Port Chester, NY Map & Demographics
Port Chester Map
Port Chester Overview
$40,722
PER CAPITA INCOME
$94,522
AVG FAMILY INCOME
$92,116
AVG HOUSEHOLD INCOME
37.2%
WAGE / INCOME GAP [ % ]
62.8¢/ $1
WAGE / INCOME GAP [ $ ]
0.47
INEQUALITY / GINI INDEX
31,288
TOTAL POPULATION
16,654
MALE POPULATION
14,634
FEMALE POPULATION
113.80
MALES / 100 FEMALES
87.87
FEMALES / 100 MALES
38.2
MEDIAN AGE
3.5
AVG FAMILY SIZE
3.0
AVG HOUSEHOLD SIZE
17,586
LABOR FORCE [ PEOPLE ]
68.4%
PERCENT IN LABOR FORCE
6.9%
UNEMPLOYMENT RATE
Port Chester Zip Codes
Port Chester Area Codes
Income in Port Chester
Income Overview in Port Chester
Per Capita Income in Port Chester is $40,722, while median incomes of families and households are $94,522 and $92,116 respectively.
| Characteristic | Number | Measure |
| Per Capita Income | 31,288 | $40,722 |
| Median Family Income | 7,437 | $94,522 |
| Mean Family Income | 7,437 | $129,135 |
| Median Household Income | 10,211 | $92,116 |
| Mean Household Income | 10,211 | $120,876 |
| Income Deficit | 7,437 | $0 |
| Wage / Income Gap (%) | 31,288 | 37.24% |
| Wage / Income Gap ($) | 31,288 | 62.76¢ per $1 |
| Gini / Inequality Index | 31,288 | 0.47 |
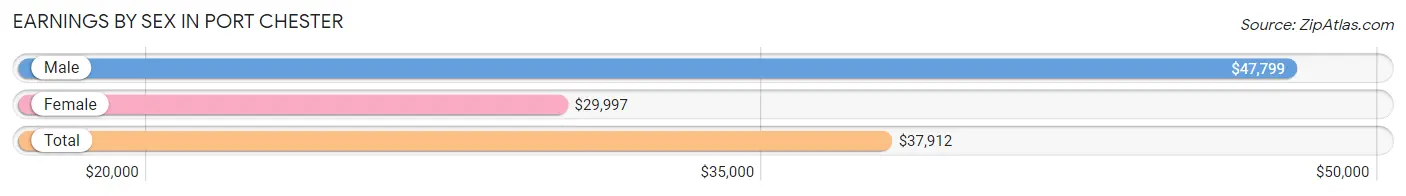
Earnings by Sex in Port Chester
Average Earnings in Port Chester are $37,912, $47,799 for men and $29,997 for women, a difference of 37.2%.
| Sex | Number | Average Earnings |
| Male | 10,304 (57.2%) | $47,799 |
| Female | 7,717 (42.8%) | $29,997 |
| Total | 18,021 (100.0%) | $37,912 |
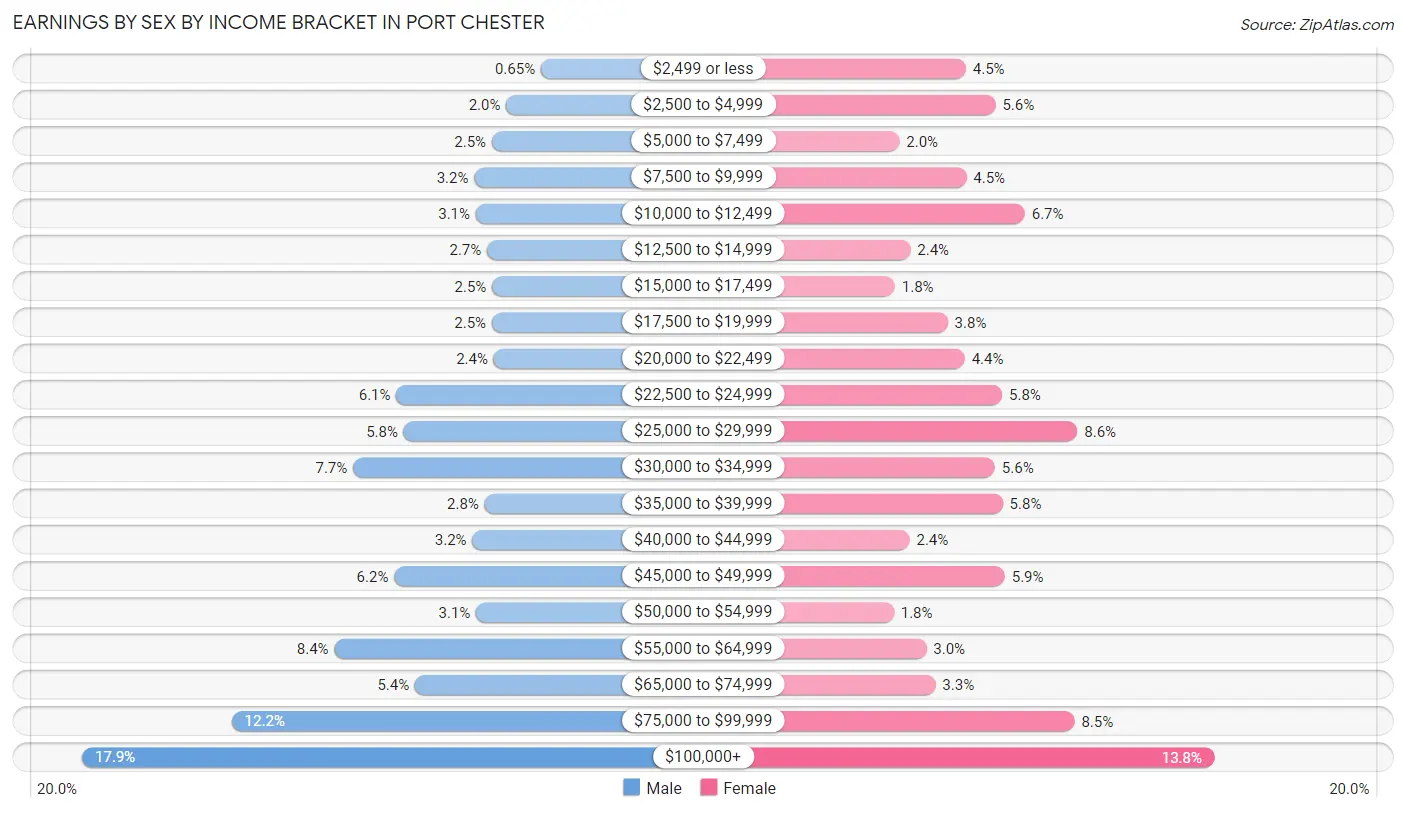
Earnings by Sex by Income Bracket in Port Chester
The most common earnings brackets in Port Chester are $100,000+ for men (1,839 | 17.8%) and $100,000+ for women (1,061 | 13.8%).
| Income | Male | Female |
| $2,499 or less | 67 (0.6%) | 344 (4.5%) |
| $2,500 to $4,999 | 201 (1.9%) | 430 (5.6%) |
| $5,000 to $7,499 | 257 (2.5%) | 152 (2.0%) |
| $7,500 to $9,999 | 325 (3.2%) | 346 (4.5%) |
| $10,000 to $12,499 | 318 (3.1%) | 515 (6.7%) |
| $12,500 to $14,999 | 275 (2.7%) | 184 (2.4%) |
| $15,000 to $17,499 | 256 (2.5%) | 139 (1.8%) |
| $17,500 to $19,999 | 257 (2.5%) | 292 (3.8%) |
| $20,000 to $22,499 | 249 (2.4%) | 341 (4.4%) |
| $22,500 to $24,999 | 625 (6.1%) | 449 (5.8%) |
| $25,000 to $29,999 | 597 (5.8%) | 667 (8.6%) |
| $30,000 to $34,999 | 792 (7.7%) | 428 (5.6%) |
| $35,000 to $39,999 | 284 (2.8%) | 451 (5.8%) |
| $40,000 to $44,999 | 332 (3.2%) | 181 (2.4%) |
| $45,000 to $49,999 | 634 (6.1%) | 457 (5.9%) |
| $50,000 to $54,999 | 317 (3.1%) | 136 (1.8%) |
| $55,000 to $64,999 | 865 (8.4%) | 230 (3.0%) |
| $65,000 to $74,999 | 553 (5.4%) | 256 (3.3%) |
| $75,000 to $99,999 | 1,261 (12.2%) | 658 (8.5%) |
| $100,000+ | 1,839 (17.8%) | 1,061 (13.8%) |
| Total | 10,304 (100.0%) | 7,717 (100.0%) |
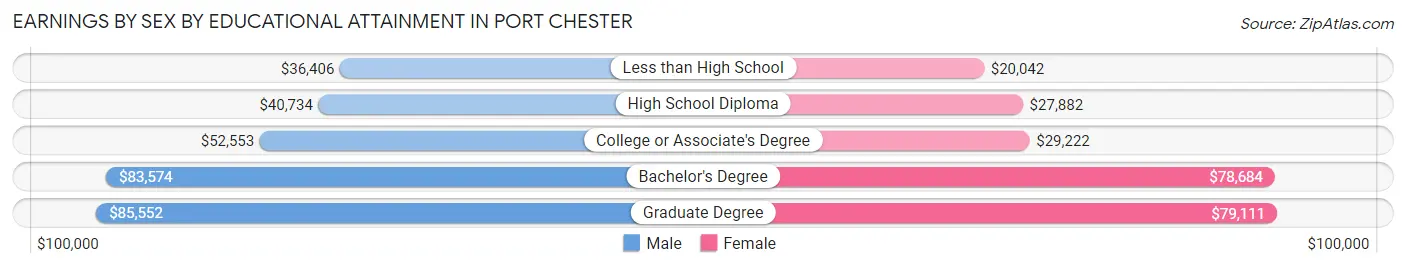
Earnings by Sex by Educational Attainment in Port Chester
Average earnings in Port Chester are $53,455 for men and $36,978 for women, a difference of 30.8%. Men with an educational attainment of graduate degree enjoy the highest average annual earnings of $85,552, while those with less than high school education earn the least with $36,406. Women with an educational attainment of graduate degree earn the most with the average annual earnings of $79,111, while those with less than high school education have the smallest earnings of $20,042.
| Educational Attainment | Male Income | Female Income |
| Less than High School | $36,406 | $20,042 |
| High School Diploma | $40,734 | $27,882 |
| College or Associate's Degree | $52,553 | $29,222 |
| Bachelor's Degree | $83,574 | $78,684 |
| Graduate Degree | $85,552 | $79,111 |
| Total | $53,455 | $36,978 |
Family Income in Port Chester
Family Income Brackets in Port Chester
According to the Port Chester family income data, there are 1,287 families falling into the $100,000 to $149,999 income range, which is the most common income bracket and makes up 17.3% of all families. Conversely, the $10,000 to $14,999 income bracket is the least frequent group with only 216 families (2.9%) belonging to this category.
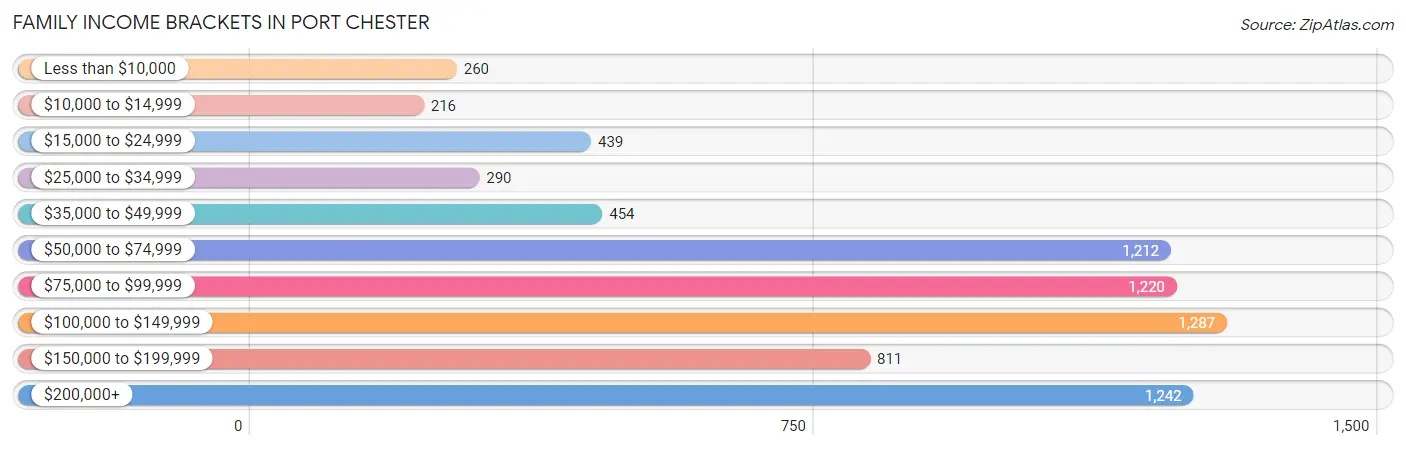
| Income Bracket | # Families | % Families |
| Less than $10,000 | 260 | 3.5% |
| $10,000 to $14,999 | 216 | 2.9% |
| $15,000 to $24,999 | 439 | 5.9% |
| $25,000 to $34,999 | 290 | 3.9% |
| $35,000 to $49,999 | 454 | 6.1% |
| $50,000 to $74,999 | 1,212 | 16.3% |
| $75,000 to $99,999 | 1,220 | 16.4% |
| $100,000 to $149,999 | 1,287 | 17.3% |
| $150,000 to $199,999 | 811 | 10.9% |
| $200,000+ | 1,242 | 16.7% |
Family Income by Famaliy Size in Port Chester
7+ person families (238 | 3.2%) account for the highest median family income in Port Chester with $245,558 per family, while 2-person families (2,644 | 35.5%) have the highest median income of $44,245 per family member.
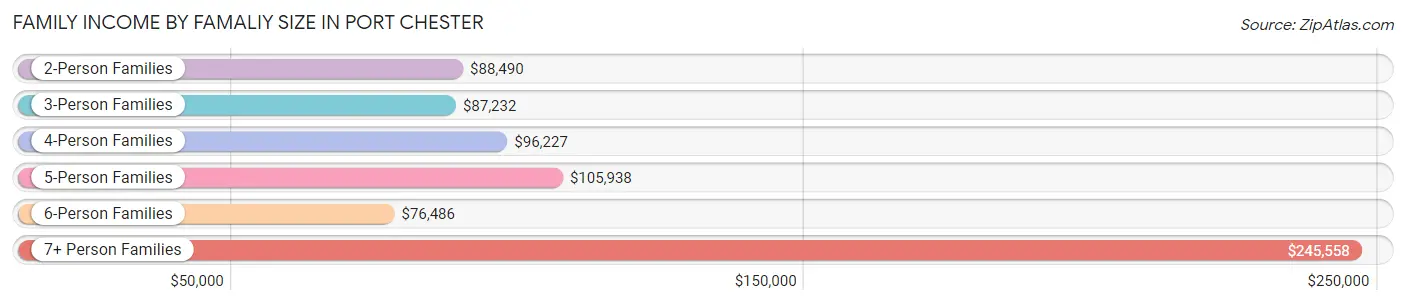
| Income Bracket | # Families | Median Income |
| 2-Person Families | 2,644 (35.5%) | $88,490 |
| 3-Person Families | 1,636 (22.0%) | $87,232 |
| 4-Person Families | 1,960 (26.4%) | $96,227 |
| 5-Person Families | 532 (7.1%) | $105,938 |
| 6-Person Families | 427 (5.7%) | $76,486 |
| 7+ Person Families | 238 (3.2%) | $245,558 |
| Total | 7,437 (100.0%) | $94,522 |
Family Income by Number of Earners in Port Chester
The median family income in Port Chester is $94,522, with families comprising 3+ earners (1,916) having the highest median family income of $157,292, while families with no earners (747) have the lowest median family income of $35,739, accounting for 25.8% and 10.0% of families, respectively.
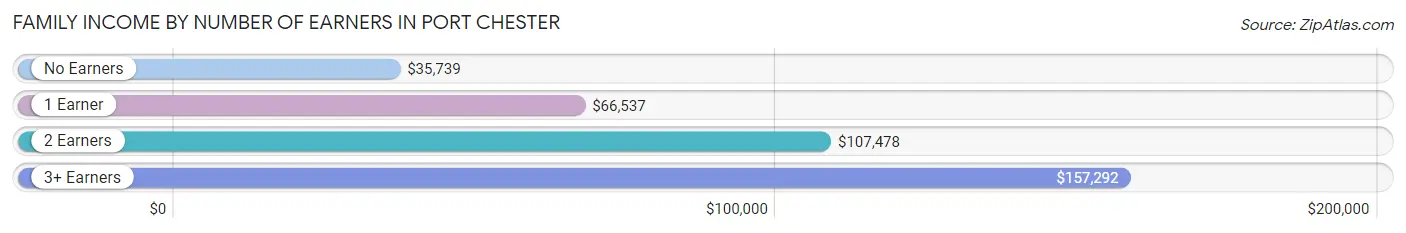
| Number of Earners | # Families | Median Income |
| No Earners | 747 (10.0%) | $35,739 |
| 1 Earner | 1,904 (25.6%) | $66,537 |
| 2 Earners | 2,870 (38.6%) | $107,478 |
| 3+ Earners | 1,916 (25.8%) | $157,292 |
| Total | 7,437 (100.0%) | $94,522 |
Household Income in Port Chester
Household Income Brackets in Port Chester
With 2,083 households falling in the category, the $100,000 to $149,999 income range is the most frequent in Port Chester, accounting for 20.4% of all households. In contrast, only 388 households (3.8%) fall into the $25,000 to $34,999 income bracket, making it the least populous group.
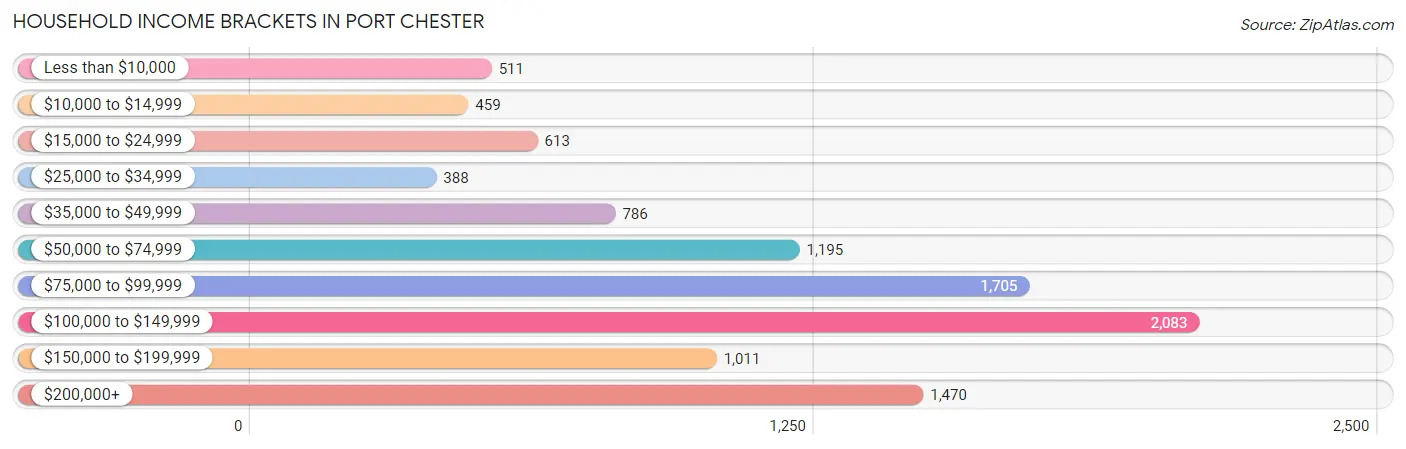
| Income Bracket | # Households | % Households |
| Less than $10,000 | 511 | 5.0% |
| $10,000 to $14,999 | 459 | 4.5% |
| $15,000 to $24,999 | 613 | 6.0% |
| $25,000 to $34,999 | 388 | 3.8% |
| $35,000 to $49,999 | 786 | 7.7% |
| $50,000 to $74,999 | 1,195 | 11.7% |
| $75,000 to $99,999 | 1,705 | 16.7% |
| $100,000 to $149,999 | 2,083 | 20.4% |
| $150,000 to $199,999 | 1,011 | 9.9% |
| $200,000+ | 1,470 | 14.4% |
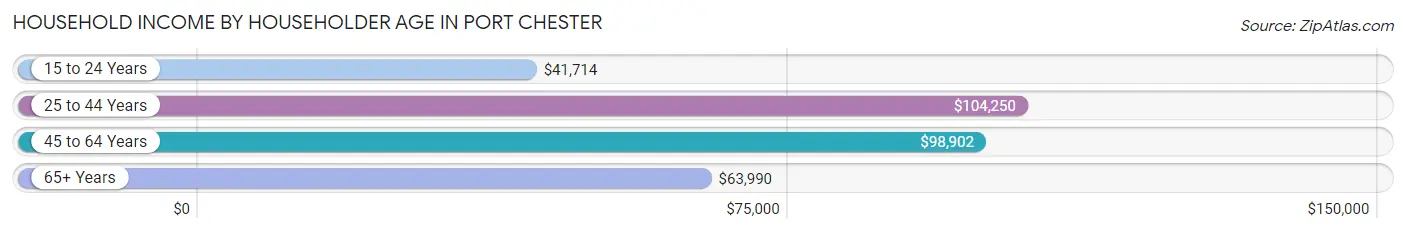
Household Income by Householder Age in Port Chester
The median household income in Port Chester is $92,116, with the highest median household income of $104,250 found in the 25 to 44 years age bracket for the primary householder. A total of 3,228 households (31.6%) fall into this category. Meanwhile, the 15 to 24 years age bracket for the primary householder has the lowest median household income of $41,714, with 168 households (1.7%) in this group.
| Income Bracket | # Households | Median Income |
| 15 to 24 Years | 168 (1.7%) | $41,714 |
| 25 to 44 Years | 3,228 (31.6%) | $104,250 |
| 45 to 64 Years | 4,542 (44.5%) | $98,902 |
| 65+ Years | 2,273 (22.3%) | $63,990 |
| Total | 10,211 (100.0%) | $92,116 |
Poverty in Port Chester
Income Below Poverty by Sex and Age in Port Chester
With 12.9% poverty level for males and 15.8% for females among the residents of Port Chester, 15 year old males and 15 year old females are the most vulnerable to poverty, with 25 males (29.8%) and 59 females (44.4%) in their respective age groups living below the poverty level.
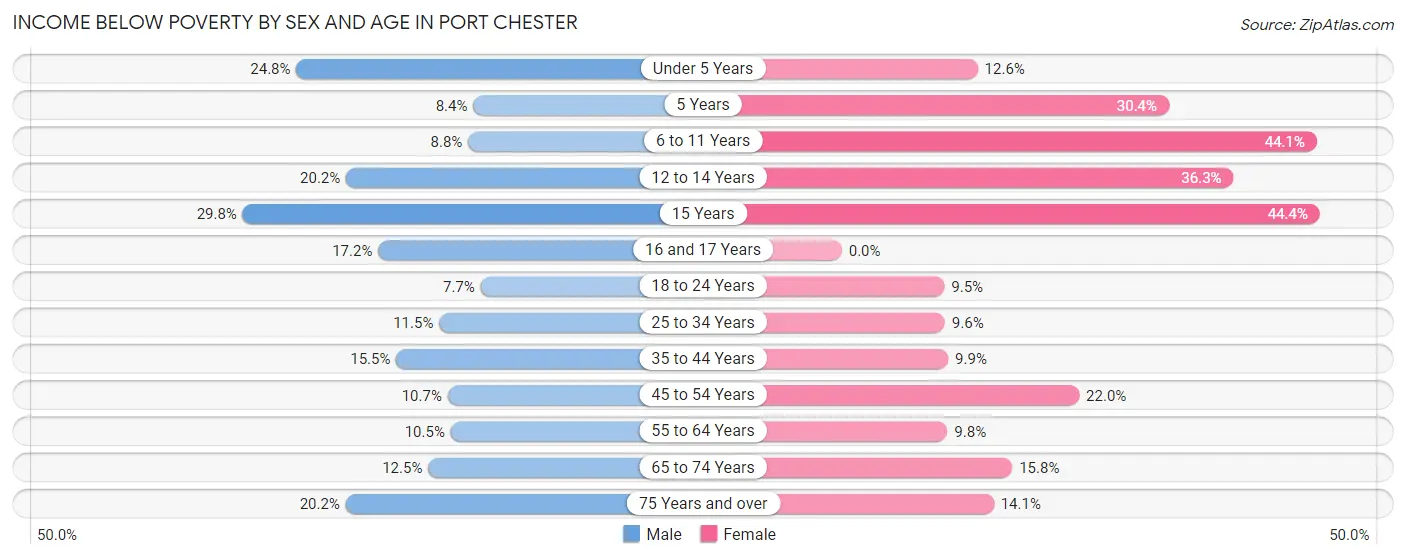
| Age Bracket | Male | Female |
| Under 5 Years | 228 (24.8%) | 116 (12.6%) |
| 5 Years | 23 (8.4%) | 61 (30.3%) |
| 6 to 11 Years | 111 (8.8%) | 398 (44.1%) |
| 12 to 14 Years | 101 (20.2%) | 129 (36.3%) |
| 15 Years | 25 (29.8%) | 59 (44.4%) |
| 16 and 17 Years | 84 (17.2%) | 0 (0.0%) |
| 18 to 24 Years | 127 (7.7%) | 161 (9.5%) |
| 25 to 34 Years | 288 (11.5%) | 198 (9.6%) |
| 35 to 44 Years | 411 (15.5%) | 182 (9.9%) |
| 45 to 54 Years | 287 (10.7%) | 502 (22.0%) |
| 55 to 64 Years | 207 (10.4%) | 175 (9.8%) |
| 65 to 74 Years | 117 (12.5%) | 191 (15.8%) |
| 75 Years and over | 139 (20.2%) | 122 (14.1%) |
| Total | 2,148 (12.9%) | 2,294 (15.8%) |
Income Above Poverty by Sex and Age in Port Chester
According to the poverty statistics in Port Chester, males aged 18 to 24 years and females aged 16 and 17 years are the age groups that are most secure financially, with 92.3% of males and 100.0% of females in these age groups living above the poverty line.
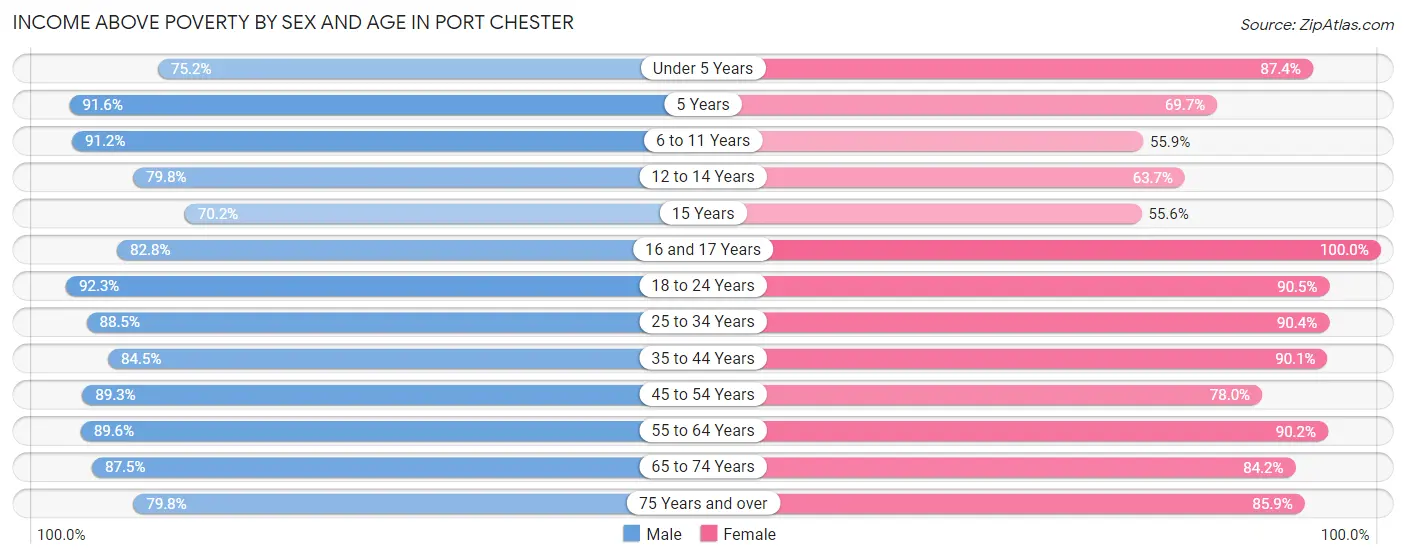
| Age Bracket | Male | Female |
| Under 5 Years | 692 (75.2%) | 804 (87.4%) |
| 5 Years | 252 (91.6%) | 140 (69.7%) |
| 6 to 11 Years | 1,146 (91.2%) | 505 (55.9%) |
| 12 to 14 Years | 400 (79.8%) | 226 (63.7%) |
| 15 Years | 59 (70.2%) | 74 (55.6%) |
| 16 and 17 Years | 405 (82.8%) | 263 (100.0%) |
| 18 to 24 Years | 1,527 (92.3%) | 1,530 (90.5%) |
| 25 to 34 Years | 2,213 (88.5%) | 1,872 (90.4%) |
| 35 to 44 Years | 2,241 (84.5%) | 1,662 (90.1%) |
| 45 to 54 Years | 2,388 (89.3%) | 1,777 (78.0%) |
| 55 to 64 Years | 1,774 (89.5%) | 1,611 (90.2%) |
| 65 to 74 Years | 816 (87.5%) | 1,016 (84.2%) |
| 75 Years and over | 549 (79.8%) | 743 (85.9%) |
| Total | 14,462 (87.1%) | 12,223 (84.2%) |
Income Below Poverty Among Married-Couple Families in Port Chester
The poverty statistics for married-couple families in Port Chester show that 7.3% or 386 of the total 5,310 families live below the poverty line. Families with 1 or 2 children have the highest poverty rate of 12.8%, comprising of 227 families. On the other hand, families with no children have the lowest poverty rate of 3.9%, which includes 123 families.
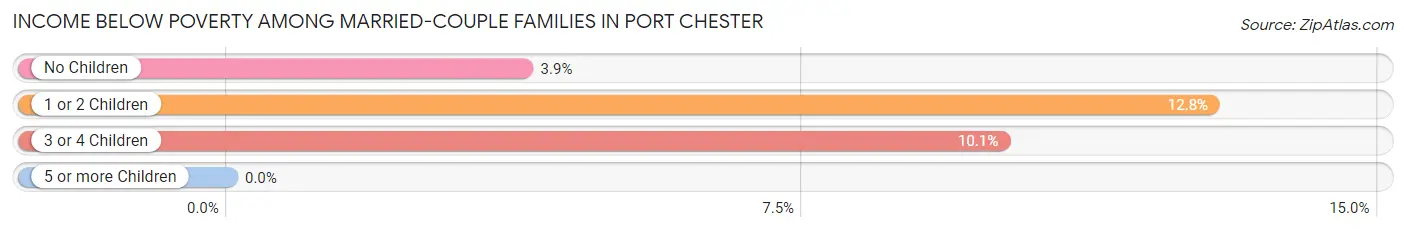
| Children | Above Poverty | Below Poverty |
| No Children | 3,060 (96.1%) | 123 (3.9%) |
| 1 or 2 Children | 1,543 (87.2%) | 227 (12.8%) |
| 3 or 4 Children | 321 (89.9%) | 36 (10.1%) |
| 5 or more Children | 0 (0.0%) | 0 (0.0%) |
| Total | 4,924 (92.7%) | 386 (7.3%) |
Income Below Poverty Among Single-Parent Households in Port Chester
According to the poverty data in Port Chester, 10.6% or 71 single-father households and 25.3% or 369 single-mother households are living below the poverty line. Among single-father households, those with 3 or 4 children have the highest poverty rate, with 37 households (100.0%) experiencing poverty. Likewise, among single-mother households, those with 3 or 4 children have the highest poverty rate, with 126 households (66.3%) falling below the poverty line.
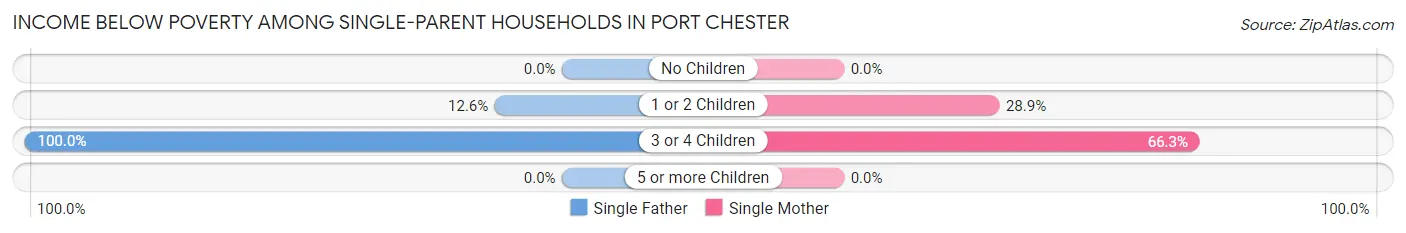
| Children | Single Father | Single Mother |
| No Children | 0 (0.0%) | 0 (0.0%) |
| 1 or 2 Children | 34 (12.6%) | 243 (28.9%) |
| 3 or 4 Children | 37 (100.0%) | 126 (66.3%) |
| 5 or more Children | 0 (0.0%) | 0 (0.0%) |
| Total | 71 (10.6%) | 369 (25.3%) |
Income Below Poverty Among Married-Couple vs Single-Parent Households in Port Chester
The poverty data for Port Chester shows that 386 of the married-couple family households (7.3%) and 440 of the single-parent households (20.7%) are living below the poverty level. Within the married-couple family households, those with 1 or 2 children have the highest poverty rate, with 227 households (12.8%) falling below the poverty line. Among the single-parent households, those with 3 or 4 children have the highest poverty rate, with 163 household (71.8%) living below poverty.
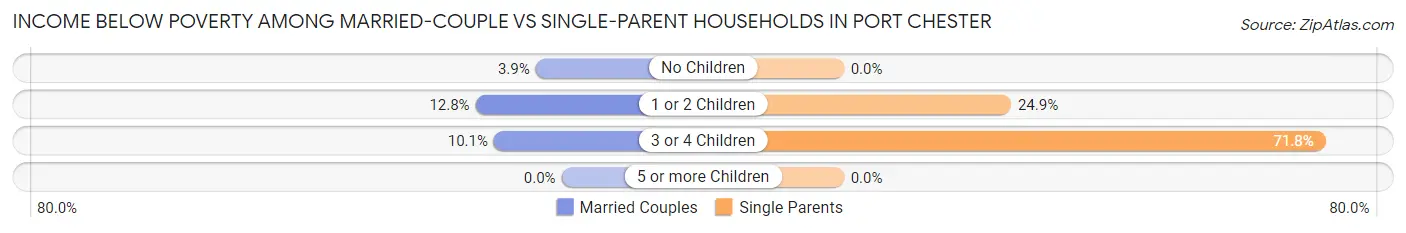
| Children | Married-Couple Families | Single-Parent Households |
| No Children | 123 (3.9%) | 0 (0.0%) |
| 1 or 2 Children | 227 (12.8%) | 277 (24.9%) |
| 3 or 4 Children | 36 (10.1%) | 163 (71.8%) |
| 5 or more Children | 0 (0.0%) | 0 (0.0%) |
| Total | 386 (7.3%) | 440 (20.7%) |
Race in Port Chester
The most populous races in Port Chester are Hispanic or Latino (19,536 | 62.4%), White / Caucasian (12,627 | 40.4%), and Some other Race (10,605 | 33.9%).
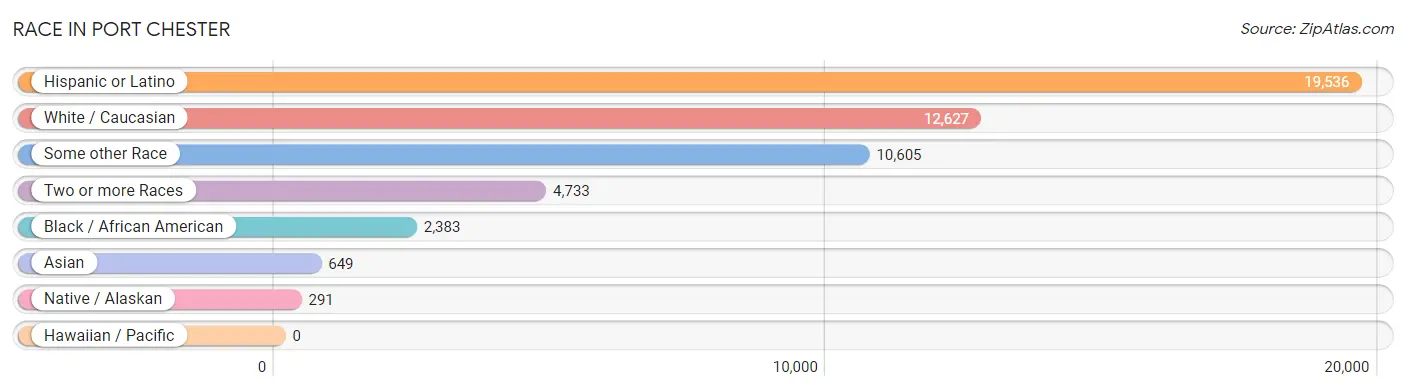
| Race | # Population | % Population |
| Asian | 649 | 2.1% |
| Black / African American | 2,383 | 7.6% |
| Hawaiian / Pacific | 0 | 0.0% |
| Hispanic or Latino | 19,536 | 62.4% |
| Native / Alaskan | 291 | 0.9% |
| White / Caucasian | 12,627 | 40.4% |
| Two or more Races | 4,733 | 15.1% |
| Some other Race | 10,605 | 33.9% |
| Total | 31,288 | 100.0% |
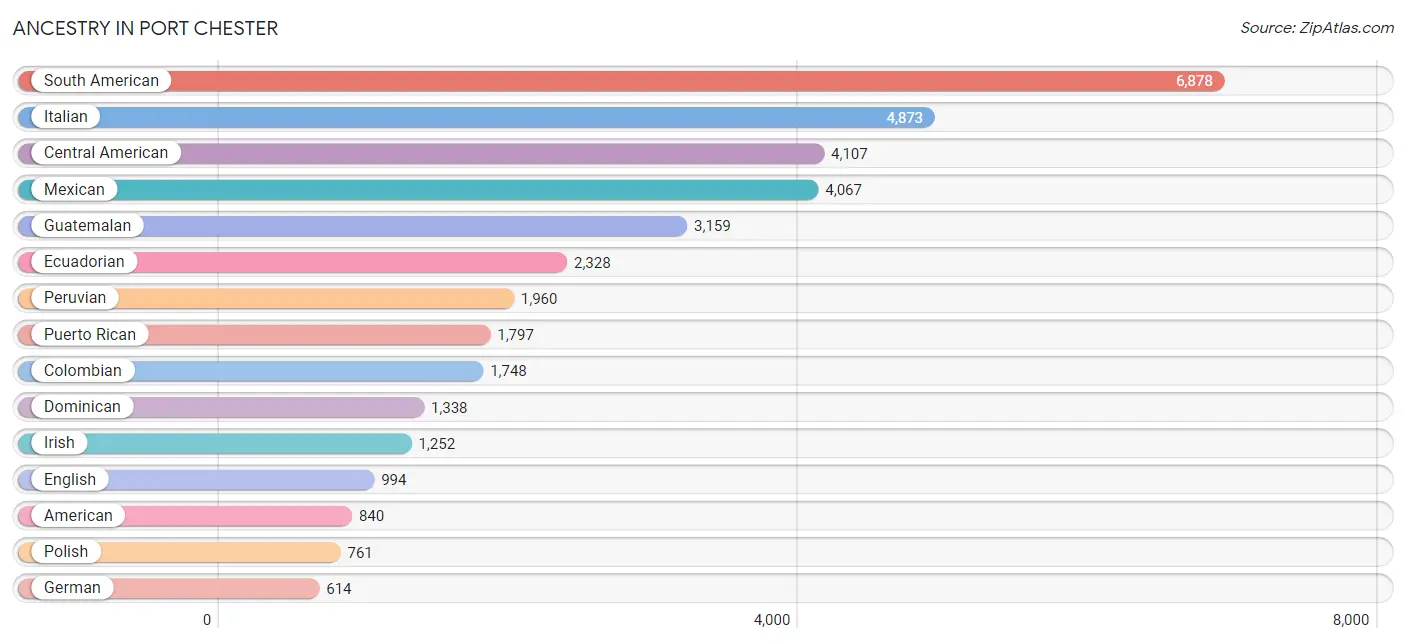
Ancestry in Port Chester
The most populous ancestries reported in Port Chester are South American (6,878 | 22.0%), Italian (4,873 | 15.6%), Central American (4,107 | 13.1%), Mexican (4,067 | 13.0%), and Guatemalan (3,159 | 10.1%), together accounting for 73.8% of all Port Chester residents.
| Ancestry | # Population | % Population |
| African | 125 | 0.4% |
| American | 840 | 2.7% |
| Apache | 133 | 0.4% |
| Arab | 59 | 0.2% |
| Argentinean | 12 | 0.0% |
| Austrian | 85 | 0.3% |
| Barbadian | 5 | 0.0% |
| Basque | 17 | 0.1% |
| Bhutanese | 31 | 0.1% |
| Bolivian | 230 | 0.7% |
| Brazilian | 202 | 0.6% |
| British | 38 | 0.1% |
| British West Indian | 13 | 0.0% |
| Burmese | 51 | 0.2% |
| Cape Verdean | 68 | 0.2% |
| Central American | 4,107 | 13.1% |
| Central American Indian | 103 | 0.3% |
| Cherokee | 56 | 0.2% |
| Chilean | 347 | 1.1% |
| Colombian | 1,748 | 5.6% |
| Costa Rican | 43 | 0.1% |
| Cuban | 322 | 1.0% |
| Czech | 134 | 0.4% |
| Czechoslovakian | 7 | 0.0% |
| Danish | 83 | 0.3% |
| Dominican | 1,338 | 4.3% |
| Dutch | 128 | 0.4% |
| Eastern European | 173 | 0.5% |
| Ecuadorian | 2,328 | 7.4% |
| Egyptian | 10 | 0.0% |
| English | 994 | 3.2% |
| European | 20 | 0.1% |
| French | 41 | 0.1% |
| French Canadian | 34 | 0.1% |
| German | 614 | 2.0% |
| Ghanaian | 2 | 0.0% |
| Greek | 229 | 0.7% |
| Guatemalan | 3,159 | 10.1% |
| Guyanese | 67 | 0.2% |
| Haitian | 20 | 0.1% |
| Honduran | 324 | 1.0% |
| Hungarian | 120 | 0.4% |
| Indian (Asian) | 309 | 1.0% |
| Iranian | 20 | 0.1% |
| Irish | 1,252 | 4.0% |
| Iroquois | 133 | 0.4% |
| Italian | 4,873 | 15.6% |
| Jamaican | 217 | 0.7% |
| Korean | 63 | 0.2% |
| Laotian | 5 | 0.0% |
| Latvian | 18 | 0.1% |
| Lebanese | 44 | 0.1% |
| Lithuanian | 42 | 0.1% |
| Maltese | 7 | 0.0% |
| Mexican | 4,067 | 13.0% |
| Mexican American Indian | 103 | 0.3% |
| Nicaraguan | 64 | 0.2% |
| Nigerian | 1 | 0.0% |
| Norwegian | 95 | 0.3% |
| Paraguayan | 133 | 0.4% |
| Peruvian | 1,960 | 6.3% |
| Polish | 761 | 2.4% |
| Portuguese | 169 | 0.5% |
| Puerto Rican | 1,797 | 5.7% |
| Romanian | 3 | 0.0% |
| Russian | 41 | 0.1% |
| Salvadoran | 517 | 1.7% |
| Scottish | 182 | 0.6% |
| Slovak | 152 | 0.5% |
| South American | 6,878 | 22.0% |
| South American Indian | 227 | 0.7% |
| Spaniard | 55 | 0.2% |
| Subsaharan African | 196 | 0.6% |
| Thai | 184 | 0.6% |
| Ukrainian | 115 | 0.4% |
| Uruguayan | 120 | 0.4% |
| West Indian | 25 | 0.1% |
| Yugoslavian | 15 | 0.1% | View All 78 Rows |
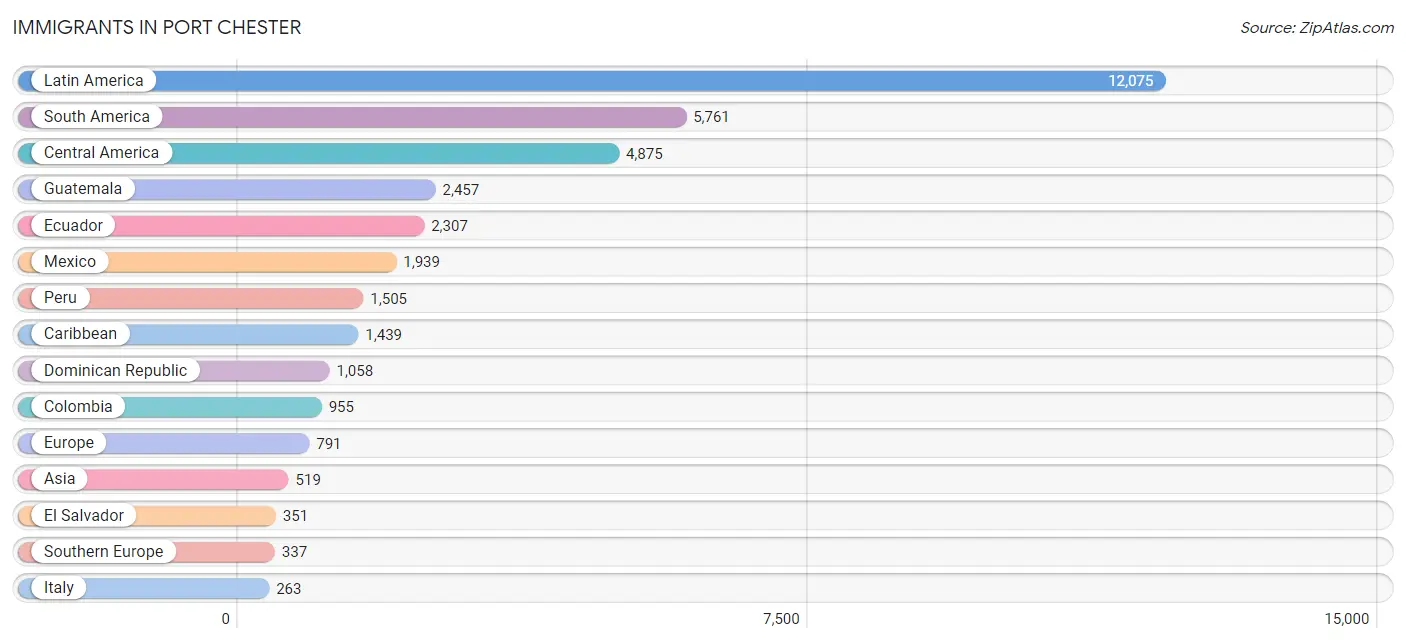
Immigrants in Port Chester
The most numerous immigrant groups reported in Port Chester came from Latin America (12,075 | 38.6%), South America (5,761 | 18.4%), Central America (4,875 | 15.6%), Guatemala (2,457 | 7.9%), and Ecuador (2,307 | 7.4%), together accounting for 87.8% of all Port Chester residents.
| Immigration Origin | # Population | % Population |
| Africa | 81 | 0.3% |
| Argentina | 12 | 0.0% |
| Asia | 519 | 1.7% |
| Australia | 23 | 0.1% |
| Belgium | 22 | 0.1% |
| Bolivia | 233 | 0.7% |
| Brazil | 254 | 0.8% |
| Cabo Verde | 17 | 0.1% |
| Caribbean | 1,439 | 4.6% |
| Central America | 4,875 | 15.6% |
| Chile | 109 | 0.4% |
| China | 174 | 0.6% |
| Colombia | 955 | 3.0% |
| Cuba | 229 | 0.7% |
| Dominican Republic | 1,058 | 3.4% |
| Eastern Asia | 256 | 0.8% |
| Eastern Europe | 236 | 0.7% |
| Ecuador | 2,307 | 7.4% |
| El Salvador | 351 | 1.1% |
| Europe | 791 | 2.5% |
| Germany | 11 | 0.0% |
| Ghana | 2 | 0.0% |
| Greece | 16 | 0.1% |
| Guatemala | 2,457 | 7.9% |
| Guyana | 67 | 0.2% |
| Honduras | 60 | 0.2% |
| Hong Kong | 13 | 0.0% |
| India | 73 | 0.2% |
| Iran | 42 | 0.1% |
| Ireland | 15 | 0.1% |
| Israel | 50 | 0.2% |
| Italy | 263 | 0.8% |
| Jamaica | 152 | 0.5% |
| Japan | 31 | 0.1% |
| Korea | 51 | 0.2% |
| Latin America | 12,075 | 38.6% |
| Mexico | 1,939 | 6.2% |
| Nepal | 52 | 0.2% |
| Nicaragua | 64 | 0.2% |
| Northern Europe | 128 | 0.4% |
| Oceania | 23 | 0.1% |
| Panama | 4 | 0.0% |
| Peru | 1,505 | 4.8% |
| Philippines | 41 | 0.1% |
| Poland | 236 | 0.7% |
| Portugal | 18 | 0.1% |
| Scotland | 87 | 0.3% |
| Singapore | 5 | 0.0% |
| South America | 5,761 | 18.4% |
| South Central Asia | 167 | 0.5% |
| South Eastern Asia | 46 | 0.2% |
| Southern Europe | 337 | 1.1% |
| Spain | 33 | 0.1% |
| Switzerland | 57 | 0.2% |
| Uruguay | 120 | 0.4% |
| Venezuela | 47 | 0.2% |
| Western Africa | 70 | 0.2% |
| Western Asia | 50 | 0.2% |
| Western Europe | 90 | 0.3% | View All 59 Rows |
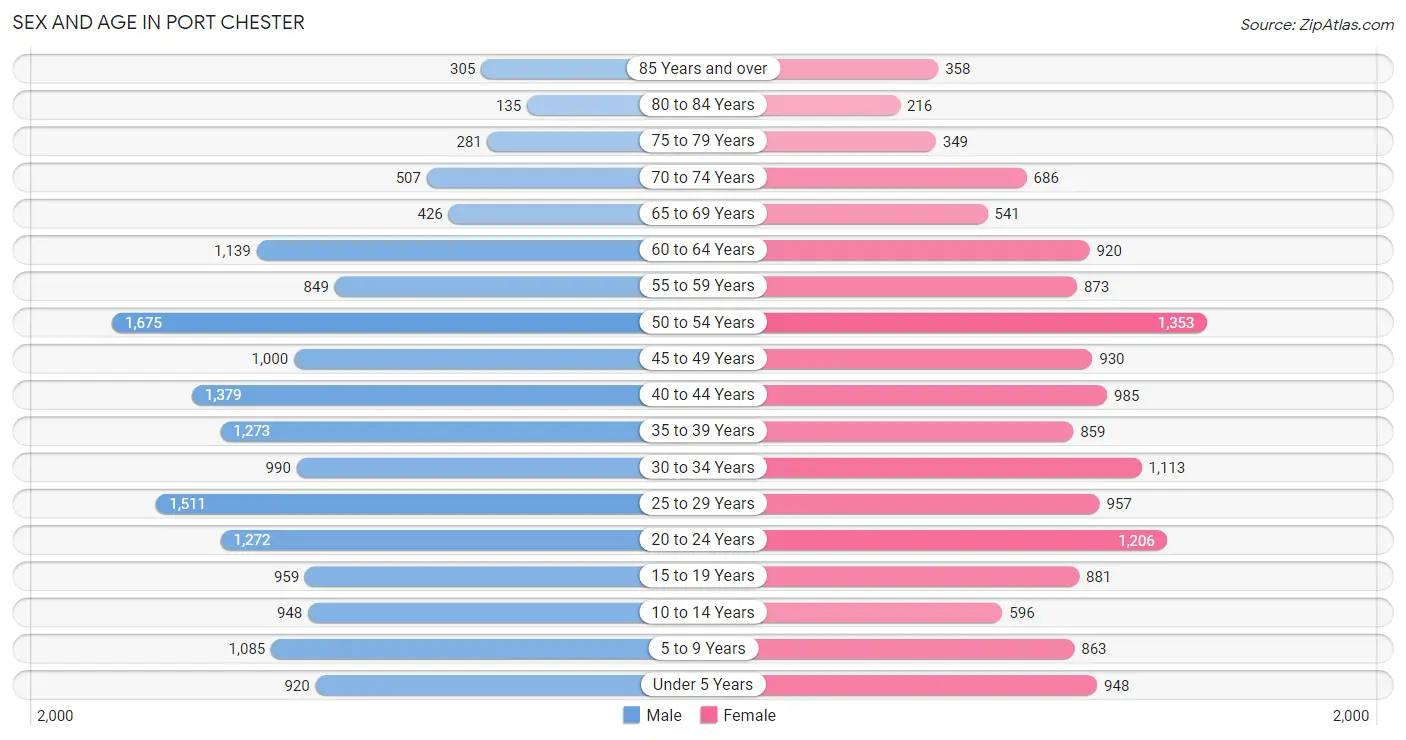
Sex and Age in Port Chester
Sex and Age in Port Chester
The most populous age groups in Port Chester are 50 to 54 Years (1,675 | 10.1%) for men and 50 to 54 Years (1,353 | 9.2%) for women.
| Age Bracket | Male | Female |
| Under 5 Years | 920 (5.5%) | 948 (6.5%) |
| 5 to 9 Years | 1,085 (6.5%) | 863 (5.9%) |
| 10 to 14 Years | 948 (5.7%) | 596 (4.1%) |
| 15 to 19 Years | 959 (5.8%) | 881 (6.0%) |
| 20 to 24 Years | 1,272 (7.6%) | 1,206 (8.2%) |
| 25 to 29 Years | 1,511 (9.1%) | 957 (6.5%) |
| 30 to 34 Years | 990 (5.9%) | 1,113 (7.6%) |
| 35 to 39 Years | 1,273 (7.6%) | 859 (5.9%) |
| 40 to 44 Years | 1,379 (8.3%) | 985 (6.7%) |
| 45 to 49 Years | 1,000 (6.0%) | 930 (6.4%) |
| 50 to 54 Years | 1,675 (10.1%) | 1,353 (9.2%) |
| 55 to 59 Years | 849 (5.1%) | 873 (6.0%) |
| 60 to 64 Years | 1,139 (6.8%) | 920 (6.3%) |
| 65 to 69 Years | 426 (2.6%) | 541 (3.7%) |
| 70 to 74 Years | 507 (3.0%) | 686 (4.7%) |
| 75 to 79 Years | 281 (1.7%) | 349 (2.4%) |
| 80 to 84 Years | 135 (0.8%) | 216 (1.5%) |
| 85 Years and over | 305 (1.8%) | 358 (2.5%) |
| Total | 16,654 (100.0%) | 14,634 (100.0%) |
Families and Households in Port Chester
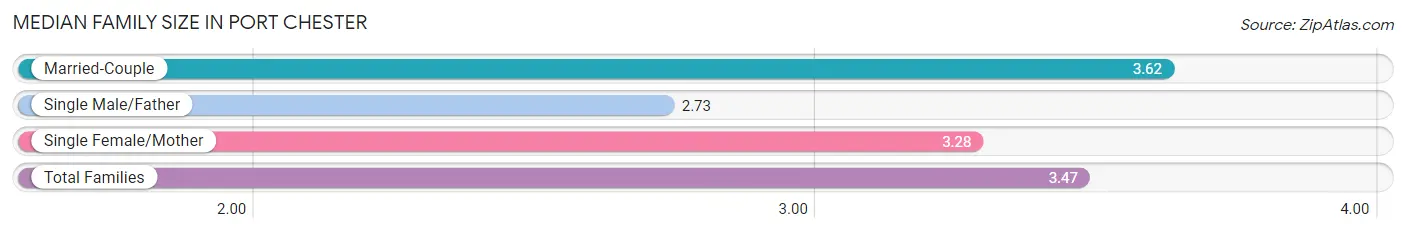
Median Family Size in Port Chester
The median family size in Port Chester is 3.47 persons per family, with married-couple families (5,310 | 71.4%) accounting for the largest median family size of 3.62 persons per family. On the other hand, single male/father families (671 | 9.0%) represent the smallest median family size with 2.73 persons per family.
| Family Type | # Families | Family Size |
| Married-Couple | 5,310 (71.4%) | 3.62 |
| Single Male/Father | 671 (9.0%) | 2.73 |
| Single Female/Mother | 1,456 (19.6%) | 3.28 |
| Total Families | 7,437 (100.0%) | 3.47 |
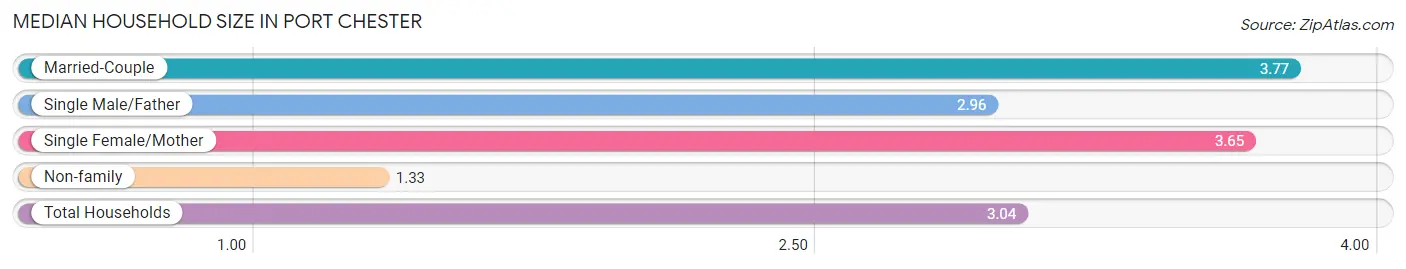
Median Household Size in Port Chester
The median household size in Port Chester is 3.04 persons per household, with married-couple households (5,310 | 52.0%) accounting for the largest median household size of 3.77 persons per household. non-family households (2,774 | 27.2%) represent the smallest median household size with 1.33 persons per household.
| Household Type | # Households | Household Size |
| Married-Couple | 5,310 (52.0%) | 3.77 |
| Single Male/Father | 671 (6.6%) | 2.96 |
| Single Female/Mother | 1,456 (14.3%) | 3.65 |
| Non-family | 2,774 (27.2%) | 1.33 |
| Total Households | 10,211 (100.0%) | 3.04 |
Household Size by Marriage Status in Port Chester
Out of a total of 10,211 households in Port Chester, 7,437 (72.8%) are family households, while 2,774 (27.2%) are nonfamily households. The most numerous type of family households are 2-person households, comprising 2,259, and the most common type of nonfamily households are 1-person households, comprising 2,344.
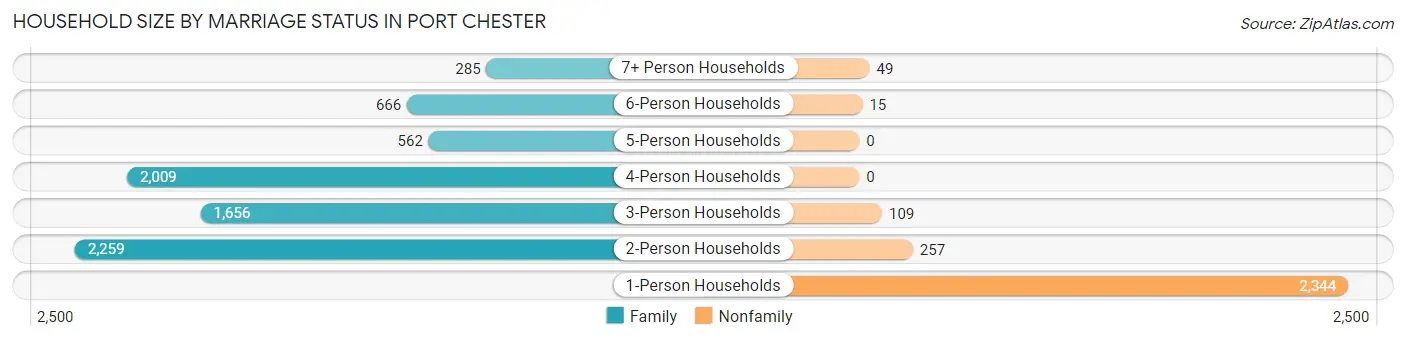
| Household Size | Family Households | Nonfamily Households |
| 1-Person Households | - | 2,344 (23.0%) |
| 2-Person Households | 2,259 (22.1%) | 257 (2.5%) |
| 3-Person Households | 1,656 (16.2%) | 109 (1.1%) |
| 4-Person Households | 2,009 (19.7%) | 0 (0.0%) |
| 5-Person Households | 562 (5.5%) | 0 (0.0%) |
| 6-Person Households | 666 (6.5%) | 15 (0.2%) |
| 7+ Person Households | 285 (2.8%) | 49 (0.5%) |
| Total | 7,437 (72.8%) | 2,774 (27.2%) |
Female Fertility in Port Chester
Fertility by Age in Port Chester
Average fertility rate in Port Chester is 55.0 births per 1,000 women. Women in the age bracket of 20 to 34 years have the highest fertility rate with 88.0 births per 1,000 women. Women in the age bracket of 20 to 34 years acount for 71.0% of all women with births.
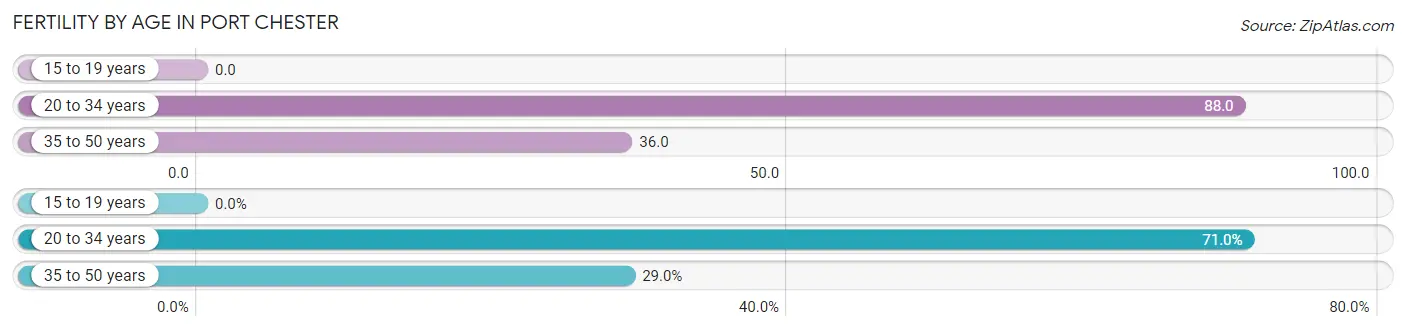
| Age Bracket | Women with Births | Births / 1,000 Women |
| 15 to 19 years | 0 (0.0%) | 0.0 |
| 20 to 34 years | 289 (71.0%) | 88.0 |
| 35 to 50 years | 118 (29.0%) | 36.0 |
| Total | 407 (100.0%) | 55.0 |
Fertility by Age by Marriage Status in Port Chester
48.9% of women with births (407) in Port Chester are married. The highest percentage of unmarried women with births falls into 20 to 34 years age bracket with 57.8% of them unmarried at the time of birth, while the lowest percentage of unmarried women with births belong to 35 to 50 years age bracket with 34.8% of them unmarried.
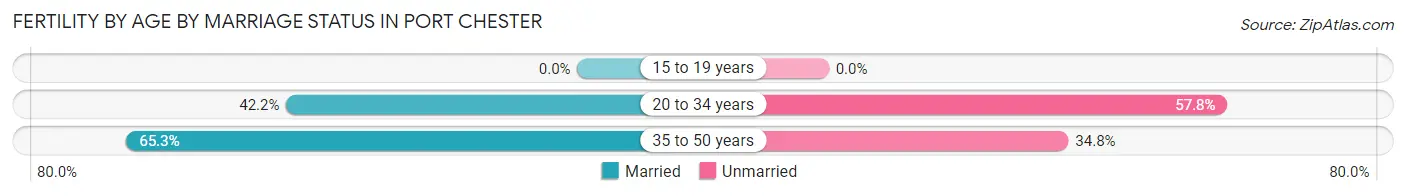
| Age Bracket | Married | Unmarried |
| 15 to 19 years | 0 (0.0%) | 0 (0.0%) |
| 20 to 34 years | 122 (42.2%) | 167 (57.8%) |
| 35 to 50 years | 77 (65.2%) | 41 (34.7%) |
| Total | 199 (48.9%) | 208 (51.1%) |
Fertility by Education in Port Chester
Average fertility rate in Port Chester is 55.0 births per 1,000 women. Women with the education attainment of graduate degree have the highest fertility rate of 105.0 births per 1,000 women, while women with the education attainment of bachelor's degree have the lowest fertility at 29.0 births per 1,000 women. Women with the education attainment of less than high school represent 40.8% of all women with births.
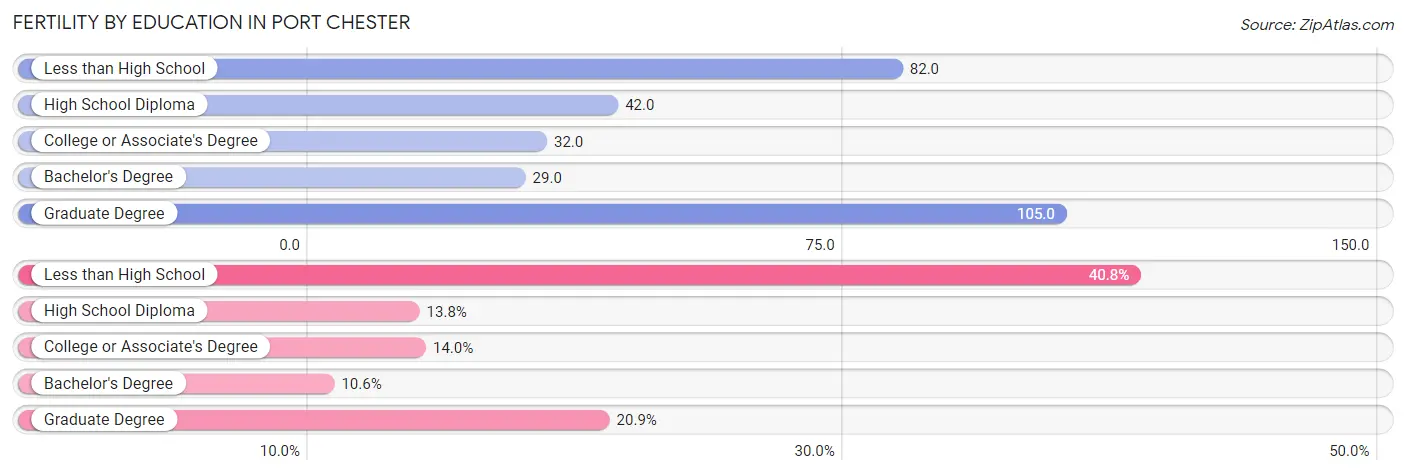
| Educational Attainment | Women with Births | Births / 1,000 Women |
| Less than High School | 166 (40.8%) | 82.0 |
| High School Diploma | 56 (13.8%) | 42.0 |
| College or Associate's Degree | 57 (14.0%) | 32.0 |
| Bachelor's Degree | 43 (10.6%) | 29.0 |
| Graduate Degree | 85 (20.9%) | 105.0 |
| Total | 407 (100.0%) | 55.0 |
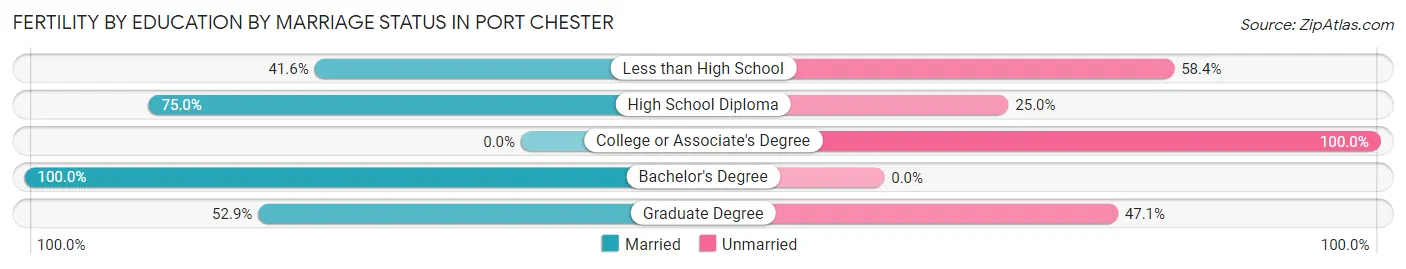
Fertility by Education by Marriage Status in Port Chester
51.1% of women with births in Port Chester are unmarried. Women with the educational attainment of bachelor's degree are most likely to be married with 100.0% of them married at childbirth, while women with the educational attainment of college or associate's degree are least likely to be married with 100.0% of them unmarried at childbirth.
| Educational Attainment | Married | Unmarried |
| Less than High School | 69 (41.6%) | 97 (58.4%) |
| High School Diploma | 42 (75.0%) | 14 (25.0%) |
| College or Associate's Degree | 0 (0.0%) | 57 (100.0%) |
| Bachelor's Degree | 43 (100.0%) | 0 (0.0%) |
| Graduate Degree | 45 (52.9%) | 40 (47.1%) |
| Total | 199 (48.9%) | 208 (51.1%) |
Employment Characteristics in Port Chester
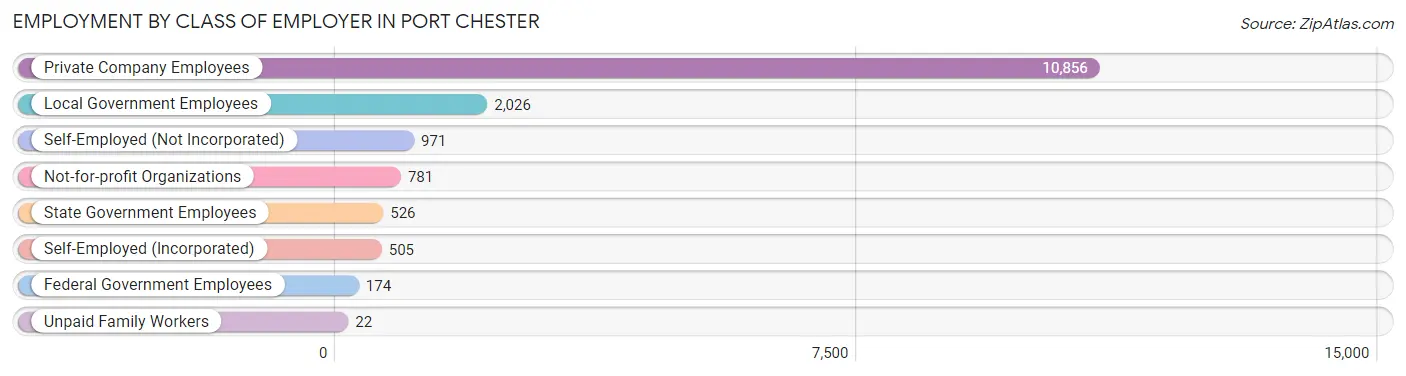
Employment by Class of Employer in Port Chester
Among the 15,861 employed individuals in Port Chester, private company employees (10,856 | 68.4%), local government employees (2,026 | 12.8%), and self-employed (not incorporated) (971 | 6.1%) make up the most common classes of employment.
| Employer Class | # Employees | % Employees |
| Private Company Employees | 10,856 | 68.4% |
| Self-Employed (Incorporated) | 505 | 3.2% |
| Self-Employed (Not Incorporated) | 971 | 6.1% |
| Not-for-profit Organizations | 781 | 4.9% |
| Local Government Employees | 2,026 | 12.8% |
| State Government Employees | 526 | 3.3% |
| Federal Government Employees | 174 | 1.1% |
| Unpaid Family Workers | 22 | 0.1% |
| Total | 15,861 | 100.0% |
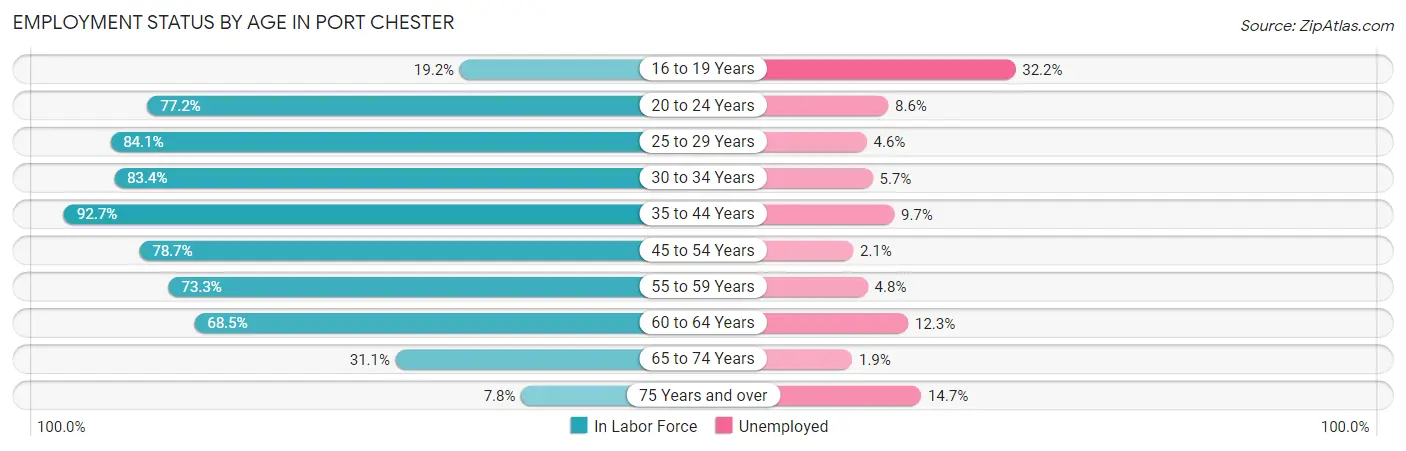
Employment Status by Age in Port Chester
According to the labor force statistics for Port Chester, out of the total population over 16 years of age (25,711), 68.4% or 17,586 individuals are in the labor force, with 6.9% or 1,213 of them unemployed. The age group with the highest labor force participation rate is 35 to 44 years, with 92.7% or 4,168 individuals in the labor force. Within the labor force, the 16 to 19 years age range has the highest percentage of unemployed individuals, with 32.2% or 100 of them being unemployed.
| Age Bracket | In Labor Force | Unemployed |
| 16 to 19 Years | 312 (19.2%) | 100 (32.2%) |
| 20 to 24 Years | 1,913 (77.2%) | 165 (8.6%) |
| 25 to 29 Years | 2,076 (84.1%) | 95 (4.6%) |
| 30 to 34 Years | 1,754 (83.4%) | 100 (5.7%) |
| 35 to 44 Years | 4,168 (92.7%) | 404 (9.7%) |
| 45 to 54 Years | 3,902 (78.7%) | 82 (2.1%) |
| 55 to 59 Years | 1,262 (73.3%) | 61 (4.8%) |
| 60 to 64 Years | 1,410 (68.5%) | 173 (12.3%) |
| 65 to 74 Years | 672 (31.1%) | 13 (1.9%) |
| 75 Years and over | 128 (7.8%) | 19 (14.7%) |
| Total | 17,586 (68.4%) | 1,213 (6.9%) |
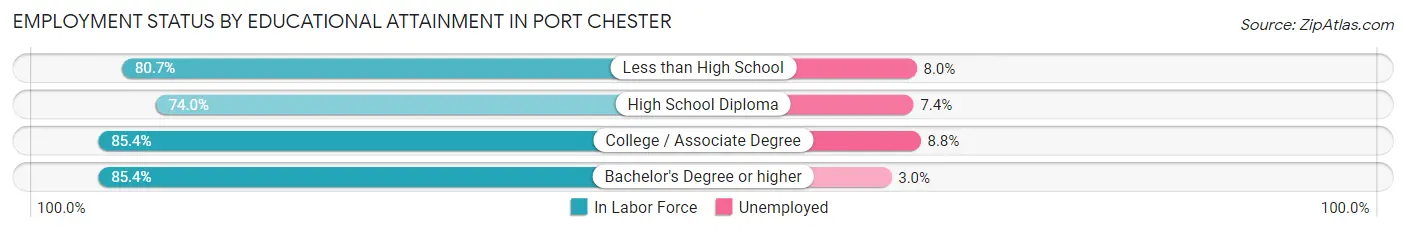
Employment Status by Educational Attainment in Port Chester
According to labor force statistics for Port Chester, 81.8% of individuals (14,565) out of the total population between 25 and 64 years of age (17,806) are in the labor force, with 6.3% or 918 of them being unemployed. The group with the highest labor force participation rate are those with the educational attainment of college / associate degree, with 85.4% or 3,353 individuals in the labor force. Within the labor force, individuals with college / associate degree education have the highest percentage of unemployment, with 8.8% or 295 of them being unemployed.
| Educational Attainment | In Labor Force | Unemployed |
| Less than High School | 2,976 (80.7%) | 295 (8.0%) |
| High School Diploma | 2,968 (74.0%) | 297 (7.4%) |
| College / Associate Degree | 3,353 (85.4%) | 345 (8.8%) |
| Bachelor's Degree or higher | 5,279 (85.4%) | 185 (3.0%) |
| Total | 14,565 (81.8%) | 1,122 (6.3%) |
Employment Occupations by Sex in Port Chester
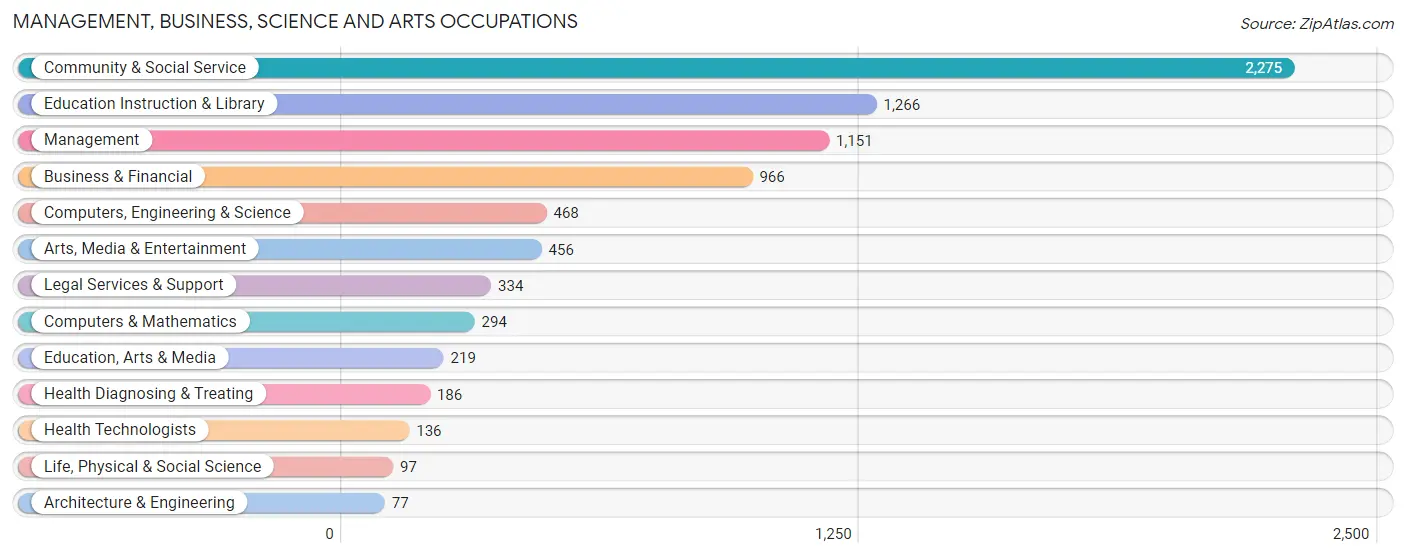
Management, Business, Science and Arts Occupations
The most common Management, Business, Science and Arts occupations in Port Chester are Community & Social Service (2,275 | 13.9%), Education Instruction & Library (1,266 | 7.7%), Management (1,151 | 7.0%), Business & Financial (966 | 5.9%), and Computers, Engineering & Science (468 | 2.9%).
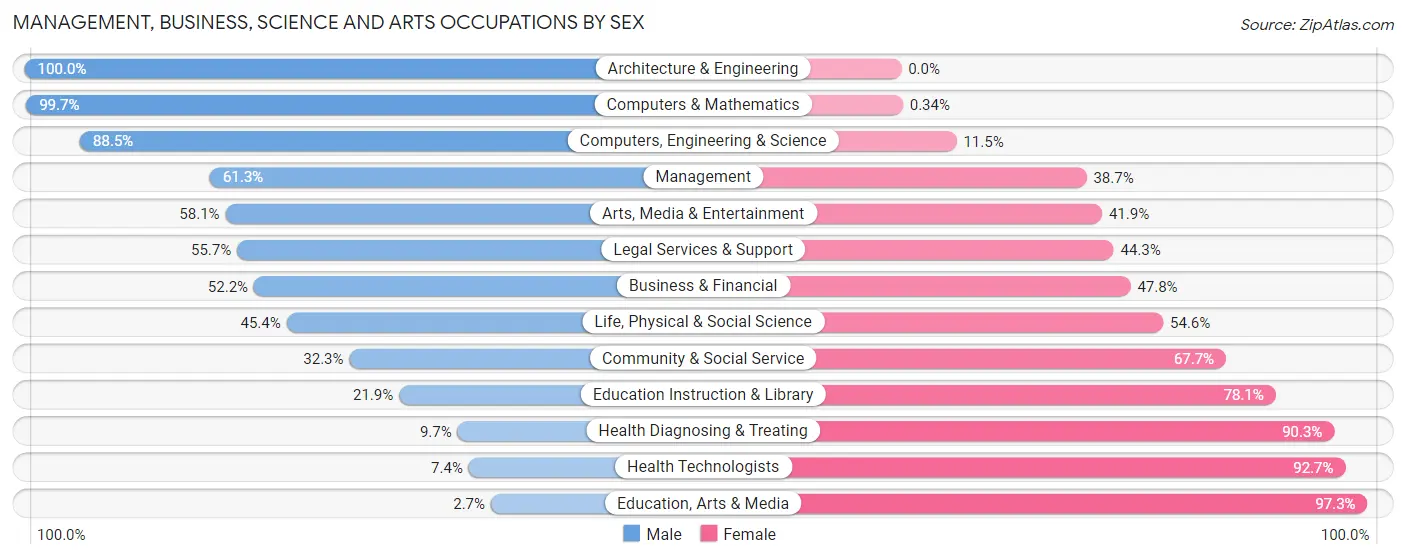
Management, Business, Science and Arts Occupations by Sex
Within the Management, Business, Science and Arts occupations in Port Chester, the most male-oriented occupations are Architecture & Engineering (100.0%), Computers & Mathematics (99.7%), and Computers, Engineering & Science (88.5%), while the most female-oriented occupations are Education, Arts & Media (97.3%), Health Technologists (92.6%), and Health Diagnosing & Treating (90.3%).
| Occupation | Male | Female |
| Management | 706 (61.3%) | 445 (38.7%) |
| Business & Financial | 504 (52.2%) | 462 (47.8%) |
| Computers, Engineering & Science | 414 (88.5%) | 54 (11.5%) |
| Computers & Mathematics | 293 (99.7%) | 1 (0.3%) |
| Architecture & Engineering | 77 (100.0%) | 0 (0.0%) |
| Life, Physical & Social Science | 44 (45.4%) | 53 (54.6%) |
| Community & Social Service | 734 (32.3%) | 1,541 (67.7%) |
| Education, Arts & Media | 6 (2.7%) | 213 (97.3%) |
| Legal Services & Support | 186 (55.7%) | 148 (44.3%) |
| Education Instruction & Library | 277 (21.9%) | 989 (78.1%) |
| Arts, Media & Entertainment | 265 (58.1%) | 191 (41.9%) |
| Health Diagnosing & Treating | 18 (9.7%) | 168 (90.3%) |
| Health Technologists | 10 (7.3%) | 126 (92.6%) |
| Total (Category) | 2,376 (47.1%) | 2,670 (52.9%) |
| Total (Overall) | 9,274 (56.6%) | 7,100 (43.4%) |
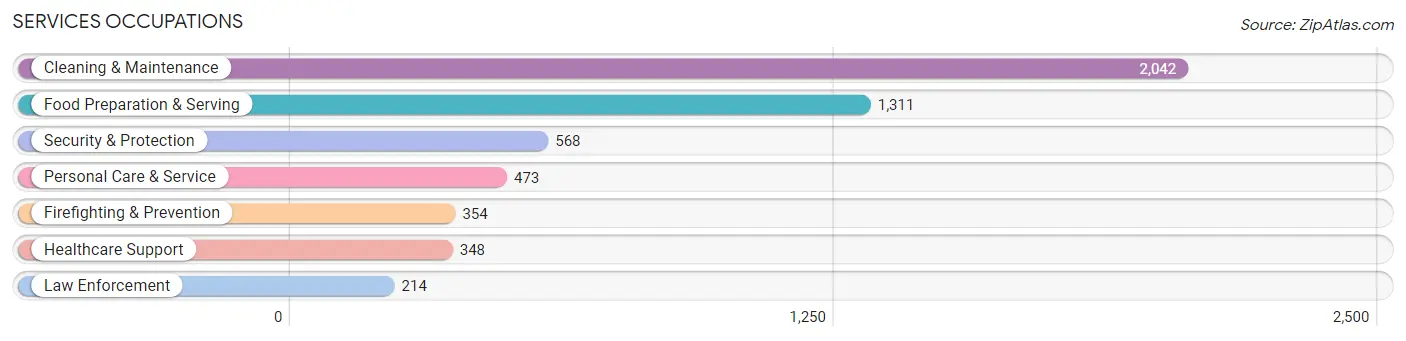
Services Occupations
The most common Services occupations in Port Chester are Cleaning & Maintenance (2,042 | 12.5%), Food Preparation & Serving (1,311 | 8.0%), Security & Protection (568 | 3.5%), Personal Care & Service (473 | 2.9%), and Firefighting & Prevention (354 | 2.2%).
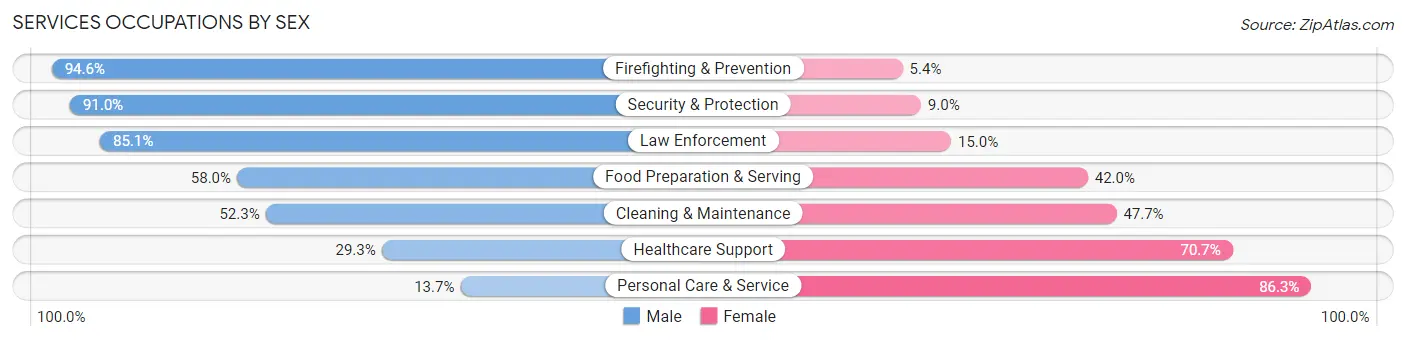
Services Occupations by Sex
Within the Services occupations in Port Chester, the most male-oriented occupations are Firefighting & Prevention (94.6%), Security & Protection (91.0%), and Law Enforcement (85.1%), while the most female-oriented occupations are Personal Care & Service (86.3%), Healthcare Support (70.7%), and Cleaning & Maintenance (47.7%).
| Occupation | Male | Female |
| Healthcare Support | 102 (29.3%) | 246 (70.7%) |
| Security & Protection | 517 (91.0%) | 51 (9.0%) |
| Firefighting & Prevention | 335 (94.6%) | 19 (5.4%) |
| Law Enforcement | 182 (85.1%) | 32 (14.9%) |
| Food Preparation & Serving | 760 (58.0%) | 551 (42.0%) |
| Cleaning & Maintenance | 1,068 (52.3%) | 974 (47.7%) |
| Personal Care & Service | 65 (13.7%) | 408 (86.3%) |
| Total (Category) | 2,512 (53.0%) | 2,230 (47.0%) |
| Total (Overall) | 9,274 (56.6%) | 7,100 (43.4%) |
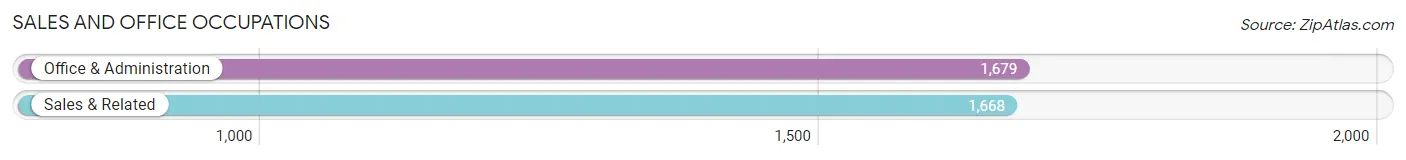
Sales and Office Occupations
The most common Sales and Office occupations in Port Chester are Office & Administration (1,679 | 10.2%), and Sales & Related (1,668 | 10.2%).
Sales and Office Occupations by Sex
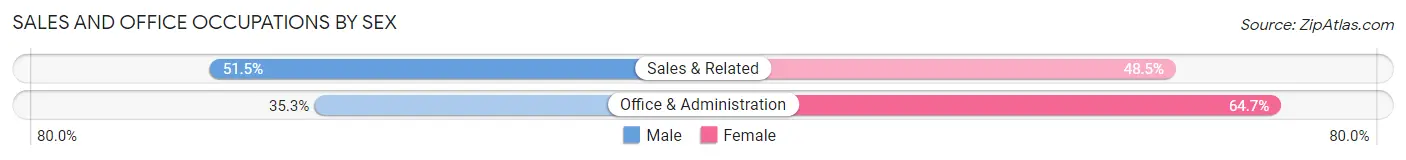
| Occupation | Male | Female |
| Sales & Related | 859 (51.5%) | 809 (48.5%) |
| Office & Administration | 593 (35.3%) | 1,086 (64.7%) |
| Total (Category) | 1,452 (43.4%) | 1,895 (56.6%) |
| Total (Overall) | 9,274 (56.6%) | 7,100 (43.4%) |
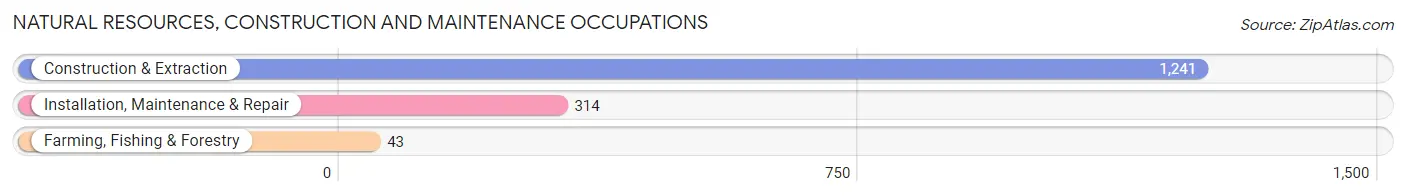
Natural Resources, Construction and Maintenance Occupations
The most common Natural Resources, Construction and Maintenance occupations in Port Chester are Construction & Extraction (1,241 | 7.6%), Installation, Maintenance & Repair (314 | 1.9%), and Farming, Fishing & Forestry (43 | 0.3%).
Natural Resources, Construction and Maintenance Occupations by Sex
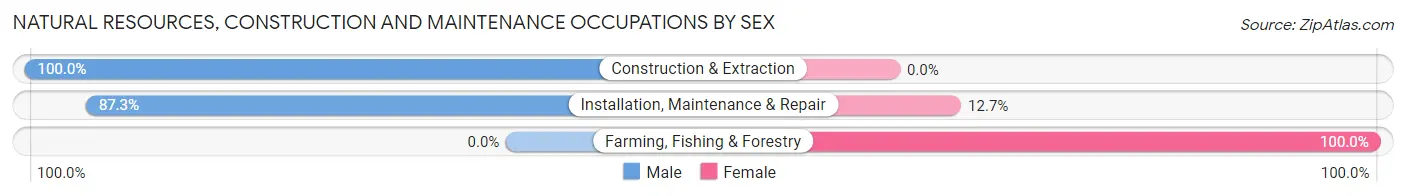
| Occupation | Male | Female |
| Farming, Fishing & Forestry | 0 (0.0%) | 43 (100.0%) |
| Construction & Extraction | 1,241 (100.0%) | 0 (0.0%) |
| Installation, Maintenance & Repair | 274 (87.3%) | 40 (12.7%) |
| Total (Category) | 1,515 (94.8%) | 83 (5.2%) |
| Total (Overall) | 9,274 (56.6%) | 7,100 (43.4%) |
Production, Transportation and Moving Occupations
The most common Production, Transportation and Moving occupations in Port Chester are Transportation (749 | 4.6%), Material Moving (468 | 2.9%), and Production (424 | 2.6%).
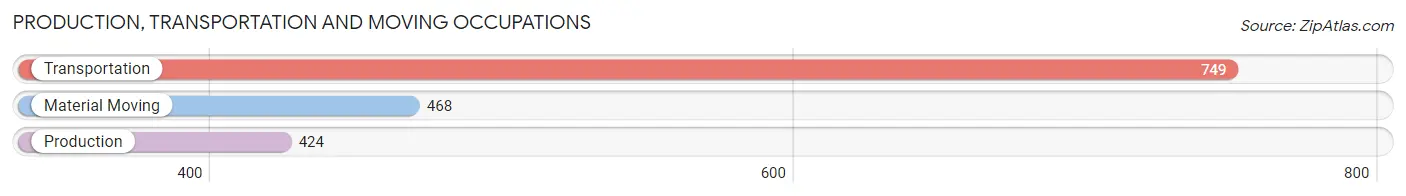
Production, Transportation and Moving Occupations by Sex
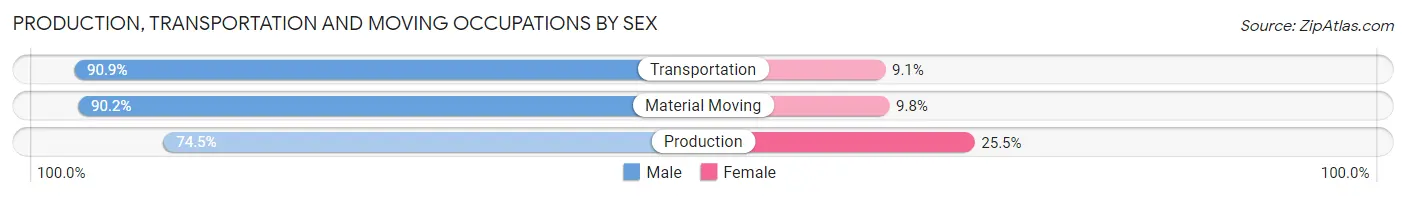
| Occupation | Male | Female |
| Production | 316 (74.5%) | 108 (25.5%) |
| Transportation | 681 (90.9%) | 68 (9.1%) |
| Material Moving | 422 (90.2%) | 46 (9.8%) |
| Total (Category) | 1,419 (86.5%) | 222 (13.5%) |
| Total (Overall) | 9,274 (56.6%) | 7,100 (43.4%) |
Employment Industries by Sex in Port Chester
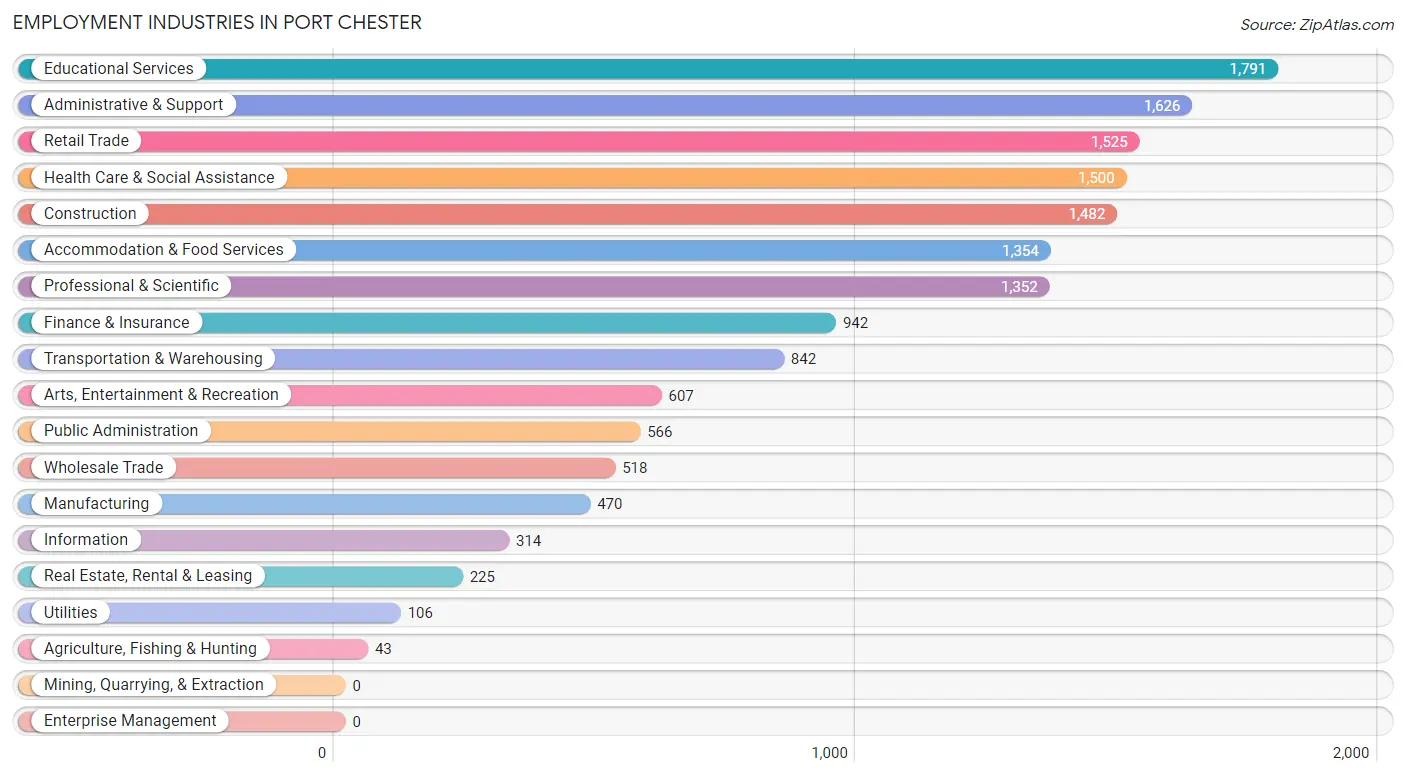
Employment Industries in Port Chester
The major employment industries in Port Chester include Educational Services (1,791 | 10.9%), Administrative & Support (1,626 | 9.9%), Retail Trade (1,525 | 9.3%), Health Care & Social Assistance (1,500 | 9.2%), and Construction (1,482 | 9.0%).
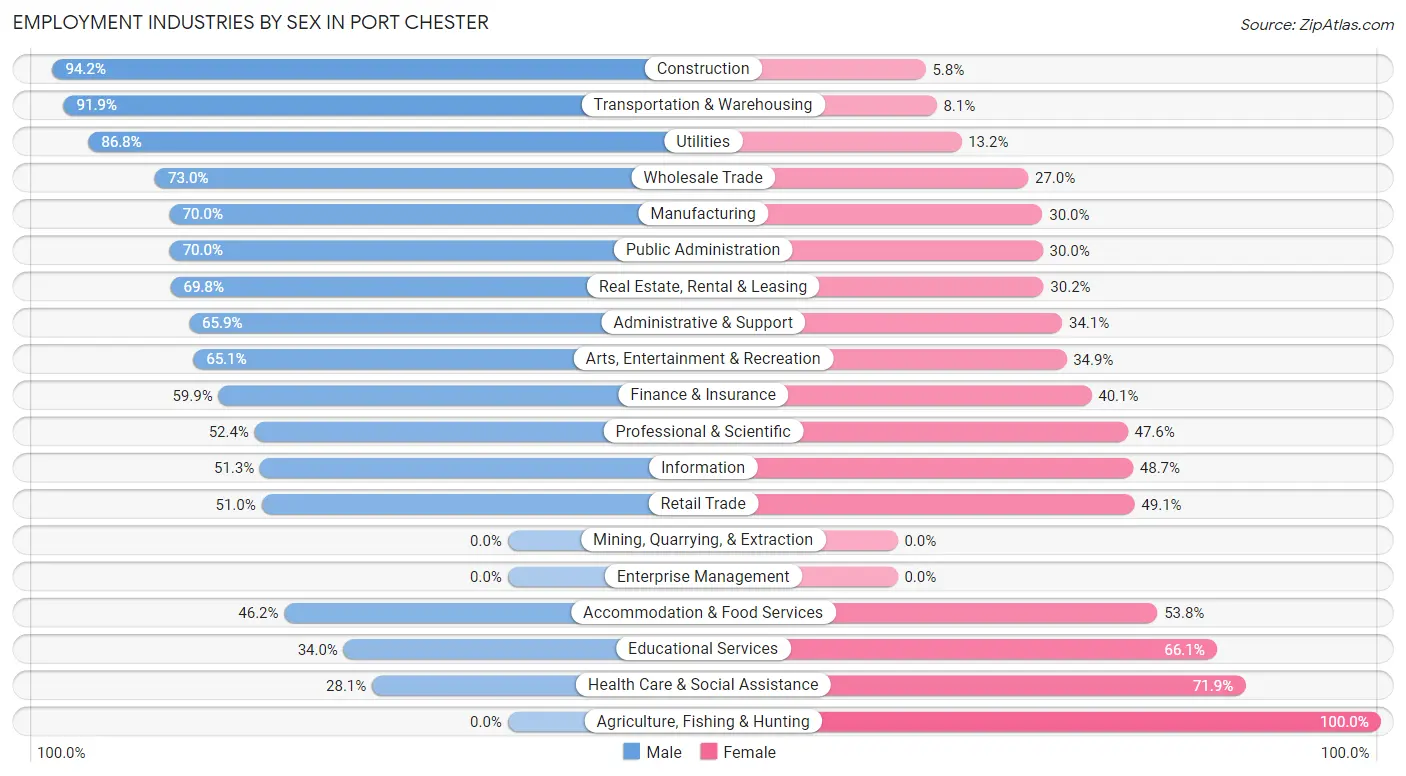
Employment Industries by Sex in Port Chester
The Port Chester industries that see more men than women are Construction (94.2%), Transportation & Warehousing (91.9%), and Utilities (86.8%), whereas the industries that tend to have a higher number of women are Agriculture, Fishing & Hunting (100.0%), Health Care & Social Assistance (71.9%), and Educational Services (66.0%).
| Industry | Male | Female |
| Agriculture, Fishing & Hunting | 0 (0.0%) | 43 (100.0%) |
| Mining, Quarrying, & Extraction | 0 (0.0%) | 0 (0.0%) |
| Construction | 1,396 (94.2%) | 86 (5.8%) |
| Manufacturing | 329 (70.0%) | 141 (30.0%) |
| Wholesale Trade | 378 (73.0%) | 140 (27.0%) |
| Retail Trade | 777 (50.9%) | 748 (49.0%) |
| Transportation & Warehousing | 774 (91.9%) | 68 (8.1%) |
| Utilities | 92 (86.8%) | 14 (13.2%) |
| Information | 161 (51.3%) | 153 (48.7%) |
| Finance & Insurance | 564 (59.9%) | 378 (40.1%) |
| Real Estate, Rental & Leasing | 157 (69.8%) | 68 (30.2%) |
| Professional & Scientific | 708 (52.4%) | 644 (47.6%) |
| Enterprise Management | 0 (0.0%) | 0 (0.0%) |
| Administrative & Support | 1,072 (65.9%) | 554 (34.1%) |
| Educational Services | 608 (34.0%) | 1,183 (66.0%) |
| Health Care & Social Assistance | 421 (28.1%) | 1,079 (71.9%) |
| Arts, Entertainment & Recreation | 395 (65.1%) | 212 (34.9%) |
| Accommodation & Food Services | 626 (46.2%) | 728 (53.8%) |
| Public Administration | 396 (70.0%) | 170 (30.0%) |
| Total | 9,274 (56.6%) | 7,100 (43.4%) |
Education in Port Chester
School Enrollment in Port Chester
The most common levels of schooling among the 7,237 students in Port Chester are college / undergraduate (1,516 | 20.9%), high school (1,457 | 20.1%), and middle school (1,440 | 19.9%).
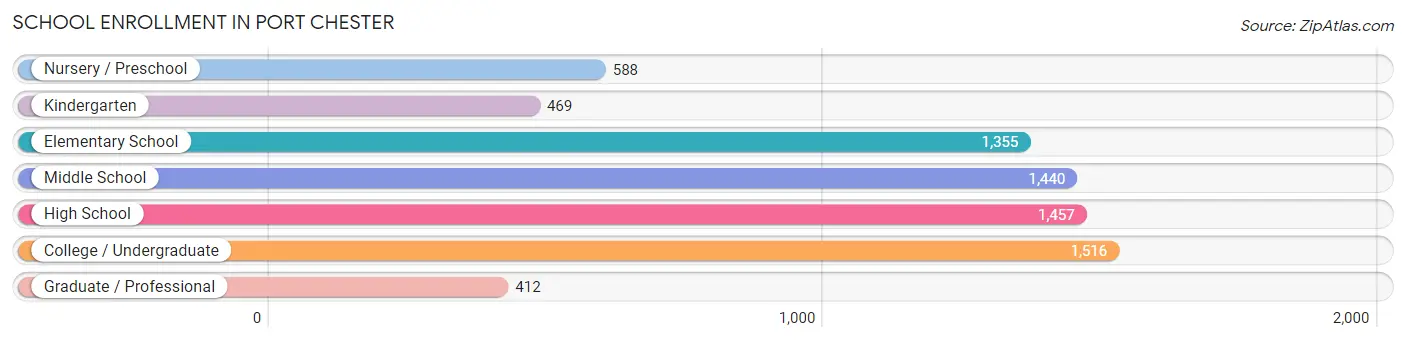
| School Level | # Students | % Students |
| Nursery / Preschool | 588 | 8.1% |
| Kindergarten | 469 | 6.5% |
| Elementary School | 1,355 | 18.7% |
| Middle School | 1,440 | 19.9% |
| High School | 1,457 | 20.1% |
| College / Undergraduate | 1,516 | 20.9% |
| Graduate / Professional | 412 | 5.7% |
| Total | 7,237 | 100.0% |
School Enrollment by Age by Funding Source in Port Chester
Out of a total of 7,237 students who are enrolled in schools in Port Chester, 977 (13.5%) attend a private institution, while the remaining 6,260 (86.5%) are enrolled in public schools. The age group of 20 to 24 year olds has the highest likelihood of being enrolled in private schools, with 339 (35.3% in the age bracket) enrolled. Conversely, the age group of 10 to 14 year olds has the lowest likelihood of being enrolled in a private school, with 1,497 (97.9% in the age bracket) attending a public institution.
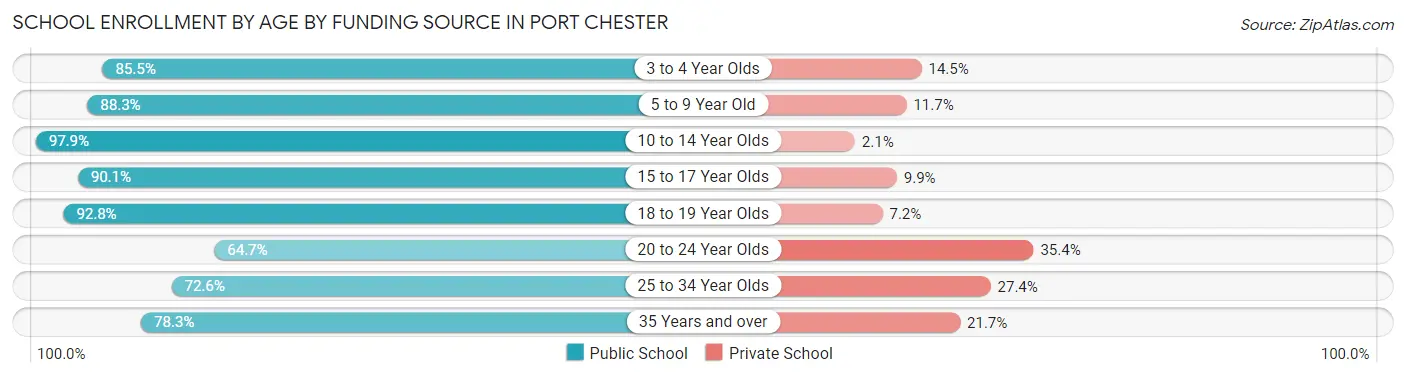
| Age Bracket | Public School | Private School |
| 3 to 4 Year Olds | 383 (85.5%) | 65 (14.5%) |
| 5 to 9 Year Old | 1,720 (88.3%) | 228 (11.7%) |
| 10 to 14 Year Olds | 1,497 (97.9%) | 32 (2.1%) |
| 15 to 17 Year Olds | 873 (90.1%) | 96 (9.9%) |
| 18 to 19 Year Olds | 679 (92.8%) | 53 (7.2%) |
| 20 to 24 Year Olds | 620 (64.6%) | 339 (35.3%) |
| 25 to 34 Year Olds | 276 (72.6%) | 104 (27.4%) |
| 35 Years and over | 213 (78.3%) | 59 (21.7%) |
| Total | 6,260 (86.5%) | 977 (13.5%) |
Educational Attainment by Field of Study in Port Chester
Business (2,239 | 28.9%), social sciences (823 | 10.6%), visual & performing arts (605 | 7.8%), communications (549 | 7.1%), and arts & humanities (488 | 6.3%) are the most common fields of study among 7,750 individuals in Port Chester who have obtained a bachelor's degree or higher.
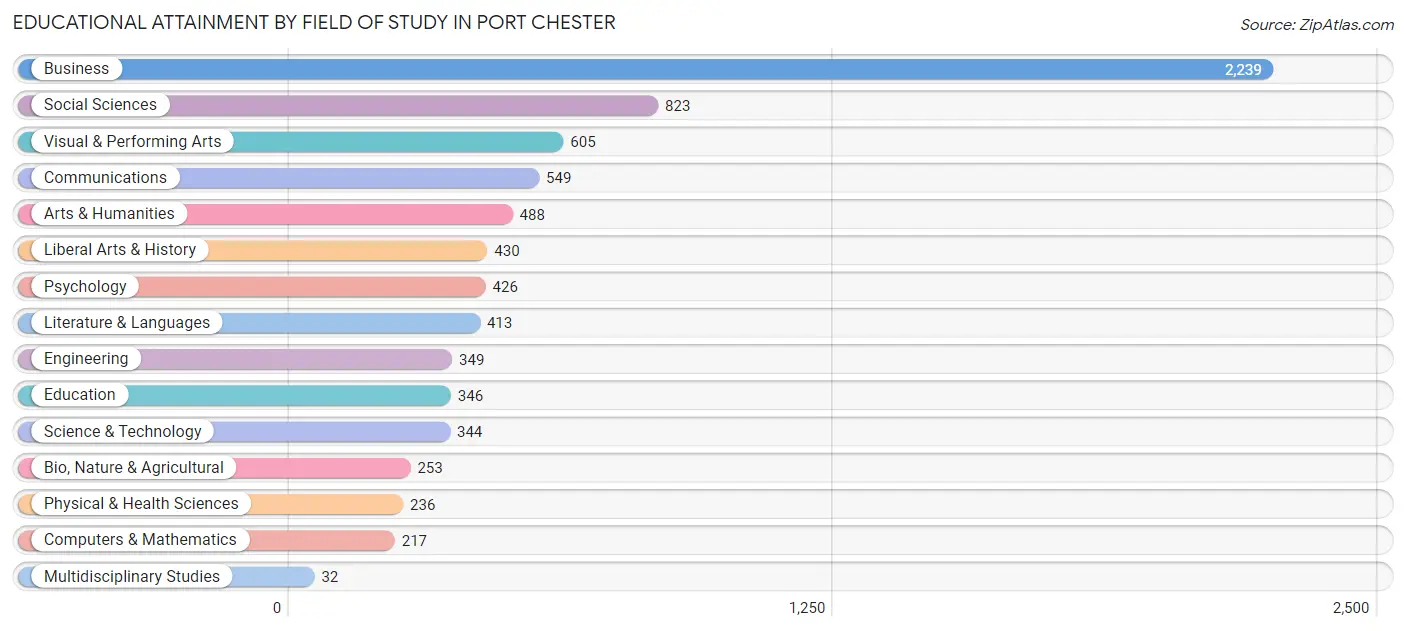
| Field of Study | # Graduates | % Graduates |
| Computers & Mathematics | 217 | 2.8% |
| Bio, Nature & Agricultural | 253 | 3.3% |
| Physical & Health Sciences | 236 | 3.0% |
| Psychology | 426 | 5.5% |
| Social Sciences | 823 | 10.6% |
| Engineering | 349 | 4.5% |
| Multidisciplinary Studies | 32 | 0.4% |
| Science & Technology | 344 | 4.4% |
| Business | 2,239 | 28.9% |
| Education | 346 | 4.5% |
| Literature & Languages | 413 | 5.3% |
| Liberal Arts & History | 430 | 5.6% |
| Visual & Performing Arts | 605 | 7.8% |
| Communications | 549 | 7.1% |
| Arts & Humanities | 488 | 6.3% |
| Total | 7,750 | 100.0% |
Transportation & Commute in Port Chester
Vehicle Availability by Sex in Port Chester
The most prevalent vehicle ownership categories in Port Chester are males with 2 vehicles (2,971, accounting for 32.6%) and females with 2 vehicles (2,292, making up 44.2%).
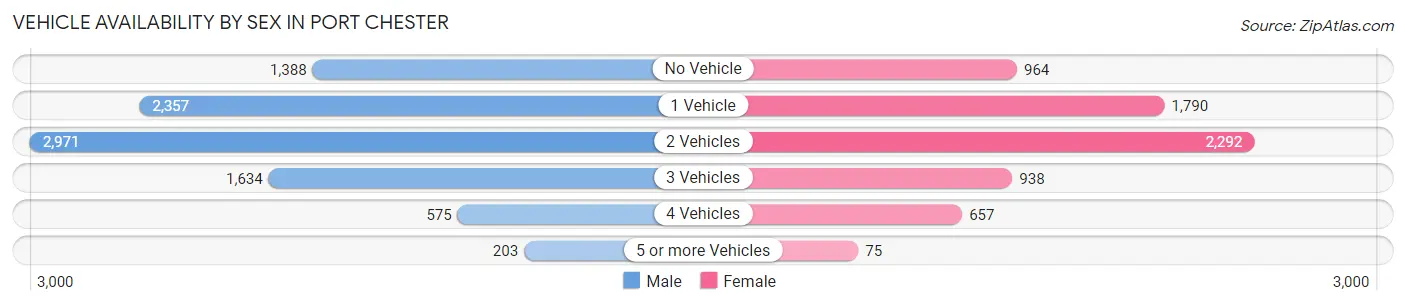
| Vehicles Available | Male | Female |
| No Vehicle | 1,388 (15.2%) | 964 (14.3%) |
| 1 Vehicle | 2,357 (25.8%) | 1,790 (26.7%) |
| 2 Vehicles | 2,971 (32.6%) | 2,292 (34.1%) |
| 3 Vehicles | 1,634 (17.9%) | 938 (14.0%) |
| 4 Vehicles | 575 (6.3%) | 657 (9.8%) |
| 5 or more Vehicles | 203 (2.2%) | 75 (1.1%) |
| Total | 9,128 (100.0%) | 6,716 (100.0%) |
Commute Time in Port Chester
The most frequently occuring commute durations in Port Chester are 15 to 19 minutes (2,707 commuters, 18.8%), 5 to 9 minutes (2,194 commuters, 15.2%), and 10 to 14 minutes (2,165 commuters, 15.0%).
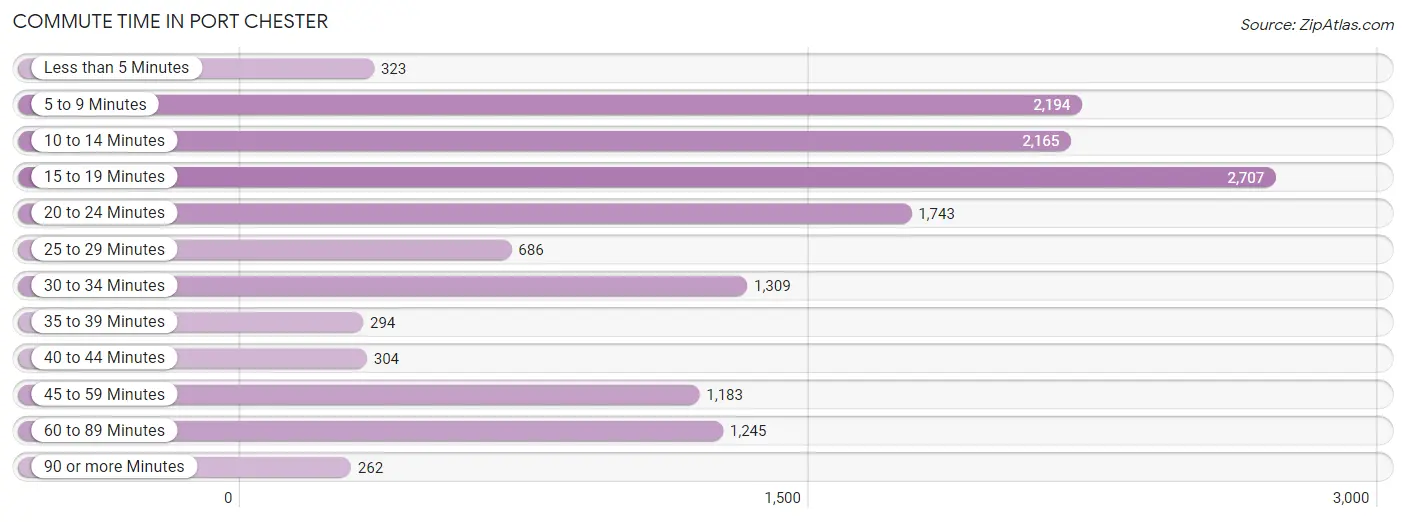
| Commute Time | # Commuters | % Commuters |
| Less than 5 Minutes | 323 | 2.2% |
| 5 to 9 Minutes | 2,194 | 15.2% |
| 10 to 14 Minutes | 2,165 | 15.0% |
| 15 to 19 Minutes | 2,707 | 18.8% |
| 20 to 24 Minutes | 1,743 | 12.1% |
| 25 to 29 Minutes | 686 | 4.8% |
| 30 to 34 Minutes | 1,309 | 9.1% |
| 35 to 39 Minutes | 294 | 2.0% |
| 40 to 44 Minutes | 304 | 2.1% |
| 45 to 59 Minutes | 1,183 | 8.2% |
| 60 to 89 Minutes | 1,245 | 8.6% |
| 90 or more Minutes | 262 | 1.8% |
Commute Time by Sex in Port Chester
The most common commute times in Port Chester are 5 to 9 minutes (1,664 commuters, 19.7%) for males and 15 to 19 minutes (1,145 commuters, 19.2%) for females.
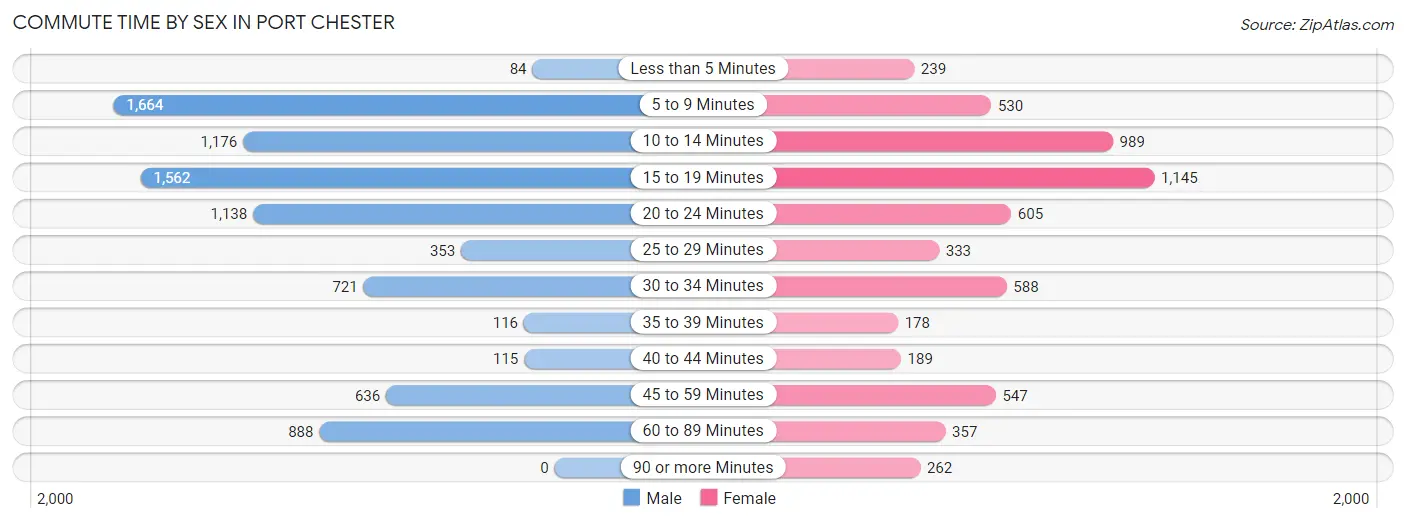
| Commute Time | Male | Female |
| Less than 5 Minutes | 84 (1.0%) | 239 (4.0%) |
| 5 to 9 Minutes | 1,664 (19.7%) | 530 (8.9%) |
| 10 to 14 Minutes | 1,176 (13.9%) | 989 (16.6%) |
| 15 to 19 Minutes | 1,562 (18.5%) | 1,145 (19.2%) |
| 20 to 24 Minutes | 1,138 (13.5%) | 605 (10.2%) |
| 25 to 29 Minutes | 353 (4.2%) | 333 (5.6%) |
| 30 to 34 Minutes | 721 (8.5%) | 588 (9.9%) |
| 35 to 39 Minutes | 116 (1.4%) | 178 (3.0%) |
| 40 to 44 Minutes | 115 (1.4%) | 189 (3.2%) |
| 45 to 59 Minutes | 636 (7.5%) | 547 (9.2%) |
| 60 to 89 Minutes | 888 (10.5%) | 357 (6.0%) |
| 90 or more Minutes | 0 (0.0%) | 262 (4.4%) |
Time of Departure to Work by Sex in Port Chester
The most frequent times of departure to work in Port Chester are 7:00 AM to 7:29 AM (1,271, 15.0%) for males and 8:00 AM to 8:29 AM (1,008, 16.9%) for females.
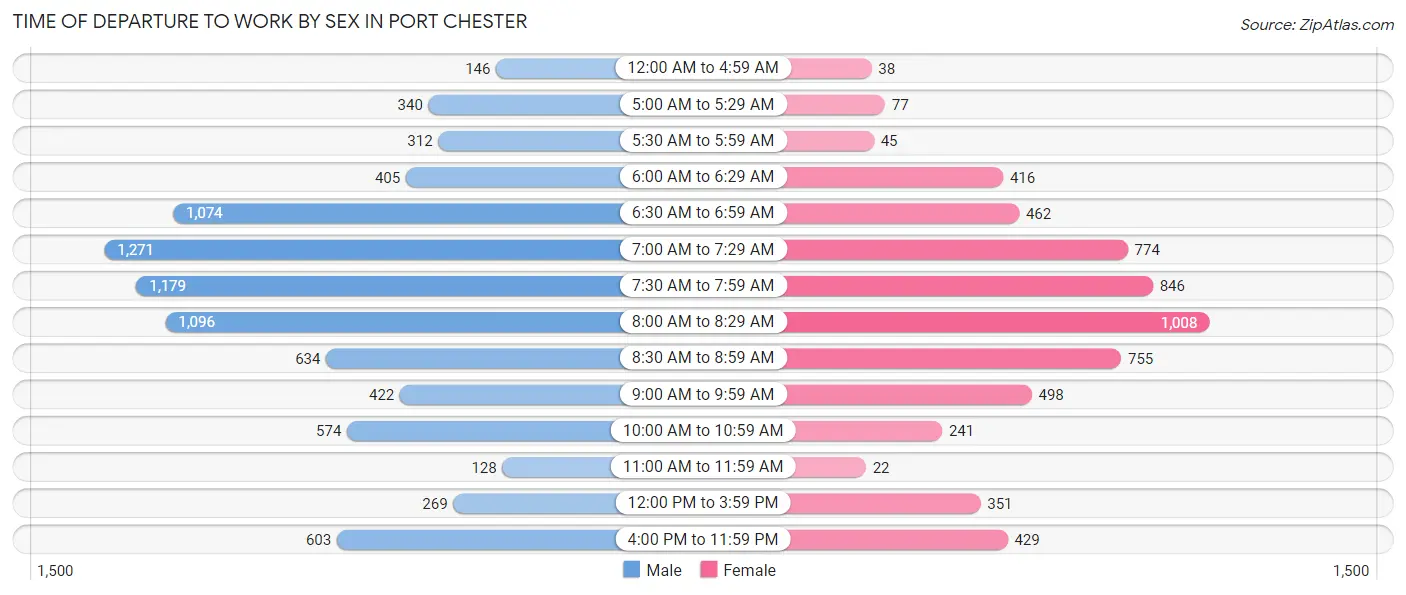
| Time of Departure | Male | Female |
| 12:00 AM to 4:59 AM | 146 (1.7%) | 38 (0.6%) |
| 5:00 AM to 5:29 AM | 340 (4.0%) | 77 (1.3%) |
| 5:30 AM to 5:59 AM | 312 (3.7%) | 45 (0.7%) |
| 6:00 AM to 6:29 AM | 405 (4.8%) | 416 (7.0%) |
| 6:30 AM to 6:59 AM | 1,074 (12.7%) | 462 (7.7%) |
| 7:00 AM to 7:29 AM | 1,271 (15.0%) | 774 (13.0%) |
| 7:30 AM to 7:59 AM | 1,179 (14.0%) | 846 (14.2%) |
| 8:00 AM to 8:29 AM | 1,096 (13.0%) | 1,008 (16.9%) |
| 8:30 AM to 8:59 AM | 634 (7.5%) | 755 (12.7%) |
| 9:00 AM to 9:59 AM | 422 (5.0%) | 498 (8.4%) |
| 10:00 AM to 10:59 AM | 574 (6.8%) | 241 (4.0%) |
| 11:00 AM to 11:59 AM | 128 (1.5%) | 22 (0.4%) |
| 12:00 PM to 3:59 PM | 269 (3.2%) | 351 (5.9%) |
| 4:00 PM to 11:59 PM | 603 (7.1%) | 429 (7.2%) |
| Total | 8,453 (100.0%) | 5,962 (100.0%) |
Housing Occupancy in Port Chester
Occupancy by Ownership in Port Chester
Of the total 10,211 dwellings in Port Chester, owner-occupied units account for 4,600 (45.1%), while renter-occupied units make up 5,611 (54.9%).
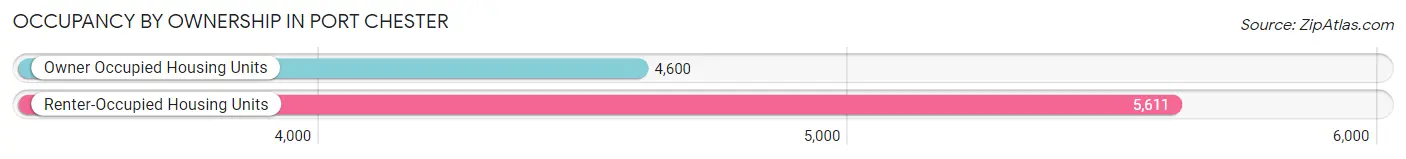
| Occupancy | # Housing Units | % Housing Units |
| Owner Occupied Housing Units | 4,600 | 45.1% |
| Renter-Occupied Housing Units | 5,611 | 54.9% |
| Total Occupied Housing Units | 10,211 | 100.0% |
Occupancy by Household Size in Port Chester
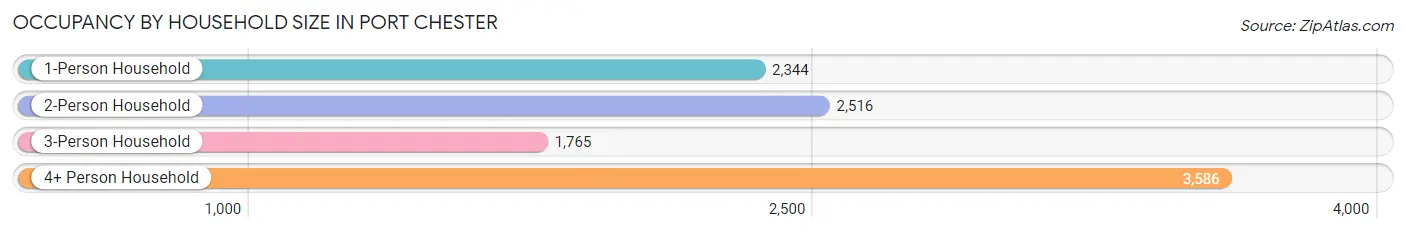
| Household Size | # Housing Units | % Housing Units |
| 1-Person Household | 2,344 | 23.0% |
| 2-Person Household | 2,516 | 24.6% |
| 3-Person Household | 1,765 | 17.3% |
| 4+ Person Household | 3,586 | 35.1% |
| Total Housing Units | 10,211 | 100.0% |
Occupancy by Ownership by Household Size in Port Chester
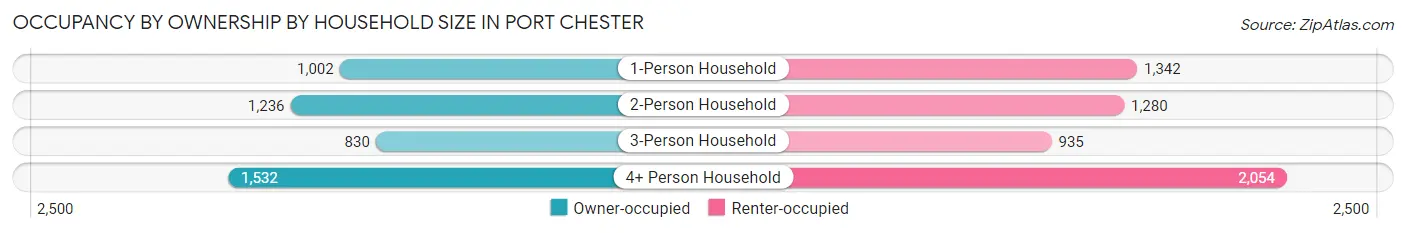
| Household Size | Owner-occupied | Renter-occupied |
| 1-Person Household | 1,002 (42.7%) | 1,342 (57.3%) |
| 2-Person Household | 1,236 (49.1%) | 1,280 (50.9%) |
| 3-Person Household | 830 (47.0%) | 935 (53.0%) |
| 4+ Person Household | 1,532 (42.7%) | 2,054 (57.3%) |
| Total Housing Units | 4,600 (45.1%) | 5,611 (54.9%) |
Occupancy by Educational Attainment in Port Chester
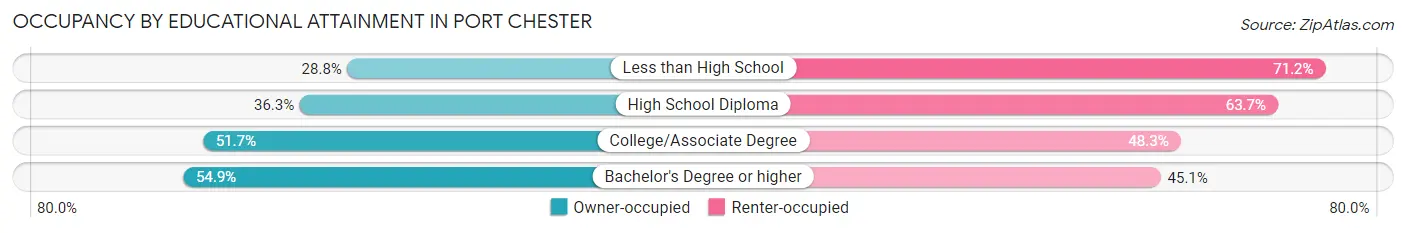
| Household Size | Owner-occupied | Renter-occupied |
| Less than High School | 610 (28.8%) | 1,511 (71.2%) |
| High School Diploma | 740 (36.3%) | 1,298 (63.7%) |
| College/Associate Degree | 1,175 (51.7%) | 1,096 (48.3%) |
| Bachelor's Degree or higher | 2,075 (54.9%) | 1,706 (45.1%) |
Occupancy by Age of Householder in Port Chester
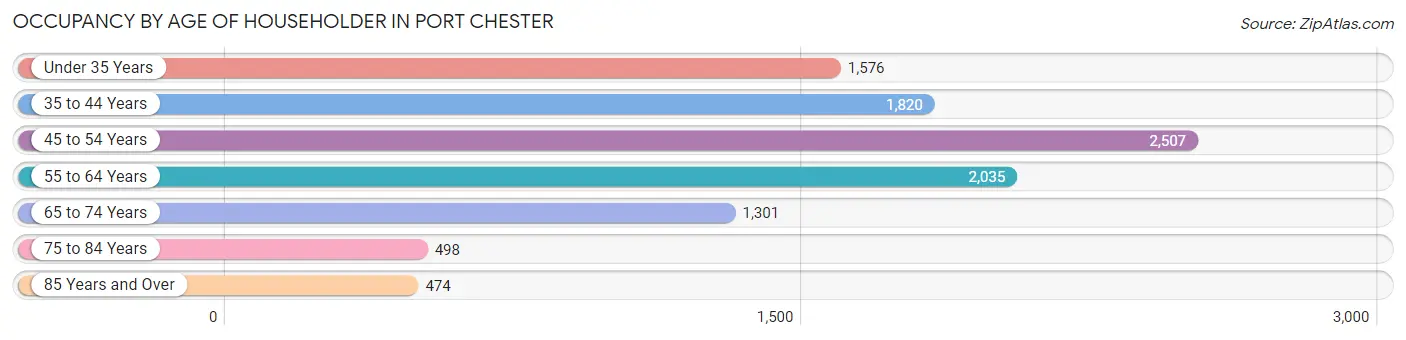
| Age Bracket | # Households | % Households |
| Under 35 Years | 1,576 | 15.4% |
| 35 to 44 Years | 1,820 | 17.8% |
| 45 to 54 Years | 2,507 | 24.5% |
| 55 to 64 Years | 2,035 | 19.9% |
| 65 to 74 Years | 1,301 | 12.7% |
| 75 to 84 Years | 498 | 4.9% |
| 85 Years and Over | 474 | 4.6% |
| Total | 10,211 | 100.0% |
Housing Finances in Port Chester
Median Income by Occupancy in Port Chester
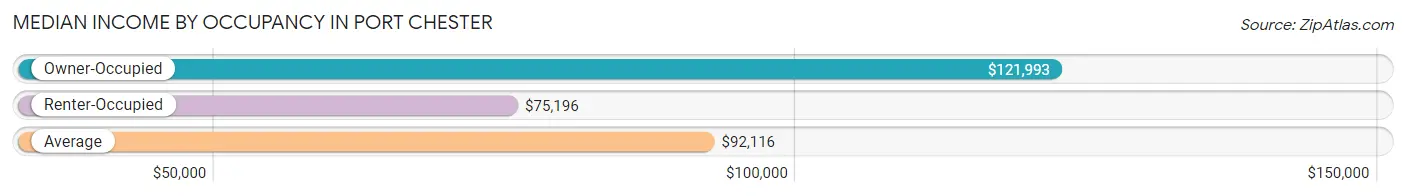
| Occupancy Type | # Households | Median Income |
| Owner-Occupied | 4,600 (45.1%) | $121,993 |
| Renter-Occupied | 5,611 (54.9%) | $75,196 |
| Average | 10,211 (100.0%) | $92,116 |
Occupancy by Householder Income Bracket in Port Chester
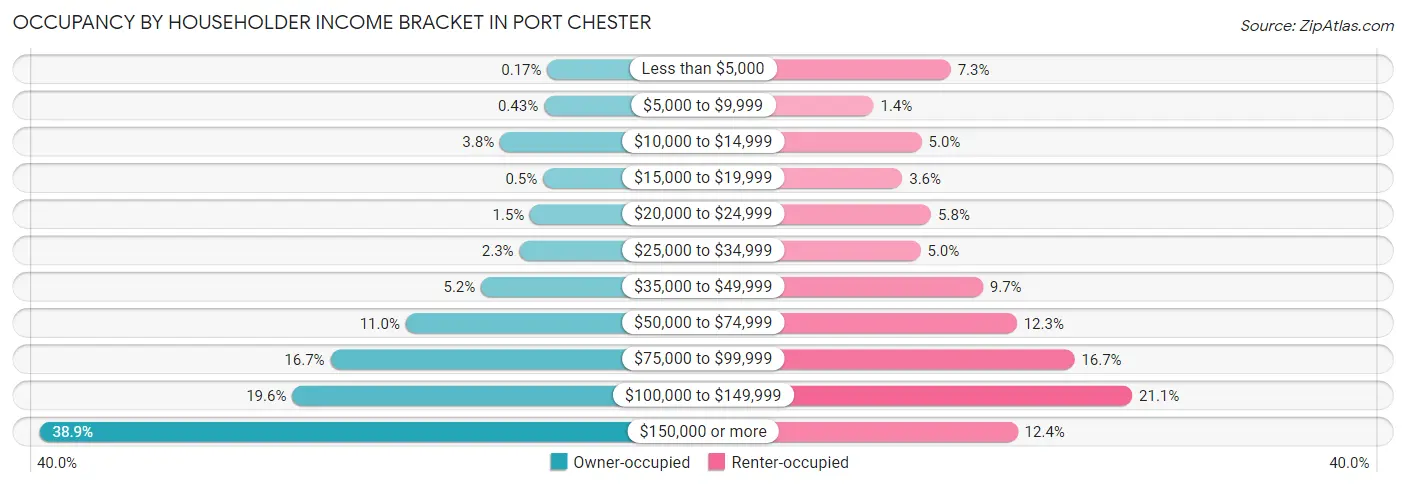
| Income Bracket | Owner-occupied | Renter-occupied |
| Less than $5,000 | 8 (0.2%) | 407 (7.2%) |
| $5,000 to $9,999 | 20 (0.4%) | 77 (1.4%) |
| $10,000 to $14,999 | 174 (3.8%) | 282 (5.0%) |
| $15,000 to $19,999 | 23 (0.5%) | 200 (3.6%) |
| $20,000 to $24,999 | 68 (1.5%) | 323 (5.8%) |
| $25,000 to $34,999 | 106 (2.3%) | 278 (5.0%) |
| $35,000 to $49,999 | 240 (5.2%) | 544 (9.7%) |
| $50,000 to $74,999 | 504 (11.0%) | 689 (12.3%) |
| $75,000 to $99,999 | 768 (16.7%) | 936 (16.7%) |
| $100,000 to $149,999 | 902 (19.6%) | 1,182 (21.1%) |
| $150,000 or more | 1,787 (38.9%) | 693 (12.3%) |
| Total | 4,600 (100.0%) | 5,611 (100.0%) |
Monthly Housing Cost Tiers in Port Chester
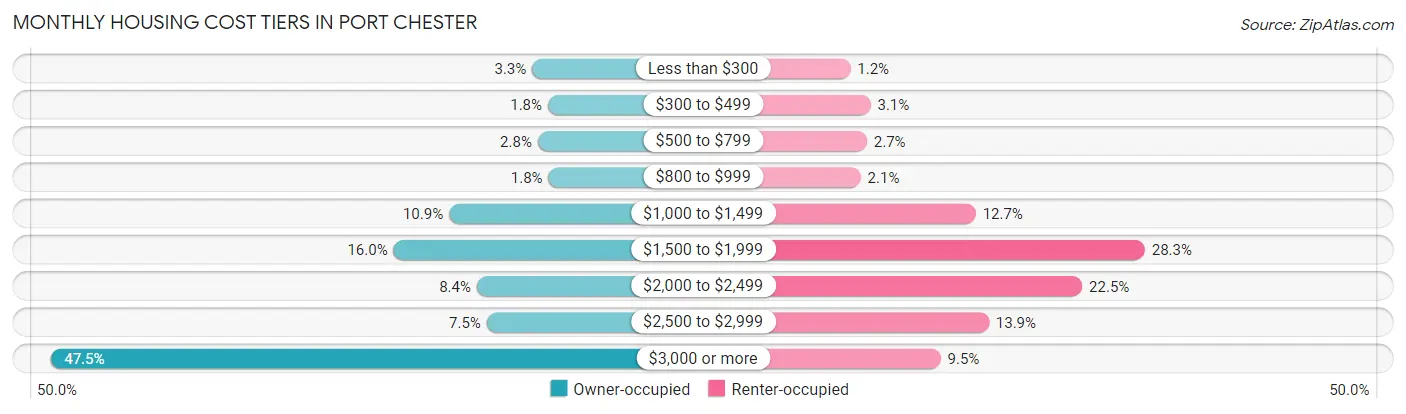
| Monthly Cost | Owner-occupied | Renter-occupied |
| Less than $300 | 151 (3.3%) | 67 (1.2%) |
| $300 to $499 | 84 (1.8%) | 171 (3.0%) |
| $500 to $799 | 127 (2.8%) | 152 (2.7%) |
| $800 to $999 | 82 (1.8%) | 120 (2.1%) |
| $1,000 to $1,499 | 503 (10.9%) | 714 (12.7%) |
| $1,500 to $1,999 | 738 (16.0%) | 1,588 (28.3%) |
| $2,000 to $2,499 | 385 (8.4%) | 1,264 (22.5%) |
| $2,500 to $2,999 | 343 (7.5%) | 782 (13.9%) |
| $3,000 or more | 2,187 (47.5%) | 533 (9.5%) |
| Total | 4,600 (100.0%) | 5,611 (100.0%) |
Physical Housing Characteristics in Port Chester
Housing Structures in Port Chester
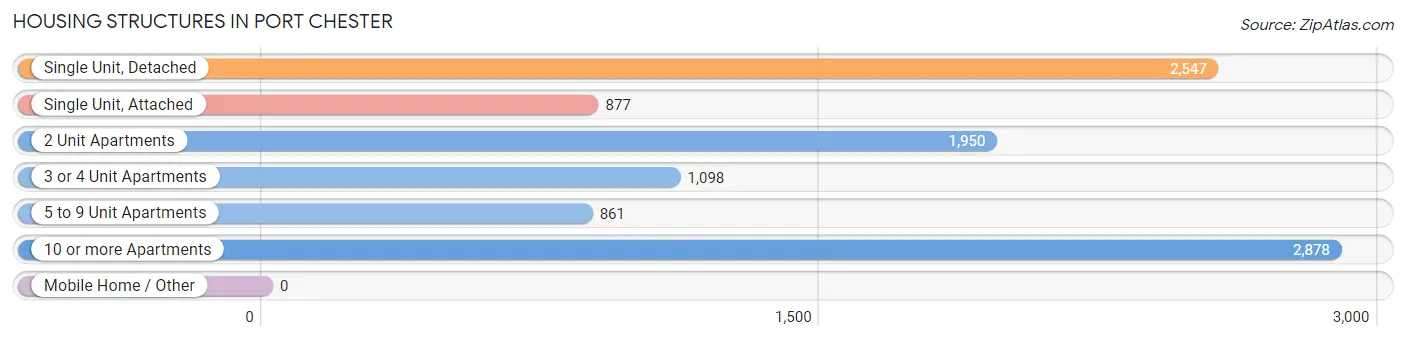
| Structure Type | # Housing Units | % Housing Units |
| Single Unit, Detached | 2,547 | 24.9% |
| Single Unit, Attached | 877 | 8.6% |
| 2 Unit Apartments | 1,950 | 19.1% |
| 3 or 4 Unit Apartments | 1,098 | 10.7% |
| 5 to 9 Unit Apartments | 861 | 8.4% |
| 10 or more Apartments | 2,878 | 28.2% |
| Mobile Home / Other | 0 | 0.0% |
| Total | 10,211 | 100.0% |
Housing Structures by Occupancy in Port Chester
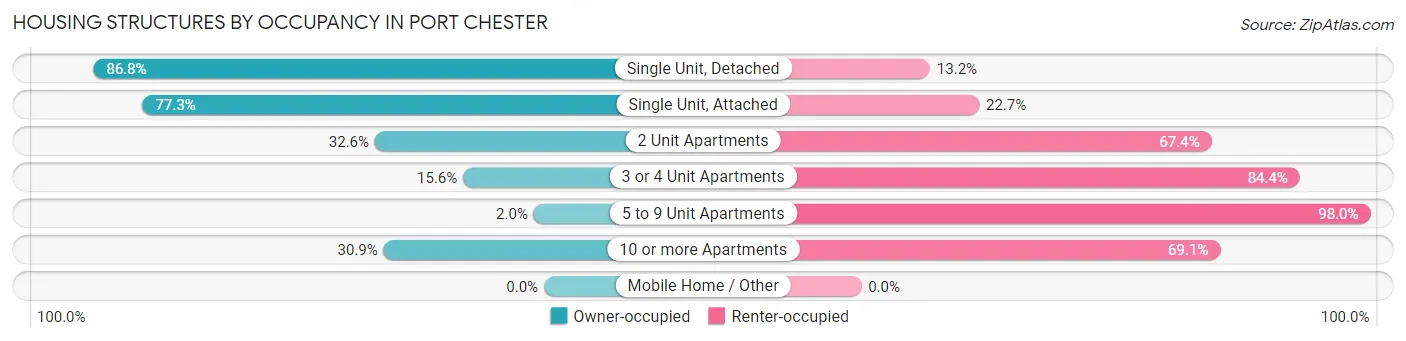
| Structure Type | Owner-occupied | Renter-occupied |
| Single Unit, Detached | 2,210 (86.8%) | 337 (13.2%) |
| Single Unit, Attached | 678 (77.3%) | 199 (22.7%) |
| 2 Unit Apartments | 635 (32.6%) | 1,315 (67.4%) |
| 3 or 4 Unit Apartments | 171 (15.6%) | 927 (84.4%) |
| 5 to 9 Unit Apartments | 17 (2.0%) | 844 (98.0%) |
| 10 or more Apartments | 889 (30.9%) | 1,989 (69.1%) |
| Mobile Home / Other | 0 (0.0%) | 0 (0.0%) |
| Total | 4,600 (45.1%) | 5,611 (54.9%) |
Housing Structures by Number of Rooms in Port Chester
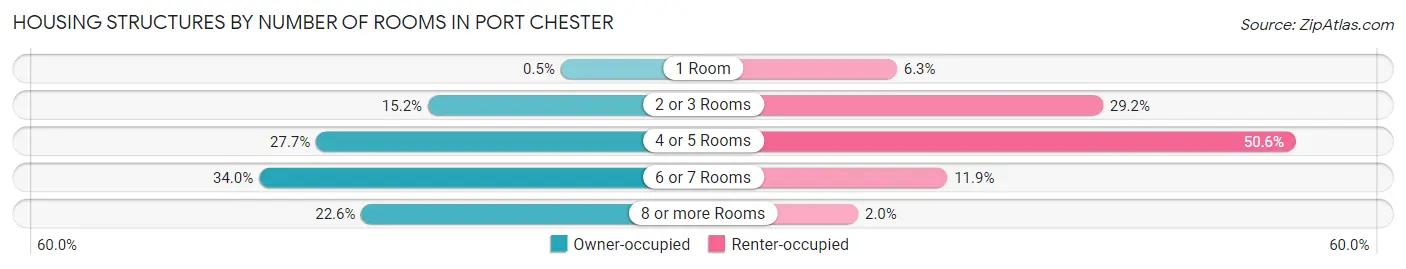
| Number of Rooms | Owner-occupied | Renter-occupied |
| 1 Room | 23 (0.5%) | 354 (6.3%) |
| 2 or 3 Rooms | 701 (15.2%) | 1,637 (29.2%) |
| 4 or 5 Rooms | 1,272 (27.7%) | 2,839 (50.6%) |
| 6 or 7 Rooms | 1,563 (34.0%) | 668 (11.9%) |
| 8 or more Rooms | 1,041 (22.6%) | 113 (2.0%) |
| Total | 4,600 (100.0%) | 5,611 (100.0%) |
Housing Structure by Heating Type in Port Chester
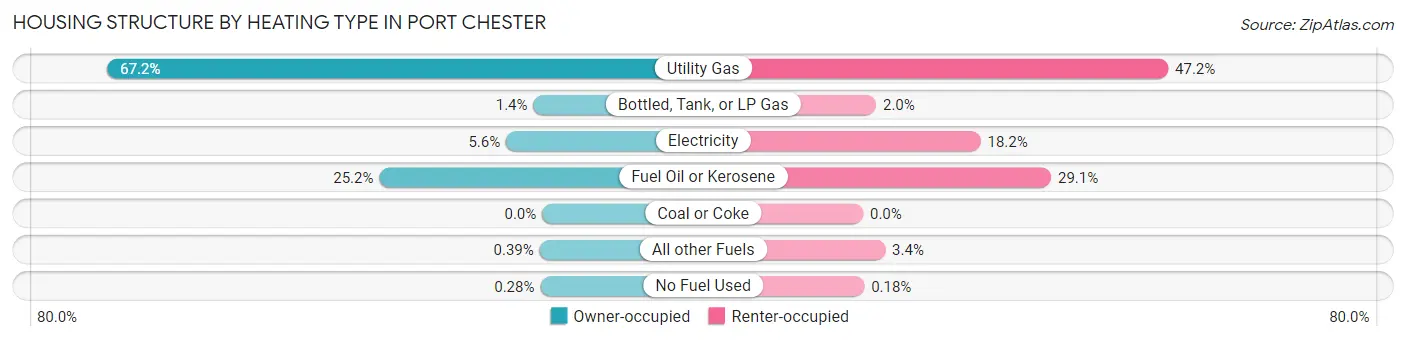
| Heating Type | Owner-occupied | Renter-occupied |
| Utility Gas | 3,093 (67.2%) | 2,646 (47.2%) |
| Bottled, Tank, or LP Gas | 62 (1.3%) | 113 (2.0%) |
| Electricity | 256 (5.6%) | 1,019 (18.2%) |
| Fuel Oil or Kerosene | 1,158 (25.2%) | 1,631 (29.1%) |
| Coal or Coke | 0 (0.0%) | 0 (0.0%) |
| All other Fuels | 18 (0.4%) | 192 (3.4%) |
| No Fuel Used | 13 (0.3%) | 10 (0.2%) |
| Total | 4,600 (100.0%) | 5,611 (100.0%) |
Household Vehicle Usage in Port Chester
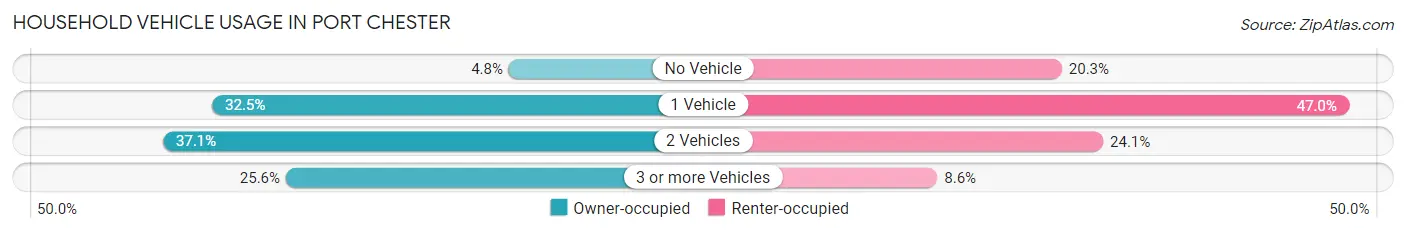
| Vehicles per Household | Owner-occupied | Renter-occupied |
| No Vehicle | 221 (4.8%) | 1,136 (20.3%) |
| 1 Vehicle | 1,495 (32.5%) | 2,639 (47.0%) |
| 2 Vehicles | 1,706 (37.1%) | 1,352 (24.1%) |
| 3 or more Vehicles | 1,178 (25.6%) | 484 (8.6%) |
| Total | 4,600 (100.0%) | 5,611 (100.0%) |
Real Estate & Mortgages in Port Chester
Real Estate and Mortgage Overview in Port Chester
| Characteristic | Without Mortgage | With Mortgage |
| Housing Units | 1,338 | 3,262 |
| Median Property Value | $495,800 | $562,500 |
| Median Household Income | $90,139 | $1,425 |
| Monthly Housing Costs | $1,501 | $2,187 |
| Real Estate Taxes | $10,001 | $215 |
Property Value by Mortgage Status in Port Chester
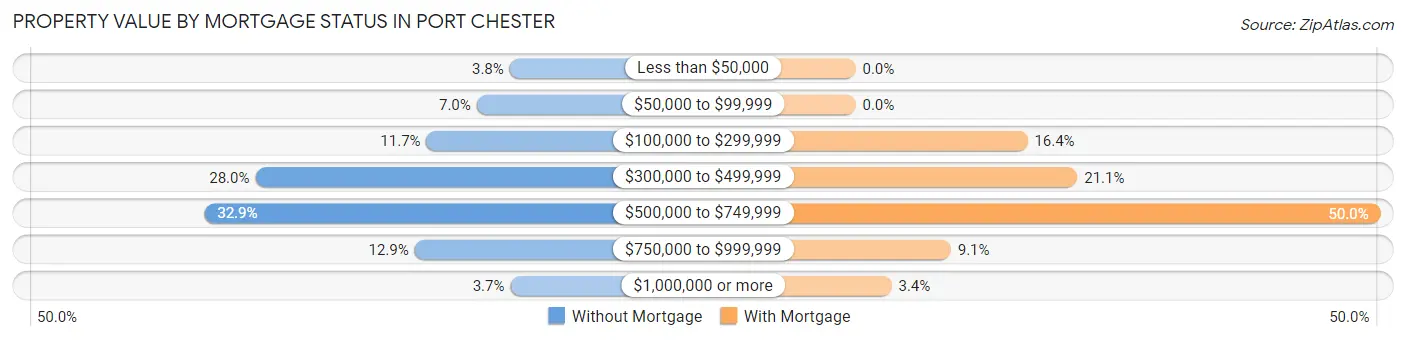
| Property Value | Without Mortgage | With Mortgage |
| Less than $50,000 | 51 (3.8%) | 0 (0.0%) |
| $50,000 to $99,999 | 93 (7.0%) | 0 (0.0%) |
| $100,000 to $299,999 | 157 (11.7%) | 534 (16.4%) |
| $300,000 to $499,999 | 375 (28.0%) | 689 (21.1%) |
| $500,000 to $749,999 | 440 (32.9%) | 1,631 (50.0%) |
| $750,000 to $999,999 | 172 (12.9%) | 296 (9.1%) |
| $1,000,000 or more | 50 (3.7%) | 112 (3.4%) |
| Total | 1,338 (100.0%) | 3,262 (100.0%) |
Household Income by Mortgage Status in Port Chester
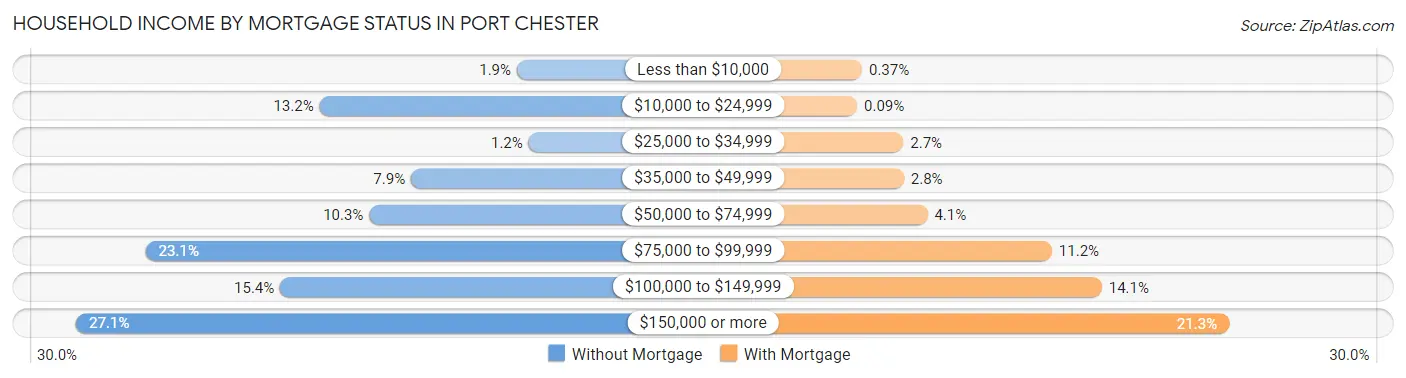
| Household Income | Without Mortgage | With Mortgage |
| Less than $10,000 | 25 (1.9%) | 12 (0.4%) |
| $10,000 to $24,999 | 176 (13.2%) | 3 (0.1%) |
| $25,000 to $34,999 | 16 (1.2%) | 89 (2.7%) |
| $35,000 to $49,999 | 106 (7.9%) | 90 (2.8%) |
| $50,000 to $74,999 | 138 (10.3%) | 134 (4.1%) |
| $75,000 to $99,999 | 309 (23.1%) | 366 (11.2%) |
| $100,000 to $149,999 | 206 (15.4%) | 459 (14.1%) |
| $150,000 or more | 362 (27.1%) | 696 (21.3%) |
| Total | 1,338 (100.0%) | 3,262 (100.0%) |
Property Value to Household Income Ratio in Port Chester
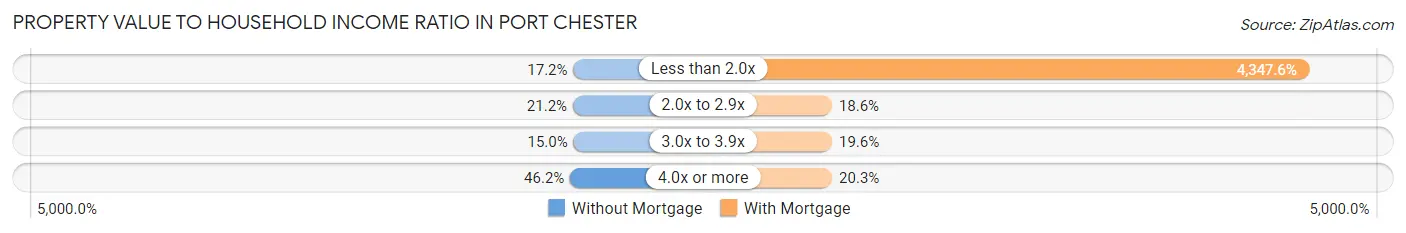
| Value-to-Income Ratio | Without Mortgage | With Mortgage |
| Less than 2.0x | 230 (17.2%) | 141,818 (4,347.6%) |
| 2.0x to 2.9x | 284 (21.2%) | 606 (18.6%) |
| 3.0x to 3.9x | 201 (15.0%) | 640 (19.6%) |
| 4.0x or more | 618 (46.2%) | 662 (20.3%) |
| Total | 1,338 (100.0%) | 3,262 (100.0%) |
Real Estate Taxes by Mortgage Status in Port Chester
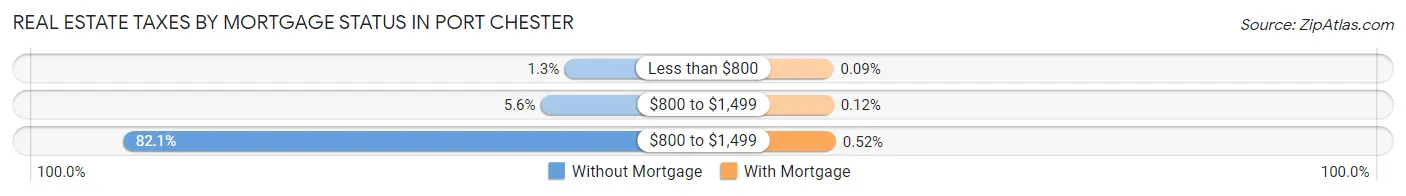
| Property Taxes | Without Mortgage | With Mortgage |
| Less than $800 | 17 (1.3%) | 3 (0.1%) |
| $800 to $1,499 | 75 (5.6%) | 4 (0.1%) |
| $800 to $1,499 | 1,098 (82.1%) | 17 (0.5%) |
| Total | 1,338 (100.0%) | 3,262 (100.0%) |
Health & Disability in Port Chester
Health Insurance Coverage by Age in Port Chester
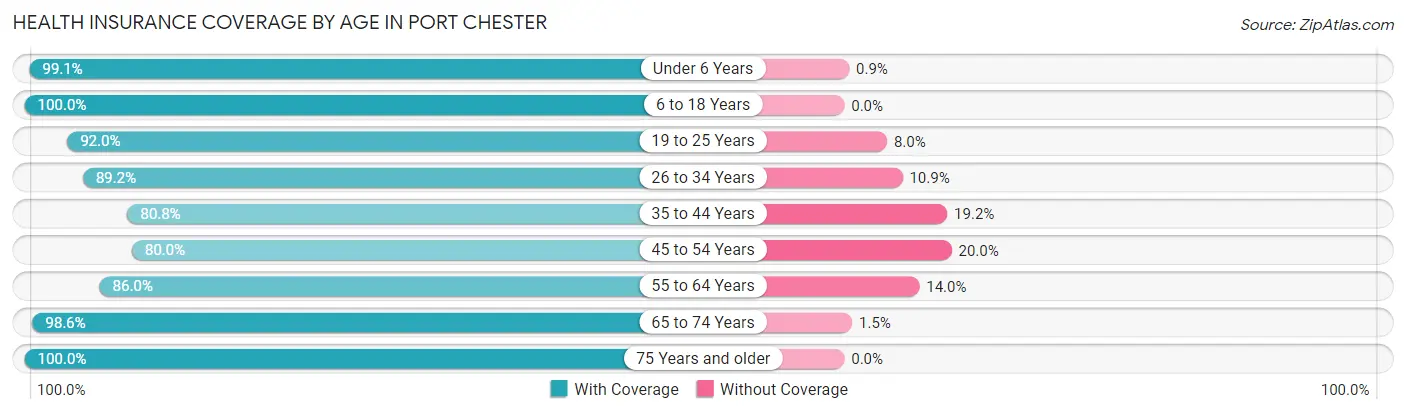
| Age Bracket | With Coverage | Without Coverage |
| Under 6 Years | 2,323 (99.1%) | 21 (0.9%) |
| 6 to 18 Years | 4,590 (100.0%) | 0 (0.0%) |
| 19 to 25 Years | 3,099 (92.0%) | 268 (8.0%) |
| 26 to 34 Years | 3,516 (89.1%) | 428 (10.8%) |
| 35 to 44 Years | 3,620 (80.8%) | 859 (19.2%) |
| 45 to 54 Years | 3,963 (80.0%) | 991 (20.0%) |
| 55 to 64 Years | 3,240 (86.0%) | 527 (14.0%) |
| 65 to 74 Years | 2,109 (98.6%) | 31 (1.5%) |
| 75 Years and older | 1,553 (100.0%) | 0 (0.0%) |
| Total | 28,013 (90.0%) | 3,125 (10.0%) |
Health Insurance Coverage by Citizenship Status in Port Chester
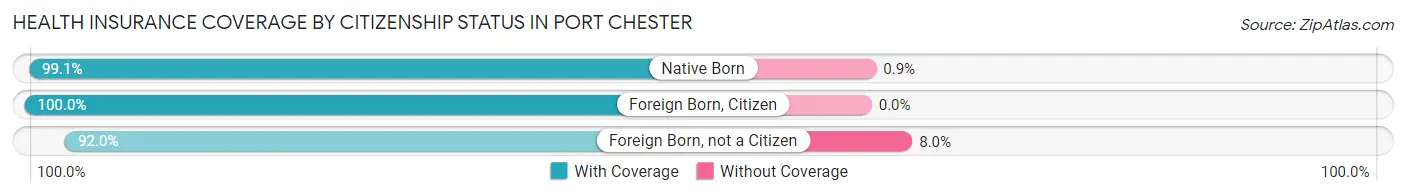
| Citizenship Status | With Coverage | Without Coverage |
| Native Born | 2,323 (99.1%) | 21 (0.9%) |
| Foreign Born, Citizen | 4,590 (100.0%) | 0 (0.0%) |
| Foreign Born, not a Citizen | 3,099 (92.0%) | 268 (8.0%) |
Health Insurance Coverage by Household Income in Port Chester
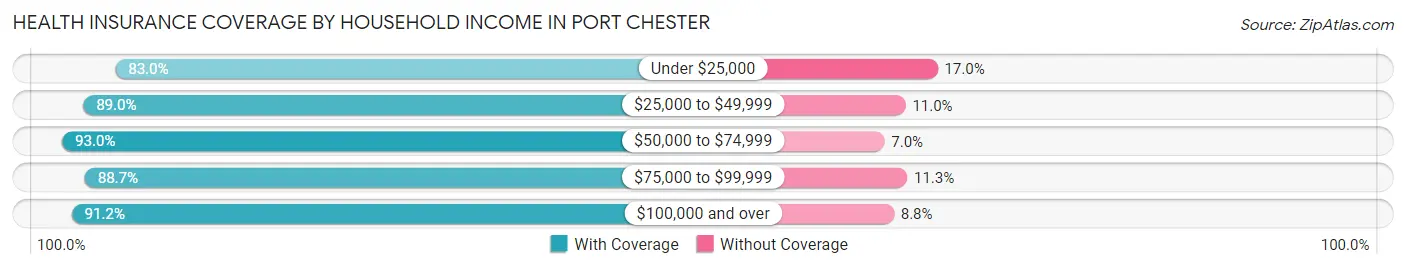
| Household Income | With Coverage | Without Coverage |
| Under $25,000 | 2,828 (83.0%) | 579 (17.0%) |
| $25,000 to $49,999 | 2,568 (89.0%) | 317 (11.0%) |
| $50,000 to $74,999 | 3,281 (93.0%) | 248 (7.0%) |
| $75,000 to $99,999 | 4,131 (88.7%) | 526 (11.3%) |
| $100,000 and over | 15,076 (91.2%) | 1,455 (8.8%) |
Public vs Private Health Insurance Coverage by Age in Port Chester
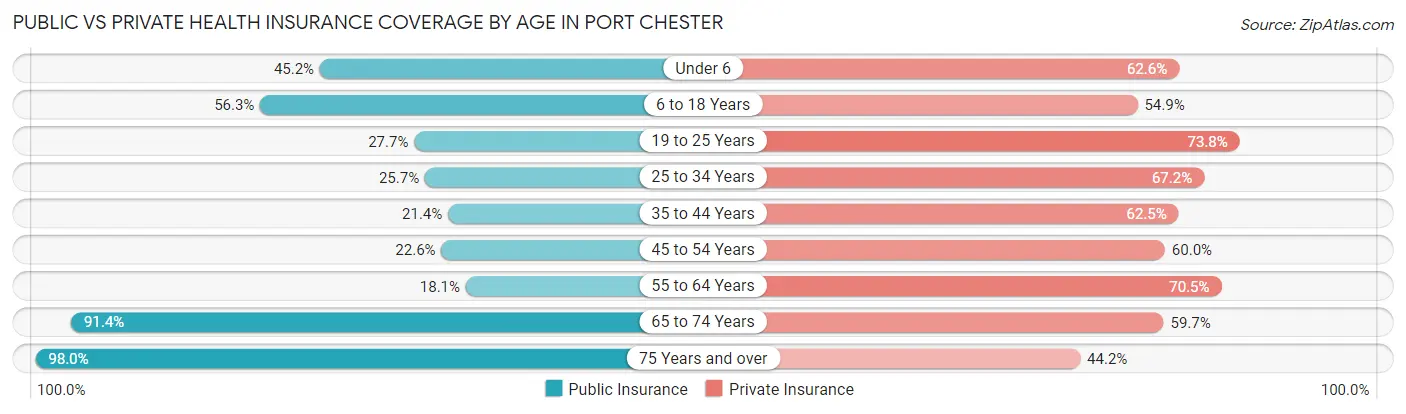
| Age Bracket | Public Insurance | Private Insurance |
| Under 6 | 1,059 (45.2%) | 1,467 (62.6%) |
| 6 to 18 Years | 2,583 (56.3%) | 2,519 (54.9%) |
| 19 to 25 Years | 932 (27.7%) | 2,486 (73.8%) |
| 25 to 34 Years | 1,013 (25.7%) | 2,651 (67.2%) |
| 35 to 44 Years | 958 (21.4%) | 2,800 (62.5%) |
| 45 to 54 Years | 1,121 (22.6%) | 2,971 (60.0%) |
| 55 to 64 Years | 682 (18.1%) | 2,654 (70.5%) |
| 65 to 74 Years | 1,956 (91.4%) | 1,278 (59.7%) |
| 75 Years and over | 1,522 (98.0%) | 687 (44.2%) |
| Total | 11,826 (38.0%) | 19,513 (62.7%) |
Disability Status by Sex by Age in Port Chester
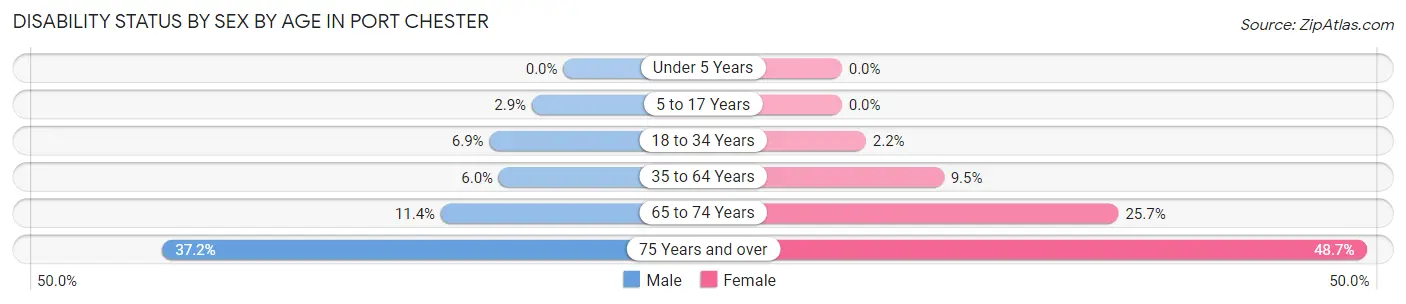
| Age Bracket | Male | Female |
| Under 5 Years | 0 (0.0%) | 0 (0.0%) |
| 5 to 17 Years | 76 (2.9%) | 0 (0.0%) |
| 18 to 34 Years | 285 (6.9%) | 84 (2.2%) |
| 35 to 64 Years | 436 (6.0%) | 559 (9.5%) |
| 65 to 74 Years | 106 (11.4%) | 310 (25.7%) |
| 75 Years and over | 256 (37.2%) | 421 (48.7%) |
Disability Class by Sex by Age in Port Chester
Disability Class: Hearing Difficulty
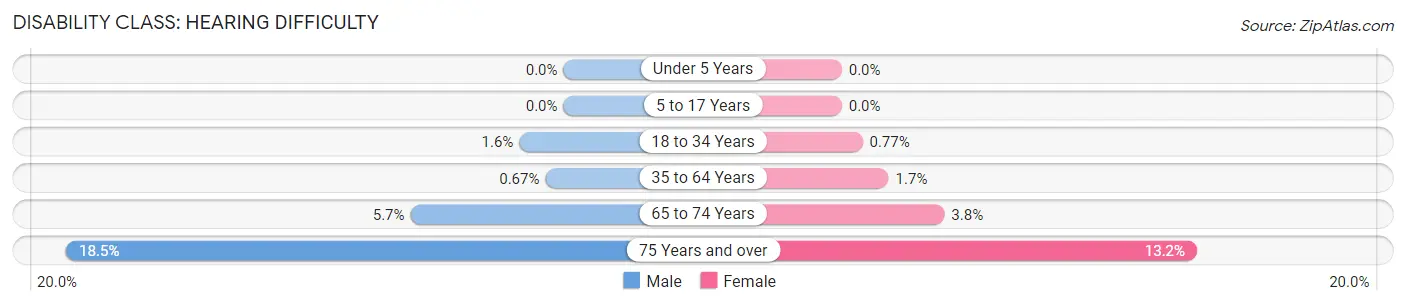
| Age Bracket | Male | Female |
| Under 5 Years | 0 (0.0%) | 0 (0.0%) |
| 5 to 17 Years | 0 (0.0%) | 0 (0.0%) |
| 18 to 34 Years | 68 (1.6%) | 29 (0.8%) |
| 35 to 64 Years | 49 (0.7%) | 103 (1.7%) |
| 65 to 74 Years | 53 (5.7%) | 46 (3.8%) |
| 75 Years and over | 127 (18.5%) | 114 (13.2%) |
Disability Class: Vision Difficulty
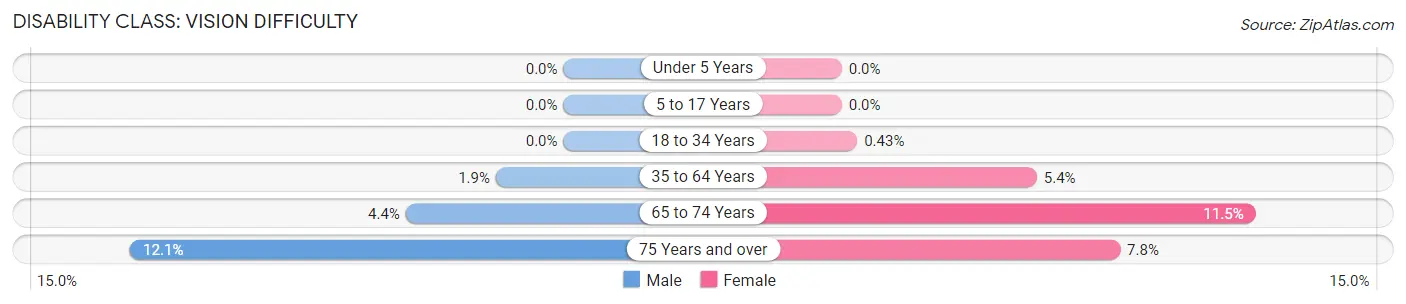
| Age Bracket | Male | Female |
| Under 5 Years | 0 (0.0%) | 0 (0.0%) |
| 5 to 17 Years | 0 (0.0%) | 0 (0.0%) |
| 18 to 34 Years | 0 (0.0%) | 16 (0.4%) |
| 35 to 64 Years | 137 (1.9%) | 321 (5.4%) |
| 65 to 74 Years | 41 (4.4%) | 139 (11.5%) |
| 75 Years and over | 83 (12.1%) | 67 (7.7%) |
Disability Class: Cognitive Difficulty
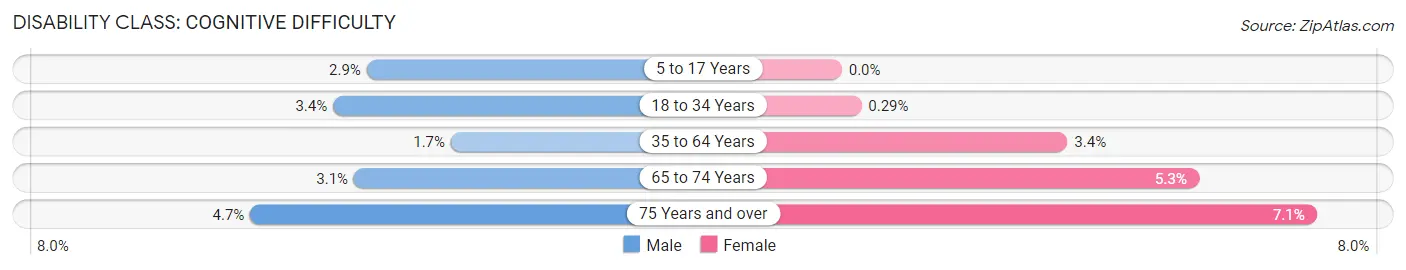
| Age Bracket | Male | Female |
| 5 to 17 Years | 76 (2.9%) | 0 (0.0%) |
| 18 to 34 Years | 142 (3.4%) | 11 (0.3%) |
| 35 to 64 Years | 122 (1.7%) | 198 (3.4%) |
| 65 to 74 Years | 29 (3.1%) | 64 (5.3%) |
| 75 Years and over | 32 (4.6%) | 61 (7.0%) |
Disability Class: Ambulatory Difficulty
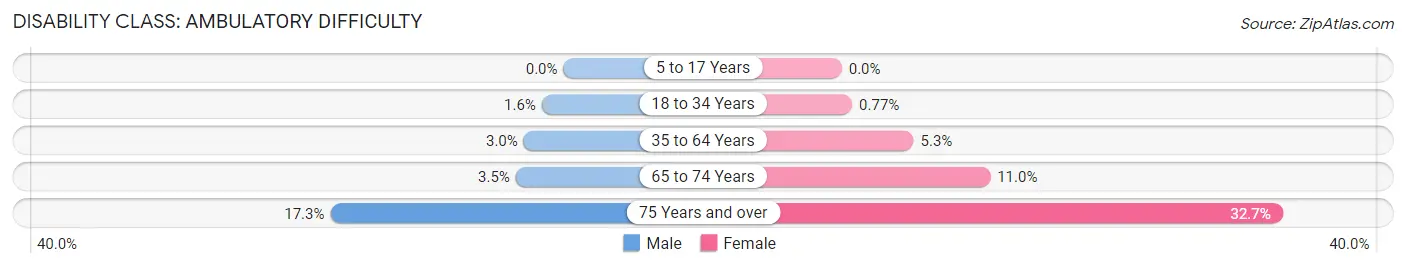
| Age Bracket | Male | Female |
| 5 to 17 Years | 0 (0.0%) | 0 (0.0%) |
| 18 to 34 Years | 67 (1.6%) | 29 (0.8%) |
| 35 to 64 Years | 215 (2.9%) | 315 (5.3%) |
| 65 to 74 Years | 33 (3.5%) | 133 (11.0%) |
| 75 Years and over | 119 (17.3%) | 283 (32.7%) |
Disability Class: Self-Care Difficulty
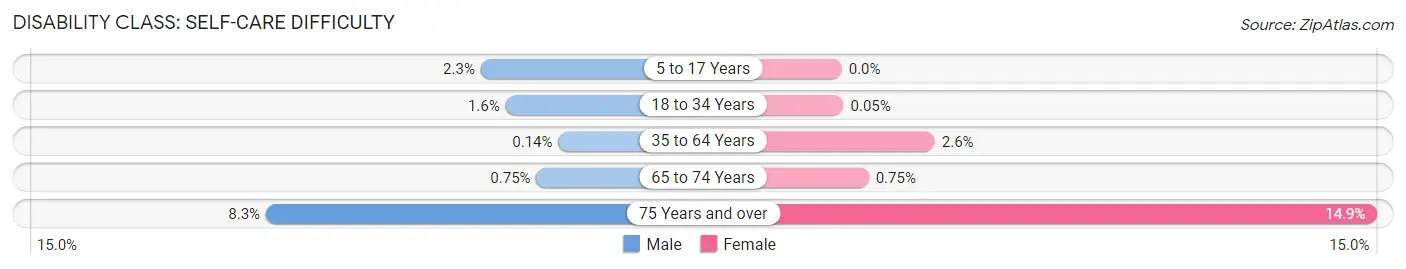
| Age Bracket | Male | Female |
| 5 to 17 Years | 60 (2.3%) | 0 (0.0%) |
| 18 to 34 Years | 67 (1.6%) | 2 (0.1%) |
| 35 to 64 Years | 10 (0.1%) | 153 (2.6%) |
| 65 to 74 Years | 7 (0.7%) | 9 (0.7%) |
| 75 Years and over | 57 (8.3%) | 129 (14.9%) |
Technology Access in Port Chester
Computing Device Access in Port Chester
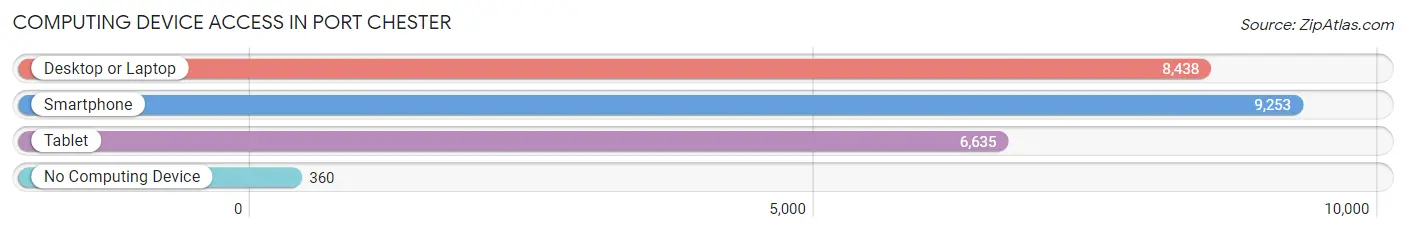
| Device Type | # Households | % Households |
| Desktop or Laptop | 8,438 | 82.6% |
| Smartphone | 9,253 | 90.6% |
| Tablet | 6,635 | 65.0% |
| No Computing Device | 360 | 3.5% |
| Total | 10,211 | 100.0% |
Internet Access in Port Chester
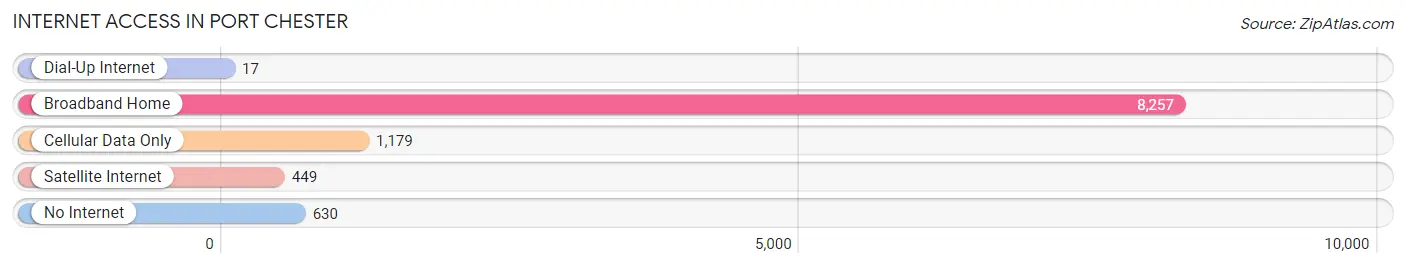
| Internet Type | # Households | % Households |
| Dial-Up Internet | 17 | 0.2% |
| Broadband Home | 8,257 | 80.9% |
| Cellular Data Only | 1,179 | 11.6% |
| Satellite Internet | 449 | 4.4% |
| No Internet | 630 | 6.2% |
| Total | 10,211 | 100.0% |
Port Chester Summary
Introduction
Port Chester is a village located in Westchester County, New York. It is situated on the Long Island Sound, just north of the New York City borough of the Bronx. The village has a population of approximately 28,967 people, according to the 2010 census. It is part of the town of Rye, and is the most populous village in the county. Port Chester has a rich history, with its roots dating back to the 1600s. It has a diverse population, with a mix of cultures and backgrounds. The village has a vibrant economy, with a variety of businesses and industries. It is also home to a number of cultural attractions, including the Capitol Theatre, the Port Chester Public Library, and the Rye Playland amusement park.
History
Port Chester was first settled in 1660 by English settlers from Rye, England. The village was originally known as Saw Pit, due to the saw pits that were used to cut timber for shipbuilding. In 1728, the village was renamed to Port Chester, after the port of Chester in England. The village was incorporated in 1868, and was the first village in Westchester County to be incorporated.
In the 19th century, Port Chester was a major port for shipping and trade. It was also a popular destination for immigrants, who came to the village in search of work. The village was home to a number of factories, including a paper mill, a brickyard, and a tannery. In the early 20th century, the village experienced a period of growth and prosperity. The population increased, and the village became a popular destination for tourists.
Geography
Port Chester is located in Westchester County, New York. It is situated on the Long Island Sound, just north of the New York City borough of the Bronx. The village is bordered by the towns of Rye, Harrison, and Greenwich, Connecticut. The village covers an area of 2.7 square miles, and has a population of approximately 28,967 people, according to the 2010 census.
The village is located in a temperate climate zone, with hot summers and cold winters. The average temperature in the summer is around 75 degrees Fahrenheit, and the average temperature in the winter is around 35 degrees Fahrenheit. The village receives an average of 44 inches of precipitation per year.
Economy
Port Chester has a vibrant economy, with a variety of businesses and industries. The village is home to a number of retail stores, restaurants, and other businesses. It is also home to a number of manufacturing companies, including a paper mill, a brickyard, and a tannery. The village is also home to a number of financial institutions, including banks and insurance companies.
The village is home to a number of cultural attractions, including the Capitol Theatre, the Port Chester Public Library, and the Rye Playland amusement park. The village is also home to a number of educational institutions, including the Port Chester-Rye Union Free School District, the Port Chester-Rye High School, and the Port Chester-Rye Middle School.
Demographics
According to the 2010 census, Port Chester has a population of 28,967 people. The population is diverse, with a mix of cultures and backgrounds. The village has a median household income of $60,945, and a median family income of $71,945. The village has a poverty rate of 11.3%, and a high school graduation rate of 87.3%.
The village is predominantly white, with a population of 24,845 people (86.1%). The village also has a large Hispanic population, with a population of 3,822 people (13.2%). The village also has a small African American population, with a population of 441 people (1.5%).
Conclusion
Port Chester is a village located in Westchester County, New York. It has a rich history, with its roots dating back to the 1600s. The village has a diverse population, with a mix of cultures and backgrounds. The village has a vibrant economy, with a variety of businesses and industries. It is also home to a number of cultural attractions, including the Capitol Theatre, the Port Chester Public Library, and the Rye Playland amusement park. The village has a population of 28,967 people, according to the 2010 census. It is predominantly white, with a population of 24,845 people (86.1%). The village also has a large Hispanic population, with a population of 3,822 people (13.2%). The village has a median household income of $60,945, and a median family income of $71,945. The village has a poverty rate of 11.3%, and a high school graduation rate of 87.3%. Port Chester is a vibrant and diverse village, with a rich history and a vibrant economy.
Common Questions
What is Per Capita Income in Port Chester?
Per Capita income in Port Chester is $40,722.
What is the Median Family Income in Port Chester?
Median Family Income in Port Chester is $94,522.
What is the Median Household income in Port Chester?
Median Household Income in Port Chester is $92,116.
What is Income or Wage Gap in Port Chester?
Income or Wage Gap in Port Chester is 37.2%.
Women in Port Chester earn 62.8 cents for every dollar earned by a man.
What is Inequality or Gini Index in Port Chester?
Inequality or Gini Index in Port Chester is 0.47.
What is the Total Population of Port Chester?
Total Population of Port Chester is 31,288.
What is the Total Male Population of Port Chester?
Total Male Population of Port Chester is 16,654.
What is the Total Female Population of Port Chester?
Total Female Population of Port Chester is 14,634.
What is the Ratio of Males per 100 Females in Port Chester?
There are 113.80 Males per 100 Females in Port Chester.
What is the Ratio of Females per 100 Males in Port Chester?
There are 87.87 Females per 100 Males in Port Chester.
What is the Median Population Age in Port Chester?
Median Population Age in Port Chester is 38.2 Years.
What is the Average Family Size in Port Chester
Average Family Size in Port Chester is 3.5 People.
What is the Average Household Size in Port Chester
Average Household Size in Port Chester is 3.0 People.
How Large is the Labor Force in Port Chester?
There are 17,586 People in the Labor Forcein in Port Chester.
What is the Percentage of People in the Labor Force in Port Chester?
68.4% of People are in the Labor Force in Port Chester.
What is the Unemployment Rate in Port Chester?
Unemployment Rate in Port Chester is 6.9%.