Riverhead, NY Map & Demographics
Riverhead Map
Riverhead Overview
$38,691
PER CAPITA INCOME
$92,679
AVG FAMILY INCOME
$73,197
AVG HOUSEHOLD INCOME
27.0%
WAGE / INCOME GAP [ % ]
73.0¢/ $1
WAGE / INCOME GAP [ $ ]
$6,617
FAMILY INCOME DEFICIT
0.48
INEQUALITY / GINI INDEX
14,388
TOTAL POPULATION
7,524
MALE POPULATION
6,864
FEMALE POPULATION
109.62
MALES / 100 FEMALES
91.23
FEMALES / 100 MALES
44.8
MEDIAN AGE
3.4
AVG FAMILY SIZE
2.7
AVG HOUSEHOLD SIZE
6,742
LABOR FORCE [ PEOPLE ]
55.4%
PERCENT IN LABOR FORCE
9.2%
UNEMPLOYMENT RATE
Riverhead Zip Codes
Riverhead Area Codes
Income in Riverhead
Income Overview in Riverhead
Per Capita Income in Riverhead is $38,691, while median incomes of families and households are $92,679 and $73,197 respectively.
| Characteristic | Number | Measure |
| Per Capita Income | 14,388 | $38,691 |
| Median Family Income | 3,445 | $92,679 |
| Mean Family Income | 3,445 | $124,881 |
| Median Household Income | 5,191 | $73,197 |
| Mean Household Income | 5,191 | $101,577 |
| Income Deficit | 3,445 | $6,617 |
| Wage / Income Gap (%) | 14,388 | 27.05% |
| Wage / Income Gap ($) | 14,388 | 72.95¢ per $1 |
| Gini / Inequality Index | 14,388 | 0.48 |
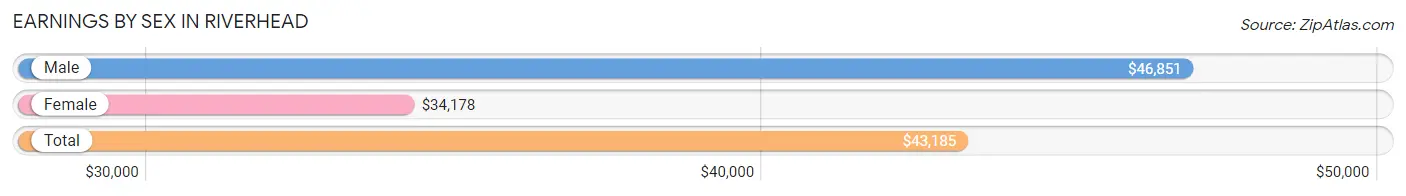
Earnings by Sex in Riverhead
Average Earnings in Riverhead are $43,185, $46,851 for men and $34,178 for women, a difference of 27.1%.
| Sex | Number | Average Earnings |
| Male | 4,046 (56.7%) | $46,851 |
| Female | 3,086 (43.3%) | $34,178 |
| Total | 7,132 (100.0%) | $43,185 |
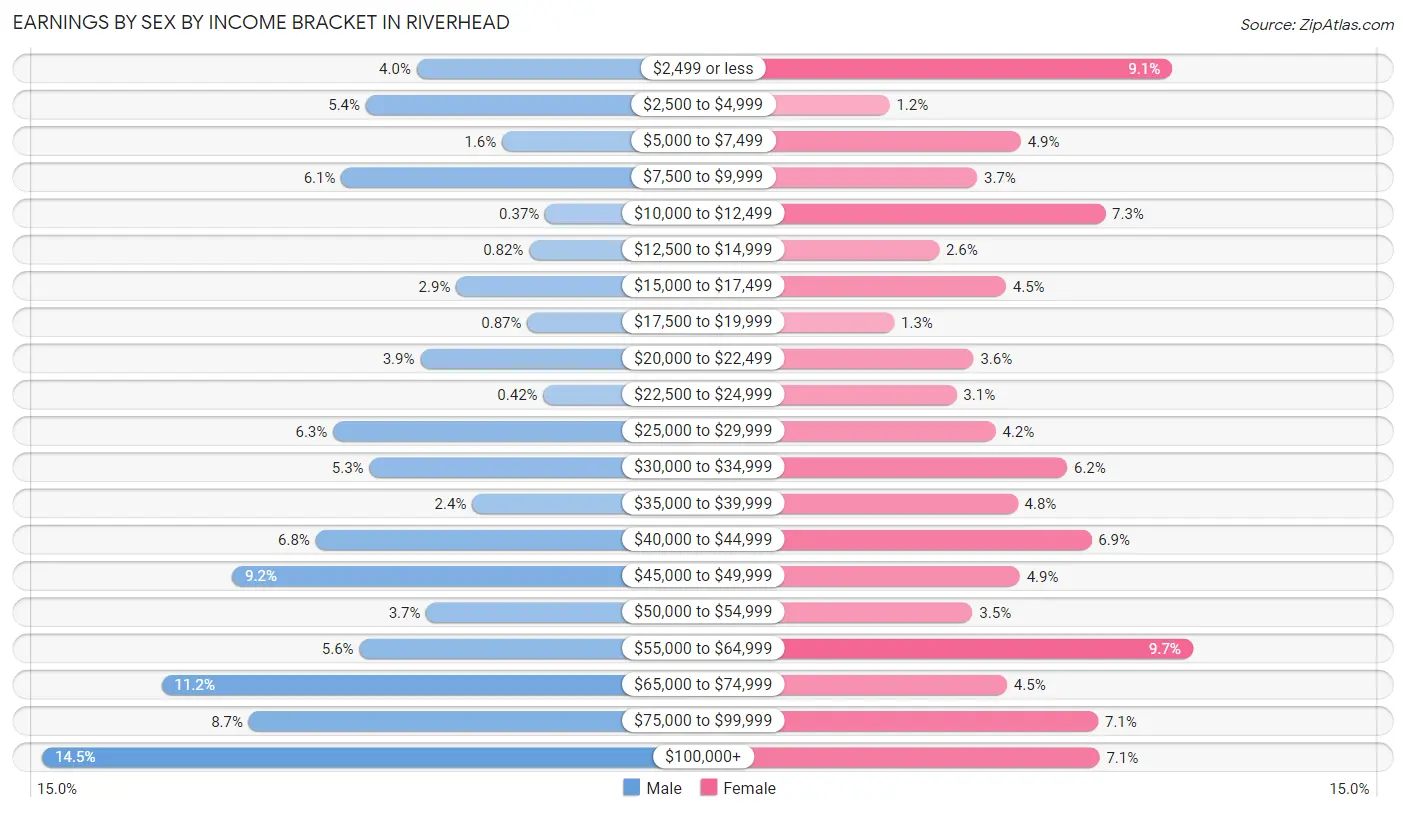
Earnings by Sex by Income Bracket in Riverhead
The most common earnings brackets in Riverhead are $100,000+ for men (587 | 14.5%) and $55,000 to $64,999 for women (300 | 9.7%).
| Income | Male | Female |
| $2,499 or less | 161 (4.0%) | 282 (9.1%) |
| $2,500 to $4,999 | 219 (5.4%) | 37 (1.2%) |
| $5,000 to $7,499 | 64 (1.6%) | 151 (4.9%) |
| $7,500 to $9,999 | 247 (6.1%) | 113 (3.7%) |
| $10,000 to $12,499 | 15 (0.4%) | 224 (7.3%) |
| $12,500 to $14,999 | 33 (0.8%) | 80 (2.6%) |
| $15,000 to $17,499 | 116 (2.9%) | 138 (4.5%) |
| $17,500 to $19,999 | 35 (0.9%) | 41 (1.3%) |
| $20,000 to $22,499 | 157 (3.9%) | 110 (3.6%) |
| $22,500 to $24,999 | 17 (0.4%) | 95 (3.1%) |
| $25,000 to $29,999 | 256 (6.3%) | 129 (4.2%) |
| $30,000 to $34,999 | 215 (5.3%) | 191 (6.2%) |
| $35,000 to $39,999 | 98 (2.4%) | 148 (4.8%) |
| $40,000 to $44,999 | 276 (6.8%) | 212 (6.9%) |
| $45,000 to $49,999 | 371 (9.2%) | 150 (4.9%) |
| $50,000 to $54,999 | 150 (3.7%) | 109 (3.5%) |
| $55,000 to $64,999 | 226 (5.6%) | 300 (9.7%) |
| $65,000 to $74,999 | 451 (11.2%) | 139 (4.5%) |
| $75,000 to $99,999 | 352 (8.7%) | 218 (7.1%) |
| $100,000+ | 587 (14.5%) | 219 (7.1%) |
| Total | 4,046 (100.0%) | 3,086 (100.0%) |
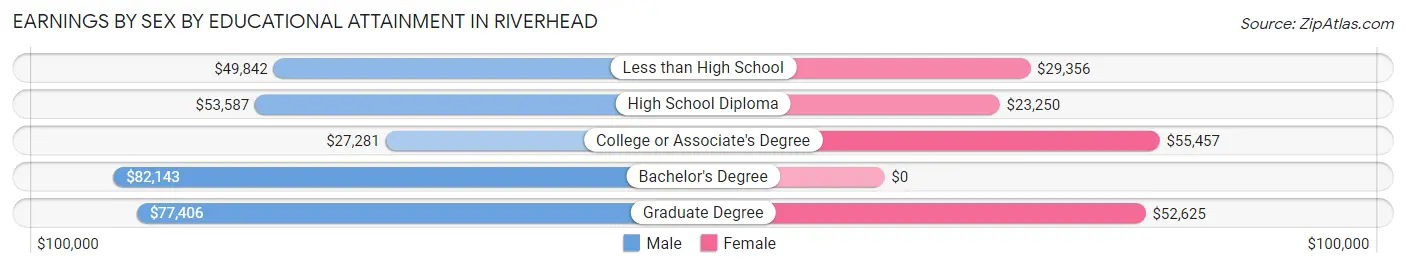
Earnings by Sex by Educational Attainment in Riverhead
Average earnings in Riverhead are $49,672 for men and $38,967 for women, a difference of 21.5%. Men with an educational attainment of bachelor's degree enjoy the highest average annual earnings of $82,143, while those with college or associate's degree education earn the least with $27,281. Women with an educational attainment of college or associate's degree earn the most with the average annual earnings of $55,457, while those with high school diploma education have the smallest earnings of $23,250.
| Educational Attainment | Male Income | Female Income |
| Less than High School | $49,842 | $29,356 |
| High School Diploma | $53,587 | $23,250 |
| College or Associate's Degree | $27,281 | $55,457 |
| Bachelor's Degree | $82,143 | $0 |
| Graduate Degree | $77,406 | $52,625 |
| Total | $49,672 | $38,967 |
Family Income in Riverhead
Family Income Brackets in Riverhead
According to the Riverhead family income data, there are 641 families falling into the $100,000 to $149,999 income range, which is the most common income bracket and makes up 18.6% of all families. Conversely, the $10,000 to $14,999 income bracket is the least frequent group with only 52 families (1.5%) belonging to this category.
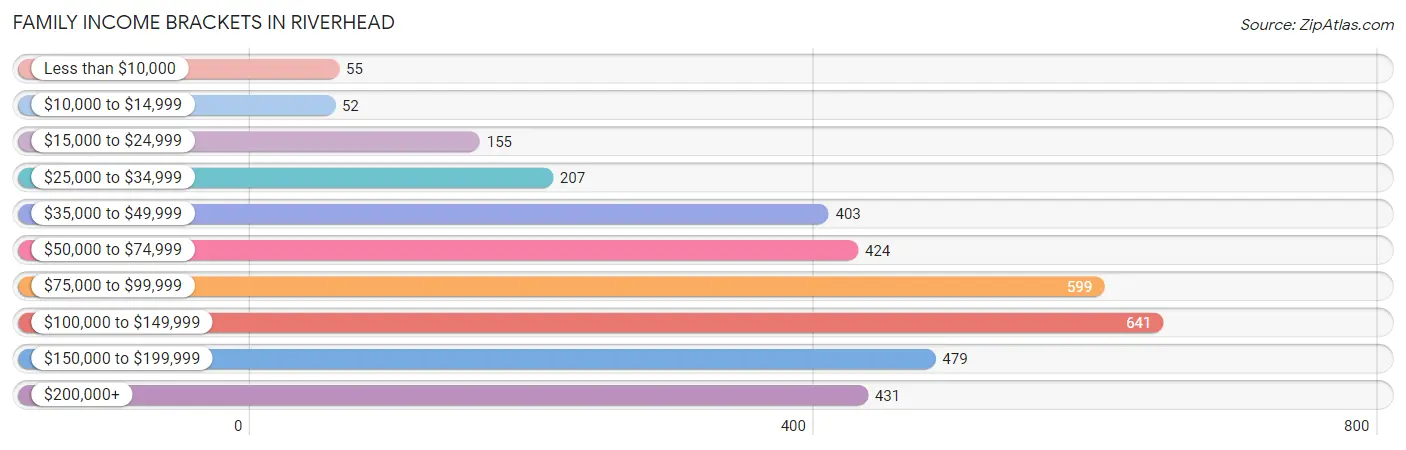
| Income Bracket | # Families | % Families |
| Less than $10,000 | 55 | 1.6% |
| $10,000 to $14,999 | 52 | 1.5% |
| $15,000 to $24,999 | 155 | 4.5% |
| $25,000 to $34,999 | 207 | 6.0% |
| $35,000 to $49,999 | 403 | 11.7% |
| $50,000 to $74,999 | 424 | 12.3% |
| $75,000 to $99,999 | 599 | 17.4% |
| $100,000 to $149,999 | 641 | 18.6% |
| $150,000 to $199,999 | 479 | 13.9% |
| $200,000+ | 431 | 12.5% |
Family Income by Famaliy Size in Riverhead
5-person families (215 | 6.2%) account for the highest median family income in Riverhead with $147,875 per family, while 2-person families (1,815 | 52.7%) have the highest median income of $43,742 per family member.
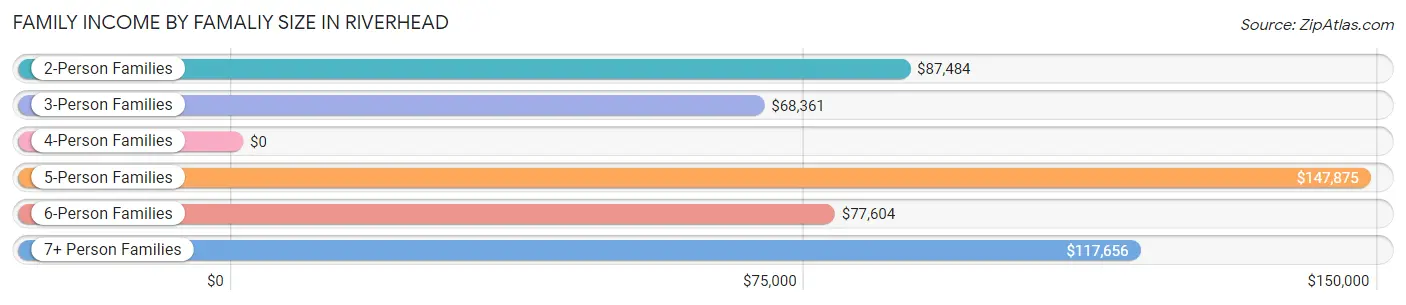
| Income Bracket | # Families | Median Income |
| 2-Person Families | 1,815 (52.7%) | $87,484 |
| 3-Person Families | 573 (16.6%) | $68,361 |
| 4-Person Families | 544 (15.8%) | $0 |
| 5-Person Families | 215 (6.2%) | $147,875 |
| 6-Person Families | 124 (3.6%) | $77,604 |
| 7+ Person Families | 174 (5.1%) | $117,656 |
| Total | 3,445 (100.0%) | $92,679 |
Family Income by Number of Earners in Riverhead
The median family income in Riverhead is $92,679, with families comprising 3+ earners (695) having the highest median family income of $139,375, while families with no earners (721) have the lowest median family income of $56,382, accounting for 20.2% and 20.9% of families, respectively.
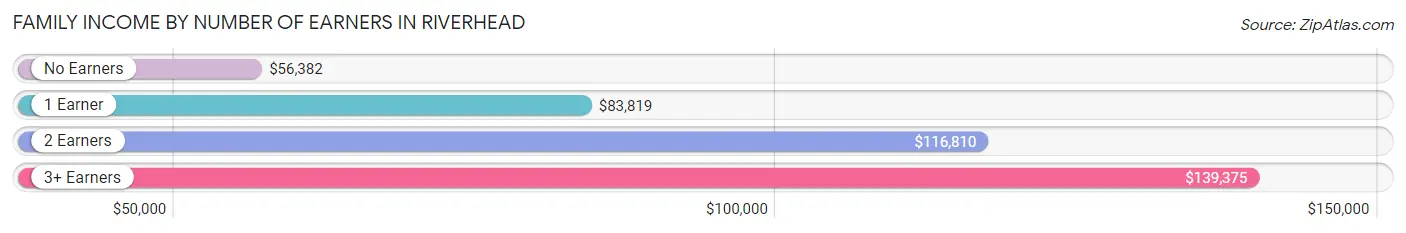
| Number of Earners | # Families | Median Income |
| No Earners | 721 (20.9%) | $56,382 |
| 1 Earner | 851 (24.7%) | $83,819 |
| 2 Earners | 1,178 (34.2%) | $116,810 |
| 3+ Earners | 695 (20.2%) | $139,375 |
| Total | 3,445 (100.0%) | $92,679 |
Household Income in Riverhead
Household Income Brackets in Riverhead
With 908 households falling in the category, the $50,000 to $74,999 income range is the most frequent in Riverhead, accounting for 17.5% of all households. In contrast, only 171 households (3.3%) fall into the $10,000 to $14,999 income bracket, making it the least populous group.
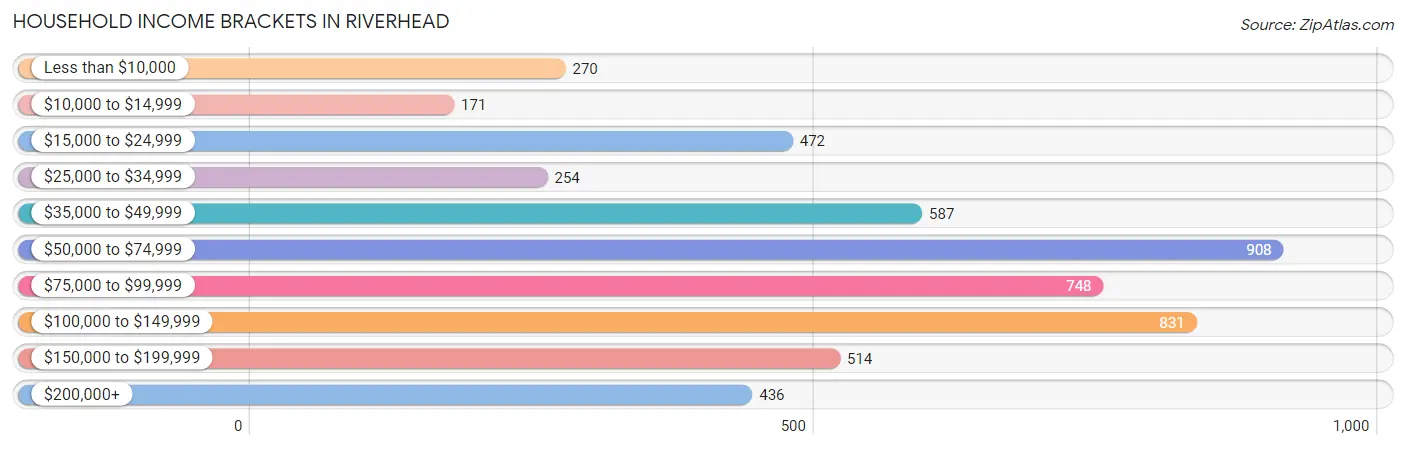
| Income Bracket | # Households | % Households |
| Less than $10,000 | 270 | 5.2% |
| $10,000 to $14,999 | 171 | 3.3% |
| $15,000 to $24,999 | 472 | 9.1% |
| $25,000 to $34,999 | 254 | 4.9% |
| $35,000 to $49,999 | 587 | 11.3% |
| $50,000 to $74,999 | 908 | 17.5% |
| $75,000 to $99,999 | 748 | 14.4% |
| $100,000 to $149,999 | 831 | 16.0% |
| $150,000 to $199,999 | 514 | 9.9% |
| $200,000+ | 436 | 8.4% |
Household Income by Householder Age in Riverhead
The median household income in Riverhead is $73,197, with the highest median household income of $115,011 found in the 25 to 44 years age bracket for the primary householder. A total of 1,019 households (19.6%) fall into this category. Meanwhile, the 15 to 24 years age bracket for the primary householder has the lowest median household income of $0, with 70 households (1.3%) in this group.
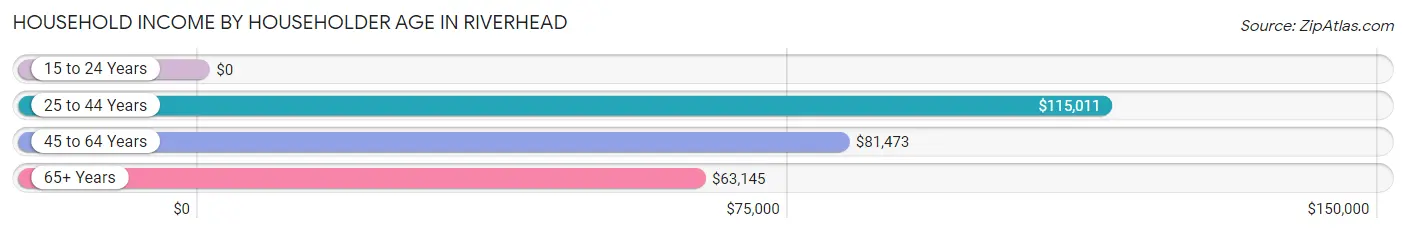
| Income Bracket | # Households | Median Income |
| 15 to 24 Years | 70 (1.3%) | $0 |
| 25 to 44 Years | 1,019 (19.6%) | $115,011 |
| 45 to 64 Years | 1,984 (38.2%) | $81,473 |
| 65+ Years | 2,118 (40.8%) | $63,145 |
| Total | 5,191 (100.0%) | $73,197 |
Poverty in Riverhead
Income Below Poverty by Sex and Age in Riverhead
With 8.9% poverty level for males and 13.9% for females among the residents of Riverhead, 6 to 11 year old males and 5 year old females are the most vulnerable to poverty, with 186 males (44.9%) and 42 females (40.0%) in their respective age groups living below the poverty level.
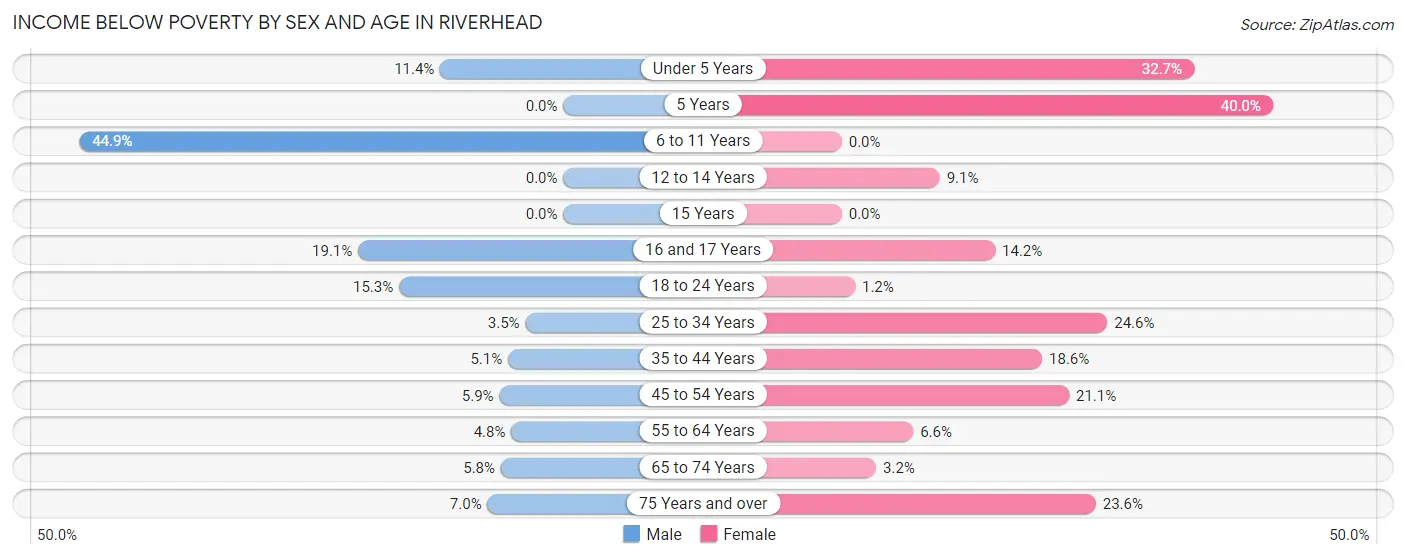
| Age Bracket | Male | Female |
| Under 5 Years | 60 (11.4%) | 147 (32.7%) |
| 5 Years | 0 (0.0%) | 42 (40.0%) |
| 6 to 11 Years | 186 (44.9%) | 0 (0.0%) |
| 12 to 14 Years | 0 (0.0%) | 14 (9.1%) |
| 15 Years | 0 (0.0%) | 0 (0.0%) |
| 16 and 17 Years | 84 (19.1%) | 35 (14.2%) |
| 18 to 24 Years | 59 (15.2%) | 7 (1.2%) |
| 25 to 34 Years | 43 (3.5%) | 208 (24.6%) |
| 35 to 44 Years | 43 (5.1%) | 87 (18.6%) |
| 45 to 54 Years | 35 (5.9%) | 163 (21.1%) |
| 55 to 64 Years | 54 (4.8%) | 67 (6.6%) |
| 65 to 74 Years | 61 (5.8%) | 44 (3.2%) |
| 75 Years and over | 35 (7.0%) | 132 (23.6%) |
| Total | 660 (8.9%) | 946 (13.9%) |
Income Above Poverty by Sex and Age in Riverhead
According to the poverty statistics in Riverhead, males aged 12 to 14 years and females aged 6 to 11 years are the age groups that are most secure financially, with 100.0% of males and 100.0% of females in these age groups living above the poverty line.
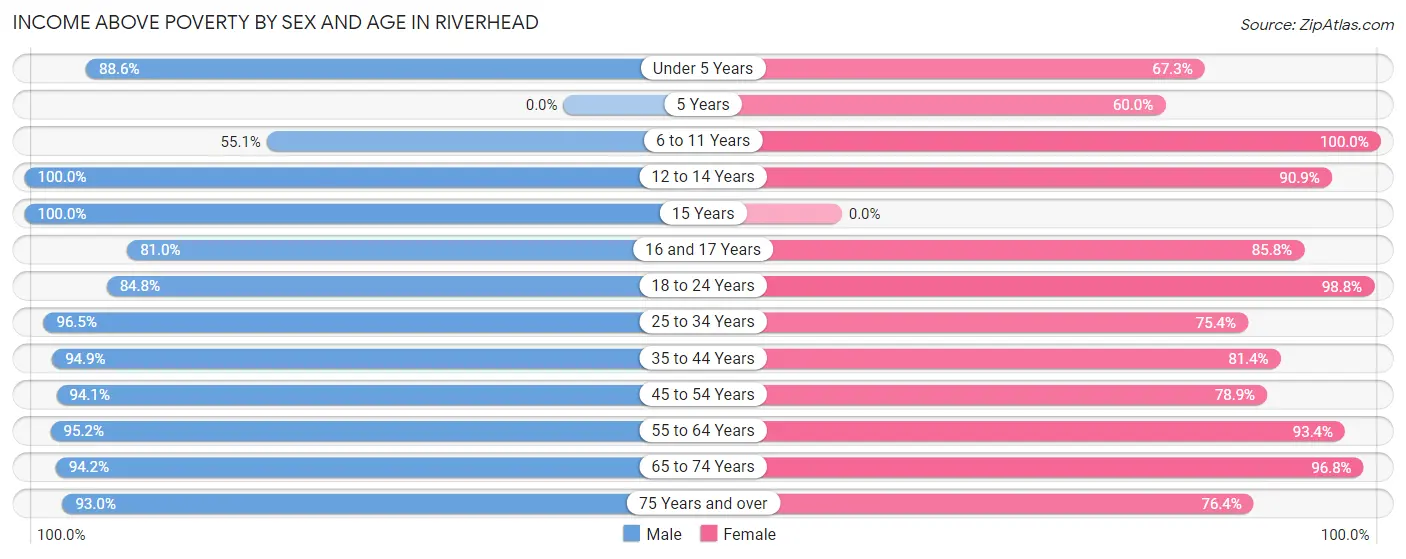
| Age Bracket | Male | Female |
| Under 5 Years | 465 (88.6%) | 303 (67.3%) |
| 5 Years | 0 (0.0%) | 63 (60.0%) |
| 6 to 11 Years | 228 (55.1%) | 225 (100.0%) |
| 12 to 14 Years | 240 (100.0%) | 140 (90.9%) |
| 15 Years | 98 (100.0%) | 0 (0.0%) |
| 16 and 17 Years | 357 (80.9%) | 211 (85.8%) |
| 18 to 24 Years | 328 (84.8%) | 564 (98.8%) |
| 25 to 34 Years | 1,177 (96.5%) | 636 (75.4%) |
| 35 to 44 Years | 796 (94.9%) | 381 (81.4%) |
| 45 to 54 Years | 555 (94.1%) | 610 (78.9%) |
| 55 to 64 Years | 1,065 (95.2%) | 943 (93.4%) |
| 65 to 74 Years | 990 (94.2%) | 1,341 (96.8%) |
| 75 Years and over | 462 (93.0%) | 428 (76.4%) |
| Total | 6,761 (91.1%) | 5,845 (86.1%) |
Income Below Poverty Among Married-Couple Families in Riverhead
The poverty statistics for married-couple families in Riverhead show that 3.8% or 95 of the total 2,467 families live below the poverty line. Families with 1 or 2 children have the highest poverty rate of 4.8%, comprising of 30 families. On the other hand, families with 3 or 4 children have the lowest poverty rate of 0.0%, which includes 0 families.
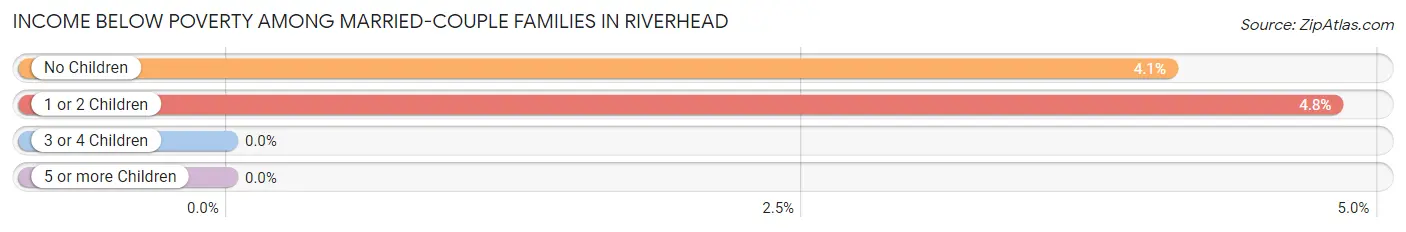
| Children | Above Poverty | Below Poverty |
| No Children | 1,524 (95.9%) | 65 (4.1%) |
| 1 or 2 Children | 594 (95.2%) | 30 (4.8%) |
| 3 or 4 Children | 254 (100.0%) | 0 (0.0%) |
| 5 or more Children | 0 (0.0%) | 0 (0.0%) |
| Total | 2,372 (96.2%) | 95 (3.8%) |
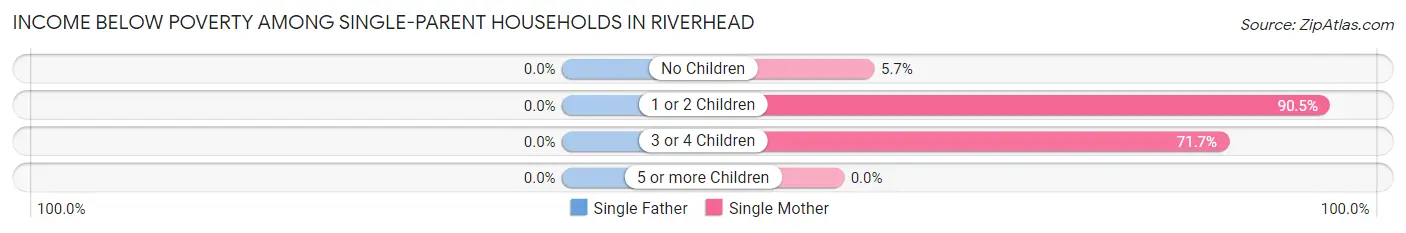
Income Below Poverty Among Single-Parent Households in Riverhead
| Children | Single Father | Single Mother |
| No Children | 0 (0.0%) | 23 (5.7%) |
| 1 or 2 Children | 0 (0.0%) | 67 (90.5%) |
| 3 or 4 Children | 0 (0.0%) | 33 (71.7%) |
| 5 or more Children | 0 (0.0%) | 0 (0.0%) |
| Total | 0 (0.0%) | 123 (23.3%) |
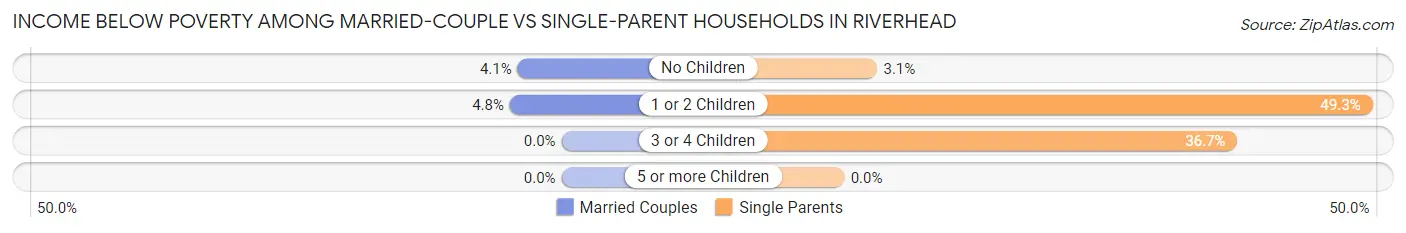
Income Below Poverty Among Married-Couple vs Single-Parent Households in Riverhead
The poverty data for Riverhead shows that 95 of the married-couple family households (3.8%) and 123 of the single-parent households (12.6%) are living below the poverty level. Within the married-couple family households, those with 1 or 2 children have the highest poverty rate, with 30 households (4.8%) falling below the poverty line. Among the single-parent households, those with 1 or 2 children have the highest poverty rate, with 67 household (49.3%) living below poverty.
| Children | Married-Couple Families | Single-Parent Households |
| No Children | 65 (4.1%) | 23 (3.1%) |
| 1 or 2 Children | 30 (4.8%) | 67 (49.3%) |
| 3 or 4 Children | 0 (0.0%) | 33 (36.7%) |
| 5 or more Children | 0 (0.0%) | 0 (0.0%) |
| Total | 95 (3.8%) | 123 (12.6%) |
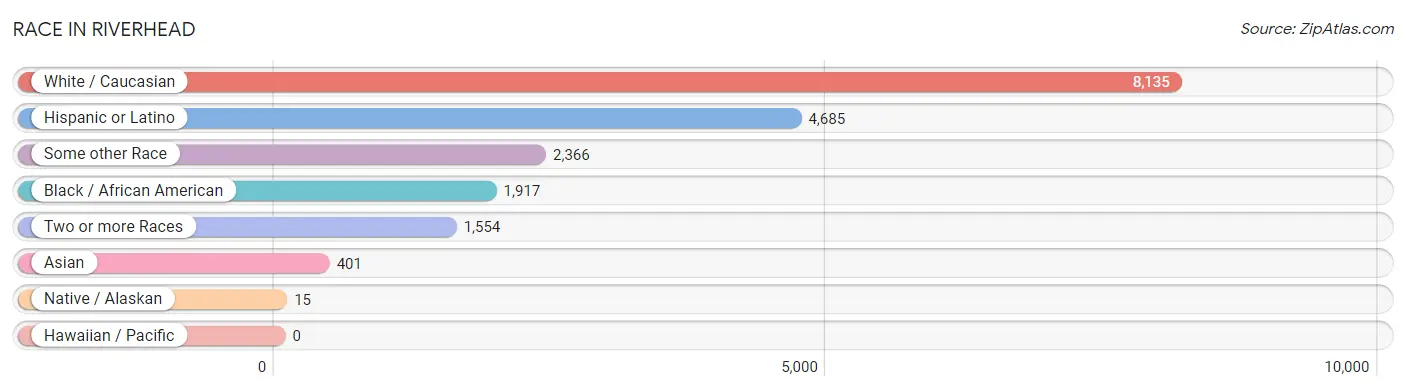
Race in Riverhead
The most populous races in Riverhead are White / Caucasian (8,135 | 56.5%), Hispanic or Latino (4,685 | 32.6%), and Some other Race (2,366 | 16.4%).
| Race | # Population | % Population |
| Asian | 401 | 2.8% |
| Black / African American | 1,917 | 13.3% |
| Hawaiian / Pacific | 0 | 0.0% |
| Hispanic or Latino | 4,685 | 32.6% |
| Native / Alaskan | 15 | 0.1% |
| White / Caucasian | 8,135 | 56.5% |
| Two or more Races | 1,554 | 10.8% |
| Some other Race | 2,366 | 16.4% |
| Total | 14,388 | 100.0% |
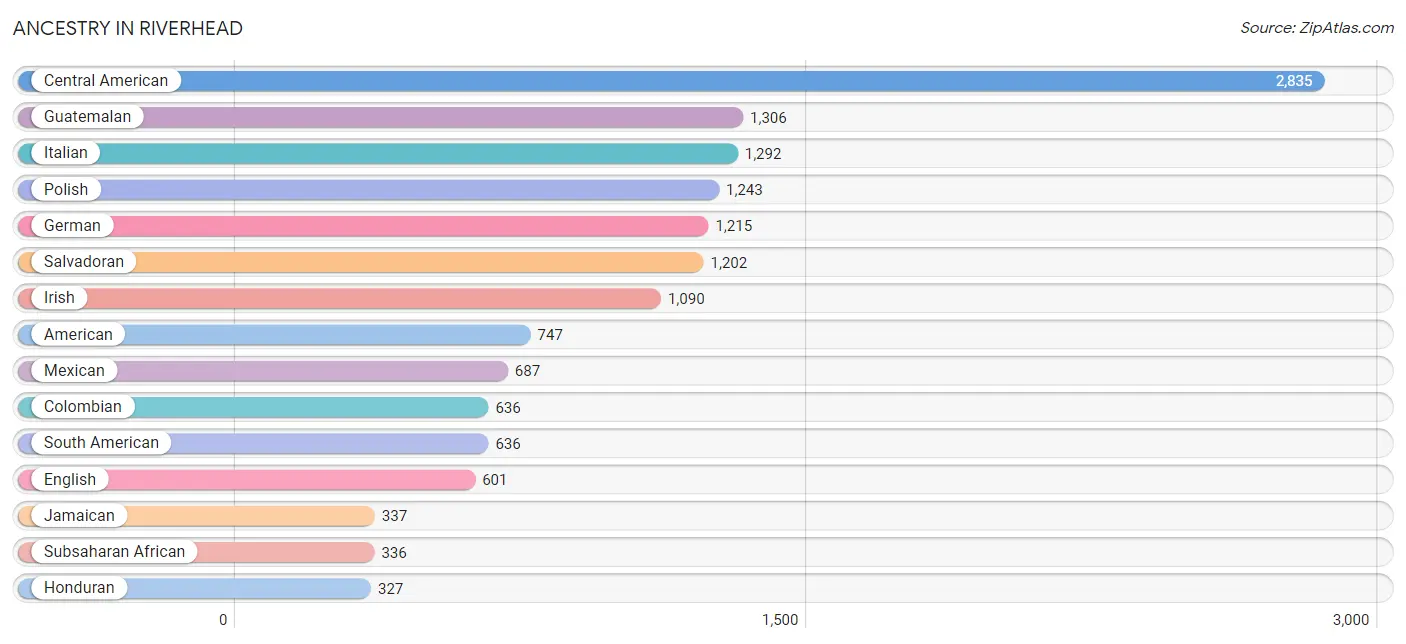
Ancestry in Riverhead
The most populous ancestries reported in Riverhead are Central American (2,835 | 19.7%), Guatemalan (1,306 | 9.1%), Italian (1,292 | 9.0%), Polish (1,243 | 8.6%), and German (1,215 | 8.4%), together accounting for 54.8% of all Riverhead residents.
| Ancestry | # Population | % Population |
| African | 232 | 1.6% |
| American | 747 | 5.2% |
| Austrian | 27 | 0.2% |
| Belgian | 202 | 1.4% |
| British | 40 | 0.3% |
| Burmese | 108 | 0.7% |
| Canadian | 35 | 0.2% |
| Central American | 2,835 | 19.7% |
| Colombian | 636 | 4.4% |
| Cuban | 54 | 0.4% |
| Czech | 39 | 0.3% |
| Czechoslovakian | 25 | 0.2% |
| Danish | 48 | 0.3% |
| Dominican | 98 | 0.7% |
| Dutch | 108 | 0.7% |
| Eastern European | 42 | 0.3% |
| English | 601 | 4.2% |
| European | 282 | 2.0% |
| French | 69 | 0.5% |
| French Canadian | 67 | 0.5% |
| German | 1,215 | 8.4% |
| Ghanaian | 104 | 0.7% |
| Greek | 9 | 0.1% |
| Guatemalan | 1,306 | 9.1% |
| Haitian | 207 | 1.4% |
| Honduran | 327 | 2.3% |
| Hungarian | 71 | 0.5% |
| Irish | 1,090 | 7.6% |
| Italian | 1,292 | 9.0% |
| Jamaican | 337 | 2.3% |
| Korean | 12 | 0.1% |
| Lithuanian | 144 | 1.0% |
| Mexican | 687 | 4.8% |
| Mexican American Indian | 145 | 1.0% |
| Navajo | 26 | 0.2% |
| Northern European | 30 | 0.2% |
| Norwegian | 5 | 0.0% |
| Polish | 1,243 | 8.6% |
| Portuguese | 8 | 0.1% |
| Puerto Rican | 199 | 1.4% |
| Russian | 148 | 1.0% |
| Salvadoran | 1,202 | 8.4% |
| Scandinavian | 13 | 0.1% |
| Scotch-Irish | 16 | 0.1% |
| Scottish | 81 | 0.6% |
| Slovak | 21 | 0.2% |
| South American | 636 | 4.4% |
| Subsaharan African | 336 | 2.3% |
| Swedish | 15 | 0.1% |
| Swiss | 19 | 0.1% |
| Thai | 44 | 0.3% |
| Ukrainian | 71 | 0.5% |
| Vietnamese | 63 | 0.4% |
| Welsh | 35 | 0.2% | View All 54 Rows |
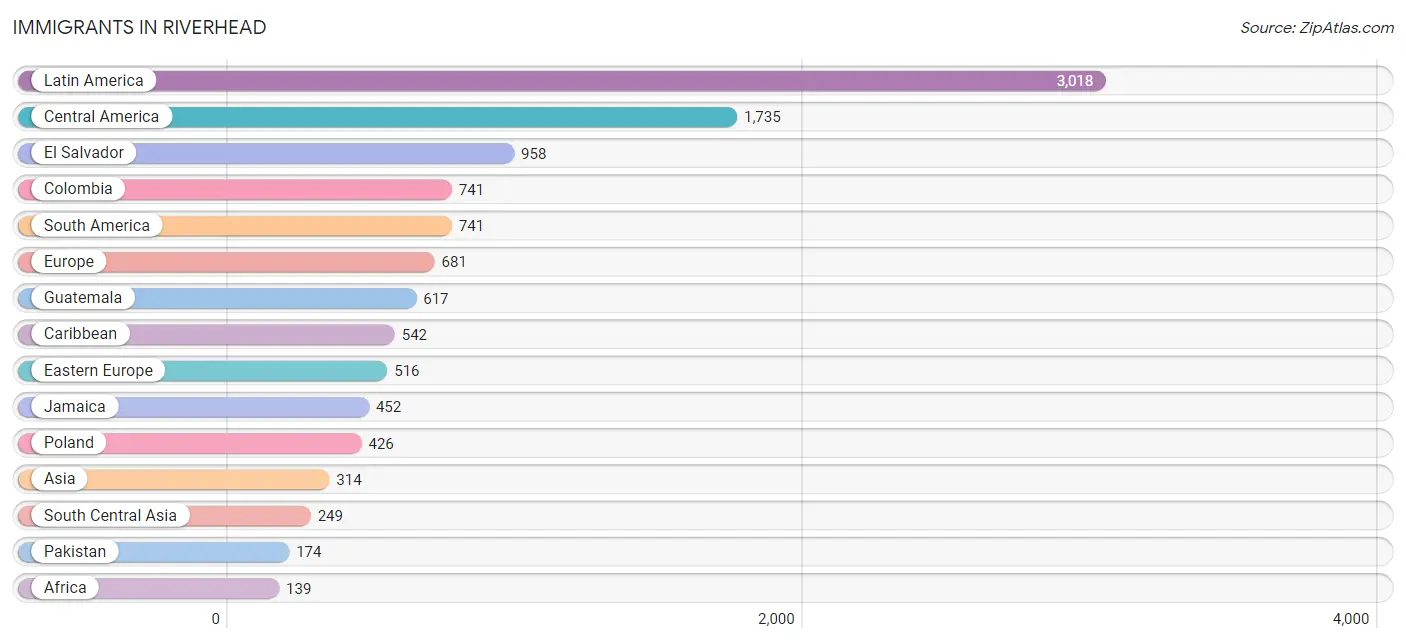
Immigrants in Riverhead
The most numerous immigrant groups reported in Riverhead came from Latin America (3,018 | 21.0%), Central America (1,735 | 12.1%), El Salvador (958 | 6.7%), Colombia (741 | 5.1%), and South America (741 | 5.1%), together accounting for 50.0% of all Riverhead residents.
| Immigration Origin | # Population | % Population |
| Africa | 139 | 1.0% |
| Asia | 314 | 2.2% |
| Bangladesh | 31 | 0.2% |
| Belgium | 41 | 0.3% |
| Canada | 19 | 0.1% |
| Caribbean | 542 | 3.8% |
| Central America | 1,735 | 12.1% |
| Colombia | 741 | 5.1% |
| Dominican Republic | 85 | 0.6% |
| Eastern Asia | 48 | 0.3% |
| Eastern Europe | 516 | 3.6% |
| El Salvador | 958 | 6.7% |
| Europe | 681 | 4.7% |
| Germany | 47 | 0.3% |
| Ghana | 104 | 0.7% |
| Guatemala | 617 | 4.3% |
| Haiti | 5 | 0.0% |
| Honduras | 52 | 0.4% |
| India | 44 | 0.3% |
| Israel | 5 | 0.0% |
| Italy | 40 | 0.3% |
| Jamaica | 452 | 3.1% |
| Korea | 48 | 0.3% |
| Latin America | 3,018 | 21.0% |
| Liberia | 35 | 0.2% |
| Lithuania | 90 | 0.6% |
| Mexico | 108 | 0.7% |
| Northern Europe | 33 | 0.2% |
| Pakistan | 174 | 1.2% |
| Philippines | 12 | 0.1% |
| Poland | 426 | 3.0% |
| Portugal | 4 | 0.0% |
| Scotland | 19 | 0.1% |
| South America | 741 | 5.1% |
| South Central Asia | 249 | 1.7% |
| South Eastern Asia | 12 | 0.1% |
| Southern Europe | 44 | 0.3% |
| Western Africa | 139 | 1.0% |
| Western Asia | 5 | 0.0% |
| Western Europe | 88 | 0.6% | View All 40 Rows |
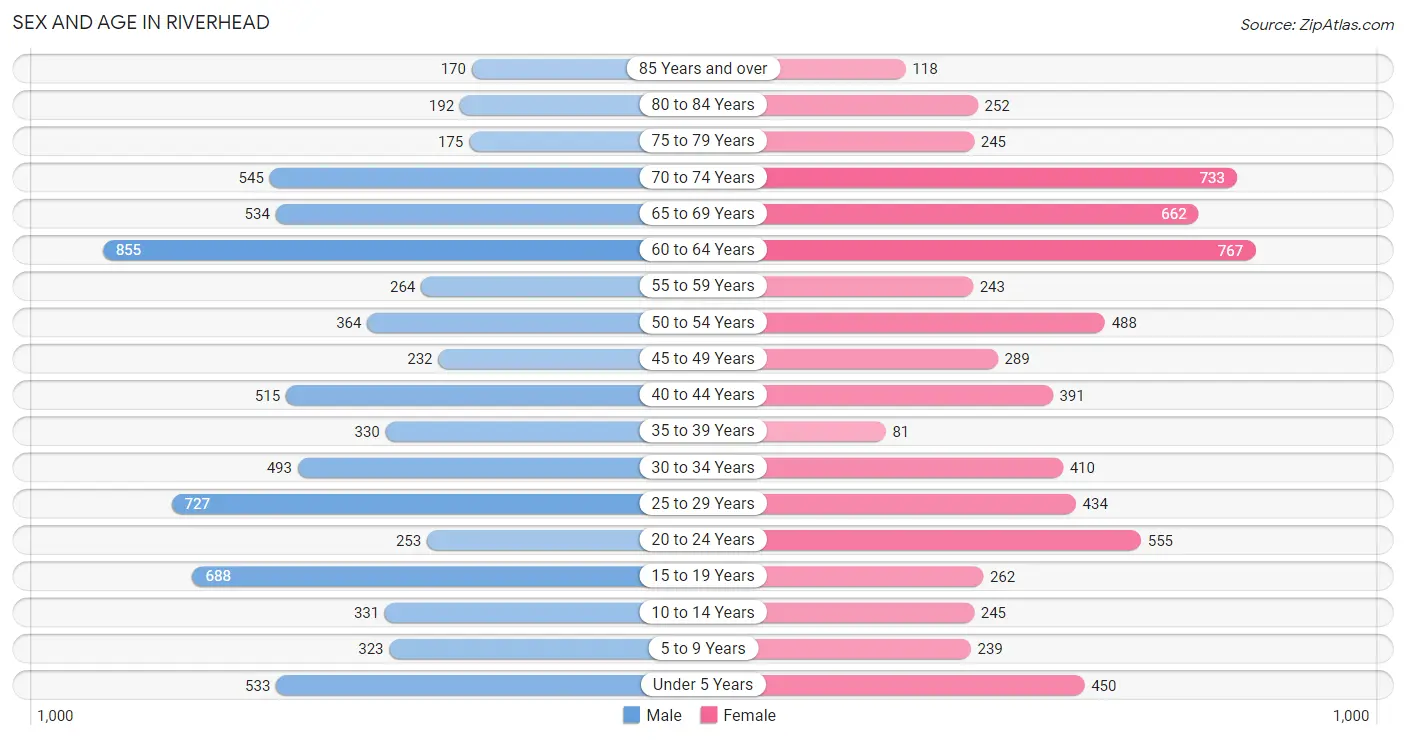
Sex and Age in Riverhead
Sex and Age in Riverhead
The most populous age groups in Riverhead are 60 to 64 Years (855 | 11.4%) for men and 60 to 64 Years (767 | 11.2%) for women.
| Age Bracket | Male | Female |
| Under 5 Years | 533 (7.1%) | 450 (6.6%) |
| 5 to 9 Years | 323 (4.3%) | 239 (3.5%) |
| 10 to 14 Years | 331 (4.4%) | 245 (3.6%) |
| 15 to 19 Years | 688 (9.1%) | 262 (3.8%) |
| 20 to 24 Years | 253 (3.4%) | 555 (8.1%) |
| 25 to 29 Years | 727 (9.7%) | 434 (6.3%) |
| 30 to 34 Years | 493 (6.6%) | 410 (6.0%) |
| 35 to 39 Years | 330 (4.4%) | 81 (1.2%) |
| 40 to 44 Years | 515 (6.8%) | 391 (5.7%) |
| 45 to 49 Years | 232 (3.1%) | 289 (4.2%) |
| 50 to 54 Years | 364 (4.8%) | 488 (7.1%) |
| 55 to 59 Years | 264 (3.5%) | 243 (3.5%) |
| 60 to 64 Years | 855 (11.4%) | 767 (11.2%) |
| 65 to 69 Years | 534 (7.1%) | 662 (9.6%) |
| 70 to 74 Years | 545 (7.2%) | 733 (10.7%) |
| 75 to 79 Years | 175 (2.3%) | 245 (3.6%) |
| 80 to 84 Years | 192 (2.5%) | 252 (3.7%) |
| 85 Years and over | 170 (2.3%) | 118 (1.7%) |
| Total | 7,524 (100.0%) | 6,864 (100.0%) |
Families and Households in Riverhead
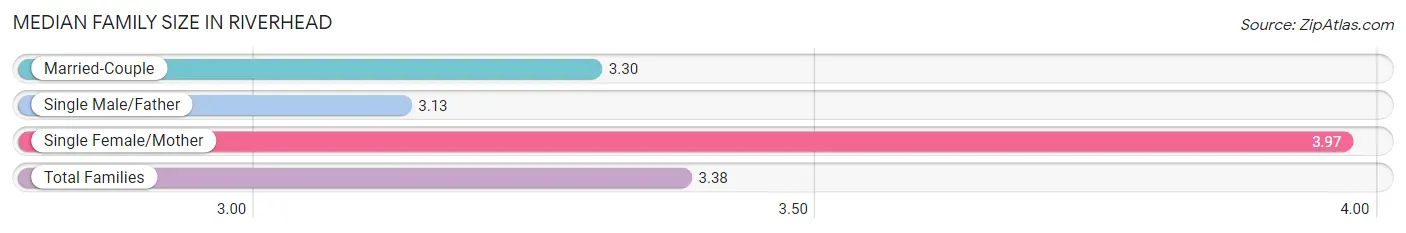
Median Family Size in Riverhead
The median family size in Riverhead is 3.38 persons per family, with single female/mother families (527 | 15.3%) accounting for the largest median family size of 3.97 persons per family. On the other hand, single male/father families (451 | 13.1%) represent the smallest median family size with 3.13 persons per family.
| Family Type | # Families | Family Size |
| Married-Couple | 2,467 (71.6%) | 3.30 |
| Single Male/Father | 451 (13.1%) | 3.13 |
| Single Female/Mother | 527 (15.3%) | 3.97 |
| Total Families | 3,445 (100.0%) | 3.38 |
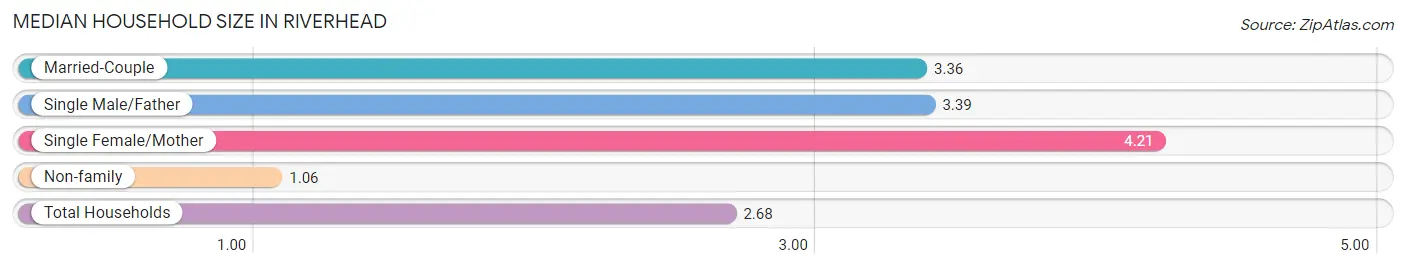
Median Household Size in Riverhead
The median household size in Riverhead is 2.68 persons per household, with single female/mother households (527 | 10.2%) accounting for the largest median household size of 4.21 persons per household. non-family households (1,746 | 33.6%) represent the smallest median household size with 1.06 persons per household.
| Household Type | # Households | Household Size |
| Married-Couple | 2,467 (47.5%) | 3.36 |
| Single Male/Father | 451 (8.7%) | 3.39 |
| Single Female/Mother | 527 (10.2%) | 4.21 |
| Non-family | 1,746 (33.6%) | 1.06 |
| Total Households | 5,191 (100.0%) | 2.68 |
Household Size by Marriage Status in Riverhead
Out of a total of 5,191 households in Riverhead, 3,445 (66.4%) are family households, while 1,746 (33.6%) are nonfamily households. The most numerous type of family households are 2-person households, comprising 1,725, and the most common type of nonfamily households are 1-person households, comprising 1,692.
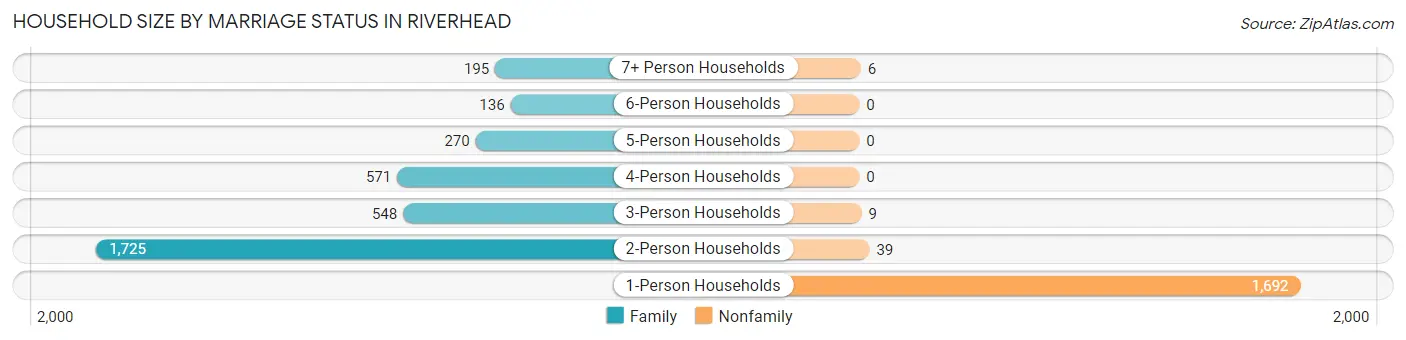
| Household Size | Family Households | Nonfamily Households |
| 1-Person Households | - | 1,692 (32.6%) |
| 2-Person Households | 1,725 (33.2%) | 39 (0.7%) |
| 3-Person Households | 548 (10.6%) | 9 (0.2%) |
| 4-Person Households | 571 (11.0%) | 0 (0.0%) |
| 5-Person Households | 270 (5.2%) | 0 (0.0%) |
| 6-Person Households | 136 (2.6%) | 0 (0.0%) |
| 7+ Person Households | 195 (3.8%) | 6 (0.1%) |
| Total | 3,445 (66.4%) | 1,746 (33.6%) |
Female Fertility in Riverhead
Fertility by Age in Riverhead
Average fertility rate in Riverhead is 41.0 births per 1,000 women. Women in the age bracket of 20 to 34 years have the highest fertility rate with 61.0 births per 1,000 women. Women in the age bracket of 20 to 34 years acount for 83.3% of all women with births.
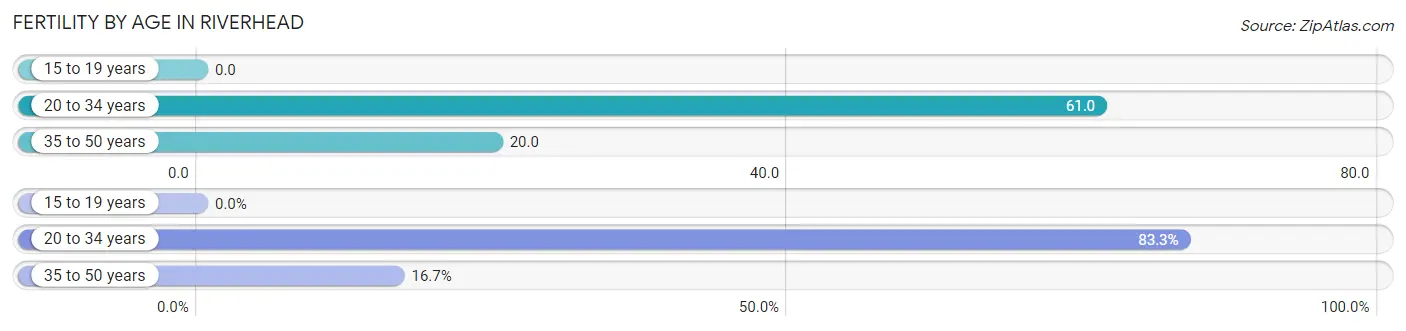
| Age Bracket | Women with Births | Births / 1,000 Women |
| 15 to 19 years | 0 (0.0%) | 0.0 |
| 20 to 34 years | 85 (83.3%) | 61.0 |
| 35 to 50 years | 17 (16.7%) | 20.0 |
| Total | 102 (100.0%) | 41.0 |
Fertility by Age by Marriage Status in Riverhead
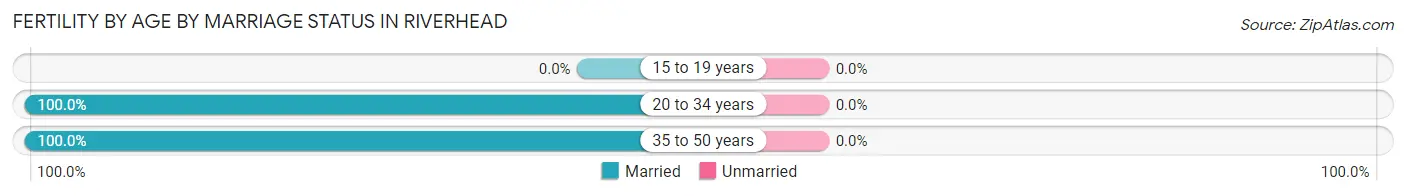
| Age Bracket | Married | Unmarried |
| 15 to 19 years | 0 (0.0%) | 0 (0.0%) |
| 20 to 34 years | 85 (100.0%) | 0 (0.0%) |
| 35 to 50 years | 17 (100.0%) | 0 (0.0%) |
| Total | 102 (100.0%) | 0 (0.0%) |
Fertility by Education in Riverhead
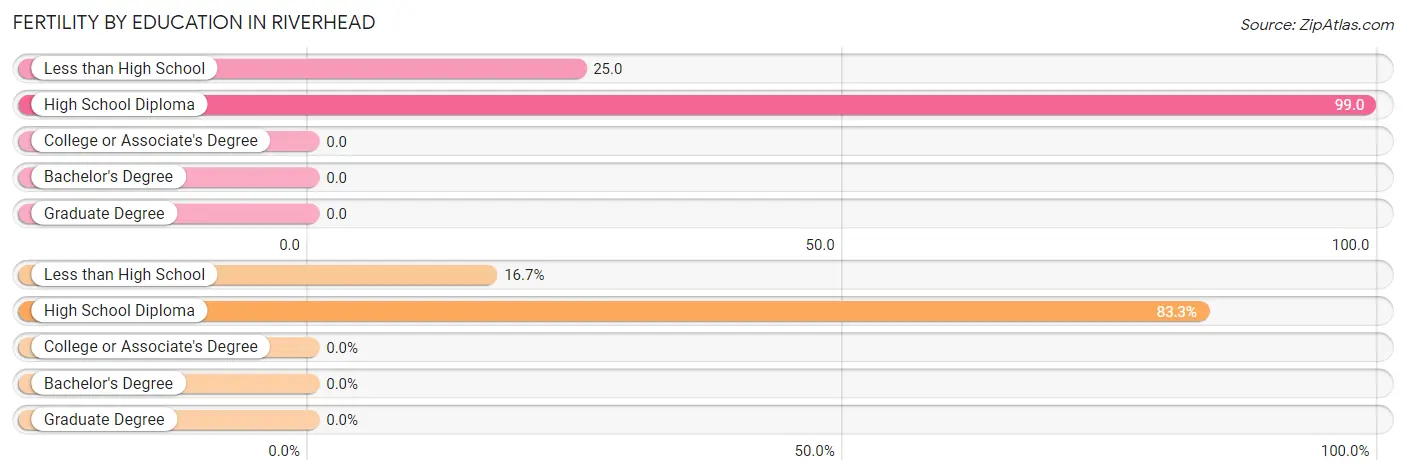
| Educational Attainment | Women with Births | Births / 1,000 Women |
| Less than High School | 17 (16.7%) | 25.0 |
| High School Diploma | 85 (83.3%) | 99.0 |
| College or Associate's Degree | 0 (0.0%) | 0.0 |
| Bachelor's Degree | 0 (0.0%) | 0.0 |
| Graduate Degree | 0 (0.0%) | 0.0 |
| Total | 102 (100.0%) | 41.0 |
Fertility by Education by Marriage Status in Riverhead
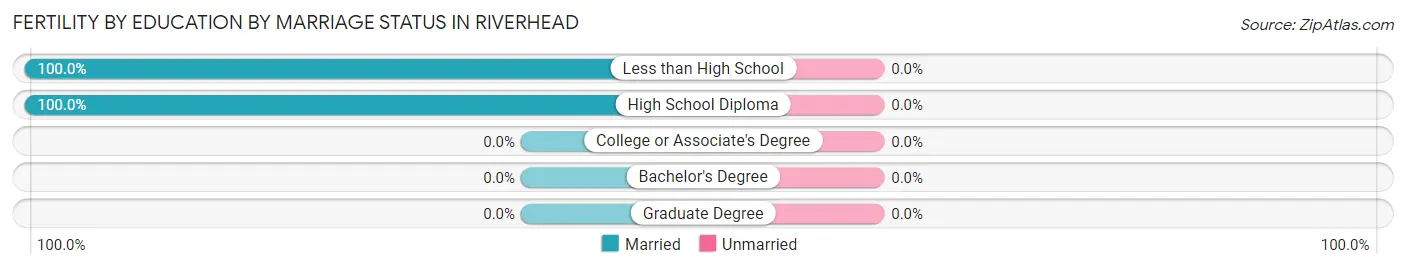
| Educational Attainment | Married | Unmarried |
| Less than High School | 17 (100.0%) | 0 (0.0%) |
| High School Diploma | 85 (100.0%) | 0 (0.0%) |
| College or Associate's Degree | 0 (0.0%) | 0 (0.0%) |
| Bachelor's Degree | 0 (0.0%) | 0 (0.0%) |
| Graduate Degree | 0 (0.0%) | 0 (0.0%) |
| Total | 102 (100.0%) | 0 (0.0%) |
Employment Characteristics in Riverhead
Employment by Class of Employer in Riverhead
Among the 5,958 employed individuals in Riverhead, private company employees (4,293 | 72.1%), local government employees (420 | 7.0%), and self-employed (incorporated) (363 | 6.1%) make up the most common classes of employment.
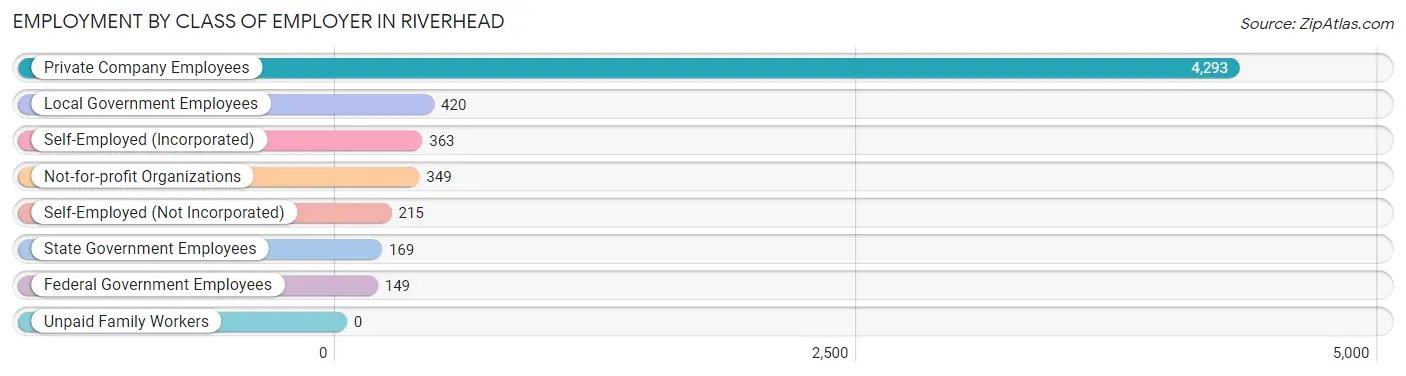
| Employer Class | # Employees | % Employees |
| Private Company Employees | 4,293 | 72.1% |
| Self-Employed (Incorporated) | 363 | 6.1% |
| Self-Employed (Not Incorporated) | 215 | 3.6% |
| Not-for-profit Organizations | 349 | 5.9% |
| Local Government Employees | 420 | 7.0% |
| State Government Employees | 169 | 2.8% |
| Federal Government Employees | 149 | 2.5% |
| Unpaid Family Workers | 0 | 0.0% |
| Total | 5,958 | 100.0% |
Employment Status by Age in Riverhead
According to the labor force statistics for Riverhead, out of the total population over 16 years of age (12,169), 55.4% or 6,742 individuals are in the labor force, with 9.2% or 620 of them unemployed. The age group with the highest labor force participation rate is 30 to 34 years, with 83.9% or 758 individuals in the labor force. Within the labor force, the 55 to 59 years age range has the highest percentage of unemployed individuals, with 22.1% or 91 of them being unemployed.
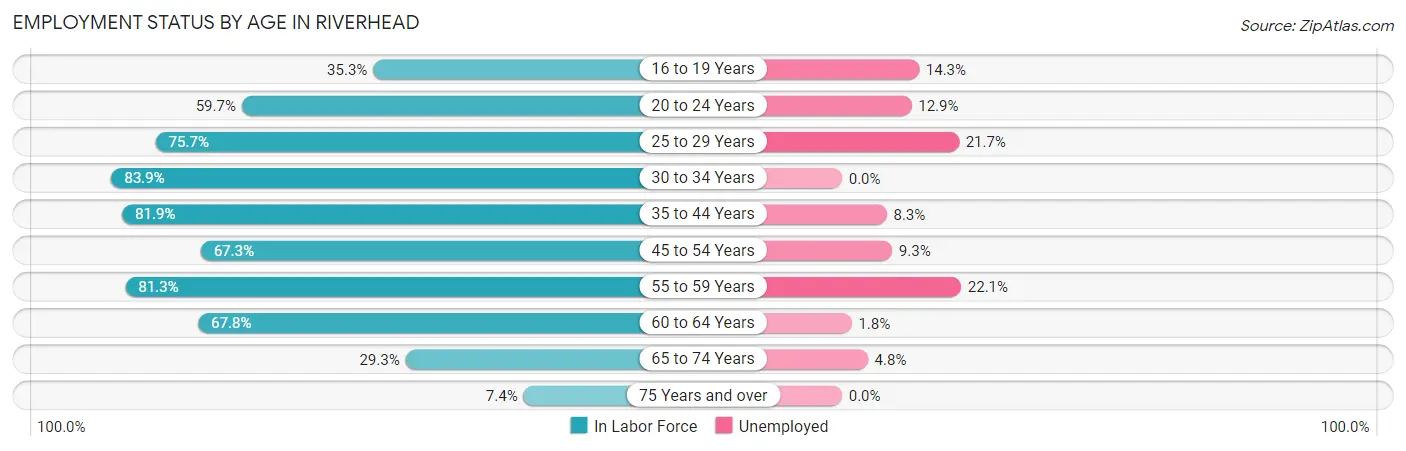
| Age Bracket | In Labor Force | Unemployed |
| 16 to 19 Years | 301 (35.3%) | 43 (14.3%) |
| 20 to 24 Years | 482 (59.7%) | 62 (12.9%) |
| 25 to 29 Years | 879 (75.7%) | 191 (21.7%) |
| 30 to 34 Years | 758 (83.9%) | 0 (0.0%) |
| 35 to 44 Years | 1,079 (81.9%) | 90 (8.3%) |
| 45 to 54 Years | 924 (67.3%) | 86 (9.3%) |
| 55 to 59 Years | 412 (81.3%) | 91 (22.1%) |
| 60 to 64 Years | 1,100 (67.8%) | 20 (1.8%) |
| 65 to 74 Years | 725 (29.3%) | 35 (4.8%) |
| 75 Years and over | 85 (7.4%) | 0 (0.0%) |
| Total | 6,742 (55.4%) | 620 (9.2%) |
Employment Status by Educational Attainment in Riverhead
According to labor force statistics for Riverhead, 74.8% of individuals (5,148) out of the total population between 25 and 64 years of age (6,883) are in the labor force, with 9.3% or 479 of them being unemployed. The group with the highest labor force participation rate are those with the educational attainment of bachelor's degree or higher, with 83.6% or 1,084 individuals in the labor force. Within the labor force, individuals with bachelor's degree or higher education have the highest percentage of unemployment, with 15.2% or 165 of them being unemployed.
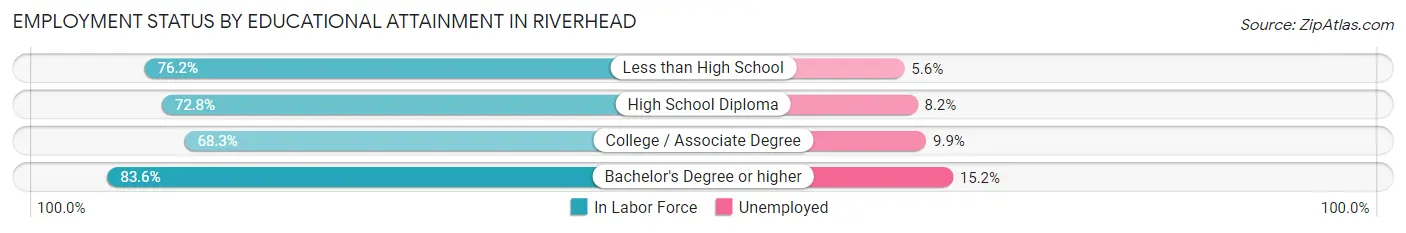
| Educational Attainment | In Labor Force | Unemployed |
| Less than High School | 1,504 (76.2%) | 111 (5.6%) |
| High School Diploma | 1,545 (72.8%) | 174 (8.2%) |
| College / Associate Degree | 1,018 (68.3%) | 148 (9.9%) |
| Bachelor's Degree or higher | 1,084 (83.6%) | 197 (15.2%) |
| Total | 5,148 (74.8%) | 640 (9.3%) |
Employment Occupations by Sex in Riverhead
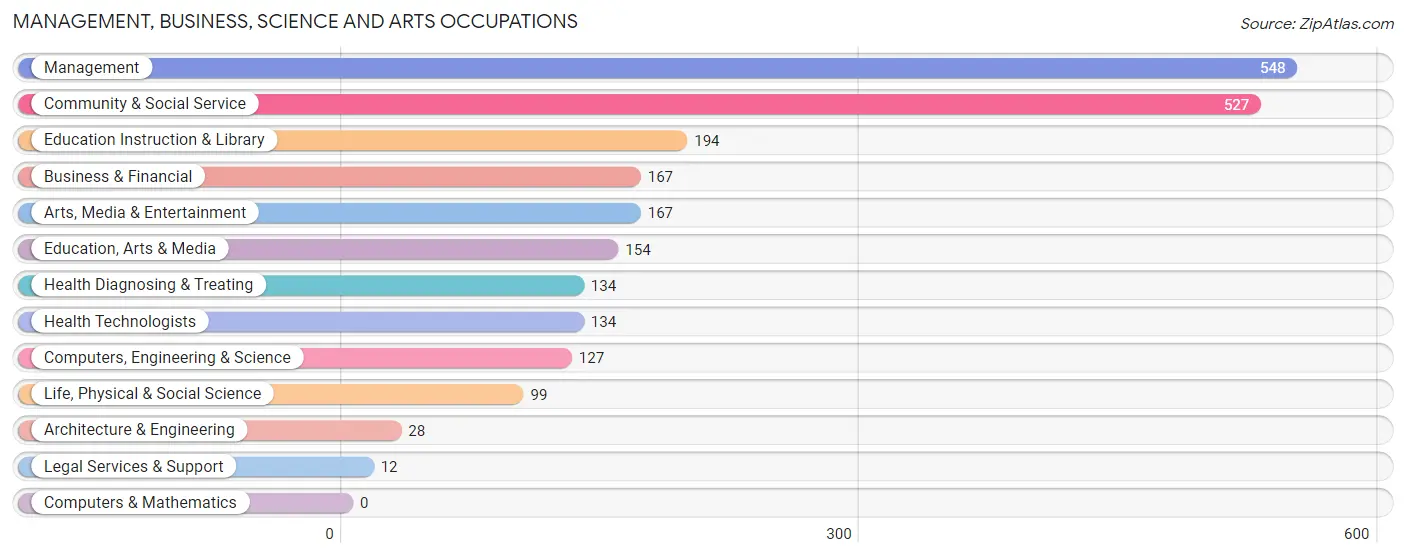
Management, Business, Science and Arts Occupations
The most common Management, Business, Science and Arts occupations in Riverhead are Management (548 | 8.9%), Community & Social Service (527 | 8.6%), Education Instruction & Library (194 | 3.2%), Business & Financial (167 | 2.7%), and Arts, Media & Entertainment (167 | 2.7%).
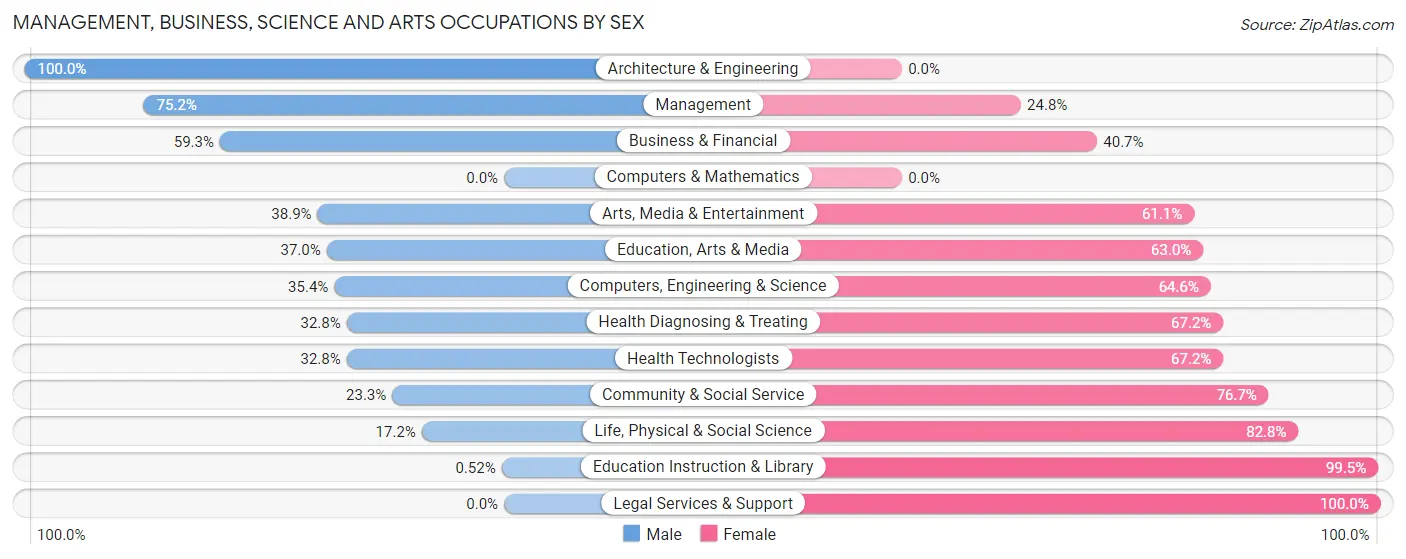
Management, Business, Science and Arts Occupations by Sex
Within the Management, Business, Science and Arts occupations in Riverhead, the most male-oriented occupations are Architecture & Engineering (100.0%), Management (75.2%), and Business & Financial (59.3%), while the most female-oriented occupations are Legal Services & Support (100.0%), Education Instruction & Library (99.5%), and Life, Physical & Social Science (82.8%).
| Occupation | Male | Female |
| Management | 412 (75.2%) | 136 (24.8%) |
| Business & Financial | 99 (59.3%) | 68 (40.7%) |
| Computers, Engineering & Science | 45 (35.4%) | 82 (64.6%) |
| Computers & Mathematics | 0 (0.0%) | 0 (0.0%) |
| Architecture & Engineering | 28 (100.0%) | 0 (0.0%) |
| Life, Physical & Social Science | 17 (17.2%) | 82 (82.8%) |
| Community & Social Service | 123 (23.3%) | 404 (76.7%) |
| Education, Arts & Media | 57 (37.0%) | 97 (63.0%) |
| Legal Services & Support | 0 (0.0%) | 12 (100.0%) |
| Education Instruction & Library | 1 (0.5%) | 193 (99.5%) |
| Arts, Media & Entertainment | 65 (38.9%) | 102 (61.1%) |
| Health Diagnosing & Treating | 44 (32.8%) | 90 (67.2%) |
| Health Technologists | 44 (32.8%) | 90 (67.2%) |
| Total (Category) | 723 (48.1%) | 780 (51.9%) |
| Total (Overall) | 3,558 (58.1%) | 2,567 (41.9%) |
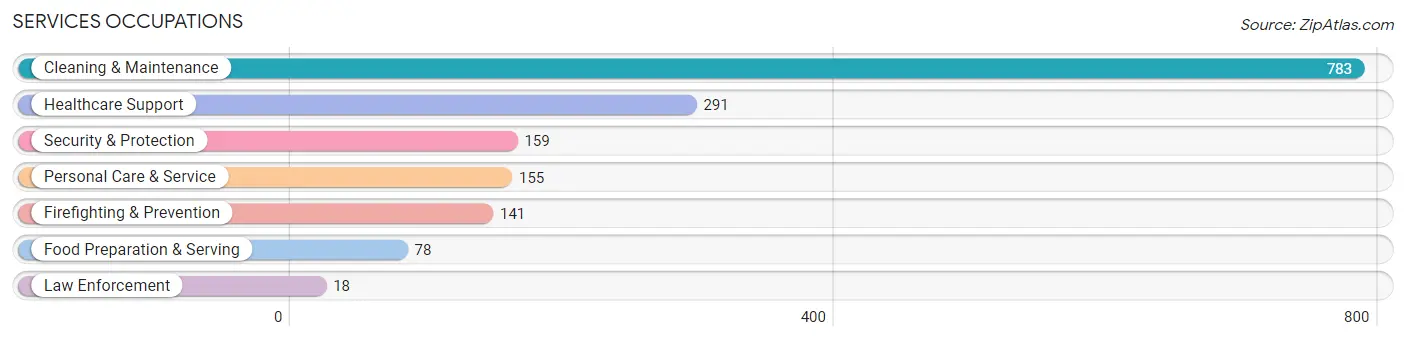
Services Occupations
The most common Services occupations in Riverhead are Cleaning & Maintenance (783 | 12.8%), Healthcare Support (291 | 4.8%), Security & Protection (159 | 2.6%), Personal Care & Service (155 | 2.5%), and Firefighting & Prevention (141 | 2.3%).
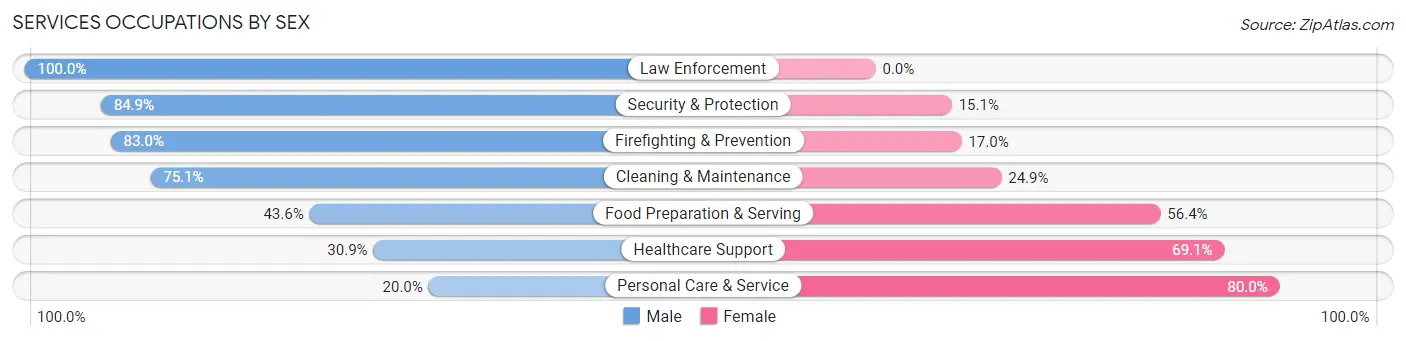
Services Occupations by Sex
Within the Services occupations in Riverhead, the most male-oriented occupations are Law Enforcement (100.0%), Security & Protection (84.9%), and Firefighting & Prevention (83.0%), while the most female-oriented occupations are Personal Care & Service (80.0%), Healthcare Support (69.1%), and Food Preparation & Serving (56.4%).
| Occupation | Male | Female |
| Healthcare Support | 90 (30.9%) | 201 (69.1%) |
| Security & Protection | 135 (84.9%) | 24 (15.1%) |
| Firefighting & Prevention | 117 (83.0%) | 24 (17.0%) |
| Law Enforcement | 18 (100.0%) | 0 (0.0%) |
| Food Preparation & Serving | 34 (43.6%) | 44 (56.4%) |
| Cleaning & Maintenance | 588 (75.1%) | 195 (24.9%) |
| Personal Care & Service | 31 (20.0%) | 124 (80.0%) |
| Total (Category) | 878 (59.9%) | 588 (40.1%) |
| Total (Overall) | 3,558 (58.1%) | 2,567 (41.9%) |
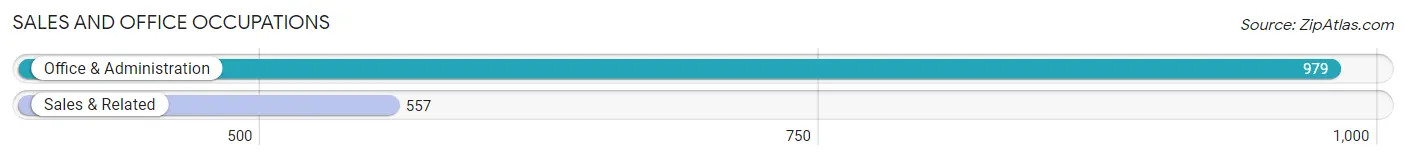
Sales and Office Occupations
The most common Sales and Office occupations in Riverhead are Office & Administration (979 | 16.0%), and Sales & Related (557 | 9.1%).
Sales and Office Occupations by Sex
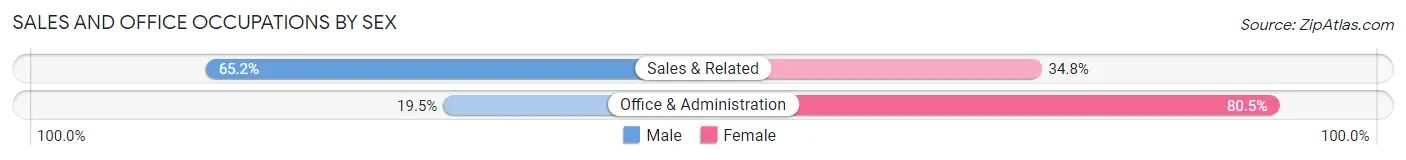
| Occupation | Male | Female |
| Sales & Related | 363 (65.2%) | 194 (34.8%) |
| Office & Administration | 191 (19.5%) | 788 (80.5%) |
| Total (Category) | 554 (36.1%) | 982 (63.9%) |
| Total (Overall) | 3,558 (58.1%) | 2,567 (41.9%) |
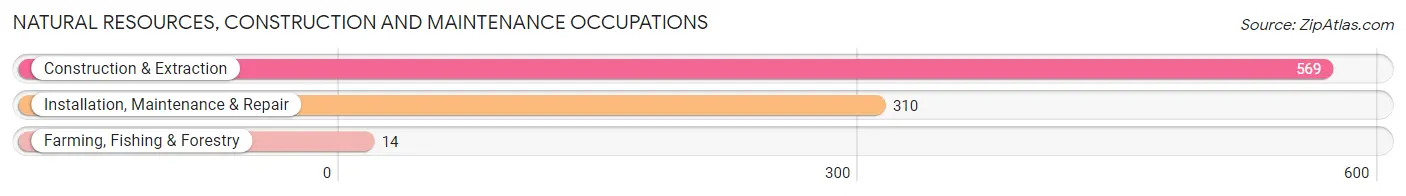
Natural Resources, Construction and Maintenance Occupations
The most common Natural Resources, Construction and Maintenance occupations in Riverhead are Construction & Extraction (569 | 9.3%), Installation, Maintenance & Repair (310 | 5.1%), and Farming, Fishing & Forestry (14 | 0.2%).
Natural Resources, Construction and Maintenance Occupations by Sex
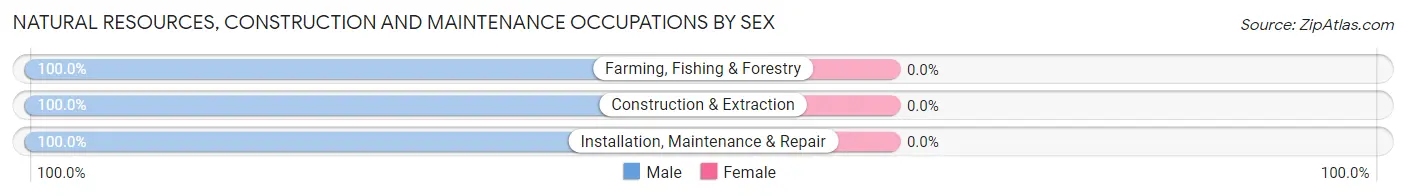
| Occupation | Male | Female |
| Farming, Fishing & Forestry | 14 (100.0%) | 0 (0.0%) |
| Construction & Extraction | 569 (100.0%) | 0 (0.0%) |
| Installation, Maintenance & Repair | 310 (100.0%) | 0 (0.0%) |
| Total (Category) | 893 (100.0%) | 0 (0.0%) |
| Total (Overall) | 3,558 (58.1%) | 2,567 (41.9%) |
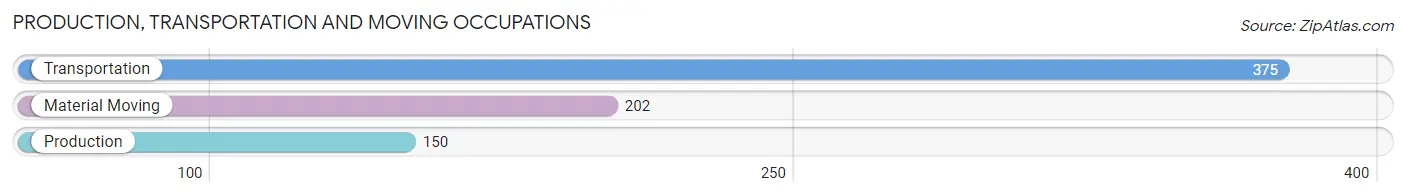
Production, Transportation and Moving Occupations
The most common Production, Transportation and Moving occupations in Riverhead are Transportation (375 | 6.1%), Material Moving (202 | 3.3%), and Production (150 | 2.5%).
Production, Transportation and Moving Occupations by Sex
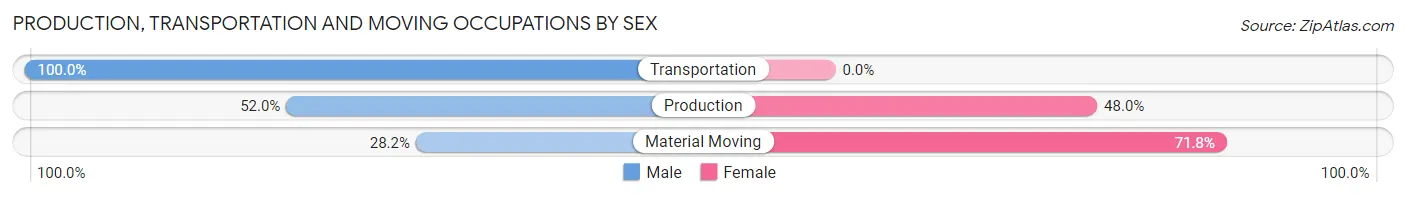
| Occupation | Male | Female |
| Production | 78 (52.0%) | 72 (48.0%) |
| Transportation | 375 (100.0%) | 0 (0.0%) |
| Material Moving | 57 (28.2%) | 145 (71.8%) |
| Total (Category) | 510 (70.2%) | 217 (29.8%) |
| Total (Overall) | 3,558 (58.1%) | 2,567 (41.9%) |
Employment Industries by Sex in Riverhead
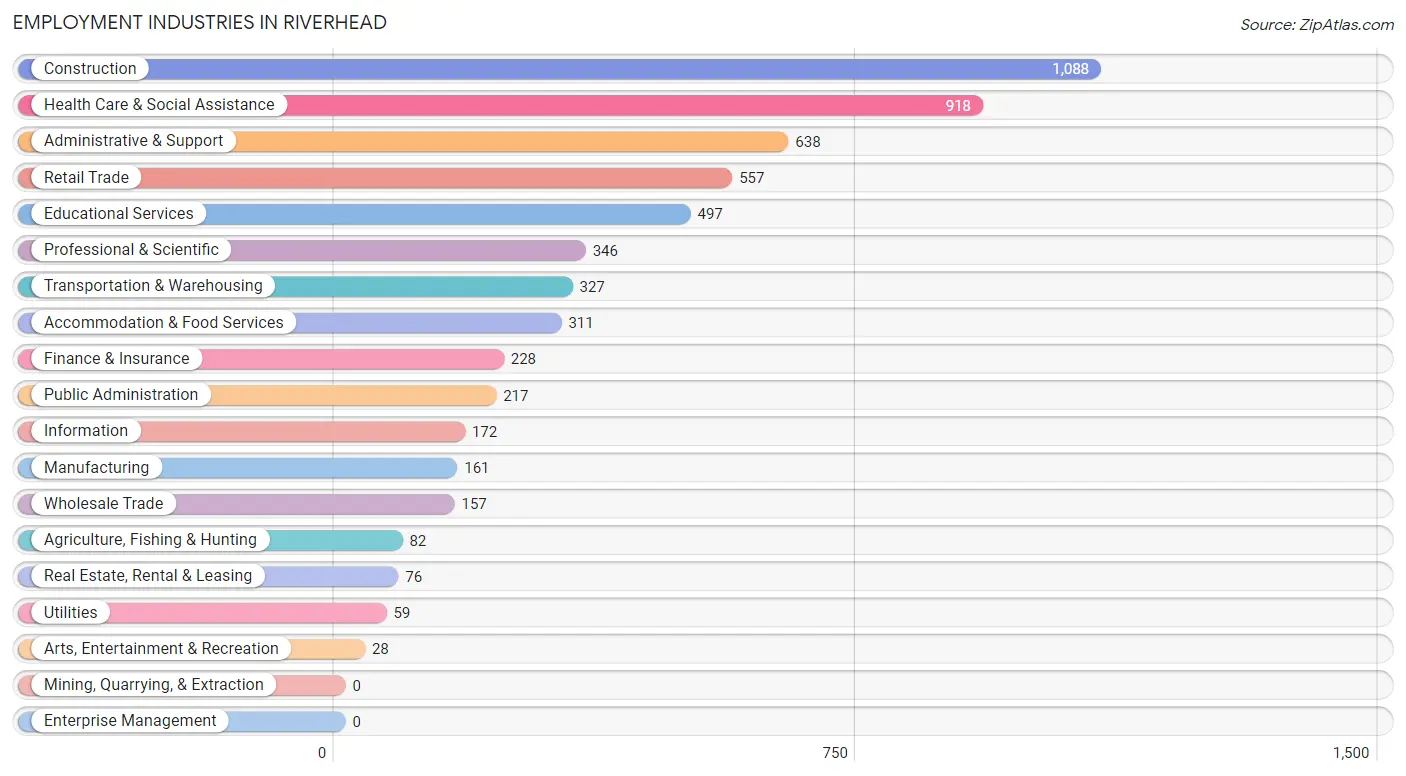
Employment Industries in Riverhead
The major employment industries in Riverhead include Construction (1,088 | 17.8%), Health Care & Social Assistance (918 | 15.0%), Administrative & Support (638 | 10.4%), Retail Trade (557 | 9.1%), and Educational Services (497 | 8.1%).
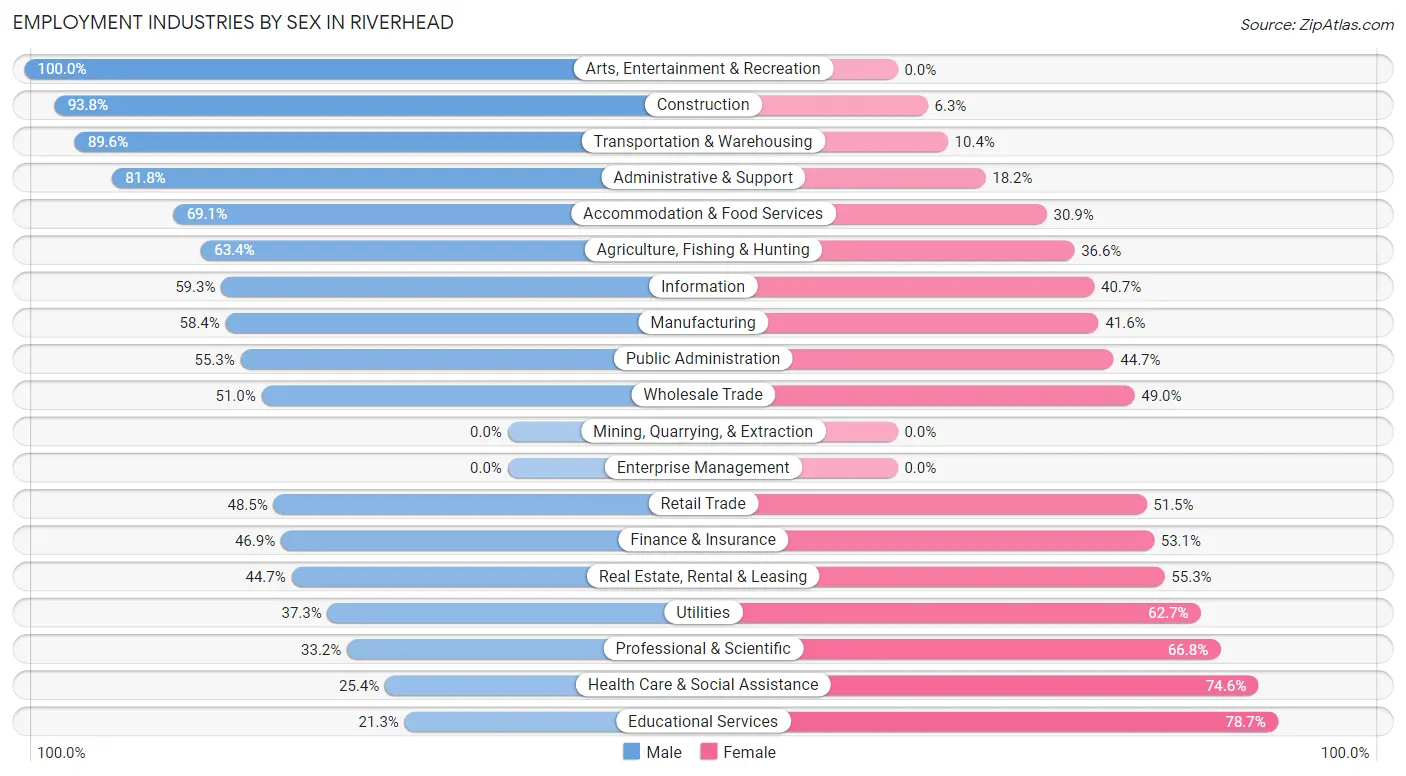
Employment Industries by Sex in Riverhead
The Riverhead industries that see more men than women are Arts, Entertainment & Recreation (100.0%), Construction (93.8%), and Transportation & Warehousing (89.6%), whereas the industries that tend to have a higher number of women are Educational Services (78.7%), Health Care & Social Assistance (74.6%), and Professional & Scientific (66.8%).
| Industry | Male | Female |
| Agriculture, Fishing & Hunting | 52 (63.4%) | 30 (36.6%) |
| Mining, Quarrying, & Extraction | 0 (0.0%) | 0 (0.0%) |
| Construction | 1,020 (93.8%) | 68 (6.2%) |
| Manufacturing | 94 (58.4%) | 67 (41.6%) |
| Wholesale Trade | 80 (51.0%) | 77 (49.0%) |
| Retail Trade | 270 (48.5%) | 287 (51.5%) |
| Transportation & Warehousing | 293 (89.6%) | 34 (10.4%) |
| Utilities | 22 (37.3%) | 37 (62.7%) |
| Information | 102 (59.3%) | 70 (40.7%) |
| Finance & Insurance | 107 (46.9%) | 121 (53.1%) |
| Real Estate, Rental & Leasing | 34 (44.7%) | 42 (55.3%) |
| Professional & Scientific | 115 (33.2%) | 231 (66.8%) |
| Enterprise Management | 0 (0.0%) | 0 (0.0%) |
| Administrative & Support | 522 (81.8%) | 116 (18.2%) |
| Educational Services | 106 (21.3%) | 391 (78.7%) |
| Health Care & Social Assistance | 233 (25.4%) | 685 (74.6%) |
| Arts, Entertainment & Recreation | 28 (100.0%) | 0 (0.0%) |
| Accommodation & Food Services | 215 (69.1%) | 96 (30.9%) |
| Public Administration | 120 (55.3%) | 97 (44.7%) |
| Total | 3,558 (58.1%) | 2,567 (41.9%) |
Education in Riverhead
School Enrollment in Riverhead
The most common levels of schooling among the 2,466 students in Riverhead are high school (901 | 36.5%), elementary school (500 | 20.3%), and middle school (445 | 18.0%).
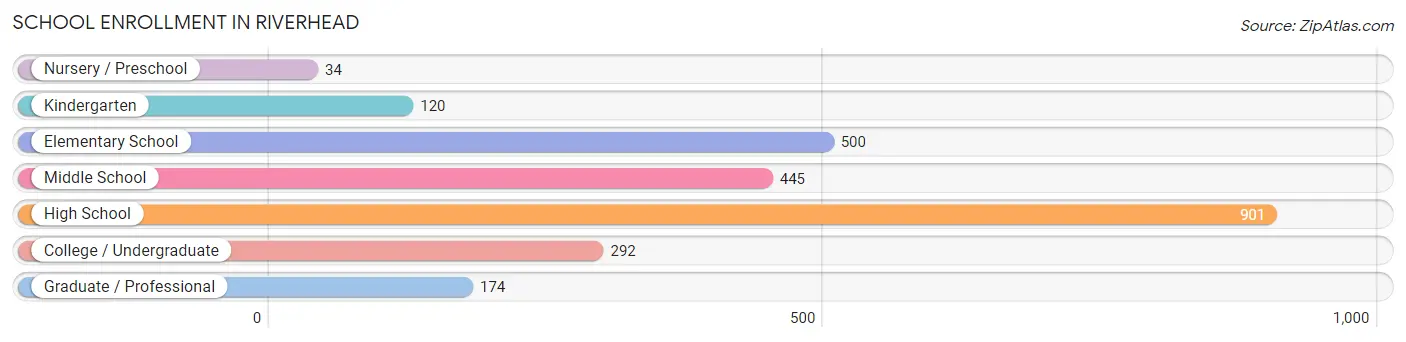
| School Level | # Students | % Students |
| Nursery / Preschool | 34 | 1.4% |
| Kindergarten | 120 | 4.9% |
| Elementary School | 500 | 20.3% |
| Middle School | 445 | 18.0% |
| High School | 901 | 36.5% |
| College / Undergraduate | 292 | 11.8% |
| Graduate / Professional | 174 | 7.1% |
| Total | 2,466 | 100.0% |
School Enrollment by Age by Funding Source in Riverhead
Out of a total of 2,466 students who are enrolled in schools in Riverhead, 180 (7.3%) attend a private institution, while the remaining 2,286 (92.7%) are enrolled in public schools. The age group of 25 to 34 year olds has the highest likelihood of being enrolled in private schools, with 94 (86.2% in the age bracket) enrolled. Conversely, the age group of 3 to 4 year olds has the lowest likelihood of being enrolled in a private school, with 49 (100.0% in the age bracket) attending a public institution.
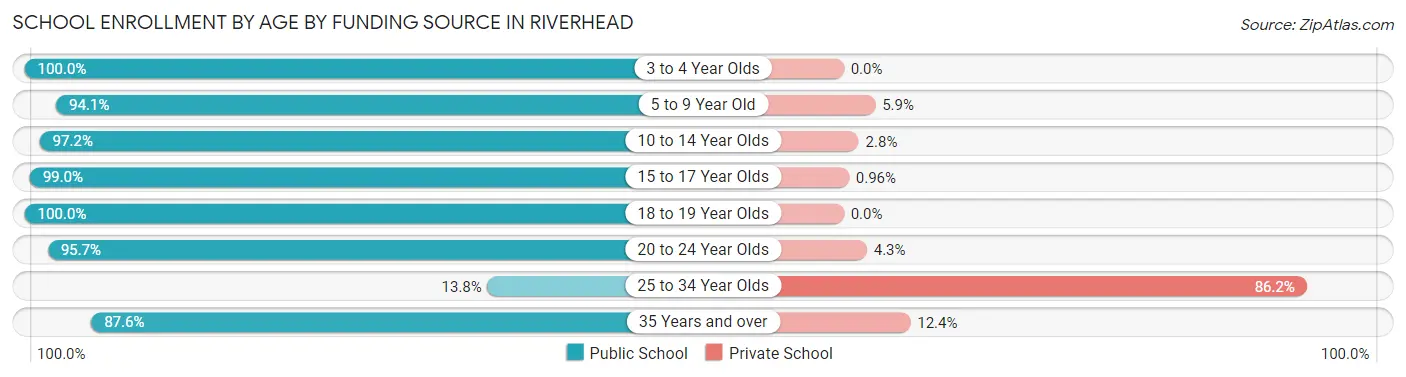
| Age Bracket | Public School | Private School |
| 3 to 4 Year Olds | 49 (100.0%) | 0 (0.0%) |
| 5 to 9 Year Old | 529 (94.1%) | 33 (5.9%) |
| 10 to 14 Year Olds | 488 (97.2%) | 14 (2.8%) |
| 15 to 17 Year Olds | 619 (99.0%) | 6 (1.0%) |
| 18 to 19 Year Olds | 134 (100.0%) | 0 (0.0%) |
| 20 to 24 Year Olds | 333 (95.7%) | 15 (4.3%) |
| 25 to 34 Year Olds | 15 (13.8%) | 94 (86.2%) |
| 35 Years and over | 120 (87.6%) | 17 (12.4%) |
| Total | 2,286 (92.7%) | 180 (7.3%) |
Educational Attainment by Field of Study in Riverhead
Education (357 | 18.2%), liberal arts & history (263 | 13.4%), business (259 | 13.2%), engineering (199 | 10.2%), and science & technology (183 | 9.3%) are the most common fields of study among 1,959 individuals in Riverhead who have obtained a bachelor's degree or higher.
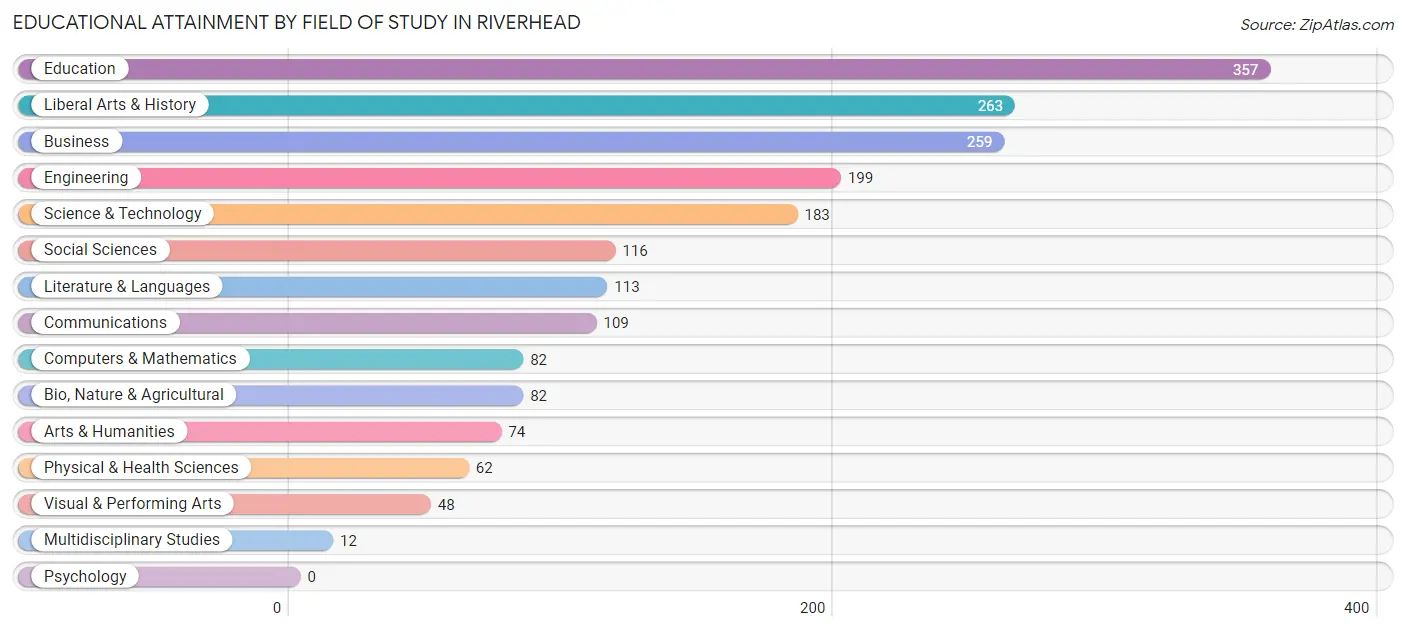
| Field of Study | # Graduates | % Graduates |
| Computers & Mathematics | 82 | 4.2% |
| Bio, Nature & Agricultural | 82 | 4.2% |
| Physical & Health Sciences | 62 | 3.2% |
| Psychology | 0 | 0.0% |
| Social Sciences | 116 | 5.9% |
| Engineering | 199 | 10.2% |
| Multidisciplinary Studies | 12 | 0.6% |
| Science & Technology | 183 | 9.3% |
| Business | 259 | 13.2% |
| Education | 357 | 18.2% |
| Literature & Languages | 113 | 5.8% |
| Liberal Arts & History | 263 | 13.4% |
| Visual & Performing Arts | 48 | 2.5% |
| Communications | 109 | 5.6% |
| Arts & Humanities | 74 | 3.8% |
| Total | 1,959 | 100.0% |
Transportation & Commute in Riverhead
Vehicle Availability by Sex in Riverhead
The most prevalent vehicle ownership categories in Riverhead are males with 2 vehicles (999, accounting for 28.7%) and females with 2 vehicles (857, making up 40.9%).
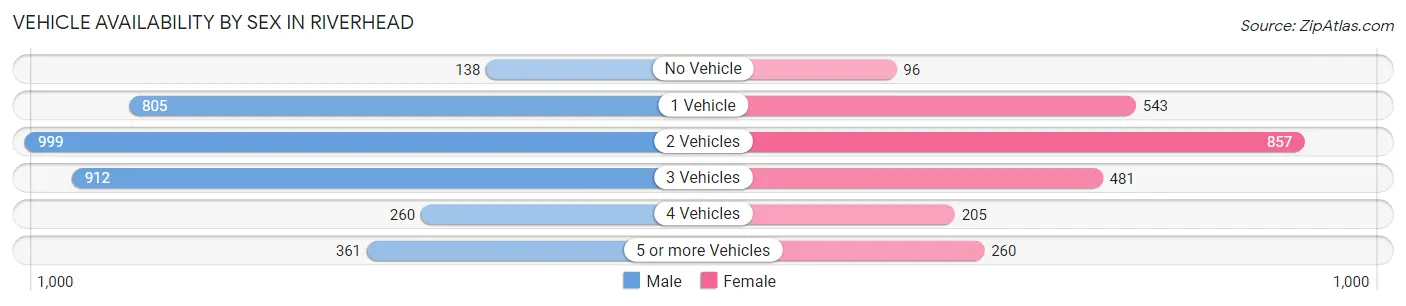
| Vehicles Available | Male | Female |
| No Vehicle | 138 (4.0%) | 96 (3.9%) |
| 1 Vehicle | 805 (23.2%) | 543 (22.2%) |
| 2 Vehicles | 999 (28.7%) | 857 (35.1%) |
| 3 Vehicles | 912 (26.2%) | 481 (19.7%) |
| 4 Vehicles | 260 (7.5%) | 205 (8.4%) |
| 5 or more Vehicles | 361 (10.4%) | 260 (10.6%) |
| Total | 3,475 (100.0%) | 2,442 (100.0%) |
Commute Time in Riverhead
The most frequently occuring commute durations in Riverhead are 10 to 14 minutes (1,086 commuters, 18.9%), 30 to 34 minutes (765 commuters, 13.3%), and 45 to 59 minutes (668 commuters, 11.6%).
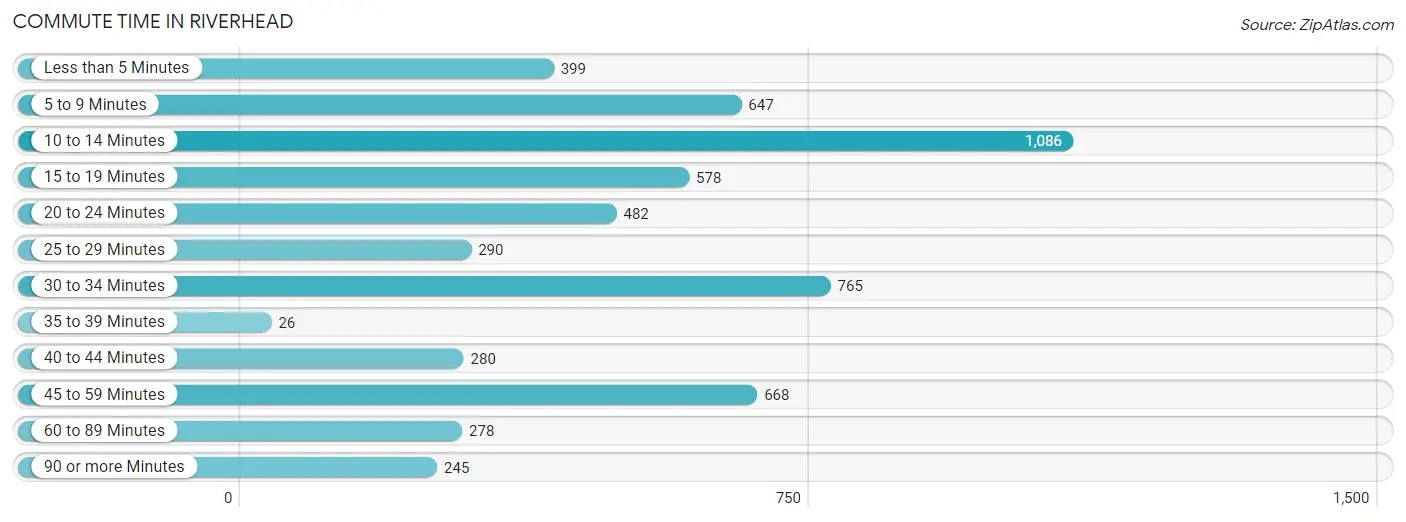
| Commute Time | # Commuters | % Commuters |
| Less than 5 Minutes | 399 | 7.0% |
| 5 to 9 Minutes | 647 | 11.3% |
| 10 to 14 Minutes | 1,086 | 18.9% |
| 15 to 19 Minutes | 578 | 10.1% |
| 20 to 24 Minutes | 482 | 8.4% |
| 25 to 29 Minutes | 290 | 5.1% |
| 30 to 34 Minutes | 765 | 13.3% |
| 35 to 39 Minutes | 26 | 0.4% |
| 40 to 44 Minutes | 280 | 4.9% |
| 45 to 59 Minutes | 668 | 11.6% |
| 60 to 89 Minutes | 278 | 4.8% |
| 90 or more Minutes | 245 | 4.3% |
Commute Time by Sex in Riverhead
The most common commute times in Riverhead are 10 to 14 minutes (672 commuters, 19.5%) for males and 5 to 9 minutes (469 commuters, 20.5%) for females.
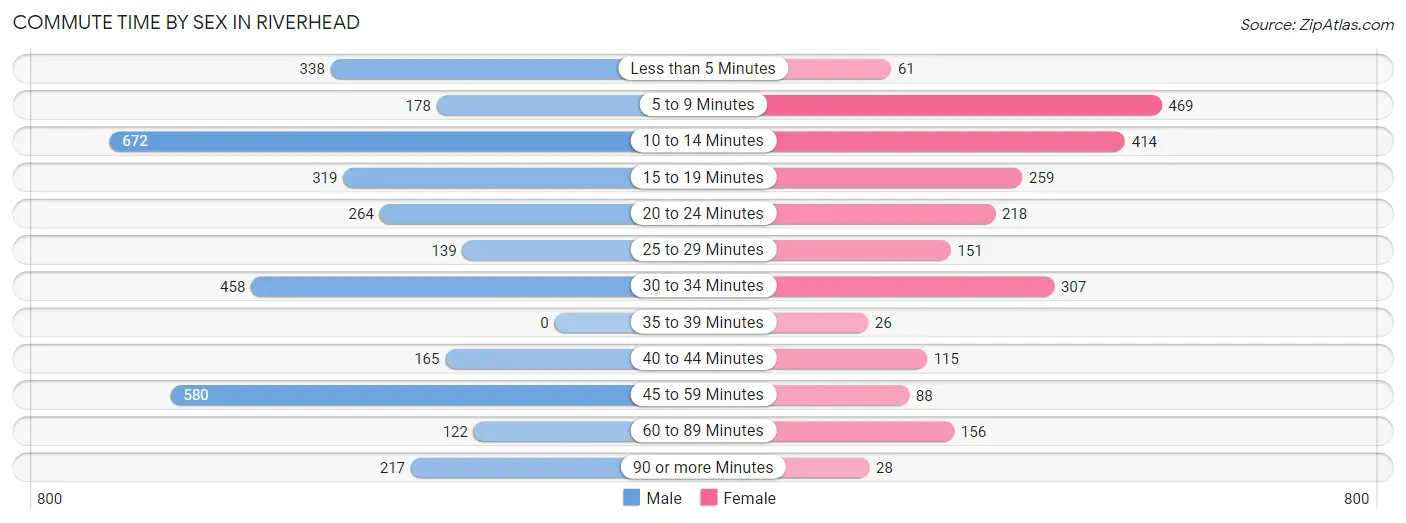
| Commute Time | Male | Female |
| Less than 5 Minutes | 338 (9.8%) | 61 (2.7%) |
| 5 to 9 Minutes | 178 (5.2%) | 469 (20.5%) |
| 10 to 14 Minutes | 672 (19.5%) | 414 (18.1%) |
| 15 to 19 Minutes | 319 (9.2%) | 259 (11.3%) |
| 20 to 24 Minutes | 264 (7.6%) | 218 (9.5%) |
| 25 to 29 Minutes | 139 (4.0%) | 151 (6.6%) |
| 30 to 34 Minutes | 458 (13.3%) | 307 (13.4%) |
| 35 to 39 Minutes | 0 (0.0%) | 26 (1.1%) |
| 40 to 44 Minutes | 165 (4.8%) | 115 (5.0%) |
| 45 to 59 Minutes | 580 (16.8%) | 88 (3.8%) |
| 60 to 89 Minutes | 122 (3.5%) | 156 (6.8%) |
| 90 or more Minutes | 217 (6.3%) | 28 (1.2%) |
Time of Departure to Work by Sex in Riverhead
The most frequent times of departure to work in Riverhead are 7:00 AM to 7:29 AM (530, 15.3%) for males and 8:00 AM to 8:29 AM (453, 19.8%) for females.
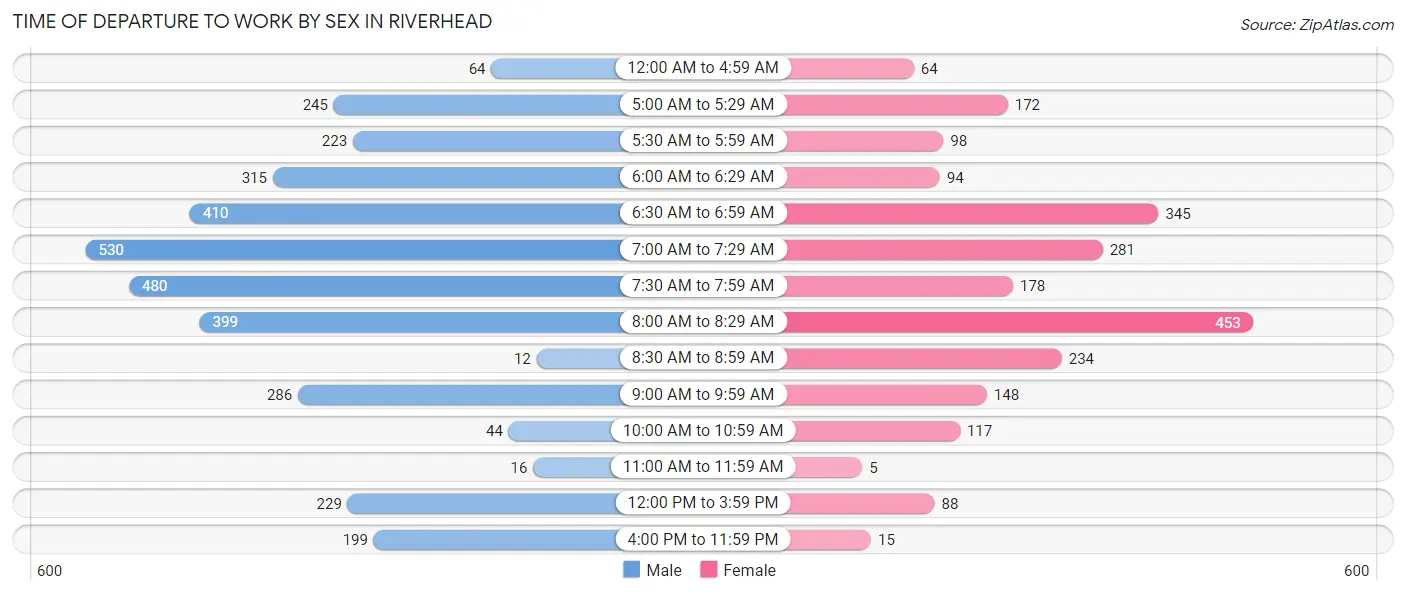
| Time of Departure | Male | Female |
| 12:00 AM to 4:59 AM | 64 (1.8%) | 64 (2.8%) |
| 5:00 AM to 5:29 AM | 245 (7.1%) | 172 (7.5%) |
| 5:30 AM to 5:59 AM | 223 (6.5%) | 98 (4.3%) |
| 6:00 AM to 6:29 AM | 315 (9.1%) | 94 (4.1%) |
| 6:30 AM to 6:59 AM | 410 (11.9%) | 345 (15.0%) |
| 7:00 AM to 7:29 AM | 530 (15.3%) | 281 (12.3%) |
| 7:30 AM to 7:59 AM | 480 (13.9%) | 178 (7.8%) |
| 8:00 AM to 8:29 AM | 399 (11.6%) | 453 (19.8%) |
| 8:30 AM to 8:59 AM | 12 (0.4%) | 234 (10.2%) |
| 9:00 AM to 9:59 AM | 286 (8.3%) | 148 (6.5%) |
| 10:00 AM to 10:59 AM | 44 (1.3%) | 117 (5.1%) |
| 11:00 AM to 11:59 AM | 16 (0.5%) | 5 (0.2%) |
| 12:00 PM to 3:59 PM | 229 (6.6%) | 88 (3.8%) |
| 4:00 PM to 11:59 PM | 199 (5.8%) | 15 (0.6%) |
| Total | 3,452 (100.0%) | 2,292 (100.0%) |
Housing Occupancy in Riverhead
Occupancy by Ownership in Riverhead
Of the total 5,191 dwellings in Riverhead, owner-occupied units account for 2,986 (57.5%), while renter-occupied units make up 2,205 (42.5%).
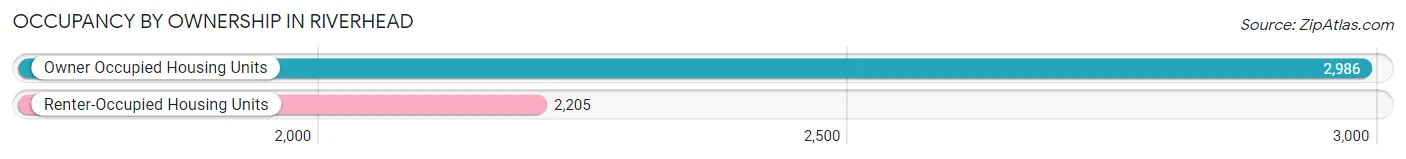
| Occupancy | # Housing Units | % Housing Units |
| Owner Occupied Housing Units | 2,986 | 57.5% |
| Renter-Occupied Housing Units | 2,205 | 42.5% |
| Total Occupied Housing Units | 5,191 | 100.0% |
Occupancy by Household Size in Riverhead
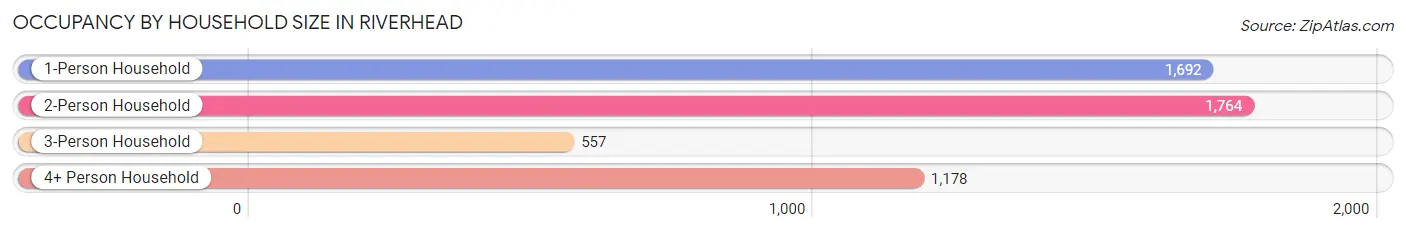
| Household Size | # Housing Units | % Housing Units |
| 1-Person Household | 1,692 | 32.6% |
| 2-Person Household | 1,764 | 34.0% |
| 3-Person Household | 557 | 10.7% |
| 4+ Person Household | 1,178 | 22.7% |
| Total Housing Units | 5,191 | 100.0% |
Occupancy by Ownership by Household Size in Riverhead
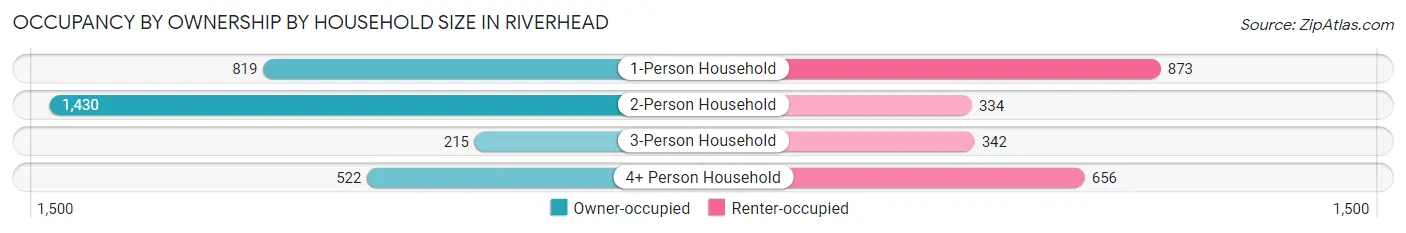
| Household Size | Owner-occupied | Renter-occupied |
| 1-Person Household | 819 (48.4%) | 873 (51.6%) |
| 2-Person Household | 1,430 (81.1%) | 334 (18.9%) |
| 3-Person Household | 215 (38.6%) | 342 (61.4%) |
| 4+ Person Household | 522 (44.3%) | 656 (55.7%) |
| Total Housing Units | 2,986 (57.5%) | 2,205 (42.5%) |
Occupancy by Educational Attainment in Riverhead
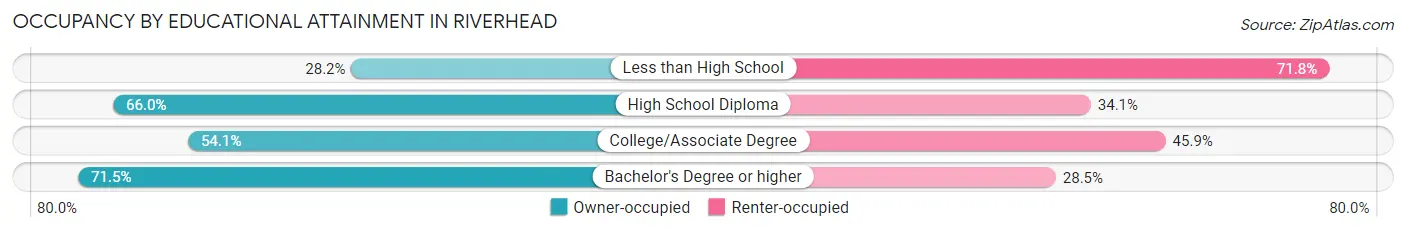
| Household Size | Owner-occupied | Renter-occupied |
| Less than High School | 222 (28.2%) | 566 (71.8%) |
| High School Diploma | 1,313 (65.9%) | 678 (34.1%) |
| College/Associate Degree | 849 (54.1%) | 721 (45.9%) |
| Bachelor's Degree or higher | 602 (71.5%) | 240 (28.5%) |
Occupancy by Age of Householder in Riverhead
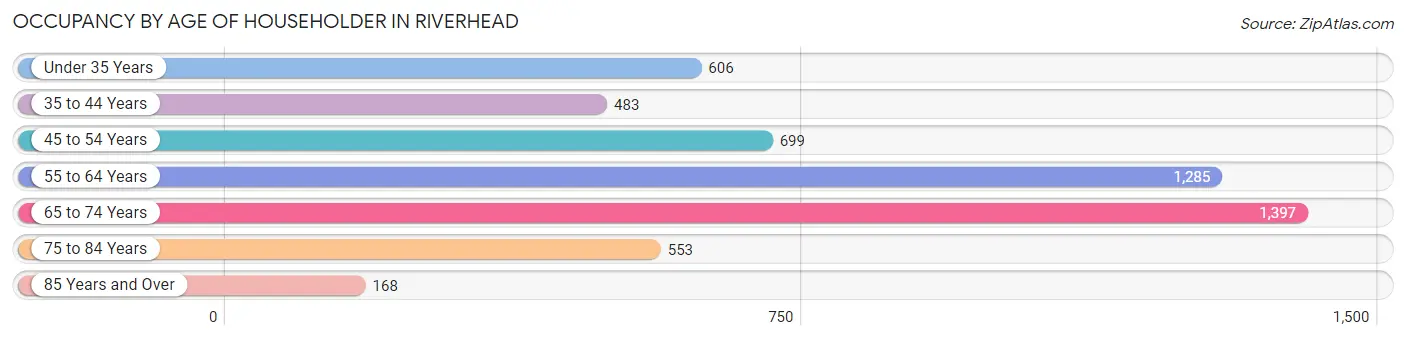
| Age Bracket | # Households | % Households |
| Under 35 Years | 606 | 11.7% |
| 35 to 44 Years | 483 | 9.3% |
| 45 to 54 Years | 699 | 13.5% |
| 55 to 64 Years | 1,285 | 24.7% |
| 65 to 74 Years | 1,397 | 26.9% |
| 75 to 84 Years | 553 | 10.6% |
| 85 Years and Over | 168 | 3.2% |
| Total | 5,191 | 100.0% |
Housing Finances in Riverhead
Median Income by Occupancy in Riverhead
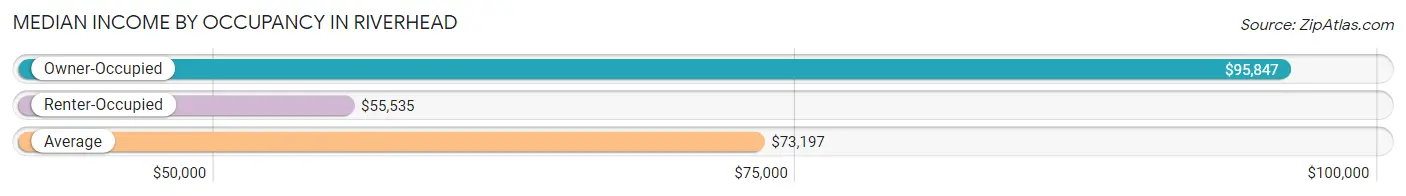
| Occupancy Type | # Households | Median Income |
| Owner-Occupied | 2,986 (57.5%) | $95,847 |
| Renter-Occupied | 2,205 (42.5%) | $55,535 |
| Average | 5,191 (100.0%) | $73,197 |
Occupancy by Householder Income Bracket in Riverhead
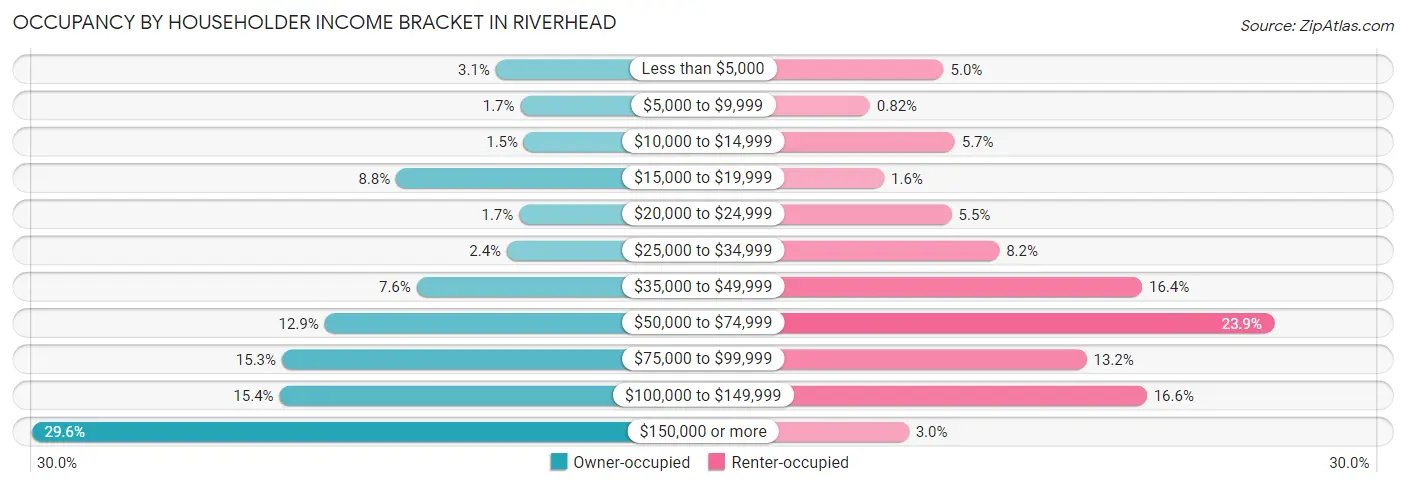
| Income Bracket | Owner-occupied | Renter-occupied |
| Less than $5,000 | 92 (3.1%) | 111 (5.0%) |
| $5,000 to $9,999 | 50 (1.7%) | 18 (0.8%) |
| $10,000 to $14,999 | 44 (1.5%) | 125 (5.7%) |
| $15,000 to $19,999 | 262 (8.8%) | 36 (1.6%) |
| $20,000 to $24,999 | 52 (1.7%) | 121 (5.5%) |
| $25,000 to $34,999 | 73 (2.4%) | 181 (8.2%) |
| $35,000 to $49,999 | 227 (7.6%) | 361 (16.4%) |
| $50,000 to $74,999 | 384 (12.9%) | 527 (23.9%) |
| $75,000 to $99,999 | 457 (15.3%) | 291 (13.2%) |
| $100,000 to $149,999 | 461 (15.4%) | 367 (16.6%) |
| $150,000 or more | 884 (29.6%) | 67 (3.0%) |
| Total | 2,986 (100.0%) | 2,205 (100.0%) |
Monthly Housing Cost Tiers in Riverhead
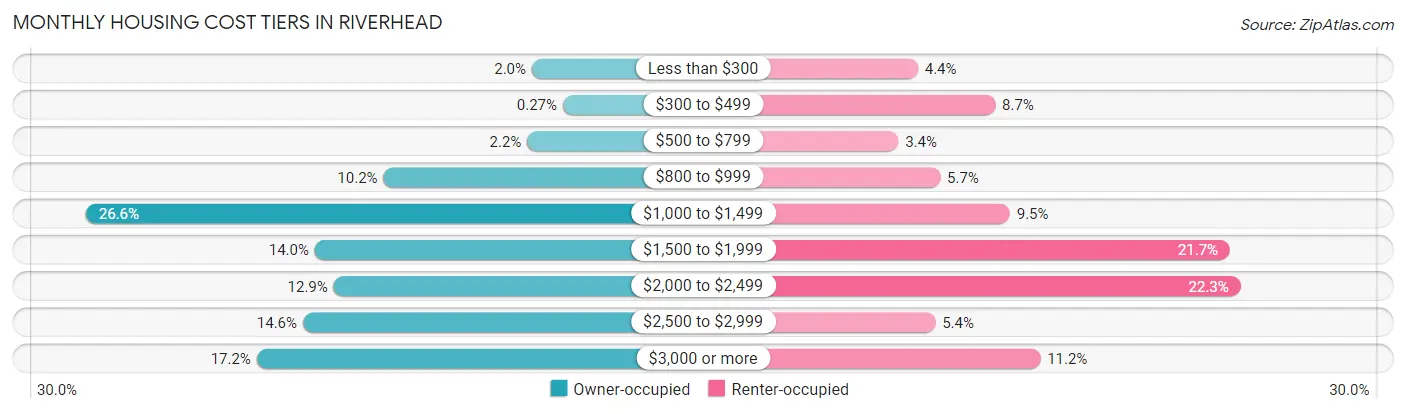
| Monthly Cost | Owner-occupied | Renter-occupied |
| Less than $300 | 59 (2.0%) | 98 (4.4%) |
| $300 to $499 | 8 (0.3%) | 192 (8.7%) |
| $500 to $799 | 67 (2.2%) | 74 (3.4%) |
| $800 to $999 | 304 (10.2%) | 125 (5.7%) |
| $1,000 to $1,499 | 795 (26.6%) | 210 (9.5%) |
| $1,500 to $1,999 | 417 (14.0%) | 478 (21.7%) |
| $2,000 to $2,499 | 386 (12.9%) | 491 (22.3%) |
| $2,500 to $2,999 | 437 (14.6%) | 119 (5.4%) |
| $3,000 or more | 513 (17.2%) | 247 (11.2%) |
| Total | 2,986 (100.0%) | 2,205 (100.0%) |
Physical Housing Characteristics in Riverhead
Housing Structures in Riverhead
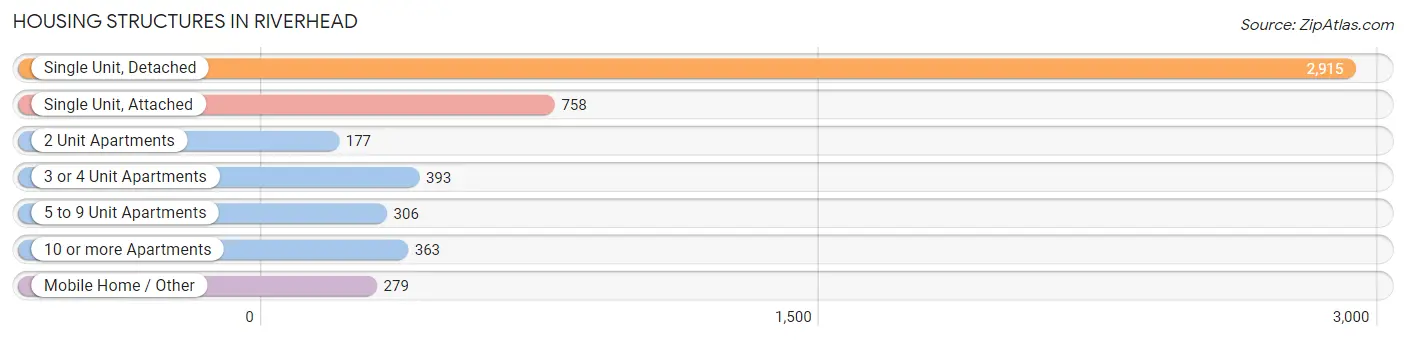
| Structure Type | # Housing Units | % Housing Units |
| Single Unit, Detached | 2,915 | 56.1% |
| Single Unit, Attached | 758 | 14.6% |
| 2 Unit Apartments | 177 | 3.4% |
| 3 or 4 Unit Apartments | 393 | 7.6% |
| 5 to 9 Unit Apartments | 306 | 5.9% |
| 10 or more Apartments | 363 | 7.0% |
| Mobile Home / Other | 279 | 5.4% |
| Total | 5,191 | 100.0% |
Housing Structures by Occupancy in Riverhead
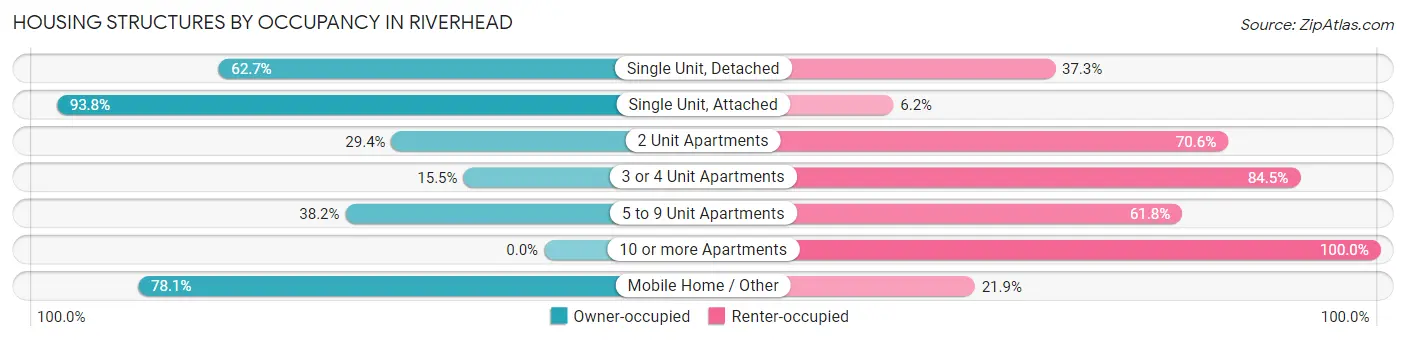
| Structure Type | Owner-occupied | Renter-occupied |
| Single Unit, Detached | 1,827 (62.7%) | 1,088 (37.3%) |
| Single Unit, Attached | 711 (93.8%) | 47 (6.2%) |
| 2 Unit Apartments | 52 (29.4%) | 125 (70.6%) |
| 3 or 4 Unit Apartments | 61 (15.5%) | 332 (84.5%) |
| 5 to 9 Unit Apartments | 117 (38.2%) | 189 (61.8%) |
| 10 or more Apartments | 0 (0.0%) | 363 (100.0%) |
| Mobile Home / Other | 218 (78.1%) | 61 (21.9%) |
| Total | 2,986 (57.5%) | 2,205 (42.5%) |
Housing Structures by Number of Rooms in Riverhead
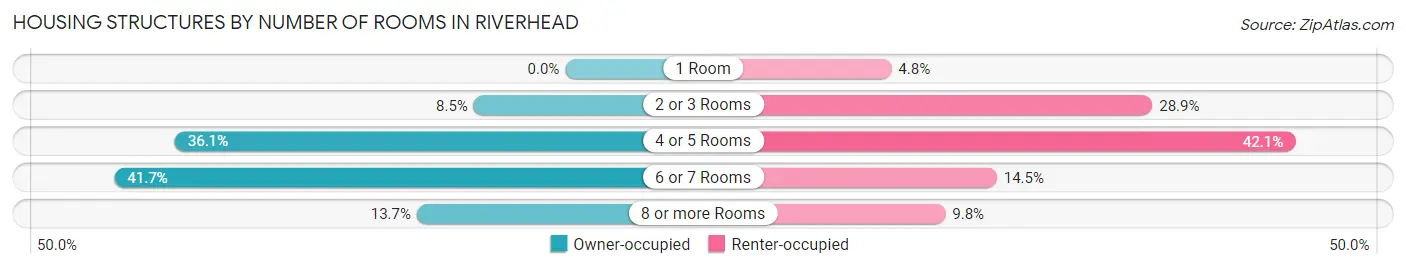
| Number of Rooms | Owner-occupied | Renter-occupied |
| 1 Room | 0 (0.0%) | 105 (4.8%) |
| 2 or 3 Rooms | 253 (8.5%) | 637 (28.9%) |
| 4 or 5 Rooms | 1,078 (36.1%) | 928 (42.1%) |
| 6 or 7 Rooms | 1,245 (41.7%) | 320 (14.5%) |
| 8 or more Rooms | 410 (13.7%) | 215 (9.8%) |
| Total | 2,986 (100.0%) | 2,205 (100.0%) |
Housing Structure by Heating Type in Riverhead
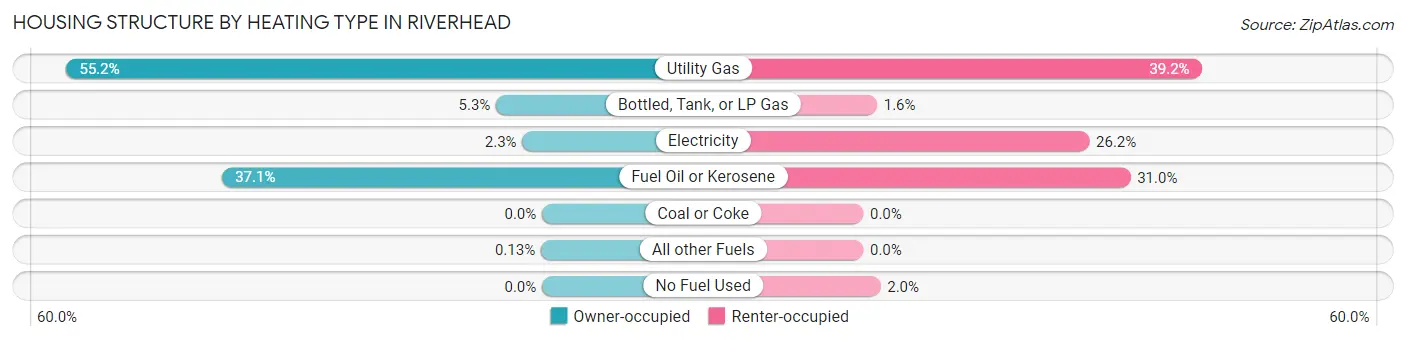
| Heating Type | Owner-occupied | Renter-occupied |
| Utility Gas | 1,647 (55.2%) | 865 (39.2%) |
| Bottled, Tank, or LP Gas | 159 (5.3%) | 35 (1.6%) |
| Electricity | 68 (2.3%) | 578 (26.2%) |
| Fuel Oil or Kerosene | 1,108 (37.1%) | 683 (31.0%) |
| Coal or Coke | 0 (0.0%) | 0 (0.0%) |
| All other Fuels | 4 (0.1%) | 0 (0.0%) |
| No Fuel Used | 0 (0.0%) | 44 (2.0%) |
| Total | 2,986 (100.0%) | 2,205 (100.0%) |
Household Vehicle Usage in Riverhead
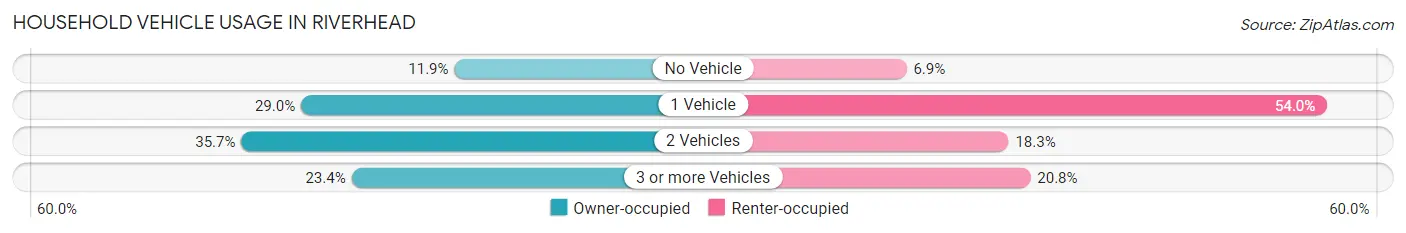
| Vehicles per Household | Owner-occupied | Renter-occupied |
| No Vehicle | 354 (11.9%) | 152 (6.9%) |
| 1 Vehicle | 867 (29.0%) | 1,191 (54.0%) |
| 2 Vehicles | 1,067 (35.7%) | 404 (18.3%) |
| 3 or more Vehicles | 698 (23.4%) | 458 (20.8%) |
| Total | 2,986 (100.0%) | 2,205 (100.0%) |
Real Estate & Mortgages in Riverhead
Real Estate and Mortgage Overview in Riverhead
| Characteristic | Without Mortgage | With Mortgage |
| Housing Units | 1,269 | 1,717 |
| Median Property Value | $373,700 | $435,700 |
| Median Household Income | $67,188 | $797 |
| Monthly Housing Costs | $1,216 | $513 |
| Real Estate Taxes | $5,284 | $0 |
Property Value by Mortgage Status in Riverhead
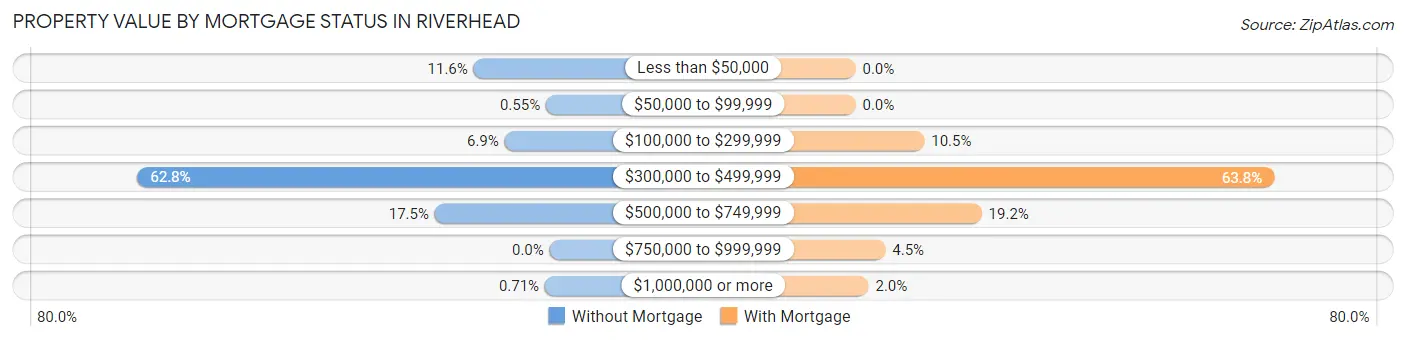
| Property Value | Without Mortgage | With Mortgage |
| Less than $50,000 | 147 (11.6%) | 0 (0.0%) |
| $50,000 to $99,999 | 7 (0.5%) | 0 (0.0%) |
| $100,000 to $299,999 | 87 (6.9%) | 180 (10.5%) |
| $300,000 to $499,999 | 797 (62.8%) | 1,095 (63.8%) |
| $500,000 to $749,999 | 222 (17.5%) | 330 (19.2%) |
| $750,000 to $999,999 | 0 (0.0%) | 78 (4.5%) |
| $1,000,000 or more | 9 (0.7%) | 34 (2.0%) |
| Total | 1,269 (100.0%) | 1,717 (100.0%) |
Household Income by Mortgage Status in Riverhead
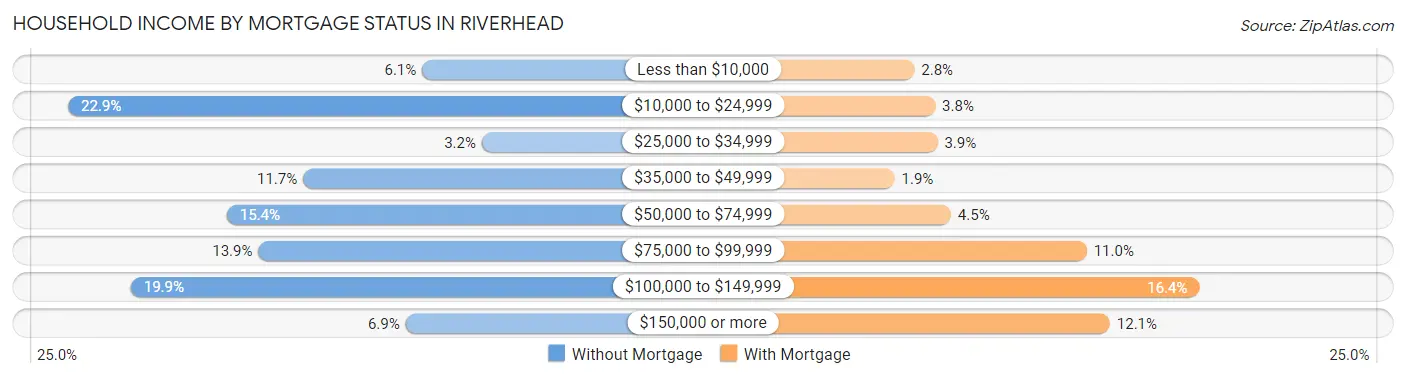
| Household Income | Without Mortgage | With Mortgage |
| Less than $10,000 | 77 (6.1%) | 48 (2.8%) |
| $10,000 to $24,999 | 291 (22.9%) | 65 (3.8%) |
| $25,000 to $34,999 | 41 (3.2%) | 67 (3.9%) |
| $35,000 to $49,999 | 149 (11.7%) | 32 (1.9%) |
| $50,000 to $74,999 | 195 (15.4%) | 78 (4.5%) |
| $75,000 to $99,999 | 176 (13.9%) | 189 (11.0%) |
| $100,000 to $149,999 | 253 (19.9%) | 281 (16.4%) |
| $150,000 or more | 87 (6.9%) | 208 (12.1%) |
| Total | 1,269 (100.0%) | 1,717 (100.0%) |
Property Value to Household Income Ratio in Riverhead
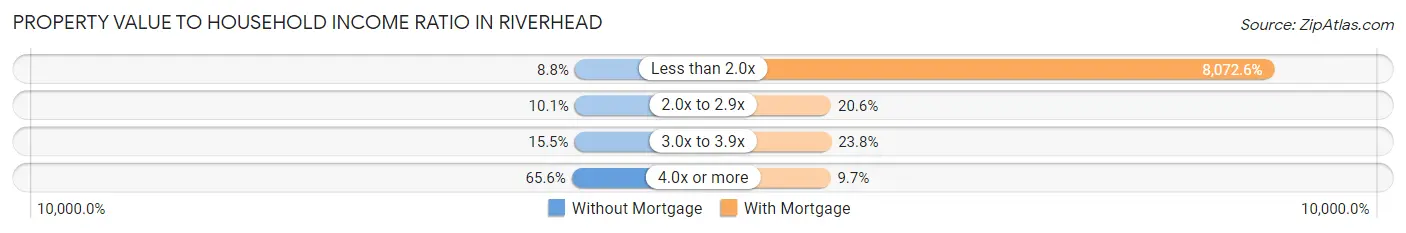
| Value-to-Income Ratio | Without Mortgage | With Mortgage |
| Less than 2.0x | 112 (8.8%) | 138,607 (8,072.6%) |
| 2.0x to 2.9x | 128 (10.1%) | 354 (20.6%) |
| 3.0x to 3.9x | 196 (15.4%) | 409 (23.8%) |
| 4.0x or more | 833 (65.6%) | 167 (9.7%) |
| Total | 1,269 (100.0%) | 1,717 (100.0%) |
Real Estate Taxes by Mortgage Status in Riverhead
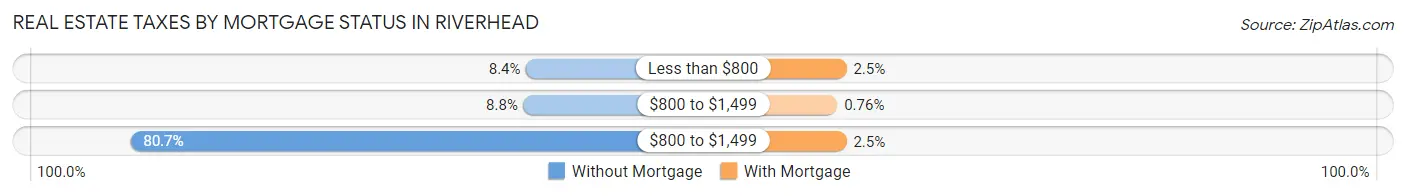
| Property Taxes | Without Mortgage | With Mortgage |
| Less than $800 | 106 (8.4%) | 42 (2.5%) |
| $800 to $1,499 | 112 (8.8%) | 13 (0.8%) |
| $800 to $1,499 | 1,024 (80.7%) | 42 (2.5%) |
| Total | 1,269 (100.0%) | 1,717 (100.0%) |
Health & Disability in Riverhead
Health Insurance Coverage by Age in Riverhead
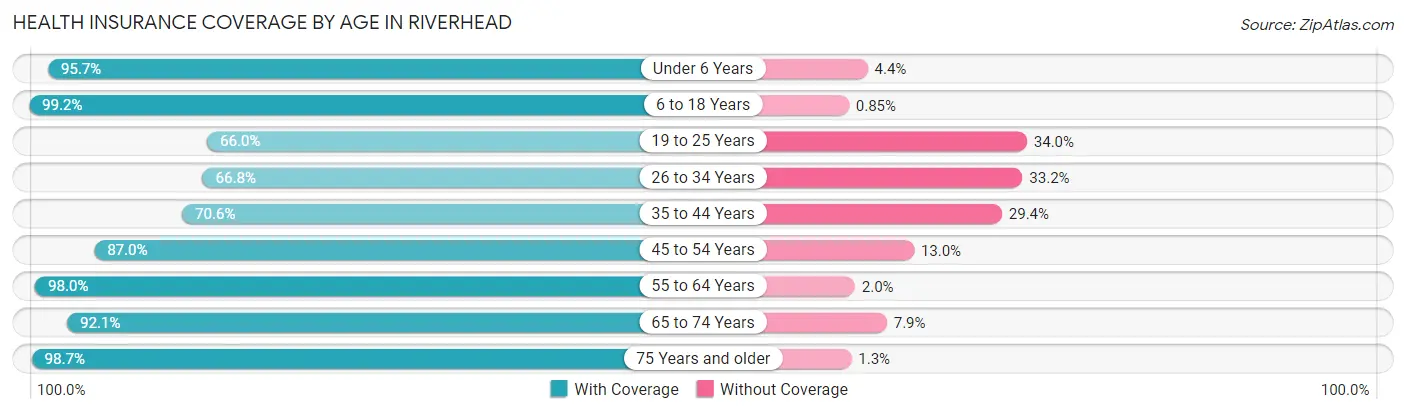
| Age Bracket | With Coverage | Without Coverage |
| Under 6 Years | 1,033 (95.7%) | 47 (4.3%) |
| 6 to 18 Years | 1,875 (99.2%) | 16 (0.9%) |
| 19 to 25 Years | 839 (66.0%) | 433 (34.0%) |
| 26 to 34 Years | 1,120 (66.8%) | 557 (33.2%) |
| 35 to 44 Years | 923 (70.6%) | 384 (29.4%) |
| 45 to 54 Years | 1,186 (87.0%) | 177 (13.0%) |
| 55 to 64 Years | 2,087 (98.0%) | 42 (2.0%) |
| 65 to 74 Years | 2,243 (92.1%) | 193 (7.9%) |
| 75 Years and older | 1,043 (98.7%) | 14 (1.3%) |
| Total | 12,349 (86.9%) | 1,863 (13.1%) |
Health Insurance Coverage by Citizenship Status in Riverhead
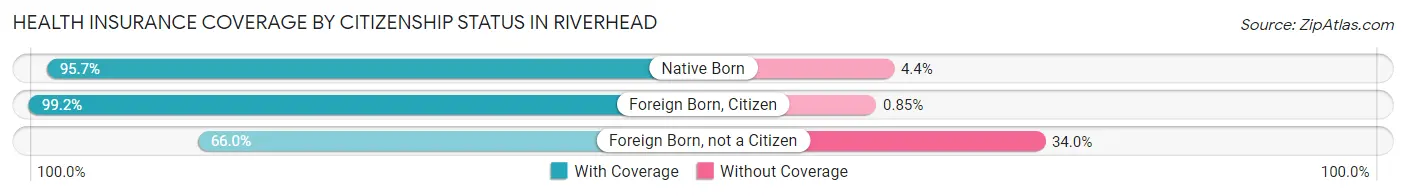
| Citizenship Status | With Coverage | Without Coverage |
| Native Born | 1,033 (95.7%) | 47 (4.3%) |
| Foreign Born, Citizen | 1,875 (99.2%) | 16 (0.9%) |
| Foreign Born, not a Citizen | 839 (66.0%) | 433 (34.0%) |
Health Insurance Coverage by Household Income in Riverhead

| Household Income | With Coverage | Without Coverage |
| Under $25,000 | 1,456 (97.1%) | 43 (2.9%) |
| $25,000 to $49,999 | 1,509 (92.0%) | 131 (8.0%) |
| $50,000 to $74,999 | 1,652 (87.5%) | 236 (12.5%) |
| $75,000 to $99,999 | 2,136 (96.0%) | 89 (4.0%) |
| $100,000 and over | 5,282 (79.5%) | 1,364 (20.5%) |
Public vs Private Health Insurance Coverage by Age in Riverhead
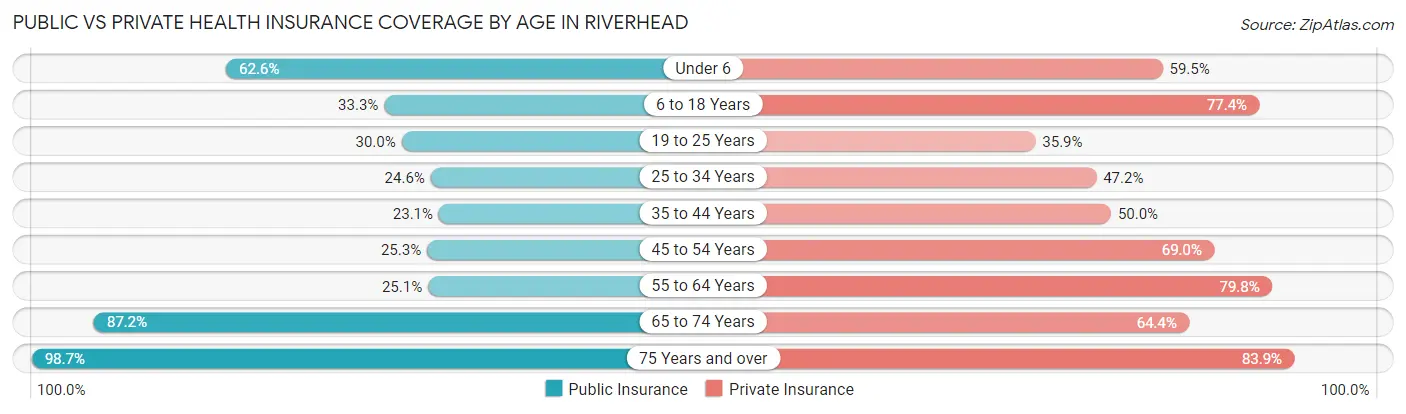
| Age Bracket | Public Insurance | Private Insurance |
| Under 6 | 676 (62.6%) | 643 (59.5%) |
| 6 to 18 Years | 629 (33.3%) | 1,464 (77.4%) |
| 19 to 25 Years | 382 (30.0%) | 457 (35.9%) |
| 25 to 34 Years | 413 (24.6%) | 792 (47.2%) |
| 35 to 44 Years | 302 (23.1%) | 653 (50.0%) |
| 45 to 54 Years | 345 (25.3%) | 941 (69.0%) |
| 55 to 64 Years | 535 (25.1%) | 1,698 (79.8%) |
| 65 to 74 Years | 2,123 (87.2%) | 1,569 (64.4%) |
| 75 Years and over | 1,043 (98.7%) | 887 (83.9%) |
| Total | 6,448 (45.4%) | 9,104 (64.1%) |
Disability Status by Sex by Age in Riverhead
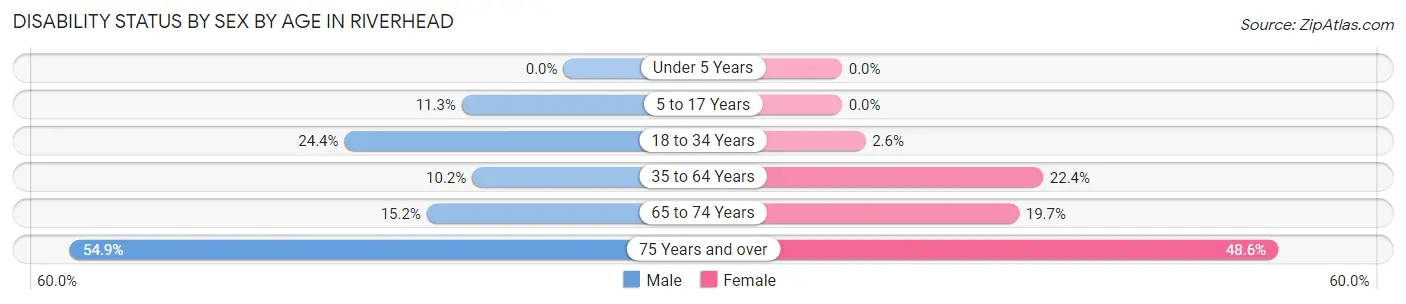
| Age Bracket | Male | Female |
| Under 5 Years | 0 (0.0%) | 0 (0.0%) |
| 5 to 17 Years | 135 (11.3%) | 0 (0.0%) |
| 18 to 34 Years | 392 (24.4%) | 37 (2.6%) |
| 35 to 64 Years | 259 (10.2%) | 504 (22.4%) |
| 65 to 74 Years | 160 (15.2%) | 273 (19.7%) |
| 75 Years and over | 273 (54.9%) | 272 (48.6%) |
Disability Class by Sex by Age in Riverhead
Disability Class: Hearing Difficulty
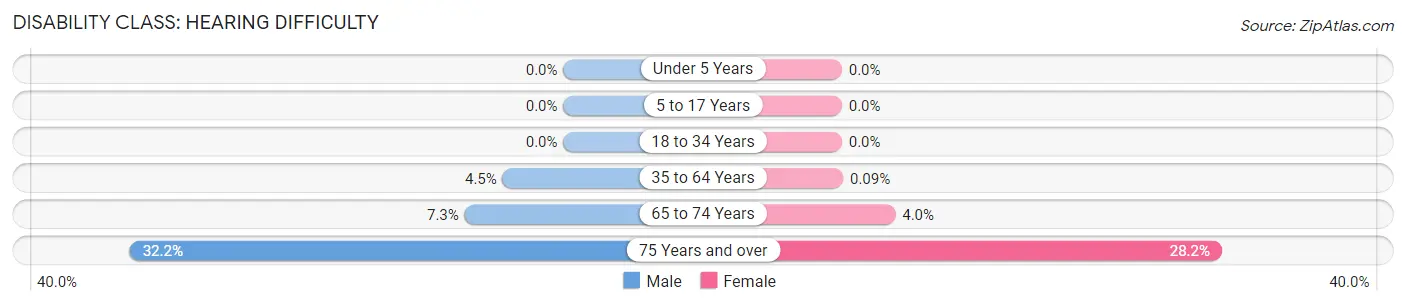
| Age Bracket | Male | Female |
| Under 5 Years | 0 (0.0%) | 0 (0.0%) |
| 5 to 17 Years | 0 (0.0%) | 0 (0.0%) |
| 18 to 34 Years | 0 (0.0%) | 0 (0.0%) |
| 35 to 64 Years | 115 (4.5%) | 2 (0.1%) |
| 65 to 74 Years | 77 (7.3%) | 55 (4.0%) |
| 75 Years and over | 160 (32.2%) | 158 (28.2%) |
Disability Class: Vision Difficulty
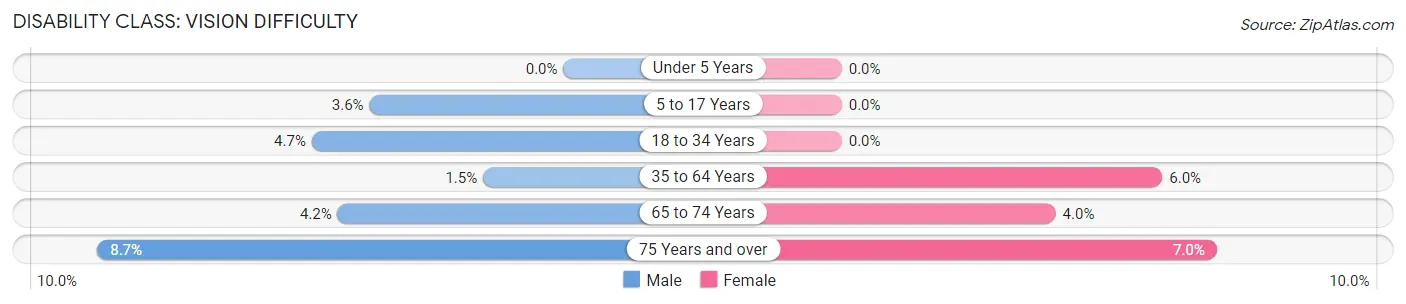
| Age Bracket | Male | Female |
| Under 5 Years | 0 (0.0%) | 0 (0.0%) |
| 5 to 17 Years | 43 (3.6%) | 0 (0.0%) |
| 18 to 34 Years | 75 (4.7%) | 0 (0.0%) |
| 35 to 64 Years | 38 (1.5%) | 134 (5.9%) |
| 65 to 74 Years | 44 (4.2%) | 55 (4.0%) |
| 75 Years and over | 43 (8.6%) | 39 (7.0%) |
Disability Class: Cognitive Difficulty
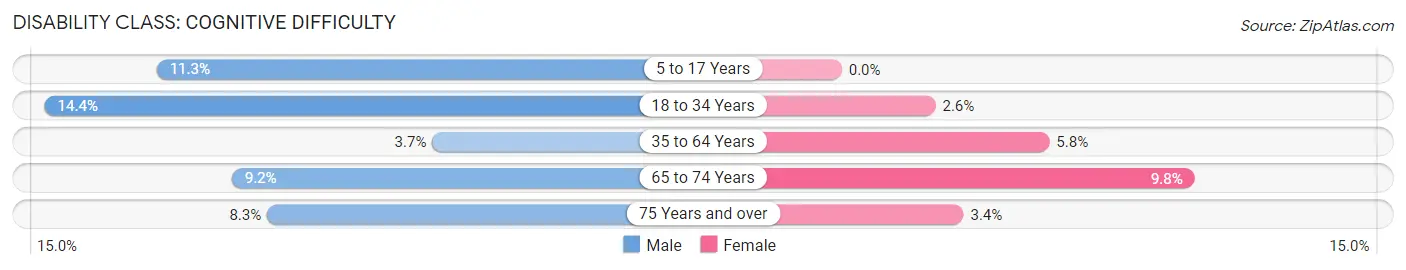
| Age Bracket | Male | Female |
| 5 to 17 Years | 135 (11.3%) | 0 (0.0%) |
| 18 to 34 Years | 232 (14.4%) | 37 (2.6%) |
| 35 to 64 Years | 93 (3.6%) | 130 (5.8%) |
| 65 to 74 Years | 97 (9.2%) | 136 (9.8%) |
| 75 Years and over | 41 (8.3%) | 19 (3.4%) |
Disability Class: Ambulatory Difficulty
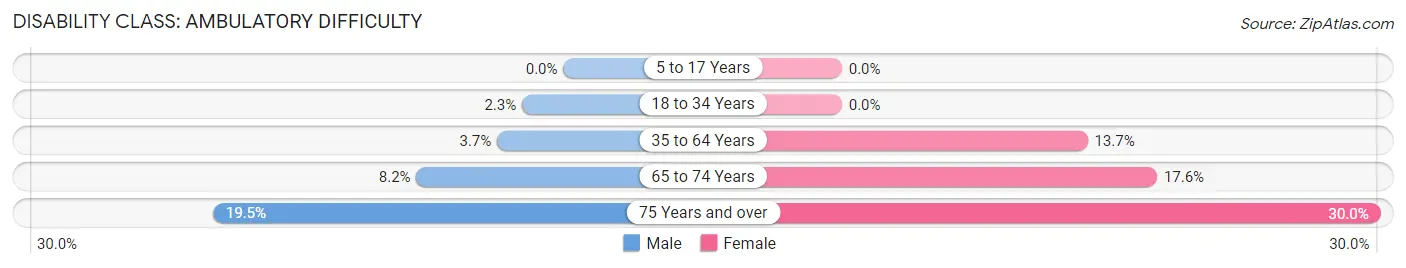
| Age Bracket | Male | Female |
| 5 to 17 Years | 0 (0.0%) | 0 (0.0%) |
| 18 to 34 Years | 37 (2.3%) | 0 (0.0%) |
| 35 to 64 Years | 94 (3.7%) | 308 (13.7%) |
| 65 to 74 Years | 86 (8.2%) | 243 (17.5%) |
| 75 Years and over | 97 (19.5%) | 168 (30.0%) |
Disability Class: Self-Care Difficulty
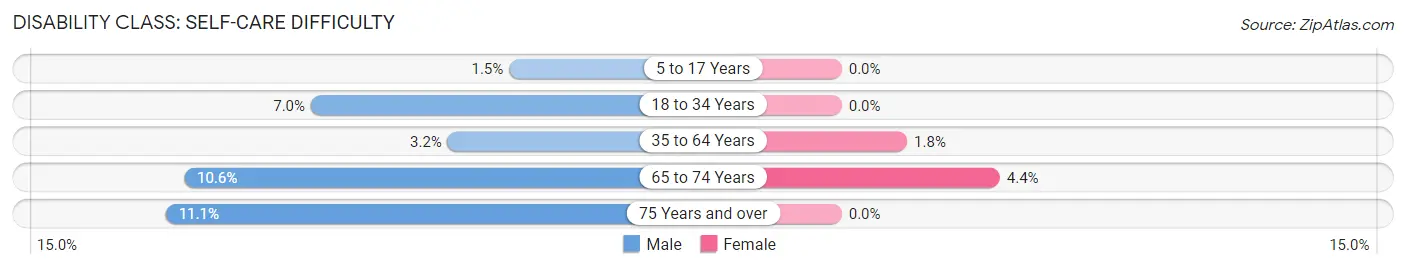
| Age Bracket | Male | Female |
| 5 to 17 Years | 18 (1.5%) | 0 (0.0%) |
| 18 to 34 Years | 113 (7.0%) | 0 (0.0%) |
| 35 to 64 Years | 82 (3.2%) | 41 (1.8%) |
| 65 to 74 Years | 111 (10.6%) | 61 (4.4%) |
| 75 Years and over | 55 (11.1%) | 0 (0.0%) |
Technology Access in Riverhead
Computing Device Access in Riverhead
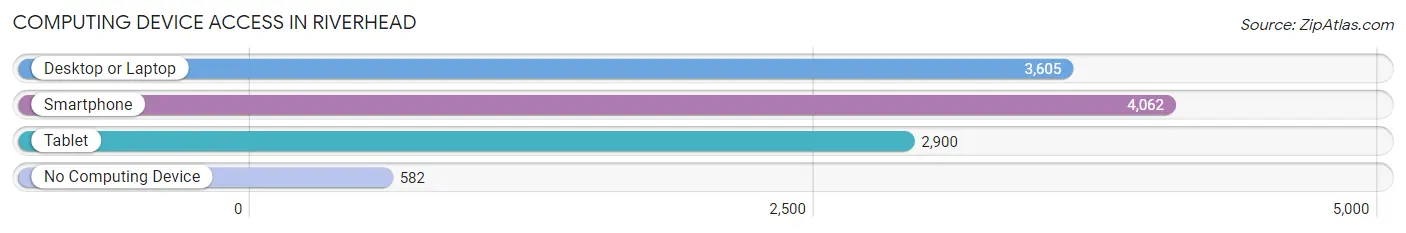
| Device Type | # Households | % Households |
| Desktop or Laptop | 3,605 | 69.5% |
| Smartphone | 4,062 | 78.2% |
| Tablet | 2,900 | 55.9% |
| No Computing Device | 582 | 11.2% |
| Total | 5,191 | 100.0% |
Internet Access in Riverhead
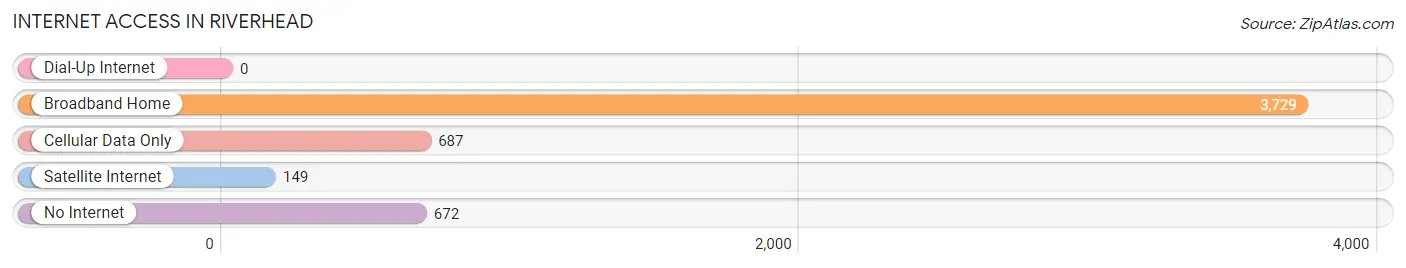
| Internet Type | # Households | % Households |
| Dial-Up Internet | 0 | 0.0% |
| Broadband Home | 3,729 | 71.8% |
| Cellular Data Only | 687 | 13.2% |
| Satellite Internet | 149 | 2.9% |
| No Internet | 672 | 13.0% |
| Total | 5,191 | 100.0% |
Riverhead Summary
Riverhead is a town located in Suffolk County, New York, United States. It is situated on the north shore of Long Island, approximately 58 miles east of Manhattan. The population was 33,506 at the 2010 census. Riverhead is the county seat of Suffolk County.
Geography
Riverhead is located at 40°56'N 72°41'W (40.937, -72.683). According to the United States Census Bureau, the town has a total area of 97.3 square miles (251.7 km2), of which, 95.2 square miles (246.3 km2) of it is land and 2.1 square miles (5.4 km2) of it (2.17%) is water.
The town is bordered to the west by the Peconic River, to the north by the Long Island Sound, to the east by the Town of Southold, and to the south by the Town of Brookhaven.
History
The area now known as Riverhead was originally inhabited by the Shinnecock Native American tribe. The first European settlers arrived in the area in 1649, and the town was officially established in 1792.
Riverhead was originally part of the Town of Southold, but was separated in 1792 and incorporated as its own town. The town was named after the Peconic River, which flows through the town and empties into the Long Island Sound.
Riverhead was an important port in the 19th century, and was home to several shipbuilding yards. The town was also a major center for the whaling industry.
Economy
Riverhead is home to several major industries, including agriculture, fishing, and tourism. The town is also home to several wineries, breweries, and distilleries.
Agriculture is a major part of the local economy, with the town being home to several farms and nurseries. The town is also home to several seafood processing plants, which process and package local seafood for sale.
Fishing is also an important part of the local economy, with the town being home to several commercial fishing fleets. The town is also home to several marinas, which provide services to recreational boaters.
Tourism is also an important part of the local economy, with the town being home to several attractions, including the Long Island Aquarium and Exhibition Center, the Long Island Maritime Museum, and the Splish Splash Water Park.
Demographics
As of the 2010 census, there were 33,506 people, 11,845 households, and 8,717 families residing in the town. The population density was 351.3 people per square mile (135.9/km2). There were 12,845 housing units at an average density of 134.9 per square mile (52.1/km2). The racial makeup of the town was 79.2% White, 8.3% African American, 0.3% Native American, 1.7% Asian, 0.1% Pacific Islander, 7.2% from other races, and 3.4% from two or more races. Hispanic or Latino of any race were 16.7% of the population.
There were 11,845 households, out of which 33.2% had children under the age of 18 living with them, 51.2% were married couples living together, 13.2% had a female householder with no husband present, and 30.3% were non-families. 24.2% of all households were made up of individuals, and 10.2% had someone living alone who was 65 years of age or older. The average household size was 2.78 and the average family size was 3.30.
In the town, the population was spread out, with 24.7% under the age of 18, 8.2% from 18 to 24, 28.2% from 25 to 44, 25.2% from 45 to 64, and 13.7% who were 65 years of age or older. The median age was 38 years. For every 100 females, there were 95.2 males. For every 100 females age 18 and over, there were 92.2 males.
The median income for a household in the town was $60,945, and the median income for a family was $68,945. Males had a median income of $45,945 versus $35,945 for females. The per capita income for the town was $25,945. About 5.2% of families and 7.2% of the population were below the poverty line, including 9.2% of those under age 18 and 5.2% of those age 65 or over.
Common Questions
What is Per Capita Income in Riverhead?
Per Capita income in Riverhead is $38,691.
What is the Median Family Income in Riverhead?
Median Family Income in Riverhead is $92,679.
What is the Median Household income in Riverhead?
Median Household Income in Riverhead is $73,197.
What is Income or Wage Gap in Riverhead?
Income or Wage Gap in Riverhead is 27.0%.
Women in Riverhead earn 73.0 cents for every dollar earned by a man.
What is Family Income Deficit in Riverhead?
Family Income Deficit in Riverhead is $6,617.
Families that are below poverty line in Riverhead earn $6,617 less on average than the poverty threshold level.
What is Inequality or Gini Index in Riverhead?
Inequality or Gini Index in Riverhead is 0.48.
What is the Total Population of Riverhead?
Total Population of Riverhead is 14,388.
What is the Total Male Population of Riverhead?
Total Male Population of Riverhead is 7,524.
What is the Total Female Population of Riverhead?
Total Female Population of Riverhead is 6,864.
What is the Ratio of Males per 100 Females in Riverhead?
There are 109.62 Males per 100 Females in Riverhead.
What is the Ratio of Females per 100 Males in Riverhead?
There are 91.23 Females per 100 Males in Riverhead.
What is the Median Population Age in Riverhead?
Median Population Age in Riverhead is 44.8 Years.
What is the Average Family Size in Riverhead
Average Family Size in Riverhead is 3.4 People.
What is the Average Household Size in Riverhead
Average Household Size in Riverhead is 2.7 People.
How Large is the Labor Force in Riverhead?
There are 6,742 People in the Labor Forcein in Riverhead.
What is the Percentage of People in the Labor Force in Riverhead?
55.4% of People are in the Labor Force in Riverhead.
What is the Unemployment Rate in Riverhead?
Unemployment Rate in Riverhead is 9.2%.