North Bellport, NY Map & Demographics
North Bellport Map
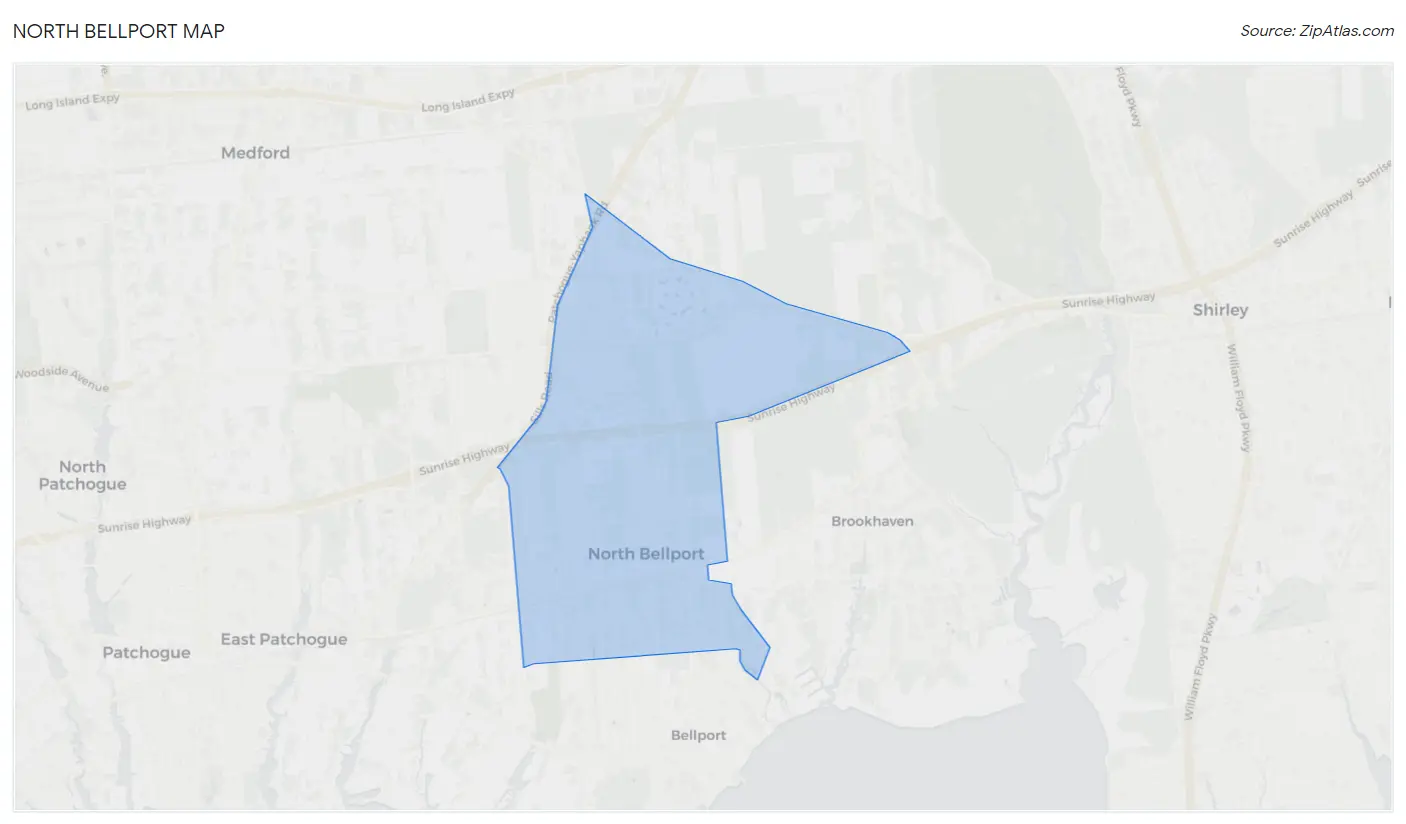
North Bellport Overview
$33,002
PER CAPITA INCOME
$87,946
AVG FAMILY INCOME
$89,026
AVG HOUSEHOLD INCOME
24.7%
WAGE / INCOME GAP [ % ]
75.3¢/ $1
WAGE / INCOME GAP [ $ ]
$10,580
FAMILY INCOME DEFICIT
0.40
INEQUALITY / GINI INDEX
10,530
TOTAL POPULATION
5,176
MALE POPULATION
5,354
FEMALE POPULATION
96.68
MALES / 100 FEMALES
103.44
FEMALES / 100 MALES
33.9
MEDIAN AGE
3.5
AVG FAMILY SIZE
3.2
AVG HOUSEHOLD SIZE
5,582
LABOR FORCE [ PEOPLE ]
67.0%
PERCENT IN LABOR FORCE
7.8%
UNEMPLOYMENT RATE
Income in North Bellport
Income Overview in North Bellport
Per Capita Income in North Bellport is $33,002, while median incomes of families and households are $87,946 and $89,026 respectively.
| Characteristic | Number | Measure |
| Per Capita Income | 10,530 | $33,002 |
| Median Family Income | 2,569 | $87,946 |
| Mean Family Income | 2,569 | $105,718 |
| Median Household Income | 3,253 | $89,026 |
| Mean Household Income | 3,253 | $103,534 |
| Income Deficit | 2,569 | $10,580 |
| Wage / Income Gap (%) | 10,530 | 24.69% |
| Wage / Income Gap ($) | 10,530 | 75.31¢ per $1 |
| Gini / Inequality Index | 10,530 | 0.40 |
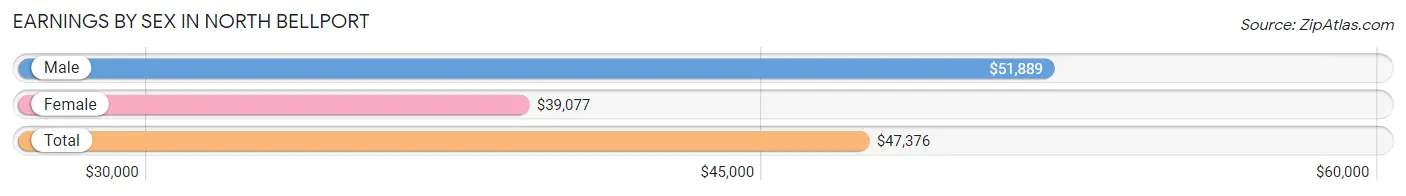
Earnings by Sex in North Bellport
Average Earnings in North Bellport are $47,376, $51,889 for men and $39,077 for women, a difference of 24.7%.
| Sex | Number | Average Earnings |
| Male | 2,978 (55.2%) | $51,889 |
| Female | 2,412 (44.8%) | $39,077 |
| Total | 5,390 (100.0%) | $47,376 |
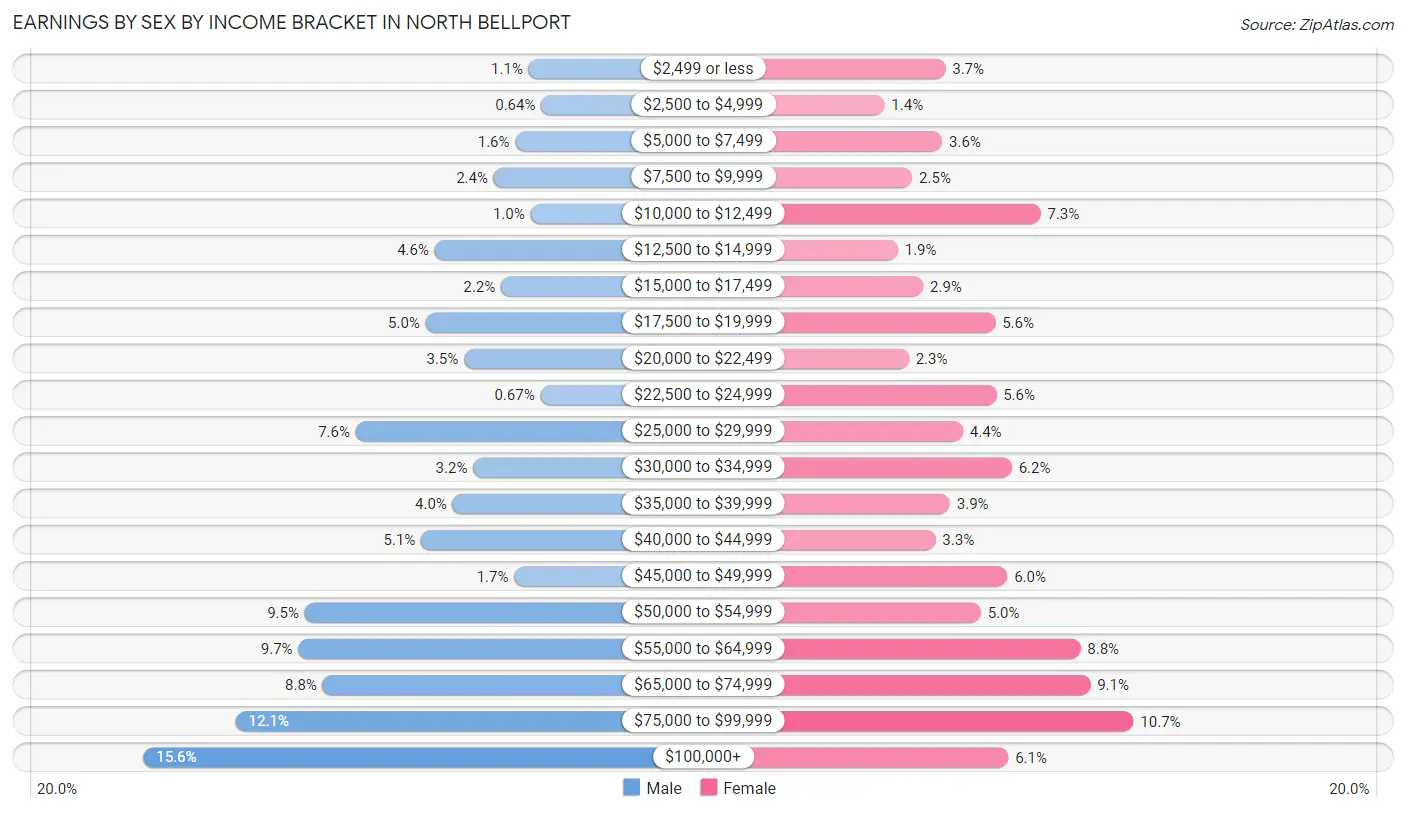
Earnings by Sex by Income Bracket in North Bellport
The most common earnings brackets in North Bellport are $100,000+ for men (463 | 15.5%) and $75,000 to $99,999 for women (259 | 10.7%).
| Income | Male | Female |
| $2,499 or less | 33 (1.1%) | 89 (3.7%) |
| $2,500 to $4,999 | 19 (0.6%) | 34 (1.4%) |
| $5,000 to $7,499 | 48 (1.6%) | 86 (3.6%) |
| $7,500 to $9,999 | 72 (2.4%) | 59 (2.5%) |
| $10,000 to $12,499 | 31 (1.0%) | 175 (7.3%) |
| $12,500 to $14,999 | 138 (4.6%) | 46 (1.9%) |
| $15,000 to $17,499 | 64 (2.1%) | 69 (2.9%) |
| $17,500 to $19,999 | 148 (5.0%) | 134 (5.6%) |
| $20,000 to $22,499 | 105 (3.5%) | 56 (2.3%) |
| $22,500 to $24,999 | 20 (0.7%) | 135 (5.6%) |
| $25,000 to $29,999 | 226 (7.6%) | 105 (4.3%) |
| $30,000 to $34,999 | 95 (3.2%) | 149 (6.2%) |
| $35,000 to $39,999 | 118 (4.0%) | 93 (3.9%) |
| $40,000 to $44,999 | 153 (5.1%) | 80 (3.3%) |
| $45,000 to $49,999 | 49 (1.7%) | 145 (6.0%) |
| $50,000 to $54,999 | 283 (9.5%) | 121 (5.0%) |
| $55,000 to $64,999 | 290 (9.7%) | 211 (8.7%) |
| $65,000 to $74,999 | 263 (8.8%) | 220 (9.1%) |
| $75,000 to $99,999 | 360 (12.1%) | 259 (10.7%) |
| $100,000+ | 463 (15.5%) | 146 (6.0%) |
| Total | 2,978 (100.0%) | 2,412 (100.0%) |
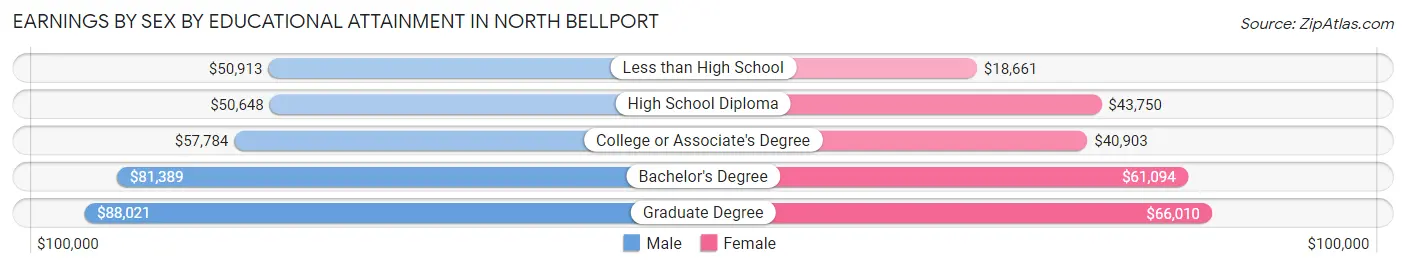
Earnings by Sex by Educational Attainment in North Bellport
Average earnings in North Bellport are $54,418 for men and $45,896 for women, a difference of 15.7%. Men with an educational attainment of graduate degree enjoy the highest average annual earnings of $88,021, while those with high school diploma education earn the least with $50,648. Women with an educational attainment of graduate degree earn the most with the average annual earnings of $66,010, while those with less than high school education have the smallest earnings of $18,661.
| Educational Attainment | Male Income | Female Income |
| Less than High School | $50,913 | $18,661 |
| High School Diploma | $50,648 | $43,750 |
| College or Associate's Degree | $57,784 | $40,903 |
| Bachelor's Degree | $81,389 | $61,094 |
| Graduate Degree | $88,021 | $66,010 |
| Total | $54,418 | $45,896 |
Family Income in North Bellport
Family Income Brackets in North Bellport
According to the North Bellport family income data, there are 560 families falling into the $100,000 to $149,999 income range, which is the most common income bracket and makes up 21.8% of all families. Conversely, the $10,000 to $14,999 income bracket is the least frequent group with only 26 families (1.0%) belonging to this category.
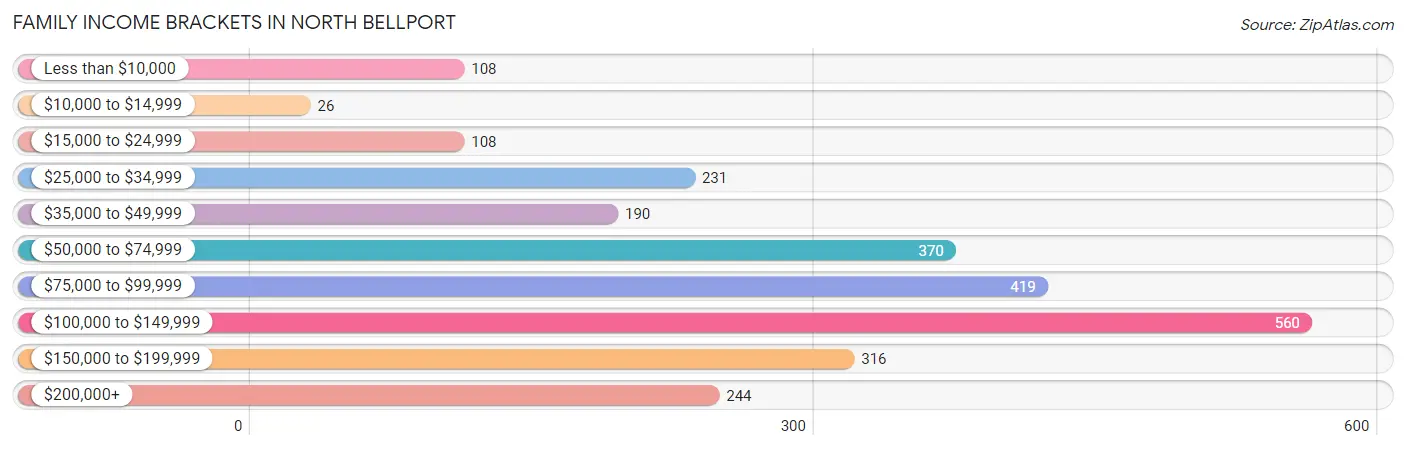
| Income Bracket | # Families | % Families |
| Less than $10,000 | 108 | 4.2% |
| $10,000 to $14,999 | 26 | 1.0% |
| $15,000 to $24,999 | 108 | 4.2% |
| $25,000 to $34,999 | 231 | 9.0% |
| $35,000 to $49,999 | 190 | 7.4% |
| $50,000 to $74,999 | 370 | 14.4% |
| $75,000 to $99,999 | 419 | 16.3% |
| $100,000 to $149,999 | 560 | 21.8% |
| $150,000 to $199,999 | 316 | 12.3% |
| $200,000+ | 244 | 9.5% |
Family Income by Famaliy Size in North Bellport
5-person families (309 | 12.0%) account for the highest median family income in North Bellport with $110,665 per family, while 2-person families (975 | 38.0%) have the highest median income of $43,574 per family member.
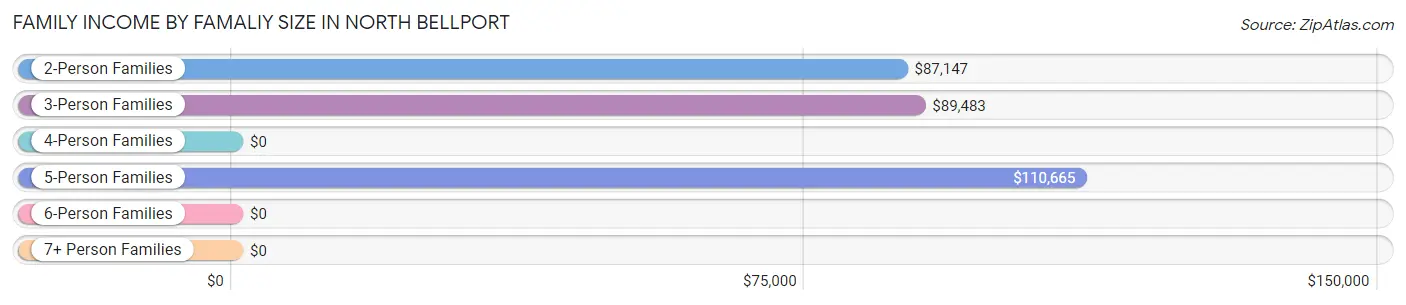
| Income Bracket | # Families | Median Income |
| 2-Person Families | 975 (38.0%) | $87,147 |
| 3-Person Families | 642 (25.0%) | $89,483 |
| 4-Person Families | 490 (19.1%) | $0 |
| 5-Person Families | 309 (12.0%) | $110,665 |
| 6-Person Families | 83 (3.2%) | $0 |
| 7+ Person Families | 70 (2.7%) | $0 |
| Total | 2,569 (100.0%) | $87,946 |
Family Income by Number of Earners in North Bellport
The median family income in North Bellport is $87,946, with families comprising 3+ earners (368) having the highest median family income of $169,583, while families with no earners (403) have the lowest median family income of $28,272, accounting for 14.3% and 15.7% of families, respectively.
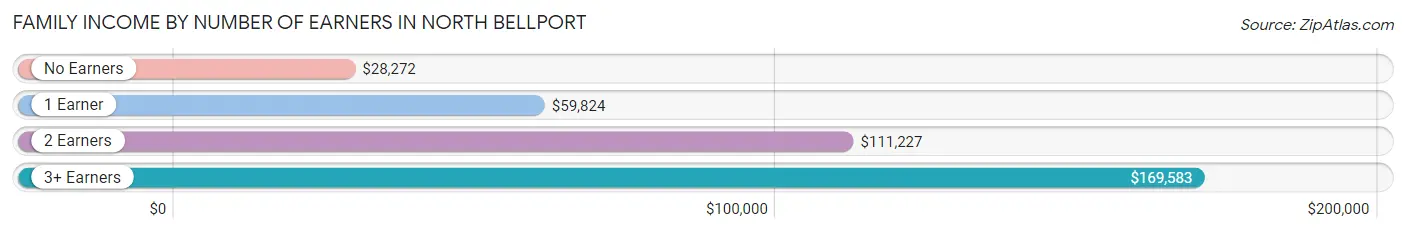
| Number of Earners | # Families | Median Income |
| No Earners | 403 (15.7%) | $28,272 |
| 1 Earner | 757 (29.5%) | $59,824 |
| 2 Earners | 1,041 (40.5%) | $111,227 |
| 3+ Earners | 368 (14.3%) | $169,583 |
| Total | 2,569 (100.0%) | $87,946 |
Household Income in North Bellport
Household Income Brackets in North Bellport
With 722 households falling in the category, the $100,000 to $149,999 income range is the most frequent in North Bellport, accounting for 22.2% of all households. In contrast, only 33 households (1.0%) fall into the $10,000 to $14,999 income bracket, making it the least populous group.
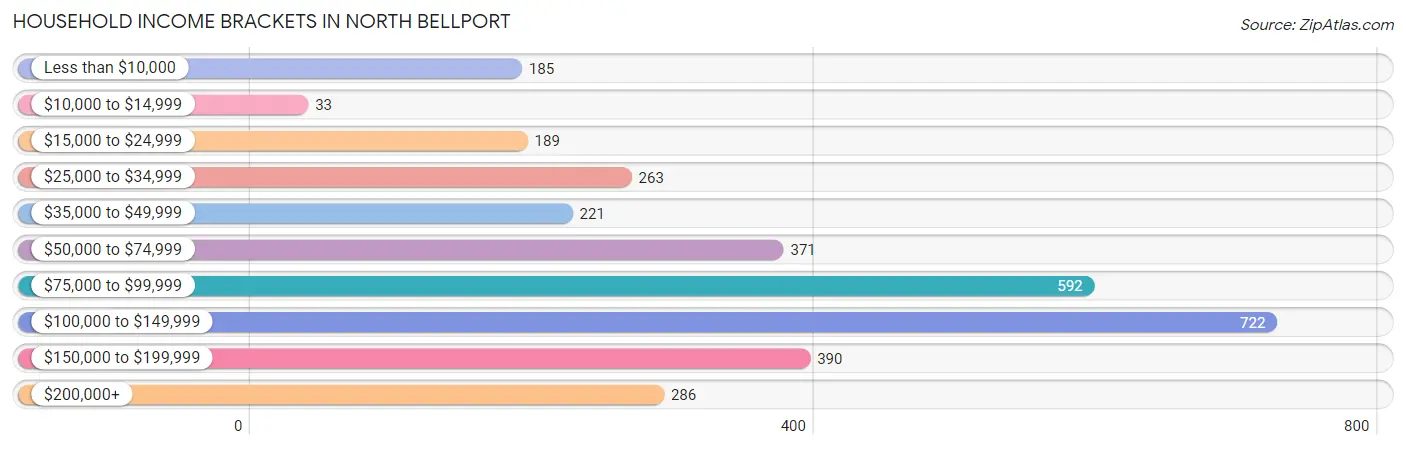
| Income Bracket | # Households | % Households |
| Less than $10,000 | 185 | 5.7% |
| $10,000 to $14,999 | 33 | 1.0% |
| $15,000 to $24,999 | 189 | 5.8% |
| $25,000 to $34,999 | 263 | 8.1% |
| $35,000 to $49,999 | 221 | 6.8% |
| $50,000 to $74,999 | 371 | 11.4% |
| $75,000 to $99,999 | 592 | 18.2% |
| $100,000 to $149,999 | 722 | 22.2% |
| $150,000 to $199,999 | 390 | 12.0% |
| $200,000+ | 286 | 8.8% |
Household Income by Householder Age in North Bellport
The median household income in North Bellport is $89,026, with the highest median household income of $111,786 found in the 45 to 64 years age bracket for the primary householder. A total of 1,482 households (45.6%) fall into this category. Meanwhile, the 15 to 24 years age bracket for the primary householder has the lowest median household income of $0, with 12 households (0.4%) in this group.
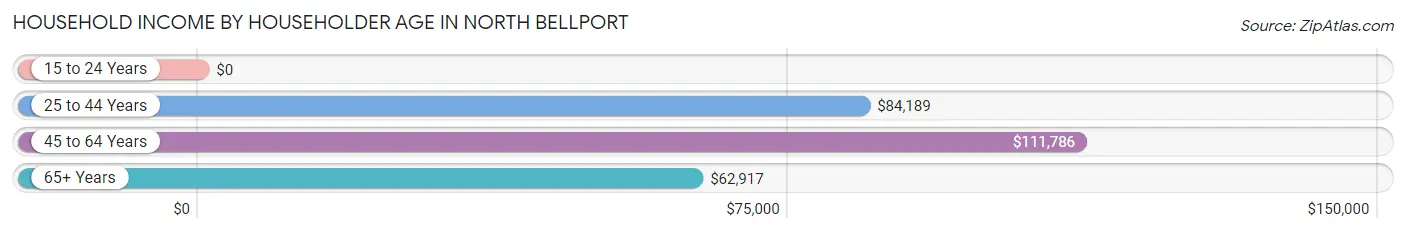
| Income Bracket | # Households | Median Income |
| 15 to 24 Years | 12 (0.4%) | $0 |
| 25 to 44 Years | 1,180 (36.3%) | $84,189 |
| 45 to 64 Years | 1,482 (45.6%) | $111,786 |
| 65+ Years | 579 (17.8%) | $62,917 |
| Total | 3,253 (100.0%) | $89,026 |
Poverty in North Bellport
Income Below Poverty by Sex and Age in North Bellport
With 14.7% poverty level for males and 17.4% for females among the residents of North Bellport, under 5 year old males and 12 to 14 year old females are the most vulnerable to poverty, with 210 males (56.3%) and 116 females (44.1%) in their respective age groups living below the poverty level.
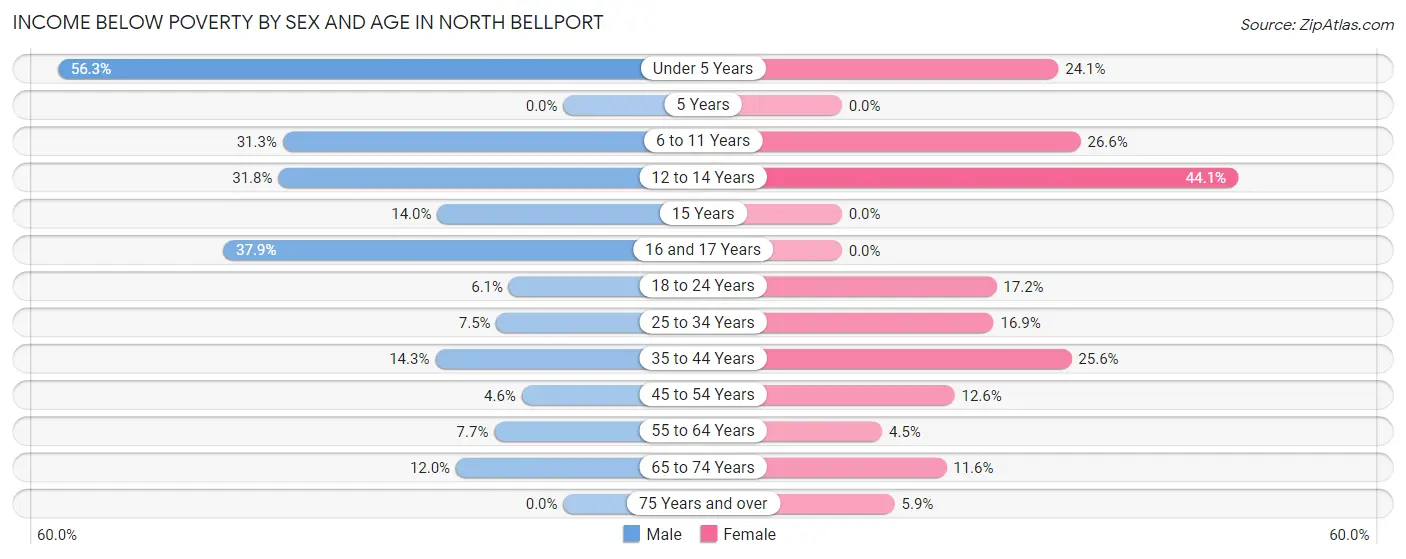
| Age Bracket | Male | Female |
| Under 5 Years | 210 (56.3%) | 68 (24.1%) |
| 5 Years | 0 (0.0%) | 0 (0.0%) |
| 6 to 11 Years | 75 (31.2%) | 113 (26.6%) |
| 12 to 14 Years | 60 (31.8%) | 116 (44.1%) |
| 15 Years | 16 (14.0%) | 0 (0.0%) |
| 16 and 17 Years | 61 (37.9%) | 0 (0.0%) |
| 18 to 24 Years | 35 (6.1%) | 134 (17.2%) |
| 25 to 34 Years | 59 (7.4%) | 146 (16.9%) |
| 35 to 44 Years | 102 (14.3%) | 167 (25.6%) |
| 45 to 54 Years | 35 (4.6%) | 75 (12.6%) |
| 55 to 64 Years | 50 (7.7%) | 27 (4.5%) |
| 65 to 74 Years | 53 (12.0%) | 51 (11.6%) |
| 75 Years and over | 0 (0.0%) | 8 (5.9%) |
| Total | 756 (14.7%) | 905 (17.4%) |
Income Above Poverty by Sex and Age in North Bellport
According to the poverty statistics in North Bellport, males aged 5 years and females aged 5 years are the age groups that are most secure financially, with 100.0% of males and 100.0% of females in these age groups living above the poverty line.
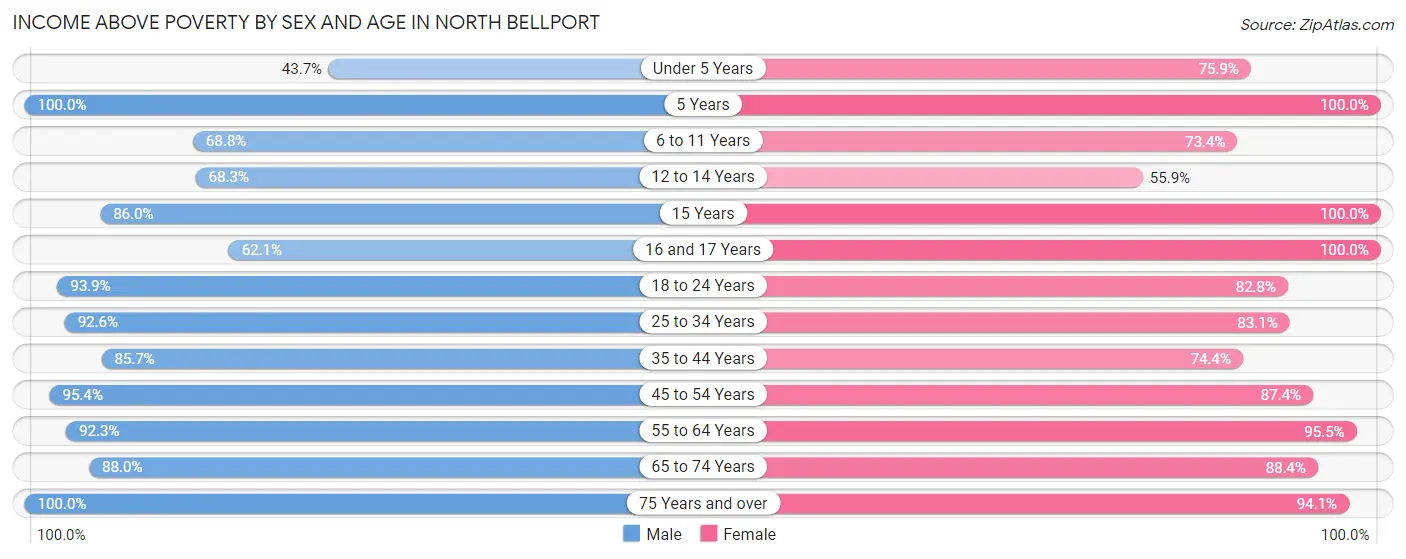
| Age Bracket | Male | Female |
| Under 5 Years | 163 (43.7%) | 214 (75.9%) |
| 5 Years | 42 (100.0%) | 57 (100.0%) |
| 6 to 11 Years | 165 (68.8%) | 312 (73.4%) |
| 12 to 14 Years | 129 (68.2%) | 147 (55.9%) |
| 15 Years | 98 (86.0%) | 7 (100.0%) |
| 16 and 17 Years | 100 (62.1%) | 83 (100.0%) |
| 18 to 24 Years | 542 (93.9%) | 644 (82.8%) |
| 25 to 34 Years | 733 (92.5%) | 718 (83.1%) |
| 35 to 44 Years | 613 (85.7%) | 486 (74.4%) |
| 45 to 54 Years | 719 (95.4%) | 522 (87.4%) |
| 55 to 64 Years | 599 (92.3%) | 575 (95.5%) |
| 65 to 74 Years | 390 (88.0%) | 387 (88.4%) |
| 75 Years and over | 90 (100.0%) | 128 (94.1%) |
| Total | 4,383 (85.3%) | 4,280 (82.6%) |
Income Below Poverty Among Married-Couple Families in North Bellport
The poverty statistics for married-couple families in North Bellport show that 10.9% or 177 of the total 1,627 families live below the poverty line. Families with 3 or 4 children have the highest poverty rate of 52.8%, comprising of 93 families. On the other hand, families with 5 or more children have the lowest poverty rate of 0.0%, which includes 0 families.
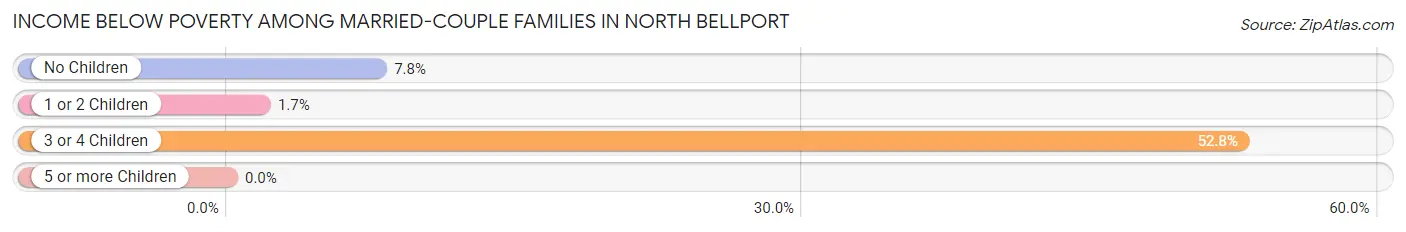
| Children | Above Poverty | Below Poverty |
| No Children | 899 (92.2%) | 76 (7.8%) |
| 1 or 2 Children | 457 (98.3%) | 8 (1.7%) |
| 3 or 4 Children | 83 (47.2%) | 93 (52.8%) |
| 5 or more Children | 11 (100.0%) | 0 (0.0%) |
| Total | 1,450 (89.1%) | 177 (10.9%) |
Income Below Poverty Among Single-Parent Households in North Bellport
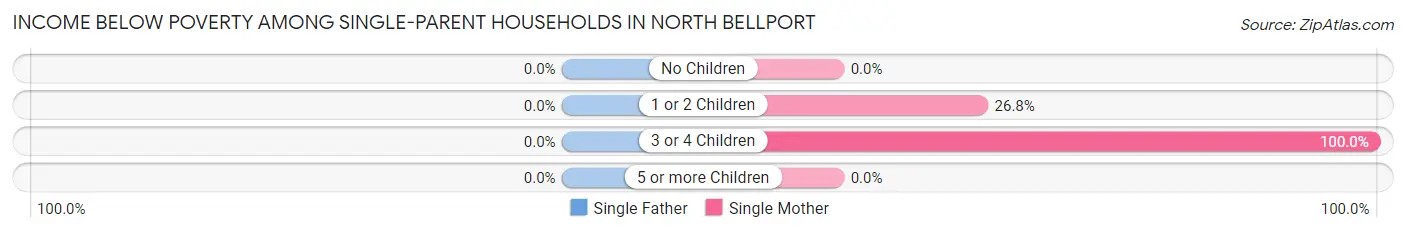
| Children | Single Father | Single Mother |
| No Children | 0 (0.0%) | 0 (0.0%) |
| 1 or 2 Children | 0 (0.0%) | 85 (26.8%) |
| 3 or 4 Children | 0 (0.0%) | 42 (100.0%) |
| 5 or more Children | 0 (0.0%) | 0 (0.0%) |
| Total | 0 (0.0%) | 127 (18.0%) |
Income Below Poverty Among Married-Couple vs Single-Parent Households in North Bellport
The poverty data for North Bellport shows that 177 of the married-couple family households (10.9%) and 127 of the single-parent households (13.5%) are living below the poverty level. Within the married-couple family households, those with 3 or 4 children have the highest poverty rate, with 93 households (52.8%) falling below the poverty line. Among the single-parent households, those with 3 or 4 children have the highest poverty rate, with 42 household (100.0%) living below poverty.
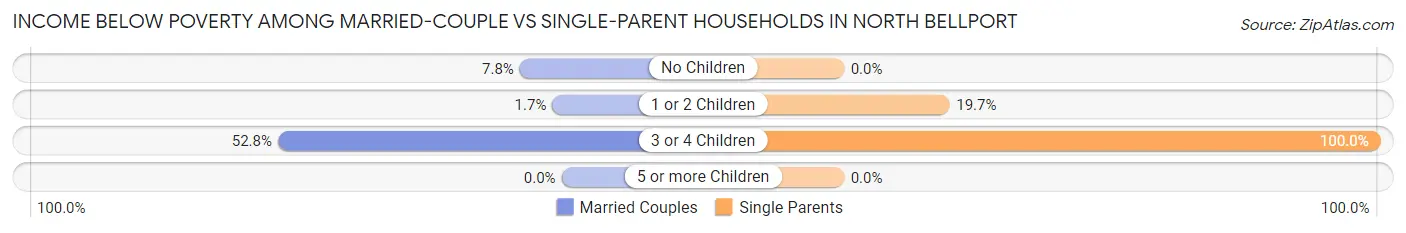
| Children | Married-Couple Families | Single-Parent Households |
| No Children | 76 (7.8%) | 0 (0.0%) |
| 1 or 2 Children | 8 (1.7%) | 85 (19.7%) |
| 3 or 4 Children | 93 (52.8%) | 42 (100.0%) |
| 5 or more Children | 0 (0.0%) | 0 (0.0%) |
| Total | 177 (10.9%) | 127 (13.5%) |
Race in North Bellport
The most populous races in North Bellport are White / Caucasian (5,795 | 55.0%), Hispanic or Latino (4,189 | 39.8%), and Black / African American (2,439 | 23.2%).
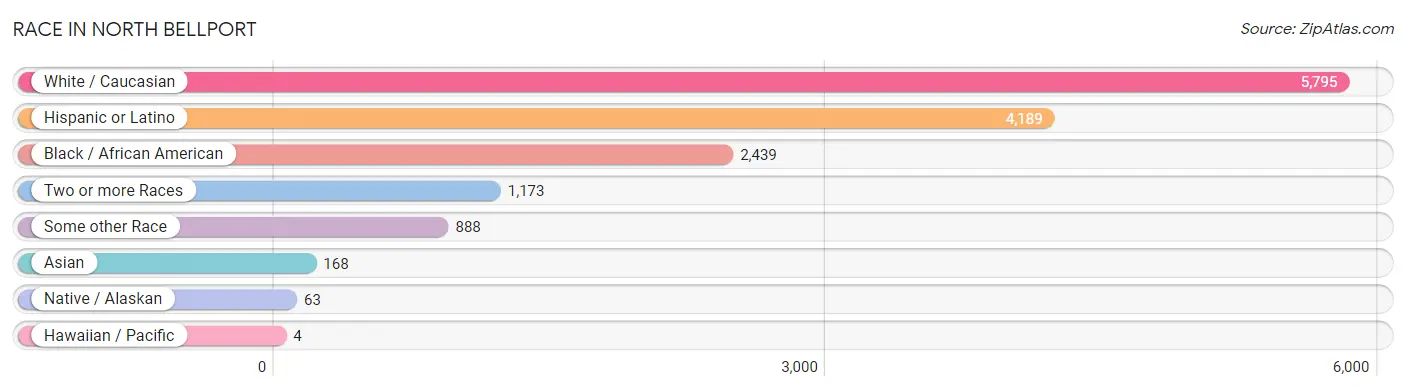
| Race | # Population | % Population |
| Asian | 168 | 1.6% |
| Black / African American | 2,439 | 23.2% |
| Hawaiian / Pacific | 4 | 0.0% |
| Hispanic or Latino | 4,189 | 39.8% |
| Native / Alaskan | 63 | 0.6% |
| White / Caucasian | 5,795 | 55.0% |
| Two or more Races | 1,173 | 11.1% |
| Some other Race | 888 | 8.4% |
| Total | 10,530 | 100.0% |
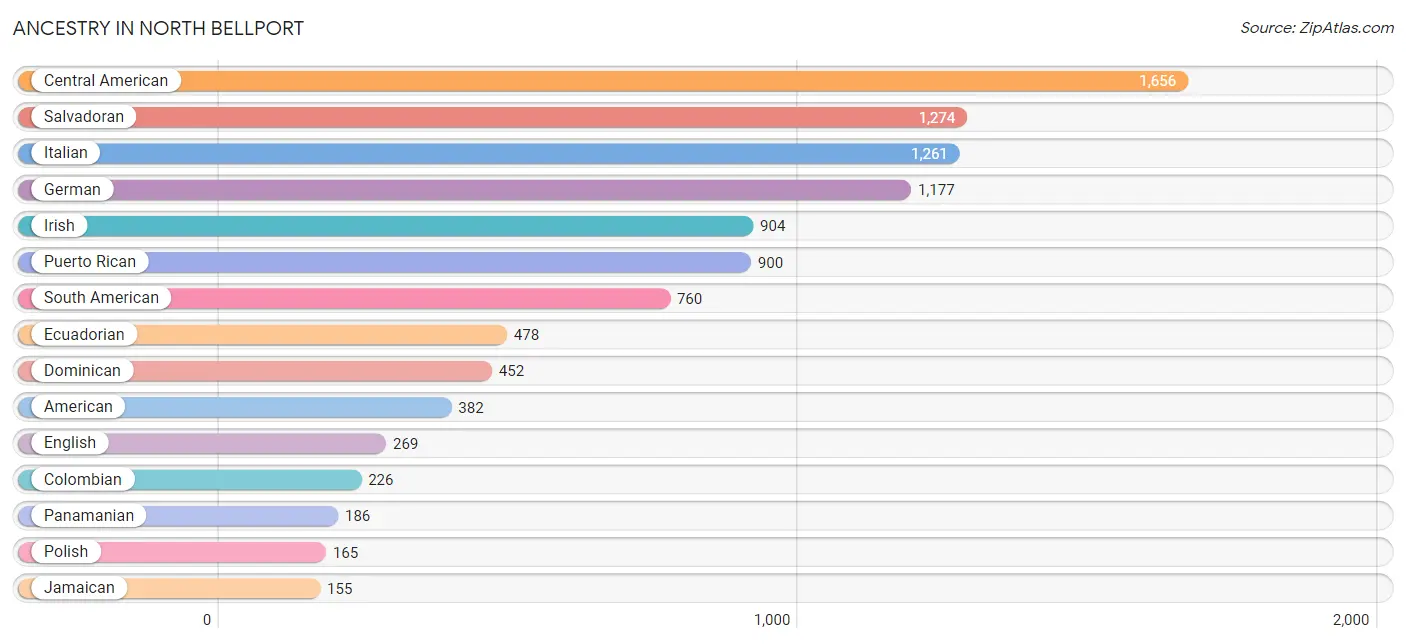
Ancestry in North Bellport
The most populous ancestries reported in North Bellport are Central American (1,656 | 15.7%), Salvadoran (1,274 | 12.1%), Italian (1,261 | 12.0%), German (1,177 | 11.2%), and Irish (904 | 8.6%), together accounting for 59.6% of all North Bellport residents.
| Ancestry | # Population | % Population |
| African | 49 | 0.5% |
| American | 382 | 3.6% |
| Arab | 10 | 0.1% |
| Bhutanese | 10 | 0.1% |
| British | 31 | 0.3% |
| Central American | 1,656 | 15.7% |
| Central American Indian | 22 | 0.2% |
| Colombian | 226 | 2.1% |
| Cuban | 10 | 0.1% |
| Czech | 18 | 0.2% |
| Czechoslovakian | 12 | 0.1% |
| Danish | 6 | 0.1% |
| Dominican | 452 | 4.3% |
| Dutch | 39 | 0.4% |
| Eastern European | 30 | 0.3% |
| Ecuadorian | 478 | 4.5% |
| English | 269 | 2.5% |
| European | 56 | 0.5% |
| Finnish | 8 | 0.1% |
| French | 55 | 0.5% |
| French Canadian | 24 | 0.2% |
| German | 1,177 | 11.2% |
| Greek | 11 | 0.1% |
| Guatemalan | 88 | 0.8% |
| Haitian | 96 | 0.9% |
| Honduran | 108 | 1.0% |
| Indian (Asian) | 86 | 0.8% |
| Iranian | 8 | 0.1% |
| Irish | 904 | 8.6% |
| Israeli | 12 | 0.1% |
| Italian | 1,261 | 12.0% |
| Jamaican | 155 | 1.5% |
| Korean | 32 | 0.3% |
| Lebanese | 10 | 0.1% |
| Maltese | 15 | 0.1% |
| Mexican | 130 | 1.2% |
| Native Hawaiian | 54 | 0.5% |
| Northern European | 18 | 0.2% |
| Norwegian | 6 | 0.1% |
| Panamanian | 186 | 1.8% |
| Paraguayan | 20 | 0.2% |
| Polish | 165 | 1.6% |
| Puerto Rican | 900 | 8.6% |
| Russian | 58 | 0.5% |
| Salvadoran | 1,274 | 12.1% |
| Scandinavian | 17 | 0.2% |
| Scotch-Irish | 28 | 0.3% |
| Scottish | 62 | 0.6% |
| South American | 760 | 7.2% |
| Spaniard | 39 | 0.4% |
| Spanish | 30 | 0.3% |
| Subsaharan African | 49 | 0.5% |
| Swedish | 77 | 0.7% |
| Swiss | 4 | 0.0% |
| Thai | 98 | 0.9% |
| Ukrainian | 23 | 0.2% |
| Venezuelan | 36 | 0.3% |
| West Indian | 91 | 0.9% | View All 58 Rows |
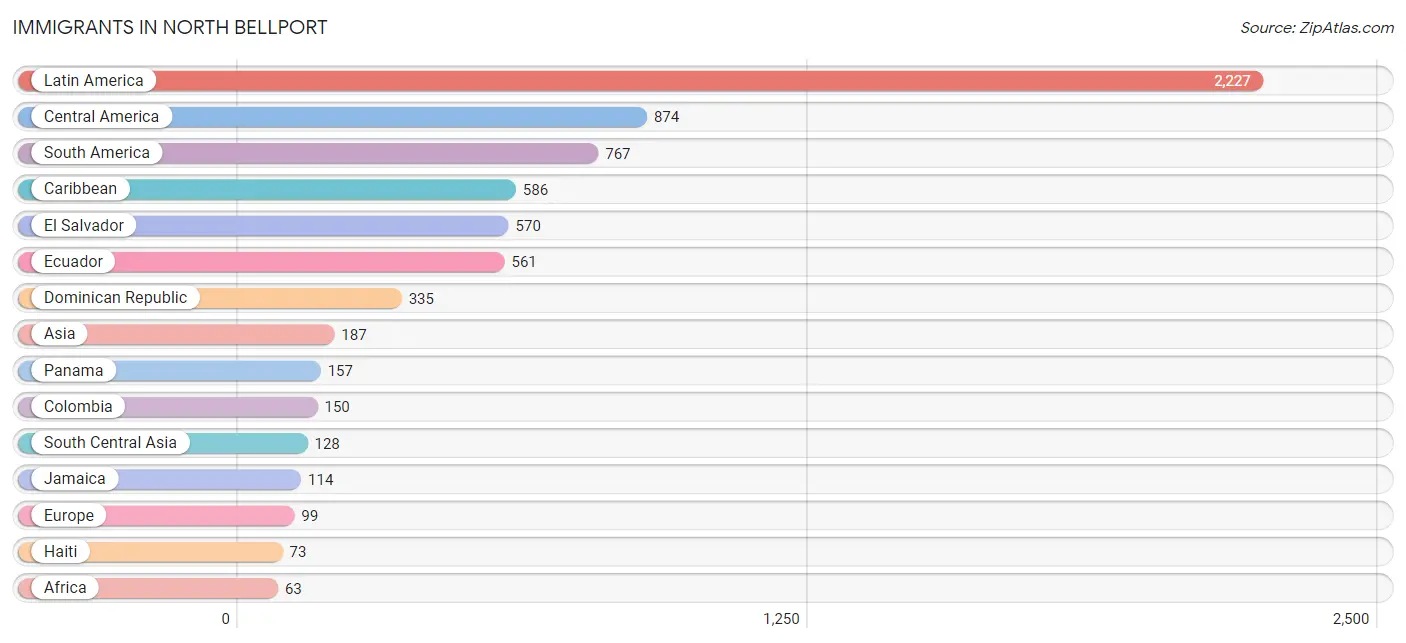
Immigrants in North Bellport
The most numerous immigrant groups reported in North Bellport came from Latin America (2,227 | 21.1%), Central America (874 | 8.3%), South America (767 | 7.3%), Caribbean (586 | 5.6%), and El Salvador (570 | 5.4%), together accounting for 47.7% of all North Bellport residents.
| Immigration Origin | # Population | % Population |
| Africa | 63 | 0.6% |
| Asia | 187 | 1.8% |
| Australia | 36 | 0.3% |
| Caribbean | 586 | 5.6% |
| Central America | 874 | 8.3% |
| China | 12 | 0.1% |
| Colombia | 150 | 1.4% |
| Cuba | 10 | 0.1% |
| Dominican Republic | 335 | 3.2% |
| Eastern Asia | 12 | 0.1% |
| Eastern Europe | 24 | 0.2% |
| Ecuador | 561 | 5.3% |
| El Salvador | 570 | 5.4% |
| England | 19 | 0.2% |
| Europe | 99 | 0.9% |
| Germany | 33 | 0.3% |
| Ghana | 38 | 0.4% |
| Greece | 11 | 0.1% |
| Guatemala | 62 | 0.6% |
| Haiti | 73 | 0.7% |
| Honduras | 48 | 0.5% |
| India | 59 | 0.6% |
| Iran | 8 | 0.1% |
| Israel | 12 | 0.1% |
| Italy | 12 | 0.1% |
| Jamaica | 114 | 1.1% |
| Latin America | 2,227 | 21.1% |
| Mexico | 37 | 0.4% |
| Northern Africa | 25 | 0.2% |
| Northern Europe | 19 | 0.2% |
| Oceania | 36 | 0.3% |
| Pakistan | 61 | 0.6% |
| Panama | 157 | 1.5% |
| Philippines | 16 | 0.2% |
| Poland | 3 | 0.0% |
| Saudi Arabia | 11 | 0.1% |
| South America | 767 | 7.3% |
| South Central Asia | 128 | 1.2% |
| South Eastern Asia | 24 | 0.2% |
| Southern Europe | 23 | 0.2% |
| St. Vincent and the Grenadines | 30 | 0.3% |
| Taiwan | 4 | 0.0% |
| Trinidad and Tobago | 24 | 0.2% |
| Ukraine | 21 | 0.2% |
| Venezuela | 36 | 0.3% |
| Western Africa | 38 | 0.4% |
| Western Asia | 23 | 0.2% |
| Western Europe | 33 | 0.3% | View All 48 Rows |
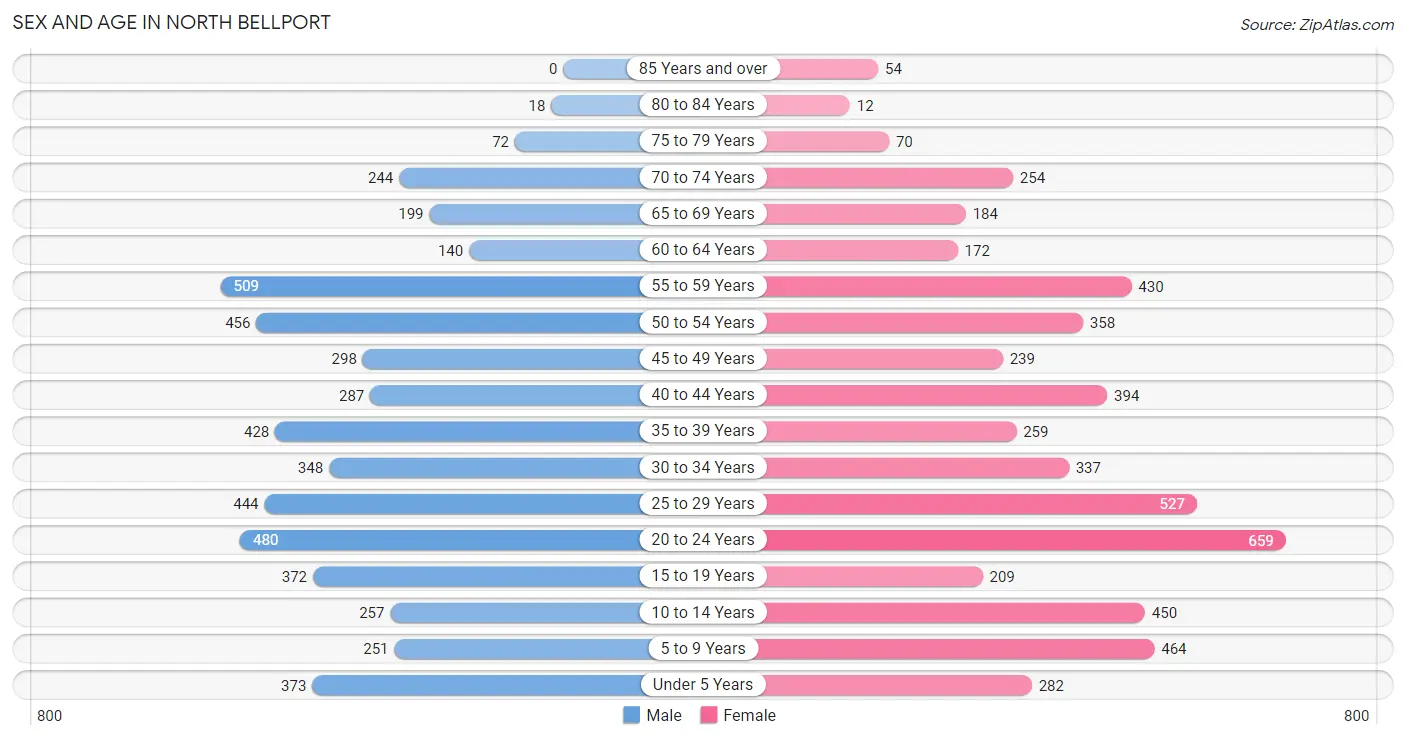
Sex and Age in North Bellport
Sex and Age in North Bellport
The most populous age groups in North Bellport are 55 to 59 Years (509 | 9.8%) for men and 20 to 24 Years (659 | 12.3%) for women.
| Age Bracket | Male | Female |
| Under 5 Years | 373 (7.2%) | 282 (5.3%) |
| 5 to 9 Years | 251 (4.9%) | 464 (8.7%) |
| 10 to 14 Years | 257 (5.0%) | 450 (8.4%) |
| 15 to 19 Years | 372 (7.2%) | 209 (3.9%) |
| 20 to 24 Years | 480 (9.3%) | 659 (12.3%) |
| 25 to 29 Years | 444 (8.6%) | 527 (9.8%) |
| 30 to 34 Years | 348 (6.7%) | 337 (6.3%) |
| 35 to 39 Years | 428 (8.3%) | 259 (4.8%) |
| 40 to 44 Years | 287 (5.5%) | 394 (7.4%) |
| 45 to 49 Years | 298 (5.8%) | 239 (4.5%) |
| 50 to 54 Years | 456 (8.8%) | 358 (6.7%) |
| 55 to 59 Years | 509 (9.8%) | 430 (8.0%) |
| 60 to 64 Years | 140 (2.7%) | 172 (3.2%) |
| 65 to 69 Years | 199 (3.8%) | 184 (3.4%) |
| 70 to 74 Years | 244 (4.7%) | 254 (4.7%) |
| 75 to 79 Years | 72 (1.4%) | 70 (1.3%) |
| 80 to 84 Years | 18 (0.4%) | 12 (0.2%) |
| 85 Years and over | 0 (0.0%) | 54 (1.0%) |
| Total | 5,176 (100.0%) | 5,354 (100.0%) |
Families and Households in North Bellport
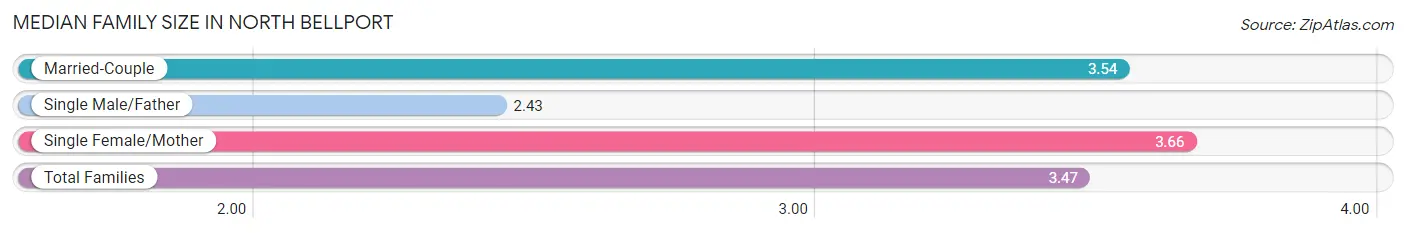
Median Family Size in North Bellport
The median family size in North Bellport is 3.47 persons per family, with single female/mother families (705 | 27.4%) accounting for the largest median family size of 3.66 persons per family. On the other hand, single male/father families (237 | 9.2%) represent the smallest median family size with 2.43 persons per family.
| Family Type | # Families | Family Size |
| Married-Couple | 1,627 (63.3%) | 3.54 |
| Single Male/Father | 237 (9.2%) | 2.43 |
| Single Female/Mother | 705 (27.4%) | 3.66 |
| Total Families | 2,569 (100.0%) | 3.47 |
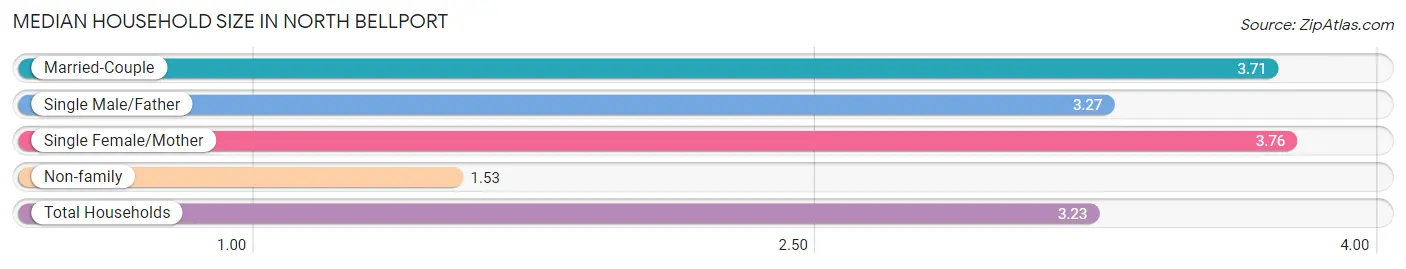
Median Household Size in North Bellport
The median household size in North Bellport is 3.23 persons per household, with single female/mother households (705 | 21.7%) accounting for the largest median household size of 3.76 persons per household. non-family households (684 | 21.0%) represent the smallest median household size with 1.53 persons per household.
| Household Type | # Households | Household Size |
| Married-Couple | 1,627 (50.0%) | 3.71 |
| Single Male/Father | 237 (7.3%) | 3.27 |
| Single Female/Mother | 705 (21.7%) | 3.76 |
| Non-family | 684 (21.0%) | 1.53 |
| Total Households | 3,253 (100.0%) | 3.23 |
Household Size by Marriage Status in North Bellport
Out of a total of 3,253 households in North Bellport, 2,569 (79.0%) are family households, while 684 (21.0%) are nonfamily households. The most numerous type of family households are 2-person households, comprising 894, and the most common type of nonfamily households are 1-person households, comprising 420.
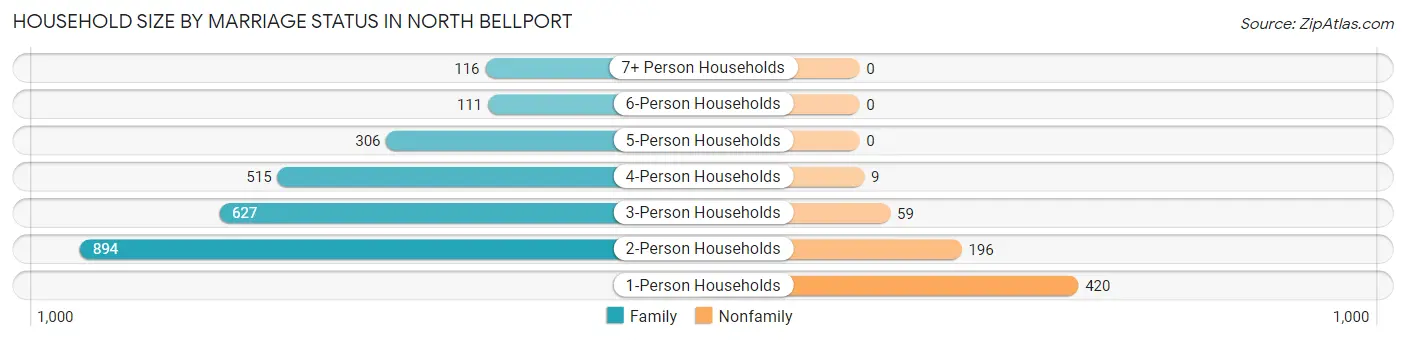
| Household Size | Family Households | Nonfamily Households |
| 1-Person Households | - | 420 (12.9%) |
| 2-Person Households | 894 (27.5%) | 196 (6.0%) |
| 3-Person Households | 627 (19.3%) | 59 (1.8%) |
| 4-Person Households | 515 (15.8%) | 9 (0.3%) |
| 5-Person Households | 306 (9.4%) | 0 (0.0%) |
| 6-Person Households | 111 (3.4%) | 0 (0.0%) |
| 7+ Person Households | 116 (3.6%) | 0 (0.0%) |
| Total | 2,569 (79.0%) | 684 (21.0%) |
Female Fertility in North Bellport
Fertility by Age in North Bellport
Average fertility rate in North Bellport is 66.0 births per 1,000 women. Women in the age bracket of 20 to 34 years have the highest fertility rate with 92.0 births per 1,000 women. Women in the age bracket of 20 to 34 years acount for 80.5% of all women with births.
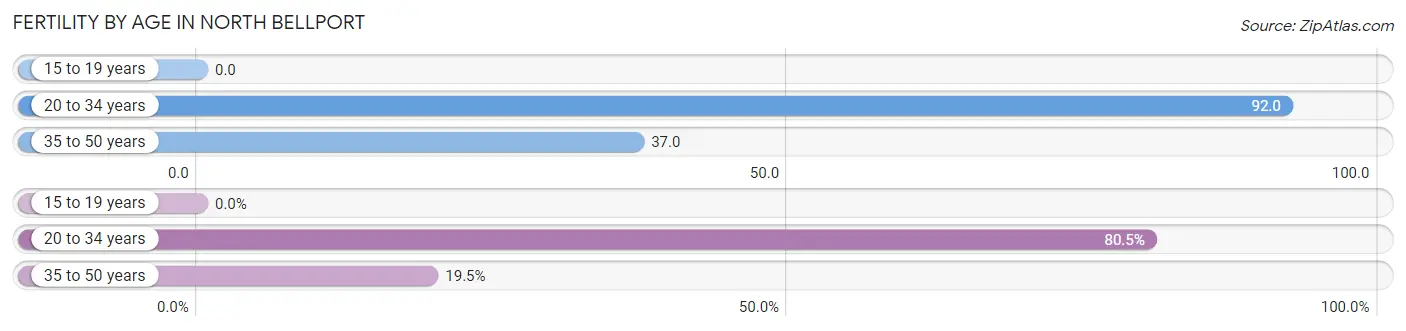
| Age Bracket | Women with Births | Births / 1,000 Women |
| 15 to 19 years | 0 (0.0%) | 0.0 |
| 20 to 34 years | 140 (80.5%) | 92.0 |
| 35 to 50 years | 34 (19.5%) | 37.0 |
| Total | 174 (100.0%) | 66.0 |
Fertility by Age by Marriage Status in North Bellport
68.4% of women with births (174) in North Bellport are married. The highest percentage of unmarried women with births falls into 20 to 34 years age bracket with 39.3% of them unmarried at the time of birth, while the lowest percentage of unmarried women with births belong to 35 to 50 years age bracket with 0.0% of them unmarried.
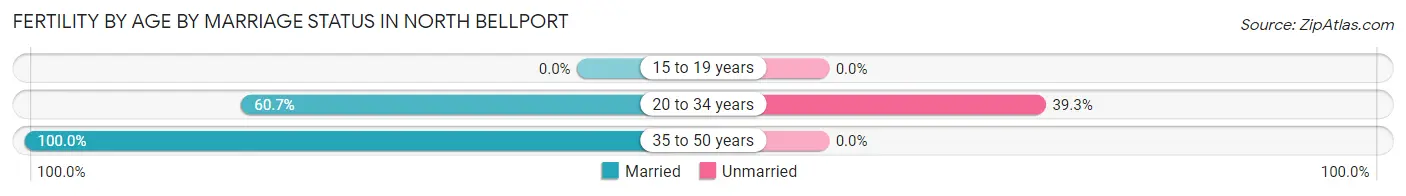
| Age Bracket | Married | Unmarried |
| 15 to 19 years | 0 (0.0%) | 0 (0.0%) |
| 20 to 34 years | 85 (60.7%) | 55 (39.3%) |
| 35 to 50 years | 34 (100.0%) | 0 (0.0%) |
| Total | 119 (68.4%) | 55 (31.6%) |
Fertility by Education in North Bellport
Average fertility rate in North Bellport is 66.0 births per 1,000 women. Women with the education attainment of less than high school have the highest fertility rate of 129.0 births per 1,000 women, while women with the education attainment of high school diploma have the lowest fertility at 13.0 births per 1,000 women. Women with the education attainment of college or associate's degree represent 51.7% of all women with births.
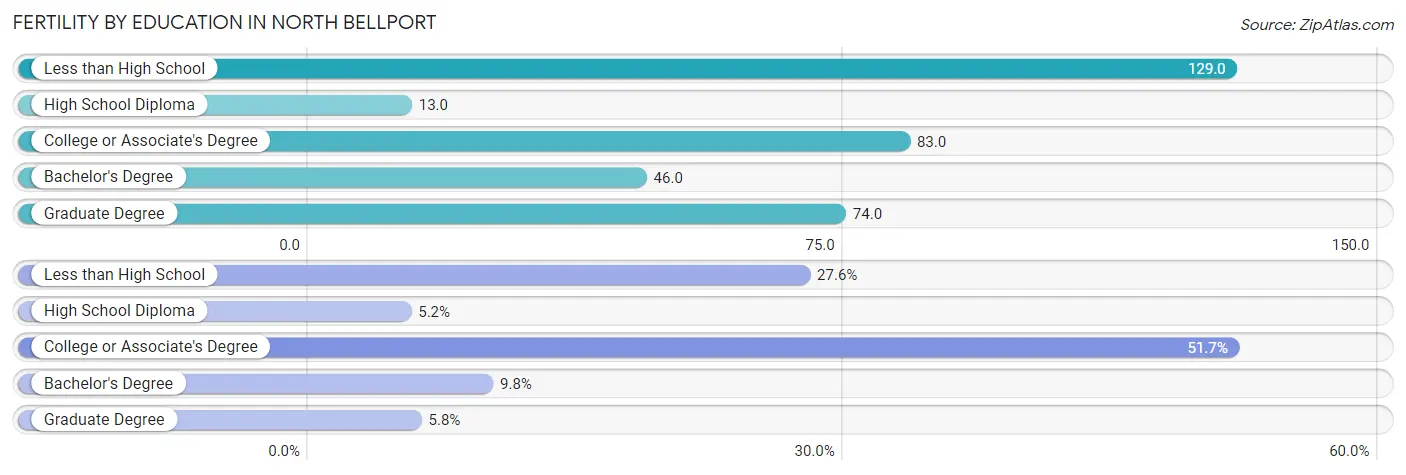
| Educational Attainment | Women with Births | Births / 1,000 Women |
| Less than High School | 48 (27.6%) | 129.0 |
| High School Diploma | 9 (5.2%) | 13.0 |
| College or Associate's Degree | 90 (51.7%) | 83.0 |
| Bachelor's Degree | 17 (9.8%) | 46.0 |
| Graduate Degree | 10 (5.8%) | 74.0 |
| Total | 174 (100.0%) | 66.0 |
Fertility by Education by Marriage Status in North Bellport
31.6% of women with births in North Bellport are unmarried. Women with the educational attainment of less than high school are most likely to be married with 100.0% of them married at childbirth, while women with the educational attainment of high school diploma are least likely to be married with 100.0% of them unmarried at childbirth.
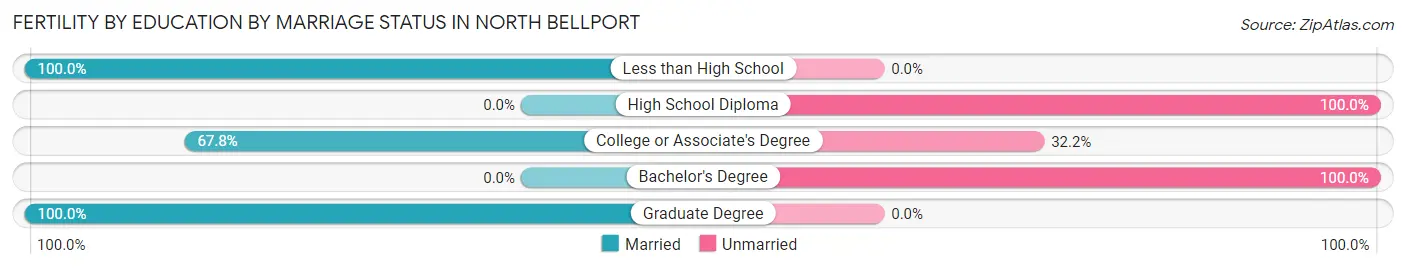
| Educational Attainment | Married | Unmarried |
| Less than High School | 48 (100.0%) | 0 (0.0%) |
| High School Diploma | 0 (0.0%) | 9 (100.0%) |
| College or Associate's Degree | 61 (67.8%) | 29 (32.2%) |
| Bachelor's Degree | 0 (0.0%) | 17 (100.0%) |
| Graduate Degree | 10 (100.0%) | 0 (0.0%) |
| Total | 119 (68.4%) | 55 (31.6%) |
Employment Characteristics in North Bellport
Employment by Class of Employer in North Bellport
Among the 5,064 employed individuals in North Bellport, private company employees (3,513 | 69.4%), local government employees (586 | 11.6%), and not-for-profit organizations (336 | 6.6%) make up the most common classes of employment.
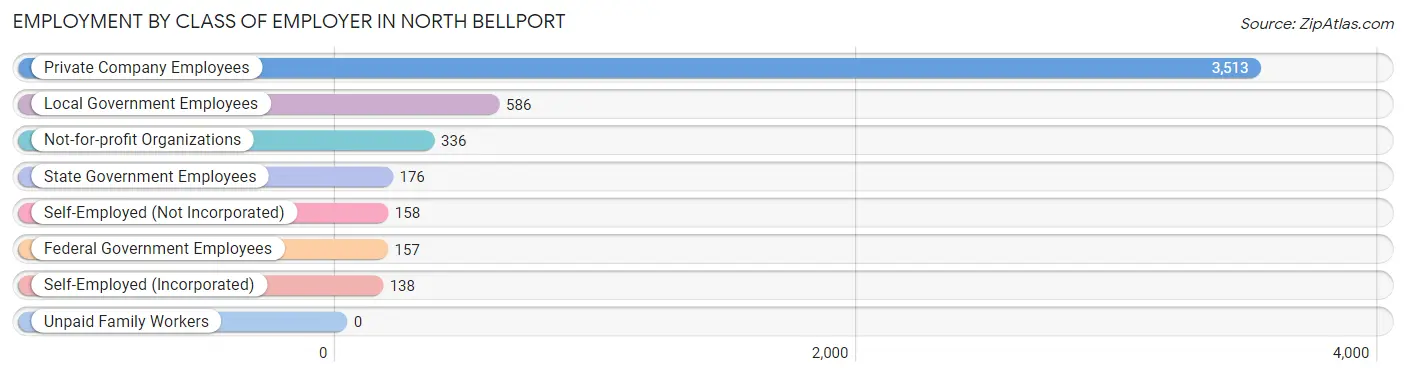
| Employer Class | # Employees | % Employees |
| Private Company Employees | 3,513 | 69.4% |
| Self-Employed (Incorporated) | 138 | 2.7% |
| Self-Employed (Not Incorporated) | 158 | 3.1% |
| Not-for-profit Organizations | 336 | 6.6% |
| Local Government Employees | 586 | 11.6% |
| State Government Employees | 176 | 3.5% |
| Federal Government Employees | 157 | 3.1% |
| Unpaid Family Workers | 0 | 0.0% |
| Total | 5,064 | 100.0% |
Employment Status by Age in North Bellport
According to the labor force statistics for North Bellport, out of the total population over 16 years of age (8,332), 67.0% or 5,582 individuals are in the labor force, with 7.8% or 435 of them unemployed. The age group with the highest labor force participation rate is 25 to 29 years, with 87.7% or 852 individuals in the labor force. Within the labor force, the 20 to 24 years age range has the highest percentage of unemployed individuals, with 27.0% or 161 of them being unemployed.
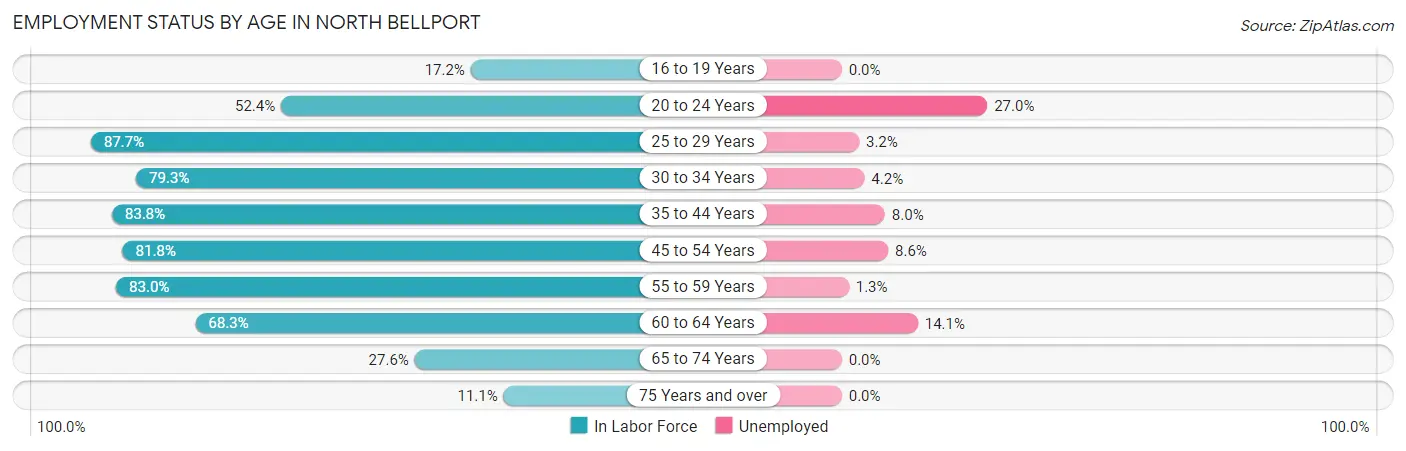
| Age Bracket | In Labor Force | Unemployed |
| 16 to 19 Years | 79 (17.2%) | 0 (0.0%) |
| 20 to 24 Years | 597 (52.4%) | 161 (27.0%) |
| 25 to 29 Years | 852 (87.7%) | 27 (3.2%) |
| 30 to 34 Years | 543 (79.3%) | 23 (4.2%) |
| 35 to 44 Years | 1,146 (83.8%) | 92 (8.0%) |
| 45 to 54 Years | 1,105 (81.8%) | 95 (8.6%) |
| 55 to 59 Years | 779 (83.0%) | 10 (1.3%) |
| 60 to 64 Years | 213 (68.3%) | 30 (14.1%) |
| 65 to 74 Years | 243 (27.6%) | 0 (0.0%) |
| 75 Years and over | 25 (11.1%) | 0 (0.0%) |
| Total | 5,582 (67.0%) | 435 (7.8%) |
Employment Status by Educational Attainment in North Bellport
According to labor force statistics for North Bellport, 82.5% of individuals (4,641) out of the total population between 25 and 64 years of age (5,626) are in the labor force, with 6.0% or 278 of them being unemployed. The group with the highest labor force participation rate are those with the educational attainment of bachelor's degree or higher, with 88.7% or 917 individuals in the labor force. Within the labor force, individuals with college / associate degree education have the highest percentage of unemployment, with 8.5% or 142 of them being unemployed.
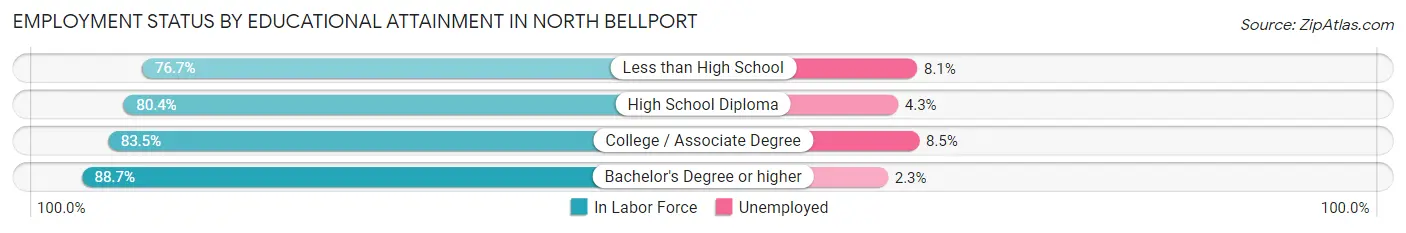
| Educational Attainment | In Labor Force | Unemployed |
| Less than High School | 664 (76.7%) | 70 (8.1%) |
| High School Diploma | 1,393 (80.4%) | 74 (4.3%) |
| College / Associate Degree | 1,665 (83.5%) | 169 (8.5%) |
| Bachelor's Degree or higher | 917 (88.7%) | 24 (2.3%) |
| Total | 4,641 (82.5%) | 338 (6.0%) |
Employment Occupations by Sex in North Bellport
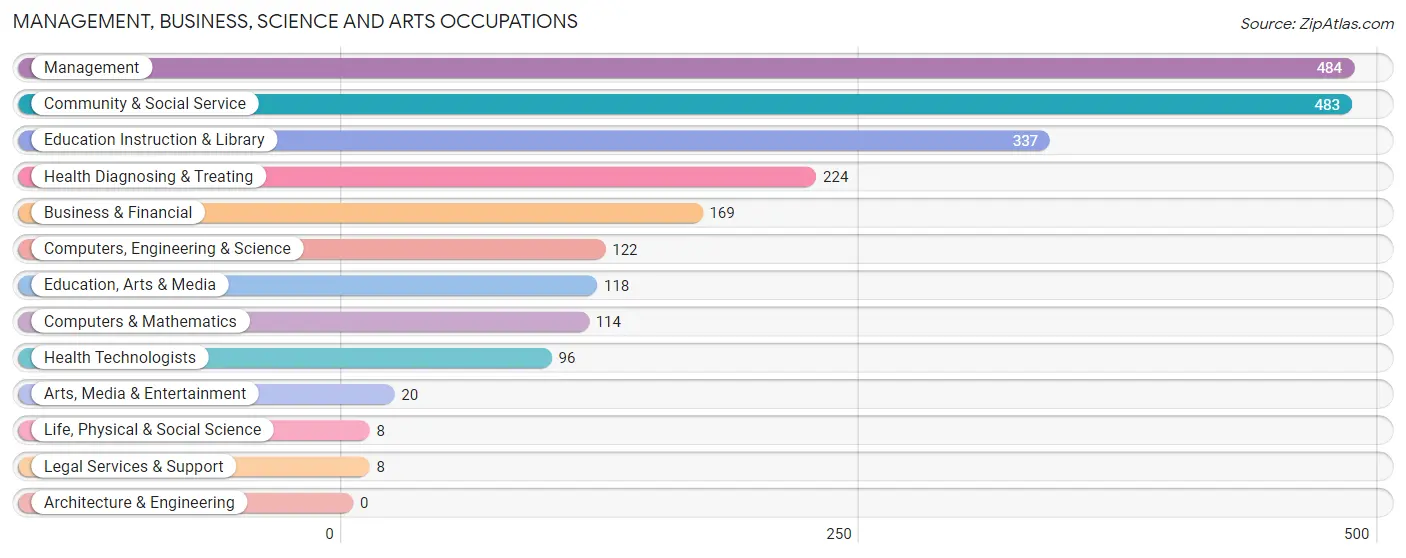
Management, Business, Science and Arts Occupations
The most common Management, Business, Science and Arts occupations in North Bellport are Management (484 | 9.4%), Community & Social Service (483 | 9.4%), Education Instruction & Library (337 | 6.6%), Health Diagnosing & Treating (224 | 4.3%), and Business & Financial (169 | 3.3%).
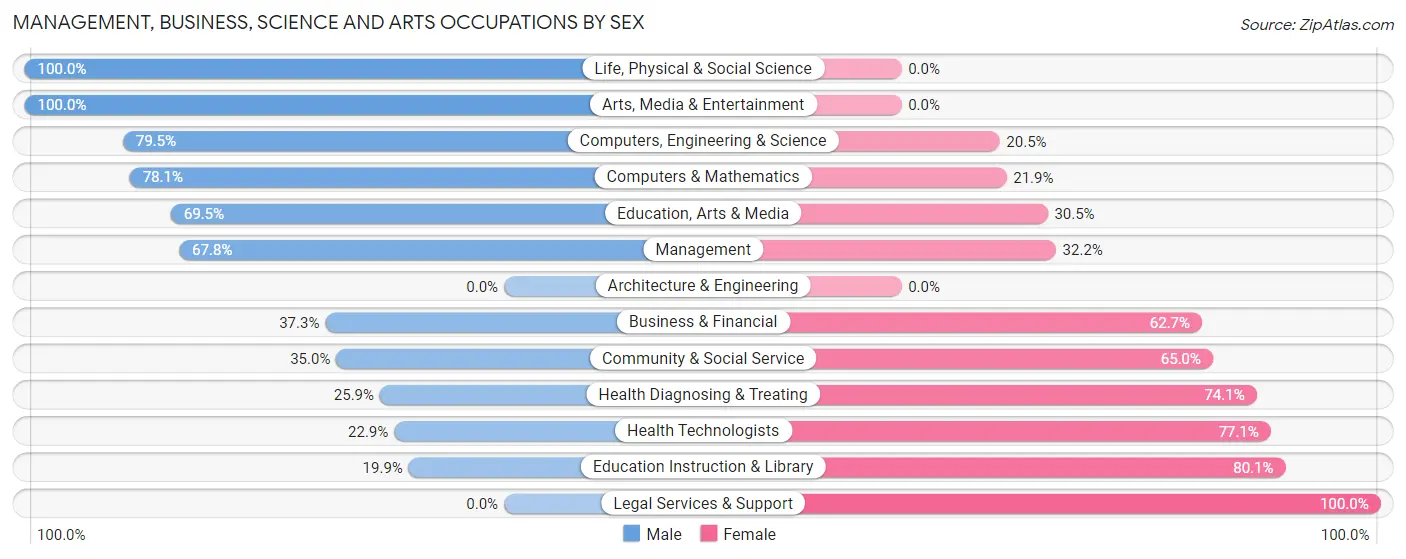
Management, Business, Science and Arts Occupations by Sex
Within the Management, Business, Science and Arts occupations in North Bellport, the most male-oriented occupations are Life, Physical & Social Science (100.0%), Arts, Media & Entertainment (100.0%), and Computers, Engineering & Science (79.5%), while the most female-oriented occupations are Legal Services & Support (100.0%), Education Instruction & Library (80.1%), and Health Technologists (77.1%).
| Occupation | Male | Female |
| Management | 328 (67.8%) | 156 (32.2%) |
| Business & Financial | 63 (37.3%) | 106 (62.7%) |
| Computers, Engineering & Science | 97 (79.5%) | 25 (20.5%) |
| Computers & Mathematics | 89 (78.1%) | 25 (21.9%) |
| Architecture & Engineering | 0 (0.0%) | 0 (0.0%) |
| Life, Physical & Social Science | 8 (100.0%) | 0 (0.0%) |
| Community & Social Service | 169 (35.0%) | 314 (65.0%) |
| Education, Arts & Media | 82 (69.5%) | 36 (30.5%) |
| Legal Services & Support | 0 (0.0%) | 8 (100.0%) |
| Education Instruction & Library | 67 (19.9%) | 270 (80.1%) |
| Arts, Media & Entertainment | 20 (100.0%) | 0 (0.0%) |
| Health Diagnosing & Treating | 58 (25.9%) | 166 (74.1%) |
| Health Technologists | 22 (22.9%) | 74 (77.1%) |
| Total (Category) | 715 (48.2%) | 767 (51.7%) |
| Total (Overall) | 2,808 (54.6%) | 2,337 (45.4%) |
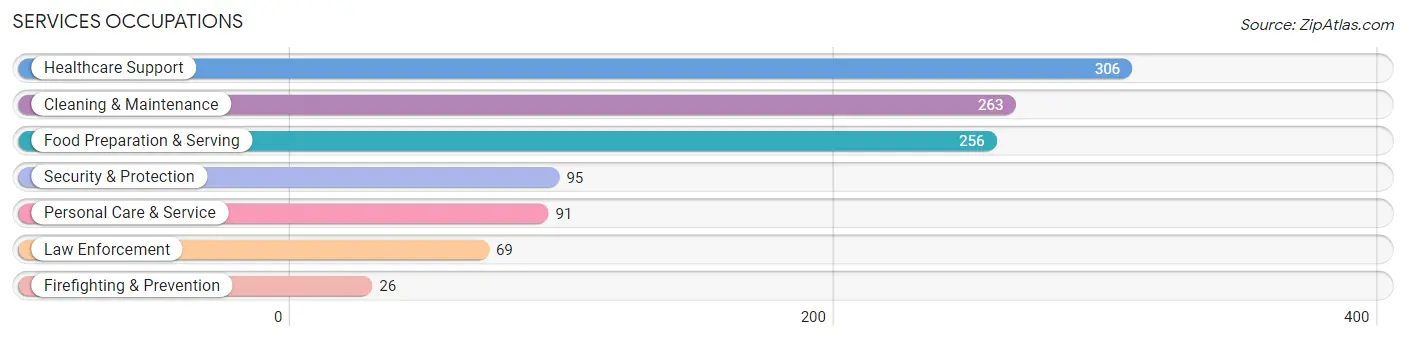
Services Occupations
The most common Services occupations in North Bellport are Healthcare Support (306 | 5.9%), Cleaning & Maintenance (263 | 5.1%), Food Preparation & Serving (256 | 5.0%), Security & Protection (95 | 1.8%), and Personal Care & Service (91 | 1.8%).
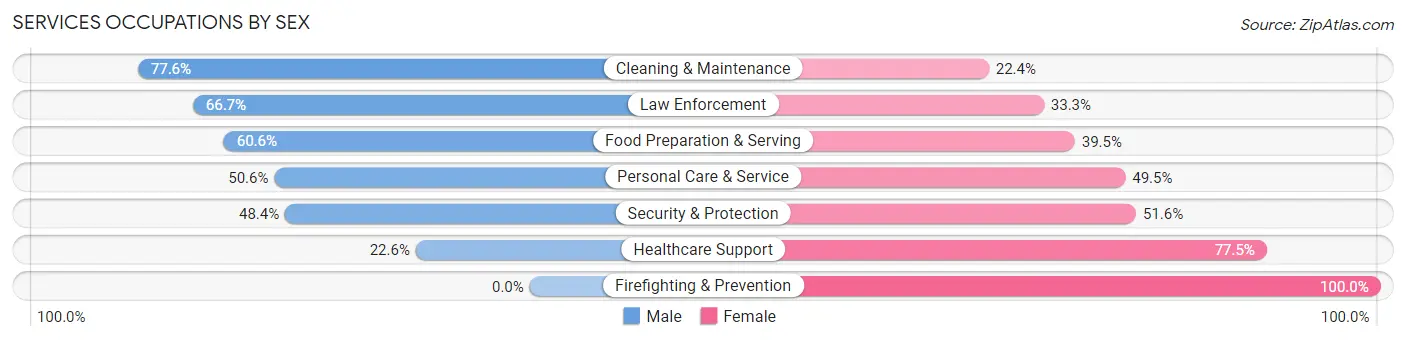
Services Occupations by Sex
Within the Services occupations in North Bellport, the most male-oriented occupations are Cleaning & Maintenance (77.6%), Law Enforcement (66.7%), and Food Preparation & Serving (60.6%), while the most female-oriented occupations are Firefighting & Prevention (100.0%), Healthcare Support (77.4%), and Security & Protection (51.6%).
| Occupation | Male | Female |
| Healthcare Support | 69 (22.6%) | 237 (77.4%) |
| Security & Protection | 46 (48.4%) | 49 (51.6%) |
| Firefighting & Prevention | 0 (0.0%) | 26 (100.0%) |
| Law Enforcement | 46 (66.7%) | 23 (33.3%) |
| Food Preparation & Serving | 155 (60.6%) | 101 (39.5%) |
| Cleaning & Maintenance | 204 (77.6%) | 59 (22.4%) |
| Personal Care & Service | 46 (50.5%) | 45 (49.4%) |
| Total (Category) | 520 (51.4%) | 491 (48.6%) |
| Total (Overall) | 2,808 (54.6%) | 2,337 (45.4%) |
Sales and Office Occupations
The most common Sales and Office occupations in North Bellport are Office & Administration (761 | 14.8%), and Sales & Related (567 | 11.0%).
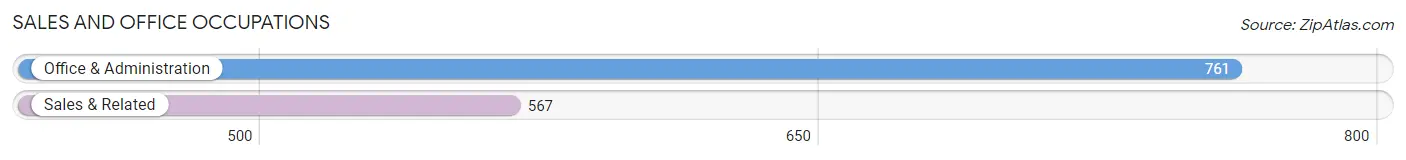
Sales and Office Occupations by Sex

| Occupation | Male | Female |
| Sales & Related | 310 (54.7%) | 257 (45.3%) |
| Office & Administration | 142 (18.7%) | 619 (81.3%) |
| Total (Category) | 452 (34.0%) | 876 (66.0%) |
| Total (Overall) | 2,808 (54.6%) | 2,337 (45.4%) |
Natural Resources, Construction and Maintenance Occupations
The most common Natural Resources, Construction and Maintenance occupations in North Bellport are Construction & Extraction (366 | 7.1%), Installation, Maintenance & Repair (171 | 3.3%), and Farming, Fishing & Forestry (58 | 1.1%).
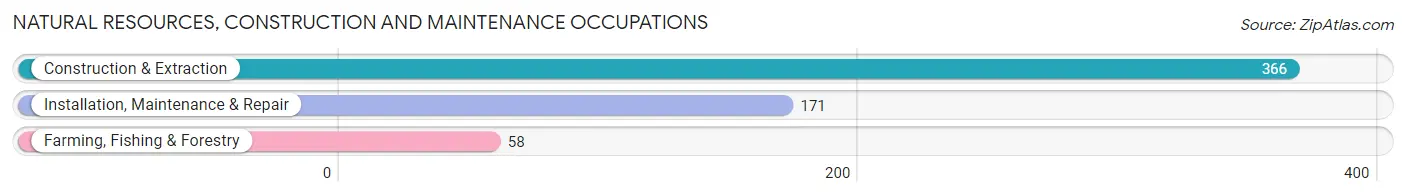
Natural Resources, Construction and Maintenance Occupations by Sex
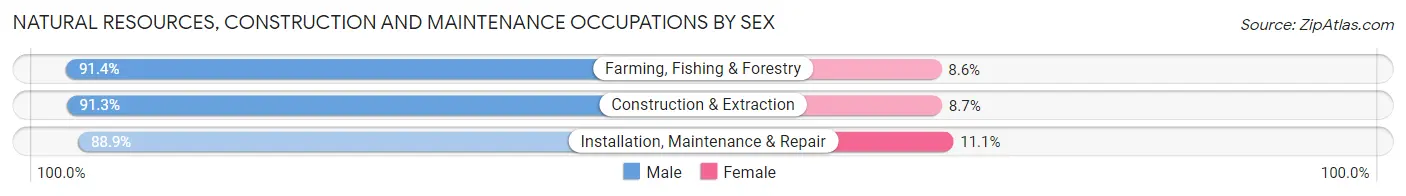
| Occupation | Male | Female |
| Farming, Fishing & Forestry | 53 (91.4%) | 5 (8.6%) |
| Construction & Extraction | 334 (91.3%) | 32 (8.7%) |
| Installation, Maintenance & Repair | 152 (88.9%) | 19 (11.1%) |
| Total (Category) | 539 (90.6%) | 56 (9.4%) |
| Total (Overall) | 2,808 (54.6%) | 2,337 (45.4%) |
Production, Transportation and Moving Occupations
The most common Production, Transportation and Moving occupations in North Bellport are Production (351 | 6.8%), Transportation (295 | 5.7%), and Material Moving (83 | 1.6%).
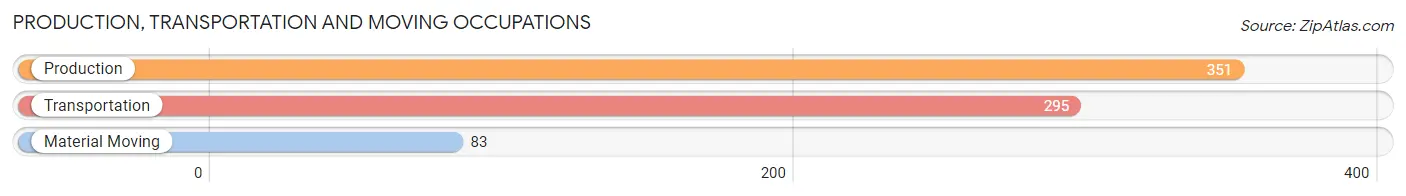
Production, Transportation and Moving Occupations by Sex
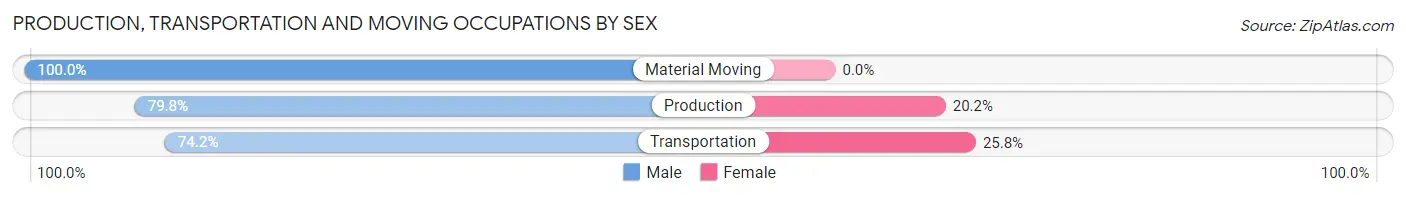
| Occupation | Male | Female |
| Production | 280 (79.8%) | 71 (20.2%) |
| Transportation | 219 (74.2%) | 76 (25.8%) |
| Material Moving | 83 (100.0%) | 0 (0.0%) |
| Total (Category) | 582 (79.8%) | 147 (20.2%) |
| Total (Overall) | 2,808 (54.6%) | 2,337 (45.4%) |
Employment Industries by Sex in North Bellport
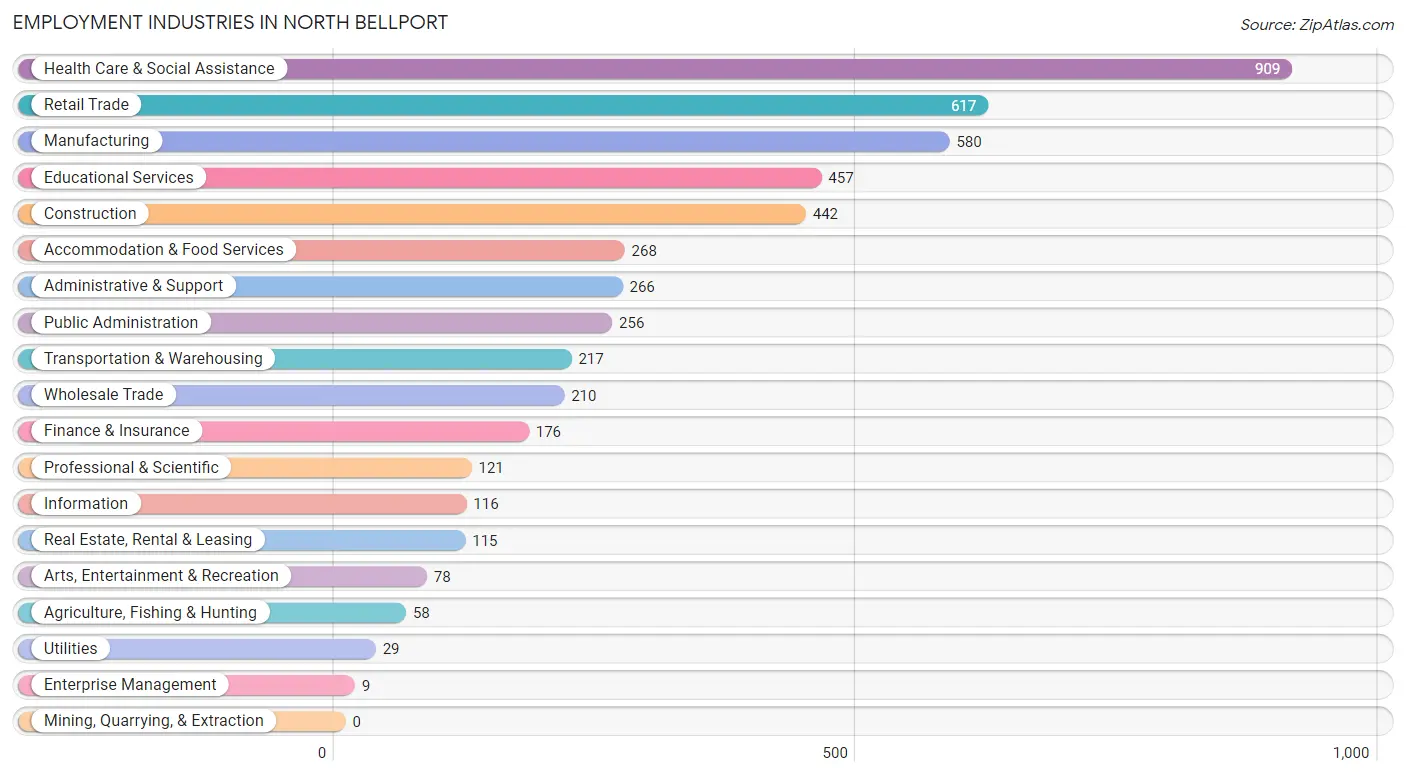
Employment Industries in North Bellport
The major employment industries in North Bellport include Health Care & Social Assistance (909 | 17.7%), Retail Trade (617 | 12.0%), Manufacturing (580 | 11.3%), Educational Services (457 | 8.9%), and Construction (442 | 8.6%).
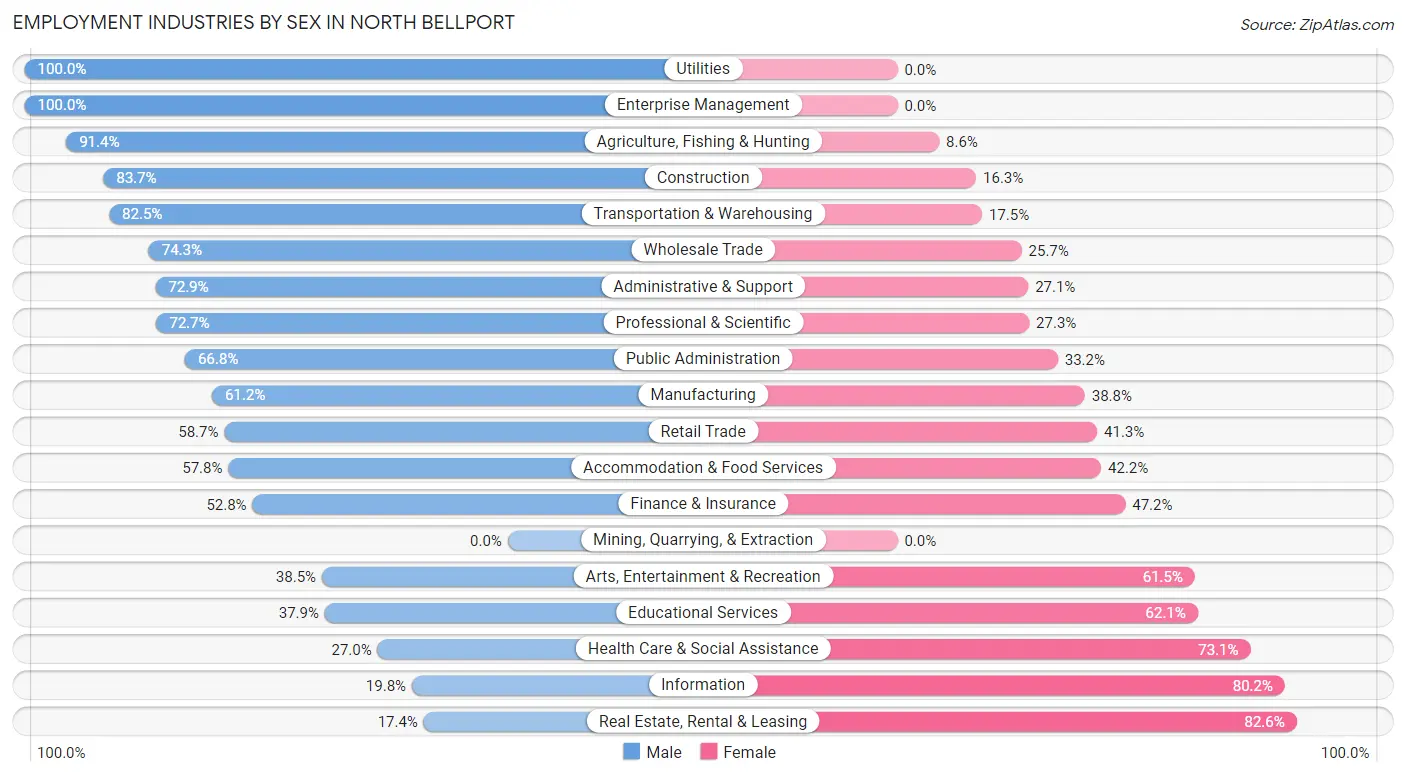
Employment Industries by Sex in North Bellport
The North Bellport industries that see more men than women are Utilities (100.0%), Enterprise Management (100.0%), and Agriculture, Fishing & Hunting (91.4%), whereas the industries that tend to have a higher number of women are Real Estate, Rental & Leasing (82.6%), Information (80.2%), and Health Care & Social Assistance (73.1%).
| Industry | Male | Female |
| Agriculture, Fishing & Hunting | 53 (91.4%) | 5 (8.6%) |
| Mining, Quarrying, & Extraction | 0 (0.0%) | 0 (0.0%) |
| Construction | 370 (83.7%) | 72 (16.3%) |
| Manufacturing | 355 (61.2%) | 225 (38.8%) |
| Wholesale Trade | 156 (74.3%) | 54 (25.7%) |
| Retail Trade | 362 (58.7%) | 255 (41.3%) |
| Transportation & Warehousing | 179 (82.5%) | 38 (17.5%) |
| Utilities | 29 (100.0%) | 0 (0.0%) |
| Information | 23 (19.8%) | 93 (80.2%) |
| Finance & Insurance | 93 (52.8%) | 83 (47.2%) |
| Real Estate, Rental & Leasing | 20 (17.4%) | 95 (82.6%) |
| Professional & Scientific | 88 (72.7%) | 33 (27.3%) |
| Enterprise Management | 9 (100.0%) | 0 (0.0%) |
| Administrative & Support | 194 (72.9%) | 72 (27.1%) |
| Educational Services | 173 (37.9%) | 284 (62.1%) |
| Health Care & Social Assistance | 245 (27.0%) | 664 (73.1%) |
| Arts, Entertainment & Recreation | 30 (38.5%) | 48 (61.5%) |
| Accommodation & Food Services | 155 (57.8%) | 113 (42.2%) |
| Public Administration | 171 (66.8%) | 85 (33.2%) |
| Total | 2,808 (54.6%) | 2,337 (45.4%) |
Education in North Bellport
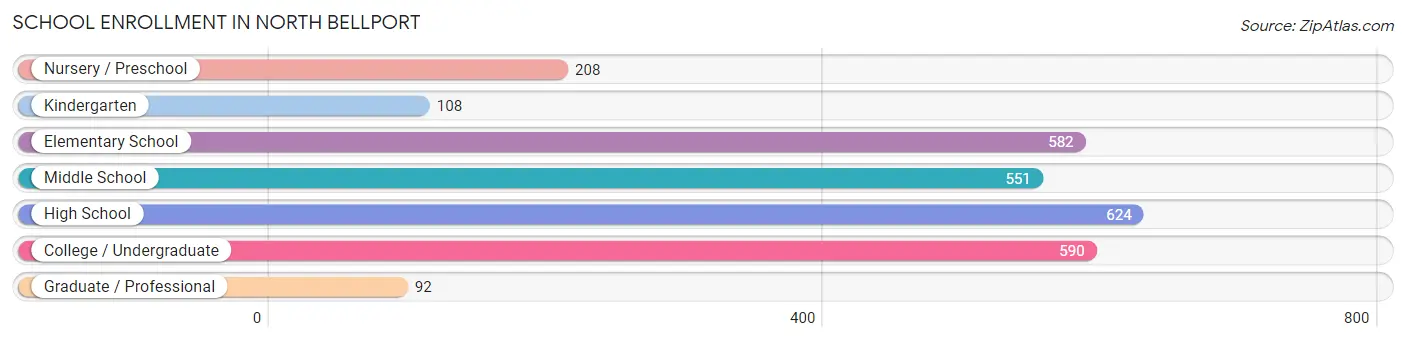
School Enrollment in North Bellport
The most common levels of schooling among the 2,755 students in North Bellport are high school (624 | 22.7%), college / undergraduate (590 | 21.4%), and elementary school (582 | 21.1%).
| School Level | # Students | % Students |
| Nursery / Preschool | 208 | 7.5% |
| Kindergarten | 108 | 3.9% |
| Elementary School | 582 | 21.1% |
| Middle School | 551 | 20.0% |
| High School | 624 | 22.7% |
| College / Undergraduate | 590 | 21.4% |
| Graduate / Professional | 92 | 3.3% |
| Total | 2,755 | 100.0% |
School Enrollment by Age by Funding Source in North Bellport
Out of a total of 2,755 students who are enrolled in schools in North Bellport, 245 (8.9%) attend a private institution, while the remaining 2,510 (91.1%) are enrolled in public schools. The age group of 35 years and over has the highest likelihood of being enrolled in private schools, with 32 (31.1% in the age bracket) enrolled. Conversely, the age group of 15 to 17 year olds has the lowest likelihood of being enrolled in a private school, with 365 (100.0% in the age bracket) attending a public institution.
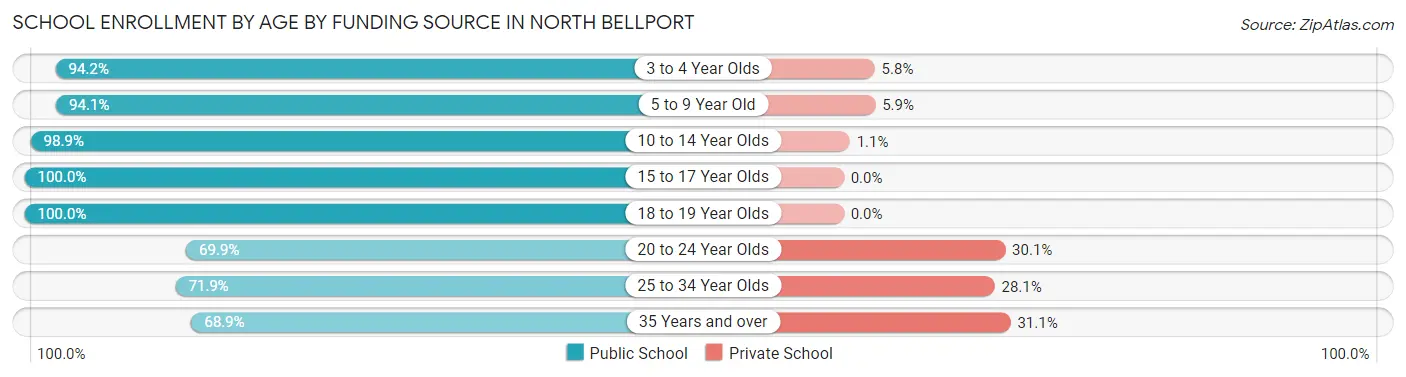
| Age Bracket | Public School | Private School |
| 3 to 4 Year Olds | 196 (94.2%) | 12 (5.8%) |
| 5 to 9 Year Old | 624 (94.1%) | 39 (5.9%) |
| 10 to 14 Year Olds | 699 (98.9%) | 8 (1.1%) |
| 15 to 17 Year Olds | 365 (100.0%) | 0 (0.0%) |
| 18 to 19 Year Olds | 187 (100.0%) | 0 (0.0%) |
| 20 to 24 Year Olds | 258 (69.9%) | 111 (30.1%) |
| 25 to 34 Year Olds | 110 (71.9%) | 43 (28.1%) |
| 35 Years and over | 71 (68.9%) | 32 (31.1%) |
| Total | 2,510 (91.1%) | 245 (8.9%) |
Educational Attainment by Field of Study in North Bellport
Business (267 | 19.5%), arts & humanities (181 | 13.2%), science & technology (171 | 12.5%), education (114 | 8.3%), and liberal arts & history (104 | 7.6%) are the most common fields of study among 1,370 individuals in North Bellport who have obtained a bachelor's degree or higher.
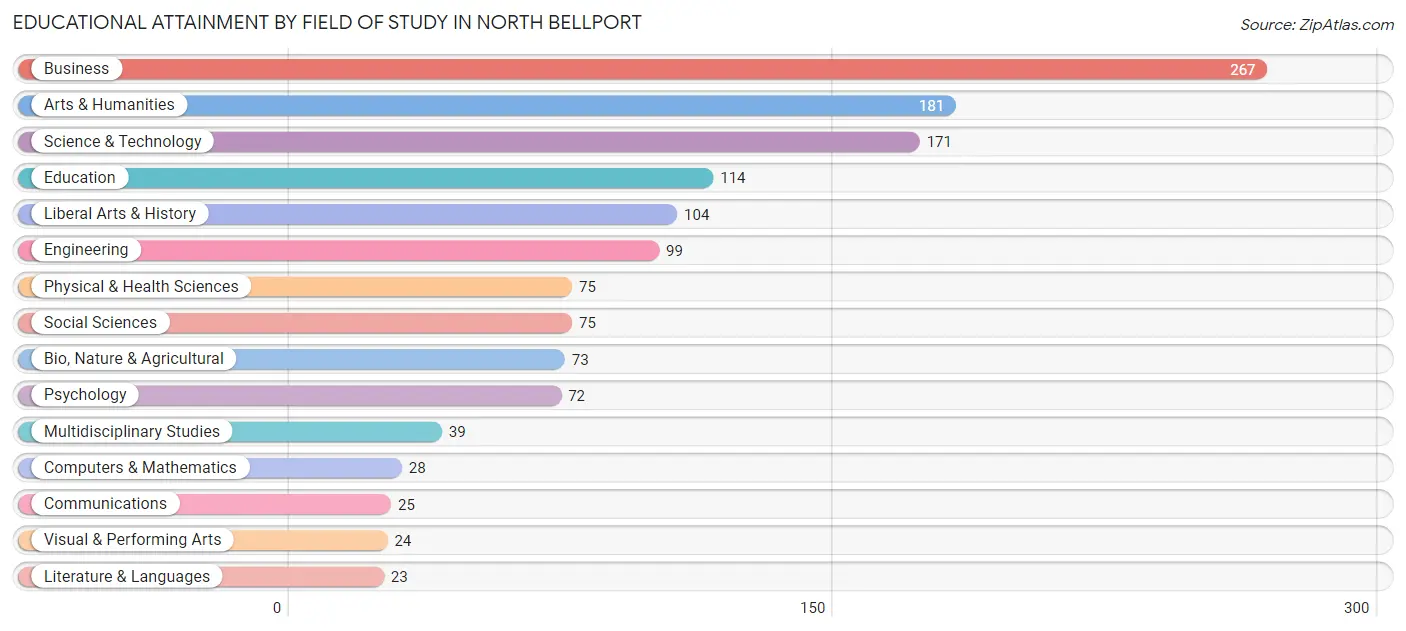
| Field of Study | # Graduates | % Graduates |
| Computers & Mathematics | 28 | 2.0% |
| Bio, Nature & Agricultural | 73 | 5.3% |
| Physical & Health Sciences | 75 | 5.5% |
| Psychology | 72 | 5.3% |
| Social Sciences | 75 | 5.5% |
| Engineering | 99 | 7.2% |
| Multidisciplinary Studies | 39 | 2.9% |
| Science & Technology | 171 | 12.5% |
| Business | 267 | 19.5% |
| Education | 114 | 8.3% |
| Literature & Languages | 23 | 1.7% |
| Liberal Arts & History | 104 | 7.6% |
| Visual & Performing Arts | 24 | 1.8% |
| Communications | 25 | 1.8% |
| Arts & Humanities | 181 | 13.2% |
| Total | 1,370 | 100.0% |
Transportation & Commute in North Bellport
Vehicle Availability by Sex in North Bellport
The most prevalent vehicle ownership categories in North Bellport are males with 2 vehicles (1,164, accounting for 41.7%) and females with 2 vehicles (989, making up 51.5%).
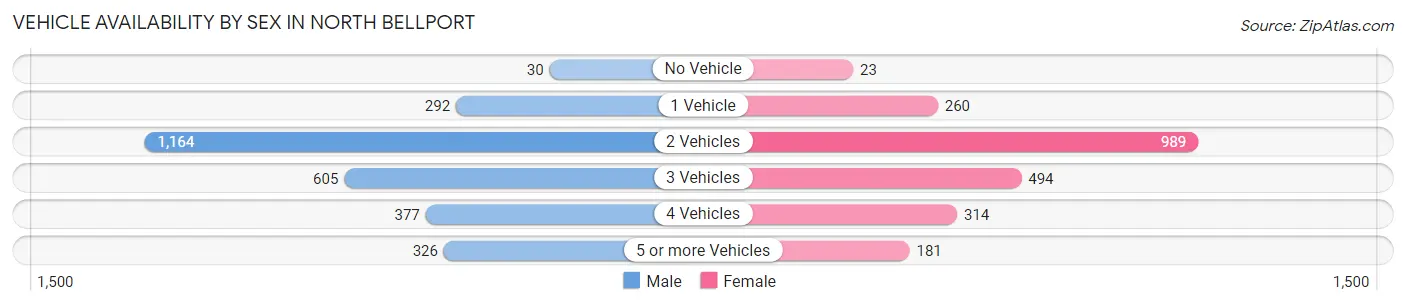
| Vehicles Available | Male | Female |
| No Vehicle | 30 (1.1%) | 23 (1.0%) |
| 1 Vehicle | 292 (10.4%) | 260 (11.5%) |
| 2 Vehicles | 1,164 (41.7%) | 989 (43.7%) |
| 3 Vehicles | 605 (21.6%) | 494 (21.8%) |
| 4 Vehicles | 377 (13.5%) | 314 (13.9%) |
| 5 or more Vehicles | 326 (11.7%) | 181 (8.0%) |
| Total | 2,794 (100.0%) | 2,261 (100.0%) |
Commute Time in North Bellport
The most frequently occuring commute durations in North Bellport are 30 to 34 minutes (1,128 commuters, 23.5%), 20 to 24 minutes (662 commuters, 13.8%), and 15 to 19 minutes (621 commuters, 13.0%).
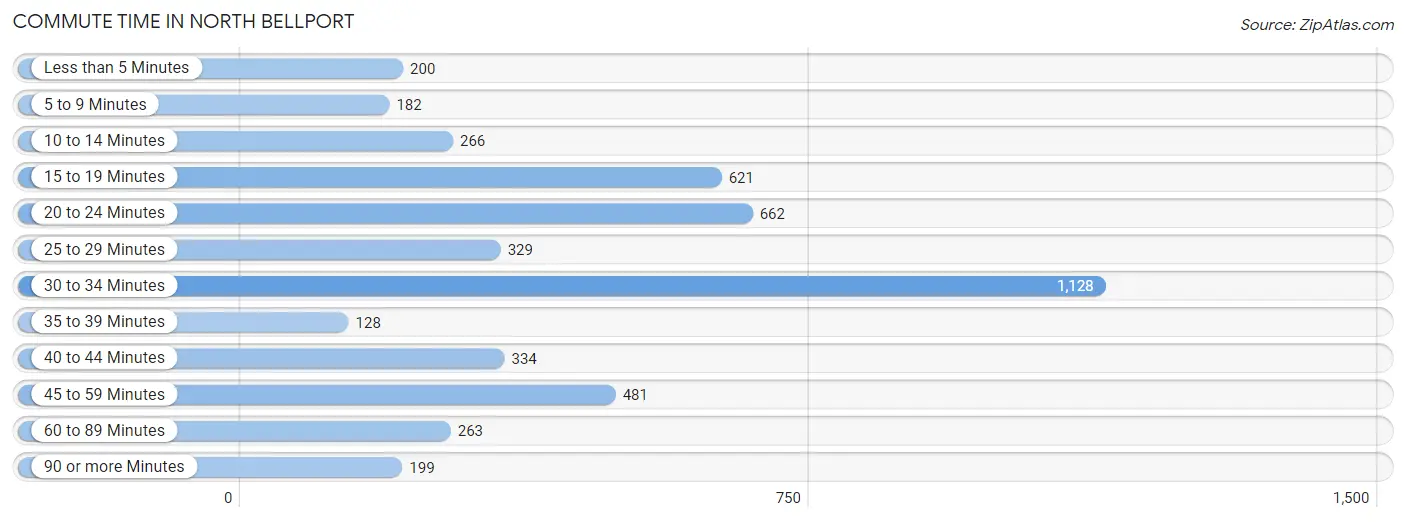
| Commute Time | # Commuters | % Commuters |
| Less than 5 Minutes | 200 | 4.2% |
| 5 to 9 Minutes | 182 | 3.8% |
| 10 to 14 Minutes | 266 | 5.6% |
| 15 to 19 Minutes | 621 | 13.0% |
| 20 to 24 Minutes | 662 | 13.8% |
| 25 to 29 Minutes | 329 | 6.9% |
| 30 to 34 Minutes | 1,128 | 23.5% |
| 35 to 39 Minutes | 128 | 2.7% |
| 40 to 44 Minutes | 334 | 7.0% |
| 45 to 59 Minutes | 481 | 10.0% |
| 60 to 89 Minutes | 263 | 5.5% |
| 90 or more Minutes | 199 | 4.2% |
Commute Time by Sex in North Bellport
The most common commute times in North Bellport are 30 to 34 minutes (756 commuters, 28.1%) for males and 30 to 34 minutes (372 commuters, 17.7%) for females.
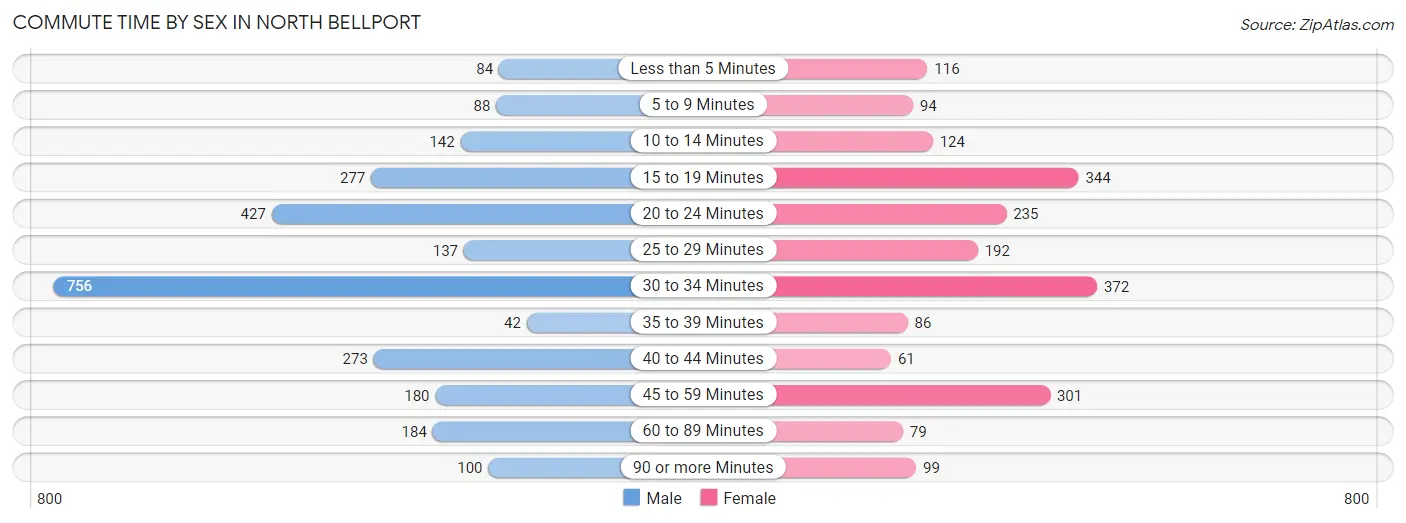
| Commute Time | Male | Female |
| Less than 5 Minutes | 84 (3.1%) | 116 (5.5%) |
| 5 to 9 Minutes | 88 (3.3%) | 94 (4.5%) |
| 10 to 14 Minutes | 142 (5.3%) | 124 (5.9%) |
| 15 to 19 Minutes | 277 (10.3%) | 344 (16.4%) |
| 20 to 24 Minutes | 427 (15.9%) | 235 (11.2%) |
| 25 to 29 Minutes | 137 (5.1%) | 192 (9.1%) |
| 30 to 34 Minutes | 756 (28.1%) | 372 (17.7%) |
| 35 to 39 Minutes | 42 (1.6%) | 86 (4.1%) |
| 40 to 44 Minutes | 273 (10.2%) | 61 (2.9%) |
| 45 to 59 Minutes | 180 (6.7%) | 301 (14.3%) |
| 60 to 89 Minutes | 184 (6.8%) | 79 (3.8%) |
| 90 or more Minutes | 100 (3.7%) | 99 (4.7%) |
Time of Departure to Work by Sex in North Bellport
The most frequent times of departure to work in North Bellport are 7:00 AM to 7:29 AM (444, 16.5%) for males and 8:00 AM to 8:29 AM (428, 20.3%) for females.
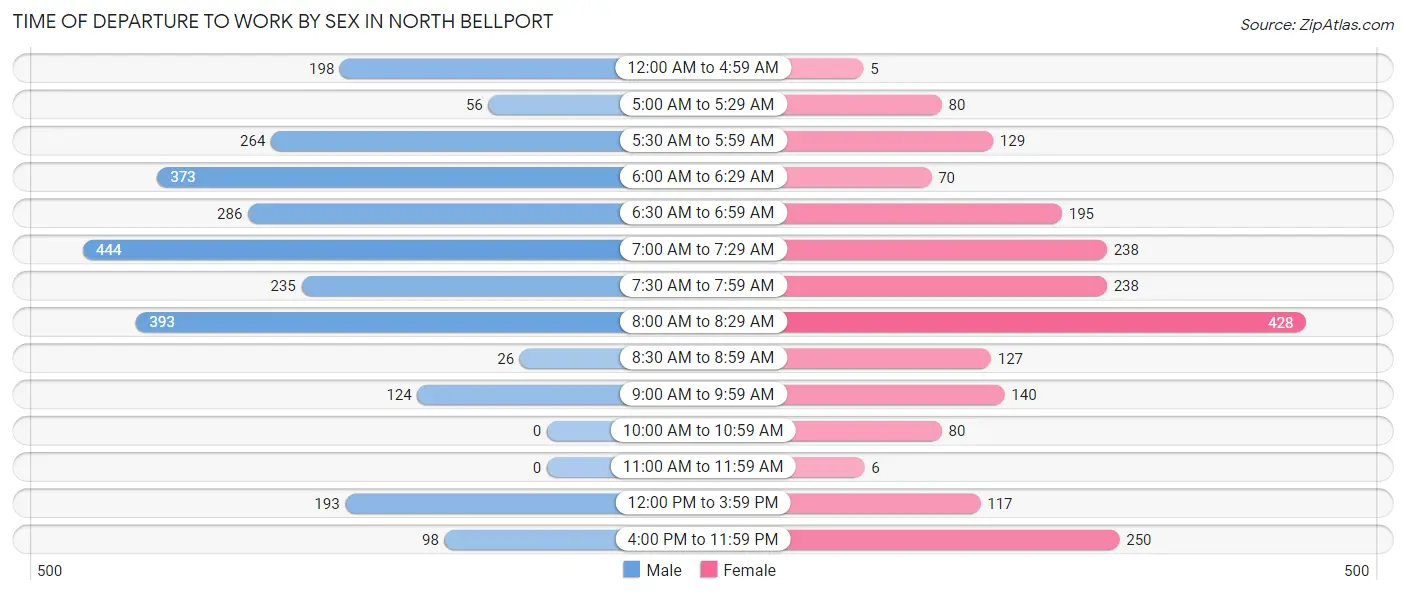
| Time of Departure | Male | Female |
| 12:00 AM to 4:59 AM | 198 (7.4%) | 5 (0.2%) |
| 5:00 AM to 5:29 AM | 56 (2.1%) | 80 (3.8%) |
| 5:30 AM to 5:59 AM | 264 (9.8%) | 129 (6.1%) |
| 6:00 AM to 6:29 AM | 373 (13.9%) | 70 (3.3%) |
| 6:30 AM to 6:59 AM | 286 (10.6%) | 195 (9.3%) |
| 7:00 AM to 7:29 AM | 444 (16.5%) | 238 (11.3%) |
| 7:30 AM to 7:59 AM | 235 (8.7%) | 238 (11.3%) |
| 8:00 AM to 8:29 AM | 393 (14.6%) | 428 (20.3%) |
| 8:30 AM to 8:59 AM | 26 (1.0%) | 127 (6.0%) |
| 9:00 AM to 9:59 AM | 124 (4.6%) | 140 (6.7%) |
| 10:00 AM to 10:59 AM | 0 (0.0%) | 80 (3.8%) |
| 11:00 AM to 11:59 AM | 0 (0.0%) | 6 (0.3%) |
| 12:00 PM to 3:59 PM | 193 (7.2%) | 117 (5.6%) |
| 4:00 PM to 11:59 PM | 98 (3.6%) | 250 (11.9%) |
| Total | 2,690 (100.0%) | 2,103 (100.0%) |
Housing Occupancy in North Bellport
Occupancy by Ownership in North Bellport
Of the total 3,253 dwellings in North Bellport, owner-occupied units account for 2,044 (62.8%), while renter-occupied units make up 1,209 (37.2%).
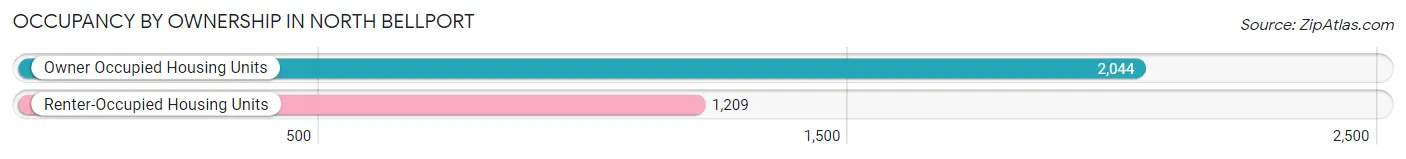
| Occupancy | # Housing Units | % Housing Units |
| Owner Occupied Housing Units | 2,044 | 62.8% |
| Renter-Occupied Housing Units | 1,209 | 37.2% |
| Total Occupied Housing Units | 3,253 | 100.0% |
Occupancy by Household Size in North Bellport
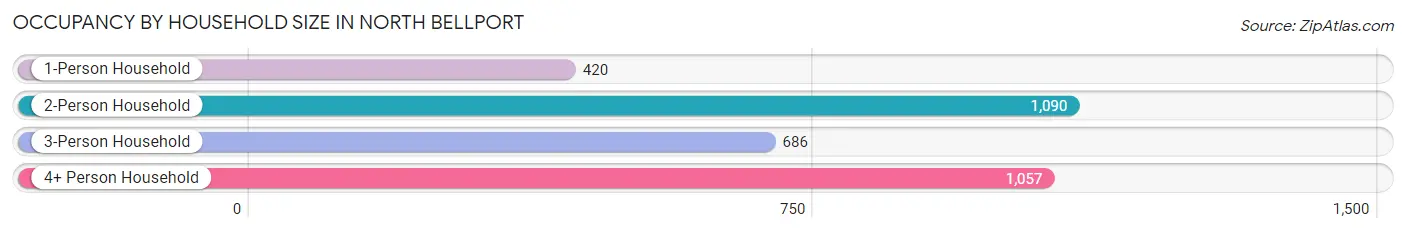
| Household Size | # Housing Units | % Housing Units |
| 1-Person Household | 420 | 12.9% |
| 2-Person Household | 1,090 | 33.5% |
| 3-Person Household | 686 | 21.1% |
| 4+ Person Household | 1,057 | 32.5% |
| Total Housing Units | 3,253 | 100.0% |
Occupancy by Ownership by Household Size in North Bellport
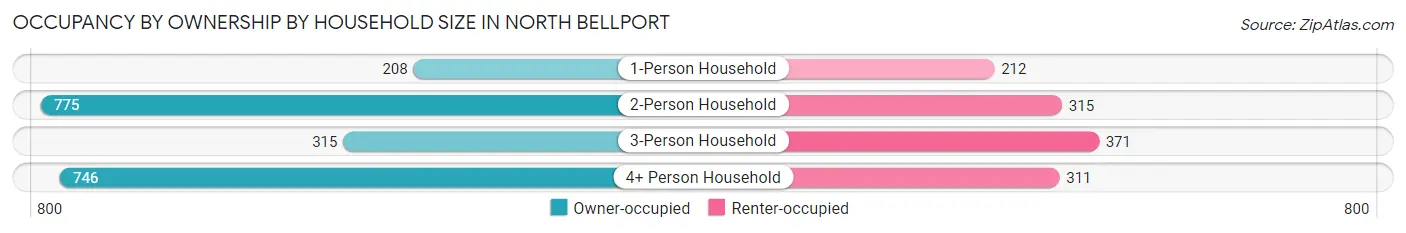
| Household Size | Owner-occupied | Renter-occupied |
| 1-Person Household | 208 (49.5%) | 212 (50.5%) |
| 2-Person Household | 775 (71.1%) | 315 (28.9%) |
| 3-Person Household | 315 (45.9%) | 371 (54.1%) |
| 4+ Person Household | 746 (70.6%) | 311 (29.4%) |
| Total Housing Units | 2,044 (62.8%) | 1,209 (37.2%) |
Occupancy by Educational Attainment in North Bellport
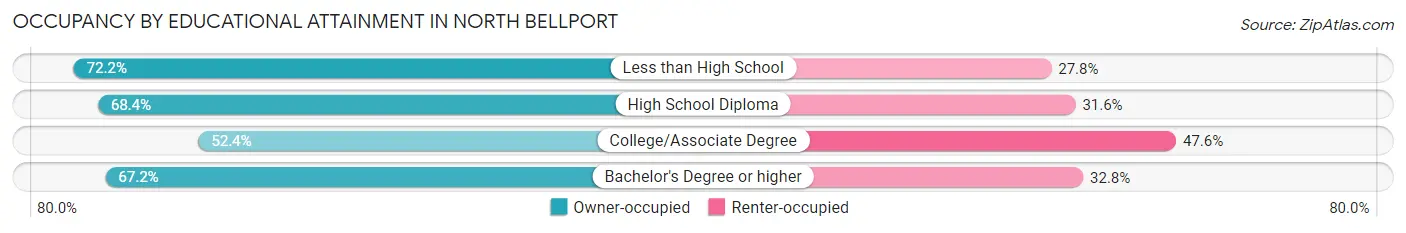
| Household Size | Owner-occupied | Renter-occupied |
| Less than High School | 377 (72.2%) | 145 (27.8%) |
| High School Diploma | 636 (68.4%) | 294 (31.6%) |
| College/Associate Degree | 636 (52.4%) | 577 (47.6%) |
| Bachelor's Degree or higher | 395 (67.2%) | 193 (32.8%) |
Occupancy by Age of Householder in North Bellport
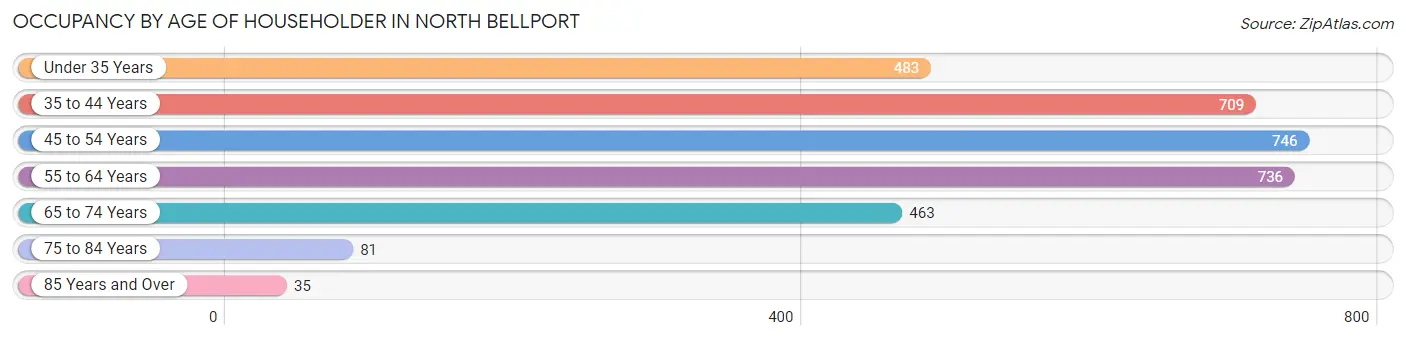
| Age Bracket | # Households | % Households |
| Under 35 Years | 483 | 14.8% |
| 35 to 44 Years | 709 | 21.8% |
| 45 to 54 Years | 746 | 22.9% |
| 55 to 64 Years | 736 | 22.6% |
| 65 to 74 Years | 463 | 14.2% |
| 75 to 84 Years | 81 | 2.5% |
| 85 Years and Over | 35 | 1.1% |
| Total | 3,253 | 100.0% |
Housing Finances in North Bellport
Median Income by Occupancy in North Bellport
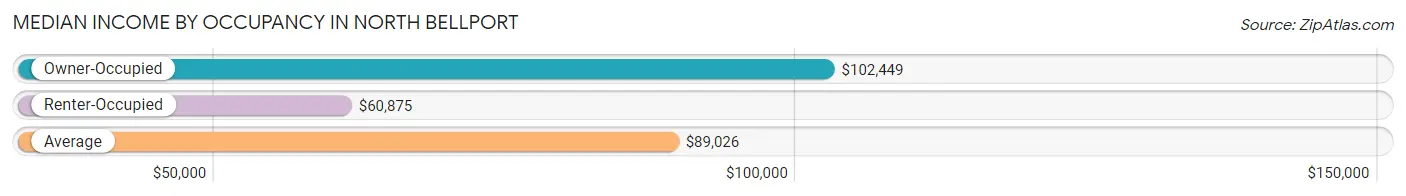
| Occupancy Type | # Households | Median Income |
| Owner-Occupied | 2,044 (62.8%) | $102,449 |
| Renter-Occupied | 1,209 (37.2%) | $60,875 |
| Average | 3,253 (100.0%) | $89,026 |
Occupancy by Householder Income Bracket in North Bellport
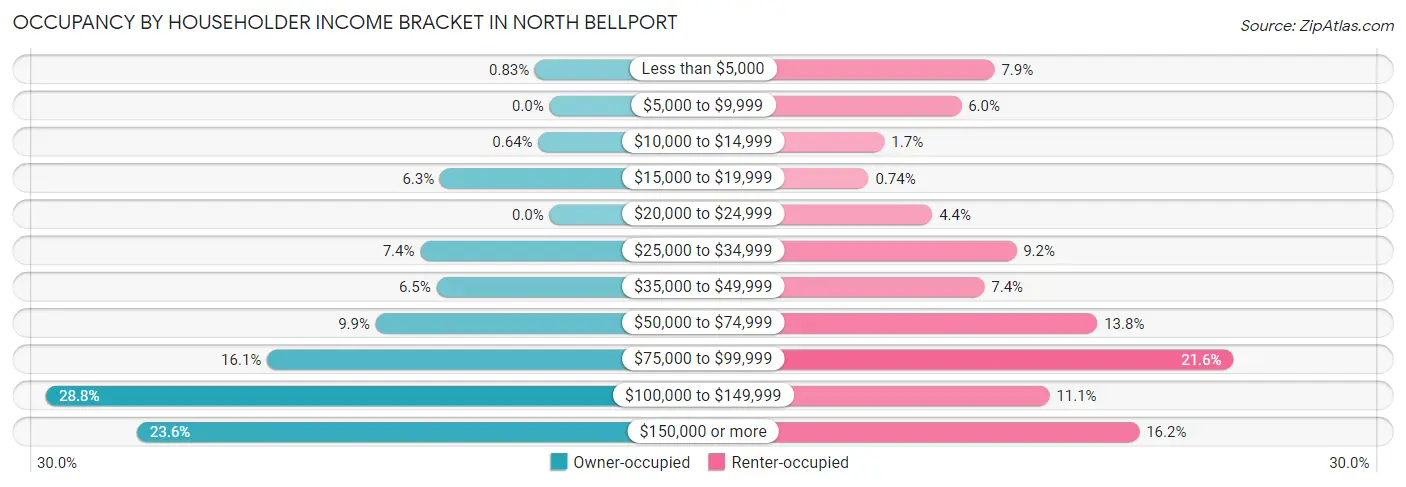
| Income Bracket | Owner-occupied | Renter-occupied |
| Less than $5,000 | 17 (0.8%) | 96 (7.9%) |
| $5,000 to $9,999 | 0 (0.0%) | 73 (6.0%) |
| $10,000 to $14,999 | 13 (0.6%) | 20 (1.7%) |
| $15,000 to $19,999 | 128 (6.3%) | 9 (0.7%) |
| $20,000 to $24,999 | 0 (0.0%) | 53 (4.4%) |
| $25,000 to $34,999 | 151 (7.4%) | 111 (9.2%) |
| $35,000 to $49,999 | 132 (6.5%) | 89 (7.4%) |
| $50,000 to $74,999 | 203 (9.9%) | 167 (13.8%) |
| $75,000 to $99,999 | 330 (16.1%) | 261 (21.6%) |
| $100,000 to $149,999 | 588 (28.8%) | 134 (11.1%) |
| $150,000 or more | 482 (23.6%) | 196 (16.2%) |
| Total | 2,044 (100.0%) | 1,209 (100.0%) |
Monthly Housing Cost Tiers in North Bellport
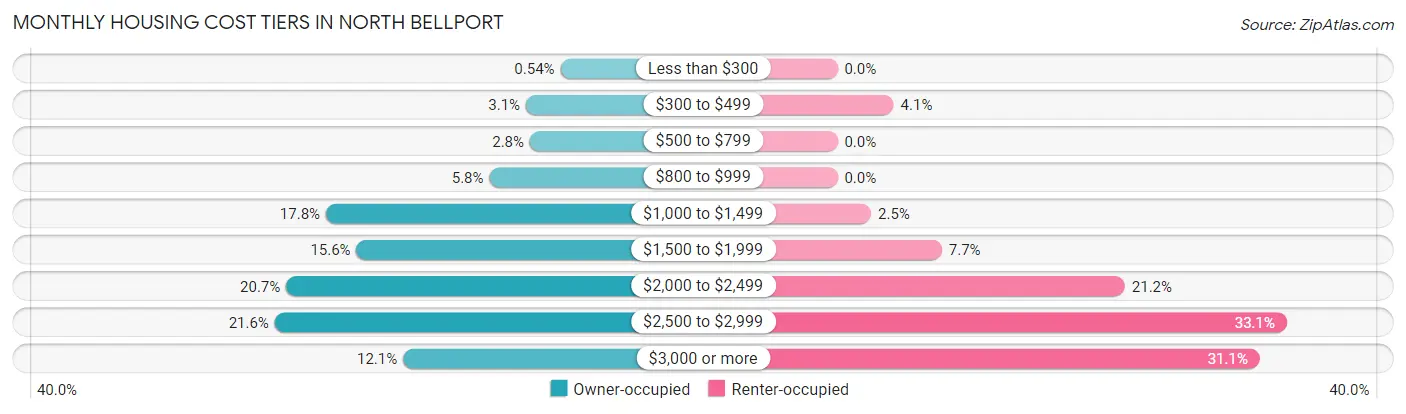
| Monthly Cost | Owner-occupied | Renter-occupied |
| Less than $300 | 11 (0.5%) | 0 (0.0%) |
| $300 to $499 | 63 (3.1%) | 50 (4.1%) |
| $500 to $799 | 57 (2.8%) | 0 (0.0%) |
| $800 to $999 | 118 (5.8%) | 0 (0.0%) |
| $1,000 to $1,499 | 364 (17.8%) | 30 (2.5%) |
| $1,500 to $1,999 | 318 (15.6%) | 93 (7.7%) |
| $2,000 to $2,499 | 424 (20.7%) | 256 (21.2%) |
| $2,500 to $2,999 | 441 (21.6%) | 400 (33.1%) |
| $3,000 or more | 248 (12.1%) | 376 (31.1%) |
| Total | 2,044 (100.0%) | 1,209 (100.0%) |
Physical Housing Characteristics in North Bellport
Housing Structures in North Bellport
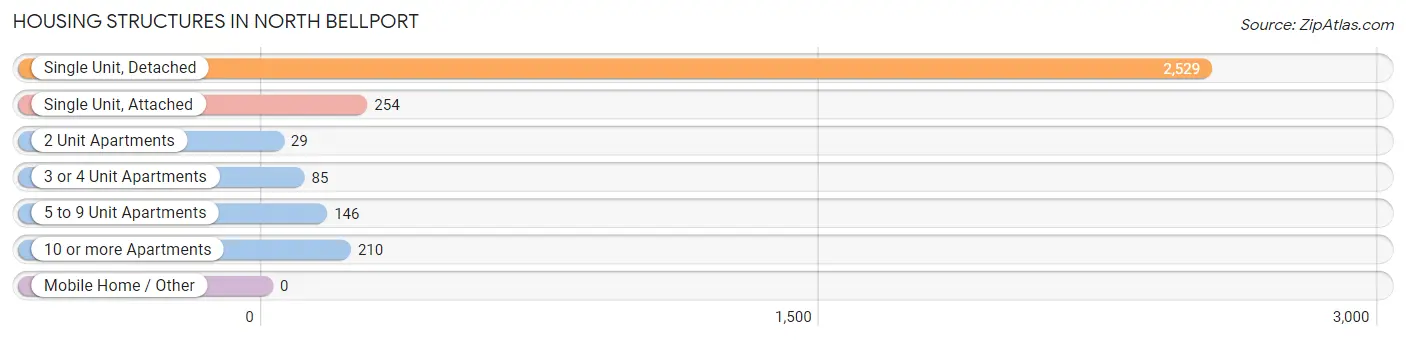
| Structure Type | # Housing Units | % Housing Units |
| Single Unit, Detached | 2,529 | 77.7% |
| Single Unit, Attached | 254 | 7.8% |
| 2 Unit Apartments | 29 | 0.9% |
| 3 or 4 Unit Apartments | 85 | 2.6% |
| 5 to 9 Unit Apartments | 146 | 4.5% |
| 10 or more Apartments | 210 | 6.5% |
| Mobile Home / Other | 0 | 0.0% |
| Total | 3,253 | 100.0% |
Housing Structures by Occupancy in North Bellport
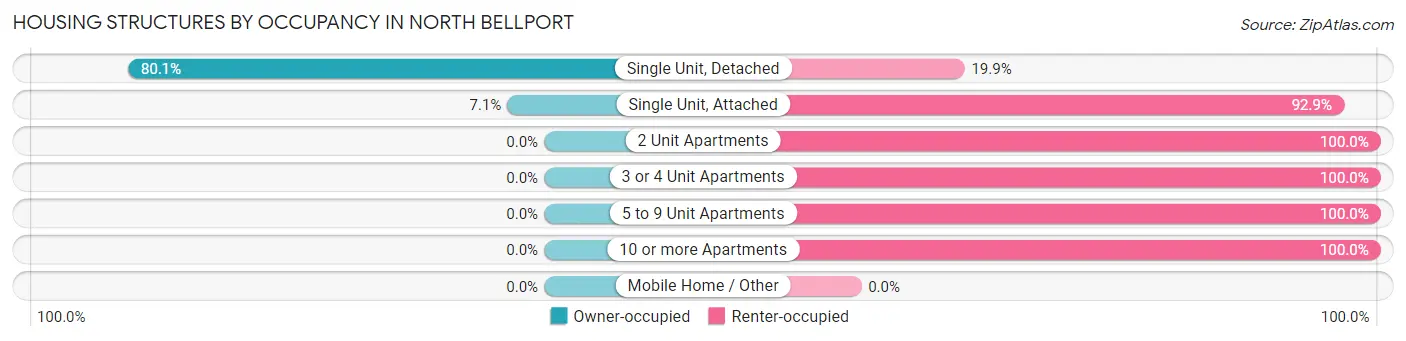
| Structure Type | Owner-occupied | Renter-occupied |
| Single Unit, Detached | 2,026 (80.1%) | 503 (19.9%) |
| Single Unit, Attached | 18 (7.1%) | 236 (92.9%) |
| 2 Unit Apartments | 0 (0.0%) | 29 (100.0%) |
| 3 or 4 Unit Apartments | 0 (0.0%) | 85 (100.0%) |
| 5 to 9 Unit Apartments | 0 (0.0%) | 146 (100.0%) |
| 10 or more Apartments | 0 (0.0%) | 210 (100.0%) |
| Mobile Home / Other | 0 (0.0%) | 0 (0.0%) |
| Total | 2,044 (62.8%) | 1,209 (37.2%) |
Housing Structures by Number of Rooms in North Bellport
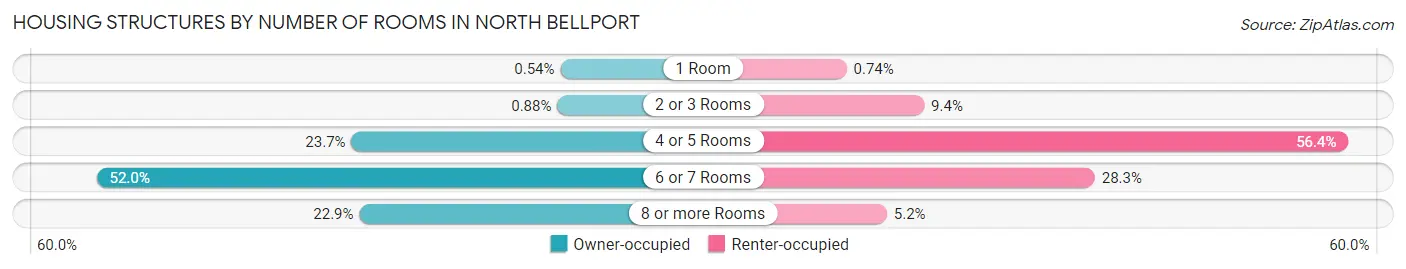
| Number of Rooms | Owner-occupied | Renter-occupied |
| 1 Room | 11 (0.5%) | 9 (0.7%) |
| 2 or 3 Rooms | 18 (0.9%) | 113 (9.3%) |
| 4 or 5 Rooms | 485 (23.7%) | 682 (56.4%) |
| 6 or 7 Rooms | 1,063 (52.0%) | 342 (28.3%) |
| 8 or more Rooms | 467 (22.9%) | 63 (5.2%) |
| Total | 2,044 (100.0%) | 1,209 (100.0%) |
Housing Structure by Heating Type in North Bellport
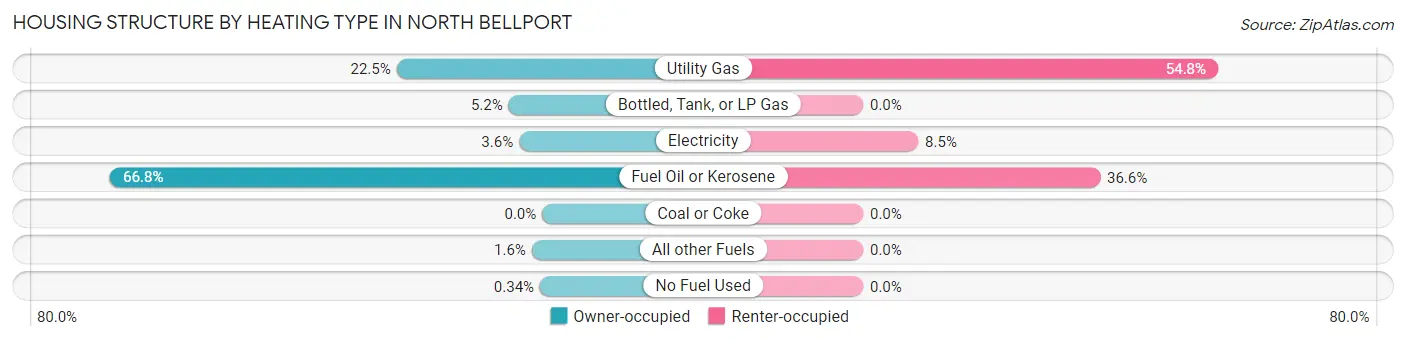
| Heating Type | Owner-occupied | Renter-occupied |
| Utility Gas | 460 (22.5%) | 663 (54.8%) |
| Bottled, Tank, or LP Gas | 106 (5.2%) | 0 (0.0%) |
| Electricity | 73 (3.6%) | 103 (8.5%) |
| Fuel Oil or Kerosene | 1,365 (66.8%) | 443 (36.6%) |
| Coal or Coke | 0 (0.0%) | 0 (0.0%) |
| All other Fuels | 33 (1.6%) | 0 (0.0%) |
| No Fuel Used | 7 (0.3%) | 0 (0.0%) |
| Total | 2,044 (100.0%) | 1,209 (100.0%) |
Household Vehicle Usage in North Bellport
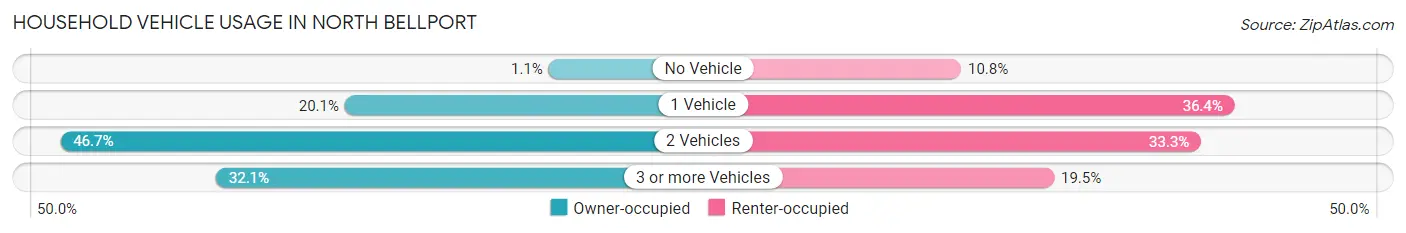
| Vehicles per Household | Owner-occupied | Renter-occupied |
| No Vehicle | 22 (1.1%) | 131 (10.8%) |
| 1 Vehicle | 411 (20.1%) | 440 (36.4%) |
| 2 Vehicles | 954 (46.7%) | 402 (33.3%) |
| 3 or more Vehicles | 657 (32.1%) | 236 (19.5%) |
| Total | 2,044 (100.0%) | 1,209 (100.0%) |
Real Estate & Mortgages in North Bellport
Real Estate and Mortgage Overview in North Bellport
| Characteristic | Without Mortgage | With Mortgage |
| Housing Units | 582 | 1,462 |
| Median Property Value | $347,700 | $359,300 |
| Median Household Income | $66,250 | $431 |
| Monthly Housing Costs | $1,088 | $248 |
| Real Estate Taxes | $7,034 | $24 |
Property Value by Mortgage Status in North Bellport
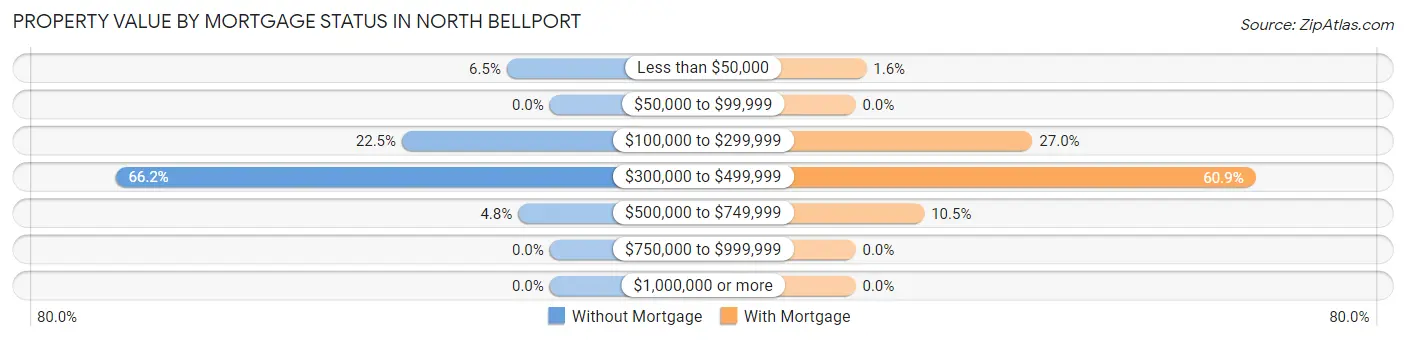
| Property Value | Without Mortgage | With Mortgage |
| Less than $50,000 | 38 (6.5%) | 24 (1.6%) |
| $50,000 to $99,999 | 0 (0.0%) | 0 (0.0%) |
| $100,000 to $299,999 | 131 (22.5%) | 394 (27.0%) |
| $300,000 to $499,999 | 385 (66.1%) | 891 (60.9%) |
| $500,000 to $749,999 | 28 (4.8%) | 153 (10.5%) |
| $750,000 to $999,999 | 0 (0.0%) | 0 (0.0%) |
| $1,000,000 or more | 0 (0.0%) | 0 (0.0%) |
| Total | 582 (100.0%) | 1,462 (100.0%) |
Household Income by Mortgage Status in North Bellport
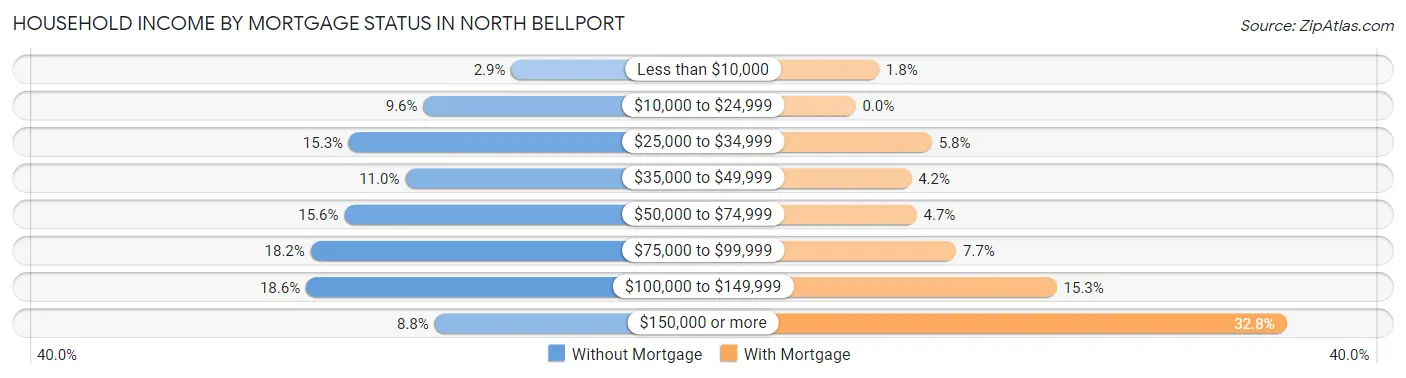
| Household Income | Without Mortgage | With Mortgage |
| Less than $10,000 | 17 (2.9%) | 26 (1.8%) |
| $10,000 to $24,999 | 56 (9.6%) | 0 (0.0%) |
| $25,000 to $34,999 | 89 (15.3%) | 85 (5.8%) |
| $35,000 to $49,999 | 64 (11.0%) | 62 (4.2%) |
| $50,000 to $74,999 | 91 (15.6%) | 68 (4.6%) |
| $75,000 to $99,999 | 106 (18.2%) | 112 (7.7%) |
| $100,000 to $149,999 | 108 (18.6%) | 224 (15.3%) |
| $150,000 or more | 51 (8.8%) | 480 (32.8%) |
| Total | 582 (100.0%) | 1,462 (100.0%) |
Property Value to Household Income Ratio in North Bellport
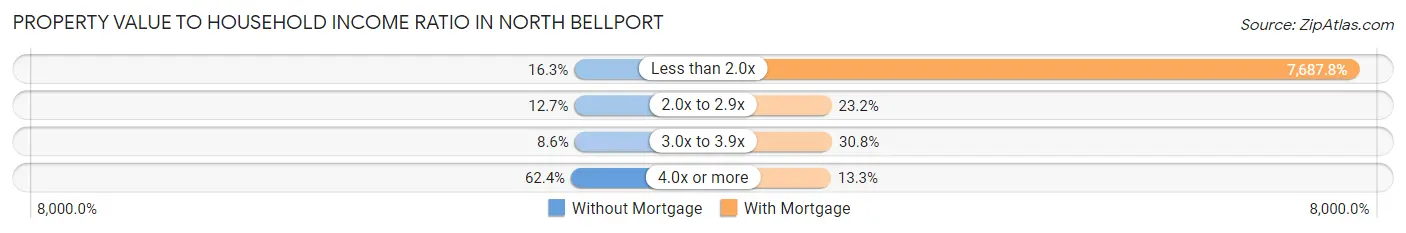
| Value-to-Income Ratio | Without Mortgage | With Mortgage |
| Less than 2.0x | 95 (16.3%) | 112,395 (7,687.8%) |
| 2.0x to 2.9x | 74 (12.7%) | 339 (23.2%) |
| 3.0x to 3.9x | 50 (8.6%) | 450 (30.8%) |
| 4.0x or more | 363 (62.4%) | 195 (13.3%) |
| Total | 582 (100.0%) | 1,462 (100.0%) |
Real Estate Taxes by Mortgage Status in North Bellport
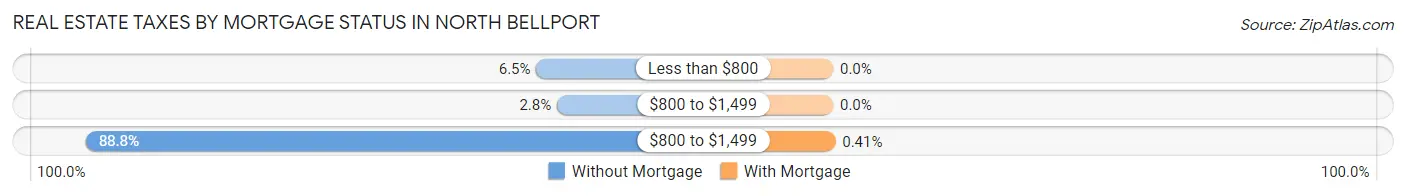
| Property Taxes | Without Mortgage | With Mortgage |
| Less than $800 | 38 (6.5%) | 0 (0.0%) |
| $800 to $1,499 | 16 (2.8%) | 0 (0.0%) |
| $800 to $1,499 | 517 (88.8%) | 6 (0.4%) |
| Total | 582 (100.0%) | 1,462 (100.0%) |
Health & Disability in North Bellport
Health Insurance Coverage by Age in North Bellport
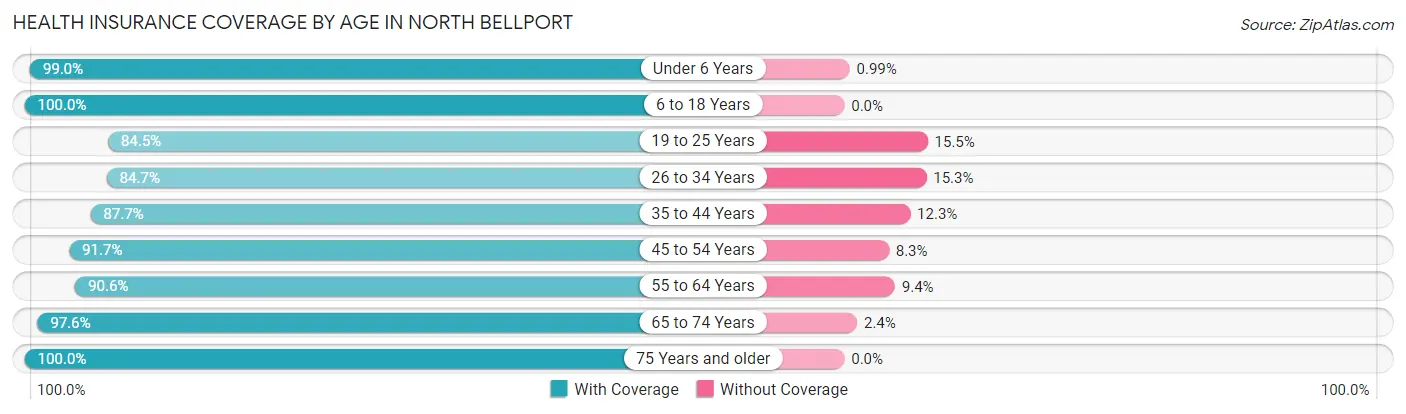
| Age Bracket | With Coverage | Without Coverage |
| Under 6 Years | 798 (99.0%) | 8 (1.0%) |
| 6 to 18 Years | 1,754 (100.0%) | 0 (0.0%) |
| 19 to 25 Years | 1,223 (84.5%) | 225 (15.5%) |
| 26 to 34 Years | 1,224 (84.7%) | 221 (15.3%) |
| 35 to 44 Years | 1,200 (87.7%) | 168 (12.3%) |
| 45 to 54 Years | 1,239 (91.7%) | 112 (8.3%) |
| 55 to 64 Years | 1,133 (90.6%) | 118 (9.4%) |
| 65 to 74 Years | 860 (97.6%) | 21 (2.4%) |
| 75 Years and older | 226 (100.0%) | 0 (0.0%) |
| Total | 9,657 (91.7%) | 873 (8.3%) |
Health Insurance Coverage by Citizenship Status in North Bellport
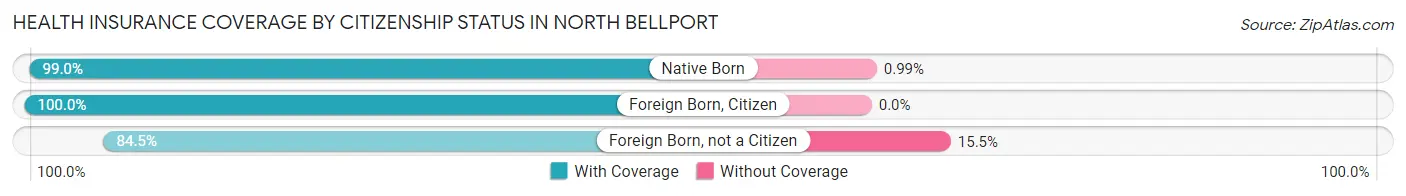
| Citizenship Status | With Coverage | Without Coverage |
| Native Born | 798 (99.0%) | 8 (1.0%) |
| Foreign Born, Citizen | 1,754 (100.0%) | 0 (0.0%) |
| Foreign Born, not a Citizen | 1,223 (84.5%) | 225 (15.5%) |
Health Insurance Coverage by Household Income in North Bellport

| Household Income | With Coverage | Without Coverage |
| Under $25,000 | 1,086 (94.6%) | 62 (5.4%) |
| $25,000 to $49,999 | 1,417 (96.0%) | 59 (4.0%) |
| $50,000 to $74,999 | 884 (88.1%) | 119 (11.9%) |
| $75,000 to $99,999 | 2,013 (95.3%) | 99 (4.7%) |
| $100,000 and over | 4,239 (88.8%) | 534 (11.2%) |
Public vs Private Health Insurance Coverage by Age in North Bellport
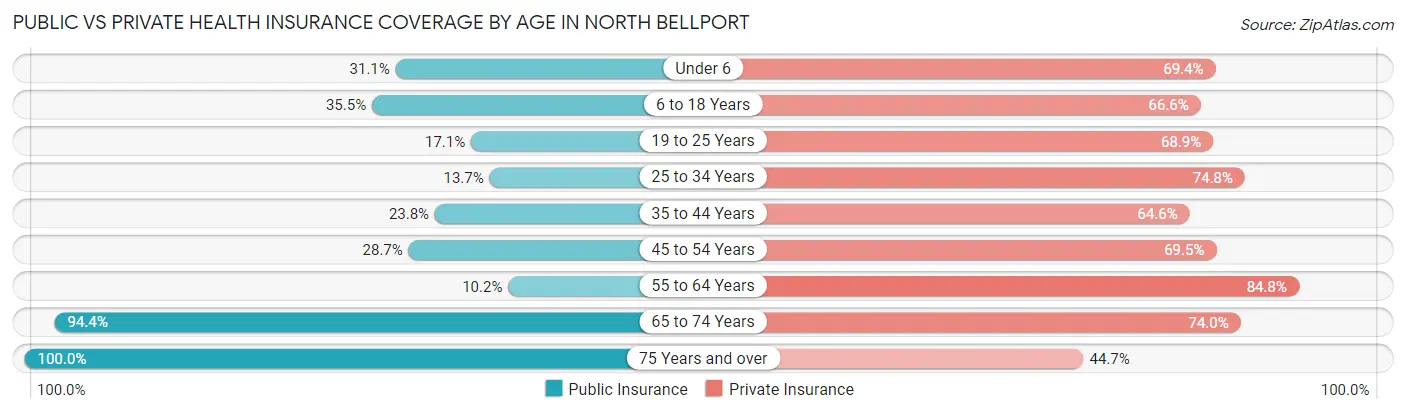
| Age Bracket | Public Insurance | Private Insurance |
| Under 6 | 251 (31.1%) | 559 (69.4%) |
| 6 to 18 Years | 623 (35.5%) | 1,168 (66.6%) |
| 19 to 25 Years | 248 (17.1%) | 998 (68.9%) |
| 25 to 34 Years | 198 (13.7%) | 1,081 (74.8%) |
| 35 to 44 Years | 326 (23.8%) | 883 (64.5%) |
| 45 to 54 Years | 388 (28.7%) | 939 (69.5%) |
| 55 to 64 Years | 128 (10.2%) | 1,061 (84.8%) |
| 65 to 74 Years | 832 (94.4%) | 652 (74.0%) |
| 75 Years and over | 226 (100.0%) | 101 (44.7%) |
| Total | 3,220 (30.6%) | 7,442 (70.7%) |
Disability Status by Sex by Age in North Bellport
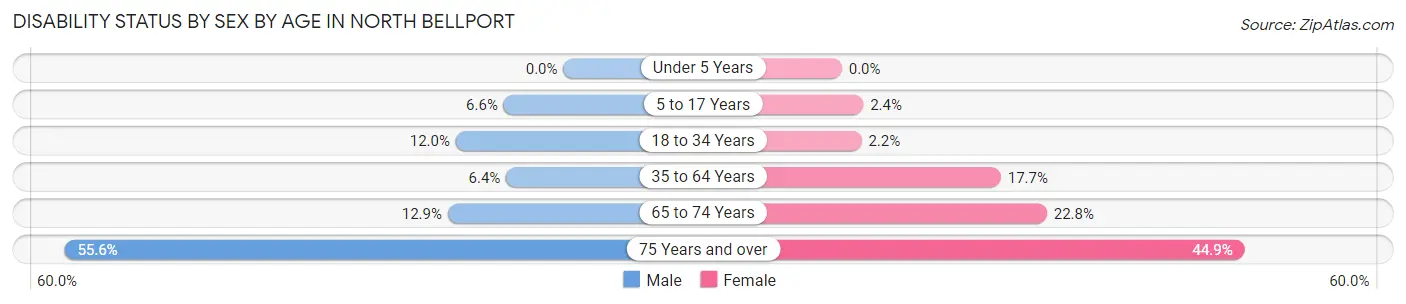
| Age Bracket | Male | Female |
| Under 5 Years | 0 (0.0%) | 0 (0.0%) |
| 5 to 17 Years | 52 (6.6%) | 24 (2.4%) |
| 18 to 34 Years | 164 (12.0%) | 36 (2.2%) |
| 35 to 64 Years | 135 (6.4%) | 328 (17.7%) |
| 65 to 74 Years | 57 (12.9%) | 100 (22.8%) |
| 75 Years and over | 50 (55.6%) | 61 (44.9%) |
Disability Class by Sex by Age in North Bellport
Disability Class: Hearing Difficulty
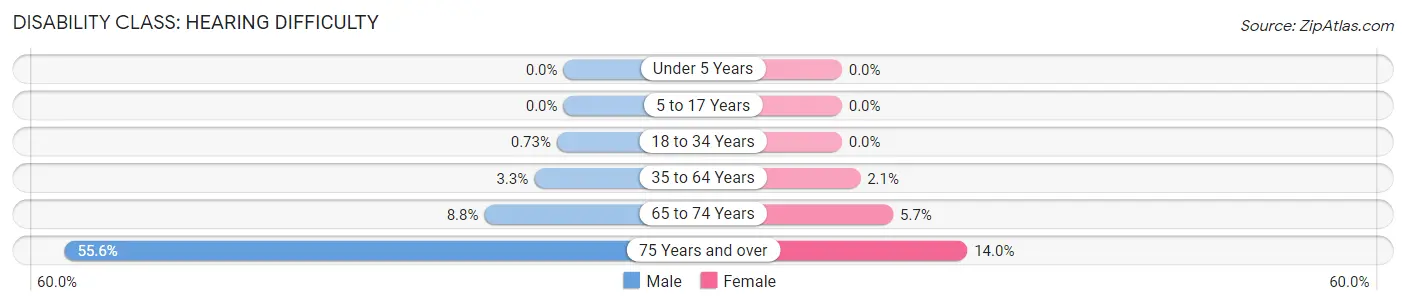
| Age Bracket | Male | Female |
| Under 5 Years | 0 (0.0%) | 0 (0.0%) |
| 5 to 17 Years | 0 (0.0%) | 0 (0.0%) |
| 18 to 34 Years | 10 (0.7%) | 0 (0.0%) |
| 35 to 64 Years | 69 (3.3%) | 38 (2.1%) |
| 65 to 74 Years | 39 (8.8%) | 25 (5.7%) |
| 75 Years and over | 50 (55.6%) | 19 (14.0%) |
Disability Class: Vision Difficulty
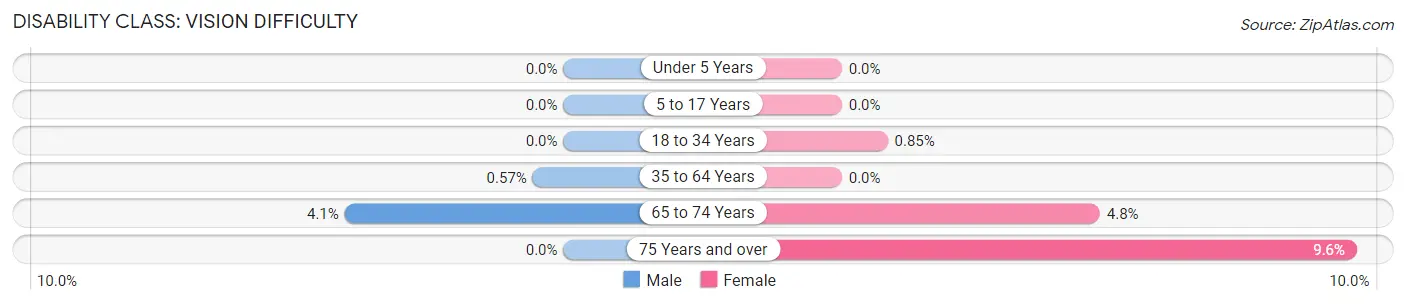
| Age Bracket | Male | Female |
| Under 5 Years | 0 (0.0%) | 0 (0.0%) |
| 5 to 17 Years | 0 (0.0%) | 0 (0.0%) |
| 18 to 34 Years | 0 (0.0%) | 14 (0.9%) |
| 35 to 64 Years | 12 (0.6%) | 0 (0.0%) |
| 65 to 74 Years | 18 (4.1%) | 21 (4.8%) |
| 75 Years and over | 0 (0.0%) | 13 (9.6%) |
Disability Class: Cognitive Difficulty
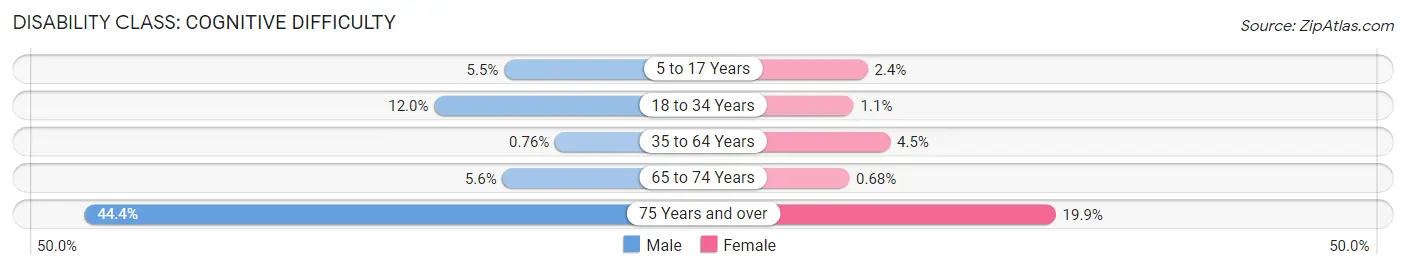
| Age Bracket | Male | Female |
| 5 to 17 Years | 43 (5.5%) | 24 (2.4%) |
| 18 to 34 Years | 164 (12.0%) | 18 (1.1%) |
| 35 to 64 Years | 16 (0.8%) | 83 (4.5%) |
| 65 to 74 Years | 25 (5.6%) | 3 (0.7%) |
| 75 Years and over | 40 (44.4%) | 27 (19.9%) |
Disability Class: Ambulatory Difficulty
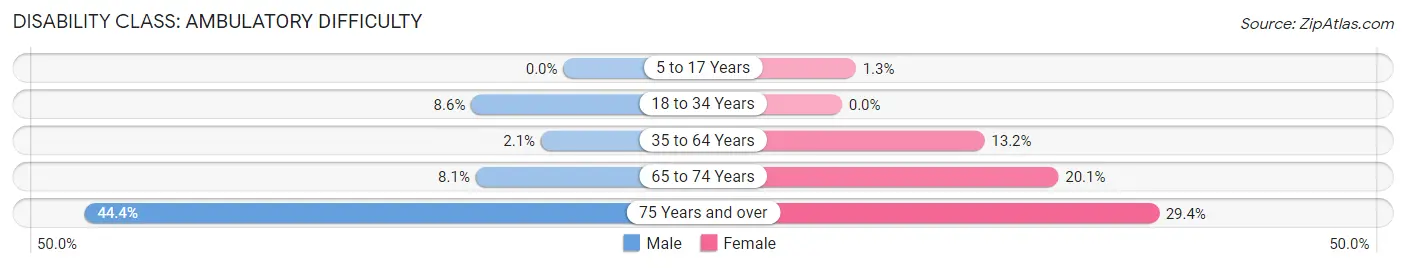
| Age Bracket | Male | Female |
| 5 to 17 Years | 0 (0.0%) | 13 (1.3%) |
| 18 to 34 Years | 117 (8.6%) | 0 (0.0%) |
| 35 to 64 Years | 44 (2.1%) | 245 (13.2%) |
| 65 to 74 Years | 36 (8.1%) | 88 (20.1%) |
| 75 Years and over | 40 (44.4%) | 40 (29.4%) |
Disability Class: Self-Care Difficulty
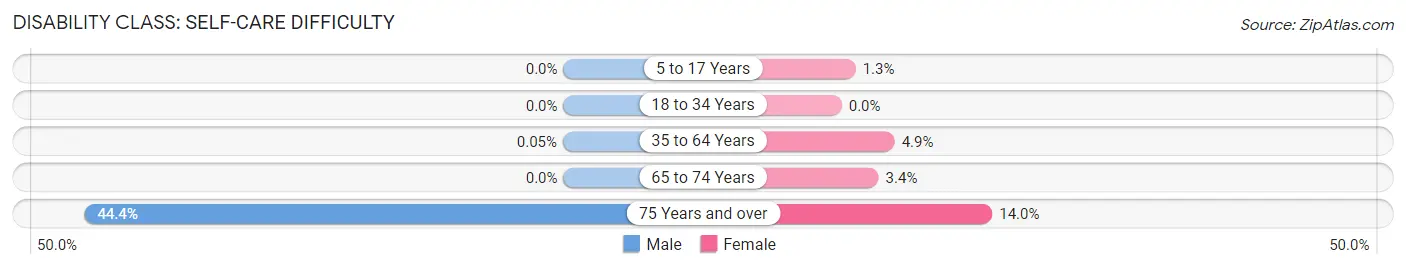
| Age Bracket | Male | Female |
| 5 to 17 Years | 0 (0.0%) | 13 (1.3%) |
| 18 to 34 Years | 0 (0.0%) | 0 (0.0%) |
| 35 to 64 Years | 1 (0.1%) | 91 (4.9%) |
| 65 to 74 Years | 0 (0.0%) | 15 (3.4%) |
| 75 Years and over | 40 (44.4%) | 19 (14.0%) |
Technology Access in North Bellport
Computing Device Access in North Bellport
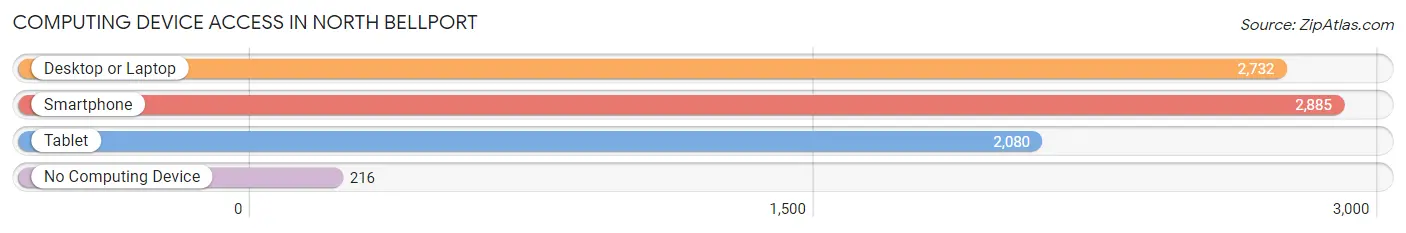
| Device Type | # Households | % Households |
| Desktop or Laptop | 2,732 | 84.0% |
| Smartphone | 2,885 | 88.7% |
| Tablet | 2,080 | 63.9% |
| No Computing Device | 216 | 6.6% |
| Total | 3,253 | 100.0% |
Internet Access in North Bellport
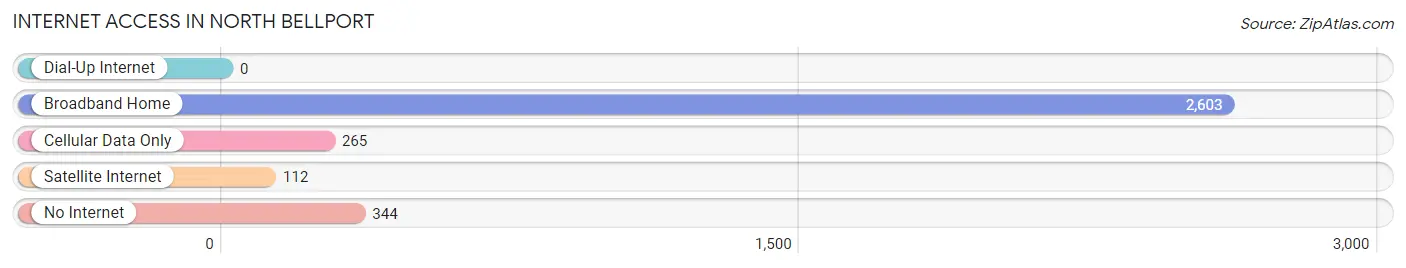
| Internet Type | # Households | % Households |
| Dial-Up Internet | 0 | 0.0% |
| Broadband Home | 2,603 | 80.0% |
| Cellular Data Only | 265 | 8.2% |
| Satellite Internet | 112 | 3.4% |
| No Internet | 344 | 10.6% |
| Total | 3,253 | 100.0% |
North Bellport Summary
Bellport is a hamlet located in the Town of Brookhaven in Suffolk County, New York. It is situated on the south shore of Long Island, approximately 60 miles east of New York City. The hamlet is bordered by East Patchogue to the west, Brookhaven to the north, and the Great South Bay to the south.
History
The area that is now Bellport was originally inhabited by the Secatogue Indians, a sub-tribe of the larger Montaukett tribe. The Secatogue Indians were a peaceful people who lived off the land, fishing, hunting, and gathering shellfish. The first European settlers arrived in the area in the late 1600s, and the hamlet was officially established in 1739.
The hamlet was originally known as Fireplace, due to the abundance of fireplaces in the area. In 1829, the hamlet was renamed Bellport after the Bell family, who had purchased a large tract of land in the area. The Bell family built a large estate, which is now known as the Bellport Country Club.
Geography
Bellport is located on the south shore of Long Island, approximately 60 miles east of New York City. The hamlet is bordered by East Patchogue to the west, Brookhaven to the north, and the Great South Bay to the south. The hamlet is situated on a peninsula, with the Great South Bay to the south and east, and the Patchogue River to the west.
The hamlet has a total area of 2.2 square miles, all of which is land. The terrain is mostly flat, with some rolling hills. The highest point in the hamlet is approximately 50 feet above sea level.
Economy
The economy of Bellport is largely based on tourism and retail. The hamlet is home to several popular restaurants, bars, and shops, as well as a number of marinas and boatyards. The Bellport Country Club is also a popular destination for golfers and other visitors.
The hamlet is also home to several light industrial and manufacturing businesses, as well as a number of professional services firms. The hamlet is also home to a number of small businesses, including a number of art galleries, antique stores, and specialty shops.
Demographics
As of the 2010 census, the population of Bellport was 6,846. The population is predominantly white (90.2%), with a small percentage of African Americans (3.2%), Hispanics (2.7%), and Asians (2.2%). The median household income is $77,917, and the median home value is $400,000.
The hamlet is served by the South Country Central School District, which includes four elementary schools, one middle school, and one high school. The hamlet is also home to several private schools, including the Bellport Academy and the Bellport Montessori School.
Conclusion
Bellport is a hamlet located in the Town of Brookhaven in Suffolk County, New York. It is situated on the south shore of Long Island, approximately 60 miles east of New York City. The hamlet is bordered by East Patchogue to the west, Brookhaven to the north, and the Great South Bay to the south. The hamlet was originally inhabited by the Secatogue Indians, and was officially established in 1739. The economy of Bellport is largely based on tourism and retail, and the population is predominantly white. The hamlet is served by the South Country Central School District, and is home to several private schools.
Common Questions
What is Per Capita Income in North Bellport?
Per Capita income in North Bellport is $33,002.
What is the Median Family Income in North Bellport?
Median Family Income in North Bellport is $87,946.
What is the Median Household income in North Bellport?
Median Household Income in North Bellport is $89,026.
What is Income or Wage Gap in North Bellport?
Income or Wage Gap in North Bellport is 24.7%.
Women in North Bellport earn 75.3 cents for every dollar earned by a man.
What is Family Income Deficit in North Bellport?
Family Income Deficit in North Bellport is $10,580.
Families that are below poverty line in North Bellport earn $10,580 less on average than the poverty threshold level.
What is Inequality or Gini Index in North Bellport?
Inequality or Gini Index in North Bellport is 0.40.
What is the Total Population of North Bellport?
Total Population of North Bellport is 10,530.
What is the Total Male Population of North Bellport?
Total Male Population of North Bellport is 5,176.
What is the Total Female Population of North Bellport?
Total Female Population of North Bellport is 5,354.
What is the Ratio of Males per 100 Females in North Bellport?
There are 96.68 Males per 100 Females in North Bellport.
What is the Ratio of Females per 100 Males in North Bellport?
There are 103.44 Females per 100 Males in North Bellport.
What is the Median Population Age in North Bellport?
Median Population Age in North Bellport is 33.9 Years.
What is the Average Family Size in North Bellport
Average Family Size in North Bellport is 3.5 People.
What is the Average Household Size in North Bellport
Average Household Size in North Bellport is 3.2 People.
How Large is the Labor Force in North Bellport?
There are 5,582 People in the Labor Forcein in North Bellport.
What is the Percentage of People in the Labor Force in North Bellport?
67.0% of People are in the Labor Force in North Bellport.
What is the Unemployment Rate in North Bellport?
Unemployment Rate in North Bellport is 7.8%.