New York, NY Map & Demographics
New York Map
New York Overview
$48,066
PER CAPITA INCOME
$86,984
AVG FAMILY INCOME
$76,607
AVG HOUSEHOLD INCOME
14.7%
WAGE / INCOME GAP [ % ]
85.3¢/ $1
WAGE / INCOME GAP [ $ ]
$11,079
FAMILY INCOME DEFICIT
0.55
INEQUALITY / GINI INDEX
8,622,467
TOTAL POPULATION
4,148,719
MALE POPULATION
4,473,748
FEMALE POPULATION
92.73
MALES / 100 FEMALES
107.83
FEMALES / 100 MALES
37.5
MEDIAN AGE
3.3
AVG FAMILY SIZE
2.6
AVG HOUSEHOLD SIZE
4,447,787
LABOR FORCE [ PEOPLE ]
63.2%
PERCENT IN LABOR FORCE
7.6%
UNEMPLOYMENT RATE
New York Zip Codes
Income in New York
Income Overview in New York
Per Capita Income in New York is $48,066, while median incomes of families and households are $86,984 and $76,607 respectively.
| Characteristic | Number | Measure |
| Per Capita Income | 8,622,467 | $48,066 |
| Median Family Income | 1,930,996 | $86,984 |
| Mean Family Income | 1,930,996 | $138,569 |
| Median Household Income | 3,282,804 | $76,607 |
| Mean Household Income | 3,282,804 | $122,667 |
| Income Deficit | 1,930,996 | $11,079 |
| Wage / Income Gap (%) | 8,622,467 | 14.74% |
| Wage / Income Gap ($) | 8,622,467 | 85.26¢ per $1 |
| Gini / Inequality Index | 8,622,467 | 0.55 |
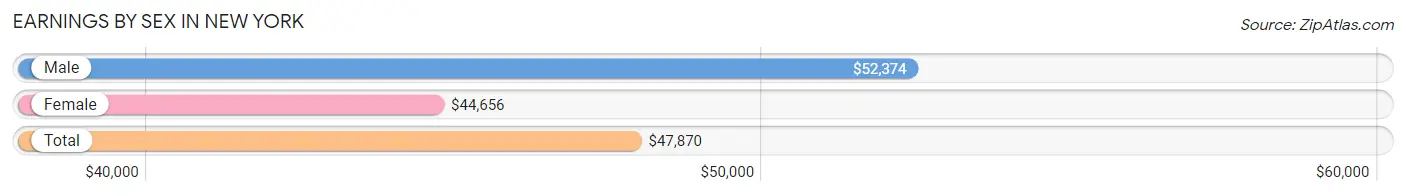
Earnings by Sex in New York
Average Earnings in New York are $47,870, $52,374 for men and $44,656 for women, a difference of 14.7%.
| Sex | Number | Average Earnings |
| Male | 2,287,002 (50.7%) | $52,374 |
| Female | 2,225,756 (49.3%) | $44,656 |
| Total | 4,512,758 (100.0%) | $47,870 |
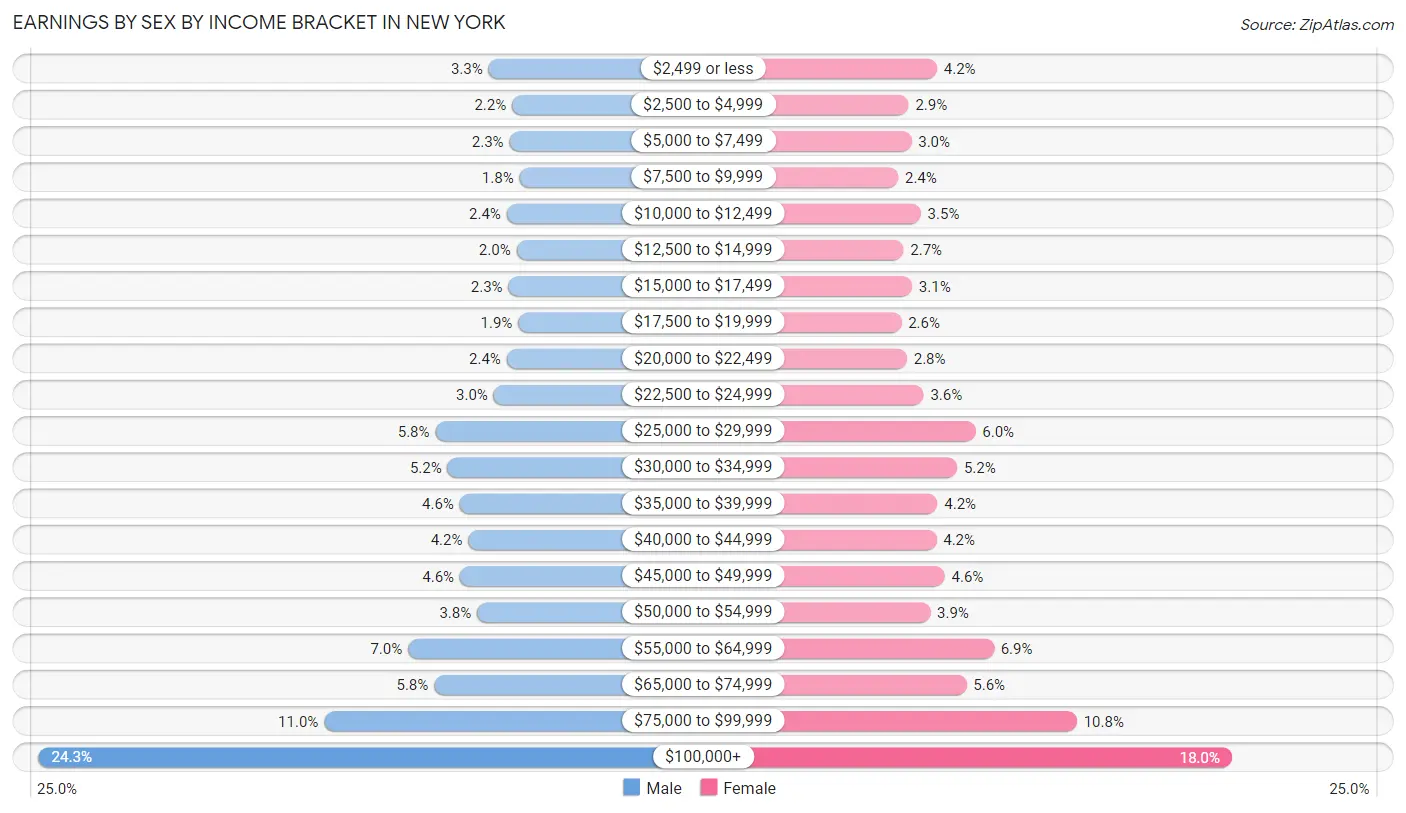
Earnings by Sex by Income Bracket in New York
The most common earnings brackets in New York are $100,000+ for men (556,612 | 24.3%) and $100,000+ for women (401,302 | 18.0%).
| Income | Male | Female |
| $2,499 or less | 74,840 (3.3%) | 93,875 (4.2%) |
| $2,500 to $4,999 | 49,556 (2.2%) | 64,398 (2.9%) |
| $5,000 to $7,499 | 52,419 (2.3%) | 67,246 (3.0%) |
| $7,500 to $9,999 | 41,681 (1.8%) | 53,406 (2.4%) |
| $10,000 to $12,499 | 55,451 (2.4%) | 76,931 (3.5%) |
| $12,500 to $14,999 | 44,737 (2.0%) | 59,029 (2.6%) |
| $15,000 to $17,499 | 53,486 (2.3%) | 67,848 (3.0%) |
| $17,500 to $19,999 | 42,974 (1.9%) | 56,728 (2.5%) |
| $20,000 to $22,499 | 55,275 (2.4%) | 62,455 (2.8%) |
| $22,500 to $24,999 | 69,292 (3.0%) | 79,903 (3.6%) |
| $25,000 to $29,999 | 131,814 (5.8%) | 133,932 (6.0%) |
| $30,000 to $34,999 | 118,741 (5.2%) | 114,885 (5.2%) |
| $35,000 to $39,999 | 105,710 (4.6%) | 94,483 (4.2%) |
| $40,000 to $44,999 | 96,570 (4.2%) | 93,309 (4.2%) |
| $45,000 to $49,999 | 105,487 (4.6%) | 101,896 (4.6%) |
| $50,000 to $54,999 | 87,233 (3.8%) | 86,752 (3.9%) |
| $55,000 to $64,999 | 161,072 (7.0%) | 153,185 (6.9%) |
| $65,000 to $74,999 | 133,083 (5.8%) | 124,566 (5.6%) |
| $75,000 to $99,999 | 250,969 (11.0%) | 239,627 (10.8%) |
| $100,000+ | 556,612 (24.3%) | 401,302 (18.0%) |
| Total | 2,287,002 (100.0%) | 2,225,756 (100.0%) |
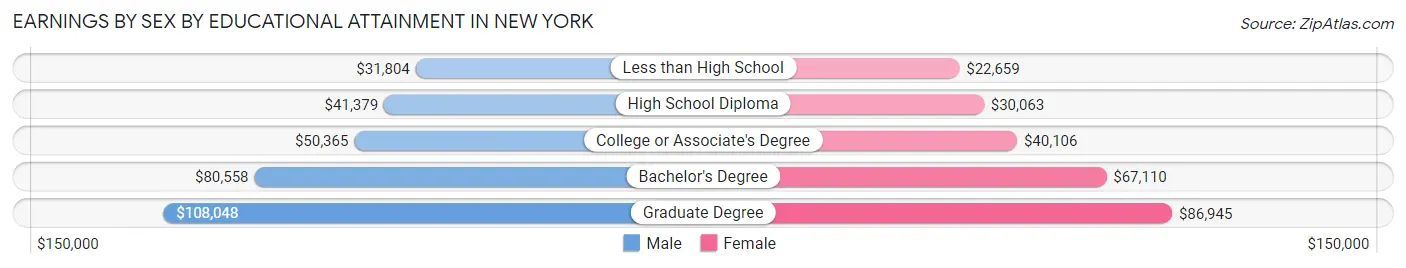
Earnings by Sex by Educational Attainment in New York
Average earnings in New York are $57,141 for men and $49,177 for women, a difference of 13.9%. Men with an educational attainment of graduate degree enjoy the highest average annual earnings of $108,048, while those with less than high school education earn the least with $31,804. Women with an educational attainment of graduate degree earn the most with the average annual earnings of $86,945, while those with less than high school education have the smallest earnings of $22,659.
| Educational Attainment | Male Income | Female Income |
| Less than High School | $31,804 | $22,659 |
| High School Diploma | $41,379 | $30,063 |
| College or Associate's Degree | $50,365 | $40,106 |
| Bachelor's Degree | $80,558 | $67,110 |
| Graduate Degree | $108,048 | $86,945 |
| Total | $57,141 | $49,177 |
Family Income in New York
Family Income Brackets in New York
According to the New York family income data, there are 347,579 families falling into the $200,000+ income range, which is the most common income bracket and makes up 18.0% of all families. Conversely, the $10,000 to $14,999 income bracket is the least frequent group with only 57,930 families (3.0%) belonging to this category.
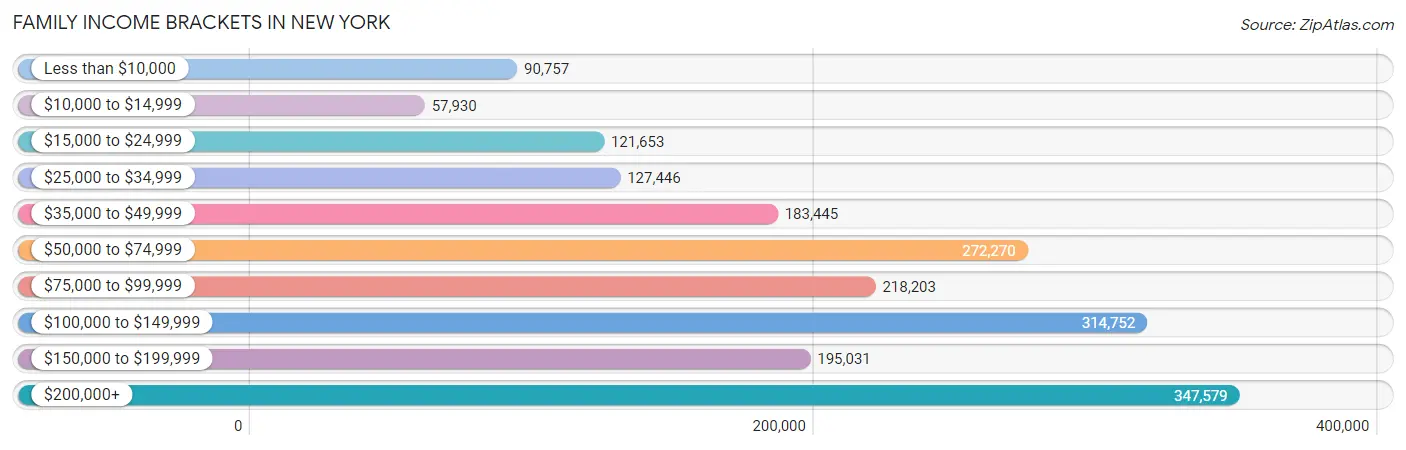
| Income Bracket | # Families | % Families |
| Less than $10,000 | 90,757 | 4.7% |
| $10,000 to $14,999 | 57,930 | 3.0% |
| $15,000 to $24,999 | 121,653 | 6.3% |
| $25,000 to $34,999 | 127,446 | 6.6% |
| $35,000 to $49,999 | 183,445 | 9.5% |
| $50,000 to $74,999 | 272,270 | 14.1% |
| $75,000 to $99,999 | 218,203 | 11.3% |
| $100,000 to $149,999 | 314,752 | 16.3% |
| $150,000 to $199,999 | 195,031 | 10.1% |
| $200,000+ | 347,579 | 18.0% |
Family Income by Famaliy Size in New York
7+ person families (52,352 | 2.7%) account for the highest median family income in New York with $117,541 per family, while 2-person families (790,285 | 40.9%) have the highest median income of $37,438 per family member.
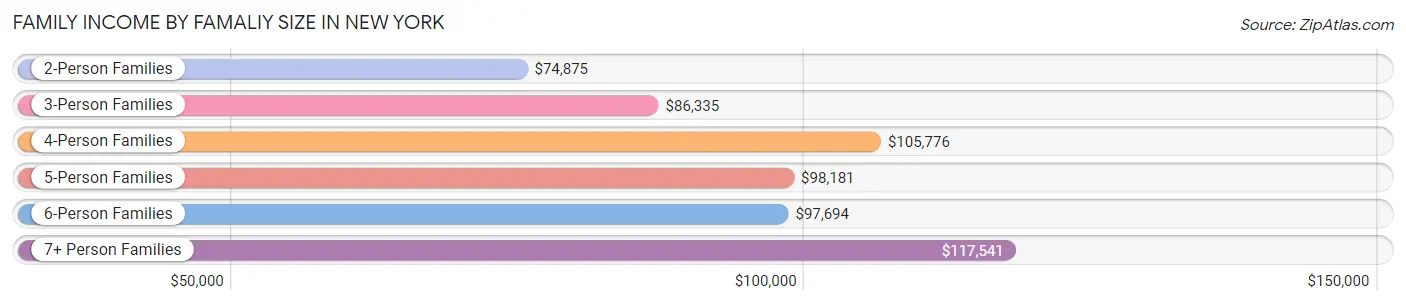
| Income Bracket | # Families | Median Income |
| 2-Person Families | 790,285 (40.9%) | $74,875 |
| 3-Person Families | 490,923 (25.4%) | $86,335 |
| 4-Person Families | 361,425 (18.7%) | $105,776 |
| 5-Person Families | 166,239 (8.6%) | $98,181 |
| 6-Person Families | 69,772 (3.6%) | $97,694 |
| 7+ Person Families | 52,352 (2.7%) | $117,541 |
| Total | 1,930,996 (100.0%) | $86,984 |
Family Income by Number of Earners in New York
The median family income in New York is $86,984, with families comprising 3+ earners (254,759) having the highest median family income of $145,592, while families with no earners (259,487) have the lowest median family income of $25,207, accounting for 13.2% and 13.4% of families, respectively.
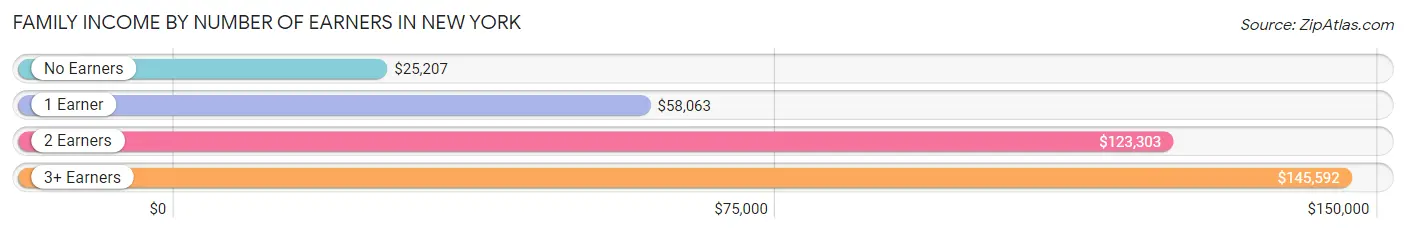
| Number of Earners | # Families | Median Income |
| No Earners | 259,487 (13.4%) | $25,207 |
| 1 Earner | 645,973 (33.5%) | $58,063 |
| 2 Earners | 770,777 (39.9%) | $123,303 |
| 3+ Earners | 254,759 (13.2%) | $145,592 |
| Total | 1,930,996 (100.0%) | $86,984 |
Household Income in New York
Household Income Brackets in New York
With 512,117 households falling in the category, the $200,000+ income range is the most frequent in New York, accounting for 15.6% of all households. In contrast, only 183,837 households (5.6%) fall into the $10,000 to $14,999 income bracket, making it the least populous group.
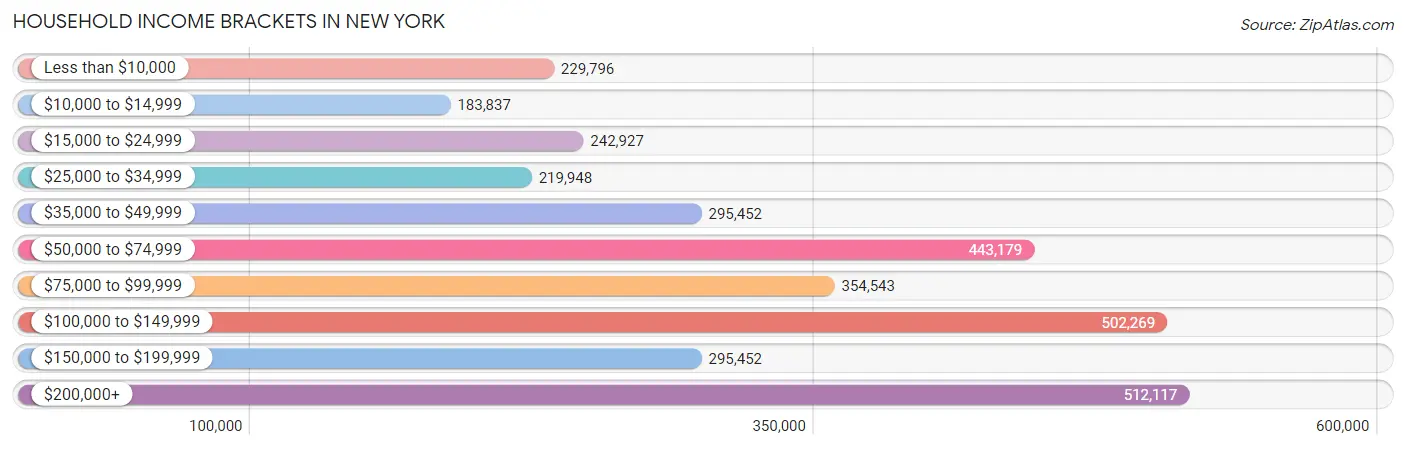
| Income Bracket | # Households | % Households |
| Less than $10,000 | 229,796 | 7.0% |
| $10,000 to $14,999 | 183,837 | 5.6% |
| $15,000 to $24,999 | 242,927 | 7.4% |
| $25,000 to $34,999 | 219,948 | 6.7% |
| $35,000 to $49,999 | 295,452 | 9.0% |
| $50,000 to $74,999 | 443,179 | 13.5% |
| $75,000 to $99,999 | 354,543 | 10.8% |
| $100,000 to $149,999 | 502,269 | 15.3% |
| $150,000 to $199,999 | 295,452 | 9.0% |
| $200,000+ | 512,117 | 15.6% |
Household Income by Householder Age in New York
The median household income in New York is $76,607, with the highest median household income of $95,324 found in the 25 to 44 years age bracket for the primary householder. A total of 1,180,277 households (35.9%) fall into this category. Meanwhile, the 65+ years age bracket for the primary householder has the lowest median household income of $46,949, with 821,078 households (25.0%) in this group.
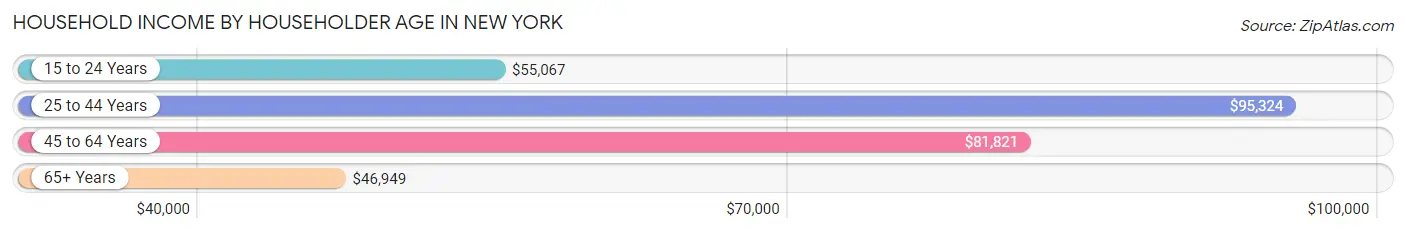
| Income Bracket | # Households | Median Income |
| 15 to 24 Years | 81,935 (2.5%) | $55,067 |
| 25 to 44 Years | 1,180,277 (35.9%) | $95,324 |
| 45 to 64 Years | 1,199,514 (36.5%) | $81,821 |
| 65+ Years | 821,078 (25.0%) | $46,949 |
| Total | 3,282,804 (100.0%) | $76,607 |
Poverty in New York
Income Below Poverty by Sex and Age in New York
With 15.8% poverty level for males and 18.5% for females among the residents of New York, 5 year old males and 6 to 11 year old females are the most vulnerable to poverty, with 12,019 males (25.7%) and 66,449 females (24.2%) in their respective age groups living below the poverty level.
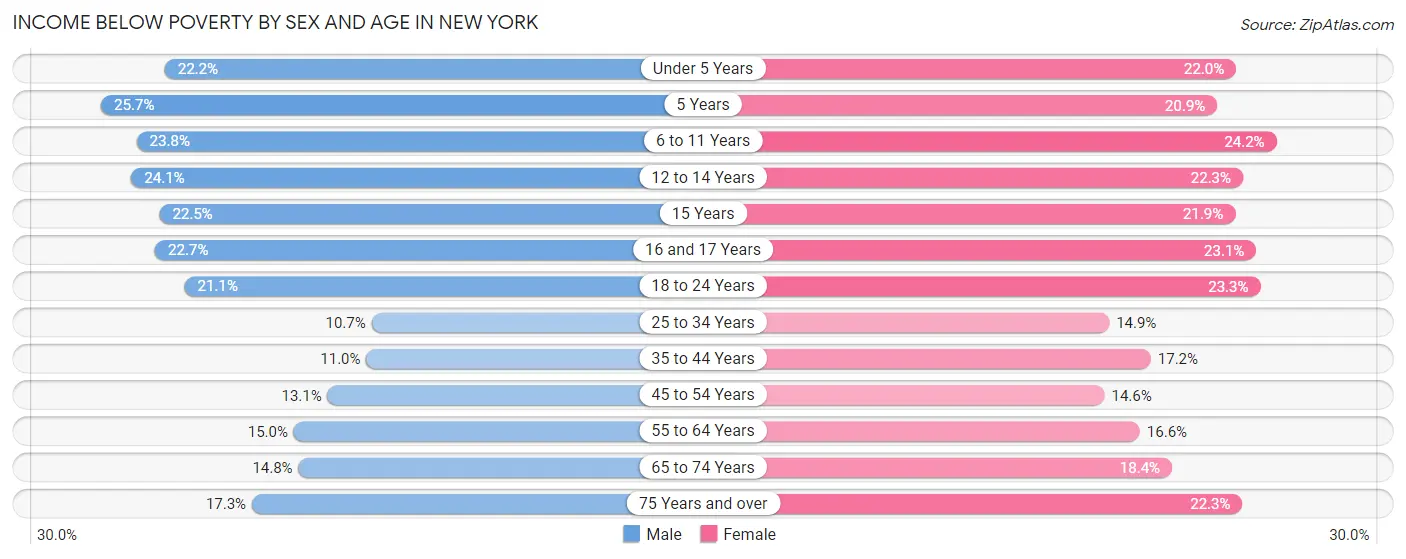
| Age Bracket | Male | Female |
| Under 5 Years | 57,808 (22.2%) | 54,466 (22.0%) |
| 5 Years | 12,019 (25.7%) | 9,636 (20.9%) |
| 6 to 11 Years | 68,817 (23.8%) | 66,449 (24.2%) |
| 12 to 14 Years | 36,625 (24.0%) | 32,333 (22.3%) |
| 15 Years | 10,892 (22.5%) | 9,770 (21.9%) |
| 16 and 17 Years | 21,416 (22.7%) | 21,279 (23.1%) |
| 18 to 24 Years | 70,107 (21.1%) | 79,320 (23.3%) |
| 25 to 34 Years | 77,087 (10.7%) | 111,874 (14.9%) |
| 35 to 44 Years | 64,250 (11.0%) | 103,799 (17.2%) |
| 45 to 54 Years | 68,110 (13.1%) | 80,516 (14.6%) |
| 55 to 64 Years | 73,777 (15.0%) | 90,822 (16.6%) |
| 65 to 74 Years | 49,217 (14.7%) | 77,066 (18.4%) |
| 75 Years and over | 36,006 (17.3%) | 76,147 (22.3%) |
| Total | 646,131 (15.8%) | 813,477 (18.5%) |
Income Above Poverty by Sex and Age in New York
According to the poverty statistics in New York, males aged 25 to 34 years and females aged 45 to 54 years are the age groups that are most secure financially, with 89.3% of males and 85.4% of females in these age groups living above the poverty line.
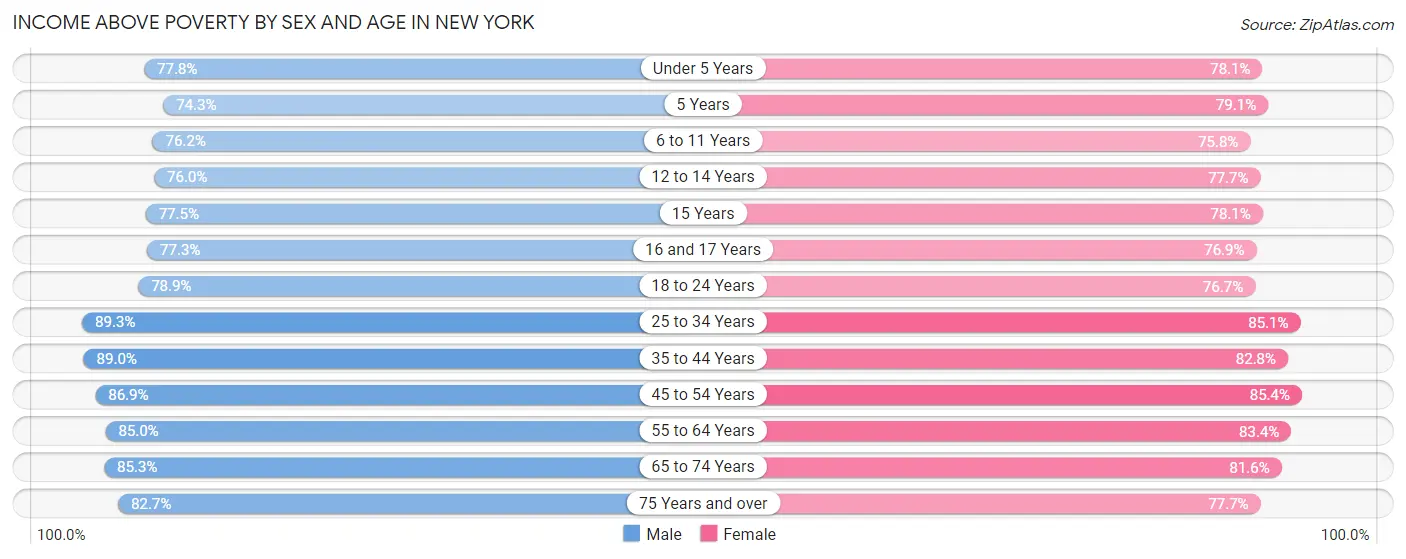
| Age Bracket | Male | Female |
| Under 5 Years | 202,683 (77.8%) | 193,678 (78.0%) |
| 5 Years | 34,668 (74.3%) | 36,473 (79.1%) |
| 6 to 11 Years | 220,813 (76.2%) | 208,127 (75.8%) |
| 12 to 14 Years | 115,675 (75.9%) | 112,469 (77.7%) |
| 15 Years | 37,542 (77.5%) | 34,851 (78.1%) |
| 16 and 17 Years | 72,805 (77.3%) | 70,943 (76.9%) |
| 18 to 24 Years | 262,272 (78.9%) | 261,110 (76.7%) |
| 25 to 34 Years | 644,578 (89.3%) | 639,705 (85.1%) |
| 35 to 44 Years | 521,467 (89.0%) | 499,453 (82.8%) |
| 45 to 54 Years | 450,445 (86.9%) | 469,983 (85.4%) |
| 55 to 64 Years | 417,805 (85.0%) | 456,220 (83.4%) |
| 65 to 74 Years | 284,372 (85.3%) | 342,212 (81.6%) |
| 75 Years and over | 171,627 (82.7%) | 265,391 (77.7%) |
| Total | 3,436,752 (84.2%) | 3,590,615 (81.5%) |
Income Below Poverty Among Married-Couple Families in New York
The poverty statistics for married-couple families in New York show that 8.3% or 98,954 of the total 1,189,789 families live below the poverty line. Families with 5 or more children have the highest poverty rate of 37.4%, comprising of 5,230 families. On the other hand, families with no children have the lowest poverty rate of 6.7%, which includes 44,655 families.
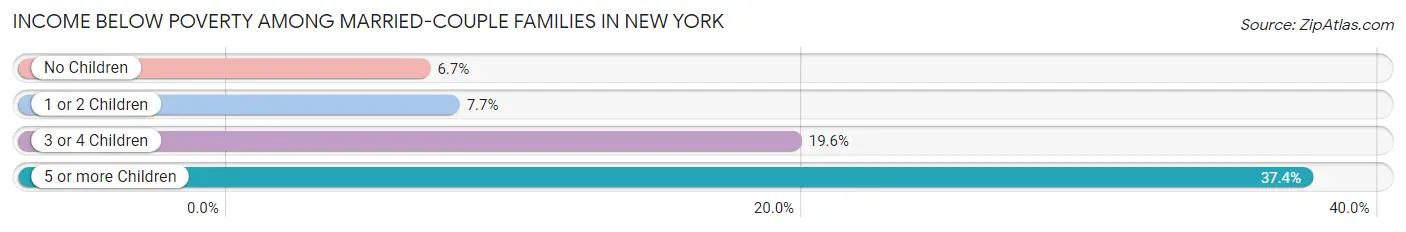
| Children | Above Poverty | Below Poverty |
| No Children | 621,669 (93.3%) | 44,655 (6.7%) |
| 1 or 2 Children | 394,859 (92.3%) | 33,055 (7.7%) |
| 3 or 4 Children | 65,561 (80.4%) | 16,014 (19.6%) |
| 5 or more Children | 8,746 (62.6%) | 5,230 (37.4%) |
| Total | 1,090,835 (91.7%) | 98,954 (8.3%) |
Income Below Poverty Among Single-Parent Households in New York
According to the poverty data in New York, 13.5% or 24,651 single-father households and 24.7% or 138,163 single-mother households are living below the poverty line. Among single-father households, those with 5 or more children have the highest poverty rate, with 208 households (34.2%) experiencing poverty. Likewise, among single-mother households, those with 5 or more children have the highest poverty rate, with 2,032 households (68.8%) falling below the poverty line.
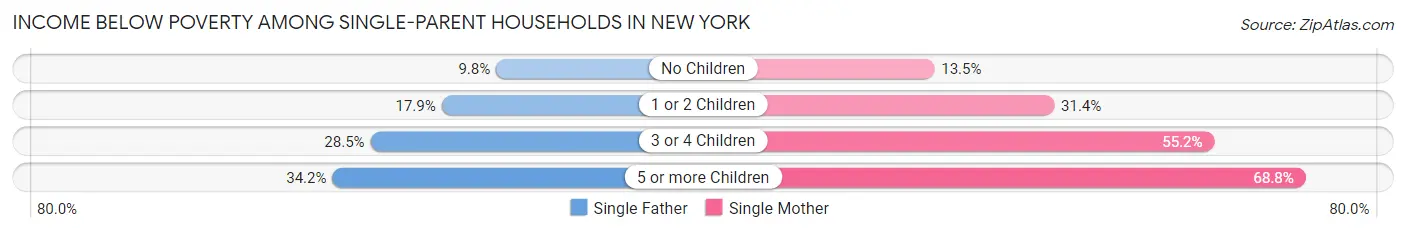
| Children | Single Father | Single Mother |
| No Children | 10,811 (9.8%) | 35,736 (13.5%) |
| 1 or 2 Children | 11,351 (17.9%) | 78,858 (31.4%) |
| 3 or 4 Children | 2,281 (28.5%) | 21,537 (55.2%) |
| 5 or more Children | 208 (34.2%) | 2,032 (68.8%) |
| Total | 24,651 (13.5%) | 138,163 (24.7%) |
Income Below Poverty Among Married-Couple vs Single-Parent Households in New York
The poverty data for New York shows that 98,954 of the married-couple family households (8.3%) and 162,814 of the single-parent households (22.0%) are living below the poverty level. Within the married-couple family households, those with 5 or more children have the highest poverty rate, with 5,230 households (37.4%) falling below the poverty line. Among the single-parent households, those with 5 or more children have the highest poverty rate, with 2,240 household (62.9%) living below poverty.
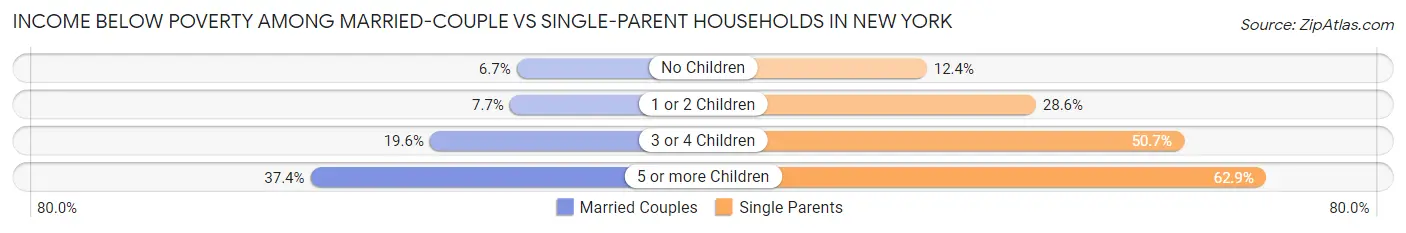
| Children | Married-Couple Families | Single-Parent Households |
| No Children | 44,655 (6.7%) | 46,547 (12.4%) |
| 1 or 2 Children | 33,055 (7.7%) | 90,209 (28.6%) |
| 3 or 4 Children | 16,014 (19.6%) | 23,818 (50.7%) |
| 5 or more Children | 5,230 (37.4%) | 2,240 (62.9%) |
| Total | 98,954 (8.3%) | 162,814 (22.0%) |
Race in New York
The most populous races in New York are White / Caucasian (3,230,647 | 37.5%), Hispanic or Latino (2,503,005 | 29.0%), and Black / African American (1,992,200 | 23.1%).
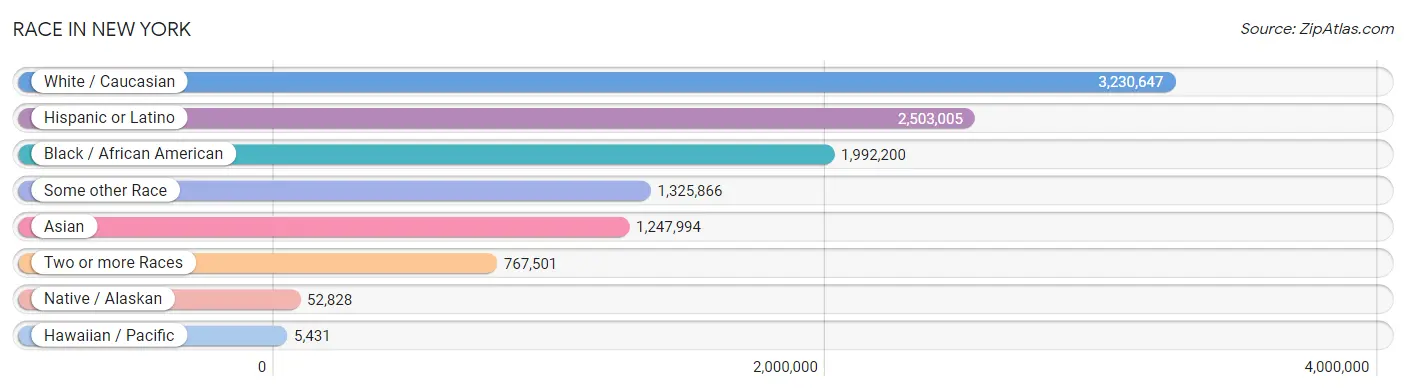
| Race | # Population | % Population |
| Asian | 1,247,994 | 14.5% |
| Black / African American | 1,992,200 | 23.1% |
| Hawaiian / Pacific | 5,431 | 0.1% |
| Hispanic or Latino | 2,503,005 | 29.0% |
| Native / Alaskan | 52,828 | 0.6% |
| White / Caucasian | 3,230,647 | 37.5% |
| Two or more Races | 767,501 | 8.9% |
| Some other Race | 1,325,866 | 15.4% |
| Total | 8,622,467 | 100.0% |
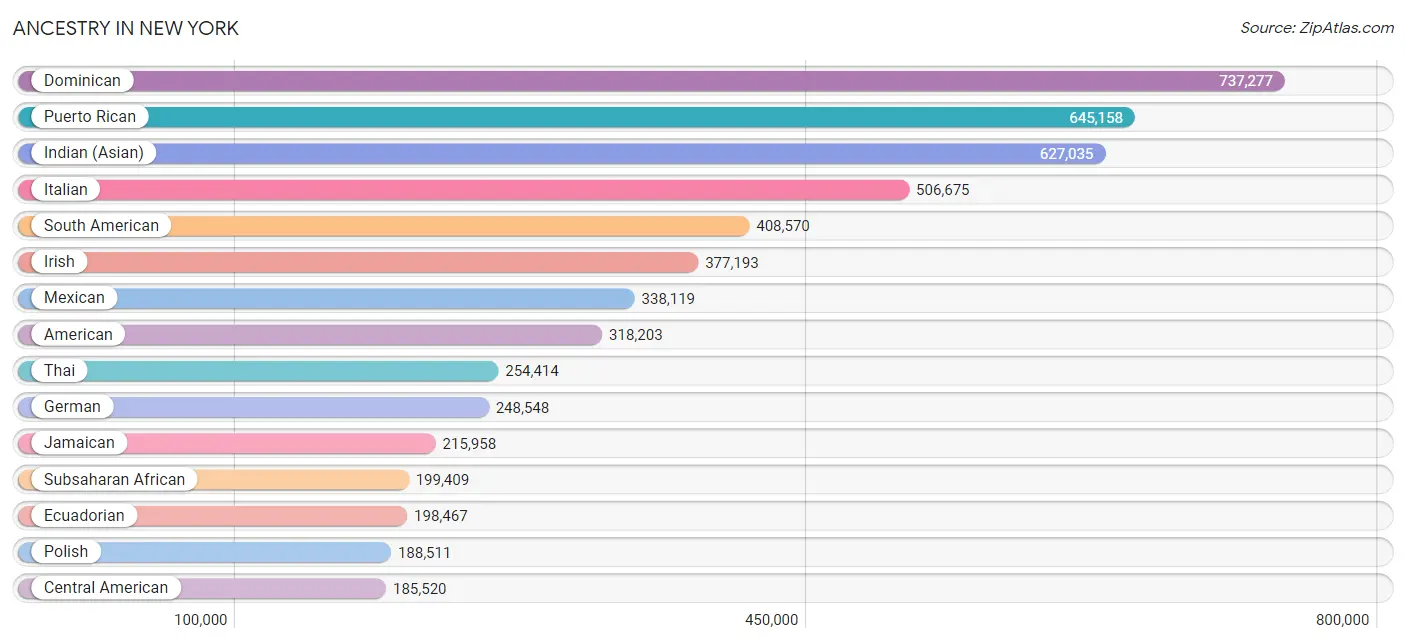
Ancestry in New York
The most populous ancestries reported in New York are Dominican (737,277 | 8.6%), Puerto Rican (645,158 | 7.5%), Indian (Asian) (627,035 | 7.3%), Italian (506,675 | 5.9%), and South American (408,570 | 4.7%), together accounting for 33.9% of all New York residents.
| Ancestry | # Population | % Population |
| Afghan | 3,216 | 0.0% |
| African | 93,911 | 1.1% |
| Alaska Native | 352 | 0.0% |
| Albanian | 36,999 | 0.4% |
| Aleut | 34 | 0.0% |
| Alsatian | 212 | 0.0% |
| American | 318,203 | 3.7% |
| Apache | 628 | 0.0% |
| Arab | 110,889 | 1.3% |
| Argentinean | 18,163 | 0.2% |
| Armenian | 10,227 | 0.1% |
| Assyrian / Chaldean / Syriac | 209 | 0.0% |
| Australian | 5,682 | 0.1% |
| Austrian | 21,383 | 0.3% |
| Bahamian | 1,627 | 0.0% |
| Bangladeshi | 284 | 0.0% |
| Barbadian | 22,593 | 0.3% |
| Basque | 799 | 0.0% |
| Belgian | 3,876 | 0.0% |
| Belizean | 7,105 | 0.1% |
| Bermudan | 569 | 0.0% |
| Bhutanese | 37,567 | 0.4% |
| Blackfeet | 2,944 | 0.0% |
| Bolivian | 4,113 | 0.1% |
| Brazilian | 12,869 | 0.2% |
| British | 26,368 | 0.3% |
| British West Indian | 49,370 | 0.6% |
| Bulgarian | 4,053 | 0.1% |
| Burmese | 92,370 | 1.1% |
| Cajun | 528 | 0.0% |
| Cambodian | 624 | 0.0% |
| Canadian | 9,994 | 0.1% |
| Cape Verdean | 635 | 0.0% |
| Carpatho Rusyn | 158 | 0.0% |
| Celtic | 357 | 0.0% |
| Central American | 185,520 | 2.1% |
| Central American Indian | 31,169 | 0.4% |
| Cherokee | 9,151 | 0.1% |
| Cheyenne | 24 | 0.0% |
| Chickasaw | 401 | 0.0% |
| Chilean | 8,625 | 0.1% |
| Chinese | 6 | 0.0% |
| Chippewa | 669 | 0.0% |
| Choctaw | 761 | 0.0% |
| Colombian | 109,862 | 1.3% |
| Colville | 18 | 0.0% |
| Comanche | 29 | 0.0% |
| Costa Rican | 6,614 | 0.1% |
| Cree | 233 | 0.0% |
| Creek | 457 | 0.0% |
| Croatian | 9,331 | 0.1% |
| Crow | 71 | 0.0% |
| Cuban | 41,029 | 0.5% |
| Cypriot | 1,577 | 0.0% |
| Czech | 11,766 | 0.1% |
| Czechoslovakian | 2,710 | 0.0% |
| Danish | 7,829 | 0.1% |
| Delaware | 312 | 0.0% |
| Dominican | 737,277 | 8.6% |
| Dutch | 22,452 | 0.3% |
| Dutch West Indian | 1,019 | 0.0% |
| Eastern European | 73,403 | 0.9% |
| Ecuadorian | 198,467 | 2.3% |
| Egyptian | 29,498 | 0.3% |
| English | 167,790 | 1.9% |
| Estonian | 976 | 0.0% |
| Ethiopian | 4,518 | 0.1% |
| European | 75,267 | 0.9% |
| Fijian | 56 | 0.0% |
| Filipino | 15,834 | 0.2% |
| Finnish | 4,052 | 0.1% |
| French | 67,737 | 0.8% |
| French American Indian | 197 | 0.0% |
| French Canadian | 10,126 | 0.1% |
| German | 248,548 | 2.9% |
| German Russian | 243 | 0.0% |
| Ghanaian | 27,627 | 0.3% |
| Greek | 62,944 | 0.7% |
| Guamanian / Chamorro | 967 | 0.0% |
| Guatemalan | 43,920 | 0.5% |
| Guyanese | 124,637 | 1.5% |
| Haitian | 118,674 | 1.4% |
| Hmong | 66 | 0.0% |
| Honduran | 50,395 | 0.6% |
| Hopi | 2 | 0.0% |
| Houma | 4 | 0.0% |
| Hungarian | 52,560 | 0.6% |
| Icelander | 473 | 0.0% |
| Indian (Asian) | 627,035 | 7.3% |
| Indonesian | 6,477 | 0.1% |
| Inupiat | 252 | 0.0% |
| Iranian | 13,128 | 0.2% |
| Iraqi | 1,932 | 0.0% |
| Irish | 377,193 | 4.4% |
| Iroquois | 4,389 | 0.1% |
| Israeli | 18,602 | 0.2% |
| Italian | 506,675 | 5.9% |
| Jamaican | 215,958 | 2.5% |
| Japanese | 3,029 | 0.0% |
| Jordanian | 1,887 | 0.0% |
| Kenyan | 1,136 | 0.0% |
| Kiowa | 21 | 0.0% |
| Korean | 94,904 | 1.1% |
| Laotian | 6,736 | 0.1% |
| Latvian | 3,888 | 0.1% |
| Lebanese | 14,594 | 0.2% |
| Liberian | 4,124 | 0.1% |
| Lithuanian | 12,873 | 0.2% |
| Lumbee | 238 | 0.0% |
| Luxembourger | 363 | 0.0% |
| Macedonian | 6,809 | 0.1% |
| Malaysian | 1,021 | 0.0% |
| Maltese | 2,588 | 0.0% |
| Menominee | 41 | 0.0% |
| Mexican | 338,119 | 3.9% |
| Mexican American Indian | 13,850 | 0.2% |
| Mongolian | 4,009 | 0.1% |
| Moroccan | 12,076 | 0.1% |
| Native Hawaiian | 4,324 | 0.1% |
| Navajo | 439 | 0.0% |
| New Zealander | 669 | 0.0% |
| Nicaraguan | 11,288 | 0.1% |
| Nigerian | 32,338 | 0.4% |
| Northern European | 5,495 | 0.1% |
| Norwegian | 22,076 | 0.3% |
| Okinawan | 1,489 | 0.0% |
| Osage | 116 | 0.0% |
| Paiute | 57 | 0.0% |
| Pakistani | 8,894 | 0.1% |
| Palestinian | 4,376 | 0.1% |
| Panamanian | 22,558 | 0.3% |
| Paraguayan | 4,127 | 0.1% |
| Pennsylvania German | 505 | 0.0% |
| Peruvian | 42,420 | 0.5% |
| Pima | 29 | 0.0% |
| Polish | 188,511 | 2.2% |
| Portuguese | 14,646 | 0.2% |
| Potawatomi | 62 | 0.0% |
| Pueblo | 292 | 0.0% |
| Puerto Rican | 645,158 | 7.5% |
| Puget Sound Salish | 12 | 0.0% |
| Romanian | 28,008 | 0.3% |
| Russian | 179,182 | 2.1% |
| Salvadoran | 49,579 | 0.6% |
| Samoan | 1,428 | 0.0% |
| Scandinavian | 5,408 | 0.1% |
| Scotch-Irish | 14,117 | 0.2% |
| Scottish | 40,225 | 0.5% |
| Seminole | 130 | 0.0% |
| Senegalese | 4,792 | 0.1% |
| Serbian | 5,298 | 0.1% |
| Shoshone | 82 | 0.0% |
| Sierra Leonean | 1,355 | 0.0% |
| Sioux | 775 | 0.0% |
| Slavic | 4,859 | 0.1% |
| Slovak | 7,571 | 0.1% |
| Slovene | 1,583 | 0.0% |
| Somali | 1,023 | 0.0% |
| South African | 2,263 | 0.0% |
| South American | 408,570 | 4.7% |
| South American Indian | 6,290 | 0.1% |
| Soviet Union | 769 | 0.0% |
| Spaniard | 29,576 | 0.3% |
| Spanish | 13,911 | 0.2% |
| Spanish American | 750 | 0.0% |
| Spanish American Indian | 843 | 0.0% |
| Sri Lankan | 21,834 | 0.3% |
| Subsaharan African | 199,409 | 2.3% |
| Sudanese | 1,828 | 0.0% |
| Swedish | 23,649 | 0.3% |
| Swiss | 7,639 | 0.1% |
| Syrian | 11,181 | 0.1% |
| Taiwanese | 182 | 0.0% |
| Thai | 254,414 | 2.9% |
| Tohono O'Odham | 81 | 0.0% |
| Tongan | 318 | 0.0% |
| Trinidadian and Tobagonian | 70,939 | 0.8% |
| Turkish | 16,980 | 0.2% |
| U.S. Virgin Islander | 3,184 | 0.0% |
| Ugandan | 549 | 0.0% |
| Ukrainian | 68,680 | 0.8% |
| Uruguayan | 2,705 | 0.0% |
| Ute | 34 | 0.0% |
| Venezuelan | 17,158 | 0.2% |
| Vietnamese | 89,570 | 1.0% |
| Welsh | 11,007 | 0.1% |
| West Indian | 81,226 | 0.9% |
| Yugoslavian | 3,945 | 0.1% |
| Yuman | 59 | 0.0% |
| Yup'ik | 49 | 0.0% |
| Zimbabwean | 116 | 0.0% | View All 191 Rows |
Immigrants in New York
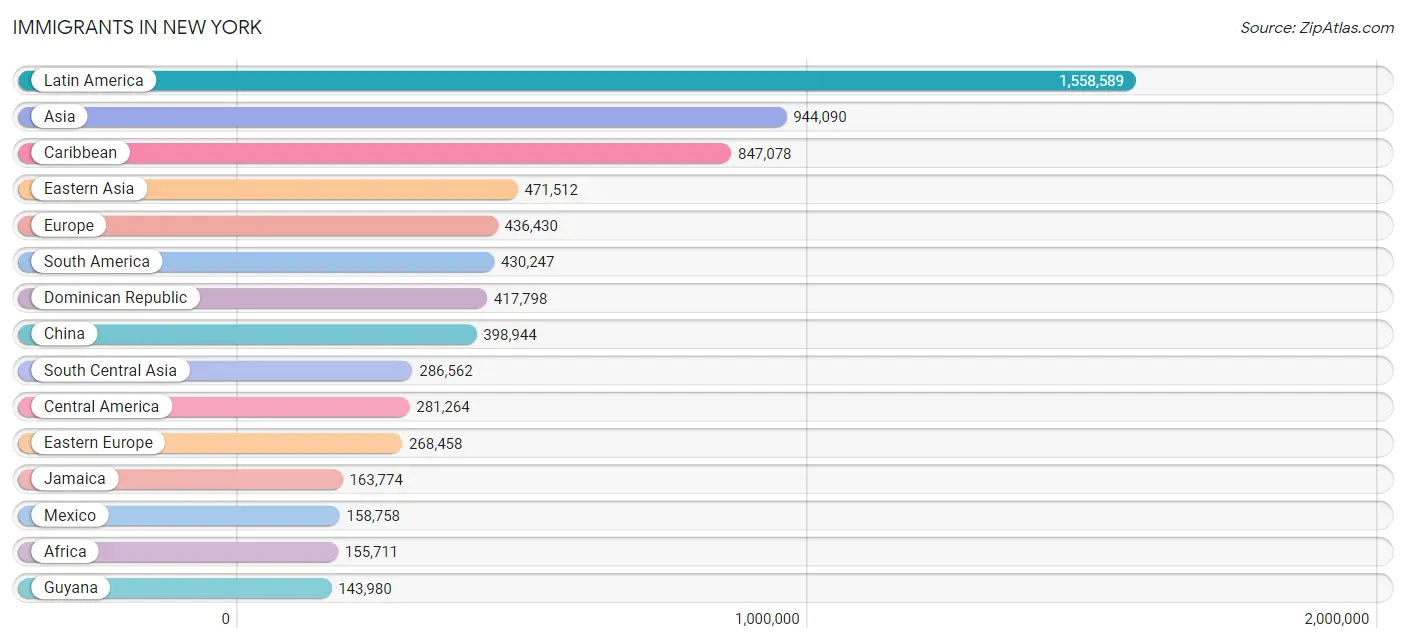
The most numerous immigrant groups reported in New York came from Latin America (1,558,589 | 18.1%), Asia (944,090 | 11.0%), Caribbean (847,078 | 9.8%), Eastern Asia (471,512 | 5.5%), and Europe (436,430 | 5.1%), together accounting for 49.4% of all New York residents.
| Immigration Origin | # Population | % Population |
| Afghanistan | 3,061 | 0.0% |
| Africa | 155,711 | 1.8% |
| Albania | 19,708 | 0.2% |
| Argentina | 12,718 | 0.2% |
| Armenia | 2,326 | 0.0% |
| Asia | 944,090 | 11.0% |
| Australia | 9,929 | 0.1% |
| Austria | 2,526 | 0.0% |
| Bahamas | 1,239 | 0.0% |
| Bangladesh | 99,472 | 1.1% |
| Barbados | 21,730 | 0.3% |
| Belarus | 14,304 | 0.2% |
| Belgium | 2,599 | 0.0% |
| Belize | 6,292 | 0.1% |
| Bolivia | 2,774 | 0.0% |
| Bosnia and Herzegovina | 2,066 | 0.0% |
| Brazil | 15,529 | 0.2% |
| Bulgaria | 3,699 | 0.0% |
| Cabo Verde | 105 | 0.0% |
| Cambodia | 1,802 | 0.0% |
| Cameroon | 822 | 0.0% |
| Canada | 26,201 | 0.3% |
| Caribbean | 847,078 | 9.8% |
| Central America | 281,264 | 3.3% |
| Chile | 5,937 | 0.1% |
| China | 398,944 | 4.6% |
| Colombia | 72,458 | 0.8% |
| Congo | 411 | 0.0% |
| Costa Rica | 4,059 | 0.1% |
| Croatia | 3,806 | 0.0% |
| Cuba | 13,126 | 0.2% |
| Czechoslovakia | 5,186 | 0.1% |
| Denmark | 1,280 | 0.0% |
| Dominica | 7,203 | 0.1% |
| Dominican Republic | 417,798 | 4.9% |
| Eastern Africa | 10,270 | 0.1% |
| Eastern Asia | 471,512 | 5.5% |
| Eastern Europe | 268,458 | 3.1% |
| Ecuador | 125,959 | 1.5% |
| Egypt | 21,341 | 0.3% |
| El Salvador | 30,084 | 0.4% |
| England | 10,617 | 0.1% |
| Eritrea | 308 | 0.0% |
| Ethiopia | 3,409 | 0.0% |
| Europe | 436,430 | 5.1% |
| Fiji | 11 | 0.0% |
| France | 19,172 | 0.2% |
| Germany | 14,979 | 0.2% |
| Ghana | 30,634 | 0.4% |
| Greece | 18,339 | 0.2% |
| Grenada | 20,756 | 0.2% |
| Guatemala | 28,371 | 0.3% |
| Guyana | 143,980 | 1.7% |
| Haiti | 81,926 | 0.9% |
| Honduras | 32,433 | 0.4% |
| Hong Kong | 34,012 | 0.4% |
| Hungary | 5,192 | 0.1% |
| India | 78,976 | 0.9% |
| Indonesia | 5,126 | 0.1% |
| Iran | 7,791 | 0.1% |
| Iraq | 713 | 0.0% |
| Ireland | 11,954 | 0.1% |
| Israel | 19,887 | 0.2% |
| Italy | 39,896 | 0.5% |
| Jamaica | 163,774 | 1.9% |
| Japan | 18,879 | 0.2% |
| Jordan | 2,169 | 0.0% |
| Kazakhstan | 5,038 | 0.1% |
| Kenya | 1,838 | 0.0% |
| Korea | 53,468 | 0.6% |
| Kuwait | 933 | 0.0% |
| Laos | 665 | 0.0% |
| Latin America | 1,558,589 | 18.1% |
| Latvia | 2,293 | 0.0% |
| Lebanon | 4,710 | 0.1% |
| Liberia | 3,369 | 0.0% |
| Lithuania | 1,573 | 0.0% |
| Malaysia | 9,876 | 0.1% |
| Mexico | 158,758 | 1.8% |
| Micronesia | 76 | 0.0% |
| Middle Africa | 2,619 | 0.0% |
| Moldova | 5,079 | 0.1% |
| Morocco | 7,473 | 0.1% |
| Nepal | 12,358 | 0.1% |
| Netherlands | 2,903 | 0.0% |
| Nicaragua | 6,779 | 0.1% |
| Nigeria | 24,451 | 0.3% |
| North Macedonia | 2,298 | 0.0% |
| Northern Africa | 35,532 | 0.4% |
| Northern Europe | 49,604 | 0.6% |
| Norway | 1,236 | 0.0% |
| Oceania | 11,720 | 0.1% |
| Pakistan | 36,804 | 0.4% |
| Panama | 14,179 | 0.2% |
| Peru | 28,489 | 0.3% |
| Philippines | 57,191 | 0.7% |
| Poland | 41,653 | 0.5% |
| Portugal | 1,980 | 0.0% |
| Romania | 12,802 | 0.2% |
| Russia | 61,346 | 0.7% |
| Saudi Arabia | 1,363 | 0.0% |
| Scotland | 1,653 | 0.0% |
| Senegal | 6,950 | 0.1% |
| Serbia | 3,381 | 0.0% |
| Sierra Leone | 2,399 | 0.0% |
| Singapore | 2,992 | 0.0% |
| Somalia | 437 | 0.0% |
| South Africa | 3,931 | 0.1% |
| South America | 430,247 | 5.0% |
| South Central Asia | 286,562 | 3.3% |
| South Eastern Asia | 105,818 | 1.2% |
| Southern Europe | 71,799 | 0.8% |
| Spain | 10,624 | 0.1% |
| Sri Lanka | 5,344 | 0.1% |
| St. Vincent and the Grenadines | 12,527 | 0.2% |
| Sudan | 2,226 | 0.0% |
| Sweden | 2,307 | 0.0% |
| Switzerland | 2,535 | 0.0% |
| Syria | 5,285 | 0.1% |
| Taiwan | 21,575 | 0.3% |
| Thailand | 6,796 | 0.1% |
| Trinidad and Tobago | 76,393 | 0.9% |
| Turkey | 10,942 | 0.1% |
| Uganda | 574 | 0.0% |
| Ukraine | 62,540 | 0.7% |
| Uruguay | 2,402 | 0.0% |
| Uzbekistan | 30,662 | 0.4% |
| Venezuela | 14,040 | 0.2% |
| Vietnam | 14,180 | 0.2% |
| West Indies | 6,103 | 0.1% |
| Western Africa | 93,849 | 1.1% |
| Western Asia | 77,480 | 0.9% |
| Western Europe | 44,937 | 0.5% |
| Yemen | 10,567 | 0.1% |
| Zaire | 506 | 0.0% |
| Zimbabwe | 603 | 0.0% | View All 136 Rows |
Sex and Age in New York
Sex and Age in New York
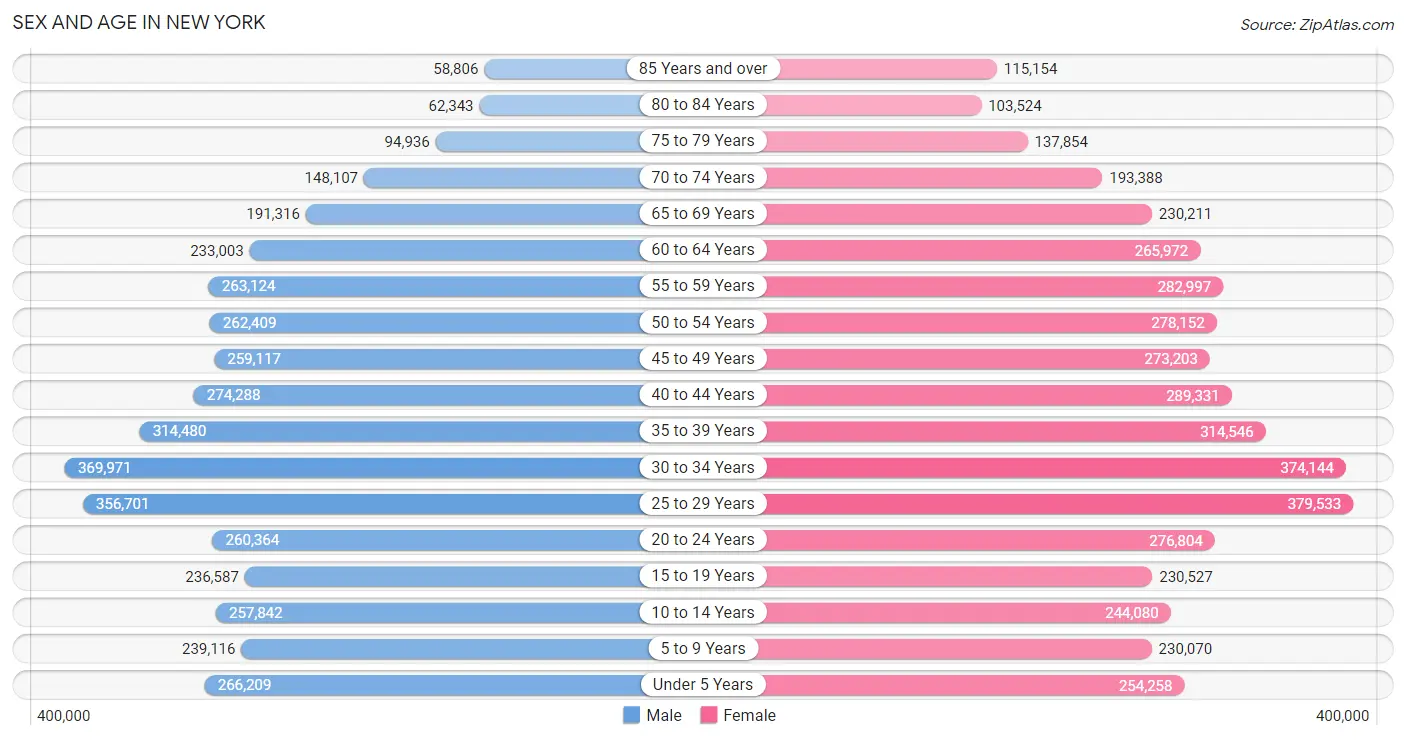
The most populous age groups in New York are 30 to 34 Years (369,971 | 8.9%) for men and 25 to 29 Years (379,533 | 8.5%) for women.
| Age Bracket | Male | Female |
| Under 5 Years | 266,209 (6.4%) | 254,258 (5.7%) |
| 5 to 9 Years | 239,116 (5.8%) | 230,070 (5.1%) |
| 10 to 14 Years | 257,842 (6.2%) | 244,080 (5.5%) |
| 15 to 19 Years | 236,587 (5.7%) | 230,527 (5.1%) |
| 20 to 24 Years | 260,364 (6.3%) | 276,804 (6.2%) |
| 25 to 29 Years | 356,701 (8.6%) | 379,533 (8.5%) |
| 30 to 34 Years | 369,971 (8.9%) | 374,144 (8.4%) |
| 35 to 39 Years | 314,480 (7.6%) | 314,546 (7.0%) |
| 40 to 44 Years | 274,288 (6.6%) | 289,331 (6.5%) |
| 45 to 49 Years | 259,117 (6.2%) | 273,203 (6.1%) |
| 50 to 54 Years | 262,409 (6.3%) | 278,152 (6.2%) |
| 55 to 59 Years | 263,124 (6.3%) | 282,997 (6.3%) |
| 60 to 64 Years | 233,003 (5.6%) | 265,972 (5.9%) |
| 65 to 69 Years | 191,316 (4.6%) | 230,211 (5.1%) |
| 70 to 74 Years | 148,107 (3.6%) | 193,388 (4.3%) |
| 75 to 79 Years | 94,936 (2.3%) | 137,854 (3.1%) |
| 80 to 84 Years | 62,343 (1.5%) | 103,524 (2.3%) |
| 85 Years and over | 58,806 (1.4%) | 115,154 (2.6%) |
| Total | 4,148,719 (100.0%) | 4,473,748 (100.0%) |
Families and Households in New York
Median Family Size in New York
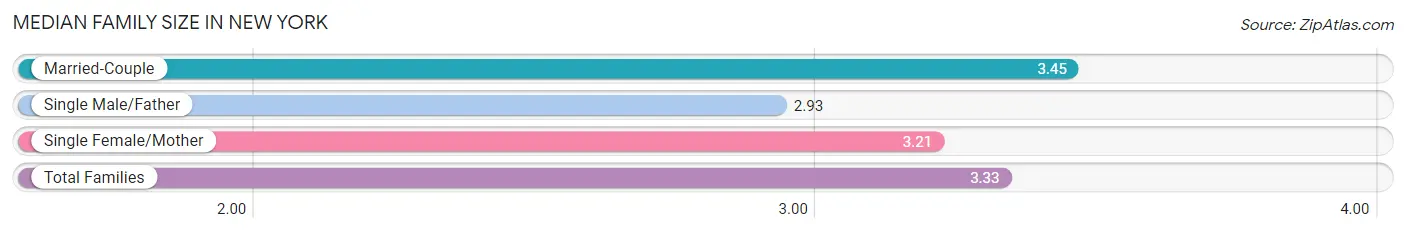
The median family size in New York is 3.33 persons per family, with married-couple families (1,189,789 | 61.6%) accounting for the largest median family size of 3.45 persons per family. On the other hand, single male/father families (182,976 | 9.5%) represent the smallest median family size with 2.93 persons per family.
| Family Type | # Families | Family Size |
| Married-Couple | 1,189,789 (61.6%) | 3.45 |
| Single Male/Father | 182,976 (9.5%) | 2.93 |
| Single Female/Mother | 558,231 (28.9%) | 3.21 |
| Total Families | 1,930,996 (100.0%) | 3.33 |
Median Household Size in New York
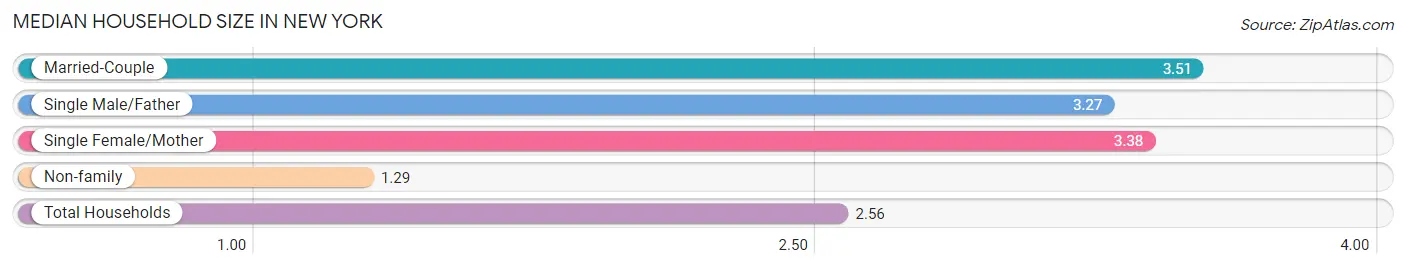
The median household size in New York is 2.56 persons per household, with married-couple households (1,189,789 | 36.2%) accounting for the largest median household size of 3.51 persons per household. non-family households (1,351,808 | 41.2%) represent the smallest median household size with 1.29 persons per household.
| Household Type | # Households | Household Size |
| Married-Couple | 1,189,789 (36.2%) | 3.51 |
| Single Male/Father | 182,976 (5.6%) | 3.27 |
| Single Female/Mother | 558,231 (17.0%) | 3.38 |
| Non-family | 1,351,808 (41.2%) | 1.29 |
| Total Households | 3,282,804 (100.0%) | 2.56 |
Household Size by Marriage Status in New York
Out of a total of 3,282,804 households in New York, 1,930,996 (58.8%) are family households, while 1,351,808 (41.2%) are nonfamily households. The most numerous type of family households are 2-person households, comprising 726,177, and the most common type of nonfamily households are 1-person households, comprising 1,075,277.
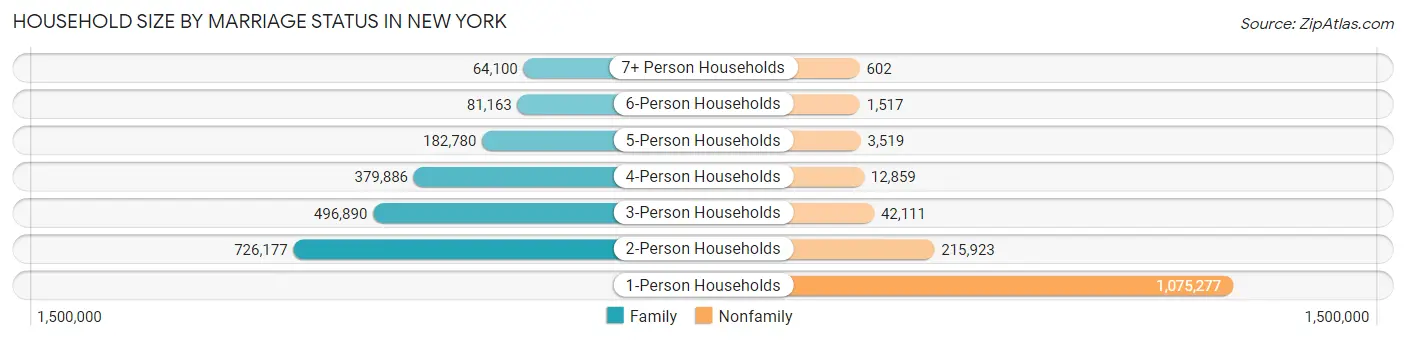
| Household Size | Family Households | Nonfamily Households |
| 1-Person Households | - | 1,075,277 (32.8%) |
| 2-Person Households | 726,177 (22.1%) | 215,923 (6.6%) |
| 3-Person Households | 496,890 (15.1%) | 42,111 (1.3%) |
| 4-Person Households | 379,886 (11.6%) | 12,859 (0.4%) |
| 5-Person Households | 182,780 (5.6%) | 3,519 (0.1%) |
| 6-Person Households | 81,163 (2.5%) | 1,517 (0.1%) |
| 7+ Person Households | 64,100 (1.9%) | 602 (0.0%) |
| Total | 1,930,996 (58.8%) | 1,351,808 (41.2%) |
Female Fertility in New York
Fertility by Age in New York
Average fertility rate in New York is 45.0 births per 1,000 women. Women in the age bracket of 20 to 34 years have the highest fertility rate with 58.0 births per 1,000 women. Women in the age bracket of 20 to 34 years acount for 60.5% of all women with births.
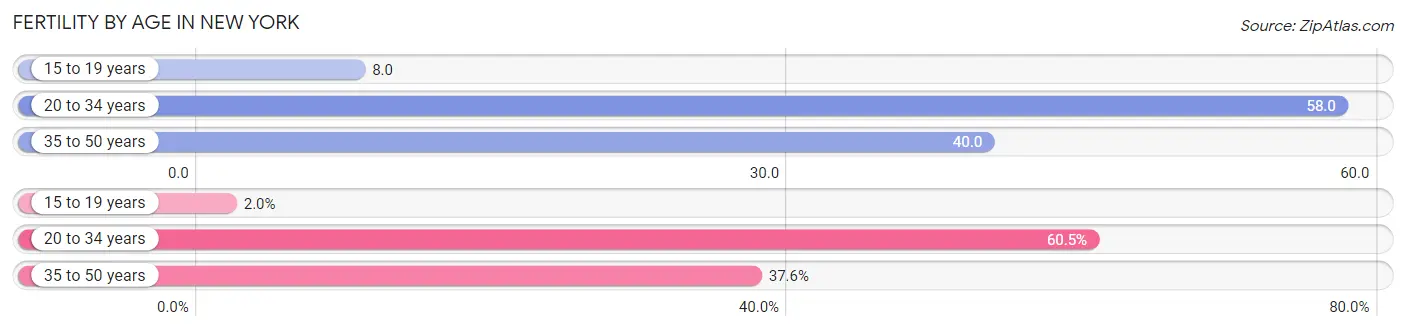
| Age Bracket | Women with Births | Births / 1,000 Women |
| 15 to 19 years | 1,947 (1.9%) | 8.0 |
| 20 to 34 years | 60,273 (60.5%) | 58.0 |
| 35 to 50 years | 37,465 (37.6%) | 40.0 |
| Total | 99,685 (100.0%) | 45.0 |
Fertility by Age by Marriage Status in New York
69.4% of women with births (99,685) in New York are married. The highest percentage of unmarried women with births falls into 15 to 19 years age bracket with 87.2% of them unmarried at the time of birth, while the lowest percentage of unmarried women with births belong to 35 to 50 years age bracket with 20.6% of them unmarried.
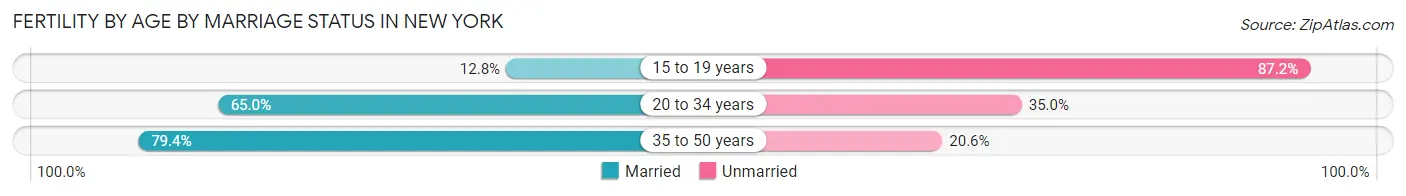
| Age Bracket | Married | Unmarried |
| 15 to 19 years | 249 (12.8%) | 1,698 (87.2%) |
| 20 to 34 years | 39,177 (65.0%) | 21,096 (35.0%) |
| 35 to 50 years | 29,747 (79.4%) | 7,718 (20.6%) |
| Total | 69,181 (69.4%) | 30,504 (30.6%) |
Fertility by Education in New York
Average fertility rate in New York is 45.0 births per 1,000 women. Women with the education attainment of graduate degree have the highest fertility rate of 59.0 births per 1,000 women, while women with the education attainment of less than high school have the lowest fertility at 38.0 births per 1,000 women. Women with the education attainment of bachelor's degree represent 23.6% of all women with births.
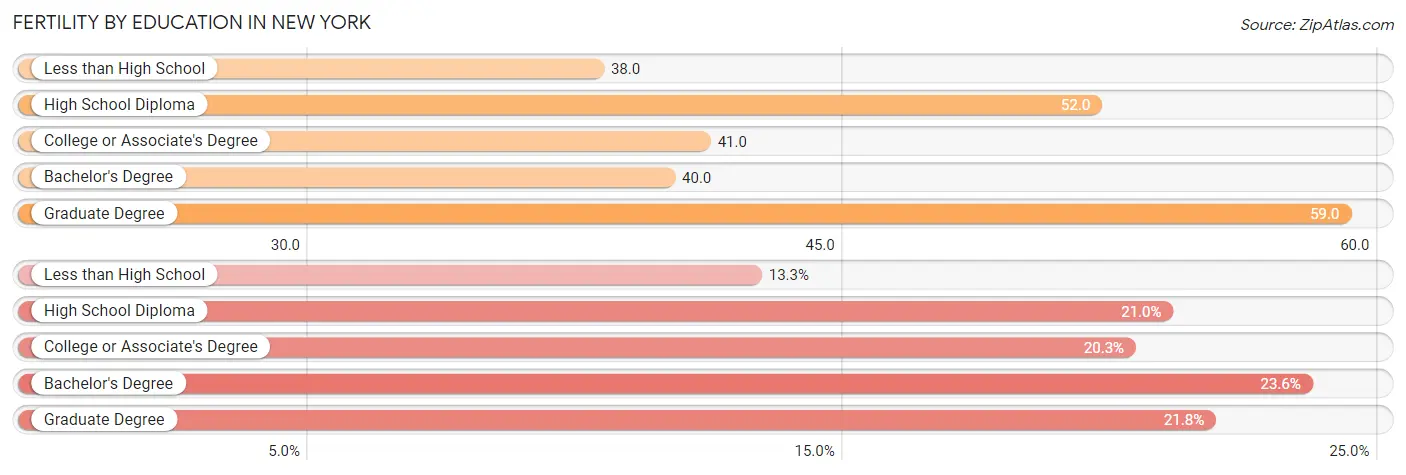
| Educational Attainment | Women with Births | Births / 1,000 Women |
| Less than High School | 13,250 (13.3%) | 38.0 |
| High School Diploma | 20,930 (21.0%) | 52.0 |
| College or Associate's Degree | 20,232 (20.3%) | 41.0 |
| Bachelor's Degree | 23,537 (23.6%) | 40.0 |
| Graduate Degree | 21,736 (21.8%) | 59.0 |
| Total | 99,685 (100.0%) | 45.0 |
Fertility by Education by Marriage Status in New York
30.6% of women with births in New York are unmarried. Women with the educational attainment of graduate degree are most likely to be married with 90.7% of them married at childbirth, while women with the educational attainment of less than high school are least likely to be married with 49.1% of them unmarried at childbirth.
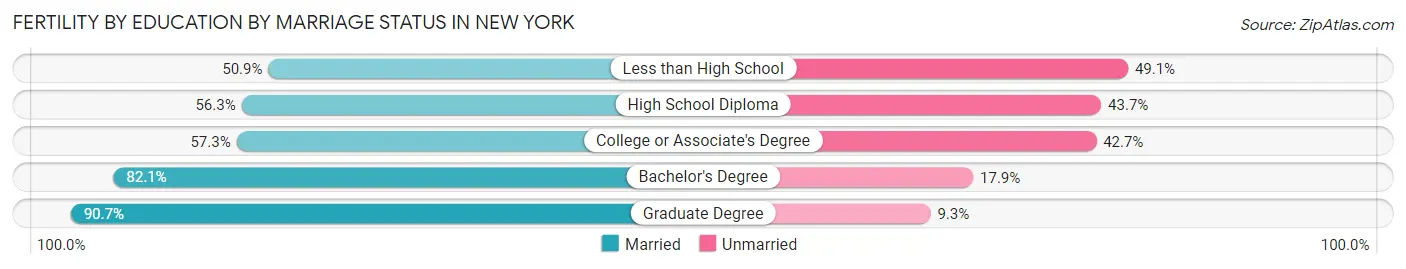
| Educational Attainment | Married | Unmarried |
| Less than High School | 6,744 (50.9%) | 6,506 (49.1%) |
| High School Diploma | 11,784 (56.3%) | 9,146 (43.7%) |
| College or Associate's Degree | 11,593 (57.3%) | 8,639 (42.7%) |
| Bachelor's Degree | 19,324 (82.1%) | 4,213 (17.9%) |
| Graduate Degree | 19,715 (90.7%) | 2,021 (9.3%) |
| Total | 69,181 (69.4%) | 30,504 (30.6%) |
Employment Characteristics in New York
Employment by Class of Employer in New York
Among the 3,991,760 employed individuals in New York, private company employees (2,614,006 | 65.5%), not-for-profit organizations (441,798 | 11.1%), and local government employees (374,067 | 9.4%) make up the most common classes of employment.
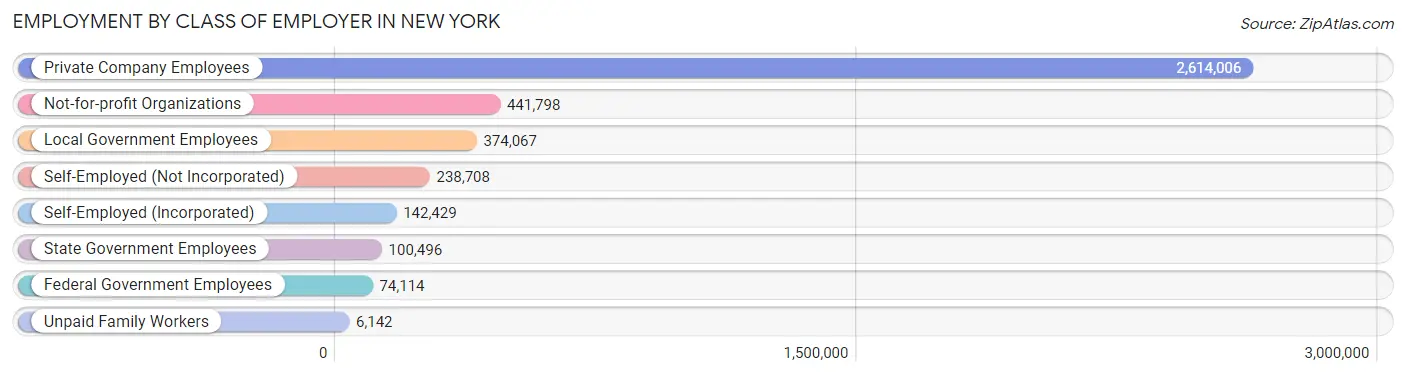
| Employer Class | # Employees | % Employees |
| Private Company Employees | 2,614,006 | 65.5% |
| Self-Employed (Incorporated) | 142,429 | 3.6% |
| Self-Employed (Not Incorporated) | 238,708 | 6.0% |
| Not-for-profit Organizations | 441,798 | 11.1% |
| Local Government Employees | 374,067 | 9.4% |
| State Government Employees | 100,496 | 2.5% |
| Federal Government Employees | 74,114 | 1.9% |
| Unpaid Family Workers | 6,142 | 0.2% |
| Total | 3,991,760 | 100.0% |
Employment Status by Age in New York
According to the labor force statistics for New York, out of the total population over 16 years of age (7,037,637), 63.2% or 4,447,787 individuals are in the labor force, with 7.6% or 338,032 of them unemployed. The age group with the highest labor force participation rate is 30 to 34 years, with 84.5% or 628,777 individuals in the labor force. Within the labor force, the 16 to 19 years age range has the highest percentage of unemployed individuals, with 28.1% or 21,956 of them being unemployed.
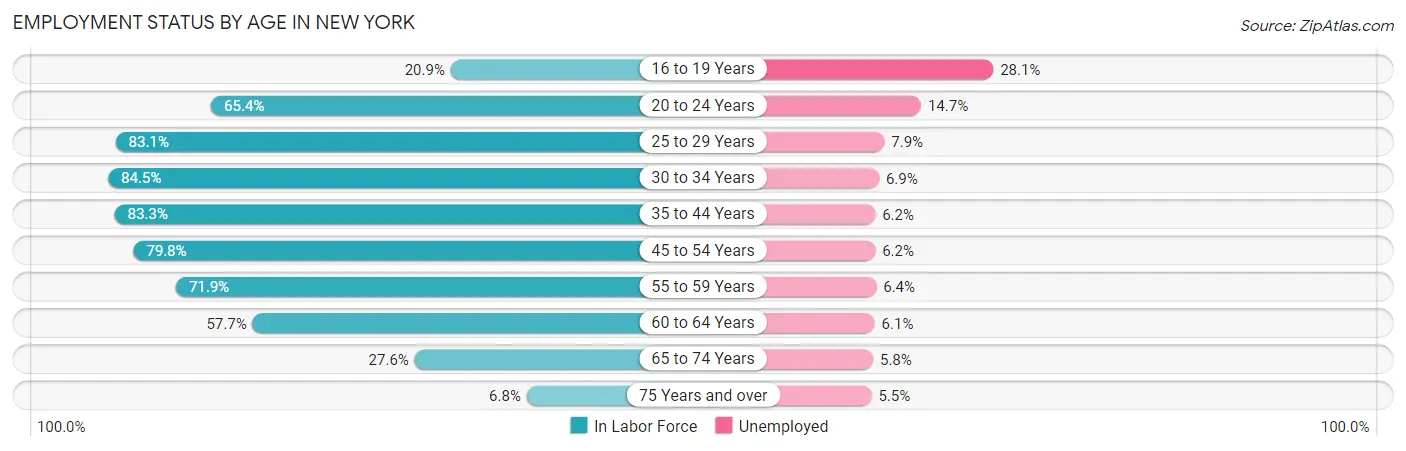
| Age Bracket | In Labor Force | Unemployed |
| 16 to 19 Years | 78,137 (20.9%) | 21,956 (28.1%) |
| 20 to 24 Years | 351,308 (65.4%) | 51,642 (14.7%) |
| 25 to 29 Years | 611,810 (83.1%) | 48,333 (7.9%) |
| 30 to 34 Years | 628,777 (84.5%) | 43,386 (6.9%) |
| 35 to 44 Years | 993,473 (83.3%) | 61,595 (6.2%) |
| 45 to 54 Years | 856,159 (79.8%) | 53,082 (6.2%) |
| 55 to 59 Years | 392,661 (71.9%) | 25,130 (6.4%) |
| 60 to 64 Years | 287,909 (57.7%) | 17,562 (6.1%) |
| 65 to 74 Years | 210,594 (27.6%) | 12,214 (5.8%) |
| 75 Years and over | 38,938 (6.8%) | 2,142 (5.5%) |
| Total | 4,447,787 (63.2%) | 338,032 (7.6%) |
Employment Status by Educational Attainment in New York
According to labor force statistics for New York, 78.7% of individuals (3,770,494) out of the total population between 25 and 64 years of age (4,790,971) are in the labor force, with 6.6% or 248,853 of them being unemployed. The group with the highest labor force participation rate are those with the educational attainment of bachelor's degree or higher, with 88.6% or 1,831,506 individuals in the labor force. Within the labor force, individuals with less than high school education have the highest percentage of unemployment, with 10.1% or 41,313 of them being unemployed.
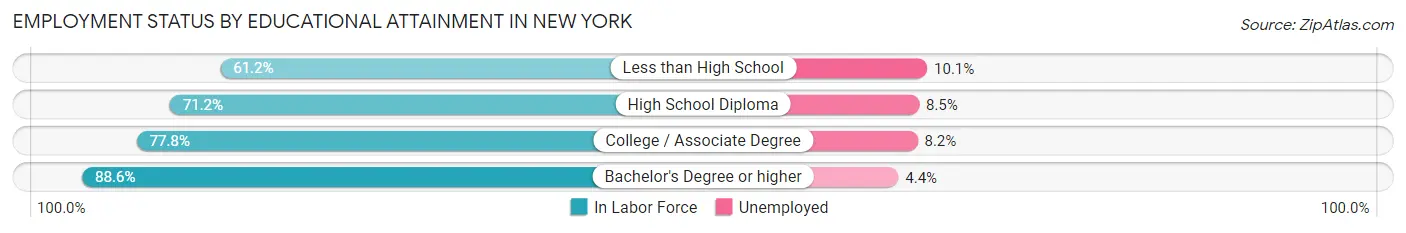
| Educational Attainment | In Labor Force | Unemployed |
| Less than High School | 409,041 (61.2%) | 67,505 (10.1%) |
| High School Diploma | 762,091 (71.2%) | 90,980 (8.5%) |
| College / Associate Degree | 766,400 (77.8%) | 80,777 (8.2%) |
| Bachelor's Degree or higher | 1,831,506 (88.6%) | 90,955 (4.4%) |
| Total | 3,770,494 (78.7%) | 316,204 (6.6%) |
Employment Occupations by Sex in New York
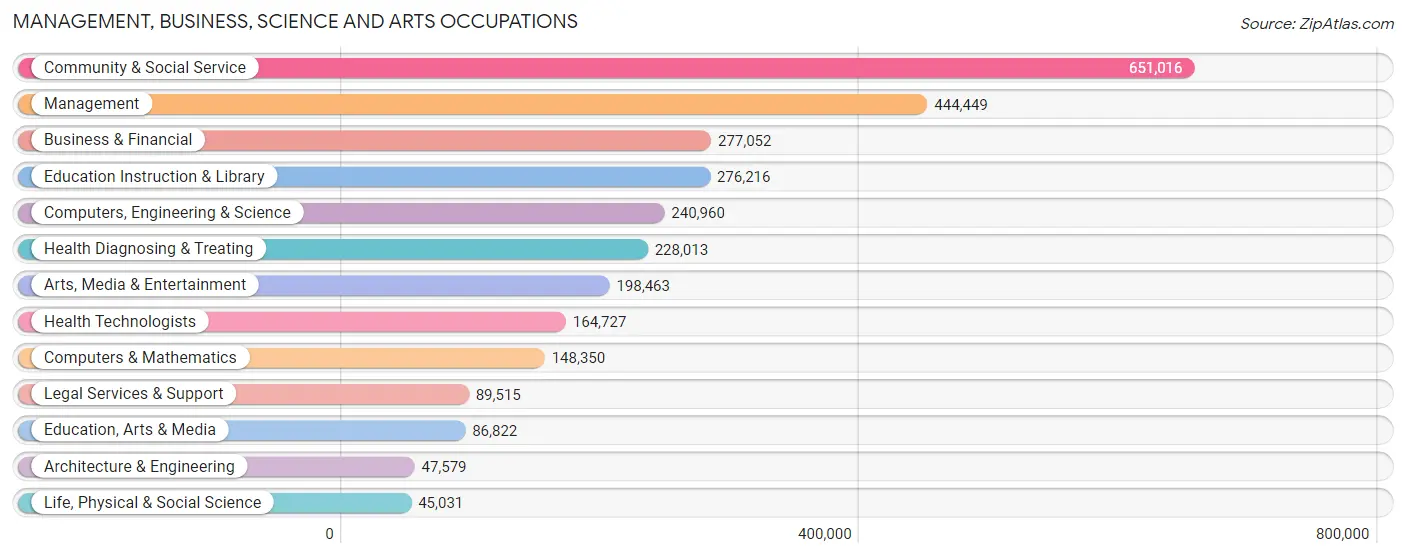
Management, Business, Science and Arts Occupations
The most common Management, Business, Science and Arts occupations in New York are Community & Social Service (651,016 | 15.8%), Management (444,449 | 10.8%), Business & Financial (277,052 | 6.7%), Education Instruction & Library (276,216 | 6.7%), and Computers, Engineering & Science (240,960 | 5.9%).
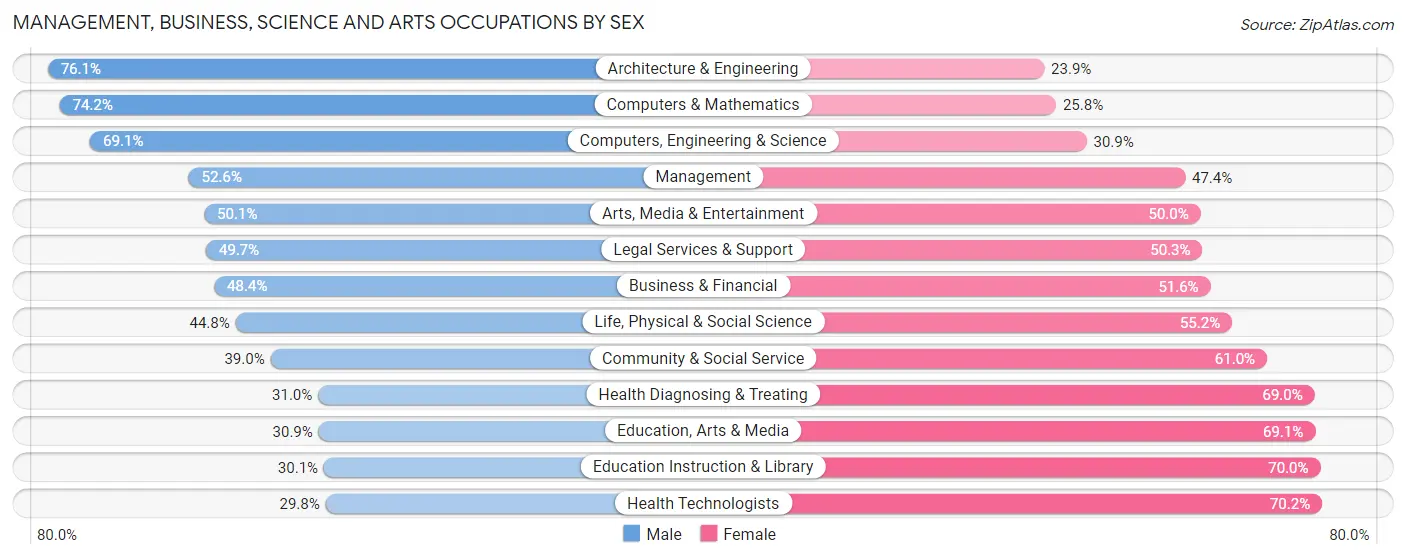
Management, Business, Science and Arts Occupations by Sex
Within the Management, Business, Science and Arts occupations in New York, the most male-oriented occupations are Architecture & Engineering (76.1%), Computers & Mathematics (74.2%), and Computers, Engineering & Science (69.1%), while the most female-oriented occupations are Health Technologists (70.2%), Education Instruction & Library (70.0%), and Education, Arts & Media (69.1%).
| Occupation | Male | Female |
| Management | 233,908 (52.6%) | 210,541 (47.4%) |
| Business & Financial | 134,066 (48.4%) | 142,986 (51.6%) |
| Computers, Engineering & Science | 166,407 (69.1%) | 74,553 (30.9%) |
| Computers & Mathematics | 110,009 (74.2%) | 38,341 (25.8%) |
| Architecture & Engineering | 36,226 (76.1%) | 11,353 (23.9%) |
| Life, Physical & Social Science | 20,172 (44.8%) | 24,859 (55.2%) |
| Community & Social Service | 253,708 (39.0%) | 397,308 (61.0%) |
| Education, Arts & Media | 26,852 (30.9%) | 59,970 (69.1%) |
| Legal Services & Support | 44,526 (49.7%) | 44,989 (50.3%) |
| Education Instruction & Library | 83,003 (30.0%) | 193,213 (70.0%) |
| Arts, Media & Entertainment | 99,327 (50.0%) | 99,136 (49.9%) |
| Health Diagnosing & Treating | 70,724 (31.0%) | 157,289 (69.0%) |
| Health Technologists | 49,056 (29.8%) | 115,671 (70.2%) |
| Total (Category) | 858,813 (46.6%) | 982,677 (53.4%) |
| Total (Overall) | 2,085,307 (50.7%) | 2,023,375 (49.2%) |
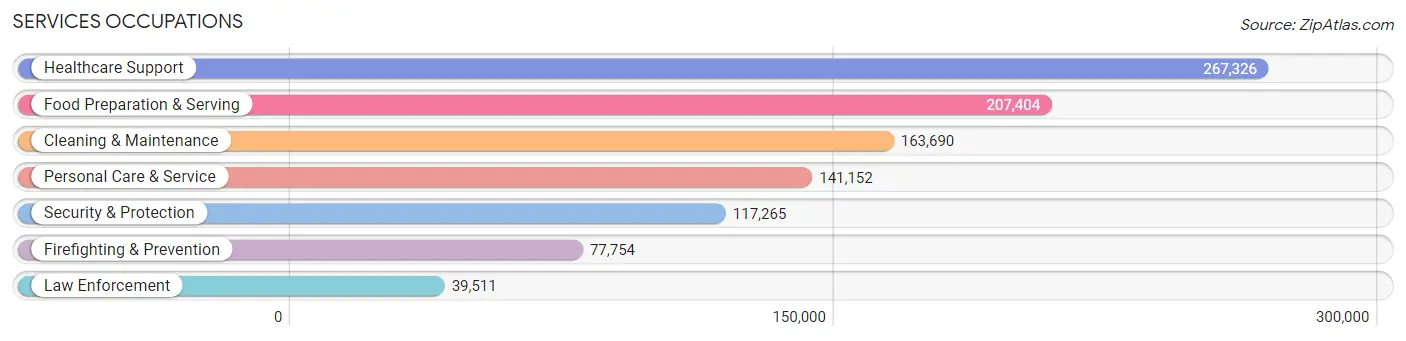
Services Occupations
The most common Services occupations in New York are Healthcare Support (267,326 | 6.5%), Food Preparation & Serving (207,404 | 5.1%), Cleaning & Maintenance (163,690 | 4.0%), Personal Care & Service (141,152 | 3.4%), and Security & Protection (117,265 | 2.9%).
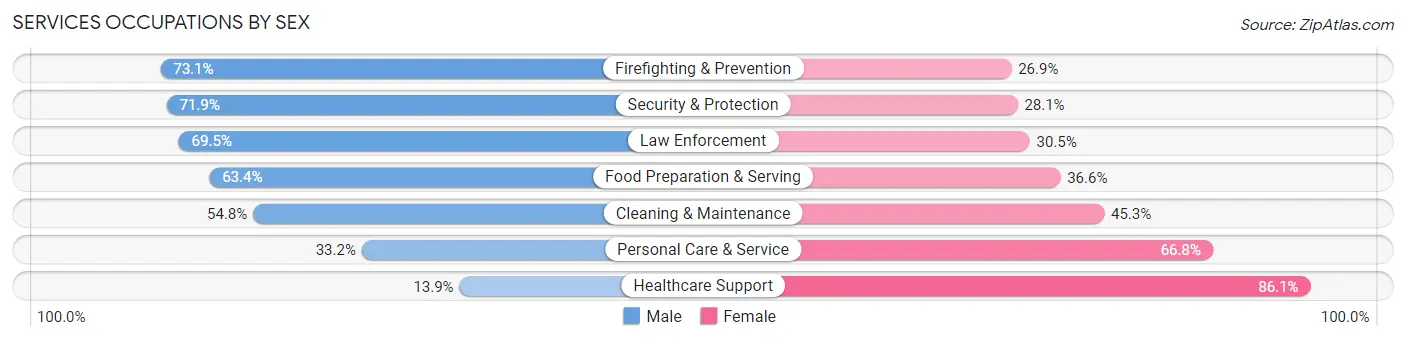
Services Occupations by Sex
Within the Services occupations in New York, the most male-oriented occupations are Firefighting & Prevention (73.1%), Security & Protection (71.9%), and Law Enforcement (69.5%), while the most female-oriented occupations are Healthcare Support (86.1%), Personal Care & Service (66.8%), and Cleaning & Maintenance (45.3%).
| Occupation | Male | Female |
| Healthcare Support | 37,133 (13.9%) | 230,193 (86.1%) |
| Security & Protection | 84,318 (71.9%) | 32,947 (28.1%) |
| Firefighting & Prevention | 56,863 (73.1%) | 20,891 (26.9%) |
| Law Enforcement | 27,455 (69.5%) | 12,056 (30.5%) |
| Food Preparation & Serving | 131,551 (63.4%) | 75,853 (36.6%) |
| Cleaning & Maintenance | 89,614 (54.7%) | 74,076 (45.3%) |
| Personal Care & Service | 46,922 (33.2%) | 94,230 (66.8%) |
| Total (Category) | 389,538 (43.4%) | 507,299 (56.6%) |
| Total (Overall) | 2,085,307 (50.7%) | 2,023,375 (49.2%) |
Sales and Office Occupations
The most common Sales and Office occupations in New York are Office & Administration (423,056 | 10.3%), and Sales & Related (344,581 | 8.4%).

Sales and Office Occupations by Sex
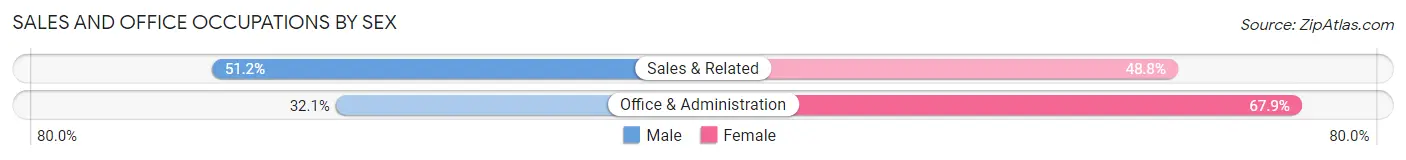
| Occupation | Male | Female |
| Sales & Related | 176,418 (51.2%) | 168,163 (48.8%) |
| Office & Administration | 135,967 (32.1%) | 287,089 (67.9%) |
| Total (Category) | 312,385 (40.7%) | 455,252 (59.3%) |
| Total (Overall) | 2,085,307 (50.7%) | 2,023,375 (49.2%) |
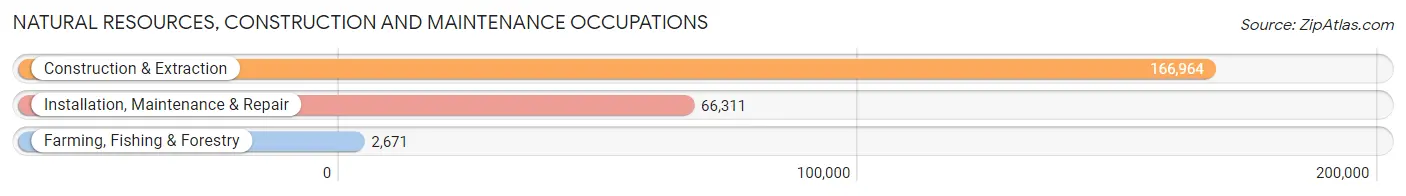
Natural Resources, Construction and Maintenance Occupations
The most common Natural Resources, Construction and Maintenance occupations in New York are Construction & Extraction (166,964 | 4.1%), Installation, Maintenance & Repair (66,311 | 1.6%), and Farming, Fishing & Forestry (2,671 | 0.1%).
Natural Resources, Construction and Maintenance Occupations by Sex
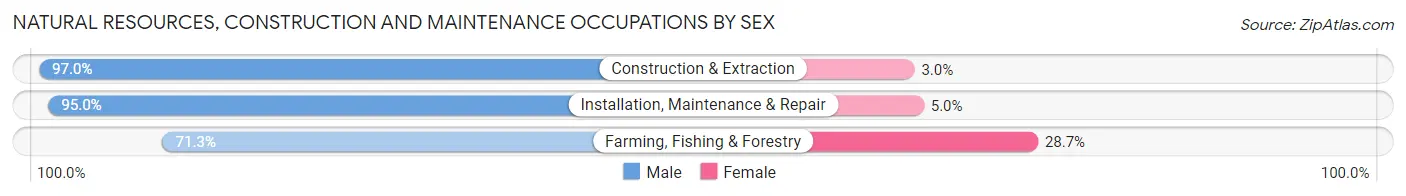
| Occupation | Male | Female |
| Farming, Fishing & Forestry | 1,904 (71.3%) | 767 (28.7%) |
| Construction & Extraction | 161,919 (97.0%) | 5,045 (3.0%) |
| Installation, Maintenance & Repair | 63,024 (95.0%) | 3,287 (5.0%) |
| Total (Category) | 226,847 (96.1%) | 9,099 (3.9%) |
| Total (Overall) | 2,085,307 (50.7%) | 2,023,375 (49.2%) |
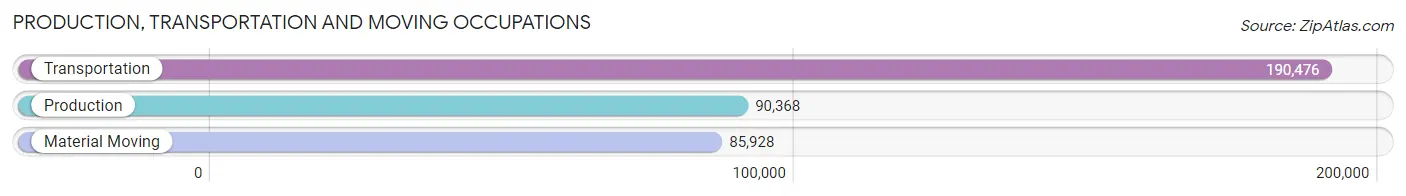
Production, Transportation and Moving Occupations
The most common Production, Transportation and Moving occupations in New York are Transportation (190,476 | 4.6%), Production (90,368 | 2.2%), and Material Moving (85,928 | 2.1%).
Production, Transportation and Moving Occupations by Sex
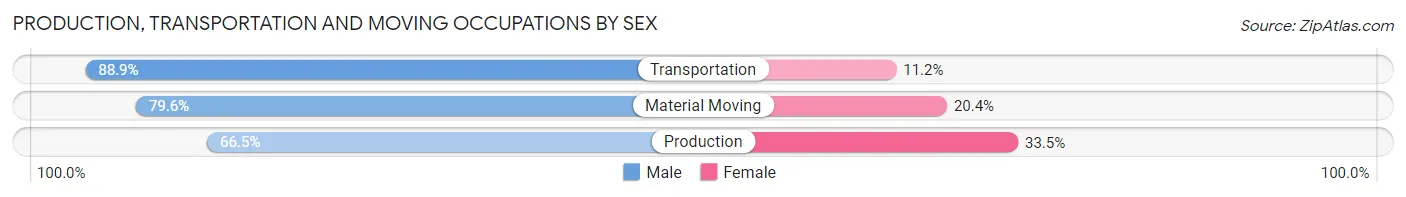
| Occupation | Male | Female |
| Production | 60,112 (66.5%) | 30,256 (33.5%) |
| Transportation | 169,246 (88.8%) | 21,230 (11.2%) |
| Material Moving | 68,366 (79.6%) | 17,562 (20.4%) |
| Total (Category) | 297,724 (81.2%) | 69,048 (18.8%) |
| Total (Overall) | 2,085,307 (50.7%) | 2,023,375 (49.2%) |
Employment Industries by Sex in New York
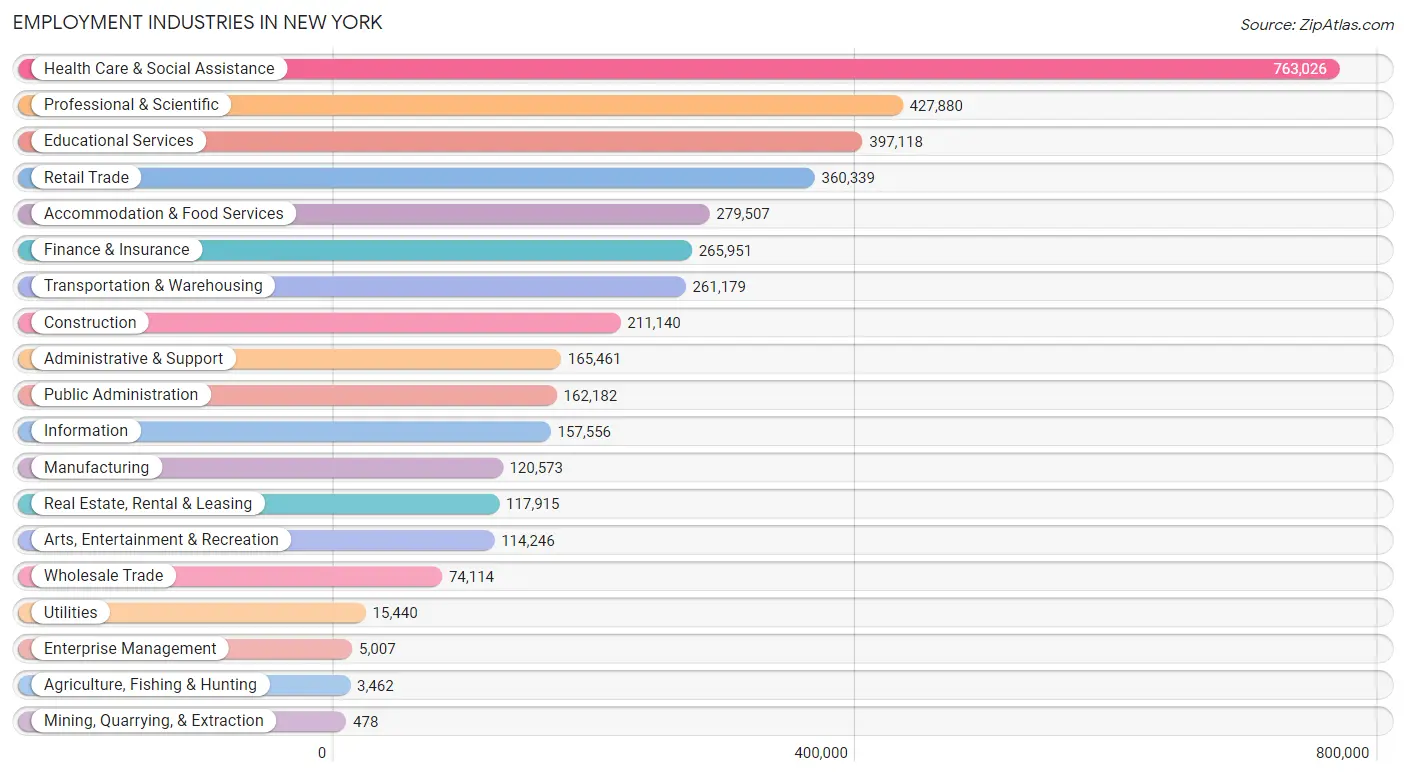
Employment Industries in New York
The major employment industries in New York include Health Care & Social Assistance (763,026 | 18.6%), Professional & Scientific (427,880 | 10.4%), Educational Services (397,118 | 9.7%), Retail Trade (360,339 | 8.8%), and Accommodation & Food Services (279,507 | 6.8%).
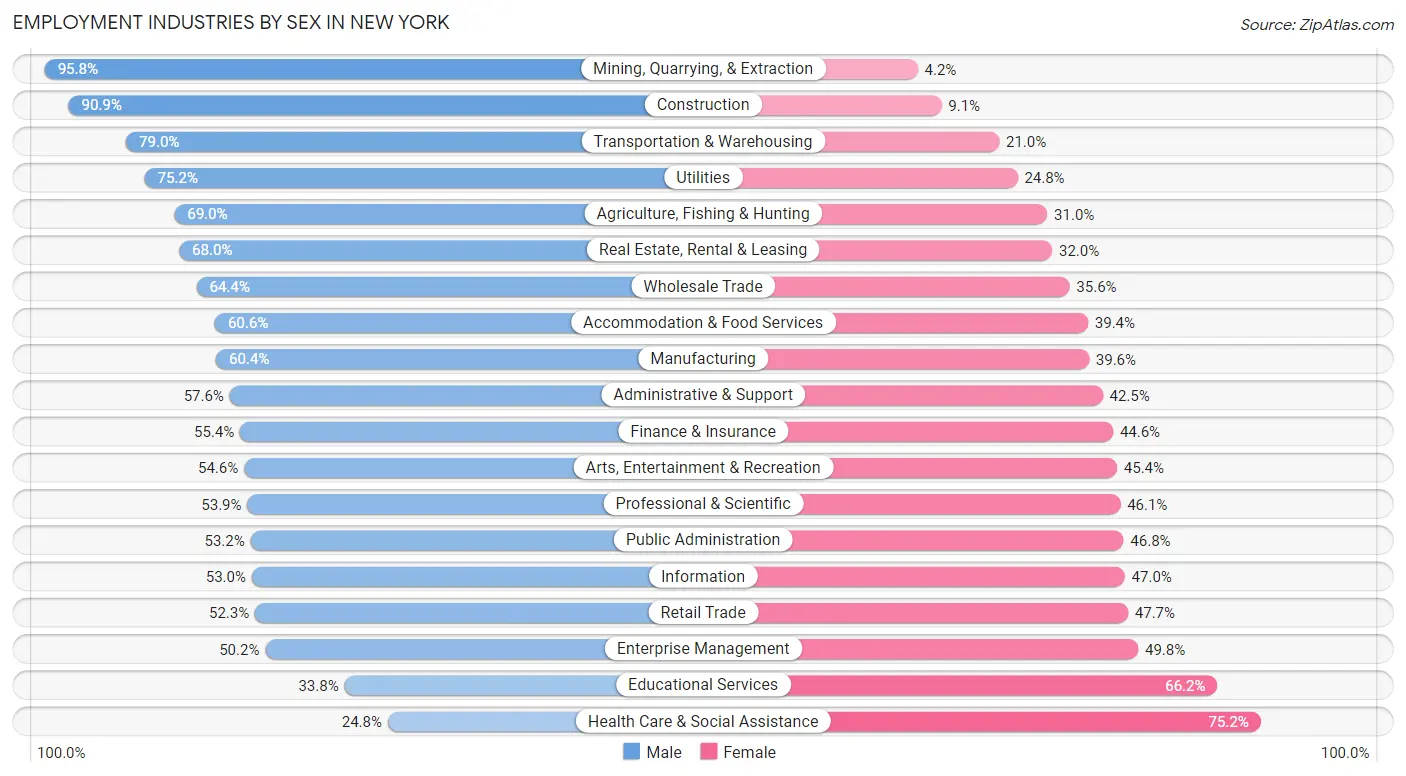
Employment Industries by Sex in New York
The New York industries that see more men than women are Mining, Quarrying, & Extraction (95.8%), Construction (90.9%), and Transportation & Warehousing (79.0%), whereas the industries that tend to have a higher number of women are Health Care & Social Assistance (75.2%), Educational Services (66.2%), and Enterprise Management (49.8%).
| Industry | Male | Female |
| Agriculture, Fishing & Hunting | 2,389 (69.0%) | 1,073 (31.0%) |
| Mining, Quarrying, & Extraction | 458 (95.8%) | 20 (4.2%) |
| Construction | 191,931 (90.9%) | 19,209 (9.1%) |
| Manufacturing | 72,789 (60.4%) | 47,784 (39.6%) |
| Wholesale Trade | 47,728 (64.4%) | 26,386 (35.6%) |
| Retail Trade | 188,474 (52.3%) | 171,865 (47.7%) |
| Transportation & Warehousing | 206,241 (79.0%) | 54,938 (21.0%) |
| Utilities | 11,605 (75.2%) | 3,835 (24.8%) |
| Information | 83,455 (53.0%) | 74,101 (47.0%) |
| Finance & Insurance | 147,317 (55.4%) | 118,634 (44.6%) |
| Real Estate, Rental & Leasing | 80,179 (68.0%) | 37,736 (32.0%) |
| Professional & Scientific | 230,583 (53.9%) | 197,297 (46.1%) |
| Enterprise Management | 2,513 (50.2%) | 2,494 (49.8%) |
| Administrative & Support | 95,223 (57.6%) | 70,238 (42.4%) |
| Educational Services | 134,193 (33.8%) | 262,925 (66.2%) |
| Health Care & Social Assistance | 189,372 (24.8%) | 573,654 (75.2%) |
| Arts, Entertainment & Recreation | 62,350 (54.6%) | 51,896 (45.4%) |
| Accommodation & Food Services | 169,323 (60.6%) | 110,184 (39.4%) |
| Public Administration | 86,335 (53.2%) | 75,847 (46.8%) |
| Total | 2,085,307 (50.7%) | 2,023,375 (49.2%) |
Education in New York
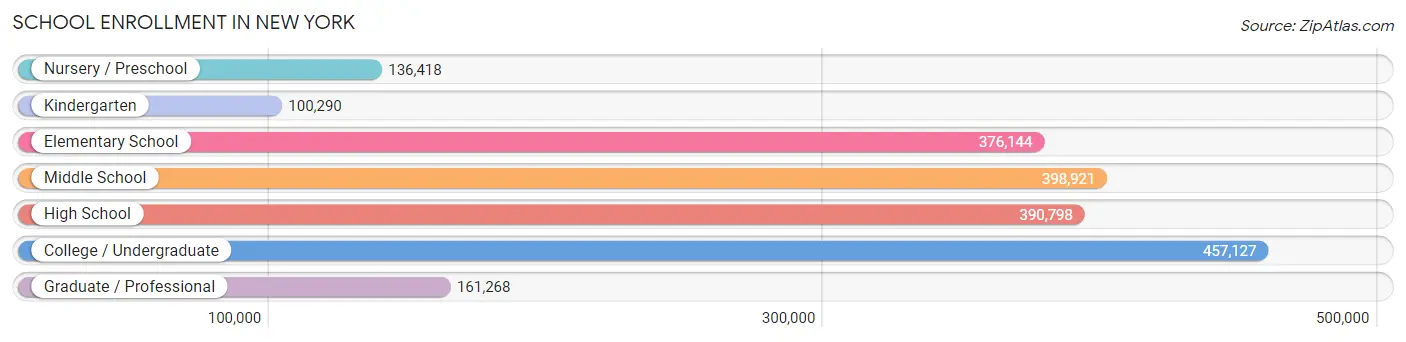
School Enrollment in New York
The most common levels of schooling among the 2,020,966 students in New York are college / undergraduate (457,127 | 22.6%), middle school (398,921 | 19.7%), and high school (390,798 | 19.3%).
| School Level | # Students | % Students |
| Nursery / Preschool | 136,418 | 6.8% |
| Kindergarten | 100,290 | 5.0% |
| Elementary School | 376,144 | 18.6% |
| Middle School | 398,921 | 19.7% |
| High School | 390,798 | 19.3% |
| College / Undergraduate | 457,127 | 22.6% |
| Graduate / Professional | 161,268 | 8.0% |
| Total | 2,020,966 | 100.0% |
School Enrollment by Age by Funding Source in New York
Out of a total of 2,020,966 students who are enrolled in schools in New York, 559,808 (27.7%) attend a private institution, while the remaining 1,461,158 (72.3%) are enrolled in public schools. The age group of 25 to 34 year olds has the highest likelihood of being enrolled in private schools, with 77,779 (46.4% in the age bracket) enrolled. Conversely, the age group of 5 to 9 year old has the lowest likelihood of being enrolled in a private school, with 366,737 (80.9% in the age bracket) attending a public institution.
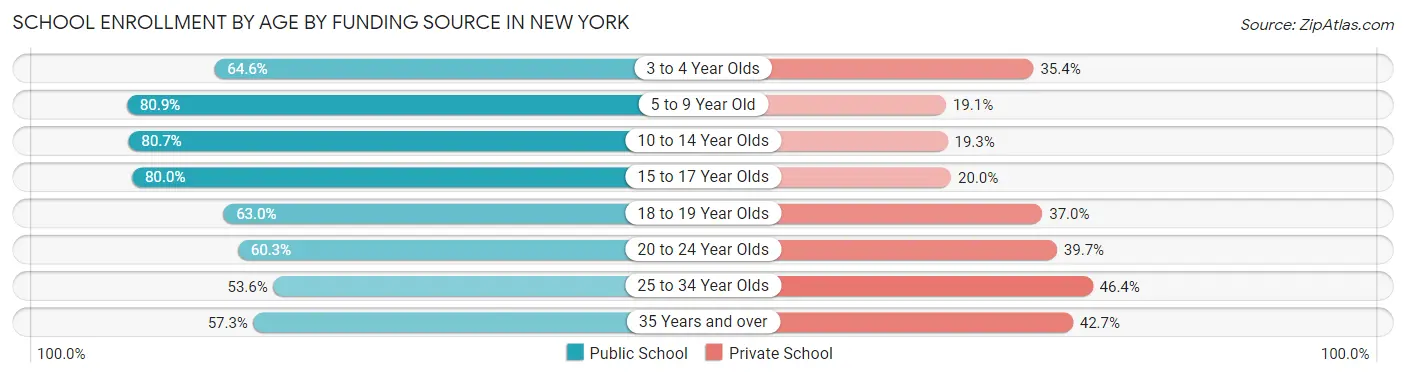
| Age Bracket | Public School | Private School |
| 3 to 4 Year Olds | 86,897 (64.6%) | 47,538 (35.4%) |
| 5 to 9 Year Old | 366,737 (80.9%) | 86,343 (19.1%) |
| 10 to 14 Year Olds | 394,387 (80.7%) | 94,547 (19.3%) |
| 15 to 17 Year Olds | 217,069 (80.0%) | 54,303 (20.0%) |
| 18 to 19 Year Olds | 95,028 (63.0%) | 55,812 (37.0%) |
| 20 to 24 Year Olds | 144,446 (60.3%) | 95,193 (39.7%) |
| 25 to 34 Year Olds | 89,954 (53.6%) | 77,779 (46.4%) |
| 35 Years and over | 65,891 (57.3%) | 49,042 (42.7%) |
| Total | 1,461,158 (72.3%) | 559,808 (27.7%) |
Educational Attainment by Field of Study in New York
Business (476,261 | 17.7%), social sciences (334,774 | 12.5%), visual & performing arts (247,441 | 9.2%), science & technology (213,337 | 7.9%), and literature & languages (181,368 | 6.8%) are the most common fields of study among 2,685,456 individuals in New York who have obtained a bachelor's degree or higher.
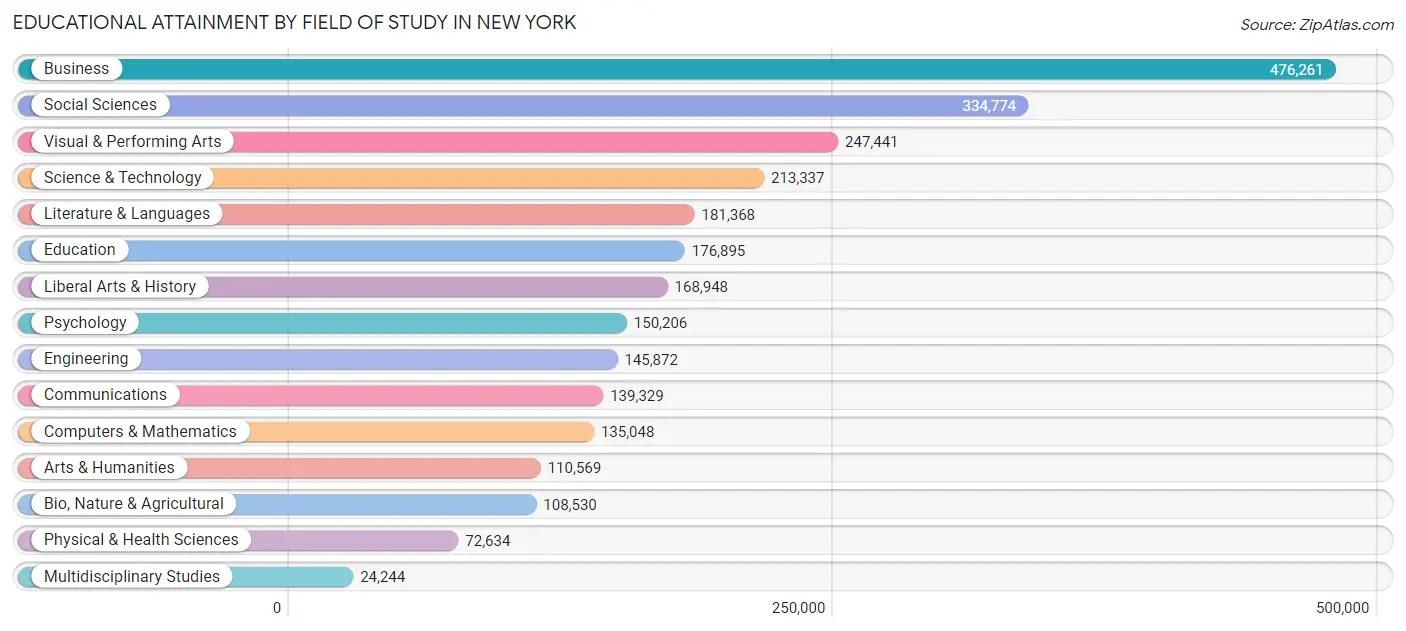
| Field of Study | # Graduates | % Graduates |
| Computers & Mathematics | 135,048 | 5.0% |
| Bio, Nature & Agricultural | 108,530 | 4.0% |
| Physical & Health Sciences | 72,634 | 2.7% |
| Psychology | 150,206 | 5.6% |
| Social Sciences | 334,774 | 12.5% |
| Engineering | 145,872 | 5.4% |
| Multidisciplinary Studies | 24,244 | 0.9% |
| Science & Technology | 213,337 | 7.9% |
| Business | 476,261 | 17.7% |
| Education | 176,895 | 6.6% |
| Literature & Languages | 181,368 | 6.8% |
| Liberal Arts & History | 168,948 | 6.3% |
| Visual & Performing Arts | 247,441 | 9.2% |
| Communications | 139,329 | 5.2% |
| Arts & Humanities | 110,569 | 4.1% |
| Total | 2,685,456 | 100.0% |
Transportation & Commute in New York
Vehicle Availability by Sex in New York
The most prevalent vehicle ownership categories in New York are males with no vehicle (860,449, accounting for 42.6%) and females with no vehicle (918,905, making up 44.5%).
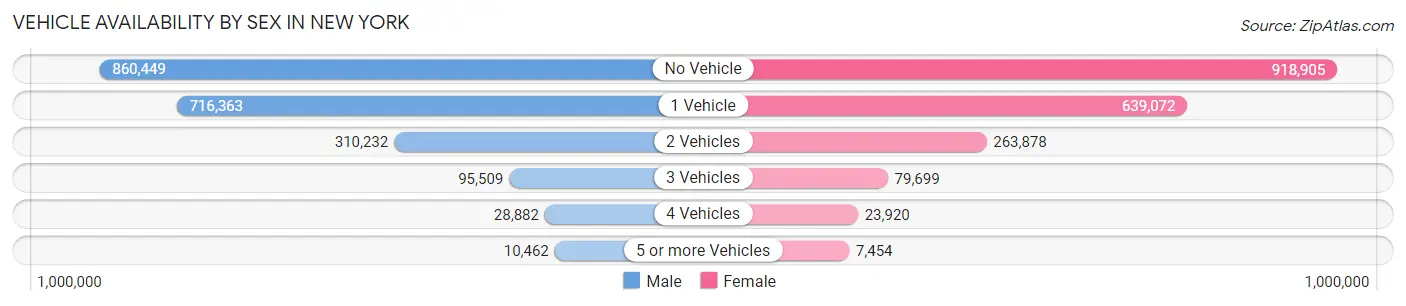
| Vehicles Available | Male | Female |
| No Vehicle | 860,449 (42.6%) | 918,905 (47.5%) |
| 1 Vehicle | 716,363 (35.4%) | 639,072 (33.1%) |
| 2 Vehicles | 310,232 (15.3%) | 263,878 (13.7%) |
| 3 Vehicles | 95,509 (4.7%) | 79,699 (4.1%) |
| 4 Vehicles | 28,882 (1.4%) | 23,920 (1.2%) |
| 5 or more Vehicles | 10,462 (0.5%) | 7,454 (0.4%) |
| Total | 2,021,897 (100.0%) | 1,932,928 (100.0%) |
Commute Time in New York
The most frequently occuring commute durations in New York are 60 to 89 minutes (658,451 commuters, 19.0%), 45 to 59 minutes (561,768 commuters, 16.2%), and 30 to 34 minutes (560,061 commuters, 16.1%).
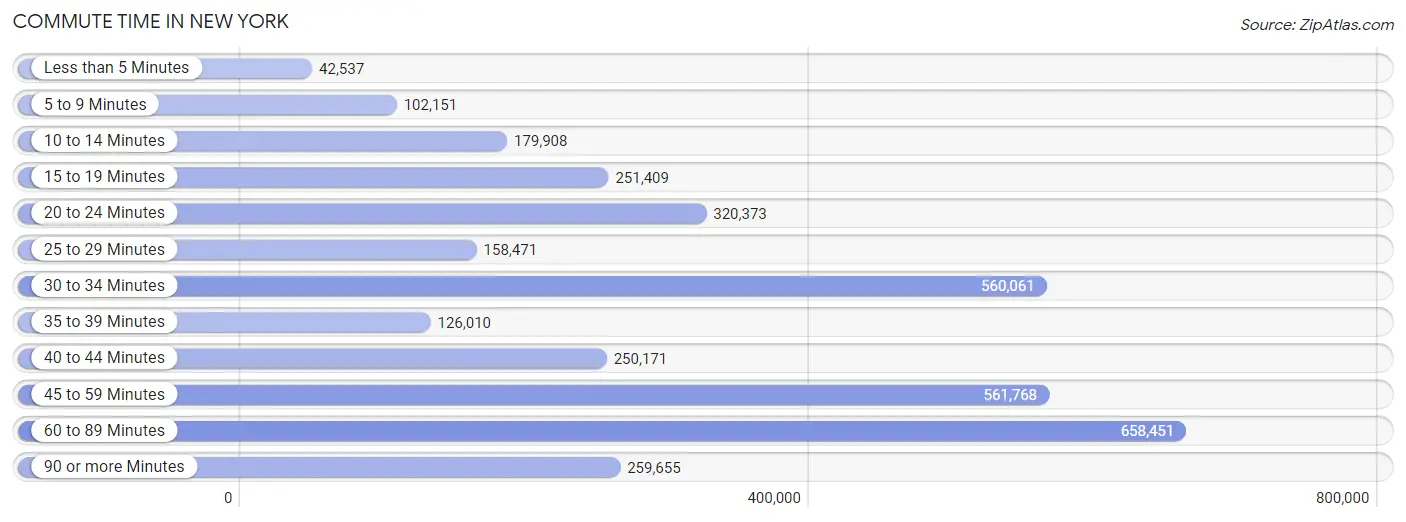
| Commute Time | # Commuters | % Commuters |
| Less than 5 Minutes | 42,537 | 1.2% |
| 5 to 9 Minutes | 102,151 | 2.9% |
| 10 to 14 Minutes | 179,908 | 5.2% |
| 15 to 19 Minutes | 251,409 | 7.2% |
| 20 to 24 Minutes | 320,373 | 9.2% |
| 25 to 29 Minutes | 158,471 | 4.6% |
| 30 to 34 Minutes | 560,061 | 16.1% |
| 35 to 39 Minutes | 126,010 | 3.6% |
| 40 to 44 Minutes | 250,171 | 7.2% |
| 45 to 59 Minutes | 561,768 | 16.2% |
| 60 to 89 Minutes | 658,451 | 19.0% |
| 90 or more Minutes | 259,655 | 7.5% |
Commute Time by Sex in New York
The most common commute times in New York are 60 to 89 minutes (349,178 commuters, 19.5%) for males and 60 to 89 minutes (309,273 commuters, 18.4%) for females.
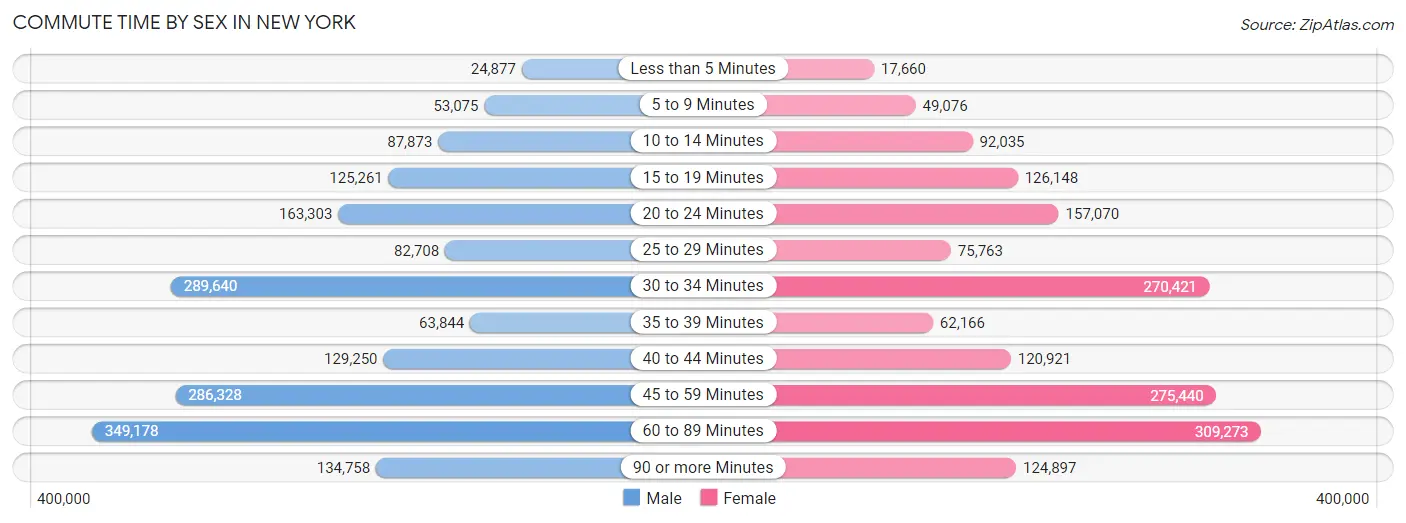
| Commute Time | Male | Female |
| Less than 5 Minutes | 24,877 (1.4%) | 17,660 (1.1%) |
| 5 to 9 Minutes | 53,075 (3.0%) | 49,076 (2.9%) |
| 10 to 14 Minutes | 87,873 (4.9%) | 92,035 (5.5%) |
| 15 to 19 Minutes | 125,261 (7.0%) | 126,148 (7.5%) |
| 20 to 24 Minutes | 163,303 (9.1%) | 157,070 (9.3%) |
| 25 to 29 Minutes | 82,708 (4.6%) | 75,763 (4.5%) |
| 30 to 34 Minutes | 289,640 (16.2%) | 270,421 (16.1%) |
| 35 to 39 Minutes | 63,844 (3.6%) | 62,166 (3.7%) |
| 40 to 44 Minutes | 129,250 (7.2%) | 120,921 (7.2%) |
| 45 to 59 Minutes | 286,328 (16.0%) | 275,440 (16.4%) |
| 60 to 89 Minutes | 349,178 (19.5%) | 309,273 (18.4%) |
| 90 or more Minutes | 134,758 (7.5%) | 124,897 (7.4%) |
Time of Departure to Work by Sex in New York
The most frequent times of departure to work in New York are 8:00 AM to 8:29 AM (259,204, 14.5%) for males and 8:00 AM to 8:29 AM (306,098, 18.2%) for females.
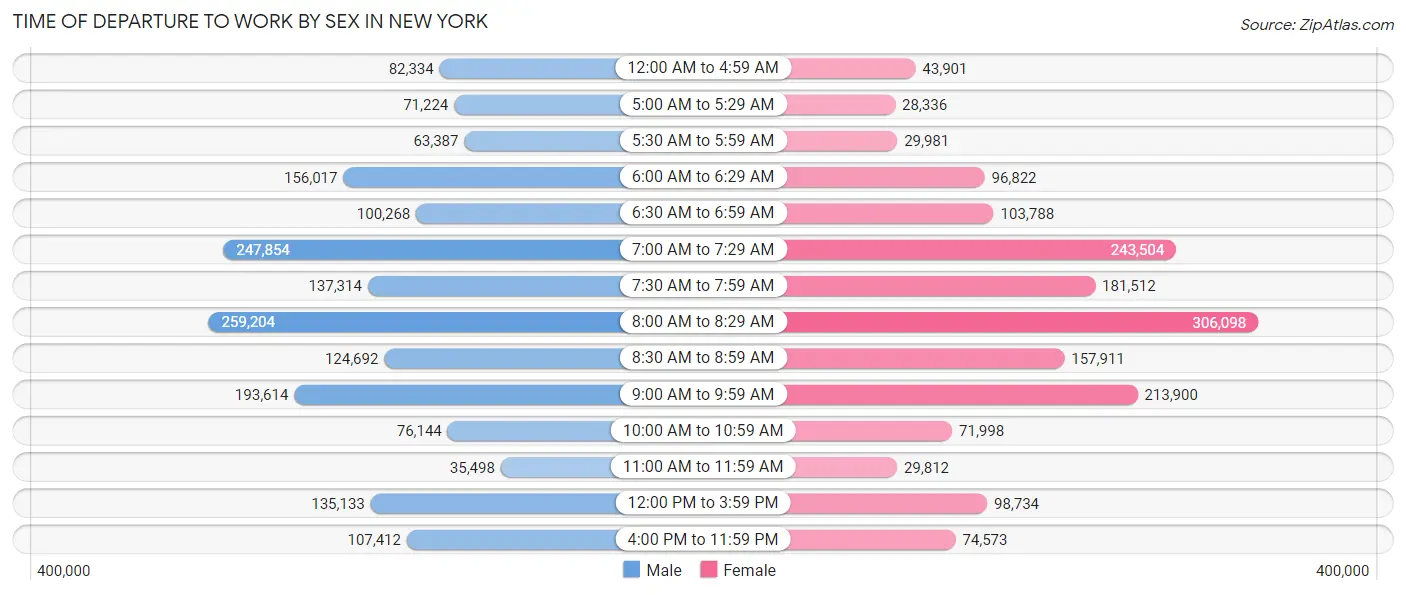
| Time of Departure | Male | Female |
| 12:00 AM to 4:59 AM | 82,334 (4.6%) | 43,901 (2.6%) |
| 5:00 AM to 5:29 AM | 71,224 (4.0%) | 28,336 (1.7%) |
| 5:30 AM to 5:59 AM | 63,387 (3.5%) | 29,981 (1.8%) |
| 6:00 AM to 6:29 AM | 156,017 (8.7%) | 96,822 (5.8%) |
| 6:30 AM to 6:59 AM | 100,268 (5.6%) | 103,788 (6.2%) |
| 7:00 AM to 7:29 AM | 247,854 (13.9%) | 243,504 (14.5%) |
| 7:30 AM to 7:59 AM | 137,314 (7.7%) | 181,512 (10.8%) |
| 8:00 AM to 8:29 AM | 259,204 (14.5%) | 306,098 (18.2%) |
| 8:30 AM to 8:59 AM | 124,692 (7.0%) | 157,911 (9.4%) |
| 9:00 AM to 9:59 AM | 193,614 (10.8%) | 213,900 (12.7%) |
| 10:00 AM to 10:59 AM | 76,144 (4.3%) | 71,998 (4.3%) |
| 11:00 AM to 11:59 AM | 35,498 (2.0%) | 29,812 (1.8%) |
| 12:00 PM to 3:59 PM | 135,133 (7.5%) | 98,734 (5.9%) |
| 4:00 PM to 11:59 PM | 107,412 (6.0%) | 74,573 (4.4%) |
| Total | 1,790,095 (100.0%) | 1,680,870 (100.0%) |
Housing Occupancy in New York
Occupancy by Ownership in New York
Of the total 3,282,804 dwellings in New York, owner-occupied units account for 1,081,125 (32.9%), while renter-occupied units make up 2,201,679 (67.1%).
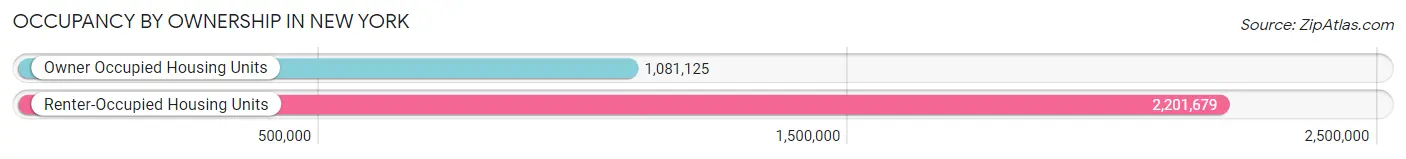
| Occupancy | # Housing Units | % Housing Units |
| Owner Occupied Housing Units | 1,081,125 | 32.9% |
| Renter-Occupied Housing Units | 2,201,679 | 67.1% |
| Total Occupied Housing Units | 3,282,804 | 100.0% |
Occupancy by Household Size in New York

| Household Size | # Housing Units | % Housing Units |
| 1-Person Household | 1,075,277 | 32.8% |
| 2-Person Household | 942,100 | 28.7% |
| 3-Person Household | 539,001 | 16.4% |
| 4+ Person Household | 726,426 | 22.1% |
| Total Housing Units | 3,282,804 | 100.0% |
Occupancy by Ownership by Household Size in New York
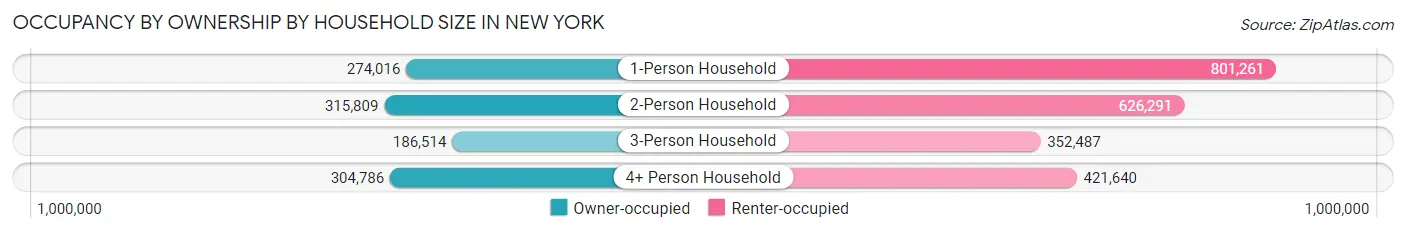
| Household Size | Owner-occupied | Renter-occupied |
| 1-Person Household | 274,016 (25.5%) | 801,261 (74.5%) |
| 2-Person Household | 315,809 (33.5%) | 626,291 (66.5%) |
| 3-Person Household | 186,514 (34.6%) | 352,487 (65.4%) |
| 4+ Person Household | 304,786 (42.0%) | 421,640 (58.0%) |
| Total Housing Units | 1,081,125 (32.9%) | 2,201,679 (67.1%) |
Occupancy by Educational Attainment in New York
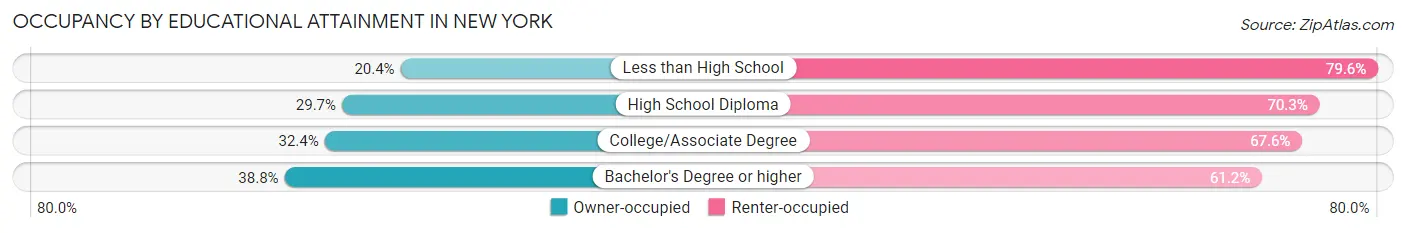
| Household Size | Owner-occupied | Renter-occupied |
| Less than High School | 96,227 (20.4%) | 375,700 (79.6%) |
| High School Diploma | 203,674 (29.7%) | 482,629 (70.3%) |
| College/Associate Degree | 218,351 (32.4%) | 455,044 (67.6%) |
| Bachelor's Degree or higher | 562,873 (38.8%) | 888,306 (61.2%) |
Occupancy by Age of Householder in New York
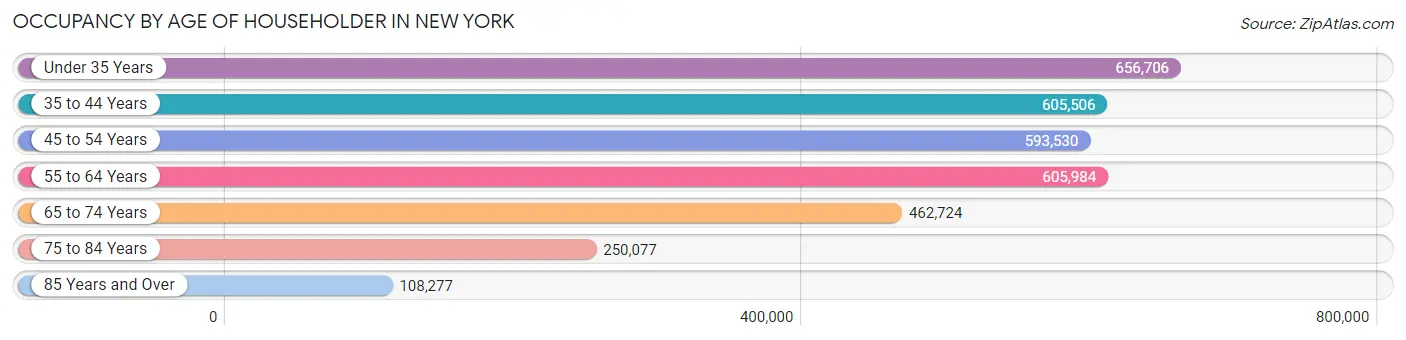
| Age Bracket | # Households | % Households |
| Under 35 Years | 656,706 | 20.0% |
| 35 to 44 Years | 605,506 | 18.4% |
| 45 to 54 Years | 593,530 | 18.1% |
| 55 to 64 Years | 605,984 | 18.5% |
| 65 to 74 Years | 462,724 | 14.1% |
| 75 to 84 Years | 250,077 | 7.6% |
| 85 Years and Over | 108,277 | 3.3% |
| Total | 3,282,804 | 100.0% |
Housing Finances in New York
Median Income by Occupancy in New York
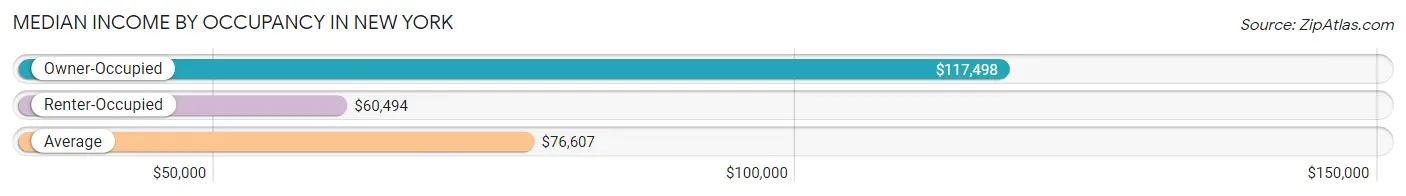
| Occupancy Type | # Households | Median Income |
| Owner-Occupied | 1,081,125 (32.9%) | $117,498 |
| Renter-Occupied | 2,201,679 (67.1%) | $60,494 |
| Average | 3,282,804 (100.0%) | $76,607 |
Occupancy by Householder Income Bracket in New York
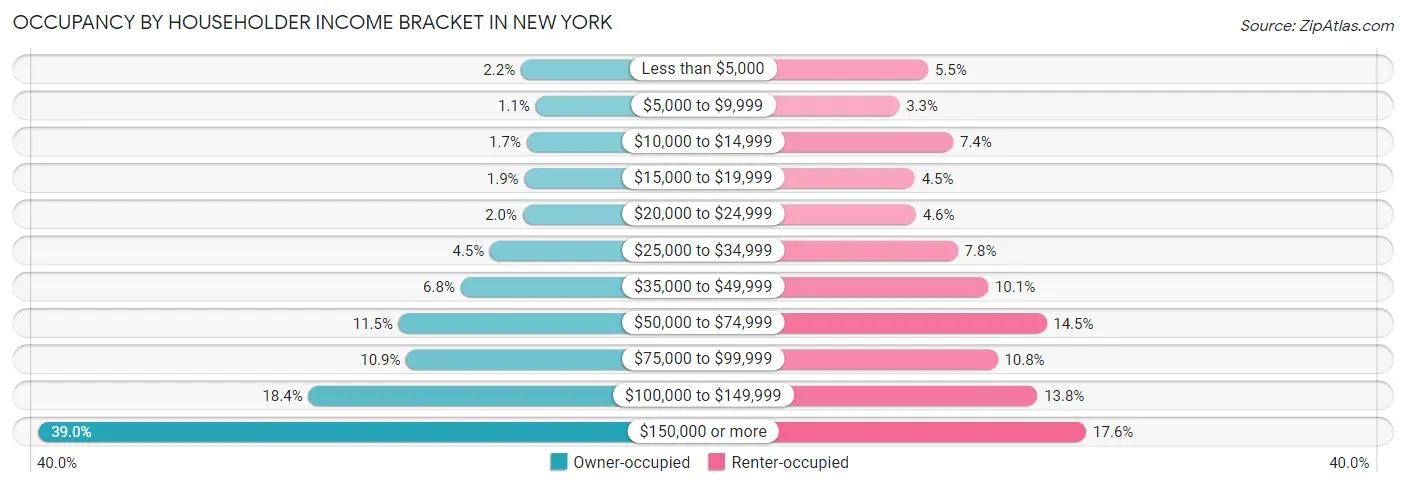
| Income Bracket | Owner-occupied | Renter-occupied |
| Less than $5,000 | 23,554 (2.2%) | 121,628 (5.5%) |
| $5,000 to $9,999 | 11,596 (1.1%) | 73,229 (3.3%) |
| $10,000 to $14,999 | 18,848 (1.7%) | 163,527 (7.4%) |
| $15,000 to $19,999 | 20,782 (1.9%) | 99,301 (4.5%) |
| $20,000 to $24,999 | 22,075 (2.0%) | 101,109 (4.6%) |
| $25,000 to $34,999 | 48,954 (4.5%) | 171,299 (7.8%) |
| $35,000 to $49,999 | 73,222 (6.8%) | 222,096 (10.1%) |
| $50,000 to $74,999 | 124,196 (11.5%) | 319,949 (14.5%) |
| $75,000 to $99,999 | 118,101 (10.9%) | 238,008 (10.8%) |
| $100,000 to $149,999 | 198,581 (18.4%) | 304,631 (13.8%) |
| $150,000 or more | 421,216 (39.0%) | 386,902 (17.6%) |
| Total | 1,081,125 (100.0%) | 2,201,679 (100.0%) |
Monthly Housing Cost Tiers in New York
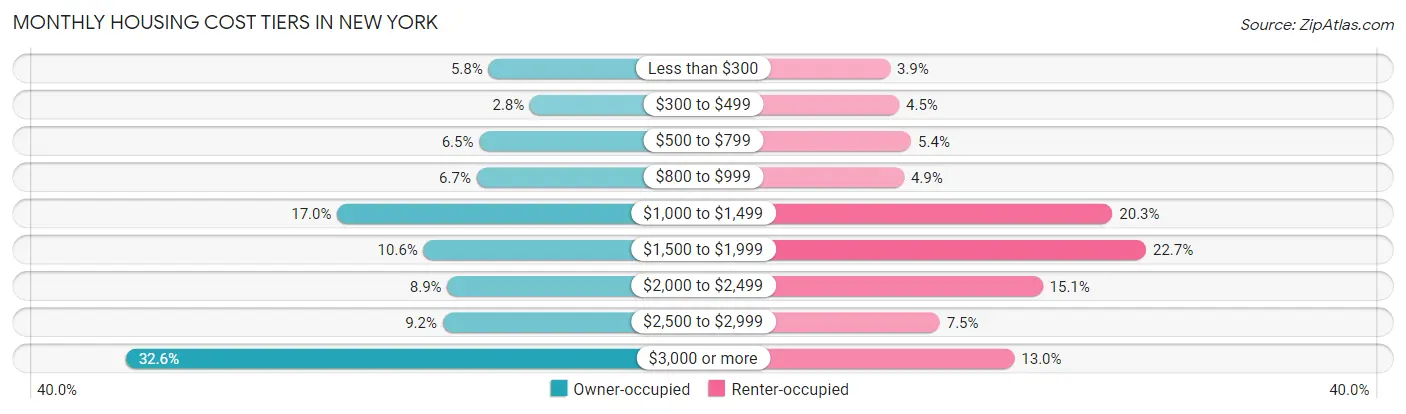
| Monthly Cost | Owner-occupied | Renter-occupied |
| Less than $300 | 63,057 (5.8%) | 85,244 (3.9%) |
| $300 to $499 | 29,942 (2.8%) | 99,967 (4.5%) |
| $500 to $799 | 70,372 (6.5%) | 119,624 (5.4%) |
| $800 to $999 | 72,410 (6.7%) | 107,859 (4.9%) |
| $1,000 to $1,499 | 183,421 (17.0%) | 445,880 (20.3%) |
| $1,500 to $1,999 | 114,688 (10.6%) | 500,460 (22.7%) |
| $2,000 to $2,499 | 95,780 (8.9%) | 332,568 (15.1%) |
| $2,500 to $2,999 | 99,512 (9.2%) | 166,029 (7.5%) |
| $3,000 or more | 351,943 (32.6%) | 286,917 (13.0%) |
| Total | 1,081,125 (100.0%) | 2,201,679 (100.0%) |
Physical Housing Characteristics in New York
Housing Structures in New York
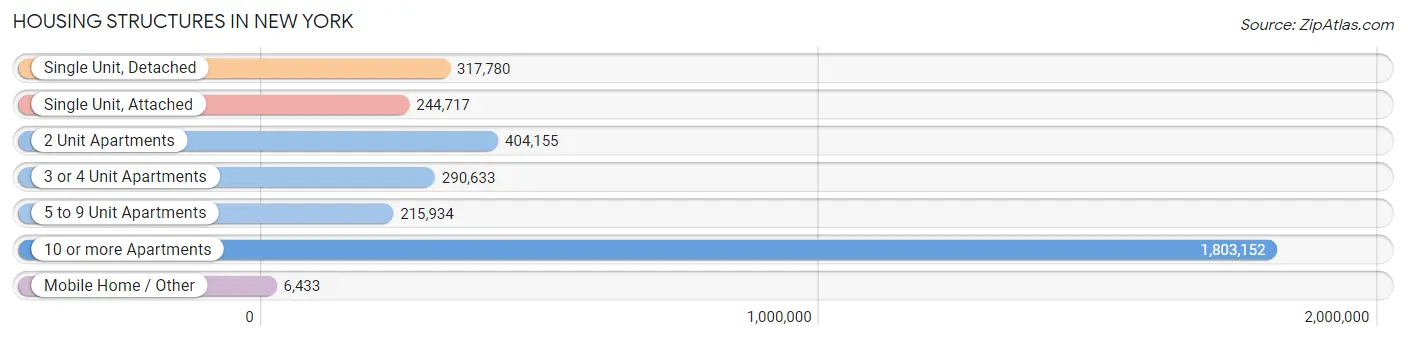
| Structure Type | # Housing Units | % Housing Units |
| Single Unit, Detached | 317,780 | 9.7% |
| Single Unit, Attached | 244,717 | 7.4% |
| 2 Unit Apartments | 404,155 | 12.3% |
| 3 or 4 Unit Apartments | 290,633 | 8.8% |
| 5 to 9 Unit Apartments | 215,934 | 6.6% |
| 10 or more Apartments | 1,803,152 | 54.9% |
| Mobile Home / Other | 6,433 | 0.2% |
| Total | 3,282,804 | 100.0% |
Housing Structures by Occupancy in New York
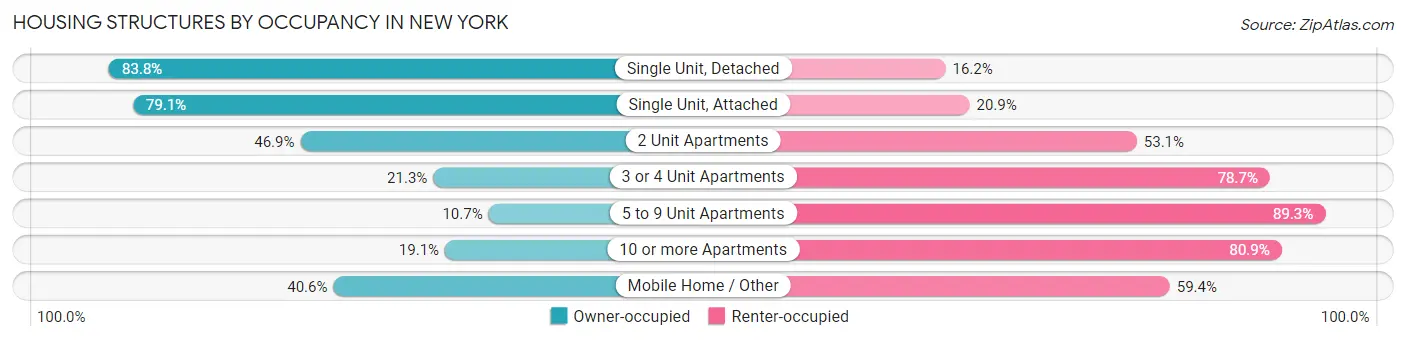
| Structure Type | Owner-occupied | Renter-occupied |
| Single Unit, Detached | 266,172 (83.8%) | 51,608 (16.2%) |
| Single Unit, Attached | 193,674 (79.1%) | 51,043 (20.9%) |
| 2 Unit Apartments | 189,626 (46.9%) | 214,529 (53.1%) |
| 3 or 4 Unit Apartments | 62,022 (21.3%) | 228,611 (78.7%) |
| 5 to 9 Unit Apartments | 23,070 (10.7%) | 192,864 (89.3%) |
| 10 or more Apartments | 343,951 (19.1%) | 1,459,201 (80.9%) |
| Mobile Home / Other | 2,610 (40.6%) | 3,823 (59.4%) |
| Total | 1,081,125 (32.9%) | 2,201,679 (67.1%) |
Housing Structures by Number of Rooms in New York
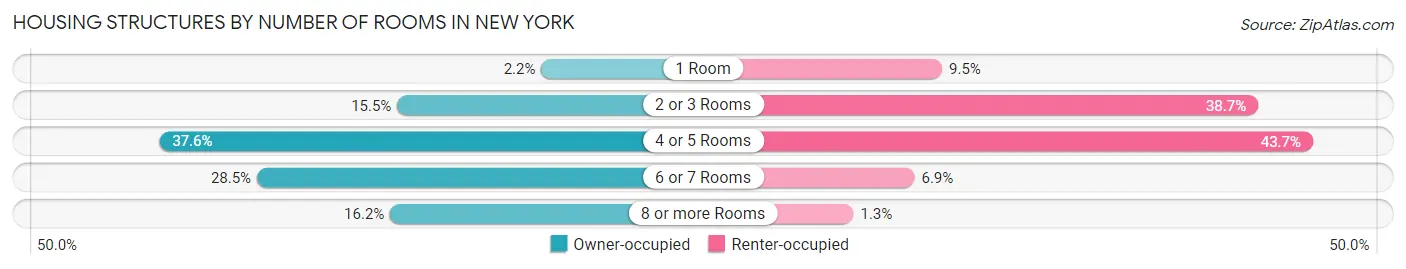
| Number of Rooms | Owner-occupied | Renter-occupied |
| 1 Room | 23,898 (2.2%) | 207,984 (9.5%) |
| 2 or 3 Rooms | 167,973 (15.5%) | 851,134 (38.7%) |
| 4 or 5 Rooms | 405,919 (37.6%) | 962,756 (43.7%) |
| 6 or 7 Rooms | 308,271 (28.5%) | 151,970 (6.9%) |
| 8 or more Rooms | 175,064 (16.2%) | 27,835 (1.3%) |
| Total | 1,081,125 (100.0%) | 2,201,679 (100.0%) |
Housing Structure by Heating Type in New York
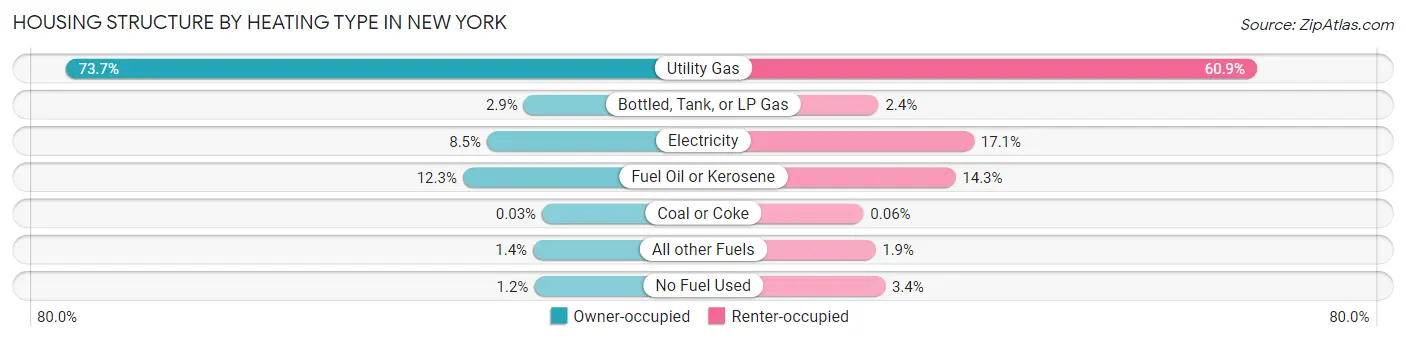
| Heating Type | Owner-occupied | Renter-occupied |
| Utility Gas | 796,379 (73.7%) | 1,340,087 (60.9%) |
| Bottled, Tank, or LP Gas | 30,911 (2.9%) | 52,636 (2.4%) |
| Electricity | 92,316 (8.5%) | 377,202 (17.1%) |
| Fuel Oil or Kerosene | 132,652 (12.3%) | 314,081 (14.3%) |
| Coal or Coke | 378 (0.0%) | 1,386 (0.1%) |
| All other Fuels | 15,314 (1.4%) | 41,561 (1.9%) |
| No Fuel Used | 13,175 (1.2%) | 74,726 (3.4%) |
| Total | 1,081,125 (100.0%) | 2,201,679 (100.0%) |
Household Vehicle Usage in New York
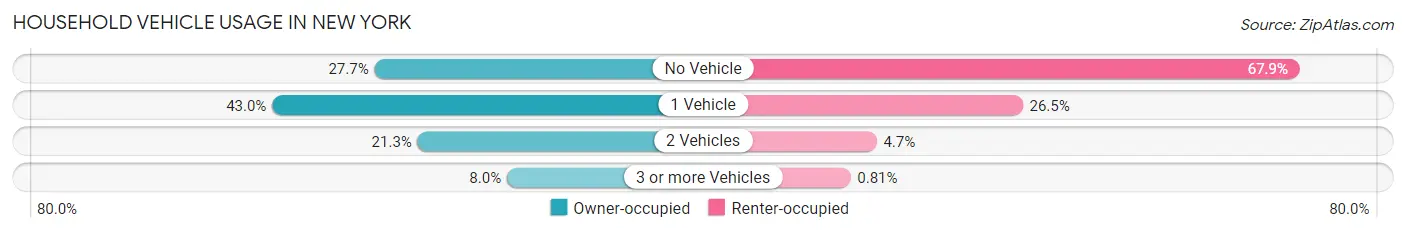
| Vehicles per Household | Owner-occupied | Renter-occupied |
| No Vehicle | 299,950 (27.7%) | 1,495,891 (67.9%) |
| 1 Vehicle | 465,057 (43.0%) | 584,190 (26.5%) |
| 2 Vehicles | 230,145 (21.3%) | 103,687 (4.7%) |
| 3 or more Vehicles | 85,973 (8.0%) | 17,911 (0.8%) |
| Total | 1,081,125 (100.0%) | 2,201,679 (100.0%) |
Real Estate & Mortgages in New York
Real Estate and Mortgage Overview in New York
| Characteristic | Without Mortgage | With Mortgage |
| Housing Units | 467,930 | 613,195 |
| Median Property Value | $714,200 | $742,800 |
| Median Household Income | $90,975 | $282,645 |
| Monthly Housing Costs | $1,071 | $331,645 |
| Real Estate Taxes | $6,324 | $64,295 |
Property Value by Mortgage Status in New York
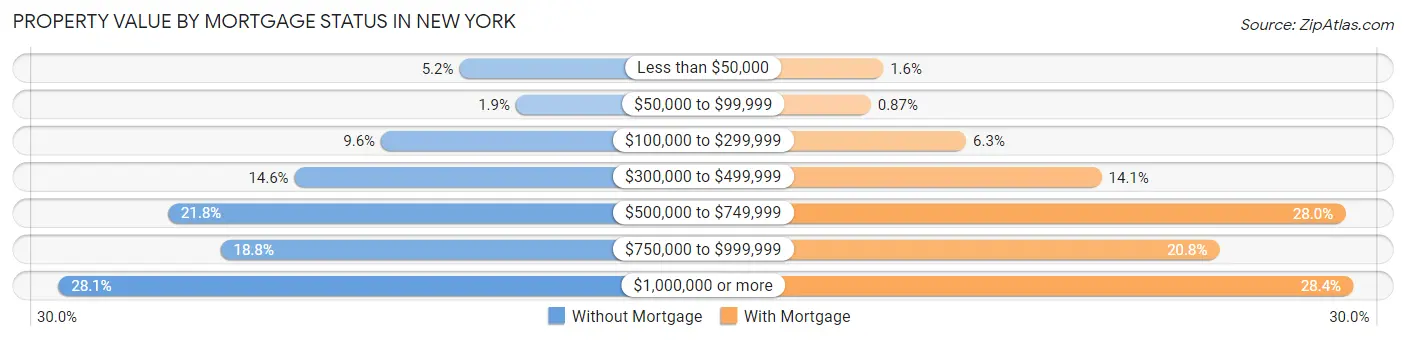
| Property Value | Without Mortgage | With Mortgage |
| Less than $50,000 | 24,152 (5.2%) | 9,667 (1.6%) |
| $50,000 to $99,999 | 9,030 (1.9%) | 5,350 (0.9%) |
| $100,000 to $299,999 | 45,110 (9.6%) | 38,753 (6.3%) |
| $300,000 to $499,999 | 68,212 (14.6%) | 86,225 (14.1%) |
| $500,000 to $749,999 | 102,071 (21.8%) | 171,539 (28.0%) |
| $750,000 to $999,999 | 87,990 (18.8%) | 127,401 (20.8%) |
| $1,000,000 or more | 131,365 (28.1%) | 174,260 (28.4%) |
| Total | 467,930 (100.0%) | 613,195 (100.0%) |
Household Income by Mortgage Status in New York
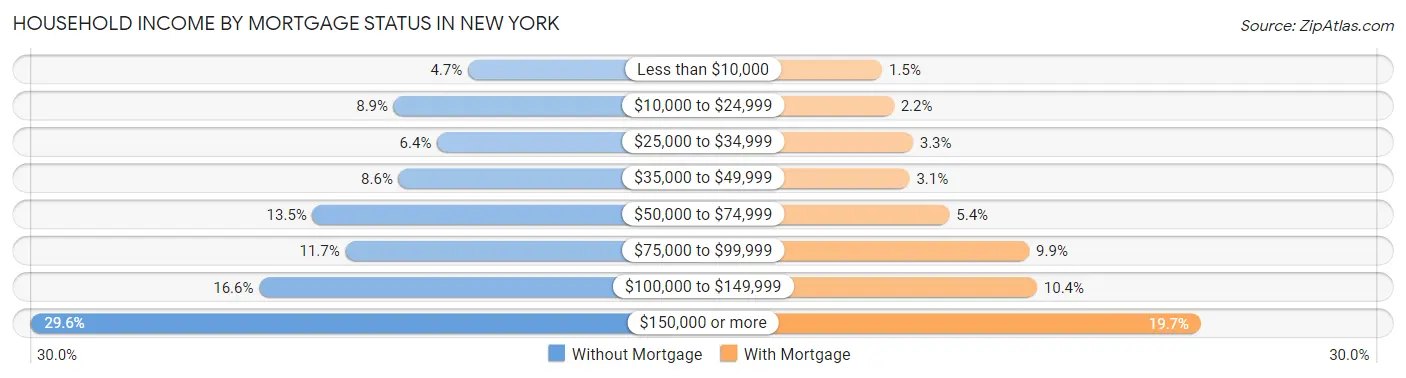
| Household Income | Without Mortgage | With Mortgage |
| Less than $10,000 | 21,813 (4.7%) | 9,333 (1.5%) |
| $10,000 to $24,999 | 41,643 (8.9%) | 13,337 (2.2%) |
| $25,000 to $34,999 | 30,055 (6.4%) | 20,062 (3.3%) |
| $35,000 to $49,999 | 40,341 (8.6%) | 18,899 (3.1%) |
| $50,000 to $74,999 | 63,337 (13.5%) | 32,881 (5.4%) |
| $75,000 to $99,999 | 54,560 (11.7%) | 60,859 (9.9%) |
| $100,000 to $149,999 | 77,610 (16.6%) | 63,541 (10.4%) |
| $150,000 or more | 138,571 (29.6%) | 120,971 (19.7%) |
| Total | 467,930 (100.0%) | 613,195 (100.0%) |
Property Value to Household Income Ratio in New York
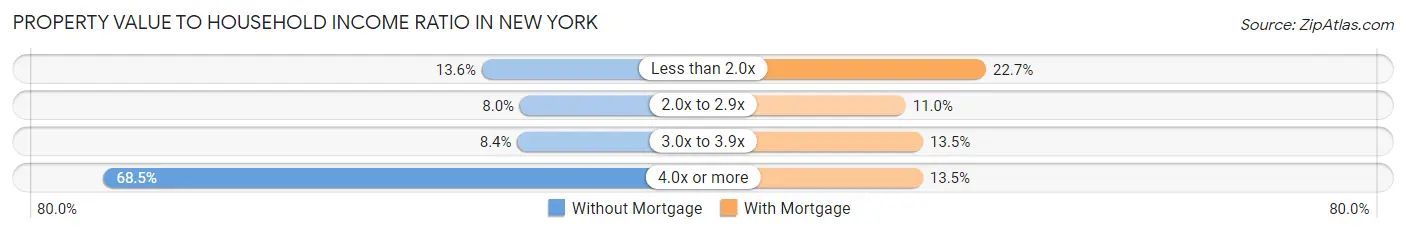
| Value-to-Income Ratio | Without Mortgage | With Mortgage |
| Less than 2.0x | 63,566 (13.6%) | 139,047 (22.7%) |
| 2.0x to 2.9x | 37,597 (8.0%) | 67,588 (11.0%) |
| 3.0x to 3.9x | 39,343 (8.4%) | 83,045 (13.5%) |
| 4.0x or more | 320,643 (68.5%) | 82,754 (13.5%) |
| Total | 467,930 (100.0%) | 613,195 (100.0%) |
Real Estate Taxes by Mortgage Status in New York
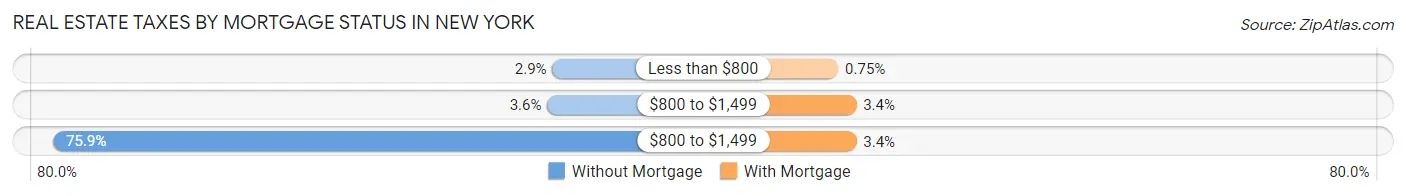
| Property Taxes | Without Mortgage | With Mortgage |
| Less than $800 | 13,416 (2.9%) | 4,575 (0.7%) |
| $800 to $1,499 | 16,984 (3.6%) | 20,723 (3.4%) |
| $800 to $1,499 | 354,934 (75.8%) | 20,929 (3.4%) |
| Total | 467,930 (100.0%) | 613,195 (100.0%) |
Health & Disability in New York
Health Insurance Coverage by Age in New York
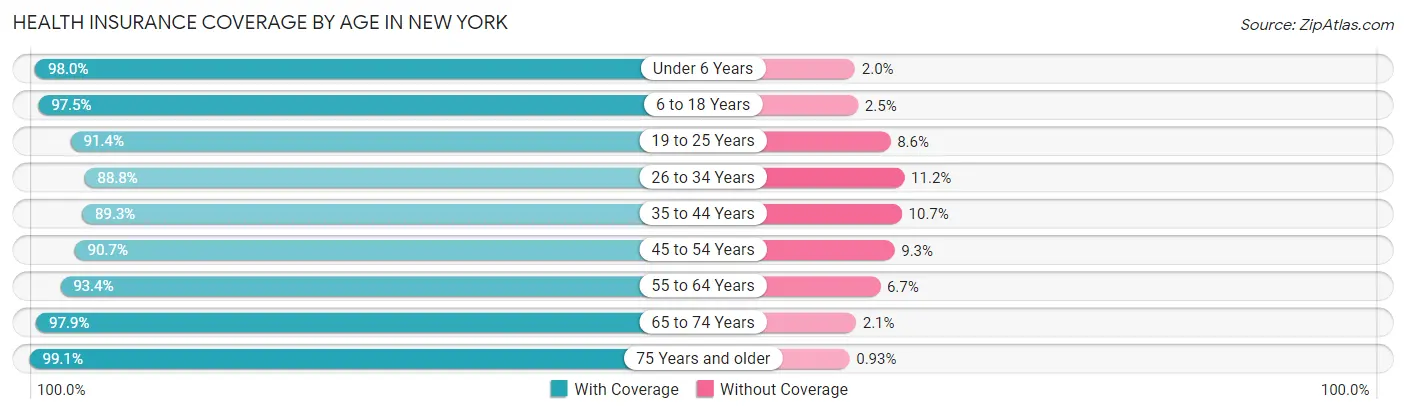
| Age Bracket | With Coverage | Without Coverage |
| Under 6 Years | 602,523 (98.0%) | 12,116 (2.0%) |
| 6 to 18 Years | 1,218,837 (97.5%) | 31,793 (2.5%) |
| 19 to 25 Years | 707,571 (91.4%) | 66,200 (8.6%) |
| 26 to 34 Years | 1,179,923 (88.8%) | 148,285 (11.2%) |
| 35 to 44 Years | 1,061,340 (89.3%) | 127,078 (10.7%) |
| 45 to 54 Years | 969,081 (90.7%) | 99,653 (9.3%) |
| 55 to 64 Years | 969,540 (93.3%) | 69,092 (6.7%) |
| 65 to 74 Years | 736,777 (97.9%) | 16,090 (2.1%) |
| 75 Years and older | 544,065 (99.1%) | 5,106 (0.9%) |
| Total | 7,989,657 (93.3%) | 575,413 (6.7%) |
Health Insurance Coverage by Citizenship Status in New York
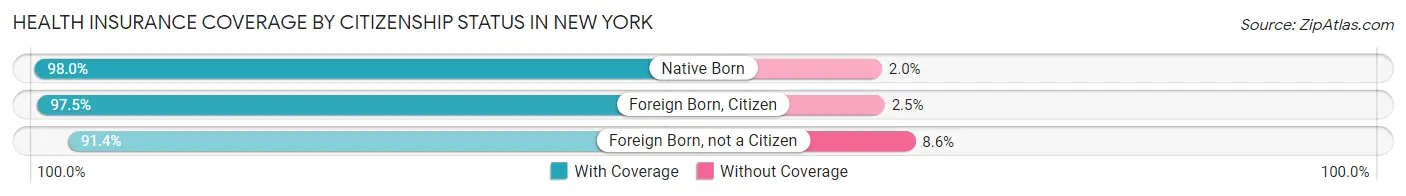
| Citizenship Status | With Coverage | Without Coverage |
| Native Born | 602,523 (98.0%) | 12,116 (2.0%) |
| Foreign Born, Citizen | 1,218,837 (97.5%) | 31,793 (2.5%) |
| Foreign Born, not a Citizen | 707,571 (91.4%) | 66,200 (8.6%) |
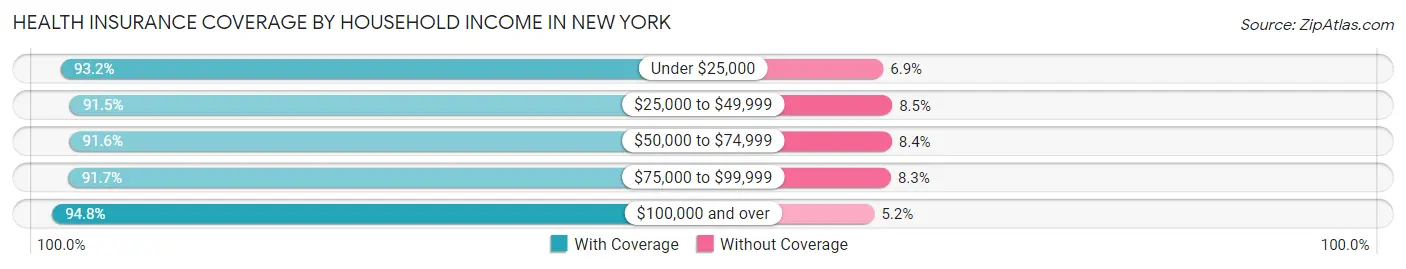
Health Insurance Coverage by Household Income in New York
| Household Income | With Coverage | Without Coverage |
| Under $25,000 | 1,138,295 (93.1%) | 83,667 (6.9%) |
| $25,000 to $49,999 | 1,118,719 (91.5%) | 104,021 (8.5%) |
| $50,000 to $74,999 | 1,029,759 (91.6%) | 94,974 (8.4%) |
| $75,000 to $99,999 | 858,609 (91.7%) | 77,470 (8.3%) |
| $100,000 and over | 3,702,012 (94.8%) | 202,242 (5.2%) |
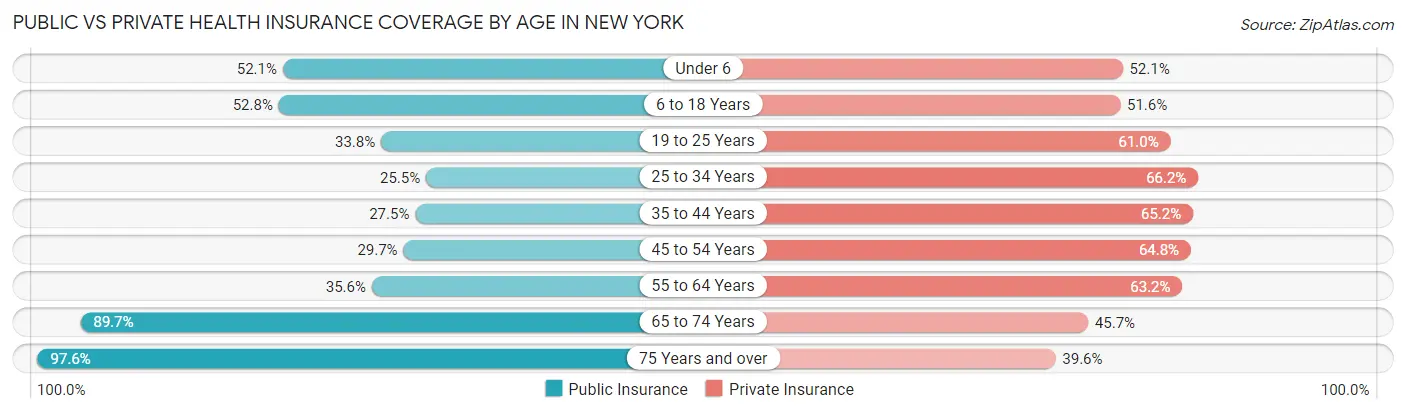
Public vs Private Health Insurance Coverage by Age in New York
| Age Bracket | Public Insurance | Private Insurance |
| Under 6 | 320,105 (52.1%) | 320,227 (52.1%) |
| 6 to 18 Years | 660,755 (52.8%) | 645,767 (51.6%) |
| 19 to 25 Years | 261,879 (33.8%) | 472,171 (61.0%) |
| 25 to 34 Years | 338,573 (25.5%) | 878,606 (66.1%) |
| 35 to 44 Years | 326,677 (27.5%) | 774,693 (65.2%) |
| 45 to 54 Years | 317,180 (29.7%) | 692,566 (64.8%) |
| 55 to 64 Years | 369,269 (35.5%) | 656,499 (63.2%) |
| 65 to 74 Years | 675,007 (89.7%) | 343,921 (45.7%) |
| 75 Years and over | 536,076 (97.6%) | 217,717 (39.6%) |
| Total | 3,805,521 (44.4%) | 5,002,167 (58.4%) |
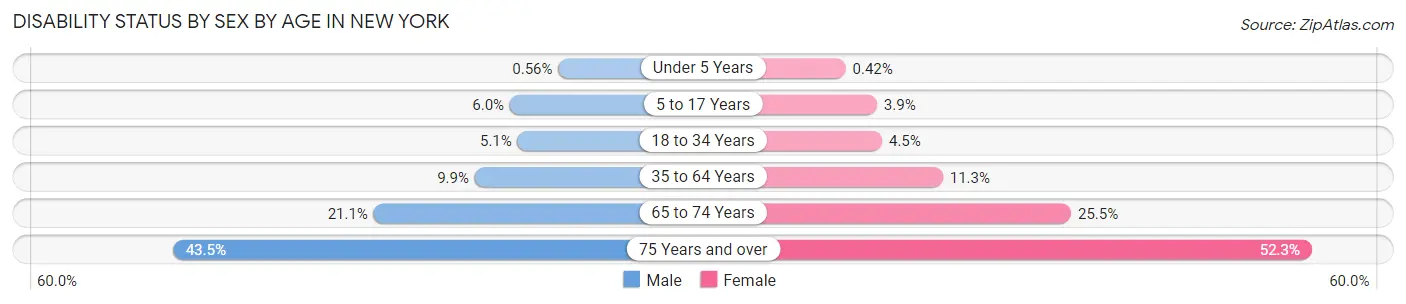
Disability Status by Sex by Age in New York
| Age Bracket | Male | Female |
| Under 5 Years | 1,492 (0.6%) | 1,060 (0.4%) |
| 5 to 17 Years | 38,057 (5.9%) | 23,919 (3.9%) |
| 18 to 34 Years | 54,623 (5.1%) | 50,286 (4.5%) |
| 35 to 64 Years | 157,193 (9.9%) | 191,382 (11.3%) |
| 65 to 74 Years | 70,465 (21.1%) | 107,048 (25.5%) |
| 75 Years and over | 90,311 (43.5%) | 178,774 (52.3%) |
Disability Class by Sex by Age in New York
Disability Class: Hearing Difficulty
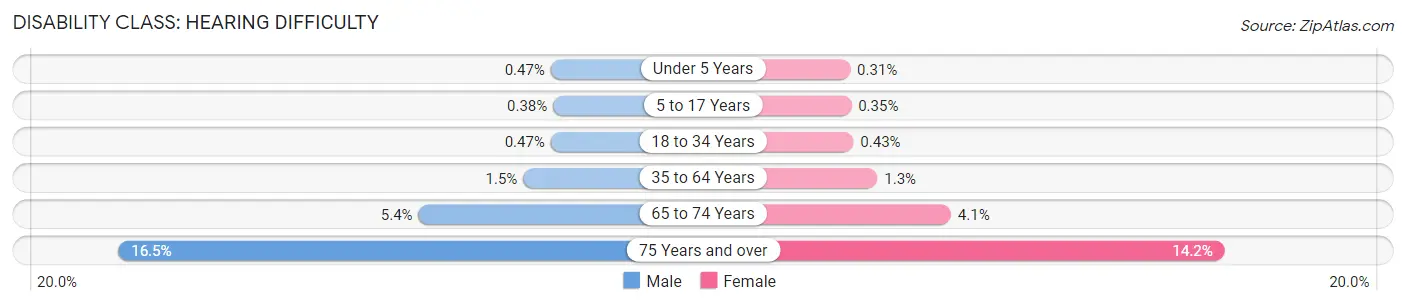
| Age Bracket | Male | Female |
| Under 5 Years | 1,239 (0.5%) | 793 (0.3%) |
| 5 to 17 Years | 2,447 (0.4%) | 2,126 (0.4%) |
| 18 to 34 Years | 5,007 (0.5%) | 4,817 (0.4%) |
| 35 to 64 Years | 23,690 (1.5%) | 22,534 (1.3%) |
| 65 to 74 Years | 17,950 (5.4%) | 16,966 (4.1%) |
| 75 Years and over | 34,300 (16.5%) | 48,542 (14.2%) |
Disability Class: Vision Difficulty
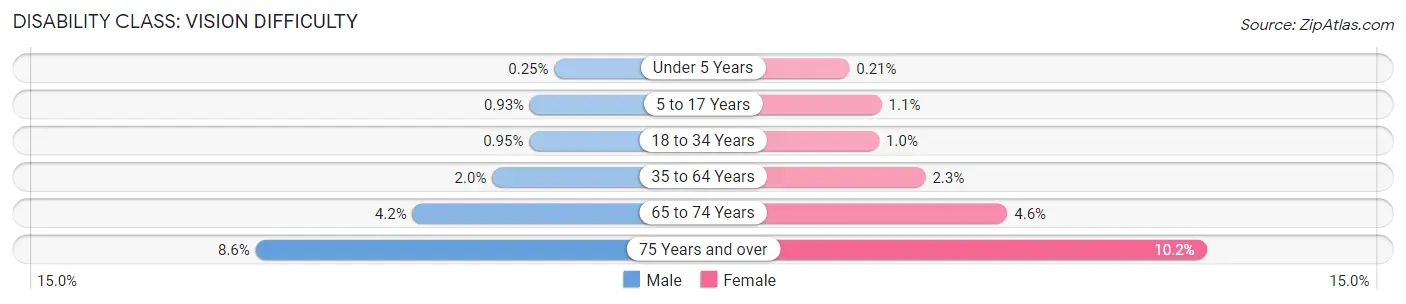
| Age Bracket | Male | Female |
| Under 5 Years | 665 (0.3%) | 523 (0.2%) |
| 5 to 17 Years | 5,963 (0.9%) | 6,796 (1.1%) |
| 18 to 34 Years | 10,189 (0.9%) | 11,675 (1.0%) |
| 35 to 64 Years | 31,538 (2.0%) | 39,548 (2.3%) |
| 65 to 74 Years | 14,001 (4.2%) | 19,319 (4.6%) |
| 75 Years and over | 17,793 (8.6%) | 34,683 (10.2%) |
Disability Class: Cognitive Difficulty
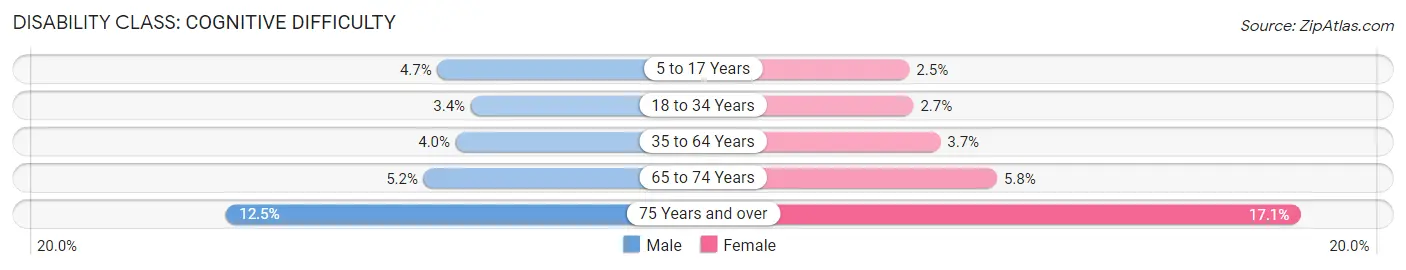
| Age Bracket | Male | Female |
| 5 to 17 Years | 29,894 (4.7%) | 15,352 (2.5%) |
| 18 to 34 Years | 36,866 (3.4%) | 29,864 (2.7%) |
| 35 to 64 Years | 63,713 (4.0%) | 62,324 (3.7%) |
| 65 to 74 Years | 17,277 (5.2%) | 24,136 (5.8%) |
| 75 Years and over | 25,980 (12.5%) | 58,226 (17.1%) |
Disability Class: Ambulatory Difficulty
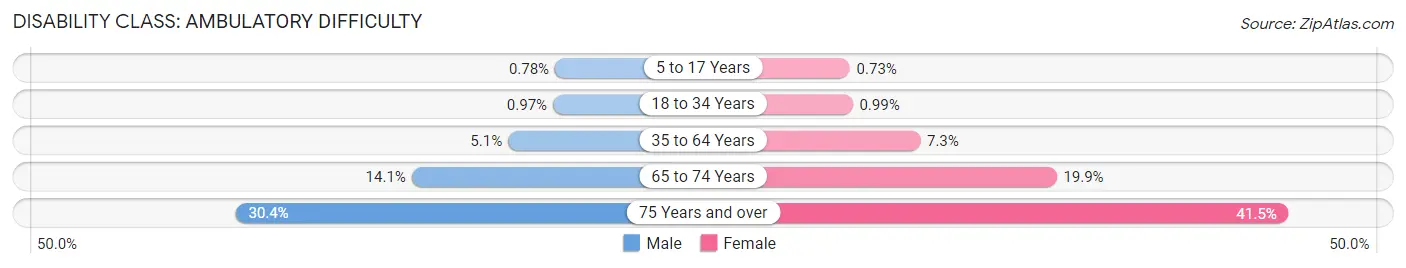
| Age Bracket | Male | Female |
| 5 to 17 Years | 4,997 (0.8%) | 4,441 (0.7%) |
| 18 to 34 Years | 10,412 (1.0%) | 11,131 (1.0%) |
| 35 to 64 Years | 82,052 (5.1%) | 123,442 (7.3%) |
| 65 to 74 Years | 46,953 (14.1%) | 83,541 (19.9%) |
| 75 Years and over | 63,173 (30.4%) | 141,628 (41.5%) |
Disability Class: Self-Care Difficulty
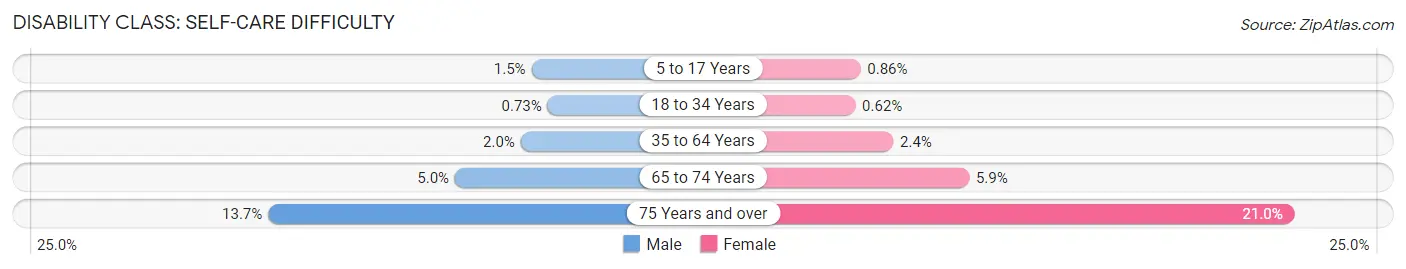
| Age Bracket | Male | Female |
| 5 to 17 Years | 9,455 (1.5%) | 5,275 (0.9%) |
| 18 to 34 Years | 7,879 (0.7%) | 6,966 (0.6%) |
| 35 to 64 Years | 31,622 (2.0%) | 40,393 (2.4%) |
| 65 to 74 Years | 16,794 (5.0%) | 24,749 (5.9%) |
| 75 Years and over | 28,445 (13.7%) | 71,758 (21.0%) |
Technology Access in New York
Computing Device Access in New York
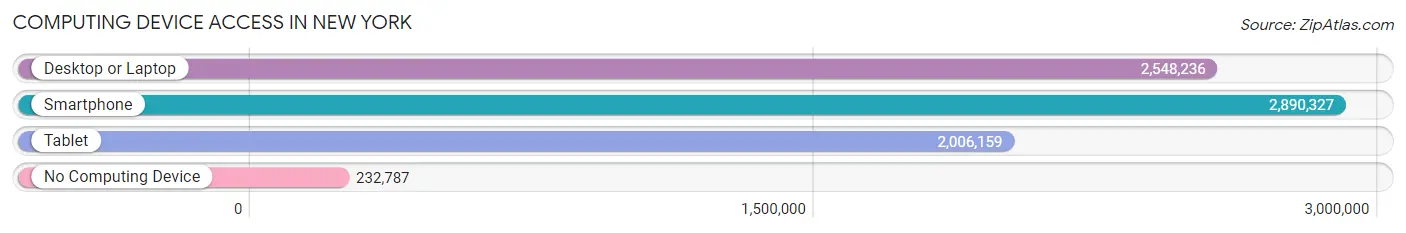
| Device Type | # Households | % Households |
| Desktop or Laptop | 2,548,236 | 77.6% |
| Smartphone | 2,890,327 | 88.0% |
| Tablet | 2,006,159 | 61.1% |
| No Computing Device | 232,787 | 7.1% |
| Total | 3,282,804 | 100.0% |
Internet Access in New York
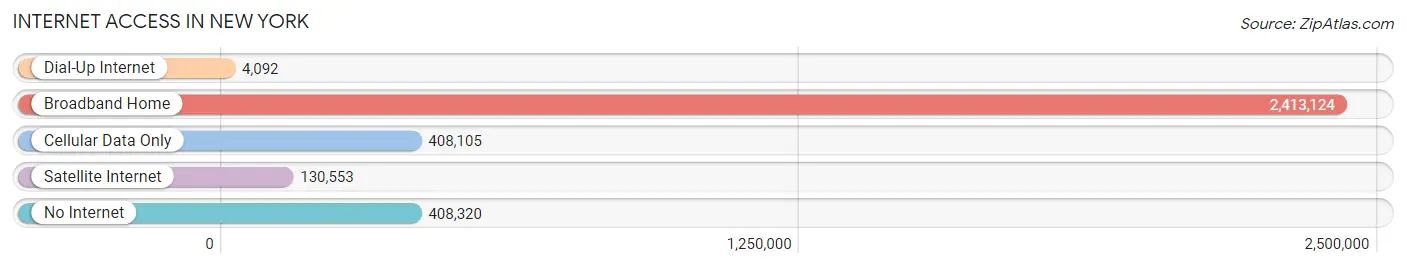
| Internet Type | # Households | % Households |
| Dial-Up Internet | 4,092 | 0.1% |
| Broadband Home | 2,413,124 | 73.5% |
| Cellular Data Only | 408,105 | 12.4% |
| Satellite Internet | 130,553 | 4.0% |
| No Internet | 408,320 | 12.4% |
| Total | 3,282,804 | 100.0% |
New York Summary
New York City is the most populous city in the United States and is located in the state of New York. It is a global hub of business, finance, media, art, fashion, research, technology, education, and entertainment. It is one of the most influential cities in the world and is home to the United Nations headquarters.
History
The history of New York City dates back to the 17th century when it was founded by Dutch settlers. The city was originally named New Amsterdam and was a major trading post for the Dutch West India Company. In 1664, the British took control of the city and renamed it New York after the Duke of York. The city quickly grew in size and importance and became the capital of the United States in 1785.
During the 19th century, New York City experienced a period of rapid growth and industrialization. It became the largest city in the United States and a major center of immigration. By the early 20th century, the city had become a major financial and cultural center.
Geography
New York City is located in the southeastern part of the state of New York. It is situated on the Atlantic coast at the mouth of the Hudson River. The city is divided into five boroughs: Manhattan, Brooklyn, Queens, the Bronx, and Staten Island. The city covers an area of 468.9 square miles and has a population of 8.6 million people.
The city is home to a variety of landscapes, from the bustling streets of Manhattan to the rolling hills of Staten Island. The city is also home to numerous parks, including Central Park, Prospect Park, and Flushing Meadows-Corona Park.
Economy
New York City is a major global financial center and is home to the New York Stock Exchange, the world’s largest stock exchange. The city is also home to numerous Fortune 500 companies, including JPMorgan Chase, Citigroup, and Goldman Sachs.
The city’s economy is also driven by its tourism industry. It is one of the most visited cities in the world and is home to numerous iconic landmarks, such as the Empire State Building, the Statue of Liberty, and Times Square.
Demographics
New York City is one of the most diverse cities in the world. According to the 2019 American Community Survey, the city’s population is 44.7% White, 28.6% Black or African American, 13.3% Hispanic or Latino, and 12.7% Asian. The city is also home to numerous immigrant communities, including Chinese, Indian, and Dominican.
The city’s population is also highly educated. According to the 2019 American Community Survey, 37.2% of the population has a bachelor’s degree or higher. The city is also home to numerous universities, including Columbia University, New York University, and the City University of New York.
Common Questions
What is Per Capita Income in New York?
Per Capita income in New York is $48,066.
What is the Median Family Income in New York?
Median Family Income in New York is $86,984.
What is the Median Household income in New York?
Median Household Income in New York is $76,607.
What is Income or Wage Gap in New York?
Income or Wage Gap in New York is 14.7%.
Women in New York earn 85.3 cents for every dollar earned by a man.
What is Family Income Deficit in New York?
Family Income Deficit in New York is $11,079.
Families that are below poverty line in New York earn $11,079 less on average than the poverty threshold level.
What is Inequality or Gini Index in New York?
Inequality or Gini Index in New York is 0.55.
What is the Total Population of New York?
Total Population of New York is 8,622,467.
What is the Total Male Population of New York?
Total Male Population of New York is 4,148,719.
What is the Total Female Population of New York?
Total Female Population of New York is 4,473,748.
What is the Ratio of Males per 100 Females in New York?
There are 92.73 Males per 100 Females in New York.
What is the Ratio of Females per 100 Males in New York?
There are 107.83 Females per 100 Males in New York.
What is the Median Population Age in New York?
Median Population Age in New York is 37.5 Years.
What is the Average Family Size in New York
Average Family Size in New York is 3.3 People.
What is the Average Household Size in New York
Average Household Size in New York is 2.6 People.
How Large is the Labor Force in New York?
There are 4,447,787 People in the Labor Forcein in New York.
What is the Percentage of People in the Labor Force in New York?
63.2% of People are in the Labor Force in New York.
What is the Unemployment Rate in New York?
Unemployment Rate in New York is 7.6%.