North Patchogue, NY Map & Demographics
North Patchogue Map
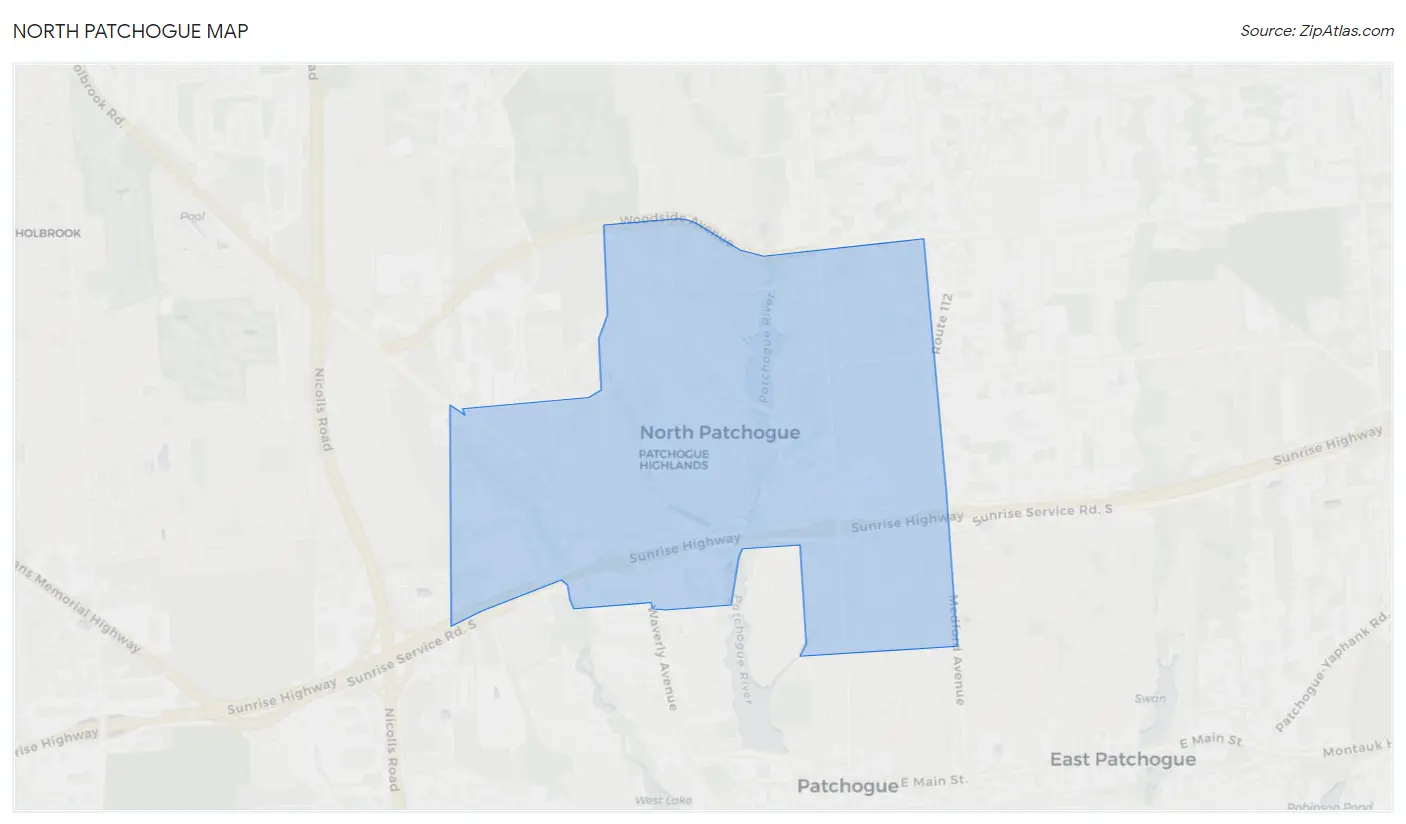
North Patchogue Overview
$44,655
PER CAPITA INCOME
$127,644
AVG FAMILY INCOME
$117,586
AVG HOUSEHOLD INCOME
38.5%
WAGE / INCOME GAP [ % ]
61.5¢/ $1
WAGE / INCOME GAP [ $ ]
0.41
INEQUALITY / GINI INDEX
7,800
TOTAL POPULATION
3,676
MALE POPULATION
4,124
FEMALE POPULATION
89.14
MALES / 100 FEMALES
112.19
FEMALES / 100 MALES
36.2
MEDIAN AGE
3.8
AVG FAMILY SIZE
3.3
AVG HOUSEHOLD SIZE
3,825
LABOR FORCE [ PEOPLE ]
63.9%
PERCENT IN LABOR FORCE
1.4%
UNEMPLOYMENT RATE
Income in North Patchogue
Income Overview in North Patchogue
Per Capita Income in North Patchogue is $44,655, while median incomes of families and households are $127,644 and $117,586 respectively.
| Characteristic | Number | Measure |
| Per Capita Income | 7,800 | $44,655 |
| Median Family Income | 1,887 | $127,644 |
| Mean Family Income | 1,887 | $159,868 |
| Median Household Income | 2,346 | $117,586 |
| Mean Household Income | 2,346 | $145,344 |
| Income Deficit | 1,887 | $0 |
| Wage / Income Gap (%) | 7,800 | 38.51% |
| Wage / Income Gap ($) | 7,800 | 61.49¢ per $1 |
| Gini / Inequality Index | 7,800 | 0.41 |
Earnings by Sex in North Patchogue
Average Earnings in North Patchogue are $55,552, $65,440 for men and $40,241 for women, a difference of 38.5%.
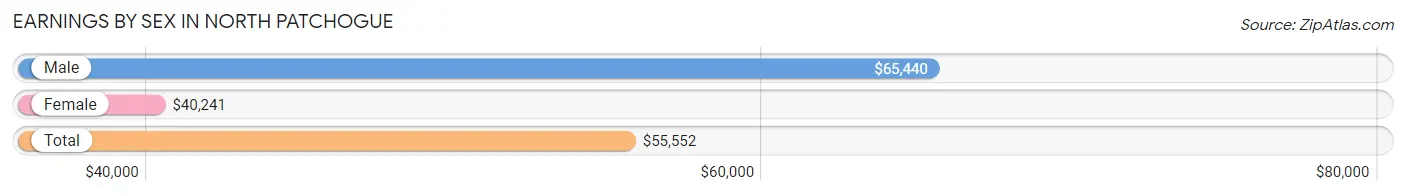
| Sex | Number | Average Earnings |
| Male | 2,055 (51.3%) | $65,440 |
| Female | 1,951 (48.7%) | $40,241 |
| Total | 4,006 (100.0%) | $55,552 |
Earnings by Sex by Income Bracket in North Patchogue
The most common earnings brackets in North Patchogue are $100,000+ for men (626 | 30.5%) and $75,000 to $99,999 for women (266 | 13.6%).
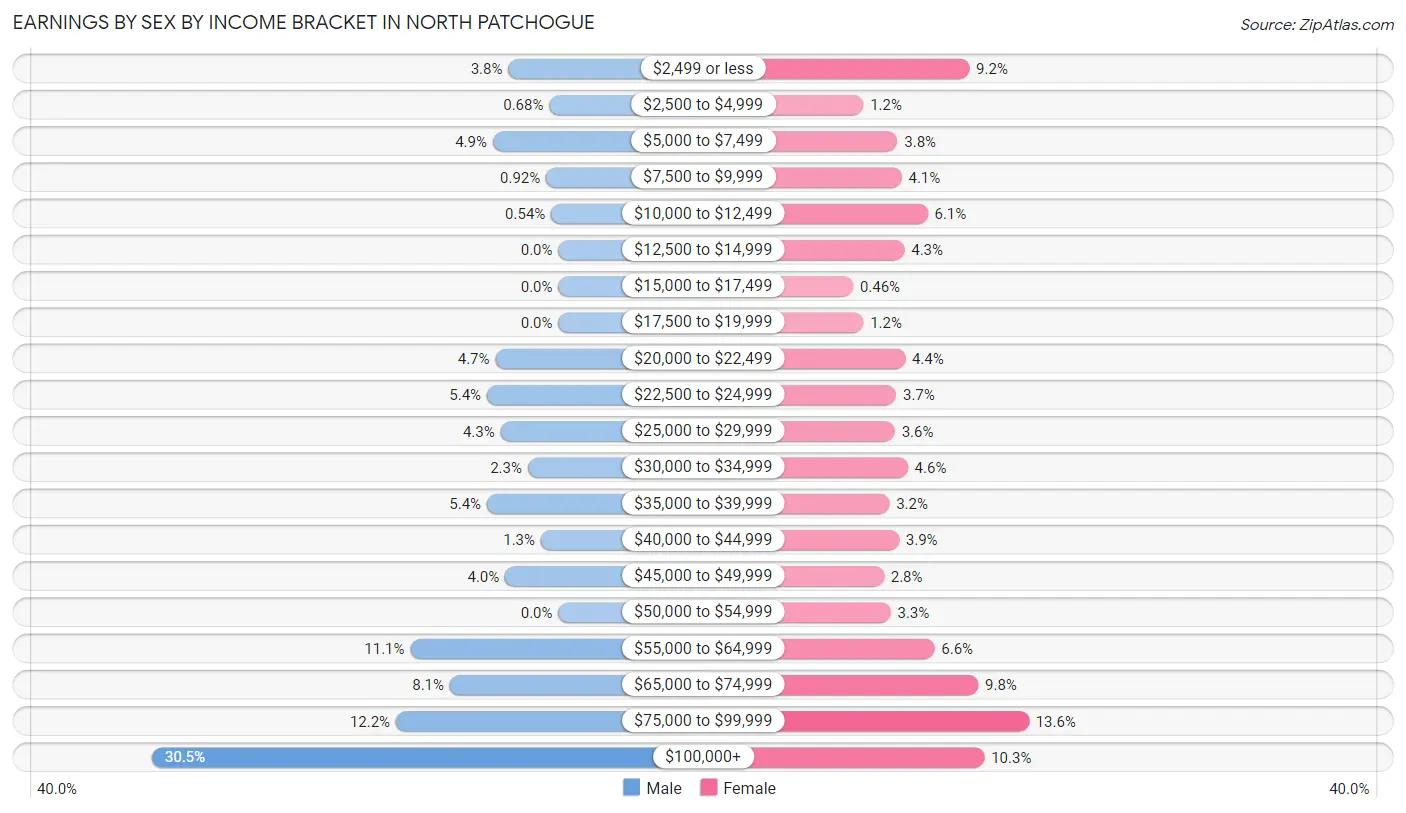
| Income | Male | Female |
| $2,499 or less | 77 (3.7%) | 179 (9.2%) |
| $2,500 to $4,999 | 14 (0.7%) | 24 (1.2%) |
| $5,000 to $7,499 | 101 (4.9%) | 74 (3.8%) |
| $7,500 to $9,999 | 19 (0.9%) | 80 (4.1%) |
| $10,000 to $12,499 | 11 (0.5%) | 118 (6.0%) |
| $12,500 to $14,999 | 0 (0.0%) | 84 (4.3%) |
| $15,000 to $17,499 | 0 (0.0%) | 9 (0.5%) |
| $17,500 to $19,999 | 0 (0.0%) | 24 (1.2%) |
| $20,000 to $22,499 | 97 (4.7%) | 85 (4.4%) |
| $22,500 to $24,999 | 110 (5.3%) | 72 (3.7%) |
| $25,000 to $29,999 | 89 (4.3%) | 70 (3.6%) |
| $30,000 to $34,999 | 47 (2.3%) | 89 (4.6%) |
| $35,000 to $39,999 | 110 (5.3%) | 62 (3.2%) |
| $40,000 to $44,999 | 27 (1.3%) | 76 (3.9%) |
| $45,000 to $49,999 | 82 (4.0%) | 54 (2.8%) |
| $50,000 to $54,999 | 0 (0.0%) | 64 (3.3%) |
| $55,000 to $64,999 | 228 (11.1%) | 128 (6.6%) |
| $65,000 to $74,999 | 167 (8.1%) | 192 (9.8%) |
| $75,000 to $99,999 | 250 (12.2%) | 266 (13.6%) |
| $100,000+ | 626 (30.5%) | 201 (10.3%) |
| Total | 2,055 (100.0%) | 1,951 (100.0%) |
Earnings by Sex by Educational Attainment in North Patchogue
Average earnings in North Patchogue are $71,167 for men and $50,972 for women, a difference of 28.4%. Men with an educational attainment of bachelor's degree enjoy the highest average annual earnings of $108,250, while those with college or associate's degree education earn the least with $60,341. Women with an educational attainment of graduate degree earn the most with the average annual earnings of $85,250, while those with high school diploma education have the smallest earnings of $18,750.
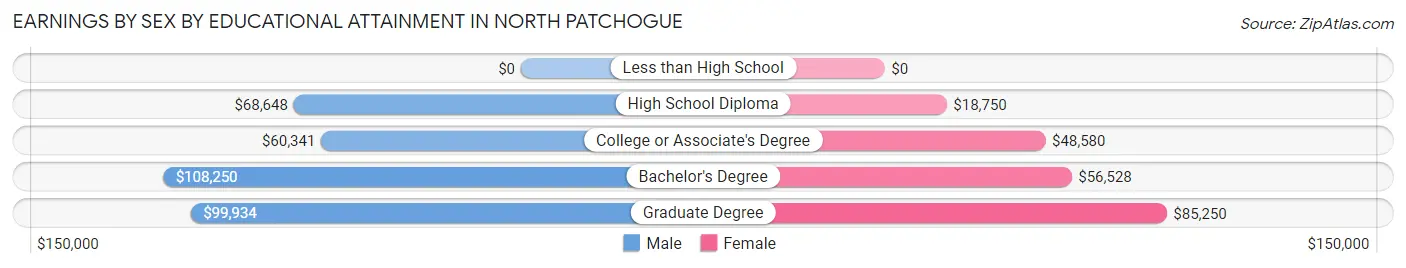
| Educational Attainment | Male Income | Female Income |
| Less than High School | - | - |
| High School Diploma | $68,648 | $18,750 |
| College or Associate's Degree | $60,341 | $48,580 |
| Bachelor's Degree | $108,250 | $56,528 |
| Graduate Degree | $99,934 | $85,250 |
| Total | $71,167 | $50,972 |
Family Income in North Patchogue
Family Income Brackets in North Patchogue
According to the North Patchogue family income data, there are 477 families falling into the $100,000 to $149,999 income range, which is the most common income bracket and makes up 25.3% of all families.
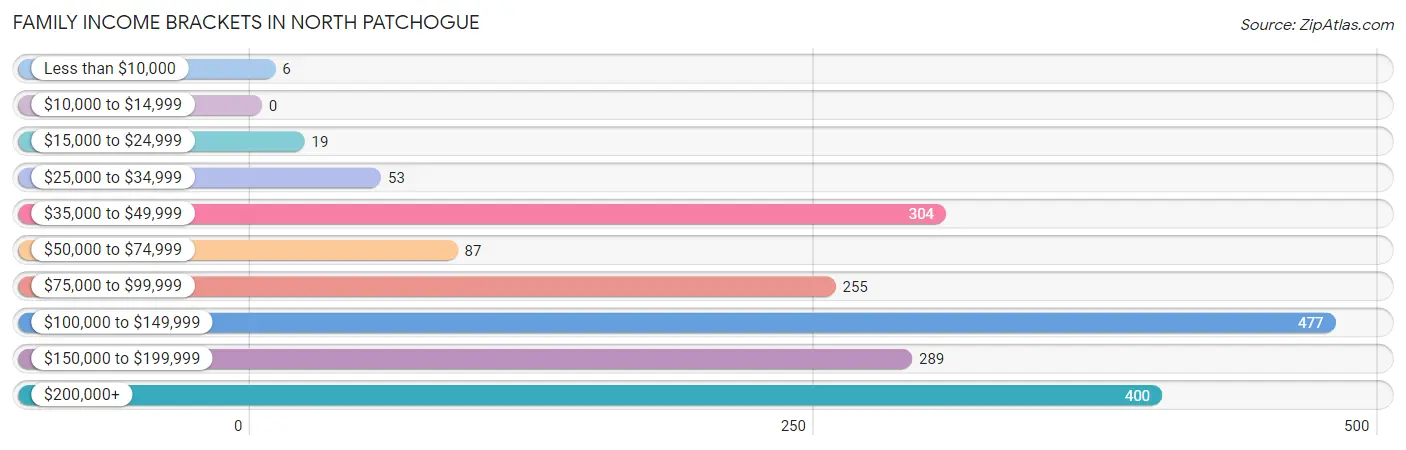
| Income Bracket | # Families | % Families |
| Less than $10,000 | 6 | 0.3% |
| $10,000 to $14,999 | 0 | 0.0% |
| $15,000 to $24,999 | 19 | 1.0% |
| $25,000 to $34,999 | 53 | 2.8% |
| $35,000 to $49,999 | 304 | 16.1% |
| $50,000 to $74,999 | 87 | 4.6% |
| $75,000 to $99,999 | 255 | 13.5% |
| $100,000 to $149,999 | 477 | 25.3% |
| $150,000 to $199,999 | 289 | 15.3% |
| $200,000+ | 400 | 21.2% |
Family Income by Famaliy Size in North Patchogue
6-person families (83 | 4.4%) account for the highest median family income in North Patchogue with $188,866 per family, while 2-person families (400 | 21.2%) have the highest median income of $48,946 per family member.
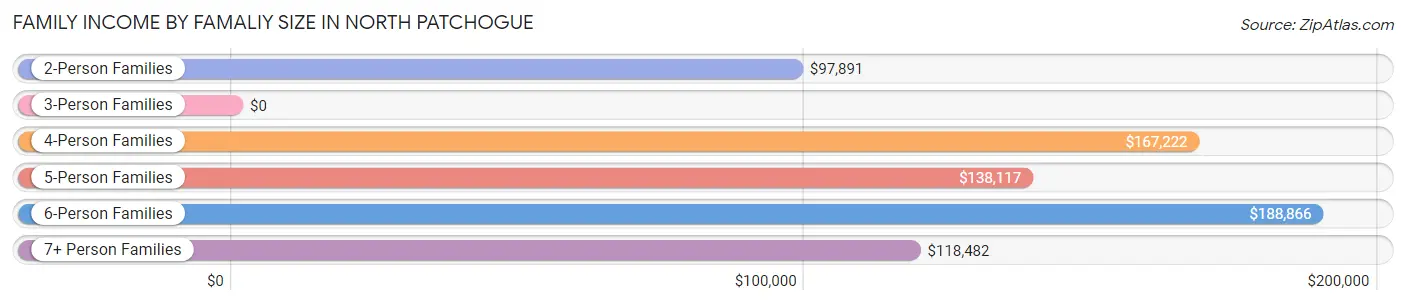
| Income Bracket | # Families | Median Income |
| 2-Person Families | 400 (21.2%) | $97,891 |
| 3-Person Families | 649 (34.4%) | $0 |
| 4-Person Families | 486 (25.8%) | $167,222 |
| 5-Person Families | 185 (9.8%) | $138,117 |
| 6-Person Families | 83 (4.4%) | $188,866 |
| 7+ Person Families | 84 (4.4%) | $118,482 |
| Total | 1,887 (100.0%) | $127,644 |
Family Income by Number of Earners in North Patchogue
The median family income in North Patchogue is $127,644, with families comprising 3+ earners (326) having the highest median family income of $200,357, while families with no earners (335) have the lowest median family income of $48,972, accounting for 17.3% and 17.7% of families, respectively.
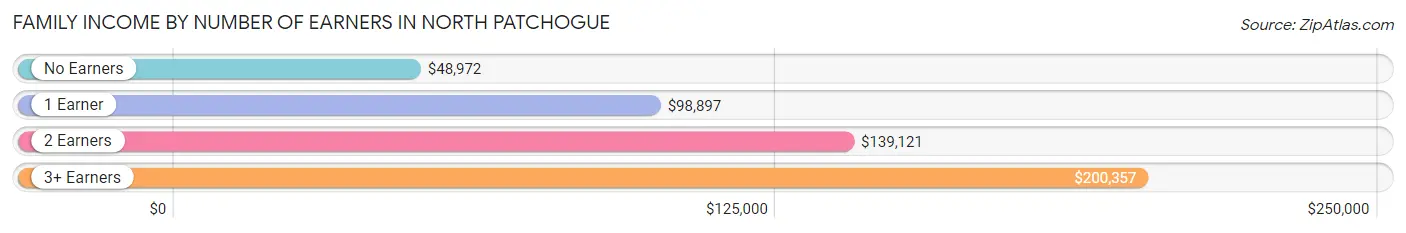
| Number of Earners | # Families | Median Income |
| No Earners | 335 (17.7%) | $48,972 |
| 1 Earner | 350 (18.5%) | $98,897 |
| 2 Earners | 876 (46.4%) | $139,121 |
| 3+ Earners | 326 (17.3%) | $200,357 |
| Total | 1,887 (100.0%) | $127,644 |
Household Income in North Patchogue
Household Income Brackets in North Patchogue
With 650 households falling in the category, the $100,000 to $149,999 income range is the most frequent in North Patchogue, accounting for 27.7% of all households. In contrast, only 5 households (0.2%) fall into the less than $10,000 income bracket, making it the least populous group.
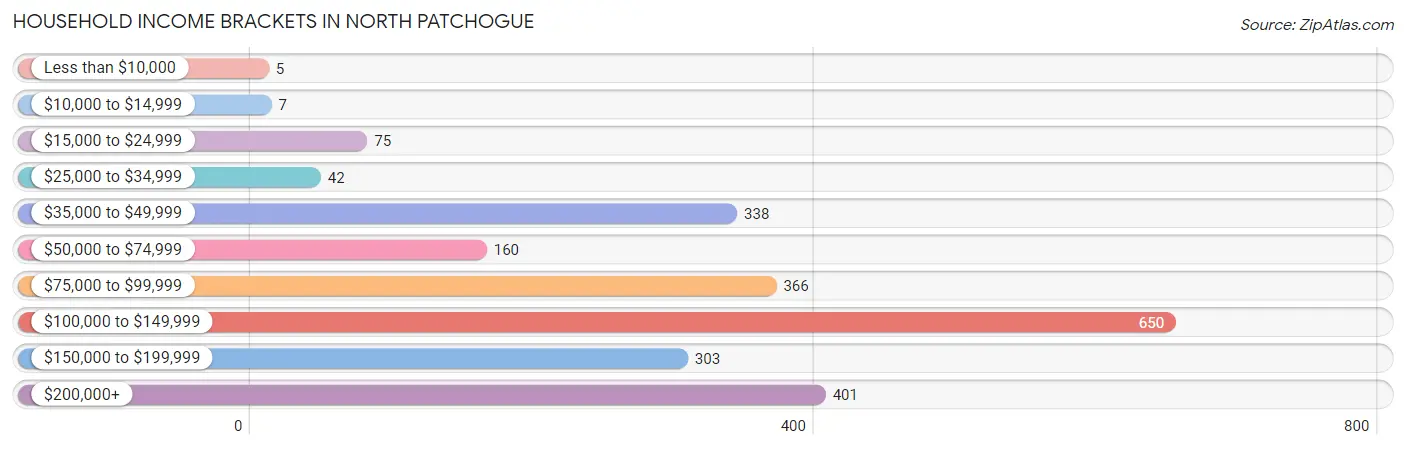
| Income Bracket | # Households | % Households |
| Less than $10,000 | 5 | 0.2% |
| $10,000 to $14,999 | 7 | 0.3% |
| $15,000 to $24,999 | 75 | 3.2% |
| $25,000 to $34,999 | 42 | 1.8% |
| $35,000 to $49,999 | 338 | 14.4% |
| $50,000 to $74,999 | 160 | 6.8% |
| $75,000 to $99,999 | 366 | 15.6% |
| $100,000 to $149,999 | 650 | 27.7% |
| $150,000 to $199,999 | 303 | 12.9% |
| $200,000+ | 401 | 17.1% |
Household Income by Householder Age in North Patchogue
The median household income in North Patchogue is $117,586, with the highest median household income of $133,279 found in the 25 to 44 years age bracket for the primary householder. A total of 786 households (33.5%) fall into this category.
| Income Bracket | # Households | Median Income |
| 15 to 24 Years | 0 (0.0%) | $0 |
| 25 to 44 Years | 786 (33.5%) | $133,279 |
| 45 to 64 Years | 1,090 (46.5%) | $102,600 |
| 65+ Years | 470 (20.0%) | $65,833 |
| Total | 2,346 (100.0%) | $117,586 |
Poverty in North Patchogue
Income Below Poverty by Sex and Age in North Patchogue
With 0.5% poverty level for males and 2.4% for females among the residents of North Patchogue, 75 year old and over males and 25 to 34 year old females are the most vulnerable to poverty, with 12 males (9.8%) and 51 females (9.3%) in their respective age groups living below the poverty level.
| Age Bracket | Male | Female |
| Under 5 Years | 0 (0.0%) | 21 (8.1%) |
| 5 Years | 0 (0.0%) | 0 (0.0%) |
| 6 to 11 Years | 0 (0.0%) | 0 (0.0%) |
| 12 to 14 Years | 0 (0.0%) | 0 (0.0%) |
| 15 Years | 0 (0.0%) | 0 (0.0%) |
| 16 and 17 Years | 0 (0.0%) | 0 (0.0%) |
| 18 to 24 Years | 0 (0.0%) | 0 (0.0%) |
| 25 to 34 Years | 0 (0.0%) | 51 (9.3%) |
| 35 to 44 Years | 0 (0.0%) | 4 (1.0%) |
| 45 to 54 Years | 0 (0.0%) | 3 (0.5%) |
| 55 to 64 Years | 5 (0.7%) | 14 (2.5%) |
| 65 to 74 Years | 2 (0.8%) | 7 (2.5%) |
| 75 Years and over | 12 (9.8%) | 0 (0.0%) |
| Total | 19 (0.5%) | 100 (2.4%) |
Income Above Poverty by Sex and Age in North Patchogue
According to the poverty statistics in North Patchogue, males aged under 5 years and females aged 5 years are the age groups that are most secure financially, with 100.0% of males and 100.0% of females in these age groups living above the poverty line.
| Age Bracket | Male | Female |
| Under 5 Years | 314 (100.0%) | 237 (91.9%) |
| 5 Years | 14 (100.0%) | 116 (100.0%) |
| 6 to 11 Years | 335 (100.0%) | 368 (100.0%) |
| 12 to 14 Years | 163 (100.0%) | 204 (100.0%) |
| 15 Years | 0 (0.0%) | 42 (100.0%) |
| 16 and 17 Years | 61 (100.0%) | 62 (100.0%) |
| 18 to 24 Years | 349 (100.0%) | 596 (100.0%) |
| 25 to 34 Years | 391 (100.0%) | 496 (90.7%) |
| 35 to 44 Years | 415 (100.0%) | 414 (99.0%) |
| 45 to 54 Years | 577 (100.0%) | 570 (99.5%) |
| 55 to 64 Years | 662 (99.3%) | 540 (97.5%) |
| 65 to 74 Years | 262 (99.2%) | 272 (97.5%) |
| 75 Years and over | 110 (90.2%) | 99 (100.0%) |
| Total | 3,653 (99.5%) | 4,016 (97.6%) |
Income Below Poverty Among Married-Couple Families in North Patchogue
The poverty statistics for married-couple families in North Patchogue show that 0.3% or 5 of the total 1,715 families live below the poverty line. Families with no children have the highest poverty rate of 0.6%, comprising of 5 families. On the other hand, families with 1 or 2 children have the lowest poverty rate of 0.0%, which includes 0 families.
| Children | Above Poverty | Below Poverty |
| No Children | 894 (99.4%) | 5 (0.6%) |
| 1 or 2 Children | 591 (100.0%) | 0 (0.0%) |
| 3 or 4 Children | 194 (100.0%) | 0 (0.0%) |
| 5 or more Children | 31 (100.0%) | 0 (0.0%) |
| Total | 1,710 (99.7%) | 5 (0.3%) |
Income Below Poverty Among Single-Parent Households in North Patchogue
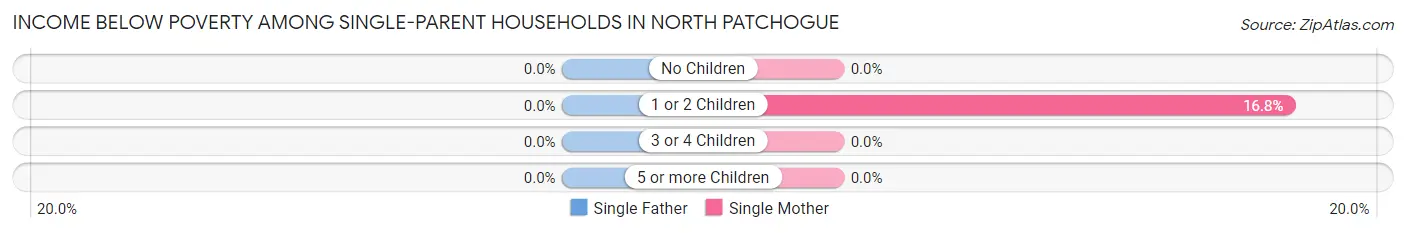
| Children | Single Father | Single Mother |
| No Children | 0 (0.0%) | 0 (0.0%) |
| 1 or 2 Children | 0 (0.0%) | 18 (16.8%) |
| 3 or 4 Children | 0 (0.0%) | 0 (0.0%) |
| 5 or more Children | 0 (0.0%) | 0 (0.0%) |
| Total | 0 (0.0%) | 18 (13.0%) |
Income Below Poverty Among Married-Couple vs Single-Parent Households in North Patchogue
The poverty data for North Patchogue shows that 5 of the married-couple family households (0.3%) and 18 of the single-parent households (10.5%) are living below the poverty level. Within the married-couple family households, those with no children have the highest poverty rate, with 5 households (0.6%) falling below the poverty line. Among the single-parent households, those with 1 or 2 children have the highest poverty rate, with 18 household (12.9%) living below poverty.
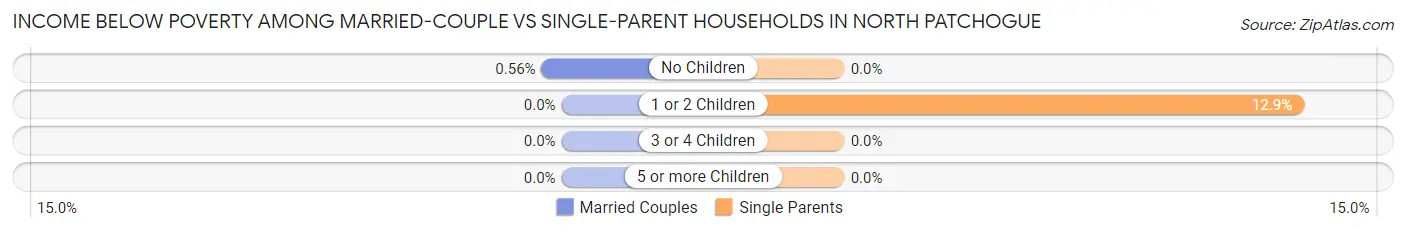
| Children | Married-Couple Families | Single-Parent Households |
| No Children | 5 (0.6%) | 0 (0.0%) |
| 1 or 2 Children | 0 (0.0%) | 18 (12.9%) |
| 3 or 4 Children | 0 (0.0%) | 0 (0.0%) |
| 5 or more Children | 0 (0.0%) | 0 (0.0%) |
| Total | 5 (0.3%) | 18 (10.5%) |
Race in North Patchogue
The most populous races in North Patchogue are White / Caucasian (6,108 | 78.3%), Hispanic or Latino (1,939 | 24.9%), and Two or more Races (797 | 10.2%).
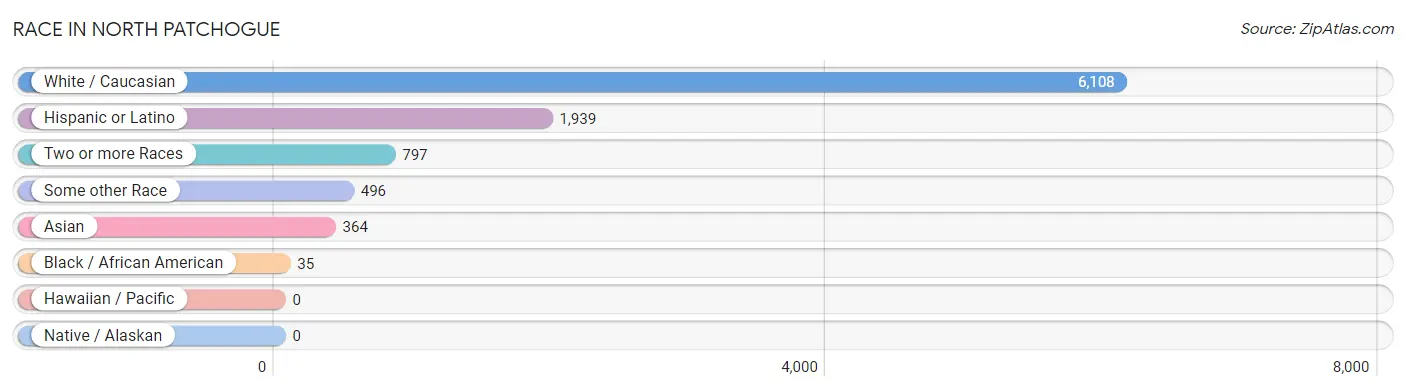
| Race | # Population | % Population |
| Asian | 364 | 4.7% |
| Black / African American | 35 | 0.4% |
| Hawaiian / Pacific | 0 | 0.0% |
| Hispanic or Latino | 1,939 | 24.9% |
| Native / Alaskan | 0 | 0.0% |
| White / Caucasian | 6,108 | 78.3% |
| Two or more Races | 797 | 10.2% |
| Some other Race | 496 | 6.4% |
| Total | 7,800 | 100.0% |
Ancestry in North Patchogue
The most populous ancestries reported in North Patchogue are Irish (1,917 | 24.6%), Italian (1,509 | 19.4%), German (925 | 11.9%), South American (527 | 6.8%), and Central American (470 | 6.0%), together accounting for 68.6% of all North Patchogue residents.
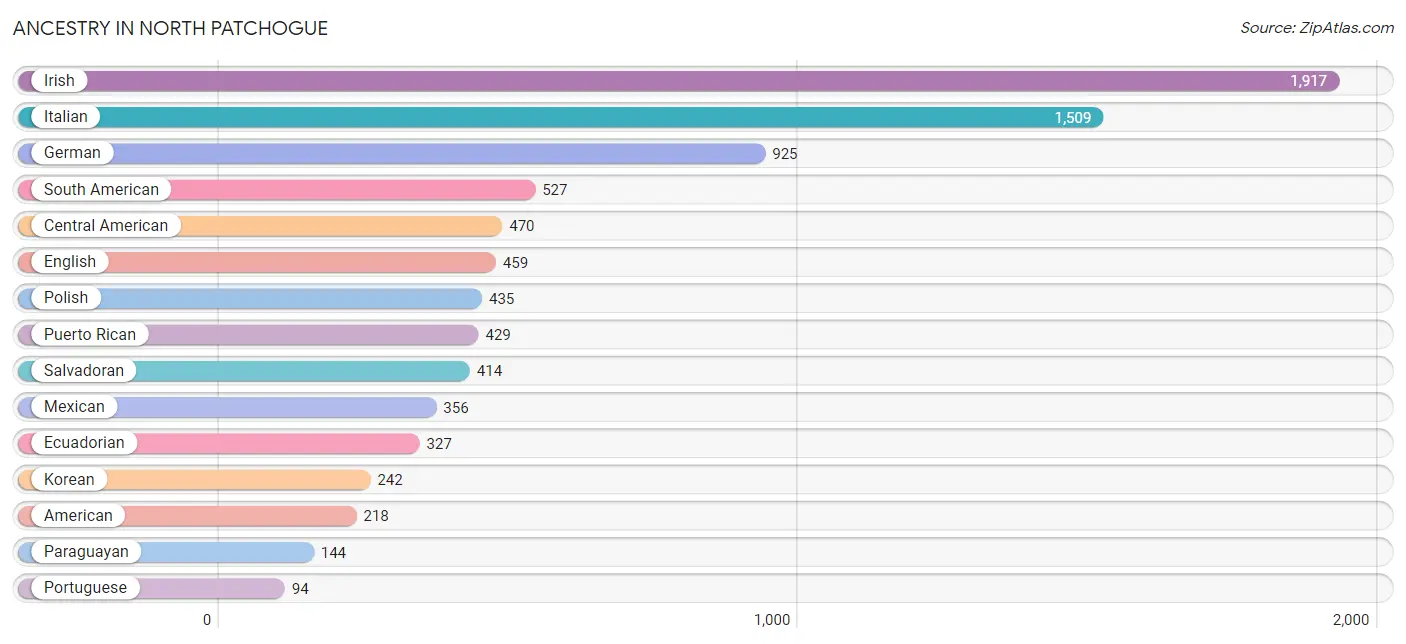
| Ancestry | # Population | % Population |
| American | 218 | 2.8% |
| Austrian | 37 | 0.5% |
| Central American | 470 | 6.0% |
| Colombian | 56 | 0.7% |
| Czech | 68 | 0.9% |
| Dominican | 44 | 0.6% |
| Dutch | 28 | 0.4% |
| Ecuadorian | 327 | 4.2% |
| English | 459 | 5.9% |
| French | 8 | 0.1% |
| French Canadian | 25 | 0.3% |
| German | 925 | 11.9% |
| Guatemalan | 31 | 0.4% |
| Indian (Asian) | 32 | 0.4% |
| Irish | 1,917 | 24.6% |
| Italian | 1,509 | 19.4% |
| Korean | 242 | 3.1% |
| Mexican | 356 | 4.6% |
| Navajo | 16 | 0.2% |
| Northern European | 55 | 0.7% |
| Norwegian | 60 | 0.8% |
| Panamanian | 25 | 0.3% |
| Paraguayan | 144 | 1.8% |
| Polish | 435 | 5.6% |
| Portuguese | 94 | 1.2% |
| Puerto Rican | 429 | 5.5% |
| Russian | 60 | 0.8% |
| Salvadoran | 414 | 5.3% |
| Scandinavian | 14 | 0.2% |
| Scotch-Irish | 27 | 0.4% |
| Scottish | 20 | 0.3% |
| Slavic | 57 | 0.7% |
| South African | 73 | 0.9% |
| South American | 527 | 6.8% |
| Spanish | 33 | 0.4% |
| Sri Lankan | 28 | 0.4% |
| Subsaharan African | 73 | 0.9% |
| Swedish | 45 | 0.6% |
| Turkish | 6 | 0.1% | View All 39 Rows |
Immigrants in North Patchogue
The most numerous immigrant groups reported in North Patchogue came from Latin America (451 | 5.8%), Central America (314 | 4.0%), Asia (225 | 2.9%), El Salvador (147 | 1.9%), and South America (137 | 1.8%), together accounting for 16.3% of all North Patchogue residents.
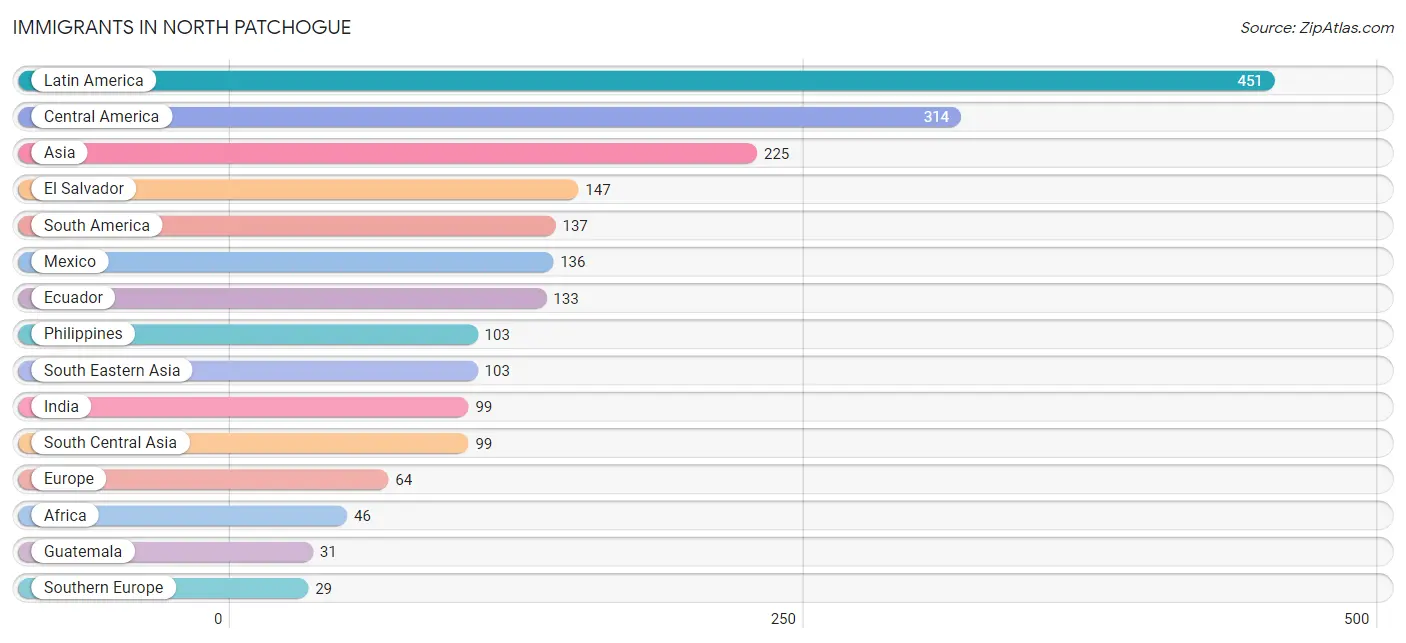
| Immigration Origin | # Population | % Population |
| Africa | 46 | 0.6% |
| Asia | 225 | 2.9% |
| Central America | 314 | 4.0% |
| China | 23 | 0.3% |
| Colombia | 4 | 0.1% |
| Eastern Asia | 23 | 0.3% |
| Eastern Europe | 14 | 0.2% |
| Ecuador | 133 | 1.7% |
| El Salvador | 147 | 1.9% |
| England | 2 | 0.0% |
| Europe | 64 | 0.8% |
| Guatemala | 31 | 0.4% |
| Hong Kong | 6 | 0.1% |
| India | 99 | 1.3% |
| Ireland | 19 | 0.2% |
| Italy | 10 | 0.1% |
| Latin America | 451 | 5.8% |
| Mexico | 136 | 1.7% |
| Middle Africa | 24 | 0.3% |
| Northern Europe | 21 | 0.3% |
| Philippines | 103 | 1.3% |
| Portugal | 19 | 0.2% |
| Russia | 14 | 0.2% |
| South Africa | 22 | 0.3% |
| South America | 137 | 1.8% |
| South Central Asia | 99 | 1.3% |
| South Eastern Asia | 103 | 1.3% |
| Southern Europe | 29 | 0.4% | View All 28 Rows |
Sex and Age in North Patchogue
Sex and Age in North Patchogue
The most populous age groups in North Patchogue are 45 to 49 Years (446 | 12.1%) for men and 20 to 24 Years (471 | 11.4%) for women.
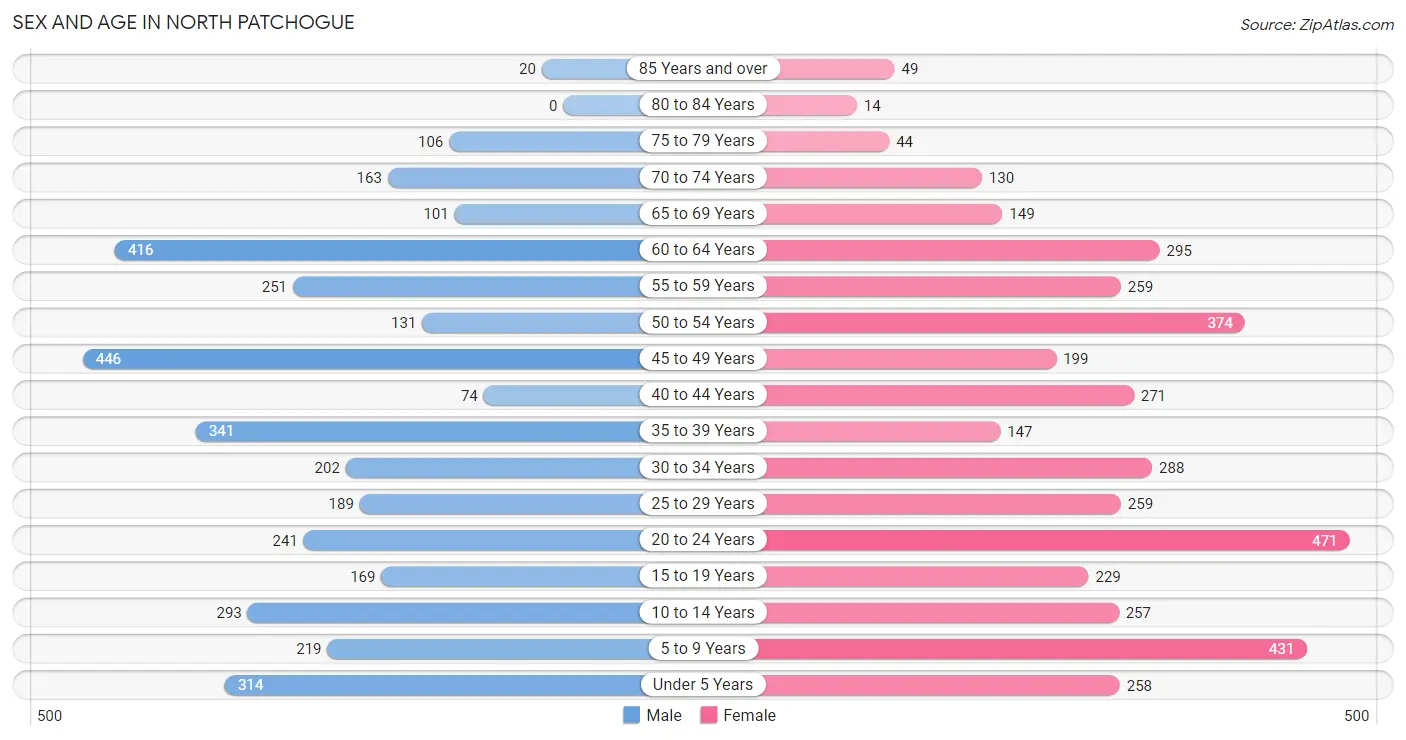
| Age Bracket | Male | Female |
| Under 5 Years | 314 (8.5%) | 258 (6.3%) |
| 5 to 9 Years | 219 (6.0%) | 431 (10.4%) |
| 10 to 14 Years | 293 (8.0%) | 257 (6.2%) |
| 15 to 19 Years | 169 (4.6%) | 229 (5.6%) |
| 20 to 24 Years | 241 (6.6%) | 471 (11.4%) |
| 25 to 29 Years | 189 (5.1%) | 259 (6.3%) |
| 30 to 34 Years | 202 (5.5%) | 288 (7.0%) |
| 35 to 39 Years | 341 (9.3%) | 147 (3.6%) |
| 40 to 44 Years | 74 (2.0%) | 271 (6.6%) |
| 45 to 49 Years | 446 (12.1%) | 199 (4.8%) |
| 50 to 54 Years | 131 (3.6%) | 374 (9.1%) |
| 55 to 59 Years | 251 (6.8%) | 259 (6.3%) |
| 60 to 64 Years | 416 (11.3%) | 295 (7.1%) |
| 65 to 69 Years | 101 (2.8%) | 149 (3.6%) |
| 70 to 74 Years | 163 (4.4%) | 130 (3.2%) |
| 75 to 79 Years | 106 (2.9%) | 44 (1.1%) |
| 80 to 84 Years | 0 (0.0%) | 14 (0.3%) |
| 85 Years and over | 20 (0.5%) | 49 (1.2%) |
| Total | 3,676 (100.0%) | 4,124 (100.0%) |
Families and Households in North Patchogue
Median Family Size in North Patchogue
The median family size in North Patchogue is 3.76 persons per family, with single female/mother families (139 | 7.4%) accounting for the largest median family size of 4.08 persons per family. On the other hand, single male/father families (33 | 1.8%) represent the smallest median family size with 2.67 persons per family.
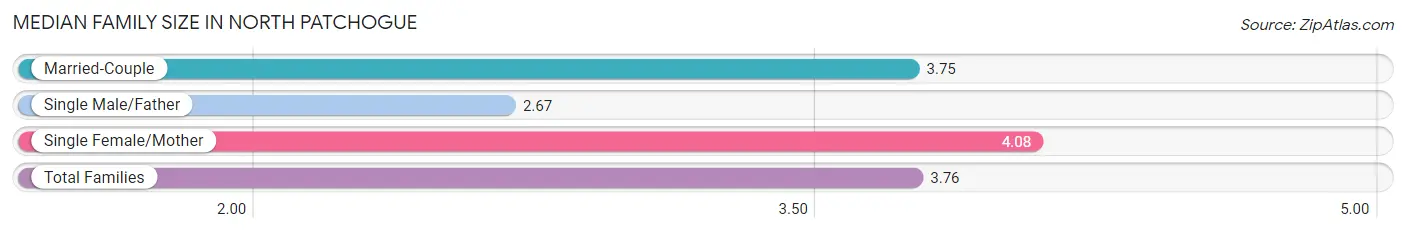
| Family Type | # Families | Family Size |
| Married-Couple | 1,715 (90.9%) | 3.75 |
| Single Male/Father | 33 (1.8%) | 2.67 |
| Single Female/Mother | 139 (7.4%) | 4.08 |
| Total Families | 1,887 (100.0%) | 3.76 |
Median Household Size in North Patchogue
The median household size in North Patchogue is 3.31 persons per household, with single female/mother households (139 | 5.9%) accounting for the largest median household size of 4.37 persons per household. non-family households (459 | 19.6%) represent the smallest median household size with 1.29 persons per household.
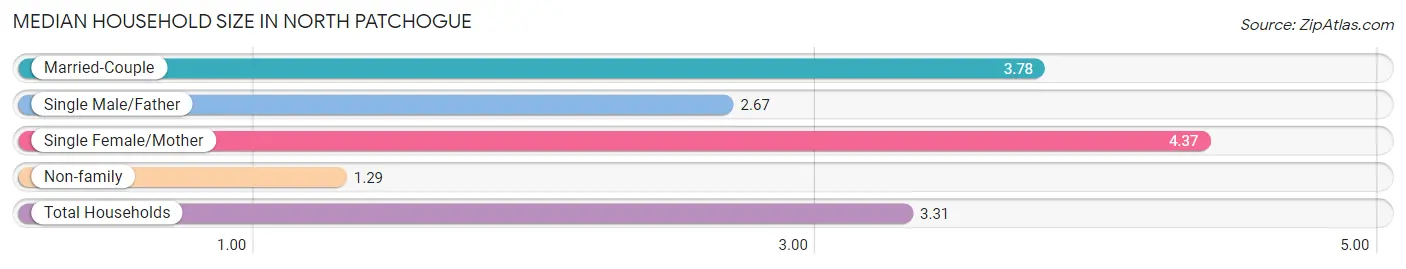
| Household Type | # Households | Household Size |
| Married-Couple | 1,715 (73.1%) | 3.78 |
| Single Male/Father | 33 (1.4%) | 2.67 |
| Single Female/Mother | 139 (5.9%) | 4.37 |
| Non-family | 459 (19.6%) | 1.29 |
| Total Households | 2,346 (100.0%) | 3.31 |
Household Size by Marriage Status in North Patchogue
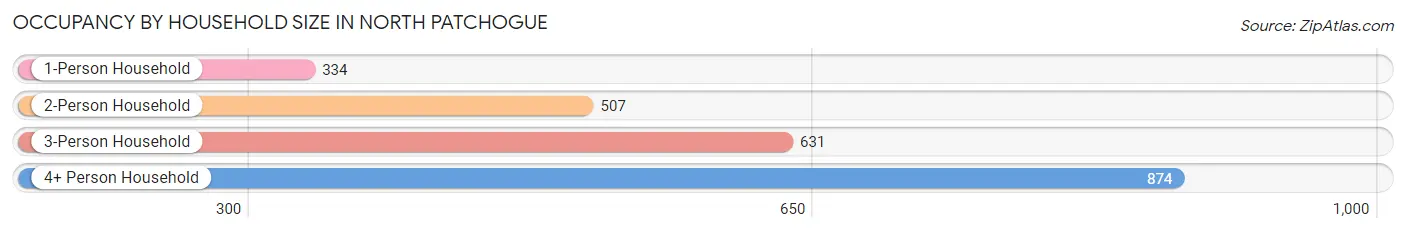
Out of a total of 2,346 households in North Patchogue, 1,887 (80.4%) are family households, while 459 (19.6%) are nonfamily households. The most numerous type of family households are 3-person households, comprising 631, and the most common type of nonfamily households are 1-person households, comprising 334.
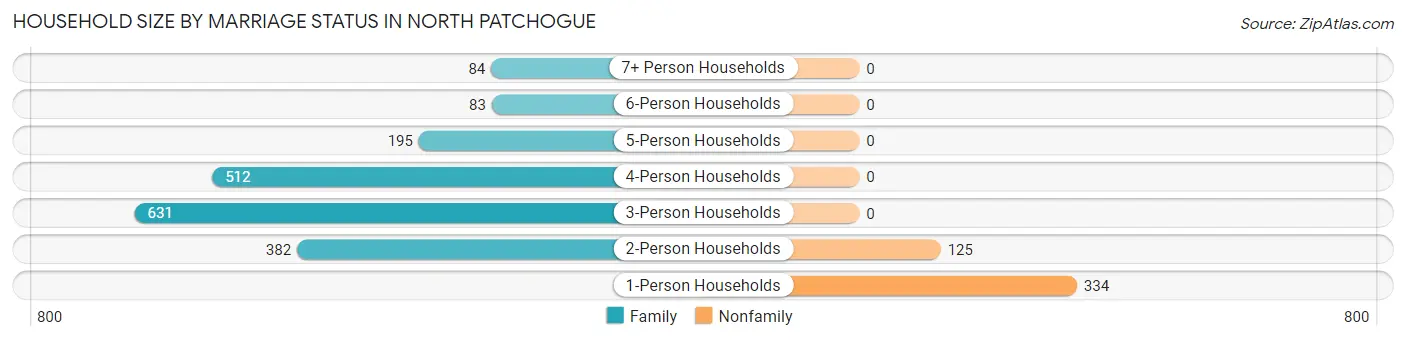
| Household Size | Family Households | Nonfamily Households |
| 1-Person Households | - | 334 (14.2%) |
| 2-Person Households | 382 (16.3%) | 125 (5.3%) |
| 3-Person Households | 631 (26.9%) | 0 (0.0%) |
| 4-Person Households | 512 (21.8%) | 0 (0.0%) |
| 5-Person Households | 195 (8.3%) | 0 (0.0%) |
| 6-Person Households | 83 (3.5%) | 0 (0.0%) |
| 7+ Person Households | 84 (3.6%) | 0 (0.0%) |
| Total | 1,887 (80.4%) | 459 (19.6%) |
Female Fertility in North Patchogue
Fertility by Age in North Patchogue
Average fertility rate in North Patchogue is 47.0 births per 1,000 women. Women in the age bracket of 35 to 50 years have the highest fertility rate with 107.0 births per 1,000 women. Women in the age bracket of 35 to 50 years acount for 80.0% of all women with births.
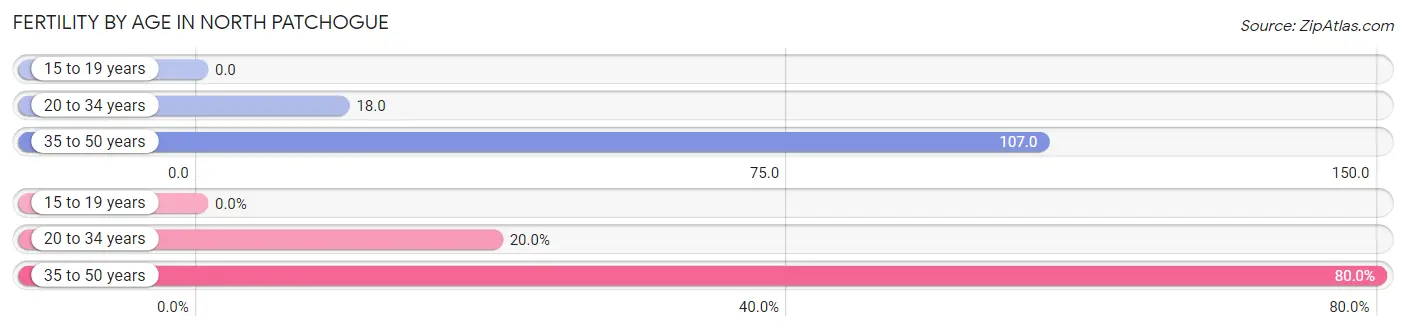
| Age Bracket | Women with Births | Births / 1,000 Women |
| 15 to 19 years | 0 (0.0%) | 0.0 |
| 20 to 34 years | 18 (20.0%) | 18.0 |
| 35 to 50 years | 72 (80.0%) | 107.0 |
| Total | 90 (100.0%) | 47.0 |
Fertility by Age by Marriage Status in North Patchogue
80.0% of women with births (90) in North Patchogue are married. The highest percentage of unmarried women with births falls into 20 to 34 years age bracket with 100.0% of them unmarried at the time of birth, while the lowest percentage of unmarried women with births belong to 35 to 50 years age bracket with 0.0% of them unmarried.
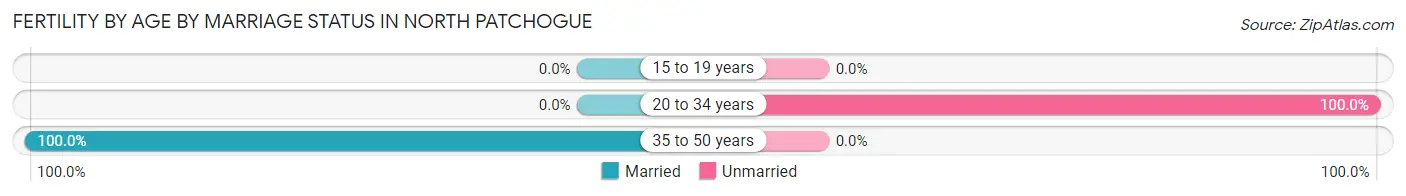
| Age Bracket | Married | Unmarried |
| 15 to 19 years | 0 (0.0%) | 0 (0.0%) |
| 20 to 34 years | 0 (0.0%) | 18 (100.0%) |
| 35 to 50 years | 72 (100.0%) | 0 (0.0%) |
| Total | 72 (80.0%) | 18 (20.0%) |
Fertility by Education in North Patchogue
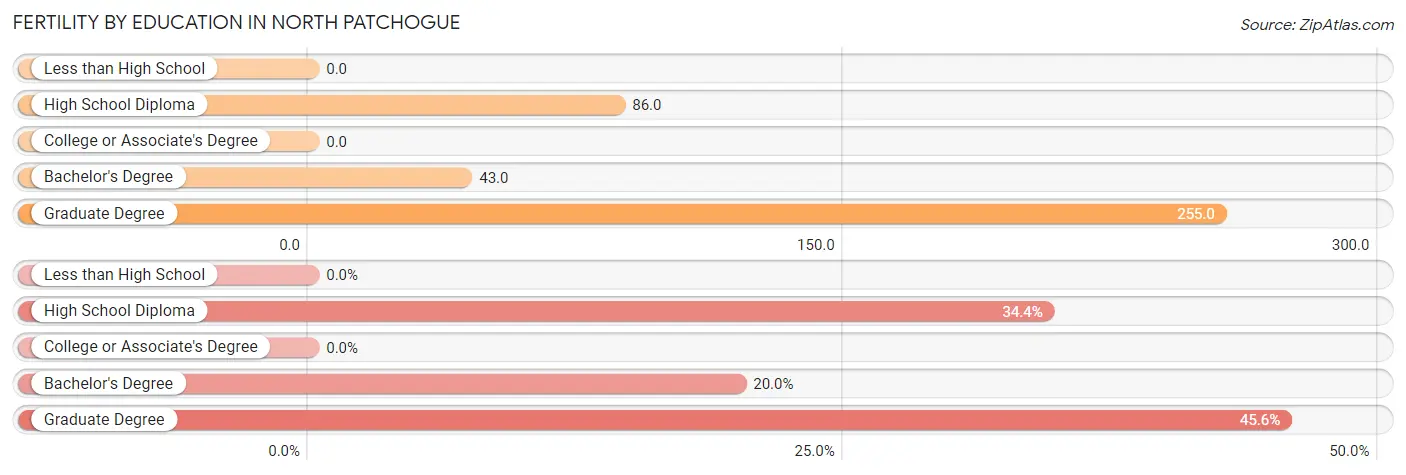
| Educational Attainment | Women with Births | Births / 1,000 Women |
| Less than High School | 0 (0.0%) | 0.0 |
| High School Diploma | 31 (34.4%) | 86.0 |
| College or Associate's Degree | 0 (0.0%) | 0.0 |
| Bachelor's Degree | 18 (20.0%) | 43.0 |
| Graduate Degree | 41 (45.6%) | 255.0 |
| Total | 90 (100.0%) | 47.0 |
Fertility by Education by Marriage Status in North Patchogue
20.0% of women with births in North Patchogue are unmarried. Women with the educational attainment of high school diploma are most likely to be married with 100.0% of them married at childbirth, while women with the educational attainment of bachelor's degree are least likely to be married with 100.0% of them unmarried at childbirth.
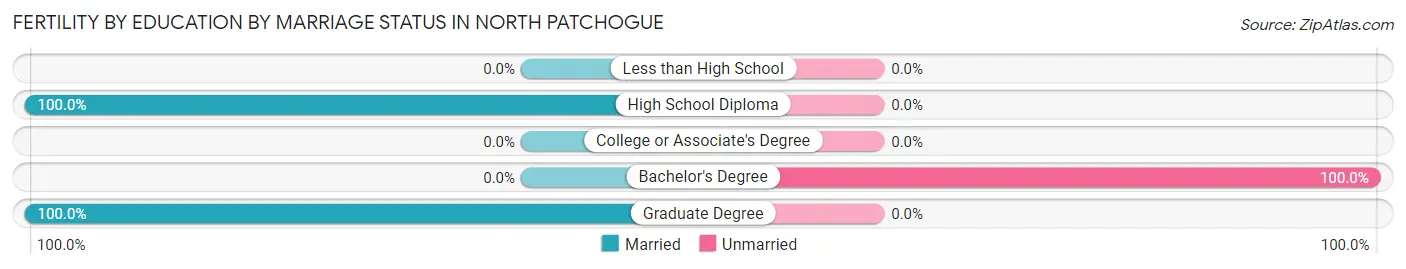
| Educational Attainment | Married | Unmarried |
| Less than High School | 0 (0.0%) | 0 (0.0%) |
| High School Diploma | 31 (100.0%) | 0 (0.0%) |
| College or Associate's Degree | 0 (0.0%) | 0 (0.0%) |
| Bachelor's Degree | 0 (0.0%) | 18 (100.0%) |
| Graduate Degree | 41 (100.0%) | 0 (0.0%) |
| Total | 72 (80.0%) | 18 (20.0%) |
Employment Characteristics in North Patchogue
Employment by Class of Employer in North Patchogue
Among the 3,704 employed individuals in North Patchogue, private company employees (2,497 | 67.4%), local government employees (434 | 11.7%), and not-for-profit organizations (251 | 6.8%) make up the most common classes of employment.
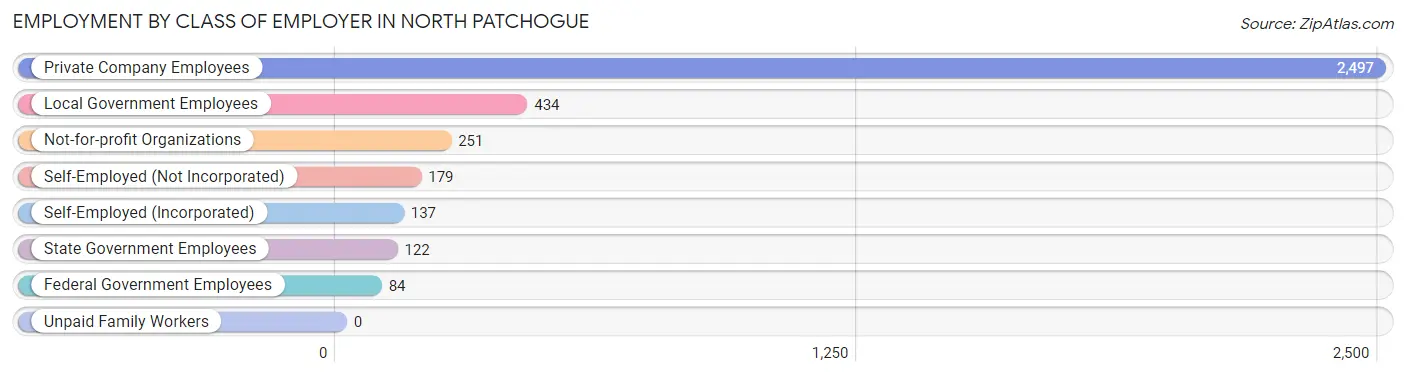
| Employer Class | # Employees | % Employees |
| Private Company Employees | 2,497 | 67.4% |
| Self-Employed (Incorporated) | 137 | 3.7% |
| Self-Employed (Not Incorporated) | 179 | 4.8% |
| Not-for-profit Organizations | 251 | 6.8% |
| Local Government Employees | 434 | 11.7% |
| State Government Employees | 122 | 3.3% |
| Federal Government Employees | 84 | 2.3% |
| Unpaid Family Workers | 0 | 0.0% |
| Total | 3,704 | 100.0% |
Employment Status by Age in North Patchogue
According to the labor force statistics for North Patchogue, out of the total population over 16 years of age (5,986), 63.9% or 3,825 individuals are in the labor force, with 1.4% or 54 of them unemployed. The age group with the highest labor force participation rate is 25 to 29 years, with 96.7% or 433 individuals in the labor force. Within the labor force, the 20 to 24 years age range has the highest percentage of unemployed individuals, with 8.2% or 27 of them being unemployed.
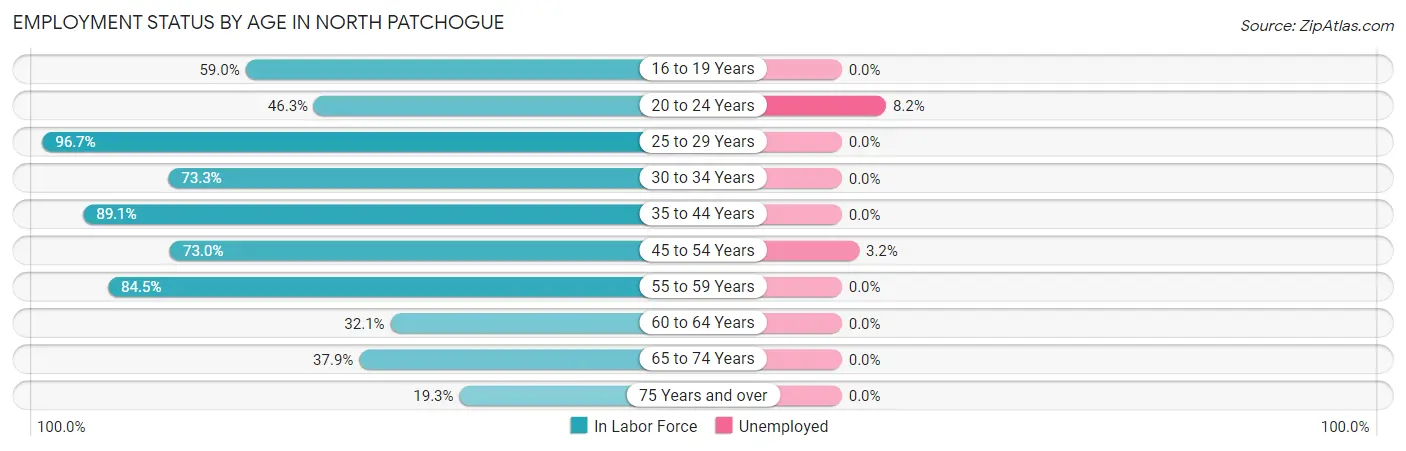
| Age Bracket | In Labor Force | Unemployed |
| 16 to 19 Years | 210 (59.0%) | 0 (0.0%) |
| 20 to 24 Years | 330 (46.3%) | 27 (8.2%) |
| 25 to 29 Years | 433 (96.7%) | 0 (0.0%) |
| 30 to 34 Years | 359 (73.3%) | 0 (0.0%) |
| 35 to 44 Years | 742 (89.1%) | 0 (0.0%) |
| 45 to 54 Years | 840 (73.0%) | 27 (3.2%) |
| 55 to 59 Years | 431 (84.5%) | 0 (0.0%) |
| 60 to 64 Years | 228 (32.1%) | 0 (0.0%) |
| 65 to 74 Years | 206 (37.9%) | 0 (0.0%) |
| 75 Years and over | 45 (19.3%) | 0 (0.0%) |
| Total | 3,825 (63.9%) | 54 (1.4%) |
Employment Status by Educational Attainment in North Patchogue
According to labor force statistics for North Patchogue, 73.2% of individuals (3,032) out of the total population between 25 and 64 years of age (4,142) are in the labor force, with 0.9% or 27 of them being unemployed. The group with the highest labor force participation rate are those with the educational attainment of bachelor's degree or higher, with 90.0% or 1,055 individuals in the labor force. Within the labor force, individuals with college / associate degree education have the highest percentage of unemployment, with 2.3% or 27 of them being unemployed.
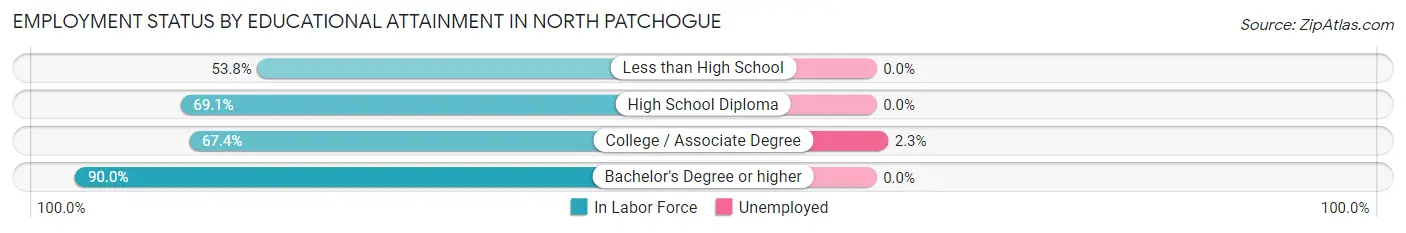
| Educational Attainment | In Labor Force | Unemployed |
| Less than High School | 161 (53.8%) | 0 (0.0%) |
| High School Diploma | 634 (69.1%) | 0 (0.0%) |
| College / Associate Degree | 1,182 (67.4%) | 40 (2.3%) |
| Bachelor's Degree or higher | 1,055 (90.0%) | 0 (0.0%) |
| Total | 3,032 (73.2%) | 37 (0.9%) |
Employment Occupations by Sex in North Patchogue
Management, Business, Science and Arts Occupations
The most common Management, Business, Science and Arts occupations in North Patchogue are Community & Social Service (372 | 9.9%), Management (347 | 9.2%), Education Instruction & Library (225 | 6.0%), Computers, Engineering & Science (168 | 4.5%), and Education, Arts & Media (136 | 3.6%).
Management, Business, Science and Arts Occupations by Sex
Within the Management, Business, Science and Arts occupations in North Patchogue, the most male-oriented occupations are Architecture & Engineering (100.0%), Arts, Media & Entertainment (100.0%), and Business & Financial (79.0%), while the most female-oriented occupations are Education, Arts & Media (100.0%), Health Technologists (86.4%), and Community & Social Service (76.1%).
| Occupation | Male | Female |
| Management | 131 (37.8%) | 216 (62.3%) |
| Business & Financial | 79 (79.0%) | 21 (21.0%) |
| Computers, Engineering & Science | 116 (69.1%) | 52 (30.9%) |
| Computers & Mathematics | 60 (63.2%) | 35 (36.8%) |
| Architecture & Engineering | 42 (100.0%) | 0 (0.0%) |
| Life, Physical & Social Science | 14 (45.2%) | 17 (54.8%) |
| Community & Social Service | 89 (23.9%) | 283 (76.1%) |
| Education, Arts & Media | 0 (0.0%) | 136 (100.0%) |
| Legal Services & Support | 0 (0.0%) | 0 (0.0%) |
| Education Instruction & Library | 78 (34.7%) | 147 (65.3%) |
| Arts, Media & Entertainment | 11 (100.0%) | 0 (0.0%) |
| Health Diagnosing & Treating | 35 (27.8%) | 91 (72.2%) |
| Health Technologists | 9 (13.6%) | 57 (86.4%) |
| Total (Category) | 450 (40.4%) | 663 (59.6%) |
| Total (Overall) | 1,914 (50.8%) | 1,855 (49.2%) |
Services Occupations
The most common Services occupations in North Patchogue are Security & Protection (165 | 4.4%), Cleaning & Maintenance (145 | 3.8%), Healthcare Support (140 | 3.7%), Firefighting & Prevention (103 | 2.7%), and Food Preparation & Serving (89 | 2.4%).
Services Occupations by Sex
Within the Services occupations in North Patchogue, the most male-oriented occupations are Firefighting & Prevention (92.2%), Security & Protection (90.9%), and Law Enforcement (88.7%), while the most female-oriented occupations are Healthcare Support (89.3%), Personal Care & Service (84.7%), and Food Preparation & Serving (84.3%).
| Occupation | Male | Female |
| Healthcare Support | 15 (10.7%) | 125 (89.3%) |
| Security & Protection | 150 (90.9%) | 15 (9.1%) |
| Firefighting & Prevention | 95 (92.2%) | 8 (7.8%) |
| Law Enforcement | 55 (88.7%) | 7 (11.3%) |
| Food Preparation & Serving | 14 (15.7%) | 75 (84.3%) |
| Cleaning & Maintenance | 66 (45.5%) | 79 (54.5%) |
| Personal Care & Service | 11 (15.3%) | 61 (84.7%) |
| Total (Category) | 256 (41.9%) | 355 (58.1%) |
| Total (Overall) | 1,914 (50.8%) | 1,855 (49.2%) |
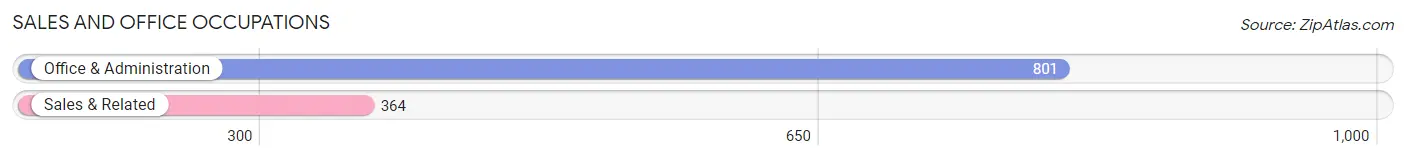
Sales and Office Occupations
The most common Sales and Office occupations in North Patchogue are Office & Administration (801 | 21.2%), and Sales & Related (364 | 9.7%).
Sales and Office Occupations by Sex
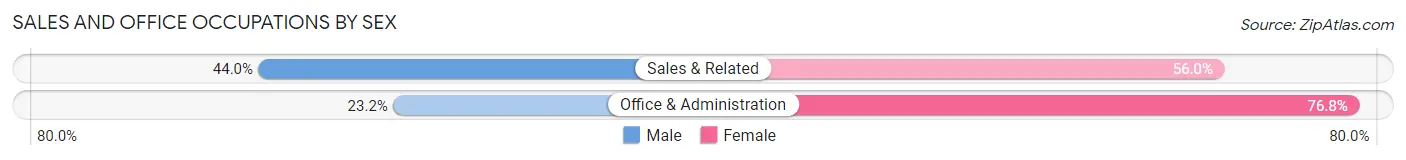
| Occupation | Male | Female |
| Sales & Related | 160 (44.0%) | 204 (56.0%) |
| Office & Administration | 186 (23.2%) | 615 (76.8%) |
| Total (Category) | 346 (29.7%) | 819 (70.3%) |
| Total (Overall) | 1,914 (50.8%) | 1,855 (49.2%) |
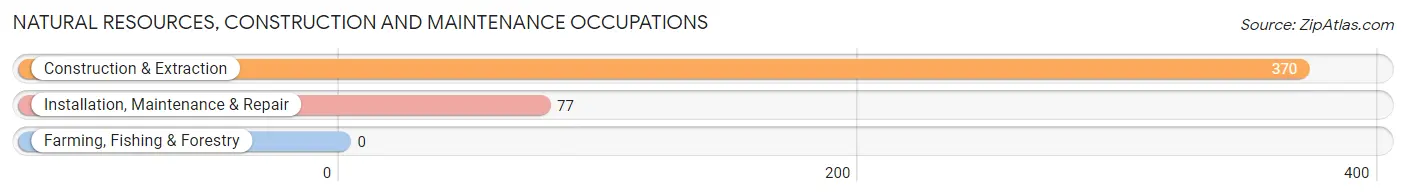
Natural Resources, Construction and Maintenance Occupations
The most common Natural Resources, Construction and Maintenance occupations in North Patchogue are Construction & Extraction (370 | 9.8%), and Installation, Maintenance & Repair (77 | 2.0%).
Natural Resources, Construction and Maintenance Occupations by Sex
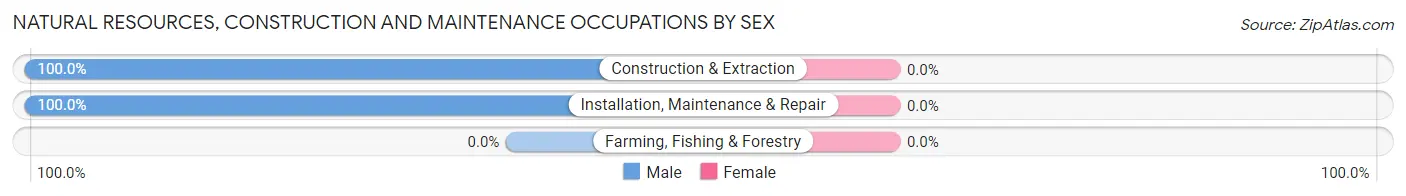
| Occupation | Male | Female |
| Farming, Fishing & Forestry | 0 (0.0%) | 0 (0.0%) |
| Construction & Extraction | 370 (100.0%) | 0 (0.0%) |
| Installation, Maintenance & Repair | 77 (100.0%) | 0 (0.0%) |
| Total (Category) | 447 (100.0%) | 0 (0.0%) |
| Total (Overall) | 1,914 (50.8%) | 1,855 (49.2%) |
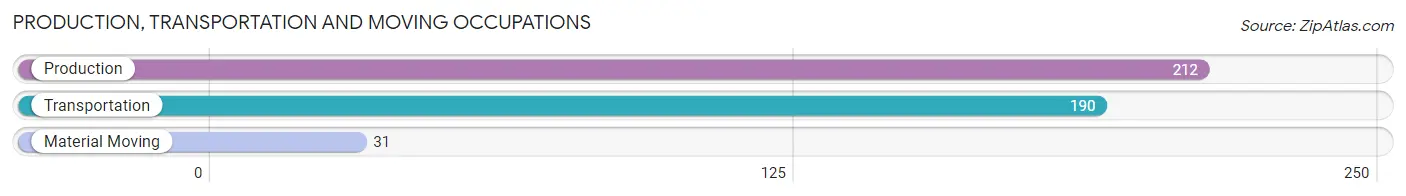
Production, Transportation and Moving Occupations
The most common Production, Transportation and Moving occupations in North Patchogue are Production (212 | 5.6%), Transportation (190 | 5.0%), and Material Moving (31 | 0.8%).
Production, Transportation and Moving Occupations by Sex
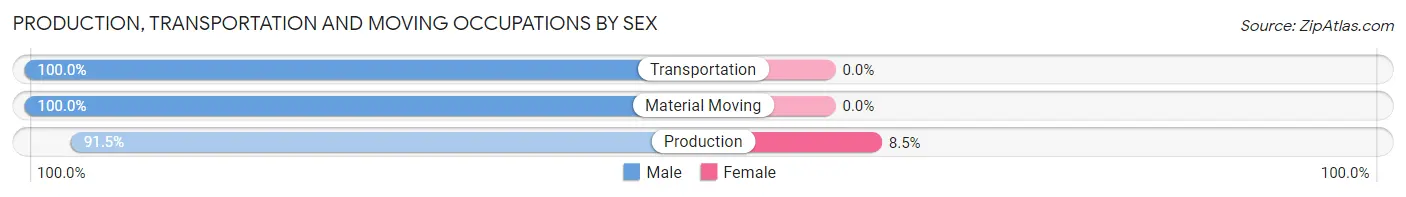
| Occupation | Male | Female |
| Production | 194 (91.5%) | 18 (8.5%) |
| Transportation | 190 (100.0%) | 0 (0.0%) |
| Material Moving | 31 (100.0%) | 0 (0.0%) |
| Total (Category) | 415 (95.8%) | 18 (4.2%) |
| Total (Overall) | 1,914 (50.8%) | 1,855 (49.2%) |
Employment Industries by Sex in North Patchogue
Employment Industries in North Patchogue
The major employment industries in North Patchogue include Health Care & Social Assistance (475 | 12.6%), Manufacturing (435 | 11.5%), Construction (422 | 11.2%), Retail Trade (357 | 9.5%), and Public Administration (298 | 7.9%).
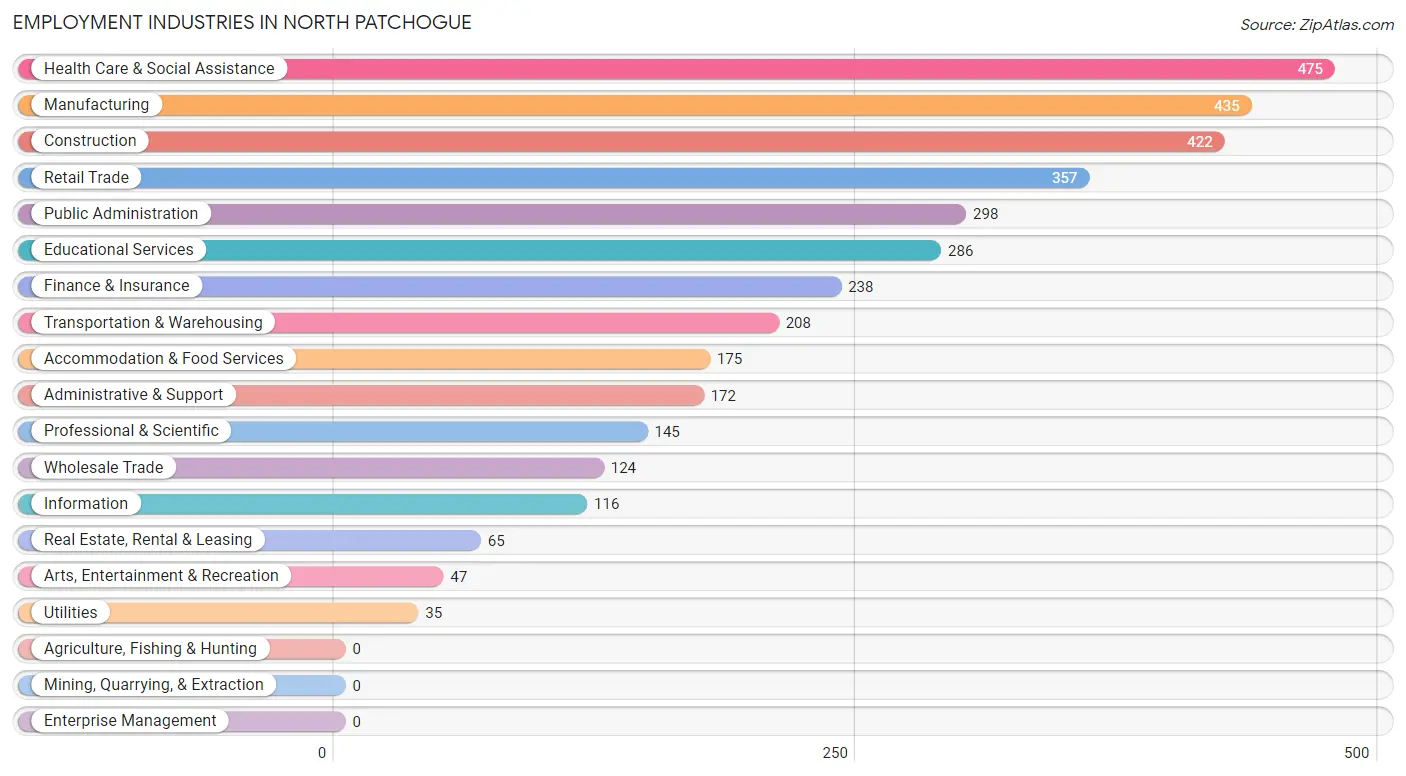
Employment Industries by Sex in North Patchogue
The North Patchogue industries that see more men than women are Arts, Entertainment & Recreation (100.0%), Transportation & Warehousing (96.6%), and Wholesale Trade (86.3%), whereas the industries that tend to have a higher number of women are Utilities (100.0%), Information (100.0%), and Health Care & Social Assistance (83.2%).
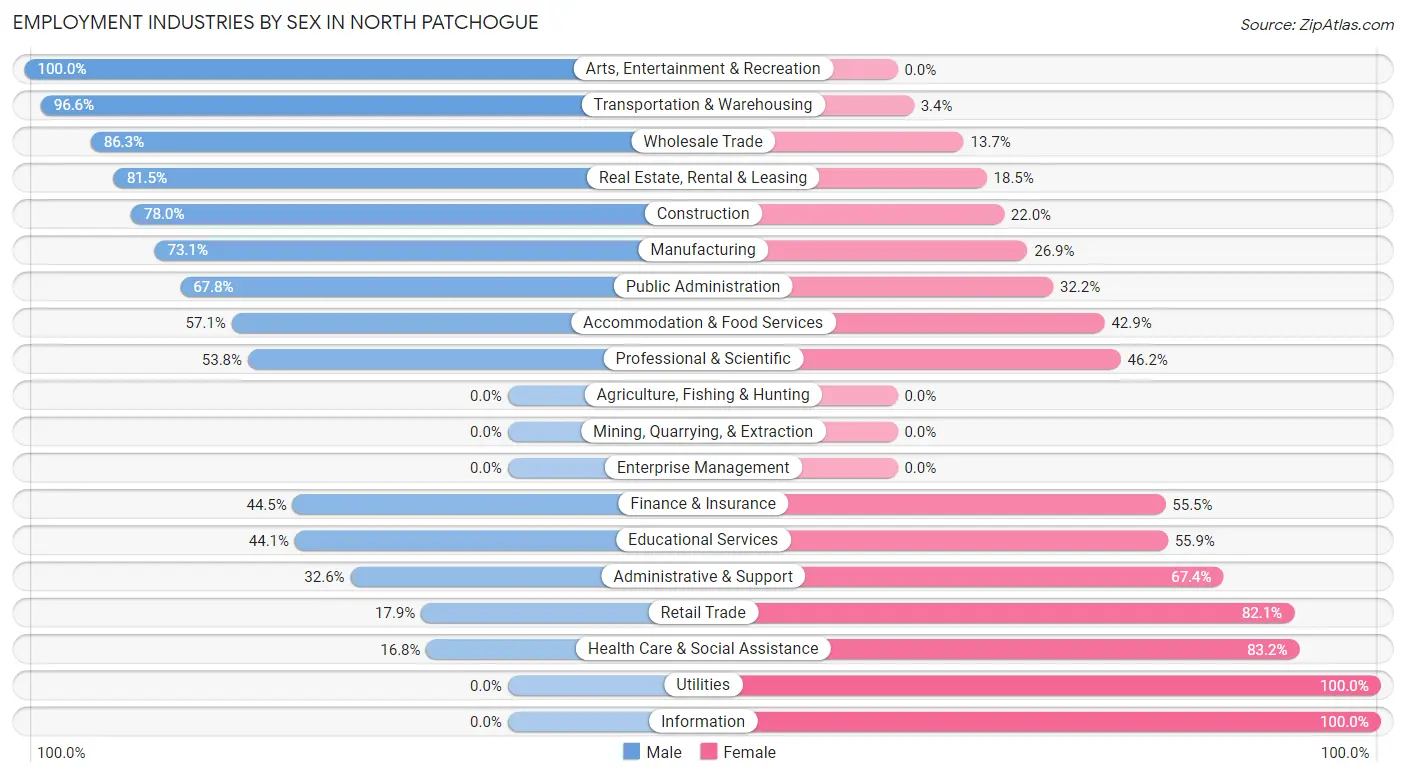
| Industry | Male | Female |
| Agriculture, Fishing & Hunting | 0 (0.0%) | 0 (0.0%) |
| Mining, Quarrying, & Extraction | 0 (0.0%) | 0 (0.0%) |
| Construction | 329 (78.0%) | 93 (22.0%) |
| Manufacturing | 318 (73.1%) | 117 (26.9%) |
| Wholesale Trade | 107 (86.3%) | 17 (13.7%) |
| Retail Trade | 64 (17.9%) | 293 (82.1%) |
| Transportation & Warehousing | 201 (96.6%) | 7 (3.4%) |
| Utilities | 0 (0.0%) | 35 (100.0%) |
| Information | 0 (0.0%) | 116 (100.0%) |
| Finance & Insurance | 106 (44.5%) | 132 (55.5%) |
| Real Estate, Rental & Leasing | 53 (81.5%) | 12 (18.5%) |
| Professional & Scientific | 78 (53.8%) | 67 (46.2%) |
| Enterprise Management | 0 (0.0%) | 0 (0.0%) |
| Administrative & Support | 56 (32.6%) | 116 (67.4%) |
| Educational Services | 126 (44.1%) | 160 (55.9%) |
| Health Care & Social Assistance | 80 (16.8%) | 395 (83.2%) |
| Arts, Entertainment & Recreation | 47 (100.0%) | 0 (0.0%) |
| Accommodation & Food Services | 100 (57.1%) | 75 (42.9%) |
| Public Administration | 202 (67.8%) | 96 (32.2%) |
| Total | 1,914 (50.8%) | 1,855 (49.2%) |
Education in North Patchogue
School Enrollment in North Patchogue
The most common levels of schooling among the 2,549 students in North Patchogue are college / undergraduate (668 | 26.2%), middle school (486 | 19.1%), and elementary school (447 | 17.5%).
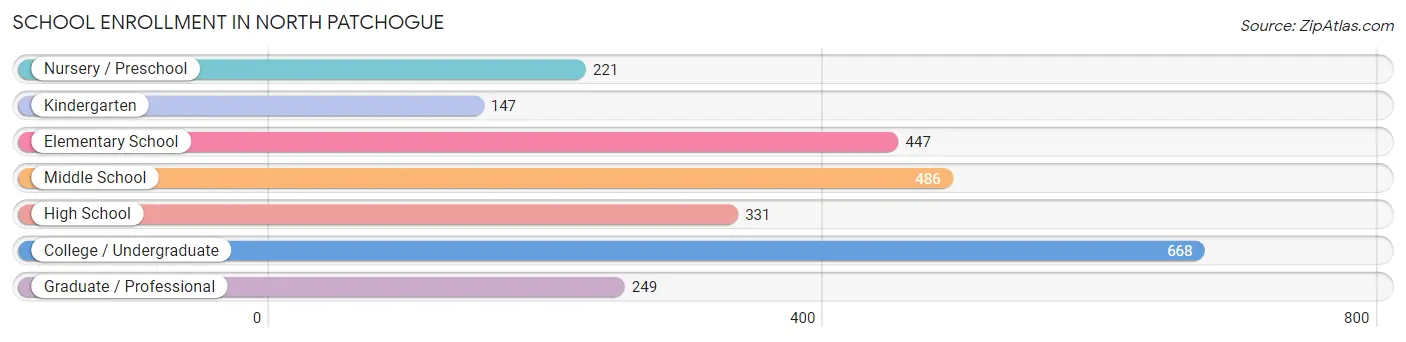
| School Level | # Students | % Students |
| Nursery / Preschool | 221 | 8.7% |
| Kindergarten | 147 | 5.8% |
| Elementary School | 447 | 17.5% |
| Middle School | 486 | 19.1% |
| High School | 331 | 13.0% |
| College / Undergraduate | 668 | 26.2% |
| Graduate / Professional | 249 | 9.8% |
| Total | 2,549 | 100.0% |
School Enrollment by Age by Funding Source in North Patchogue
Out of a total of 2,549 students who are enrolled in schools in North Patchogue, 607 (23.8%) attend a private institution, while the remaining 1,942 (76.2%) are enrolled in public schools. The age group of 20 to 24 year olds has the highest likelihood of being enrolled in private schools, with 323 (65.2% in the age bracket) enrolled. Conversely, the age group of 10 to 14 year olds has the lowest likelihood of being enrolled in a private school, with 550 (100.0% in the age bracket) attending a public institution.
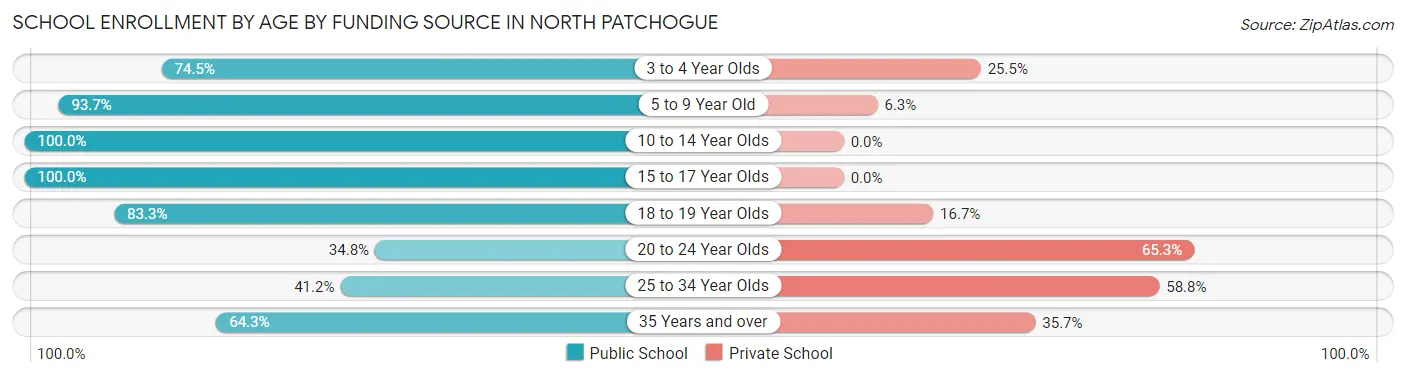
| Age Bracket | Public School | Private School |
| 3 to 4 Year Olds | 140 (74.5%) | 48 (25.5%) |
| 5 to 9 Year Old | 609 (93.7%) | 41 (6.3%) |
| 10 to 14 Year Olds | 550 (100.0%) | 0 (0.0%) |
| 15 to 17 Year Olds | 165 (100.0%) | 0 (0.0%) |
| 18 to 19 Year Olds | 135 (83.3%) | 27 (16.7%) |
| 20 to 24 Year Olds | 172 (34.7%) | 323 (65.2%) |
| 25 to 34 Year Olds | 82 (41.2%) | 117 (58.8%) |
| 35 Years and over | 90 (64.3%) | 50 (35.7%) |
| Total | 1,942 (76.2%) | 607 (23.8%) |
Educational Attainment by Field of Study in North Patchogue
Business (236 | 17.1%), education (193 | 14.0%), liberal arts & history (181 | 13.1%), arts & humanities (153 | 11.1%), and bio, nature & agricultural (112 | 8.1%) are the most common fields of study among 1,381 individuals in North Patchogue who have obtained a bachelor's degree or higher.
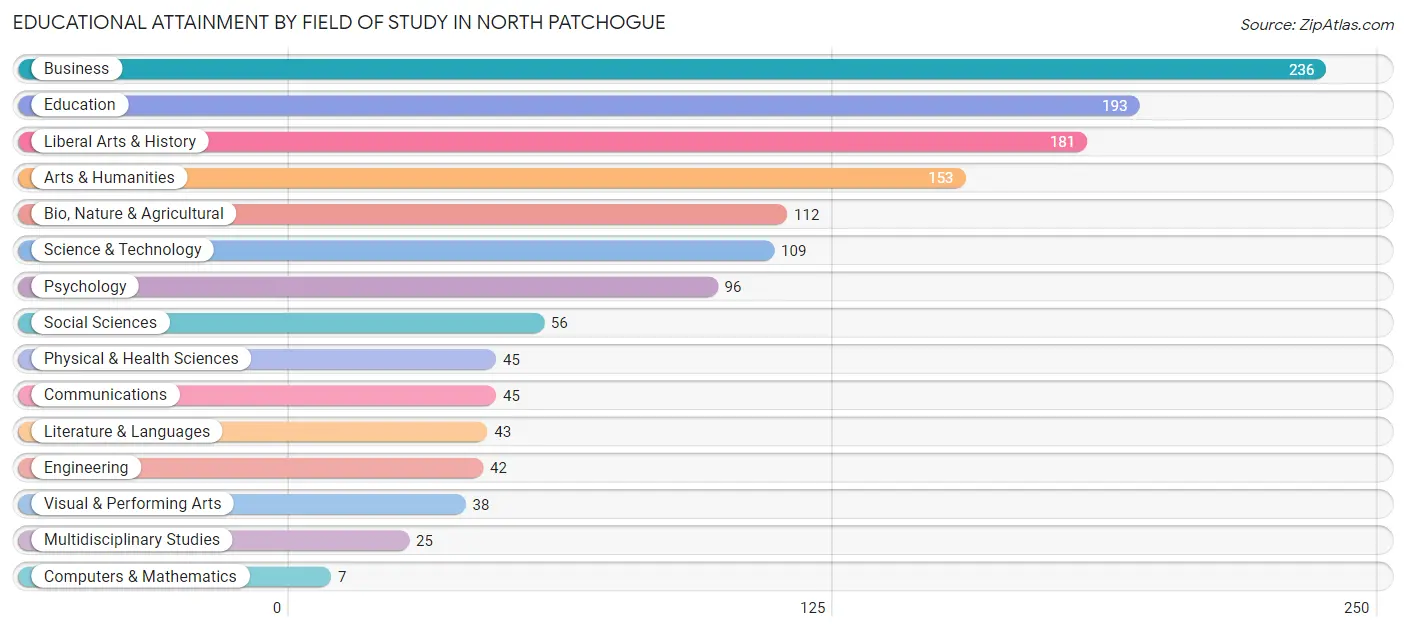
| Field of Study | # Graduates | % Graduates |
| Computers & Mathematics | 7 | 0.5% |
| Bio, Nature & Agricultural | 112 | 8.1% |
| Physical & Health Sciences | 45 | 3.3% |
| Psychology | 96 | 7.0% |
| Social Sciences | 56 | 4.1% |
| Engineering | 42 | 3.0% |
| Multidisciplinary Studies | 25 | 1.8% |
| Science & Technology | 109 | 7.9% |
| Business | 236 | 17.1% |
| Education | 193 | 14.0% |
| Literature & Languages | 43 | 3.1% |
| Liberal Arts & History | 181 | 13.1% |
| Visual & Performing Arts | 38 | 2.8% |
| Communications | 45 | 3.3% |
| Arts & Humanities | 153 | 11.1% |
| Total | 1,381 | 100.0% |
Transportation & Commute in North Patchogue
Vehicle Availability by Sex in North Patchogue
The most prevalent vehicle ownership categories in North Patchogue are males with 2 vehicles (889, accounting for 46.8%) and females with 2 vehicles (733, making up 49.2%).
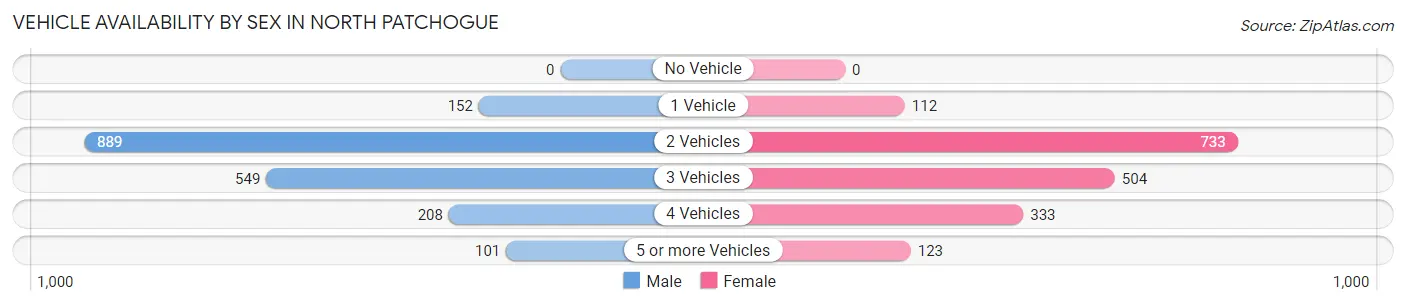
| Vehicles Available | Male | Female |
| No Vehicle | 0 (0.0%) | 0 (0.0%) |
| 1 Vehicle | 152 (8.0%) | 112 (6.2%) |
| 2 Vehicles | 889 (46.8%) | 733 (40.6%) |
| 3 Vehicles | 549 (28.9%) | 504 (27.9%) |
| 4 Vehicles | 208 (11.0%) | 333 (18.4%) |
| 5 or more Vehicles | 101 (5.3%) | 123 (6.8%) |
| Total | 1,899 (100.0%) | 1,805 (100.0%) |
Commute Time in North Patchogue
The most frequently occuring commute durations in North Patchogue are 30 to 34 minutes (577 commuters, 17.1%), 10 to 14 minutes (453 commuters, 13.4%), and 20 to 24 minutes (430 commuters, 12.7%).
| Commute Time | # Commuters | % Commuters |
| Less than 5 Minutes | 7 | 0.2% |
| 5 to 9 Minutes | 358 | 10.6% |
| 10 to 14 Minutes | 453 | 13.4% |
| 15 to 19 Minutes | 429 | 12.7% |
| 20 to 24 Minutes | 430 | 12.7% |
| 25 to 29 Minutes | 122 | 3.6% |
| 30 to 34 Minutes | 577 | 17.1% |
| 35 to 39 Minutes | 33 | 1.0% |
| 40 to 44 Minutes | 204 | 6.0% |
| 45 to 59 Minutes | 255 | 7.5% |
| 60 to 89 Minutes | 130 | 3.8% |
| 90 or more Minutes | 378 | 11.2% |
Commute Time by Sex in North Patchogue
The most common commute times in North Patchogue are 30 to 34 minutes (373 commuters, 21.6%) for males and 5 to 9 minutes (325 commuters, 19.7%) for females.
| Commute Time | Male | Female |
| Less than 5 Minutes | 0 (0.0%) | 7 (0.4%) |
| 5 to 9 Minutes | 33 (1.9%) | 325 (19.7%) |
| 10 to 14 Minutes | 185 (10.7%) | 268 (16.2%) |
| 15 to 19 Minutes | 214 (12.4%) | 215 (13.0%) |
| 20 to 24 Minutes | 152 (8.8%) | 278 (16.8%) |
| 25 to 29 Minutes | 92 (5.3%) | 30 (1.8%) |
| 30 to 34 Minutes | 373 (21.6%) | 204 (12.4%) |
| 35 to 39 Minutes | 14 (0.8%) | 19 (1.1%) |
| 40 to 44 Minutes | 114 (6.6%) | 90 (5.4%) |
| 45 to 59 Minutes | 158 (9.2%) | 97 (5.9%) |
| 60 to 89 Minutes | 77 (4.5%) | 53 (3.2%) |
| 90 or more Minutes | 313 (18.1%) | 65 (3.9%) |
Time of Departure to Work by Sex in North Patchogue
The most frequent times of departure to work in North Patchogue are 6:00 AM to 6:29 AM (337, 19.5%) for males and 7:00 AM to 7:29 AM (258, 15.6%) for females.
| Time of Departure | Male | Female |
| 12:00 AM to 4:59 AM | 185 (10.7%) | 161 (9.8%) |
| 5:00 AM to 5:29 AM | 113 (6.6%) | 0 (0.0%) |
| 5:30 AM to 5:59 AM | 164 (9.5%) | 0 (0.0%) |
| 6:00 AM to 6:29 AM | 337 (19.5%) | 43 (2.6%) |
| 6:30 AM to 6:59 AM | 155 (9.0%) | 61 (3.7%) |
| 7:00 AM to 7:29 AM | 164 (9.5%) | 258 (15.6%) |
| 7:30 AM to 7:59 AM | 99 (5.7%) | 119 (7.2%) |
| 8:00 AM to 8:29 AM | 65 (3.8%) | 172 (10.4%) |
| 8:30 AM to 8:59 AM | 69 (4.0%) | 141 (8.5%) |
| 9:00 AM to 9:59 AM | 143 (8.3%) | 164 (9.9%) |
| 10:00 AM to 10:59 AM | 0 (0.0%) | 81 (4.9%) |
| 11:00 AM to 11:59 AM | 25 (1.5%) | 12 (0.7%) |
| 12:00 PM to 3:59 PM | 149 (8.6%) | 188 (11.4%) |
| 4:00 PM to 11:59 PM | 57 (3.3%) | 251 (15.2%) |
| Total | 1,725 (100.0%) | 1,651 (100.0%) |
Housing Occupancy in North Patchogue
Occupancy by Ownership in North Patchogue
Of the total 2,346 dwellings in North Patchogue, owner-occupied units account for 2,096 (89.3%), while renter-occupied units make up 250 (10.7%).
| Occupancy | # Housing Units | % Housing Units |
| Owner Occupied Housing Units | 2,096 | 89.3% |
| Renter-Occupied Housing Units | 250 | 10.7% |
| Total Occupied Housing Units | 2,346 | 100.0% |
Occupancy by Household Size in North Patchogue
| Household Size | # Housing Units | % Housing Units |
| 1-Person Household | 334 | 14.2% |
| 2-Person Household | 507 | 21.6% |
| 3-Person Household | 631 | 26.9% |
| 4+ Person Household | 874 | 37.2% |
| Total Housing Units | 2,346 | 100.0% |
Occupancy by Ownership by Household Size in North Patchogue
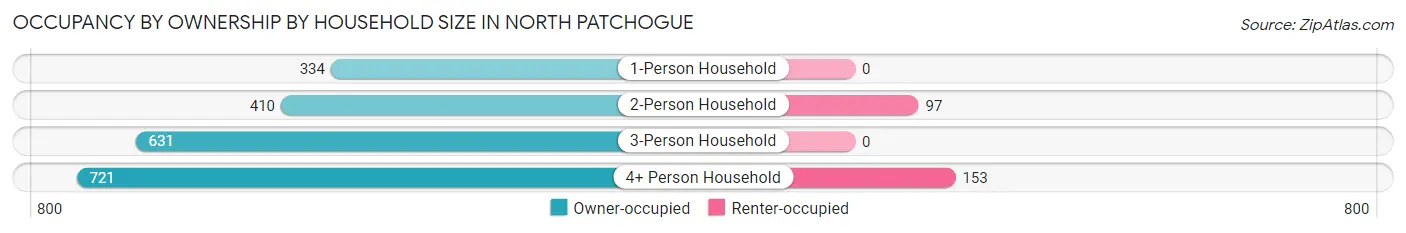
| Household Size | Owner-occupied | Renter-occupied |
| 1-Person Household | 334 (100.0%) | 0 (0.0%) |
| 2-Person Household | 410 (80.9%) | 97 (19.1%) |
| 3-Person Household | 631 (100.0%) | 0 (0.0%) |
| 4+ Person Household | 721 (82.5%) | 153 (17.5%) |
| Total Housing Units | 2,096 (89.3%) | 250 (10.7%) |
Occupancy by Educational Attainment in North Patchogue
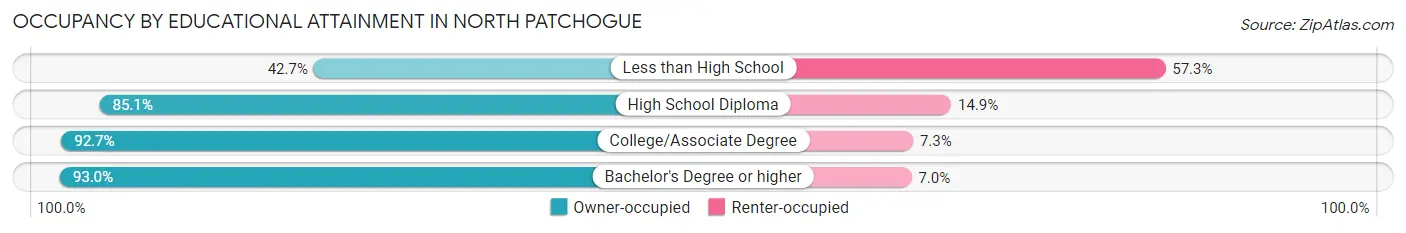
| Household Size | Owner-occupied | Renter-occupied |
| Less than High School | 32 (42.7%) | 43 (57.3%) |
| High School Diploma | 487 (85.1%) | 85 (14.9%) |
| College/Associate Degree | 992 (92.7%) | 78 (7.3%) |
| Bachelor's Degree or higher | 585 (93.0%) | 44 (7.0%) |
Occupancy by Age of Householder in North Patchogue
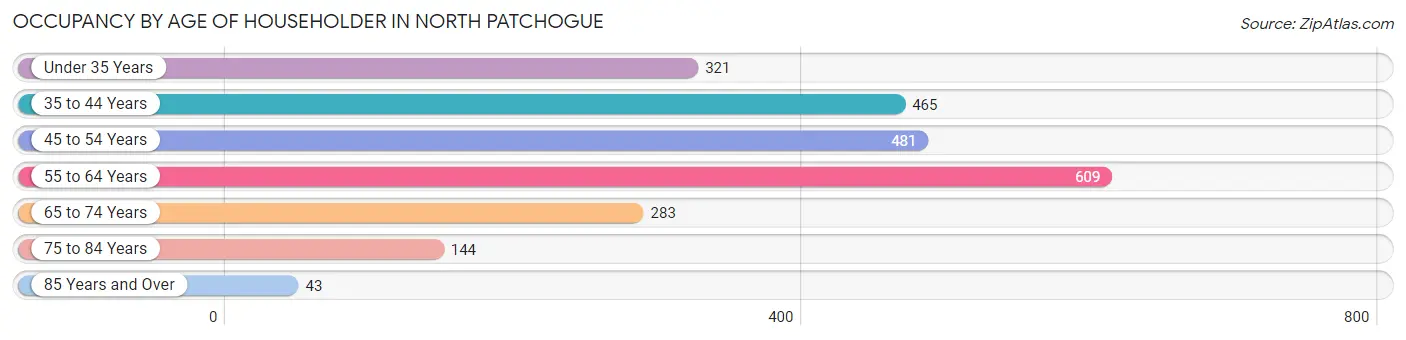
| Age Bracket | # Households | % Households |
| Under 35 Years | 321 | 13.7% |
| 35 to 44 Years | 465 | 19.8% |
| 45 to 54 Years | 481 | 20.5% |
| 55 to 64 Years | 609 | 26.0% |
| 65 to 74 Years | 283 | 12.1% |
| 75 to 84 Years | 144 | 6.1% |
| 85 Years and Over | 43 | 1.8% |
| Total | 2,346 | 100.0% |
Housing Finances in North Patchogue
Median Income by Occupancy in North Patchogue
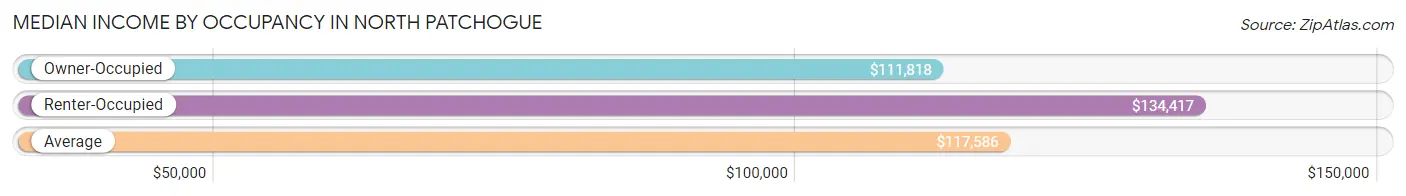
| Occupancy Type | # Households | Median Income |
| Owner-Occupied | 2,096 (89.3%) | $111,818 |
| Renter-Occupied | 250 (10.7%) | $134,417 |
| Average | 2,346 (100.0%) | $117,586 |
Occupancy by Householder Income Bracket in North Patchogue
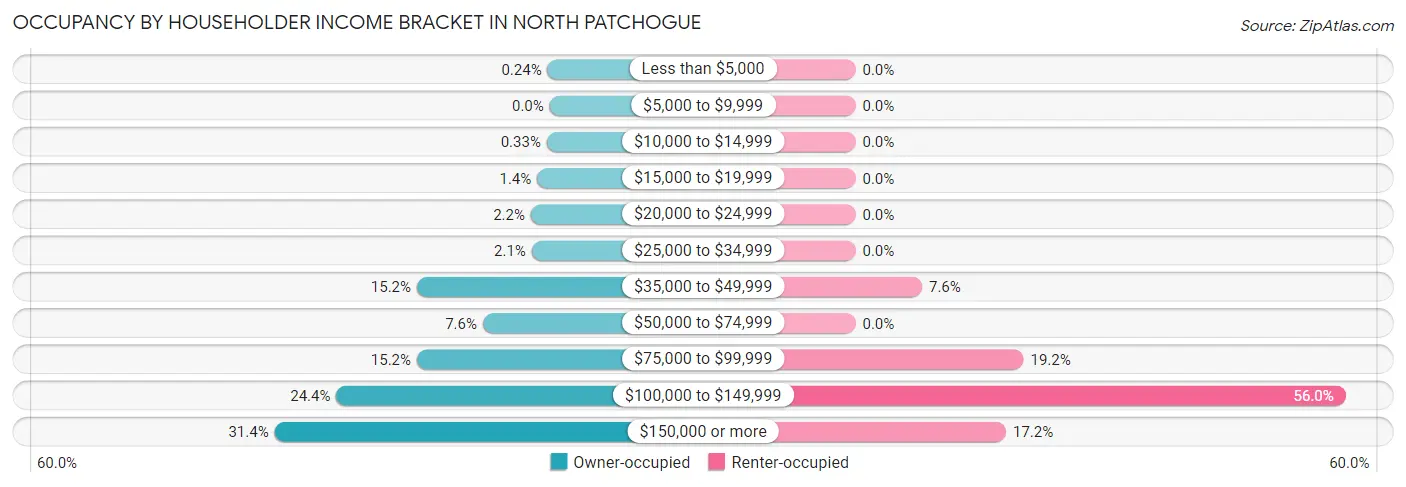
| Income Bracket | Owner-occupied | Renter-occupied |
| Less than $5,000 | 5 (0.2%) | 0 (0.0%) |
| $5,000 to $9,999 | 0 (0.0%) | 0 (0.0%) |
| $10,000 to $14,999 | 7 (0.3%) | 0 (0.0%) |
| $15,000 to $19,999 | 30 (1.4%) | 0 (0.0%) |
| $20,000 to $24,999 | 45 (2.1%) | 0 (0.0%) |
| $25,000 to $34,999 | 43 (2.1%) | 0 (0.0%) |
| $35,000 to $49,999 | 318 (15.2%) | 19 (7.6%) |
| $50,000 to $74,999 | 160 (7.6%) | 0 (0.0%) |
| $75,000 to $99,999 | 318 (15.2%) | 48 (19.2%) |
| $100,000 to $149,999 | 511 (24.4%) | 140 (56.0%) |
| $150,000 or more | 659 (31.4%) | 43 (17.2%) |
| Total | 2,096 (100.0%) | 250 (100.0%) |
Monthly Housing Cost Tiers in North Patchogue
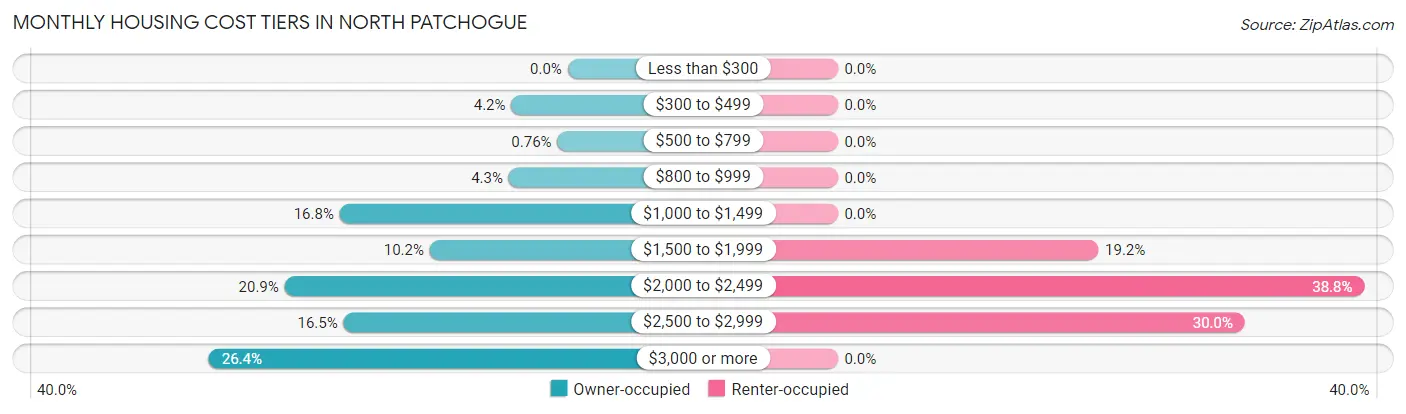
| Monthly Cost | Owner-occupied | Renter-occupied |
| Less than $300 | 0 (0.0%) | 0 (0.0%) |
| $300 to $499 | 87 (4.2%) | 0 (0.0%) |
| $500 to $799 | 16 (0.8%) | 0 (0.0%) |
| $800 to $999 | 91 (4.3%) | 0 (0.0%) |
| $1,000 to $1,499 | 352 (16.8%) | 0 (0.0%) |
| $1,500 to $1,999 | 213 (10.2%) | 48 (19.2%) |
| $2,000 to $2,499 | 437 (20.8%) | 97 (38.8%) |
| $2,500 to $2,999 | 346 (16.5%) | 75 (30.0%) |
| $3,000 or more | 554 (26.4%) | 0 (0.0%) |
| Total | 2,096 (100.0%) | 250 (100.0%) |
Physical Housing Characteristics in North Patchogue
Housing Structures in North Patchogue
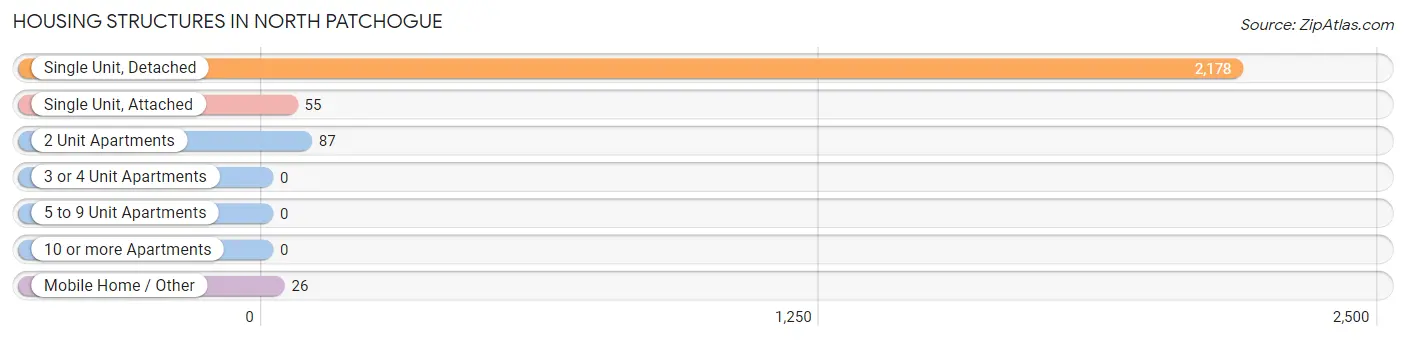
| Structure Type | # Housing Units | % Housing Units |
| Single Unit, Detached | 2,178 | 92.8% |
| Single Unit, Attached | 55 | 2.3% |
| 2 Unit Apartments | 87 | 3.7% |
| 3 or 4 Unit Apartments | 0 | 0.0% |
| 5 to 9 Unit Apartments | 0 | 0.0% |
| 10 or more Apartments | 0 | 0.0% |
| Mobile Home / Other | 26 | 1.1% |
| Total | 2,346 | 100.0% |
Housing Structures by Occupancy in North Patchogue
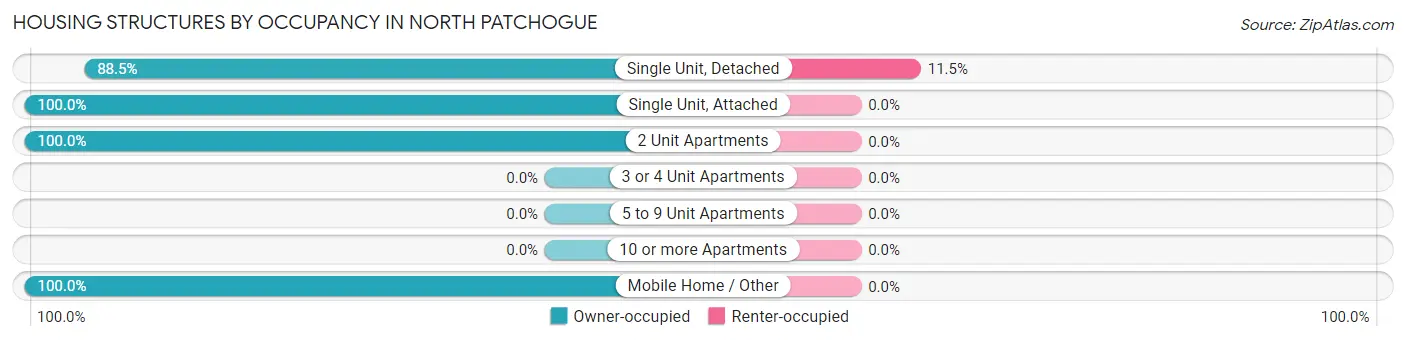
| Structure Type | Owner-occupied | Renter-occupied |
| Single Unit, Detached | 1,928 (88.5%) | 250 (11.5%) |
| Single Unit, Attached | 55 (100.0%) | 0 (0.0%) |
| 2 Unit Apartments | 87 (100.0%) | 0 (0.0%) |
| 3 or 4 Unit Apartments | 0 (0.0%) | 0 (0.0%) |
| 5 to 9 Unit Apartments | 0 (0.0%) | 0 (0.0%) |
| 10 or more Apartments | 0 (0.0%) | 0 (0.0%) |
| Mobile Home / Other | 26 (100.0%) | 0 (0.0%) |
| Total | 2,096 (89.3%) | 250 (10.7%) |
Housing Structures by Number of Rooms in North Patchogue
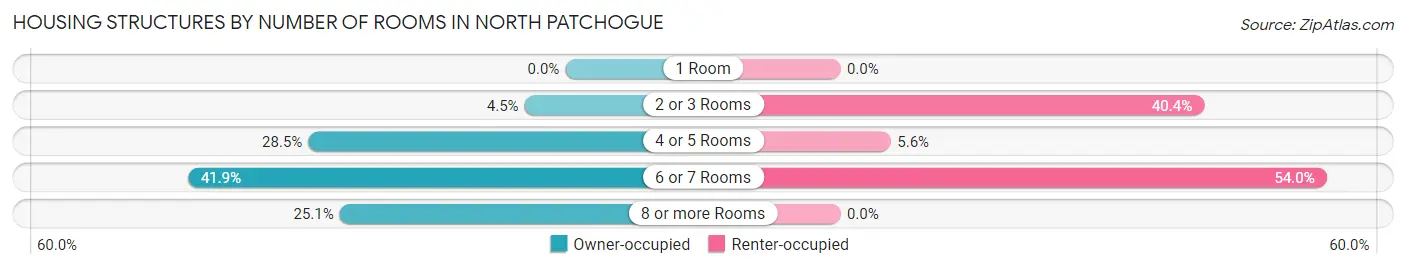
| Number of Rooms | Owner-occupied | Renter-occupied |
| 1 Room | 0 (0.0%) | 0 (0.0%) |
| 2 or 3 Rooms | 95 (4.5%) | 101 (40.4%) |
| 4 or 5 Rooms | 598 (28.5%) | 14 (5.6%) |
| 6 or 7 Rooms | 878 (41.9%) | 135 (54.0%) |
| 8 or more Rooms | 525 (25.1%) | 0 (0.0%) |
| Total | 2,096 (100.0%) | 250 (100.0%) |
Housing Structure by Heating Type in North Patchogue
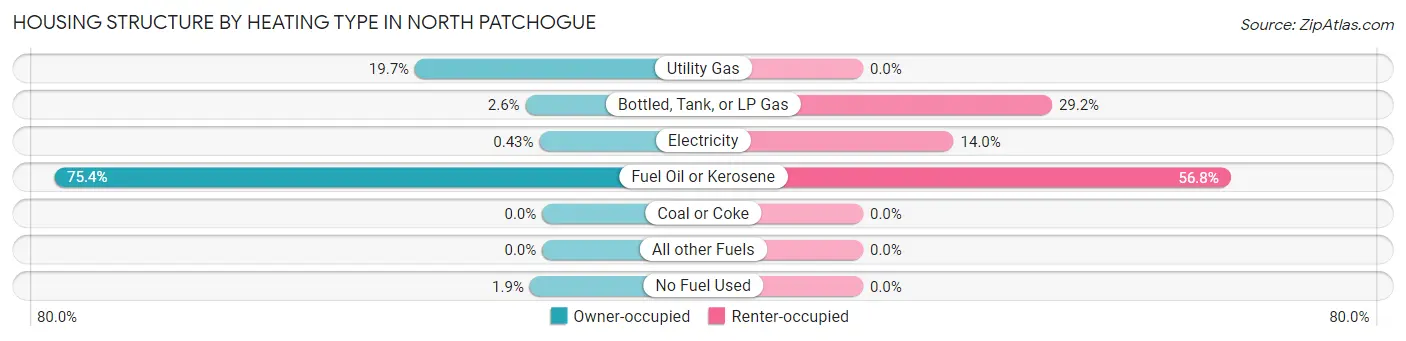
| Heating Type | Owner-occupied | Renter-occupied |
| Utility Gas | 412 (19.7%) | 0 (0.0%) |
| Bottled, Tank, or LP Gas | 54 (2.6%) | 73 (29.2%) |
| Electricity | 9 (0.4%) | 35 (14.0%) |
| Fuel Oil or Kerosene | 1,581 (75.4%) | 142 (56.8%) |
| Coal or Coke | 0 (0.0%) | 0 (0.0%) |
| All other Fuels | 0 (0.0%) | 0 (0.0%) |
| No Fuel Used | 40 (1.9%) | 0 (0.0%) |
| Total | 2,096 (100.0%) | 250 (100.0%) |
Household Vehicle Usage in North Patchogue
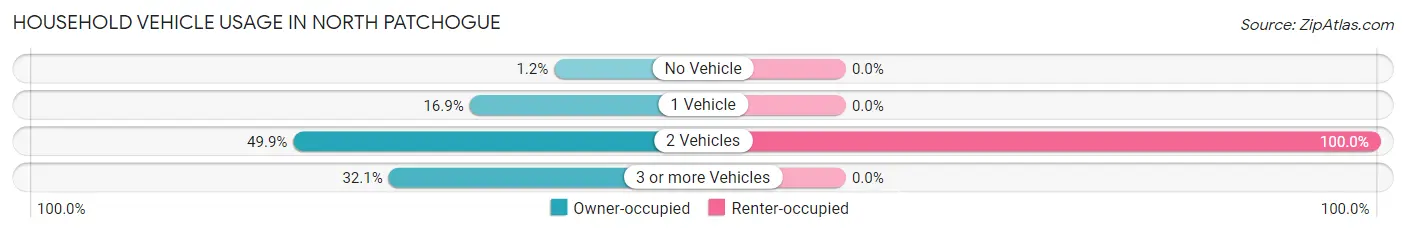
| Vehicles per Household | Owner-occupied | Renter-occupied |
| No Vehicle | 24 (1.1%) | 0 (0.0%) |
| 1 Vehicle | 355 (16.9%) | 0 (0.0%) |
| 2 Vehicles | 1,045 (49.9%) | 250 (100.0%) |
| 3 or more Vehicles | 672 (32.1%) | 0 (0.0%) |
| Total | 2,096 (100.0%) | 250 (100.0%) |
Real Estate & Mortgages in North Patchogue
Real Estate and Mortgage Overview in North Patchogue
| Characteristic | Without Mortgage | With Mortgage |
| Housing Units | 647 | 1,449 |
| Median Property Value | $350,600 | $384,900 |
| Median Household Income | $84,893 | $585 |
| Monthly Housing Costs | $1,255 | $554 |
| Real Estate Taxes | $8,236 | $11 |
Property Value by Mortgage Status in North Patchogue
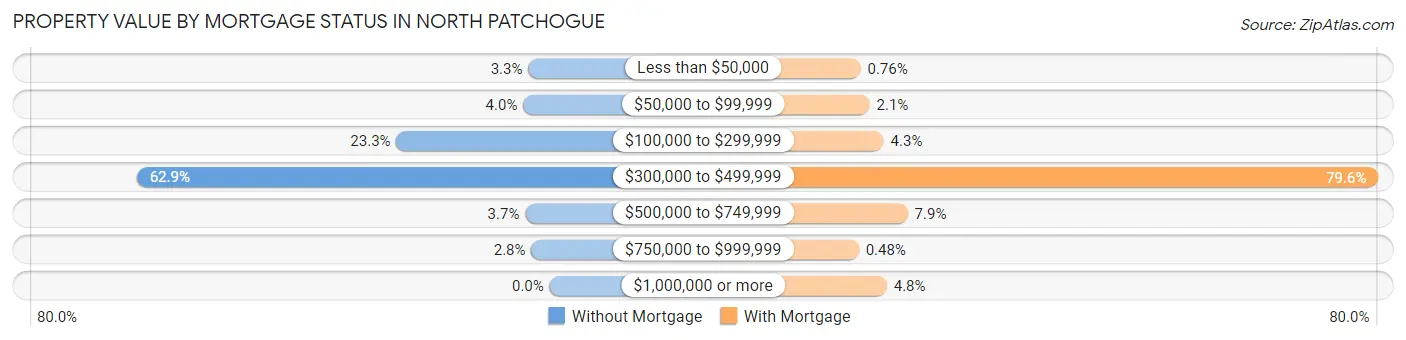
| Property Value | Without Mortgage | With Mortgage |
| Less than $50,000 | 21 (3.3%) | 11 (0.8%) |
| $50,000 to $99,999 | 26 (4.0%) | 31 (2.1%) |
| $100,000 to $299,999 | 151 (23.3%) | 62 (4.3%) |
| $300,000 to $499,999 | 407 (62.9%) | 1,154 (79.6%) |
| $500,000 to $749,999 | 24 (3.7%) | 115 (7.9%) |
| $750,000 to $999,999 | 18 (2.8%) | 7 (0.5%) |
| $1,000,000 or more | 0 (0.0%) | 69 (4.8%) |
| Total | 647 (100.0%) | 1,449 (100.0%) |
Household Income by Mortgage Status in North Patchogue
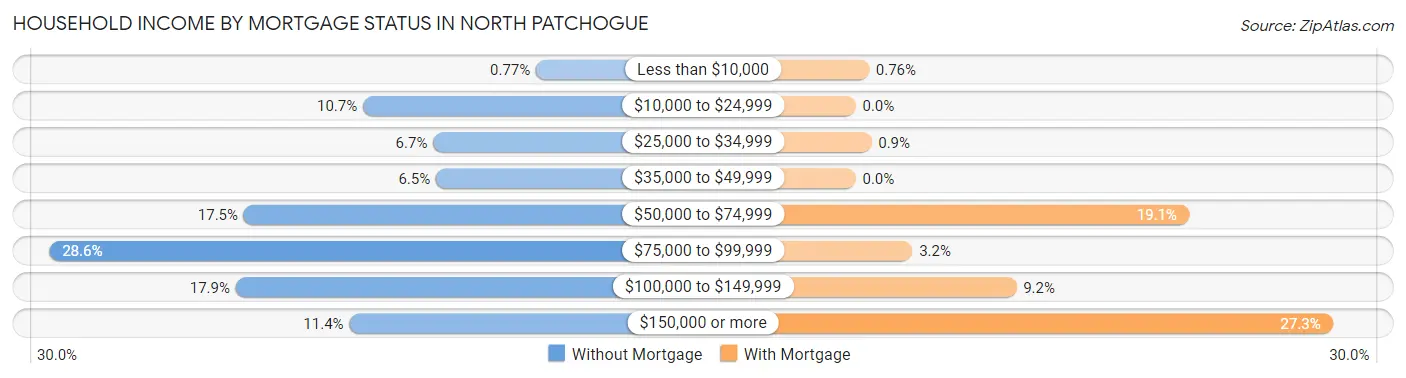
| Household Income | Without Mortgage | With Mortgage |
| Less than $10,000 | 5 (0.8%) | 11 (0.8%) |
| $10,000 to $24,999 | 69 (10.7%) | 0 (0.0%) |
| $25,000 to $34,999 | 43 (6.7%) | 13 (0.9%) |
| $35,000 to $49,999 | 42 (6.5%) | 0 (0.0%) |
| $50,000 to $74,999 | 113 (17.5%) | 276 (19.1%) |
| $75,000 to $99,999 | 185 (28.6%) | 47 (3.2%) |
| $100,000 to $149,999 | 116 (17.9%) | 133 (9.2%) |
| $150,000 or more | 74 (11.4%) | 395 (27.3%) |
| Total | 647 (100.0%) | 1,449 (100.0%) |
Property Value to Household Income Ratio in North Patchogue
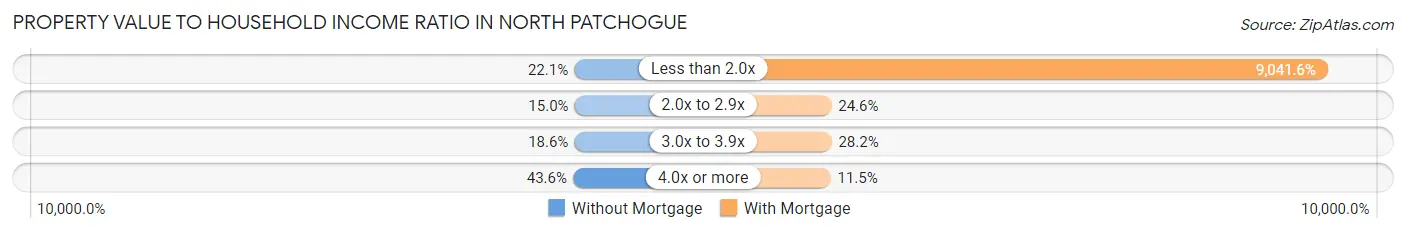
| Value-to-Income Ratio | Without Mortgage | With Mortgage |
| Less than 2.0x | 143 (22.1%) | 131,012 (9,041.5%) |
| 2.0x to 2.9x | 97 (15.0%) | 356 (24.6%) |
| 3.0x to 3.9x | 120 (18.5%) | 408 (28.2%) |
| 4.0x or more | 282 (43.6%) | 167 (11.5%) |
| Total | 647 (100.0%) | 1,449 (100.0%) |
Real Estate Taxes by Mortgage Status in North Patchogue
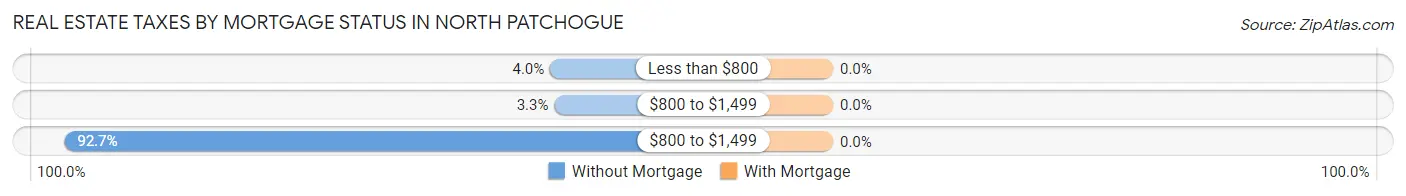
| Property Taxes | Without Mortgage | With Mortgage |
| Less than $800 | 26 (4.0%) | 0 (0.0%) |
| $800 to $1,499 | 21 (3.3%) | 0 (0.0%) |
| $800 to $1,499 | 600 (92.7%) | 0 (0.0%) |
| Total | 647 (100.0%) | 1,449 (100.0%) |
Health & Disability in North Patchogue
Health Insurance Coverage by Age in North Patchogue
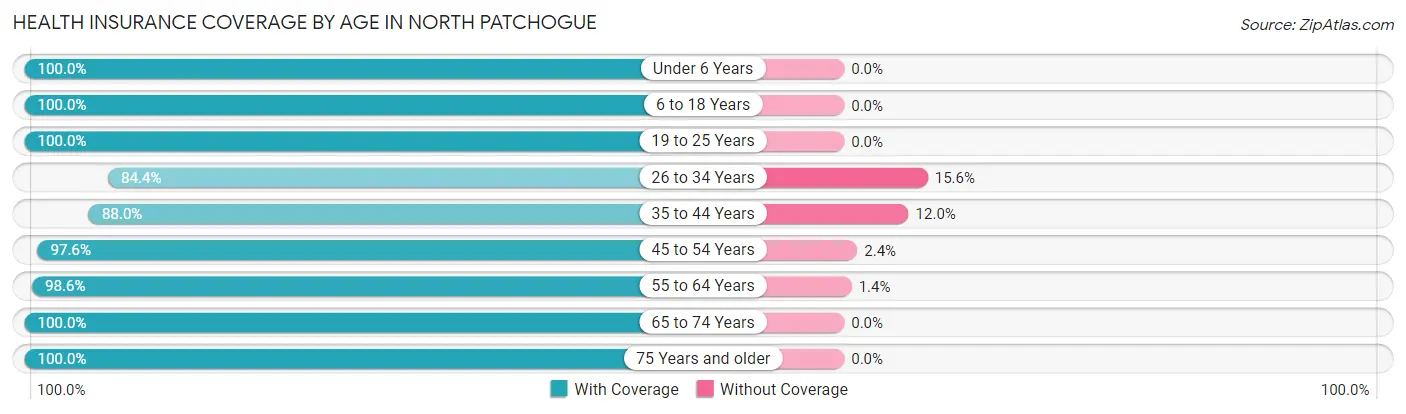
| Age Bracket | With Coverage | Without Coverage |
| Under 6 Years | 702 (100.0%) | 0 (0.0%) |
| 6 to 18 Years | 1,290 (100.0%) | 0 (0.0%) |
| 19 to 25 Years | 1,019 (100.0%) | 0 (0.0%) |
| 26 to 34 Years | 683 (84.4%) | 126 (15.6%) |
| 35 to 44 Years | 733 (88.0%) | 100 (12.0%) |
| 45 to 54 Years | 1,122 (97.6%) | 28 (2.4%) |
| 55 to 64 Years | 1,204 (98.6%) | 17 (1.4%) |
| 65 to 74 Years | 543 (100.0%) | 0 (0.0%) |
| 75 Years and older | 221 (100.0%) | 0 (0.0%) |
| Total | 7,517 (96.5%) | 271 (3.5%) |
Health Insurance Coverage by Citizenship Status in North Patchogue
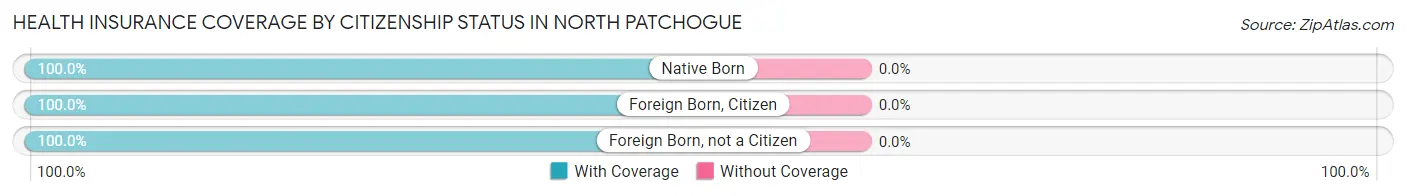
| Citizenship Status | With Coverage | Without Coverage |
| Native Born | 702 (100.0%) | 0 (0.0%) |
| Foreign Born, Citizen | 1,290 (100.0%) | 0 (0.0%) |
| Foreign Born, not a Citizen | 1,019 (100.0%) | 0 (0.0%) |
Health Insurance Coverage by Household Income in North Patchogue
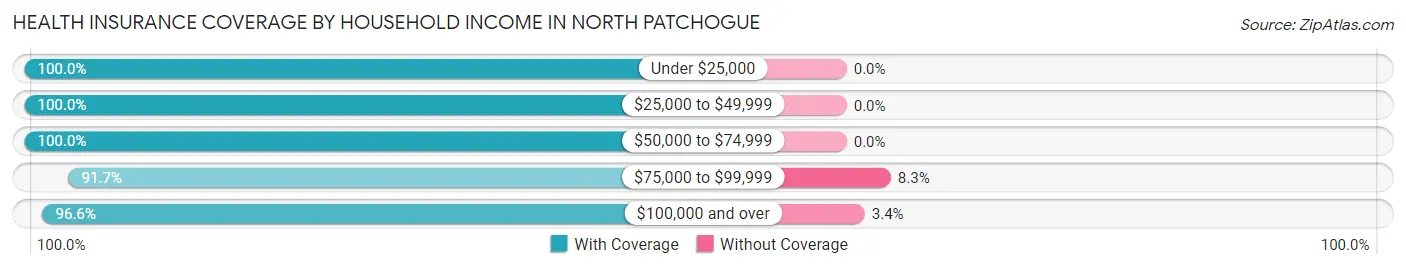
| Household Income | With Coverage | Without Coverage |
| Under $25,000 | 92 (100.0%) | 0 (0.0%) |
| $25,000 to $49,999 | 1,013 (100.0%) | 0 (0.0%) |
| $50,000 to $74,999 | 335 (100.0%) | 0 (0.0%) |
| $75,000 to $99,999 | 1,077 (91.7%) | 97 (8.3%) |
| $100,000 and over | 4,974 (96.6%) | 174 (3.4%) |
Public vs Private Health Insurance Coverage by Age in North Patchogue
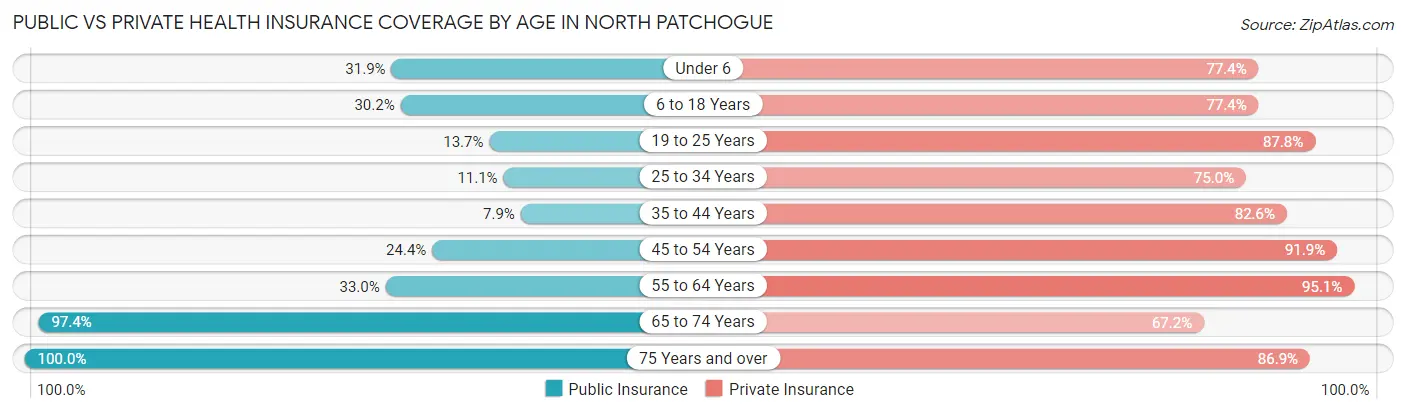
| Age Bracket | Public Insurance | Private Insurance |
| Under 6 | 224 (31.9%) | 543 (77.3%) |
| 6 to 18 Years | 390 (30.2%) | 998 (77.4%) |
| 19 to 25 Years | 140 (13.7%) | 895 (87.8%) |
| 25 to 34 Years | 90 (11.1%) | 607 (75.0%) |
| 35 to 44 Years | 66 (7.9%) | 688 (82.6%) |
| 45 to 54 Years | 280 (24.3%) | 1,057 (91.9%) |
| 55 to 64 Years | 403 (33.0%) | 1,161 (95.1%) |
| 65 to 74 Years | 529 (97.4%) | 365 (67.2%) |
| 75 Years and over | 221 (100.0%) | 192 (86.9%) |
| Total | 2,343 (30.1%) | 6,506 (83.5%) |
Disability Status by Sex by Age in North Patchogue
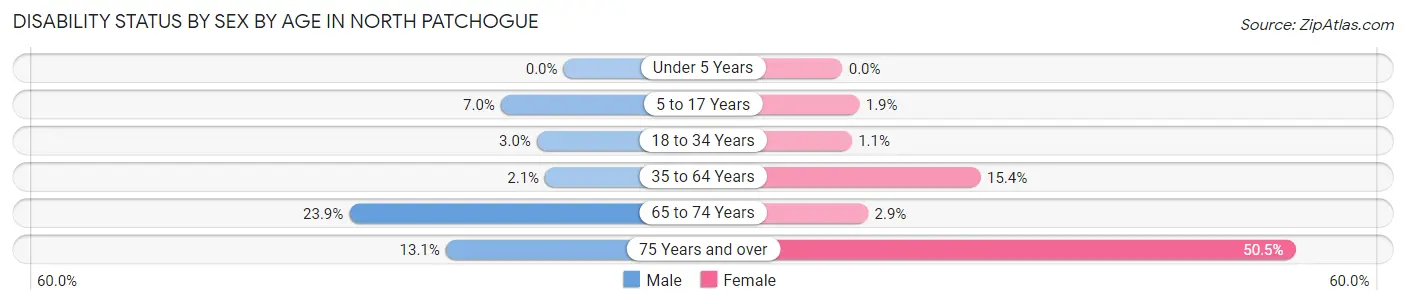
| Age Bracket | Male | Female |
| Under 5 Years | 0 (0.0%) | 0 (0.0%) |
| 5 to 17 Years | 40 (7.0%) | 15 (1.9%) |
| 18 to 34 Years | 22 (3.0%) | 12 (1.1%) |
| 35 to 64 Years | 34 (2.1%) | 238 (15.4%) |
| 65 to 74 Years | 63 (23.9%) | 8 (2.9%) |
| 75 Years and over | 16 (13.1%) | 50 (50.5%) |
Disability Class by Sex by Age in North Patchogue
Disability Class: Hearing Difficulty
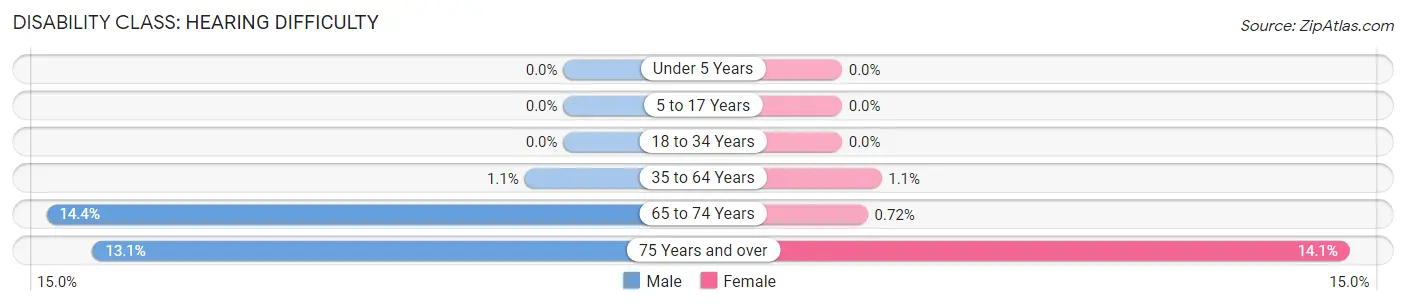
| Age Bracket | Male | Female |
| Under 5 Years | 0 (0.0%) | 0 (0.0%) |
| 5 to 17 Years | 0 (0.0%) | 0 (0.0%) |
| 18 to 34 Years | 0 (0.0%) | 0 (0.0%) |
| 35 to 64 Years | 18 (1.1%) | 17 (1.1%) |
| 65 to 74 Years | 38 (14.4%) | 2 (0.7%) |
| 75 Years and over | 16 (13.1%) | 14 (14.1%) |
Disability Class: Vision Difficulty
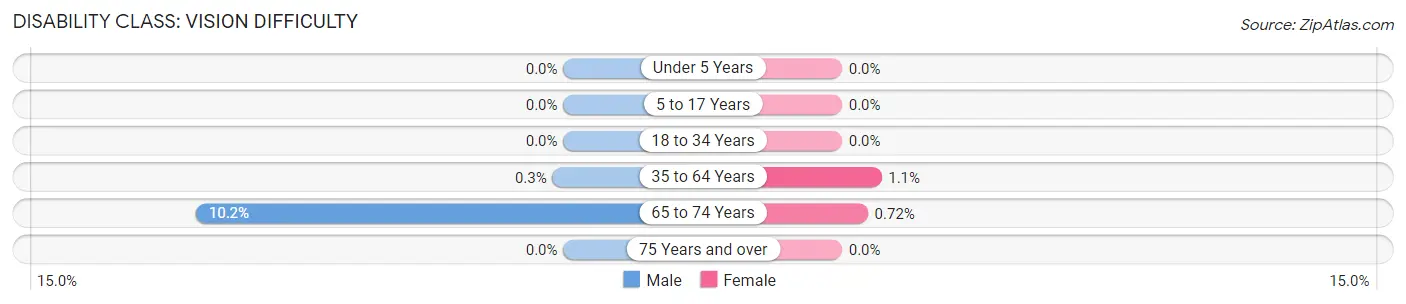
| Age Bracket | Male | Female |
| Under 5 Years | 0 (0.0%) | 0 (0.0%) |
| 5 to 17 Years | 0 (0.0%) | 0 (0.0%) |
| 18 to 34 Years | 0 (0.0%) | 0 (0.0%) |
| 35 to 64 Years | 5 (0.3%) | 17 (1.1%) |
| 65 to 74 Years | 27 (10.2%) | 2 (0.7%) |
| 75 Years and over | 0 (0.0%) | 0 (0.0%) |
Disability Class: Cognitive Difficulty
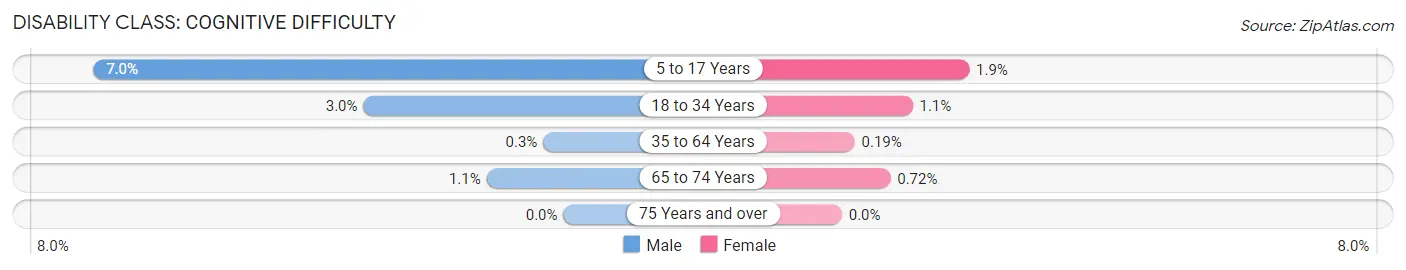
| Age Bracket | Male | Female |
| 5 to 17 Years | 40 (7.0%) | 15 (1.9%) |
| 18 to 34 Years | 22 (3.0%) | 12 (1.1%) |
| 35 to 64 Years | 5 (0.3%) | 3 (0.2%) |
| 65 to 74 Years | 3 (1.1%) | 2 (0.7%) |
| 75 Years and over | 0 (0.0%) | 0 (0.0%) |
Disability Class: Ambulatory Difficulty
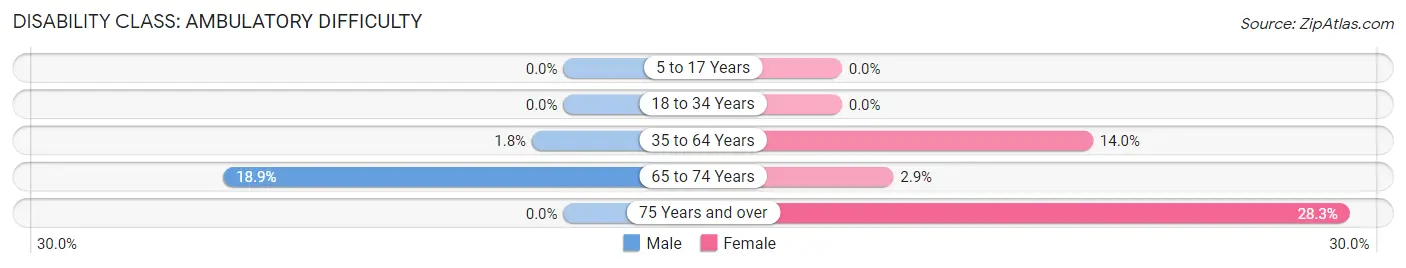
| Age Bracket | Male | Female |
| 5 to 17 Years | 0 (0.0%) | 0 (0.0%) |
| 18 to 34 Years | 0 (0.0%) | 0 (0.0%) |
| 35 to 64 Years | 29 (1.8%) | 216 (14.0%) |
| 65 to 74 Years | 50 (18.9%) | 8 (2.9%) |
| 75 Years and over | 0 (0.0%) | 28 (28.3%) |
Disability Class: Self-Care Difficulty
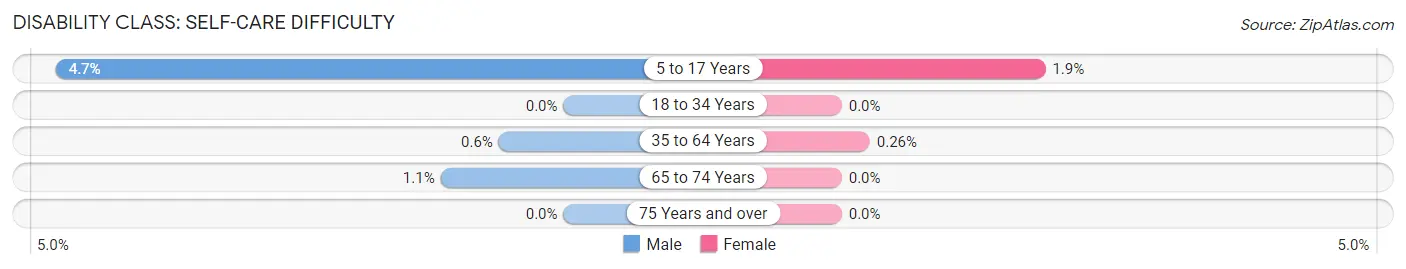
| Age Bracket | Male | Female |
| 5 to 17 Years | 27 (4.7%) | 15 (1.9%) |
| 18 to 34 Years | 0 (0.0%) | 0 (0.0%) |
| 35 to 64 Years | 10 (0.6%) | 4 (0.3%) |
| 65 to 74 Years | 3 (1.1%) | 0 (0.0%) |
| 75 Years and over | 0 (0.0%) | 0 (0.0%) |
Technology Access in North Patchogue
Computing Device Access in North Patchogue
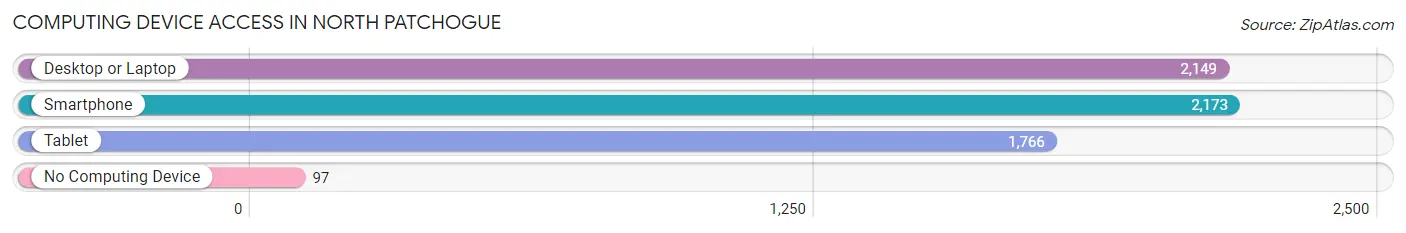
| Device Type | # Households | % Households |
| Desktop or Laptop | 2,149 | 91.6% |
| Smartphone | 2,173 | 92.6% |
| Tablet | 1,766 | 75.3% |
| No Computing Device | 97 | 4.1% |
| Total | 2,346 | 100.0% |
Internet Access in North Patchogue
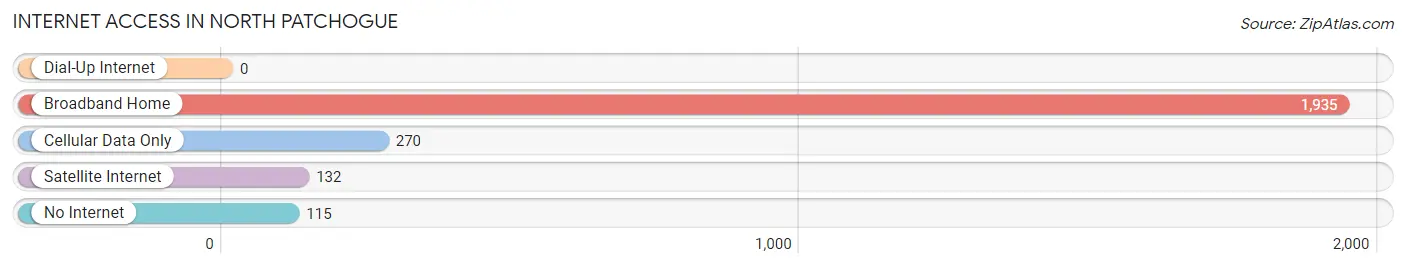
| Internet Type | # Households | % Households |
| Dial-Up Internet | 0 | 0.0% |
| Broadband Home | 1,935 | 82.5% |
| Cellular Data Only | 270 | 11.5% |
| Satellite Internet | 132 | 5.6% |
| No Internet | 115 | 4.9% |
| Total | 2,346 | 100.0% |
North Patchogue Summary
Patchogue is a village located in the Town of Brookhaven in Suffolk County, New York, United States. The population was 11,919 at the 2010 census. Patchogue is part of the Greater Patchogue area, which is part of the Greater Patchogue-Medford area.
History
The area now known as Patchogue was originally inhabited by the Secatogue tribe of the Algonquin nation. The first European settlers arrived in the area in 1685, and the village was officially founded in 1868. The village was named after the Patchogue River, which was named by the Secatogue tribe.
The village was a popular destination for fishing and boating, and it was also home to several mills and factories. In the late 19th century, Patchogue became a popular summer resort for wealthy New Yorkers.
In the early 20th century, Patchogue was a center for the production of cordage, rope, and twine. The village was also home to several shipyards, and it was a major port for the Long Island Rail Road.
In the 1950s, Patchogue began to experience a population boom, as many people moved to the area from New York City. The village was also home to several large industries, including a paper mill, a printing plant, and a chemical plant.
Geography
Patchogue is located at 40°45'17" North, 73°1'25" West (40.754722, -73.02361). The village is located on the south shore of Long Island, approximately 60 miles east of New York City.
The village is bordered to the north by the hamlet of Medford, to the east by the hamlet of East Patchogue, to the south by the hamlet of North Patchogue, and to the west by the hamlet of Bellport.
The Patchogue River runs through the village and the Patchogue Bay is located to the south
Economy
The economy of Patchogue is largely based on tourism and retail. The village is home to several restaurants, bars, and shops, as well as a movie theater and a bowling alley.
The village is also home to several large employers, including a hospital, a nursing home, and a manufacturing plant.
Demographics
As of the 2010 census, the population of Patchogue was 11,919. The racial makeup of the village was 79.3% White, 8.2% African American, 0.3% Native American, 4.2% Asian, 0.1% Pacific Islander, 4.7% from other races, and 3.4% from two or more races. Hispanic or Latino of any race were 13.3% of the population.
The median household income in Patchogue was $63,917, and the median family income was $76,917. The per capita income for the village was $30,917. About 8.2% of families and 10.3% of the population were below the poverty line, including 14.2% of those under age 18 and 6.2% of those age 65 or over.
Common Questions
What is Per Capita Income in North Patchogue?
Per Capita income in North Patchogue is $44,655.
What is the Median Family Income in North Patchogue?
Median Family Income in North Patchogue is $127,644.
What is the Median Household income in North Patchogue?
Median Household Income in North Patchogue is $117,586.
What is Income or Wage Gap in North Patchogue?
Income or Wage Gap in North Patchogue is 38.5%.
Women in North Patchogue earn 61.5 cents for every dollar earned by a man.
What is Inequality or Gini Index in North Patchogue?
Inequality or Gini Index in North Patchogue is 0.41.
What is the Total Population of North Patchogue?
Total Population of North Patchogue is 7,800.
What is the Total Male Population of North Patchogue?
Total Male Population of North Patchogue is 3,676.
What is the Total Female Population of North Patchogue?
Total Female Population of North Patchogue is 4,124.
What is the Ratio of Males per 100 Females in North Patchogue?
There are 89.14 Males per 100 Females in North Patchogue.
What is the Ratio of Females per 100 Males in North Patchogue?
There are 112.19 Females per 100 Males in North Patchogue.
What is the Median Population Age in North Patchogue?
Median Population Age in North Patchogue is 36.2 Years.
What is the Average Family Size in North Patchogue
Average Family Size in North Patchogue is 3.8 People.
What is the Average Household Size in North Patchogue
Average Household Size in North Patchogue is 3.3 People.
How Large is the Labor Force in North Patchogue?
There are 3,825 People in the Labor Forcein in North Patchogue.
What is the Percentage of People in the Labor Force in North Patchogue?
63.9% of People are in the Labor Force in North Patchogue.
What is the Unemployment Rate in North Patchogue?
Unemployment Rate in North Patchogue is 1.4%.