Spring Valley, NY Map & Demographics
Spring Valley Map
Spring Valley Overview
$21,398
PER CAPITA INCOME
$56,089
AVG FAMILY INCOME
$50,749
AVG HOUSEHOLD INCOME
31.4%
WAGE / INCOME GAP [ % ]
68.6¢/ $1
WAGE / INCOME GAP [ $ ]
$13,335
FAMILY INCOME DEFICIT
0.48
INEQUALITY / GINI INDEX
32,963
TOTAL POPULATION
16,368
MALE POPULATION
16,595
FEMALE POPULATION
98.63
MALES / 100 FEMALES
101.39
FEMALES / 100 MALES
27.5
MEDIAN AGE
4.1
AVG FAMILY SIZE
3.5
AVG HOUSEHOLD SIZE
14,816
LABOR FORCE [ PEOPLE ]
66.1%
PERCENT IN LABOR FORCE
5.6%
UNEMPLOYMENT RATE
Spring Valley Zip Codes
Income in Spring Valley
Income Overview in Spring Valley
Per Capita Income in Spring Valley is $21,398, while median incomes of families and households are $56,089 and $50,749 respectively.
| Characteristic | Number | Measure |
| Per Capita Income | 32,963 | $21,398 |
| Median Family Income | 7,062 | $56,089 |
| Mean Family Income | 7,062 | $82,019 |
| Median Household Income | 9,527 | $50,749 |
| Mean Household Income | 9,527 | $73,587 |
| Income Deficit | 7,062 | $13,335 |
| Wage / Income Gap (%) | 32,963 | 31.37% |
| Wage / Income Gap ($) | 32,963 | 68.63¢ per $1 |
| Gini / Inequality Index | 32,963 | 0.48 |
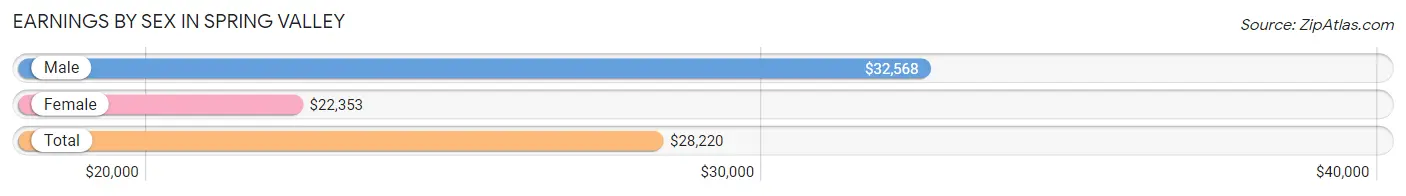
Earnings by Sex in Spring Valley
Average Earnings in Spring Valley are $28,220, $32,568 for men and $22,353 for women, a difference of 31.4%.
| Sex | Number | Average Earnings |
| Male | 7,938 (52.9%) | $32,568 |
| Female | 7,077 (47.1%) | $22,353 |
| Total | 15,015 (100.0%) | $28,220 |
Earnings by Sex by Income Bracket in Spring Valley
The most common earnings brackets in Spring Valley are $30,000 to $34,999 for men (845 | 10.6%) and $30,000 to $34,999 for women (611 | 8.6%).
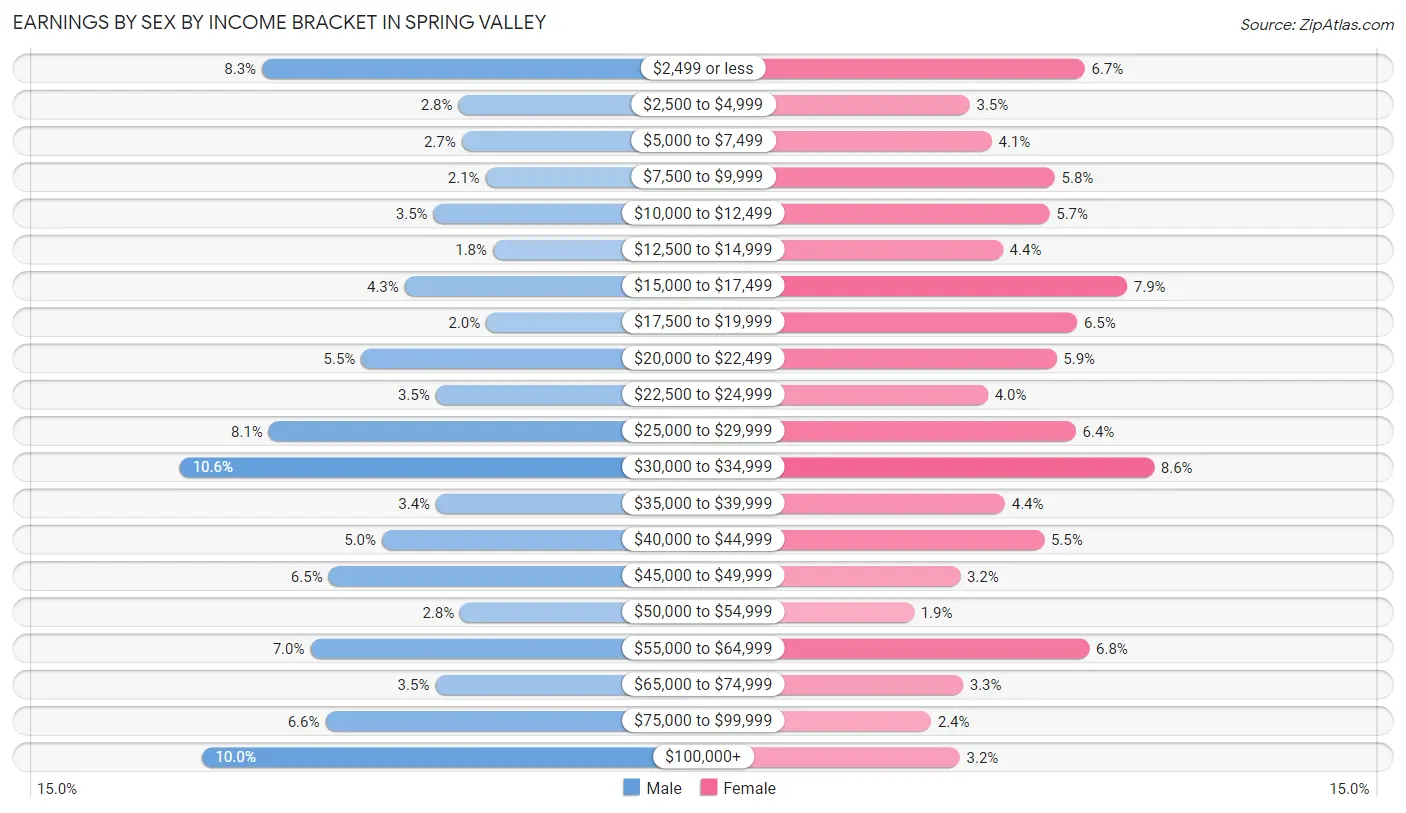
| Income | Male | Female |
| $2,499 or less | 661 (8.3%) | 473 (6.7%) |
| $2,500 to $4,999 | 223 (2.8%) | 244 (3.5%) |
| $5,000 to $7,499 | 216 (2.7%) | 288 (4.1%) |
| $7,500 to $9,999 | 163 (2.1%) | 413 (5.8%) |
| $10,000 to $12,499 | 279 (3.5%) | 403 (5.7%) |
| $12,500 to $14,999 | 146 (1.8%) | 310 (4.4%) |
| $15,000 to $17,499 | 343 (4.3%) | 557 (7.9%) |
| $17,500 to $19,999 | 161 (2.0%) | 458 (6.5%) |
| $20,000 to $22,499 | 440 (5.5%) | 417 (5.9%) |
| $22,500 to $24,999 | 274 (3.5%) | 280 (4.0%) |
| $25,000 to $29,999 | 646 (8.1%) | 455 (6.4%) |
| $30,000 to $34,999 | 845 (10.6%) | 611 (8.6%) |
| $35,000 to $39,999 | 273 (3.4%) | 314 (4.4%) |
| $40,000 to $44,999 | 394 (5.0%) | 392 (5.5%) |
| $45,000 to $49,999 | 513 (6.5%) | 225 (3.2%) |
| $50,000 to $54,999 | 219 (2.8%) | 133 (1.9%) |
| $55,000 to $64,999 | 553 (7.0%) | 482 (6.8%) |
| $65,000 to $74,999 | 275 (3.5%) | 231 (3.3%) |
| $75,000 to $99,999 | 520 (6.6%) | 167 (2.4%) |
| $100,000+ | 794 (10.0%) | 224 (3.2%) |
| Total | 7,938 (100.0%) | 7,077 (100.0%) |
Earnings by Sex by Educational Attainment in Spring Valley
Average earnings in Spring Valley are $34,892 for men and $27,224 for women, a difference of 22.0%. Men with an educational attainment of bachelor's degree enjoy the highest average annual earnings of $57,169, while those with less than high school education earn the least with $29,523. Women with an educational attainment of graduate degree earn the most with the average annual earnings of $47,174, while those with less than high school education have the smallest earnings of $21,330.
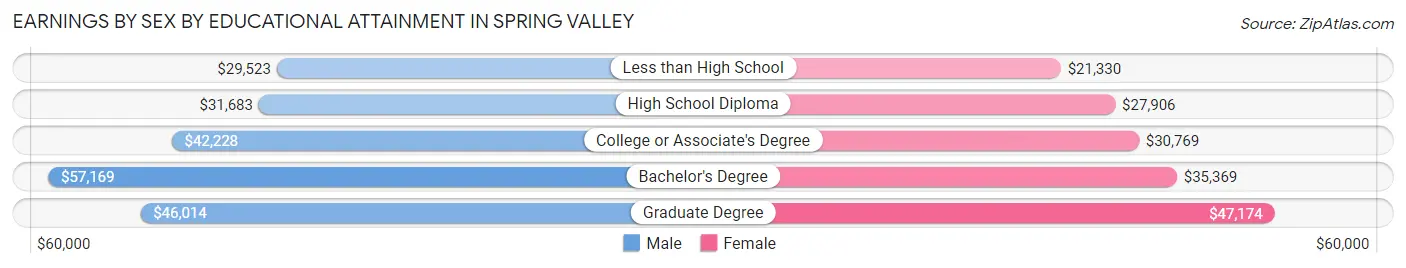
| Educational Attainment | Male Income | Female Income |
| Less than High School | $29,523 | $21,330 |
| High School Diploma | $31,683 | $27,906 |
| College or Associate's Degree | $42,228 | $30,769 |
| Bachelor's Degree | $57,169 | $35,369 |
| Graduate Degree | $46,014 | $47,174 |
| Total | $34,892 | $27,224 |
Family Income in Spring Valley
Family Income Brackets in Spring Valley
According to the Spring Valley family income data, there are 1,384 families falling into the $50,000 to $74,999 income range, which is the most common income bracket and makes up 19.6% of all families. Conversely, the $10,000 to $14,999 income bracket is the least frequent group with only 148 families (2.1%) belonging to this category.
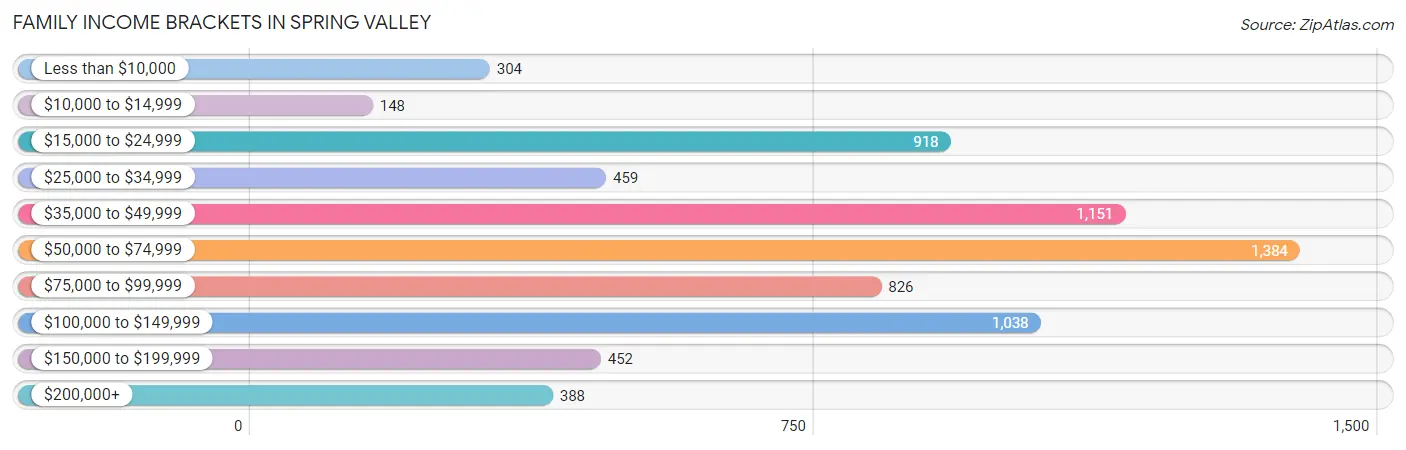
| Income Bracket | # Families | % Families |
| Less than $10,000 | 304 | 4.3% |
| $10,000 to $14,999 | 148 | 2.1% |
| $15,000 to $24,999 | 918 | 13.0% |
| $25,000 to $34,999 | 459 | 6.5% |
| $35,000 to $49,999 | 1,151 | 16.3% |
| $50,000 to $74,999 | 1,384 | 19.6% |
| $75,000 to $99,999 | 826 | 11.7% |
| $100,000 to $149,999 | 1,038 | 14.7% |
| $150,000 to $199,999 | 452 | 6.4% |
| $200,000+ | 388 | 5.5% |
Family Income by Famaliy Size in Spring Valley
4-person families (1,405 | 19.9%) account for the highest median family income in Spring Valley with $78,191 per family, while 2-person families (1,567 | 22.2%) have the highest median income of $24,754 per family member.
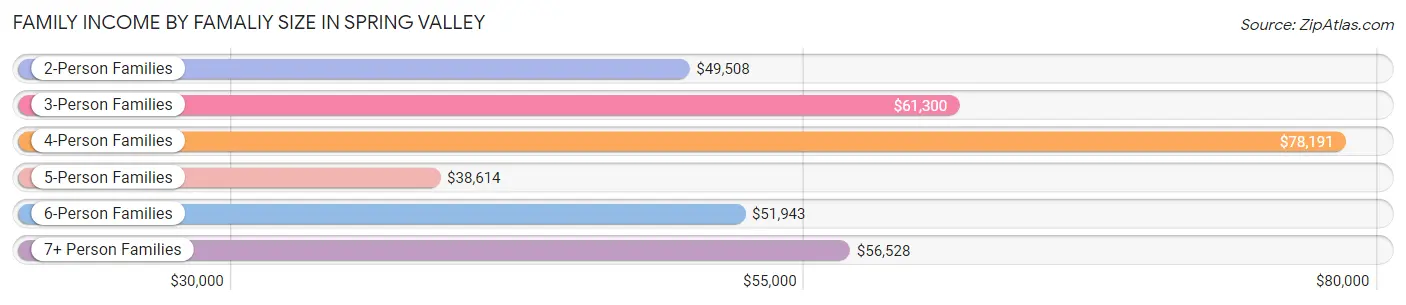
| Income Bracket | # Families | Median Income |
| 2-Person Families | 1,567 (22.2%) | $49,508 |
| 3-Person Families | 1,578 (22.3%) | $61,300 |
| 4-Person Families | 1,405 (19.9%) | $78,191 |
| 5-Person Families | 1,225 (17.3%) | $38,614 |
| 6-Person Families | 562 (8.0%) | $51,943 |
| 7+ Person Families | 725 (10.3%) | $56,528 |
| Total | 7,062 (100.0%) | $56,089 |
Family Income by Number of Earners in Spring Valley
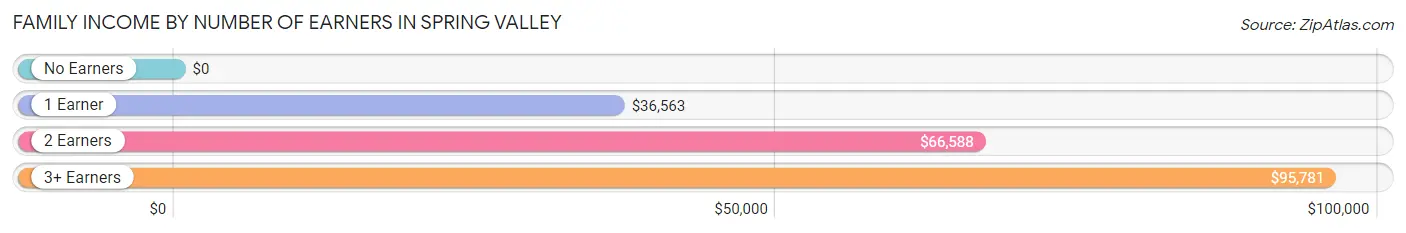
| Number of Earners | # Families | Median Income |
| No Earners | 476 (6.7%) | $0 |
| 1 Earner | 2,172 (30.8%) | $36,563 |
| 2 Earners | 3,305 (46.8%) | $66,588 |
| 3+ Earners | 1,109 (15.7%) | $95,781 |
| Total | 7,062 (100.0%) | $56,089 |
Household Income in Spring Valley
Household Income Brackets in Spring Valley
With 1,648 households falling in the category, the $50,000 to $74,999 income range is the most frequent in Spring Valley, accounting for 17.3% of all households. In contrast, only 429 households (4.5%) fall into the $200,000+ income bracket, making it the least populous group.
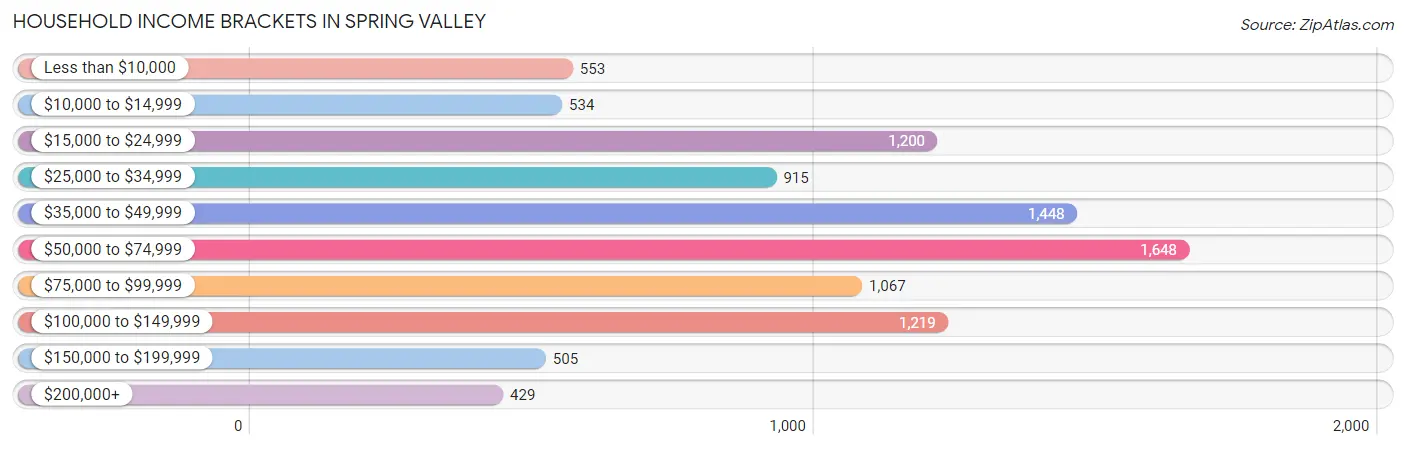
| Income Bracket | # Households | % Households |
| Less than $10,000 | 553 | 5.8% |
| $10,000 to $14,999 | 534 | 5.6% |
| $15,000 to $24,999 | 1,200 | 12.6% |
| $25,000 to $34,999 | 915 | 9.6% |
| $35,000 to $49,999 | 1,448 | 15.2% |
| $50,000 to $74,999 | 1,648 | 17.3% |
| $75,000 to $99,999 | 1,067 | 11.2% |
| $100,000 to $149,999 | 1,219 | 12.8% |
| $150,000 to $199,999 | 505 | 5.3% |
| $200,000+ | 429 | 4.5% |
Household Income by Householder Age in Spring Valley
The median household income in Spring Valley is $50,749, with the highest median household income of $53,125 found in the 15 to 24 years age bracket for the primary householder. A total of 238 households (2.5%) fall into this category. Meanwhile, the 65+ years age bracket for the primary householder has the lowest median household income of $35,174, with 1,991 households (20.9%) in this group.
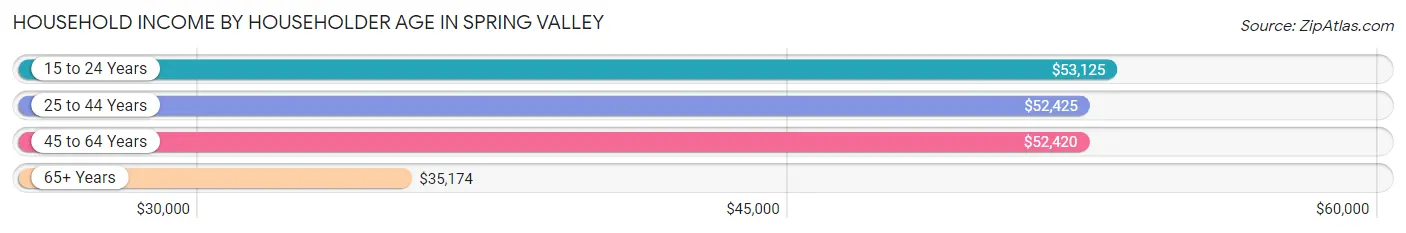
| Income Bracket | # Households | Median Income |
| 15 to 24 Years | 238 (2.5%) | $53,125 |
| 25 to 44 Years | 3,653 (38.3%) | $52,425 |
| 45 to 64 Years | 3,645 (38.3%) | $52,420 |
| 65+ Years | 1,991 (20.9%) | $35,174 |
| Total | 9,527 (100.0%) | $50,749 |
Poverty in Spring Valley
Income Below Poverty by Sex and Age in Spring Valley
With 25.3% poverty level for males and 25.2% for females among the residents of Spring Valley, 15 year old males and 16 and 17 year old females are the most vulnerable to poverty, with 127 males (41.6%) and 161 females (50.8%) in their respective age groups living below the poverty level.
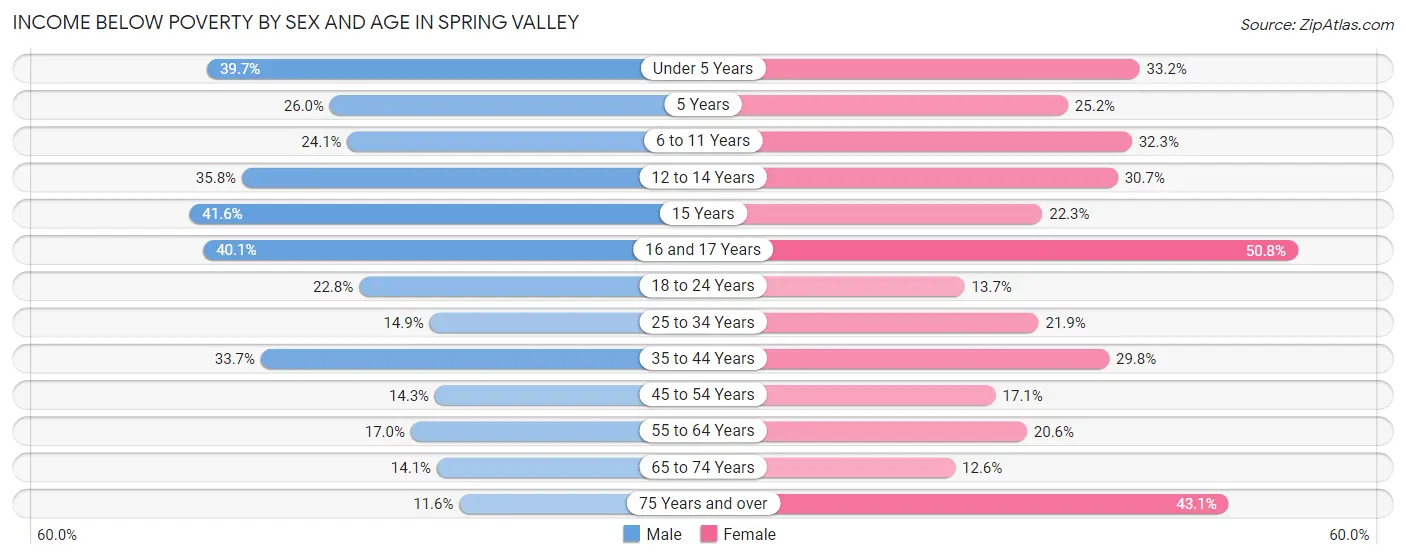
| Age Bracket | Male | Female |
| Under 5 Years | 772 (39.7%) | 537 (33.2%) |
| 5 Years | 65 (26.0%) | 71 (25.2%) |
| 6 to 11 Years | 360 (24.0%) | 724 (32.3%) |
| 12 to 14 Years | 373 (35.8%) | 319 (30.7%) |
| 15 Years | 127 (41.6%) | 46 (22.3%) |
| 16 and 17 Years | 312 (40.1%) | 161 (50.8%) |
| 18 to 24 Years | 407 (22.8%) | 247 (13.7%) |
| 25 to 34 Years | 339 (14.9%) | 494 (21.9%) |
| 35 to 44 Years | 723 (33.7%) | 566 (29.8%) |
| 45 to 54 Years | 183 (14.3%) | 278 (17.1%) |
| 55 to 64 Years | 305 (17.0%) | 292 (20.6%) |
| 65 to 74 Years | 149 (14.1%) | 140 (12.6%) |
| 75 Years and over | 24 (11.6%) | 283 (43.1%) |
| Total | 4,139 (25.3%) | 4,158 (25.2%) |
Income Above Poverty by Sex and Age in Spring Valley
According to the poverty statistics in Spring Valley, males aged 75 years and over and females aged 65 to 74 years are the age groups that are most secure financially, with 88.4% of males and 87.4% of females in these age groups living above the poverty line.
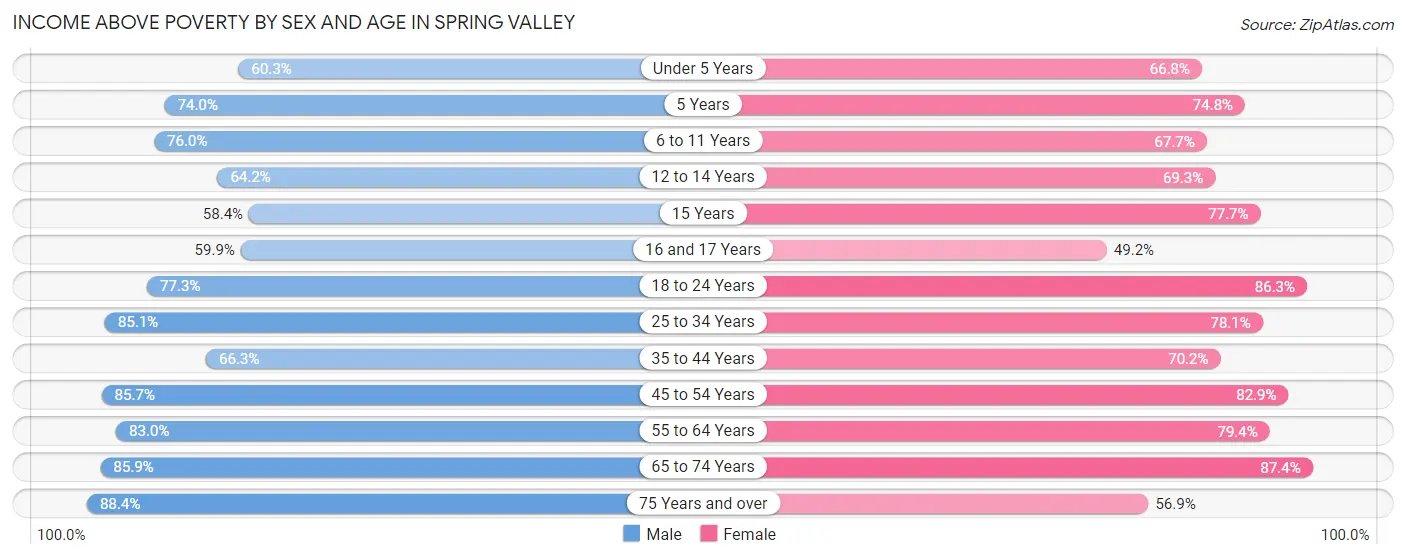
| Age Bracket | Male | Female |
| Under 5 Years | 1,173 (60.3%) | 1,082 (66.8%) |
| 5 Years | 185 (74.0%) | 211 (74.8%) |
| 6 to 11 Years | 1,137 (75.9%) | 1,518 (67.7%) |
| 12 to 14 Years | 669 (64.2%) | 719 (69.3%) |
| 15 Years | 178 (58.4%) | 160 (77.7%) |
| 16 and 17 Years | 466 (59.9%) | 156 (49.2%) |
| 18 to 24 Years | 1,382 (77.2%) | 1,559 (86.3%) |
| 25 to 34 Years | 1,935 (85.1%) | 1,761 (78.1%) |
| 35 to 44 Years | 1,423 (66.3%) | 1,336 (70.2%) |
| 45 to 54 Years | 1,097 (85.7%) | 1,345 (82.9%) |
| 55 to 64 Years | 1,490 (83.0%) | 1,125 (79.4%) |
| 65 to 74 Years | 909 (85.9%) | 969 (87.4%) |
| 75 Years and over | 183 (88.4%) | 374 (56.9%) |
| Total | 12,227 (74.7%) | 12,315 (74.8%) |
Income Below Poverty Among Married-Couple Families in Spring Valley
The poverty statistics for married-couple families in Spring Valley show that 19.0% or 864 of the total 4,546 families live below the poverty line. Families with 5 or more children have the highest poverty rate of 41.1%, comprising of 209 families. On the other hand, families with no children have the lowest poverty rate of 5.7%, which includes 73 families.
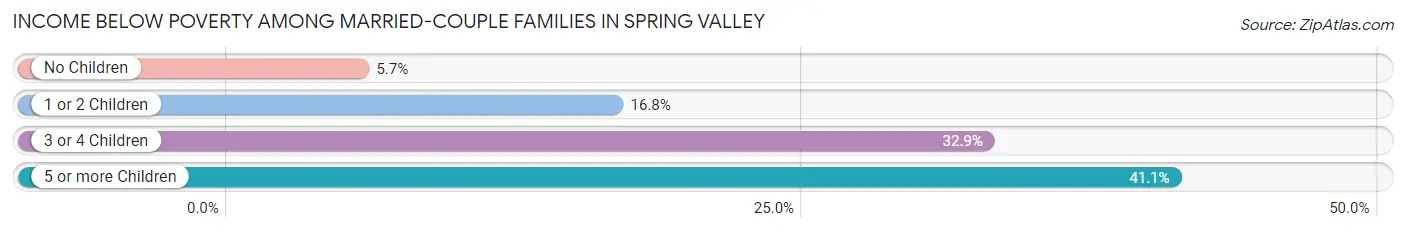
| Children | Above Poverty | Below Poverty |
| No Children | 1,203 (94.3%) | 73 (5.7%) |
| 1 or 2 Children | 1,686 (83.2%) | 340 (16.8%) |
| 3 or 4 Children | 493 (67.1%) | 242 (32.9%) |
| 5 or more Children | 300 (58.9%) | 209 (41.1%) |
| Total | 3,682 (81.0%) | 864 (19.0%) |
Income Below Poverty Among Single-Parent Households in Spring Valley
According to the poverty data in Spring Valley, 40.5% or 270 single-father households and 22.4% or 415 single-mother households are living below the poverty line. Among single-father households, those with 3 or 4 children have the highest poverty rate, with 130 households (100.0%) experiencing poverty. Likewise, among single-mother households, those with 3 or 4 children have the highest poverty rate, with 95 households (44.6%) falling below the poverty line.
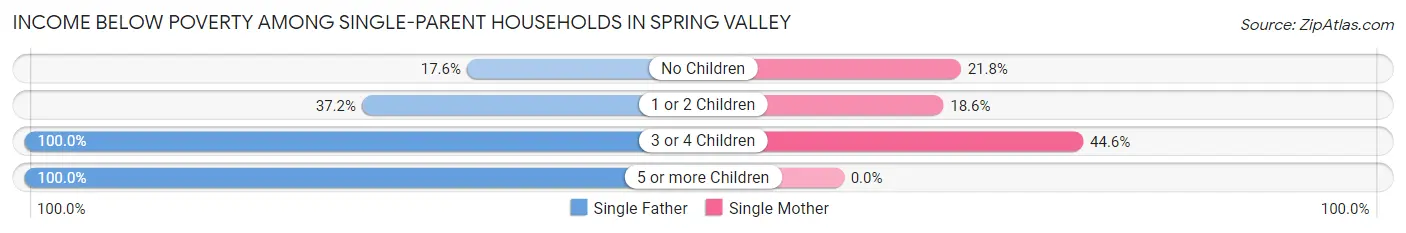
| Children | Single Father | Single Mother |
| No Children | 58 (17.6%) | 109 (21.8%) |
| 1 or 2 Children | 74 (37.2%) | 211 (18.6%) |
| 3 or 4 Children | 130 (100.0%) | 95 (44.6%) |
| 5 or more Children | 8 (100.0%) | 0 (0.0%) |
| Total | 270 (40.5%) | 415 (22.4%) |
Income Below Poverty Among Married-Couple vs Single-Parent Households in Spring Valley
The poverty data for Spring Valley shows that 864 of the married-couple family households (19.0%) and 685 of the single-parent households (27.2%) are living below the poverty level. Within the married-couple family households, those with 5 or more children have the highest poverty rate, with 209 households (41.1%) falling below the poverty line. Among the single-parent households, those with 5 or more children have the highest poverty rate, with 8 household (100.0%) living below poverty.
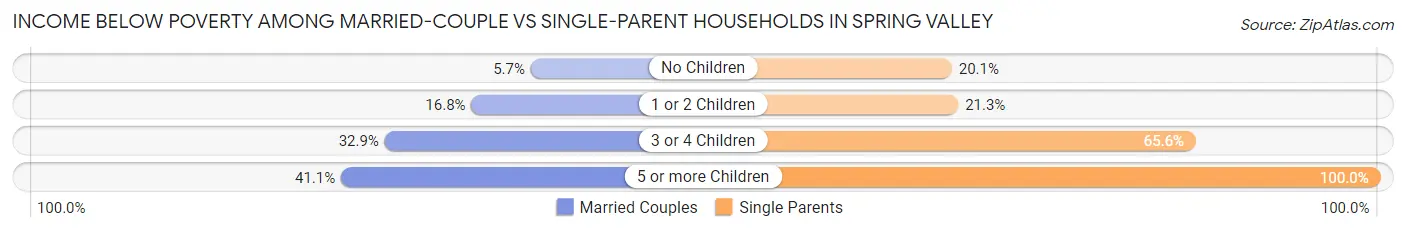
| Children | Married-Couple Families | Single-Parent Households |
| No Children | 73 (5.7%) | 167 (20.1%) |
| 1 or 2 Children | 340 (16.8%) | 285 (21.3%) |
| 3 or 4 Children | 242 (32.9%) | 225 (65.6%) |
| 5 or more Children | 209 (41.1%) | 8 (100.0%) |
| Total | 864 (19.0%) | 685 (27.2%) |
Race in Spring Valley
The most populous races in Spring Valley are White / Caucasian (13,655 | 41.4%), Black / African American (10,589 | 32.1%), and Hispanic or Latino (9,660 | 29.3%).
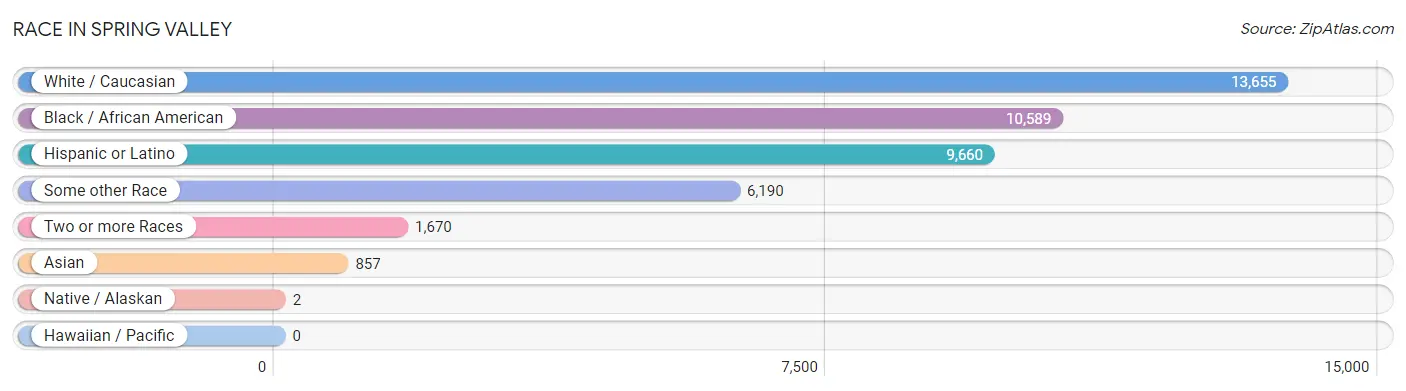
| Race | # Population | % Population |
| Asian | 857 | 2.6% |
| Black / African American | 10,589 | 32.1% |
| Hawaiian / Pacific | 0 | 0.0% |
| Hispanic or Latino | 9,660 | 29.3% |
| Native / Alaskan | 2 | 0.0% |
| White / Caucasian | 13,655 | 41.4% |
| Two or more Races | 1,670 | 5.1% |
| Some other Race | 6,190 | 18.8% |
| Total | 32,963 | 100.0% |
Ancestry in Spring Valley
The most populous ancestries reported in Spring Valley are Haitian (5,914 | 17.9%), South American (3,541 | 10.7%), Ecuadorian (3,361 | 10.2%), American (3,066 | 9.3%), and Hungarian (2,542 | 7.7%), together accounting for 55.9% of all Spring Valley residents.
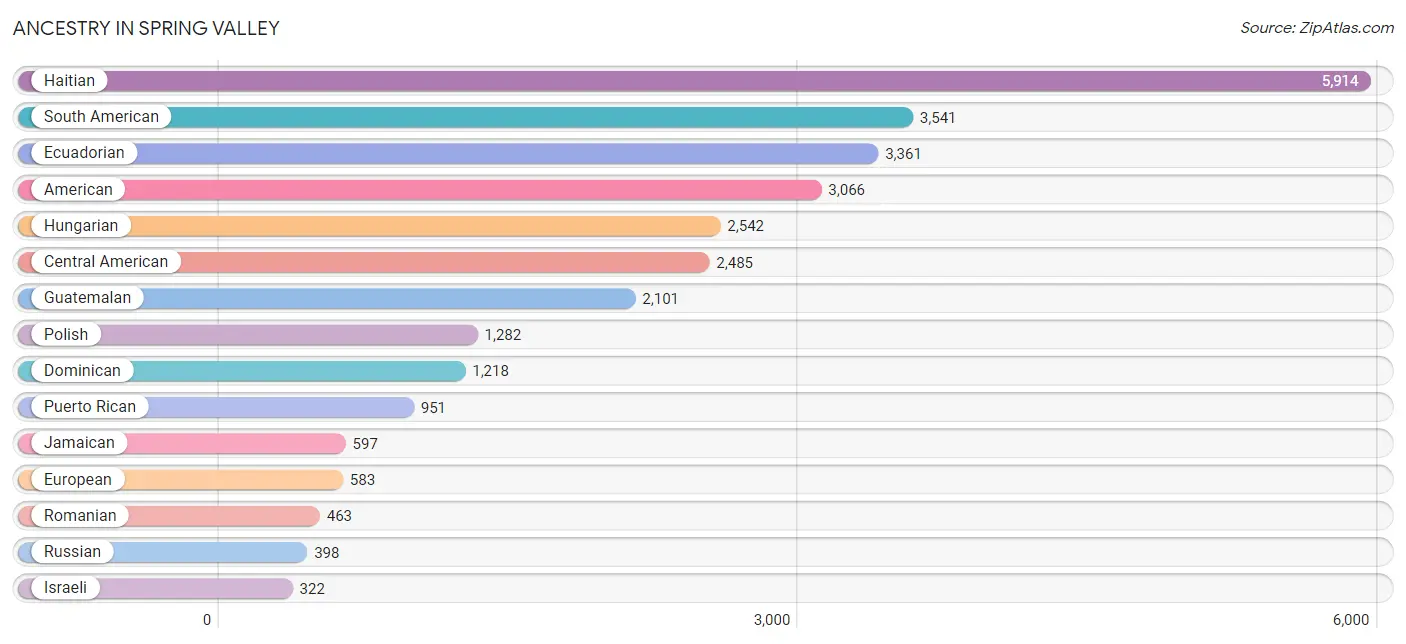
| Ancestry | # Population | % Population |
| African | 129 | 0.4% |
| American | 3,066 | 9.3% |
| Arab | 108 | 0.3% |
| Argentinean | 46 | 0.1% |
| Austrian | 192 | 0.6% |
| Bahamian | 34 | 0.1% |
| Belizean | 24 | 0.1% |
| Bolivian | 1 | 0.0% |
| Brazilian | 29 | 0.1% |
| British West Indian | 30 | 0.1% |
| Burmese | 34 | 0.1% |
| Canadian | 14 | 0.0% |
| Central American | 2,485 | 7.5% |
| Cherokee | 36 | 0.1% |
| Croatian | 13 | 0.0% |
| Cuban | 54 | 0.2% |
| Czech | 18 | 0.1% |
| Danish | 11 | 0.0% |
| Dominican | 1,218 | 3.7% |
| Dutch | 31 | 0.1% |
| Eastern European | 272 | 0.8% |
| Ecuadorian | 3,361 | 10.2% |
| Egyptian | 40 | 0.1% |
| English | 117 | 0.4% |
| Estonian | 119 | 0.4% |
| European | 583 | 1.8% |
| French | 70 | 0.2% |
| French Canadian | 4 | 0.0% |
| German | 213 | 0.6% |
| Ghanaian | 77 | 0.2% |
| Greek | 66 | 0.2% |
| Guatemalan | 2,101 | 6.4% |
| Haitian | 5,914 | 17.9% |
| Honduran | 238 | 0.7% |
| Hungarian | 2,542 | 7.7% |
| Indian (Asian) | 157 | 0.5% |
| Irish | 207 | 0.6% |
| Israeli | 322 | 1.0% |
| Italian | 199 | 0.6% |
| Jamaican | 597 | 1.8% |
| Korean | 81 | 0.3% |
| Lithuanian | 9 | 0.0% |
| Malaysian | 76 | 0.2% |
| Mexican | 320 | 1.0% |
| Mexican American Indian | 7 | 0.0% |
| Moroccan | 60 | 0.2% |
| Nigerian | 18 | 0.1% |
| Norwegian | 17 | 0.1% |
| Panamanian | 24 | 0.1% |
| Peruvian | 34 | 0.1% |
| Polish | 1,282 | 3.9% |
| Puerto Rican | 951 | 2.9% |
| Romanian | 463 | 1.4% |
| Russian | 398 | 1.2% |
| Salvadoran | 122 | 0.4% |
| Seminole | 32 | 0.1% |
| Serbian | 13 | 0.0% |
| Slovak | 19 | 0.1% |
| South American | 3,541 | 10.7% |
| Spaniard | 75 | 0.2% |
| Spanish | 9 | 0.0% |
| Subsaharan African | 260 | 0.8% |
| Thai | 286 | 0.9% |
| Trinidadian and Tobagonian | 159 | 0.5% |
| Turkish | 10 | 0.0% |
| Ukrainian | 150 | 0.5% |
| Venezuelan | 99 | 0.3% |
| Welsh | 14 | 0.0% |
| West Indian | 41 | 0.1% | View All 69 Rows |
Immigrants in Spring Valley
The most numerous immigrant groups reported in Spring Valley came from Latin America (9,408 | 28.5%), Caribbean (5,991 | 18.2%), Haiti (4,798 | 14.6%), Central America (2,075 | 6.3%), and Guatemala (1,510 | 4.6%), together accounting for 72.1% of all Spring Valley residents.
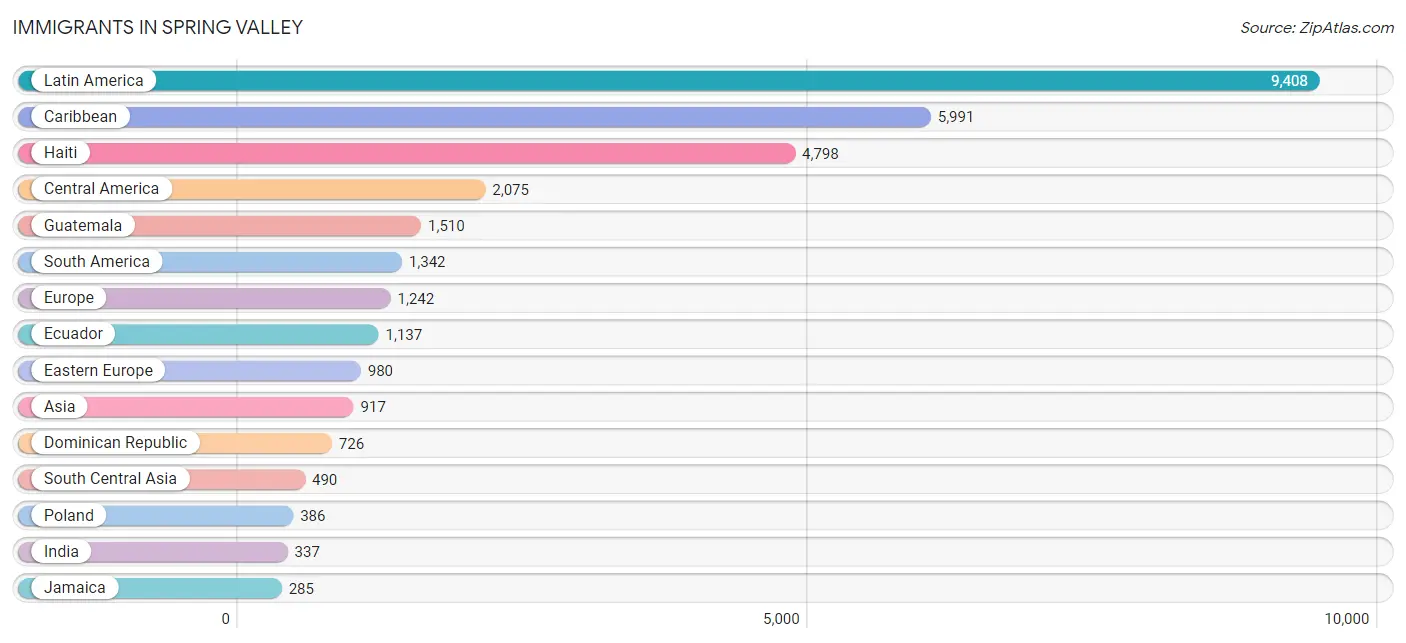
| Immigration Origin | # Population | % Population |
| Africa | 112 | 0.3% |
| Asia | 917 | 2.8% |
| Australia | 4 | 0.0% |
| Bahamas | 34 | 0.1% |
| Belize | 24 | 0.1% |
| Bolivia | 1 | 0.0% |
| Brazil | 36 | 0.1% |
| Canada | 202 | 0.6% |
| Caribbean | 5,991 | 18.2% |
| Central America | 2,075 | 6.3% |
| China | 98 | 0.3% |
| Czechoslovakia | 29 | 0.1% |
| Denmark | 11 | 0.0% |
| Dominican Republic | 726 | 2.2% |
| Eastern Asia | 132 | 0.4% |
| Eastern Europe | 980 | 3.0% |
| Ecuador | 1,137 | 3.5% |
| Egypt | 26 | 0.1% |
| El Salvador | 134 | 0.4% |
| England | 17 | 0.1% |
| Europe | 1,242 | 3.8% |
| France | 5 | 0.0% |
| Germany | 25 | 0.1% |
| Ghana | 30 | 0.1% |
| Grenada | 13 | 0.0% |
| Guatemala | 1,510 | 4.6% |
| Haiti | 4,798 | 14.6% |
| Honduras | 134 | 0.4% |
| Hong Kong | 62 | 0.2% |
| Hungary | 27 | 0.1% |
| India | 337 | 1.0% |
| Israel | 143 | 0.4% |
| Jamaica | 285 | 0.9% |
| Korea | 34 | 0.1% |
| Kuwait | 11 | 0.0% |
| Latin America | 9,408 | 28.5% |
| Mexico | 248 | 0.7% |
| Moldova | 66 | 0.2% |
| Nigeria | 18 | 0.1% |
| Northern Africa | 26 | 0.1% |
| Northern Europe | 219 | 0.7% |
| Oceania | 4 | 0.0% |
| Pakistan | 153 | 0.5% |
| Panama | 14 | 0.0% |
| Peru | 34 | 0.1% |
| Philippines | 97 | 0.3% |
| Poland | 386 | 1.2% |
| Russia | 155 | 0.5% |
| South America | 1,342 | 4.1% |
| South Central Asia | 490 | 1.5% |
| South Eastern Asia | 141 | 0.4% |
| Southern Europe | 13 | 0.0% |
| Spain | 13 | 0.0% |
| St. Vincent and the Grenadines | 41 | 0.1% |
| Thailand | 17 | 0.1% |
| Trinidad and Tobago | 94 | 0.3% |
| Ukraine | 157 | 0.5% |
| Venezuela | 134 | 0.4% |
| Vietnam | 20 | 0.1% |
| Western Africa | 86 | 0.3% |
| Western Asia | 154 | 0.5% |
| Western Europe | 30 | 0.1% | View All 62 Rows |
Sex and Age in Spring Valley
Sex and Age in Spring Valley
The most populous age groups in Spring Valley are Under 5 Years (1,945 | 11.9%) for men and 10 to 14 Years (1,875 | 11.3%) for women.
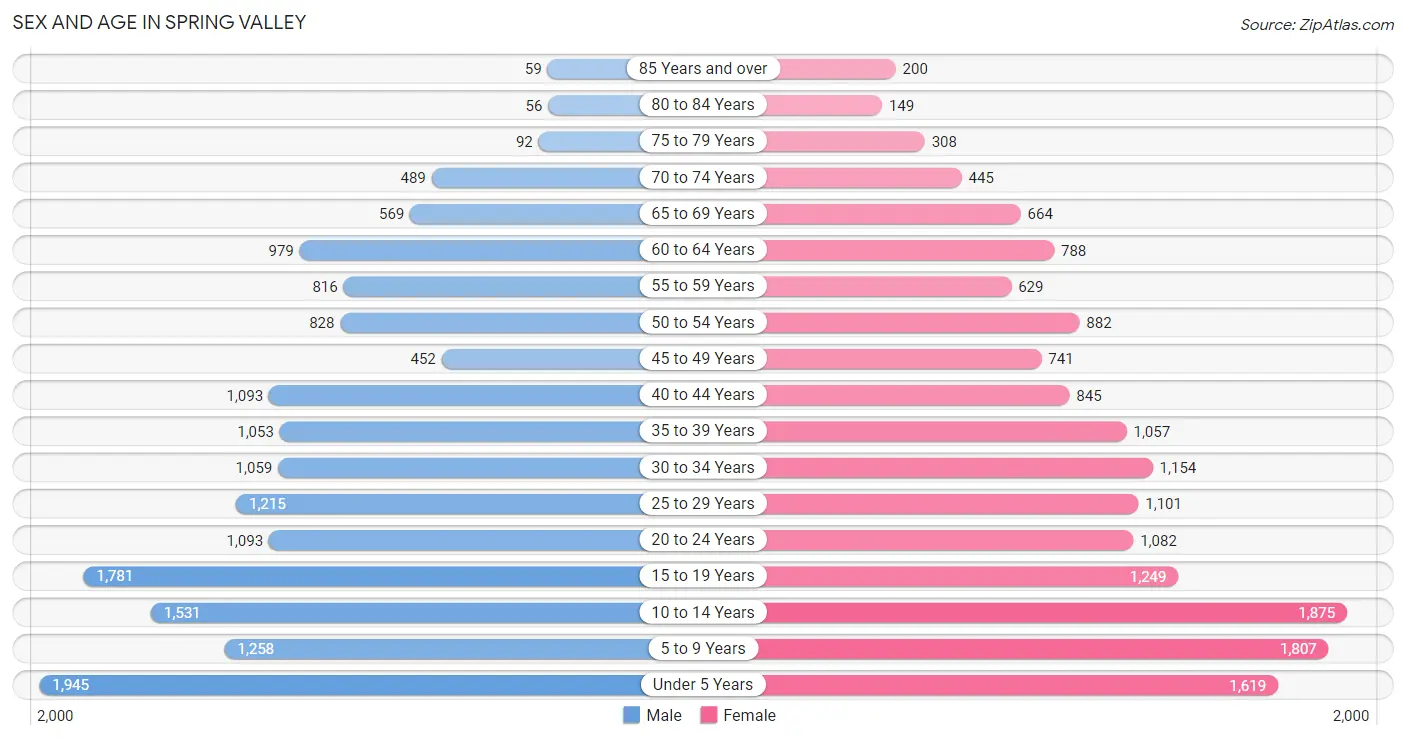
| Age Bracket | Male | Female |
| Under 5 Years | 1,945 (11.9%) | 1,619 (9.8%) |
| 5 to 9 Years | 1,258 (7.7%) | 1,807 (10.9%) |
| 10 to 14 Years | 1,531 (9.3%) | 1,875 (11.3%) |
| 15 to 19 Years | 1,781 (10.9%) | 1,249 (7.5%) |
| 20 to 24 Years | 1,093 (6.7%) | 1,082 (6.5%) |
| 25 to 29 Years | 1,215 (7.4%) | 1,101 (6.6%) |
| 30 to 34 Years | 1,059 (6.5%) | 1,154 (7.0%) |
| 35 to 39 Years | 1,053 (6.4%) | 1,057 (6.4%) |
| 40 to 44 Years | 1,093 (6.7%) | 845 (5.1%) |
| 45 to 49 Years | 452 (2.8%) | 741 (4.5%) |
| 50 to 54 Years | 828 (5.1%) | 882 (5.3%) |
| 55 to 59 Years | 816 (5.0%) | 629 (3.8%) |
| 60 to 64 Years | 979 (6.0%) | 788 (4.8%) |
| 65 to 69 Years | 569 (3.5%) | 664 (4.0%) |
| 70 to 74 Years | 489 (3.0%) | 445 (2.7%) |
| 75 to 79 Years | 92 (0.6%) | 308 (1.9%) |
| 80 to 84 Years | 56 (0.3%) | 149 (0.9%) |
| 85 Years and over | 59 (0.4%) | 200 (1.2%) |
| Total | 16,368 (100.0%) | 16,595 (100.0%) |
Families and Households in Spring Valley
Median Family Size in Spring Valley
The median family size in Spring Valley is 4.10 persons per family, with married-couple families (4,546 | 64.4%) accounting for the largest median family size of 4.21 persons per family. On the other hand, single male/father families (666 | 9.4%) represent the smallest median family size with 3.08 persons per family.
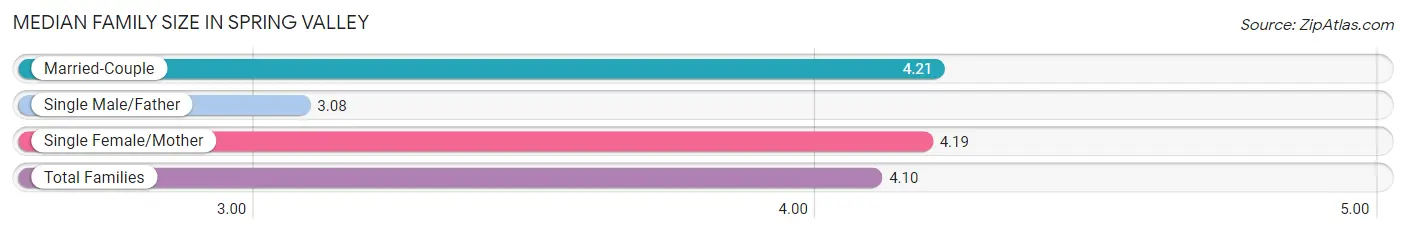
| Family Type | # Families | Family Size |
| Married-Couple | 4,546 (64.4%) | 4.21 |
| Single Male/Father | 666 (9.4%) | 3.08 |
| Single Female/Mother | 1,850 (26.2%) | 4.19 |
| Total Families | 7,062 (100.0%) | 4.10 |
Median Household Size in Spring Valley
The median household size in Spring Valley is 3.45 persons per household, with single female/mother households (1,850 | 19.4%) accounting for the largest median household size of 4.43 persons per household. non-family households (2,465 | 25.9%) represent the smallest median household size with 1.16 persons per household.
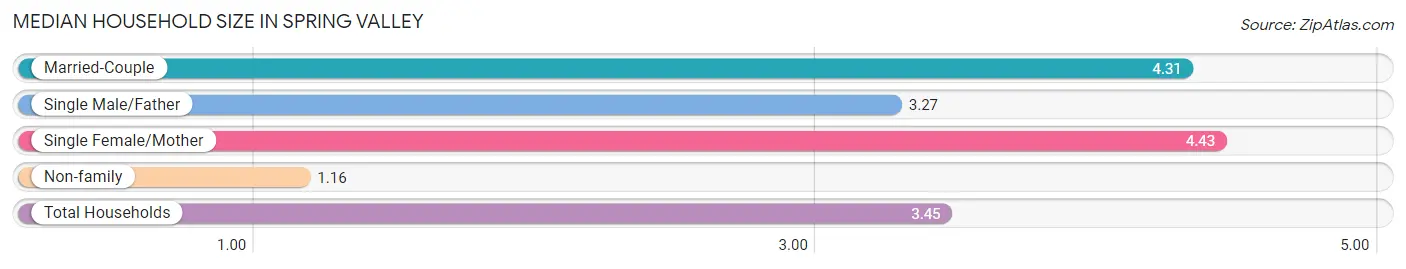
| Household Type | # Households | Household Size |
| Married-Couple | 4,546 (47.7%) | 4.31 |
| Single Male/Father | 666 (7.0%) | 3.27 |
| Single Female/Mother | 1,850 (19.4%) | 4.43 |
| Non-family | 2,465 (25.9%) | 1.16 |
| Total Households | 9,527 (100.0%) | 3.45 |
Household Size by Marriage Status in Spring Valley
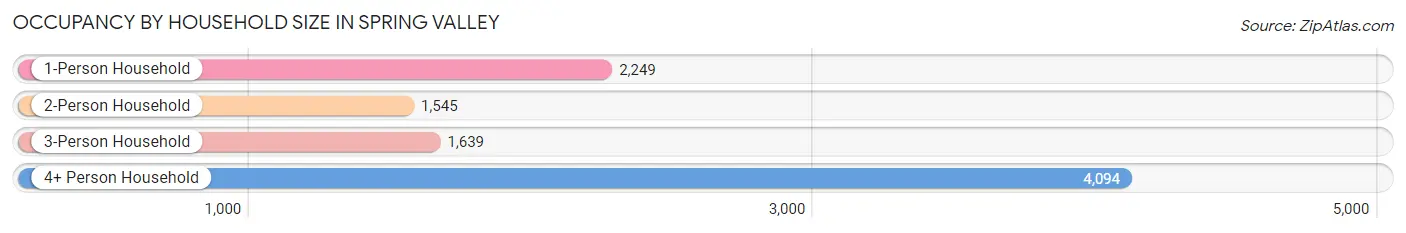
Out of a total of 9,527 households in Spring Valley, 7,062 (74.1%) are family households, while 2,465 (25.9%) are nonfamily households. The most numerous type of family households are 3-person households, comprising 1,639, and the most common type of nonfamily households are 1-person households, comprising 2,249.
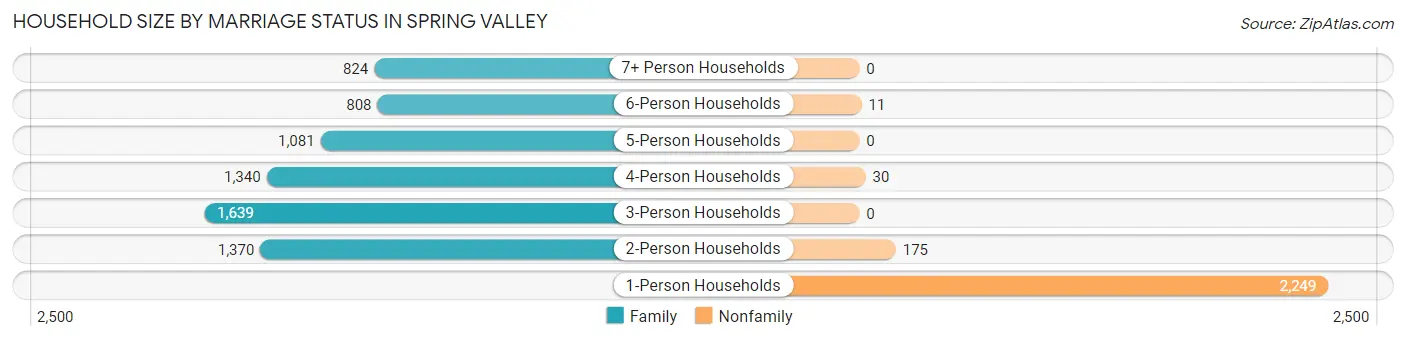
| Household Size | Family Households | Nonfamily Households |
| 1-Person Households | - | 2,249 (23.6%) |
| 2-Person Households | 1,370 (14.4%) | 175 (1.8%) |
| 3-Person Households | 1,639 (17.2%) | 0 (0.0%) |
| 4-Person Households | 1,340 (14.1%) | 30 (0.3%) |
| 5-Person Households | 1,081 (11.4%) | 0 (0.0%) |
| 6-Person Households | 808 (8.5%) | 11 (0.1%) |
| 7+ Person Households | 824 (8.6%) | 0 (0.0%) |
| Total | 7,062 (74.1%) | 2,465 (25.9%) |
Female Fertility in Spring Valley
Fertility by Age in Spring Valley
Average fertility rate in Spring Valley is 115.0 births per 1,000 women. Women in the age bracket of 20 to 34 years have the highest fertility rate with 190.0 births per 1,000 women. Women in the age bracket of 20 to 34 years acount for 74.1% of all women with births.
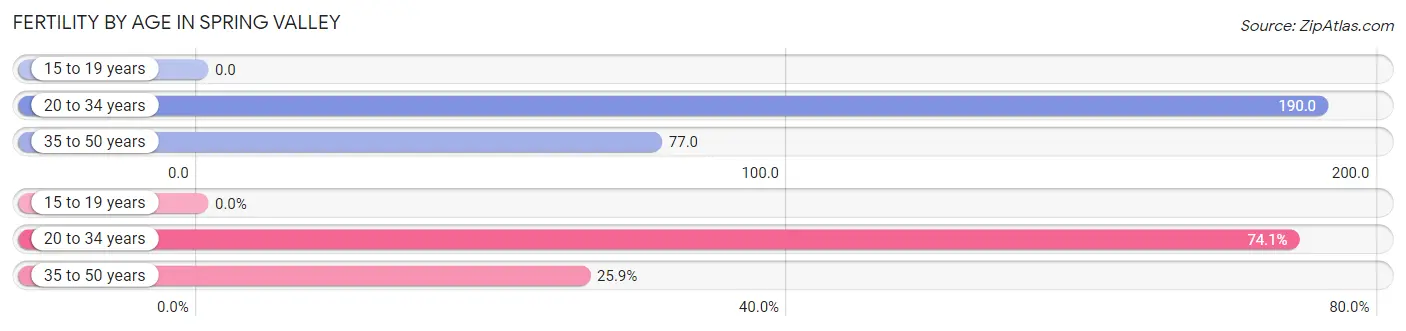
| Age Bracket | Women with Births | Births / 1,000 Women |
| 15 to 19 years | 0 (0.0%) | 0.0 |
| 20 to 34 years | 634 (74.1%) | 190.0 |
| 35 to 50 years | 222 (25.9%) | 77.0 |
| Total | 856 (100.0%) | 115.0 |
Fertility by Age by Marriage Status in Spring Valley
71.5% of women with births (856) in Spring Valley are married. The highest percentage of unmarried women with births falls into 20 to 34 years age bracket with 37.5% of them unmarried at the time of birth, while the lowest percentage of unmarried women with births belong to 35 to 50 years age bracket with 2.7% of them unmarried.
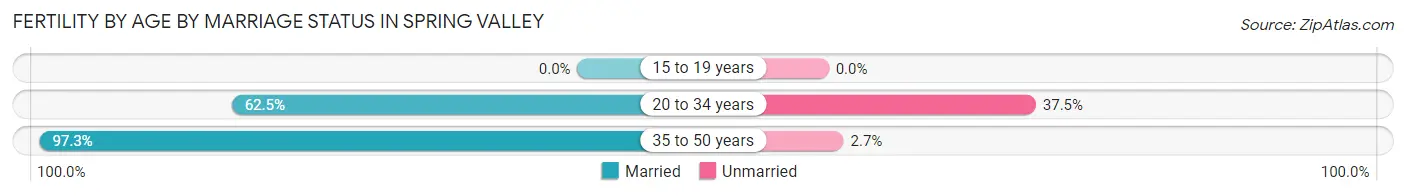
| Age Bracket | Married | Unmarried |
| 15 to 19 years | 0 (0.0%) | 0 (0.0%) |
| 20 to 34 years | 396 (62.5%) | 238 (37.5%) |
| 35 to 50 years | 216 (97.3%) | 6 (2.7%) |
| Total | 612 (71.5%) | 244 (28.5%) |
Fertility by Education in Spring Valley
Average fertility rate in Spring Valley is 115.0 births per 1,000 women. Women with the education attainment of college or associate's degree have the highest fertility rate of 167.0 births per 1,000 women, while women with the education attainment of bachelor's degree have the lowest fertility at 53.0 births per 1,000 women. Women with the education attainment of college or associate's degree represent 43.6% of all women with births.
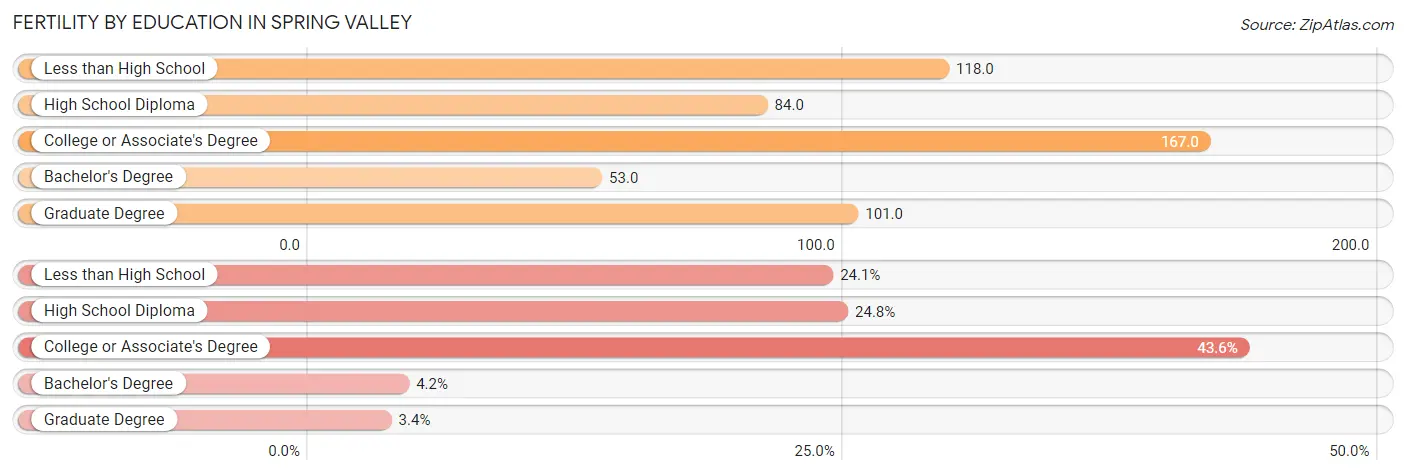
| Educational Attainment | Women with Births | Births / 1,000 Women |
| Less than High School | 206 (24.1%) | 118.0 |
| High School Diploma | 212 (24.8%) | 84.0 |
| College or Associate's Degree | 373 (43.6%) | 167.0 |
| Bachelor's Degree | 36 (4.2%) | 53.0 |
| Graduate Degree | 29 (3.4%) | 101.0 |
| Total | 856 (100.0%) | 115.0 |
Fertility by Education by Marriage Status in Spring Valley
28.5% of women with births in Spring Valley are unmarried. Women with the educational attainment of less than high school are most likely to be married with 100.0% of them married at childbirth, while women with the educational attainment of college or associate's degree are least likely to be married with 60.6% of them unmarried at childbirth.
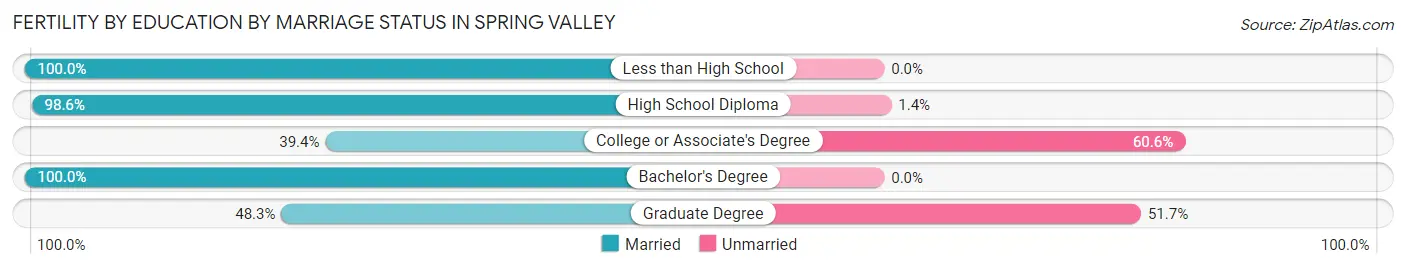
| Educational Attainment | Married | Unmarried |
| Less than High School | 206 (100.0%) | 0 (0.0%) |
| High School Diploma | 209 (98.6%) | 3 (1.4%) |
| College or Associate's Degree | 147 (39.4%) | 226 (60.6%) |
| Bachelor's Degree | 36 (100.0%) | 0 (0.0%) |
| Graduate Degree | 14 (48.3%) | 15 (51.7%) |
| Total | 612 (71.5%) | 244 (28.5%) |
Employment Characteristics in Spring Valley
Employment by Class of Employer in Spring Valley
Among the 13,323 employed individuals in Spring Valley, private company employees (8,887 | 66.7%), not-for-profit organizations (1,697 | 12.7%), and self-employed (not incorporated) (1,321 | 9.9%) make up the most common classes of employment.
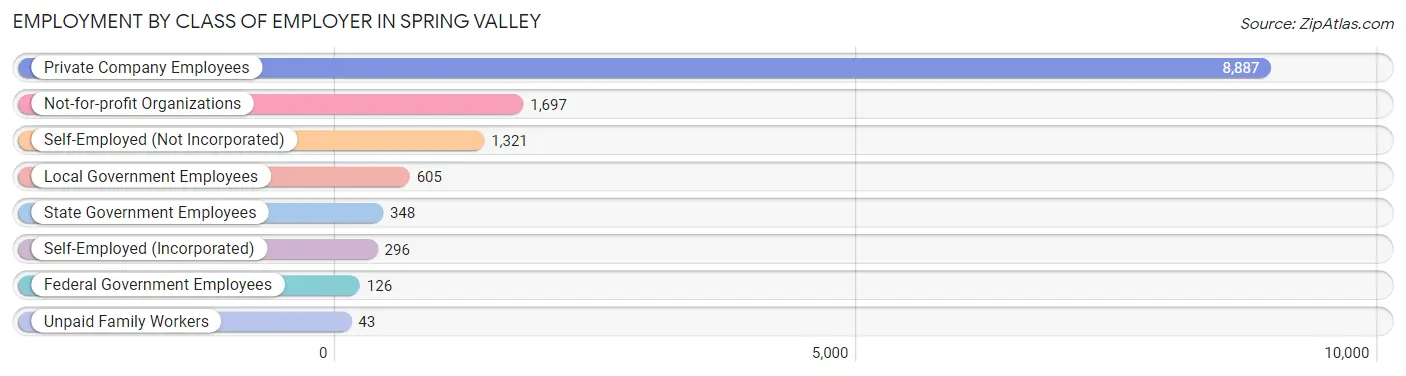
| Employer Class | # Employees | % Employees |
| Private Company Employees | 8,887 | 66.7% |
| Self-Employed (Incorporated) | 296 | 2.2% |
| Self-Employed (Not Incorporated) | 1,321 | 9.9% |
| Not-for-profit Organizations | 1,697 | 12.7% |
| Local Government Employees | 605 | 4.5% |
| State Government Employees | 348 | 2.6% |
| Federal Government Employees | 126 | 0.9% |
| Unpaid Family Workers | 43 | 0.3% |
| Total | 13,323 | 100.0% |
Employment Status by Age in Spring Valley
According to the labor force statistics for Spring Valley, out of the total population over 16 years of age (22,415), 66.1% or 14,816 individuals are in the labor force, with 5.6% or 830 of them unemployed. The age group with the highest labor force participation rate is 45 to 54 years, with 86.5% or 2,511 individuals in the labor force. Within the labor force, the 25 to 29 years age range has the highest percentage of unemployed individuals, with 17.8% or 339 of them being unemployed.
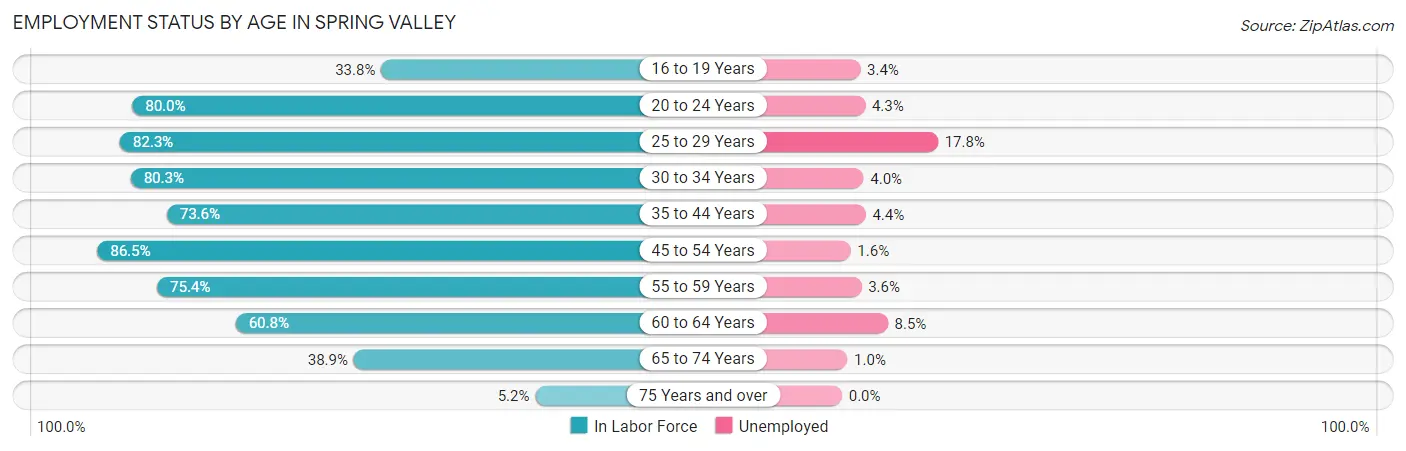
| Age Bracket | In Labor Force | Unemployed |
| 16 to 19 Years | 851 (33.8%) | 29 (3.4%) |
| 20 to 24 Years | 1,740 (80.0%) | 75 (4.3%) |
| 25 to 29 Years | 1,906 (82.3%) | 339 (17.8%) |
| 30 to 34 Years | 1,777 (80.3%) | 71 (4.0%) |
| 35 to 44 Years | 2,979 (73.6%) | 131 (4.4%) |
| 45 to 54 Years | 2,511 (86.5%) | 40 (1.6%) |
| 55 to 59 Years | 1,090 (75.4%) | 39 (3.6%) |
| 60 to 64 Years | 1,074 (60.8%) | 91 (8.5%) |
| 65 to 74 Years | 843 (38.9%) | 8 (1.0%) |
| 75 Years and over | 45 (5.2%) | 0 (0.0%) |
| Total | 14,816 (66.1%) | 830 (5.6%) |
Employment Status by Educational Attainment in Spring Valley
According to labor force statistics for Spring Valley, 77.2% of individuals (11,342) out of the total population between 25 and 64 years of age (14,692) are in the labor force, with 6.3% or 715 of them being unemployed. The group with the highest labor force participation rate are those with the educational attainment of college / associate degree, with 83.9% or 3,764 individuals in the labor force. Within the labor force, individuals with high school diploma education have the highest percentage of unemployment, with 8.8% or 293 of them being unemployed.
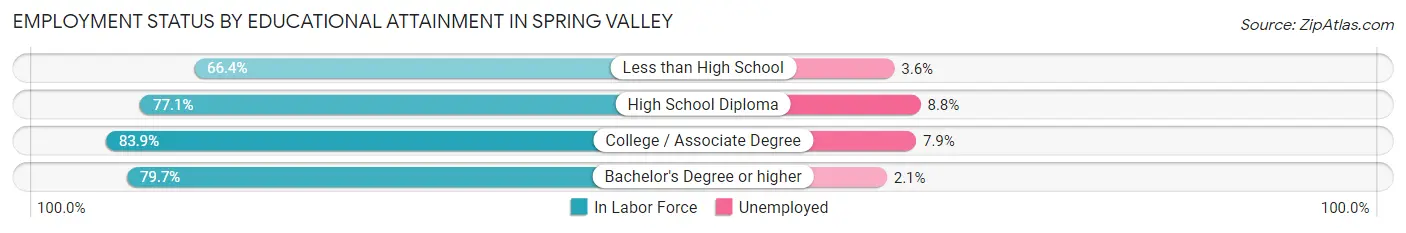
| Educational Attainment | In Labor Force | Unemployed |
| Less than High School | 2,248 (66.4%) | 122 (3.6%) |
| High School Diploma | 3,330 (77.1%) | 380 (8.8%) |
| College / Associate Degree | 3,764 (83.9%) | 354 (7.9%) |
| Bachelor's Degree or higher | 1,994 (79.7%) | 53 (2.1%) |
| Total | 11,342 (77.2%) | 926 (6.3%) |
Employment Occupations by Sex in Spring Valley
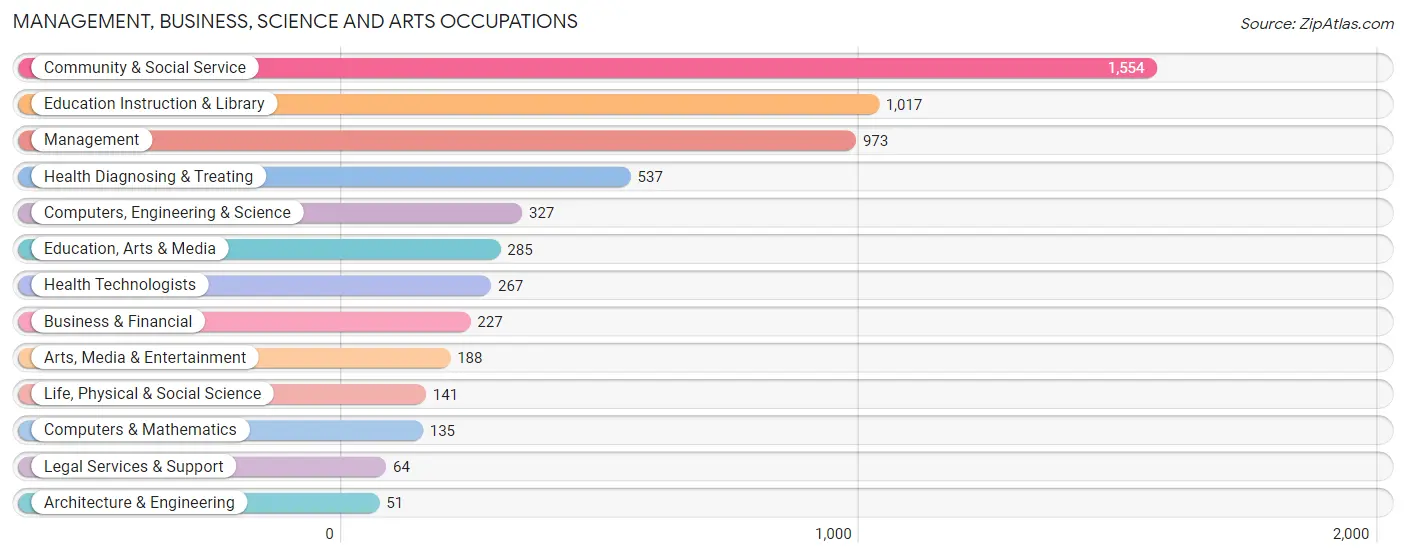
Management, Business, Science and Arts Occupations
The most common Management, Business, Science and Arts occupations in Spring Valley are Community & Social Service (1,554 | 11.1%), Education Instruction & Library (1,017 | 7.3%), Management (973 | 7.0%), Health Diagnosing & Treating (537 | 3.8%), and Computers, Engineering & Science (327 | 2.3%).
Management, Business, Science and Arts Occupations by Sex
Within the Management, Business, Science and Arts occupations in Spring Valley, the most male-oriented occupations are Architecture & Engineering (100.0%), Life, Physical & Social Science (100.0%), and Computers, Engineering & Science (93.3%), while the most female-oriented occupations are Education Instruction & Library (72.4%), Legal Services & Support (70.3%), and Health Technologists (68.9%).
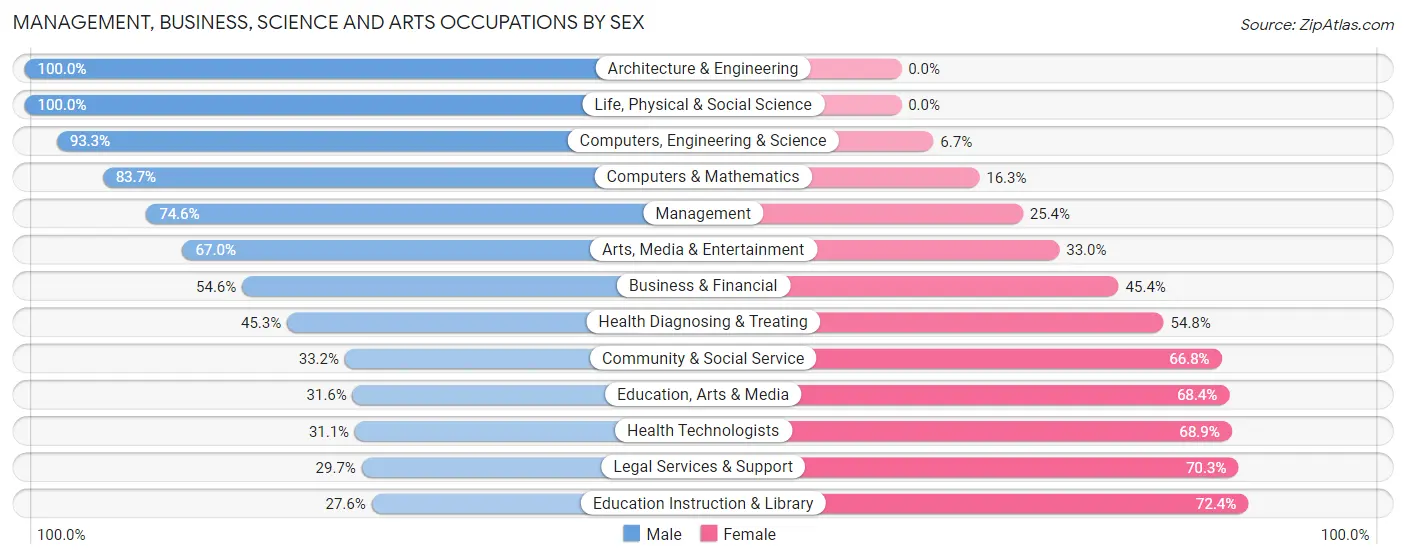
| Occupation | Male | Female |
| Management | 726 (74.6%) | 247 (25.4%) |
| Business & Financial | 124 (54.6%) | 103 (45.4%) |
| Computers, Engineering & Science | 305 (93.3%) | 22 (6.7%) |
| Computers & Mathematics | 113 (83.7%) | 22 (16.3%) |
| Architecture & Engineering | 51 (100.0%) | 0 (0.0%) |
| Life, Physical & Social Science | 141 (100.0%) | 0 (0.0%) |
| Community & Social Service | 516 (33.2%) | 1,038 (66.8%) |
| Education, Arts & Media | 90 (31.6%) | 195 (68.4%) |
| Legal Services & Support | 19 (29.7%) | 45 (70.3%) |
| Education Instruction & Library | 281 (27.6%) | 736 (72.4%) |
| Arts, Media & Entertainment | 126 (67.0%) | 62 (33.0%) |
| Health Diagnosing & Treating | 243 (45.3%) | 294 (54.7%) |
| Health Technologists | 83 (31.1%) | 184 (68.9%) |
| Total (Category) | 1,914 (52.9%) | 1,704 (47.1%) |
| Total (Overall) | 7,345 (52.6%) | 6,618 (47.4%) |
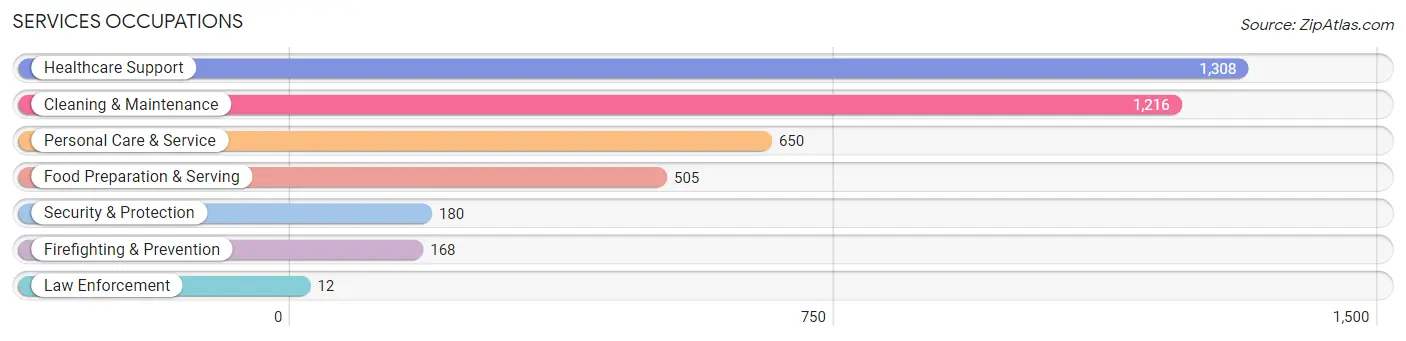
Services Occupations
The most common Services occupations in Spring Valley are Healthcare Support (1,308 | 9.4%), Cleaning & Maintenance (1,216 | 8.7%), Personal Care & Service (650 | 4.7%), Food Preparation & Serving (505 | 3.6%), and Security & Protection (180 | 1.3%).
Services Occupations by Sex
Within the Services occupations in Spring Valley, the most male-oriented occupations are Law Enforcement (100.0%), Security & Protection (80.0%), and Firefighting & Prevention (78.6%), while the most female-oriented occupations are Healthcare Support (86.8%), Personal Care & Service (85.2%), and Food Preparation & Serving (44.6%).
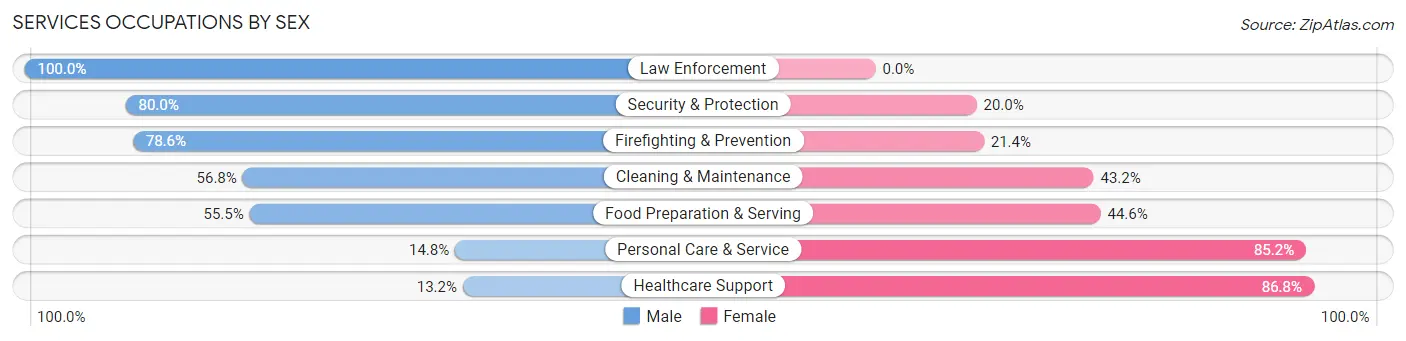
| Occupation | Male | Female |
| Healthcare Support | 173 (13.2%) | 1,135 (86.8%) |
| Security & Protection | 144 (80.0%) | 36 (20.0%) |
| Firefighting & Prevention | 132 (78.6%) | 36 (21.4%) |
| Law Enforcement | 12 (100.0%) | 0 (0.0%) |
| Food Preparation & Serving | 280 (55.4%) | 225 (44.6%) |
| Cleaning & Maintenance | 691 (56.8%) | 525 (43.2%) |
| Personal Care & Service | 96 (14.8%) | 554 (85.2%) |
| Total (Category) | 1,384 (35.9%) | 2,475 (64.1%) |
| Total (Overall) | 7,345 (52.6%) | 6,618 (47.4%) |
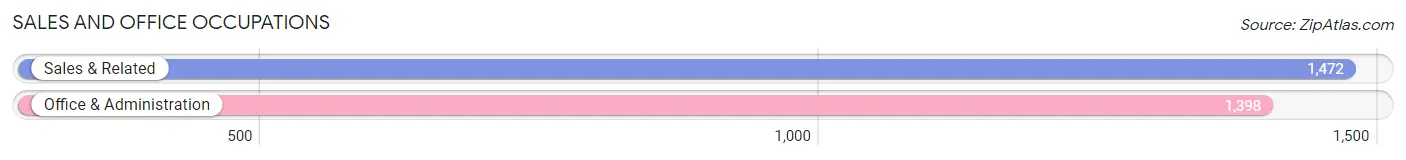
Sales and Office Occupations
The most common Sales and Office occupations in Spring Valley are Sales & Related (1,472 | 10.5%), and Office & Administration (1,398 | 10.0%).
Sales and Office Occupations by Sex
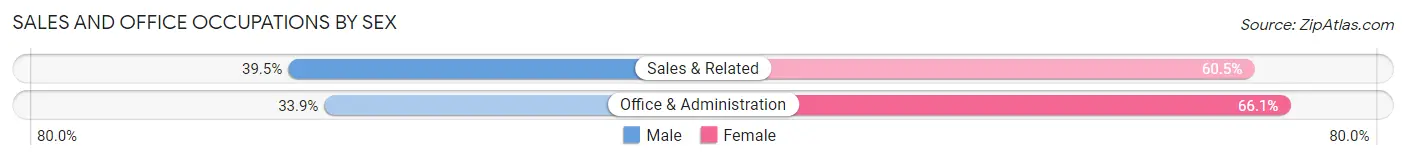
| Occupation | Male | Female |
| Sales & Related | 581 (39.5%) | 891 (60.5%) |
| Office & Administration | 474 (33.9%) | 924 (66.1%) |
| Total (Category) | 1,055 (36.8%) | 1,815 (63.2%) |
| Total (Overall) | 7,345 (52.6%) | 6,618 (47.4%) |
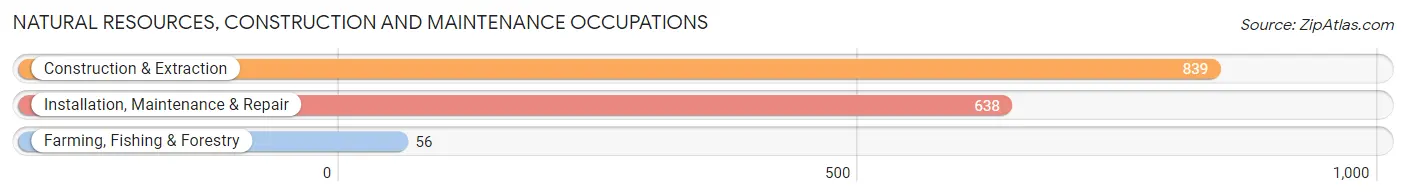
Natural Resources, Construction and Maintenance Occupations
The most common Natural Resources, Construction and Maintenance occupations in Spring Valley are Construction & Extraction (839 | 6.0%), Installation, Maintenance & Repair (638 | 4.6%), and Farming, Fishing & Forestry (56 | 0.4%).
Natural Resources, Construction and Maintenance Occupations by Sex
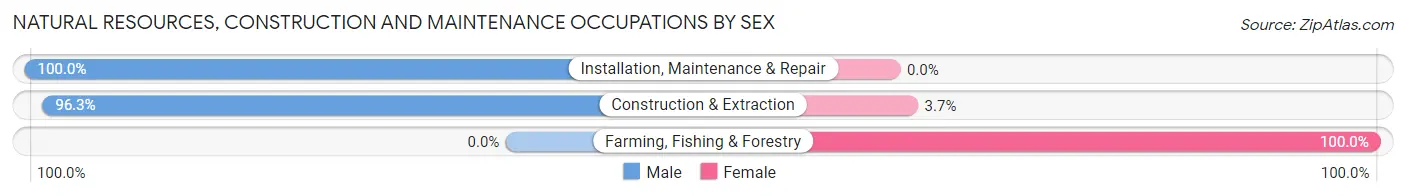
| Occupation | Male | Female |
| Farming, Fishing & Forestry | 0 (0.0%) | 56 (100.0%) |
| Construction & Extraction | 808 (96.3%) | 31 (3.7%) |
| Installation, Maintenance & Repair | 638 (100.0%) | 0 (0.0%) |
| Total (Category) | 1,446 (94.3%) | 87 (5.7%) |
| Total (Overall) | 7,345 (52.6%) | 6,618 (47.4%) |
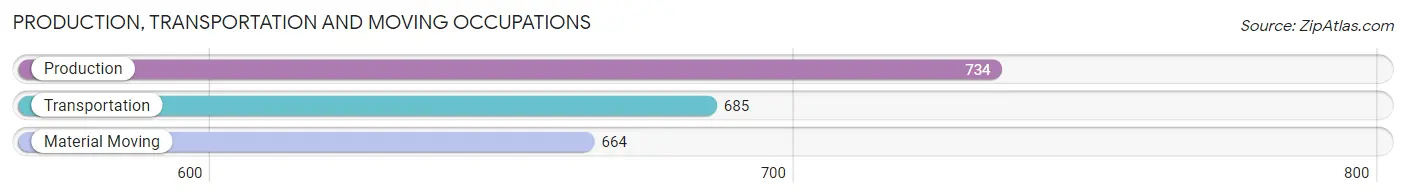
Production, Transportation and Moving Occupations
The most common Production, Transportation and Moving occupations in Spring Valley are Production (734 | 5.3%), Transportation (685 | 4.9%), and Material Moving (664 | 4.8%).
Production, Transportation and Moving Occupations by Sex
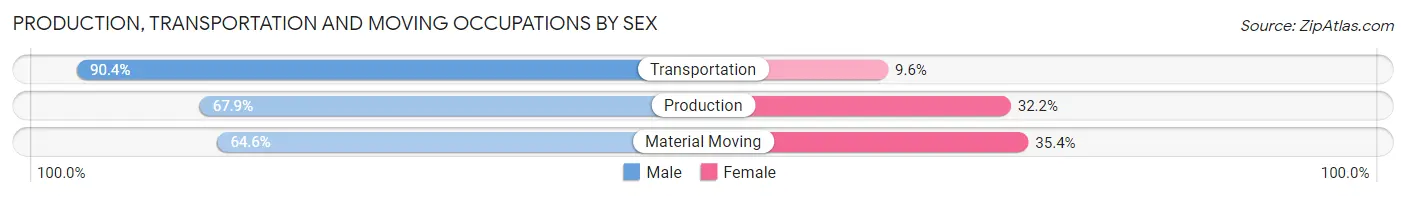
| Occupation | Male | Female |
| Production | 498 (67.8%) | 236 (32.2%) |
| Transportation | 619 (90.4%) | 66 (9.6%) |
| Material Moving | 429 (64.6%) | 235 (35.4%) |
| Total (Category) | 1,546 (74.2%) | 537 (25.8%) |
| Total (Overall) | 7,345 (52.6%) | 6,618 (47.4%) |
Employment Industries by Sex in Spring Valley
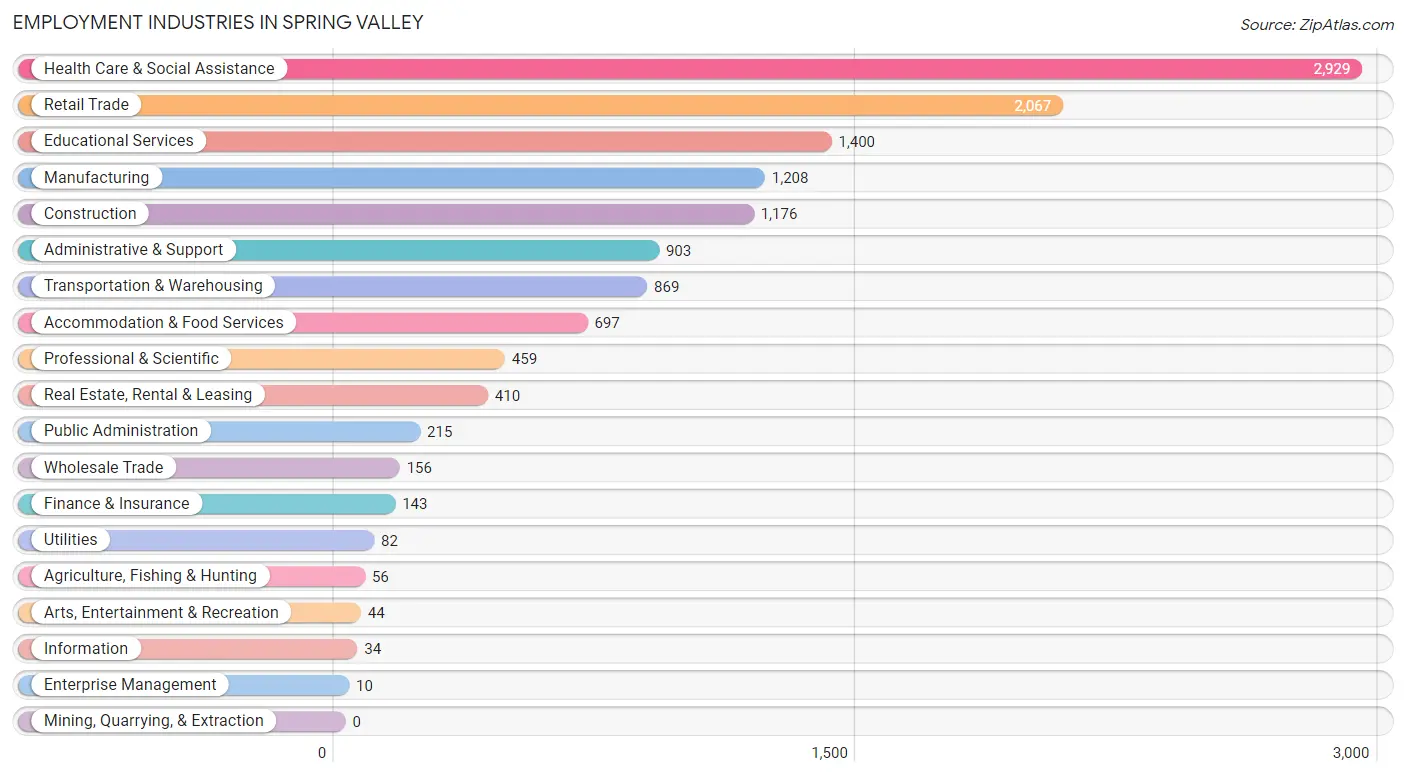
Employment Industries in Spring Valley
The major employment industries in Spring Valley include Health Care & Social Assistance (2,929 | 21.0%), Retail Trade (2,067 | 14.8%), Educational Services (1,400 | 10.0%), Manufacturing (1,208 | 8.6%), and Construction (1,176 | 8.4%).
Employment Industries by Sex in Spring Valley
The Spring Valley industries that see more men than women are Enterprise Management (100.0%), Construction (94.6%), and Wholesale Trade (91.0%), whereas the industries that tend to have a higher number of women are Agriculture, Fishing & Hunting (100.0%), Health Care & Social Assistance (73.5%), and Information (61.8%).
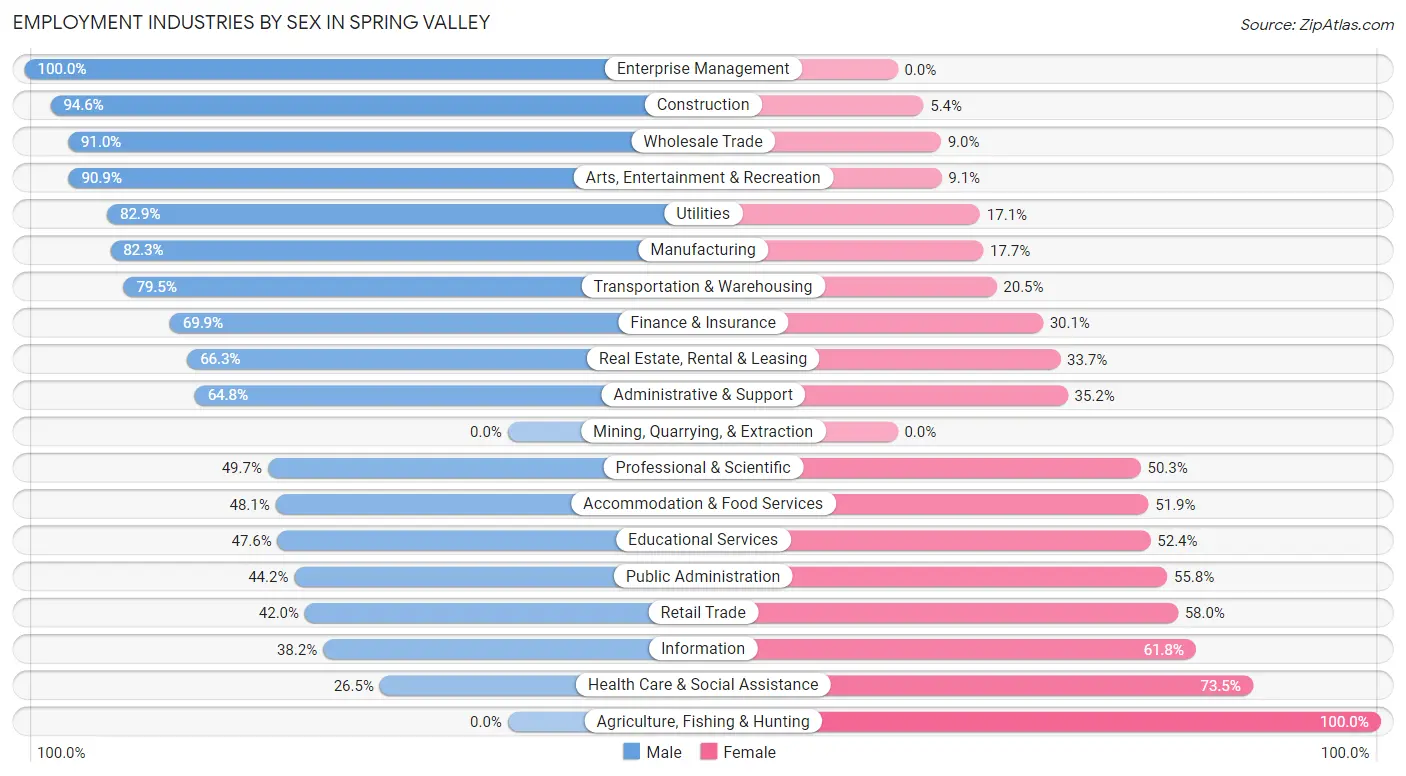
| Industry | Male | Female |
| Agriculture, Fishing & Hunting | 0 (0.0%) | 56 (100.0%) |
| Mining, Quarrying, & Extraction | 0 (0.0%) | 0 (0.0%) |
| Construction | 1,113 (94.6%) | 63 (5.4%) |
| Manufacturing | 994 (82.3%) | 214 (17.7%) |
| Wholesale Trade | 142 (91.0%) | 14 (9.0%) |
| Retail Trade | 868 (42.0%) | 1,199 (58.0%) |
| Transportation & Warehousing | 691 (79.5%) | 178 (20.5%) |
| Utilities | 68 (82.9%) | 14 (17.1%) |
| Information | 13 (38.2%) | 21 (61.8%) |
| Finance & Insurance | 100 (69.9%) | 43 (30.1%) |
| Real Estate, Rental & Leasing | 272 (66.3%) | 138 (33.7%) |
| Professional & Scientific | 228 (49.7%) | 231 (50.3%) |
| Enterprise Management | 10 (100.0%) | 0 (0.0%) |
| Administrative & Support | 585 (64.8%) | 318 (35.2%) |
| Educational Services | 667 (47.6%) | 733 (52.4%) |
| Health Care & Social Assistance | 776 (26.5%) | 2,153 (73.5%) |
| Arts, Entertainment & Recreation | 40 (90.9%) | 4 (9.1%) |
| Accommodation & Food Services | 335 (48.1%) | 362 (51.9%) |
| Public Administration | 95 (44.2%) | 120 (55.8%) |
| Total | 7,345 (52.6%) | 6,618 (47.4%) |
Education in Spring Valley
School Enrollment in Spring Valley
The most common levels of schooling among the 11,032 students in Spring Valley are elementary school (2,707 | 24.5%), high school (2,545 | 23.1%), and middle school (2,284 | 20.7%).
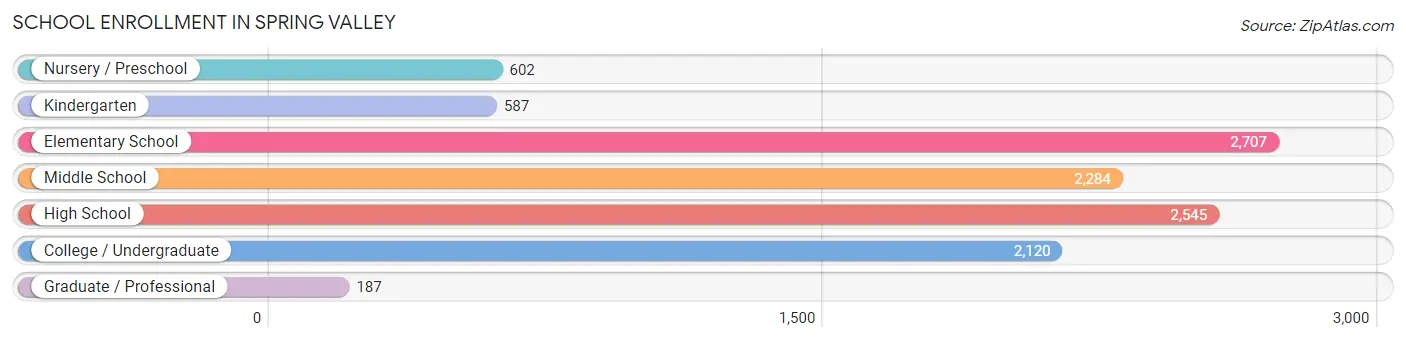
| School Level | # Students | % Students |
| Nursery / Preschool | 602 | 5.5% |
| Kindergarten | 587 | 5.3% |
| Elementary School | 2,707 | 24.5% |
| Middle School | 2,284 | 20.7% |
| High School | 2,545 | 23.1% |
| College / Undergraduate | 2,120 | 19.2% |
| Graduate / Professional | 187 | 1.7% |
| Total | 11,032 | 100.0% |
School Enrollment by Age by Funding Source in Spring Valley
Out of a total of 11,032 students who are enrolled in schools in Spring Valley, 5,847 (53.0%) attend a private institution, while the remaining 5,185 (47.0%) are enrolled in public schools. The age group of 35 years and over has the highest likelihood of being enrolled in private schools, with 267 (89.3% in the age bracket) enrolled. Conversely, the age group of 18 to 19 year olds has the lowest likelihood of being enrolled in a private school, with 710 (61.7% in the age bracket) attending a public institution.
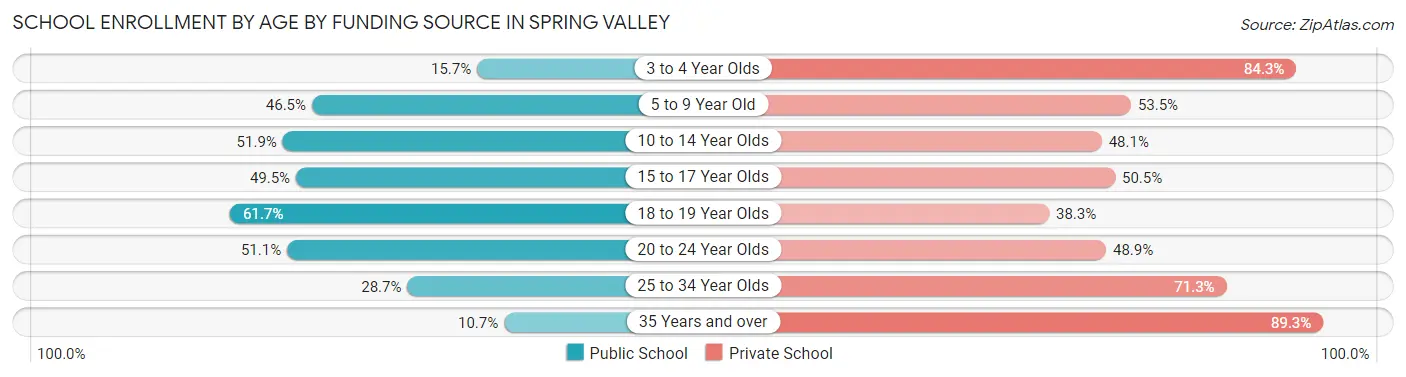
| Age Bracket | Public School | Private School |
| 3 to 4 Year Olds | 111 (15.7%) | 595 (84.3%) |
| 5 to 9 Year Old | 1,383 (46.5%) | 1,592 (53.5%) |
| 10 to 14 Year Olds | 1,707 (51.9%) | 1,580 (48.1%) |
| 15 to 17 Year Olds | 778 (49.5%) | 795 (50.5%) |
| 18 to 19 Year Olds | 710 (61.7%) | 440 (38.3%) |
| 20 to 24 Year Olds | 385 (51.1%) | 368 (48.9%) |
| 25 to 34 Year Olds | 83 (28.7%) | 206 (71.3%) |
| 35 Years and over | 32 (10.7%) | 267 (89.3%) |
| Total | 5,185 (47.0%) | 5,847 (53.0%) |
Educational Attainment by Field of Study in Spring Valley
Business (684 | 19.6%), education (630 | 18.0%), science & technology (301 | 8.6%), communications (299 | 8.6%), and liberal arts & history (296 | 8.5%) are the most common fields of study among 3,498 individuals in Spring Valley who have obtained a bachelor's degree or higher.
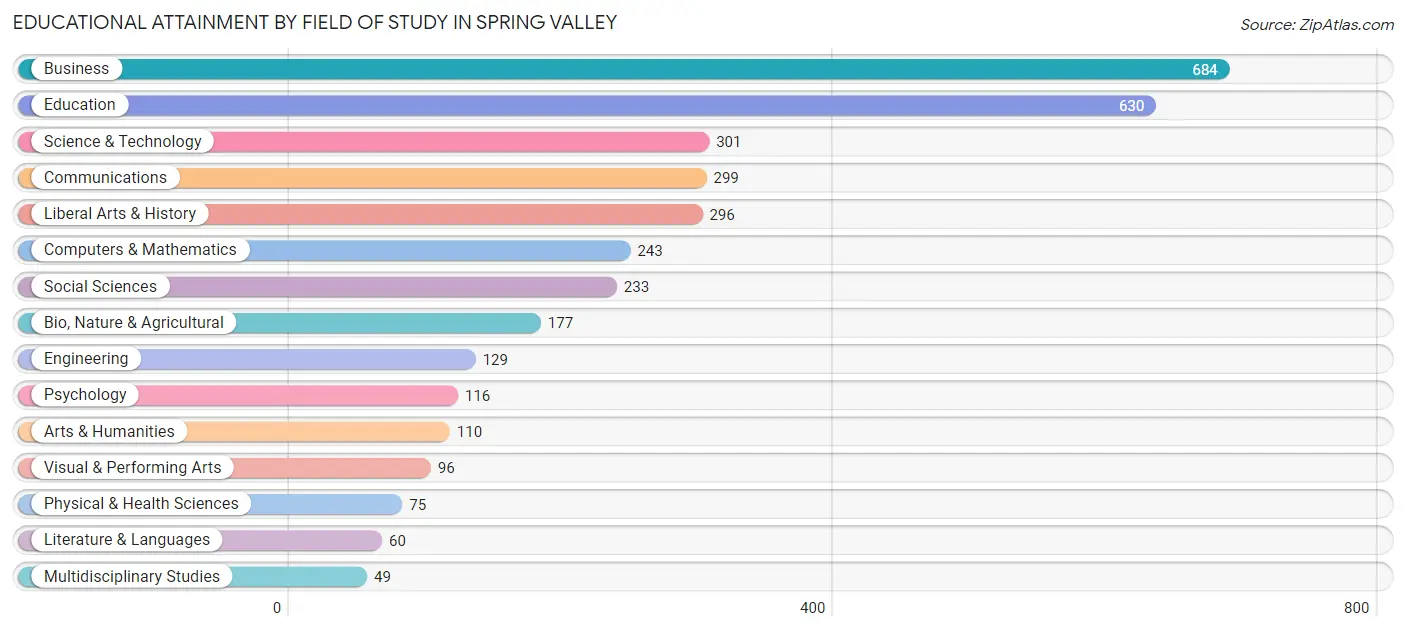
| Field of Study | # Graduates | % Graduates |
| Computers & Mathematics | 243 | 7.0% |
| Bio, Nature & Agricultural | 177 | 5.1% |
| Physical & Health Sciences | 75 | 2.1% |
| Psychology | 116 | 3.3% |
| Social Sciences | 233 | 6.7% |
| Engineering | 129 | 3.7% |
| Multidisciplinary Studies | 49 | 1.4% |
| Science & Technology | 301 | 8.6% |
| Business | 684 | 19.6% |
| Education | 630 | 18.0% |
| Literature & Languages | 60 | 1.7% |
| Liberal Arts & History | 296 | 8.5% |
| Visual & Performing Arts | 96 | 2.7% |
| Communications | 299 | 8.6% |
| Arts & Humanities | 110 | 3.1% |
| Total | 3,498 | 100.0% |
Transportation & Commute in Spring Valley
Vehicle Availability by Sex in Spring Valley
The most prevalent vehicle ownership categories in Spring Valley are males with 1 vehicle (3,001, accounting for 41.8%) and females with 1 vehicle (2,242, making up 48.8%).
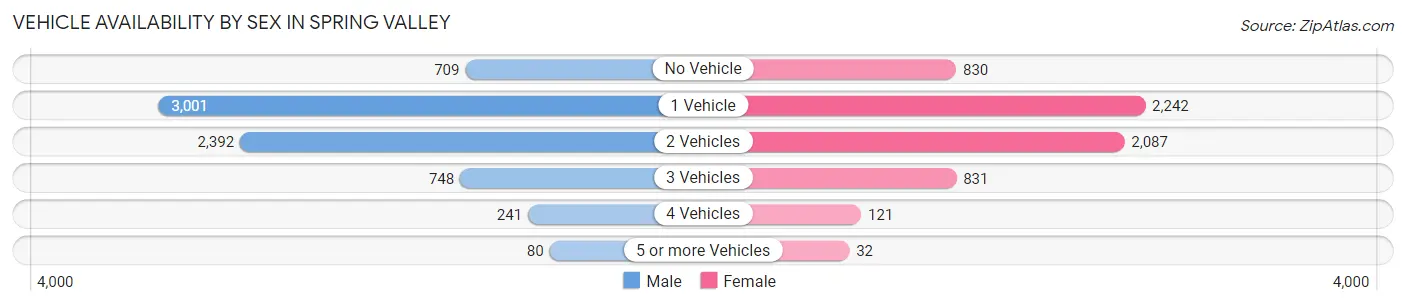
| Vehicles Available | Male | Female |
| No Vehicle | 709 (9.9%) | 830 (13.5%) |
| 1 Vehicle | 3,001 (41.8%) | 2,242 (36.5%) |
| 2 Vehicles | 2,392 (33.4%) | 2,087 (34.0%) |
| 3 Vehicles | 748 (10.4%) | 831 (13.5%) |
| 4 Vehicles | 241 (3.4%) | 121 (2.0%) |
| 5 or more Vehicles | 80 (1.1%) | 32 (0.5%) |
| Total | 7,171 (100.0%) | 6,143 (100.0%) |
Commute Time in Spring Valley
The most frequently occuring commute durations in Spring Valley are 20 to 24 minutes (2,615 commuters, 20.8%), 15 to 19 minutes (2,011 commuters, 16.0%), and 30 to 34 minutes (1,569 commuters, 12.5%).
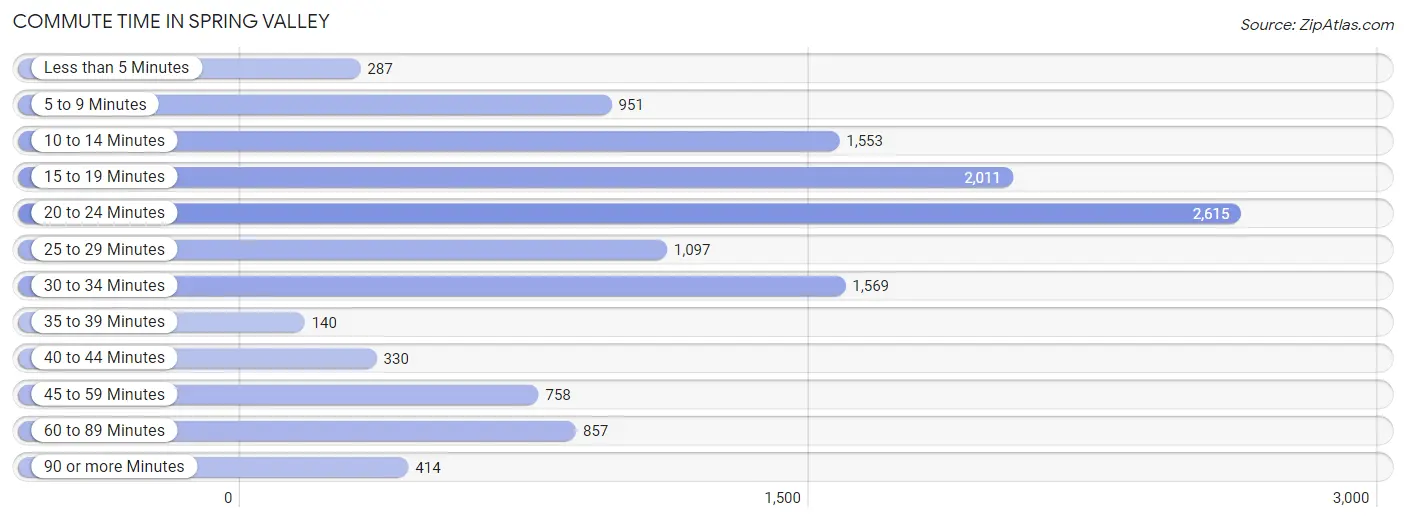
| Commute Time | # Commuters | % Commuters |
| Less than 5 Minutes | 287 | 2.3% |
| 5 to 9 Minutes | 951 | 7.6% |
| 10 to 14 Minutes | 1,553 | 12.3% |
| 15 to 19 Minutes | 2,011 | 16.0% |
| 20 to 24 Minutes | 2,615 | 20.8% |
| 25 to 29 Minutes | 1,097 | 8.7% |
| 30 to 34 Minutes | 1,569 | 12.5% |
| 35 to 39 Minutes | 140 | 1.1% |
| 40 to 44 Minutes | 330 | 2.6% |
| 45 to 59 Minutes | 758 | 6.0% |
| 60 to 89 Minutes | 857 | 6.8% |
| 90 or more Minutes | 414 | 3.3% |
Commute Time by Sex in Spring Valley
The most common commute times in Spring Valley are 20 to 24 minutes (1,466 commuters, 21.7%) for males and 20 to 24 minutes (1,149 commuters, 19.7%) for females.
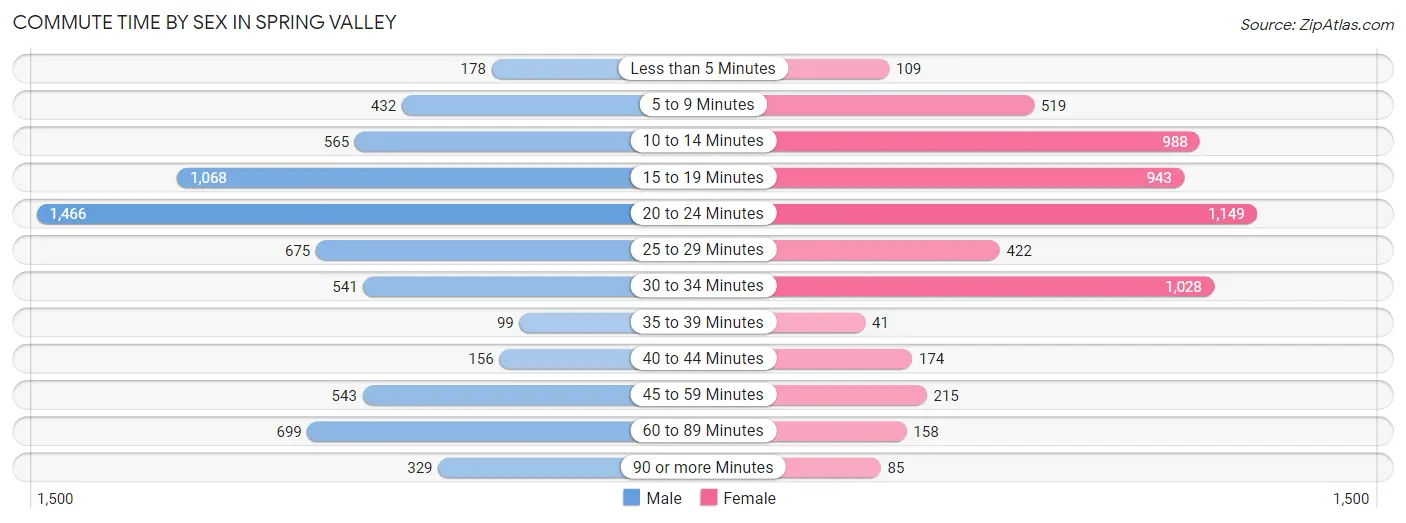
| Commute Time | Male | Female |
| Less than 5 Minutes | 178 (2.6%) | 109 (1.9%) |
| 5 to 9 Minutes | 432 (6.4%) | 519 (8.9%) |
| 10 to 14 Minutes | 565 (8.4%) | 988 (16.9%) |
| 15 to 19 Minutes | 1,068 (15.8%) | 943 (16.2%) |
| 20 to 24 Minutes | 1,466 (21.7%) | 1,149 (19.7%) |
| 25 to 29 Minutes | 675 (10.0%) | 422 (7.2%) |
| 30 to 34 Minutes | 541 (8.0%) | 1,028 (17.6%) |
| 35 to 39 Minutes | 99 (1.5%) | 41 (0.7%) |
| 40 to 44 Minutes | 156 (2.3%) | 174 (3.0%) |
| 45 to 59 Minutes | 543 (8.0%) | 215 (3.7%) |
| 60 to 89 Minutes | 699 (10.3%) | 158 (2.7%) |
| 90 or more Minutes | 329 (4.9%) | 85 (1.5%) |
Time of Departure to Work by Sex in Spring Valley
The most frequent times of departure to work in Spring Valley are 12:00 PM to 3:59 PM (1,068, 15.8%) for males and 12:00 PM to 3:59 PM (882, 15.1%) for females.
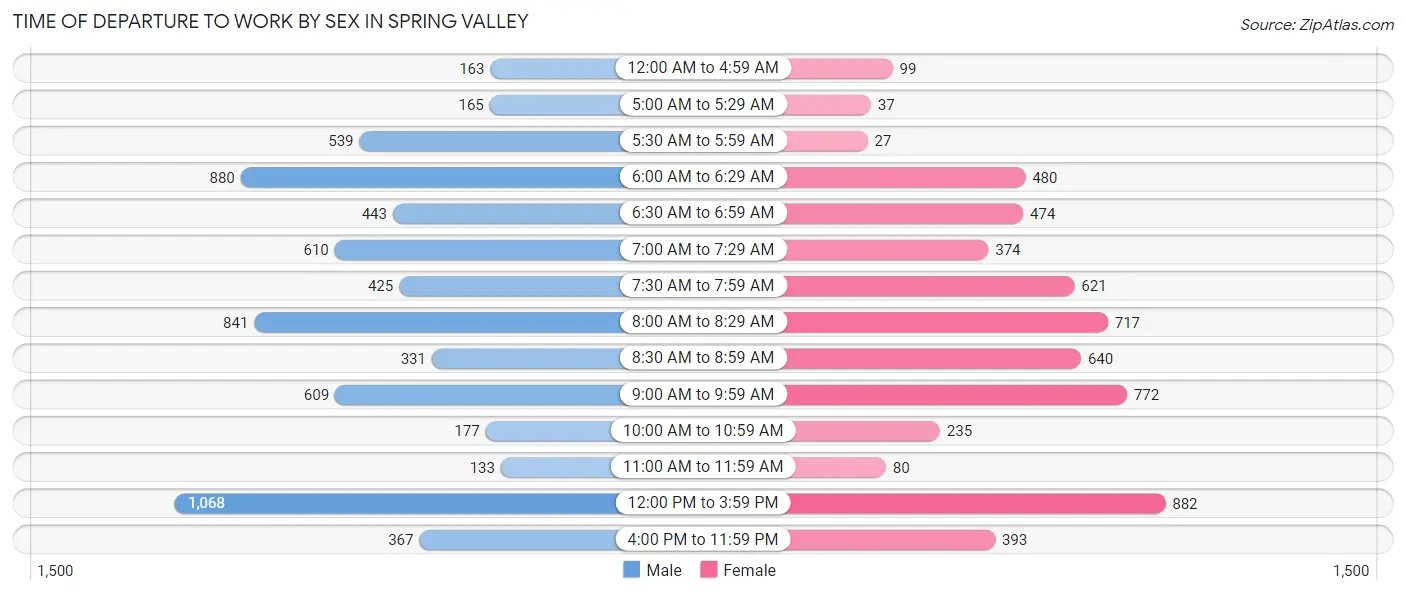
| Time of Departure | Male | Female |
| 12:00 AM to 4:59 AM | 163 (2.4%) | 99 (1.7%) |
| 5:00 AM to 5:29 AM | 165 (2.4%) | 37 (0.6%) |
| 5:30 AM to 5:59 AM | 539 (8.0%) | 27 (0.5%) |
| 6:00 AM to 6:29 AM | 880 (13.0%) | 480 (8.2%) |
| 6:30 AM to 6:59 AM | 443 (6.6%) | 474 (8.1%) |
| 7:00 AM to 7:29 AM | 610 (9.0%) | 374 (6.4%) |
| 7:30 AM to 7:59 AM | 425 (6.3%) | 621 (10.6%) |
| 8:00 AM to 8:29 AM | 841 (12.5%) | 717 (12.3%) |
| 8:30 AM to 8:59 AM | 331 (4.9%) | 640 (11.0%) |
| 9:00 AM to 9:59 AM | 609 (9.0%) | 772 (13.2%) |
| 10:00 AM to 10:59 AM | 177 (2.6%) | 235 (4.0%) |
| 11:00 AM to 11:59 AM | 133 (2.0%) | 80 (1.4%) |
| 12:00 PM to 3:59 PM | 1,068 (15.8%) | 882 (15.1%) |
| 4:00 PM to 11:59 PM | 367 (5.4%) | 393 (6.7%) |
| Total | 6,751 (100.0%) | 5,831 (100.0%) |
Housing Occupancy in Spring Valley
Occupancy by Ownership in Spring Valley
Of the total 9,527 dwellings in Spring Valley, owner-occupied units account for 2,419 (25.4%), while renter-occupied units make up 7,108 (74.6%).
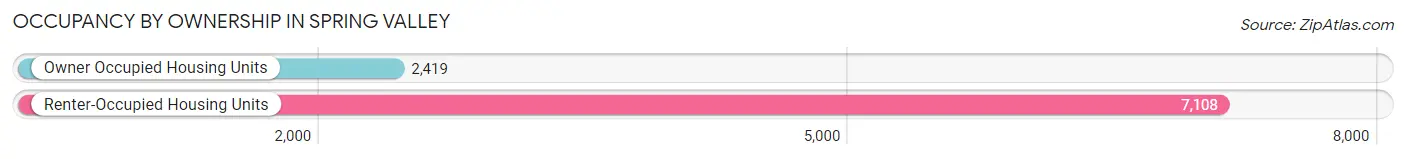
| Occupancy | # Housing Units | % Housing Units |
| Owner Occupied Housing Units | 2,419 | 25.4% |
| Renter-Occupied Housing Units | 7,108 | 74.6% |
| Total Occupied Housing Units | 9,527 | 100.0% |
Occupancy by Household Size in Spring Valley
| Household Size | # Housing Units | % Housing Units |
| 1-Person Household | 2,249 | 23.6% |
| 2-Person Household | 1,545 | 16.2% |
| 3-Person Household | 1,639 | 17.2% |
| 4+ Person Household | 4,094 | 43.0% |
| Total Housing Units | 9,527 | 100.0% |
Occupancy by Ownership by Household Size in Spring Valley
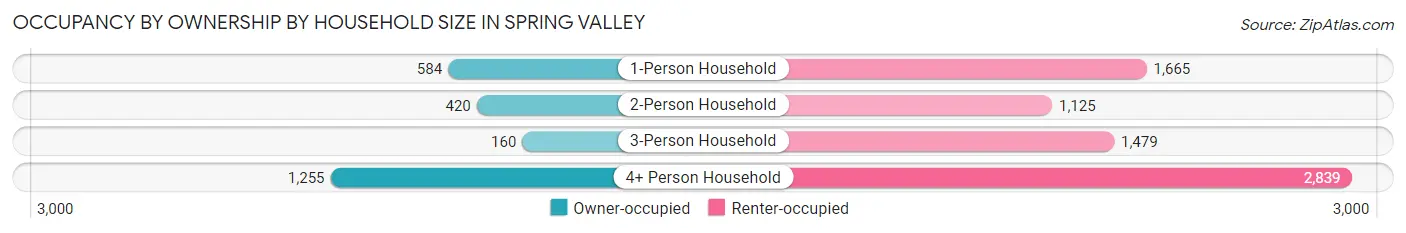
| Household Size | Owner-occupied | Renter-occupied |
| 1-Person Household | 584 (26.0%) | 1,665 (74.0%) |
| 2-Person Household | 420 (27.2%) | 1,125 (72.8%) |
| 3-Person Household | 160 (9.8%) | 1,479 (90.2%) |
| 4+ Person Household | 1,255 (30.6%) | 2,839 (69.4%) |
| Total Housing Units | 2,419 (25.4%) | 7,108 (74.6%) |
Occupancy by Educational Attainment in Spring Valley
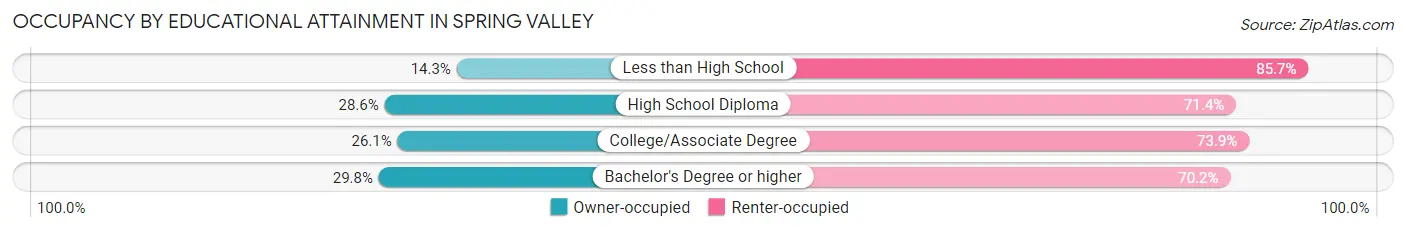
| Household Size | Owner-occupied | Renter-occupied |
| Less than High School | 257 (14.3%) | 1,536 (85.7%) |
| High School Diploma | 820 (28.6%) | 2,044 (71.4%) |
| College/Associate Degree | 758 (26.1%) | 2,151 (73.9%) |
| Bachelor's Degree or higher | 584 (29.8%) | 1,377 (70.2%) |
Occupancy by Age of Householder in Spring Valley
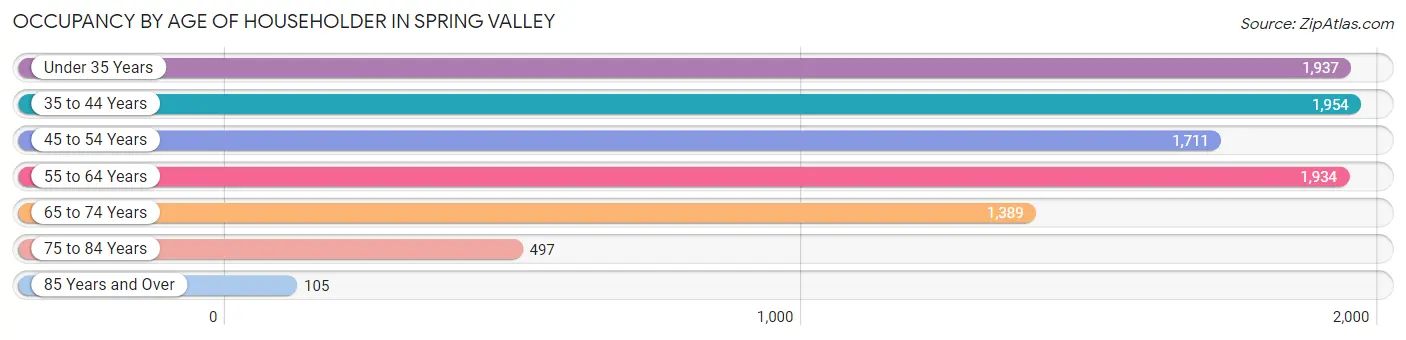
| Age Bracket | # Households | % Households |
| Under 35 Years | 1,937 | 20.3% |
| 35 to 44 Years | 1,954 | 20.5% |
| 45 to 54 Years | 1,711 | 18.0% |
| 55 to 64 Years | 1,934 | 20.3% |
| 65 to 74 Years | 1,389 | 14.6% |
| 75 to 84 Years | 497 | 5.2% |
| 85 Years and Over | 105 | 1.1% |
| Total | 9,527 | 100.0% |
Housing Finances in Spring Valley
Median Income by Occupancy in Spring Valley
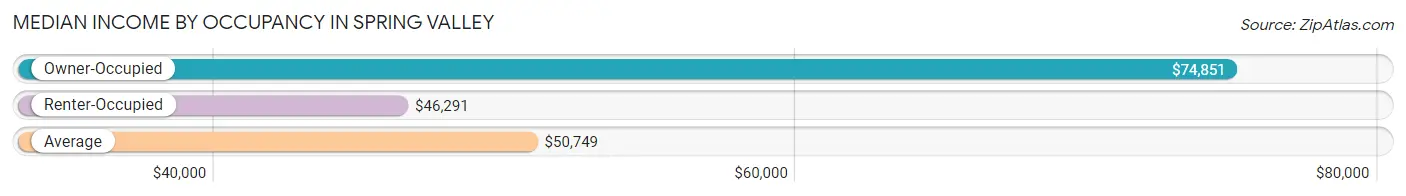
| Occupancy Type | # Households | Median Income |
| Owner-Occupied | 2,419 (25.4%) | $74,851 |
| Renter-Occupied | 7,108 (74.6%) | $46,291 |
| Average | 9,527 (100.0%) | $50,749 |
Occupancy by Householder Income Bracket in Spring Valley
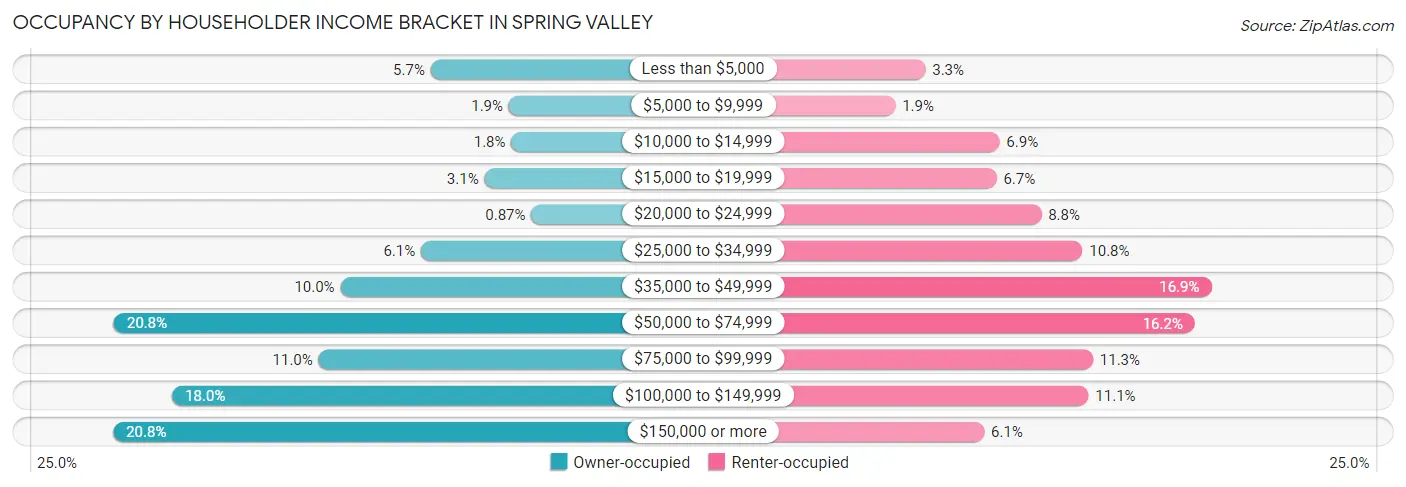
| Income Bracket | Owner-occupied | Renter-occupied |
| Less than $5,000 | 137 (5.7%) | 236 (3.3%) |
| $5,000 to $9,999 | 47 (1.9%) | 134 (1.9%) |
| $10,000 to $14,999 | 44 (1.8%) | 487 (6.9%) |
| $15,000 to $19,999 | 75 (3.1%) | 477 (6.7%) |
| $20,000 to $24,999 | 21 (0.9%) | 628 (8.8%) |
| $25,000 to $34,999 | 148 (6.1%) | 768 (10.8%) |
| $35,000 to $49,999 | 241 (10.0%) | 1,204 (16.9%) |
| $50,000 to $74,999 | 502 (20.7%) | 1,148 (16.2%) |
| $75,000 to $99,999 | 266 (11.0%) | 803 (11.3%) |
| $100,000 to $149,999 | 435 (18.0%) | 788 (11.1%) |
| $150,000 or more | 503 (20.8%) | 435 (6.1%) |
| Total | 2,419 (100.0%) | 7,108 (100.0%) |
Monthly Housing Cost Tiers in Spring Valley
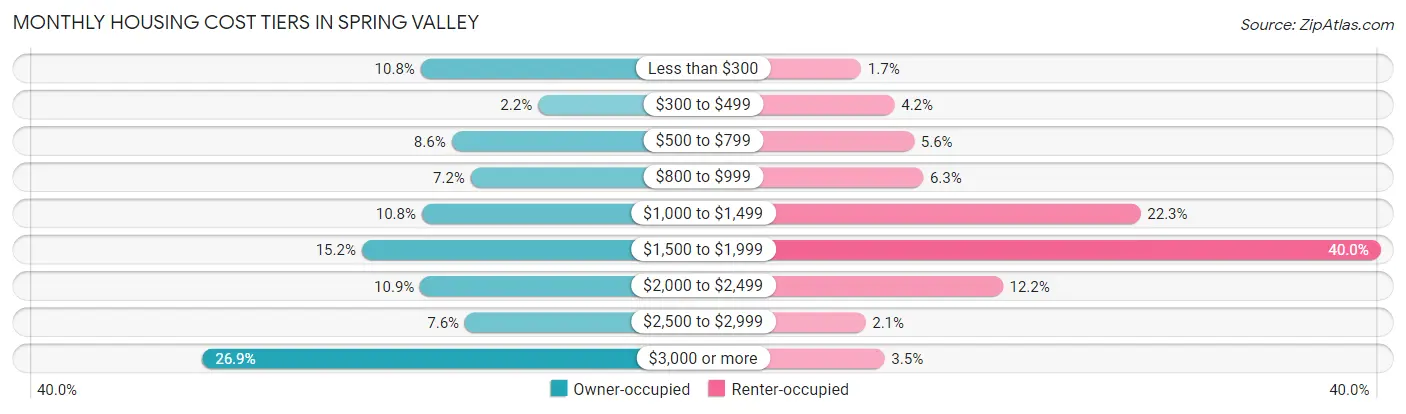
| Monthly Cost | Owner-occupied | Renter-occupied |
| Less than $300 | 262 (10.8%) | 123 (1.7%) |
| $300 to $499 | 53 (2.2%) | 298 (4.2%) |
| $500 to $799 | 207 (8.6%) | 400 (5.6%) |
| $800 to $999 | 173 (7.1%) | 448 (6.3%) |
| $1,000 to $1,499 | 260 (10.7%) | 1,586 (22.3%) |
| $1,500 to $1,999 | 367 (15.2%) | 2,843 (40.0%) |
| $2,000 to $2,499 | 263 (10.9%) | 864 (12.2%) |
| $2,500 to $2,999 | 183 (7.6%) | 146 (2.1%) |
| $3,000 or more | 651 (26.9%) | 246 (3.5%) |
| Total | 2,419 (100.0%) | 7,108 (100.0%) |
Physical Housing Characteristics in Spring Valley
Housing Structures in Spring Valley
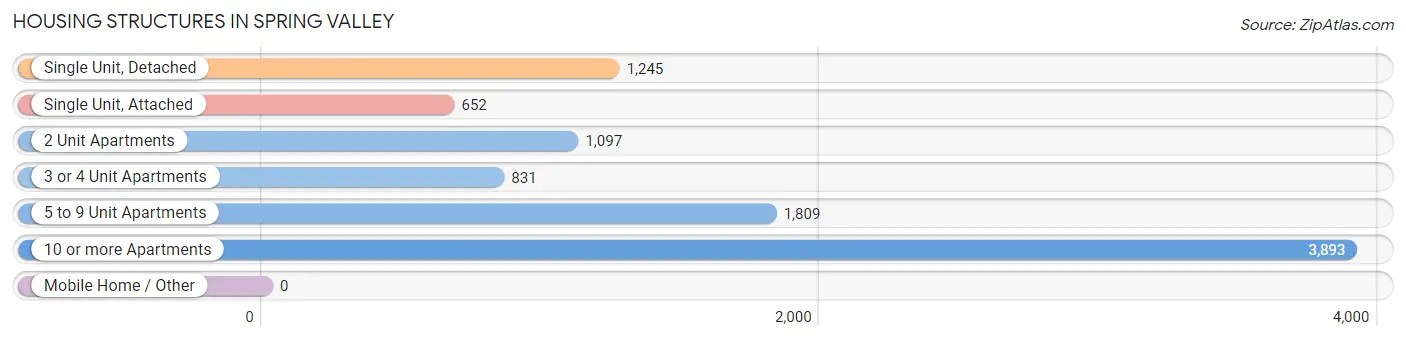
| Structure Type | # Housing Units | % Housing Units |
| Single Unit, Detached | 1,245 | 13.1% |
| Single Unit, Attached | 652 | 6.8% |
| 2 Unit Apartments | 1,097 | 11.5% |
| 3 or 4 Unit Apartments | 831 | 8.7% |
| 5 to 9 Unit Apartments | 1,809 | 19.0% |
| 10 or more Apartments | 3,893 | 40.9% |
| Mobile Home / Other | 0 | 0.0% |
| Total | 9,527 | 100.0% |
Housing Structures by Occupancy in Spring Valley
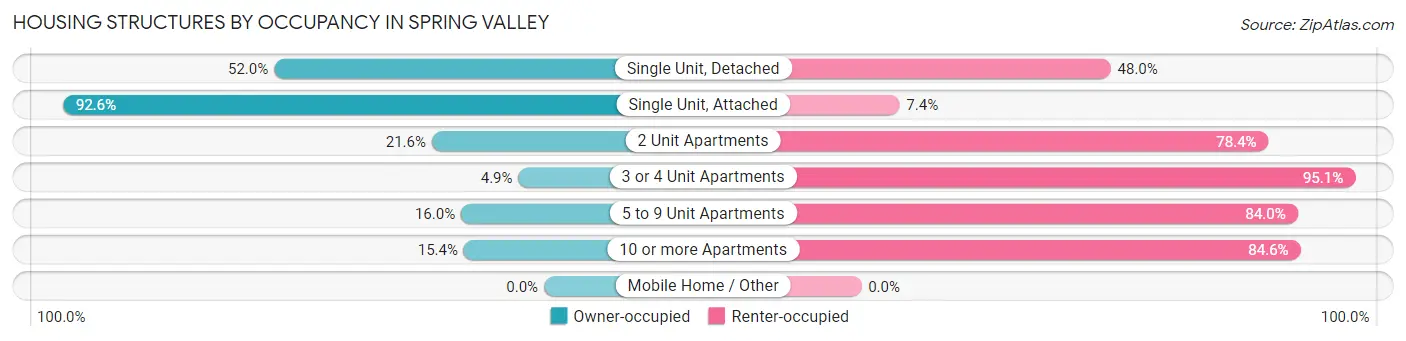
| Structure Type | Owner-occupied | Renter-occupied |
| Single Unit, Detached | 647 (52.0%) | 598 (48.0%) |
| Single Unit, Attached | 604 (92.6%) | 48 (7.4%) |
| 2 Unit Apartments | 237 (21.6%) | 860 (78.4%) |
| 3 or 4 Unit Apartments | 41 (4.9%) | 790 (95.1%) |
| 5 to 9 Unit Apartments | 289 (16.0%) | 1,520 (84.0%) |
| 10 or more Apartments | 601 (15.4%) | 3,292 (84.6%) |
| Mobile Home / Other | 0 (0.0%) | 0 (0.0%) |
| Total | 2,419 (25.4%) | 7,108 (74.6%) |
Housing Structures by Number of Rooms in Spring Valley
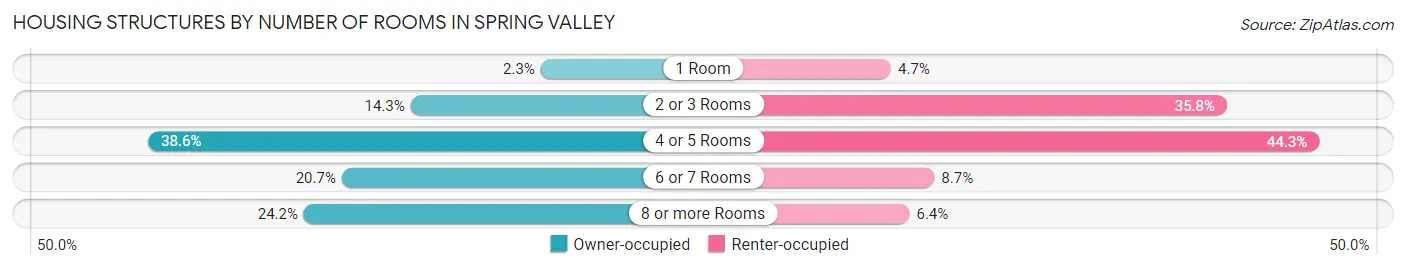
| Number of Rooms | Owner-occupied | Renter-occupied |
| 1 Room | 55 (2.3%) | 336 (4.7%) |
| 2 or 3 Rooms | 346 (14.3%) | 2,543 (35.8%) |
| 4 or 5 Rooms | 933 (38.6%) | 3,150 (44.3%) |
| 6 or 7 Rooms | 500 (20.7%) | 621 (8.7%) |
| 8 or more Rooms | 585 (24.2%) | 458 (6.4%) |
| Total | 2,419 (100.0%) | 7,108 (100.0%) |
Housing Structure by Heating Type in Spring Valley
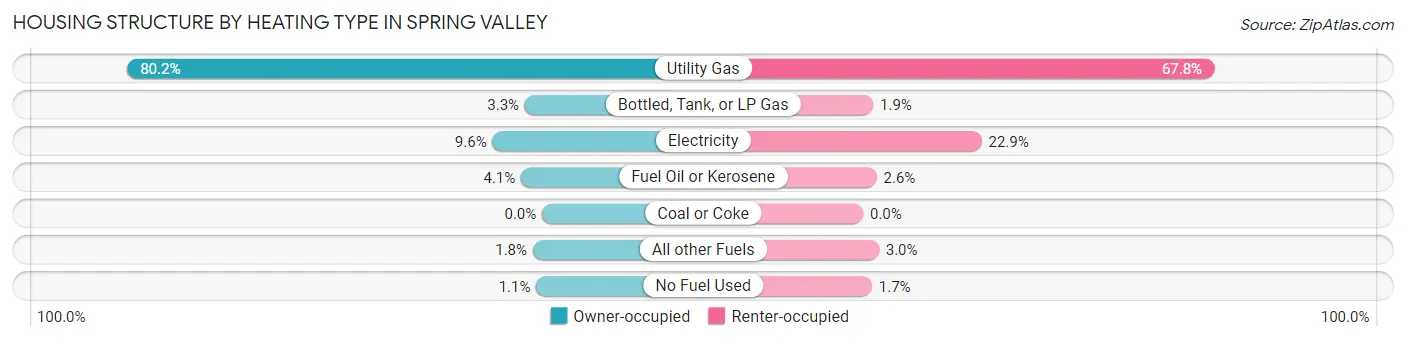
| Heating Type | Owner-occupied | Renter-occupied |
| Utility Gas | 1,939 (80.2%) | 4,819 (67.8%) |
| Bottled, Tank, or LP Gas | 80 (3.3%) | 138 (1.9%) |
| Electricity | 232 (9.6%) | 1,628 (22.9%) |
| Fuel Oil or Kerosene | 98 (4.1%) | 186 (2.6%) |
| Coal or Coke | 0 (0.0%) | 0 (0.0%) |
| All other Fuels | 43 (1.8%) | 216 (3.0%) |
| No Fuel Used | 27 (1.1%) | 121 (1.7%) |
| Total | 2,419 (100.0%) | 7,108 (100.0%) |
Household Vehicle Usage in Spring Valley
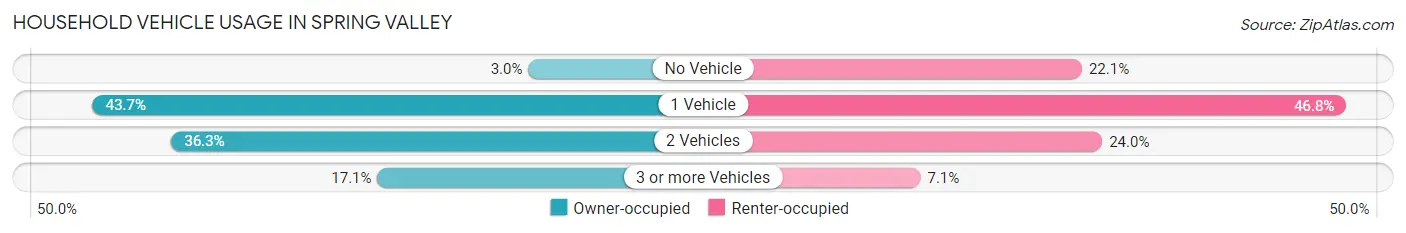
| Vehicles per Household | Owner-occupied | Renter-occupied |
| No Vehicle | 72 (3.0%) | 1,573 (22.1%) |
| 1 Vehicle | 1,056 (43.6%) | 3,326 (46.8%) |
| 2 Vehicles | 878 (36.3%) | 1,707 (24.0%) |
| 3 or more Vehicles | 413 (17.1%) | 502 (7.1%) |
| Total | 2,419 (100.0%) | 7,108 (100.0%) |
Real Estate & Mortgages in Spring Valley
Real Estate and Mortgage Overview in Spring Valley
| Characteristic | Without Mortgage | With Mortgage |
| Housing Units | 1,060 | 1,359 |
| Median Property Value | $271,800 | $379,200 |
| Median Household Income | $51,470 | $376 |
| Monthly Housing Costs | $929 | $582 |
| Real Estate Taxes | $7,319 | $190 |
Property Value by Mortgage Status in Spring Valley
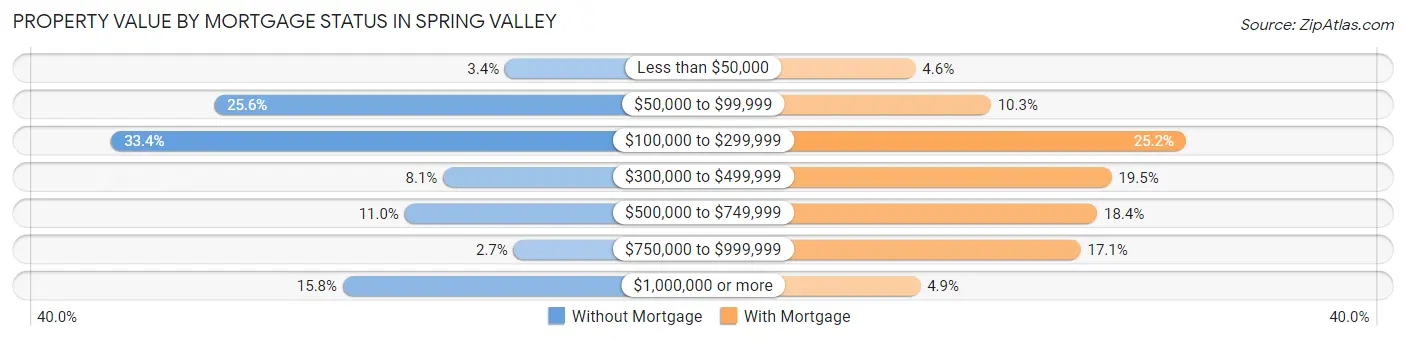
| Property Value | Without Mortgage | With Mortgage |
| Less than $50,000 | 36 (3.4%) | 62 (4.6%) |
| $50,000 to $99,999 | 271 (25.6%) | 140 (10.3%) |
| $100,000 to $299,999 | 354 (33.4%) | 342 (25.2%) |
| $300,000 to $499,999 | 86 (8.1%) | 265 (19.5%) |
| $500,000 to $749,999 | 117 (11.0%) | 250 (18.4%) |
| $750,000 to $999,999 | 29 (2.7%) | 233 (17.1%) |
| $1,000,000 or more | 167 (15.8%) | 67 (4.9%) |
| Total | 1,060 (100.0%) | 1,359 (100.0%) |
Household Income by Mortgage Status in Spring Valley
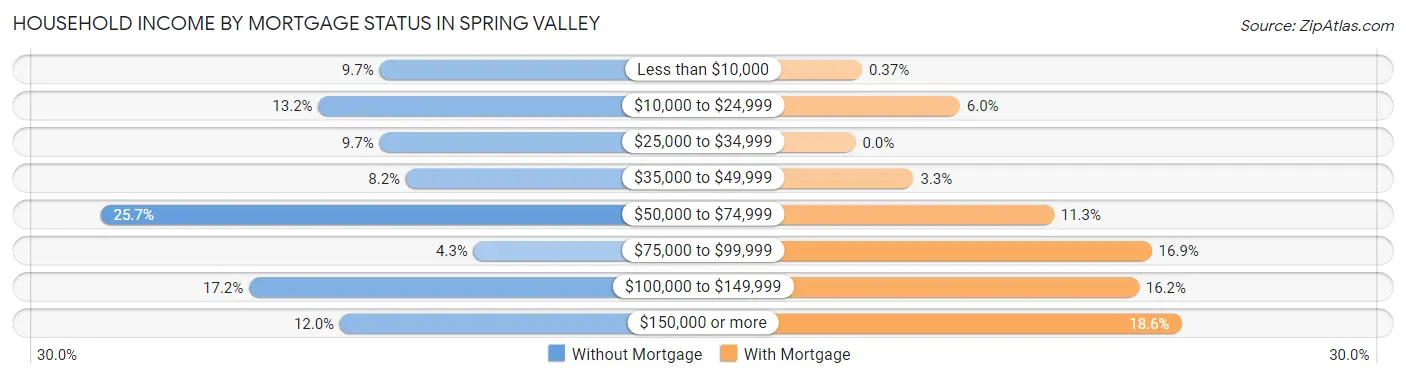
| Household Income | Without Mortgage | With Mortgage |
| Less than $10,000 | 103 (9.7%) | 5 (0.4%) |
| $10,000 to $24,999 | 140 (13.2%) | 81 (6.0%) |
| $25,000 to $34,999 | 103 (9.7%) | 0 (0.0%) |
| $35,000 to $49,999 | 87 (8.2%) | 45 (3.3%) |
| $50,000 to $74,999 | 272 (25.7%) | 154 (11.3%) |
| $75,000 to $99,999 | 46 (4.3%) | 230 (16.9%) |
| $100,000 to $149,999 | 182 (17.2%) | 220 (16.2%) |
| $150,000 or more | 127 (12.0%) | 253 (18.6%) |
| Total | 1,060 (100.0%) | 1,359 (100.0%) |
Property Value to Household Income Ratio in Spring Valley
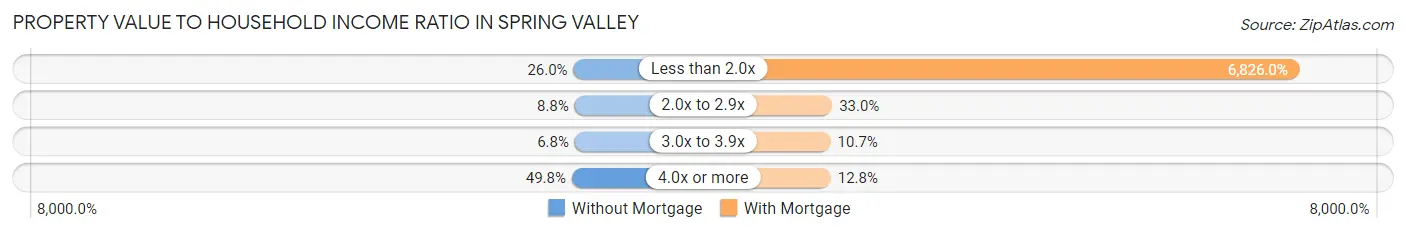
| Value-to-Income Ratio | Without Mortgage | With Mortgage |
| Less than 2.0x | 276 (26.0%) | 92,765 (6,826.0%) |
| 2.0x to 2.9x | 93 (8.8%) | 449 (33.0%) |
| 3.0x to 3.9x | 72 (6.8%) | 146 (10.7%) |
| 4.0x or more | 528 (49.8%) | 174 (12.8%) |
| Total | 1,060 (100.0%) | 1,359 (100.0%) |
Real Estate Taxes by Mortgage Status in Spring Valley
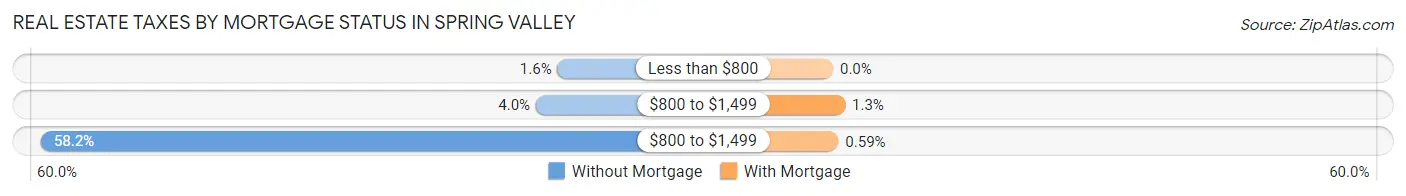
| Property Taxes | Without Mortgage | With Mortgage |
| Less than $800 | 17 (1.6%) | 0 (0.0%) |
| $800 to $1,499 | 42 (4.0%) | 18 (1.3%) |
| $800 to $1,499 | 617 (58.2%) | 8 (0.6%) |
| Total | 1,060 (100.0%) | 1,359 (100.0%) |
Health & Disability in Spring Valley
Health Insurance Coverage by Age in Spring Valley
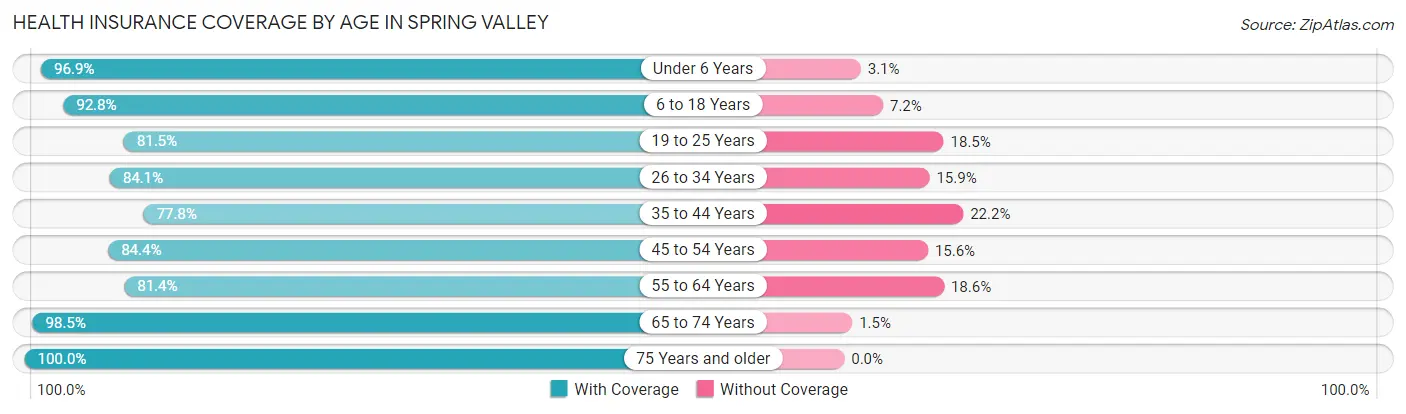
| Age Bracket | With Coverage | Without Coverage |
| Under 6 Years | 3,970 (96.9%) | 126 (3.1%) |
| 6 to 18 Years | 7,694 (92.8%) | 599 (7.2%) |
| 19 to 25 Years | 2,767 (81.5%) | 629 (18.5%) |
| 26 to 34 Years | 3,323 (84.1%) | 628 (15.9%) |
| 35 to 44 Years | 3,150 (77.8%) | 898 (22.2%) |
| 45 to 54 Years | 2,450 (84.4%) | 453 (15.6%) |
| 55 to 64 Years | 2,615 (81.4%) | 597 (18.6%) |
| 65 to 74 Years | 2,135 (98.5%) | 32 (1.5%) |
| 75 Years and older | 864 (100.0%) | 0 (0.0%) |
| Total | 28,968 (88.0%) | 3,962 (12.0%) |
Health Insurance Coverage by Citizenship Status in Spring Valley
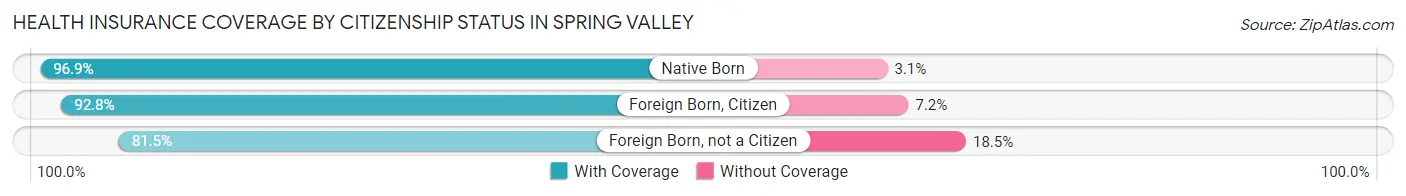
| Citizenship Status | With Coverage | Without Coverage |
| Native Born | 3,970 (96.9%) | 126 (3.1%) |
| Foreign Born, Citizen | 7,694 (92.8%) | 599 (7.2%) |
| Foreign Born, not a Citizen | 2,767 (81.5%) | 629 (18.5%) |
Health Insurance Coverage by Household Income in Spring Valley
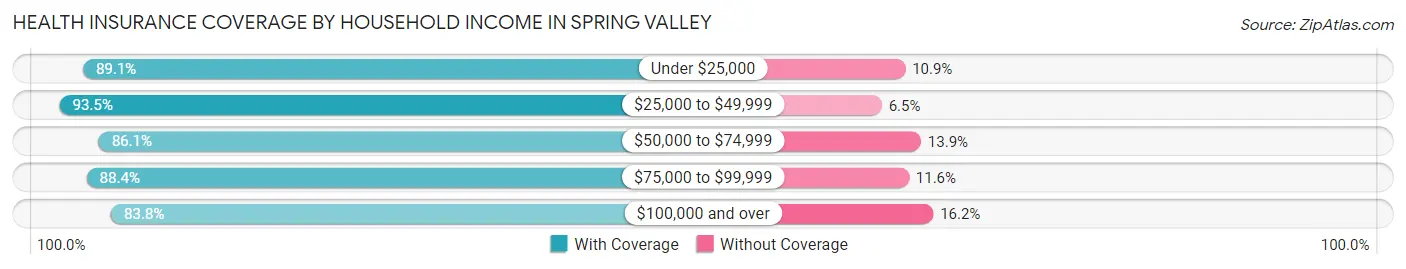
| Household Income | With Coverage | Without Coverage |
| Under $25,000 | 5,926 (89.1%) | 728 (10.9%) |
| $25,000 to $49,999 | 6,575 (93.5%) | 460 (6.5%) |
| $50,000 to $74,999 | 5,660 (86.1%) | 913 (13.9%) |
| $75,000 to $99,999 | 3,290 (88.4%) | 433 (11.6%) |
| $100,000 and over | 7,386 (83.8%) | 1,427 (16.2%) |
Public vs Private Health Insurance Coverage by Age in Spring Valley
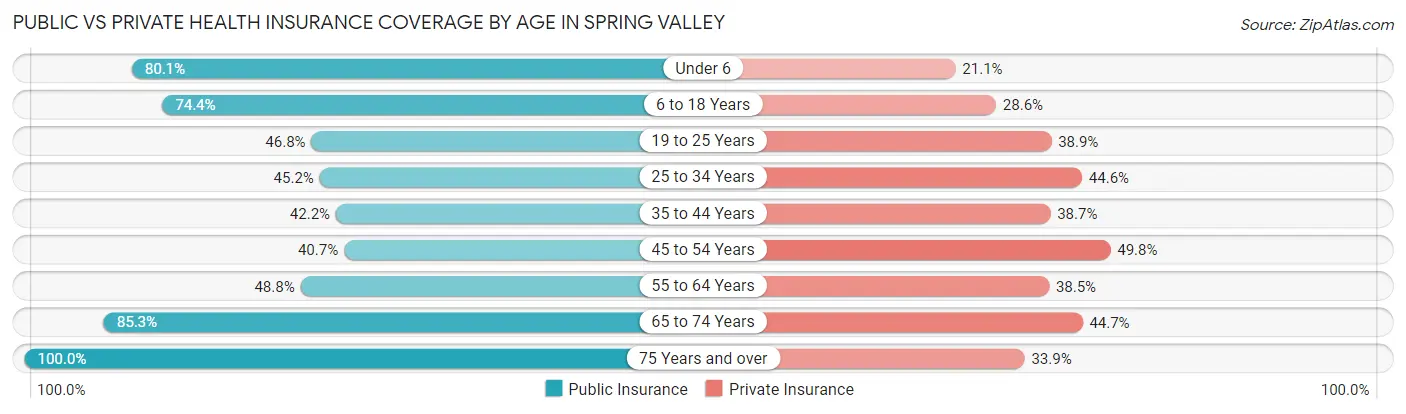
| Age Bracket | Public Insurance | Private Insurance |
| Under 6 | 3,280 (80.1%) | 864 (21.1%) |
| 6 to 18 Years | 6,172 (74.4%) | 2,373 (28.6%) |
| 19 to 25 Years | 1,588 (46.8%) | 1,320 (38.9%) |
| 25 to 34 Years | 1,787 (45.2%) | 1,761 (44.6%) |
| 35 to 44 Years | 1,709 (42.2%) | 1,566 (38.7%) |
| 45 to 54 Years | 1,182 (40.7%) | 1,447 (49.8%) |
| 55 to 64 Years | 1,567 (48.8%) | 1,235 (38.5%) |
| 65 to 74 Years | 1,848 (85.3%) | 968 (44.7%) |
| 75 Years and over | 864 (100.0%) | 293 (33.9%) |
| Total | 19,997 (60.7%) | 11,827 (35.9%) |
Disability Status by Sex by Age in Spring Valley
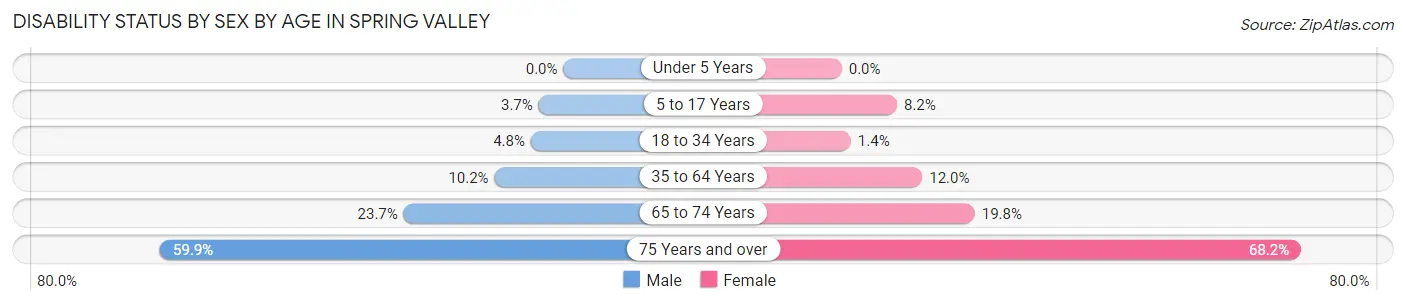
| Age Bracket | Male | Female |
| Under 5 Years | 0 (0.0%) | 0 (0.0%) |
| 5 to 17 Years | 142 (3.7%) | 345 (8.2%) |
| 18 to 34 Years | 195 (4.8%) | 55 (1.3%) |
| 35 to 64 Years | 534 (10.2%) | 591 (12.0%) |
| 65 to 74 Years | 251 (23.7%) | 219 (19.8%) |
| 75 Years and over | 124 (59.9%) | 448 (68.2%) |
Disability Class by Sex by Age in Spring Valley
Disability Class: Hearing Difficulty
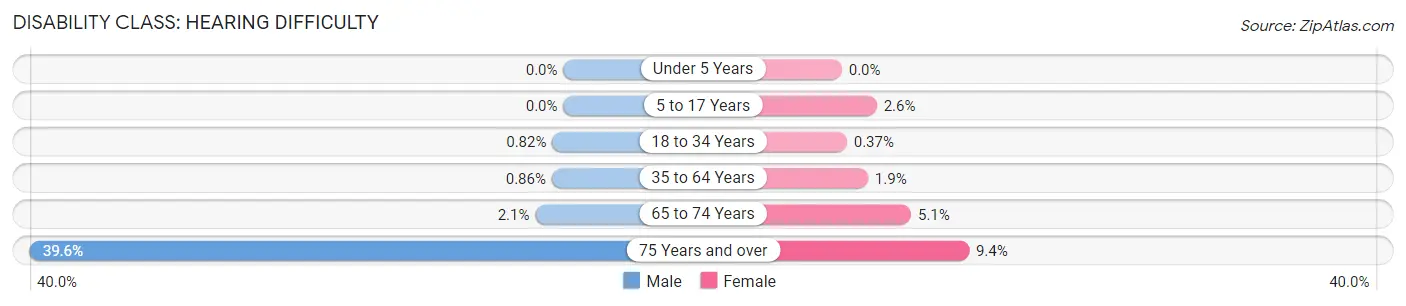
| Age Bracket | Male | Female |
| Under 5 Years | 0 (0.0%) | 0 (0.0%) |
| 5 to 17 Years | 0 (0.0%) | 109 (2.6%) |
| 18 to 34 Years | 33 (0.8%) | 15 (0.4%) |
| 35 to 64 Years | 45 (0.9%) | 96 (1.9%) |
| 65 to 74 Years | 22 (2.1%) | 57 (5.1%) |
| 75 Years and over | 82 (39.6%) | 62 (9.4%) |
Disability Class: Vision Difficulty
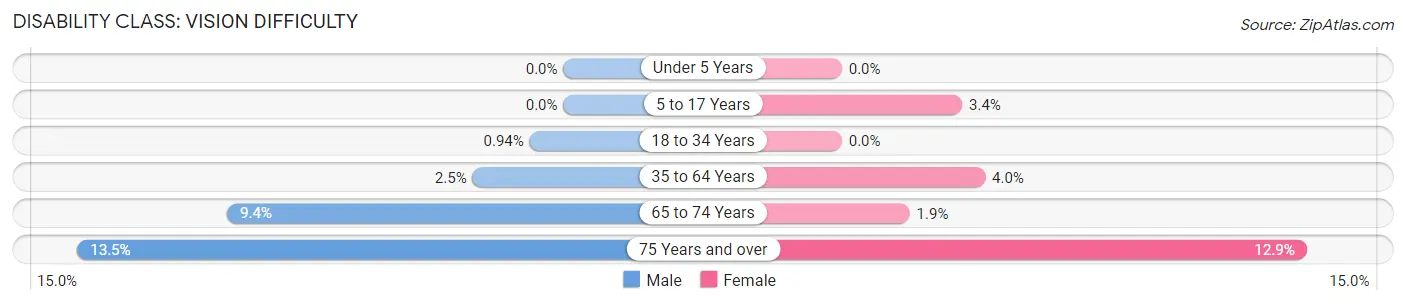
| Age Bracket | Male | Female |
| Under 5 Years | 0 (0.0%) | 0 (0.0%) |
| 5 to 17 Years | 0 (0.0%) | 141 (3.4%) |
| 18 to 34 Years | 38 (0.9%) | 0 (0.0%) |
| 35 to 64 Years | 132 (2.5%) | 197 (4.0%) |
| 65 to 74 Years | 99 (9.4%) | 21 (1.9%) |
| 75 Years and over | 28 (13.5%) | 85 (12.9%) |
Disability Class: Cognitive Difficulty
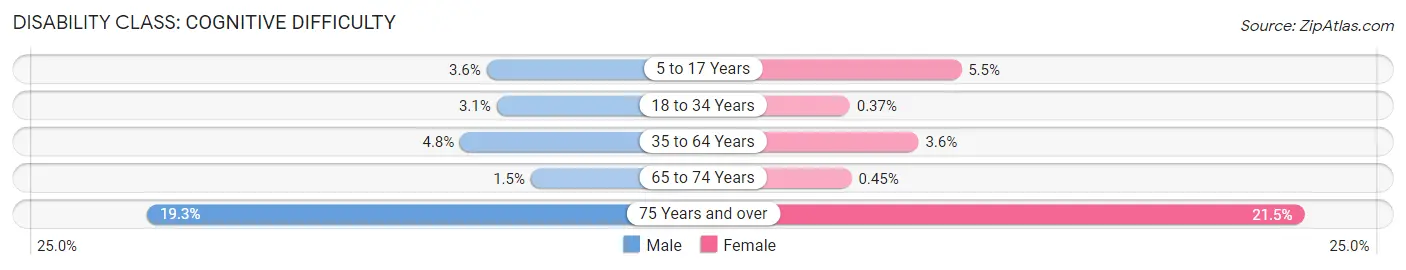
| Age Bracket | Male | Female |
| 5 to 17 Years | 138 (3.6%) | 233 (5.5%) |
| 18 to 34 Years | 125 (3.1%) | 15 (0.4%) |
| 35 to 64 Years | 250 (4.8%) | 176 (3.6%) |
| 65 to 74 Years | 16 (1.5%) | 5 (0.4%) |
| 75 Years and over | 40 (19.3%) | 141 (21.5%) |
Disability Class: Ambulatory Difficulty
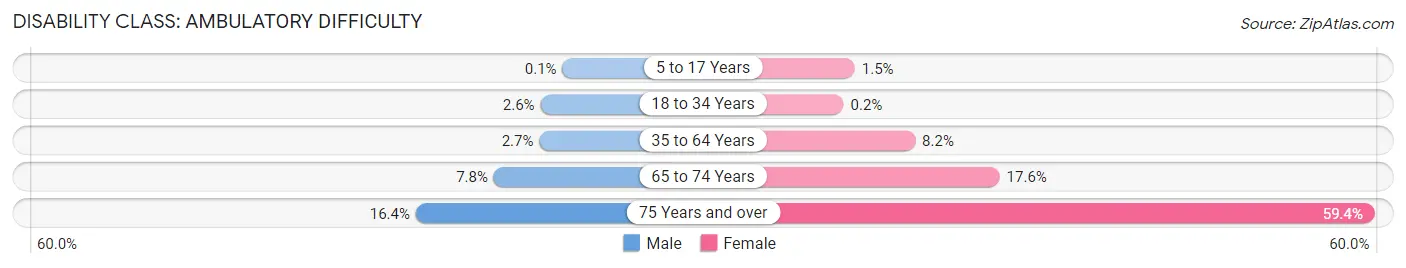
| Age Bracket | Male | Female |
| 5 to 17 Years | 4 (0.1%) | 61 (1.5%) |
| 18 to 34 Years | 103 (2.5%) | 8 (0.2%) |
| 35 to 64 Years | 140 (2.7%) | 404 (8.2%) |
| 65 to 74 Years | 82 (7.7%) | 195 (17.6%) |
| 75 Years and over | 34 (16.4%) | 390 (59.4%) |
Disability Class: Self-Care Difficulty
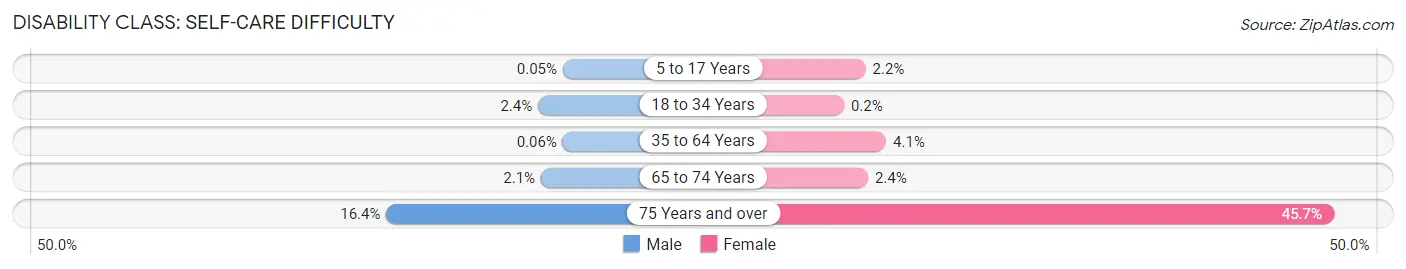
| Age Bracket | Male | Female |
| 5 to 17 Years | 2 (0.1%) | 93 (2.2%) |
| 18 to 34 Years | 95 (2.4%) | 8 (0.2%) |
| 35 to 64 Years | 3 (0.1%) | 203 (4.1%) |
| 65 to 74 Years | 22 (2.1%) | 27 (2.4%) |
| 75 Years and over | 34 (16.4%) | 300 (45.7%) |
Technology Access in Spring Valley
Computing Device Access in Spring Valley
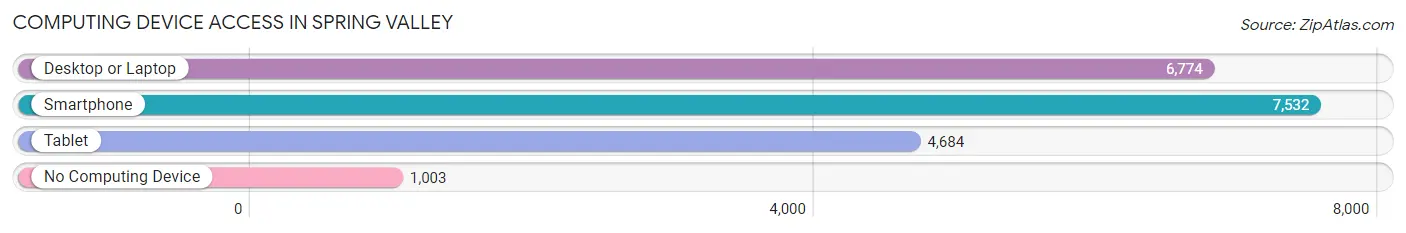
| Device Type | # Households | % Households |
| Desktop or Laptop | 6,774 | 71.1% |
| Smartphone | 7,532 | 79.1% |
| Tablet | 4,684 | 49.2% |
| No Computing Device | 1,003 | 10.5% |
| Total | 9,527 | 100.0% |
Internet Access in Spring Valley
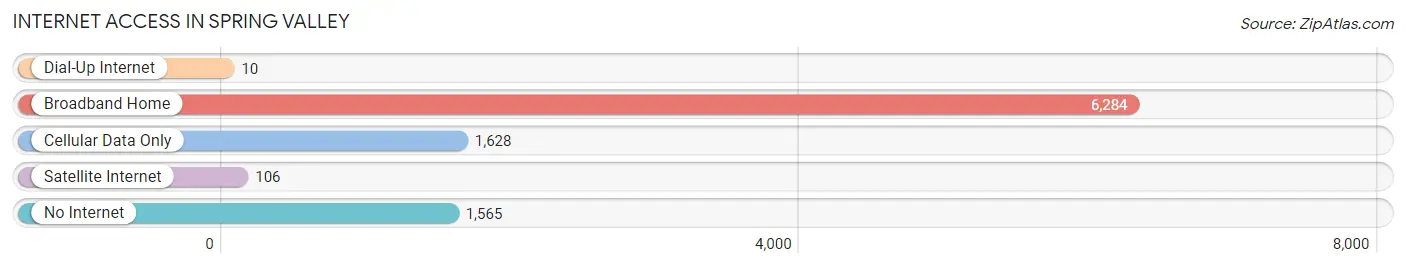
| Internet Type | # Households | % Households |
| Dial-Up Internet | 10 | 0.1% |
| Broadband Home | 6,284 | 66.0% |
| Cellular Data Only | 1,628 | 17.1% |
| Satellite Internet | 106 | 1.1% |
| No Internet | 1,565 | 16.4% |
| Total | 9,527 | 100.0% |
Spring Valley Summary
Introduction
Spring Valley is a village located in the town of Ramapo in Rockland County, New York. It is located approximately 25 miles northwest of New York City. The village has a population of approximately 32,000 people and is the most populous village in the state of New York. Spring Valley is a diverse community with a rich history, geography, economy, and demographics.
History
The area that is now Spring Valley was originally inhabited by the Munsee people, a branch of the Lenape Native Americans. The first European settlers arrived in the area in the late 1700s. The village was originally known as “Pascack” and was part of the larger town of Haverstraw. In 1858, the village was incorporated as the Village of Spring Valley.
The village grew rapidly in the late 19th and early 20th centuries, as it became a popular summer resort destination for wealthy New Yorkers. The village was home to several large resorts, including the Grand View Hotel, the Spring Valley Inn, and the Ramapo Valley House. The village also became a popular destination for Jewish immigrants from Eastern Europe, who established several synagogues and other Jewish institutions in the area.
Geography
Spring Valley is located in the Ramapo Mountains, which are part of the Appalachian Mountains. The village is located at an elevation of approximately 500 feet above sea level. The village is located on the western edge of the Hudson Valley, and is bordered by the towns of Ramapo, Clarkstown, and Haverstraw. The village is located approximately 25 miles northwest of New York City.
The village is located in a temperate climate zone, with hot summers and cold winters. The average annual temperature is approximately 50 degrees Fahrenheit. The average annual precipitation is approximately 45 inches.
Economy
The economy of Spring Valley is largely based on retail and services. The village is home to several large shopping centers, including the Spring Valley Marketplace and the Spring Valley Mall. The village is also home to several large employers, including the Montefiore Medical Center, the Spring Valley Post Office, and the Spring Valley Public Library.
The village is also home to several small businesses, including restaurants, bars, and other retail establishments. The village is also home to several manufacturing companies, including the Spring Valley Manufacturing Company and the Spring Valley Tool and Die Company.
Demographics
As of the 2010 census, the population of Spring Valley was 32,000. The population is largely composed of African Americans, Hispanics, and Asians. The median household income is approximately $50,000. The median age is approximately 33 years old.
Conclusion
Spring Valley is a diverse village located in Rockland County, New York. The village has a rich history, geography, economy, and demographics. The village is home to several large employers and small businesses, and is a popular destination for tourists and immigrants. The village is a vibrant and diverse community that is an important part of the Hudson Valley region.
Common Questions
What is Per Capita Income in Spring Valley?
Per Capita income in Spring Valley is $21,398.
What is the Median Family Income in Spring Valley?
Median Family Income in Spring Valley is $56,089.
What is the Median Household income in Spring Valley?
Median Household Income in Spring Valley is $50,749.
What is Income or Wage Gap in Spring Valley?
Income or Wage Gap in Spring Valley is 31.4%.
Women in Spring Valley earn 68.6 cents for every dollar earned by a man.
What is Family Income Deficit in Spring Valley?
Family Income Deficit in Spring Valley is $13,335.
Families that are below poverty line in Spring Valley earn $13,335 less on average than the poverty threshold level.
What is Inequality or Gini Index in Spring Valley?
Inequality or Gini Index in Spring Valley is 0.48.
What is the Total Population of Spring Valley?
Total Population of Spring Valley is 32,963.
What is the Total Male Population of Spring Valley?
Total Male Population of Spring Valley is 16,368.
What is the Total Female Population of Spring Valley?
Total Female Population of Spring Valley is 16,595.
What is the Ratio of Males per 100 Females in Spring Valley?
There are 98.63 Males per 100 Females in Spring Valley.
What is the Ratio of Females per 100 Males in Spring Valley?
There are 101.39 Females per 100 Males in Spring Valley.
What is the Median Population Age in Spring Valley?
Median Population Age in Spring Valley is 27.5 Years.
What is the Average Family Size in Spring Valley
Average Family Size in Spring Valley is 4.1 People.
What is the Average Household Size in Spring Valley
Average Household Size in Spring Valley is 3.5 People.
How Large is the Labor Force in Spring Valley?
There are 14,816 People in the Labor Forcein in Spring Valley.
What is the Percentage of People in the Labor Force in Spring Valley?
66.1% of People are in the Labor Force in Spring Valley.
What is the Unemployment Rate in Spring Valley?
Unemployment Rate in Spring Valley is 5.6%.