Lake Carmel, NY Map & Demographics
Lake Carmel Map
Lake Carmel Overview
$47,137
PER CAPITA INCOME
$130,096
AVG FAMILY INCOME
$102,125
AVG HOUSEHOLD INCOME
31.9%
WAGE / INCOME GAP [ % ]
68.1¢/ $1
WAGE / INCOME GAP [ $ ]
0.40
INEQUALITY / GINI INDEX
8,089
TOTAL POPULATION
4,053
MALE POPULATION
4,036
FEMALE POPULATION
100.42
MALES / 100 FEMALES
99.58
FEMALES / 100 MALES
42.9
MEDIAN AGE
3.3
AVG FAMILY SIZE
2.8
AVG HOUSEHOLD SIZE
4,641
LABOR FORCE [ PEOPLE ]
69.9%
PERCENT IN LABOR FORCE
3.7%
UNEMPLOYMENT RATE
Income in Lake Carmel
Income Overview in Lake Carmel
Per Capita Income in Lake Carmel is $47,137, while median incomes of families and households are $130,096 and $102,125 respectively.
| Characteristic | Number | Measure |
| Per Capita Income | 8,089 | $47,137 |
| Median Family Income | 2,097 | $130,096 |
| Mean Family Income | 2,097 | $136,437 |
| Median Household Income | 2,900 | $102,125 |
| Mean Household Income | 2,900 | $124,685 |
| Income Deficit | 2,097 | $0 |
| Wage / Income Gap (%) | 8,089 | 31.94% |
| Wage / Income Gap ($) | 8,089 | 68.06¢ per $1 |
| Gini / Inequality Index | 8,089 | 0.40 |
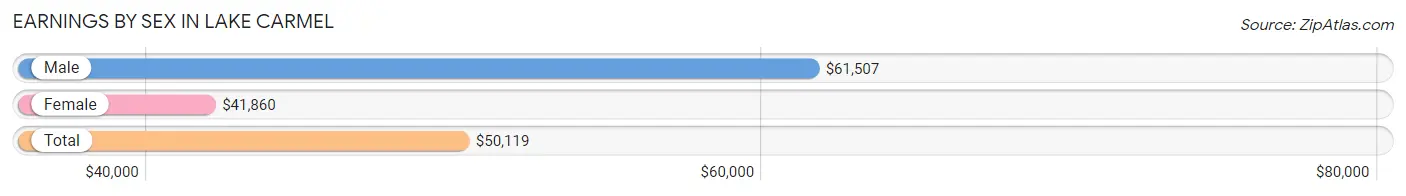
Earnings by Sex in Lake Carmel
Average Earnings in Lake Carmel are $50,119, $61,507 for men and $41,860 for women, a difference of 31.9%.
| Sex | Number | Average Earnings |
| Male | 2,525 (52.9%) | $61,507 |
| Female | 2,247 (47.1%) | $41,860 |
| Total | 4,772 (100.0%) | $50,119 |
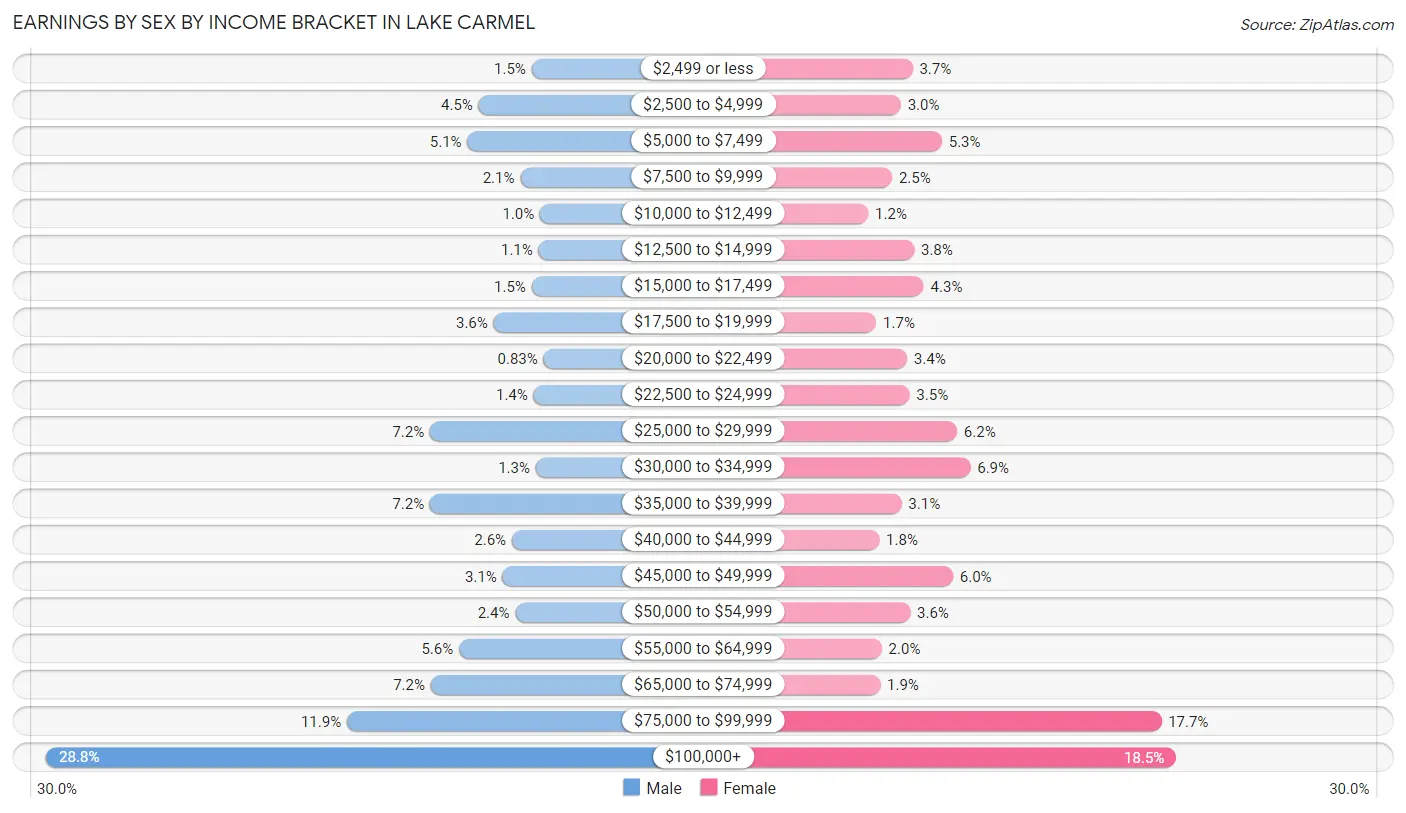
Earnings by Sex by Income Bracket in Lake Carmel
The most common earnings brackets in Lake Carmel are $100,000+ for men (727 | 28.8%) and $100,000+ for women (416 | 18.5%).
| Income | Male | Female |
| $2,499 or less | 38 (1.5%) | 83 (3.7%) |
| $2,500 to $4,999 | 113 (4.5%) | 68 (3.0%) |
| $5,000 to $7,499 | 129 (5.1%) | 120 (5.3%) |
| $7,500 to $9,999 | 54 (2.1%) | 57 (2.5%) |
| $10,000 to $12,499 | 26 (1.0%) | 27 (1.2%) |
| $12,500 to $14,999 | 28 (1.1%) | 85 (3.8%) |
| $15,000 to $17,499 | 38 (1.5%) | 97 (4.3%) |
| $17,500 to $19,999 | 92 (3.6%) | 37 (1.7%) |
| $20,000 to $22,499 | 21 (0.8%) | 76 (3.4%) |
| $22,500 to $24,999 | 35 (1.4%) | 79 (3.5%) |
| $25,000 to $29,999 | 182 (7.2%) | 139 (6.2%) |
| $30,000 to $34,999 | 32 (1.3%) | 156 (6.9%) |
| $35,000 to $39,999 | 182 (7.2%) | 69 (3.1%) |
| $40,000 to $44,999 | 66 (2.6%) | 41 (1.8%) |
| $45,000 to $49,999 | 79 (3.1%) | 134 (6.0%) |
| $50,000 to $54,999 | 61 (2.4%) | 80 (3.6%) |
| $55,000 to $64,999 | 141 (5.6%) | 44 (2.0%) |
| $65,000 to $74,999 | 181 (7.2%) | 42 (1.9%) |
| $75,000 to $99,999 | 300 (11.9%) | 397 (17.7%) |
| $100,000+ | 727 (28.8%) | 416 (18.5%) |
| Total | 2,525 (100.0%) | 2,247 (100.0%) |
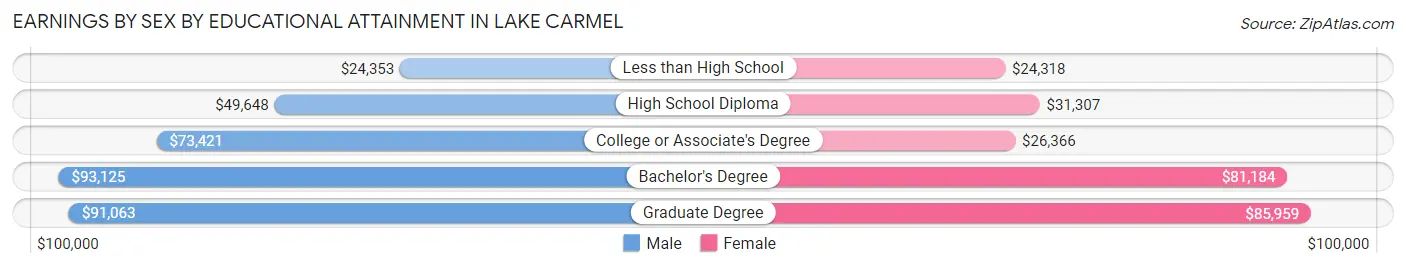
Earnings by Sex by Educational Attainment in Lake Carmel
Average earnings in Lake Carmel are $66,589 for men and $49,209 for women, a difference of 26.1%. Men with an educational attainment of bachelor's degree enjoy the highest average annual earnings of $93,125, while those with less than high school education earn the least with $24,353. Women with an educational attainment of graduate degree earn the most with the average annual earnings of $85,959, while those with less than high school education have the smallest earnings of $24,318.
| Educational Attainment | Male Income | Female Income |
| Less than High School | $24,353 | $24,318 |
| High School Diploma | $49,648 | $31,307 |
| College or Associate's Degree | $73,421 | $26,366 |
| Bachelor's Degree | $93,125 | $81,184 |
| Graduate Degree | $91,063 | $85,959 |
| Total | $66,589 | $49,209 |
Family Income in Lake Carmel
Family Income Brackets in Lake Carmel
According to the Lake Carmel family income data, there are 468 families falling into the $200,000+ income range, which is the most common income bracket and makes up 22.3% of all families. Conversely, the $25,000 to $34,999 income bracket is the least frequent group with only 23 families (1.1%) belonging to this category.
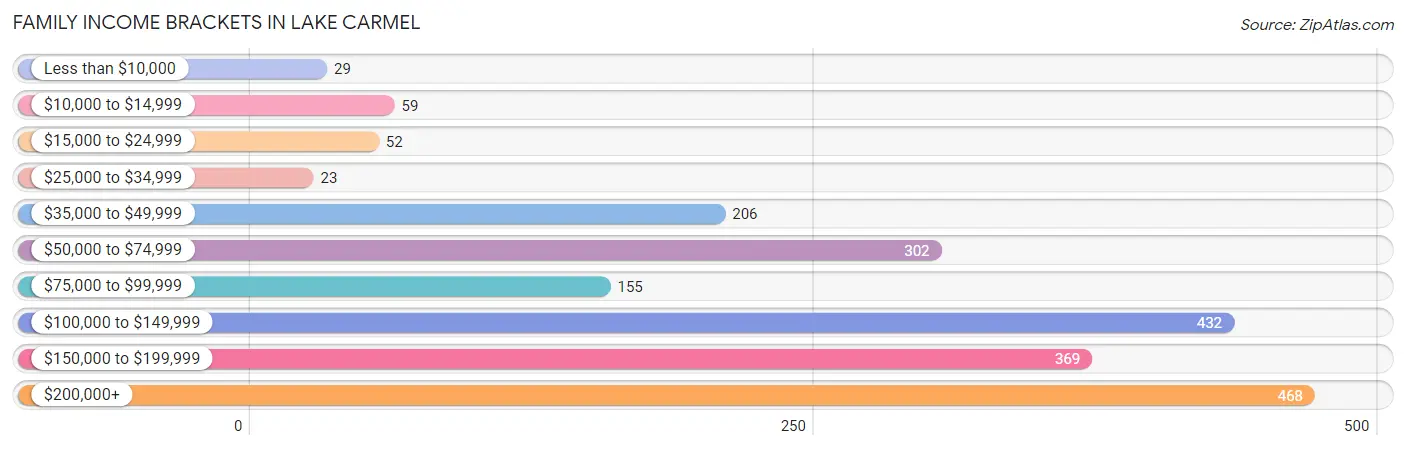
| Income Bracket | # Families | % Families |
| Less than $10,000 | 29 | 1.4% |
| $10,000 to $14,999 | 59 | 2.8% |
| $15,000 to $24,999 | 52 | 2.5% |
| $25,000 to $34,999 | 23 | 1.1% |
| $35,000 to $49,999 | 206 | 9.8% |
| $50,000 to $74,999 | 302 | 14.4% |
| $75,000 to $99,999 | 155 | 7.4% |
| $100,000 to $149,999 | 432 | 20.6% |
| $150,000 to $199,999 | 369 | 17.6% |
| $200,000+ | 468 | 22.3% |
Family Income by Famaliy Size in Lake Carmel
3-person families (565 | 26.9%) account for the highest median family income in Lake Carmel with $162,725 per family, while 3-person families (565 | 26.9%) have the highest median income of $54,242 per family member.
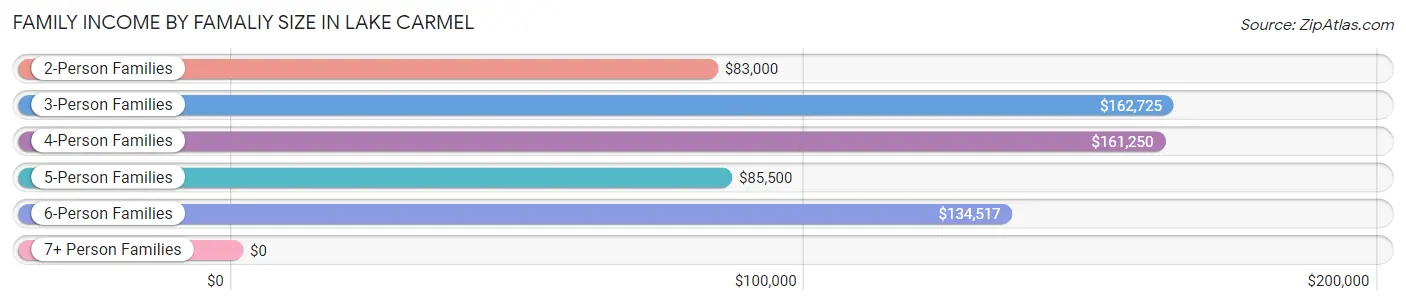
| Income Bracket | # Families | Median Income |
| 2-Person Families | 922 (44.0%) | $83,000 |
| 3-Person Families | 565 (26.9%) | $162,725 |
| 4-Person Families | 267 (12.7%) | $161,250 |
| 5-Person Families | 164 (7.8%) | $85,500 |
| 6-Person Families | 179 (8.5%) | $134,517 |
| 7+ Person Families | 0 (0.0%) | $0 |
| Total | 2,097 (100.0%) | $130,096 |
Family Income by Number of Earners in Lake Carmel
The median family income in Lake Carmel is $130,096, with families comprising 3+ earners (300) having the highest median family income of $160,227, while families with no earners (208) have the lowest median family income of $42,813, accounting for 14.3% and 9.9% of families, respectively.
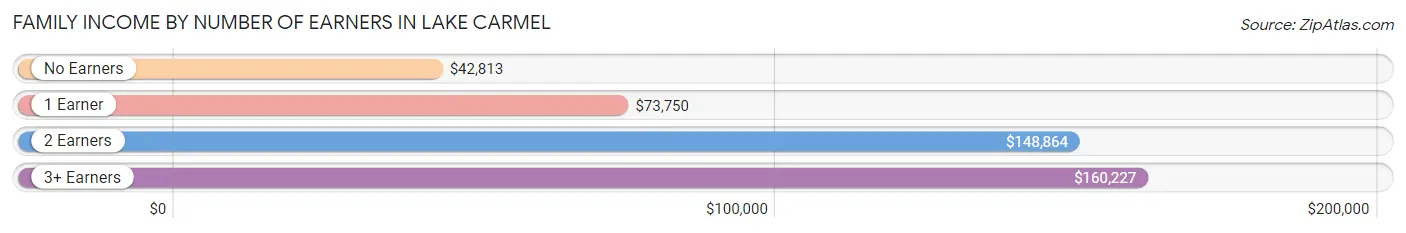
| Number of Earners | # Families | Median Income |
| No Earners | 208 (9.9%) | $42,813 |
| 1 Earner | 487 (23.2%) | $73,750 |
| 2 Earners | 1,102 (52.5%) | $148,864 |
| 3+ Earners | 300 (14.3%) | $160,227 |
| Total | 2,097 (100.0%) | $130,096 |
Household Income in Lake Carmel
Household Income Brackets in Lake Carmel
With 577 households falling in the category, the $200,000+ income range is the most frequent in Lake Carmel, accounting for 19.9% of all households. In contrast, only 17 households (0.6%) fall into the less than $10,000 income bracket, making it the least populous group.
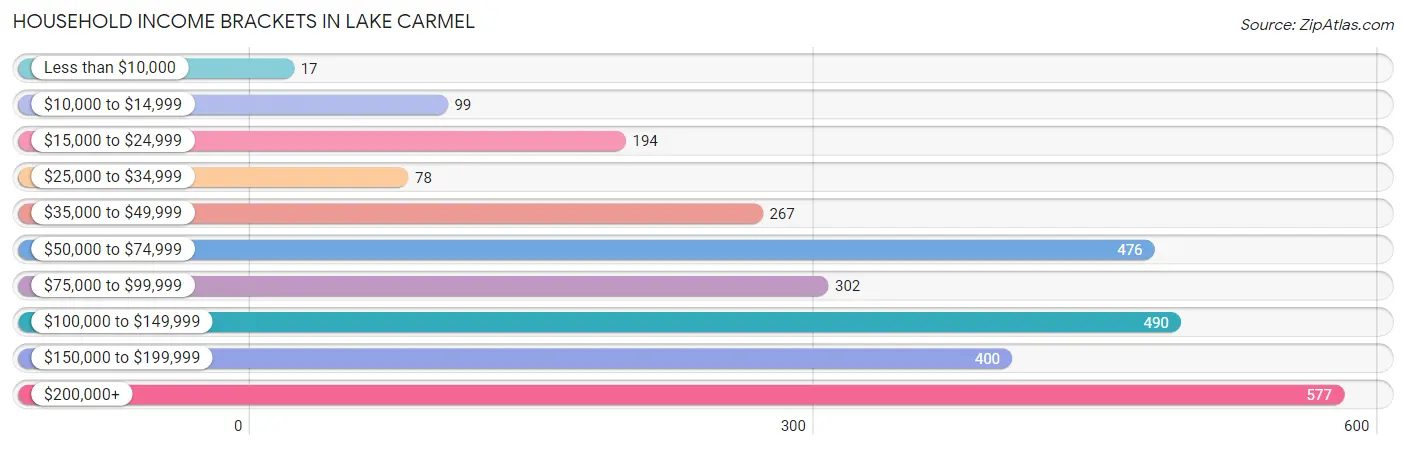
| Income Bracket | # Households | % Households |
| Less than $10,000 | 17 | 0.6% |
| $10,000 to $14,999 | 99 | 3.4% |
| $15,000 to $24,999 | 194 | 6.7% |
| $25,000 to $34,999 | 78 | 2.7% |
| $35,000 to $49,999 | 267 | 9.2% |
| $50,000 to $74,999 | 476 | 16.4% |
| $75,000 to $99,999 | 302 | 10.4% |
| $100,000 to $149,999 | 490 | 16.9% |
| $150,000 to $199,999 | 400 | 13.8% |
| $200,000+ | 577 | 19.9% |
Household Income by Householder Age in Lake Carmel
The median household income in Lake Carmel is $102,125, with the highest median household income of $134,574 found in the 25 to 44 years age bracket for the primary householder. A total of 681 households (23.5%) fall into this category. Meanwhile, the 15 to 24 years age bracket for the primary householder has the lowest median household income of $0, with 10 households (0.3%) in this group.
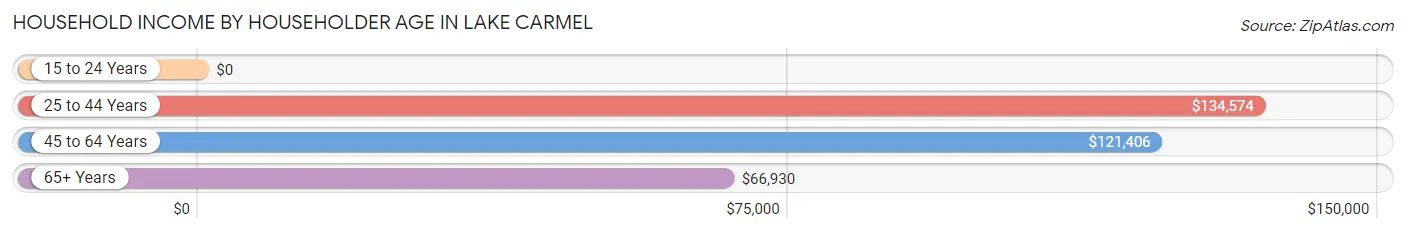
| Income Bracket | # Households | Median Income |
| 15 to 24 Years | 10 (0.3%) | $0 |
| 25 to 44 Years | 681 (23.5%) | $134,574 |
| 45 to 64 Years | 1,325 (45.7%) | $121,406 |
| 65+ Years | 884 (30.5%) | $66,930 |
| Total | 2,900 (100.0%) | $102,125 |
Poverty in Lake Carmel
Income Below Poverty by Sex and Age in Lake Carmel
With 7.4% poverty level for males and 7.6% for females among the residents of Lake Carmel, 15 year old males and 35 to 44 year old females are the most vulnerable to poverty, with 19 males (21.6%) and 77 females (15.8%) in their respective age groups living below the poverty level.
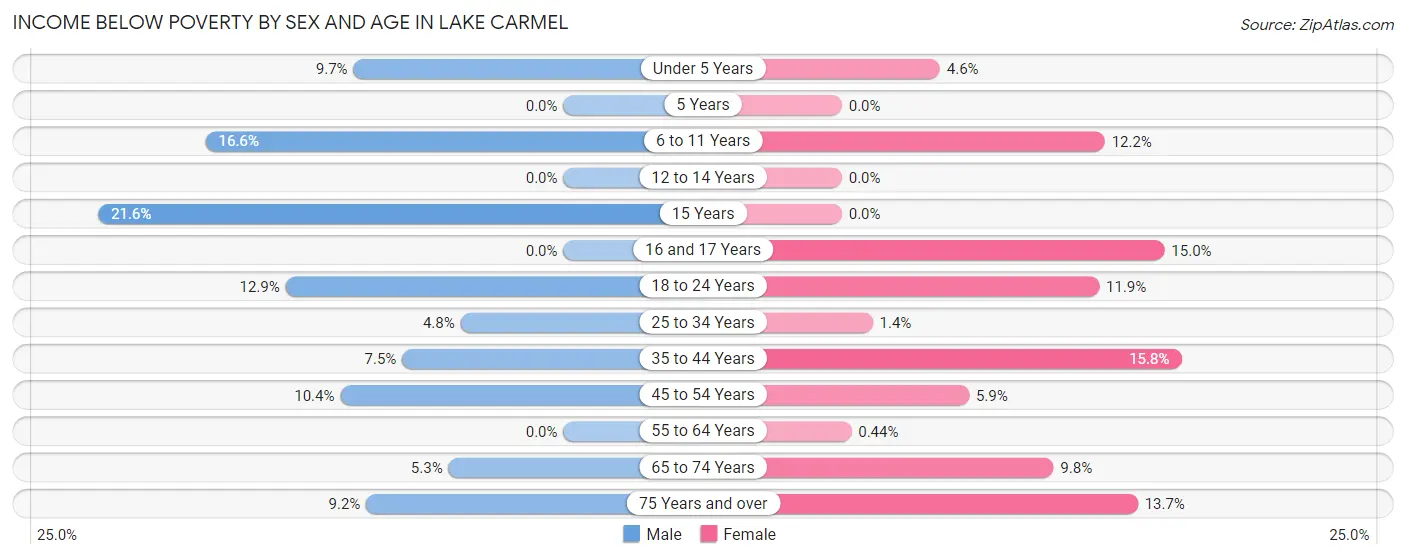
| Age Bracket | Male | Female |
| Under 5 Years | 19 (9.7%) | 10 (4.5%) |
| 5 Years | 0 (0.0%) | 0 (0.0%) |
| 6 to 11 Years | 39 (16.6%) | 40 (12.2%) |
| 12 to 14 Years | 0 (0.0%) | 0 (0.0%) |
| 15 Years | 19 (21.6%) | 0 (0.0%) |
| 16 and 17 Years | 0 (0.0%) | 22 (15.0%) |
| 18 to 24 Years | 33 (12.9%) | 32 (11.9%) |
| 25 to 34 Years | 21 (4.8%) | 8 (1.4%) |
| 35 to 44 Years | 45 (7.5%) | 77 (15.8%) |
| 45 to 54 Years | 79 (10.3%) | 38 (5.9%) |
| 55 to 64 Years | 0 (0.0%) | 2 (0.4%) |
| 65 to 74 Years | 18 (5.3%) | 33 (9.8%) |
| 75 Years and over | 29 (9.1%) | 46 (13.7%) |
| Total | 302 (7.4%) | 308 (7.6%) |
Income Above Poverty by Sex and Age in Lake Carmel
According to the poverty statistics in Lake Carmel, males aged 5 years and females aged 5 years are the age groups that are most secure financially, with 100.0% of males and 100.0% of females in these age groups living above the poverty line.
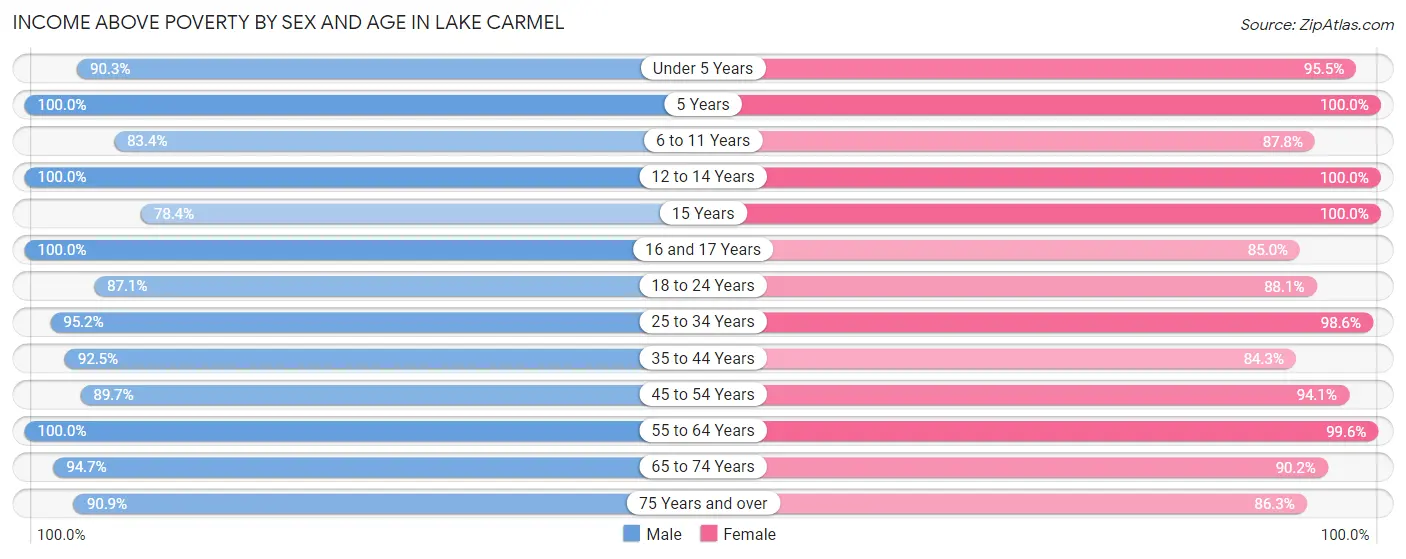
| Age Bracket | Male | Female |
| Under 5 Years | 176 (90.3%) | 210 (95.5%) |
| 5 Years | 15 (100.0%) | 41 (100.0%) |
| 6 to 11 Years | 196 (83.4%) | 288 (87.8%) |
| 12 to 14 Years | 114 (100.0%) | 163 (100.0%) |
| 15 Years | 69 (78.4%) | 49 (100.0%) |
| 16 and 17 Years | 118 (100.0%) | 125 (85.0%) |
| 18 to 24 Years | 223 (87.1%) | 236 (88.1%) |
| 25 to 34 Years | 419 (95.2%) | 552 (98.6%) |
| 35 to 44 Years | 557 (92.5%) | 412 (84.3%) |
| 45 to 54 Years | 684 (89.6%) | 606 (94.1%) |
| 55 to 64 Years | 572 (100.0%) | 453 (99.6%) |
| 65 to 74 Years | 320 (94.7%) | 303 (90.2%) |
| 75 Years and over | 288 (90.8%) | 289 (86.3%) |
| Total | 3,751 (92.5%) | 3,727 (92.4%) |
Income Below Poverty Among Married-Couple Families in Lake Carmel
The poverty statistics for married-couple families in Lake Carmel show that 5.7% or 96 of the total 1,696 families live below the poverty line. Families with 3 or 4 children have the highest poverty rate of 24.5%, comprising of 37 families. On the other hand, families with no children have the lowest poverty rate of 2.9%, which includes 27 families.
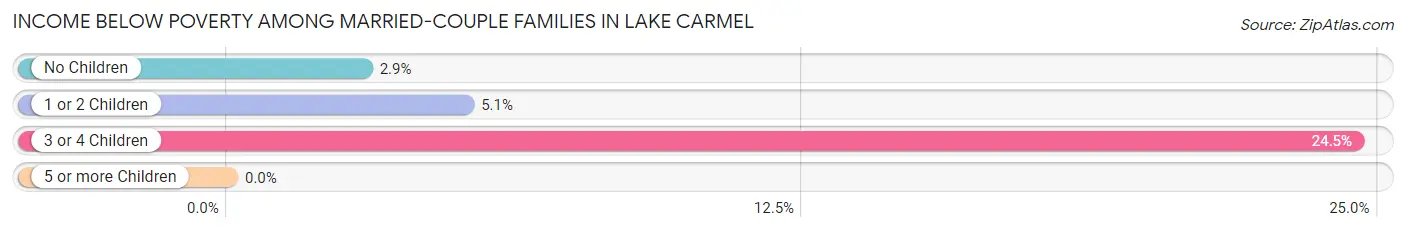
| Children | Above Poverty | Below Poverty |
| No Children | 896 (97.1%) | 27 (2.9%) |
| 1 or 2 Children | 590 (94.9%) | 32 (5.1%) |
| 3 or 4 Children | 114 (75.5%) | 37 (24.5%) |
| 5 or more Children | 0 (0.0%) | 0 (0.0%) |
| Total | 1,600 (94.3%) | 96 (5.7%) |
Income Below Poverty Among Single-Parent Households in Lake Carmel
According to the poverty data in Lake Carmel, 9.5% or 18 single-father households and 11.8% or 25 single-mother households are living below the poverty line. Among single-father households, those with no children have the highest poverty rate, with 18 households (13.3%) experiencing poverty. Likewise, among single-mother households, those with 1 or 2 children have the highest poverty rate, with 21 households (13.6%) falling below the poverty line.
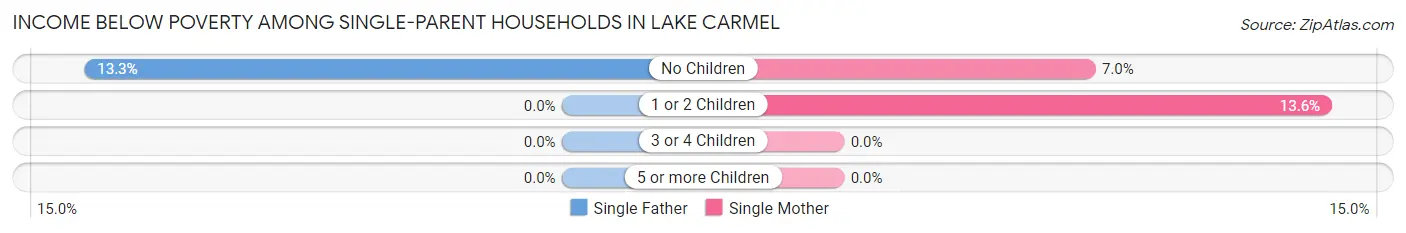
| Children | Single Father | Single Mother |
| No Children | 18 (13.3%) | 4 (7.0%) |
| 1 or 2 Children | 0 (0.0%) | 21 (13.6%) |
| 3 or 4 Children | 0 (0.0%) | 0 (0.0%) |
| 5 or more Children | 0 (0.0%) | 0 (0.0%) |
| Total | 18 (9.5%) | 25 (11.8%) |
Income Below Poverty Among Married-Couple vs Single-Parent Households in Lake Carmel
The poverty data for Lake Carmel shows that 96 of the married-couple family households (5.7%) and 43 of the single-parent households (10.7%) are living below the poverty level. Within the married-couple family households, those with 3 or 4 children have the highest poverty rate, with 37 households (24.5%) falling below the poverty line. Among the single-parent households, those with no children have the highest poverty rate, with 22 household (11.5%) living below poverty.
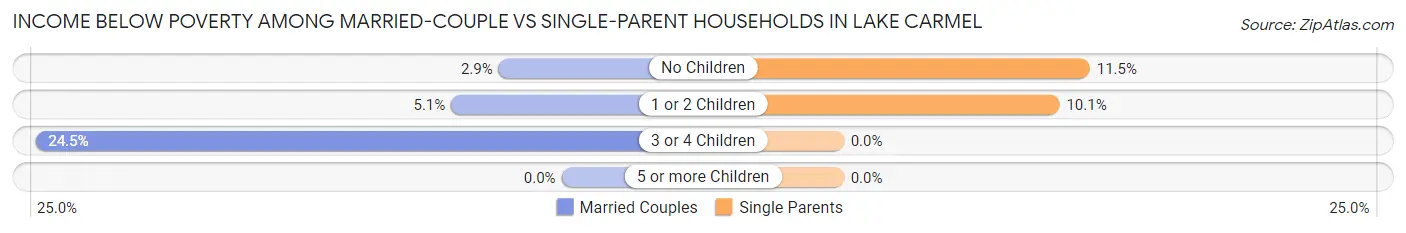
| Children | Married-Couple Families | Single-Parent Households |
| No Children | 27 (2.9%) | 22 (11.5%) |
| 1 or 2 Children | 32 (5.1%) | 21 (10.1%) |
| 3 or 4 Children | 37 (24.5%) | 0 (0.0%) |
| 5 or more Children | 0 (0.0%) | 0 (0.0%) |
| Total | 96 (5.7%) | 43 (10.7%) |
Race in Lake Carmel
The most populous races in Lake Carmel are White / Caucasian (5,538 | 68.5%), Hispanic or Latino (2,188 | 27.1%), and Some other Race (1,164 | 14.4%).
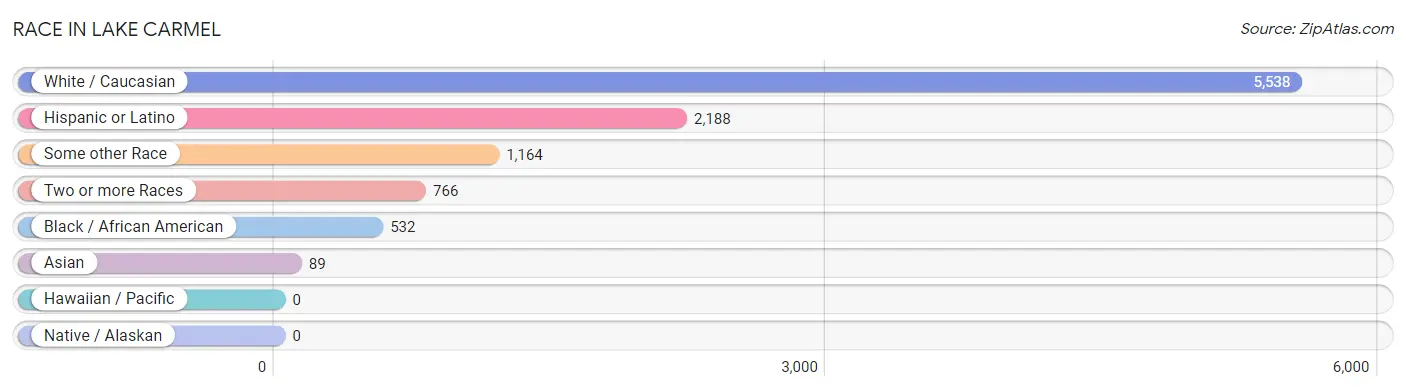
| Race | # Population | % Population |
| Asian | 89 | 1.1% |
| Black / African American | 532 | 6.6% |
| Hawaiian / Pacific | 0 | 0.0% |
| Hispanic or Latino | 2,188 | 27.1% |
| Native / Alaskan | 0 | 0.0% |
| White / Caucasian | 5,538 | 68.5% |
| Two or more Races | 766 | 9.5% |
| Some other Race | 1,164 | 14.4% |
| Total | 8,089 | 100.0% |
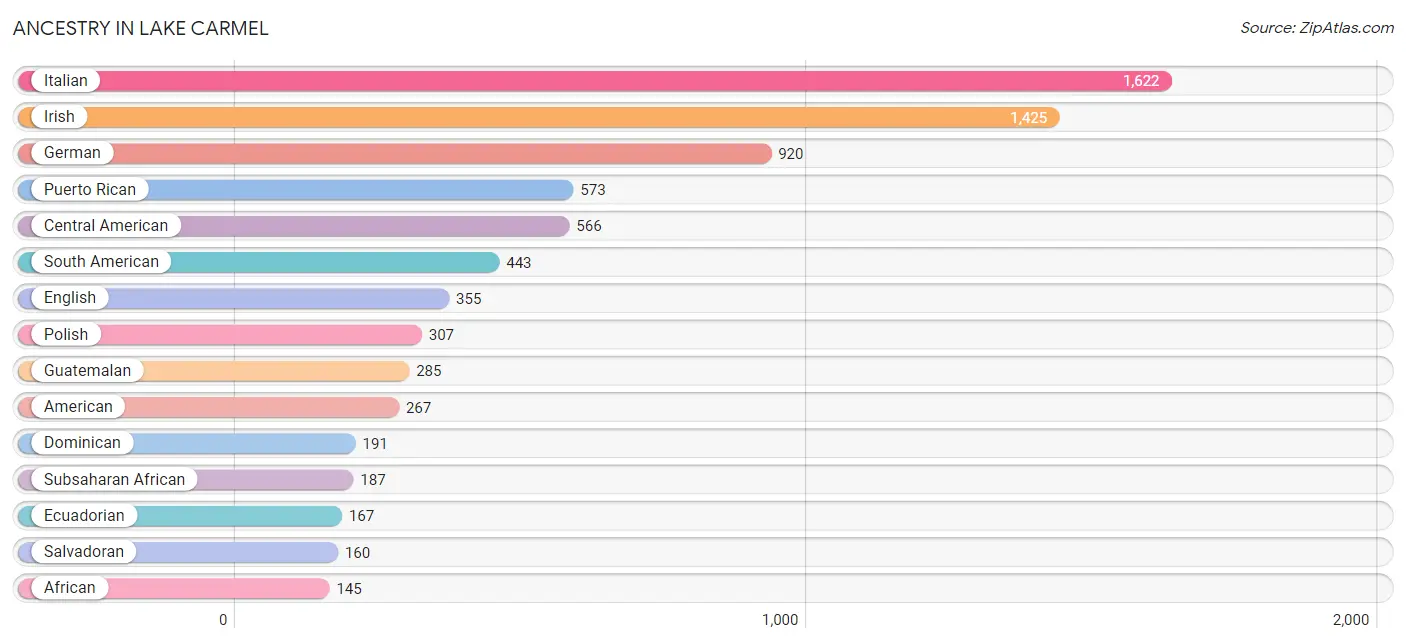
Ancestry in Lake Carmel
The most populous ancestries reported in Lake Carmel are Italian (1,622 | 20.1%), Irish (1,425 | 17.6%), German (920 | 11.4%), Puerto Rican (573 | 7.1%), and Central American (566 | 7.0%), together accounting for 63.1% of all Lake Carmel residents.
| Ancestry | # Population | % Population |
| African | 145 | 1.8% |
| Albanian | 62 | 0.8% |
| American | 267 | 3.3% |
| Arab | 21 | 0.3% |
| Austrian | 45 | 0.6% |
| Brazilian | 76 | 0.9% |
| British | 32 | 0.4% |
| Canadian | 104 | 1.3% |
| Central American | 566 | 7.0% |
| Chilean | 55 | 0.7% |
| Chippewa | 21 | 0.3% |
| Colombian | 47 | 0.6% |
| Czechoslovakian | 20 | 0.3% |
| Danish | 13 | 0.2% |
| Dominican | 191 | 2.4% |
| Dutch | 63 | 0.8% |
| Eastern European | 18 | 0.2% |
| Ecuadorian | 167 | 2.1% |
| English | 355 | 4.4% |
| Estonian | 13 | 0.2% |
| European | 97 | 1.2% |
| Finnish | 13 | 0.2% |
| French | 69 | 0.9% |
| French Canadian | 28 | 0.4% |
| German | 920 | 11.4% |
| Greek | 30 | 0.4% |
| Guatemalan | 285 | 3.5% |
| Honduran | 121 | 1.5% |
| Hungarian | 19 | 0.2% |
| Indian (Asian) | 59 | 0.7% |
| Irish | 1,425 | 17.6% |
| Italian | 1,622 | 20.1% |
| Jordanian | 10 | 0.1% |
| Korean | 12 | 0.2% |
| Lithuanian | 17 | 0.2% |
| Mexican | 134 | 1.7% |
| Nigerian | 42 | 0.5% |
| Norwegian | 8 | 0.1% |
| Peruvian | 145 | 1.8% |
| Polish | 307 | 3.8% |
| Portuguese | 78 | 1.0% |
| Puerto Rican | 573 | 7.1% |
| Romanian | 6 | 0.1% |
| Russian | 56 | 0.7% |
| Salvadoran | 160 | 2.0% |
| Scotch-Irish | 41 | 0.5% |
| Scottish | 30 | 0.4% |
| Sierra Leonean | 42 | 0.5% |
| Slovak | 5 | 0.1% |
| South American | 443 | 5.5% |
| Spaniard | 78 | 1.0% |
| Spanish | 32 | 0.4% |
| Subsaharan African | 187 | 2.3% |
| Swedish | 43 | 0.5% |
| Swiss | 25 | 0.3% |
| Syrian | 11 | 0.1% |
| Thai | 27 | 0.3% |
| Trinidadian and Tobagonian | 12 | 0.2% |
| Ukrainian | 50 | 0.6% |
| Welsh | 29 | 0.4% | View All 60 Rows |
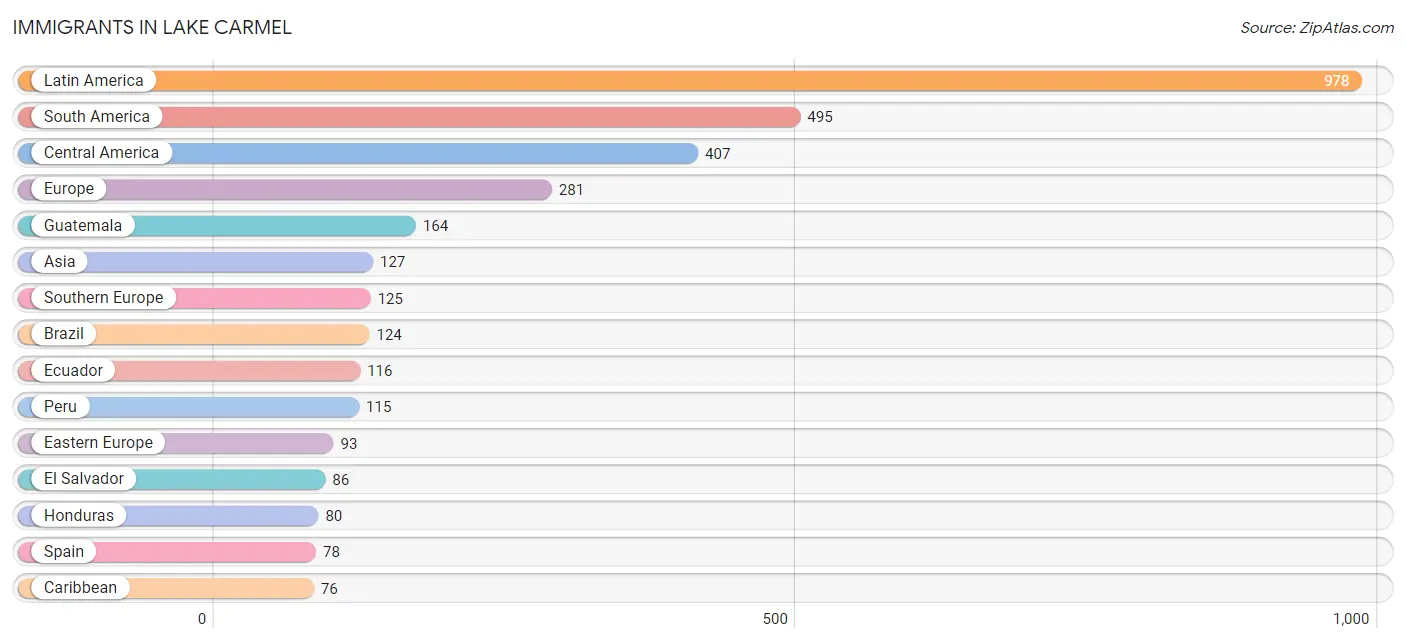
Immigrants in Lake Carmel
The most numerous immigrant groups reported in Lake Carmel came from Latin America (978 | 12.1%), South America (495 | 6.1%), Central America (407 | 5.0%), Europe (281 | 3.5%), and Guatemala (164 | 2.0%), together accounting for 28.7% of all Lake Carmel residents.
| Immigration Origin | # Population | % Population |
| Africa | 72 | 0.9% |
| Asia | 127 | 1.6% |
| Brazil | 124 | 1.5% |
| Canada | 9 | 0.1% |
| Caribbean | 76 | 0.9% |
| Central America | 407 | 5.0% |
| Chile | 65 | 0.8% |
| China | 54 | 0.7% |
| Colombia | 75 | 0.9% |
| Dominican Republic | 64 | 0.8% |
| Eastern Africa | 36 | 0.4% |
| Eastern Asia | 54 | 0.7% |
| Eastern Europe | 93 | 1.1% |
| Ecuador | 116 | 1.4% |
| El Salvador | 86 | 1.1% |
| England | 8 | 0.1% |
| Ethiopia | 36 | 0.4% |
| Europe | 281 | 3.5% |
| Germany | 9 | 0.1% |
| Guatemala | 164 | 2.0% |
| Honduras | 80 | 1.0% |
| Hong Kong | 14 | 0.2% |
| India | 27 | 0.3% |
| Ireland | 37 | 0.5% |
| Italy | 47 | 0.6% |
| Jordan | 10 | 0.1% |
| Latin America | 978 | 12.1% |
| Latvia | 8 | 0.1% |
| Mexico | 61 | 0.7% |
| Northern Europe | 54 | 0.7% |
| Panama | 16 | 0.2% |
| Peru | 115 | 1.4% |
| Philippines | 31 | 0.4% |
| Poland | 35 | 0.4% |
| Sierra Leone | 36 | 0.4% |
| South America | 495 | 6.1% |
| South Central Asia | 27 | 0.3% |
| South Eastern Asia | 36 | 0.4% |
| Southern Europe | 125 | 1.5% |
| Spain | 78 | 1.0% |
| Trinidad and Tobago | 12 | 0.2% |
| Western Africa | 36 | 0.4% |
| Western Asia | 10 | 0.1% |
| Western Europe | 9 | 0.1% | View All 44 Rows |
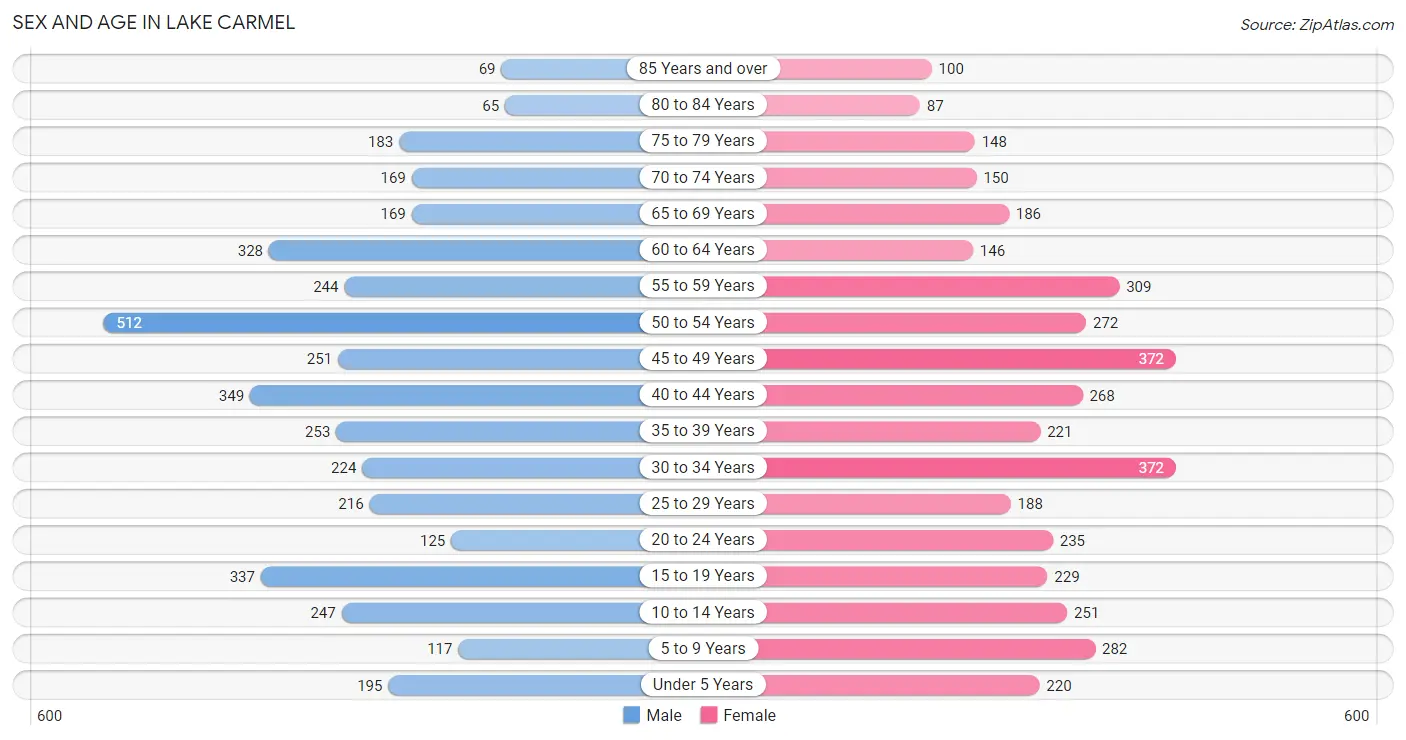
Sex and Age in Lake Carmel
Sex and Age in Lake Carmel
The most populous age groups in Lake Carmel are 50 to 54 Years (512 | 12.6%) for men and 30 to 34 Years (372 | 9.2%) for women.
| Age Bracket | Male | Female |
| Under 5 Years | 195 (4.8%) | 220 (5.4%) |
| 5 to 9 Years | 117 (2.9%) | 282 (7.0%) |
| 10 to 14 Years | 247 (6.1%) | 251 (6.2%) |
| 15 to 19 Years | 337 (8.3%) | 229 (5.7%) |
| 20 to 24 Years | 125 (3.1%) | 235 (5.8%) |
| 25 to 29 Years | 216 (5.3%) | 188 (4.7%) |
| 30 to 34 Years | 224 (5.5%) | 372 (9.2%) |
| 35 to 39 Years | 253 (6.2%) | 221 (5.5%) |
| 40 to 44 Years | 349 (8.6%) | 268 (6.6%) |
| 45 to 49 Years | 251 (6.2%) | 372 (9.2%) |
| 50 to 54 Years | 512 (12.6%) | 272 (6.7%) |
| 55 to 59 Years | 244 (6.0%) | 309 (7.7%) |
| 60 to 64 Years | 328 (8.1%) | 146 (3.6%) |
| 65 to 69 Years | 169 (4.2%) | 186 (4.6%) |
| 70 to 74 Years | 169 (4.2%) | 150 (3.7%) |
| 75 to 79 Years | 183 (4.5%) | 148 (3.7%) |
| 80 to 84 Years | 65 (1.6%) | 87 (2.2%) |
| 85 Years and over | 69 (1.7%) | 100 (2.5%) |
| Total | 4,053 (100.0%) | 4,036 (100.0%) |
Families and Households in Lake Carmel
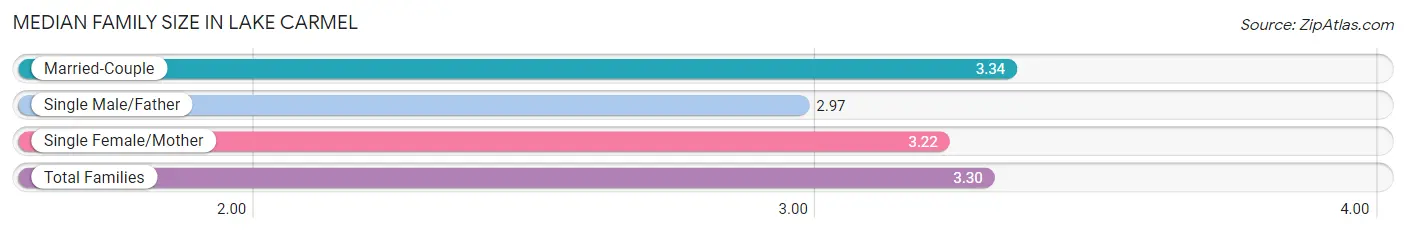
Median Family Size in Lake Carmel
The median family size in Lake Carmel is 3.30 persons per family, with married-couple families (1,696 | 80.9%) accounting for the largest median family size of 3.34 persons per family. On the other hand, single male/father families (190 | 9.1%) represent the smallest median family size with 2.97 persons per family.
| Family Type | # Families | Family Size |
| Married-Couple | 1,696 (80.9%) | 3.34 |
| Single Male/Father | 190 (9.1%) | 2.97 |
| Single Female/Mother | 211 (10.1%) | 3.22 |
| Total Families | 2,097 (100.0%) | 3.30 |
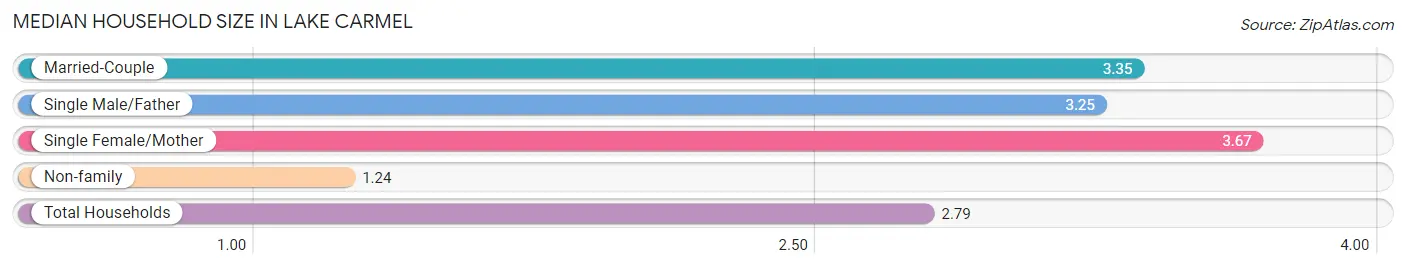
Median Household Size in Lake Carmel
The median household size in Lake Carmel is 2.79 persons per household, with single female/mother households (211 | 7.3%) accounting for the largest median household size of 3.67 persons per household. non-family households (803 | 27.7%) represent the smallest median household size with 1.24 persons per household.
| Household Type | # Households | Household Size |
| Married-Couple | 1,696 (58.5%) | 3.35 |
| Single Male/Father | 190 (6.6%) | 3.25 |
| Single Female/Mother | 211 (7.3%) | 3.67 |
| Non-family | 803 (27.7%) | 1.24 |
| Total Households | 2,900 (100.0%) | 2.79 |
Household Size by Marriage Status in Lake Carmel
Out of a total of 2,900 households in Lake Carmel, 2,097 (72.3%) are family households, while 803 (27.7%) are nonfamily households. The most numerous type of family households are 2-person households, comprising 819, and the most common type of nonfamily households are 1-person households, comprising 676.
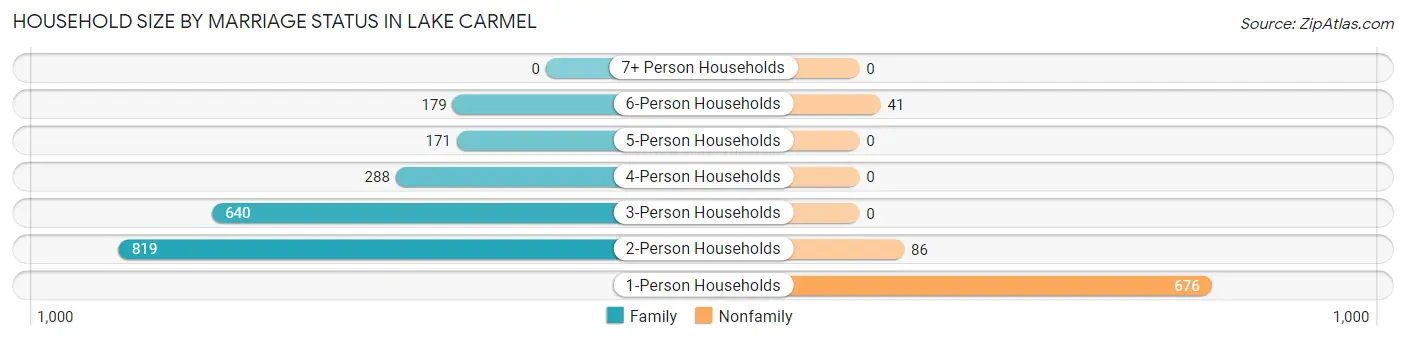
| Household Size | Family Households | Nonfamily Households |
| 1-Person Households | - | 676 (23.3%) |
| 2-Person Households | 819 (28.2%) | 86 (3.0%) |
| 3-Person Households | 640 (22.1%) | 0 (0.0%) |
| 4-Person Households | 288 (9.9%) | 0 (0.0%) |
| 5-Person Households | 171 (5.9%) | 0 (0.0%) |
| 6-Person Households | 179 (6.2%) | 41 (1.4%) |
| 7+ Person Households | 0 (0.0%) | 0 (0.0%) |
| Total | 2,097 (72.3%) | 803 (27.7%) |
Female Fertility in Lake Carmel
Fertility by Age in Lake Carmel
Average fertility rate in Lake Carmel is 71.0 births per 1,000 women. Women in the age bracket of 20 to 34 years have the highest fertility rate with 109.0 births per 1,000 women. Women in the age bracket of 20 to 34 years acount for 61.7% of all women with births.
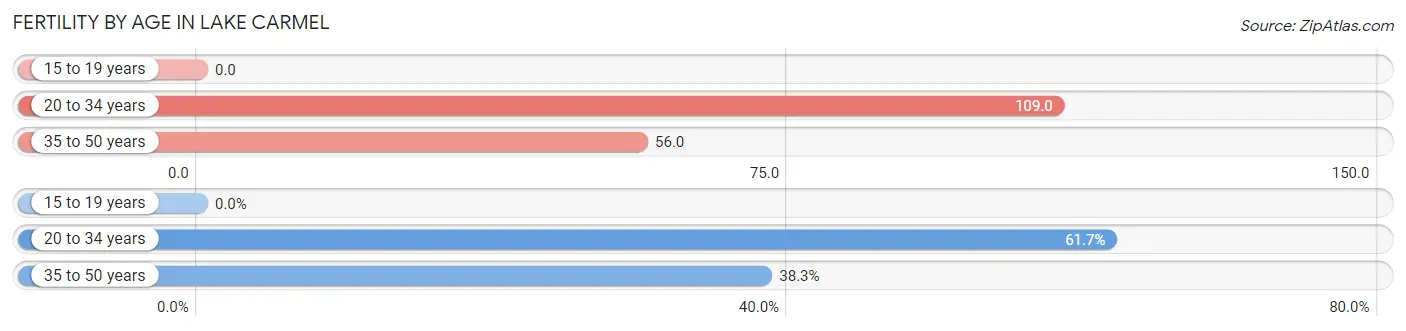
| Age Bracket | Women with Births | Births / 1,000 Women |
| 15 to 19 years | 0 (0.0%) | 0.0 |
| 20 to 34 years | 87 (61.7%) | 109.0 |
| 35 to 50 years | 54 (38.3%) | 56.0 |
| Total | 141 (100.0%) | 71.0 |
Fertility by Age by Marriage Status in Lake Carmel
92.9% of women with births (141) in Lake Carmel are married. The highest percentage of unmarried women with births falls into 20 to 34 years age bracket with 11.5% of them unmarried at the time of birth, while the lowest percentage of unmarried women with births belong to 35 to 50 years age bracket with 0.0% of them unmarried.
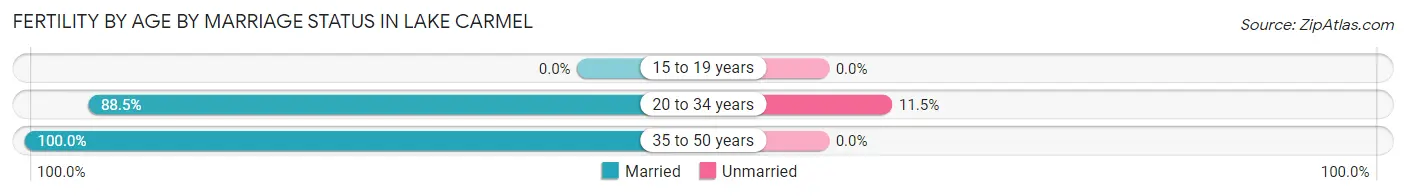
| Age Bracket | Married | Unmarried |
| 15 to 19 years | 0 (0.0%) | 0 (0.0%) |
| 20 to 34 years | 77 (88.5%) | 10 (11.5%) |
| 35 to 50 years | 54 (100.0%) | 0 (0.0%) |
| Total | 131 (92.9%) | 10 (7.1%) |
Fertility by Education in Lake Carmel
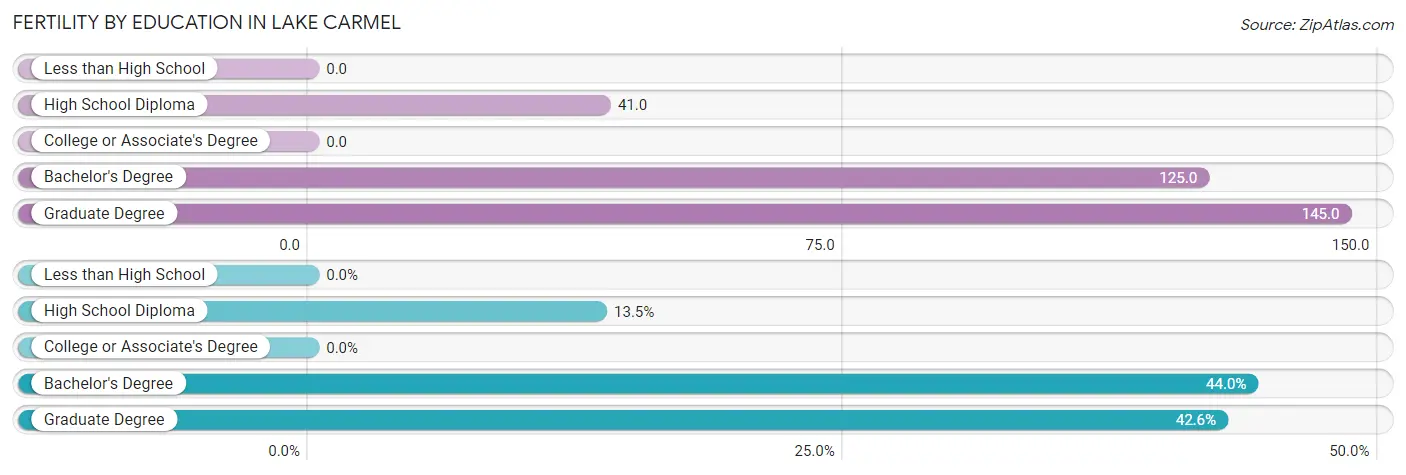
| Educational Attainment | Women with Births | Births / 1,000 Women |
| Less than High School | 0 (0.0%) | 0.0 |
| High School Diploma | 19 (13.5%) | 41.0 |
| College or Associate's Degree | 0 (0.0%) | 0.0 |
| Bachelor's Degree | 62 (44.0%) | 125.0 |
| Graduate Degree | 60 (42.5%) | 145.0 |
| Total | 141 (100.0%) | 71.0 |
Fertility by Education by Marriage Status in Lake Carmel
7.1% of women with births in Lake Carmel are unmarried. Women with the educational attainment of bachelor's degree are most likely to be married with 100.0% of them married at childbirth, while women with the educational attainment of high school diploma are least likely to be married with 52.6% of them unmarried at childbirth.
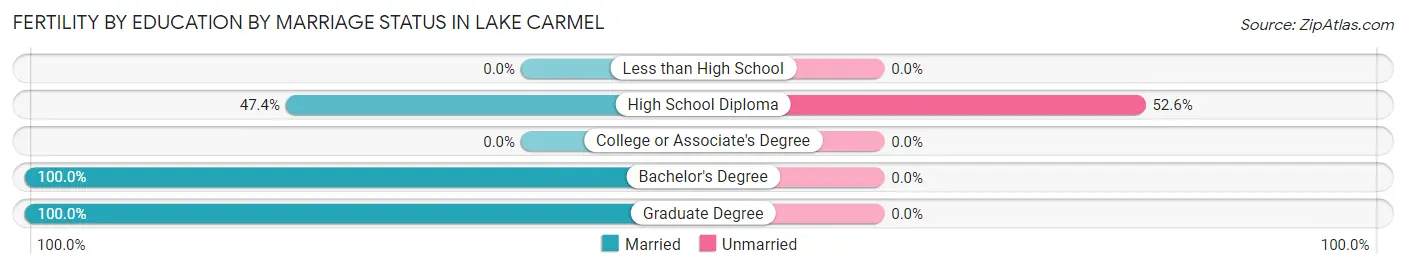
| Educational Attainment | Married | Unmarried |
| Less than High School | 0 (0.0%) | 0 (0.0%) |
| High School Diploma | 9 (47.4%) | 10 (52.6%) |
| College or Associate's Degree | 0 (0.0%) | 0 (0.0%) |
| Bachelor's Degree | 62 (100.0%) | 0 (0.0%) |
| Graduate Degree | 60 (100.0%) | 0 (0.0%) |
| Total | 131 (92.9%) | 10 (7.1%) |
Employment Characteristics in Lake Carmel
Employment by Class of Employer in Lake Carmel
Among the 4,362 employed individuals in Lake Carmel, private company employees (2,659 | 61.0%), local government employees (653 | 15.0%), and not-for-profit organizations (406 | 9.3%) make up the most common classes of employment.
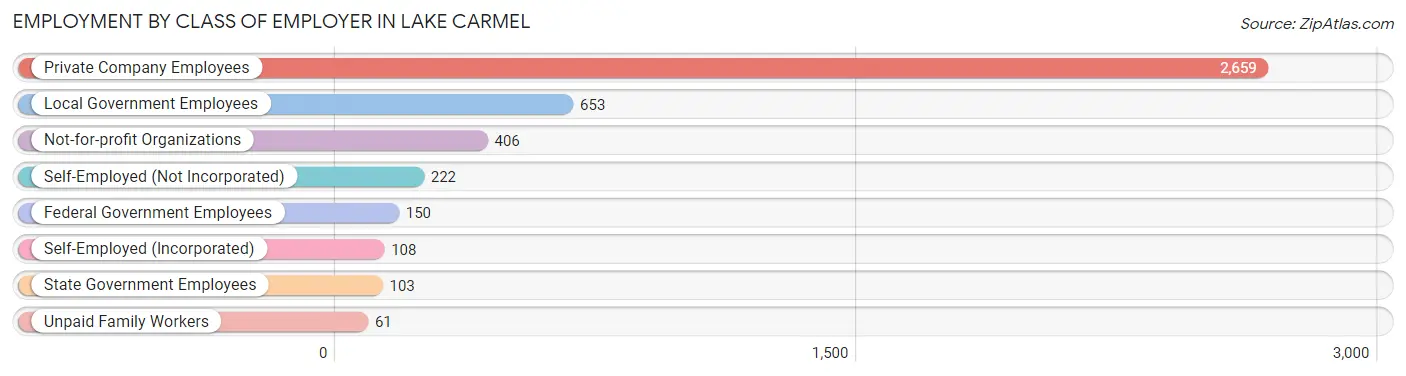
| Employer Class | # Employees | % Employees |
| Private Company Employees | 2,659 | 61.0% |
| Self-Employed (Incorporated) | 108 | 2.5% |
| Self-Employed (Not Incorporated) | 222 | 5.1% |
| Not-for-profit Organizations | 406 | 9.3% |
| Local Government Employees | 653 | 15.0% |
| State Government Employees | 103 | 2.4% |
| Federal Government Employees | 150 | 3.4% |
| Unpaid Family Workers | 61 | 1.4% |
| Total | 4,362 | 100.0% |
Employment Status by Age in Lake Carmel
According to the labor force statistics for Lake Carmel, out of the total population over 16 years of age (6,640), 69.9% or 4,641 individuals are in the labor force, with 3.7% or 172 of them unemployed. The age group with the highest labor force participation rate is 35 to 44 years, with 92.7% or 1,011 individuals in the labor force. Within the labor force, the 20 to 24 years age range has the highest percentage of unemployed individuals, with 15.9% or 42 of them being unemployed.
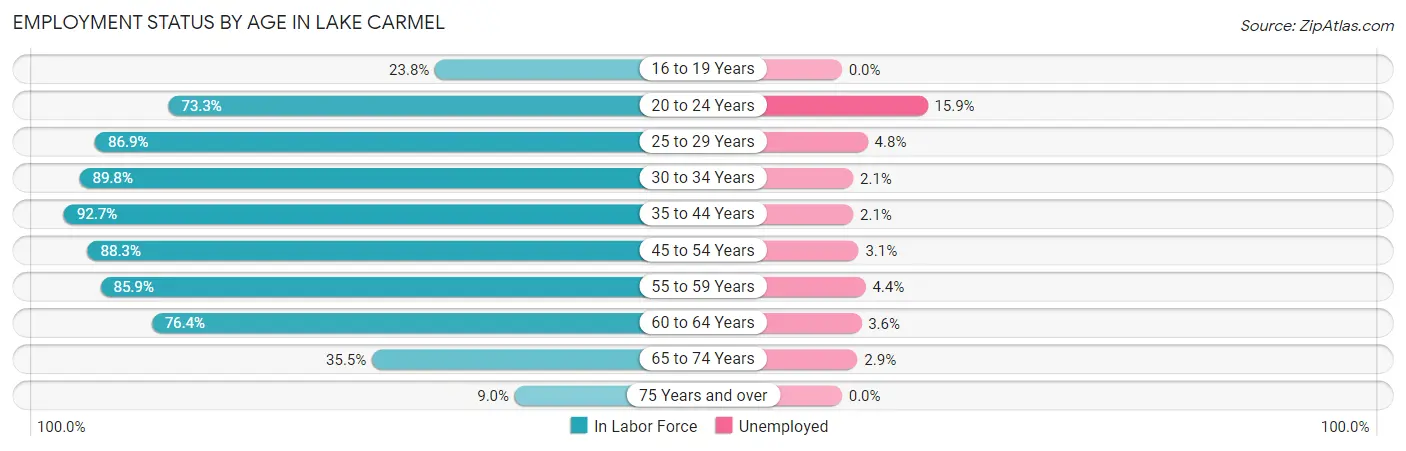
| Age Bracket | In Labor Force | Unemployed |
| 16 to 19 Years | 102 (23.8%) | 0 (0.0%) |
| 20 to 24 Years | 264 (73.3%) | 42 (15.9%) |
| 25 to 29 Years | 351 (86.9%) | 17 (4.8%) |
| 30 to 34 Years | 535 (89.8%) | 11 (2.1%) |
| 35 to 44 Years | 1,011 (92.7%) | 21 (2.1%) |
| 45 to 54 Years | 1,242 (88.3%) | 39 (3.1%) |
| 55 to 59 Years | 475 (85.9%) | 21 (4.4%) |
| 60 to 64 Years | 362 (76.4%) | 13 (3.6%) |
| 65 to 74 Years | 239 (35.5%) | 7 (2.9%) |
| 75 Years and over | 59 (9.0%) | 0 (0.0%) |
| Total | 4,641 (69.9%) | 172 (3.7%) |
Employment Status by Educational Attainment in Lake Carmel
According to labor force statistics for Lake Carmel, 87.9% of individuals (3,977) out of the total population between 25 and 64 years of age (4,525) are in the labor force, with 3.1% or 123 of them being unemployed. The group with the highest labor force participation rate are those with the educational attainment of bachelor's degree or higher, with 92.8% or 1,869 individuals in the labor force. Within the labor force, individuals with less than high school education have the highest percentage of unemployment, with 7.1% or 16 of them being unemployed.
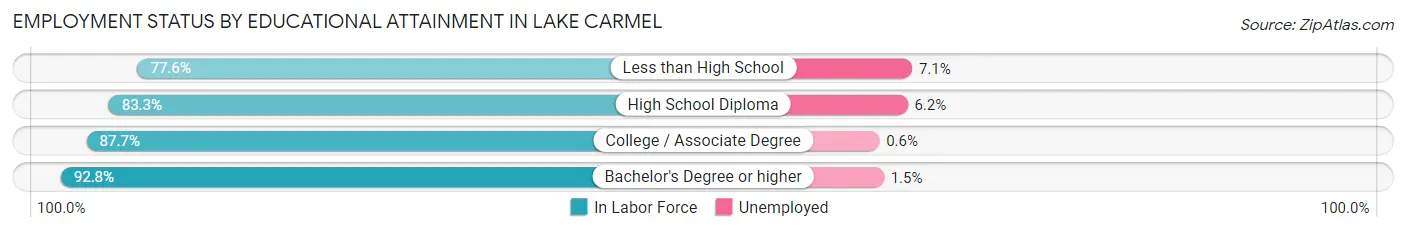
| Educational Attainment | In Labor Force | Unemployed |
| Less than High School | 225 (77.6%) | 21 (7.1%) |
| High School Diploma | 1,194 (83.3%) | 89 (6.2%) |
| College / Associate Degree | 691 (87.7%) | 5 (0.6%) |
| Bachelor's Degree or higher | 1,869 (92.8%) | 30 (1.5%) |
| Total | 3,977 (87.9%) | 140 (3.1%) |
Employment Occupations by Sex in Lake Carmel
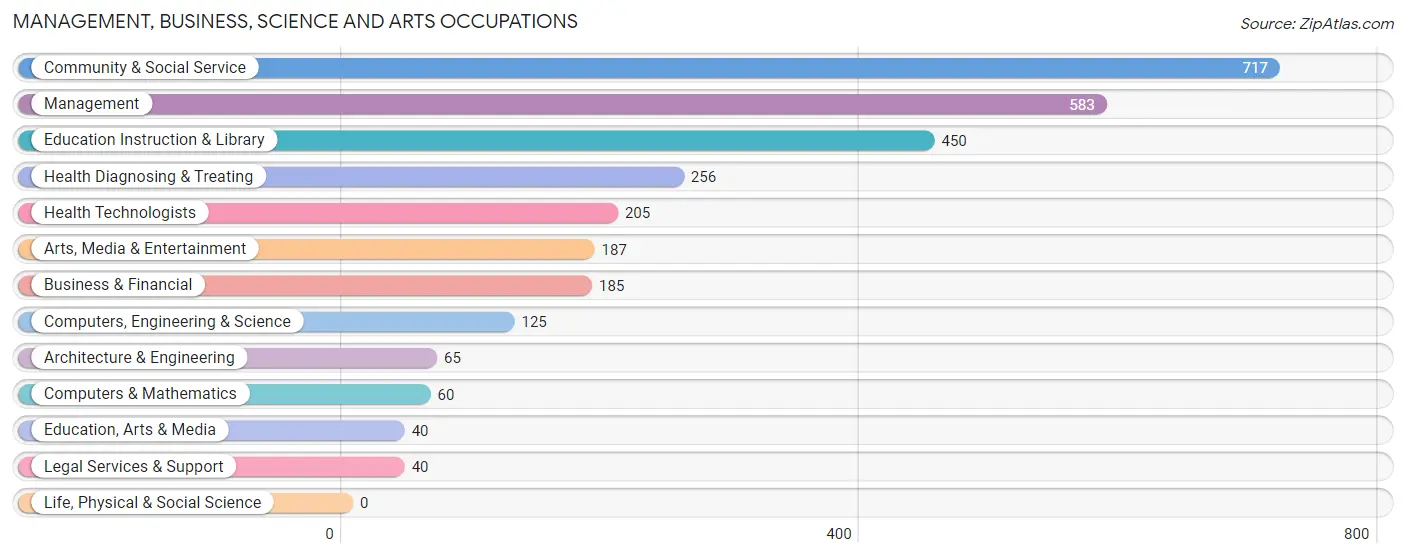
Management, Business, Science and Arts Occupations
The most common Management, Business, Science and Arts occupations in Lake Carmel are Community & Social Service (717 | 16.0%), Management (583 | 13.0%), Education Instruction & Library (450 | 10.1%), Health Diagnosing & Treating (256 | 5.7%), and Health Technologists (205 | 4.6%).
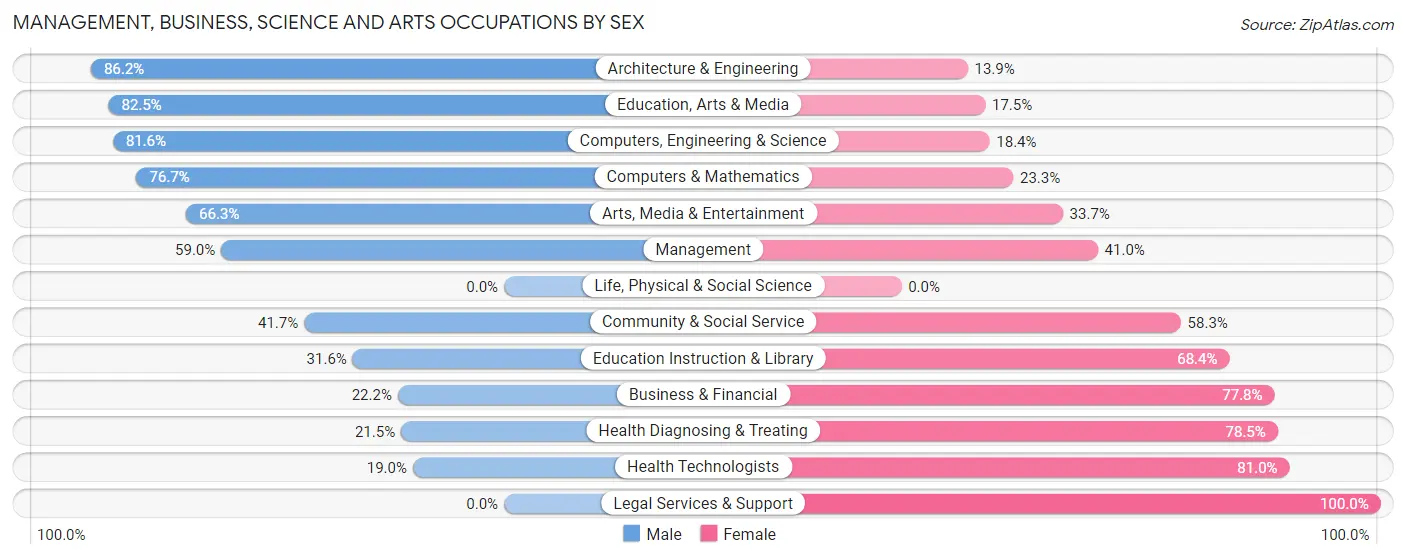
Management, Business, Science and Arts Occupations by Sex
Within the Management, Business, Science and Arts occupations in Lake Carmel, the most male-oriented occupations are Architecture & Engineering (86.2%), Education, Arts & Media (82.5%), and Computers, Engineering & Science (81.6%), while the most female-oriented occupations are Legal Services & Support (100.0%), Health Technologists (81.0%), and Health Diagnosing & Treating (78.5%).
| Occupation | Male | Female |
| Management | 344 (59.0%) | 239 (41.0%) |
| Business & Financial | 41 (22.2%) | 144 (77.8%) |
| Computers, Engineering & Science | 102 (81.6%) | 23 (18.4%) |
| Computers & Mathematics | 46 (76.7%) | 14 (23.3%) |
| Architecture & Engineering | 56 (86.2%) | 9 (13.9%) |
| Life, Physical & Social Science | 0 (0.0%) | 0 (0.0%) |
| Community & Social Service | 299 (41.7%) | 418 (58.3%) |
| Education, Arts & Media | 33 (82.5%) | 7 (17.5%) |
| Legal Services & Support | 0 (0.0%) | 40 (100.0%) |
| Education Instruction & Library | 142 (31.6%) | 308 (68.4%) |
| Arts, Media & Entertainment | 124 (66.3%) | 63 (33.7%) |
| Health Diagnosing & Treating | 55 (21.5%) | 201 (78.5%) |
| Health Technologists | 39 (19.0%) | 166 (81.0%) |
| Total (Category) | 841 (45.1%) | 1,025 (54.9%) |
| Total (Overall) | 2,347 (52.5%) | 2,123 (47.5%) |
Services Occupations
The most common Services occupations in Lake Carmel are Security & Protection (329 | 7.4%), Law Enforcement (222 | 5.0%), Cleaning & Maintenance (167 | 3.7%), Food Preparation & Serving (161 | 3.6%), and Healthcare Support (137 | 3.1%).

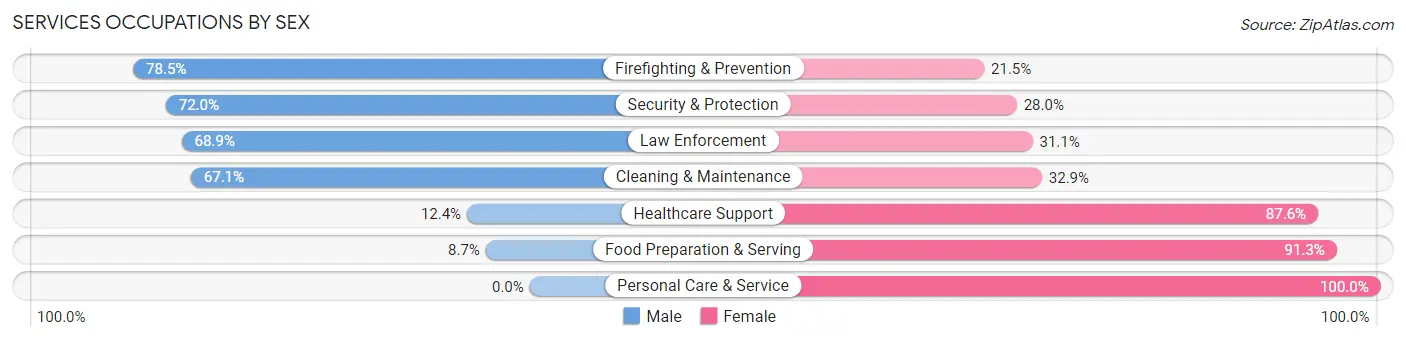
Services Occupations by Sex
Within the Services occupations in Lake Carmel, the most male-oriented occupations are Firefighting & Prevention (78.5%), Security & Protection (72.0%), and Law Enforcement (68.9%), while the most female-oriented occupations are Personal Care & Service (100.0%), Food Preparation & Serving (91.3%), and Healthcare Support (87.6%).
| Occupation | Male | Female |
| Healthcare Support | 17 (12.4%) | 120 (87.6%) |
| Security & Protection | 237 (72.0%) | 92 (28.0%) |
| Firefighting & Prevention | 84 (78.5%) | 23 (21.5%) |
| Law Enforcement | 153 (68.9%) | 69 (31.1%) |
| Food Preparation & Serving | 14 (8.7%) | 147 (91.3%) |
| Cleaning & Maintenance | 112 (67.1%) | 55 (32.9%) |
| Personal Care & Service | 0 (0.0%) | 38 (100.0%) |
| Total (Category) | 380 (45.7%) | 452 (54.3%) |
| Total (Overall) | 2,347 (52.5%) | 2,123 (47.5%) |
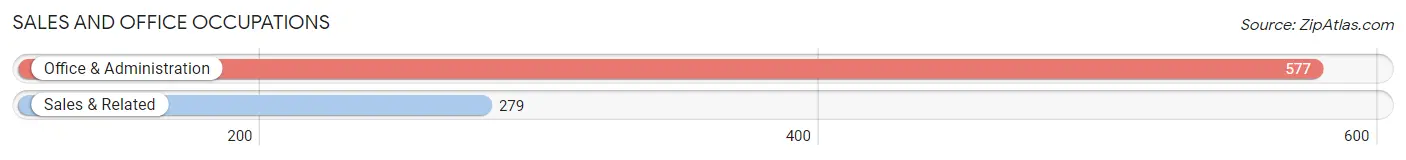
Sales and Office Occupations
The most common Sales and Office occupations in Lake Carmel are Office & Administration (577 | 12.9%), and Sales & Related (279 | 6.2%).
Sales and Office Occupations by Sex
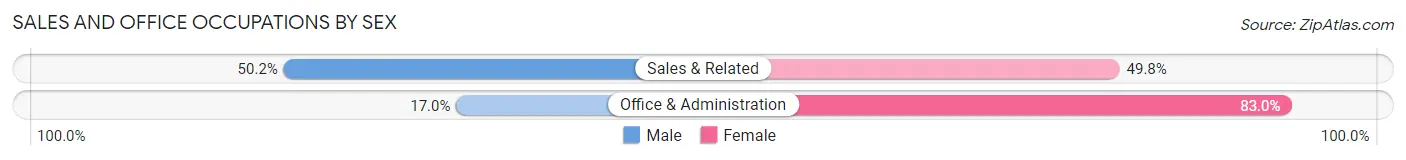
| Occupation | Male | Female |
| Sales & Related | 140 (50.2%) | 139 (49.8%) |
| Office & Administration | 98 (17.0%) | 479 (83.0%) |
| Total (Category) | 238 (27.8%) | 618 (72.2%) |
| Total (Overall) | 2,347 (52.5%) | 2,123 (47.5%) |
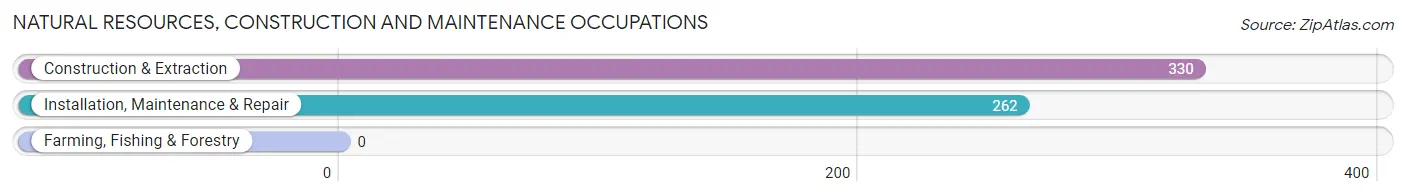
Natural Resources, Construction and Maintenance Occupations
The most common Natural Resources, Construction and Maintenance occupations in Lake Carmel are Construction & Extraction (330 | 7.4%), and Installation, Maintenance & Repair (262 | 5.9%).
Natural Resources, Construction and Maintenance Occupations by Sex
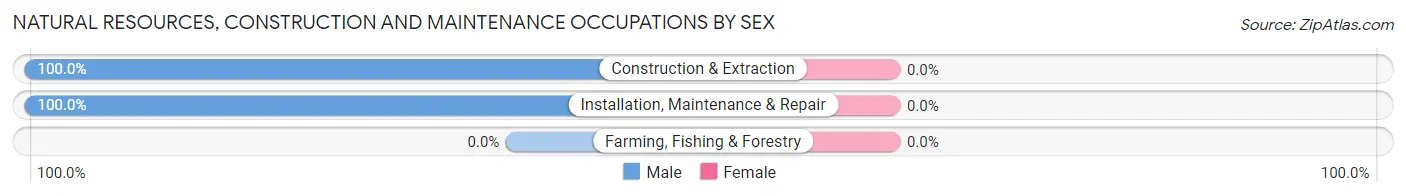
| Occupation | Male | Female |
| Farming, Fishing & Forestry | 0 (0.0%) | 0 (0.0%) |
| Construction & Extraction | 330 (100.0%) | 0 (0.0%) |
| Installation, Maintenance & Repair | 262 (100.0%) | 0 (0.0%) |
| Total (Category) | 592 (100.0%) | 0 (0.0%) |
| Total (Overall) | 2,347 (52.5%) | 2,123 (47.5%) |
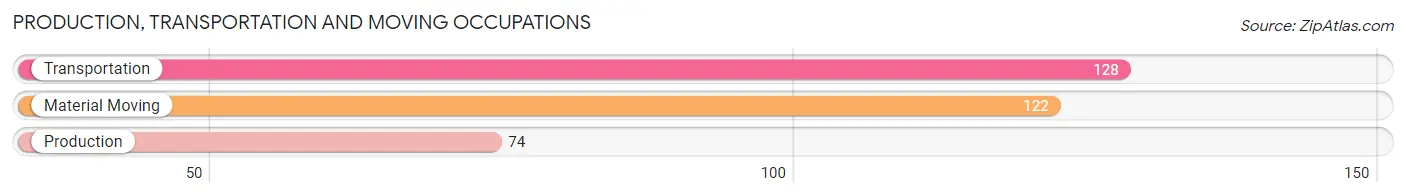
Production, Transportation and Moving Occupations
The most common Production, Transportation and Moving occupations in Lake Carmel are Transportation (128 | 2.9%), Material Moving (122 | 2.7%), and Production (74 | 1.7%).
Production, Transportation and Moving Occupations by Sex
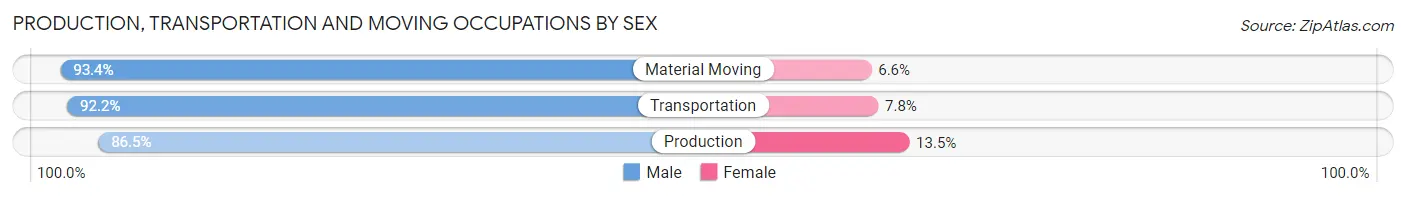
| Occupation | Male | Female |
| Production | 64 (86.5%) | 10 (13.5%) |
| Transportation | 118 (92.2%) | 10 (7.8%) |
| Material Moving | 114 (93.4%) | 8 (6.6%) |
| Total (Category) | 296 (91.4%) | 28 (8.6%) |
| Total (Overall) | 2,347 (52.5%) | 2,123 (47.5%) |
Employment Industries by Sex in Lake Carmel
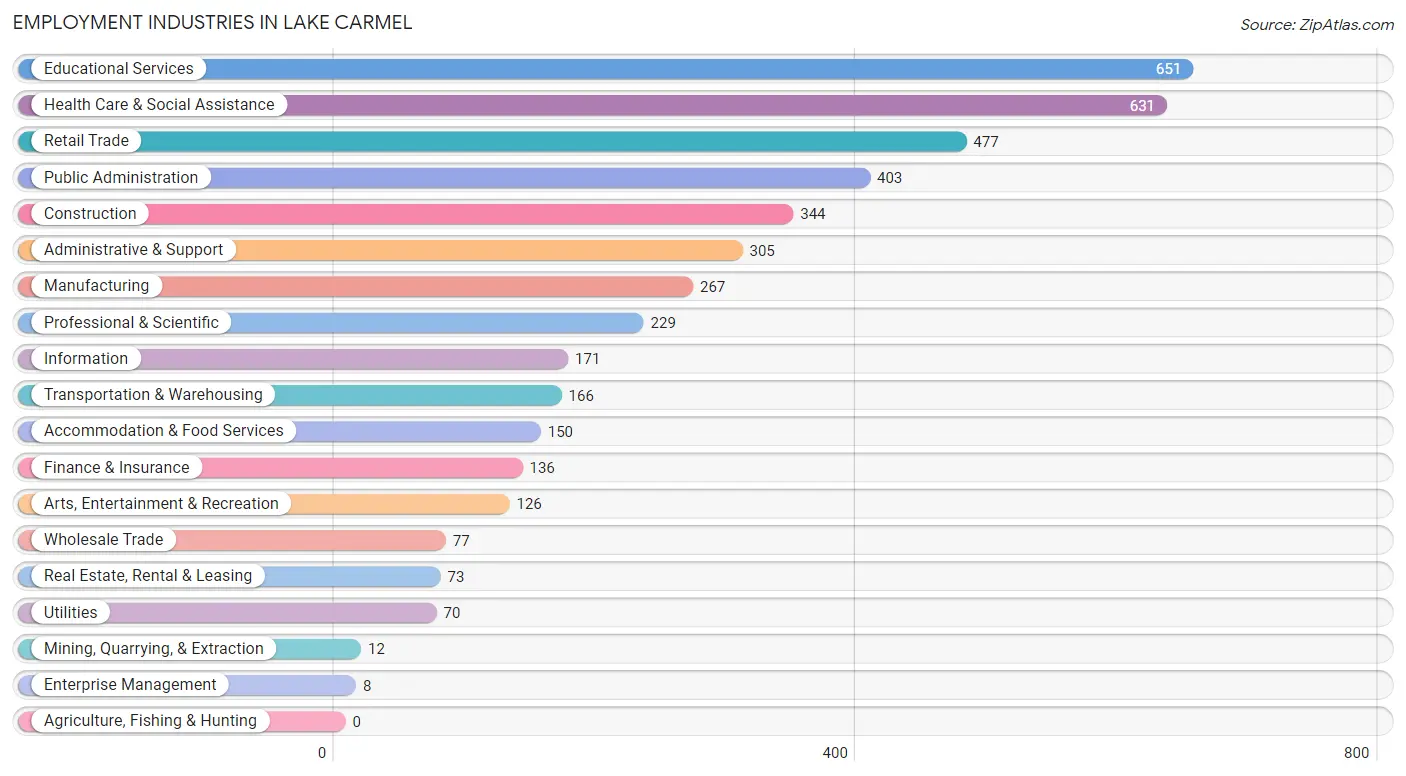
Employment Industries in Lake Carmel
The major employment industries in Lake Carmel include Educational Services (651 | 14.6%), Health Care & Social Assistance (631 | 14.1%), Retail Trade (477 | 10.7%), Public Administration (403 | 9.0%), and Construction (344 | 7.7%).
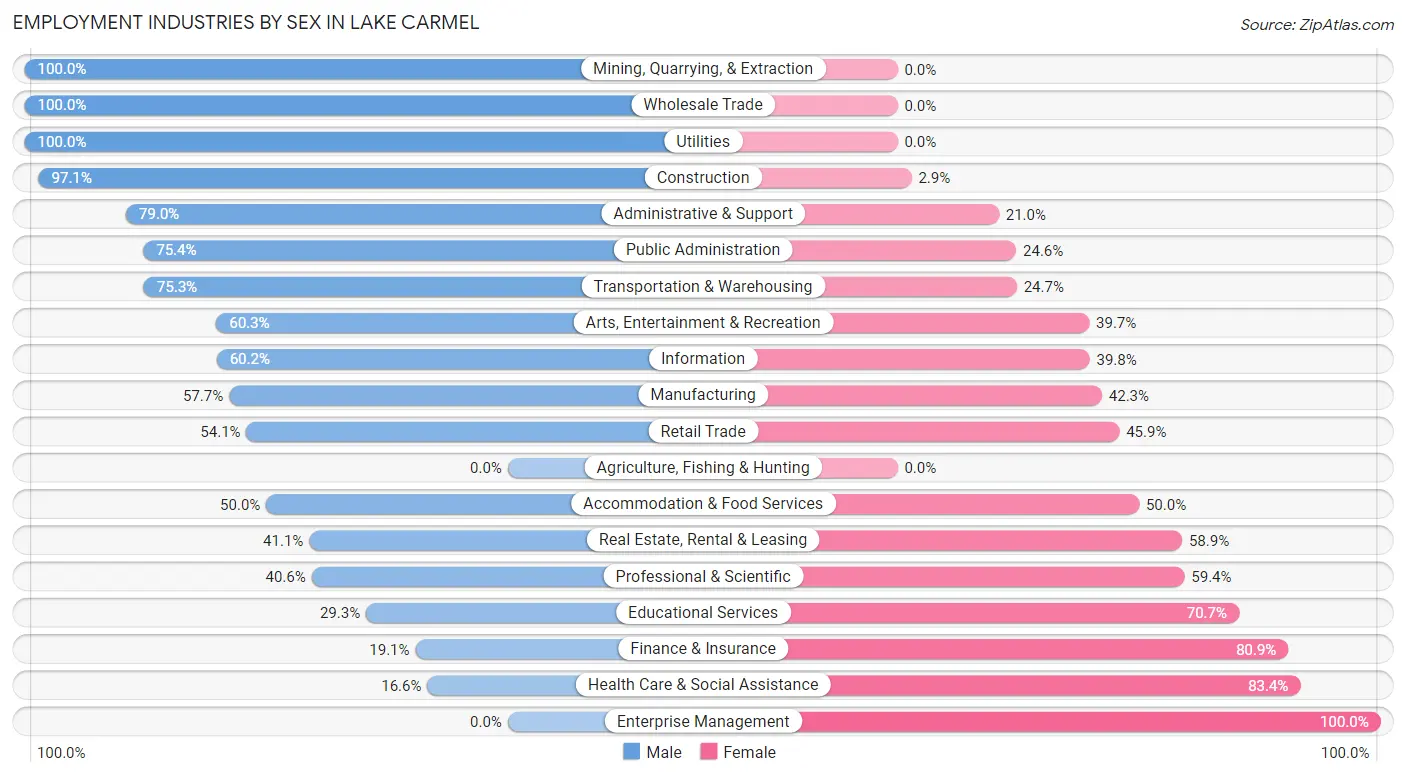
Employment Industries by Sex in Lake Carmel
The Lake Carmel industries that see more men than women are Mining, Quarrying, & Extraction (100.0%), Wholesale Trade (100.0%), and Utilities (100.0%), whereas the industries that tend to have a higher number of women are Enterprise Management (100.0%), Health Care & Social Assistance (83.4%), and Finance & Insurance (80.9%).
| Industry | Male | Female |
| Agriculture, Fishing & Hunting | 0 (0.0%) | 0 (0.0%) |
| Mining, Quarrying, & Extraction | 12 (100.0%) | 0 (0.0%) |
| Construction | 334 (97.1%) | 10 (2.9%) |
| Manufacturing | 154 (57.7%) | 113 (42.3%) |
| Wholesale Trade | 77 (100.0%) | 0 (0.0%) |
| Retail Trade | 258 (54.1%) | 219 (45.9%) |
| Transportation & Warehousing | 125 (75.3%) | 41 (24.7%) |
| Utilities | 70 (100.0%) | 0 (0.0%) |
| Information | 103 (60.2%) | 68 (39.8%) |
| Finance & Insurance | 26 (19.1%) | 110 (80.9%) |
| Real Estate, Rental & Leasing | 30 (41.1%) | 43 (58.9%) |
| Professional & Scientific | 93 (40.6%) | 136 (59.4%) |
| Enterprise Management | 0 (0.0%) | 8 (100.0%) |
| Administrative & Support | 241 (79.0%) | 64 (21.0%) |
| Educational Services | 191 (29.3%) | 460 (70.7%) |
| Health Care & Social Assistance | 105 (16.6%) | 526 (83.4%) |
| Arts, Entertainment & Recreation | 76 (60.3%) | 50 (39.7%) |
| Accommodation & Food Services | 75 (50.0%) | 75 (50.0%) |
| Public Administration | 304 (75.4%) | 99 (24.6%) |
| Total | 2,347 (52.5%) | 2,123 (47.5%) |
Education in Lake Carmel
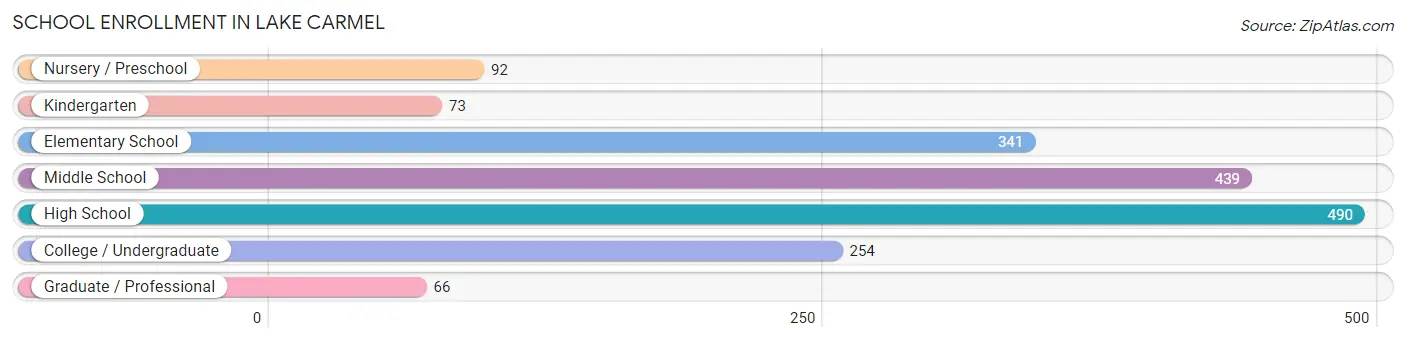
School Enrollment in Lake Carmel
The most common levels of schooling among the 1,755 students in Lake Carmel are high school (490 | 27.9%), middle school (439 | 25.0%), and elementary school (341 | 19.4%).
| School Level | # Students | % Students |
| Nursery / Preschool | 92 | 5.2% |
| Kindergarten | 73 | 4.2% |
| Elementary School | 341 | 19.4% |
| Middle School | 439 | 25.0% |
| High School | 490 | 27.9% |
| College / Undergraduate | 254 | 14.5% |
| Graduate / Professional | 66 | 3.8% |
| Total | 1,755 | 100.0% |
School Enrollment by Age by Funding Source in Lake Carmel
Out of a total of 1,755 students who are enrolled in schools in Lake Carmel, 386 (22.0%) attend a private institution, while the remaining 1,369 (78.0%) are enrolled in public schools. The age group of 25 to 34 year olds has the highest likelihood of being enrolled in private schools, with 85 (98.8% in the age bracket) enrolled. Conversely, the age group of 18 to 19 year olds has the lowest likelihood of being enrolled in a private school, with 91 (100.0% in the age bracket) attending a public institution.
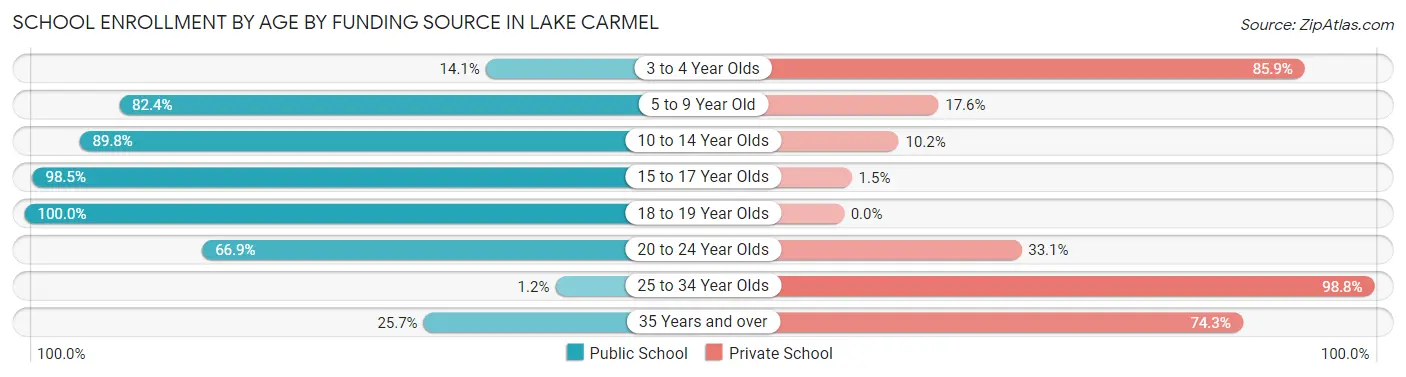
| Age Bracket | Public School | Private School |
| 3 to 4 Year Olds | 13 (14.1%) | 79 (85.9%) |
| 5 to 9 Year Old | 318 (82.4%) | 68 (17.6%) |
| 10 to 14 Year Olds | 439 (89.8%) | 50 (10.2%) |
| 15 to 17 Year Olds | 396 (98.5%) | 6 (1.5%) |
| 18 to 19 Year Olds | 91 (100.0%) | 0 (0.0%) |
| 20 to 24 Year Olds | 93 (66.9%) | 46 (33.1%) |
| 25 to 34 Year Olds | 1 (1.2%) | 85 (98.8%) |
| 35 Years and over | 18 (25.7%) | 52 (74.3%) |
| Total | 1,369 (78.0%) | 386 (22.0%) |
Educational Attainment by Field of Study in Lake Carmel
Business (467 | 18.8%), education (372 | 15.0%), liberal arts & history (275 | 11.1%), science & technology (241 | 9.7%), and psychology (188 | 7.6%) are the most common fields of study among 2,486 individuals in Lake Carmel who have obtained a bachelor's degree or higher.
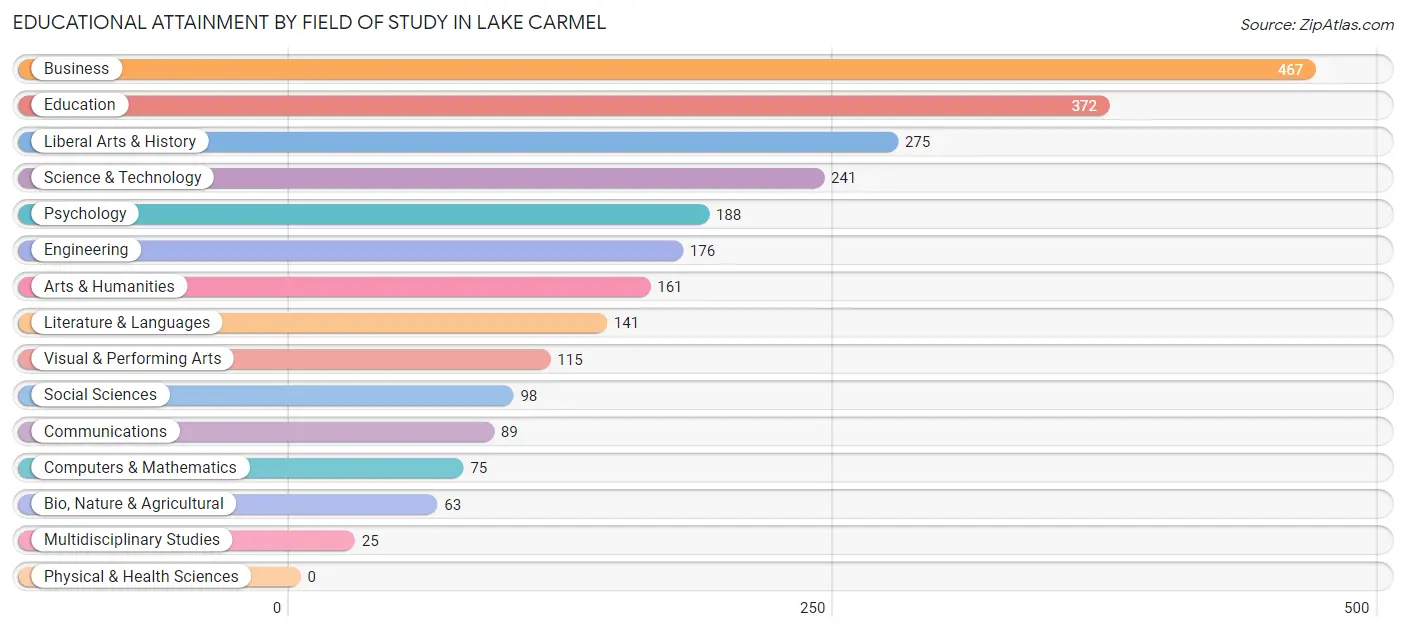
| Field of Study | # Graduates | % Graduates |
| Computers & Mathematics | 75 | 3.0% |
| Bio, Nature & Agricultural | 63 | 2.5% |
| Physical & Health Sciences | 0 | 0.0% |
| Psychology | 188 | 7.6% |
| Social Sciences | 98 | 3.9% |
| Engineering | 176 | 7.1% |
| Multidisciplinary Studies | 25 | 1.0% |
| Science & Technology | 241 | 9.7% |
| Business | 467 | 18.8% |
| Education | 372 | 15.0% |
| Literature & Languages | 141 | 5.7% |
| Liberal Arts & History | 275 | 11.1% |
| Visual & Performing Arts | 115 | 4.6% |
| Communications | 89 | 3.6% |
| Arts & Humanities | 161 | 6.5% |
| Total | 2,486 | 100.0% |
Transportation & Commute in Lake Carmel
Vehicle Availability by Sex in Lake Carmel
The most prevalent vehicle ownership categories in Lake Carmel are males with 2 vehicles (811, accounting for 34.8%) and females with 2 vehicles (715, making up 39.9%).
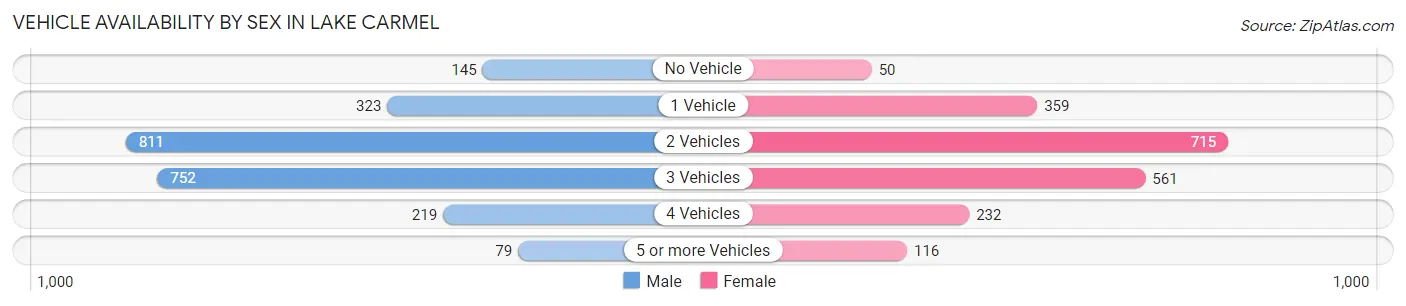
| Vehicles Available | Male | Female |
| No Vehicle | 145 (6.2%) | 50 (2.5%) |
| 1 Vehicle | 323 (13.9%) | 359 (17.7%) |
| 2 Vehicles | 811 (34.8%) | 715 (35.2%) |
| 3 Vehicles | 752 (32.3%) | 561 (27.6%) |
| 4 Vehicles | 219 (9.4%) | 232 (11.4%) |
| 5 or more Vehicles | 79 (3.4%) | 116 (5.7%) |
| Total | 2,329 (100.0%) | 2,033 (100.0%) |
Commute Time in Lake Carmel
The most frequently occuring commute durations in Lake Carmel are 45 to 59 minutes (944 commuters, 23.6%), 60 to 89 minutes (534 commuters, 13.3%), and 10 to 14 minutes (477 commuters, 11.9%).
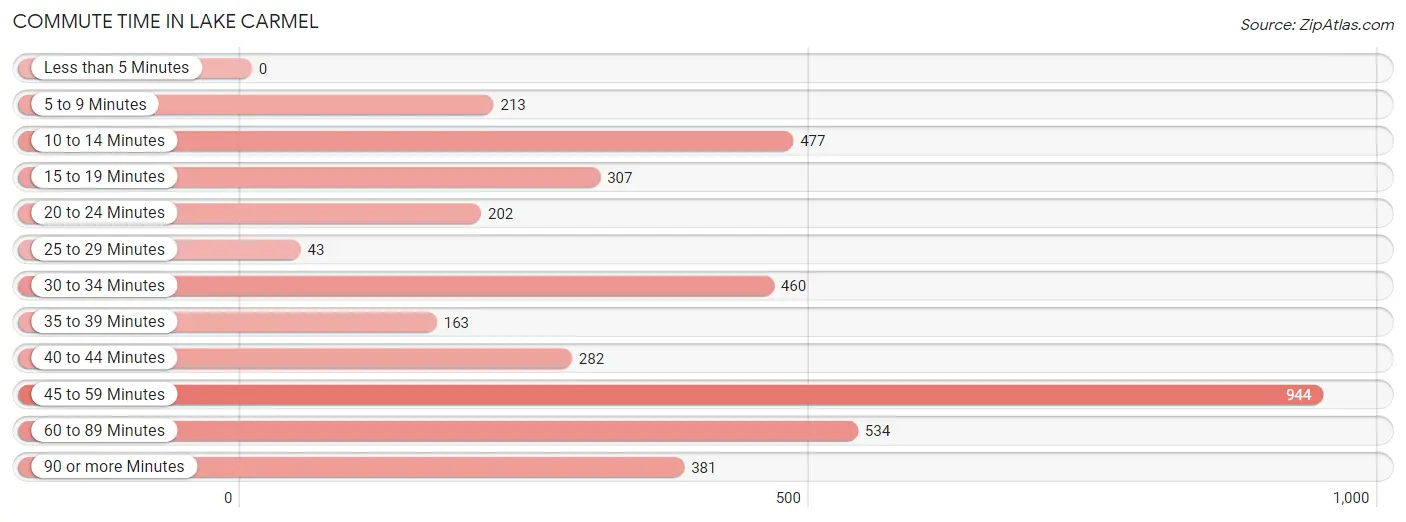
| Commute Time | # Commuters | % Commuters |
| Less than 5 Minutes | 0 | 0.0% |
| 5 to 9 Minutes | 213 | 5.3% |
| 10 to 14 Minutes | 477 | 11.9% |
| 15 to 19 Minutes | 307 | 7.7% |
| 20 to 24 Minutes | 202 | 5.0% |
| 25 to 29 Minutes | 43 | 1.1% |
| 30 to 34 Minutes | 460 | 11.5% |
| 35 to 39 Minutes | 163 | 4.1% |
| 40 to 44 Minutes | 282 | 7.0% |
| 45 to 59 Minutes | 944 | 23.6% |
| 60 to 89 Minutes | 534 | 13.3% |
| 90 or more Minutes | 381 | 9.5% |
Commute Time by Sex in Lake Carmel
The most common commute times in Lake Carmel are 45 to 59 minutes (524 commuters, 24.4%) for males and 45 to 59 minutes (420 commuters, 22.6%) for females.
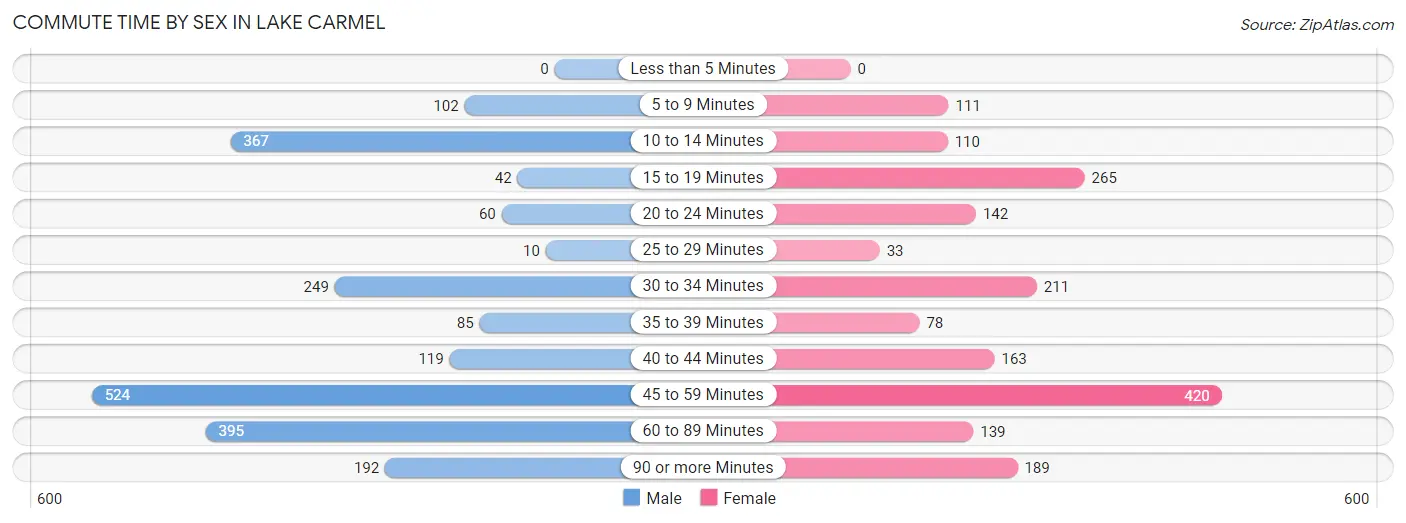
| Commute Time | Male | Female |
| Less than 5 Minutes | 0 (0.0%) | 0 (0.0%) |
| 5 to 9 Minutes | 102 (4.8%) | 111 (6.0%) |
| 10 to 14 Minutes | 367 (17.1%) | 110 (5.9%) |
| 15 to 19 Minutes | 42 (2.0%) | 265 (14.2%) |
| 20 to 24 Minutes | 60 (2.8%) | 142 (7.6%) |
| 25 to 29 Minutes | 10 (0.5%) | 33 (1.8%) |
| 30 to 34 Minutes | 249 (11.6%) | 211 (11.3%) |
| 35 to 39 Minutes | 85 (4.0%) | 78 (4.2%) |
| 40 to 44 Minutes | 119 (5.6%) | 163 (8.8%) |
| 45 to 59 Minutes | 524 (24.4%) | 420 (22.6%) |
| 60 to 89 Minutes | 395 (18.4%) | 139 (7.5%) |
| 90 or more Minutes | 192 (8.9%) | 189 (10.2%) |
Time of Departure to Work by Sex in Lake Carmel
The most frequent times of departure to work in Lake Carmel are 6:30 AM to 6:59 AM (419, 19.5%) for males and 6:00 AM to 6:29 AM (276, 14.8%) for females.
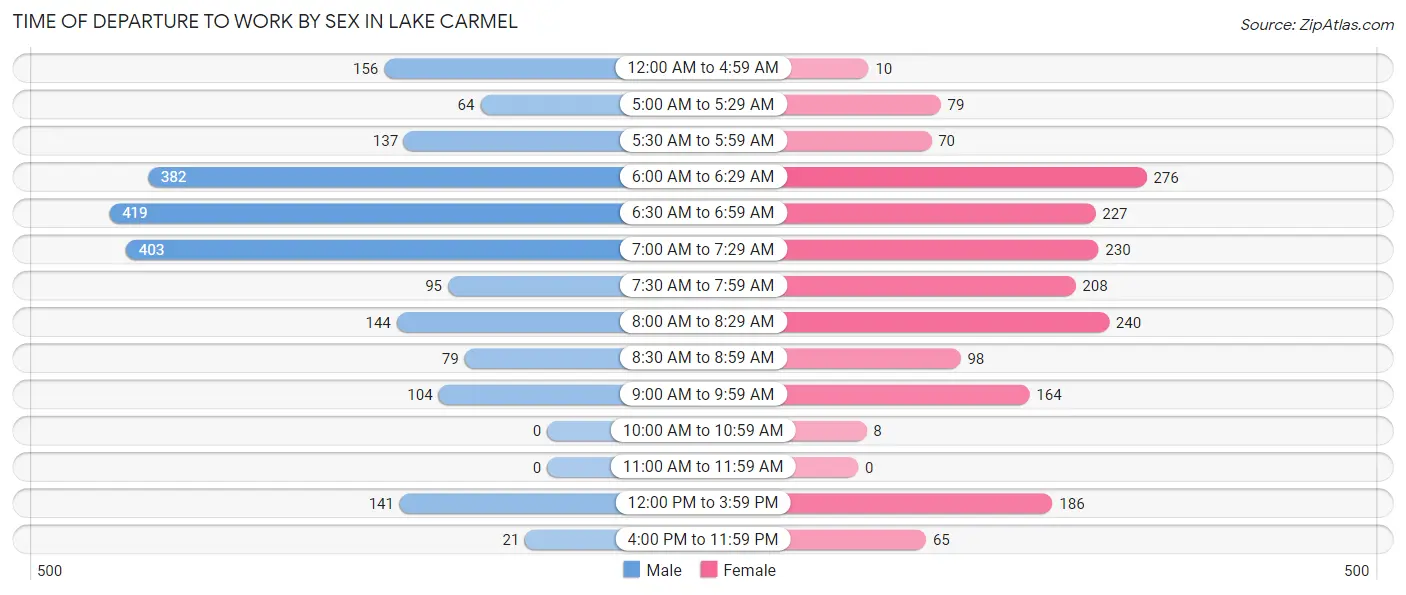
| Time of Departure | Male | Female |
| 12:00 AM to 4:59 AM | 156 (7.3%) | 10 (0.5%) |
| 5:00 AM to 5:29 AM | 64 (3.0%) | 79 (4.3%) |
| 5:30 AM to 5:59 AM | 137 (6.4%) | 70 (3.8%) |
| 6:00 AM to 6:29 AM | 382 (17.8%) | 276 (14.8%) |
| 6:30 AM to 6:59 AM | 419 (19.5%) | 227 (12.2%) |
| 7:00 AM to 7:29 AM | 403 (18.8%) | 230 (12.4%) |
| 7:30 AM to 7:59 AM | 95 (4.4%) | 208 (11.2%) |
| 8:00 AM to 8:29 AM | 144 (6.7%) | 240 (12.9%) |
| 8:30 AM to 8:59 AM | 79 (3.7%) | 98 (5.3%) |
| 9:00 AM to 9:59 AM | 104 (4.9%) | 164 (8.8%) |
| 10:00 AM to 10:59 AM | 0 (0.0%) | 8 (0.4%) |
| 11:00 AM to 11:59 AM | 0 (0.0%) | 0 (0.0%) |
| 12:00 PM to 3:59 PM | 141 (6.6%) | 186 (10.0%) |
| 4:00 PM to 11:59 PM | 21 (1.0%) | 65 (3.5%) |
| Total | 2,145 (100.0%) | 1,861 (100.0%) |
Housing Occupancy in Lake Carmel
Occupancy by Ownership in Lake Carmel
Of the total 2,900 dwellings in Lake Carmel, owner-occupied units account for 2,597 (89.5%), while renter-occupied units make up 303 (10.4%).
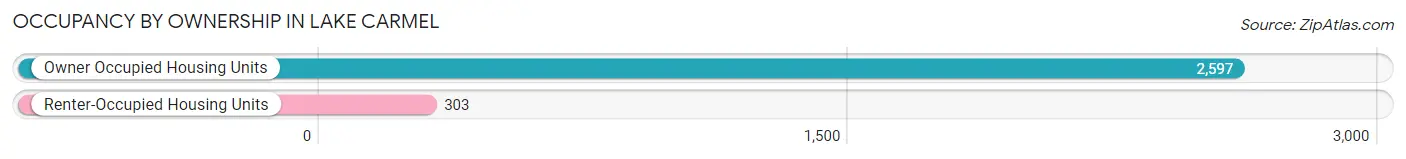
| Occupancy | # Housing Units | % Housing Units |
| Owner Occupied Housing Units | 2,597 | 89.5% |
| Renter-Occupied Housing Units | 303 | 10.4% |
| Total Occupied Housing Units | 2,900 | 100.0% |
Occupancy by Household Size in Lake Carmel
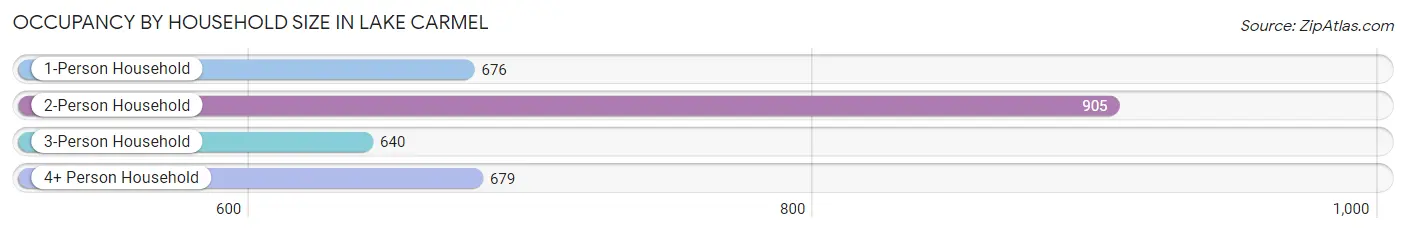
| Household Size | # Housing Units | % Housing Units |
| 1-Person Household | 676 | 23.3% |
| 2-Person Household | 905 | 31.2% |
| 3-Person Household | 640 | 22.1% |
| 4+ Person Household | 679 | 23.4% |
| Total Housing Units | 2,900 | 100.0% |
Occupancy by Ownership by Household Size in Lake Carmel
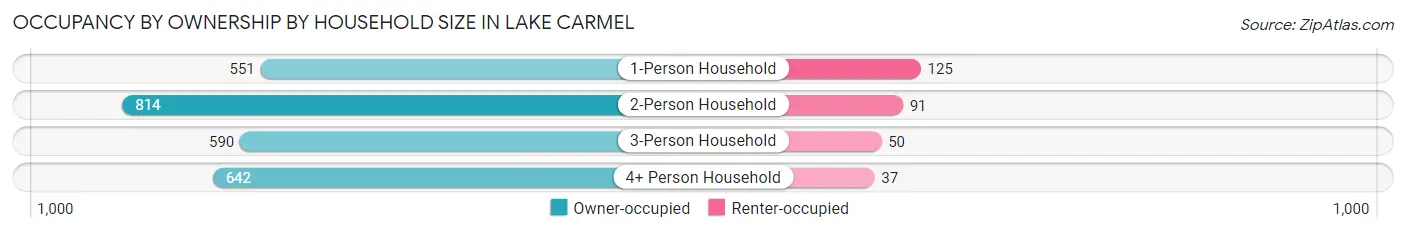
| Household Size | Owner-occupied | Renter-occupied |
| 1-Person Household | 551 (81.5%) | 125 (18.5%) |
| 2-Person Household | 814 (89.9%) | 91 (10.1%) |
| 3-Person Household | 590 (92.2%) | 50 (7.8%) |
| 4+ Person Household | 642 (94.6%) | 37 (5.4%) |
| Total Housing Units | 2,597 (89.5%) | 303 (10.4%) |
Occupancy by Educational Attainment in Lake Carmel
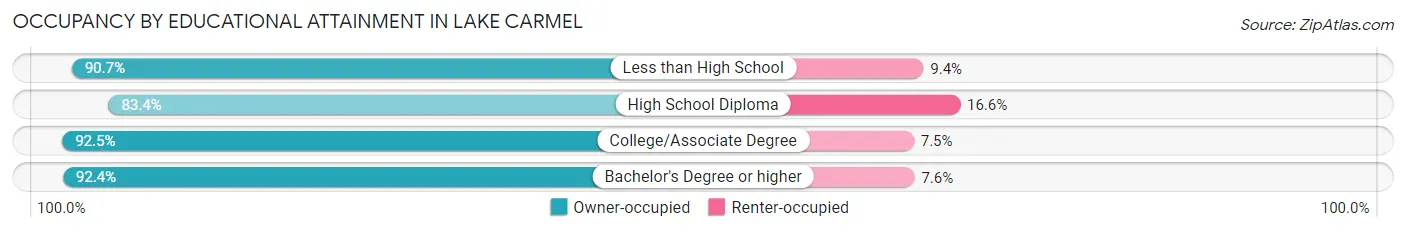
| Household Size | Owner-occupied | Renter-occupied |
| Less than High School | 223 (90.6%) | 23 (9.3%) |
| High School Diploma | 732 (83.4%) | 146 (16.6%) |
| College/Associate Degree | 583 (92.5%) | 47 (7.5%) |
| Bachelor's Degree or higher | 1,059 (92.4%) | 87 (7.6%) |
Occupancy by Age of Householder in Lake Carmel
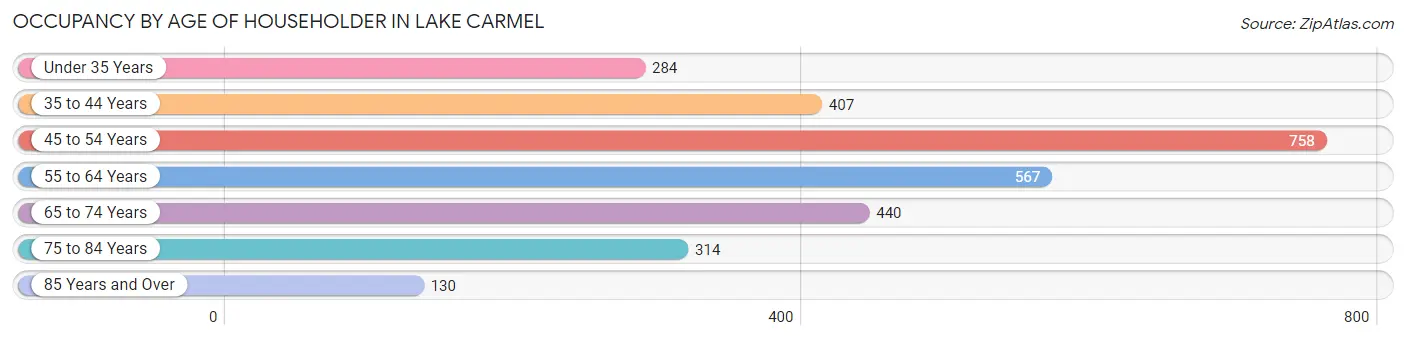
| Age Bracket | # Households | % Households |
| Under 35 Years | 284 | 9.8% |
| 35 to 44 Years | 407 | 14.0% |
| 45 to 54 Years | 758 | 26.1% |
| 55 to 64 Years | 567 | 19.6% |
| 65 to 74 Years | 440 | 15.2% |
| 75 to 84 Years | 314 | 10.8% |
| 85 Years and Over | 130 | 4.5% |
| Total | 2,900 | 100.0% |
Housing Finances in Lake Carmel
Median Income by Occupancy in Lake Carmel
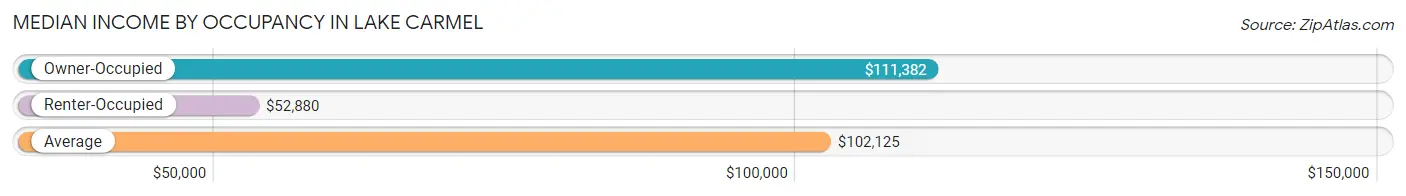
| Occupancy Type | # Households | Median Income |
| Owner-Occupied | 2,597 (89.5%) | $111,382 |
| Renter-Occupied | 303 (10.4%) | $52,880 |
| Average | 2,900 (100.0%) | $102,125 |
Occupancy by Householder Income Bracket in Lake Carmel
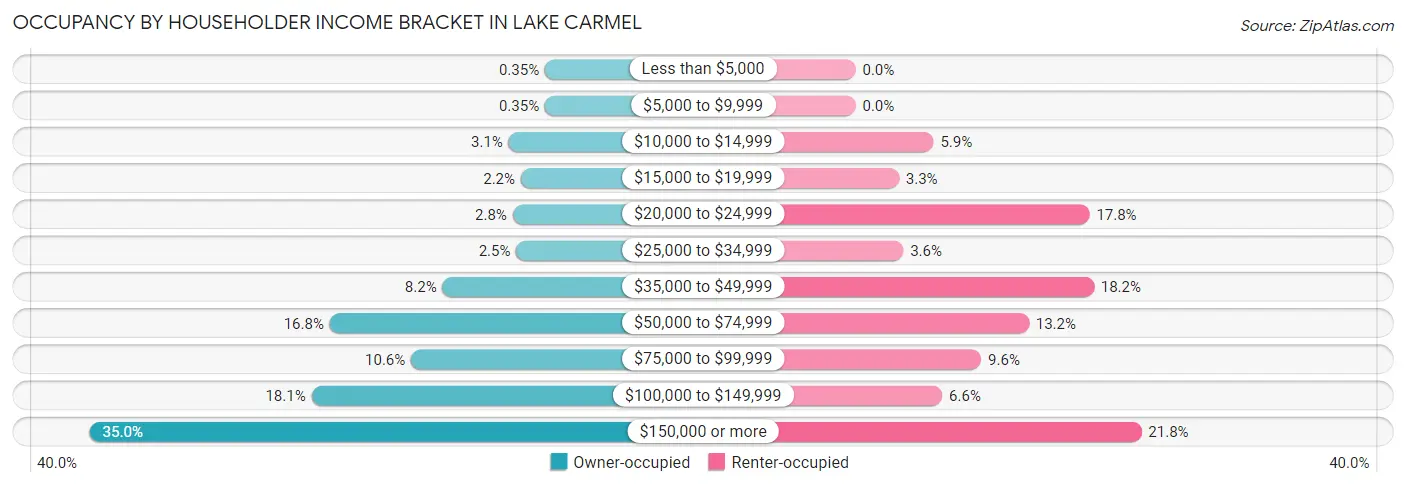
| Income Bracket | Owner-occupied | Renter-occupied |
| Less than $5,000 | 9 (0.4%) | 0 (0.0%) |
| $5,000 to $9,999 | 9 (0.4%) | 0 (0.0%) |
| $10,000 to $14,999 | 81 (3.1%) | 18 (5.9%) |
| $15,000 to $19,999 | 57 (2.2%) | 10 (3.3%) |
| $20,000 to $24,999 | 73 (2.8%) | 54 (17.8%) |
| $25,000 to $34,999 | 66 (2.5%) | 11 (3.6%) |
| $35,000 to $49,999 | 212 (8.2%) | 55 (18.1%) |
| $50,000 to $74,999 | 435 (16.8%) | 40 (13.2%) |
| $75,000 to $99,999 | 274 (10.5%) | 29 (9.6%) |
| $100,000 to $149,999 | 471 (18.1%) | 20 (6.6%) |
| $150,000 or more | 910 (35.0%) | 66 (21.8%) |
| Total | 2,597 (100.0%) | 303 (100.0%) |
Monthly Housing Cost Tiers in Lake Carmel
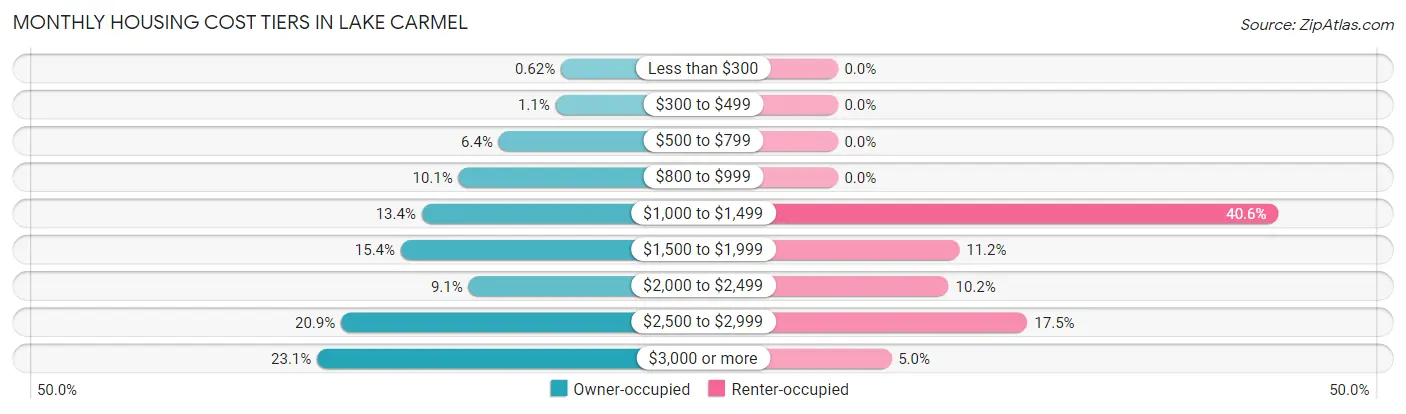
| Monthly Cost | Owner-occupied | Renter-occupied |
| Less than $300 | 16 (0.6%) | 0 (0.0%) |
| $300 to $499 | 29 (1.1%) | 0 (0.0%) |
| $500 to $799 | 165 (6.4%) | 0 (0.0%) |
| $800 to $999 | 261 (10.1%) | 0 (0.0%) |
| $1,000 to $1,499 | 349 (13.4%) | 123 (40.6%) |
| $1,500 to $1,999 | 399 (15.4%) | 34 (11.2%) |
| $2,000 to $2,499 | 237 (9.1%) | 31 (10.2%) |
| $2,500 to $2,999 | 542 (20.9%) | 53 (17.5%) |
| $3,000 or more | 599 (23.1%) | 15 (5.0%) |
| Total | 2,597 (100.0%) | 303 (100.0%) |
Physical Housing Characteristics in Lake Carmel
Housing Structures in Lake Carmel
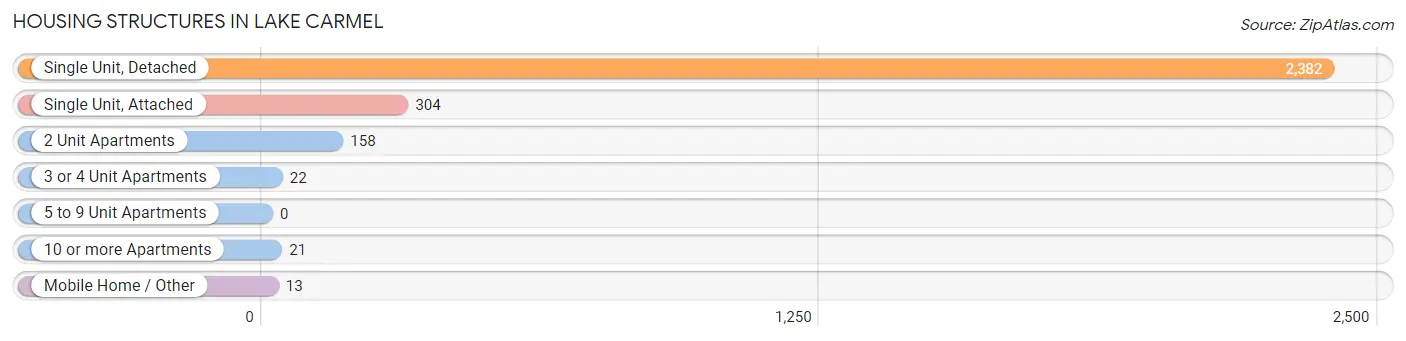
| Structure Type | # Housing Units | % Housing Units |
| Single Unit, Detached | 2,382 | 82.1% |
| Single Unit, Attached | 304 | 10.5% |
| 2 Unit Apartments | 158 | 5.4% |
| 3 or 4 Unit Apartments | 22 | 0.8% |
| 5 to 9 Unit Apartments | 0 | 0.0% |
| 10 or more Apartments | 21 | 0.7% |
| Mobile Home / Other | 13 | 0.4% |
| Total | 2,900 | 100.0% |
Housing Structures by Occupancy in Lake Carmel
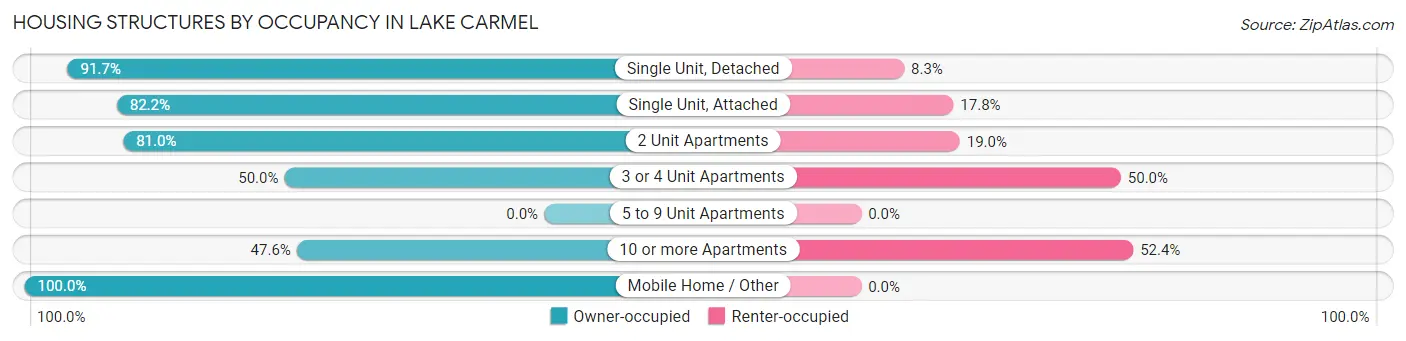
| Structure Type | Owner-occupied | Renter-occupied |
| Single Unit, Detached | 2,185 (91.7%) | 197 (8.3%) |
| Single Unit, Attached | 250 (82.2%) | 54 (17.8%) |
| 2 Unit Apartments | 128 (81.0%) | 30 (19.0%) |
| 3 or 4 Unit Apartments | 11 (50.0%) | 11 (50.0%) |
| 5 to 9 Unit Apartments | 0 (0.0%) | 0 (0.0%) |
| 10 or more Apartments | 10 (47.6%) | 11 (52.4%) |
| Mobile Home / Other | 13 (100.0%) | 0 (0.0%) |
| Total | 2,597 (89.5%) | 303 (10.4%) |
Housing Structures by Number of Rooms in Lake Carmel
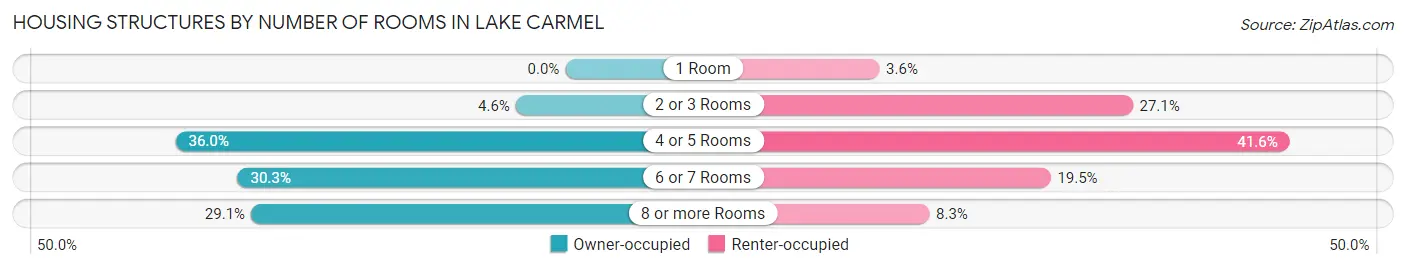
| Number of Rooms | Owner-occupied | Renter-occupied |
| 1 Room | 0 (0.0%) | 11 (3.6%) |
| 2 or 3 Rooms | 119 (4.6%) | 82 (27.1%) |
| 4 or 5 Rooms | 936 (36.0%) | 126 (41.6%) |
| 6 or 7 Rooms | 787 (30.3%) | 59 (19.5%) |
| 8 or more Rooms | 755 (29.1%) | 25 (8.3%) |
| Total | 2,597 (100.0%) | 303 (100.0%) |
Housing Structure by Heating Type in Lake Carmel
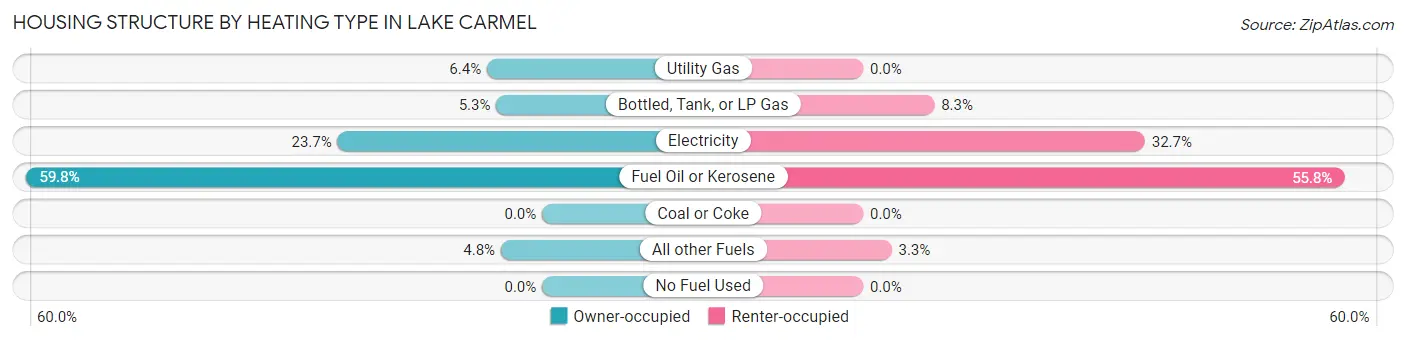
| Heating Type | Owner-occupied | Renter-occupied |
| Utility Gas | 166 (6.4%) | 0 (0.0%) |
| Bottled, Tank, or LP Gas | 138 (5.3%) | 25 (8.3%) |
| Electricity | 616 (23.7%) | 99 (32.7%) |
| Fuel Oil or Kerosene | 1,553 (59.8%) | 169 (55.8%) |
| Coal or Coke | 0 (0.0%) | 0 (0.0%) |
| All other Fuels | 124 (4.8%) | 10 (3.3%) |
| No Fuel Used | 0 (0.0%) | 0 (0.0%) |
| Total | 2,597 (100.0%) | 303 (100.0%) |
Household Vehicle Usage in Lake Carmel
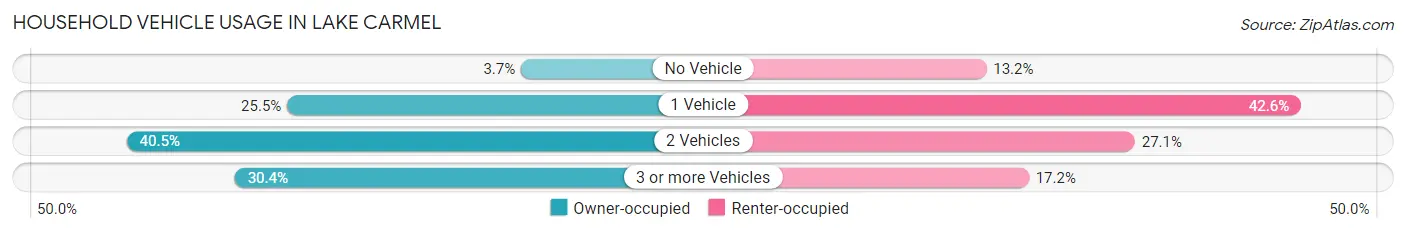
| Vehicles per Household | Owner-occupied | Renter-occupied |
| No Vehicle | 95 (3.7%) | 40 (13.2%) |
| 1 Vehicle | 662 (25.5%) | 129 (42.6%) |
| 2 Vehicles | 1,051 (40.5%) | 82 (27.1%) |
| 3 or more Vehicles | 789 (30.4%) | 52 (17.2%) |
| Total | 2,597 (100.0%) | 303 (100.0%) |
Real Estate & Mortgages in Lake Carmel
Real Estate and Mortgage Overview in Lake Carmel
| Characteristic | Without Mortgage | With Mortgage |
| Housing Units | 715 | 1,882 |
| Median Property Value | $295,600 | $335,900 |
| Median Household Income | $65,855 | $741 |
| Monthly Housing Costs | $908 | $599 |
| Real Estate Taxes | $6,682 | $102 |
Property Value by Mortgage Status in Lake Carmel
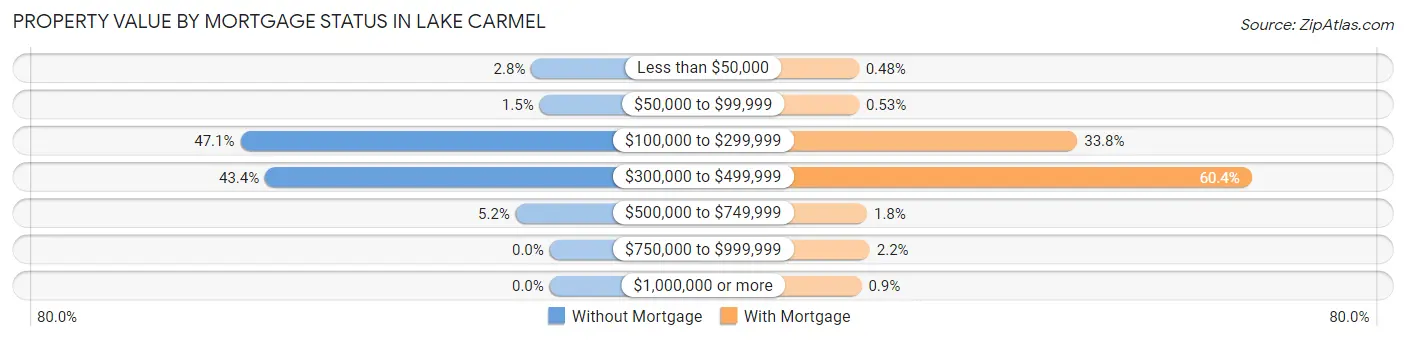
| Property Value | Without Mortgage | With Mortgage |
| Less than $50,000 | 20 (2.8%) | 9 (0.5%) |
| $50,000 to $99,999 | 11 (1.5%) | 10 (0.5%) |
| $100,000 to $299,999 | 337 (47.1%) | 636 (33.8%) |
| $300,000 to $499,999 | 310 (43.4%) | 1,136 (60.4%) |
| $500,000 to $749,999 | 37 (5.2%) | 33 (1.8%) |
| $750,000 to $999,999 | 0 (0.0%) | 41 (2.2%) |
| $1,000,000 or more | 0 (0.0%) | 17 (0.9%) |
| Total | 715 (100.0%) | 1,882 (100.0%) |
Household Income by Mortgage Status in Lake Carmel
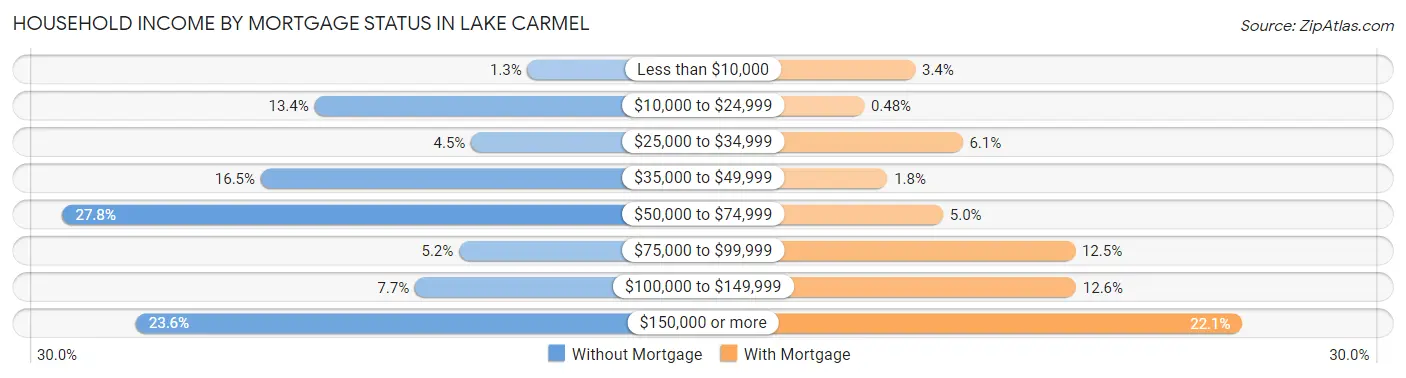
| Household Income | Without Mortgage | With Mortgage |
| Less than $10,000 | 9 (1.3%) | 64 (3.4%) |
| $10,000 to $24,999 | 96 (13.4%) | 9 (0.5%) |
| $25,000 to $34,999 | 32 (4.5%) | 115 (6.1%) |
| $35,000 to $49,999 | 118 (16.5%) | 34 (1.8%) |
| $50,000 to $74,999 | 199 (27.8%) | 94 (5.0%) |
| $75,000 to $99,999 | 37 (5.2%) | 236 (12.5%) |
| $100,000 to $149,999 | 55 (7.7%) | 237 (12.6%) |
| $150,000 or more | 169 (23.6%) | 416 (22.1%) |
| Total | 715 (100.0%) | 1,882 (100.0%) |
Property Value to Household Income Ratio in Lake Carmel
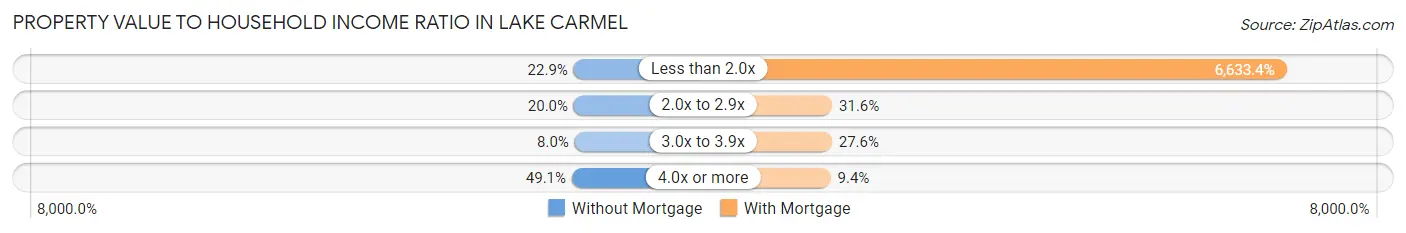
| Value-to-Income Ratio | Without Mortgage | With Mortgage |
| Less than 2.0x | 164 (22.9%) | 124,841 (6,633.4%) |
| 2.0x to 2.9x | 143 (20.0%) | 595 (31.6%) |
| 3.0x to 3.9x | 57 (8.0%) | 520 (27.6%) |
| 4.0x or more | 351 (49.1%) | 177 (9.4%) |
| Total | 715 (100.0%) | 1,882 (100.0%) |
Real Estate Taxes by Mortgage Status in Lake Carmel
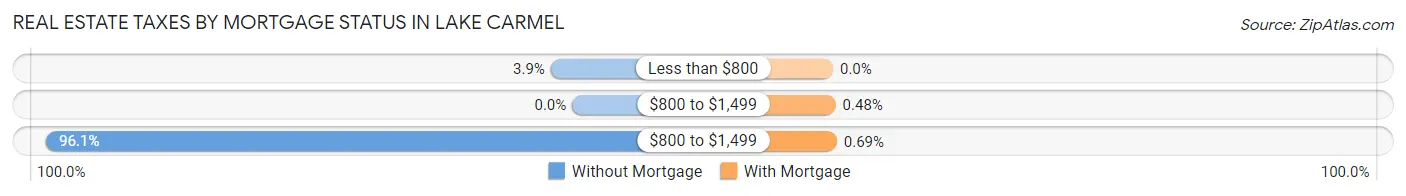
| Property Taxes | Without Mortgage | With Mortgage |
| Less than $800 | 28 (3.9%) | 0 (0.0%) |
| $800 to $1,499 | 0 (0.0%) | 9 (0.5%) |
| $800 to $1,499 | 687 (96.1%) | 13 (0.7%) |
| Total | 715 (100.0%) | 1,882 (100.0%) |
Health & Disability in Lake Carmel
Health Insurance Coverage by Age in Lake Carmel
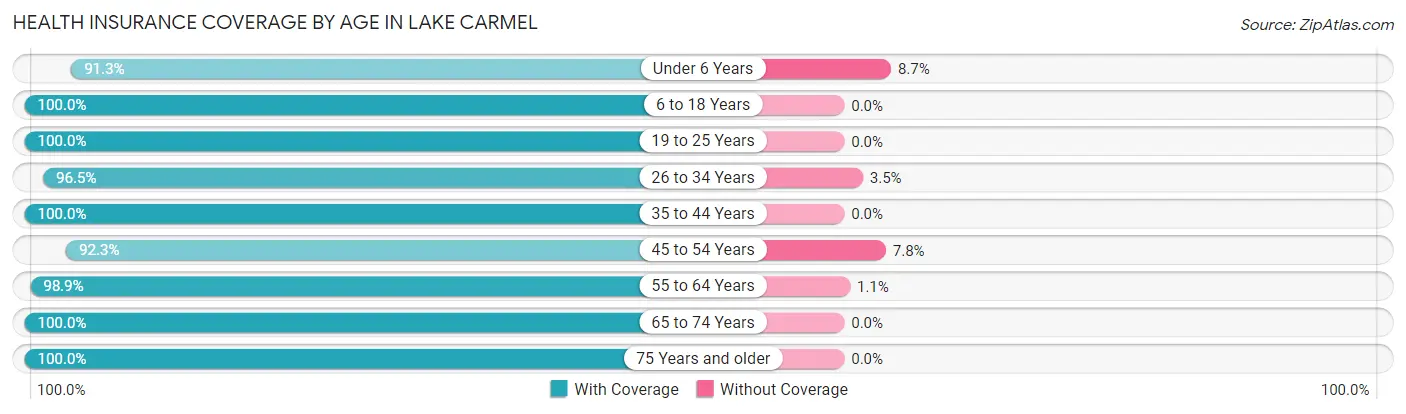
| Age Bracket | With Coverage | Without Coverage |
| Under 6 Years | 430 (91.3%) | 41 (8.7%) |
| 6 to 18 Years | 1,342 (100.0%) | 0 (0.0%) |
| 19 to 25 Years | 528 (100.0%) | 0 (0.0%) |
| 26 to 34 Years | 866 (96.5%) | 31 (3.5%) |
| 35 to 44 Years | 1,091 (100.0%) | 0 (0.0%) |
| 45 to 54 Years | 1,298 (92.2%) | 109 (7.7%) |
| 55 to 64 Years | 1,016 (98.9%) | 11 (1.1%) |
| 65 to 74 Years | 674 (100.0%) | 0 (0.0%) |
| 75 Years and older | 652 (100.0%) | 0 (0.0%) |
| Total | 7,897 (97.6%) | 192 (2.4%) |
Health Insurance Coverage by Citizenship Status in Lake Carmel
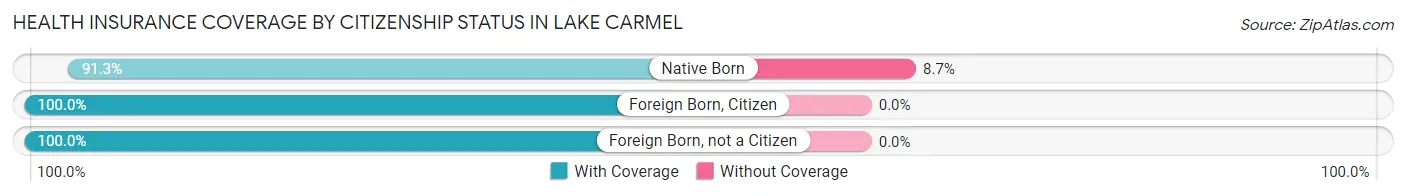
| Citizenship Status | With Coverage | Without Coverage |
| Native Born | 430 (91.3%) | 41 (8.7%) |
| Foreign Born, Citizen | 1,342 (100.0%) | 0 (0.0%) |
| Foreign Born, not a Citizen | 528 (100.0%) | 0 (0.0%) |
Health Insurance Coverage by Household Income in Lake Carmel
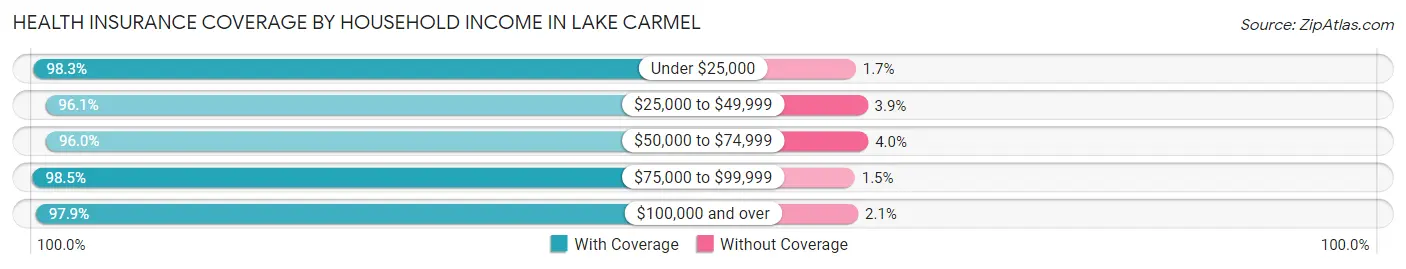
| Household Income | With Coverage | Without Coverage |
| Under $25,000 | 583 (98.3%) | 10 (1.7%) |
| $25,000 to $49,999 | 542 (96.1%) | 22 (3.9%) |
| $50,000 to $74,999 | 930 (96.0%) | 39 (4.0%) |
| $75,000 to $99,999 | 852 (98.5%) | 13 (1.5%) |
| $100,000 and over | 4,978 (97.9%) | 108 (2.1%) |
Public vs Private Health Insurance Coverage by Age in Lake Carmel
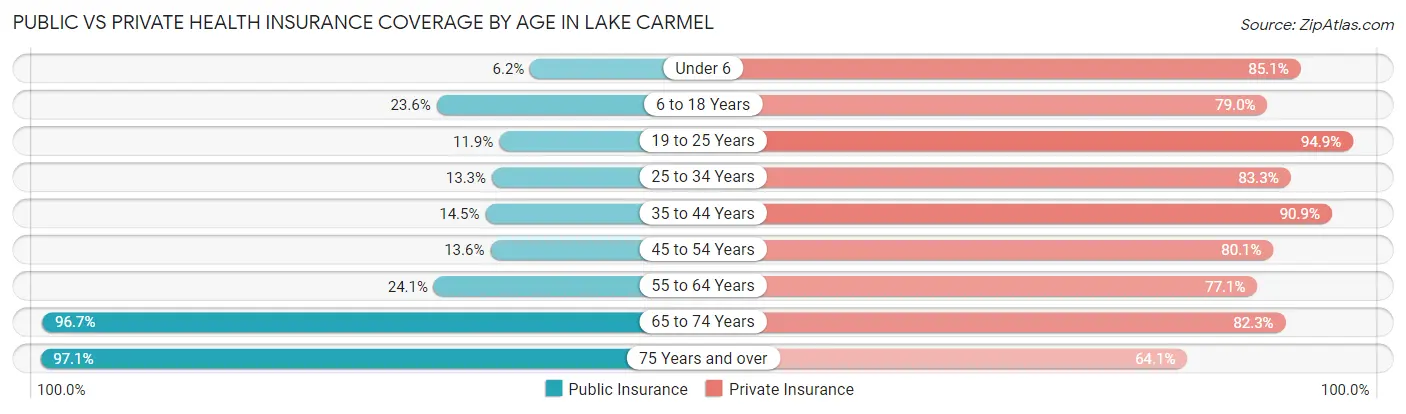
| Age Bracket | Public Insurance | Private Insurance |
| Under 6 | 29 (6.2%) | 401 (85.1%) |
| 6 to 18 Years | 316 (23.5%) | 1,060 (79.0%) |
| 19 to 25 Years | 63 (11.9%) | 501 (94.9%) |
| 25 to 34 Years | 119 (13.3%) | 747 (83.3%) |
| 35 to 44 Years | 158 (14.5%) | 992 (90.9%) |
| 45 to 54 Years | 191 (13.6%) | 1,127 (80.1%) |
| 55 to 64 Years | 247 (24.0%) | 792 (77.1%) |
| 65 to 74 Years | 652 (96.7%) | 555 (82.3%) |
| 75 Years and over | 633 (97.1%) | 418 (64.1%) |
| Total | 2,408 (29.8%) | 6,593 (81.5%) |
Disability Status by Sex by Age in Lake Carmel
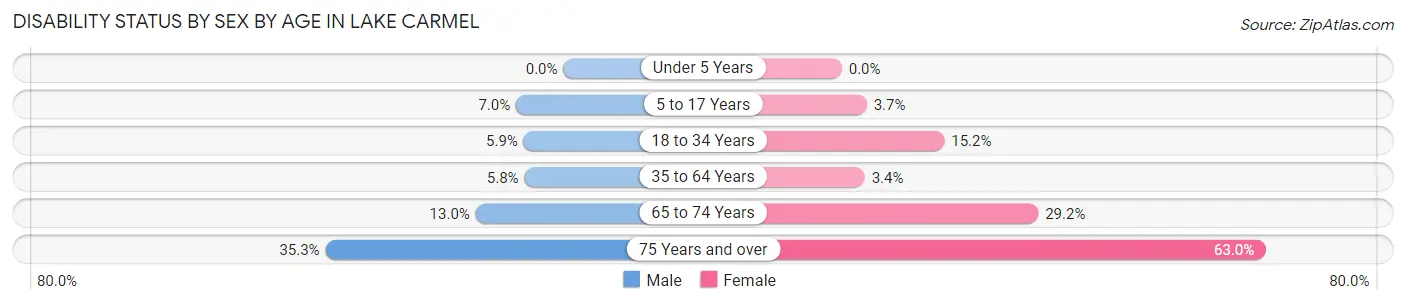
| Age Bracket | Male | Female |
| Under 5 Years | 0 (0.0%) | 0 (0.0%) |
| 5 to 17 Years | 40 (7.0%) | 27 (3.7%) |
| 18 to 34 Years | 41 (5.9%) | 126 (15.2%) |
| 35 to 64 Years | 112 (5.8%) | 54 (3.4%) |
| 65 to 74 Years | 44 (13.0%) | 98 (29.2%) |
| 75 Years and over | 112 (35.3%) | 211 (63.0%) |
Disability Class by Sex by Age in Lake Carmel
Disability Class: Hearing Difficulty
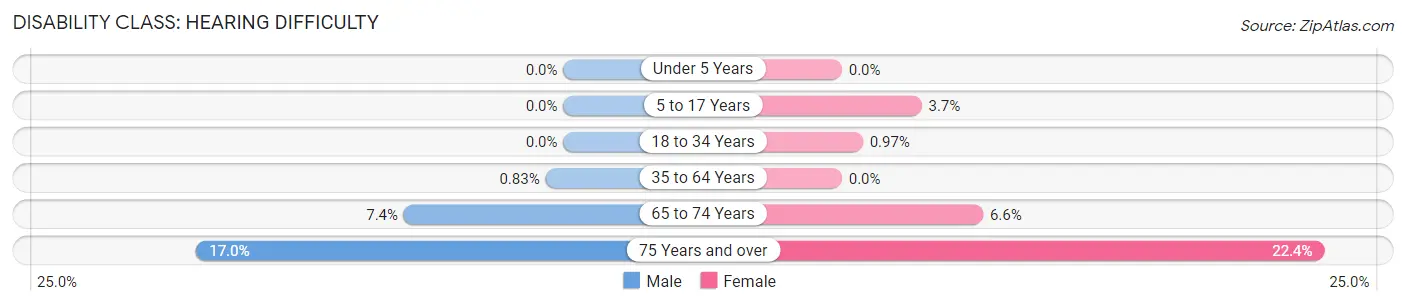
| Age Bracket | Male | Female |
| Under 5 Years | 0 (0.0%) | 0 (0.0%) |
| 5 to 17 Years | 0 (0.0%) | 27 (3.7%) |
| 18 to 34 Years | 0 (0.0%) | 8 (1.0%) |
| 35 to 64 Years | 16 (0.8%) | 0 (0.0%) |
| 65 to 74 Years | 25 (7.4%) | 22 (6.6%) |
| 75 Years and over | 54 (17.0%) | 75 (22.4%) |
Disability Class: Vision Difficulty
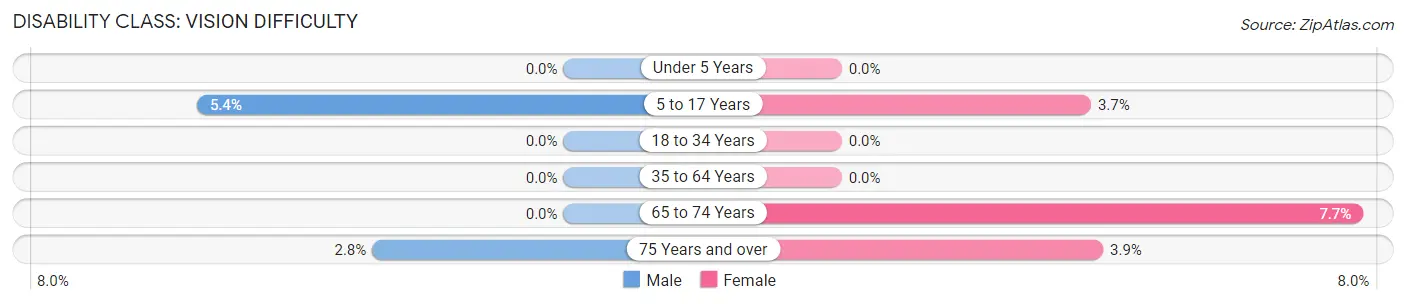
| Age Bracket | Male | Female |
| Under 5 Years | 0 (0.0%) | 0 (0.0%) |
| 5 to 17 Years | 31 (5.4%) | 27 (3.7%) |
| 18 to 34 Years | 0 (0.0%) | 0 (0.0%) |
| 35 to 64 Years | 0 (0.0%) | 0 (0.0%) |
| 65 to 74 Years | 0 (0.0%) | 26 (7.7%) |
| 75 Years and over | 9 (2.8%) | 13 (3.9%) |
Disability Class: Cognitive Difficulty
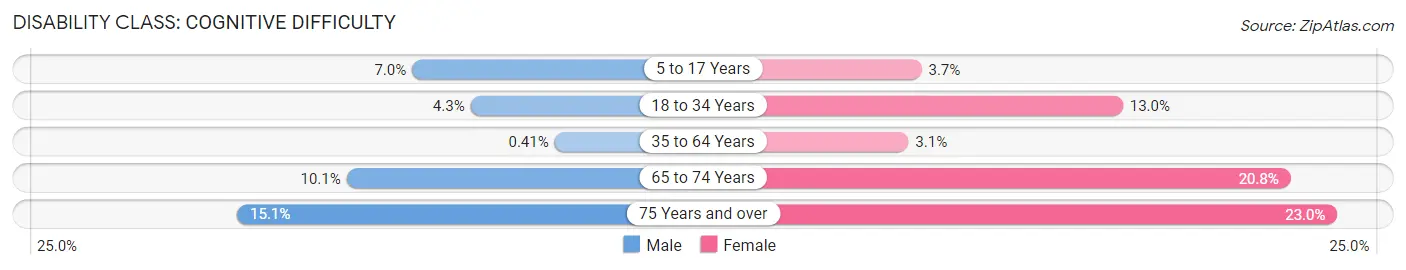
| Age Bracket | Male | Female |
| 5 to 17 Years | 40 (7.0%) | 27 (3.7%) |
| 18 to 34 Years | 30 (4.3%) | 108 (13.0%) |
| 35 to 64 Years | 8 (0.4%) | 49 (3.1%) |
| 65 to 74 Years | 34 (10.1%) | 70 (20.8%) |
| 75 Years and over | 48 (15.1%) | 77 (23.0%) |
Disability Class: Ambulatory Difficulty
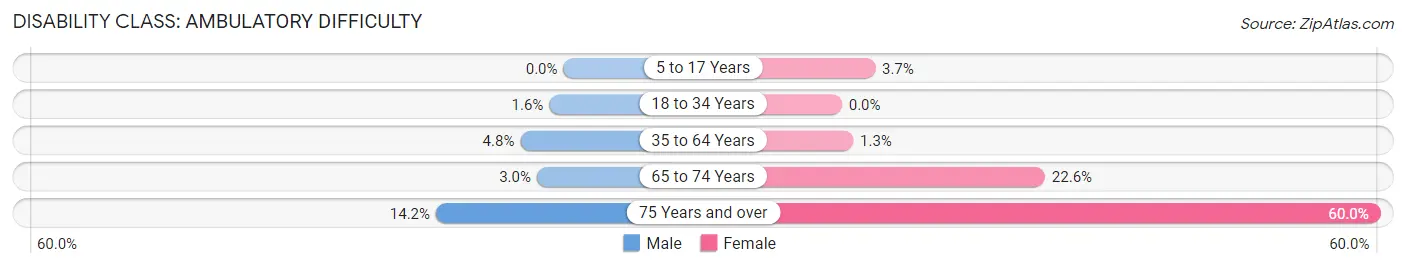
| Age Bracket | Male | Female |
| 5 to 17 Years | 0 (0.0%) | 27 (3.7%) |
| 18 to 34 Years | 11 (1.6%) | 0 (0.0%) |
| 35 to 64 Years | 93 (4.8%) | 20 (1.3%) |
| 65 to 74 Years | 10 (3.0%) | 76 (22.6%) |
| 75 Years and over | 45 (14.2%) | 201 (60.0%) |
Disability Class: Self-Care Difficulty
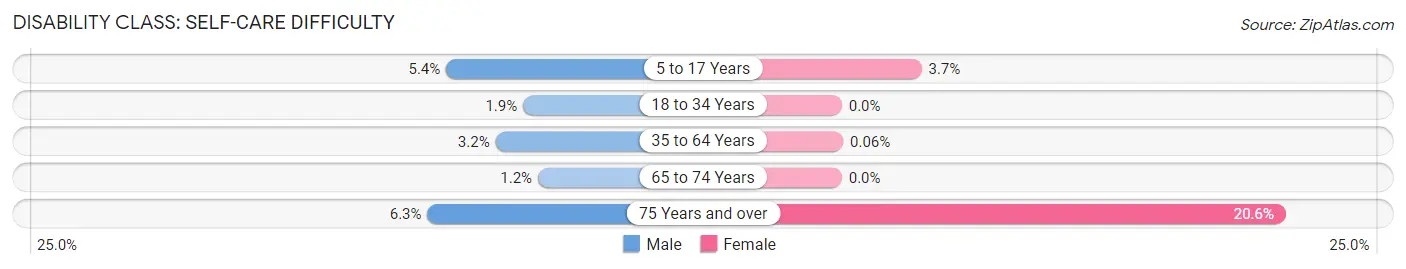
| Age Bracket | Male | Female |
| 5 to 17 Years | 31 (5.4%) | 27 (3.7%) |
| 18 to 34 Years | 13 (1.9%) | 0 (0.0%) |
| 35 to 64 Years | 61 (3.2%) | 1 (0.1%) |
| 65 to 74 Years | 4 (1.2%) | 0 (0.0%) |
| 75 Years and over | 20 (6.3%) | 69 (20.6%) |
Technology Access in Lake Carmel
Computing Device Access in Lake Carmel
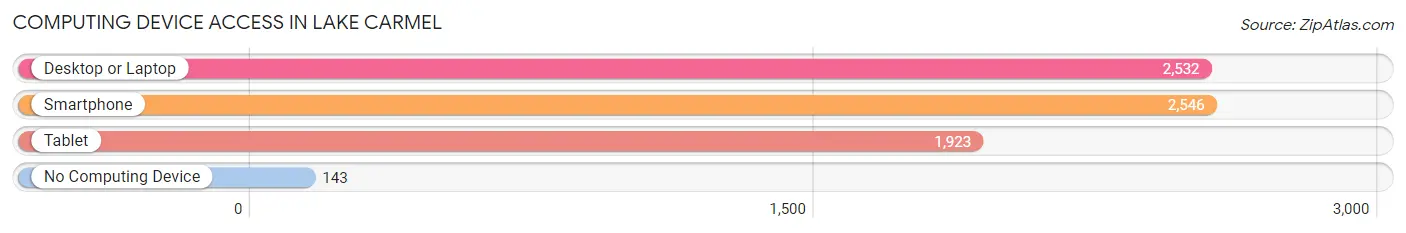
| Device Type | # Households | % Households |
| Desktop or Laptop | 2,532 | 87.3% |
| Smartphone | 2,546 | 87.8% |
| Tablet | 1,923 | 66.3% |
| No Computing Device | 143 | 4.9% |
| Total | 2,900 | 100.0% |
Internet Access in Lake Carmel
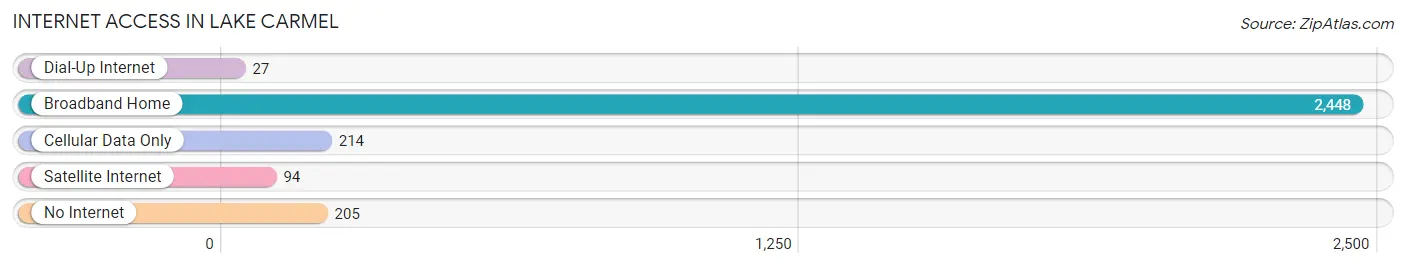
| Internet Type | # Households | % Households |
| Dial-Up Internet | 27 | 0.9% |
| Broadband Home | 2,448 | 84.4% |
| Cellular Data Only | 214 | 7.4% |
| Satellite Internet | 94 | 3.2% |
| No Internet | 205 | 7.1% |
| Total | 2,900 | 100.0% |
Lake Carmel Summary
Carmel is a town located in Putnam County, New York, United States. It is part of the New York metropolitan area. The population was estimated to be at 11,945 in 2019.
History
The area that is now known as Carmel was originally inhabited by the Wappinger Indians. The first European settlers arrived in the area in the late 17th century. The town was officially established in 1795 and was named after the biblical Mount Carmel.
In the 19th century, the town was a popular destination for wealthy New Yorkers who wanted to escape the hustle and bustle of the city. The town was home to several large estates, including the estate of William Rockefeller, the brother of John D. Rockefeller.
In the 20th century, the town continued to be a popular destination for wealthy New Yorkers. The town was also home to several large corporations, including IBM and PepsiCo.
Geography
Carmel is located in the southeastern part of Putnam County, New York. It is bordered by the towns of Kent, Patterson, Southeast, and Putnam Valley. The town is located approximately 50 miles north of New York City.
The town is located in the Hudson Valley region of New York and is part of the Appalachian Mountains. The terrain is mostly hilly and forested, with several small lakes and streams. The highest point in the town is the summit of Mount Carmel, which is 1,845 feet above sea level.
Economy
Carmel is a largely residential town, with a few small businesses located in the town center. The town is home to several large corporations, including IBM and PepsiCo. The town is also home to several small businesses, including restaurants, retail stores, and professional services.
The town is also home to several large estates, including the estate of William Rockefeller. The town is also home to several golf courses, including the Putnam County Golf Course.
Demographics
As of the 2010 census, the population of Carmel was 11,945. The racial makeup of the town was 94.3% White, 2.2% African American, 0.3% Native American, 1.2% Asian, 0.1% Pacific Islander, 0.7% from other races, and 1.4% from two or more races. Hispanic or Latino of any race were 4.2% of the population.
The median household income in the town was $90,945, and the median family income was $103,945. The per capita income for the town was $41,945. About 3.2% of families and 4.3% of the population were below the poverty line, including 5.2% of those under age 18 and 4.2% of those age 65 or over.
Conclusion
Carmel is a town located in Putnam County, New York. It is part of the New York metropolitan area and is home to several large corporations, including IBM and PepsiCo. The town is largely residential, with a few small businesses located in the town center. The population of the town was estimated to be at 11,945 in 2019. The town is home to several large estates, including the estate of William Rockefeller, and several golf courses. The median household income in the town was $90,945, and the median family income was $103,945.
Common Questions
What is Per Capita Income in Lake Carmel?
Per Capita income in Lake Carmel is $47,137.
What is the Median Family Income in Lake Carmel?
Median Family Income in Lake Carmel is $130,096.
What is the Median Household income in Lake Carmel?
Median Household Income in Lake Carmel is $102,125.
What is Income or Wage Gap in Lake Carmel?
Income or Wage Gap in Lake Carmel is 31.9%.
Women in Lake Carmel earn 68.1 cents for every dollar earned by a man.
What is Inequality or Gini Index in Lake Carmel?
Inequality or Gini Index in Lake Carmel is 0.40.
What is the Total Population of Lake Carmel?
Total Population of Lake Carmel is 8,089.
What is the Total Male Population of Lake Carmel?
Total Male Population of Lake Carmel is 4,053.
What is the Total Female Population of Lake Carmel?
Total Female Population of Lake Carmel is 4,036.
What is the Ratio of Males per 100 Females in Lake Carmel?
There are 100.42 Males per 100 Females in Lake Carmel.
What is the Ratio of Females per 100 Males in Lake Carmel?
There are 99.58 Females per 100 Males in Lake Carmel.
What is the Median Population Age in Lake Carmel?
Median Population Age in Lake Carmel is 42.9 Years.
What is the Average Family Size in Lake Carmel
Average Family Size in Lake Carmel is 3.3 People.
What is the Average Household Size in Lake Carmel
Average Household Size in Lake Carmel is 2.8 People.
How Large is the Labor Force in Lake Carmel?
There are 4,641 People in the Labor Forcein in Lake Carmel.
What is the Percentage of People in the Labor Force in Lake Carmel?
69.9% of People are in the Labor Force in Lake Carmel.
What is the Unemployment Rate in Lake Carmel?
Unemployment Rate in Lake Carmel is 3.7%.