Greenport, NY Map & Demographics
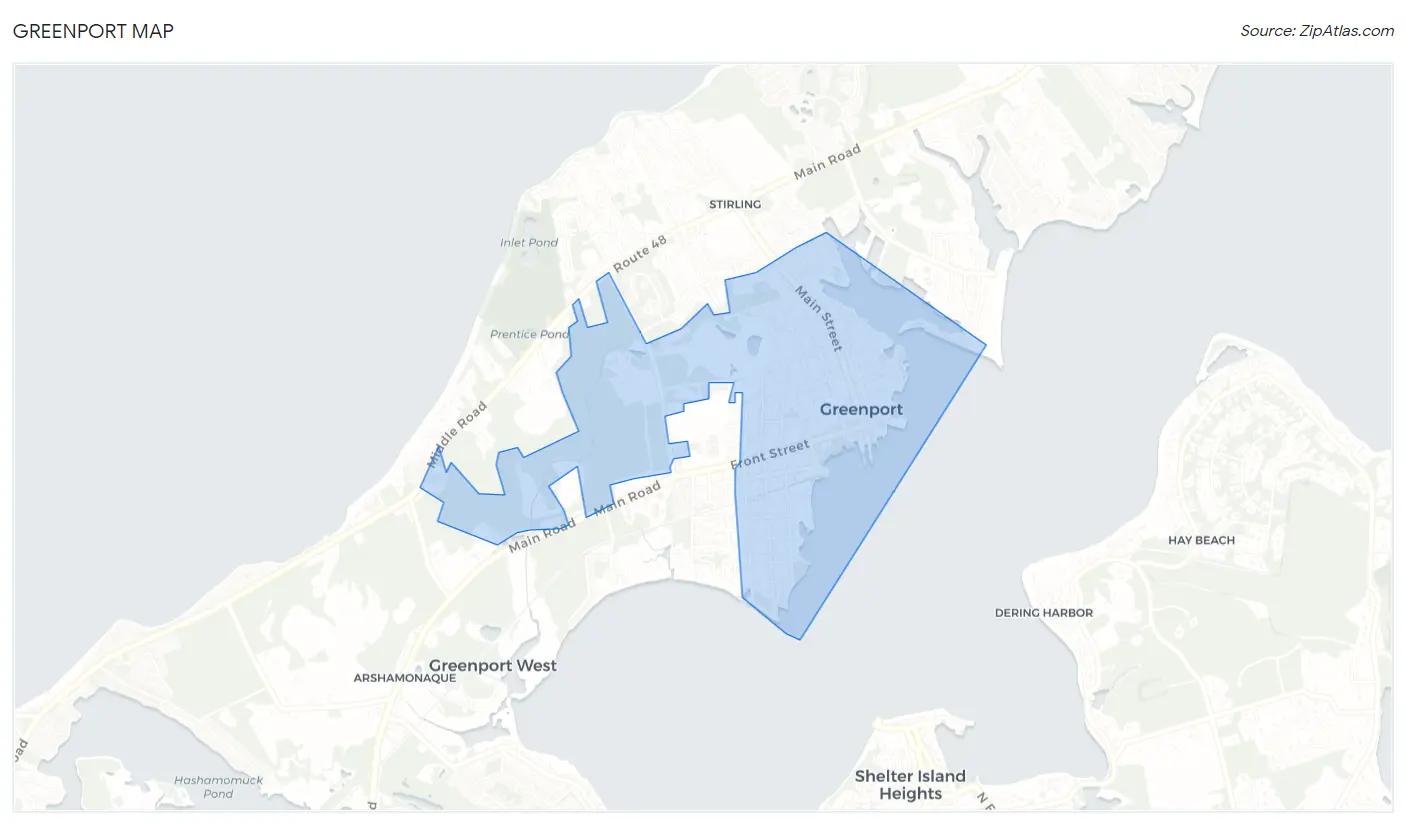
Greenport Map
Greenport Overview
$58,316
PER CAPITA INCOME
$117,031
AVG FAMILY INCOME
$78,919
AVG HOUSEHOLD INCOME
34.0%
WAGE / INCOME GAP [ % ]
66.0¢/ $1
WAGE / INCOME GAP [ $ ]
0.53
INEQUALITY / GINI INDEX
2,569
TOTAL POPULATION
1,169
MALE POPULATION
1,400
FEMALE POPULATION
83.50
MALES / 100 FEMALES
119.76
FEMALES / 100 MALES
54.6
MEDIAN AGE
2.7
AVG FAMILY SIZE
2.2
AVG HOUSEHOLD SIZE
1,494
LABOR FORCE [ PEOPLE ]
65.7%
PERCENT IN LABOR FORCE
5.5%
UNEMPLOYMENT RATE
Greenport Zip Codes
Greenport Area Codes
Income in Greenport
Income Overview in Greenport
Per Capita Income in Greenport is $58,316, while median incomes of families and households are $117,031 and $78,919 respectively.
| Characteristic | Number | Measure |
| Per Capita Income | 2,569 | $58,316 |
| Median Family Income | 692 | $117,031 |
| Mean Family Income | 692 | $166,298 |
| Median Household Income | 1,126 | $78,919 |
| Mean Household Income | 1,126 | $129,761 |
| Income Deficit | 692 | $0 |
| Wage / Income Gap (%) | 2,569 | 33.96% |
| Wage / Income Gap ($) | 2,569 | 66.04¢ per $1 |
| Gini / Inequality Index | 2,569 | 0.53 |
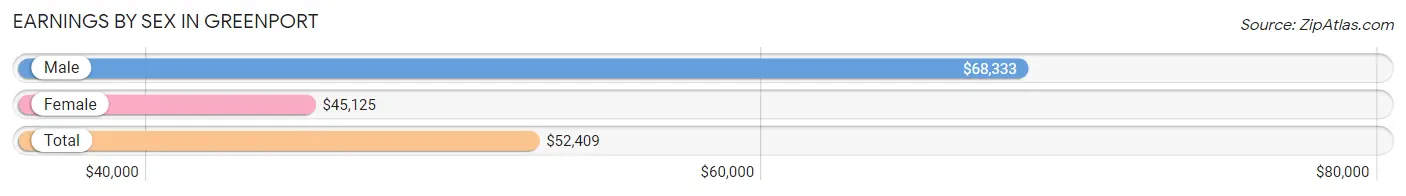
Earnings by Sex in Greenport
Average Earnings in Greenport are $52,409, $68,333 for men and $45,125 for women, a difference of 34.0%.
| Sex | Number | Average Earnings |
| Male | 760 (49.7%) | $68,333 |
| Female | 769 (50.3%) | $45,125 |
| Total | 1,529 (100.0%) | $52,409 |
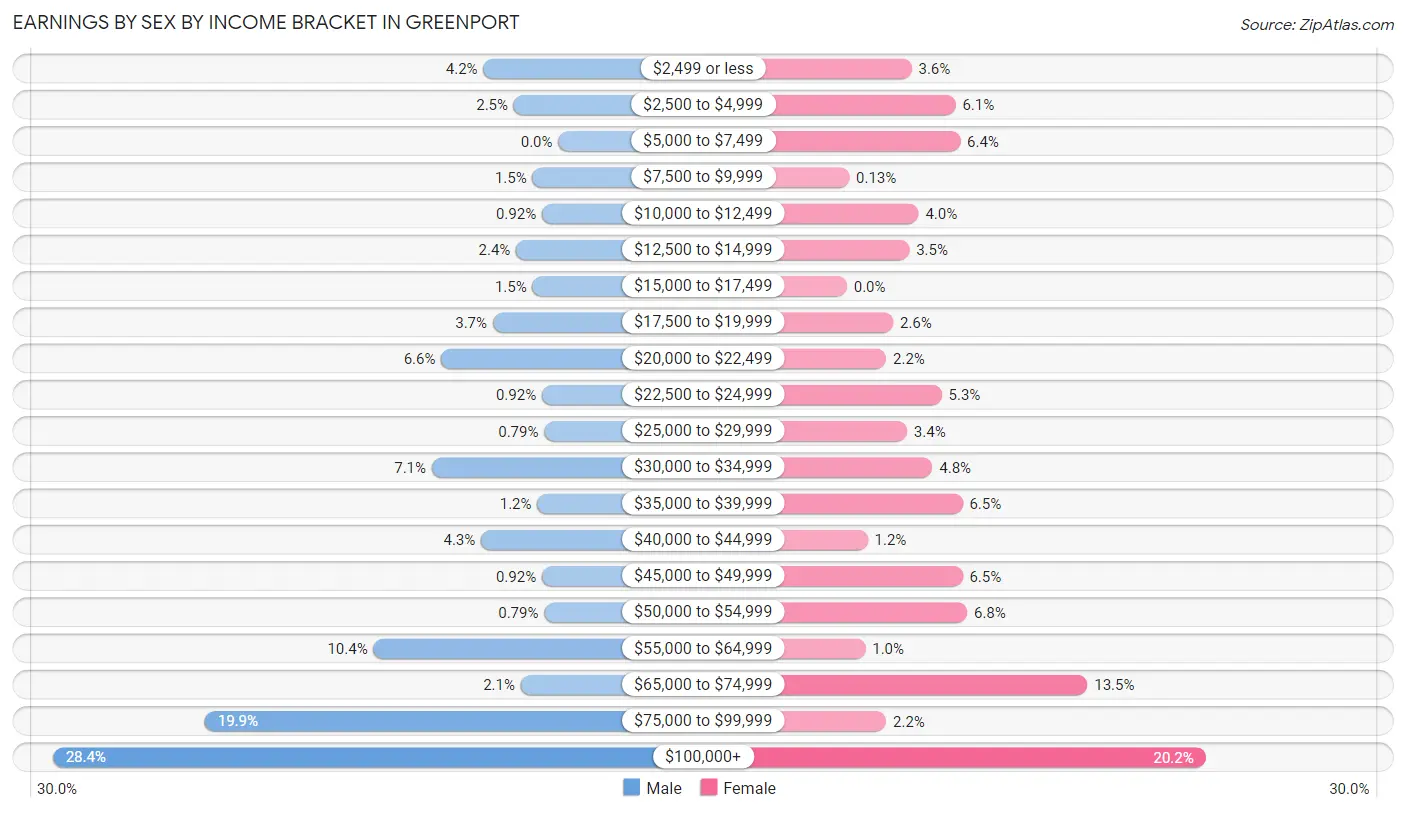
Earnings by Sex by Income Bracket in Greenport
The most common earnings brackets in Greenport are $100,000+ for men (216 | 28.4%) and $100,000+ for women (155 | 20.2%).
| Income | Male | Female |
| $2,499 or less | 32 (4.2%) | 28 (3.6%) |
| $2,500 to $4,999 | 19 (2.5%) | 47 (6.1%) |
| $5,000 to $7,499 | 0 (0.0%) | 49 (6.4%) |
| $7,500 to $9,999 | 11 (1.5%) | 1 (0.1%) |
| $10,000 to $12,499 | 7 (0.9%) | 31 (4.0%) |
| $12,500 to $14,999 | 18 (2.4%) | 27 (3.5%) |
| $15,000 to $17,499 | 11 (1.5%) | 0 (0.0%) |
| $17,500 to $19,999 | 28 (3.7%) | 20 (2.6%) |
| $20,000 to $22,499 | 50 (6.6%) | 17 (2.2%) |
| $22,500 to $24,999 | 7 (0.9%) | 41 (5.3%) |
| $25,000 to $29,999 | 6 (0.8%) | 26 (3.4%) |
| $30,000 to $34,999 | 54 (7.1%) | 37 (4.8%) |
| $35,000 to $39,999 | 9 (1.2%) | 50 (6.5%) |
| $40,000 to $44,999 | 33 (4.3%) | 9 (1.2%) |
| $45,000 to $49,999 | 7 (0.9%) | 50 (6.5%) |
| $50,000 to $54,999 | 6 (0.8%) | 52 (6.8%) |
| $55,000 to $64,999 | 79 (10.4%) | 8 (1.0%) |
| $65,000 to $74,999 | 16 (2.1%) | 104 (13.5%) |
| $75,000 to $99,999 | 151 (19.9%) | 17 (2.2%) |
| $100,000+ | 216 (28.4%) | 155 (20.2%) |
| Total | 760 (100.0%) | 769 (100.0%) |
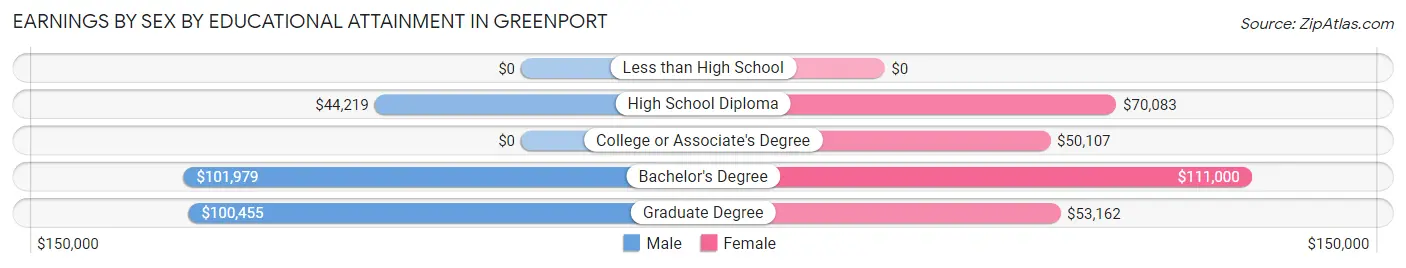
Earnings by Sex by Educational Attainment in Greenport
Average earnings in Greenport are $75,278 for men and $51,071 for women, a difference of 32.2%. Men with an educational attainment of bachelor's degree enjoy the highest average annual earnings of $101,979, while those with high school diploma education earn the least with $44,219. Women with an educational attainment of bachelor's degree earn the most with the average annual earnings of $111,000, while those with college or associate's degree education have the smallest earnings of $50,107.
| Educational Attainment | Male Income | Female Income |
| Less than High School | - | - |
| High School Diploma | $44,219 | $70,083 |
| College or Associate's Degree | - | - |
| Bachelor's Degree | $101,979 | $111,000 |
| Graduate Degree | $100,455 | $53,162 |
| Total | $75,278 | $51,071 |
Family Income in Greenport
Family Income Brackets in Greenport
According to the Greenport family income data, there are 149 families falling into the $200,000+ income range, which is the most common income bracket and makes up 21.5% of all families.
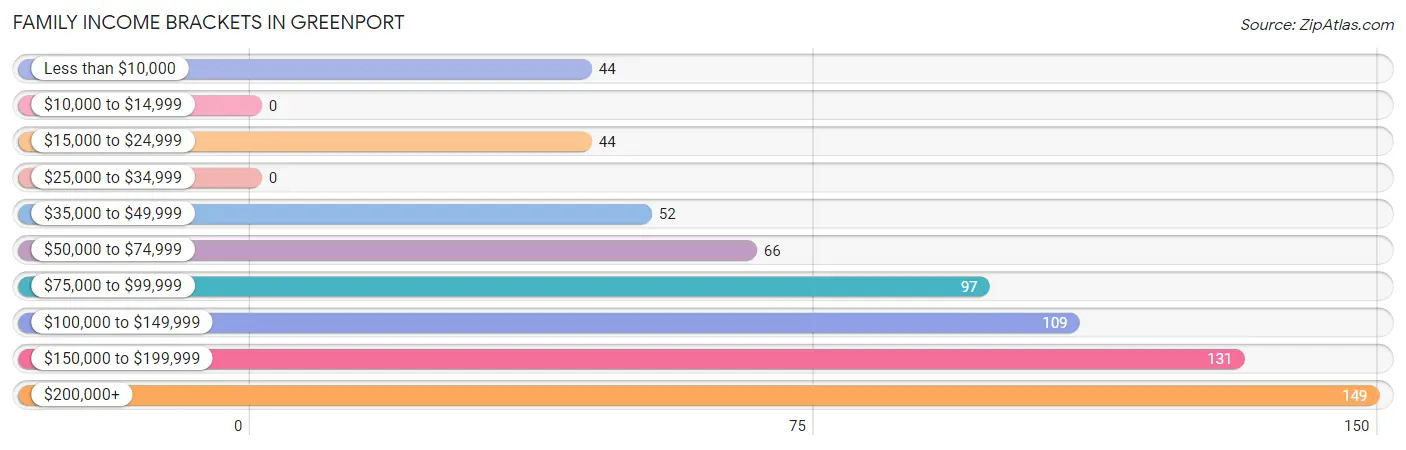
| Income Bracket | # Families | % Families |
| Less than $10,000 | 44 | 6.4% |
| $10,000 to $14,999 | 0 | 0.0% |
| $15,000 to $24,999 | 44 | 6.4% |
| $25,000 to $34,999 | 0 | 0.0% |
| $35,000 to $49,999 | 52 | 7.5% |
| $50,000 to $74,999 | 66 | 9.5% |
| $75,000 to $99,999 | 97 | 14.0% |
| $100,000 to $149,999 | 109 | 15.8% |
| $150,000 to $199,999 | 131 | 18.9% |
| $200,000+ | 149 | 21.5% |
Family Income by Famaliy Size in Greenport
3-person families (195 | 28.2%) account for the highest median family income in Greenport with $144,199 per family, while 2-person families (372 | 53.8%) have the highest median income of $49,375 per family member.
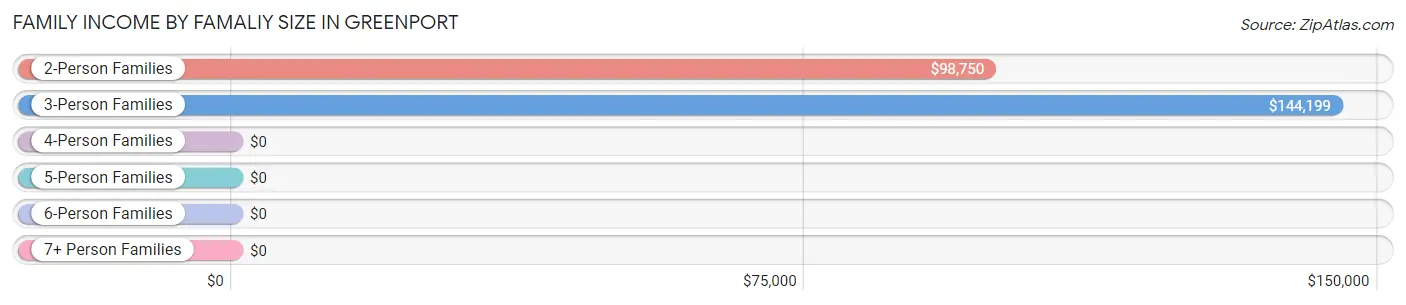
| Income Bracket | # Families | Median Income |
| 2-Person Families | 372 (53.8%) | $98,750 |
| 3-Person Families | 195 (28.2%) | $144,199 |
| 4-Person Families | 117 (16.9%) | $0 |
| 5-Person Families | 0 (0.0%) | $0 |
| 6-Person Families | 0 (0.0%) | $0 |
| 7+ Person Families | 8 (1.2%) | $0 |
| Total | 692 (100.0%) | $117,031 |
Family Income by Number of Earners in Greenport
The median family income in Greenport is $117,031, with families comprising 3+ earners (142) having the highest median family income of $177,841, while families with no earners (70) have the lowest median family income of $38,125, accounting for 20.5% and 10.1% of families, respectively.
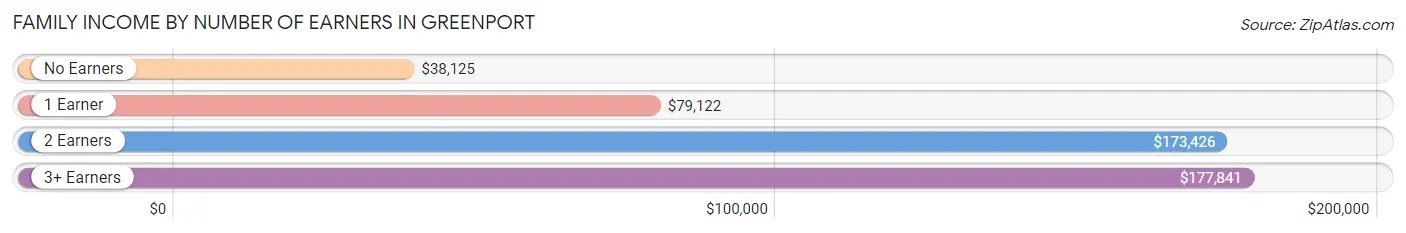
| Number of Earners | # Families | Median Income |
| No Earners | 70 (10.1%) | $38,125 |
| 1 Earner | 242 (35.0%) | $79,122 |
| 2 Earners | 238 (34.4%) | $173,426 |
| 3+ Earners | 142 (20.5%) | $177,841 |
| Total | 692 (100.0%) | $117,031 |
Household Income in Greenport
Household Income Brackets in Greenport
With 172 households falling in the category, the $200,000+ income range is the most frequent in Greenport, accounting for 15.3% of all households. In contrast, only 55 households (4.9%) fall into the $10,000 to $14,999 income bracket, making it the least populous group.
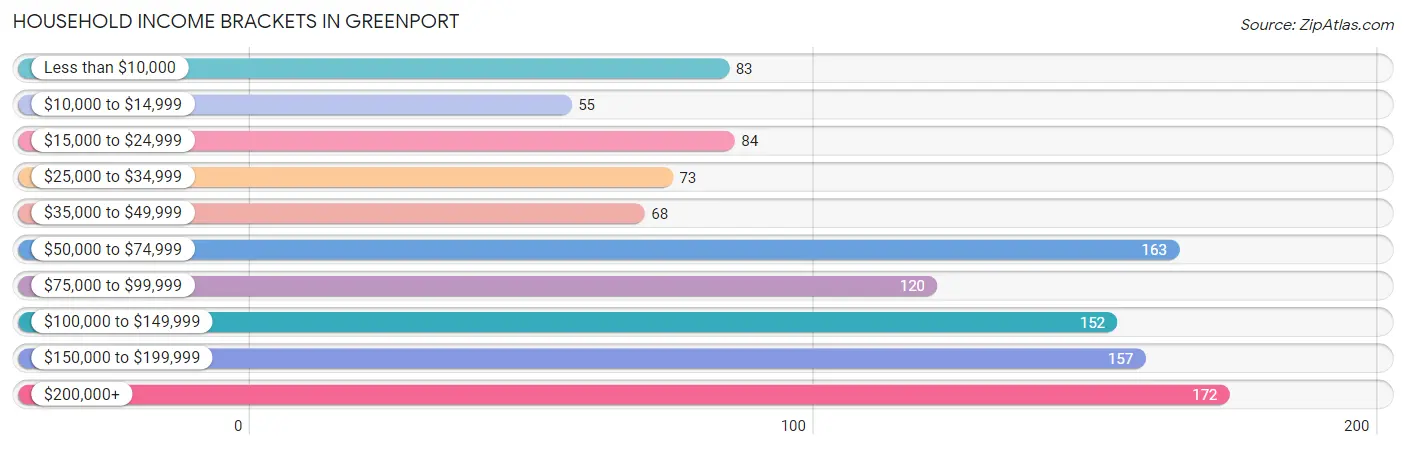
| Income Bracket | # Households | % Households |
| Less than $10,000 | 83 | 7.4% |
| $10,000 to $14,999 | 55 | 4.9% |
| $15,000 to $24,999 | 84 | 7.5% |
| $25,000 to $34,999 | 73 | 6.5% |
| $35,000 to $49,999 | 68 | 6.0% |
| $50,000 to $74,999 | 163 | 14.5% |
| $75,000 to $99,999 | 120 | 10.7% |
| $100,000 to $149,999 | 152 | 13.5% |
| $150,000 to $199,999 | 157 | 13.9% |
| $200,000+ | 172 | 15.3% |
Household Income by Householder Age in Greenport
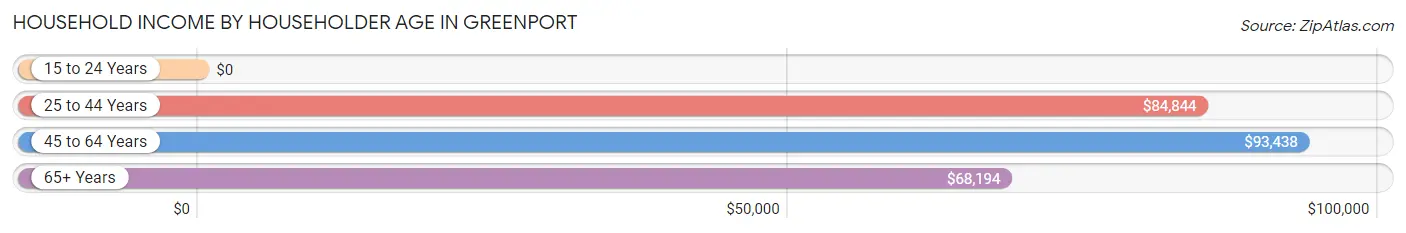
The median household income in Greenport is $78,919, with the highest median household income of $93,438 found in the 45 to 64 years age bracket for the primary householder. A total of 470 households (41.7%) fall into this category.
| Income Bracket | # Households | Median Income |
| 15 to 24 Years | 0 (0.0%) | $0 |
| 25 to 44 Years | 231 (20.5%) | $84,844 |
| 45 to 64 Years | 470 (41.7%) | $93,438 |
| 65+ Years | 425 (37.7%) | $68,194 |
| Total | 1,126 (100.0%) | $78,919 |
Poverty in Greenport
Income Below Poverty by Sex and Age in Greenport
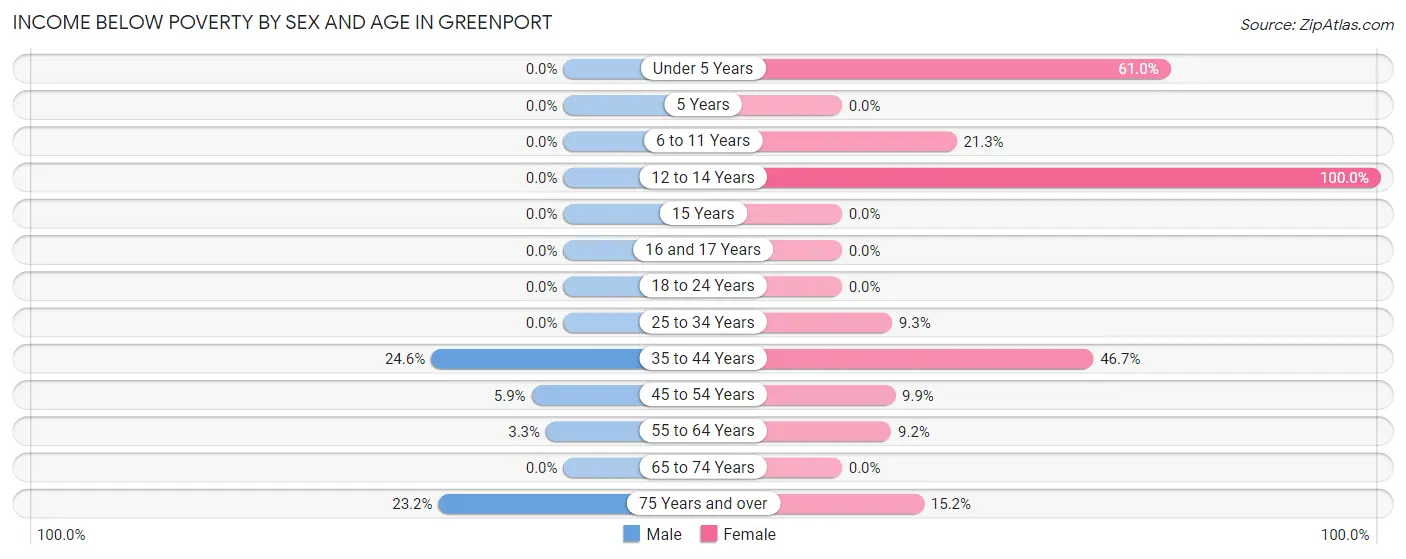
With 6.6% poverty level for males and 15.7% for females among the residents of Greenport, 35 to 44 year old males and 12 to 14 year old females are the most vulnerable to poverty, with 43 males (24.6%) and 30 females (100.0%) in their respective age groups living below the poverty level.
| Age Bracket | Male | Female |
| Under 5 Years | 0 (0.0%) | 36 (61.0%) |
| 5 Years | 0 (0.0%) | 0 (0.0%) |
| 6 to 11 Years | 0 (0.0%) | 10 (21.3%) |
| 12 to 14 Years | 0 (0.0%) | 30 (100.0%) |
| 15 Years | 0 (0.0%) | 0 (0.0%) |
| 16 and 17 Years | 0 (0.0%) | 0 (0.0%) |
| 18 to 24 Years | 0 (0.0%) | 0 (0.0%) |
| 25 to 34 Years | 0 (0.0%) | 8 (9.3%) |
| 35 to 44 Years | 43 (24.6%) | 56 (46.7%) |
| 45 to 54 Years | 10 (5.9%) | 19 (9.9%) |
| 55 to 64 Years | 9 (3.3%) | 28 (9.1%) |
| 65 to 74 Years | 0 (0.0%) | 0 (0.0%) |
| 75 Years and over | 13 (23.2%) | 23 (15.2%) |
| Total | 75 (6.6%) | 210 (15.7%) |
Income Above Poverty by Sex and Age in Greenport
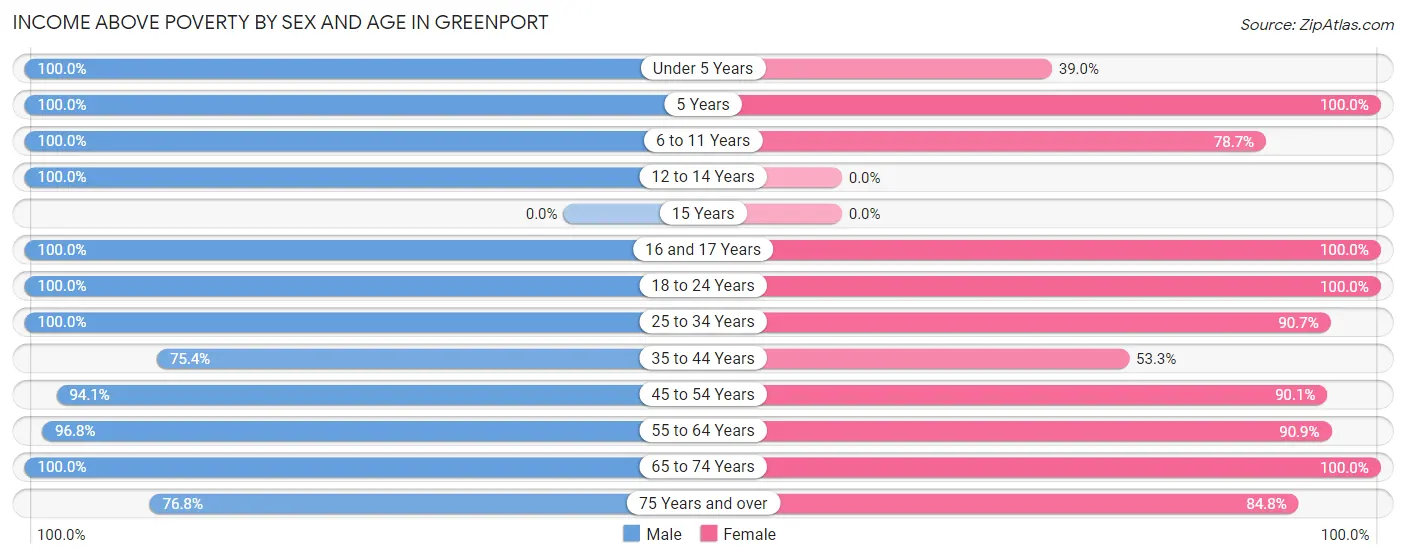
According to the poverty statistics in Greenport, males aged under 5 years and females aged 5 years are the age groups that are most secure financially, with 100.0% of males and 100.0% of females in these age groups living above the poverty line.
| Age Bracket | Male | Female |
| Under 5 Years | 8 (100.0%) | 23 (39.0%) |
| 5 Years | 2 (100.0%) | 31 (100.0%) |
| 6 to 11 Years | 94 (100.0%) | 37 (78.7%) |
| 12 to 14 Years | 24 (100.0%) | 0 (0.0%) |
| 15 Years | 0 (0.0%) | 0 (0.0%) |
| 16 and 17 Years | 20 (100.0%) | 39 (100.0%) |
| 18 to 24 Years | 10 (100.0%) | 88 (100.0%) |
| 25 to 34 Years | 114 (100.0%) | 78 (90.7%) |
| 35 to 44 Years | 132 (75.4%) | 64 (53.3%) |
| 45 to 54 Years | 159 (94.1%) | 173 (90.1%) |
| 55 to 64 Years | 268 (96.8%) | 278 (90.8%) |
| 65 to 74 Years | 183 (100.0%) | 188 (100.0%) |
| 75 Years and over | 43 (76.8%) | 128 (84.8%) |
| Total | 1,057 (93.4%) | 1,127 (84.3%) |
Income Below Poverty Among Married-Couple Families in Greenport
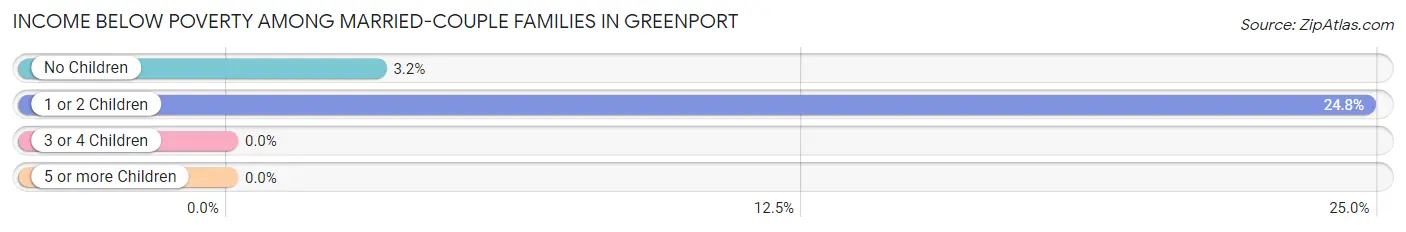
The poverty statistics for married-couple families in Greenport show that 7.3% or 40 of the total 546 families live below the poverty line. Families with 1 or 2 children have the highest poverty rate of 24.8%, comprising of 26 families. On the other hand, families with 3 or 4 children have the lowest poverty rate of 0.0%, which includes 0 families.
| Children | Above Poverty | Below Poverty |
| No Children | 419 (96.8%) | 14 (3.2%) |
| 1 or 2 Children | 79 (75.2%) | 26 (24.8%) |
| 3 or 4 Children | 8 (100.0%) | 0 (0.0%) |
| 5 or more Children | 0 (0.0%) | 0 (0.0%) |
| Total | 506 (92.7%) | 40 (7.3%) |
Income Below Poverty Among Single-Parent Households in Greenport
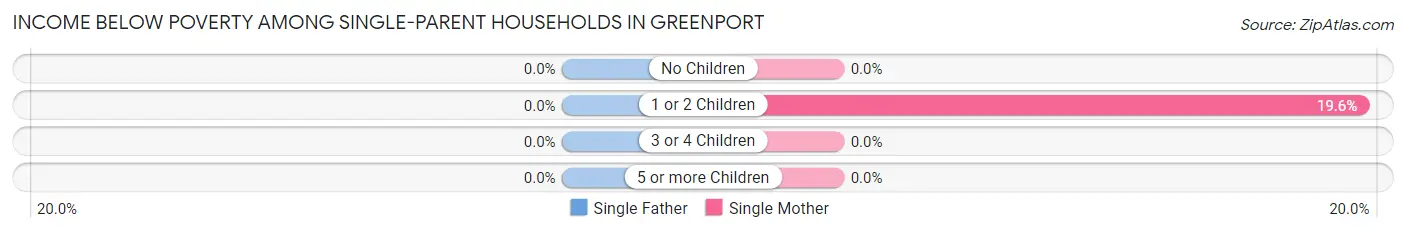
| Children | Single Father | Single Mother |
| No Children | 0 (0.0%) | 0 (0.0%) |
| 1 or 2 Children | 0 (0.0%) | 9 (19.6%) |
| 3 or 4 Children | 0 (0.0%) | 0 (0.0%) |
| 5 or more Children | 0 (0.0%) | 0 (0.0%) |
| Total | 0 (0.0%) | 9 (9.7%) |
Income Below Poverty Among Married-Couple vs Single-Parent Households in Greenport
The poverty data for Greenport shows that 40 of the married-couple family households (7.3%) and 9 of the single-parent households (6.2%) are living below the poverty level. Within the married-couple family households, those with 1 or 2 children have the highest poverty rate, with 26 households (24.8%) falling below the poverty line. Among the single-parent households, those with 1 or 2 children have the highest poverty rate, with 9 household (9.9%) living below poverty.
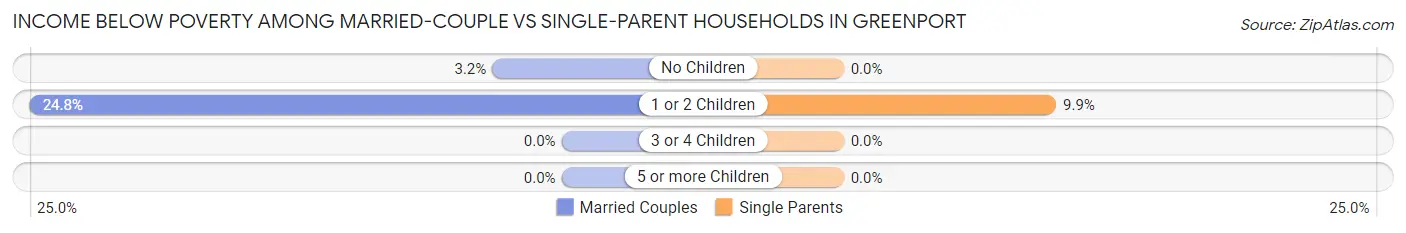
| Children | Married-Couple Families | Single-Parent Households |
| No Children | 14 (3.2%) | 0 (0.0%) |
| 1 or 2 Children | 26 (24.8%) | 9 (9.9%) |
| 3 or 4 Children | 0 (0.0%) | 0 (0.0%) |
| 5 or more Children | 0 (0.0%) | 0 (0.0%) |
| Total | 40 (7.3%) | 9 (6.2%) |
Race in Greenport
The most populous races in Greenport are White / Caucasian (1,953 | 76.0%), Hispanic or Latino (653 | 25.4%), and Some other Race (383 | 14.9%).
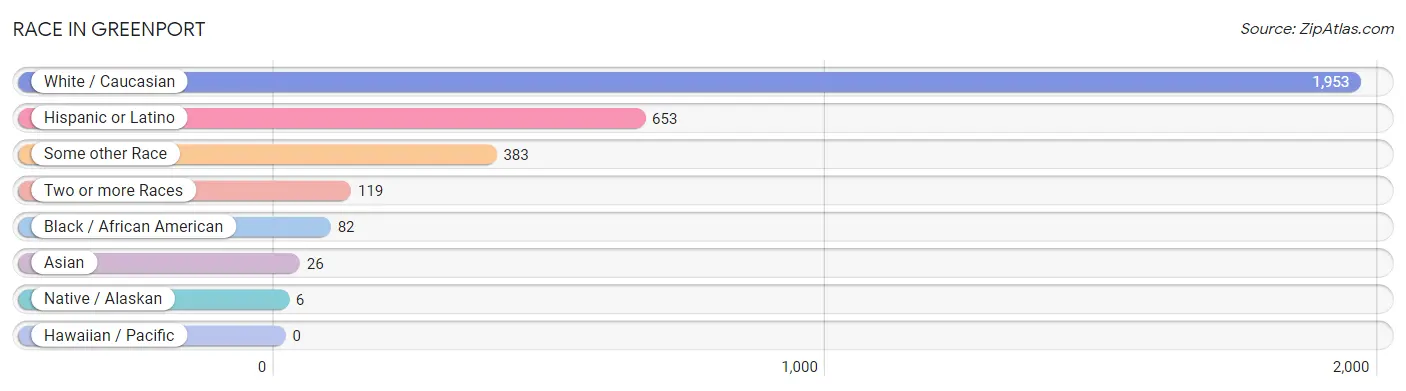
| Race | # Population | % Population |
| Asian | 26 | 1.0% |
| Black / African American | 82 | 3.2% |
| Hawaiian / Pacific | 0 | 0.0% |
| Hispanic or Latino | 653 | 25.4% |
| Native / Alaskan | 6 | 0.2% |
| White / Caucasian | 1,953 | 76.0% |
| Two or more Races | 119 | 4.6% |
| Some other Race | 383 | 14.9% |
| Total | 2,569 | 100.0% |
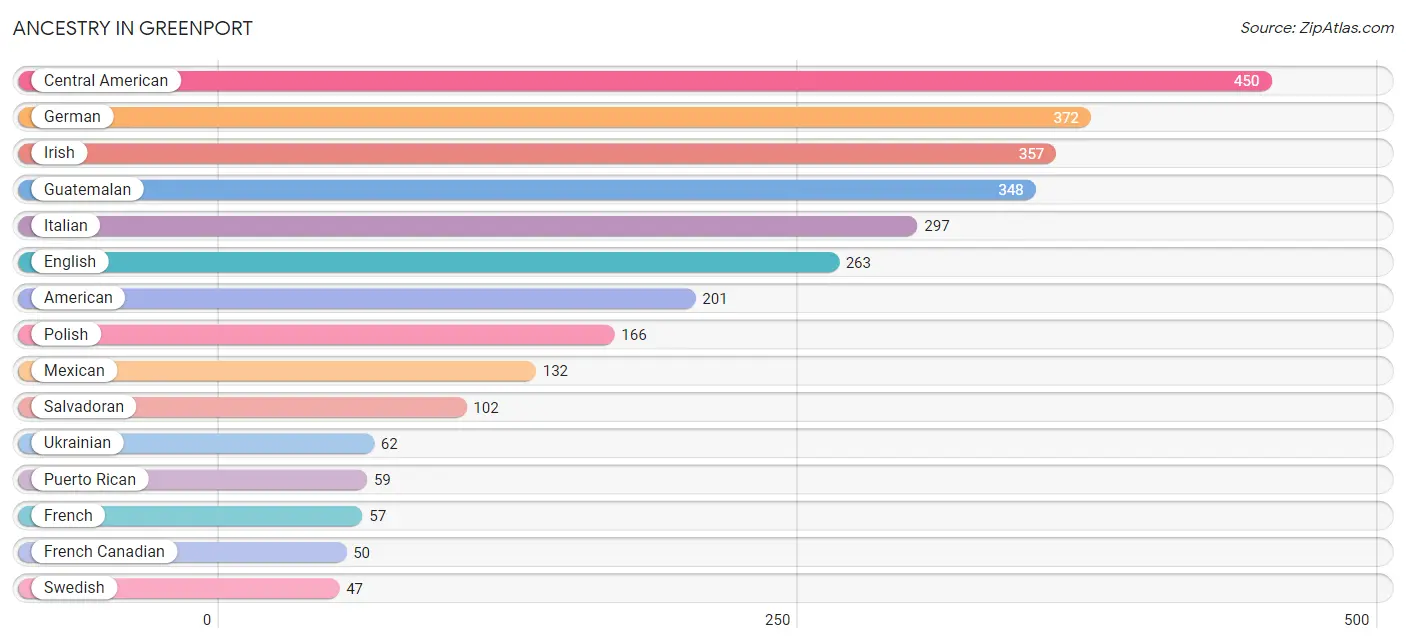
Ancestry in Greenport
The most populous ancestries reported in Greenport are Central American (450 | 17.5%), German (372 | 14.5%), Irish (357 | 13.9%), Guatemalan (348 | 13.6%), and Italian (297 | 11.6%), together accounting for 71.0% of all Greenport residents.
| Ancestry | # Population | % Population |
| African | 24 | 0.9% |
| American | 201 | 7.8% |
| Armenian | 9 | 0.4% |
| Australian | 20 | 0.8% |
| Austrian | 14 | 0.5% |
| British | 18 | 0.7% |
| Canadian | 9 | 0.4% |
| Central American | 450 | 17.5% |
| Cherokee | 19 | 0.7% |
| Czech | 31 | 1.2% |
| Danish | 8 | 0.3% |
| Dominican | 8 | 0.3% |
| Dutch | 20 | 0.8% |
| Eastern European | 34 | 1.3% |
| English | 263 | 10.2% |
| European | 17 | 0.7% |
| French | 57 | 2.2% |
| French Canadian | 50 | 1.9% |
| German | 372 | 14.5% |
| Greek | 25 | 1.0% |
| Guatemalan | 348 | 13.6% |
| Haitian | 3 | 0.1% |
| Hungarian | 8 | 0.3% |
| Irish | 357 | 13.9% |
| Italian | 297 | 11.6% |
| Korean | 19 | 0.7% |
| Lithuanian | 8 | 0.3% |
| Mexican | 132 | 5.1% |
| Norwegian | 3 | 0.1% |
| Polish | 166 | 6.5% |
| Puerto Rican | 59 | 2.3% |
| Russian | 25 | 1.0% |
| Salvadoran | 102 | 4.0% |
| Scandinavian | 8 | 0.3% |
| Scotch-Irish | 44 | 1.7% |
| Scottish | 36 | 1.4% |
| Slavic | 9 | 0.4% |
| Subsaharan African | 24 | 0.9% |
| Swedish | 47 | 1.8% |
| Swiss | 8 | 0.3% |
| Thai | 7 | 0.3% |
| Ukrainian | 62 | 2.4% |
| Welsh | 28 | 1.1% | View All 43 Rows |
Immigrants in Greenport
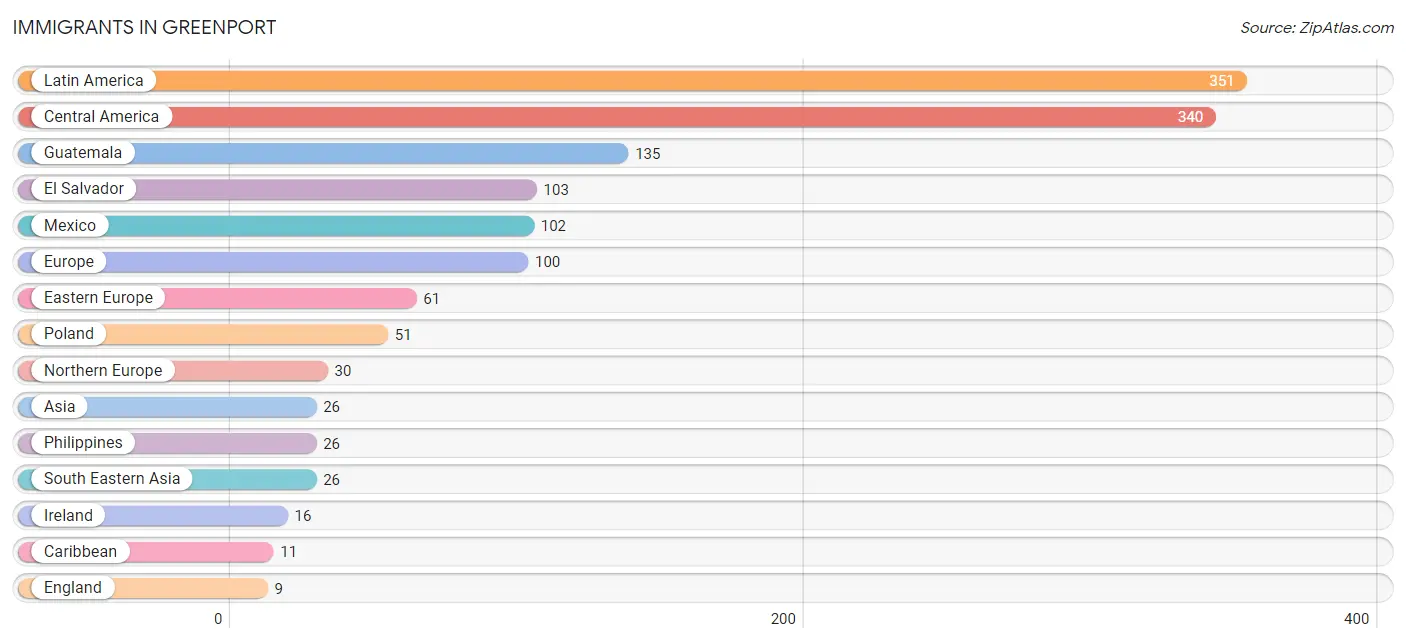
The most numerous immigrant groups reported in Greenport came from Latin America (351 | 13.7%), Central America (340 | 13.2%), Guatemala (135 | 5.2%), El Salvador (103 | 4.0%), and Mexico (102 | 4.0%), together accounting for 40.1% of all Greenport residents.
| Immigration Origin | # Population | % Population |
| Africa | 7 | 0.3% |
| Asia | 26 | 1.0% |
| Australia | 7 | 0.3% |
| Caribbean | 11 | 0.4% |
| Central America | 340 | 13.2% |
| Dominican Republic | 8 | 0.3% |
| Eastern Africa | 7 | 0.3% |
| Eastern Europe | 61 | 2.4% |
| El Salvador | 103 | 4.0% |
| England | 9 | 0.4% |
| Europe | 100 | 3.9% |
| Guatemala | 135 | 5.2% |
| Haiti | 3 | 0.1% |
| Ireland | 16 | 0.6% |
| Italy | 9 | 0.4% |
| Latin America | 351 | 13.7% |
| Mexico | 102 | 4.0% |
| Northern Europe | 30 | 1.2% |
| Oceania | 7 | 0.3% |
| Philippines | 26 | 1.0% |
| Poland | 51 | 2.0% |
| South Eastern Asia | 26 | 1.0% |
| Southern Europe | 9 | 0.4% |
| Zimbabwe | 7 | 0.3% | View All 24 Rows |
Sex and Age in Greenport
Sex and Age in Greenport
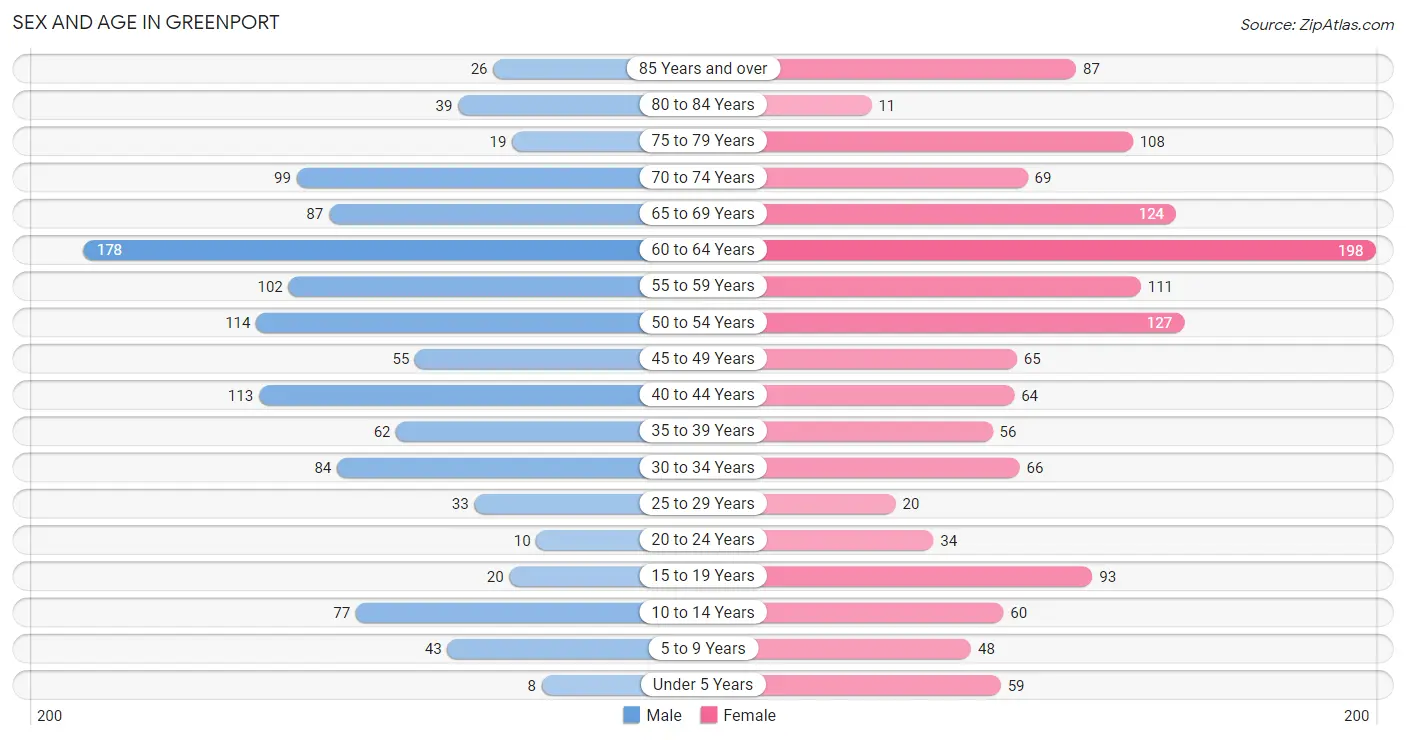
The most populous age groups in Greenport are 60 to 64 Years (178 | 15.2%) for men and 60 to 64 Years (198 | 14.1%) for women.
| Age Bracket | Male | Female |
| Under 5 Years | 8 (0.7%) | 59 (4.2%) |
| 5 to 9 Years | 43 (3.7%) | 48 (3.4%) |
| 10 to 14 Years | 77 (6.6%) | 60 (4.3%) |
| 15 to 19 Years | 20 (1.7%) | 93 (6.6%) |
| 20 to 24 Years | 10 (0.9%) | 34 (2.4%) |
| 25 to 29 Years | 33 (2.8%) | 20 (1.4%) |
| 30 to 34 Years | 84 (7.2%) | 66 (4.7%) |
| 35 to 39 Years | 62 (5.3%) | 56 (4.0%) |
| 40 to 44 Years | 113 (9.7%) | 64 (4.6%) |
| 45 to 49 Years | 55 (4.7%) | 65 (4.6%) |
| 50 to 54 Years | 114 (9.8%) | 127 (9.1%) |
| 55 to 59 Years | 102 (8.7%) | 111 (7.9%) |
| 60 to 64 Years | 178 (15.2%) | 198 (14.1%) |
| 65 to 69 Years | 87 (7.4%) | 124 (8.9%) |
| 70 to 74 Years | 99 (8.5%) | 69 (4.9%) |
| 75 to 79 Years | 19 (1.6%) | 108 (7.7%) |
| 80 to 84 Years | 39 (3.3%) | 11 (0.8%) |
| 85 Years and over | 26 (2.2%) | 87 (6.2%) |
| Total | 1,169 (100.0%) | 1,400 (100.0%) |
Families and Households in Greenport
Median Family Size in Greenport
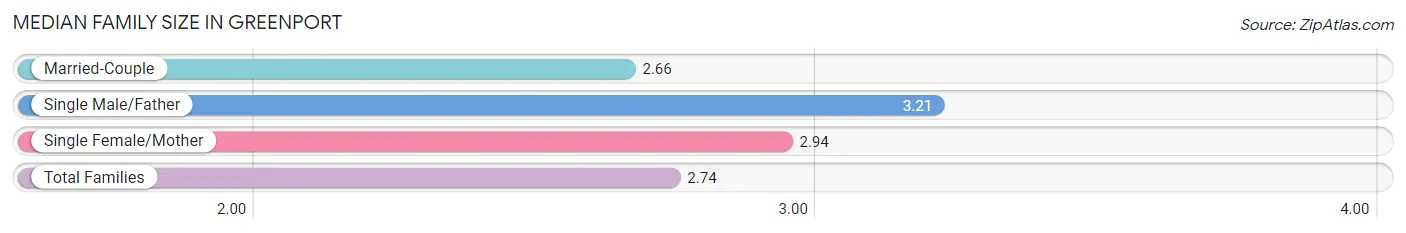
The median family size in Greenport is 2.74 persons per family, with single male/father families (53 | 7.7%) accounting for the largest median family size of 3.21 persons per family. On the other hand, married-couple families (546 | 78.9%) represent the smallest median family size with 2.66 persons per family.
| Family Type | # Families | Family Size |
| Married-Couple | 546 (78.9%) | 2.66 |
| Single Male/Father | 53 (7.7%) | 3.21 |
| Single Female/Mother | 93 (13.4%) | 2.94 |
| Total Families | 692 (100.0%) | 2.74 |
Median Household Size in Greenport
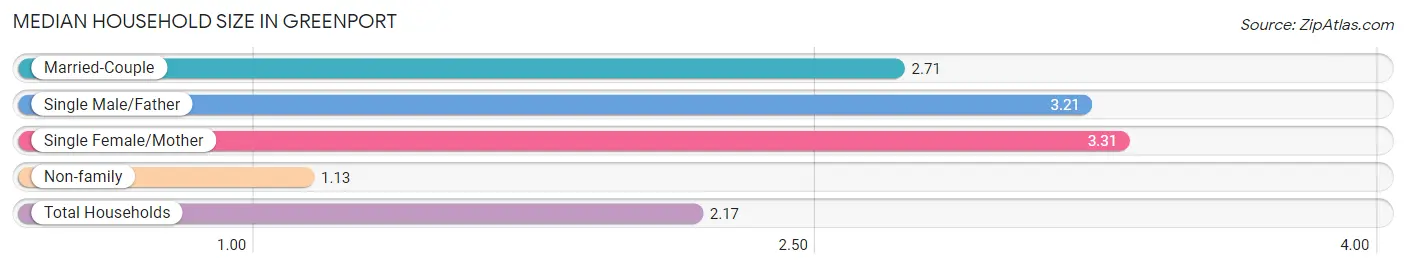
The median household size in Greenport is 2.17 persons per household, with single female/mother households (93 | 8.3%) accounting for the largest median household size of 3.31 persons per household. non-family households (434 | 38.5%) represent the smallest median household size with 1.13 persons per household.
| Household Type | # Households | Household Size |
| Married-Couple | 546 (48.5%) | 2.71 |
| Single Male/Father | 53 (4.7%) | 3.21 |
| Single Female/Mother | 93 (8.3%) | 3.31 |
| Non-family | 434 (38.5%) | 1.13 |
| Total Households | 1,126 (100.0%) | 2.17 |
Household Size by Marriage Status in Greenport
Out of a total of 1,126 households in Greenport, 692 (61.5%) are family households, while 434 (38.5%) are nonfamily households. The most numerous type of family households are 2-person households, comprising 329, and the most common type of nonfamily households are 1-person households, comprising 384.
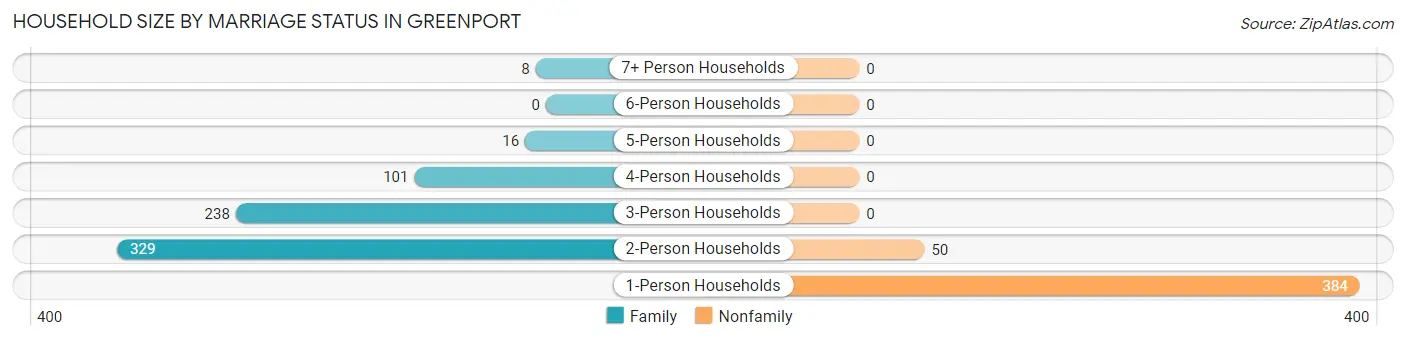
| Household Size | Family Households | Nonfamily Households |
| 1-Person Households | - | 384 (34.1%) |
| 2-Person Households | 329 (29.2%) | 50 (4.4%) |
| 3-Person Households | 238 (21.1%) | 0 (0.0%) |
| 4-Person Households | 101 (9.0%) | 0 (0.0%) |
| 5-Person Households | 16 (1.4%) | 0 (0.0%) |
| 6-Person Households | 0 (0.0%) | 0 (0.0%) |
| 7+ Person Households | 8 (0.7%) | 0 (0.0%) |
| Total | 692 (61.5%) | 434 (38.5%) |
Female Fertility in Greenport
Fertility by Age in Greenport
Average fertility rate in Greenport is 45.0 births per 1,000 women. Women in the age bracket of 20 to 34 years have the highest fertility rate with 150.0 births per 1,000 women. Women in the age bracket of 20 to 34 years acount for 100.0% of all women with births.
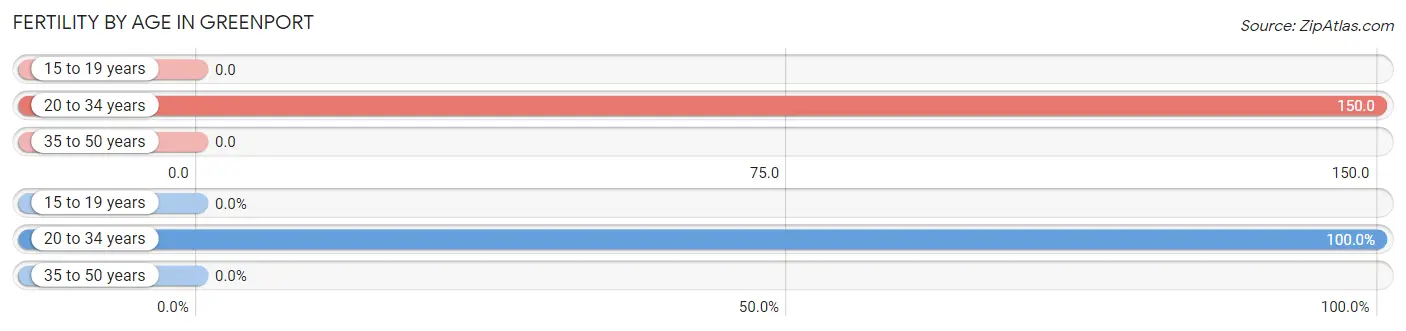
| Age Bracket | Women with Births | Births / 1,000 Women |
| 15 to 19 years | 0 (0.0%) | 0.0 |
| 20 to 34 years | 18 (100.0%) | 150.0 |
| 35 to 50 years | 0 (0.0%) | 0.0 |
| Total | 18 (100.0%) | 45.0 |
Fertility by Age by Marriage Status in Greenport
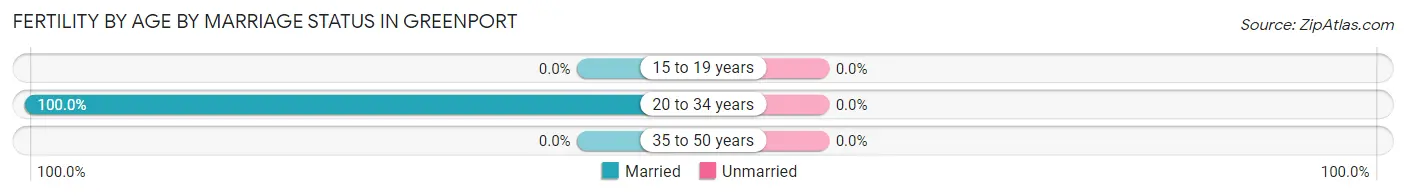
| Age Bracket | Married | Unmarried |
| 15 to 19 years | 0 (0.0%) | 0 (0.0%) |
| 20 to 34 years | 18 (100.0%) | 0 (0.0%) |
| 35 to 50 years | 0 (0.0%) | 0 (0.0%) |
| Total | 18 (100.0%) | 0 (0.0%) |
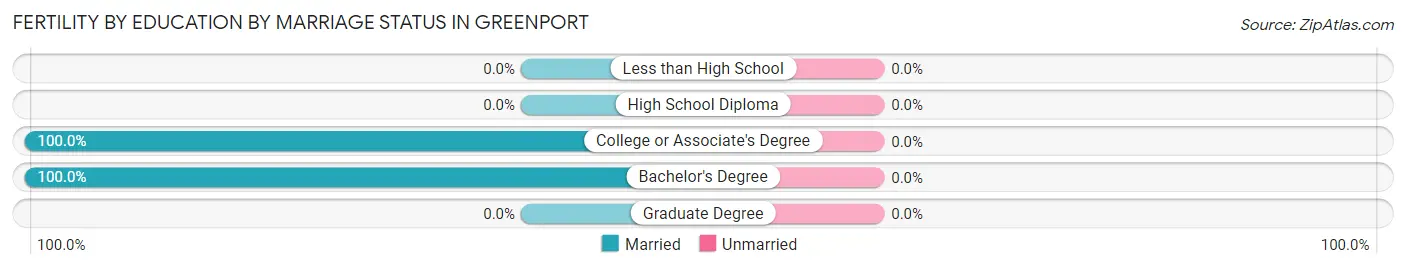
Fertility by Education in Greenport
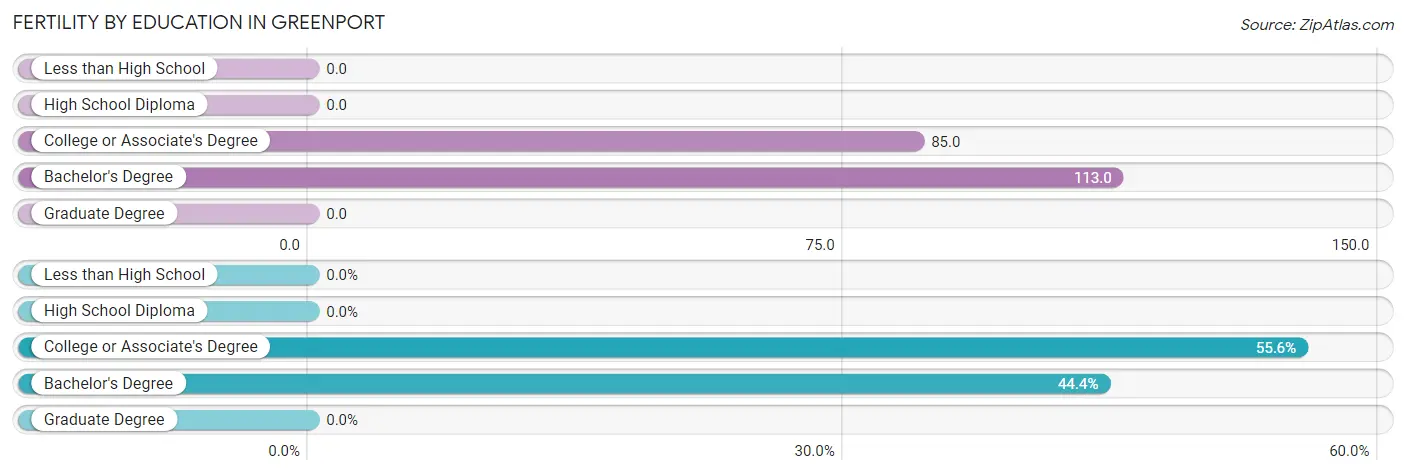
| Educational Attainment | Women with Births | Births / 1,000 Women |
| Less than High School | 0 (0.0%) | 0.0 |
| High School Diploma | 0 (0.0%) | 0.0 |
| College or Associate's Degree | 10 (55.6%) | 85.0 |
| Bachelor's Degree | 8 (44.4%) | 113.0 |
| Graduate Degree | 0 (0.0%) | 0.0 |
| Total | 18 (100.0%) | 45.0 |
Fertility by Education by Marriage Status in Greenport
| Educational Attainment | Married | Unmarried |
| Less than High School | 0 (0.0%) | 0 (0.0%) |
| High School Diploma | 0 (0.0%) | 0 (0.0%) |
| College or Associate's Degree | 10 (100.0%) | 0 (0.0%) |
| Bachelor's Degree | 8 (100.0%) | 0 (0.0%) |
| Graduate Degree | 0 (0.0%) | 0 (0.0%) |
| Total | 18 (100.0%) | 0 (0.0%) |
Employment Characteristics in Greenport
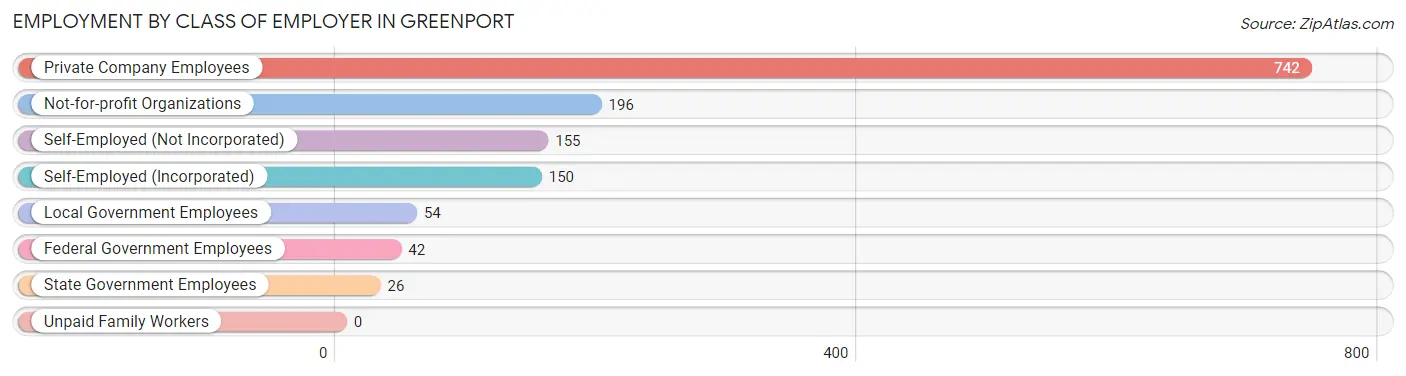
Employment by Class of Employer in Greenport
Among the 1,365 employed individuals in Greenport, private company employees (742 | 54.4%), not-for-profit organizations (196 | 14.4%), and self-employed (not incorporated) (155 | 11.4%) make up the most common classes of employment.
| Employer Class | # Employees | % Employees |
| Private Company Employees | 742 | 54.4% |
| Self-Employed (Incorporated) | 150 | 11.0% |
| Self-Employed (Not Incorporated) | 155 | 11.4% |
| Not-for-profit Organizations | 196 | 14.4% |
| Local Government Employees | 54 | 4.0% |
| State Government Employees | 26 | 1.9% |
| Federal Government Employees | 42 | 3.1% |
| Unpaid Family Workers | 0 | 0.0% |
| Total | 1,365 | 100.0% |
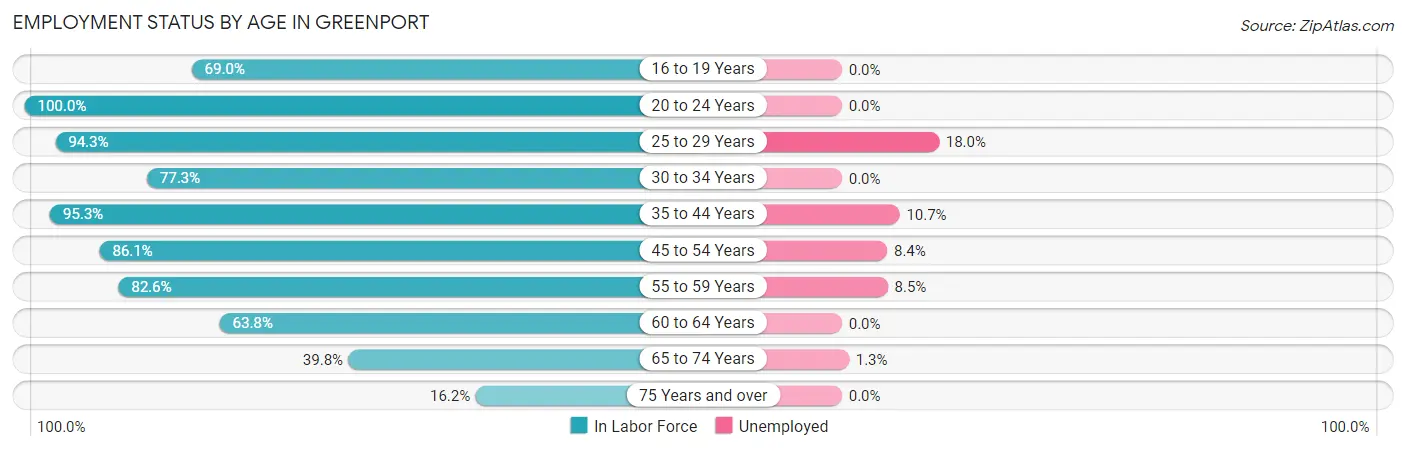
Employment Status by Age in Greenport
According to the labor force statistics for Greenport, out of the total population over 16 years of age (2,274), 65.7% or 1,494 individuals are in the labor force, with 5.5% or 82 of them unemployed. The age group with the highest labor force participation rate is 20 to 24 years, with 100.0% or 44 individuals in the labor force. Within the labor force, the 25 to 29 years age range has the highest percentage of unemployed individuals, with 18.0% or 9 of them being unemployed.
| Age Bracket | In Labor Force | Unemployed |
| 16 to 19 Years | 78 (69.0%) | 0 (0.0%) |
| 20 to 24 Years | 44 (100.0%) | 0 (0.0%) |
| 25 to 29 Years | 50 (94.3%) | 9 (18.0%) |
| 30 to 34 Years | 116 (77.3%) | 0 (0.0%) |
| 35 to 44 Years | 281 (95.3%) | 30 (10.7%) |
| 45 to 54 Years | 311 (86.1%) | 26 (8.4%) |
| 55 to 59 Years | 176 (82.6%) | 15 (8.5%) |
| 60 to 64 Years | 240 (63.8%) | 0 (0.0%) |
| 65 to 74 Years | 151 (39.8%) | 2 (1.3%) |
| 75 Years and over | 47 (16.2%) | 0 (0.0%) |
| Total | 1,494 (65.7%) | 82 (5.5%) |
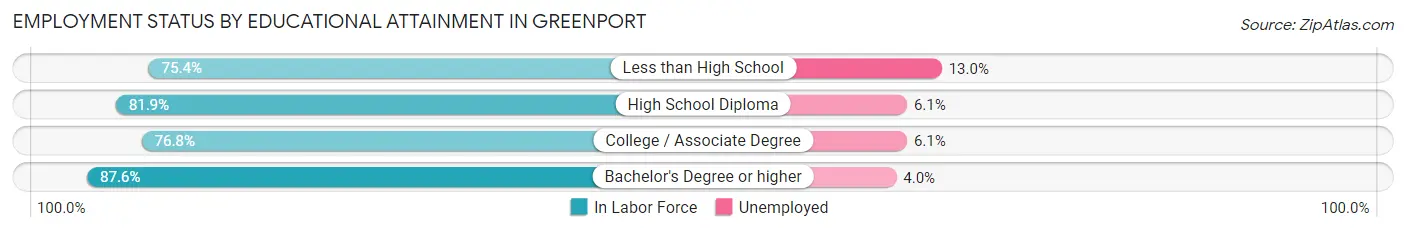
Employment Status by Educational Attainment in Greenport
According to labor force statistics for Greenport, 81.1% of individuals (1,174) out of the total population between 25 and 64 years of age (1,448) are in the labor force, with 6.8% or 80 of them being unemployed. The group with the highest labor force participation rate are those with the educational attainment of bachelor's degree or higher, with 87.6% or 373 individuals in the labor force. Within the labor force, individuals with less than high school education have the highest percentage of unemployment, with 13.0% or 30 of them being unemployed.
| Educational Attainment | In Labor Force | Unemployed |
| Less than High School | 230 (75.4%) | 40 (13.0%) |
| High School Diploma | 326 (81.9%) | 24 (6.1%) |
| College / Associate Degree | 245 (76.8%) | 19 (6.1%) |
| Bachelor's Degree or higher | 373 (87.6%) | 17 (4.0%) |
| Total | 1,174 (81.1%) | 98 (6.8%) |
Employment Occupations by Sex in Greenport
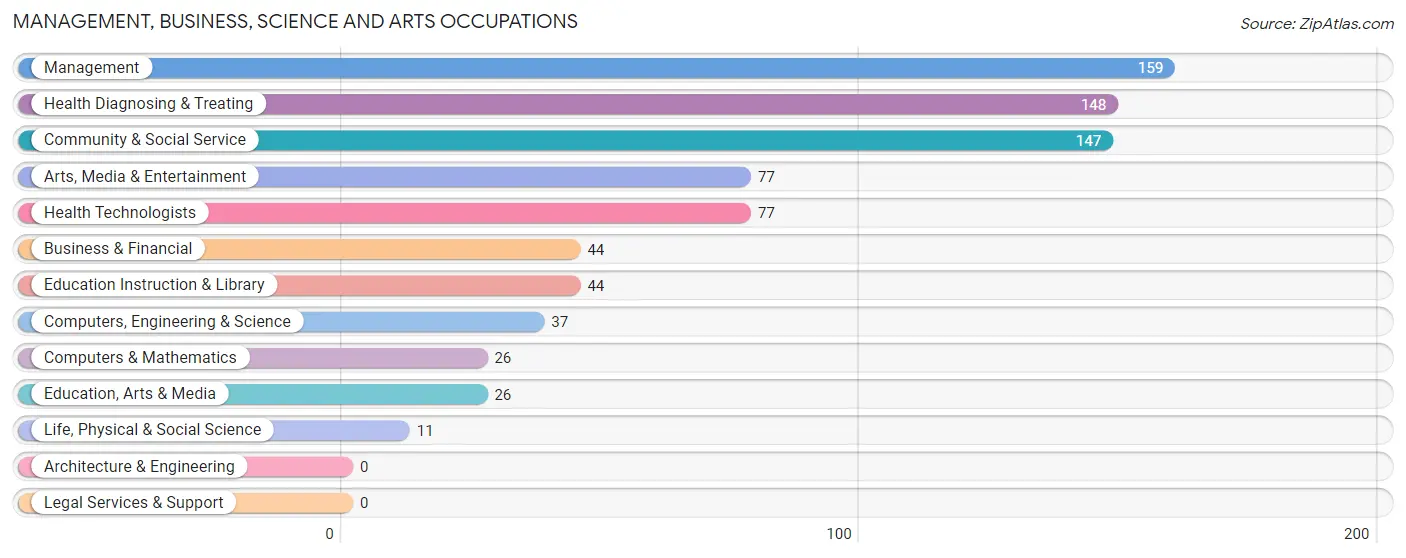
Management, Business, Science and Arts Occupations
The most common Management, Business, Science and Arts occupations in Greenport are Management (159 | 11.3%), Health Diagnosing & Treating (148 | 10.5%), Community & Social Service (147 | 10.4%), Arts, Media & Entertainment (77 | 5.4%), and Health Technologists (77 | 5.4%).
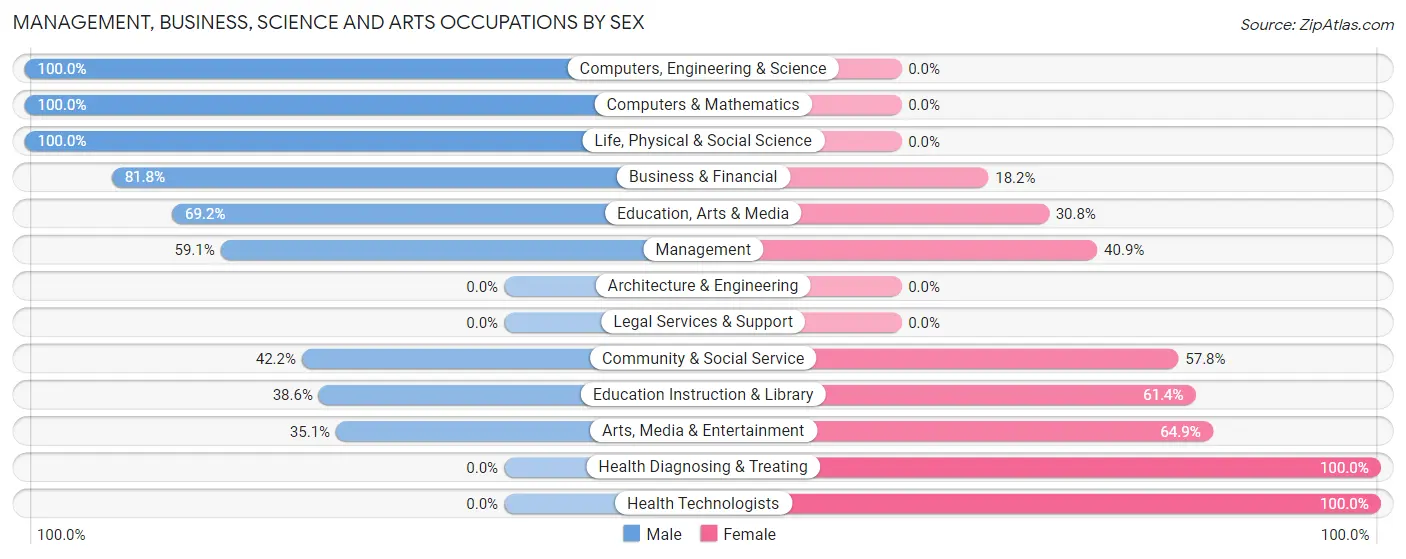
Management, Business, Science and Arts Occupations by Sex
Within the Management, Business, Science and Arts occupations in Greenport, the most male-oriented occupations are Computers, Engineering & Science (100.0%), Computers & Mathematics (100.0%), and Life, Physical & Social Science (100.0%), while the most female-oriented occupations are Health Diagnosing & Treating (100.0%), Health Technologists (100.0%), and Arts, Media & Entertainment (64.9%).
| Occupation | Male | Female |
| Management | 94 (59.1%) | 65 (40.9%) |
| Business & Financial | 36 (81.8%) | 8 (18.2%) |
| Computers, Engineering & Science | 37 (100.0%) | 0 (0.0%) |
| Computers & Mathematics | 26 (100.0%) | 0 (0.0%) |
| Architecture & Engineering | 0 (0.0%) | 0 (0.0%) |
| Life, Physical & Social Science | 11 (100.0%) | 0 (0.0%) |
| Community & Social Service | 62 (42.2%) | 85 (57.8%) |
| Education, Arts & Media | 18 (69.2%) | 8 (30.8%) |
| Legal Services & Support | 0 (0.0%) | 0 (0.0%) |
| Education Instruction & Library | 17 (38.6%) | 27 (61.4%) |
| Arts, Media & Entertainment | 27 (35.1%) | 50 (64.9%) |
| Health Diagnosing & Treating | 0 (0.0%) | 148 (100.0%) |
| Health Technologists | 0 (0.0%) | 77 (100.0%) |
| Total (Category) | 229 (42.8%) | 306 (57.2%) |
| Total (Overall) | 730 (51.7%) | 682 (48.3%) |
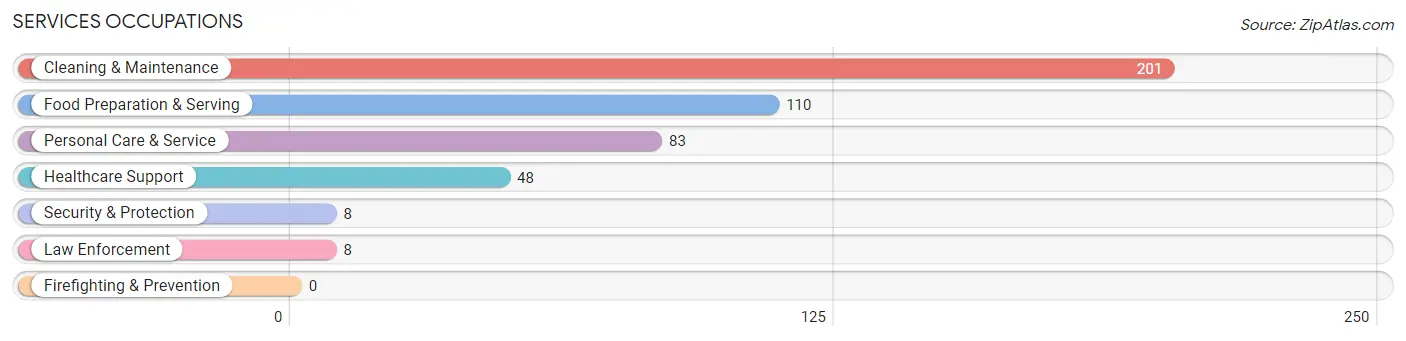
Services Occupations
The most common Services occupations in Greenport are Cleaning & Maintenance (201 | 14.2%), Food Preparation & Serving (110 | 7.8%), Personal Care & Service (83 | 5.9%), Healthcare Support (48 | 3.4%), and Security & Protection (8 | 0.6%).
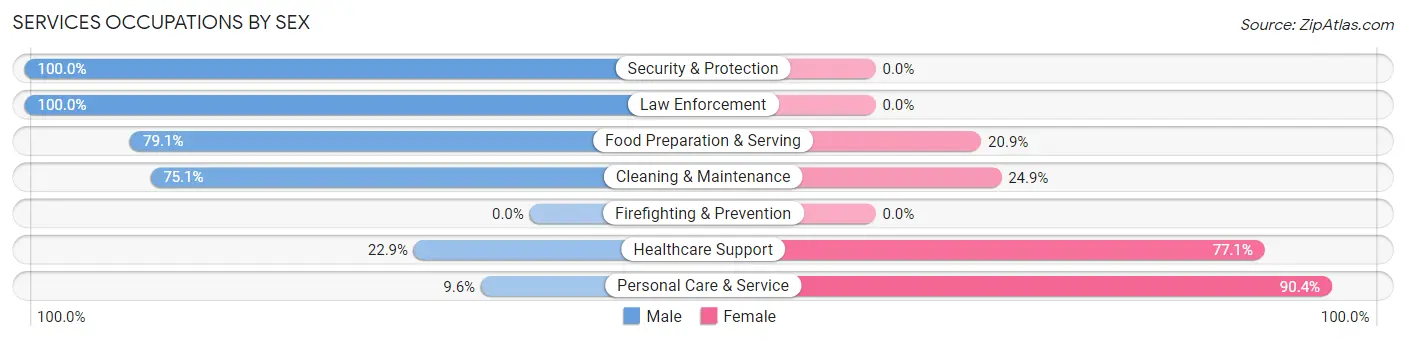
Services Occupations by Sex
Within the Services occupations in Greenport, the most male-oriented occupations are Security & Protection (100.0%), Law Enforcement (100.0%), and Food Preparation & Serving (79.1%), while the most female-oriented occupations are Personal Care & Service (90.4%), Healthcare Support (77.1%), and Cleaning & Maintenance (24.9%).
| Occupation | Male | Female |
| Healthcare Support | 11 (22.9%) | 37 (77.1%) |
| Security & Protection | 8 (100.0%) | 0 (0.0%) |
| Firefighting & Prevention | 0 (0.0%) | 0 (0.0%) |
| Law Enforcement | 8 (100.0%) | 0 (0.0%) |
| Food Preparation & Serving | 87 (79.1%) | 23 (20.9%) |
| Cleaning & Maintenance | 151 (75.1%) | 50 (24.9%) |
| Personal Care & Service | 8 (9.6%) | 75 (90.4%) |
| Total (Category) | 265 (58.9%) | 185 (41.1%) |
| Total (Overall) | 730 (51.7%) | 682 (48.3%) |
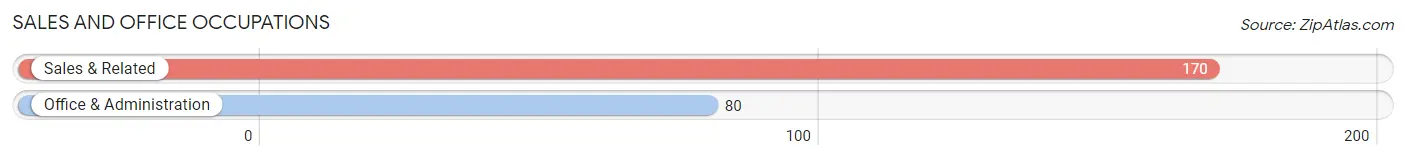
Sales and Office Occupations
The most common Sales and Office occupations in Greenport are Sales & Related (170 | 12.0%), and Office & Administration (80 | 5.7%).
Sales and Office Occupations by Sex
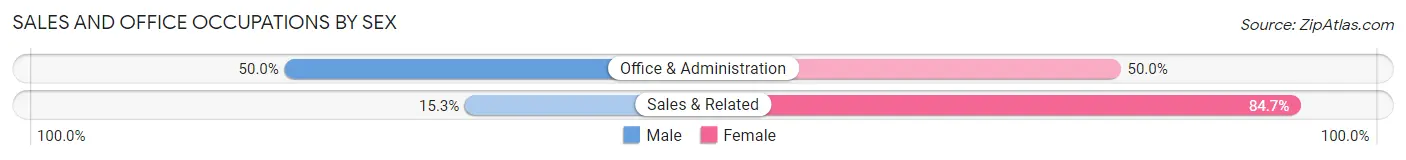
| Occupation | Male | Female |
| Sales & Related | 26 (15.3%) | 144 (84.7%) |
| Office & Administration | 40 (50.0%) | 40 (50.0%) |
| Total (Category) | 66 (26.4%) | 184 (73.6%) |
| Total (Overall) | 730 (51.7%) | 682 (48.3%) |
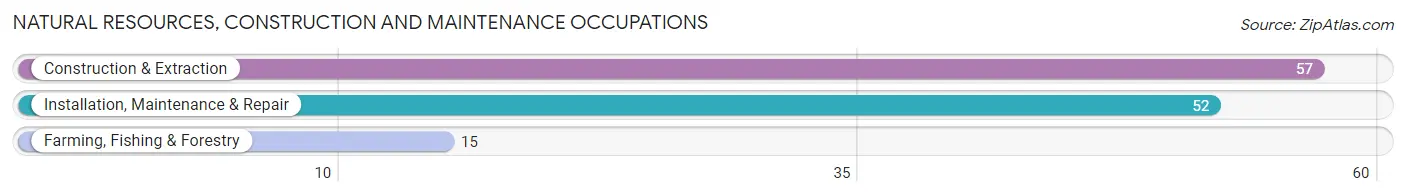
Natural Resources, Construction and Maintenance Occupations
The most common Natural Resources, Construction and Maintenance occupations in Greenport are Construction & Extraction (57 | 4.0%), Installation, Maintenance & Repair (52 | 3.7%), and Farming, Fishing & Forestry (15 | 1.1%).
Natural Resources, Construction and Maintenance Occupations by Sex
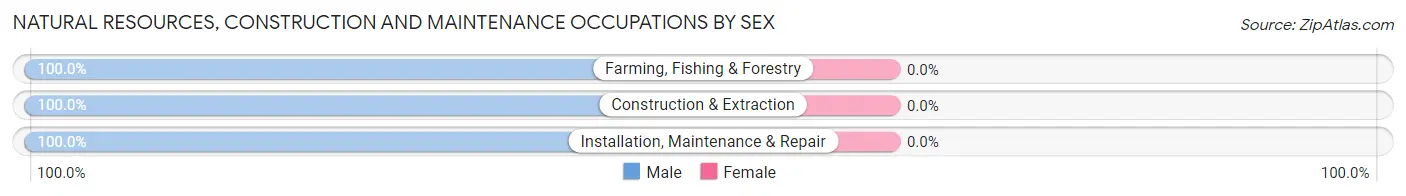
| Occupation | Male | Female |
| Farming, Fishing & Forestry | 15 (100.0%) | 0 (0.0%) |
| Construction & Extraction | 57 (100.0%) | 0 (0.0%) |
| Installation, Maintenance & Repair | 52 (100.0%) | 0 (0.0%) |
| Total (Category) | 124 (100.0%) | 0 (0.0%) |
| Total (Overall) | 730 (51.7%) | 682 (48.3%) |
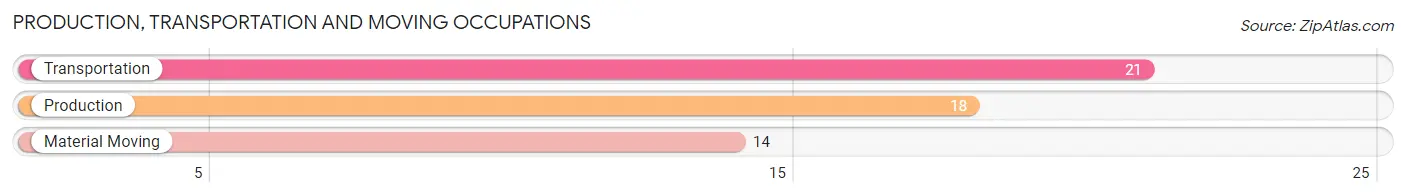
Production, Transportation and Moving Occupations
The most common Production, Transportation and Moving occupations in Greenport are Transportation (21 | 1.5%), Production (18 | 1.3%), and Material Moving (14 | 1.0%).
Production, Transportation and Moving Occupations by Sex
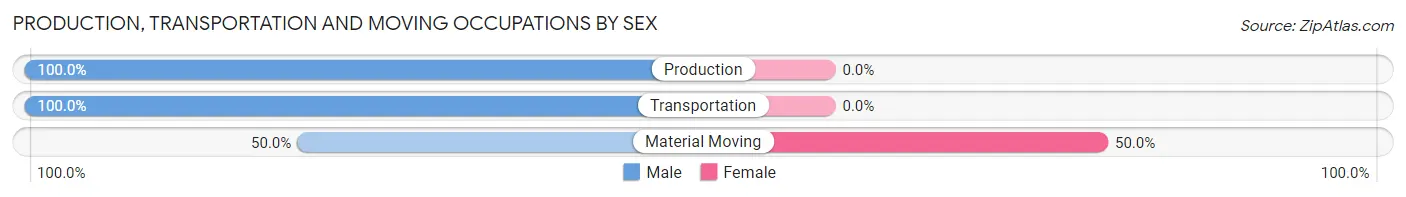
| Occupation | Male | Female |
| Production | 18 (100.0%) | 0 (0.0%) |
| Transportation | 21 (100.0%) | 0 (0.0%) |
| Material Moving | 7 (50.0%) | 7 (50.0%) |
| Total (Category) | 46 (86.8%) | 7 (13.2%) |
| Total (Overall) | 730 (51.7%) | 682 (48.3%) |
Employment Industries by Sex in Greenport
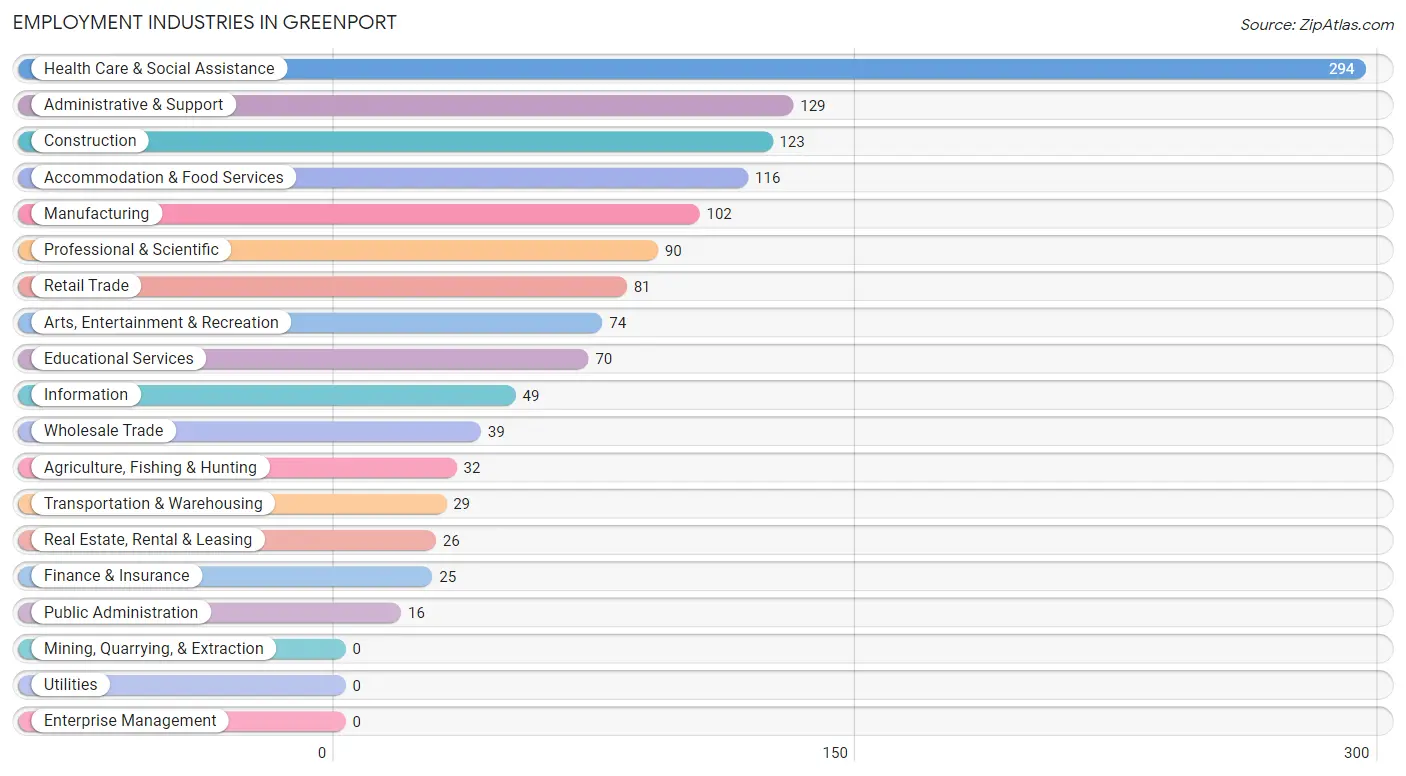
Employment Industries in Greenport
The major employment industries in Greenport include Health Care & Social Assistance (294 | 20.8%), Administrative & Support (129 | 9.1%), Construction (123 | 8.7%), Accommodation & Food Services (116 | 8.2%), and Manufacturing (102 | 7.2%).
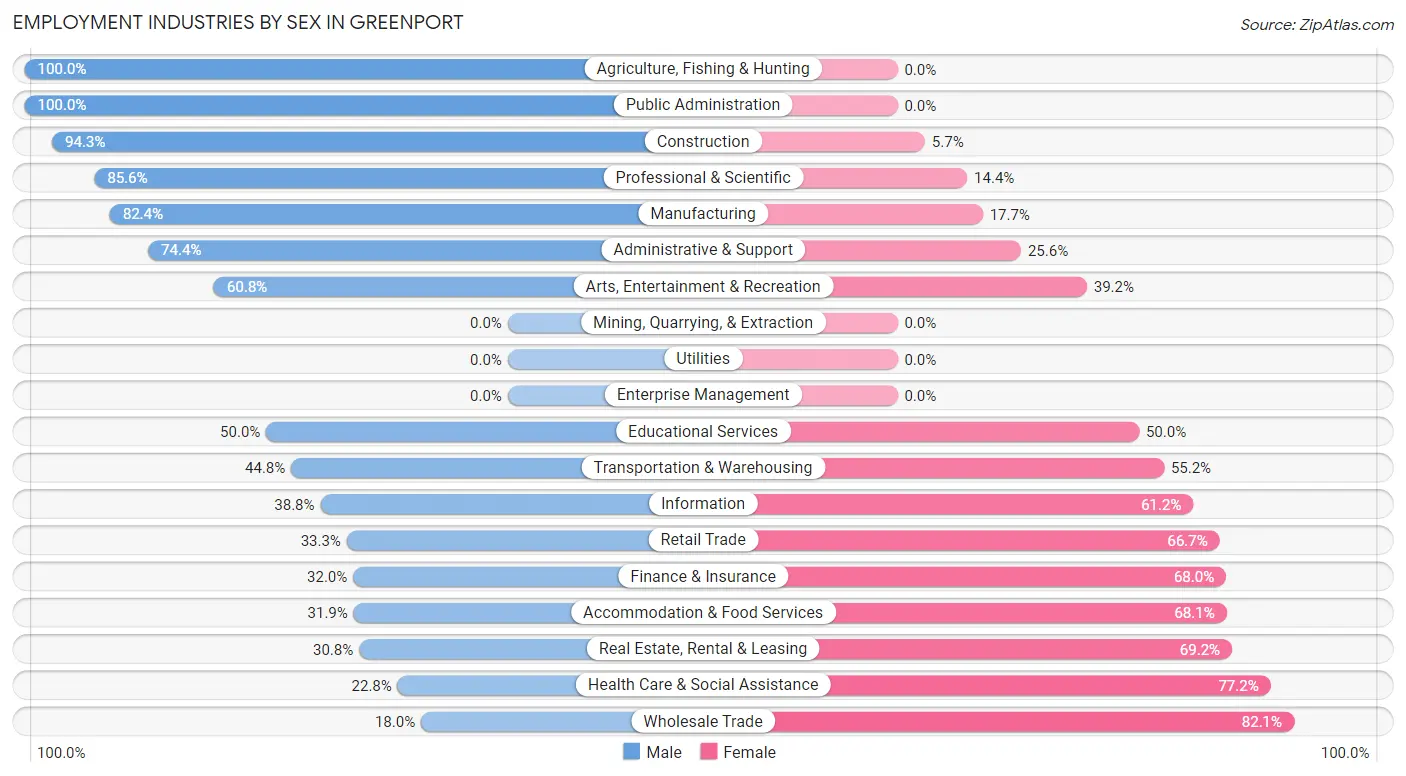
Employment Industries by Sex in Greenport
The Greenport industries that see more men than women are Agriculture, Fishing & Hunting (100.0%), Public Administration (100.0%), and Construction (94.3%), whereas the industries that tend to have a higher number of women are Wholesale Trade (82.1%), Health Care & Social Assistance (77.2%), and Real Estate, Rental & Leasing (69.2%).
| Industry | Male | Female |
| Agriculture, Fishing & Hunting | 32 (100.0%) | 0 (0.0%) |
| Mining, Quarrying, & Extraction | 0 (0.0%) | 0 (0.0%) |
| Construction | 116 (94.3%) | 7 (5.7%) |
| Manufacturing | 84 (82.4%) | 18 (17.6%) |
| Wholesale Trade | 7 (17.9%) | 32 (82.1%) |
| Retail Trade | 27 (33.3%) | 54 (66.7%) |
| Transportation & Warehousing | 13 (44.8%) | 16 (55.2%) |
| Utilities | 0 (0.0%) | 0 (0.0%) |
| Information | 19 (38.8%) | 30 (61.2%) |
| Finance & Insurance | 8 (32.0%) | 17 (68.0%) |
| Real Estate, Rental & Leasing | 8 (30.8%) | 18 (69.2%) |
| Professional & Scientific | 77 (85.6%) | 13 (14.4%) |
| Enterprise Management | 0 (0.0%) | 0 (0.0%) |
| Administrative & Support | 96 (74.4%) | 33 (25.6%) |
| Educational Services | 35 (50.0%) | 35 (50.0%) |
| Health Care & Social Assistance | 67 (22.8%) | 227 (77.2%) |
| Arts, Entertainment & Recreation | 45 (60.8%) | 29 (39.2%) |
| Accommodation & Food Services | 37 (31.9%) | 79 (68.1%) |
| Public Administration | 16 (100.0%) | 0 (0.0%) |
| Total | 730 (51.7%) | 682 (48.3%) |
Education in Greenport
School Enrollment in Greenport
The most common levels of schooling among the 339 students in Greenport are middle school (100 | 29.5%), college / undergraduate (72 | 21.2%), and high school (59 | 17.4%).
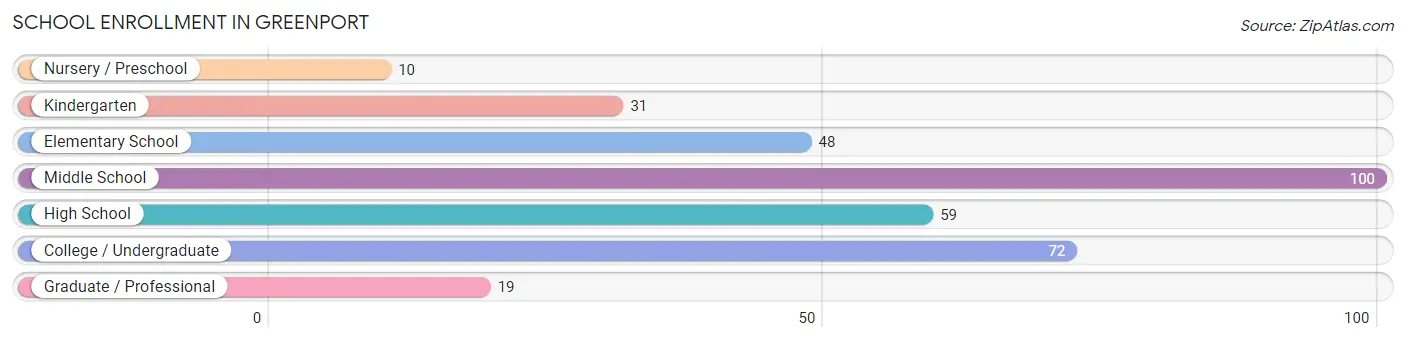
| School Level | # Students | % Students |
| Nursery / Preschool | 10 | 2.9% |
| Kindergarten | 31 | 9.1% |
| Elementary School | 48 | 14.2% |
| Middle School | 100 | 29.5% |
| High School | 59 | 17.4% |
| College / Undergraduate | 72 | 21.2% |
| Graduate / Professional | 19 | 5.6% |
| Total | 339 | 100.0% |
School Enrollment by Age by Funding Source in Greenport
Out of a total of 339 students who are enrolled in schools in Greenport, 19 (5.6%) attend a private institution, while the remaining 320 (94.4%) are enrolled in public schools. The age group of 3 to 4 year olds has the highest likelihood of being enrolled in private schools, with 8 (100.0% in the age bracket) enrolled. Conversely, the age group of 5 to 9 year old has the lowest likelihood of being enrolled in a private school, with 51 (100.0% in the age bracket) attending a public institution.
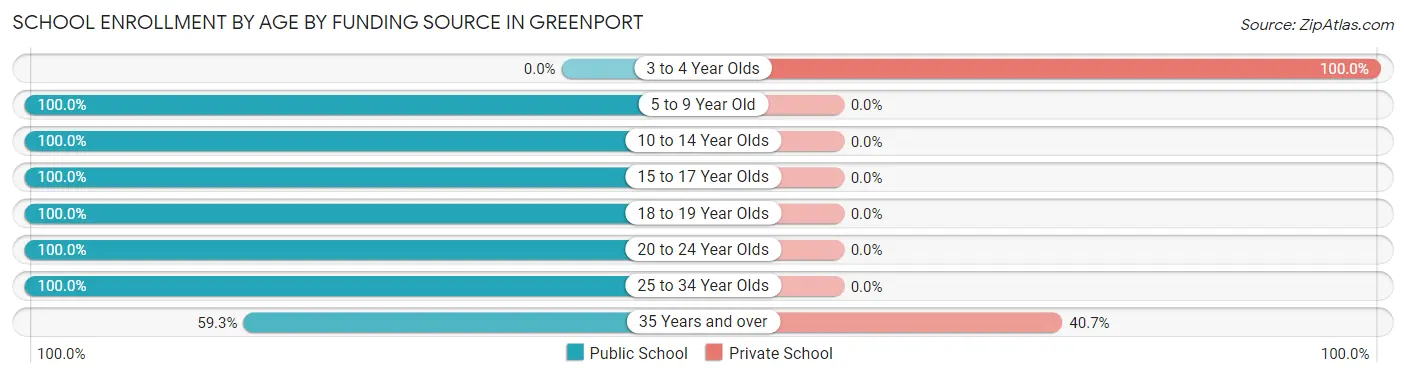
| Age Bracket | Public School | Private School |
| 3 to 4 Year Olds | 0 (0.0%) | 8 (100.0%) |
| 5 to 9 Year Old | 51 (100.0%) | 0 (0.0%) |
| 10 to 14 Year Olds | 130 (100.0%) | 0 (0.0%) |
| 15 to 17 Year Olds | 59 (100.0%) | 0 (0.0%) |
| 18 to 19 Year Olds | 23 (100.0%) | 0 (0.0%) |
| 20 to 24 Year Olds | 33 (100.0%) | 0 (0.0%) |
| 25 to 34 Year Olds | 8 (100.0%) | 0 (0.0%) |
| 35 Years and over | 16 (59.3%) | 11 (40.7%) |
| Total | 320 (94.4%) | 19 (5.6%) |
Educational Attainment by Field of Study in Greenport
Literature & languages (169 | 19.6%), social sciences (117 | 13.6%), liberal arts & history (93 | 10.8%), visual & performing arts (89 | 10.3%), and business (83 | 9.6%) are the most common fields of study among 861 individuals in Greenport who have obtained a bachelor's degree or higher.
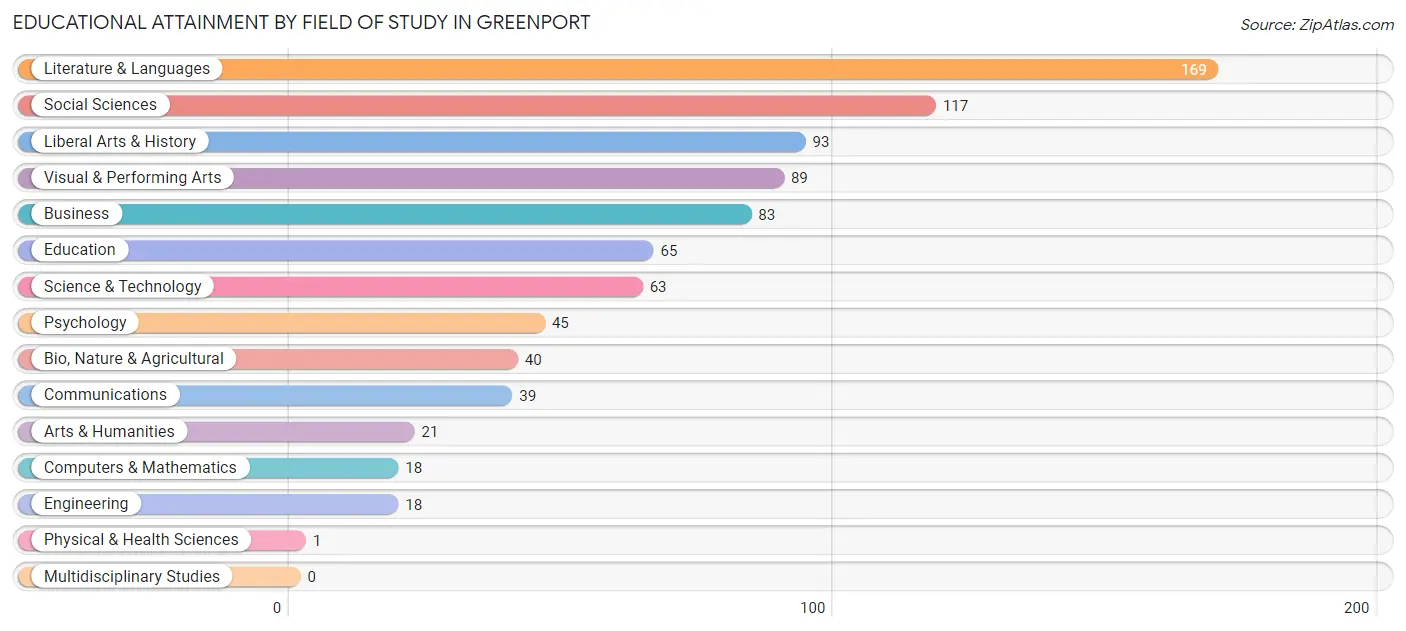
| Field of Study | # Graduates | % Graduates |
| Computers & Mathematics | 18 | 2.1% |
| Bio, Nature & Agricultural | 40 | 4.6% |
| Physical & Health Sciences | 1 | 0.1% |
| Psychology | 45 | 5.2% |
| Social Sciences | 117 | 13.6% |
| Engineering | 18 | 2.1% |
| Multidisciplinary Studies | 0 | 0.0% |
| Science & Technology | 63 | 7.3% |
| Business | 83 | 9.6% |
| Education | 65 | 7.5% |
| Literature & Languages | 169 | 19.6% |
| Liberal Arts & History | 93 | 10.8% |
| Visual & Performing Arts | 89 | 10.3% |
| Communications | 39 | 4.5% |
| Arts & Humanities | 21 | 2.4% |
| Total | 861 | 100.0% |
Transportation & Commute in Greenport
Vehicle Availability by Sex in Greenport
The most prevalent vehicle ownership categories in Greenport are males with 1 vehicle (278, accounting for 38.1%) and females with 1 vehicle (208, making up 43.8%).
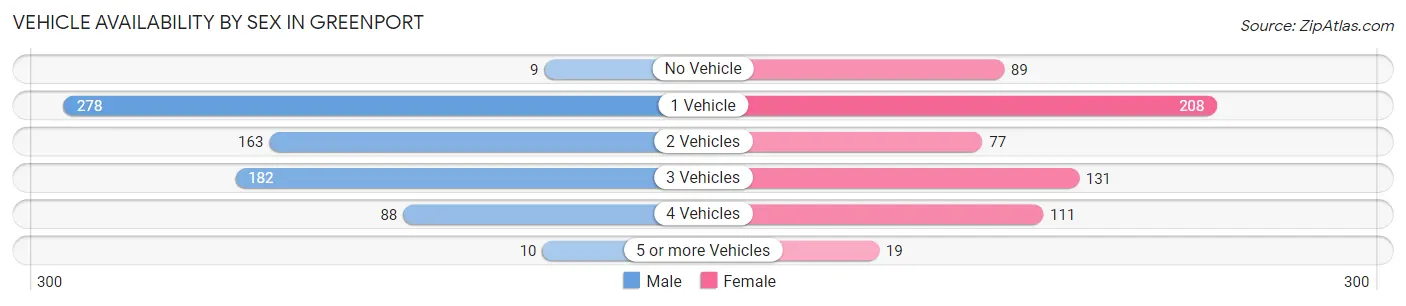
| Vehicles Available | Male | Female |
| No Vehicle | 9 (1.2%) | 89 (14.0%) |
| 1 Vehicle | 278 (38.1%) | 208 (32.8%) |
| 2 Vehicles | 163 (22.3%) | 77 (12.1%) |
| 3 Vehicles | 182 (24.9%) | 131 (20.6%) |
| 4 Vehicles | 88 (12.0%) | 111 (17.5%) |
| 5 or more Vehicles | 10 (1.4%) | 19 (3.0%) |
| Total | 730 (100.0%) | 635 (100.0%) |
Commute Time in Greenport
The most frequently occuring commute durations in Greenport are 5 to 9 minutes (258 commuters, 21.0%), 10 to 14 minutes (198 commuters, 16.2%), and 15 to 19 minutes (133 commuters, 10.8%).
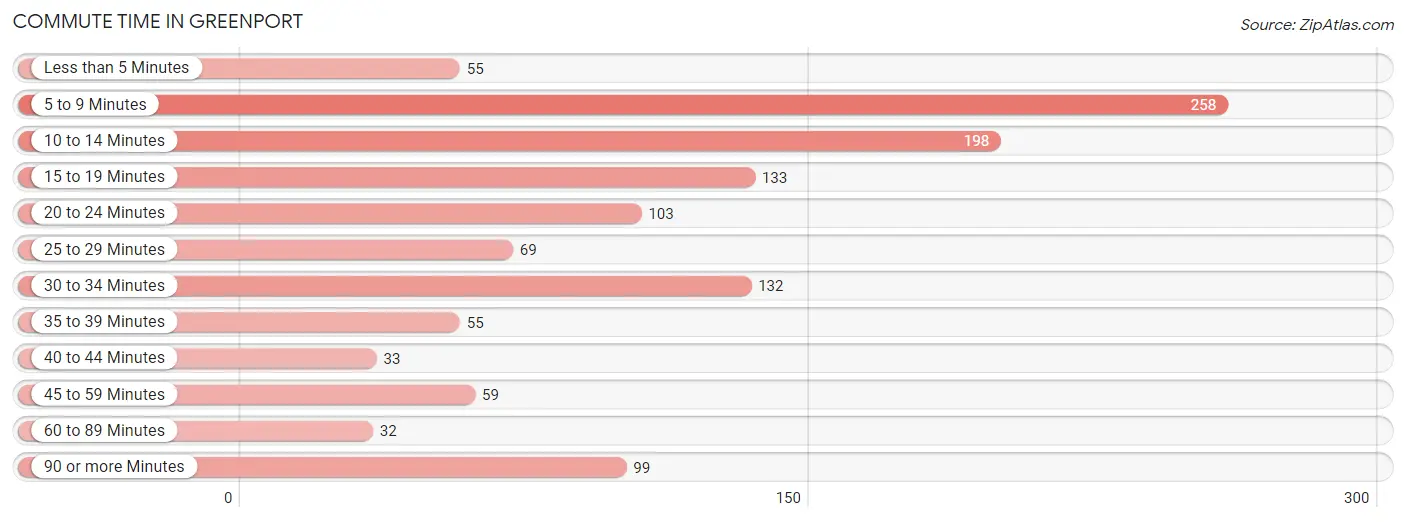
| Commute Time | # Commuters | % Commuters |
| Less than 5 Minutes | 55 | 4.5% |
| 5 to 9 Minutes | 258 | 21.0% |
| 10 to 14 Minutes | 198 | 16.2% |
| 15 to 19 Minutes | 133 | 10.8% |
| 20 to 24 Minutes | 103 | 8.4% |
| 25 to 29 Minutes | 69 | 5.6% |
| 30 to 34 Minutes | 132 | 10.8% |
| 35 to 39 Minutes | 55 | 4.5% |
| 40 to 44 Minutes | 33 | 2.7% |
| 45 to 59 Minutes | 59 | 4.8% |
| 60 to 89 Minutes | 32 | 2.6% |
| 90 or more Minutes | 99 | 8.1% |
Commute Time by Sex in Greenport
The most common commute times in Greenport are 15 to 19 minutes (133 commuters, 20.2%) for males and 5 to 9 minutes (152 commuters, 26.8%) for females.
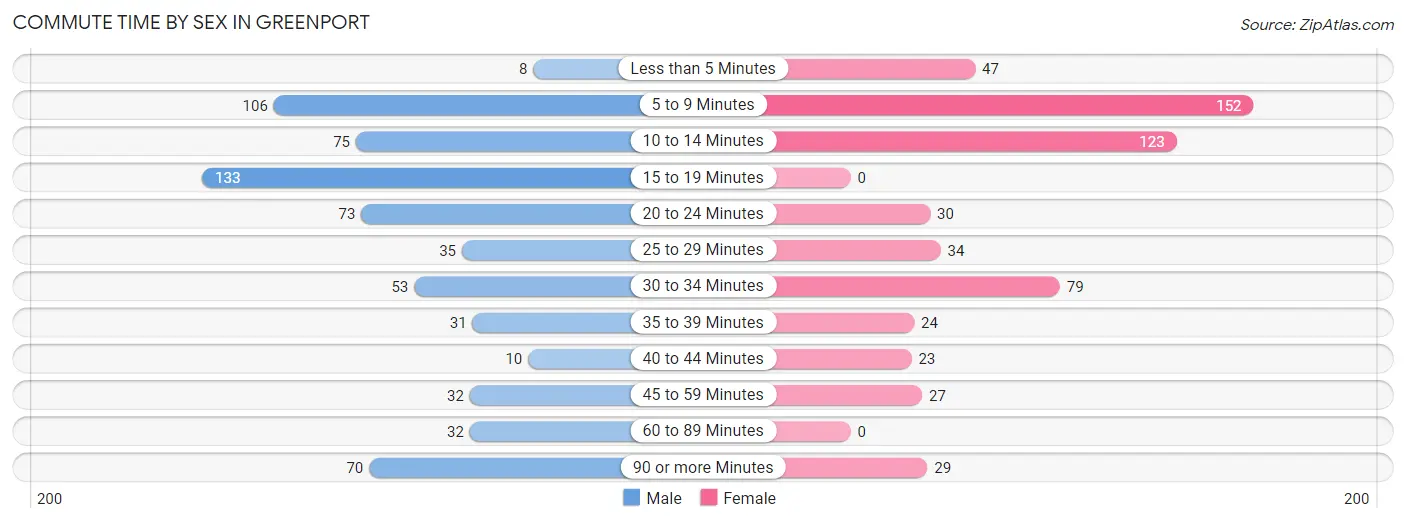
| Commute Time | Male | Female |
| Less than 5 Minutes | 8 (1.2%) | 47 (8.3%) |
| 5 to 9 Minutes | 106 (16.1%) | 152 (26.8%) |
| 10 to 14 Minutes | 75 (11.4%) | 123 (21.6%) |
| 15 to 19 Minutes | 133 (20.2%) | 0 (0.0%) |
| 20 to 24 Minutes | 73 (11.1%) | 30 (5.3%) |
| 25 to 29 Minutes | 35 (5.3%) | 34 (6.0%) |
| 30 to 34 Minutes | 53 (8.1%) | 79 (13.9%) |
| 35 to 39 Minutes | 31 (4.7%) | 24 (4.2%) |
| 40 to 44 Minutes | 10 (1.5%) | 23 (4.1%) |
| 45 to 59 Minutes | 32 (4.9%) | 27 (4.8%) |
| 60 to 89 Minutes | 32 (4.9%) | 0 (0.0%) |
| 90 or more Minutes | 70 (10.6%) | 29 (5.1%) |
Time of Departure to Work by Sex in Greenport
The most frequent times of departure to work in Greenport are 5:00 AM to 5:29 AM (131, 19.9%) for males and 10:00 AM to 10:59 AM (78, 13.7%) for females.
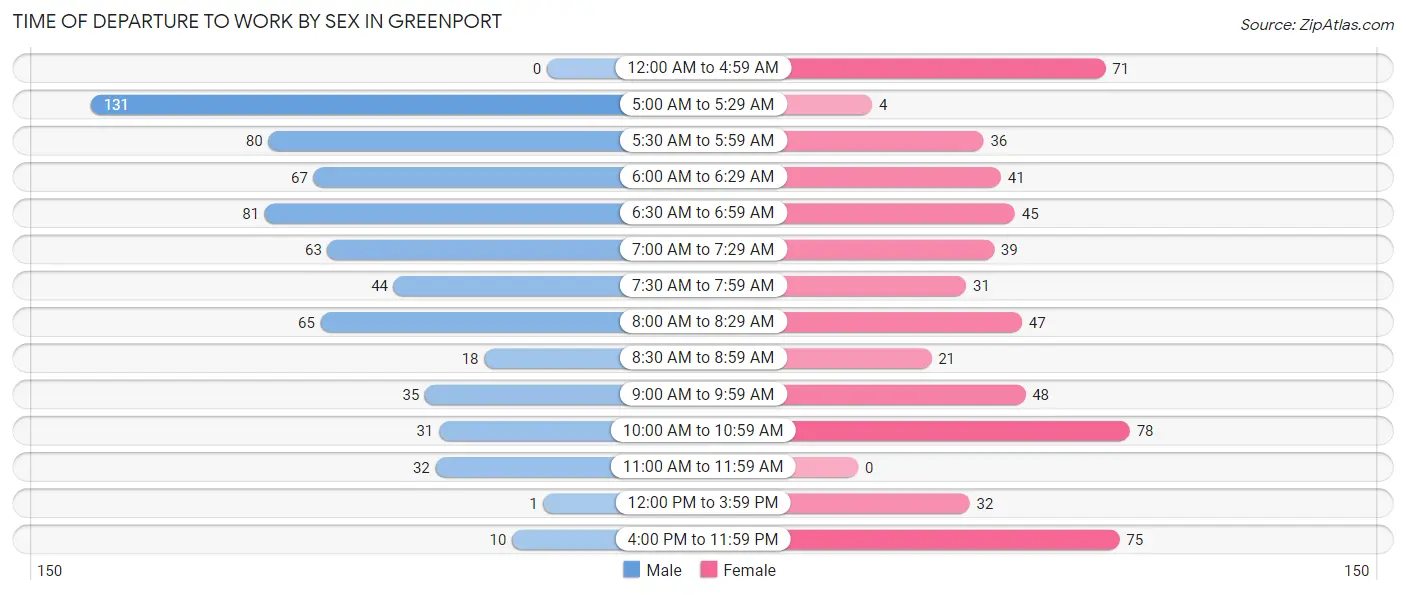
| Time of Departure | Male | Female |
| 12:00 AM to 4:59 AM | 0 (0.0%) | 71 (12.5%) |
| 5:00 AM to 5:29 AM | 131 (19.9%) | 4 (0.7%) |
| 5:30 AM to 5:59 AM | 80 (12.2%) | 36 (6.3%) |
| 6:00 AM to 6:29 AM | 67 (10.2%) | 41 (7.2%) |
| 6:30 AM to 6:59 AM | 81 (12.3%) | 45 (7.9%) |
| 7:00 AM to 7:29 AM | 63 (9.6%) | 39 (6.9%) |
| 7:30 AM to 7:59 AM | 44 (6.7%) | 31 (5.5%) |
| 8:00 AM to 8:29 AM | 65 (9.9%) | 47 (8.3%) |
| 8:30 AM to 8:59 AM | 18 (2.7%) | 21 (3.7%) |
| 9:00 AM to 9:59 AM | 35 (5.3%) | 48 (8.5%) |
| 10:00 AM to 10:59 AM | 31 (4.7%) | 78 (13.7%) |
| 11:00 AM to 11:59 AM | 32 (4.9%) | 0 (0.0%) |
| 12:00 PM to 3:59 PM | 1 (0.2%) | 32 (5.6%) |
| 4:00 PM to 11:59 PM | 10 (1.5%) | 75 (13.2%) |
| Total | 658 (100.0%) | 568 (100.0%) |
Housing Occupancy in Greenport
Occupancy by Ownership in Greenport
Of the total 1,126 dwellings in Greenport, owner-occupied units account for 677 (60.1%), while renter-occupied units make up 449 (39.9%).
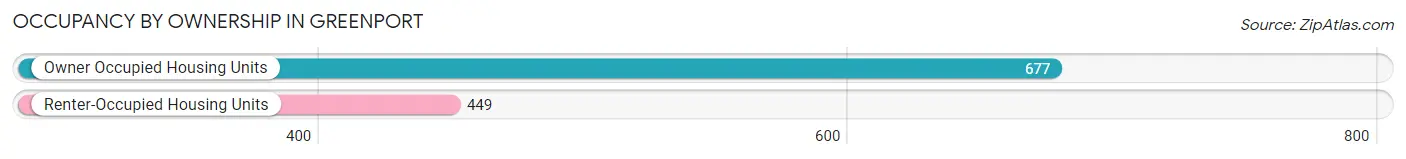
| Occupancy | # Housing Units | % Housing Units |
| Owner Occupied Housing Units | 677 | 60.1% |
| Renter-Occupied Housing Units | 449 | 39.9% |
| Total Occupied Housing Units | 1,126 | 100.0% |
Occupancy by Household Size in Greenport
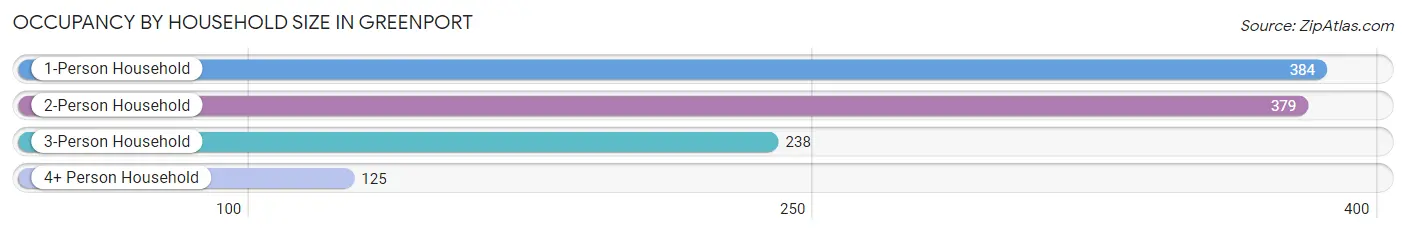
| Household Size | # Housing Units | % Housing Units |
| 1-Person Household | 384 | 34.1% |
| 2-Person Household | 379 | 33.7% |
| 3-Person Household | 238 | 21.1% |
| 4+ Person Household | 125 | 11.1% |
| Total Housing Units | 1,126 | 100.0% |
Occupancy by Ownership by Household Size in Greenport
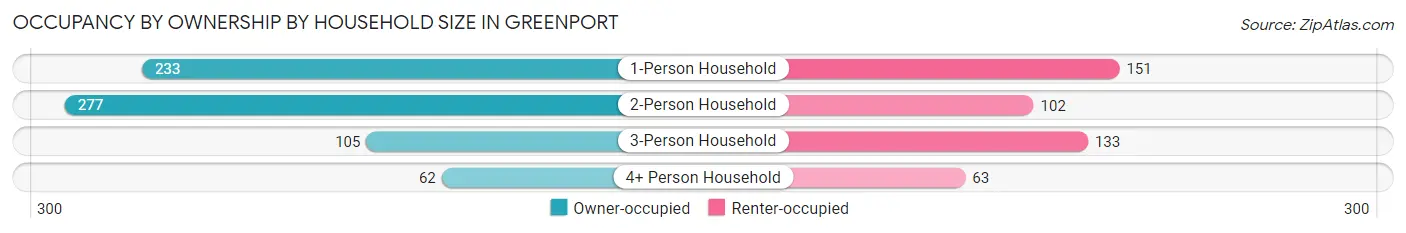
| Household Size | Owner-occupied | Renter-occupied |
| 1-Person Household | 233 (60.7%) | 151 (39.3%) |
| 2-Person Household | 277 (73.1%) | 102 (26.9%) |
| 3-Person Household | 105 (44.1%) | 133 (55.9%) |
| 4+ Person Household | 62 (49.6%) | 63 (50.4%) |
| Total Housing Units | 677 (60.1%) | 449 (39.9%) |
Occupancy by Educational Attainment in Greenport
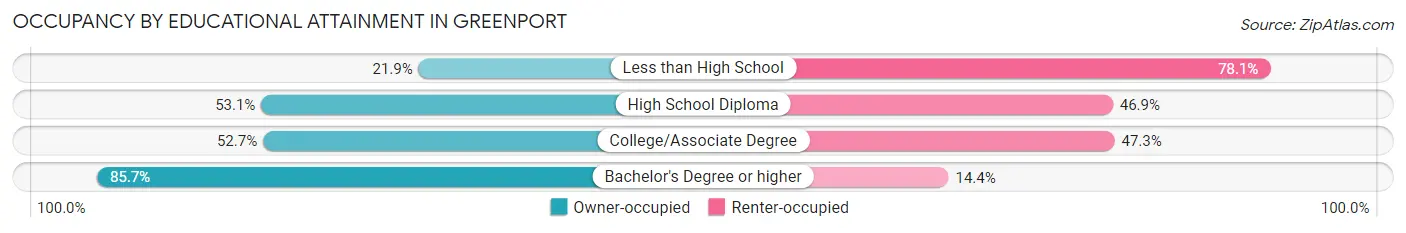
| Household Size | Owner-occupied | Renter-occupied |
| Less than High School | 44 (21.9%) | 157 (78.1%) |
| High School Diploma | 103 (53.1%) | 91 (46.9%) |
| College/Associate Degree | 154 (52.7%) | 138 (47.3%) |
| Bachelor's Degree or higher | 376 (85.7%) | 63 (14.3%) |
Occupancy by Age of Householder in Greenport
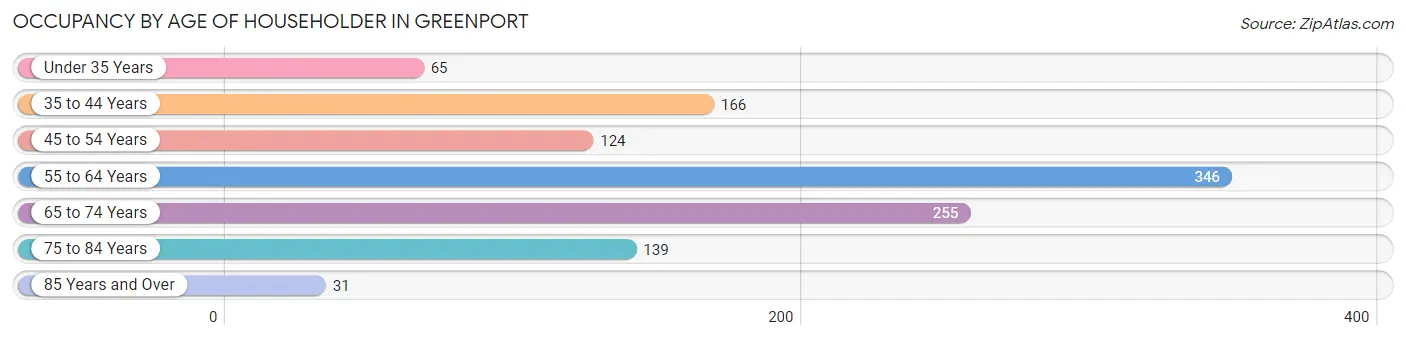
| Age Bracket | # Households | % Households |
| Under 35 Years | 65 | 5.8% |
| 35 to 44 Years | 166 | 14.7% |
| 45 to 54 Years | 124 | 11.0% |
| 55 to 64 Years | 346 | 30.7% |
| 65 to 74 Years | 255 | 22.7% |
| 75 to 84 Years | 139 | 12.3% |
| 85 Years and Over | 31 | 2.8% |
| Total | 1,126 | 100.0% |
Housing Finances in Greenport
Median Income by Occupancy in Greenport
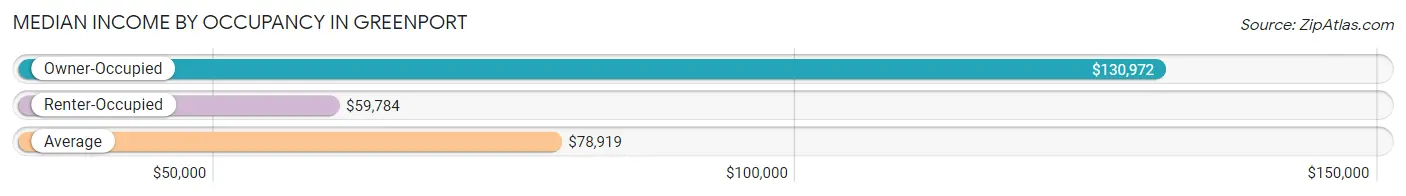
| Occupancy Type | # Households | Median Income |
| Owner-Occupied | 677 (60.1%) | $130,972 |
| Renter-Occupied | 449 (39.9%) | $59,784 |
| Average | 1,126 (100.0%) | $78,919 |
Occupancy by Householder Income Bracket in Greenport
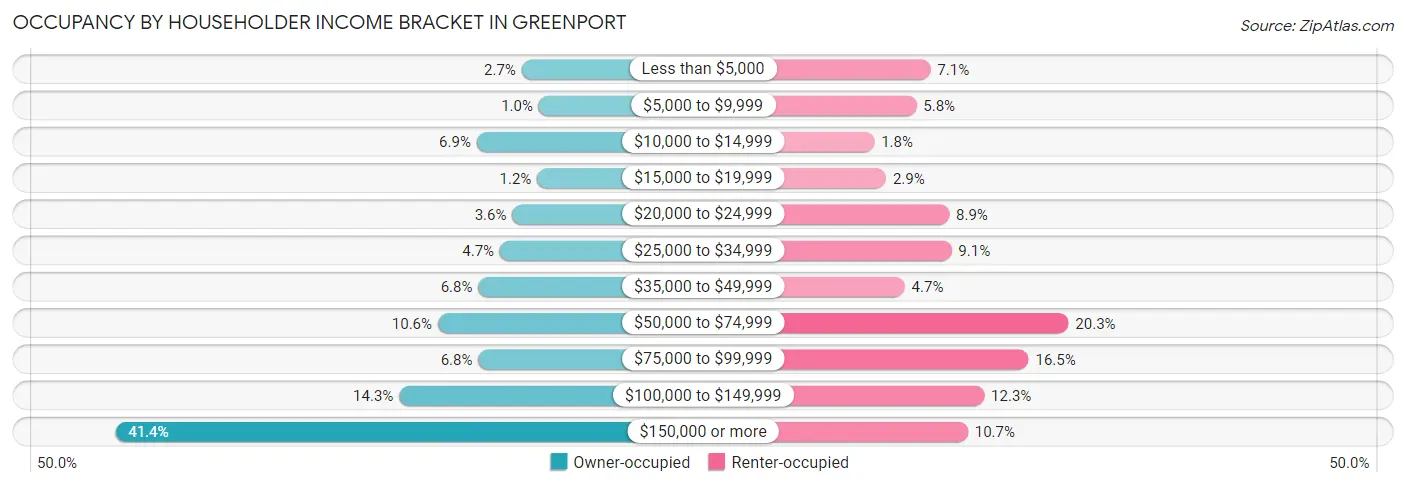
| Income Bracket | Owner-occupied | Renter-occupied |
| Less than $5,000 | 18 (2.7%) | 32 (7.1%) |
| $5,000 to $9,999 | 7 (1.0%) | 26 (5.8%) |
| $10,000 to $14,999 | 47 (6.9%) | 8 (1.8%) |
| $15,000 to $19,999 | 8 (1.2%) | 13 (2.9%) |
| $20,000 to $24,999 | 24 (3.5%) | 40 (8.9%) |
| $25,000 to $34,999 | 32 (4.7%) | 41 (9.1%) |
| $35,000 to $49,999 | 46 (6.8%) | 21 (4.7%) |
| $50,000 to $74,999 | 72 (10.6%) | 91 (20.3%) |
| $75,000 to $99,999 | 46 (6.8%) | 74 (16.5%) |
| $100,000 to $149,999 | 97 (14.3%) | 55 (12.2%) |
| $150,000 or more | 280 (41.4%) | 48 (10.7%) |
| Total | 677 (100.0%) | 449 (100.0%) |
Monthly Housing Cost Tiers in Greenport
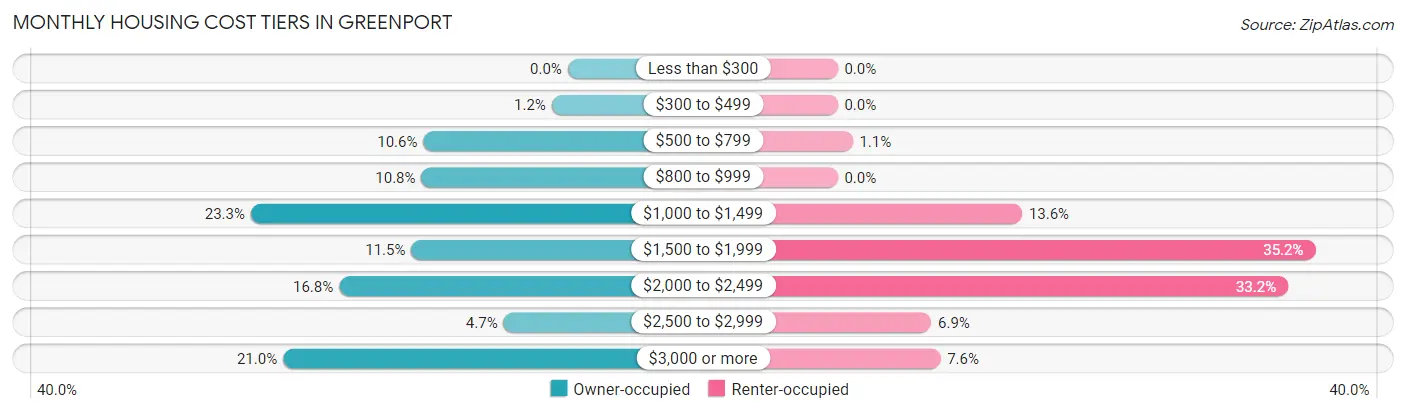
| Monthly Cost | Owner-occupied | Renter-occupied |
| Less than $300 | 0 (0.0%) | 0 (0.0%) |
| $300 to $499 | 8 (1.2%) | 0 (0.0%) |
| $500 to $799 | 72 (10.6%) | 5 (1.1%) |
| $800 to $999 | 73 (10.8%) | 0 (0.0%) |
| $1,000 to $1,499 | 158 (23.3%) | 61 (13.6%) |
| $1,500 to $1,999 | 78 (11.5%) | 158 (35.2%) |
| $2,000 to $2,499 | 114 (16.8%) | 149 (33.2%) |
| $2,500 to $2,999 | 32 (4.7%) | 31 (6.9%) |
| $3,000 or more | 142 (21.0%) | 34 (7.6%) |
| Total | 677 (100.0%) | 449 (100.0%) |
Physical Housing Characteristics in Greenport
Housing Structures in Greenport
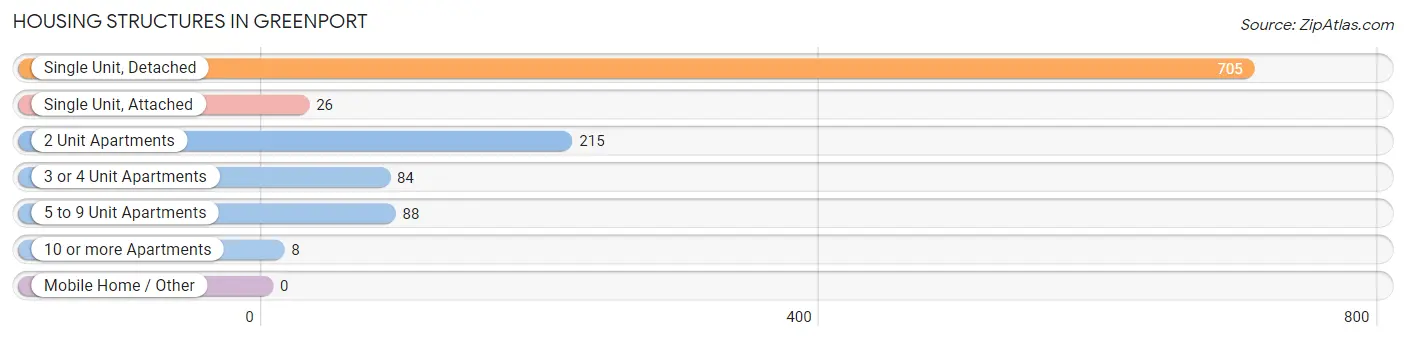
| Structure Type | # Housing Units | % Housing Units |
| Single Unit, Detached | 705 | 62.6% |
| Single Unit, Attached | 26 | 2.3% |
| 2 Unit Apartments | 215 | 19.1% |
| 3 or 4 Unit Apartments | 84 | 7.5% |
| 5 to 9 Unit Apartments | 88 | 7.8% |
| 10 or more Apartments | 8 | 0.7% |
| Mobile Home / Other | 0 | 0.0% |
| Total | 1,126 | 100.0% |
Housing Structures by Occupancy in Greenport
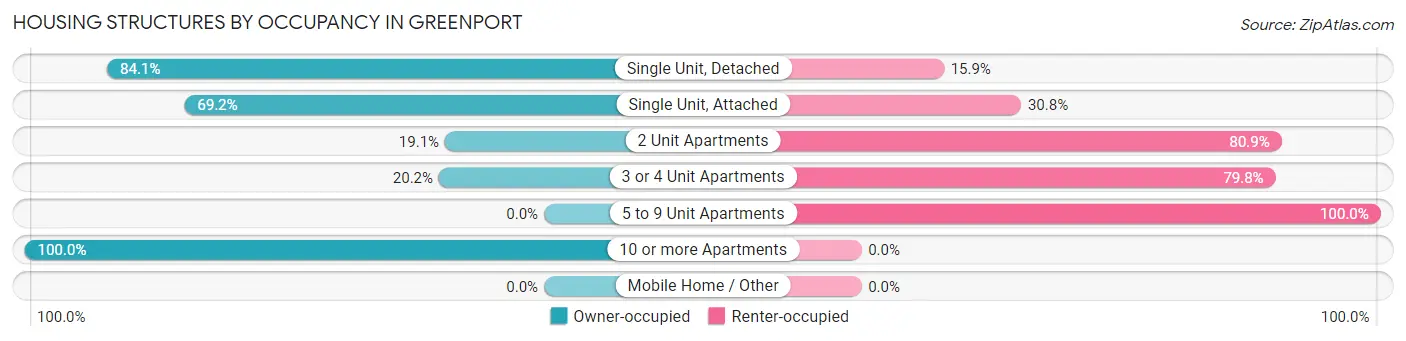
| Structure Type | Owner-occupied | Renter-occupied |
| Single Unit, Detached | 593 (84.1%) | 112 (15.9%) |
| Single Unit, Attached | 18 (69.2%) | 8 (30.8%) |
| 2 Unit Apartments | 41 (19.1%) | 174 (80.9%) |
| 3 or 4 Unit Apartments | 17 (20.2%) | 67 (79.8%) |
| 5 to 9 Unit Apartments | 0 (0.0%) | 88 (100.0%) |
| 10 or more Apartments | 8 (100.0%) | 0 (0.0%) |
| Mobile Home / Other | 0 (0.0%) | 0 (0.0%) |
| Total | 677 (60.1%) | 449 (39.9%) |
Housing Structures by Number of Rooms in Greenport
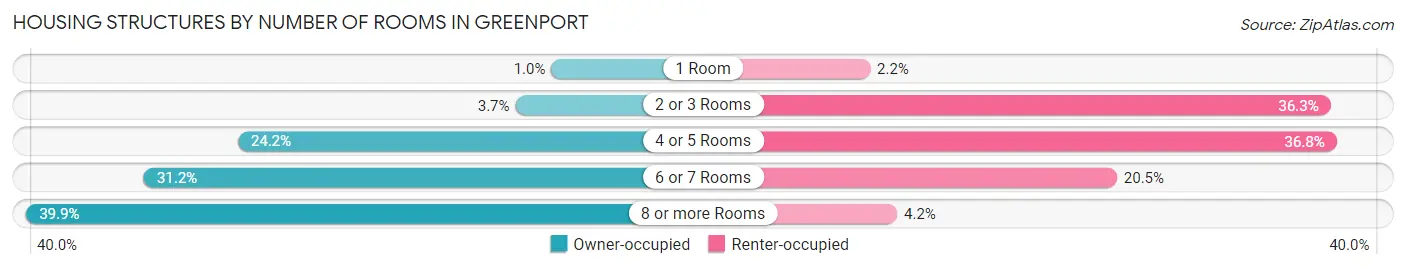
| Number of Rooms | Owner-occupied | Renter-occupied |
| 1 Room | 7 (1.0%) | 10 (2.2%) |
| 2 or 3 Rooms | 25 (3.7%) | 163 (36.3%) |
| 4 or 5 Rooms | 164 (24.2%) | 165 (36.7%) |
| 6 or 7 Rooms | 211 (31.2%) | 92 (20.5%) |
| 8 or more Rooms | 270 (39.9%) | 19 (4.2%) |
| Total | 677 (100.0%) | 449 (100.0%) |
Housing Structure by Heating Type in Greenport
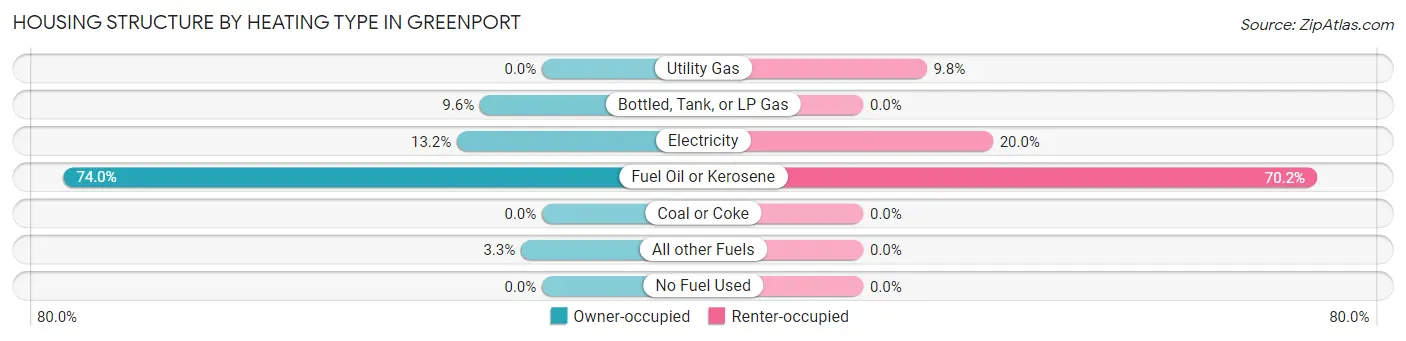
| Heating Type | Owner-occupied | Renter-occupied |
| Utility Gas | 0 (0.0%) | 44 (9.8%) |
| Bottled, Tank, or LP Gas | 65 (9.6%) | 0 (0.0%) |
| Electricity | 89 (13.2%) | 90 (20.0%) |
| Fuel Oil or Kerosene | 501 (74.0%) | 315 (70.2%) |
| Coal or Coke | 0 (0.0%) | 0 (0.0%) |
| All other Fuels | 22 (3.3%) | 0 (0.0%) |
| No Fuel Used | 0 (0.0%) | 0 (0.0%) |
| Total | 677 (100.0%) | 449 (100.0%) |
Household Vehicle Usage in Greenport
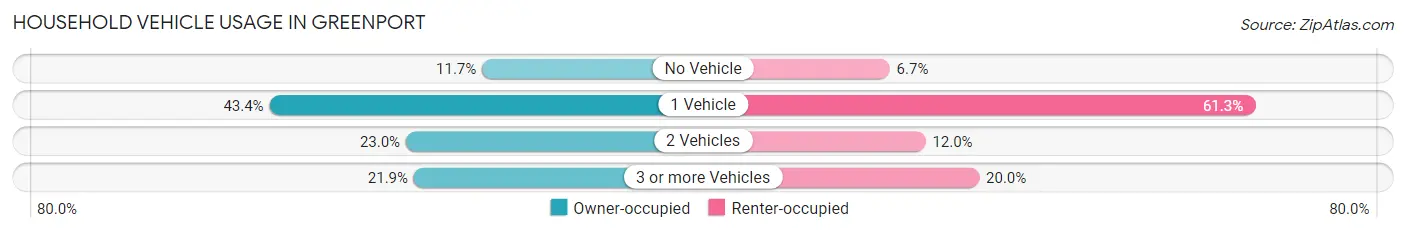
| Vehicles per Household | Owner-occupied | Renter-occupied |
| No Vehicle | 79 (11.7%) | 30 (6.7%) |
| 1 Vehicle | 294 (43.4%) | 275 (61.3%) |
| 2 Vehicles | 156 (23.0%) | 54 (12.0%) |
| 3 or more Vehicles | 148 (21.9%) | 90 (20.0%) |
| Total | 677 (100.0%) | 449 (100.0%) |
Real Estate & Mortgages in Greenport
Real Estate and Mortgage Overview in Greenport
| Characteristic | Without Mortgage | With Mortgage |
| Housing Units | 340 | 337 |
| Median Property Value | $708,800 | $816,100 |
| Median Household Income | $89,286 | $157 |
| Monthly Housing Costs | $1,047 | $134 |
| Real Estate Taxes | $5,694 | $0 |
Property Value by Mortgage Status in Greenport
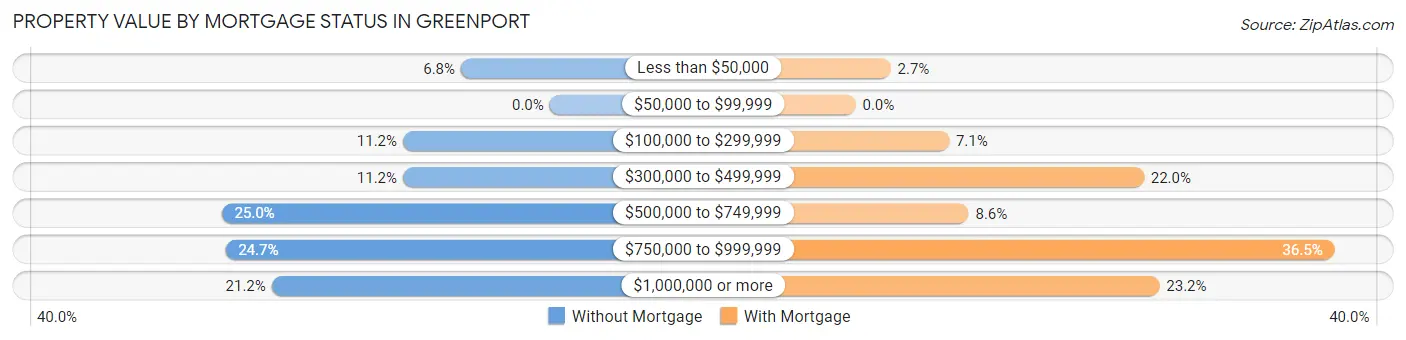
| Property Value | Without Mortgage | With Mortgage |
| Less than $50,000 | 23 (6.8%) | 9 (2.7%) |
| $50,000 to $99,999 | 0 (0.0%) | 0 (0.0%) |
| $100,000 to $299,999 | 38 (11.2%) | 24 (7.1%) |
| $300,000 to $499,999 | 38 (11.2%) | 74 (22.0%) |
| $500,000 to $749,999 | 85 (25.0%) | 29 (8.6%) |
| $750,000 to $999,999 | 84 (24.7%) | 123 (36.5%) |
| $1,000,000 or more | 72 (21.2%) | 78 (23.2%) |
| Total | 340 (100.0%) | 337 (100.0%) |
Household Income by Mortgage Status in Greenport
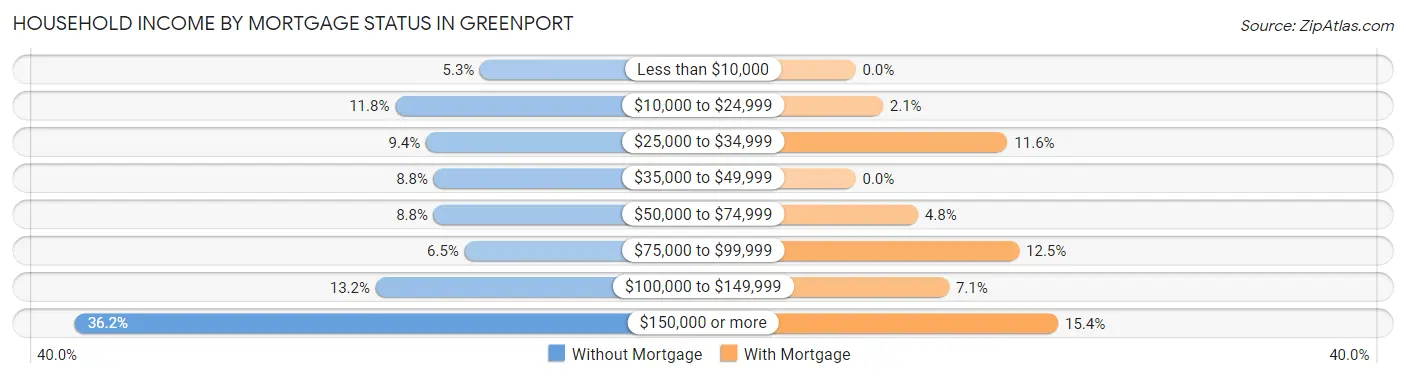
| Household Income | Without Mortgage | With Mortgage |
| Less than $10,000 | 18 (5.3%) | 0 (0.0%) |
| $10,000 to $24,999 | 40 (11.8%) | 7 (2.1%) |
| $25,000 to $34,999 | 32 (9.4%) | 39 (11.6%) |
| $35,000 to $49,999 | 30 (8.8%) | 0 (0.0%) |
| $50,000 to $74,999 | 30 (8.8%) | 16 (4.8%) |
| $75,000 to $99,999 | 22 (6.5%) | 42 (12.5%) |
| $100,000 to $149,999 | 45 (13.2%) | 24 (7.1%) |
| $150,000 or more | 123 (36.2%) | 52 (15.4%) |
| Total | 340 (100.0%) | 337 (100.0%) |
Property Value to Household Income Ratio in Greenport
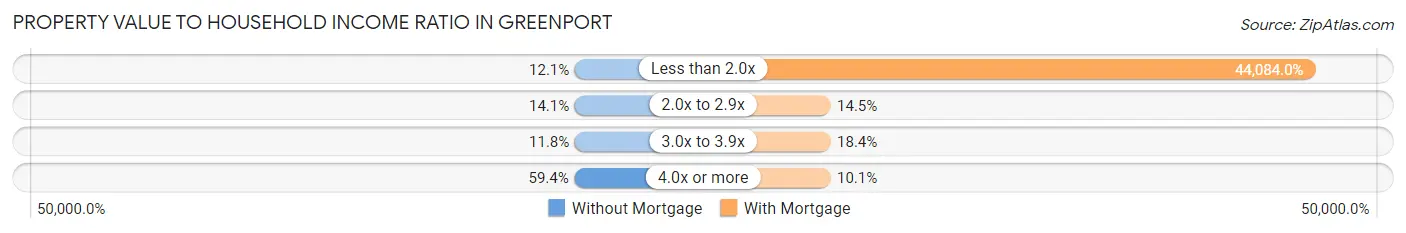
| Value-to-Income Ratio | Without Mortgage | With Mortgage |
| Less than 2.0x | 41 (12.1%) | 148,563 (44,084.0%) |
| 2.0x to 2.9x | 48 (14.1%) | 49 (14.5%) |
| 3.0x to 3.9x | 40 (11.8%) | 62 (18.4%) |
| 4.0x or more | 202 (59.4%) | 34 (10.1%) |
| Total | 340 (100.0%) | 337 (100.0%) |
Real Estate Taxes by Mortgage Status in Greenport
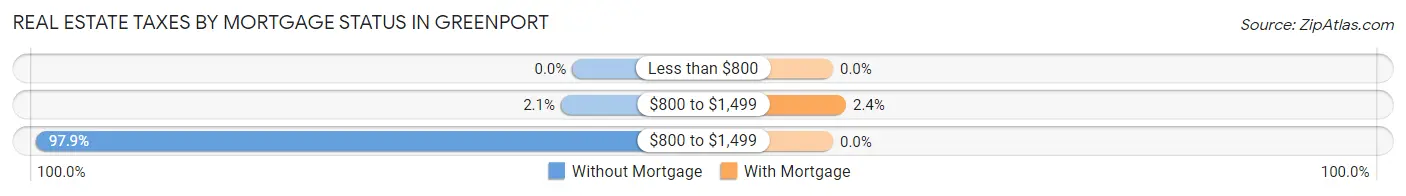
| Property Taxes | Without Mortgage | With Mortgage |
| Less than $800 | 0 (0.0%) | 0 (0.0%) |
| $800 to $1,499 | 7 (2.1%) | 8 (2.4%) |
| $800 to $1,499 | 333 (97.9%) | 0 (0.0%) |
| Total | 340 (100.0%) | 337 (100.0%) |
Health & Disability in Greenport
Health Insurance Coverage by Age in Greenport
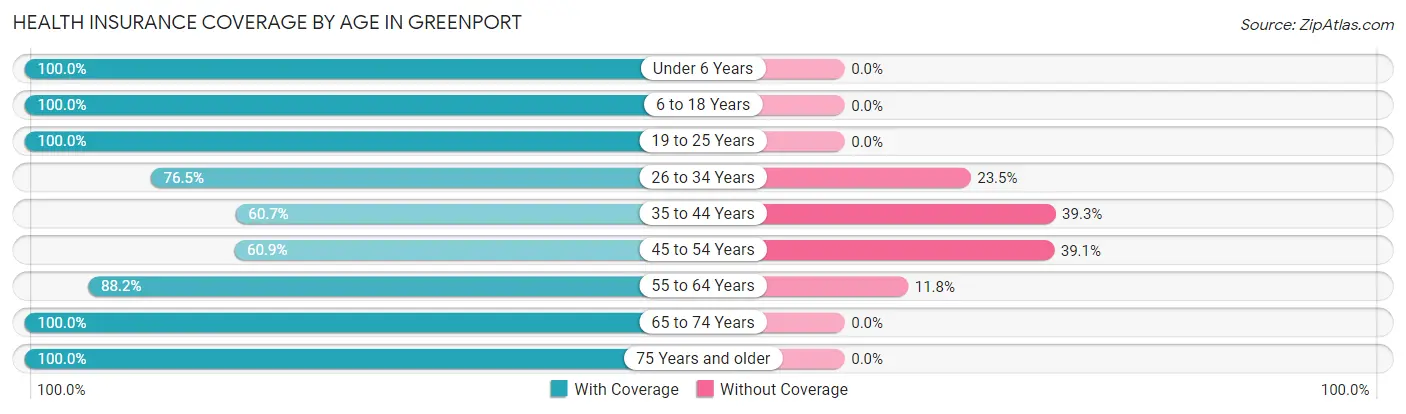
| Age Bracket | With Coverage | Without Coverage |
| Under 6 Years | 100 (100.0%) | 0 (0.0%) |
| 6 to 18 Years | 254 (100.0%) | 0 (0.0%) |
| 19 to 25 Years | 98 (100.0%) | 0 (0.0%) |
| 26 to 34 Years | 153 (76.5%) | 47 (23.5%) |
| 35 to 44 Years | 179 (60.7%) | 116 (39.3%) |
| 45 to 54 Years | 220 (60.9%) | 141 (39.1%) |
| 55 to 64 Years | 514 (88.2%) | 69 (11.8%) |
| 65 to 74 Years | 371 (100.0%) | 0 (0.0%) |
| 75 Years and older | 207 (100.0%) | 0 (0.0%) |
| Total | 2,096 (84.9%) | 373 (15.1%) |
Health Insurance Coverage by Citizenship Status in Greenport
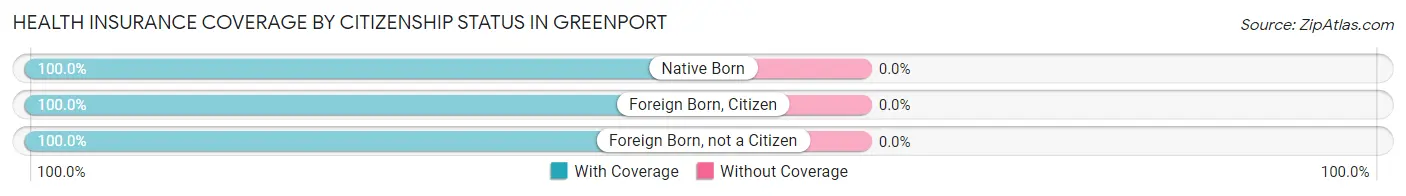
| Citizenship Status | With Coverage | Without Coverage |
| Native Born | 100 (100.0%) | 0 (0.0%) |
| Foreign Born, Citizen | 254 (100.0%) | 0 (0.0%) |
| Foreign Born, not a Citizen | 98 (100.0%) | 0 (0.0%) |
Health Insurance Coverage by Household Income in Greenport
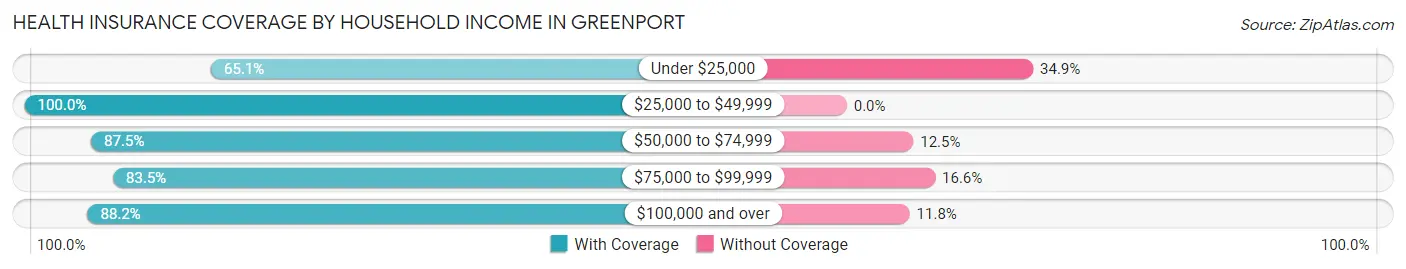
| Household Income | With Coverage | Without Coverage |
| Under $25,000 | 261 (65.1%) | 140 (34.9%) |
| $25,000 to $49,999 | 210 (100.0%) | 0 (0.0%) |
| $50,000 to $74,999 | 281 (87.5%) | 40 (12.5%) |
| $75,000 to $99,999 | 232 (83.5%) | 46 (16.6%) |
| $100,000 and over | 1,093 (88.2%) | 146 (11.8%) |
Public vs Private Health Insurance Coverage by Age in Greenport
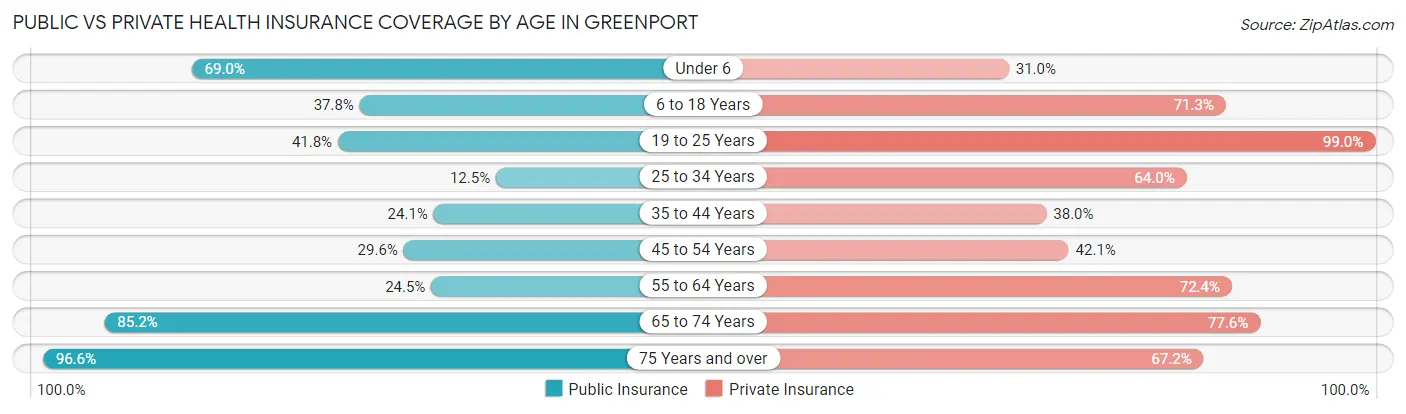
| Age Bracket | Public Insurance | Private Insurance |
| Under 6 | 69 (69.0%) | 31 (31.0%) |
| 6 to 18 Years | 96 (37.8%) | 181 (71.3%) |
| 19 to 25 Years | 41 (41.8%) | 97 (99.0%) |
| 25 to 34 Years | 25 (12.5%) | 128 (64.0%) |
| 35 to 44 Years | 71 (24.1%) | 112 (38.0%) |
| 45 to 54 Years | 107 (29.6%) | 152 (42.1%) |
| 55 to 64 Years | 143 (24.5%) | 422 (72.4%) |
| 65 to 74 Years | 316 (85.2%) | 288 (77.6%) |
| 75 Years and over | 200 (96.6%) | 139 (67.1%) |
| Total | 1,068 (43.3%) | 1,550 (62.8%) |
Disability Status by Sex by Age in Greenport
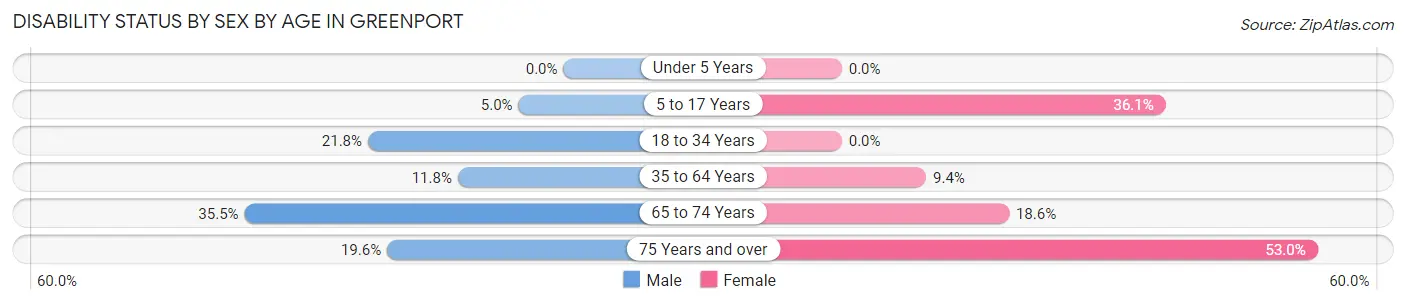
| Age Bracket | Male | Female |
| Under 5 Years | 0 (0.0%) | 0 (0.0%) |
| 5 to 17 Years | 7 (5.0%) | 53 (36.0%) |
| 18 to 34 Years | 27 (21.8%) | 0 (0.0%) |
| 35 to 64 Years | 73 (11.8%) | 58 (9.4%) |
| 65 to 74 Years | 65 (35.5%) | 35 (18.6%) |
| 75 Years and over | 11 (19.6%) | 80 (53.0%) |
Disability Class by Sex by Age in Greenport
Disability Class: Hearing Difficulty
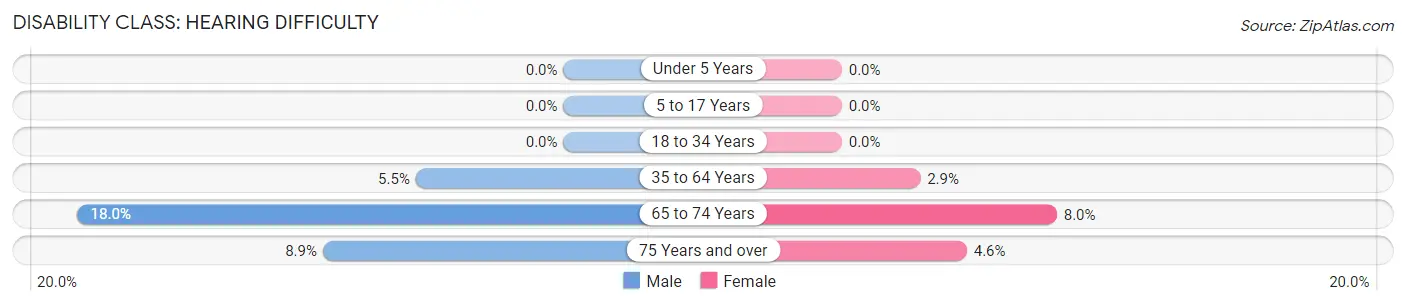
| Age Bracket | Male | Female |
| Under 5 Years | 0 (0.0%) | 0 (0.0%) |
| 5 to 17 Years | 0 (0.0%) | 0 (0.0%) |
| 18 to 34 Years | 0 (0.0%) | 0 (0.0%) |
| 35 to 64 Years | 34 (5.5%) | 18 (2.9%) |
| 65 to 74 Years | 33 (18.0%) | 15 (8.0%) |
| 75 Years and over | 5 (8.9%) | 7 (4.6%) |
Disability Class: Vision Difficulty
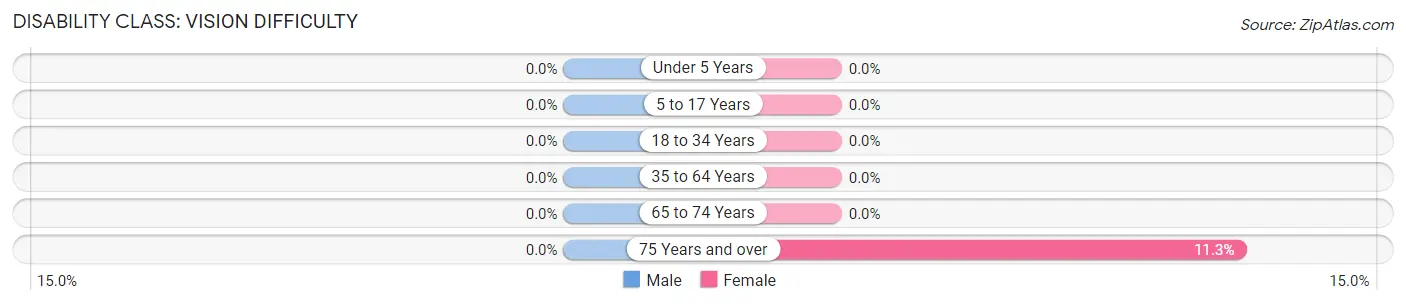
| Age Bracket | Male | Female |
| Under 5 Years | 0 (0.0%) | 0 (0.0%) |
| 5 to 17 Years | 0 (0.0%) | 0 (0.0%) |
| 18 to 34 Years | 0 (0.0%) | 0 (0.0%) |
| 35 to 64 Years | 0 (0.0%) | 0 (0.0%) |
| 65 to 74 Years | 0 (0.0%) | 0 (0.0%) |
| 75 Years and over | 0 (0.0%) | 17 (11.3%) |
Disability Class: Cognitive Difficulty
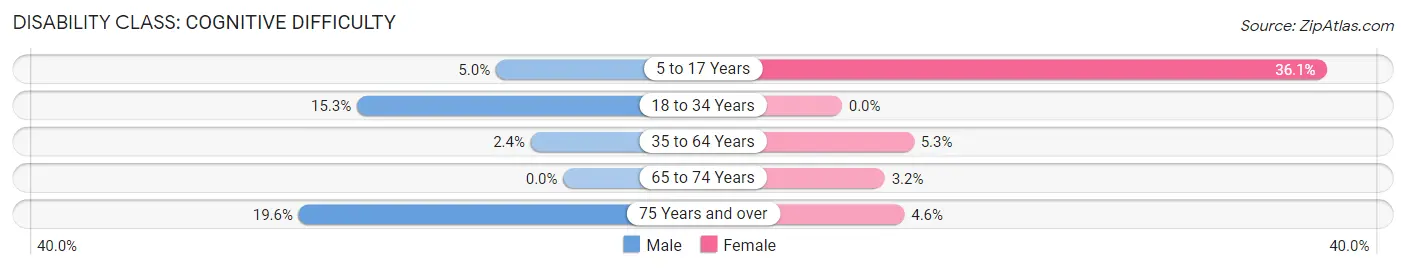
| Age Bracket | Male | Female |
| 5 to 17 Years | 7 (5.0%) | 53 (36.0%) |
| 18 to 34 Years | 19 (15.3%) | 0 (0.0%) |
| 35 to 64 Years | 15 (2.4%) | 33 (5.3%) |
| 65 to 74 Years | 0 (0.0%) | 6 (3.2%) |
| 75 Years and over | 11 (19.6%) | 7 (4.6%) |
Disability Class: Ambulatory Difficulty
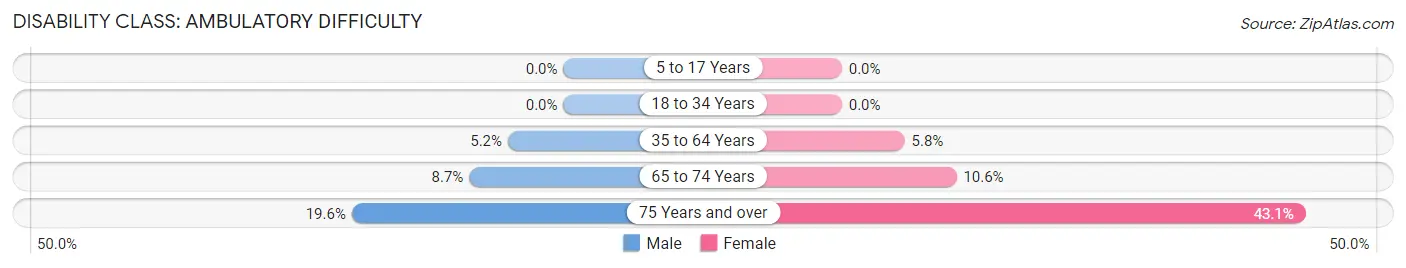
| Age Bracket | Male | Female |
| 5 to 17 Years | 0 (0.0%) | 0 (0.0%) |
| 18 to 34 Years | 0 (0.0%) | 0 (0.0%) |
| 35 to 64 Years | 32 (5.1%) | 36 (5.8%) |
| 65 to 74 Years | 16 (8.7%) | 20 (10.6%) |
| 75 Years and over | 11 (19.6%) | 65 (43.0%) |
Disability Class: Self-Care Difficulty
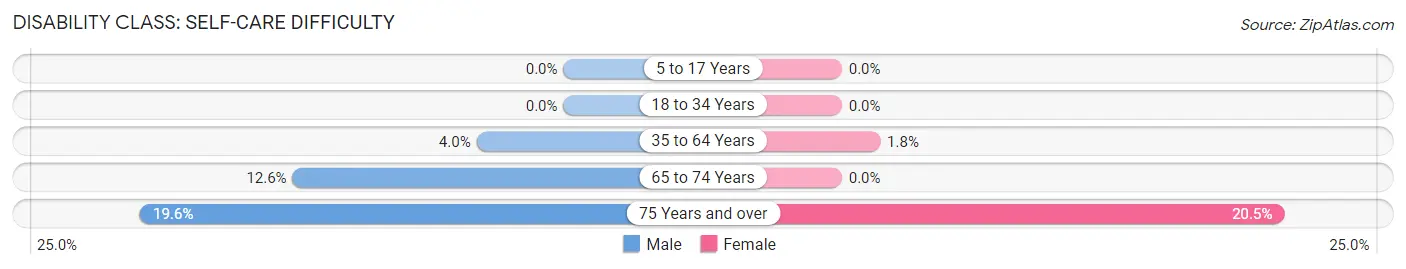
| Age Bracket | Male | Female |
| 5 to 17 Years | 0 (0.0%) | 0 (0.0%) |
| 18 to 34 Years | 0 (0.0%) | 0 (0.0%) |
| 35 to 64 Years | 25 (4.0%) | 11 (1.8%) |
| 65 to 74 Years | 23 (12.6%) | 0 (0.0%) |
| 75 Years and over | 11 (19.6%) | 31 (20.5%) |
Technology Access in Greenport
Computing Device Access in Greenport
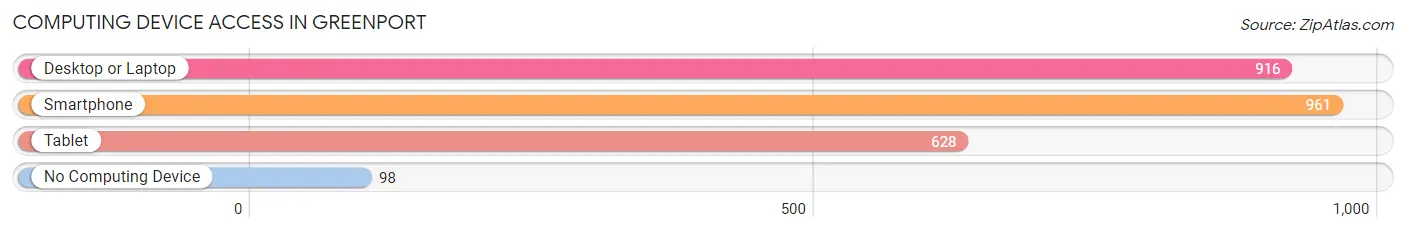
| Device Type | # Households | % Households |
| Desktop or Laptop | 916 | 81.4% |
| Smartphone | 961 | 85.4% |
| Tablet | 628 | 55.8% |
| No Computing Device | 98 | 8.7% |
| Total | 1,126 | 100.0% |
Internet Access in Greenport
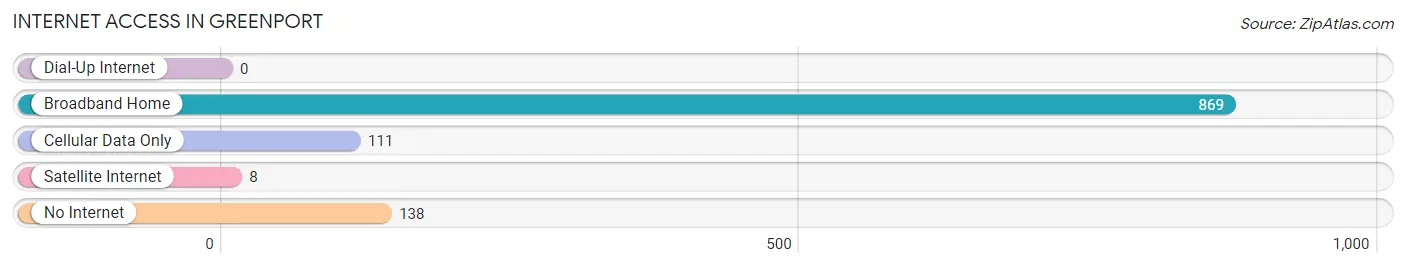
| Internet Type | # Households | % Households |
| Dial-Up Internet | 0 | 0.0% |
| Broadband Home | 869 | 77.2% |
| Cellular Data Only | 111 | 9.9% |
| Satellite Internet | 8 | 0.7% |
| No Internet | 138 | 12.3% |
| Total | 1,126 | 100.0% |
Greenport Summary
Greenport is a village located in Suffolk County, New York, United States. It is situated on the North Fork of Long Island, and is part of the Town of Southold. The population was 2,197 at the 2010 census.
History
Greenport was first settled in 1682 by English colonists. The village was originally known as Winter Harbor, and was renamed Greenport in 1838. The name was chosen to honor the green port of entry that the village provided for ships entering Long Island Sound.
Greenport was an important port for the whaling industry in the 19th century. It was also a major center for the oyster industry, and was home to several large oyster companies.
In the late 19th century, Greenport became a popular tourist destination. It was home to several large hotels, and was a popular spot for fishing and sailing.
Geography
Greenport is located at 41°5′17″N 72°25′45″W (41.0879, -72.4292). According to the United States Census Bureau, the village has a total area of 1.2 square miles (3.1 km2), all of it land.
Economy
Greenport’s economy is largely based on tourism and fishing. The village is home to several marinas, and is a popular destination for sailing and fishing.
Greenport is also home to several wineries, breweries, and distilleries. The village is home to the Greenport Harbor Brewing Company, the Long Island Spirits Distillery, and the Kontokosta Winery.
Demographics
As of the census of 2010, there were 2,197 people, 945 households, and 545 families residing in the village. The population density was 1,817.5 people per square mile (700.7/km2). There were 1,039 housing units at an average density of 858.3 per square mile (331.2/km2). The racial makeup of the village was 87.2% White, 5.2% African American, 0.2% Native American, 1.2% Asian, 0.1% Pacific Islander, 4.2% from other races, and 2.1% from two or more races. Hispanic or Latino of any race were 11.2% of the population.
There were 945 households, out of which 24.2% had children under the age of 18 living with them, 43.2% were married couples living together, 11.2% had a female householder with no husband present, and 41.2% were non-families. 34.2% of all households were made up of individuals, and 14.2% had someone living alone who was 65 years of age or older. The average household size was 2.31 and the average family size was 3.00.
In the village, the population was spread out, with 20.7% under the age of 18, 6.2% from 18 to 24, 25.2% from 25 to 44, 28.2% from 45 to 64, and 19.7% who were 65 years of age or older. The median age was 43 years. For every 100 females, there were 91.2 males. For every 100 females age 18 and over, there were 88.2 males.
The median income for a household in the village was $50,938, and the median income for a family was $60,000. Males had a median income of $41,250 versus $31,250 for females. The per capita income for the village was $27,945. About 6.2% of families and 8.2% of the population were below the poverty line, including 10.2% of those under age 18 and 5.2% of those age 65 or over.
Common Questions
What is Per Capita Income in Greenport?
Per Capita income in Greenport is $58,316.
What is the Median Family Income in Greenport?
Median Family Income in Greenport is $117,031.
What is the Median Household income in Greenport?
Median Household Income in Greenport is $78,919.
What is Income or Wage Gap in Greenport?
Income or Wage Gap in Greenport is 34.0%.
Women in Greenport earn 66.0 cents for every dollar earned by a man.
What is Inequality or Gini Index in Greenport?
Inequality or Gini Index in Greenport is 0.53.
What is the Total Population of Greenport?
Total Population of Greenport is 2,569.
What is the Total Male Population of Greenport?
Total Male Population of Greenport is 1,169.
What is the Total Female Population of Greenport?
Total Female Population of Greenport is 1,400.
What is the Ratio of Males per 100 Females in Greenport?
There are 83.50 Males per 100 Females in Greenport.
What is the Ratio of Females per 100 Males in Greenport?
There are 119.76 Females per 100 Males in Greenport.
What is the Median Population Age in Greenport?
Median Population Age in Greenport is 54.6 Years.
What is the Average Family Size in Greenport
Average Family Size in Greenport is 2.7 People.
What is the Average Household Size in Greenport
Average Household Size in Greenport is 2.2 People.
How Large is the Labor Force in Greenport?
There are 1,494 People in the Labor Forcein in Greenport.
What is the Percentage of People in the Labor Force in Greenport?
65.7% of People are in the Labor Force in Greenport.
What is the Unemployment Rate in Greenport?
Unemployment Rate in Greenport is 5.5%.