Yonkers, NY Map & Demographics
Yonkers Map
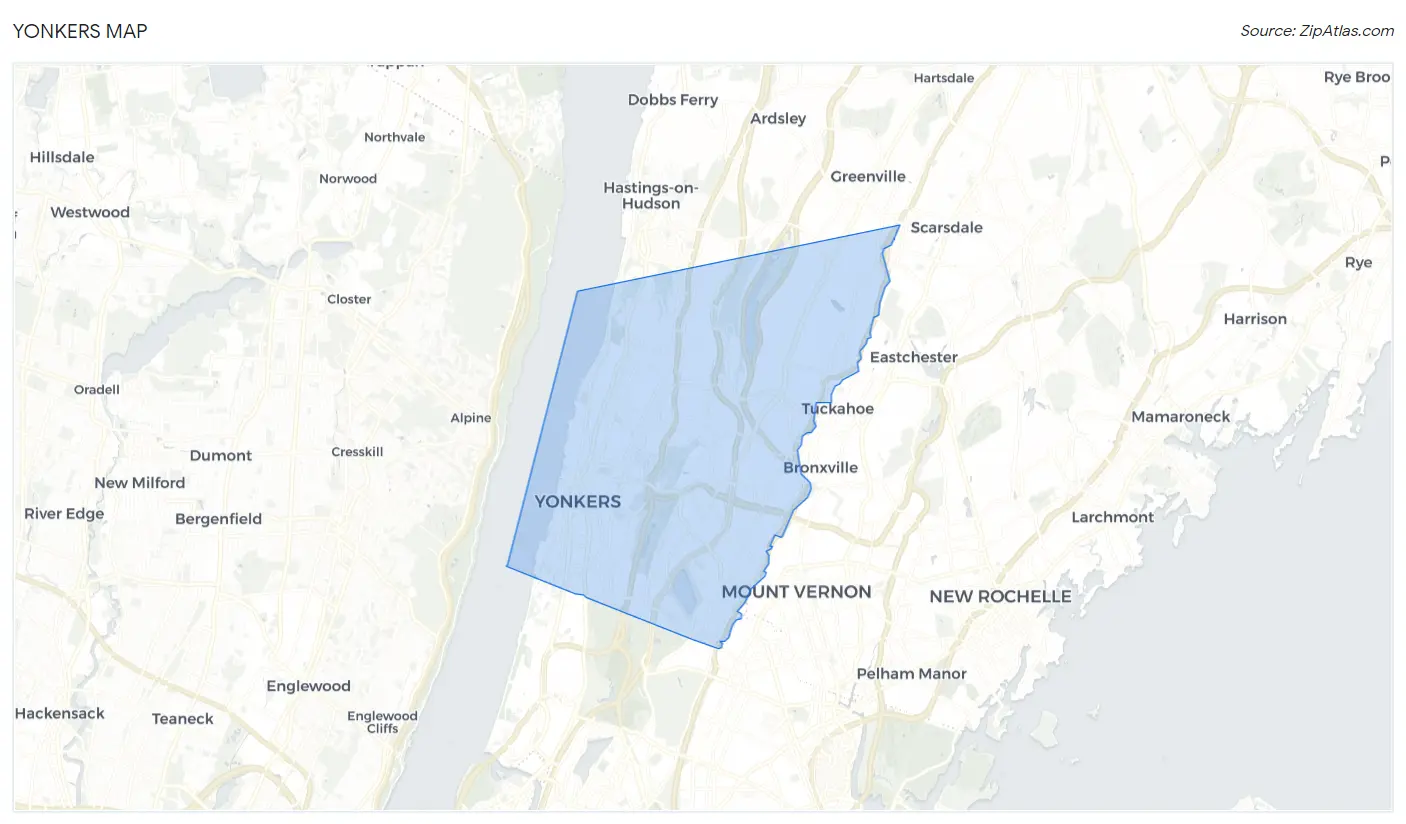
Yonkers Overview
$42,336
PER CAPITA INCOME
$96,322
AVG FAMILY INCOME
$78,208
AVG HOUSEHOLD INCOME
21.2%
WAGE / INCOME GAP [ % ]
78.8¢/ $1
WAGE / INCOME GAP [ $ ]
$12,088
FAMILY INCOME DEFICIT
0.49
INEQUALITY / GINI INDEX
209,780
TOTAL POPULATION
102,097
MALE POPULATION
107,683
FEMALE POPULATION
94.81
MALES / 100 FEMALES
105.47
FEMALES / 100 MALES
39.1
MEDIAN AGE
3.2
AVG FAMILY SIZE
2.5
AVG HOUSEHOLD SIZE
109,518
LABOR FORCE [ PEOPLE ]
63.8%
PERCENT IN LABOR FORCE
6.6%
UNEMPLOYMENT RATE
Income in Yonkers
Income Overview in Yonkers
Per Capita Income in Yonkers is $42,336, while median incomes of families and households are $96,322 and $78,208 respectively.
| Characteristic | Number | Measure |
| Per Capita Income | 209,780 | $42,336 |
| Median Family Income | 51,070 | $96,322 |
| Mean Family Income | 51,070 | $128,488 |
| Median Household Income | 81,470 | $78,208 |
| Mean Household Income | 81,470 | $108,227 |
| Income Deficit | 51,070 | $12,088 |
| Wage / Income Gap (%) | 209,780 | 21.25% |
| Wage / Income Gap ($) | 209,780 | 78.75¢ per $1 |
| Gini / Inequality Index | 209,780 | 0.49 |
Earnings by Sex in Yonkers
Average Earnings in Yonkers are $47,973, $53,795 for men and $42,364 for women, a difference of 21.2%.
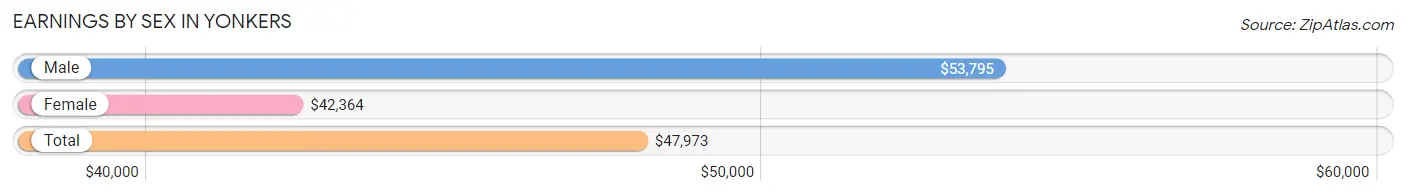
| Sex | Number | Average Earnings |
| Male | 57,252 (51.2%) | $53,795 |
| Female | 54,495 (48.8%) | $42,364 |
| Total | 111,747 (100.0%) | $47,973 |
Earnings by Sex by Income Bracket in Yonkers
The most common earnings brackets in Yonkers are $100,000+ for men (12,355 | 21.6%) and $100,000+ for women (8,275 | 15.2%).
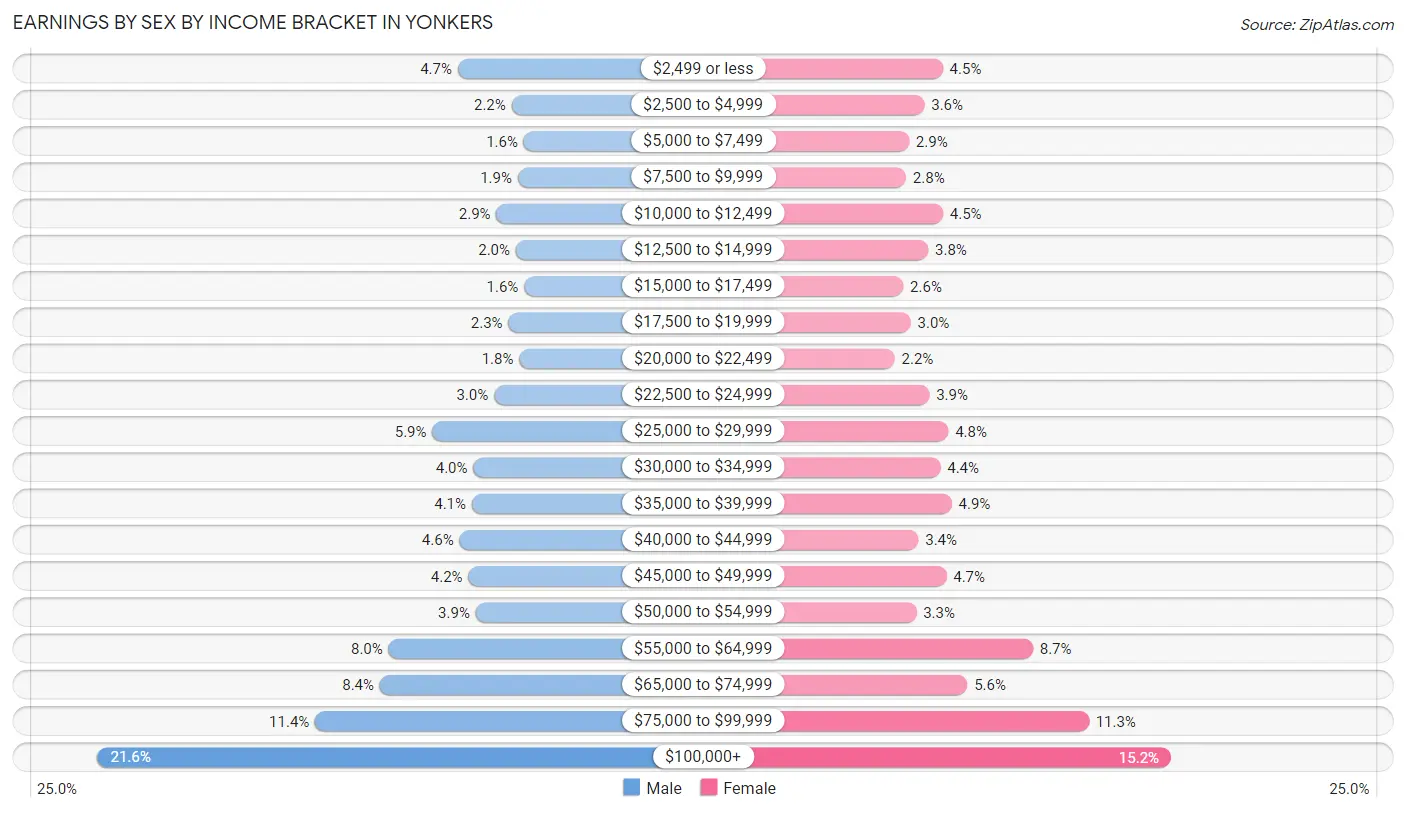
| Income | Male | Female |
| $2,499 or less | 2,695 (4.7%) | 2,445 (4.5%) |
| $2,500 to $4,999 | 1,254 (2.2%) | 1,978 (3.6%) |
| $5,000 to $7,499 | 929 (1.6%) | 1,586 (2.9%) |
| $7,500 to $9,999 | 1,089 (1.9%) | 1,511 (2.8%) |
| $10,000 to $12,499 | 1,661 (2.9%) | 2,450 (4.5%) |
| $12,500 to $14,999 | 1,140 (2.0%) | 2,078 (3.8%) |
| $15,000 to $17,499 | 916 (1.6%) | 1,437 (2.6%) |
| $17,500 to $19,999 | 1,338 (2.3%) | 1,632 (3.0%) |
| $20,000 to $22,499 | 1,045 (1.8%) | 1,219 (2.2%) |
| $22,500 to $24,999 | 1,726 (3.0%) | 2,102 (3.9%) |
| $25,000 to $29,999 | 3,379 (5.9%) | 2,587 (4.8%) |
| $30,000 to $34,999 | 2,276 (4.0%) | 2,388 (4.4%) |
| $35,000 to $39,999 | 2,316 (4.1%) | 2,676 (4.9%) |
| $40,000 to $44,999 | 2,648 (4.6%) | 1,827 (3.4%) |
| $45,000 to $49,999 | 2,411 (4.2%) | 2,539 (4.7%) |
| $50,000 to $54,999 | 2,217 (3.9%) | 1,771 (3.3%) |
| $55,000 to $64,999 | 4,551 (8.0%) | 4,749 (8.7%) |
| $65,000 to $74,999 | 4,784 (8.4%) | 3,073 (5.6%) |
| $75,000 to $99,999 | 6,522 (11.4%) | 6,172 (11.3%) |
| $100,000+ | 12,355 (21.6%) | 8,275 (15.2%) |
| Total | 57,252 (100.0%) | 54,495 (100.0%) |
Earnings by Sex by Educational Attainment in Yonkers
Average earnings in Yonkers are $59,274 for men and $49,727 for women, a difference of 16.1%. Men with an educational attainment of graduate degree enjoy the highest average annual earnings of $94,889, while those with less than high school education earn the least with $33,994. Women with an educational attainment of graduate degree earn the most with the average annual earnings of $84,390, while those with less than high school education have the smallest earnings of $25,055.
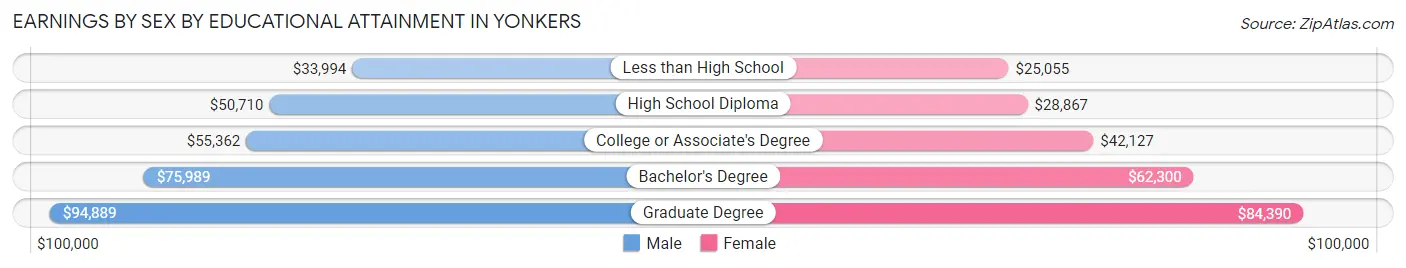
| Educational Attainment | Male Income | Female Income |
| Less than High School | $33,994 | $25,055 |
| High School Diploma | $50,710 | $28,867 |
| College or Associate's Degree | $55,362 | $42,127 |
| Bachelor's Degree | $75,989 | $62,300 |
| Graduate Degree | $94,889 | $84,390 |
| Total | $59,274 | $49,727 |
Family Income in Yonkers
Family Income Brackets in Yonkers
According to the Yonkers family income data, there are 10,112 families falling into the $200,000+ income range, which is the most common income bracket and makes up 19.8% of all families. Conversely, the $10,000 to $14,999 income bracket is the least frequent group with only 817 families (1.6%) belonging to this category.
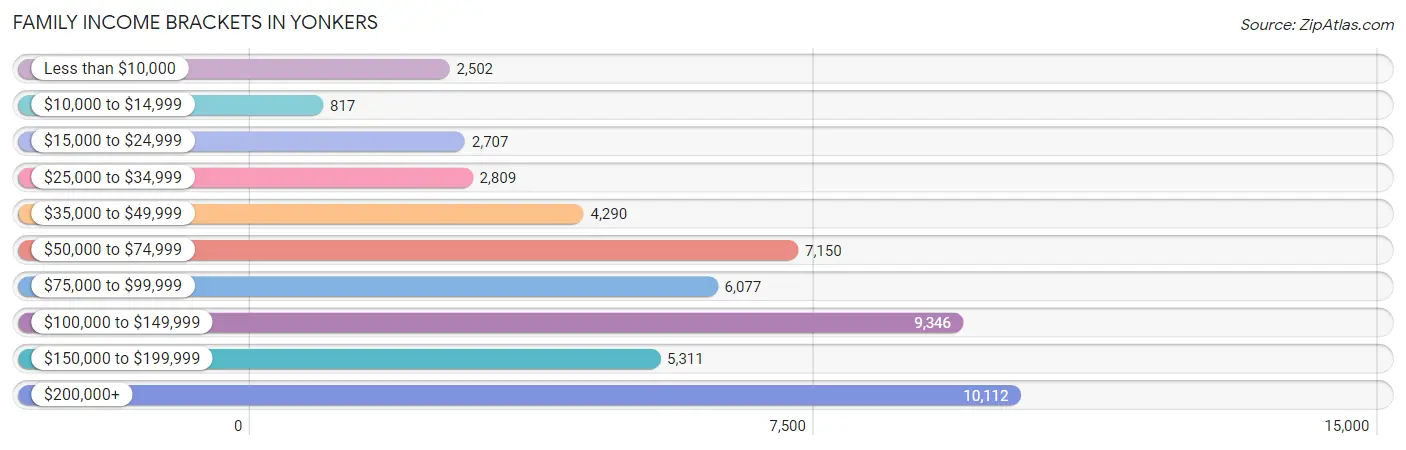
| Income Bracket | # Families | % Families |
| Less than $10,000 | 2,502 | 4.9% |
| $10,000 to $14,999 | 817 | 1.6% |
| $15,000 to $24,999 | 2,707 | 5.3% |
| $25,000 to $34,999 | 2,809 | 5.5% |
| $35,000 to $49,999 | 4,290 | 8.4% |
| $50,000 to $74,999 | 7,150 | 14.0% |
| $75,000 to $99,999 | 6,077 | 11.9% |
| $100,000 to $149,999 | 9,346 | 18.3% |
| $150,000 to $199,999 | 5,311 | 10.4% |
| $200,000+ | 10,112 | 19.8% |
Family Income by Famaliy Size in Yonkers
7+ person families (909 | 1.8%) account for the highest median family income in Yonkers with $177,734 per family, while 2-person families (20,404 | 40.0%) have the highest median income of $41,528 per family member.
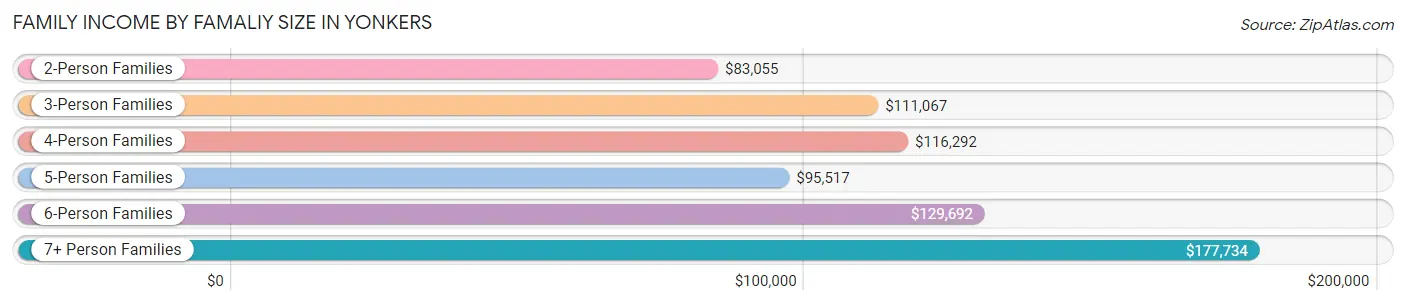
| Income Bracket | # Families | Median Income |
| 2-Person Families | 20,404 (40.0%) | $83,055 |
| 3-Person Families | 13,467 (26.4%) | $111,067 |
| 4-Person Families | 9,412 (18.4%) | $116,292 |
| 5-Person Families | 4,438 (8.7%) | $95,517 |
| 6-Person Families | 2,440 (4.8%) | $129,692 |
| 7+ Person Families | 909 (1.8%) | $177,734 |
| Total | 51,070 (100.0%) | $96,322 |
Family Income by Number of Earners in Yonkers
The median family income in Yonkers is $96,322, with families comprising 3+ earners (8,201) having the highest median family income of $168,132, while families with no earners (6,770) have the lowest median family income of $32,864, accounting for 16.1% and 13.3% of families, respectively.
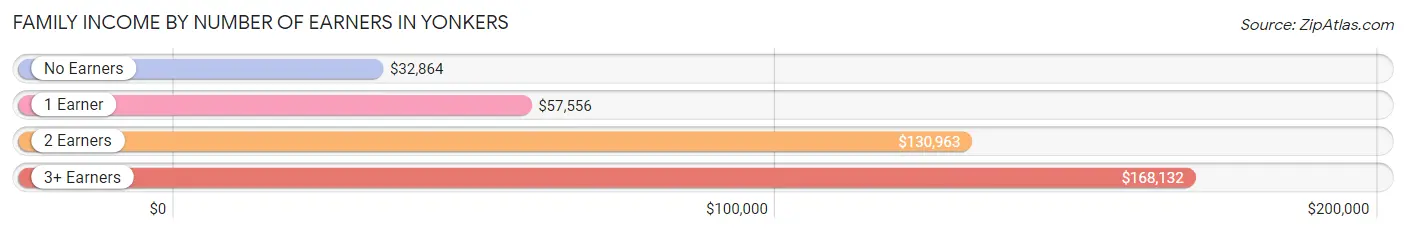
| Number of Earners | # Families | Median Income |
| No Earners | 6,770 (13.3%) | $32,864 |
| 1 Earner | 15,468 (30.3%) | $57,556 |
| 2 Earners | 20,631 (40.4%) | $130,963 |
| 3+ Earners | 8,201 (16.1%) | $168,132 |
| Total | 51,070 (100.0%) | $96,322 |
Household Income in Yonkers
Household Income Brackets in Yonkers
With 13,850 households falling in the category, the $100,000 to $149,999 income range is the most frequent in Yonkers, accounting for 17.0% of all households. In contrast, only 3,422 households (4.2%) fall into the $10,000 to $14,999 income bracket, making it the least populous group.
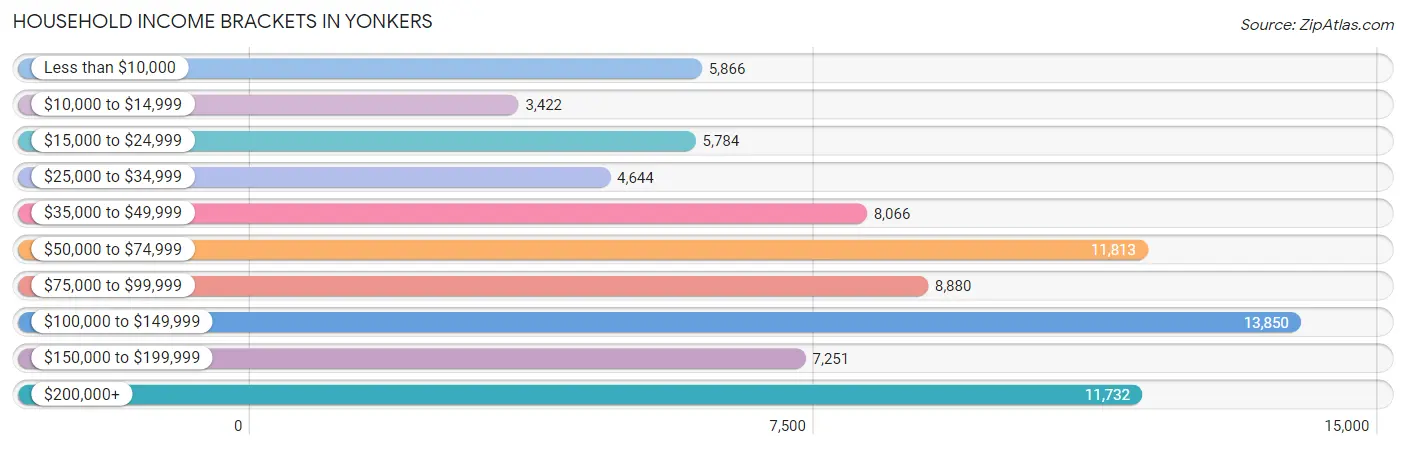
| Income Bracket | # Households | % Households |
| Less than $10,000 | 5,866 | 7.2% |
| $10,000 to $14,999 | 3,422 | 4.2% |
| $15,000 to $24,999 | 5,784 | 7.1% |
| $25,000 to $34,999 | 4,644 | 5.7% |
| $35,000 to $49,999 | 8,066 | 9.9% |
| $50,000 to $74,999 | 11,813 | 14.5% |
| $75,000 to $99,999 | 8,880 | 10.9% |
| $100,000 to $149,999 | 13,850 | 17.0% |
| $150,000 to $199,999 | 7,251 | 8.9% |
| $200,000+ | 11,732 | 14.4% |
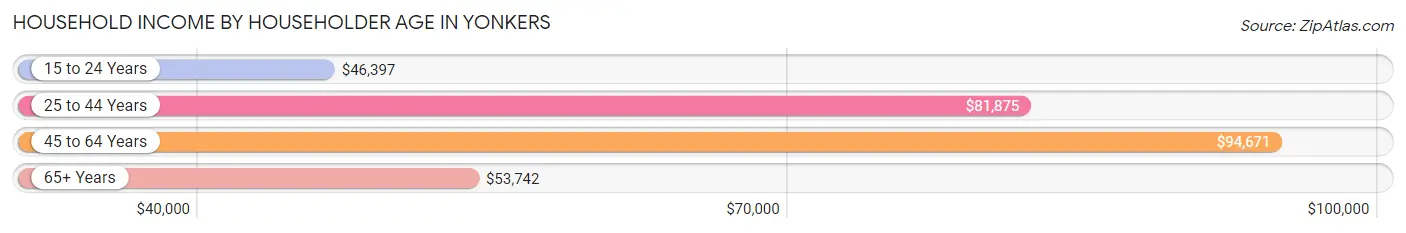
Household Income by Householder Age in Yonkers
The median household income in Yonkers is $78,208, with the highest median household income of $94,671 found in the 45 to 64 years age bracket for the primary householder. A total of 32,673 households (40.1%) fall into this category. Meanwhile, the 15 to 24 years age bracket for the primary householder has the lowest median household income of $46,397, with 1,580 households (1.9%) in this group.
| Income Bracket | # Households | Median Income |
| 15 to 24 Years | 1,580 (1.9%) | $46,397 |
| 25 to 44 Years | 24,731 (30.4%) | $81,875 |
| 45 to 64 Years | 32,673 (40.1%) | $94,671 |
| 65+ Years | 22,486 (27.6%) | $53,742 |
| Total | 81,470 (100.0%) | $78,208 |
Poverty in Yonkers
Income Below Poverty by Sex and Age in Yonkers
With 12.1% poverty level for males and 14.3% for females among the residents of Yonkers, 5 year old males and 5 year old females are the most vulnerable to poverty, with 273 males (45.4%) and 223 females (20.6%) in their respective age groups living below the poverty level.
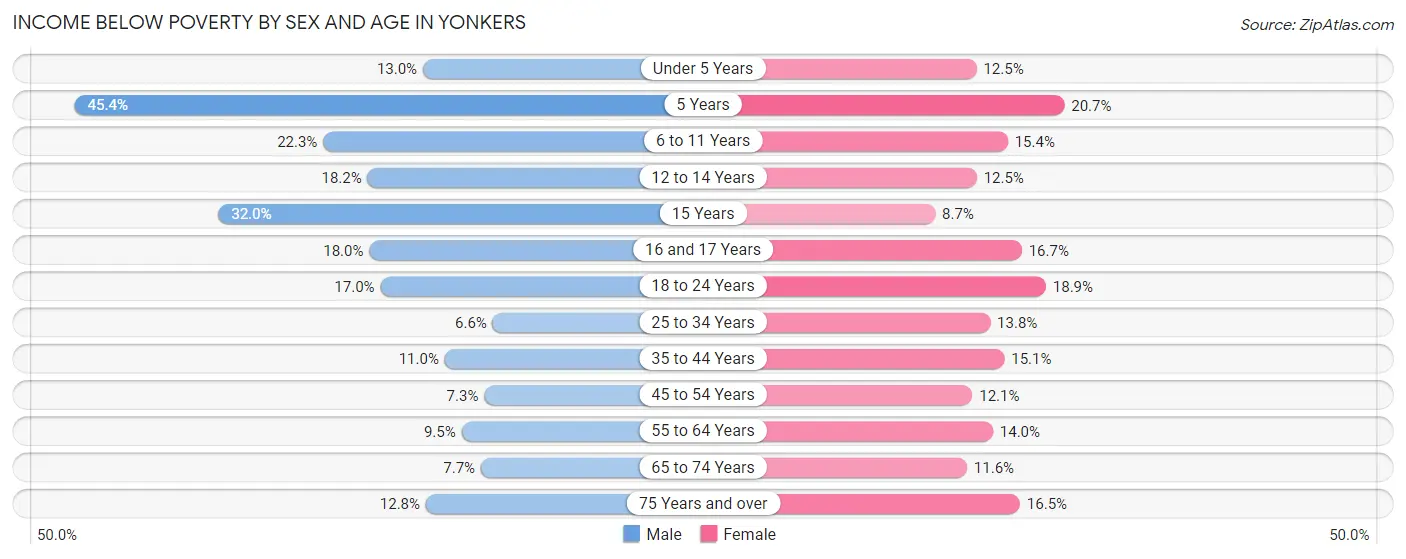
| Age Bracket | Male | Female |
| Under 5 Years | 784 (13.0%) | 735 (12.5%) |
| 5 Years | 273 (45.4%) | 223 (20.6%) |
| 6 to 11 Years | 1,781 (22.3%) | 862 (15.4%) |
| 12 to 14 Years | 653 (18.2%) | 553 (12.5%) |
| 15 Years | 481 (32.0%) | 91 (8.7%) |
| 16 and 17 Years | 620 (18.0%) | 357 (16.7%) |
| 18 to 24 Years | 1,571 (17.0%) | 1,655 (18.9%) |
| 25 to 34 Years | 978 (6.6%) | 2,085 (13.8%) |
| 35 to 44 Years | 1,394 (11.0%) | 2,133 (15.1%) |
| 45 to 54 Years | 946 (7.3%) | 1,634 (12.1%) |
| 55 to 64 Years | 1,271 (9.5%) | 2,005 (14.0%) |
| 65 to 74 Years | 664 (7.6%) | 1,207 (11.6%) |
| 75 Years and over | 779 (12.8%) | 1,606 (16.5%) |
| Total | 12,195 (12.1%) | 15,146 (14.3%) |
Income Above Poverty by Sex and Age in Yonkers
According to the poverty statistics in Yonkers, males aged 25 to 34 years and females aged 15 years are the age groups that are most secure financially, with 93.4% of males and 91.3% of females in these age groups living above the poverty line.
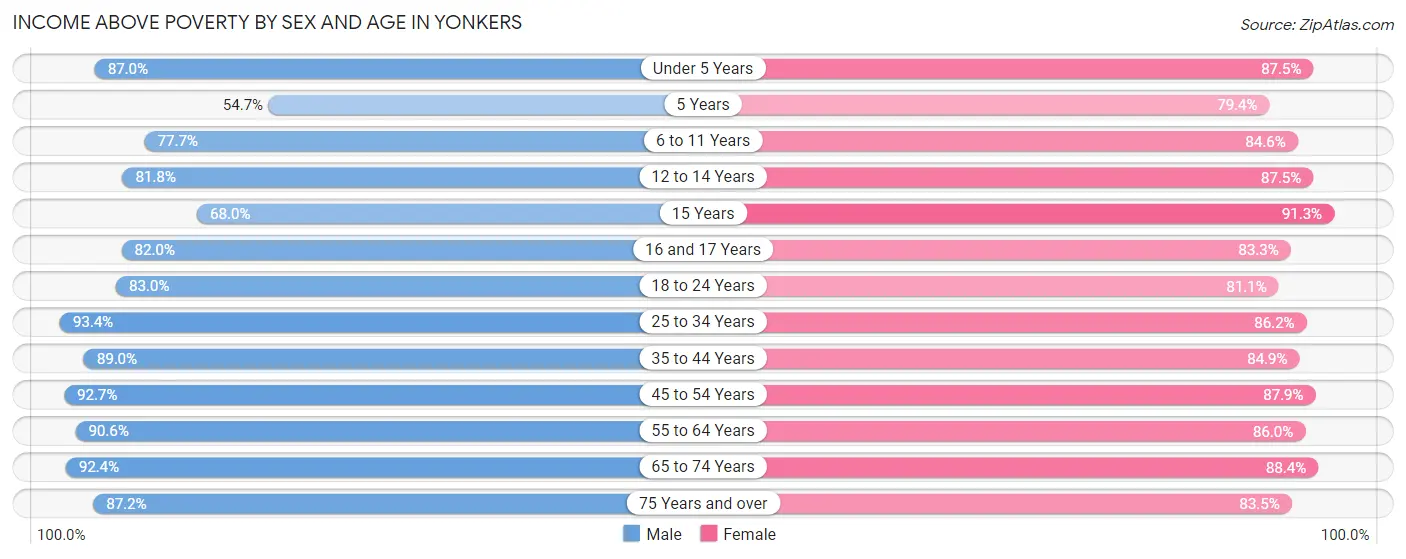
| Age Bracket | Male | Female |
| Under 5 Years | 5,233 (87.0%) | 5,145 (87.5%) |
| 5 Years | 329 (54.6%) | 857 (79.3%) |
| 6 to 11 Years | 6,208 (77.7%) | 4,734 (84.6%) |
| 12 to 14 Years | 2,941 (81.8%) | 3,863 (87.5%) |
| 15 Years | 1,021 (68.0%) | 960 (91.3%) |
| 16 and 17 Years | 2,823 (82.0%) | 1,781 (83.3%) |
| 18 to 24 Years | 7,682 (83.0%) | 7,084 (81.1%) |
| 25 to 34 Years | 13,935 (93.4%) | 13,055 (86.2%) |
| 35 to 44 Years | 11,271 (89.0%) | 12,009 (84.9%) |
| 45 to 54 Years | 11,950 (92.7%) | 11,862 (87.9%) |
| 55 to 64 Years | 12,181 (90.5%) | 12,295 (86.0%) |
| 65 to 74 Years | 8,012 (92.3%) | 9,193 (88.4%) |
| 75 Years and over | 5,325 (87.2%) | 8,112 (83.5%) |
| Total | 88,911 (87.9%) | 90,950 (85.7%) |
Income Below Poverty Among Married-Couple Families in Yonkers
The poverty statistics for married-couple families in Yonkers show that 5.5% or 1,808 of the total 33,014 families live below the poverty line. Families with 5 or more children have the highest poverty rate of 16.9%, comprising of 12 families. On the other hand, families with 1 or 2 children have the lowest poverty rate of 5.0%, which includes 604 families.
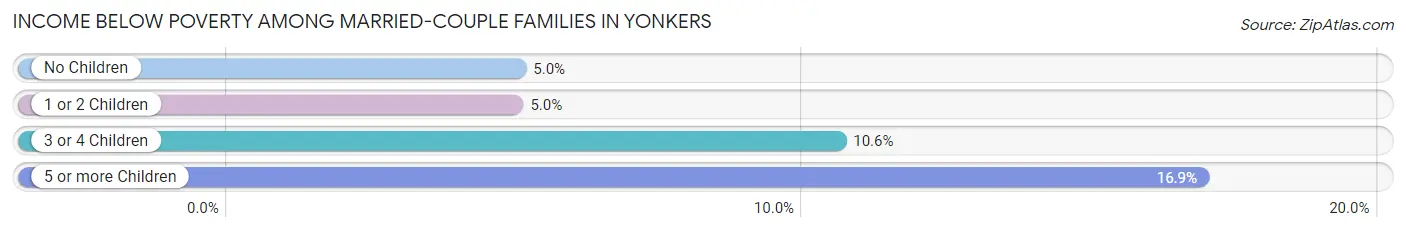
| Children | Above Poverty | Below Poverty |
| No Children | 17,224 (95.0%) | 910 (5.0%) |
| 1 or 2 Children | 11,542 (95.0%) | 604 (5.0%) |
| 3 or 4 Children | 2,381 (89.4%) | 282 (10.6%) |
| 5 or more Children | 59 (83.1%) | 12 (16.9%) |
| Total | 31,206 (94.5%) | 1,808 (5.5%) |
Income Below Poverty Among Single-Parent Households in Yonkers
According to the poverty data in Yonkers, 11.7% or 548 single-father households and 21.1% or 2,821 single-mother households are living below the poverty line. Among single-father households, those with 3 or 4 children have the highest poverty rate, with 43 households (20.0%) experiencing poverty. Likewise, among single-mother households, those with 3 or 4 children have the highest poverty rate, with 437 households (57.4%) falling below the poverty line.
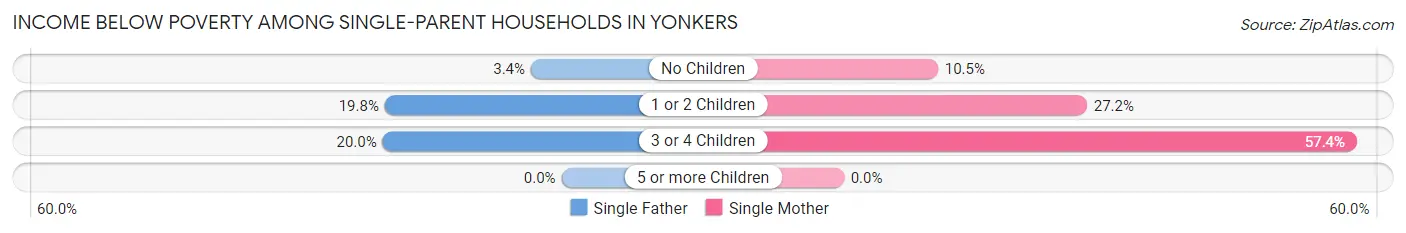
| Children | Single Father | Single Mother |
| No Children | 79 (3.4%) | 647 (10.5%) |
| 1 or 2 Children | 426 (19.8%) | 1,737 (27.2%) |
| 3 or 4 Children | 43 (20.0%) | 437 (57.4%) |
| 5 or more Children | 0 (0.0%) | 0 (0.0%) |
| Total | 548 (11.7%) | 2,821 (21.1%) |
Income Below Poverty Among Married-Couple vs Single-Parent Households in Yonkers
The poverty data for Yonkers shows that 1,808 of the married-couple family households (5.5%) and 3,369 of the single-parent households (18.7%) are living below the poverty level. Within the married-couple family households, those with 5 or more children have the highest poverty rate, with 12 households (16.9%) falling below the poverty line. Among the single-parent households, those with 3 or 4 children have the highest poverty rate, with 480 household (49.1%) living below poverty.
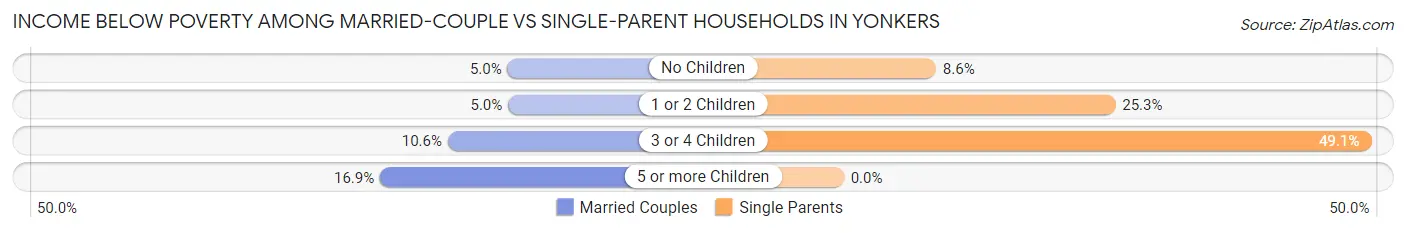
| Children | Married-Couple Families | Single-Parent Households |
| No Children | 910 (5.0%) | 726 (8.6%) |
| 1 or 2 Children | 604 (5.0%) | 2,163 (25.3%) |
| 3 or 4 Children | 282 (10.6%) | 480 (49.1%) |
| 5 or more Children | 12 (16.9%) | 0 (0.0%) |
| Total | 1,808 (5.5%) | 3,369 (18.7%) |
Race in Yonkers
The most populous races in Yonkers are White / Caucasian (90,044 | 42.9%), Hispanic or Latino (87,256 | 41.6%), and Some other Race (43,235 | 20.6%).
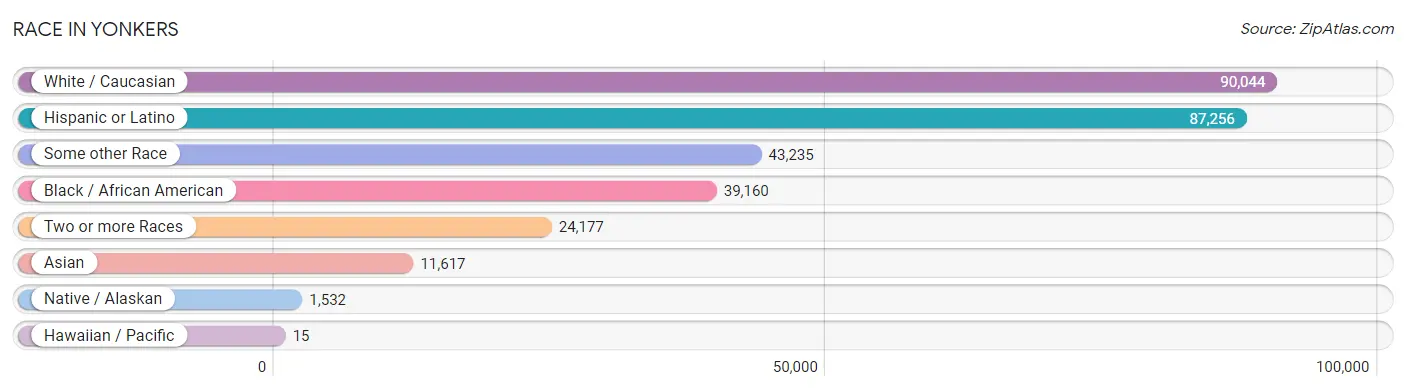
| Race | # Population | % Population |
| Asian | 11,617 | 5.5% |
| Black / African American | 39,160 | 18.7% |
| Hawaiian / Pacific | 15 | 0.0% |
| Hispanic or Latino | 87,256 | 41.6% |
| Native / Alaskan | 1,532 | 0.7% |
| White / Caucasian | 90,044 | 42.9% |
| Two or more Races | 24,177 | 11.5% |
| Some other Race | 43,235 | 20.6% |
| Total | 209,780 | 100.0% |
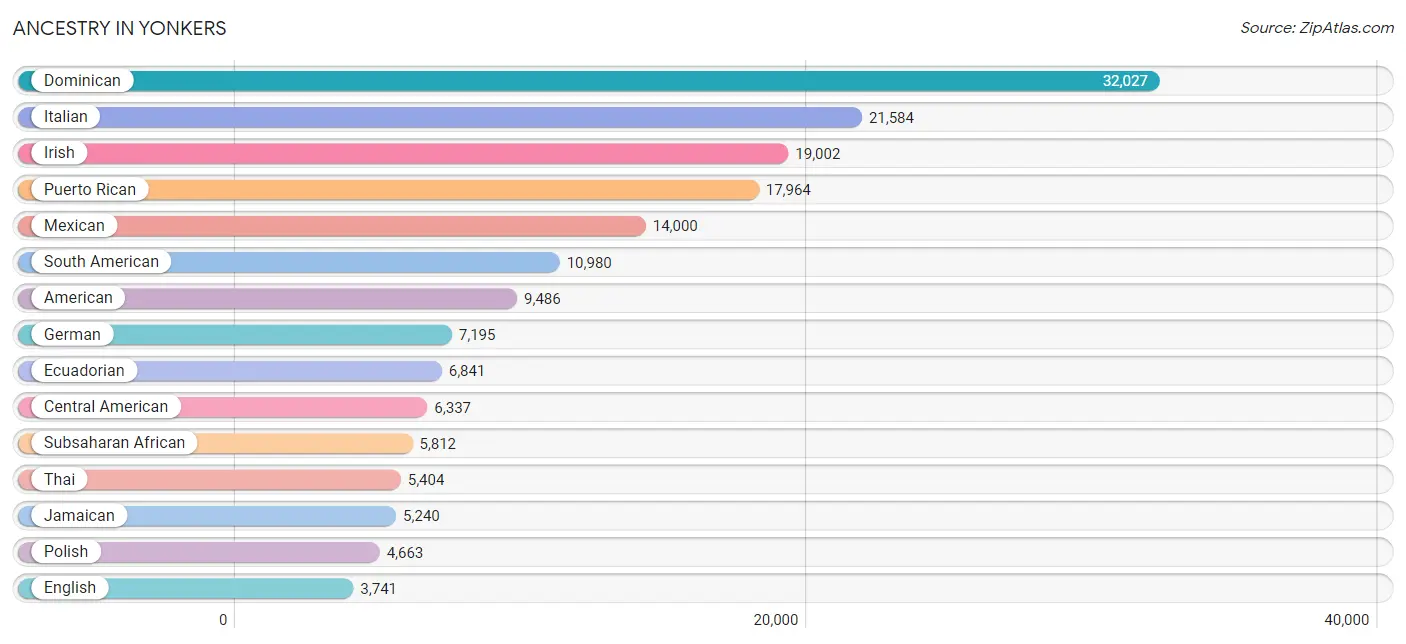
Ancestry in Yonkers
The most populous ancestries reported in Yonkers are Dominican (32,027 | 15.3%), Italian (21,584 | 10.3%), Irish (19,002 | 9.1%), Puerto Rican (17,964 | 8.6%), and Mexican (14,000 | 6.7%), together accounting for 49.8% of all Yonkers residents.
| Ancestry | # Population | % Population |
| Afghan | 20 | 0.0% |
| African | 3,007 | 1.4% |
| Albanian | 2,416 | 1.1% |
| American | 9,486 | 4.5% |
| Apache | 8 | 0.0% |
| Arab | 3,287 | 1.6% |
| Argentinean | 348 | 0.2% |
| Armenian | 249 | 0.1% |
| Assyrian / Chaldean / Syriac | 133 | 0.1% |
| Australian | 8 | 0.0% |
| Austrian | 431 | 0.2% |
| Bahamian | 19 | 0.0% |
| Barbadian | 113 | 0.1% |
| Belgian | 17 | 0.0% |
| Belizean | 28 | 0.0% |
| Bermudan | 89 | 0.0% |
| Bhutanese | 371 | 0.2% |
| Bolivian | 81 | 0.0% |
| Brazilian | 470 | 0.2% |
| British | 484 | 0.2% |
| British West Indian | 569 | 0.3% |
| Bulgarian | 56 | 0.0% |
| Burmese | 724 | 0.4% |
| Canadian | 55 | 0.0% |
| Cape Verdean | 163 | 0.1% |
| Central American | 6,337 | 3.0% |
| Central American Indian | 978 | 0.5% |
| Cherokee | 135 | 0.1% |
| Chilean | 117 | 0.1% |
| Colombian | 2,112 | 1.0% |
| Costa Rican | 142 | 0.1% |
| Croatian | 222 | 0.1% |
| Cuban | 2,049 | 1.0% |
| Czech | 283 | 0.1% |
| Czechoslovakian | 242 | 0.1% |
| Danish | 130 | 0.1% |
| Delaware | 28 | 0.0% |
| Dominican | 32,027 | 15.3% |
| Dutch | 270 | 0.1% |
| Eastern European | 615 | 0.3% |
| Ecuadorian | 6,841 | 3.3% |
| Egyptian | 252 | 0.1% |
| English | 3,741 | 1.8% |
| Ethiopian | 603 | 0.3% |
| European | 841 | 0.4% |
| Filipino | 84 | 0.0% |
| Finnish | 22 | 0.0% |
| French | 1,460 | 0.7% |
| French American Indian | 43 | 0.0% |
| French Canadian | 258 | 0.1% |
| German | 7,195 | 3.4% |
| Ghanaian | 1,163 | 0.5% |
| Greek | 1,166 | 0.6% |
| Guamanian / Chamorro | 23 | 0.0% |
| Guatemalan | 1,685 | 0.8% |
| Guyanese | 388 | 0.2% |
| Haitian | 966 | 0.5% |
| Honduran | 1,070 | 0.5% |
| Hungarian | 503 | 0.2% |
| Indian (Asian) | 1,237 | 0.6% |
| Iranian | 84 | 0.0% |
| Irish | 19,002 | 9.1% |
| Iroquois | 82 | 0.0% |
| Israeli | 24 | 0.0% |
| Italian | 21,584 | 10.3% |
| Jamaican | 5,240 | 2.5% |
| Jordanian | 1,066 | 0.5% |
| Kenyan | 33 | 0.0% |
| Korean | 3,224 | 1.5% |
| Laotian | 11 | 0.0% |
| Latvian | 40 | 0.0% |
| Lebanese | 225 | 0.1% |
| Liberian | 14 | 0.0% |
| Lithuanian | 111 | 0.1% |
| Macedonian | 220 | 0.1% |
| Maltese | 18 | 0.0% |
| Mexican | 14,000 | 6.7% |
| Mexican American Indian | 447 | 0.2% |
| Mongolian | 11 | 0.0% |
| Moroccan | 193 | 0.1% |
| Native Hawaiian | 10 | 0.0% |
| Nicaraguan | 392 | 0.2% |
| Nigerian | 731 | 0.4% |
| Northern European | 65 | 0.0% |
| Norwegian | 447 | 0.2% |
| Pakistani | 305 | 0.2% |
| Palestinian | 320 | 0.2% |
| Panamanian | 925 | 0.4% |
| Paraguayan | 19 | 0.0% |
| Peruvian | 846 | 0.4% |
| Polish | 4,663 | 2.2% |
| Portuguese | 1,856 | 0.9% |
| Potawatomi | 11 | 0.0% |
| Puerto Rican | 17,964 | 8.6% |
| Romanian | 469 | 0.2% |
| Russian | 2,079 | 1.0% |
| Salvadoran | 2,123 | 1.0% |
| Samoan | 76 | 0.0% |
| Scandinavian | 7 | 0.0% |
| Scotch-Irish | 282 | 0.1% |
| Scottish | 449 | 0.2% |
| Seminole | 23 | 0.0% |
| Senegalese | 30 | 0.0% |
| Serbian | 46 | 0.0% |
| Sierra Leonean | 65 | 0.0% |
| Sioux | 9 | 0.0% |
| Slavic | 81 | 0.0% |
| Slovak | 302 | 0.1% |
| South African | 25 | 0.0% |
| South American | 10,980 | 5.2% |
| South American Indian | 195 | 0.1% |
| Spaniard | 734 | 0.4% |
| Spanish | 722 | 0.3% |
| Spanish American Indian | 9 | 0.0% |
| Sri Lankan | 180 | 0.1% |
| Subsaharan African | 5,812 | 2.8% |
| Sudanese | 28 | 0.0% |
| Swedish | 274 | 0.1% |
| Swiss | 95 | 0.1% |
| Syrian | 55 | 0.0% |
| Thai | 5,404 | 2.6% |
| Tlingit-Haida | 30 | 0.0% |
| Trinidadian and Tobagonian | 288 | 0.1% |
| Turkish | 43 | 0.0% |
| U.S. Virgin Islander | 4 | 0.0% |
| Ukrainian | 2,144 | 1.0% |
| Uruguayan | 184 | 0.1% |
| Venezuelan | 413 | 0.2% |
| Vietnamese | 125 | 0.1% |
| Welsh | 195 | 0.1% |
| West Indian | 710 | 0.3% |
| Yugoslavian | 15 | 0.0% | View All 132 Rows |
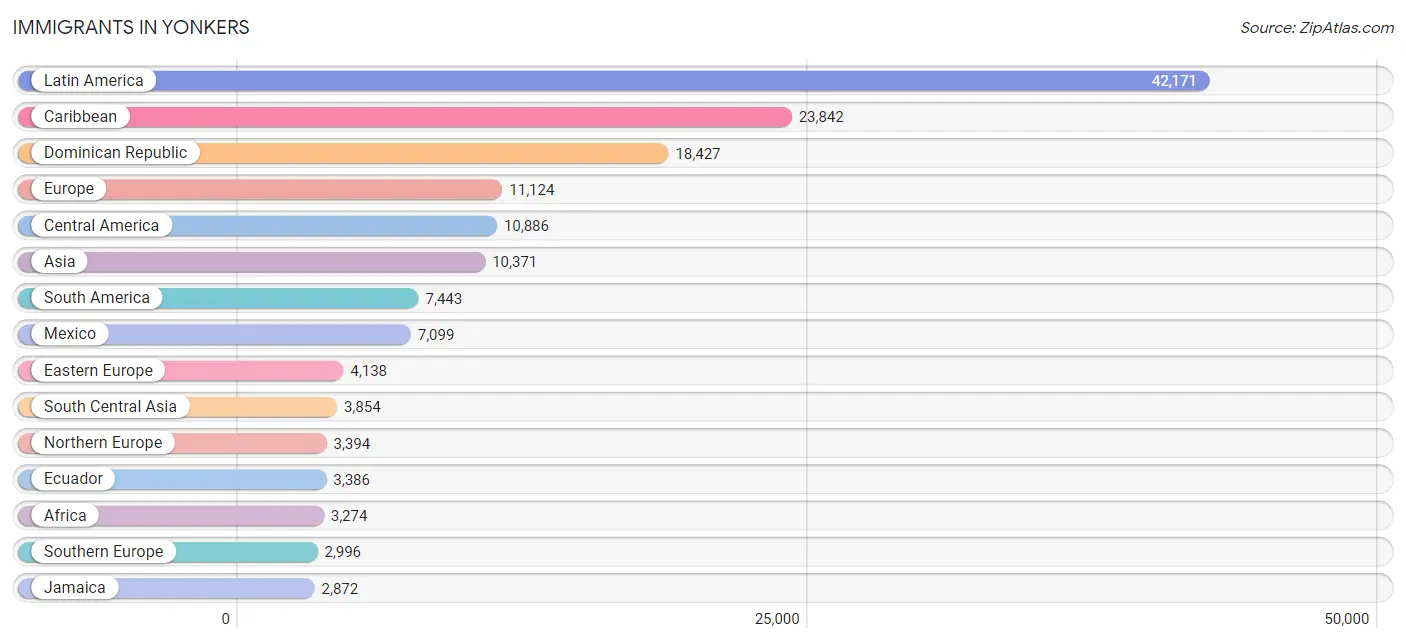
Immigrants in Yonkers
The most numerous immigrant groups reported in Yonkers came from Latin America (42,171 | 20.1%), Caribbean (23,842 | 11.4%), Dominican Republic (18,427 | 8.8%), Europe (11,124 | 5.3%), and Central America (10,886 | 5.2%), together accounting for 50.7% of all Yonkers residents.
| Immigration Origin | # Population | % Population |
| Africa | 3,274 | 1.6% |
| Albania | 898 | 0.4% |
| Argentina | 160 | 0.1% |
| Armenia | 13 | 0.0% |
| Asia | 10,371 | 4.9% |
| Australia | 36 | 0.0% |
| Austria | 3 | 0.0% |
| Bahamas | 11 | 0.0% |
| Bangladesh | 222 | 0.1% |
| Barbados | 86 | 0.0% |
| Belarus | 68 | 0.0% |
| Belize | 23 | 0.0% |
| Bolivia | 21 | 0.0% |
| Brazil | 460 | 0.2% |
| Bulgaria | 41 | 0.0% |
| Cabo Verde | 34 | 0.0% |
| Canada | 129 | 0.1% |
| Caribbean | 23,842 | 11.4% |
| Central America | 10,886 | 5.2% |
| Chile | 150 | 0.1% |
| China | 764 | 0.4% |
| Colombia | 1,395 | 0.7% |
| Costa Rica | 142 | 0.1% |
| Croatia | 18 | 0.0% |
| Cuba | 688 | 0.3% |
| Czechoslovakia | 104 | 0.1% |
| Dominica | 318 | 0.2% |
| Dominican Republic | 18,427 | 8.8% |
| Eastern Africa | 132 | 0.1% |
| Eastern Asia | 1,646 | 0.8% |
| Eastern Europe | 4,138 | 2.0% |
| Ecuador | 3,386 | 1.6% |
| Egypt | 103 | 0.1% |
| El Salvador | 1,147 | 0.5% |
| England | 288 | 0.1% |
| Ethiopia | 57 | 0.0% |
| Europe | 11,124 | 5.3% |
| France | 203 | 0.1% |
| Germany | 369 | 0.2% |
| Ghana | 1,675 | 0.8% |
| Greece | 385 | 0.2% |
| Guatemala | 924 | 0.4% |
| Guyana | 689 | 0.3% |
| Haiti | 458 | 0.2% |
| Honduras | 1,049 | 0.5% |
| Hong Kong | 48 | 0.0% |
| Hungary | 12 | 0.0% |
| India | 2,866 | 1.4% |
| Iran | 234 | 0.1% |
| Ireland | 2,532 | 1.2% |
| Israel | 160 | 0.1% |
| Italy | 1,455 | 0.7% |
| Jamaica | 2,872 | 1.4% |
| Japan | 107 | 0.1% |
| Jordan | 961 | 0.5% |
| Kenya | 50 | 0.0% |
| Korea | 775 | 0.4% |
| Kuwait | 49 | 0.0% |
| Laos | 5 | 0.0% |
| Latin America | 42,171 | 20.1% |
| Latvia | 27 | 0.0% |
| Lebanon | 39 | 0.0% |
| Liberia | 66 | 0.0% |
| Mexico | 7,099 | 3.4% |
| Middle Africa | 72 | 0.0% |
| Morocco | 185 | 0.1% |
| Nepal | 37 | 0.0% |
| Netherlands | 7 | 0.0% |
| Nicaragua | 228 | 0.1% |
| Nigeria | 600 | 0.3% |
| North Macedonia | 7 | 0.0% |
| Northern Africa | 318 | 0.2% |
| Northern Europe | 3,394 | 1.6% |
| Norway | 3 | 0.0% |
| Oceania | 36 | 0.0% |
| Pakistan | 456 | 0.2% |
| Panama | 274 | 0.1% |
| Peru | 438 | 0.2% |
| Philippines | 2,255 | 1.1% |
| Poland | 906 | 0.4% |
| Portugal | 1,057 | 0.5% |
| Romania | 322 | 0.2% |
| Russia | 444 | 0.2% |
| Saudi Arabia | 56 | 0.0% |
| Scotland | 31 | 0.0% |
| Senegal | 30 | 0.0% |
| Serbia | 58 | 0.0% |
| Sierra Leone | 176 | 0.1% |
| South Africa | 30 | 0.0% |
| South America | 7,443 | 3.5% |
| South Central Asia | 3,854 | 1.8% |
| South Eastern Asia | 2,594 | 1.2% |
| Southern Europe | 2,996 | 1.4% |
| Spain | 99 | 0.1% |
| Sri Lanka | 32 | 0.0% |
| Sudan | 14 | 0.0% |
| Switzerland | 14 | 0.0% |
| Syria | 16 | 0.0% |
| Taiwan | 122 | 0.1% |
| Thailand | 269 | 0.1% |
| Trinidad and Tobago | 519 | 0.3% |
| Turkey | 14 | 0.0% |
| Ukraine | 455 | 0.2% |
| Uruguay | 184 | 0.1% |
| Uzbekistan | 7 | 0.0% |
| Venezuela | 483 | 0.2% |
| Vietnam | 65 | 0.0% |
| West Indies | 15 | 0.0% |
| Western Africa | 2,702 | 1.3% |
| Western Asia | 2,220 | 1.1% |
| Western Europe | 596 | 0.3% |
| Yemen | 578 | 0.3% |
| Zaire | 50 | 0.0% | View All 113 Rows |
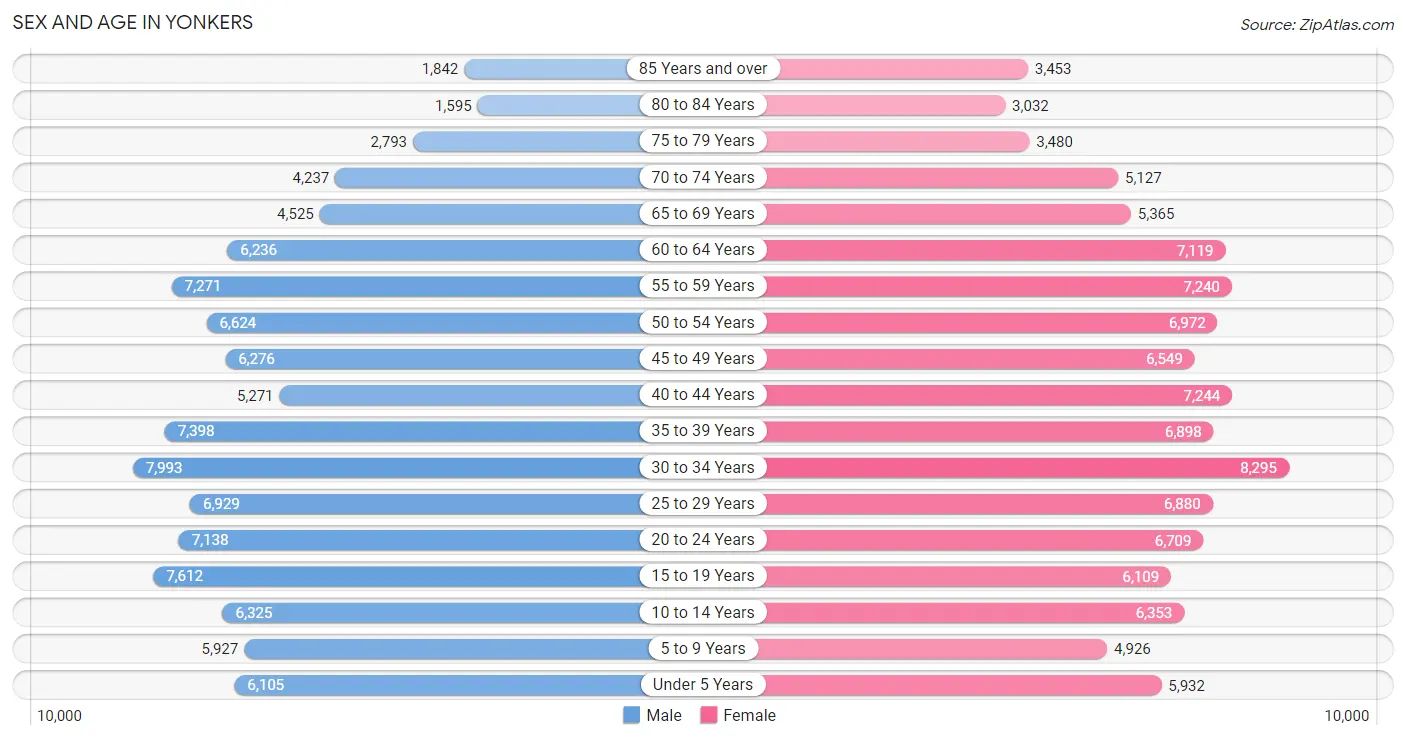
Sex and Age in Yonkers
Sex and Age in Yonkers
The most populous age groups in Yonkers are 30 to 34 Years (7,993 | 7.8%) for men and 30 to 34 Years (8,295 | 7.7%) for women.
| Age Bracket | Male | Female |
| Under 5 Years | 6,105 (6.0%) | 5,932 (5.5%) |
| 5 to 9 Years | 5,927 (5.8%) | 4,926 (4.6%) |
| 10 to 14 Years | 6,325 (6.2%) | 6,353 (5.9%) |
| 15 to 19 Years | 7,612 (7.5%) | 6,109 (5.7%) |
| 20 to 24 Years | 7,138 (7.0%) | 6,709 (6.2%) |
| 25 to 29 Years | 6,929 (6.8%) | 6,880 (6.4%) |
| 30 to 34 Years | 7,993 (7.8%) | 8,295 (7.7%) |
| 35 to 39 Years | 7,398 (7.2%) | 6,898 (6.4%) |
| 40 to 44 Years | 5,271 (5.2%) | 7,244 (6.7%) |
| 45 to 49 Years | 6,276 (6.1%) | 6,549 (6.1%) |
| 50 to 54 Years | 6,624 (6.5%) | 6,972 (6.5%) |
| 55 to 59 Years | 7,271 (7.1%) | 7,240 (6.7%) |
| 60 to 64 Years | 6,236 (6.1%) | 7,119 (6.6%) |
| 65 to 69 Years | 4,525 (4.4%) | 5,365 (5.0%) |
| 70 to 74 Years | 4,237 (4.2%) | 5,127 (4.8%) |
| 75 to 79 Years | 2,793 (2.7%) | 3,480 (3.2%) |
| 80 to 84 Years | 1,595 (1.6%) | 3,032 (2.8%) |
| 85 Years and over | 1,842 (1.8%) | 3,453 (3.2%) |
| Total | 102,097 (100.0%) | 107,683 (100.0%) |
Families and Households in Yonkers
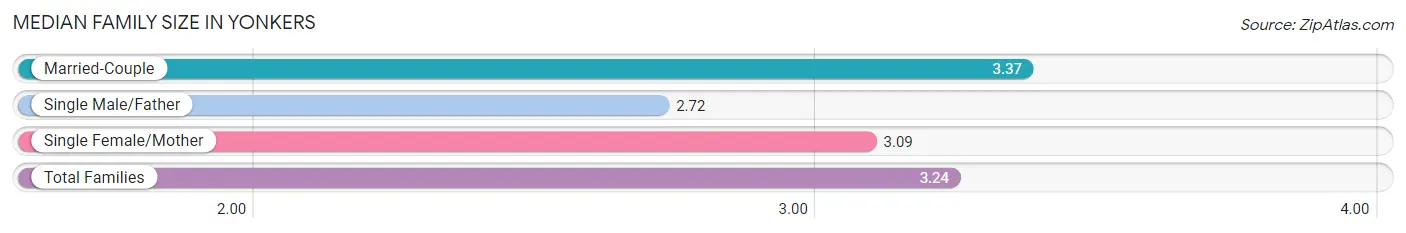
Median Family Size in Yonkers
The median family size in Yonkers is 3.24 persons per family, with married-couple families (33,014 | 64.6%) accounting for the largest median family size of 3.37 persons per family. On the other hand, single male/father families (4,679 | 9.2%) represent the smallest median family size with 2.72 persons per family.
| Family Type | # Families | Family Size |
| Married-Couple | 33,014 (64.6%) | 3.37 |
| Single Male/Father | 4,679 (9.2%) | 2.72 |
| Single Female/Mother | 13,377 (26.2%) | 3.09 |
| Total Families | 51,070 (100.0%) | 3.24 |
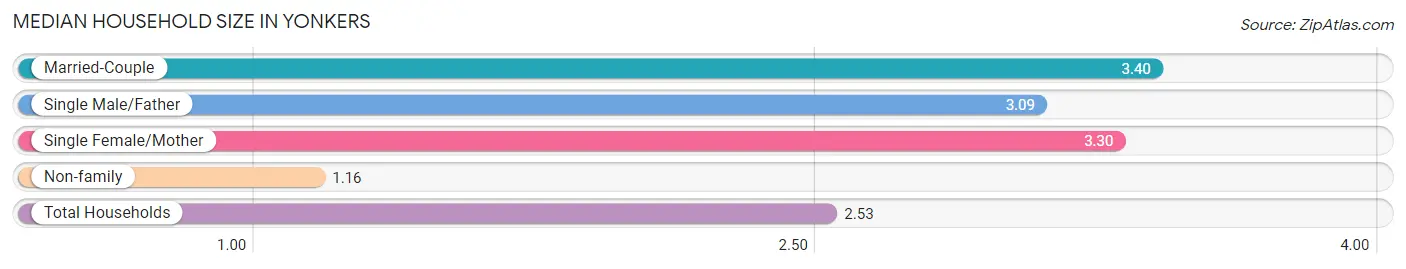
Median Household Size in Yonkers
The median household size in Yonkers is 2.53 persons per household, with married-couple households (33,014 | 40.5%) accounting for the largest median household size of 3.4 persons per household. non-family households (30,400 | 37.3%) represent the smallest median household size with 1.16 persons per household.
| Household Type | # Households | Household Size |
| Married-Couple | 33,014 (40.5%) | 3.40 |
| Single Male/Father | 4,679 (5.7%) | 3.09 |
| Single Female/Mother | 13,377 (16.4%) | 3.30 |
| Non-family | 30,400 (37.3%) | 1.16 |
| Total Households | 81,470 (100.0%) | 2.53 |
Household Size by Marriage Status in Yonkers
Out of a total of 81,470 households in Yonkers, 51,070 (62.7%) are family households, while 30,400 (37.3%) are nonfamily households. The most numerous type of family households are 2-person households, comprising 18,048, and the most common type of nonfamily households are 1-person households, comprising 26,022.
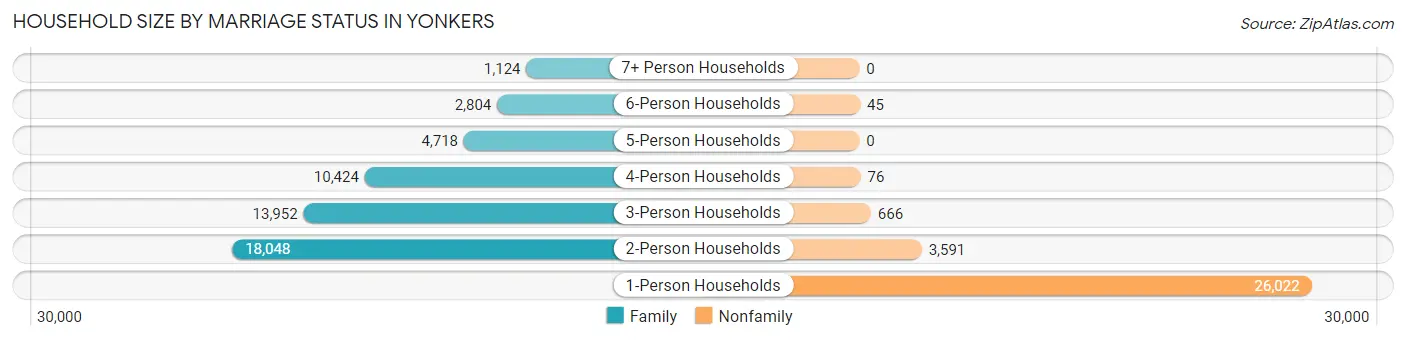
| Household Size | Family Households | Nonfamily Households |
| 1-Person Households | - | 26,022 (31.9%) |
| 2-Person Households | 18,048 (22.2%) | 3,591 (4.4%) |
| 3-Person Households | 13,952 (17.1%) | 666 (0.8%) |
| 4-Person Households | 10,424 (12.8%) | 76 (0.1%) |
| 5-Person Households | 4,718 (5.8%) | 0 (0.0%) |
| 6-Person Households | 2,804 (3.4%) | 45 (0.1%) |
| 7+ Person Households | 1,124 (1.4%) | 0 (0.0%) |
| Total | 51,070 (62.7%) | 30,400 (37.3%) |
Female Fertility in Yonkers
Fertility by Age in Yonkers
Average fertility rate in Yonkers is 57.0 births per 1,000 women. Women in the age bracket of 20 to 34 years have the highest fertility rate with 72.0 births per 1,000 women. Women in the age bracket of 20 to 34 years acount for 55.1% of all women with births.
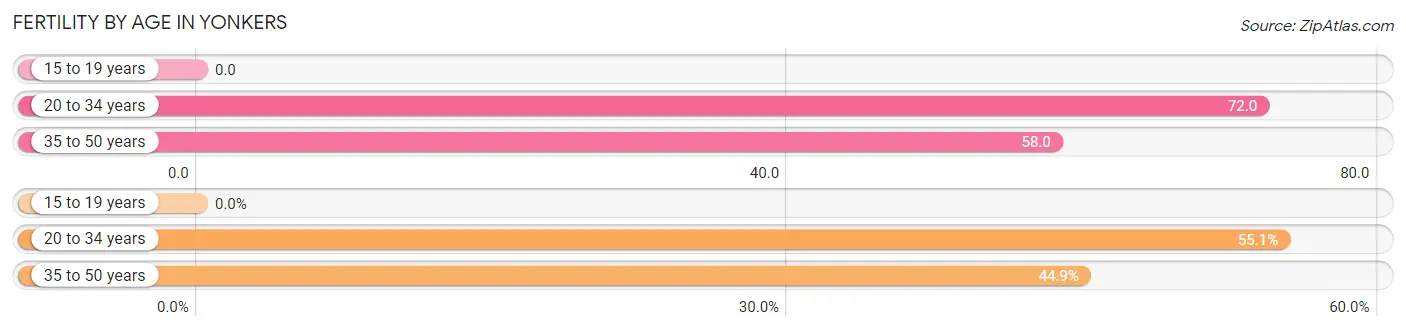
| Age Bracket | Women with Births | Births / 1,000 Women |
| 15 to 19 years | 0 (0.0%) | 0.0 |
| 20 to 34 years | 1,581 (55.1%) | 72.0 |
| 35 to 50 years | 1,290 (44.9%) | 58.0 |
| Total | 2,871 (100.0%) | 57.0 |
Fertility by Age by Marriage Status in Yonkers
80.5% of women with births (2,871) in Yonkers are married. The highest percentage of unmarried women with births falls into 20 to 34 years age bracket with 23.5% of them unmarried at the time of birth, while the lowest percentage of unmarried women with births belong to 35 to 50 years age bracket with 14.7% of them unmarried.
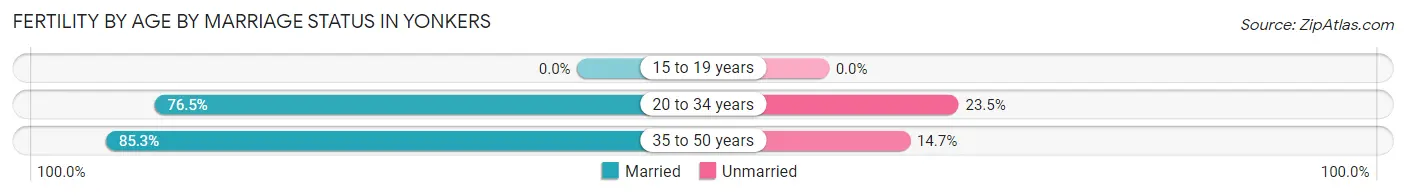
| Age Bracket | Married | Unmarried |
| 15 to 19 years | 0 (0.0%) | 0 (0.0%) |
| 20 to 34 years | 1,209 (76.5%) | 372 (23.5%) |
| 35 to 50 years | 1,100 (85.3%) | 190 (14.7%) |
| Total | 2,311 (80.5%) | 560 (19.5%) |
Fertility by Education in Yonkers
Average fertility rate in Yonkers is 57.0 births per 1,000 women. Women with the education attainment of graduate degree have the highest fertility rate of 87.0 births per 1,000 women, while women with the education attainment of high school diploma have the lowest fertility at 29.0 births per 1,000 women. Women with the education attainment of college or associate's degree represent 33.5% of all women with births.
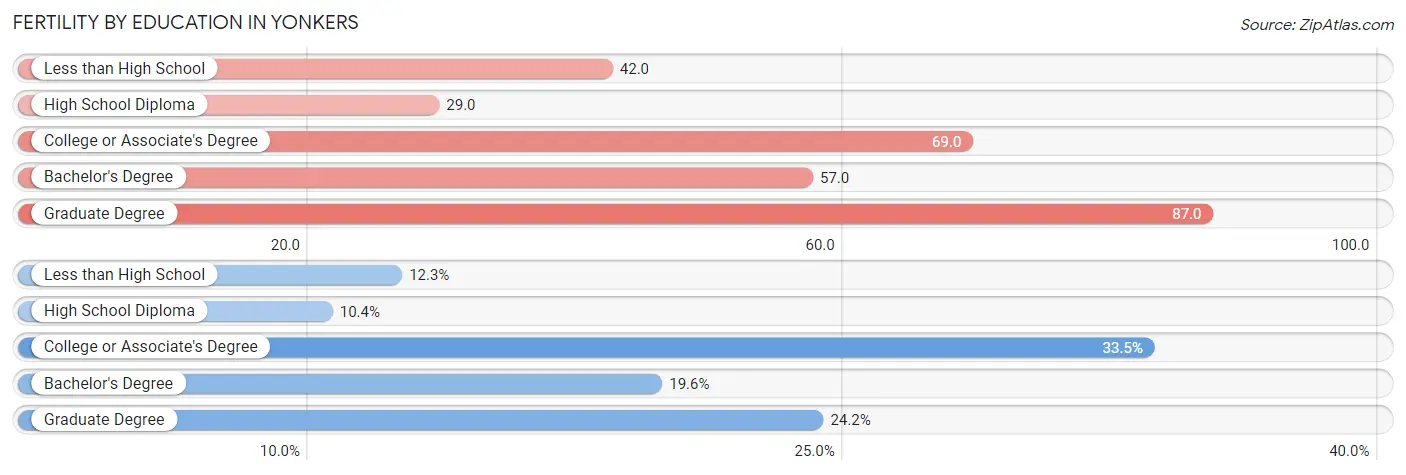
| Educational Attainment | Women with Births | Births / 1,000 Women |
| Less than High School | 354 (12.3%) | 42.0 |
| High School Diploma | 298 (10.4%) | 29.0 |
| College or Associate's Degree | 961 (33.5%) | 69.0 |
| Bachelor's Degree | 564 (19.6%) | 57.0 |
| Graduate Degree | 694 (24.2%) | 87.0 |
| Total | 2,871 (100.0%) | 57.0 |
Fertility by Education by Marriage Status in Yonkers
19.5% of women with births in Yonkers are unmarried. Women with the educational attainment of graduate degree are most likely to be married with 100.0% of them married at childbirth, while women with the educational attainment of high school diploma are least likely to be married with 37.2% of them unmarried at childbirth.

| Educational Attainment | Married | Unmarried |
| Less than High School | 314 (88.7%) | 40 (11.3%) |
| High School Diploma | 187 (62.7%) | 111 (37.2%) |
| College or Associate's Degree | 631 (65.7%) | 330 (34.3%) |
| Bachelor's Degree | 484 (85.8%) | 80 (14.2%) |
| Graduate Degree | 694 (100.0%) | 0 (0.0%) |
| Total | 2,311 (80.5%) | 560 (19.5%) |
Employment Characteristics in Yonkers
Employment by Class of Employer in Yonkers
Among the 99,132 employed individuals in Yonkers, private company employees (60,996 | 61.5%), not-for-profit organizations (12,479 | 12.6%), and local government employees (12,021 | 12.1%) make up the most common classes of employment.
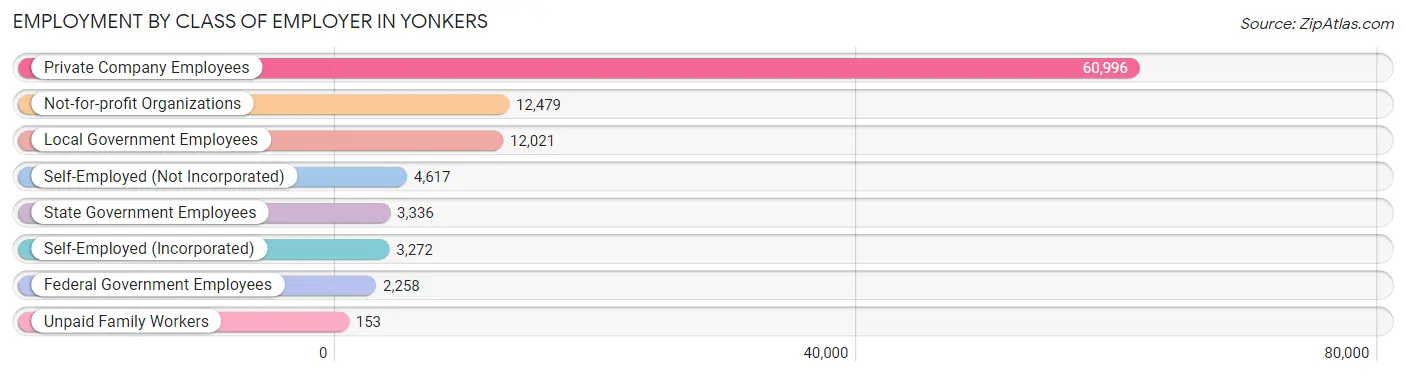
| Employer Class | # Employees | % Employees |
| Private Company Employees | 60,996 | 61.5% |
| Self-Employed (Incorporated) | 3,272 | 3.3% |
| Self-Employed (Not Incorporated) | 4,617 | 4.7% |
| Not-for-profit Organizations | 12,479 | 12.6% |
| Local Government Employees | 12,021 | 12.1% |
| State Government Employees | 3,336 | 3.4% |
| Federal Government Employees | 2,258 | 2.3% |
| Unpaid Family Workers | 153 | 0.2% |
| Total | 99,132 | 100.0% |
Employment Status by Age in Yonkers
According to the labor force statistics for Yonkers, out of the total population over 16 years of age (171,659), 63.8% or 109,518 individuals are in the labor force, with 6.6% or 7,228 of them unemployed. The age group with the highest labor force participation rate is 30 to 34 years, with 87.2% or 14,203 individuals in the labor force. Within the labor force, the 16 to 19 years age range has the highest percentage of unemployed individuals, with 24.1% or 778 of them being unemployed.
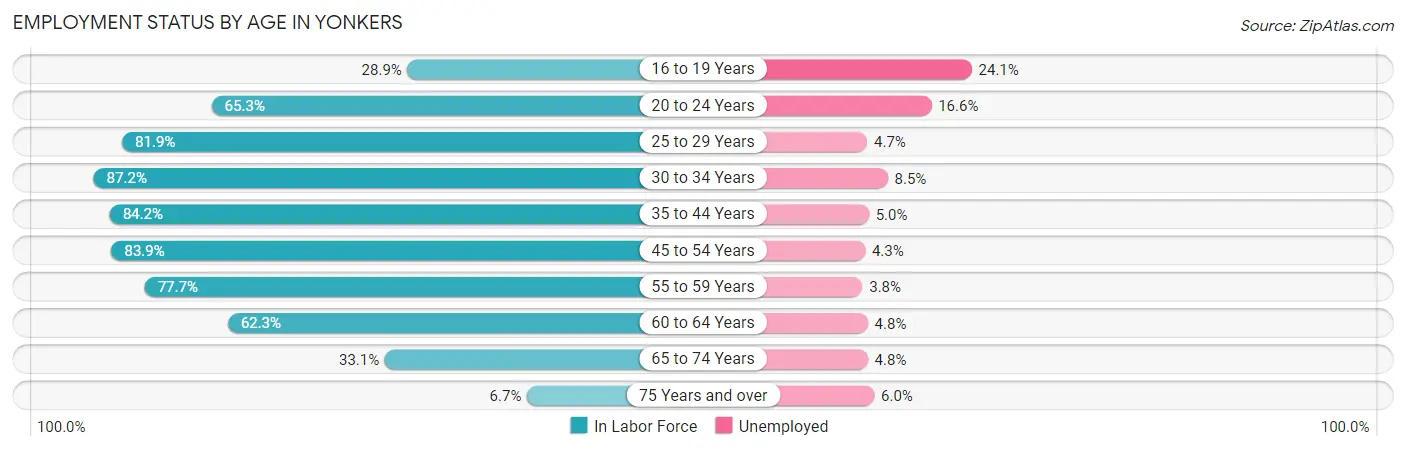
| Age Bracket | In Labor Force | Unemployed |
| 16 to 19 Years | 3,228 (28.9%) | 778 (24.1%) |
| 20 to 24 Years | 9,042 (65.3%) | 1,501 (16.6%) |
| 25 to 29 Years | 11,310 (81.9%) | 532 (4.7%) |
| 30 to 34 Years | 14,203 (87.2%) | 1,207 (8.5%) |
| 35 to 44 Years | 22,575 (84.2%) | 1,129 (5.0%) |
| 45 to 54 Years | 22,167 (83.9%) | 953 (4.3%) |
| 55 to 59 Years | 11,275 (77.7%) | 428 (3.8%) |
| 60 to 64 Years | 8,320 (62.3%) | 399 (4.8%) |
| 65 to 74 Years | 6,373 (33.1%) | 306 (4.8%) |
| 75 Years and over | 1,085 (6.7%) | 65 (6.0%) |
| Total | 109,518 (63.8%) | 7,228 (6.6%) |
Employment Status by Educational Attainment in Yonkers
According to labor force statistics for Yonkers, 80.8% of individuals (89,846) out of the total population between 25 and 64 years of age (111,195) are in the labor force, with 5.2% or 4,672 of them being unemployed. The group with the highest labor force participation rate are those with the educational attainment of bachelor's degree or higher, with 90.5% or 37,833 individuals in the labor force. Within the labor force, individuals with less than high school education have the highest percentage of unemployment, with 7.6% or 754 of them being unemployed.
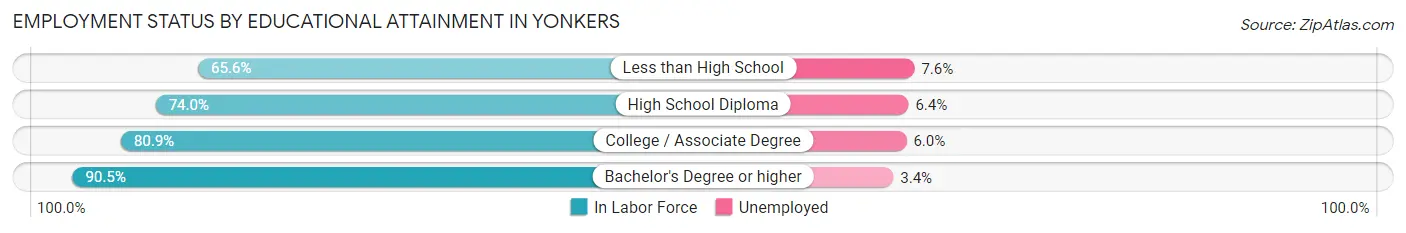
| Educational Attainment | In Labor Force | Unemployed |
| Less than High School | 9,916 (65.6%) | 1,149 (7.6%) |
| High School Diploma | 19,230 (74.0%) | 1,663 (6.4%) |
| College / Associate Degree | 22,886 (80.9%) | 1,697 (6.0%) |
| Bachelor's Degree or higher | 37,833 (90.5%) | 1,421 (3.4%) |
| Total | 89,846 (80.8%) | 5,782 (5.2%) |
Employment Occupations by Sex in Yonkers
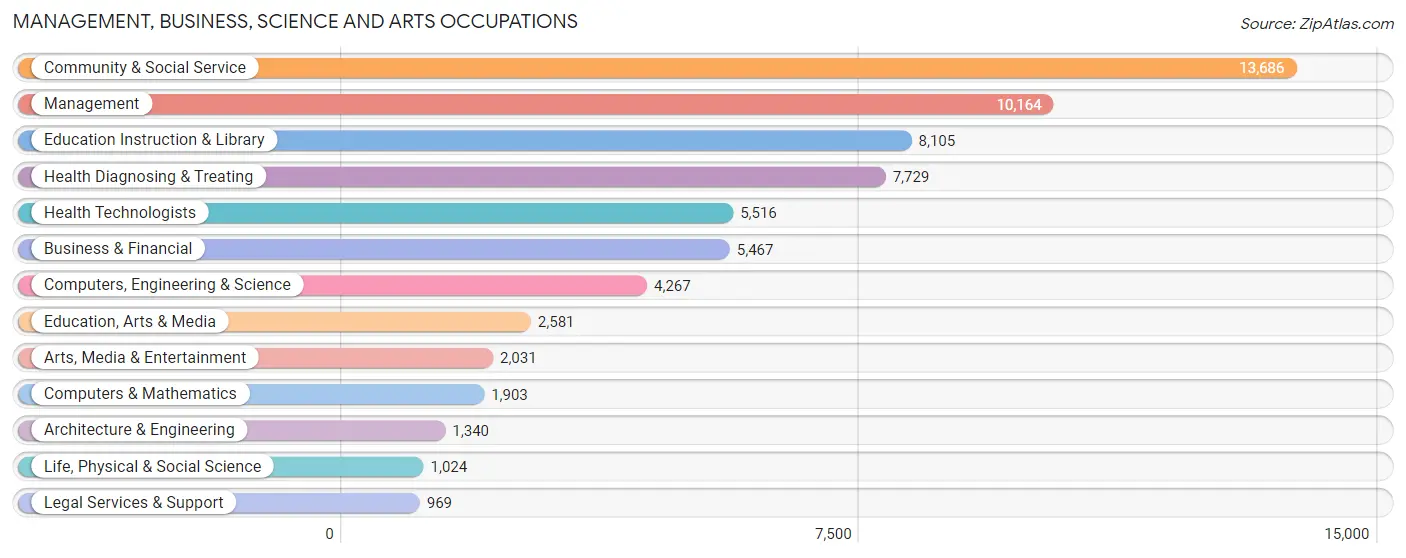
Management, Business, Science and Arts Occupations
The most common Management, Business, Science and Arts occupations in Yonkers are Community & Social Service (13,686 | 13.4%), Management (10,164 | 9.9%), Education Instruction & Library (8,105 | 7.9%), Health Diagnosing & Treating (7,729 | 7.6%), and Health Technologists (5,516 | 5.4%).
Management, Business, Science and Arts Occupations by Sex
Within the Management, Business, Science and Arts occupations in Yonkers, the most male-oriented occupations are Architecture & Engineering (92.1%), Computers & Mathematics (72.8%), and Computers, Engineering & Science (72.3%), while the most female-oriented occupations are Health Technologists (79.7%), Education, Arts & Media (77.7%), and Health Diagnosing & Treating (75.0%).
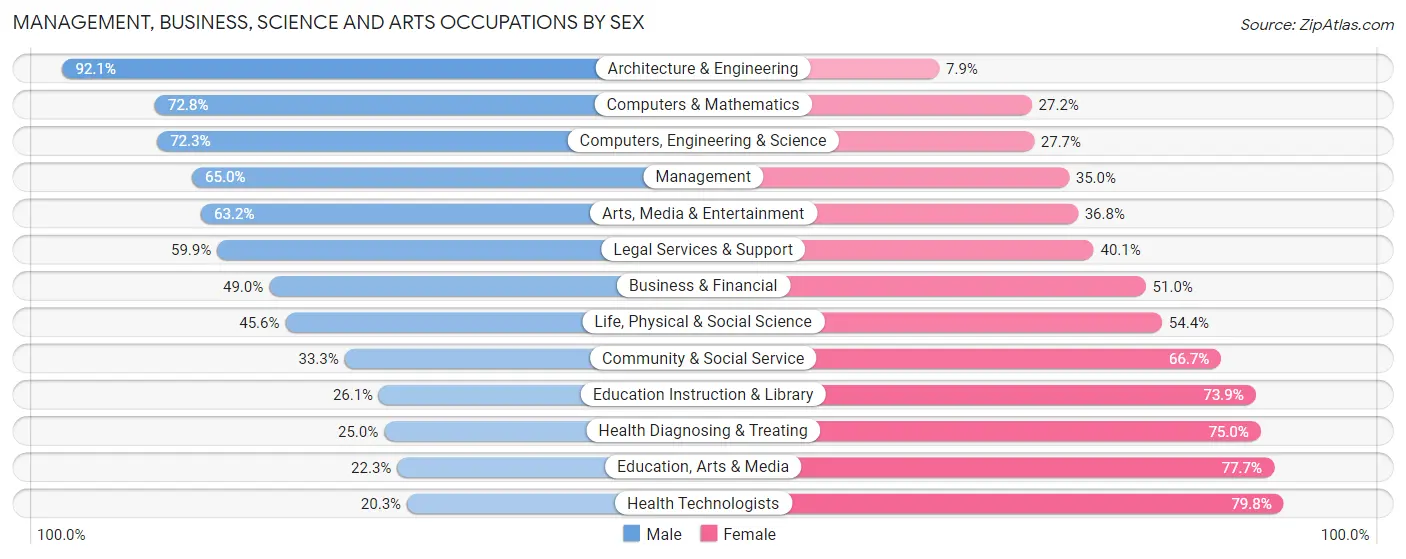
| Occupation | Male | Female |
| Management | 6,611 (65.0%) | 3,553 (35.0%) |
| Business & Financial | 2,679 (49.0%) | 2,788 (51.0%) |
| Computers, Engineering & Science | 3,086 (72.3%) | 1,181 (27.7%) |
| Computers & Mathematics | 1,385 (72.8%) | 518 (27.2%) |
| Architecture & Engineering | 1,234 (92.1%) | 106 (7.9%) |
| Life, Physical & Social Science | 467 (45.6%) | 557 (54.4%) |
| Community & Social Service | 4,552 (33.3%) | 9,134 (66.7%) |
| Education, Arts & Media | 575 (22.3%) | 2,006 (77.7%) |
| Legal Services & Support | 580 (59.9%) | 389 (40.1%) |
| Education Instruction & Library | 2,114 (26.1%) | 5,991 (73.9%) |
| Arts, Media & Entertainment | 1,283 (63.2%) | 748 (36.8%) |
| Health Diagnosing & Treating | 1,933 (25.0%) | 5,796 (75.0%) |
| Health Technologists | 1,117 (20.3%) | 4,399 (79.7%) |
| Total (Category) | 18,861 (45.7%) | 22,452 (54.3%) |
| Total (Overall) | 52,215 (51.0%) | 50,073 (48.9%) |
Services Occupations
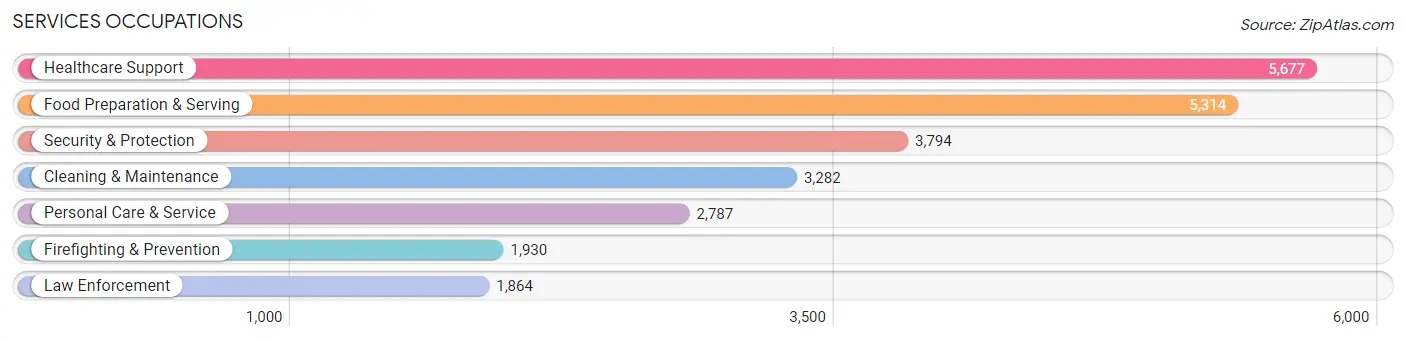
The most common Services occupations in Yonkers are Healthcare Support (5,677 | 5.6%), Food Preparation & Serving (5,314 | 5.2%), Security & Protection (3,794 | 3.7%), Cleaning & Maintenance (3,282 | 3.2%), and Personal Care & Service (2,787 | 2.7%).
Services Occupations by Sex
Within the Services occupations in Yonkers, the most male-oriented occupations are Law Enforcement (84.4%), Security & Protection (73.8%), and Firefighting & Prevention (63.5%), while the most female-oriented occupations are Healthcare Support (90.4%), Personal Care & Service (65.6%), and Food Preparation & Serving (45.1%).
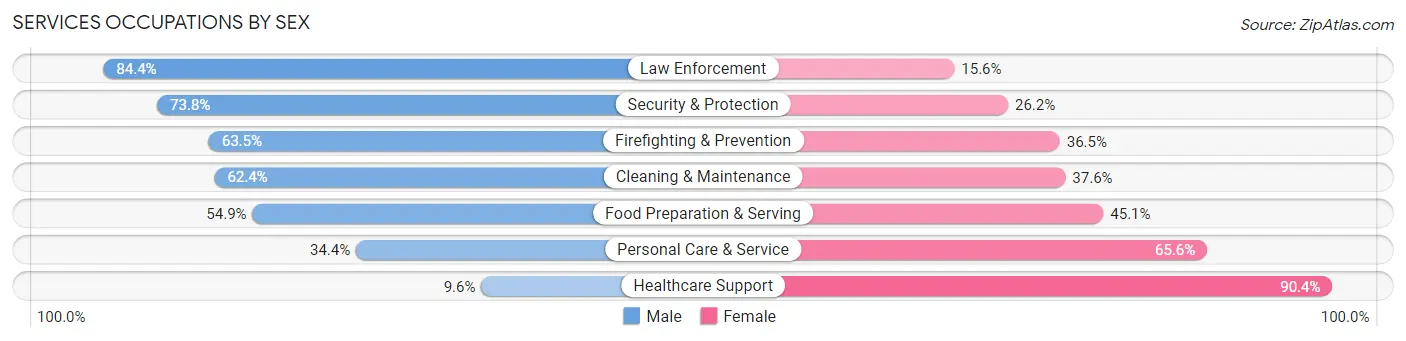
| Occupation | Male | Female |
| Healthcare Support | 543 (9.6%) | 5,134 (90.4%) |
| Security & Protection | 2,799 (73.8%) | 995 (26.2%) |
| Firefighting & Prevention | 1,226 (63.5%) | 704 (36.5%) |
| Law Enforcement | 1,573 (84.4%) | 291 (15.6%) |
| Food Preparation & Serving | 2,917 (54.9%) | 2,397 (45.1%) |
| Cleaning & Maintenance | 2,048 (62.4%) | 1,234 (37.6%) |
| Personal Care & Service | 958 (34.4%) | 1,829 (65.6%) |
| Total (Category) | 9,265 (44.4%) | 11,589 (55.6%) |
| Total (Overall) | 52,215 (51.0%) | 50,073 (48.9%) |
Sales and Office Occupations
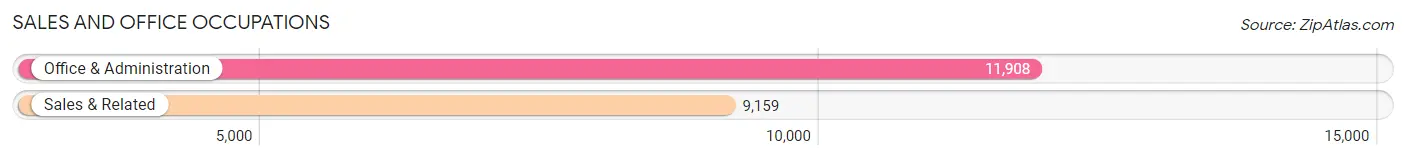
The most common Sales and Office occupations in Yonkers are Office & Administration (11,908 | 11.6%), and Sales & Related (9,159 | 8.9%).
Sales and Office Occupations by Sex
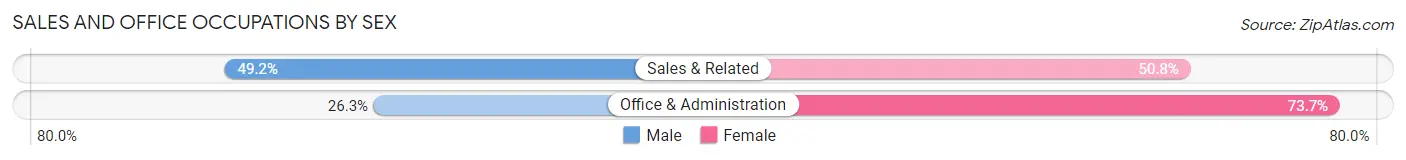
| Occupation | Male | Female |
| Sales & Related | 4,508 (49.2%) | 4,651 (50.8%) |
| Office & Administration | 3,127 (26.3%) | 8,781 (73.7%) |
| Total (Category) | 7,635 (36.2%) | 13,432 (63.8%) |
| Total (Overall) | 52,215 (51.0%) | 50,073 (48.9%) |
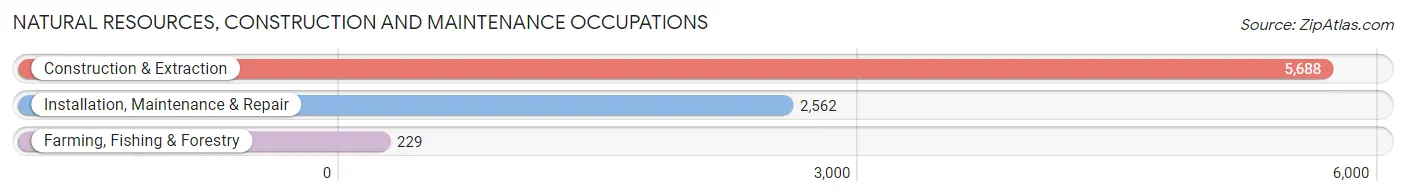
Natural Resources, Construction and Maintenance Occupations
The most common Natural Resources, Construction and Maintenance occupations in Yonkers are Construction & Extraction (5,688 | 5.6%), Installation, Maintenance & Repair (2,562 | 2.5%), and Farming, Fishing & Forestry (229 | 0.2%).
Natural Resources, Construction and Maintenance Occupations by Sex
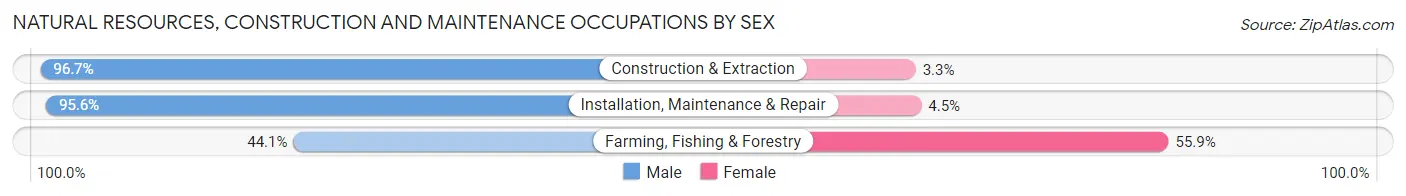
| Occupation | Male | Female |
| Farming, Fishing & Forestry | 101 (44.1%) | 128 (55.9%) |
| Construction & Extraction | 5,501 (96.7%) | 187 (3.3%) |
| Installation, Maintenance & Repair | 2,448 (95.6%) | 114 (4.4%) |
| Total (Category) | 8,050 (94.9%) | 429 (5.1%) |
| Total (Overall) | 52,215 (51.0%) | 50,073 (48.9%) |
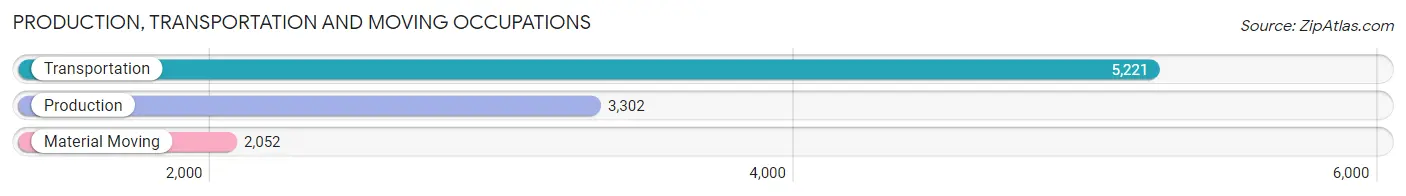
Production, Transportation and Moving Occupations
The most common Production, Transportation and Moving occupations in Yonkers are Transportation (5,221 | 5.1%), Production (3,302 | 3.2%), and Material Moving (2,052 | 2.0%).
Production, Transportation and Moving Occupations by Sex
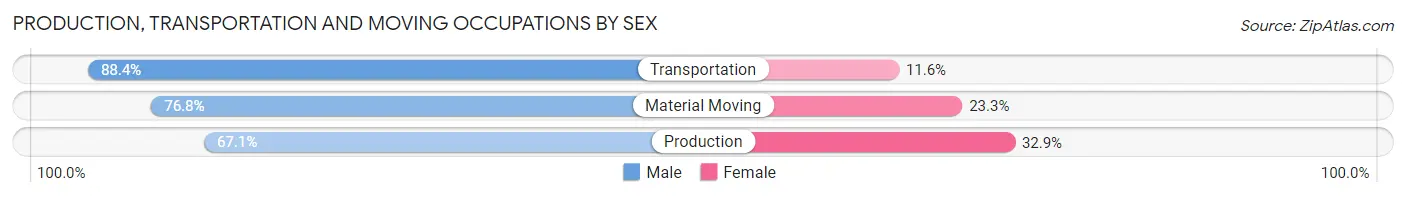
| Occupation | Male | Female |
| Production | 2,215 (67.1%) | 1,087 (32.9%) |
| Transportation | 4,614 (88.4%) | 607 (11.6%) |
| Material Moving | 1,575 (76.7%) | 477 (23.3%) |
| Total (Category) | 8,404 (79.5%) | 2,171 (20.5%) |
| Total (Overall) | 52,215 (51.0%) | 50,073 (48.9%) |
Employment Industries by Sex in Yonkers
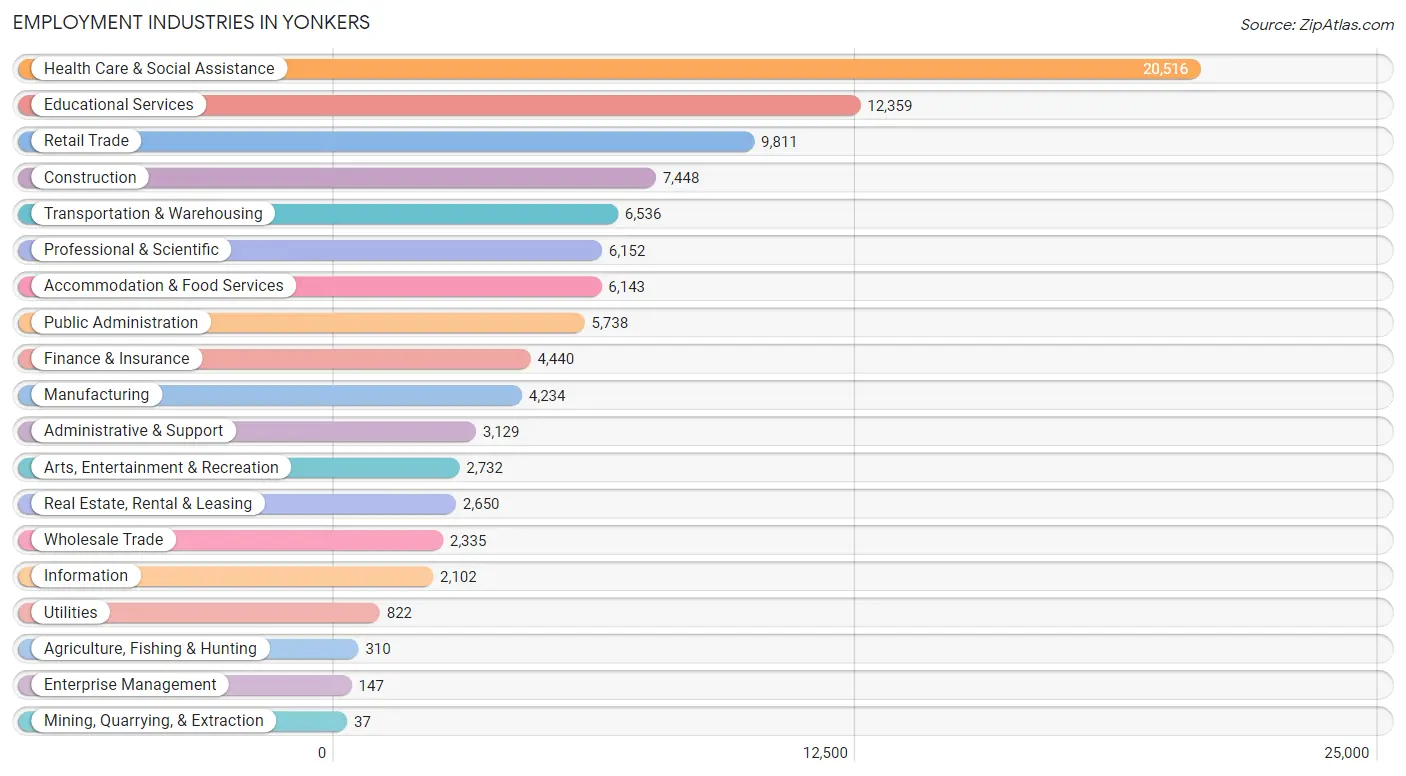
Employment Industries in Yonkers
The major employment industries in Yonkers include Health Care & Social Assistance (20,516 | 20.1%), Educational Services (12,359 | 12.1%), Retail Trade (9,811 | 9.6%), Construction (7,448 | 7.3%), and Transportation & Warehousing (6,536 | 6.4%).
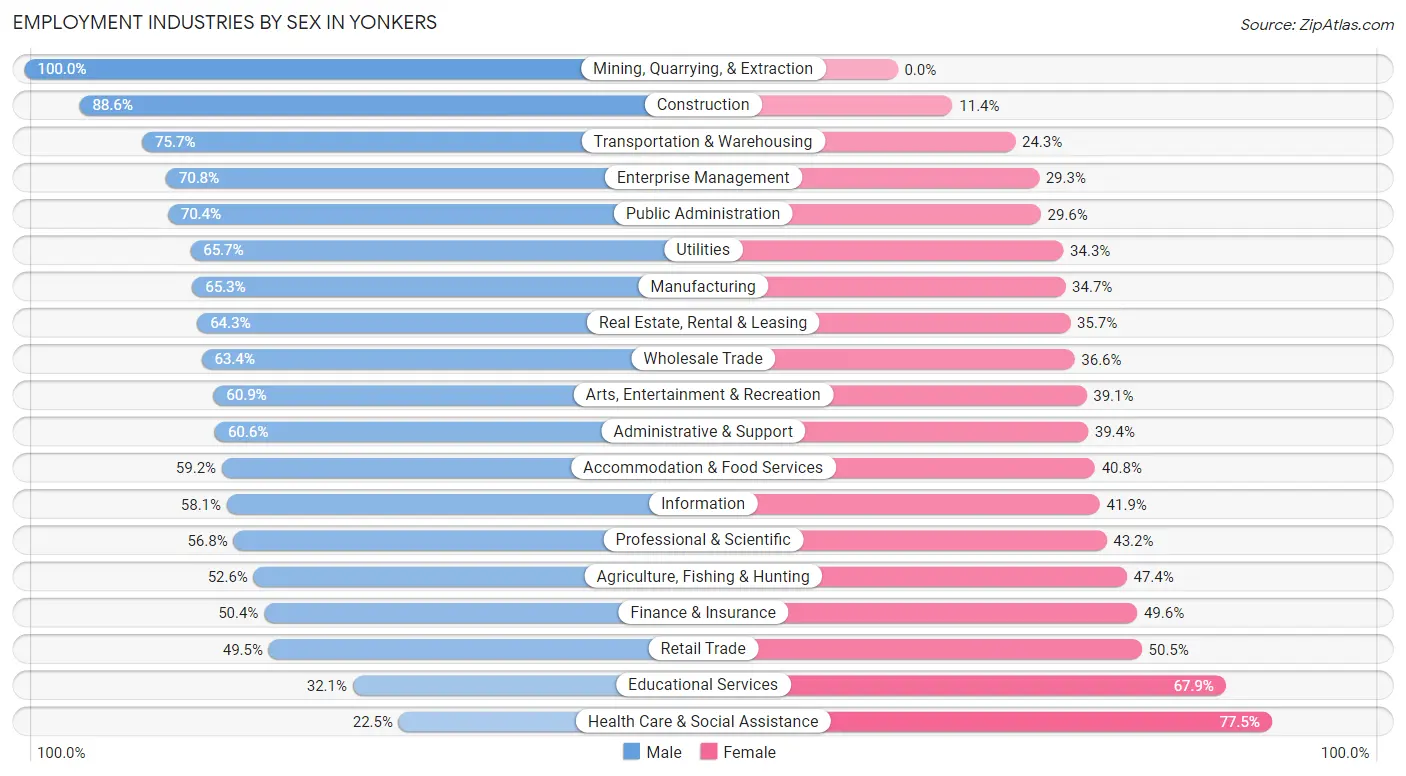
Employment Industries by Sex in Yonkers
The Yonkers industries that see more men than women are Mining, Quarrying, & Extraction (100.0%), Construction (88.6%), and Transportation & Warehousing (75.7%), whereas the industries that tend to have a higher number of women are Health Care & Social Assistance (77.5%), Educational Services (67.9%), and Retail Trade (50.5%).
| Industry | Male | Female |
| Agriculture, Fishing & Hunting | 163 (52.6%) | 147 (47.4%) |
| Mining, Quarrying, & Extraction | 37 (100.0%) | 0 (0.0%) |
| Construction | 6,601 (88.6%) | 847 (11.4%) |
| Manufacturing | 2,764 (65.3%) | 1,470 (34.7%) |
| Wholesale Trade | 1,480 (63.4%) | 855 (36.6%) |
| Retail Trade | 4,853 (49.5%) | 4,958 (50.5%) |
| Transportation & Warehousing | 4,945 (75.7%) | 1,591 (24.3%) |
| Utilities | 540 (65.7%) | 282 (34.3%) |
| Information | 1,222 (58.1%) | 880 (41.9%) |
| Finance & Insurance | 2,238 (50.4%) | 2,202 (49.6%) |
| Real Estate, Rental & Leasing | 1,703 (64.3%) | 947 (35.7%) |
| Professional & Scientific | 3,492 (56.8%) | 2,660 (43.2%) |
| Enterprise Management | 104 (70.8%) | 43 (29.2%) |
| Administrative & Support | 1,896 (60.6%) | 1,233 (39.4%) |
| Educational Services | 3,962 (32.1%) | 8,397 (67.9%) |
| Health Care & Social Assistance | 4,625 (22.5%) | 15,891 (77.5%) |
| Arts, Entertainment & Recreation | 1,664 (60.9%) | 1,068 (39.1%) |
| Accommodation & Food Services | 3,634 (59.2%) | 2,509 (40.8%) |
| Public Administration | 4,037 (70.4%) | 1,701 (29.6%) |
| Total | 52,215 (51.0%) | 50,073 (48.9%) |
Education in Yonkers
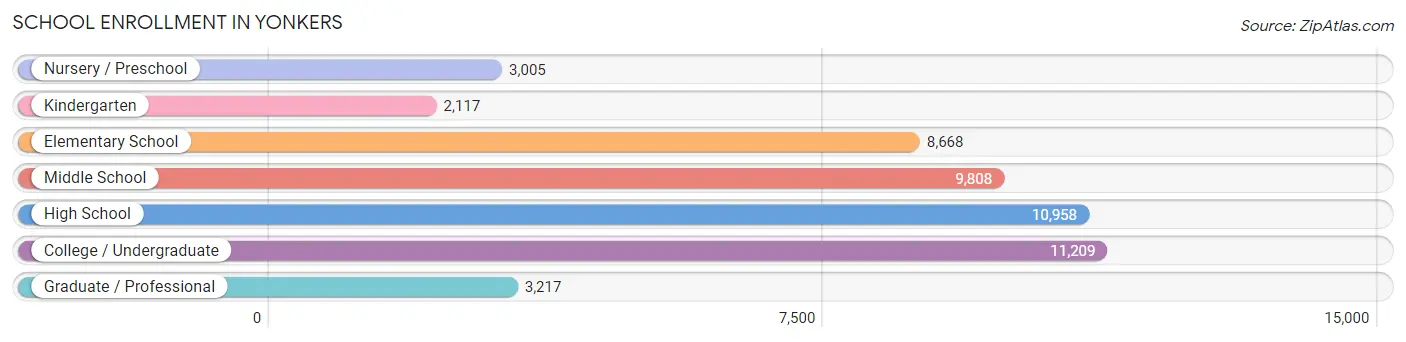
School Enrollment in Yonkers
The most common levels of schooling among the 48,982 students in Yonkers are college / undergraduate (11,209 | 22.9%), high school (10,958 | 22.4%), and middle school (9,808 | 20.0%).
| School Level | # Students | % Students |
| Nursery / Preschool | 3,005 | 6.1% |
| Kindergarten | 2,117 | 4.3% |
| Elementary School | 8,668 | 17.7% |
| Middle School | 9,808 | 20.0% |
| High School | 10,958 | 22.4% |
| College / Undergraduate | 11,209 | 22.9% |
| Graduate / Professional | 3,217 | 6.6% |
| Total | 48,982 | 100.0% |
School Enrollment by Age by Funding Source in Yonkers
Out of a total of 48,982 students who are enrolled in schools in Yonkers, 13,764 (28.1%) attend a private institution, while the remaining 35,218 (71.9%) are enrolled in public schools. The age group of 25 to 34 year olds has the highest likelihood of being enrolled in private schools, with 1,450 (50.9% in the age bracket) enrolled. Conversely, the age group of 5 to 9 year old has the lowest likelihood of being enrolled in a private school, with 9,040 (86.7% in the age bracket) attending a public institution.
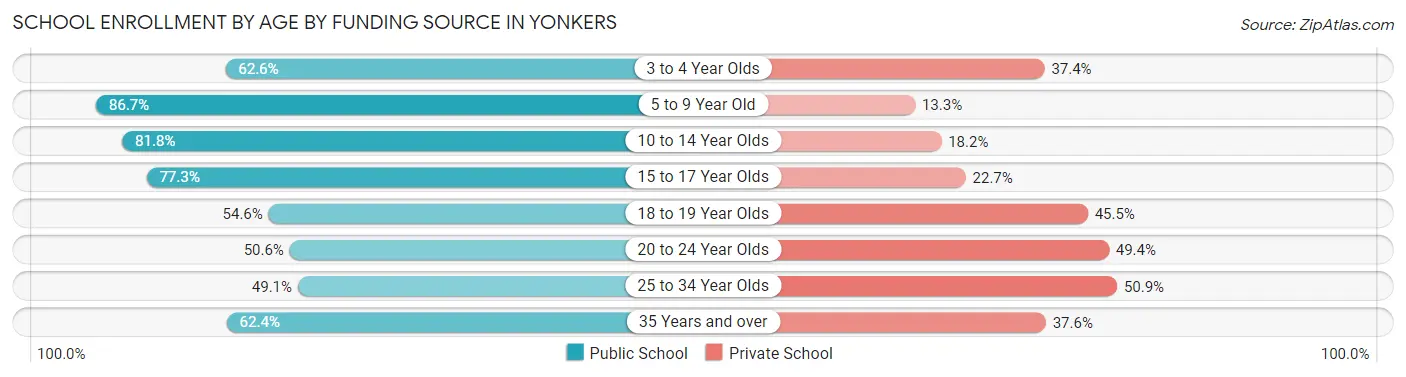
| Age Bracket | Public School | Private School |
| 3 to 4 Year Olds | 1,886 (62.6%) | 1,127 (37.4%) |
| 5 to 9 Year Old | 9,040 (86.7%) | 1,384 (13.3%) |
| 10 to 14 Year Olds | 9,934 (81.8%) | 2,206 (18.2%) |
| 15 to 17 Year Olds | 5,947 (77.3%) | 1,747 (22.7%) |
| 18 to 19 Year Olds | 2,259 (54.5%) | 1,882 (45.5%) |
| 20 to 24 Year Olds | 2,907 (50.6%) | 2,836 (49.4%) |
| 25 to 34 Year Olds | 1,399 (49.1%) | 1,450 (50.9%) |
| 35 Years and over | 1,857 (62.4%) | 1,121 (37.6%) |
| Total | 35,218 (71.9%) | 13,764 (28.1%) |
Educational Attainment by Field of Study in Yonkers
Business (11,075 | 19.7%), science & technology (7,066 | 12.5%), social sciences (5,402 | 9.6%), education (5,395 | 9.6%), and psychology (4,728 | 8.4%) are the most common fields of study among 56,362 individuals in Yonkers who have obtained a bachelor's degree or higher.
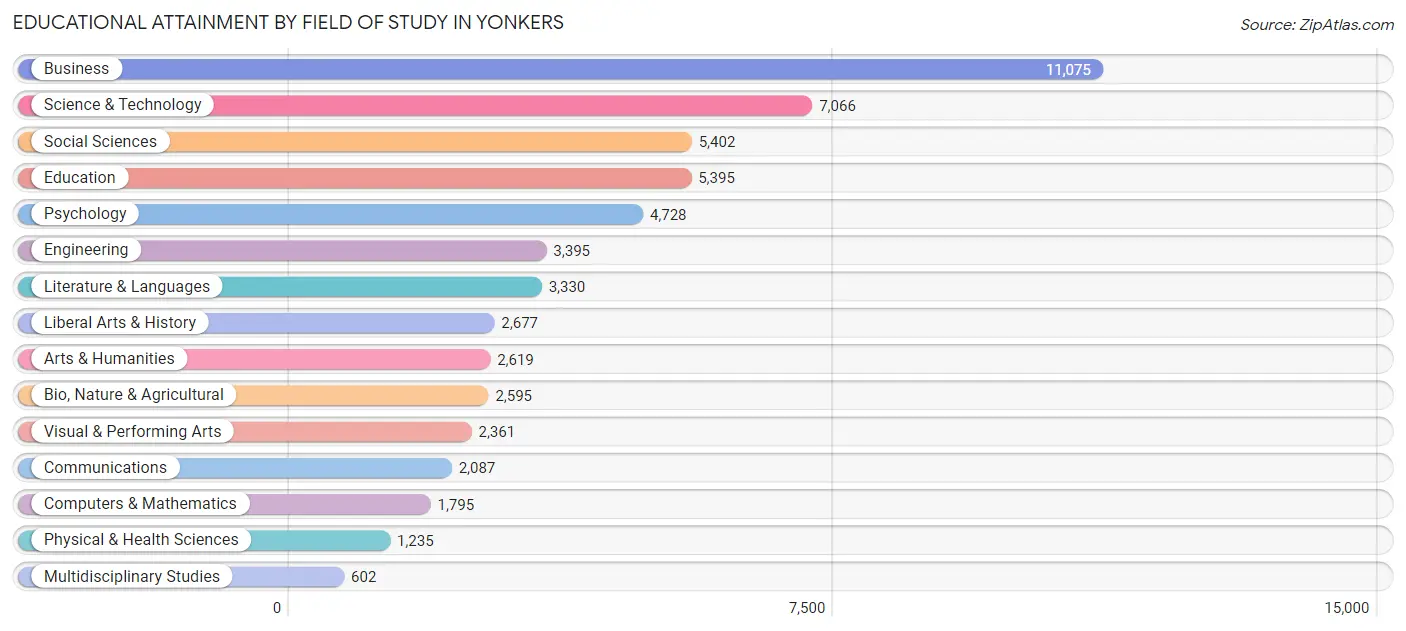
| Field of Study | # Graduates | % Graduates |
| Computers & Mathematics | 1,795 | 3.2% |
| Bio, Nature & Agricultural | 2,595 | 4.6% |
| Physical & Health Sciences | 1,235 | 2.2% |
| Psychology | 4,728 | 8.4% |
| Social Sciences | 5,402 | 9.6% |
| Engineering | 3,395 | 6.0% |
| Multidisciplinary Studies | 602 | 1.1% |
| Science & Technology | 7,066 | 12.5% |
| Business | 11,075 | 19.7% |
| Education | 5,395 | 9.6% |
| Literature & Languages | 3,330 | 5.9% |
| Liberal Arts & History | 2,677 | 4.8% |
| Visual & Performing Arts | 2,361 | 4.2% |
| Communications | 2,087 | 3.7% |
| Arts & Humanities | 2,619 | 4.6% |
| Total | 56,362 | 100.0% |
Transportation & Commute in Yonkers
Vehicle Availability by Sex in Yonkers
The most prevalent vehicle ownership categories in Yonkers are males with 2 vehicles (17,117, accounting for 33.9%) and females with 2 vehicles (13,004, making up 35.7%).
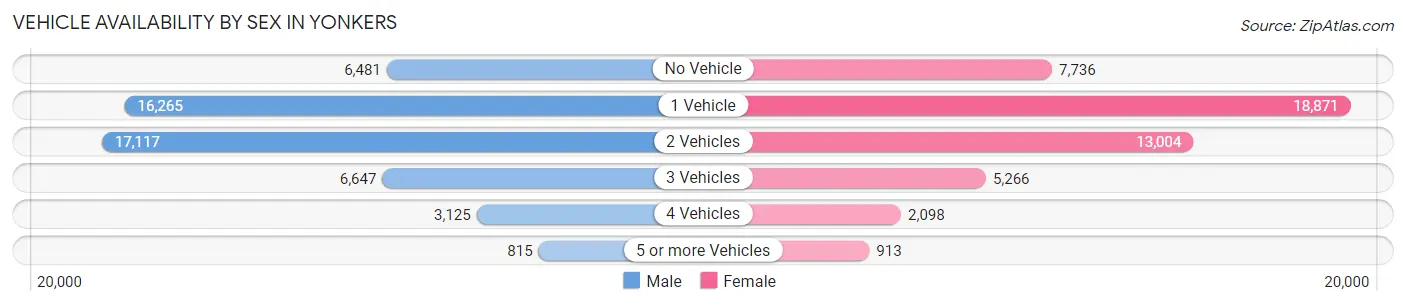
| Vehicles Available | Male | Female |
| No Vehicle | 6,481 (12.9%) | 7,736 (16.2%) |
| 1 Vehicle | 16,265 (32.2%) | 18,871 (39.4%) |
| 2 Vehicles | 17,117 (33.9%) | 13,004 (27.2%) |
| 3 Vehicles | 6,647 (13.2%) | 5,266 (11.0%) |
| 4 Vehicles | 3,125 (6.2%) | 2,098 (4.4%) |
| 5 or more Vehicles | 815 (1.6%) | 913 (1.9%) |
| Total | 50,450 (100.0%) | 47,888 (100.0%) |
Commute Time in Yonkers
The most frequently occuring commute durations in Yonkers are 30 to 34 minutes (15,137 commuters, 16.8%), 60 to 89 minutes (11,368 commuters, 12.6%), and 15 to 19 minutes (11,306 commuters, 12.6%).
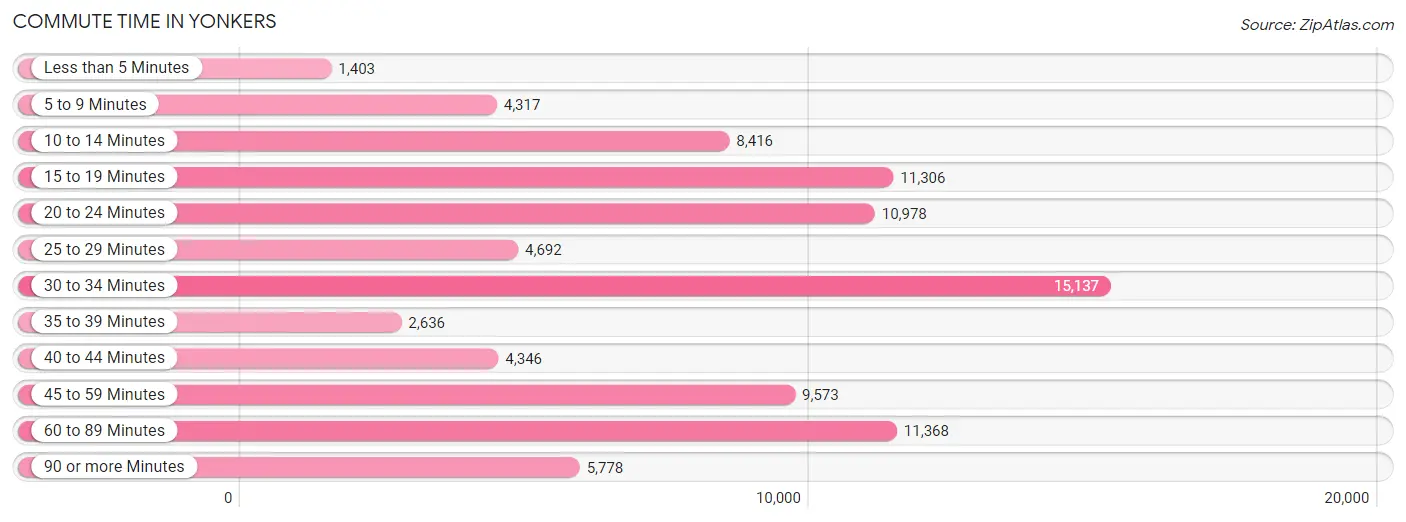
| Commute Time | # Commuters | % Commuters |
| Less than 5 Minutes | 1,403 | 1.6% |
| 5 to 9 Minutes | 4,317 | 4.8% |
| 10 to 14 Minutes | 8,416 | 9.4% |
| 15 to 19 Minutes | 11,306 | 12.6% |
| 20 to 24 Minutes | 10,978 | 12.2% |
| 25 to 29 Minutes | 4,692 | 5.2% |
| 30 to 34 Minutes | 15,137 | 16.8% |
| 35 to 39 Minutes | 2,636 | 2.9% |
| 40 to 44 Minutes | 4,346 | 4.8% |
| 45 to 59 Minutes | 9,573 | 10.6% |
| 60 to 89 Minutes | 11,368 | 12.6% |
| 90 or more Minutes | 5,778 | 6.4% |
Commute Time by Sex in Yonkers
The most common commute times in Yonkers are 30 to 34 minutes (8,007 commuters, 17.4%) for males and 30 to 34 minutes (7,130 commuters, 16.2%) for females.
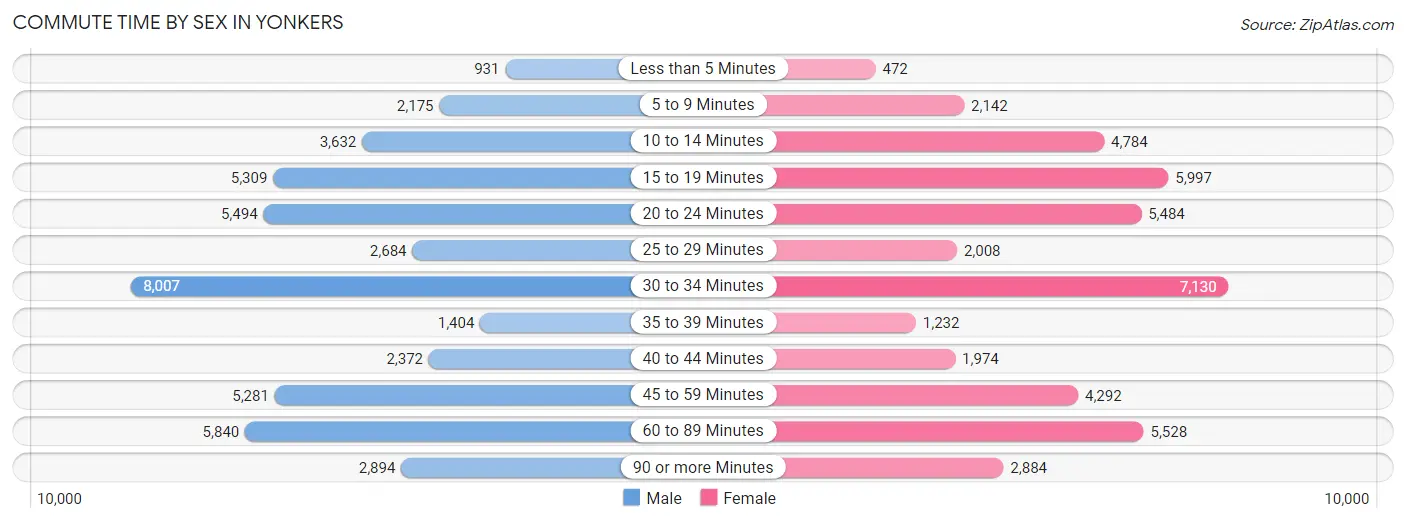
| Commute Time | Male | Female |
| Less than 5 Minutes | 931 (2.0%) | 472 (1.1%) |
| 5 to 9 Minutes | 2,175 (4.7%) | 2,142 (4.9%) |
| 10 to 14 Minutes | 3,632 (7.9%) | 4,784 (10.9%) |
| 15 to 19 Minutes | 5,309 (11.5%) | 5,997 (13.7%) |
| 20 to 24 Minutes | 5,494 (11.9%) | 5,484 (12.5%) |
| 25 to 29 Minutes | 2,684 (5.8%) | 2,008 (4.6%) |
| 30 to 34 Minutes | 8,007 (17.4%) | 7,130 (16.2%) |
| 35 to 39 Minutes | 1,404 (3.0%) | 1,232 (2.8%) |
| 40 to 44 Minutes | 2,372 (5.1%) | 1,974 (4.5%) |
| 45 to 59 Minutes | 5,281 (11.5%) | 4,292 (9.8%) |
| 60 to 89 Minutes | 5,840 (12.7%) | 5,528 (12.6%) |
| 90 or more Minutes | 2,894 (6.3%) | 2,884 (6.6%) |
Time of Departure to Work by Sex in Yonkers
The most frequent times of departure to work in Yonkers are 6:00 AM to 6:29 AM (6,414, 13.9%) for males and 8:00 AM to 8:29 AM (6,981, 15.9%) for females.
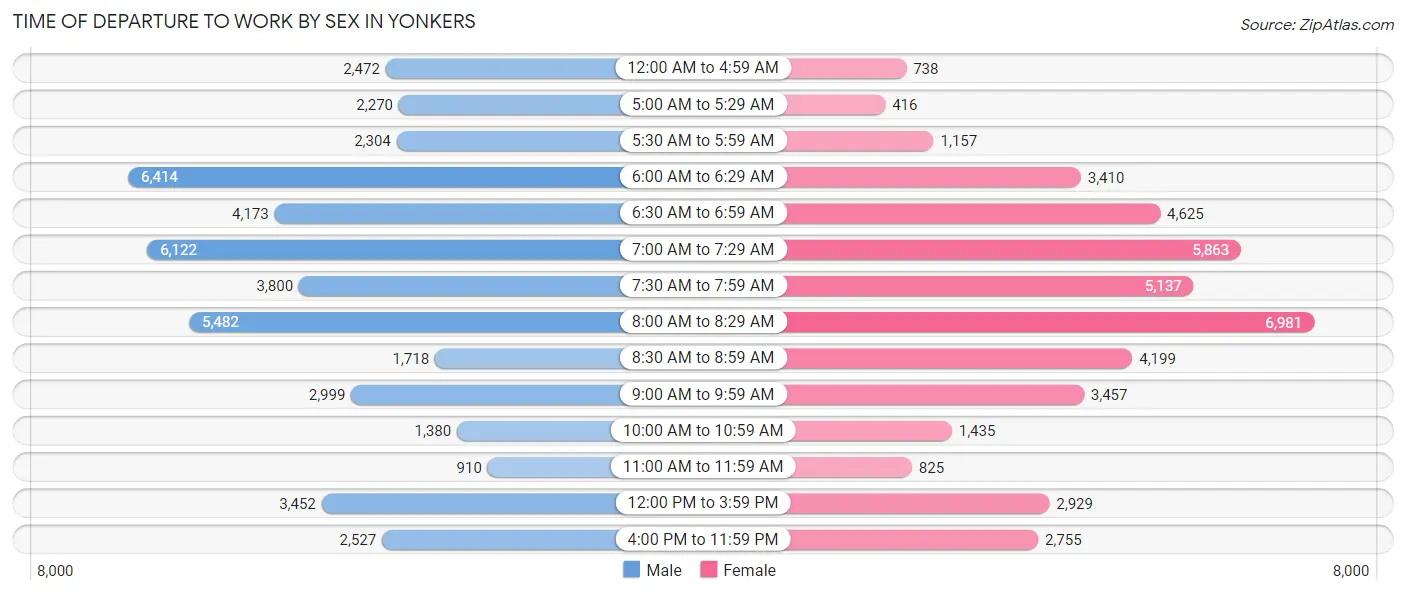
| Time of Departure | Male | Female |
| 12:00 AM to 4:59 AM | 2,472 (5.4%) | 738 (1.7%) |
| 5:00 AM to 5:29 AM | 2,270 (4.9%) | 416 (0.9%) |
| 5:30 AM to 5:59 AM | 2,304 (5.0%) | 1,157 (2.6%) |
| 6:00 AM to 6:29 AM | 6,414 (13.9%) | 3,410 (7.8%) |
| 6:30 AM to 6:59 AM | 4,173 (9.1%) | 4,625 (10.5%) |
| 7:00 AM to 7:29 AM | 6,122 (13.3%) | 5,863 (13.4%) |
| 7:30 AM to 7:59 AM | 3,800 (8.3%) | 5,137 (11.7%) |
| 8:00 AM to 8:29 AM | 5,482 (11.9%) | 6,981 (15.9%) |
| 8:30 AM to 8:59 AM | 1,718 (3.7%) | 4,199 (9.6%) |
| 9:00 AM to 9:59 AM | 2,999 (6.5%) | 3,457 (7.9%) |
| 10:00 AM to 10:59 AM | 1,380 (3.0%) | 1,435 (3.3%) |
| 11:00 AM to 11:59 AM | 910 (2.0%) | 825 (1.9%) |
| 12:00 PM to 3:59 PM | 3,452 (7.5%) | 2,929 (6.7%) |
| 4:00 PM to 11:59 PM | 2,527 (5.5%) | 2,755 (6.3%) |
| Total | 46,023 (100.0%) | 43,927 (100.0%) |
Housing Occupancy in Yonkers
Occupancy by Ownership in Yonkers
Of the total 81,470 dwellings in Yonkers, owner-occupied units account for 39,319 (48.3%), while renter-occupied units make up 42,151 (51.7%).
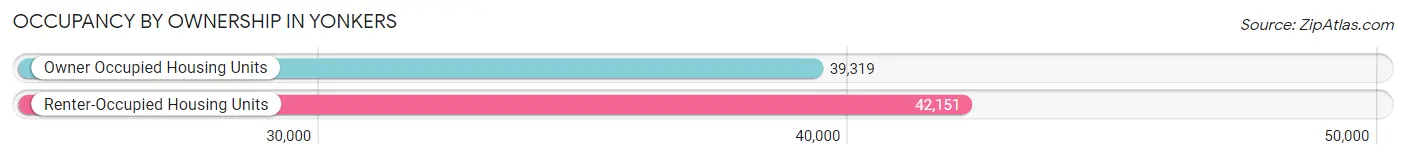
| Occupancy | # Housing Units | % Housing Units |
| Owner Occupied Housing Units | 39,319 | 48.3% |
| Renter-Occupied Housing Units | 42,151 | 51.7% |
| Total Occupied Housing Units | 81,470 | 100.0% |
Occupancy by Household Size in Yonkers
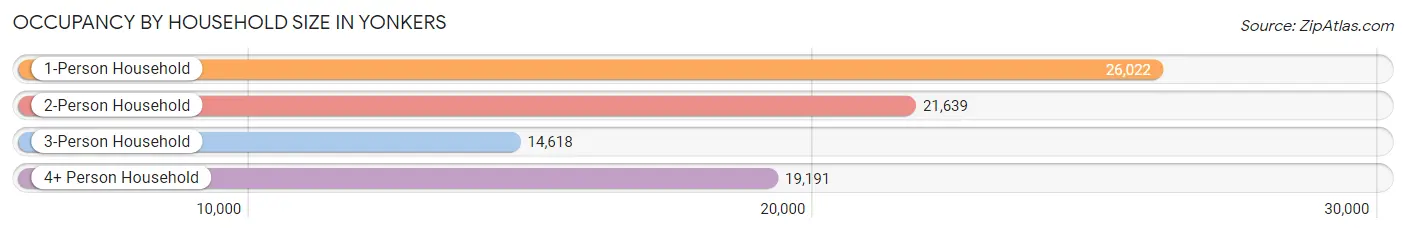
| Household Size | # Housing Units | % Housing Units |
| 1-Person Household | 26,022 | 31.9% |
| 2-Person Household | 21,639 | 26.6% |
| 3-Person Household | 14,618 | 17.9% |
| 4+ Person Household | 19,191 | 23.6% |
| Total Housing Units | 81,470 | 100.0% |
Occupancy by Ownership by Household Size in Yonkers
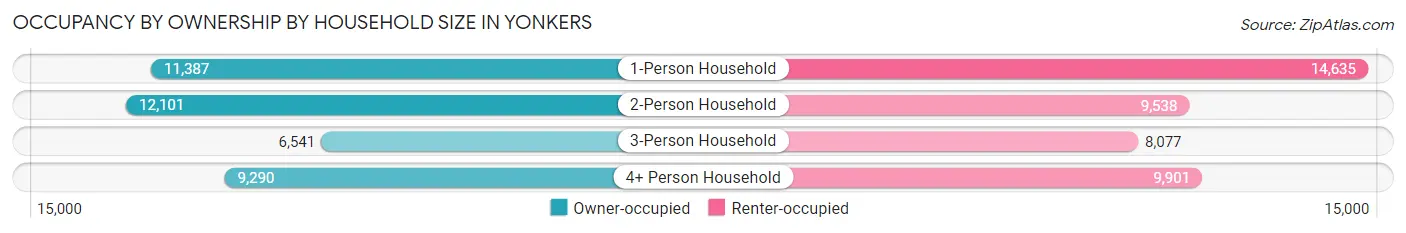
| Household Size | Owner-occupied | Renter-occupied |
| 1-Person Household | 11,387 (43.8%) | 14,635 (56.2%) |
| 2-Person Household | 12,101 (55.9%) | 9,538 (44.1%) |
| 3-Person Household | 6,541 (44.8%) | 8,077 (55.2%) |
| 4+ Person Household | 9,290 (48.4%) | 9,901 (51.6%) |
| Total Housing Units | 39,319 (48.3%) | 42,151 (51.7%) |
Occupancy by Educational Attainment in Yonkers
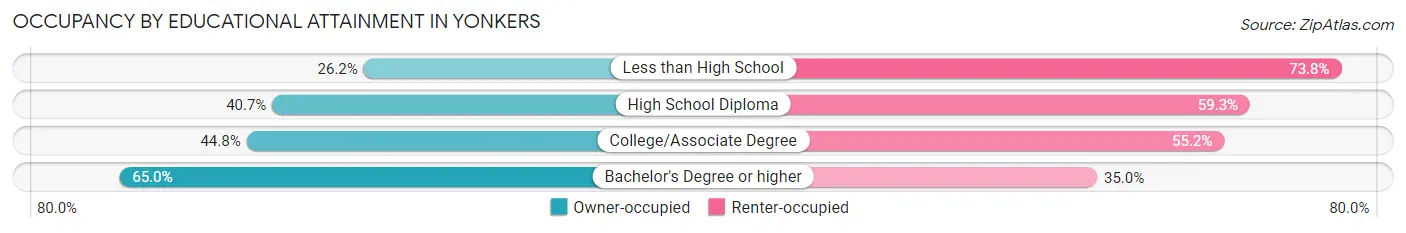
| Household Size | Owner-occupied | Renter-occupied |
| Less than High School | 3,314 (26.2%) | 9,318 (73.8%) |
| High School Diploma | 7,768 (40.7%) | 11,302 (59.3%) |
| College/Associate Degree | 9,109 (44.8%) | 11,217 (55.2%) |
| Bachelor's Degree or higher | 19,128 (65.0%) | 10,314 (35.0%) |
Occupancy by Age of Householder in Yonkers
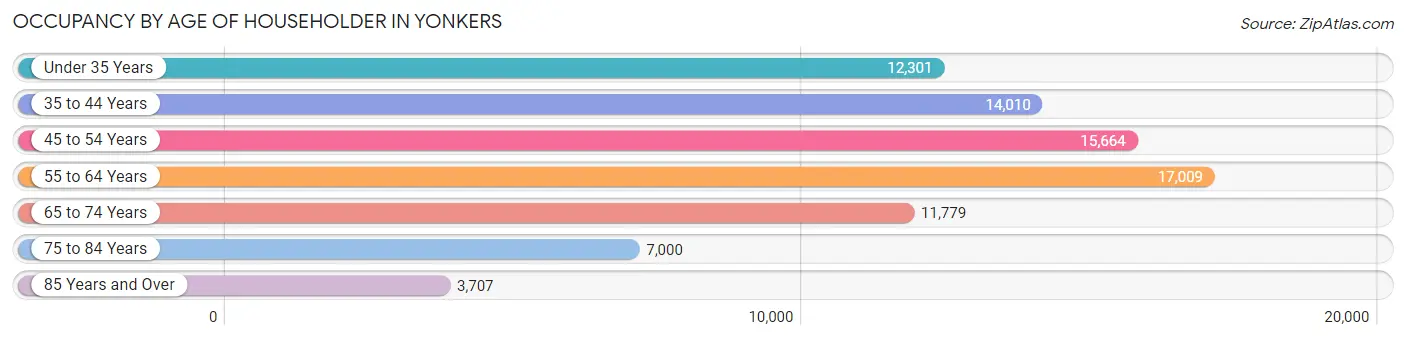
| Age Bracket | # Households | % Households |
| Under 35 Years | 12,301 | 15.1% |
| 35 to 44 Years | 14,010 | 17.2% |
| 45 to 54 Years | 15,664 | 19.2% |
| 55 to 64 Years | 17,009 | 20.9% |
| 65 to 74 Years | 11,779 | 14.5% |
| 75 to 84 Years | 7,000 | 8.6% |
| 85 Years and Over | 3,707 | 4.5% |
| Total | 81,470 | 100.0% |
Housing Finances in Yonkers
Median Income by Occupancy in Yonkers
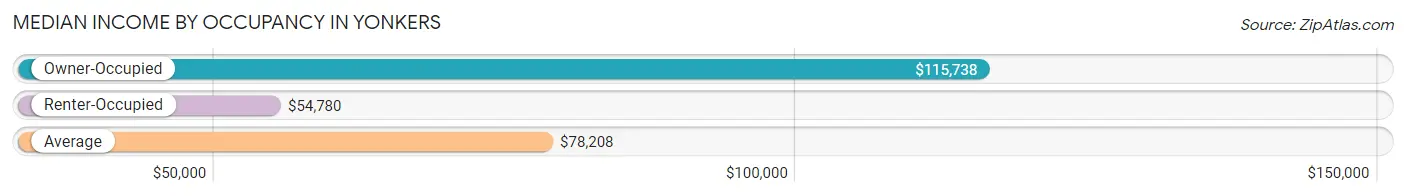
| Occupancy Type | # Households | Median Income |
| Owner-Occupied | 39,319 (48.3%) | $115,738 |
| Renter-Occupied | 42,151 (51.7%) | $54,780 |
| Average | 81,470 (100.0%) | $78,208 |
Occupancy by Householder Income Bracket in Yonkers
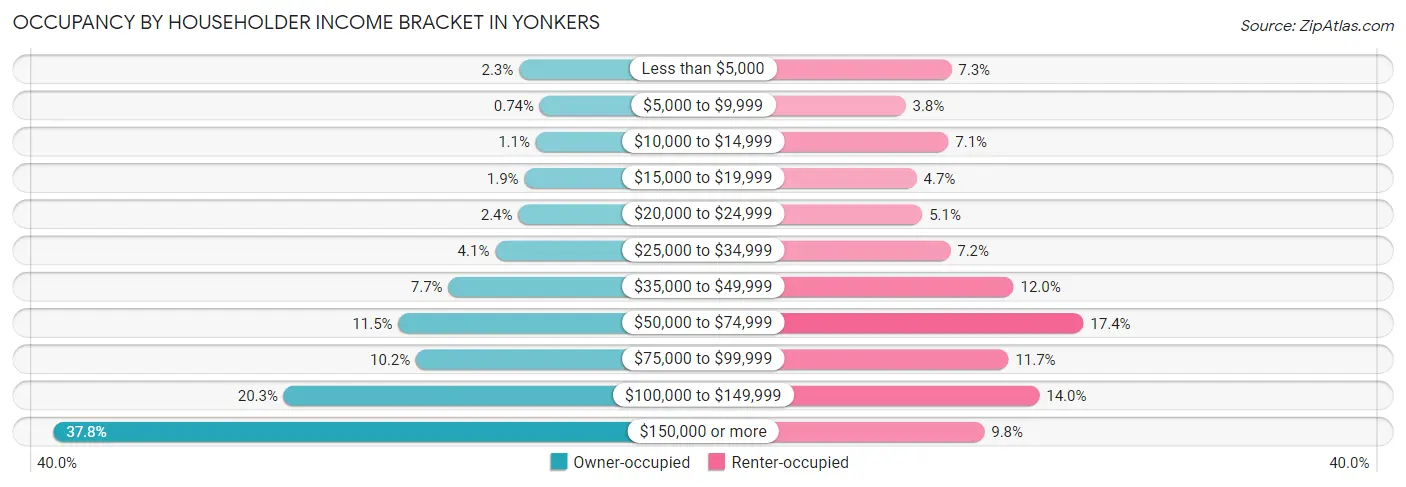
| Income Bracket | Owner-occupied | Renter-occupied |
| Less than $5,000 | 914 (2.3%) | 3,079 (7.3%) |
| $5,000 to $9,999 | 291 (0.7%) | 1,608 (3.8%) |
| $10,000 to $14,999 | 412 (1.1%) | 2,980 (7.1%) |
| $15,000 to $19,999 | 754 (1.9%) | 1,962 (4.6%) |
| $20,000 to $24,999 | 934 (2.4%) | 2,142 (5.1%) |
| $25,000 to $34,999 | 1,629 (4.1%) | 3,043 (7.2%) |
| $35,000 to $49,999 | 3,030 (7.7%) | 5,074 (12.0%) |
| $50,000 to $74,999 | 4,528 (11.5%) | 7,316 (17.4%) |
| $75,000 to $99,999 | 3,998 (10.2%) | 4,911 (11.7%) |
| $100,000 to $149,999 | 7,961 (20.3%) | 5,901 (14.0%) |
| $150,000 or more | 14,868 (37.8%) | 4,135 (9.8%) |
| Total | 39,319 (100.0%) | 42,151 (100.0%) |
Monthly Housing Cost Tiers in Yonkers
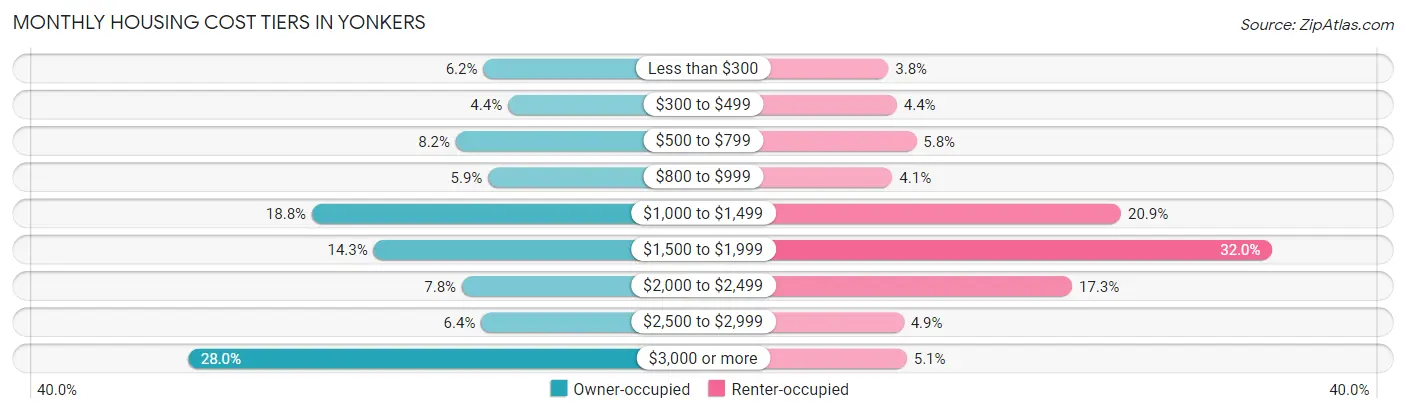
| Monthly Cost | Owner-occupied | Renter-occupied |
| Less than $300 | 2,446 (6.2%) | 1,579 (3.7%) |
| $300 to $499 | 1,731 (4.4%) | 1,846 (4.4%) |
| $500 to $799 | 3,239 (8.2%) | 2,450 (5.8%) |
| $800 to $999 | 2,303 (5.9%) | 1,708 (4.1%) |
| $1,000 to $1,499 | 7,406 (18.8%) | 8,806 (20.9%) |
| $1,500 to $1,999 | 5,622 (14.3%) | 13,501 (32.0%) |
| $2,000 to $2,499 | 3,063 (7.8%) | 7,283 (17.3%) |
| $2,500 to $2,999 | 2,506 (6.4%) | 2,058 (4.9%) |
| $3,000 or more | 11,003 (28.0%) | 2,154 (5.1%) |
| Total | 39,319 (100.0%) | 42,151 (100.0%) |
Physical Housing Characteristics in Yonkers
Housing Structures in Yonkers
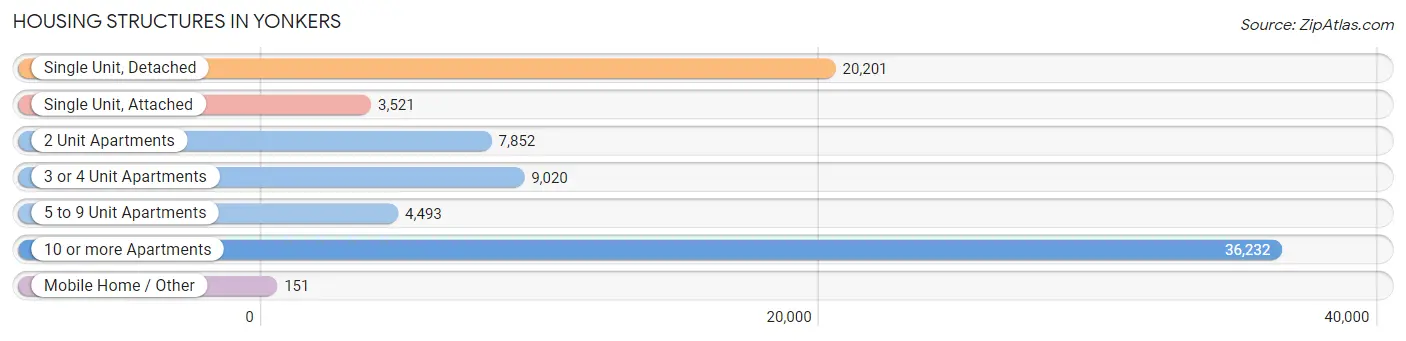
| Structure Type | # Housing Units | % Housing Units |
| Single Unit, Detached | 20,201 | 24.8% |
| Single Unit, Attached | 3,521 | 4.3% |
| 2 Unit Apartments | 7,852 | 9.6% |
| 3 or 4 Unit Apartments | 9,020 | 11.1% |
| 5 to 9 Unit Apartments | 4,493 | 5.5% |
| 10 or more Apartments | 36,232 | 44.5% |
| Mobile Home / Other | 151 | 0.2% |
| Total | 81,470 | 100.0% |
Housing Structures by Occupancy in Yonkers
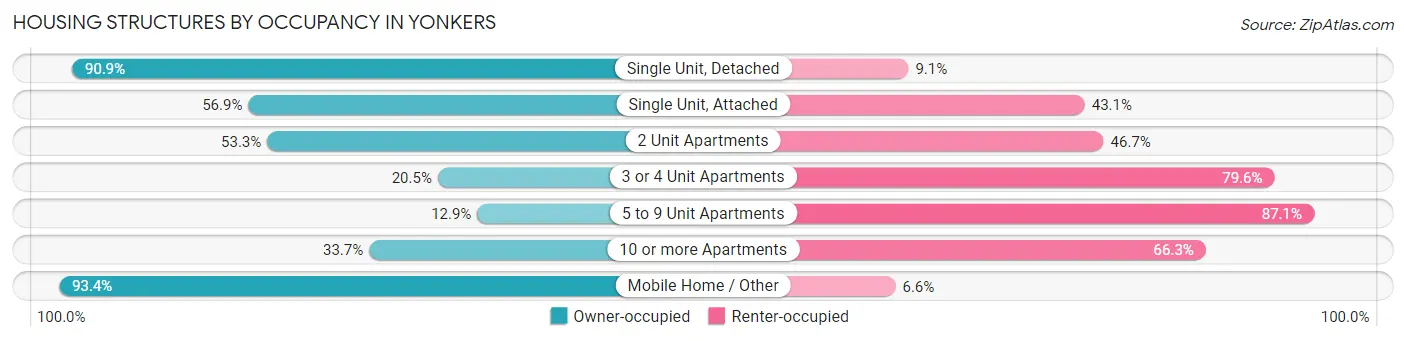
| Structure Type | Owner-occupied | Renter-occupied |
| Single Unit, Detached | 18,360 (90.9%) | 1,841 (9.1%) |
| Single Unit, Attached | 2,005 (56.9%) | 1,516 (43.1%) |
| 2 Unit Apartments | 4,186 (53.3%) | 3,666 (46.7%) |
| 3 or 4 Unit Apartments | 1,845 (20.4%) | 7,175 (79.5%) |
| 5 to 9 Unit Apartments | 578 (12.9%) | 3,915 (87.1%) |
| 10 or more Apartments | 12,204 (33.7%) | 24,028 (66.3%) |
| Mobile Home / Other | 141 (93.4%) | 10 (6.6%) |
| Total | 39,319 (48.3%) | 42,151 (51.7%) |
Housing Structures by Number of Rooms in Yonkers
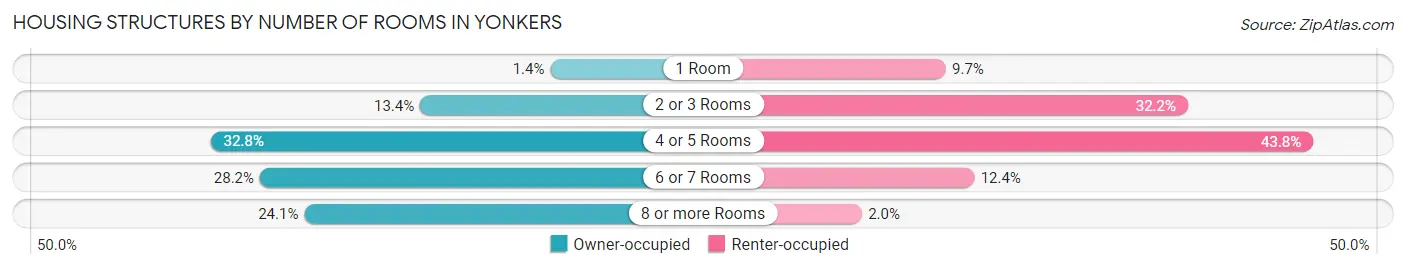
| Number of Rooms | Owner-occupied | Renter-occupied |
| 1 Room | 544 (1.4%) | 4,101 (9.7%) |
| 2 or 3 Rooms | 5,281 (13.4%) | 13,559 (32.2%) |
| 4 or 5 Rooms | 12,898 (32.8%) | 18,446 (43.8%) |
| 6 or 7 Rooms | 11,103 (28.2%) | 5,213 (12.4%) |
| 8 or more Rooms | 9,493 (24.1%) | 832 (2.0%) |
| Total | 39,319 (100.0%) | 42,151 (100.0%) |
Housing Structure by Heating Type in Yonkers
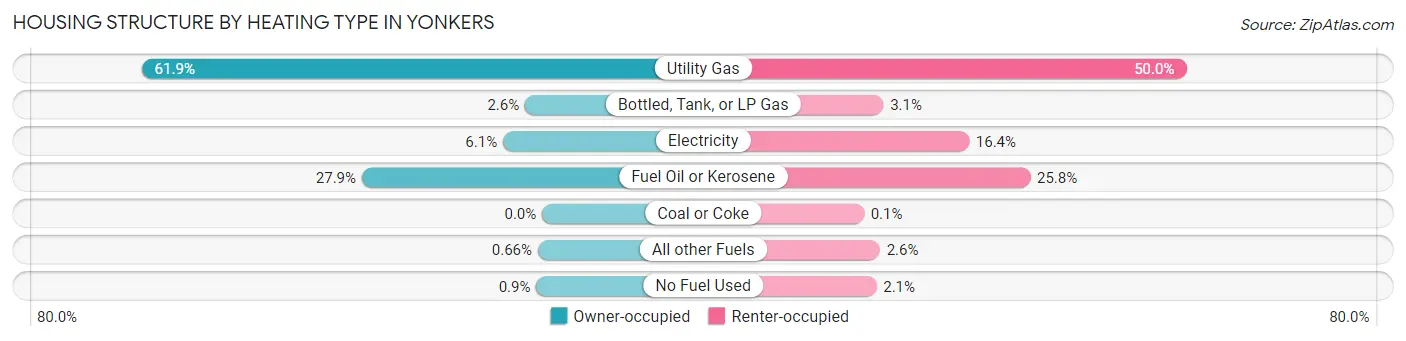
| Heating Type | Owner-occupied | Renter-occupied |
| Utility Gas | 24,337 (61.9%) | 21,060 (50.0%) |
| Bottled, Tank, or LP Gas | 1,035 (2.6%) | 1,316 (3.1%) |
| Electricity | 2,380 (6.0%) | 6,898 (16.4%) |
| Fuel Oil or Kerosene | 10,954 (27.9%) | 10,881 (25.8%) |
| Coal or Coke | 0 (0.0%) | 42 (0.1%) |
| All other Fuels | 259 (0.7%) | 1,088 (2.6%) |
| No Fuel Used | 354 (0.9%) | 866 (2.1%) |
| Total | 39,319 (100.0%) | 42,151 (100.0%) |
Household Vehicle Usage in Yonkers
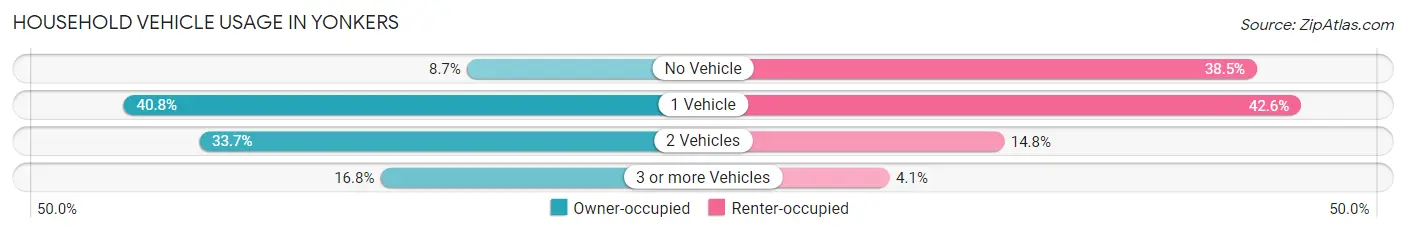
| Vehicles per Household | Owner-occupied | Renter-occupied |
| No Vehicle | 3,436 (8.7%) | 16,210 (38.5%) |
| 1 Vehicle | 16,022 (40.7%) | 17,949 (42.6%) |
| 2 Vehicles | 13,256 (33.7%) | 6,252 (14.8%) |
| 3 or more Vehicles | 6,605 (16.8%) | 1,740 (4.1%) |
| Total | 39,319 (100.0%) | 42,151 (100.0%) |
Real Estate & Mortgages in Yonkers
Real Estate and Mortgage Overview in Yonkers
| Characteristic | Without Mortgage | With Mortgage |
| Housing Units | 16,941 | 22,378 |
| Median Property Value | $431,600 | $478,800 |
| Median Household Income | $82,428 | $10,420 |
| Monthly Housing Costs | $1,187 | $10,685 |
| Real Estate Taxes | $8,450 | $3,406 |
Property Value by Mortgage Status in Yonkers
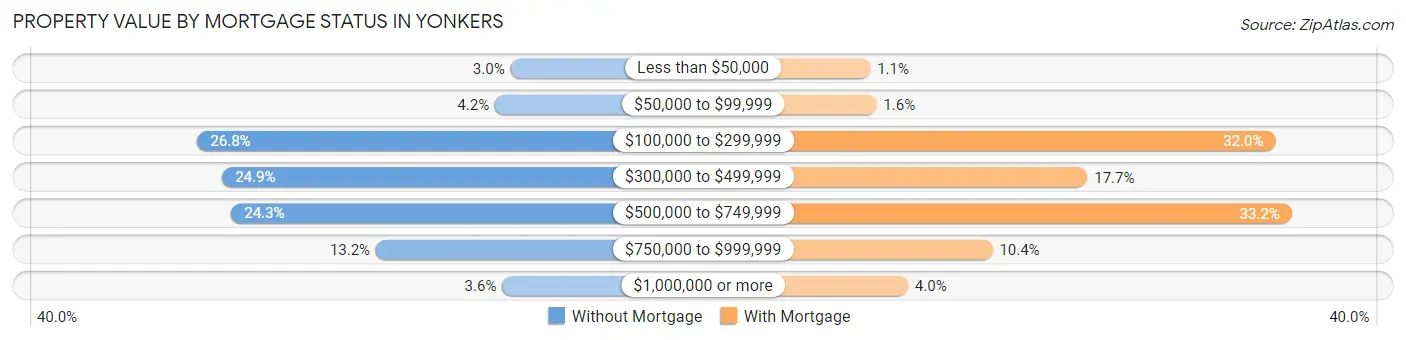
| Property Value | Without Mortgage | With Mortgage |
| Less than $50,000 | 504 (3.0%) | 251 (1.1%) |
| $50,000 to $99,999 | 705 (4.2%) | 355 (1.6%) |
| $100,000 to $299,999 | 4,545 (26.8%) | 7,156 (32.0%) |
| $300,000 to $499,999 | 4,225 (24.9%) | 3,952 (17.7%) |
| $500,000 to $749,999 | 4,108 (24.2%) | 7,436 (33.2%) |
| $750,000 to $999,999 | 2,242 (13.2%) | 2,335 (10.4%) |
| $1,000,000 or more | 612 (3.6%) | 893 (4.0%) |
| Total | 16,941 (100.0%) | 22,378 (100.0%) |
Household Income by Mortgage Status in Yonkers
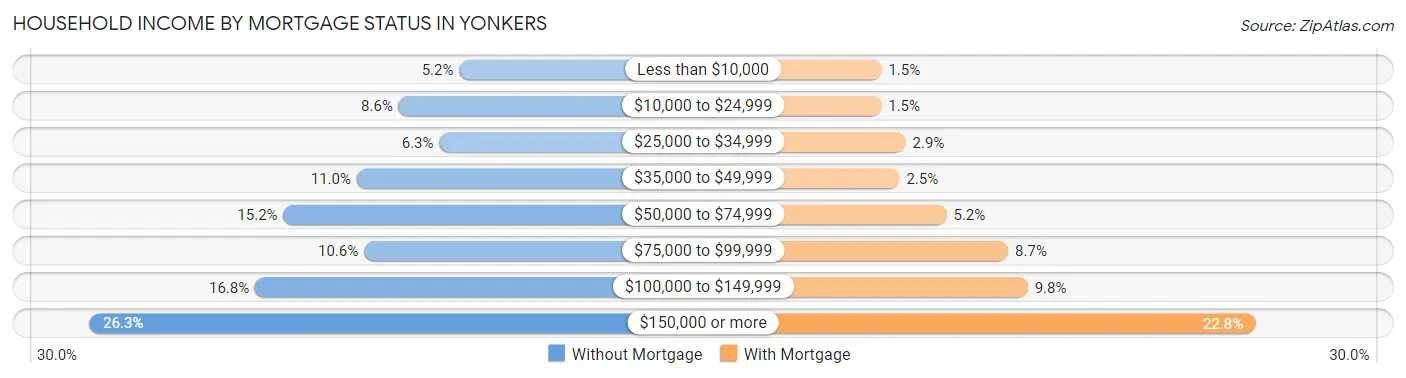
| Household Income | Without Mortgage | With Mortgage |
| Less than $10,000 | 875 (5.2%) | 332 (1.5%) |
| $10,000 to $24,999 | 1,461 (8.6%) | 330 (1.5%) |
| $25,000 to $34,999 | 1,067 (6.3%) | 639 (2.9%) |
| $35,000 to $49,999 | 1,867 (11.0%) | 562 (2.5%) |
| $50,000 to $74,999 | 2,577 (15.2%) | 1,163 (5.2%) |
| $75,000 to $99,999 | 1,795 (10.6%) | 1,951 (8.7%) |
| $100,000 to $149,999 | 2,851 (16.8%) | 2,203 (9.8%) |
| $150,000 or more | 4,448 (26.3%) | 5,110 (22.8%) |
| Total | 16,941 (100.0%) | 22,378 (100.0%) |
Property Value to Household Income Ratio in Yonkers
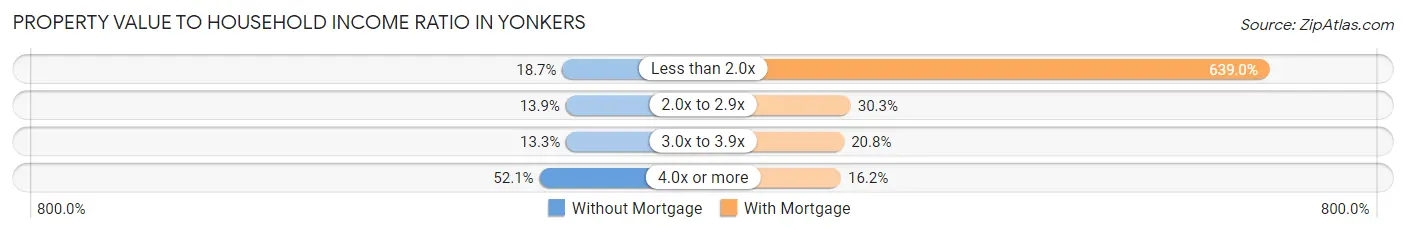
| Value-to-Income Ratio | Without Mortgage | With Mortgage |
| Less than 2.0x | 3,170 (18.7%) | 142,995 (639.0%) |
| 2.0x to 2.9x | 2,349 (13.9%) | 6,778 (30.3%) |
| 3.0x to 3.9x | 2,244 (13.3%) | 4,650 (20.8%) |
| 4.0x or more | 8,820 (52.1%) | 3,630 (16.2%) |
| Total | 16,941 (100.0%) | 22,378 (100.0%) |
Real Estate Taxes by Mortgage Status in Yonkers
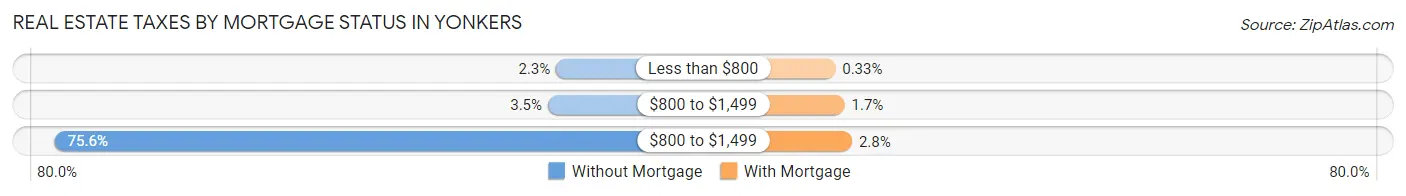
| Property Taxes | Without Mortgage | With Mortgage |
| Less than $800 | 396 (2.3%) | 74 (0.3%) |
| $800 to $1,499 | 600 (3.5%) | 378 (1.7%) |
| $800 to $1,499 | 12,808 (75.6%) | 618 (2.8%) |
| Total | 16,941 (100.0%) | 22,378 (100.0%) |
Health & Disability in Yonkers
Health Insurance Coverage by Age in Yonkers
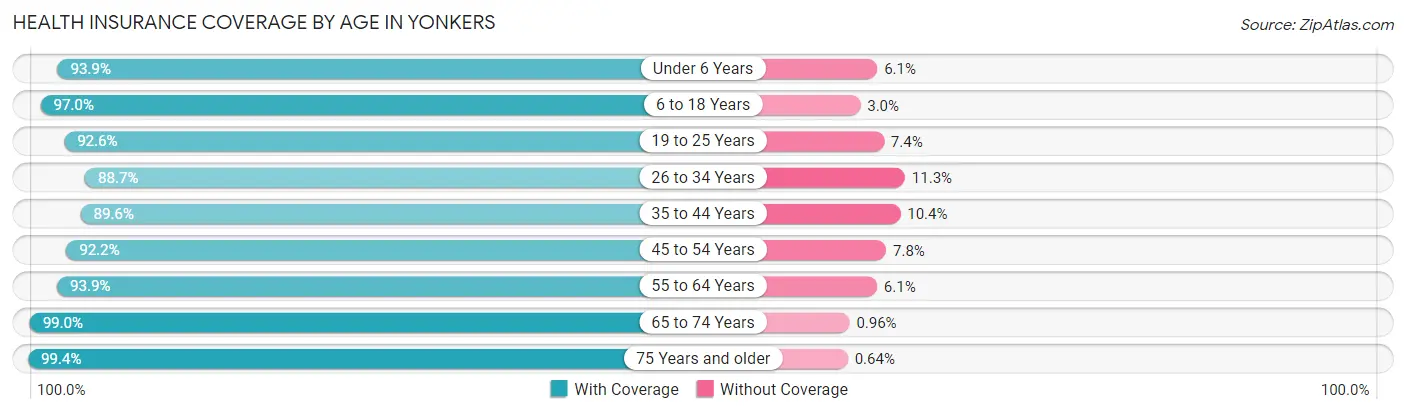
| Age Bracket | With Coverage | Without Coverage |
| Under 6 Years | 12,889 (93.9%) | 843 (6.1%) |
| 6 to 18 Years | 31,647 (97.0%) | 971 (3.0%) |
| 19 to 25 Years | 17,968 (92.6%) | 1,434 (7.4%) |
| 26 to 34 Years | 24,220 (88.7%) | 3,084 (11.3%) |
| 35 to 44 Years | 23,998 (89.6%) | 2,797 (10.4%) |
| 45 to 54 Years | 24,335 (92.2%) | 2,057 (7.8%) |
| 55 to 64 Years | 26,065 (93.9%) | 1,687 (6.1%) |
| 65 to 74 Years | 18,893 (99.0%) | 183 (1.0%) |
| 75 Years and older | 15,720 (99.4%) | 102 (0.6%) |
| Total | 195,735 (93.7%) | 13,158 (6.3%) |
Health Insurance Coverage by Citizenship Status in Yonkers
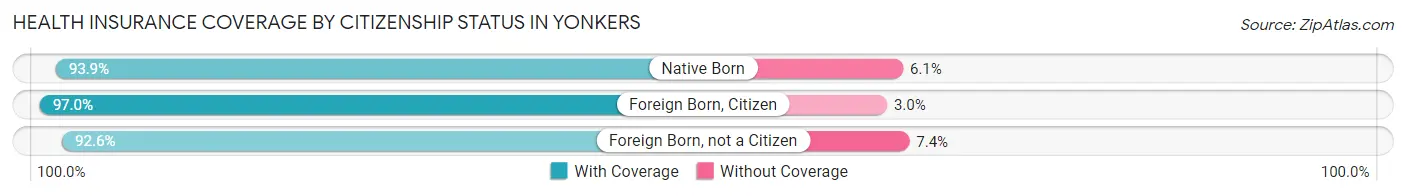
| Citizenship Status | With Coverage | Without Coverage |
| Native Born | 12,889 (93.9%) | 843 (6.1%) |
| Foreign Born, Citizen | 31,647 (97.0%) | 971 (3.0%) |
| Foreign Born, not a Citizen | 17,968 (92.6%) | 1,434 (7.4%) |
Health Insurance Coverage by Household Income in Yonkers
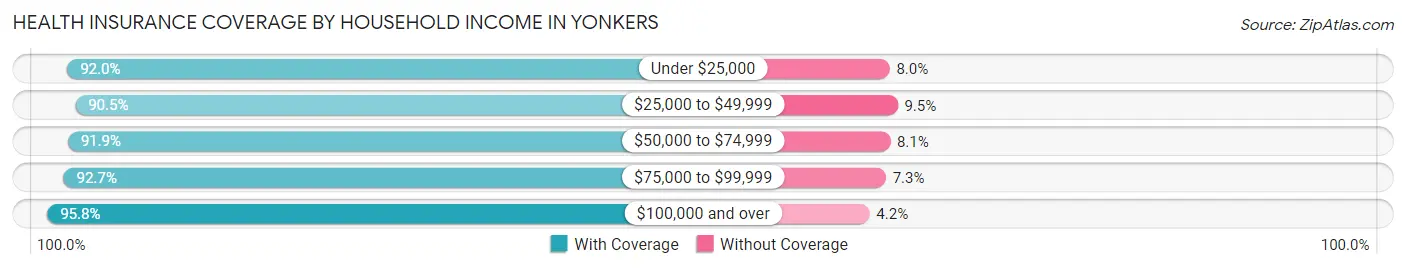
| Household Income | With Coverage | Without Coverage |
| Under $25,000 | 23,900 (92.0%) | 2,076 (8.0%) |
| $25,000 to $49,999 | 25,628 (90.5%) | 2,687 (9.5%) |
| $50,000 to $74,999 | 27,928 (91.9%) | 2,456 (8.1%) |
| $75,000 to $99,999 | 21,223 (92.7%) | 1,671 (7.3%) |
| $100,000 and over | 94,578 (95.8%) | 4,184 (4.2%) |
Public vs Private Health Insurance Coverage by Age in Yonkers
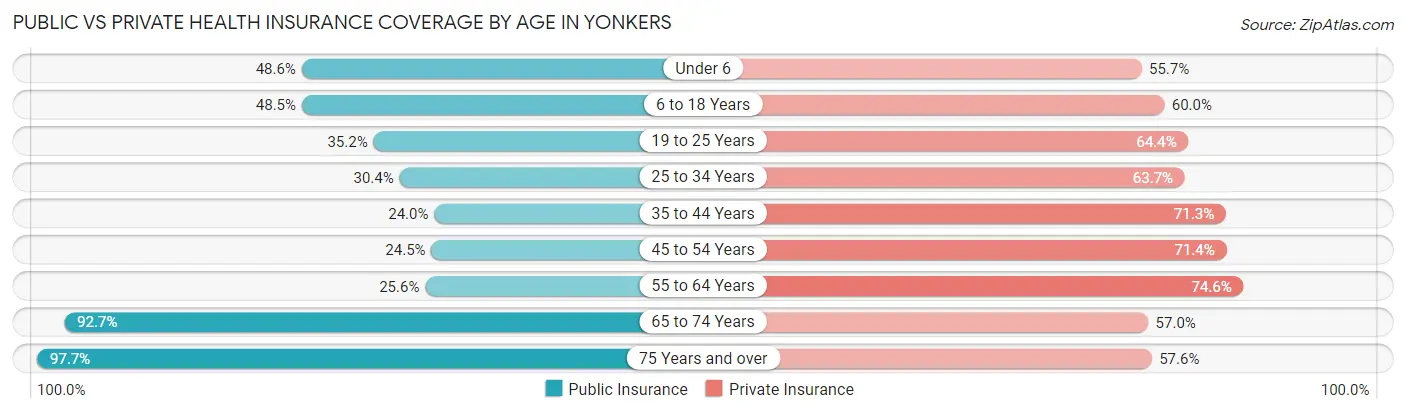
| Age Bracket | Public Insurance | Private Insurance |
| Under 6 | 6,670 (48.6%) | 7,653 (55.7%) |
| 6 to 18 Years | 15,832 (48.5%) | 19,556 (60.0%) |
| 19 to 25 Years | 6,837 (35.2%) | 12,487 (64.4%) |
| 25 to 34 Years | 8,304 (30.4%) | 17,387 (63.7%) |
| 35 to 44 Years | 6,418 (23.9%) | 19,107 (71.3%) |
| 45 to 54 Years | 6,463 (24.5%) | 18,849 (71.4%) |
| 55 to 64 Years | 7,115 (25.6%) | 20,698 (74.6%) |
| 65 to 74 Years | 17,676 (92.7%) | 10,866 (57.0%) |
| 75 Years and over | 15,459 (97.7%) | 9,116 (57.6%) |
| Total | 90,774 (43.4%) | 135,719 (65.0%) |
Disability Status by Sex by Age in Yonkers
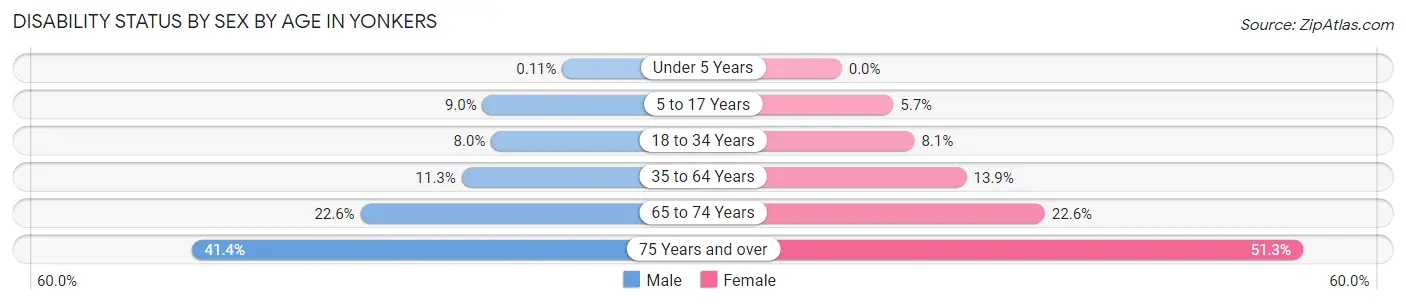
| Age Bracket | Male | Female |
| Under 5 Years | 7 (0.1%) | 0 (0.0%) |
| 5 to 17 Years | 1,544 (9.0%) | 830 (5.7%) |
| 18 to 34 Years | 1,977 (8.0%) | 2,004 (8.1%) |
| 35 to 64 Years | 4,420 (11.3%) | 5,828 (13.9%) |
| 65 to 74 Years | 1,961 (22.6%) | 2,353 (22.6%) |
| 75 Years and over | 2,527 (41.4%) | 4,989 (51.3%) |
Disability Class by Sex by Age in Yonkers
Disability Class: Hearing Difficulty
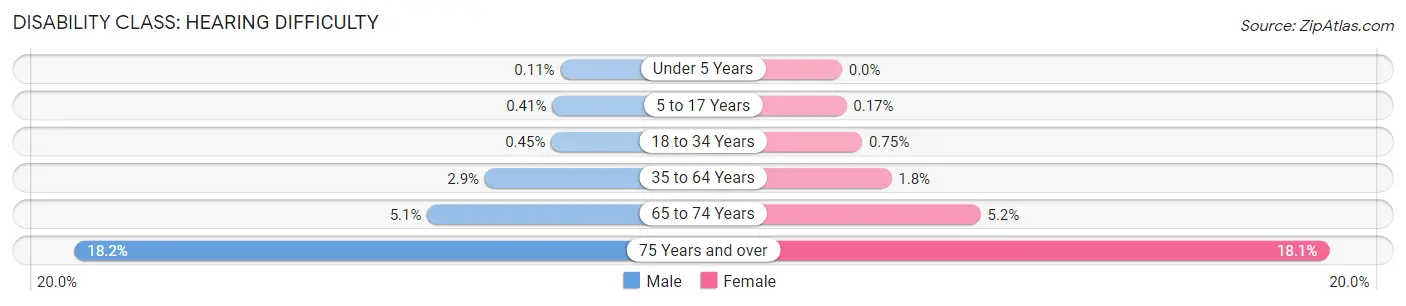
| Age Bracket | Male | Female |
| Under 5 Years | 7 (0.1%) | 0 (0.0%) |
| 5 to 17 Years | 70 (0.4%) | 24 (0.2%) |
| 18 to 34 Years | 110 (0.4%) | 185 (0.7%) |
| 35 to 64 Years | 1,136 (2.9%) | 770 (1.8%) |
| 65 to 74 Years | 438 (5.1%) | 536 (5.1%) |
| 75 Years and over | 1,108 (18.1%) | 1,758 (18.1%) |
Disability Class: Vision Difficulty
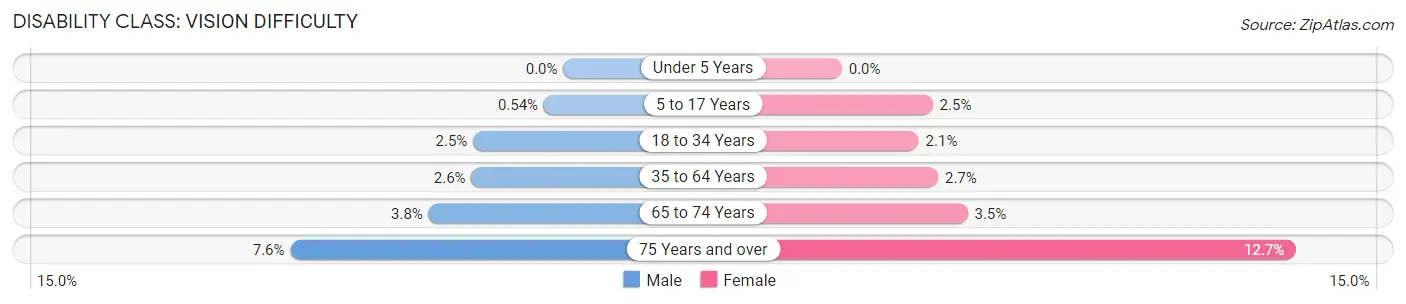
| Age Bracket | Male | Female |
| Under 5 Years | 0 (0.0%) | 0 (0.0%) |
| 5 to 17 Years | 92 (0.5%) | 366 (2.5%) |
| 18 to 34 Years | 618 (2.5%) | 531 (2.1%) |
| 35 to 64 Years | 997 (2.6%) | 1,122 (2.7%) |
| 65 to 74 Years | 325 (3.7%) | 364 (3.5%) |
| 75 Years and over | 464 (7.6%) | 1,229 (12.7%) |
Disability Class: Cognitive Difficulty
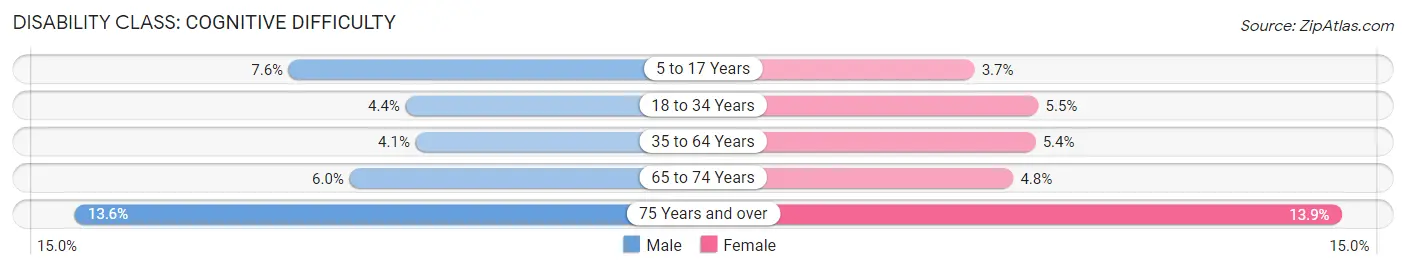
| Age Bracket | Male | Female |
| 5 to 17 Years | 1,312 (7.6%) | 536 (3.7%) |
| 18 to 34 Years | 1,080 (4.4%) | 1,357 (5.5%) |
| 35 to 64 Years | 1,604 (4.1%) | 2,263 (5.4%) |
| 65 to 74 Years | 516 (5.9%) | 497 (4.8%) |
| 75 Years and over | 830 (13.6%) | 1,352 (13.9%) |
Disability Class: Ambulatory Difficulty
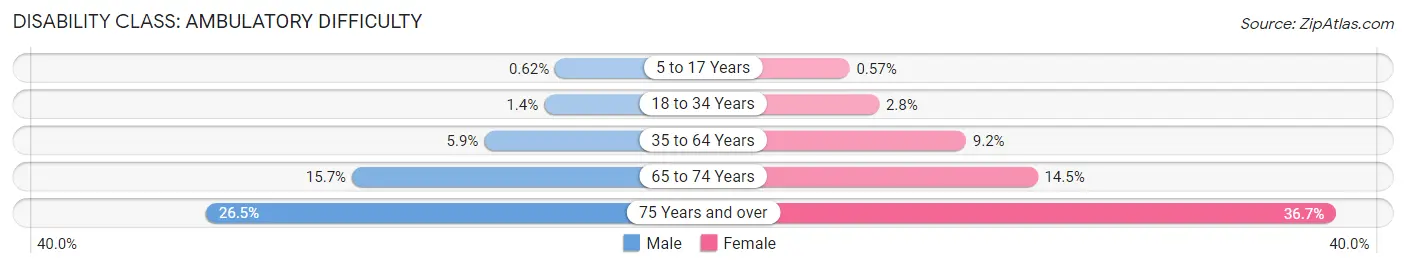
| Age Bracket | Male | Female |
| 5 to 17 Years | 107 (0.6%) | 82 (0.6%) |
| 18 to 34 Years | 353 (1.4%) | 683 (2.8%) |
| 35 to 64 Years | 2,292 (5.9%) | 3,863 (9.2%) |
| 65 to 74 Years | 1,362 (15.7%) | 1,511 (14.5%) |
| 75 Years and over | 1,620 (26.5%) | 3,566 (36.7%) |
Disability Class: Self-Care Difficulty
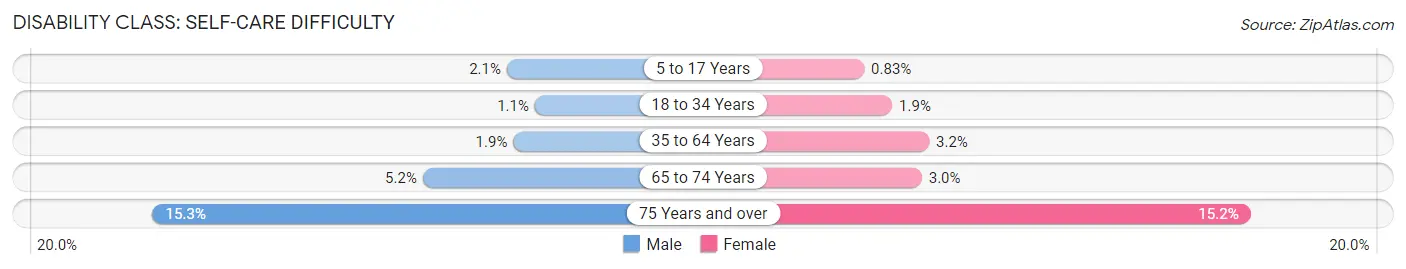
| Age Bracket | Male | Female |
| 5 to 17 Years | 361 (2.1%) | 120 (0.8%) |
| 18 to 34 Years | 260 (1.1%) | 464 (1.9%) |
| 35 to 64 Years | 725 (1.9%) | 1,359 (3.2%) |
| 65 to 74 Years | 453 (5.2%) | 309 (3.0%) |
| 75 Years and over | 931 (15.2%) | 1,474 (15.2%) |
Technology Access in Yonkers
Computing Device Access in Yonkers
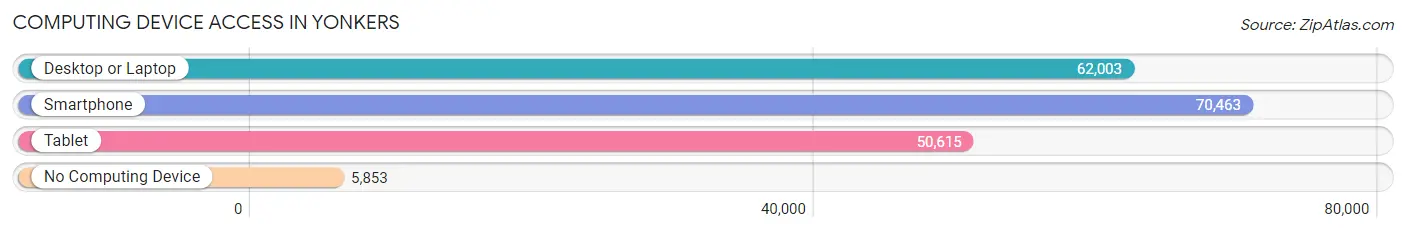
| Device Type | # Households | % Households |
| Desktop or Laptop | 62,003 | 76.1% |
| Smartphone | 70,463 | 86.5% |
| Tablet | 50,615 | 62.1% |
| No Computing Device | 5,853 | 7.2% |
| Total | 81,470 | 100.0% |
Internet Access in Yonkers
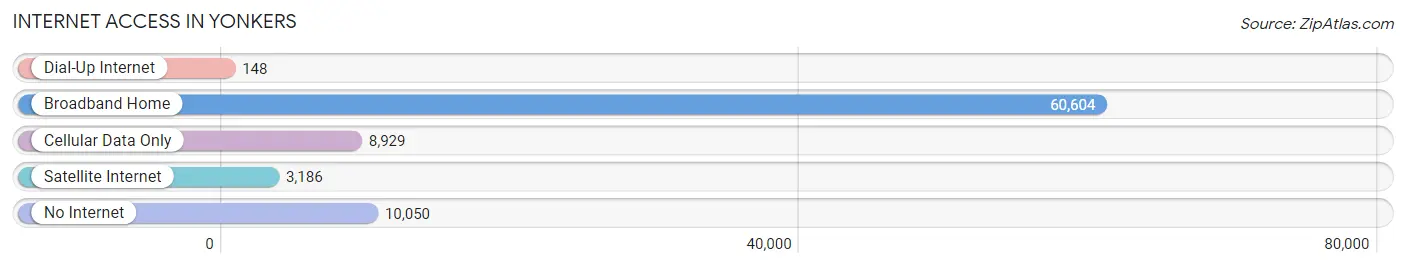
| Internet Type | # Households | % Households |
| Dial-Up Internet | 148 | 0.2% |
| Broadband Home | 60,604 | 74.4% |
| Cellular Data Only | 8,929 | 11.0% |
| Satellite Internet | 3,186 | 3.9% |
| No Internet | 10,050 | 12.3% |
| Total | 81,470 | 100.0% |
Yonkers Summary
Yonkers is a city located in Westchester County, New York, United States. It is the fourth most populous city in the state of New York, with a population of 195,976 as of the 2010 census. Yonkers borders the New York City borough of the Bronx and is located just north of the Hudson River.
History
Yonkers was first settled in 1646 by Dutch settlers, who named it after the city of Yonkers in the Netherlands. The city was incorporated in 1854 and quickly grew to become a major industrial center. During the 19th century, Yonkers was home to a number of factories, including the Otis Elevator Company, which was the first elevator manufacturer in the United States.
In the early 20th century, Yonkers was a major center for the production of silk and other textiles. The city was also home to a number of large department stores, including Macy's and Gimbels.
In the 1950s, Yonkers began to experience a decline in its manufacturing base, as many of the factories closed or moved away. This led to a period of economic decline and population loss. In the 1980s, the city began to experience a resurgence, as new businesses and industries moved into the area.
Geography
Yonkers is located in Westchester County, New York, just north of the Hudson River. The city covers an area of 19.4 square miles and is bordered by the Bronx to the south, Mount Vernon to the west, and the Hudson River to the east.
The city is divided into four distinct neighborhoods: North Yonkers, South Yonkers, East Yonkers, and West Yonkers. The neighborhoods are further divided into smaller sections, such as the Riverdale section of North Yonkers and the Getty Square section of South Yonkers.
Economy
Yonkers is home to a number of large corporations, including IBM, PepsiCo, and Heineken USA. The city is also home to a number of smaller businesses, including restaurants, retail stores, and professional services.
The city's economy is largely based on the service industry, with a large number of people employed in the retail, hospitality, and healthcare sectors. The city is also home to a number of educational institutions, including Sarah Lawrence College and the College of Mount Saint Vincent.
Demographics
As of the 2010 census, Yonkers had a population of 195,976. The city is racially diverse, with a population that is 44.3% White, 28.3% African American, 15.2% Hispanic or Latino, and 8.2% Asian.
The median household income in Yonkers is $54,845, and the median home value is $521,000. The city has a poverty rate of 17.3%, which is higher than the national average.
Conclusion
Yonkers is a city located in Westchester County, New York, United States. It is the fourth most populous city in the state of New York, with a population of 195,976 as of the 2010 census. Yonkers was first settled in 1646 by Dutch settlers, and it quickly grew to become a major industrial center. In the 1950s, Yonkers began to experience a decline in its manufacturing base, as many of the factories closed or moved away. In the 1980s, the city began to experience a resurgence, as new businesses and industries moved into the area. Today, Yonkers is home to a number of large corporations, including IBM, PepsiCo, and Heineken USA. The city is racially diverse, with a population that is 44.3% White, 28.3% African American, 15.2% Hispanic or Latino, and 8.2% Asian. The median household income in Yonkers is $54,845, and the median home value is $521,000. The city has a poverty rate of 17.3%, which is higher than the national average.
Common Questions
What is Per Capita Income in Yonkers?
Per Capita income in Yonkers is $42,336.
What is the Median Family Income in Yonkers?
Median Family Income in Yonkers is $96,322.
What is the Median Household income in Yonkers?
Median Household Income in Yonkers is $78,208.
What is Income or Wage Gap in Yonkers?
Income or Wage Gap in Yonkers is 21.2%.
Women in Yonkers earn 78.8 cents for every dollar earned by a man.
What is Family Income Deficit in Yonkers?
Family Income Deficit in Yonkers is $12,088.
Families that are below poverty line in Yonkers earn $12,088 less on average than the poverty threshold level.
What is Inequality or Gini Index in Yonkers?
Inequality or Gini Index in Yonkers is 0.49.
What is the Total Population of Yonkers?
Total Population of Yonkers is 209,780.
What is the Total Male Population of Yonkers?
Total Male Population of Yonkers is 102,097.
What is the Total Female Population of Yonkers?
Total Female Population of Yonkers is 107,683.
What is the Ratio of Males per 100 Females in Yonkers?
There are 94.81 Males per 100 Females in Yonkers.
What is the Ratio of Females per 100 Males in Yonkers?
There are 105.47 Females per 100 Males in Yonkers.
What is the Median Population Age in Yonkers?
Median Population Age in Yonkers is 39.1 Years.
What is the Average Family Size in Yonkers
Average Family Size in Yonkers is 3.2 People.
What is the Average Household Size in Yonkers
Average Household Size in Yonkers is 2.5 People.
How Large is the Labor Force in Yonkers?
There are 109,518 People in the Labor Forcein in Yonkers.
What is the Percentage of People in the Labor Force in Yonkers?
63.8% of People are in the Labor Force in Yonkers.
What is the Unemployment Rate in Yonkers?
Unemployment Rate in Yonkers is 6.6%.