Peekskill, NY Map & Demographics
Peekskill Map
Peekskill Overview
$46,211
PER CAPITA INCOME
$108,756
AVG FAMILY INCOME
$86,695
AVG HOUSEHOLD INCOME
13.1%
WAGE / INCOME GAP [ % ]
86.9¢/ $1
WAGE / INCOME GAP [ $ ]
0.45
INEQUALITY / GINI INDEX
25,401
TOTAL POPULATION
12,180
MALE POPULATION
13,221
FEMALE POPULATION
92.13
MALES / 100 FEMALES
108.55
FEMALES / 100 MALES
41.2
MEDIAN AGE
3.0
AVG FAMILY SIZE
2.3
AVG HOUSEHOLD SIZE
14,857
LABOR FORCE [ PEOPLE ]
68.8%
PERCENT IN LABOR FORCE
9.2%
UNEMPLOYMENT RATE
Peekskill Zip Codes
Income in Peekskill
Income Overview in Peekskill
Per Capita Income in Peekskill is $46,211, while median incomes of families and households are $108,756 and $86,695 respectively.
| Characteristic | Number | Measure |
| Per Capita Income | 25,401 | $46,211 |
| Median Family Income | 6,410 | $108,756 |
| Mean Family Income | 6,410 | $130,515 |
| Median Household Income | 10,884 | $86,695 |
| Mean Household Income | 10,884 | $107,823 |
| Income Deficit | 6,410 | $0 |
| Wage / Income Gap (%) | 25,401 | 13.13% |
| Wage / Income Gap ($) | 25,401 | 86.87¢ per $1 |
| Gini / Inequality Index | 25,401 | 0.45 |
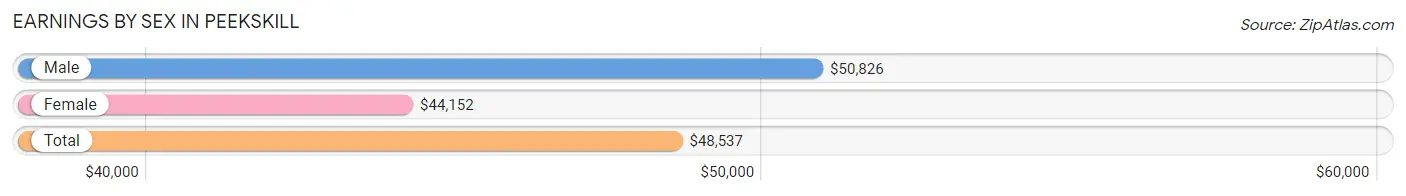
Earnings by Sex in Peekskill
Average Earnings in Peekskill are $48,537, $50,826 for men and $44,152 for women, a difference of 13.1%.
| Sex | Number | Average Earnings |
| Male | 7,328 (49.3%) | $50,826 |
| Female | 7,527 (50.7%) | $44,152 |
| Total | 14,855 (100.0%) | $48,537 |
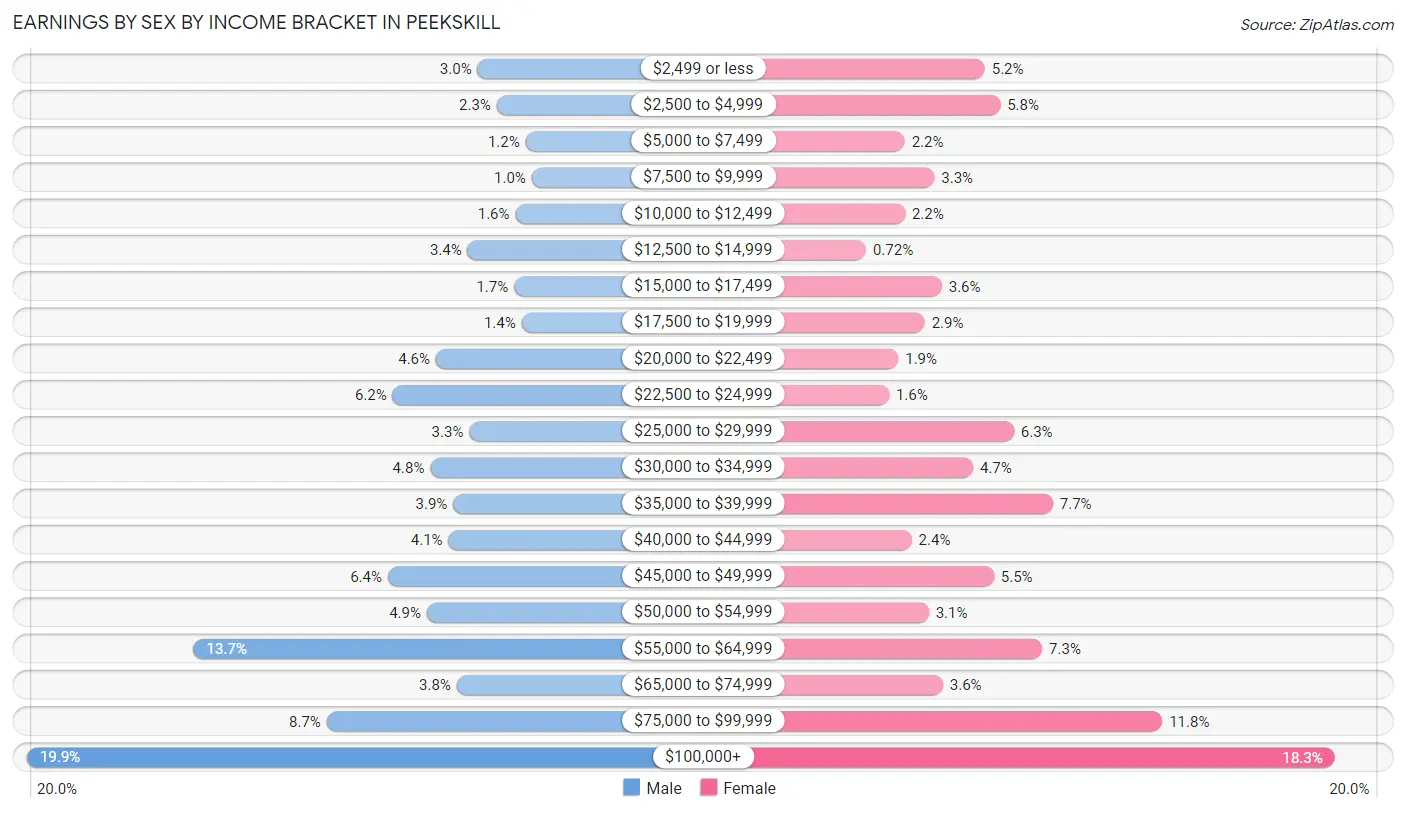
Earnings by Sex by Income Bracket in Peekskill
The most common earnings brackets in Peekskill are $100,000+ for men (1,459 | 19.9%) and $100,000+ for women (1,376 | 18.3%).
| Income | Male | Female |
| $2,499 or less | 222 (3.0%) | 389 (5.2%) |
| $2,500 to $4,999 | 169 (2.3%) | 433 (5.8%) |
| $5,000 to $7,499 | 90 (1.2%) | 163 (2.2%) |
| $7,500 to $9,999 | 73 (1.0%) | 247 (3.3%) |
| $10,000 to $12,499 | 118 (1.6%) | 164 (2.2%) |
| $12,500 to $14,999 | 249 (3.4%) | 54 (0.7%) |
| $15,000 to $17,499 | 122 (1.7%) | 268 (3.6%) |
| $17,500 to $19,999 | 101 (1.4%) | 220 (2.9%) |
| $20,000 to $22,499 | 336 (4.6%) | 145 (1.9%) |
| $22,500 to $24,999 | 455 (6.2%) | 119 (1.6%) |
| $25,000 to $29,999 | 245 (3.3%) | 471 (6.3%) |
| $30,000 to $34,999 | 352 (4.8%) | 356 (4.7%) |
| $35,000 to $39,999 | 289 (3.9%) | 581 (7.7%) |
| $40,000 to $44,999 | 302 (4.1%) | 183 (2.4%) |
| $45,000 to $49,999 | 468 (6.4%) | 415 (5.5%) |
| $50,000 to $54,999 | 361 (4.9%) | 231 (3.1%) |
| $55,000 to $64,999 | 1,002 (13.7%) | 551 (7.3%) |
| $65,000 to $74,999 | 279 (3.8%) | 271 (3.6%) |
| $75,000 to $99,999 | 636 (8.7%) | 890 (11.8%) |
| $100,000+ | 1,459 (19.9%) | 1,376 (18.3%) |
| Total | 7,328 (100.0%) | 7,527 (100.0%) |
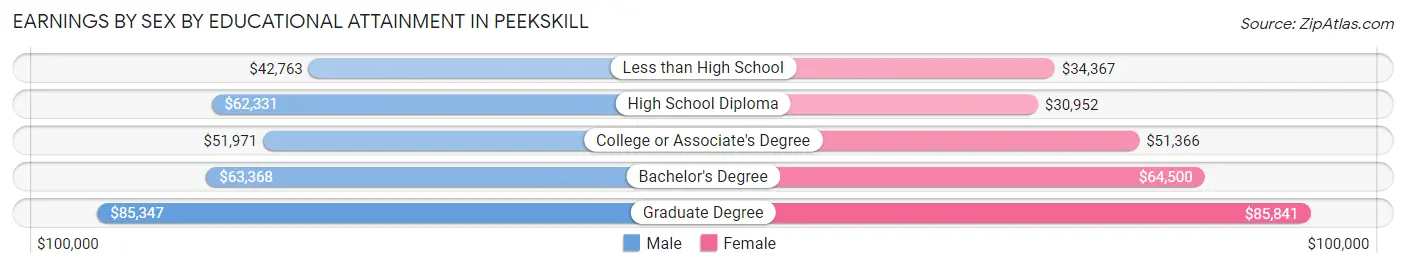
Earnings by Sex by Educational Attainment in Peekskill
Average earnings in Peekskill are $53,429 for men and $49,513 for women, a difference of 7.3%. Men with an educational attainment of graduate degree enjoy the highest average annual earnings of $85,347, while those with less than high school education earn the least with $42,763. Women with an educational attainment of graduate degree earn the most with the average annual earnings of $85,841, while those with high school diploma education have the smallest earnings of $30,952.
| Educational Attainment | Male Income | Female Income |
| Less than High School | $42,763 | $34,367 |
| High School Diploma | $62,331 | $30,952 |
| College or Associate's Degree | $51,971 | $51,366 |
| Bachelor's Degree | $63,368 | $64,500 |
| Graduate Degree | $85,347 | $85,841 |
| Total | $53,429 | $49,513 |
Family Income in Peekskill
Family Income Brackets in Peekskill
According to the Peekskill family income data, there are 1,782 families falling into the $100,000 to $149,999 income range, which is the most common income bracket and makes up 27.8% of all families. Conversely, the $10,000 to $14,999 income bracket is the least frequent group with only 19 families (0.3%) belonging to this category.
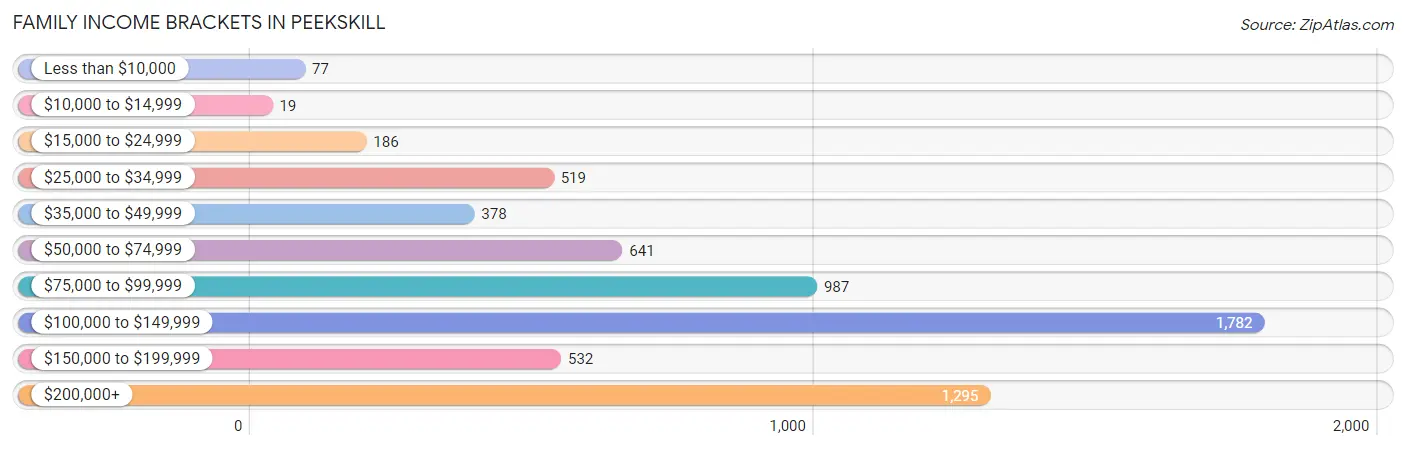
| Income Bracket | # Families | % Families |
| Less than $10,000 | 77 | 1.2% |
| $10,000 to $14,999 | 19 | 0.3% |
| $15,000 to $24,999 | 186 | 2.9% |
| $25,000 to $34,999 | 519 | 8.1% |
| $35,000 to $49,999 | 378 | 5.9% |
| $50,000 to $74,999 | 641 | 10.0% |
| $75,000 to $99,999 | 987 | 15.4% |
| $100,000 to $149,999 | 1,782 | 27.8% |
| $150,000 to $199,999 | 532 | 8.3% |
| $200,000+ | 1,295 | 20.2% |
Family Income by Famaliy Size in Peekskill
6-person families (170 | 2.6%) account for the highest median family income in Peekskill with $245,857 per family, while 2-person families (3,253 | 50.7%) have the highest median income of $51,044 per family member.
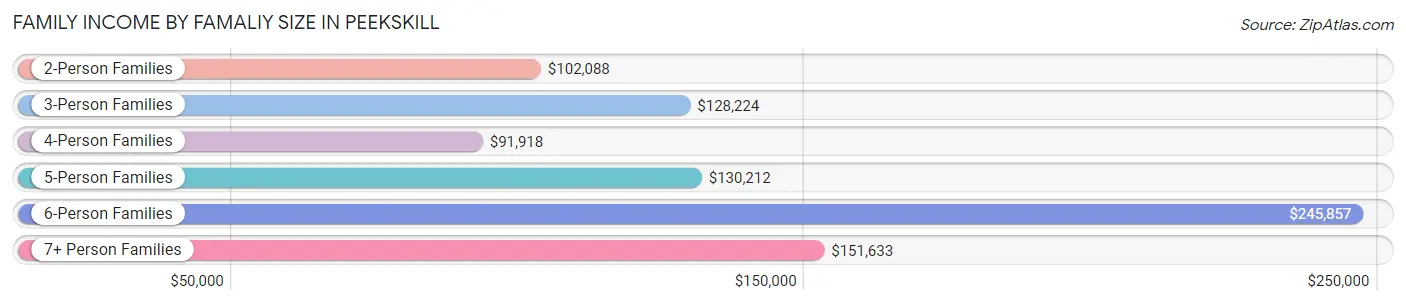
| Income Bracket | # Families | Median Income |
| 2-Person Families | 3,253 (50.7%) | $102,088 |
| 3-Person Families | 1,299 (20.3%) | $128,224 |
| 4-Person Families | 1,238 (19.3%) | $91,918 |
| 5-Person Families | 348 (5.4%) | $130,212 |
| 6-Person Families | 170 (2.6%) | $245,857 |
| 7+ Person Families | 102 (1.6%) | $151,633 |
| Total | 6,410 (100.0%) | $108,756 |
Family Income by Number of Earners in Peekskill
The median family income in Peekskill is $108,756, with families comprising 3+ earners (800) having the highest median family income of $176,932, while families with no earners (771) have the lowest median family income of $35,961, accounting for 12.5% and 12.0% of families, respectively.
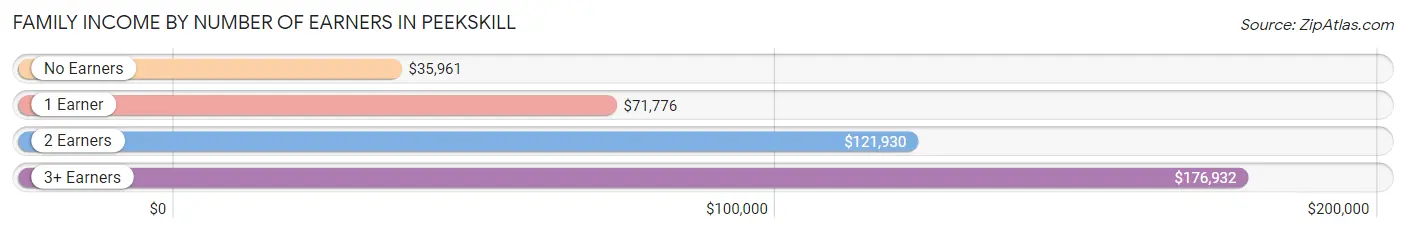
| Number of Earners | # Families | Median Income |
| No Earners | 771 (12.0%) | $35,961 |
| 1 Earner | 1,317 (20.5%) | $71,776 |
| 2 Earners | 3,522 (54.9%) | $121,930 |
| 3+ Earners | 800 (12.5%) | $176,932 |
| Total | 6,410 (100.0%) | $108,756 |
Household Income in Peekskill
Household Income Brackets in Peekskill
With 2,394 households falling in the category, the $100,000 to $149,999 income range is the most frequent in Peekskill, accounting for 22.0% of all households. In contrast, only 283 households (2.6%) fall into the $10,000 to $14,999 income bracket, making it the least populous group.
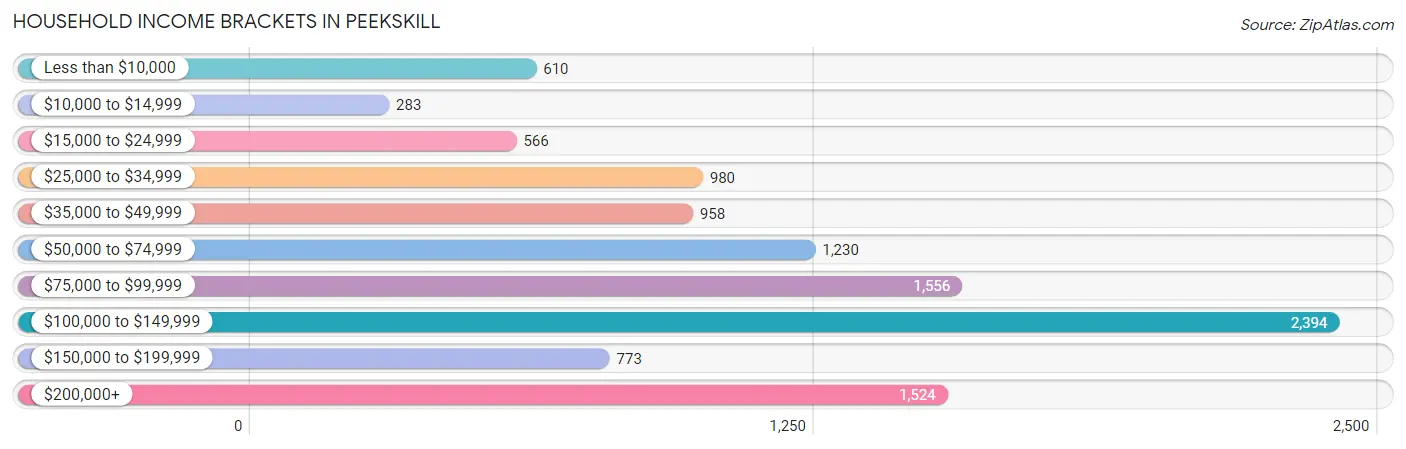
| Income Bracket | # Households | % Households |
| Less than $10,000 | 610 | 5.6% |
| $10,000 to $14,999 | 283 | 2.6% |
| $15,000 to $24,999 | 566 | 5.2% |
| $25,000 to $34,999 | 980 | 9.0% |
| $35,000 to $49,999 | 958 | 8.8% |
| $50,000 to $74,999 | 1,230 | 11.3% |
| $75,000 to $99,999 | 1,556 | 14.3% |
| $100,000 to $149,999 | 2,394 | 22.0% |
| $150,000 to $199,999 | 773 | 7.1% |
| $200,000+ | 1,524 | 14.0% |
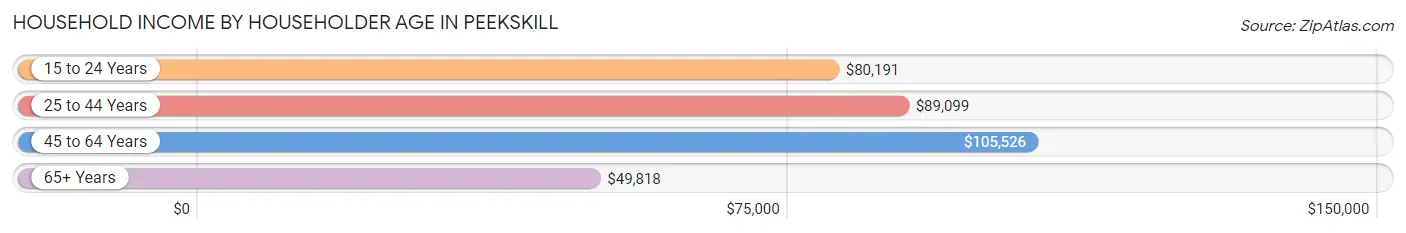
Household Income by Householder Age in Peekskill
The median household income in Peekskill is $86,695, with the highest median household income of $105,526 found in the 45 to 64 years age bracket for the primary householder. A total of 4,607 households (42.3%) fall into this category. Meanwhile, the 65+ years age bracket for the primary householder has the lowest median household income of $49,818, with 2,831 households (26.0%) in this group.
| Income Bracket | # Households | Median Income |
| 15 to 24 Years | 353 (3.2%) | $80,191 |
| 25 to 44 Years | 3,093 (28.4%) | $89,099 |
| 45 to 64 Years | 4,607 (42.3%) | $105,526 |
| 65+ Years | 2,831 (26.0%) | $49,818 |
| Total | 10,884 (100.0%) | $86,695 |
Poverty in Peekskill
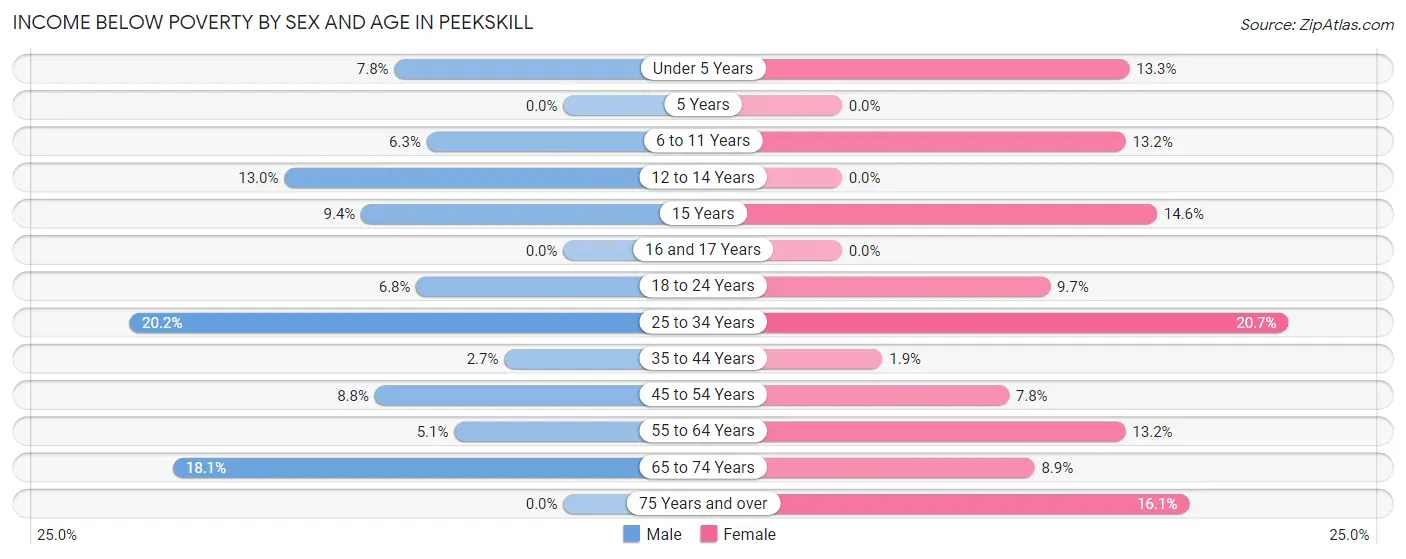
Income Below Poverty by Sex and Age in Peekskill
With 8.3% poverty level for males and 10.8% for females among the residents of Peekskill, 25 to 34 year old males and 25 to 34 year old females are the most vulnerable to poverty, with 325 males (20.2%) and 364 females (20.7%) in their respective age groups living below the poverty level.
| Age Bracket | Male | Female |
| Under 5 Years | 21 (7.8%) | 103 (13.3%) |
| 5 Years | 0 (0.0%) | 0 (0.0%) |
| 6 to 11 Years | 53 (6.3%) | 61 (13.2%) |
| 12 to 14 Years | 50 (13.0%) | 0 (0.0%) |
| 15 Years | 9 (9.4%) | 19 (14.6%) |
| 16 and 17 Years | 0 (0.0%) | 0 (0.0%) |
| 18 to 24 Years | 86 (6.8%) | 110 (9.7%) |
| 25 to 34 Years | 325 (20.2%) | 364 (20.7%) |
| 35 to 44 Years | 59 (2.7%) | 31 (1.9%) |
| 45 to 54 Years | 134 (8.7%) | 130 (7.7%) |
| 55 to 64 Years | 86 (5.1%) | 330 (13.2%) |
| 65 to 74 Years | 179 (18.1%) | 114 (8.9%) |
| 75 Years and over | 0 (0.0%) | 157 (16.1%) |
| Total | 1,002 (8.3%) | 1,419 (10.8%) |
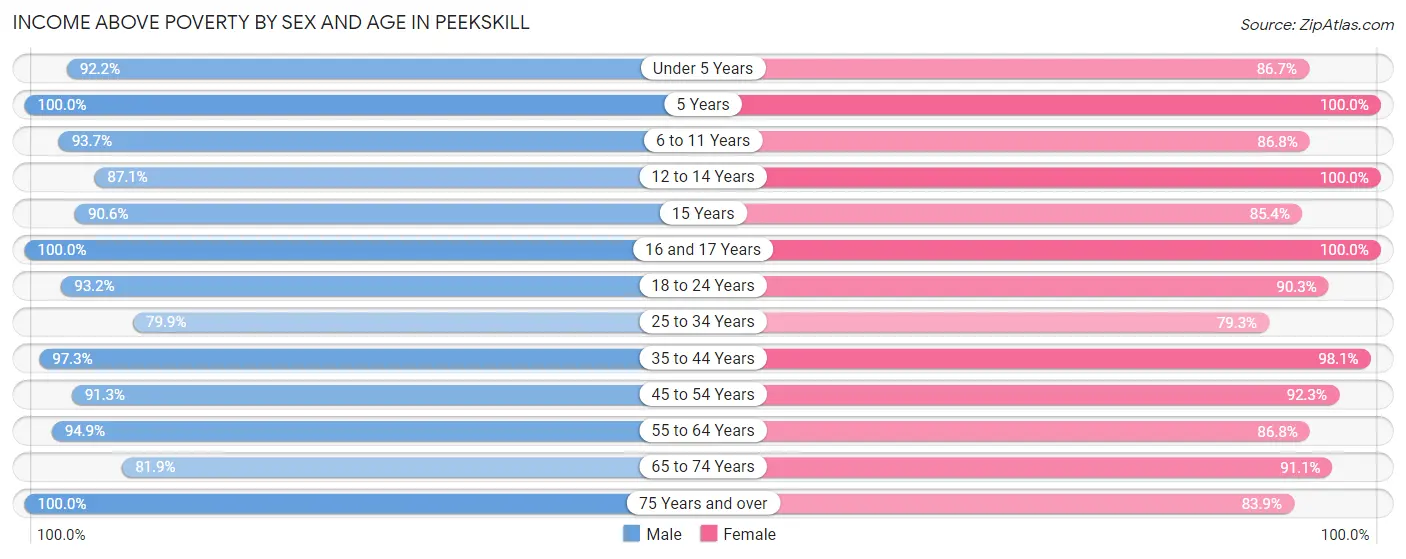
Income Above Poverty by Sex and Age in Peekskill
According to the poverty statistics in Peekskill, males aged 5 years and females aged 5 years are the age groups that are most secure financially, with 100.0% of males and 100.0% of females in these age groups living above the poverty line.
| Age Bracket | Male | Female |
| Under 5 Years | 247 (92.2%) | 669 (86.7%) |
| 5 Years | 191 (100.0%) | 79 (100.0%) |
| 6 to 11 Years | 783 (93.7%) | 402 (86.8%) |
| 12 to 14 Years | 336 (87.1%) | 529 (100.0%) |
| 15 Years | 87 (90.6%) | 111 (85.4%) |
| 16 and 17 Years | 199 (100.0%) | 224 (100.0%) |
| 18 to 24 Years | 1,175 (93.2%) | 1,029 (90.3%) |
| 25 to 34 Years | 1,288 (79.8%) | 1,393 (79.3%) |
| 35 to 44 Years | 2,092 (97.3%) | 1,615 (98.1%) |
| 45 to 54 Years | 1,397 (91.2%) | 1,547 (92.2%) |
| 55 to 64 Years | 1,615 (94.9%) | 2,177 (86.8%) |
| 65 to 74 Years | 809 (81.9%) | 1,161 (91.1%) |
| 75 Years and over | 874 (100.0%) | 817 (83.9%) |
| Total | 11,093 (91.7%) | 11,753 (89.2%) |
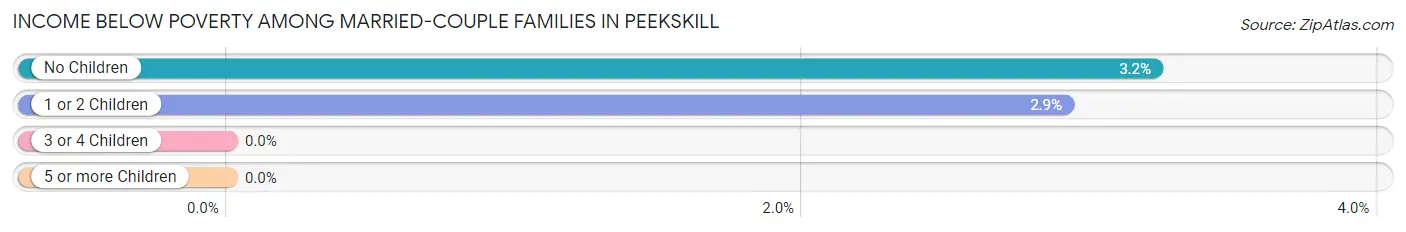
Income Below Poverty Among Married-Couple Families in Peekskill
The poverty statistics for married-couple families in Peekskill show that 3.0% or 132 of the total 4,366 families live below the poverty line. Families with no children have the highest poverty rate of 3.2%, comprising of 84 families. On the other hand, families with 3 or 4 children have the lowest poverty rate of 0.0%, which includes 0 families.
| Children | Above Poverty | Below Poverty |
| No Children | 2,521 (96.8%) | 84 (3.2%) |
| 1 or 2 Children | 1,600 (97.1%) | 48 (2.9%) |
| 3 or 4 Children | 113 (100.0%) | 0 (0.0%) |
| 5 or more Children | 0 (0.0%) | 0 (0.0%) |
| Total | 4,234 (97.0%) | 132 (3.0%) |
Income Below Poverty Among Single-Parent Households in Peekskill
According to the poverty data in Peekskill, 5.6% or 29 single-father households and 8.6% or 131 single-mother households are living below the poverty line. Among single-father households, those with 1 or 2 children have the highest poverty rate, with 29 households (24.6%) experiencing poverty. Likewise, among single-mother households, those with 3 or 4 children have the highest poverty rate, with 45 households (76.3%) falling below the poverty line.
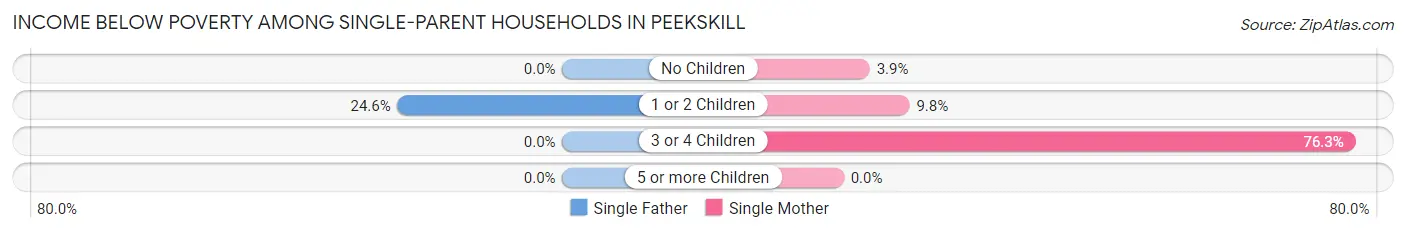
| Children | Single Father | Single Mother |
| No Children | 0 (0.0%) | 38 (3.9%) |
| 1 or 2 Children | 29 (24.6%) | 48 (9.8%) |
| 3 or 4 Children | 0 (0.0%) | 45 (76.3%) |
| 5 or more Children | 0 (0.0%) | 0 (0.0%) |
| Total | 29 (5.6%) | 131 (8.6%) |
Income Below Poverty Among Married-Couple vs Single-Parent Households in Peekskill
The poverty data for Peekskill shows that 132 of the married-couple family households (3.0%) and 160 of the single-parent households (7.8%) are living below the poverty level. Within the married-couple family households, those with no children have the highest poverty rate, with 84 households (3.2%) falling below the poverty line. Among the single-parent households, those with 3 or 4 children have the highest poverty rate, with 45 household (55.6%) living below poverty.
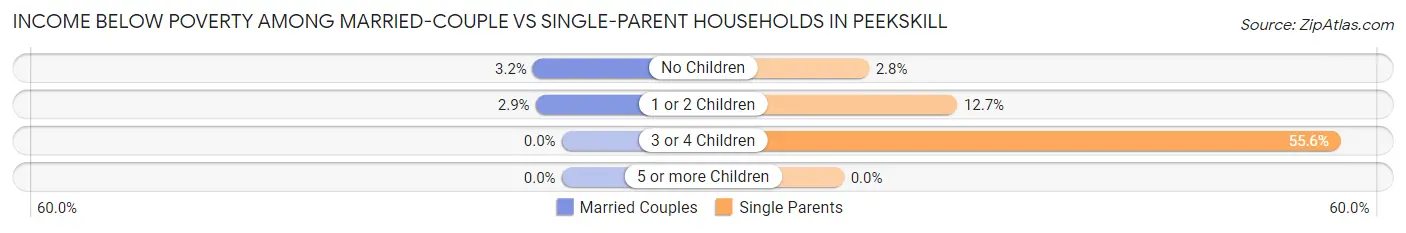
| Children | Married-Couple Families | Single-Parent Households |
| No Children | 84 (3.2%) | 38 (2.8%) |
| 1 or 2 Children | 48 (2.9%) | 77 (12.7%) |
| 3 or 4 Children | 0 (0.0%) | 45 (55.6%) |
| 5 or more Children | 0 (0.0%) | 0 (0.0%) |
| Total | 132 (3.0%) | 160 (7.8%) |
Race in Peekskill
The most populous races in Peekskill are White / Caucasian (10,965 | 43.2%), Hispanic or Latino (10,478 | 41.2%), and Some other Race (5,353 | 21.1%).
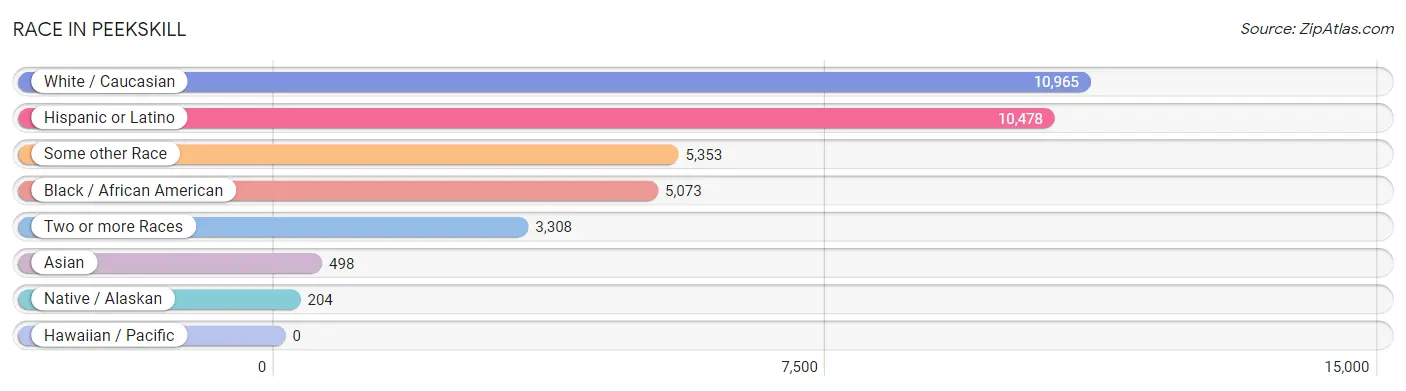
| Race | # Population | % Population |
| Asian | 498 | 2.0% |
| Black / African American | 5,073 | 20.0% |
| Hawaiian / Pacific | 0 | 0.0% |
| Hispanic or Latino | 10,478 | 41.2% |
| Native / Alaskan | 204 | 0.8% |
| White / Caucasian | 10,965 | 43.2% |
| Two or more Races | 3,308 | 13.0% |
| Some other Race | 5,353 | 21.1% |
| Total | 25,401 | 100.0% |
Ancestry in Peekskill
The most populous ancestries reported in Peekskill are South American (4,054 | 16.0%), Ecuadorian (3,527 | 13.9%), Italian (3,113 | 12.3%), Irish (2,672 | 10.5%), and Puerto Rican (1,922 | 7.6%), together accounting for 60.2% of all Peekskill residents.
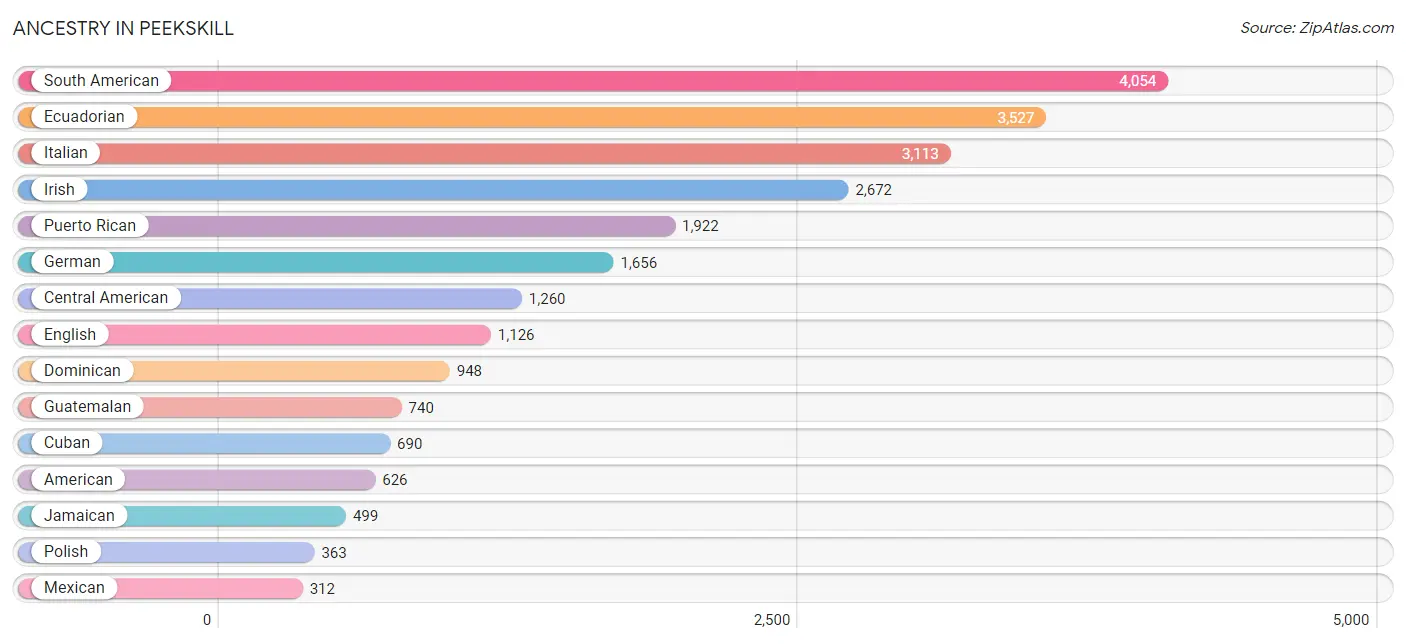
| Ancestry | # Population | % Population |
| African | 113 | 0.4% |
| American | 626 | 2.5% |
| Argentinean | 47 | 0.2% |
| Austrian | 40 | 0.2% |
| Barbadian | 25 | 0.1% |
| Belgian | 16 | 0.1% |
| Bhutanese | 20 | 0.1% |
| Blackfeet | 78 | 0.3% |
| Bolivian | 125 | 0.5% |
| Brazilian | 47 | 0.2% |
| British | 10 | 0.0% |
| British West Indian | 243 | 1.0% |
| Bulgarian | 10 | 0.0% |
| Burmese | 84 | 0.3% |
| Central American | 1,260 | 5.0% |
| Central American Indian | 70 | 0.3% |
| Chilean | 25 | 0.1% |
| Colombian | 85 | 0.3% |
| Cuban | 690 | 2.7% |
| Czech | 15 | 0.1% |
| Danish | 14 | 0.1% |
| Dominican | 948 | 3.7% |
| Dutch | 42 | 0.2% |
| Dutch West Indian | 73 | 0.3% |
| Eastern European | 83 | 0.3% |
| Ecuadorian | 3,527 | 13.9% |
| English | 1,126 | 4.4% |
| Estonian | 30 | 0.1% |
| European | 218 | 0.9% |
| French | 284 | 1.1% |
| French Canadian | 96 | 0.4% |
| German | 1,656 | 6.5% |
| Greek | 34 | 0.1% |
| Guatemalan | 740 | 2.9% |
| Guyanese | 145 | 0.6% |
| Haitian | 249 | 1.0% |
| Honduran | 260 | 1.0% |
| Hungarian | 251 | 1.0% |
| Indian (Asian) | 113 | 0.4% |
| Irish | 2,672 | 10.5% |
| Iroquois | 18 | 0.1% |
| Israeli | 17 | 0.1% |
| Italian | 3,113 | 12.3% |
| Jamaican | 499 | 2.0% |
| Korean | 170 | 0.7% |
| Macedonian | 90 | 0.4% |
| Malaysian | 16 | 0.1% |
| Mexican | 312 | 1.2% |
| Nigerian | 63 | 0.3% |
| Northern European | 89 | 0.4% |
| Norwegian | 217 | 0.9% |
| Panamanian | 74 | 0.3% |
| Peruvian | 245 | 1.0% |
| Polish | 363 | 1.4% |
| Portuguese | 234 | 0.9% |
| Puerto Rican | 1,922 | 7.6% |
| Russian | 70 | 0.3% |
| Salvadoran | 186 | 0.7% |
| Scotch-Irish | 52 | 0.2% |
| Scottish | 166 | 0.6% |
| Slavic | 19 | 0.1% |
| Slovak | 77 | 0.3% |
| South American | 4,054 | 16.0% |
| South American Indian | 150 | 0.6% |
| Spaniard | 194 | 0.8% |
| Spanish | 286 | 1.1% |
| Sri Lankan | 17 | 0.1% |
| Subsaharan African | 176 | 0.7% |
| Swedish | 17 | 0.1% |
| Swiss | 34 | 0.1% |
| Trinidadian and Tobagonian | 20 | 0.1% |
| Ukrainian | 132 | 0.5% |
| Welsh | 31 | 0.1% |
| West Indian | 249 | 1.0% | View All 74 Rows |
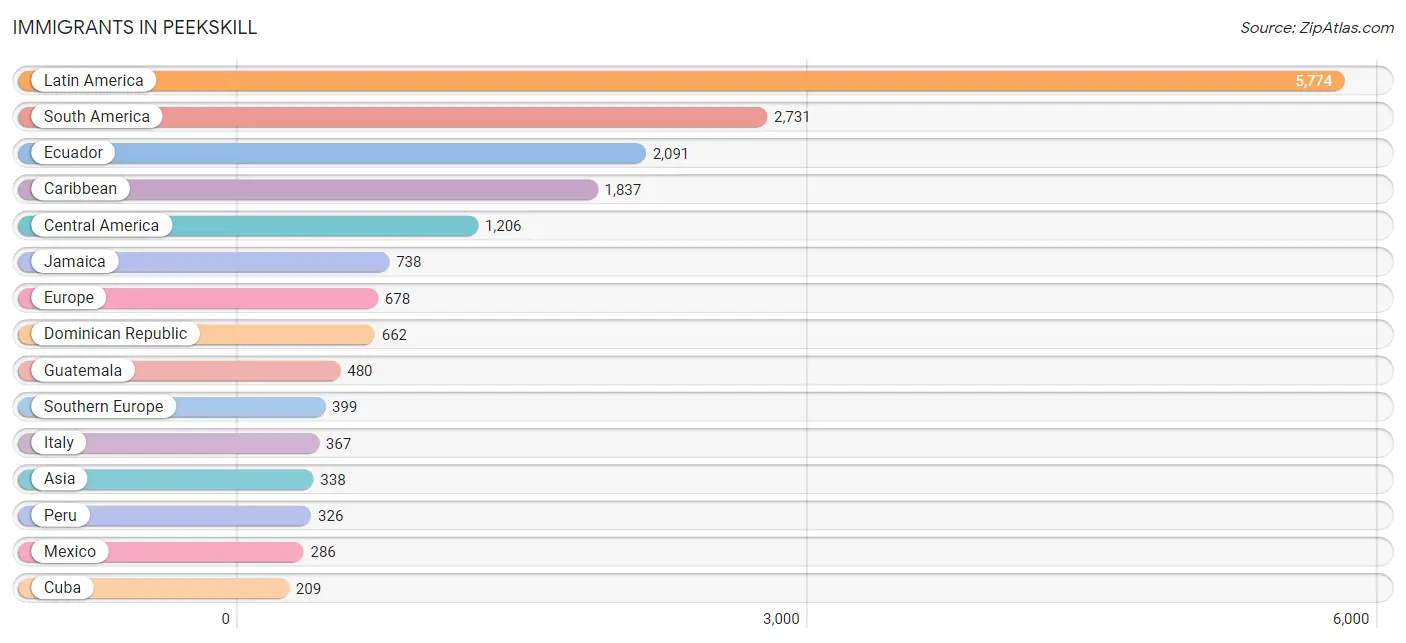
Immigrants in Peekskill
The most numerous immigrant groups reported in Peekskill came from Latin America (5,774 | 22.7%), South America (2,731 | 10.7%), Ecuador (2,091 | 8.2%), Caribbean (1,837 | 7.2%), and Central America (1,206 | 4.8%), together accounting for 53.7% of all Peekskill residents.
| Immigration Origin | # Population | % Population |
| Africa | 63 | 0.3% |
| Argentina | 40 | 0.2% |
| Asia | 338 | 1.3% |
| Belarus | 38 | 0.2% |
| Bolivia | 16 | 0.1% |
| Brazil | 47 | 0.2% |
| Bulgaria | 10 | 0.0% |
| Caribbean | 1,837 | 7.2% |
| Central America | 1,206 | 4.8% |
| Chile | 34 | 0.1% |
| China | 35 | 0.1% |
| Colombia | 29 | 0.1% |
| Costa Rica | 33 | 0.1% |
| Cuba | 209 | 0.8% |
| Dominican Republic | 662 | 2.6% |
| Eastern Asia | 51 | 0.2% |
| Eastern Europe | 176 | 0.7% |
| Ecuador | 2,091 | 8.2% |
| El Salvador | 166 | 0.6% |
| England | 15 | 0.1% |
| Europe | 678 | 2.7% |
| France | 32 | 0.1% |
| Germany | 23 | 0.1% |
| Guatemala | 480 | 1.9% |
| Guyana | 140 | 0.5% |
| Haiti | 92 | 0.4% |
| Honduras | 182 | 0.7% |
| Hong Kong | 2 | 0.0% |
| Hungary | 47 | 0.2% |
| Israel | 17 | 0.1% |
| Italy | 367 | 1.4% |
| Jamaica | 738 | 2.9% |
| Korea | 16 | 0.1% |
| Latin America | 5,774 | 22.7% |
| Mexico | 286 | 1.1% |
| Nigeria | 63 | 0.3% |
| Northern Europe | 25 | 0.1% |
| Pakistan | 10 | 0.0% |
| Panama | 59 | 0.2% |
| Peru | 326 | 1.3% |
| Philippines | 125 | 0.5% |
| Portugal | 14 | 0.1% |
| South America | 2,731 | 10.7% |
| South Central Asia | 85 | 0.3% |
| South Eastern Asia | 157 | 0.6% |
| Southern Europe | 399 | 1.6% |
| Spain | 18 | 0.1% |
| Switzerland | 23 | 0.1% |
| Thailand | 9 | 0.0% |
| Trinidad and Tobago | 80 | 0.3% |
| Uzbekistan | 75 | 0.3% |
| Vietnam | 23 | 0.1% |
| West Indies | 56 | 0.2% |
| Western Africa | 63 | 0.3% |
| Western Asia | 17 | 0.1% |
| Western Europe | 78 | 0.3% | View All 56 Rows |
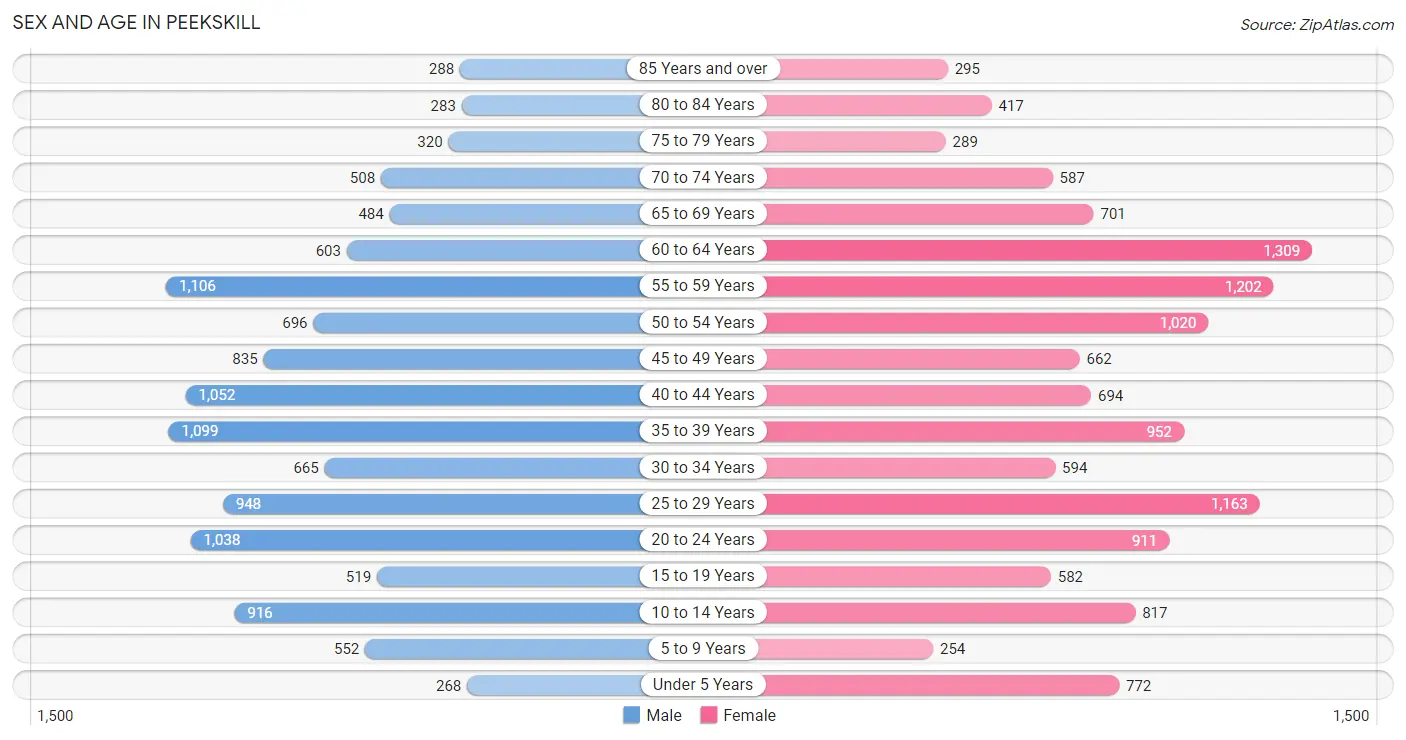
Sex and Age in Peekskill
Sex and Age in Peekskill
The most populous age groups in Peekskill are 55 to 59 Years (1,106 | 9.1%) for men and 60 to 64 Years (1,309 | 9.9%) for women.
| Age Bracket | Male | Female |
| Under 5 Years | 268 (2.2%) | 772 (5.8%) |
| 5 to 9 Years | 552 (4.5%) | 254 (1.9%) |
| 10 to 14 Years | 916 (7.5%) | 817 (6.2%) |
| 15 to 19 Years | 519 (4.3%) | 582 (4.4%) |
| 20 to 24 Years | 1,038 (8.5%) | 911 (6.9%) |
| 25 to 29 Years | 948 (7.8%) | 1,163 (8.8%) |
| 30 to 34 Years | 665 (5.5%) | 594 (4.5%) |
| 35 to 39 Years | 1,099 (9.0%) | 952 (7.2%) |
| 40 to 44 Years | 1,052 (8.6%) | 694 (5.2%) |
| 45 to 49 Years | 835 (6.9%) | 662 (5.0%) |
| 50 to 54 Years | 696 (5.7%) | 1,020 (7.7%) |
| 55 to 59 Years | 1,106 (9.1%) | 1,202 (9.1%) |
| 60 to 64 Years | 603 (5.0%) | 1,309 (9.9%) |
| 65 to 69 Years | 484 (4.0%) | 701 (5.3%) |
| 70 to 74 Years | 508 (4.2%) | 587 (4.4%) |
| 75 to 79 Years | 320 (2.6%) | 289 (2.2%) |
| 80 to 84 Years | 283 (2.3%) | 417 (3.2%) |
| 85 Years and over | 288 (2.4%) | 295 (2.2%) |
| Total | 12,180 (100.0%) | 13,221 (100.0%) |
Families and Households in Peekskill
Median Family Size in Peekskill
The median family size in Peekskill is 2.97 persons per family, with single male/father families (515 | 8.0%) accounting for the largest median family size of 3.08 persons per family. On the other hand, single female/mother families (1,529 | 23.8%) represent the smallest median family size with 2.70 persons per family.
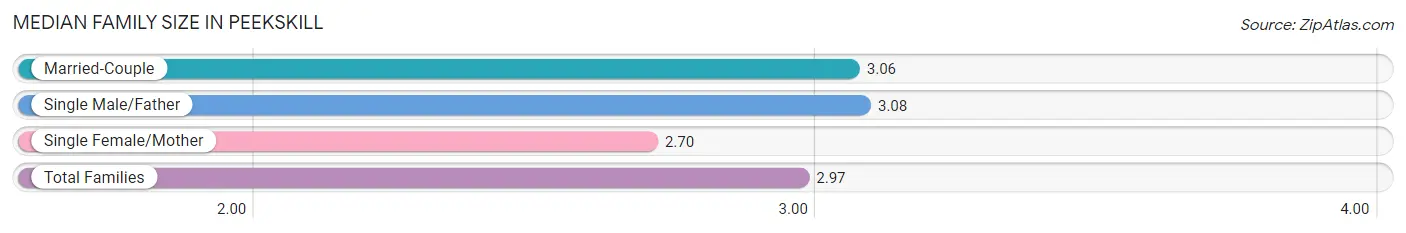
| Family Type | # Families | Family Size |
| Married-Couple | 4,366 (68.1%) | 3.06 |
| Single Male/Father | 515 (8.0%) | 3.08 |
| Single Female/Mother | 1,529 (23.8%) | 2.70 |
| Total Families | 6,410 (100.0%) | 2.97 |
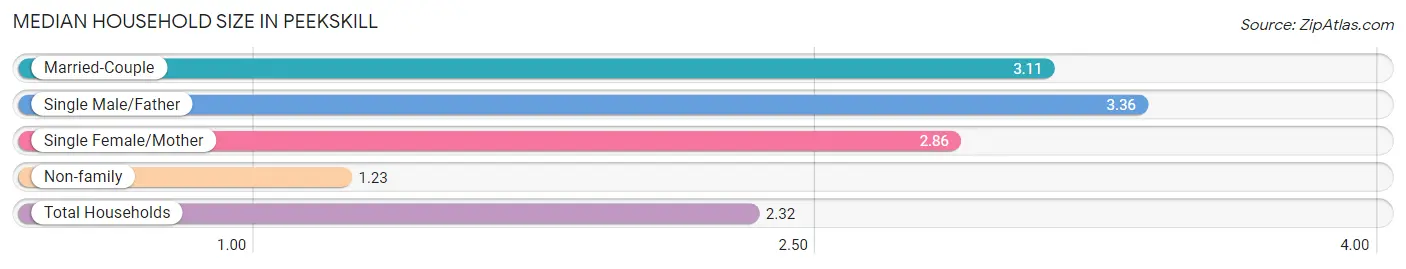
Median Household Size in Peekskill
The median household size in Peekskill is 2.32 persons per household, with single male/father households (515 | 4.7%) accounting for the largest median household size of 3.36 persons per household. non-family households (4,474 | 41.1%) represent the smallest median household size with 1.23 persons per household.
| Household Type | # Households | Household Size |
| Married-Couple | 4,366 (40.1%) | 3.11 |
| Single Male/Father | 515 (4.7%) | 3.36 |
| Single Female/Mother | 1,529 (14.1%) | 2.86 |
| Non-family | 4,474 (41.1%) | 1.23 |
| Total Households | 10,884 (100.0%) | 2.32 |
Household Size by Marriage Status in Peekskill
Out of a total of 10,884 households in Peekskill, 6,410 (58.9%) are family households, while 4,474 (41.1%) are nonfamily households. The most numerous type of family households are 2-person households, comprising 3,007, and the most common type of nonfamily households are 1-person households, comprising 3,705.
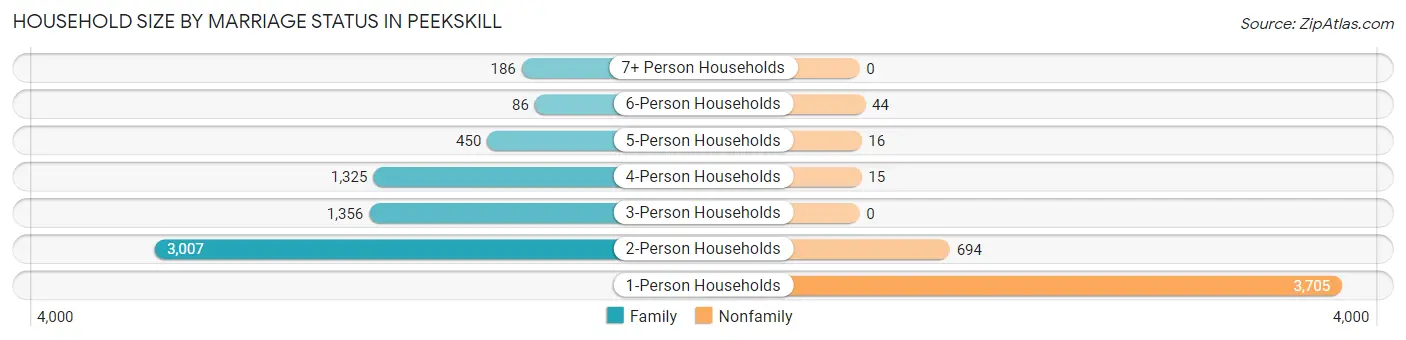
| Household Size | Family Households | Nonfamily Households |
| 1-Person Households | - | 3,705 (34.0%) |
| 2-Person Households | 3,007 (27.6%) | 694 (6.4%) |
| 3-Person Households | 1,356 (12.5%) | 0 (0.0%) |
| 4-Person Households | 1,325 (12.2%) | 15 (0.1%) |
| 5-Person Households | 450 (4.1%) | 16 (0.2%) |
| 6-Person Households | 86 (0.8%) | 44 (0.4%) |
| 7+ Person Households | 186 (1.7%) | 0 (0.0%) |
| Total | 6,410 (58.9%) | 4,474 (41.1%) |
Female Fertility in Peekskill
Fertility by Age in Peekskill
Average fertility rate in Peekskill is 38.0 births per 1,000 women. Women in the age bracket of 20 to 34 years have the highest fertility rate with 43.0 births per 1,000 women. Women in the age bracket of 20 to 34 years acount for 53.7% of all women with births.
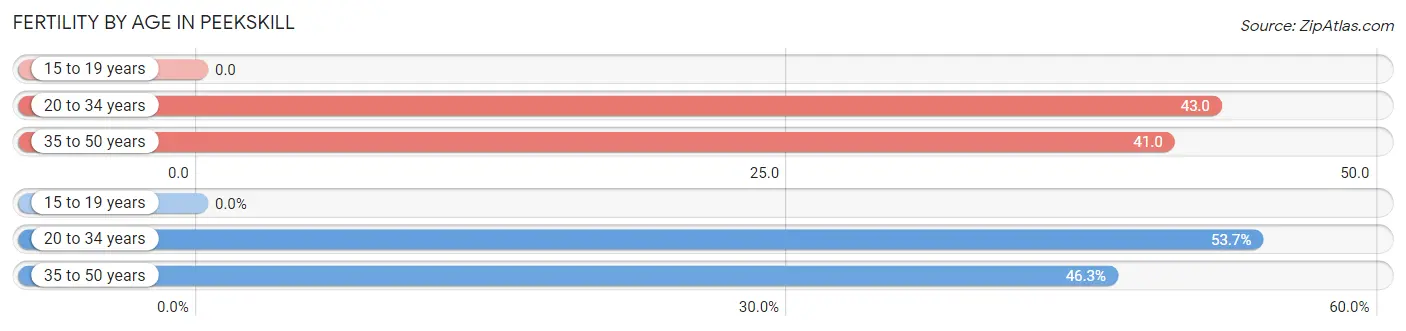
| Age Bracket | Women with Births | Births / 1,000 Women |
| 15 to 19 years | 0 (0.0%) | 0.0 |
| 20 to 34 years | 116 (53.7%) | 43.0 |
| 35 to 50 years | 100 (46.3%) | 41.0 |
| Total | 216 (100.0%) | 38.0 |
Fertility by Age by Marriage Status in Peekskill
84.3% of women with births (216) in Peekskill are married. The highest percentage of unmarried women with births falls into 20 to 34 years age bracket with 29.3% of them unmarried at the time of birth, while the lowest percentage of unmarried women with births belong to 35 to 50 years age bracket with 0.0% of them unmarried.
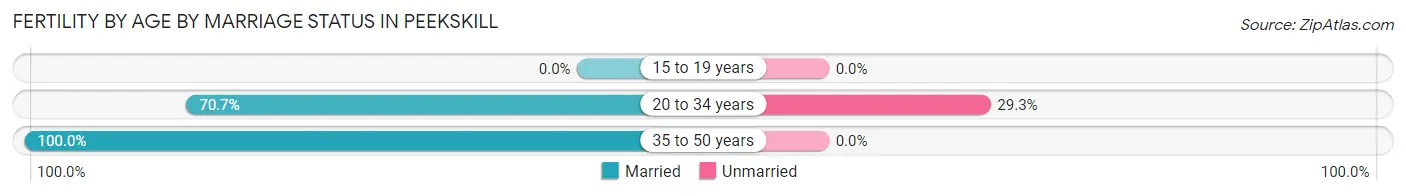
| Age Bracket | Married | Unmarried |
| 15 to 19 years | 0 (0.0%) | 0 (0.0%) |
| 20 to 34 years | 82 (70.7%) | 34 (29.3%) |
| 35 to 50 years | 100 (100.0%) | 0 (0.0%) |
| Total | 182 (84.3%) | 34 (15.7%) |
Fertility by Education in Peekskill
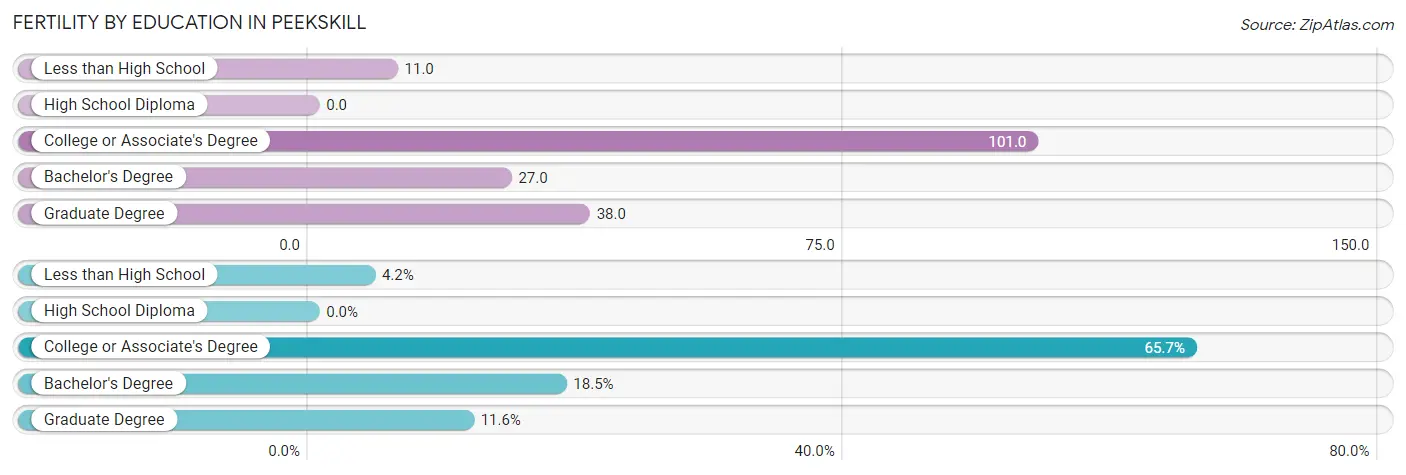
| Educational Attainment | Women with Births | Births / 1,000 Women |
| Less than High School | 9 (4.2%) | 11.0 |
| High School Diploma | 0 (0.0%) | 0.0 |
| College or Associate's Degree | 142 (65.7%) | 101.0 |
| Bachelor's Degree | 40 (18.5%) | 27.0 |
| Graduate Degree | 25 (11.6%) | 38.0 |
| Total | 216 (100.0%) | 38.0 |
Fertility by Education by Marriage Status in Peekskill
15.7% of women with births in Peekskill are unmarried. Women with the educational attainment of less than high school are most likely to be married with 100.0% of them married at childbirth, while women with the educational attainment of college or associate's degree are least likely to be married with 23.9% of them unmarried at childbirth.
| Educational Attainment | Married | Unmarried |
| Less than High School | 9 (100.0%) | 0 (0.0%) |
| High School Diploma | 0 (0.0%) | 0 (0.0%) |
| College or Associate's Degree | 108 (76.1%) | 34 (23.9%) |
| Bachelor's Degree | 40 (100.0%) | 0 (0.0%) |
| Graduate Degree | 25 (100.0%) | 0 (0.0%) |
| Total | 182 (84.3%) | 34 (15.7%) |
Employment Characteristics in Peekskill
Employment by Class of Employer in Peekskill
Among the 13,185 employed individuals in Peekskill, private company employees (8,265 | 62.7%), not-for-profit organizations (1,803 | 13.7%), and local government employees (1,435 | 10.9%) make up the most common classes of employment.
| Employer Class | # Employees | % Employees |
| Private Company Employees | 8,265 | 62.7% |
| Self-Employed (Incorporated) | 484 | 3.7% |
| Self-Employed (Not Incorporated) | 582 | 4.4% |
| Not-for-profit Organizations | 1,803 | 13.7% |
| Local Government Employees | 1,435 | 10.9% |
| State Government Employees | 351 | 2.7% |
| Federal Government Employees | 251 | 1.9% |
| Unpaid Family Workers | 14 | 0.1% |
| Total | 13,185 | 100.0% |
Employment Status by Age in Peekskill
According to the labor force statistics for Peekskill, out of the total population over 16 years of age (21,595), 68.8% or 14,857 individuals are in the labor force, with 9.2% or 1,367 of them unemployed. The age group with the highest labor force participation rate is 35 to 44 years, with 96.2% or 3,653 individuals in the labor force. Within the labor force, the 16 to 19 years age range has the highest percentage of unemployed individuals, with 38.0% or 57 of them being unemployed.
| Age Bracket | In Labor Force | Unemployed |
| 16 to 19 Years | 150 (17.2%) | 57 (38.0%) |
| 20 to 24 Years | 1,546 (79.3%) | 263 (17.0%) |
| 25 to 29 Years | 1,763 (83.5%) | 106 (6.0%) |
| 30 to 34 Years | 1,078 (85.6%) | 165 (15.3%) |
| 35 to 44 Years | 3,653 (96.2%) | 311 (8.5%) |
| 45 to 54 Years | 2,683 (83.5%) | 148 (5.5%) |
| 55 to 59 Years | 1,823 (79.0%) | 78 (4.3%) |
| 60 to 64 Years | 1,153 (60.3%) | 199 (17.3%) |
| 65 to 74 Years | 711 (31.2%) | 38 (5.3%) |
| 75 Years and over | 303 (16.0%) | 0 (0.0%) |
| Total | 14,857 (68.8%) | 1,367 (9.2%) |
Employment Status by Educational Attainment in Peekskill
According to labor force statistics for Peekskill, 83.2% of individuals (12,147) out of the total population between 25 and 64 years of age (14,600) are in the labor force, with 8.3% or 1,008 of them being unemployed. The group with the highest labor force participation rate are those with the educational attainment of bachelor's degree or higher, with 86.7% or 4,849 individuals in the labor force. Within the labor force, individuals with high school diploma education have the highest percentage of unemployment, with 16.9% or 400 of them being unemployed.
| Educational Attainment | In Labor Force | Unemployed |
| Less than High School | 1,473 (78.2%) | 77 (4.1%) |
| High School Diploma | 2,369 (80.7%) | 496 (16.9%) |
| College / Associate Degree | 3,459 (82.6%) | 360 (8.6%) |
| Bachelor's Degree or higher | 4,849 (86.7%) | 285 (5.1%) |
| Total | 12,147 (83.2%) | 1,212 (8.3%) |
Employment Occupations by Sex in Peekskill
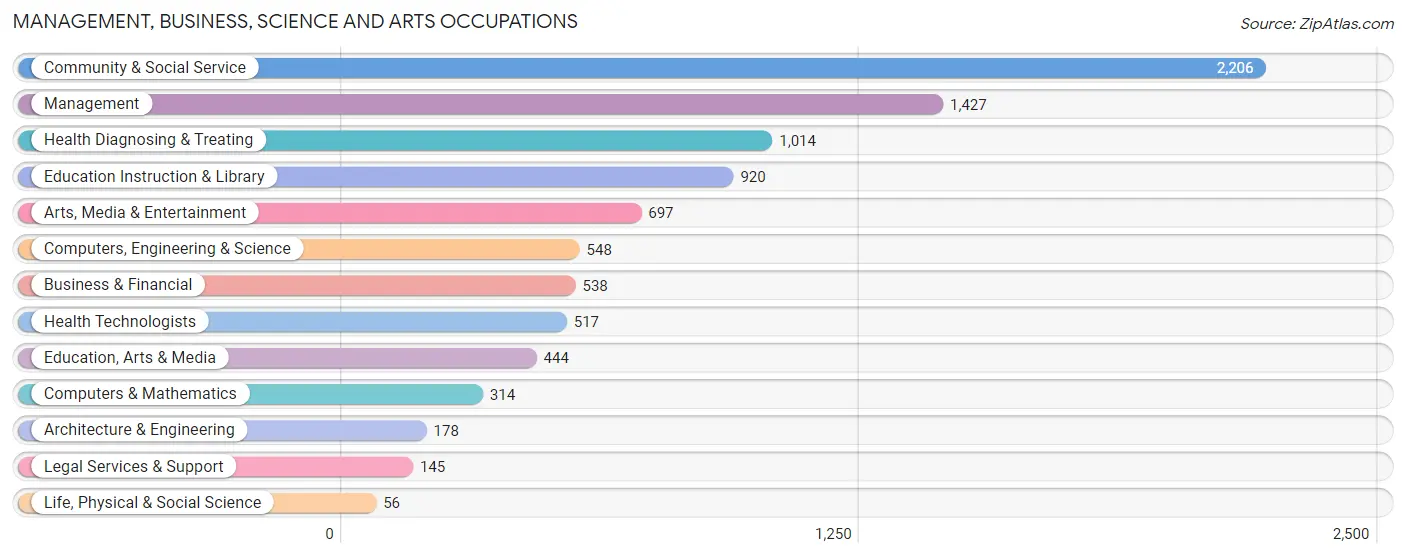
Management, Business, Science and Arts Occupations
The most common Management, Business, Science and Arts occupations in Peekskill are Community & Social Service (2,206 | 16.5%), Management (1,427 | 10.6%), Health Diagnosing & Treating (1,014 | 7.6%), Education Instruction & Library (920 | 6.9%), and Arts, Media & Entertainment (697 | 5.2%).
Management, Business, Science and Arts Occupations by Sex
Within the Management, Business, Science and Arts occupations in Peekskill, the most male-oriented occupations are Architecture & Engineering (100.0%), Legal Services & Support (81.4%), and Computers, Engineering & Science (79.9%), while the most female-oriented occupations are Education, Arts & Media (85.8%), Education Instruction & Library (83.3%), and Health Diagnosing & Treating (79.4%).
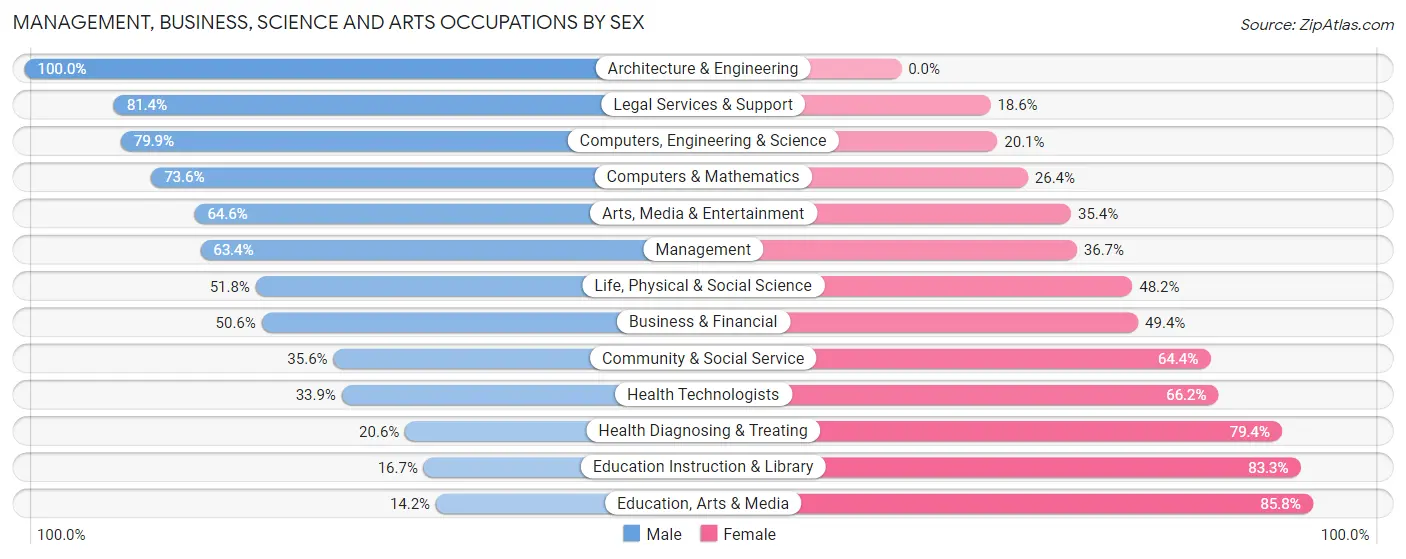
| Occupation | Male | Female |
| Management | 904 (63.3%) | 523 (36.6%) |
| Business & Financial | 272 (50.6%) | 266 (49.4%) |
| Computers, Engineering & Science | 438 (79.9%) | 110 (20.1%) |
| Computers & Mathematics | 231 (73.6%) | 83 (26.4%) |
| Architecture & Engineering | 178 (100.0%) | 0 (0.0%) |
| Life, Physical & Social Science | 29 (51.8%) | 27 (48.2%) |
| Community & Social Service | 785 (35.6%) | 1,421 (64.4%) |
| Education, Arts & Media | 63 (14.2%) | 381 (85.8%) |
| Legal Services & Support | 118 (81.4%) | 27 (18.6%) |
| Education Instruction & Library | 154 (16.7%) | 766 (83.3%) |
| Arts, Media & Entertainment | 450 (64.6%) | 247 (35.4%) |
| Health Diagnosing & Treating | 209 (20.6%) | 805 (79.4%) |
| Health Technologists | 175 (33.9%) | 342 (66.1%) |
| Total (Category) | 2,608 (45.5%) | 3,125 (54.5%) |
| Total (Overall) | 6,673 (49.8%) | 6,721 (50.2%) |
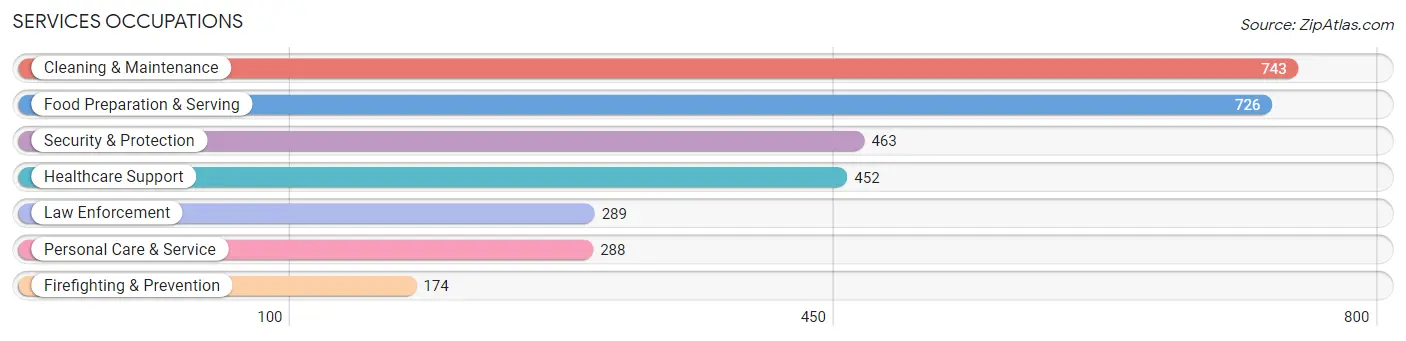
Services Occupations
The most common Services occupations in Peekskill are Cleaning & Maintenance (743 | 5.6%), Food Preparation & Serving (726 | 5.4%), Security & Protection (463 | 3.5%), Healthcare Support (452 | 3.4%), and Law Enforcement (289 | 2.2%).
Services Occupations by Sex
Within the Services occupations in Peekskill, the most male-oriented occupations are Law Enforcement (77.2%), Security & Protection (76.2%), and Firefighting & Prevention (74.7%), while the most female-oriented occupations are Personal Care & Service (93.4%), Healthcare Support (83.2%), and Food Preparation & Serving (53.4%).
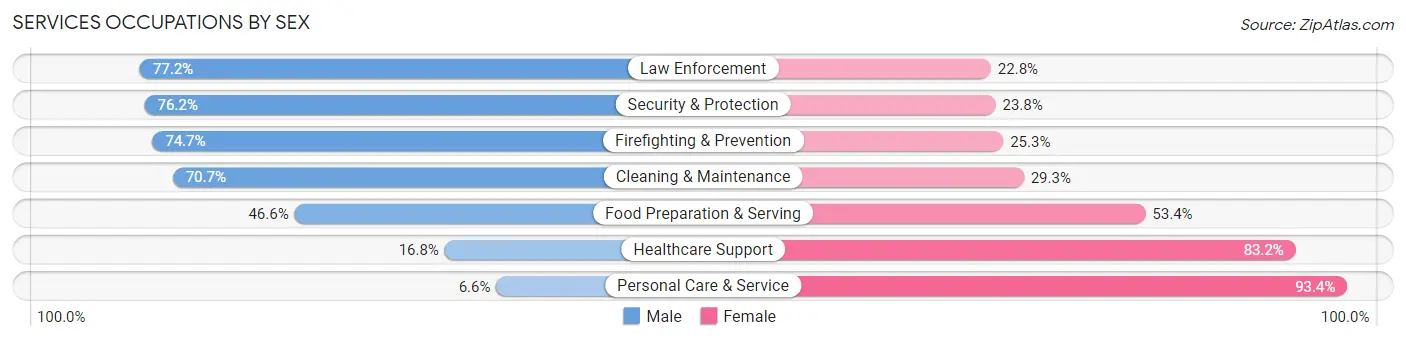
| Occupation | Male | Female |
| Healthcare Support | 76 (16.8%) | 376 (83.2%) |
| Security & Protection | 353 (76.2%) | 110 (23.8%) |
| Firefighting & Prevention | 130 (74.7%) | 44 (25.3%) |
| Law Enforcement | 223 (77.2%) | 66 (22.8%) |
| Food Preparation & Serving | 338 (46.6%) | 388 (53.4%) |
| Cleaning & Maintenance | 525 (70.7%) | 218 (29.3%) |
| Personal Care & Service | 19 (6.6%) | 269 (93.4%) |
| Total (Category) | 1,311 (49.1%) | 1,361 (50.9%) |
| Total (Overall) | 6,673 (49.8%) | 6,721 (50.2%) |
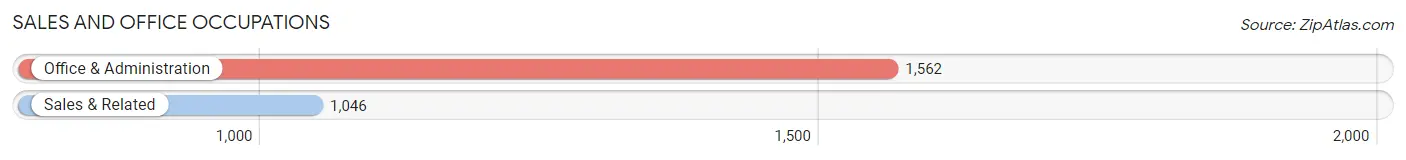
Sales and Office Occupations
The most common Sales and Office occupations in Peekskill are Office & Administration (1,562 | 11.7%), and Sales & Related (1,046 | 7.8%).
Sales and Office Occupations by Sex
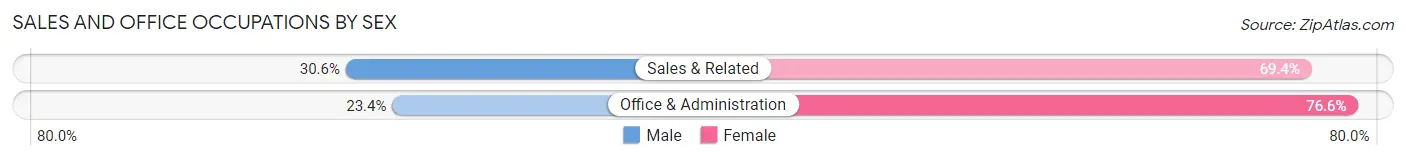
| Occupation | Male | Female |
| Sales & Related | 320 (30.6%) | 726 (69.4%) |
| Office & Administration | 366 (23.4%) | 1,196 (76.6%) |
| Total (Category) | 686 (26.3%) | 1,922 (73.7%) |
| Total (Overall) | 6,673 (49.8%) | 6,721 (50.2%) |
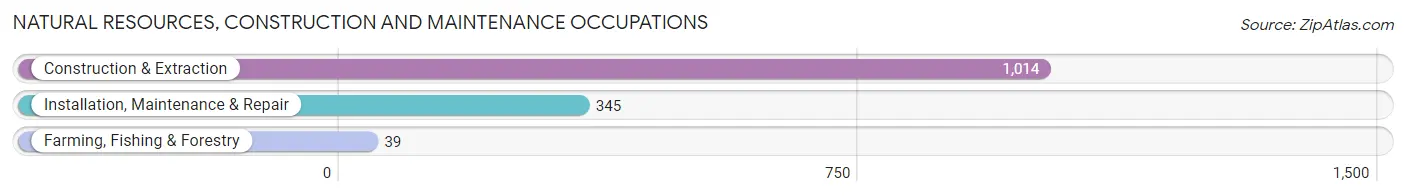
Natural Resources, Construction and Maintenance Occupations
The most common Natural Resources, Construction and Maintenance occupations in Peekskill are Construction & Extraction (1,014 | 7.6%), Installation, Maintenance & Repair (345 | 2.6%), and Farming, Fishing & Forestry (39 | 0.3%).
Natural Resources, Construction and Maintenance Occupations by Sex
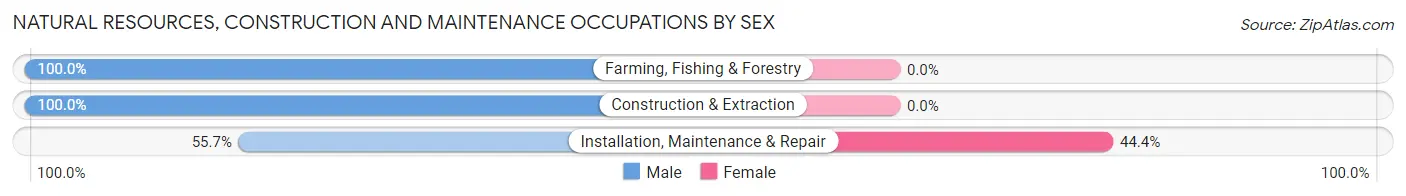
| Occupation | Male | Female |
| Farming, Fishing & Forestry | 39 (100.0%) | 0 (0.0%) |
| Construction & Extraction | 1,014 (100.0%) | 0 (0.0%) |
| Installation, Maintenance & Repair | 192 (55.6%) | 153 (44.4%) |
| Total (Category) | 1,245 (89.1%) | 153 (10.9%) |
| Total (Overall) | 6,673 (49.8%) | 6,721 (50.2%) |
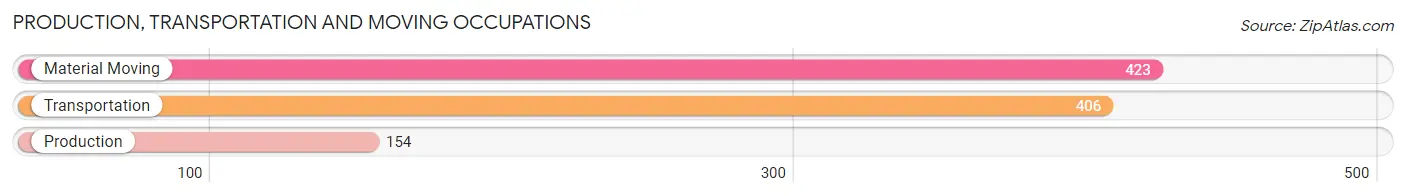
Production, Transportation and Moving Occupations
The most common Production, Transportation and Moving occupations in Peekskill are Material Moving (423 | 3.2%), Transportation (406 | 3.0%), and Production (154 | 1.1%).
Production, Transportation and Moving Occupations by Sex
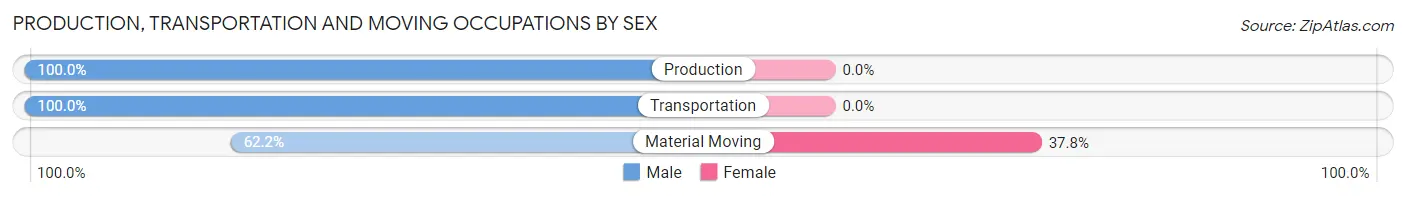
| Occupation | Male | Female |
| Production | 154 (100.0%) | 0 (0.0%) |
| Transportation | 406 (100.0%) | 0 (0.0%) |
| Material Moving | 263 (62.2%) | 160 (37.8%) |
| Total (Category) | 823 (83.7%) | 160 (16.3%) |
| Total (Overall) | 6,673 (49.8%) | 6,721 (50.2%) |
Employment Industries by Sex in Peekskill
Employment Industries in Peekskill
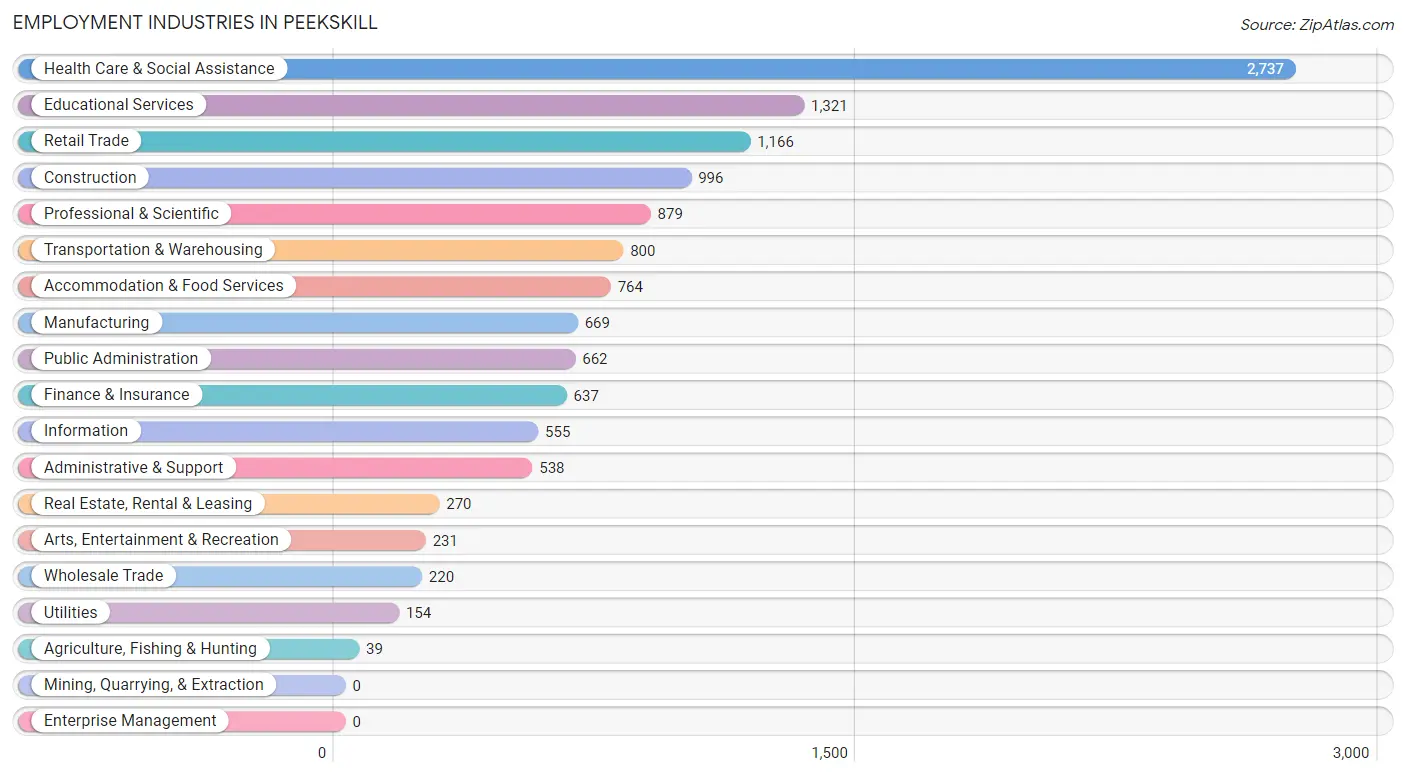
The major employment industries in Peekskill include Health Care & Social Assistance (2,737 | 20.4%), Educational Services (1,321 | 9.9%), Retail Trade (1,166 | 8.7%), Construction (996 | 7.4%), and Professional & Scientific (879 | 6.6%).
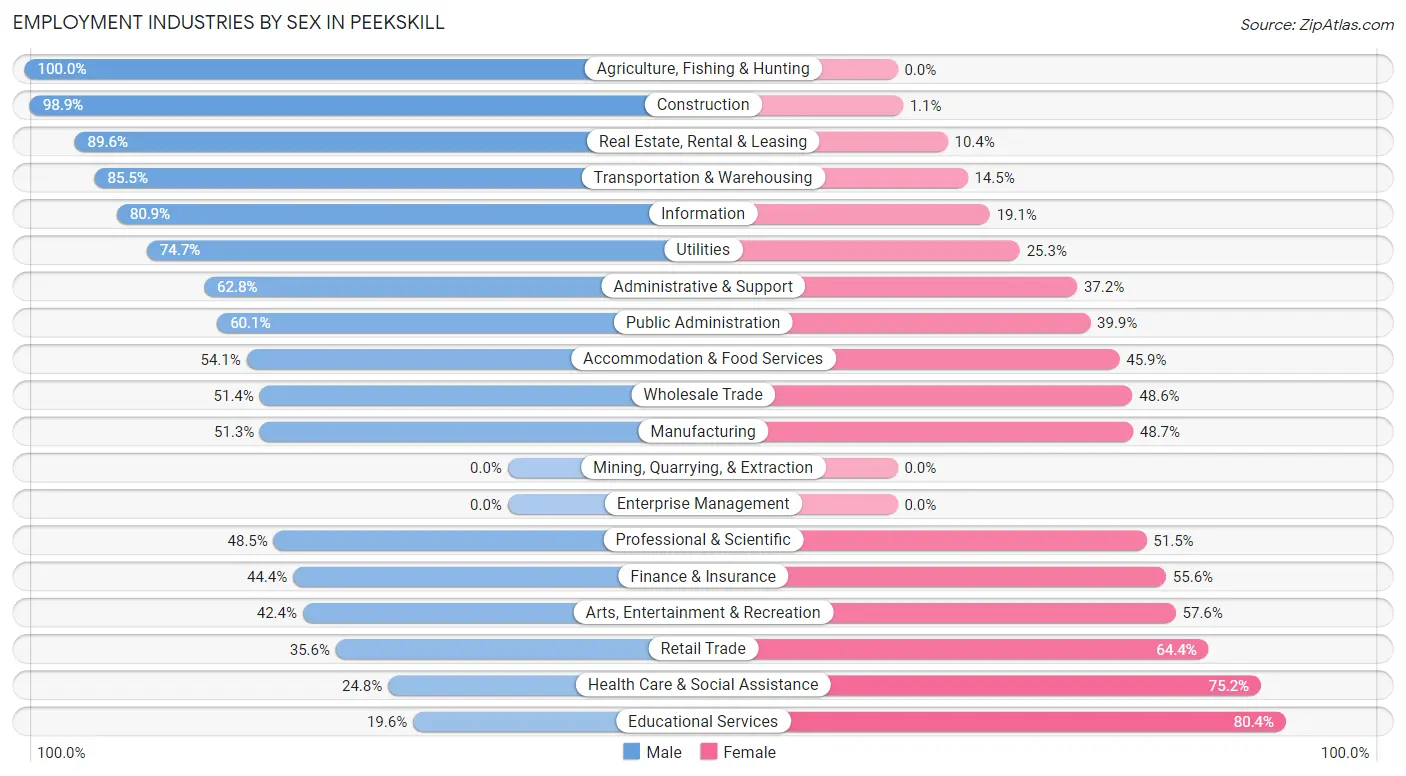
Employment Industries by Sex in Peekskill
The Peekskill industries that see more men than women are Agriculture, Fishing & Hunting (100.0%), Construction (98.9%), and Real Estate, Rental & Leasing (89.6%), whereas the industries that tend to have a higher number of women are Educational Services (80.4%), Health Care & Social Assistance (75.2%), and Retail Trade (64.4%).
| Industry | Male | Female |
| Agriculture, Fishing & Hunting | 39 (100.0%) | 0 (0.0%) |
| Mining, Quarrying, & Extraction | 0 (0.0%) | 0 (0.0%) |
| Construction | 985 (98.9%) | 11 (1.1%) |
| Manufacturing | 343 (51.3%) | 326 (48.7%) |
| Wholesale Trade | 113 (51.4%) | 107 (48.6%) |
| Retail Trade | 415 (35.6%) | 751 (64.4%) |
| Transportation & Warehousing | 684 (85.5%) | 116 (14.5%) |
| Utilities | 115 (74.7%) | 39 (25.3%) |
| Information | 449 (80.9%) | 106 (19.1%) |
| Finance & Insurance | 283 (44.4%) | 354 (55.6%) |
| Real Estate, Rental & Leasing | 242 (89.6%) | 28 (10.4%) |
| Professional & Scientific | 426 (48.5%) | 453 (51.5%) |
| Enterprise Management | 0 (0.0%) | 0 (0.0%) |
| Administrative & Support | 338 (62.8%) | 200 (37.2%) |
| Educational Services | 259 (19.6%) | 1,062 (80.4%) |
| Health Care & Social Assistance | 678 (24.8%) | 2,059 (75.2%) |
| Arts, Entertainment & Recreation | 98 (42.4%) | 133 (57.6%) |
| Accommodation & Food Services | 413 (54.1%) | 351 (45.9%) |
| Public Administration | 398 (60.1%) | 264 (39.9%) |
| Total | 6,673 (49.8%) | 6,721 (50.2%) |
Education in Peekskill
School Enrollment in Peekskill
The most common levels of schooling among the 4,892 students in Peekskill are high school (1,153 | 23.6%), middle school (1,104 | 22.6%), and college / undergraduate (1,045 | 21.4%).
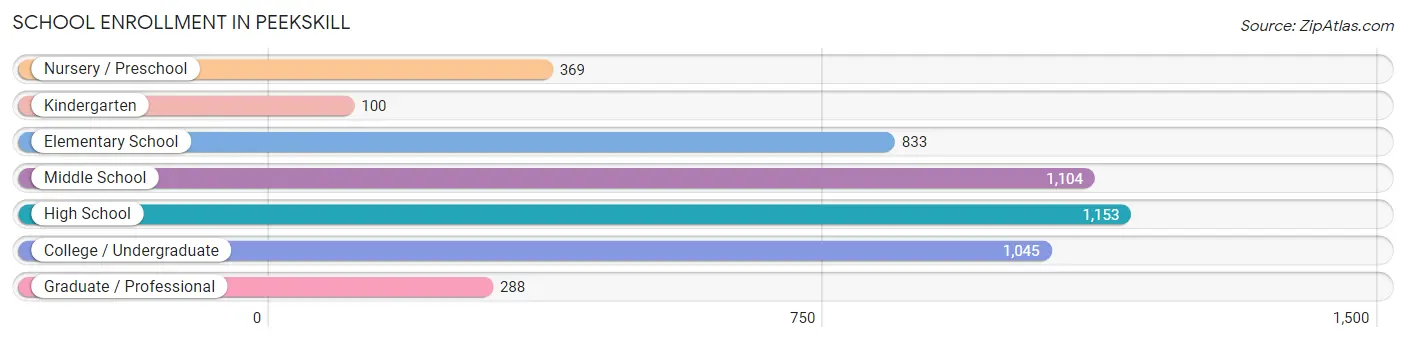
| School Level | # Students | % Students |
| Nursery / Preschool | 369 | 7.5% |
| Kindergarten | 100 | 2.0% |
| Elementary School | 833 | 17.0% |
| Middle School | 1,104 | 22.6% |
| High School | 1,153 | 23.6% |
| College / Undergraduate | 1,045 | 21.4% |
| Graduate / Professional | 288 | 5.9% |
| Total | 4,892 | 100.0% |
School Enrollment by Age by Funding Source in Peekskill
Out of a total of 4,892 students who are enrolled in schools in Peekskill, 690 (14.1%) attend a private institution, while the remaining 4,202 (85.9%) are enrolled in public schools. The age group of 35 years and over has the highest likelihood of being enrolled in private schools, with 127 (31.8% in the age bracket) enrolled. Conversely, the age group of 15 to 17 year olds has the lowest likelihood of being enrolled in a private school, with 605 (93.1% in the age bracket) attending a public institution.
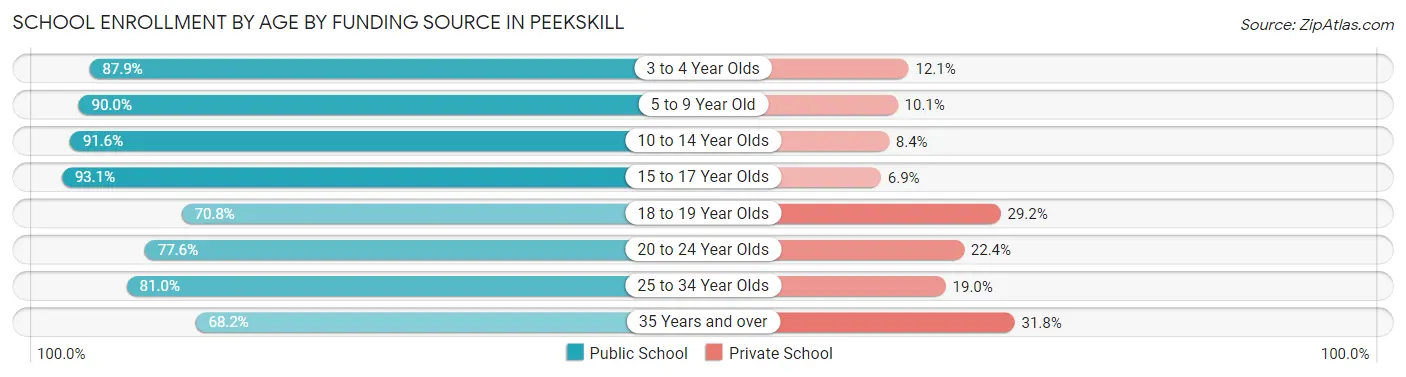
| Age Bracket | Public School | Private School |
| 3 to 4 Year Olds | 182 (87.9%) | 25 (12.1%) |
| 5 to 9 Year Old | 725 (89.9%) | 81 (10.1%) |
| 10 to 14 Year Olds | 1,587 (91.6%) | 146 (8.4%) |
| 15 to 17 Year Olds | 605 (93.1%) | 45 (6.9%) |
| 18 to 19 Year Olds | 264 (70.8%) | 109 (29.2%) |
| 20 to 24 Year Olds | 423 (77.6%) | 122 (22.4%) |
| 25 to 34 Year Olds | 145 (81.0%) | 34 (19.0%) |
| 35 Years and over | 272 (68.2%) | 127 (31.8%) |
| Total | 4,202 (85.9%) | 690 (14.1%) |
Educational Attainment by Field of Study in Peekskill
Business (1,117 | 14.7%), social sciences (843 | 11.1%), education (843 | 11.1%), science & technology (760 | 10.0%), and literature & languages (603 | 7.9%) are the most common fields of study among 7,611 individuals in Peekskill who have obtained a bachelor's degree or higher.
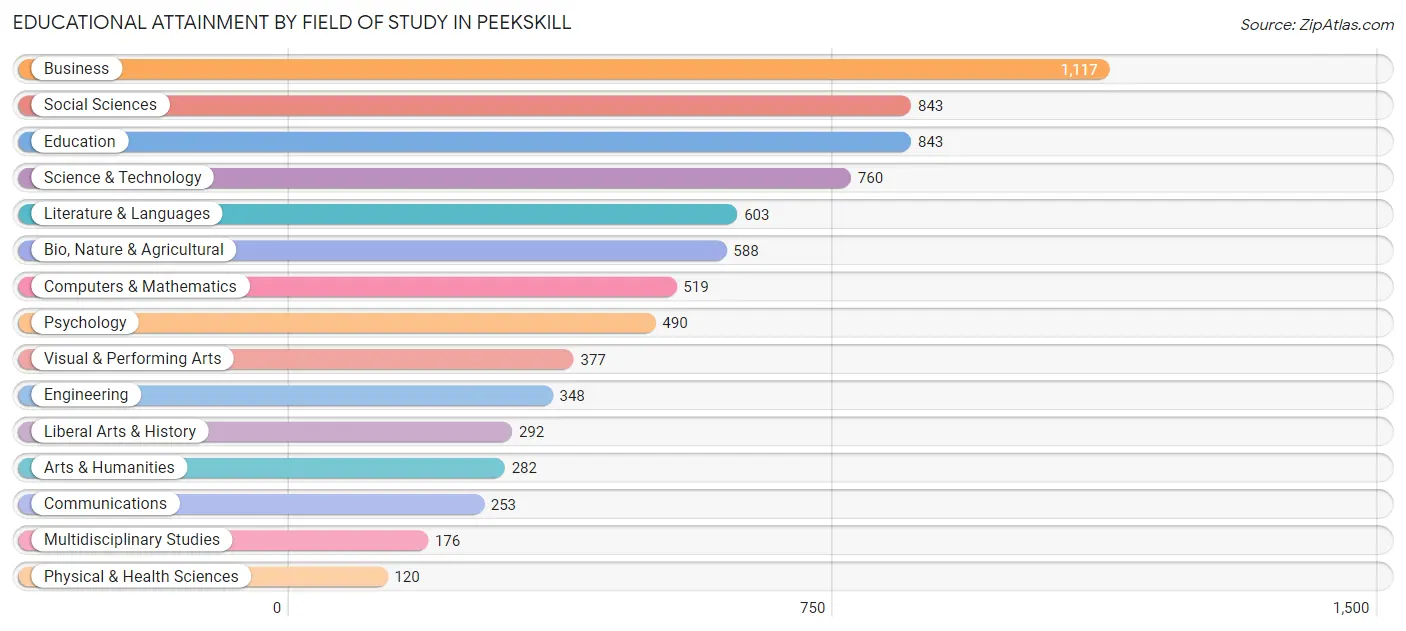
| Field of Study | # Graduates | % Graduates |
| Computers & Mathematics | 519 | 6.8% |
| Bio, Nature & Agricultural | 588 | 7.7% |
| Physical & Health Sciences | 120 | 1.6% |
| Psychology | 490 | 6.4% |
| Social Sciences | 843 | 11.1% |
| Engineering | 348 | 4.6% |
| Multidisciplinary Studies | 176 | 2.3% |
| Science & Technology | 760 | 10.0% |
| Business | 1,117 | 14.7% |
| Education | 843 | 11.1% |
| Literature & Languages | 603 | 7.9% |
| Liberal Arts & History | 292 | 3.8% |
| Visual & Performing Arts | 377 | 5.0% |
| Communications | 253 | 3.3% |
| Arts & Humanities | 282 | 3.7% |
| Total | 7,611 | 100.0% |
Transportation & Commute in Peekskill
Vehicle Availability by Sex in Peekskill
The most prevalent vehicle ownership categories in Peekskill are males with 2 vehicles (2,628, accounting for 39.3%) and females with 2 vehicles (2,778, making up 40.5%).
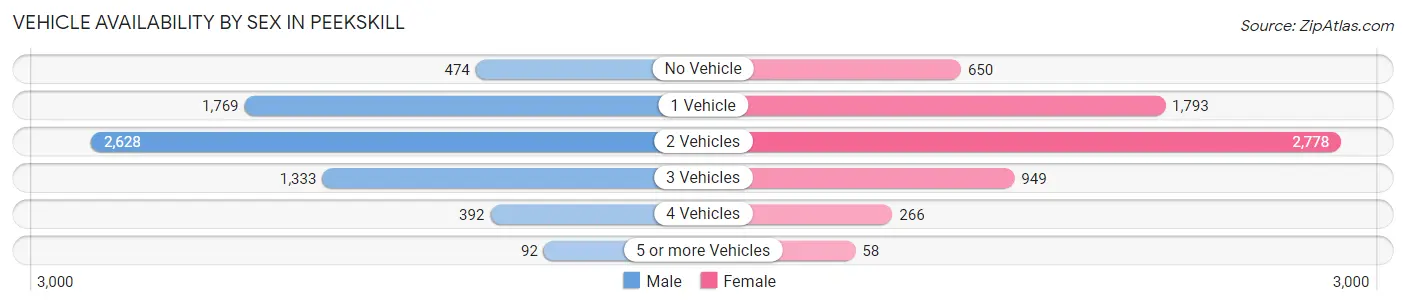
| Vehicles Available | Male | Female |
| No Vehicle | 474 (7.1%) | 650 (10.0%) |
| 1 Vehicle | 1,769 (26.5%) | 1,793 (27.6%) |
| 2 Vehicles | 2,628 (39.3%) | 2,778 (42.8%) |
| 3 Vehicles | 1,333 (19.9%) | 949 (14.6%) |
| 4 Vehicles | 392 (5.9%) | 266 (4.1%) |
| 5 or more Vehicles | 92 (1.4%) | 58 (0.9%) |
| Total | 6,688 (100.0%) | 6,494 (100.0%) |
Commute Time in Peekskill
The most frequently occuring commute durations in Peekskill are 45 to 59 minutes (1,754 commuters, 14.4%), 60 to 89 minutes (1,634 commuters, 13.4%), and 90 or more minutes (1,351 commuters, 11.1%).
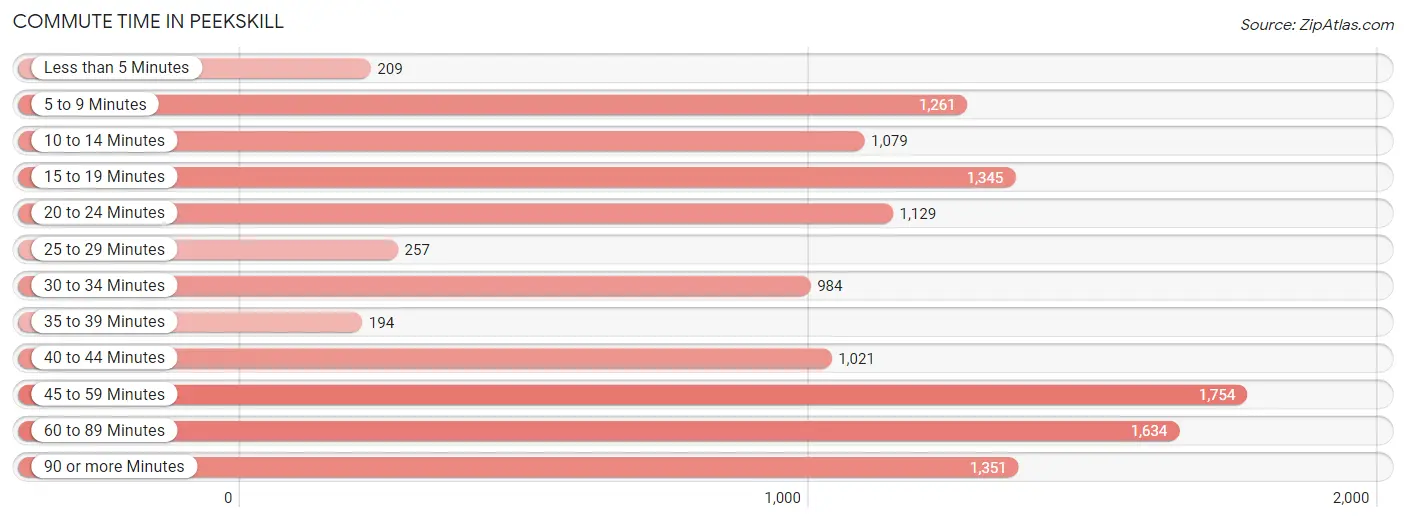
| Commute Time | # Commuters | % Commuters |
| Less than 5 Minutes | 209 | 1.7% |
| 5 to 9 Minutes | 1,261 | 10.3% |
| 10 to 14 Minutes | 1,079 | 8.8% |
| 15 to 19 Minutes | 1,345 | 11.0% |
| 20 to 24 Minutes | 1,129 | 9.2% |
| 25 to 29 Minutes | 257 | 2.1% |
| 30 to 34 Minutes | 984 | 8.1% |
| 35 to 39 Minutes | 194 | 1.6% |
| 40 to 44 Minutes | 1,021 | 8.4% |
| 45 to 59 Minutes | 1,754 | 14.4% |
| 60 to 89 Minutes | 1,634 | 13.4% |
| 90 or more Minutes | 1,351 | 11.1% |
Commute Time by Sex in Peekskill
The most common commute times in Peekskill are 45 to 59 minutes (1,076 commuters, 17.3%) for males and 10 to 14 minutes (725 commuters, 12.1%) for females.
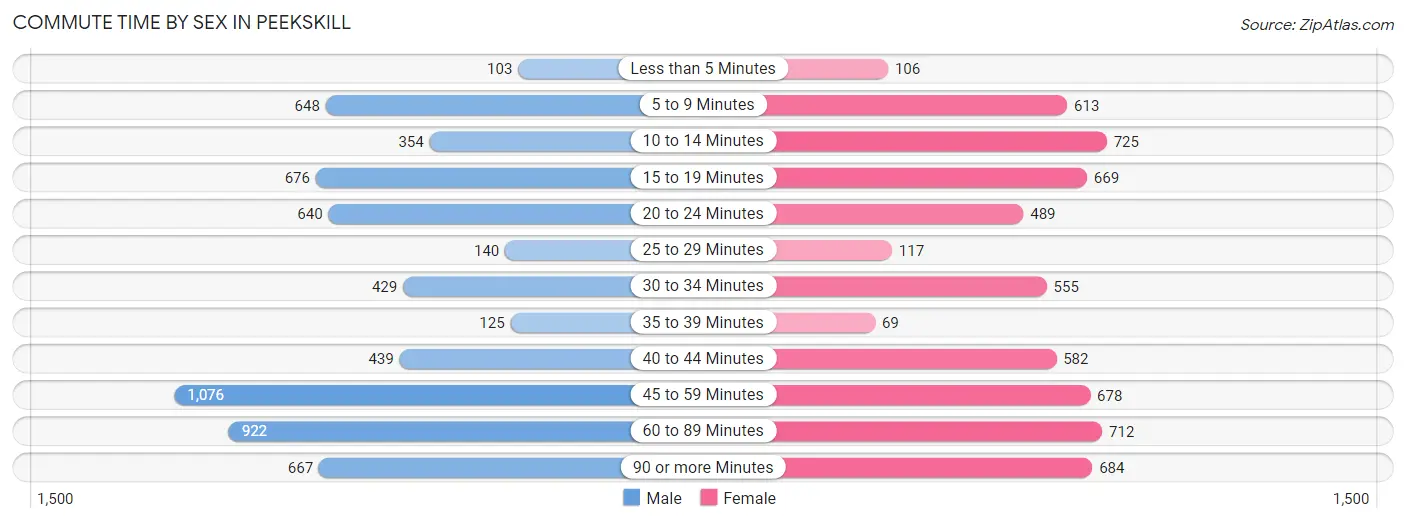
| Commute Time | Male | Female |
| Less than 5 Minutes | 103 (1.7%) | 106 (1.8%) |
| 5 to 9 Minutes | 648 (10.4%) | 613 (10.2%) |
| 10 to 14 Minutes | 354 (5.7%) | 725 (12.1%) |
| 15 to 19 Minutes | 676 (10.9%) | 669 (11.2%) |
| 20 to 24 Minutes | 640 (10.3%) | 489 (8.2%) |
| 25 to 29 Minutes | 140 (2.2%) | 117 (1.9%) |
| 30 to 34 Minutes | 429 (6.9%) | 555 (9.2%) |
| 35 to 39 Minutes | 125 (2.0%) | 69 (1.1%) |
| 40 to 44 Minutes | 439 (7.1%) | 582 (9.7%) |
| 45 to 59 Minutes | 1,076 (17.3%) | 678 (11.3%) |
| 60 to 89 Minutes | 922 (14.8%) | 712 (11.9%) |
| 90 or more Minutes | 667 (10.7%) | 684 (11.4%) |
Time of Departure to Work by Sex in Peekskill
The most frequent times of departure to work in Peekskill are 6:00 AM to 6:29 AM (1,003, 16.1%) for males and 8:00 AM to 8:29 AM (1,001, 16.7%) for females.
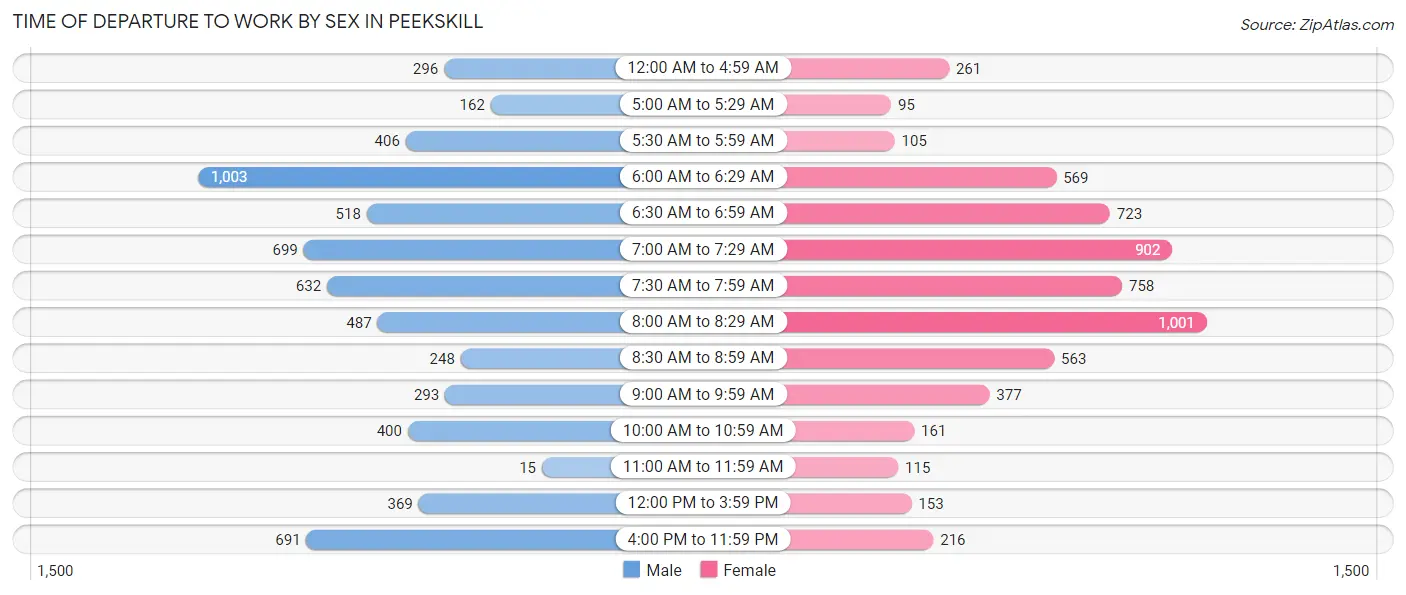
| Time of Departure | Male | Female |
| 12:00 AM to 4:59 AM | 296 (4.8%) | 261 (4.3%) |
| 5:00 AM to 5:29 AM | 162 (2.6%) | 95 (1.6%) |
| 5:30 AM to 5:59 AM | 406 (6.5%) | 105 (1.8%) |
| 6:00 AM to 6:29 AM | 1,003 (16.1%) | 569 (9.5%) |
| 6:30 AM to 6:59 AM | 518 (8.3%) | 723 (12.0%) |
| 7:00 AM to 7:29 AM | 699 (11.2%) | 902 (15.0%) |
| 7:30 AM to 7:59 AM | 632 (10.2%) | 758 (12.6%) |
| 8:00 AM to 8:29 AM | 487 (7.8%) | 1,001 (16.7%) |
| 8:30 AM to 8:59 AM | 248 (4.0%) | 563 (9.4%) |
| 9:00 AM to 9:59 AM | 293 (4.7%) | 377 (6.3%) |
| 10:00 AM to 10:59 AM | 400 (6.4%) | 161 (2.7%) |
| 11:00 AM to 11:59 AM | 15 (0.2%) | 115 (1.9%) |
| 12:00 PM to 3:59 PM | 369 (5.9%) | 153 (2.5%) |
| 4:00 PM to 11:59 PM | 691 (11.1%) | 216 (3.6%) |
| Total | 6,219 (100.0%) | 5,999 (100.0%) |
Housing Occupancy in Peekskill
Occupancy by Ownership in Peekskill
Of the total 10,884 dwellings in Peekskill, owner-occupied units account for 6,242 (57.4%), while renter-occupied units make up 4,642 (42.6%).
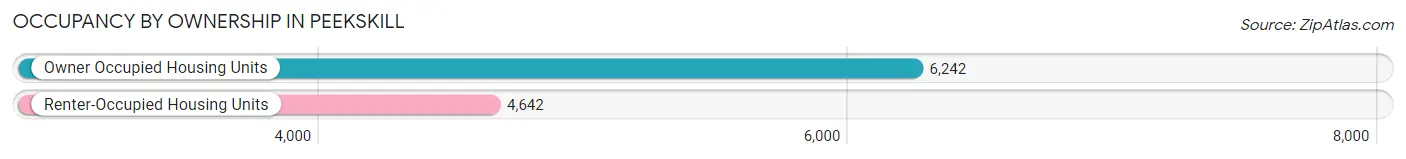
| Occupancy | # Housing Units | % Housing Units |
| Owner Occupied Housing Units | 6,242 | 57.4% |
| Renter-Occupied Housing Units | 4,642 | 42.6% |
| Total Occupied Housing Units | 10,884 | 100.0% |
Occupancy by Household Size in Peekskill
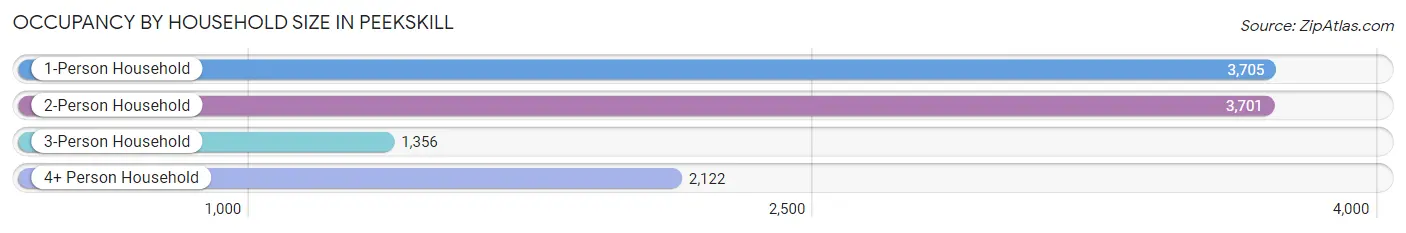
| Household Size | # Housing Units | % Housing Units |
| 1-Person Household | 3,705 | 34.0% |
| 2-Person Household | 3,701 | 34.0% |
| 3-Person Household | 1,356 | 12.5% |
| 4+ Person Household | 2,122 | 19.5% |
| Total Housing Units | 10,884 | 100.0% |
Occupancy by Ownership by Household Size in Peekskill
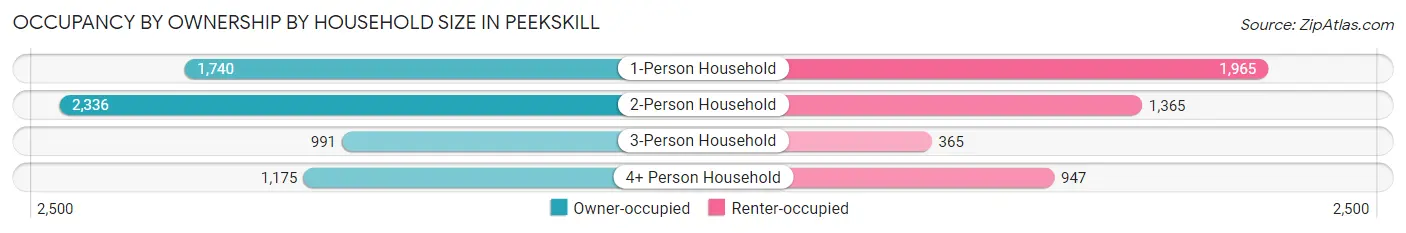
| Household Size | Owner-occupied | Renter-occupied |
| 1-Person Household | 1,740 (47.0%) | 1,965 (53.0%) |
| 2-Person Household | 2,336 (63.1%) | 1,365 (36.9%) |
| 3-Person Household | 991 (73.1%) | 365 (26.9%) |
| 4+ Person Household | 1,175 (55.4%) | 947 (44.6%) |
| Total Housing Units | 6,242 (57.4%) | 4,642 (42.6%) |
Occupancy by Educational Attainment in Peekskill
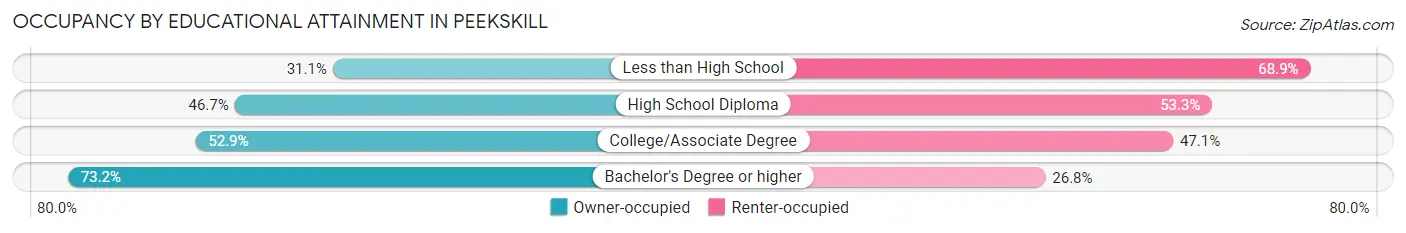
| Household Size | Owner-occupied | Renter-occupied |
| Less than High School | 395 (31.1%) | 874 (68.9%) |
| High School Diploma | 1,032 (46.7%) | 1,178 (53.3%) |
| College/Associate Degree | 1,574 (52.9%) | 1,401 (47.1%) |
| Bachelor's Degree or higher | 3,241 (73.2%) | 1,189 (26.8%) |
Occupancy by Age of Householder in Peekskill
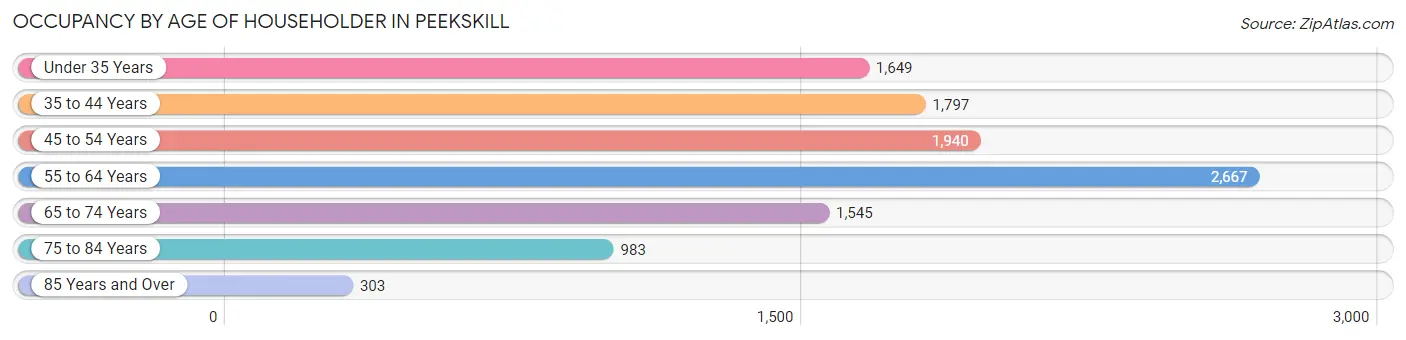
| Age Bracket | # Households | % Households |
| Under 35 Years | 1,649 | 15.1% |
| 35 to 44 Years | 1,797 | 16.5% |
| 45 to 54 Years | 1,940 | 17.8% |
| 55 to 64 Years | 2,667 | 24.5% |
| 65 to 74 Years | 1,545 | 14.2% |
| 75 to 84 Years | 983 | 9.0% |
| 85 Years and Over | 303 | 2.8% |
| Total | 10,884 | 100.0% |
Housing Finances in Peekskill
Median Income by Occupancy in Peekskill
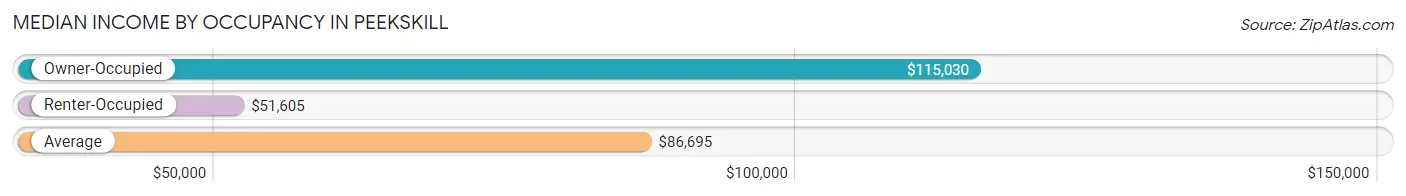
| Occupancy Type | # Households | Median Income |
| Owner-Occupied | 6,242 (57.4%) | $115,030 |
| Renter-Occupied | 4,642 (42.6%) | $51,605 |
| Average | 10,884 (100.0%) | $86,695 |
Occupancy by Householder Income Bracket in Peekskill
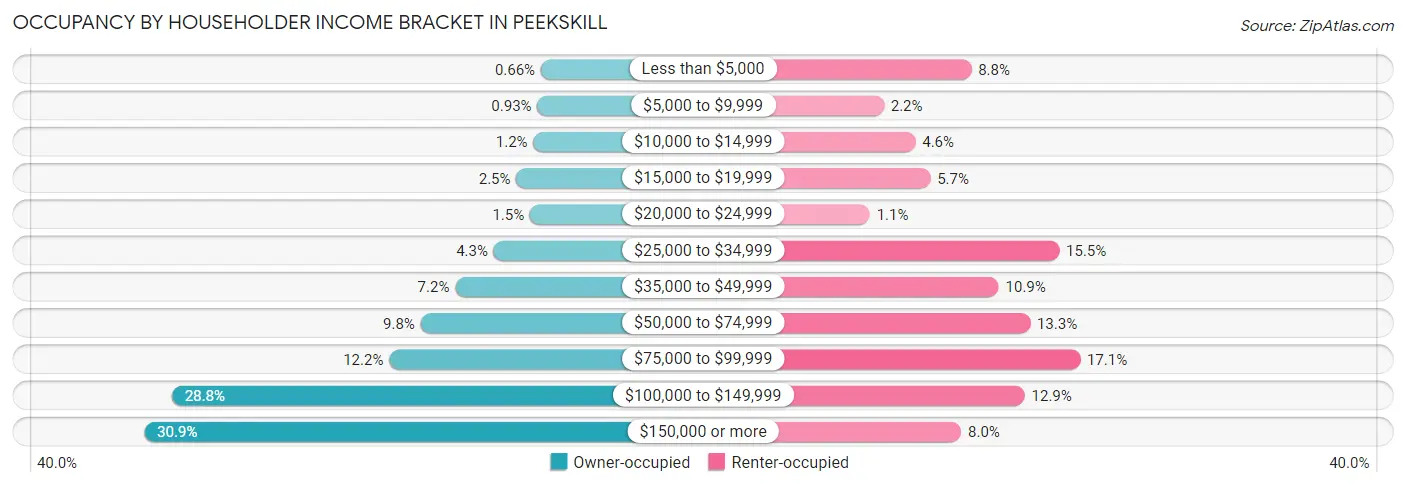
| Income Bracket | Owner-occupied | Renter-occupied |
| Less than $5,000 | 41 (0.7%) | 409 (8.8%) |
| $5,000 to $9,999 | 58 (0.9%) | 100 (2.1%) |
| $10,000 to $14,999 | 77 (1.2%) | 211 (4.5%) |
| $15,000 to $19,999 | 158 (2.5%) | 264 (5.7%) |
| $20,000 to $24,999 | 93 (1.5%) | 50 (1.1%) |
| $25,000 to $34,999 | 265 (4.3%) | 720 (15.5%) |
| $35,000 to $49,999 | 449 (7.2%) | 506 (10.9%) |
| $50,000 to $74,999 | 613 (9.8%) | 617 (13.3%) |
| $75,000 to $99,999 | 763 (12.2%) | 794 (17.1%) |
| $100,000 to $149,999 | 1,797 (28.8%) | 598 (12.9%) |
| $150,000 or more | 1,928 (30.9%) | 373 (8.0%) |
| Total | 6,242 (100.0%) | 4,642 (100.0%) |
Monthly Housing Cost Tiers in Peekskill
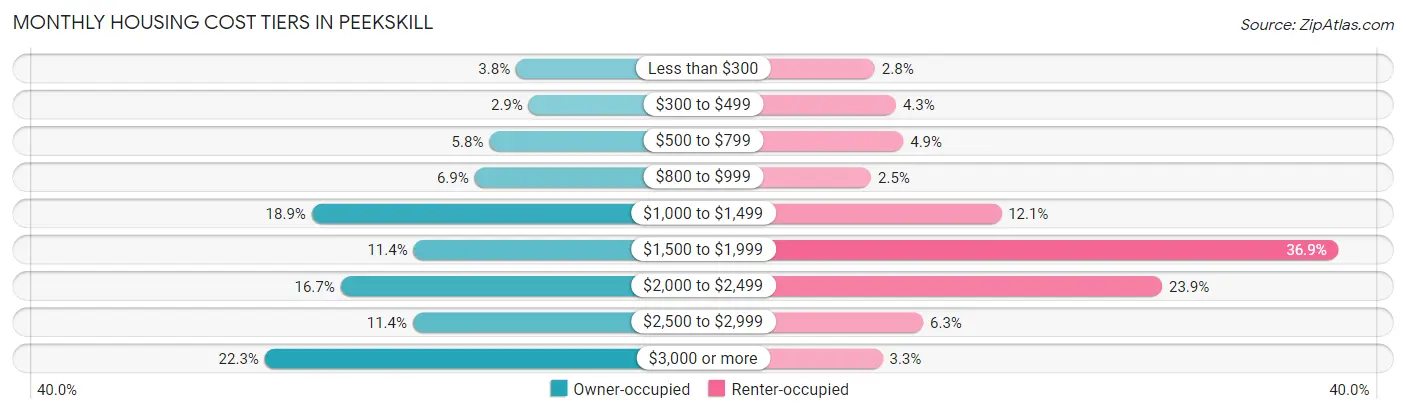
| Monthly Cost | Owner-occupied | Renter-occupied |
| Less than $300 | 238 (3.8%) | 128 (2.8%) |
| $300 to $499 | 180 (2.9%) | 200 (4.3%) |
| $500 to $799 | 361 (5.8%) | 225 (4.9%) |
| $800 to $999 | 428 (6.9%) | 115 (2.5%) |
| $1,000 to $1,499 | 1,177 (18.9%) | 560 (12.1%) |
| $1,500 to $1,999 | 709 (11.4%) | 1,713 (36.9%) |
| $2,000 to $2,499 | 1,044 (16.7%) | 1,110 (23.9%) |
| $2,500 to $2,999 | 712 (11.4%) | 293 (6.3%) |
| $3,000 or more | 1,393 (22.3%) | 154 (3.3%) |
| Total | 6,242 (100.0%) | 4,642 (100.0%) |
Physical Housing Characteristics in Peekskill
Housing Structures in Peekskill
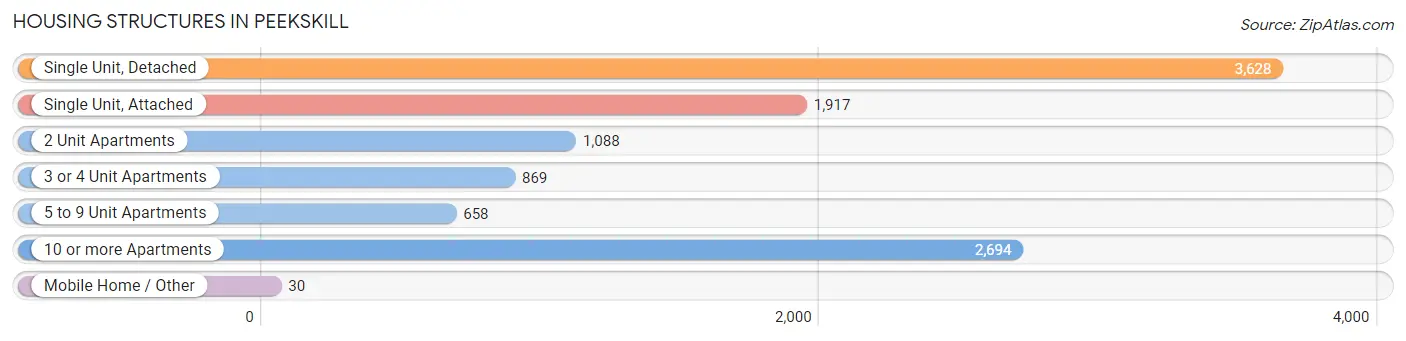
| Structure Type | # Housing Units | % Housing Units |
| Single Unit, Detached | 3,628 | 33.3% |
| Single Unit, Attached | 1,917 | 17.6% |
| 2 Unit Apartments | 1,088 | 10.0% |
| 3 or 4 Unit Apartments | 869 | 8.0% |
| 5 to 9 Unit Apartments | 658 | 6.0% |
| 10 or more Apartments | 2,694 | 24.7% |
| Mobile Home / Other | 30 | 0.3% |
| Total | 10,884 | 100.0% |
Housing Structures by Occupancy in Peekskill
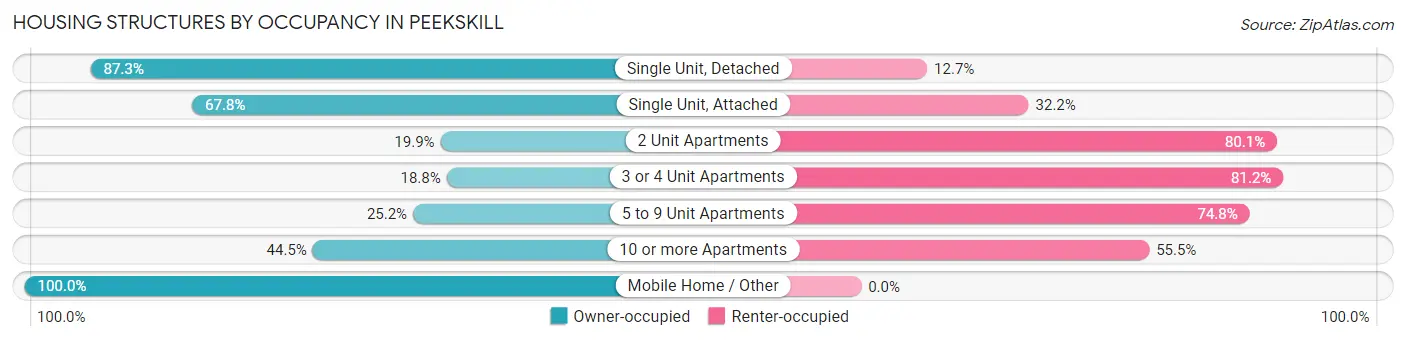
| Structure Type | Owner-occupied | Renter-occupied |
| Single Unit, Detached | 3,167 (87.3%) | 461 (12.7%) |
| Single Unit, Attached | 1,299 (67.8%) | 618 (32.2%) |
| 2 Unit Apartments | 217 (19.9%) | 871 (80.1%) |
| 3 or 4 Unit Apartments | 163 (18.8%) | 706 (81.2%) |
| 5 to 9 Unit Apartments | 166 (25.2%) | 492 (74.8%) |
| 10 or more Apartments | 1,200 (44.5%) | 1,494 (55.5%) |
| Mobile Home / Other | 30 (100.0%) | 0 (0.0%) |
| Total | 6,242 (57.4%) | 4,642 (42.6%) |
Housing Structures by Number of Rooms in Peekskill
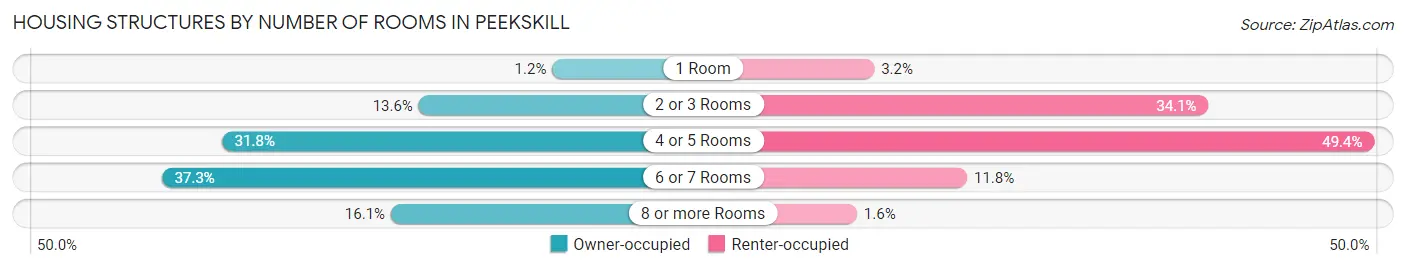
| Number of Rooms | Owner-occupied | Renter-occupied |
| 1 Room | 75 (1.2%) | 147 (3.2%) |
| 2 or 3 Rooms | 846 (13.6%) | 1,582 (34.1%) |
| 4 or 5 Rooms | 1,984 (31.8%) | 2,294 (49.4%) |
| 6 or 7 Rooms | 2,331 (37.3%) | 546 (11.8%) |
| 8 or more Rooms | 1,006 (16.1%) | 73 (1.6%) |
| Total | 6,242 (100.0%) | 4,642 (100.0%) |
Housing Structure by Heating Type in Peekskill
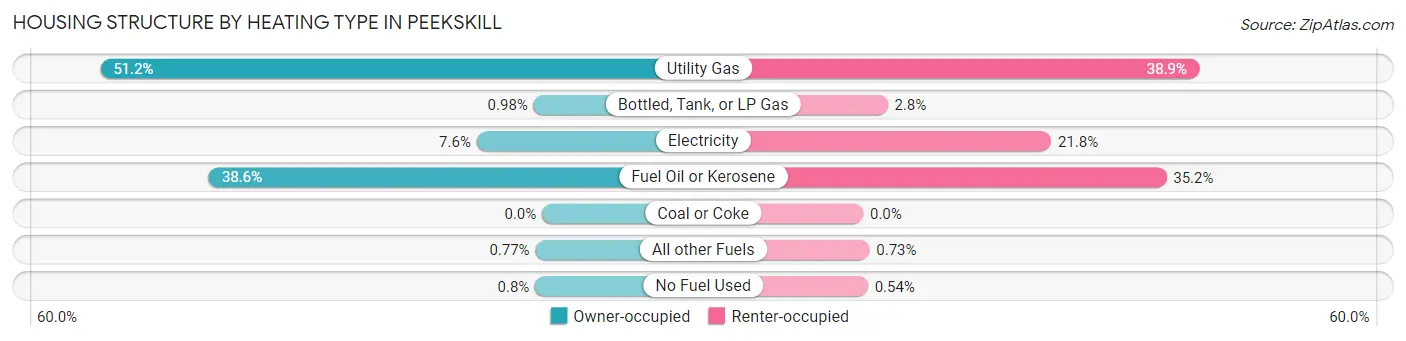
| Heating Type | Owner-occupied | Renter-occupied |
| Utility Gas | 3,198 (51.2%) | 1,807 (38.9%) |
| Bottled, Tank, or LP Gas | 61 (1.0%) | 132 (2.8%) |
| Electricity | 473 (7.6%) | 1,012 (21.8%) |
| Fuel Oil or Kerosene | 2,412 (38.6%) | 1,632 (35.2%) |
| Coal or Coke | 0 (0.0%) | 0 (0.0%) |
| All other Fuels | 48 (0.8%) | 34 (0.7%) |
| No Fuel Used | 50 (0.8%) | 25 (0.5%) |
| Total | 6,242 (100.0%) | 4,642 (100.0%) |
Household Vehicle Usage in Peekskill
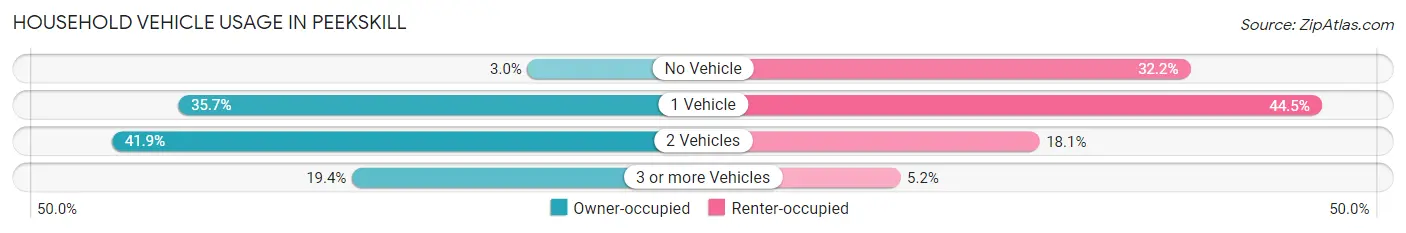
| Vehicles per Household | Owner-occupied | Renter-occupied |
| No Vehicle | 190 (3.0%) | 1,496 (32.2%) |
| 1 Vehicle | 2,227 (35.7%) | 2,065 (44.5%) |
| 2 Vehicles | 2,613 (41.9%) | 842 (18.1%) |
| 3 or more Vehicles | 1,212 (19.4%) | 239 (5.1%) |
| Total | 6,242 (100.0%) | 4,642 (100.0%) |
Real Estate & Mortgages in Peekskill
Real Estate and Mortgage Overview in Peekskill
| Characteristic | Without Mortgage | With Mortgage |
| Housing Units | 2,264 | 3,978 |
| Median Property Value | $283,100 | $401,400 |
| Median Household Income | $81,618 | $1,413 |
| Monthly Housing Costs | $1,067 | $1,393 |
| Real Estate Taxes | $4,740 | $225 |
Property Value by Mortgage Status in Peekskill
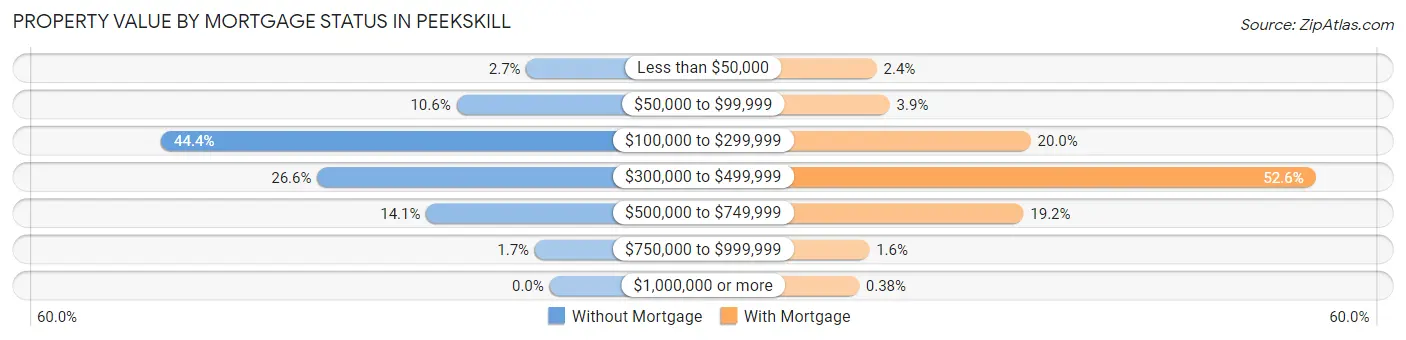
| Property Value | Without Mortgage | With Mortgage |
| Less than $50,000 | 60 (2.6%) | 96 (2.4%) |
| $50,000 to $99,999 | 241 (10.6%) | 155 (3.9%) |
| $100,000 to $299,999 | 1,005 (44.4%) | 796 (20.0%) |
| $300,000 to $499,999 | 601 (26.6%) | 2,091 (52.6%) |
| $500,000 to $749,999 | 319 (14.1%) | 763 (19.2%) |
| $750,000 to $999,999 | 38 (1.7%) | 62 (1.6%) |
| $1,000,000 or more | 0 (0.0%) | 15 (0.4%) |
| Total | 2,264 (100.0%) | 3,978 (100.0%) |
Household Income by Mortgage Status in Peekskill
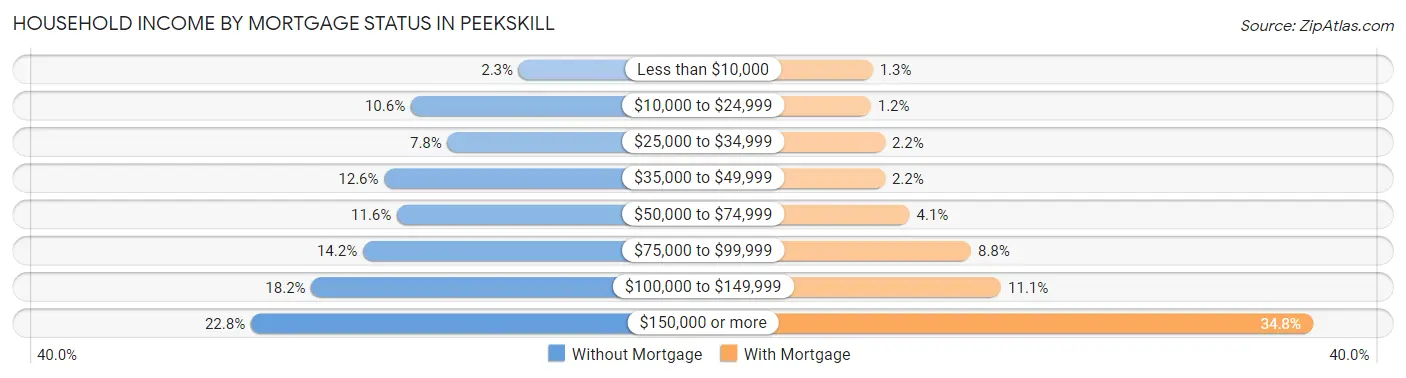
| Household Income | Without Mortgage | With Mortgage |
| Less than $10,000 | 53 (2.3%) | 52 (1.3%) |
| $10,000 to $24,999 | 239 (10.6%) | 46 (1.2%) |
| $25,000 to $34,999 | 176 (7.8%) | 89 (2.2%) |
| $35,000 to $49,999 | 285 (12.6%) | 89 (2.2%) |
| $50,000 to $74,999 | 263 (11.6%) | 164 (4.1%) |
| $75,000 to $99,999 | 322 (14.2%) | 350 (8.8%) |
| $100,000 to $149,999 | 411 (18.1%) | 441 (11.1%) |
| $150,000 or more | 515 (22.8%) | 1,386 (34.8%) |
| Total | 2,264 (100.0%) | 3,978 (100.0%) |
Property Value to Household Income Ratio in Peekskill
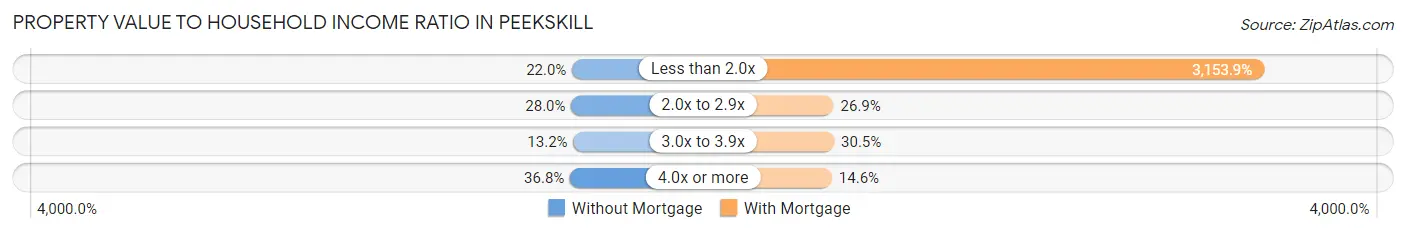
| Value-to-Income Ratio | Without Mortgage | With Mortgage |
| Less than 2.0x | 498 (22.0%) | 125,463 (3,153.9%) |
| 2.0x to 2.9x | 634 (28.0%) | 1,068 (26.9%) |
| 3.0x to 3.9x | 298 (13.2%) | 1,215 (30.5%) |
| 4.0x or more | 834 (36.8%) | 580 (14.6%) |
| Total | 2,264 (100.0%) | 3,978 (100.0%) |
Real Estate Taxes by Mortgage Status in Peekskill
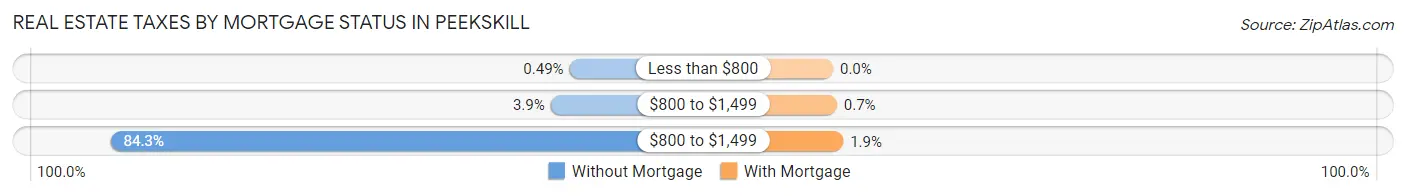
| Property Taxes | Without Mortgage | With Mortgage |
| Less than $800 | 11 (0.5%) | 0 (0.0%) |
| $800 to $1,499 | 89 (3.9%) | 28 (0.7%) |
| $800 to $1,499 | 1,908 (84.3%) | 74 (1.9%) |
| Total | 2,264 (100.0%) | 3,978 (100.0%) |
Health & Disability in Peekskill
Health Insurance Coverage by Age in Peekskill
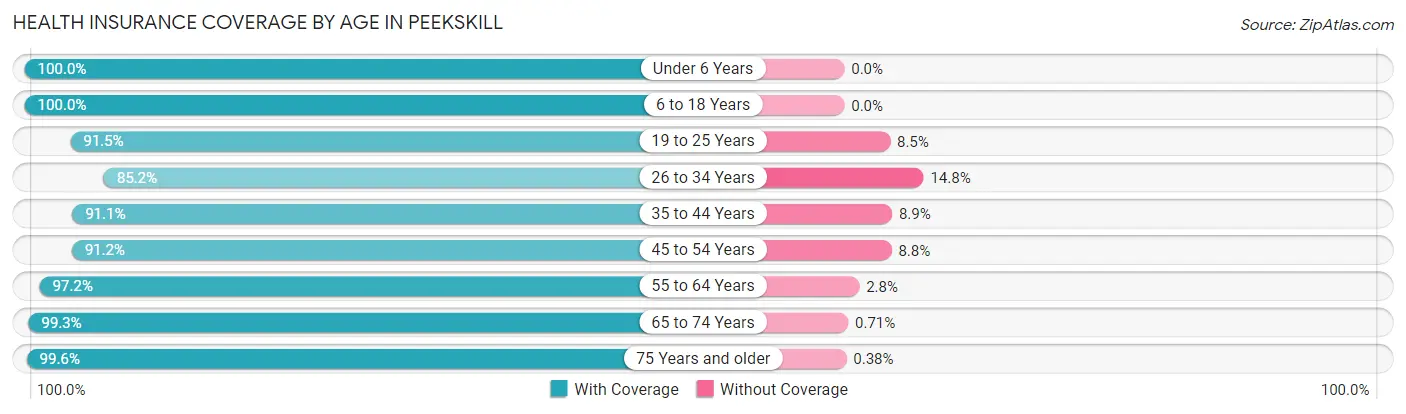
| Age Bracket | With Coverage | Without Coverage |
| Under 6 Years | 1,310 (100.0%) | 0 (0.0%) |
| 6 to 18 Years | 3,358 (100.0%) | 0 (0.0%) |
| 19 to 25 Years | 2,197 (91.5%) | 205 (8.5%) |
| 26 to 34 Years | 2,482 (85.2%) | 430 (14.8%) |
| 35 to 44 Years | 3,373 (91.1%) | 329 (8.9%) |
| 45 to 54 Years | 2,926 (91.2%) | 282 (8.8%) |
| 55 to 64 Years | 4,091 (97.2%) | 117 (2.8%) |
| 65 to 74 Years | 2,247 (99.3%) | 16 (0.7%) |
| 75 Years and older | 1,841 (99.6%) | 7 (0.4%) |
| Total | 23,825 (94.5%) | 1,386 (5.5%) |
Health Insurance Coverage by Citizenship Status in Peekskill
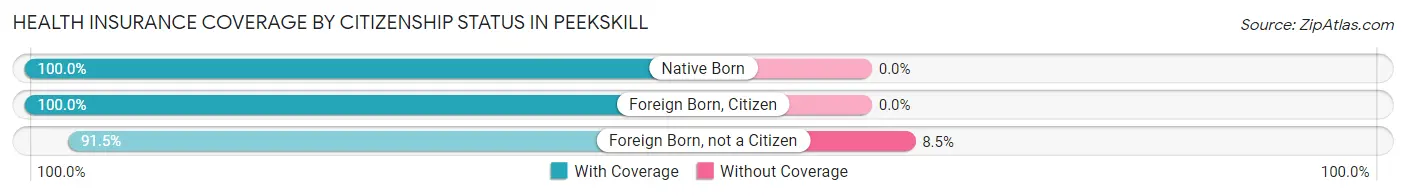
| Citizenship Status | With Coverage | Without Coverage |
| Native Born | 1,310 (100.0%) | 0 (0.0%) |
| Foreign Born, Citizen | 3,358 (100.0%) | 0 (0.0%) |
| Foreign Born, not a Citizen | 2,197 (91.5%) | 205 (8.5%) |
Health Insurance Coverage by Household Income in Peekskill
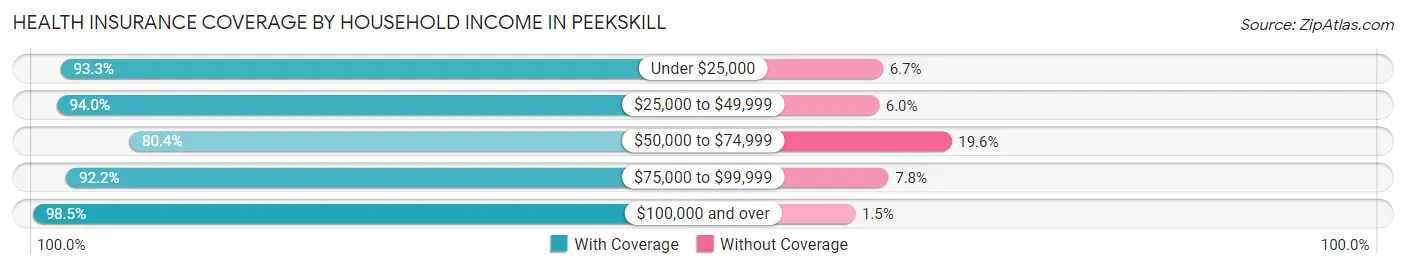
| Household Income | With Coverage | Without Coverage |
| Under $25,000 | 1,983 (93.3%) | 143 (6.7%) |
| $25,000 to $49,999 | 3,200 (94.0%) | 204 (6.0%) |
| $50,000 to $74,999 | 2,271 (80.4%) | 553 (19.6%) |
| $75,000 to $99,999 | 3,395 (92.2%) | 286 (7.8%) |
| $100,000 and over | 12,868 (98.5%) | 200 (1.5%) |
Public vs Private Health Insurance Coverage by Age in Peekskill
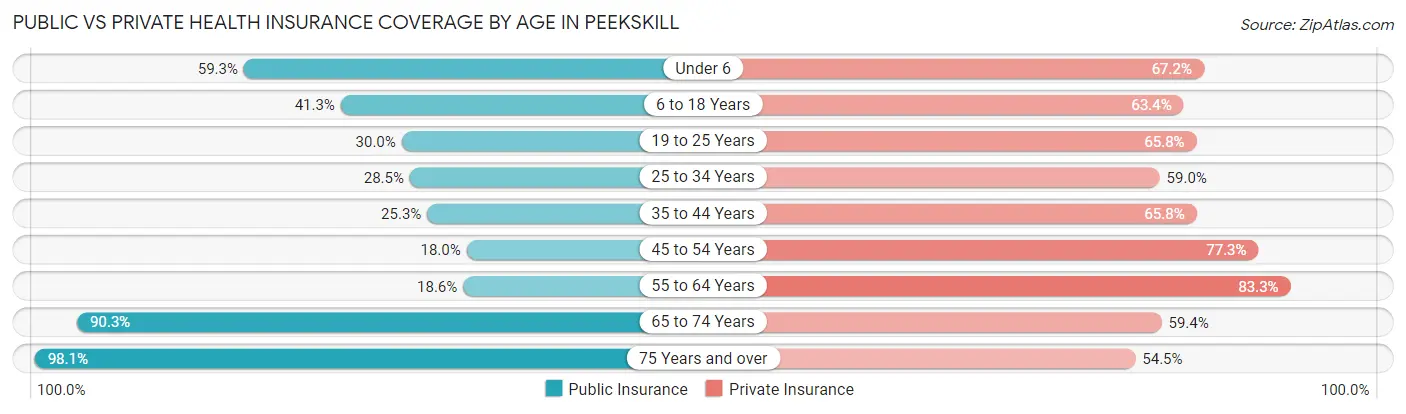
| Age Bracket | Public Insurance | Private Insurance |
| Under 6 | 777 (59.3%) | 880 (67.2%) |
| 6 to 18 Years | 1,388 (41.3%) | 2,130 (63.4%) |
| 19 to 25 Years | 721 (30.0%) | 1,581 (65.8%) |
| 25 to 34 Years | 830 (28.5%) | 1,718 (59.0%) |
| 35 to 44 Years | 936 (25.3%) | 2,437 (65.8%) |
| 45 to 54 Years | 576 (18.0%) | 2,480 (77.3%) |
| 55 to 64 Years | 783 (18.6%) | 3,504 (83.3%) |
| 65 to 74 Years | 2,043 (90.3%) | 1,343 (59.4%) |
| 75 Years and over | 1,813 (98.1%) | 1,007 (54.5%) |
| Total | 9,867 (39.1%) | 17,080 (67.7%) |
Disability Status by Sex by Age in Peekskill
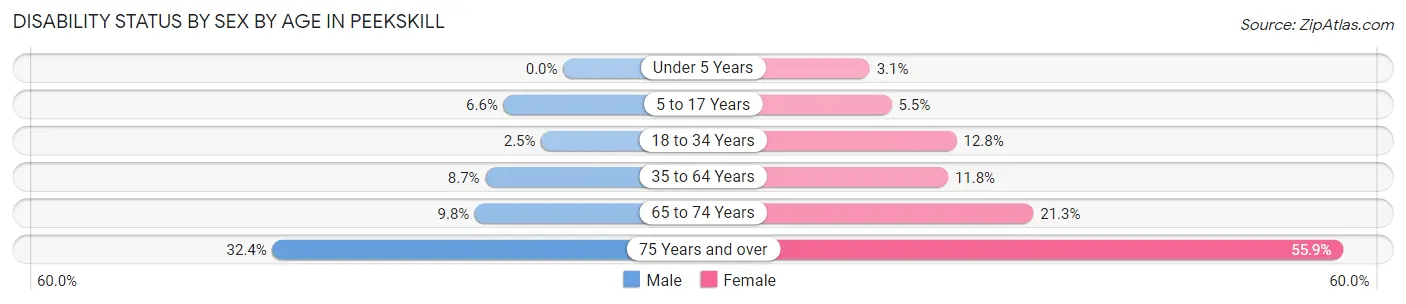
| Age Bracket | Male | Female |
| Under 5 Years | 0 (0.0%) | 24 (3.1%) |
| 5 to 17 Years | 117 (6.6%) | 79 (5.5%) |
| 18 to 34 Years | 70 (2.5%) | 370 (12.8%) |
| 35 to 64 Years | 459 (8.7%) | 689 (11.8%) |
| 65 to 74 Years | 97 (9.8%) | 272 (21.3%) |
| 75 Years and over | 283 (32.4%) | 544 (55.8%) |
Disability Class by Sex by Age in Peekskill
Disability Class: Hearing Difficulty
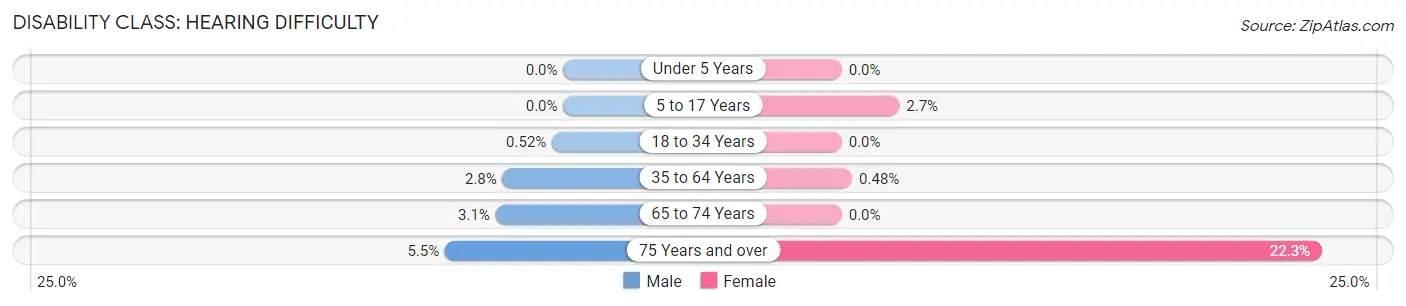
| Age Bracket | Male | Female |
| Under 5 Years | 0 (0.0%) | 0 (0.0%) |
| 5 to 17 Years | 0 (0.0%) | 38 (2.7%) |
| 18 to 34 Years | 15 (0.5%) | 0 (0.0%) |
| 35 to 64 Years | 149 (2.8%) | 28 (0.5%) |
| 65 to 74 Years | 31 (3.1%) | 0 (0.0%) |
| 75 Years and over | 48 (5.5%) | 217 (22.3%) |
Disability Class: Vision Difficulty
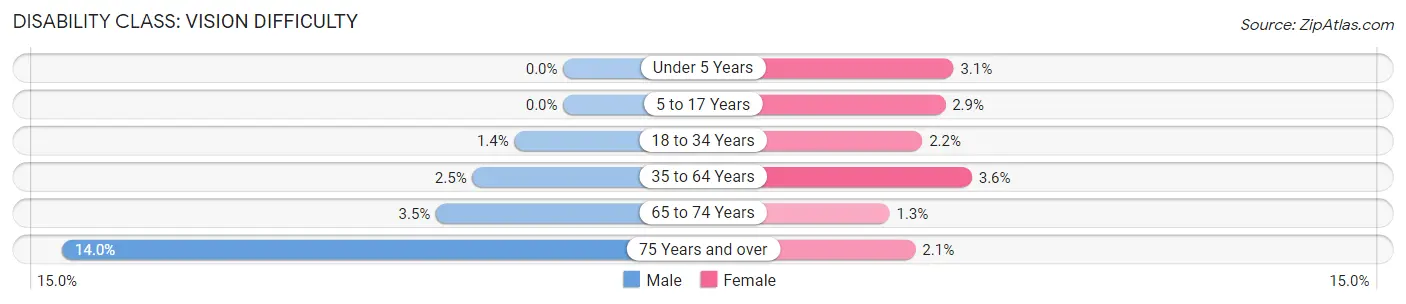
| Age Bracket | Male | Female |
| Under 5 Years | 0 (0.0%) | 24 (3.1%) |
| 5 to 17 Years | 0 (0.0%) | 41 (2.9%) |
| 18 to 34 Years | 39 (1.4%) | 65 (2.2%) |
| 35 to 64 Years | 134 (2.5%) | 211 (3.6%) |
| 65 to 74 Years | 35 (3.5%) | 17 (1.3%) |
| 75 Years and over | 122 (14.0%) | 20 (2.1%) |
Disability Class: Cognitive Difficulty
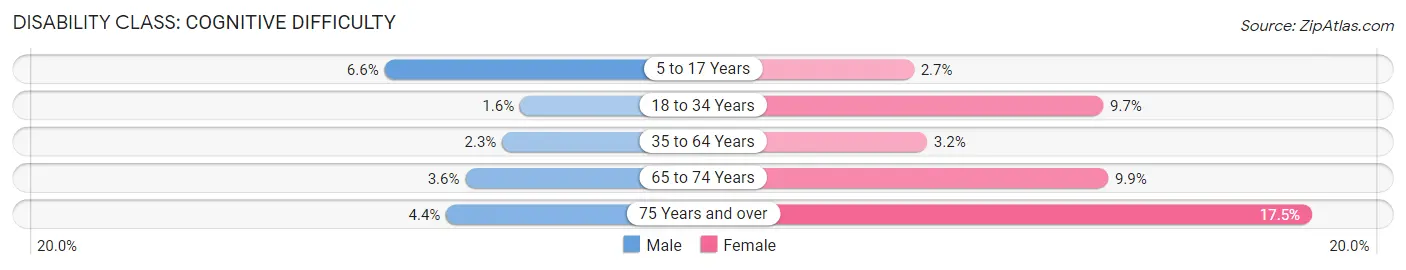
| Age Bracket | Male | Female |
| 5 to 17 Years | 117 (6.6%) | 38 (2.7%) |
| 18 to 34 Years | 46 (1.6%) | 281 (9.7%) |
| 35 to 64 Years | 120 (2.3%) | 184 (3.2%) |
| 65 to 74 Years | 36 (3.6%) | 126 (9.9%) |
| 75 Years and over | 38 (4.3%) | 170 (17.4%) |
Disability Class: Ambulatory Difficulty
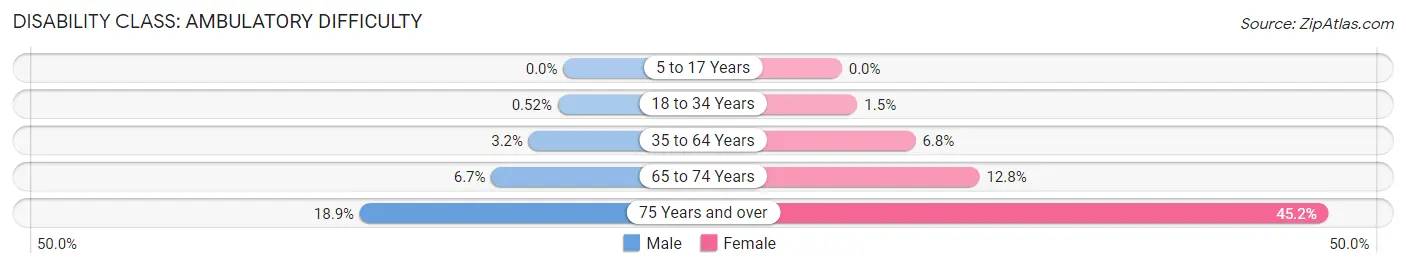
| Age Bracket | Male | Female |
| 5 to 17 Years | 0 (0.0%) | 0 (0.0%) |
| 18 to 34 Years | 15 (0.5%) | 42 (1.5%) |
| 35 to 64 Years | 169 (3.2%) | 399 (6.8%) |
| 65 to 74 Years | 66 (6.7%) | 163 (12.8%) |
| 75 Years and over | 165 (18.9%) | 440 (45.2%) |
Disability Class: Self-Care Difficulty
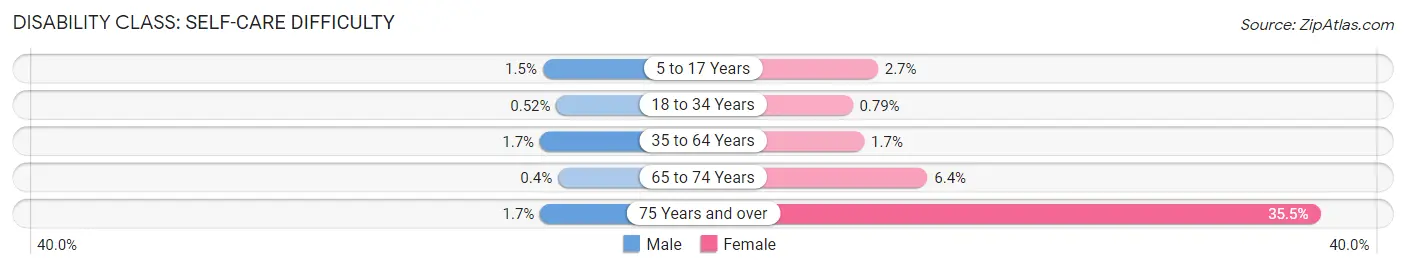
| Age Bracket | Male | Female |
| 5 to 17 Years | 27 (1.5%) | 38 (2.7%) |
| 18 to 34 Years | 15 (0.5%) | 23 (0.8%) |
| 35 to 64 Years | 92 (1.7%) | 97 (1.7%) |
| 65 to 74 Years | 4 (0.4%) | 81 (6.4%) |
| 75 Years and over | 15 (1.7%) | 346 (35.5%) |
Technology Access in Peekskill
Computing Device Access in Peekskill
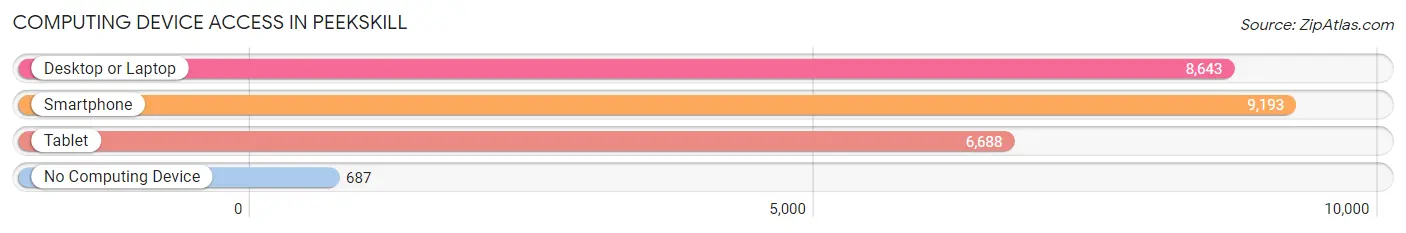
| Device Type | # Households | % Households |
| Desktop or Laptop | 8,643 | 79.4% |
| Smartphone | 9,193 | 84.5% |
| Tablet | 6,688 | 61.5% |
| No Computing Device | 687 | 6.3% |
| Total | 10,884 | 100.0% |
Internet Access in Peekskill
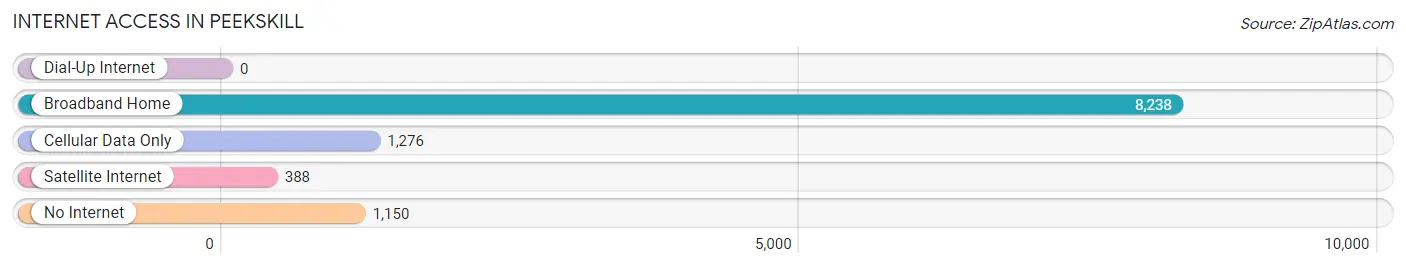
| Internet Type | # Households | % Households |
| Dial-Up Internet | 0 | 0.0% |
| Broadband Home | 8,238 | 75.7% |
| Cellular Data Only | 1,276 | 11.7% |
| Satellite Internet | 388 | 3.6% |
| No Internet | 1,150 | 10.6% |
| Total | 10,884 | 100.0% |
Peekskill Summary
Peekskill, NY is a city located in Westchester County, New York, United States. It is situated on the east bank of the Hudson River, about 50 miles north of New York City. The city has a population of 24,087 as of the 2010 census.
History
Peekskill was first settled in 1654 by Dutch and English settlers. The city was originally known as Peeks Kill, after the creek that ran through the area. The creek was named after the Peeke family, who were among the first settlers in the area. The city was incorporated in 1816 and was named after the creek.
In the 19th century, Peekskill was an important industrial center. It was home to several iron foundries, paper mills, and other factories. The city was also a major stop on the Hudson River Railroad, which connected New York City to Albany.
In the 20th century, Peekskill became a popular destination for artists and musicians. The city was home to the Peekskill Open Air Music Festival, which featured performances by Bob Dylan, Joan Baez, and other notable musicians.
Geography
Peekskill is located in Westchester County, New York, United States. It is situated on the east bank of the Hudson River, about 50 miles north of New York City. The city has a total area of 5.2 square miles, all of which is land.
The city is located in the Hudson Valley region of New York. It is bordered by the towns of Cortlandt, Yorktown, and Putnam Valley to the north; the town of Cortlandt to the east; the town of Cortlandt and the city of Poughkeepsie to the south; and the town of Cortlandt and the city of Beacon to the west.
Economy
Peekskill’s economy is largely based on manufacturing and services. The city is home to several factories and industrial parks, including the Peekskill Industrial Park and the Peekskill Business Park. The city is also home to several retail stores, restaurants, and other businesses.
The city is also home to several educational institutions, including the State University of New York at Peekskill, the Peekskill Extension Center of Westchester Community College, and the Peekskill Military Academy.
Demographics
As of the 2010 census, Peekskill had a population of 24,087. The racial makeup of the city was 57.2% White, 28.3% African American, 0.3% Native American, 2.2% Asian, 0.1% Pacific Islander, 8.7% from other races, and 3.4% from two or more races. Hispanic or Latino of any race were 20.2% of the population.
The median income for a household in the city was $50,945, and the median income for a family was $60,945. The per capita income for the city was $25,945. About 11.2% of families and 14.3% of the population were below the poverty line, including 19.2% of those under age 18 and 8.2% of those age 65 or over.
Common Questions
What is Per Capita Income in Peekskill?
Per Capita income in Peekskill is $46,211.
What is the Median Family Income in Peekskill?
Median Family Income in Peekskill is $108,756.
What is the Median Household income in Peekskill?
Median Household Income in Peekskill is $86,695.
What is Income or Wage Gap in Peekskill?
Income or Wage Gap in Peekskill is 13.1%.
Women in Peekskill earn 86.9 cents for every dollar earned by a man.
What is Inequality or Gini Index in Peekskill?
Inequality or Gini Index in Peekskill is 0.45.
What is the Total Population of Peekskill?
Total Population of Peekskill is 25,401.
What is the Total Male Population of Peekskill?
Total Male Population of Peekskill is 12,180.
What is the Total Female Population of Peekskill?
Total Female Population of Peekskill is 13,221.
What is the Ratio of Males per 100 Females in Peekskill?
There are 92.13 Males per 100 Females in Peekskill.
What is the Ratio of Females per 100 Males in Peekskill?
There are 108.55 Females per 100 Males in Peekskill.
What is the Median Population Age in Peekskill?
Median Population Age in Peekskill is 41.2 Years.
What is the Average Family Size in Peekskill
Average Family Size in Peekskill is 3.0 People.
What is the Average Household Size in Peekskill
Average Household Size in Peekskill is 2.3 People.
How Large is the Labor Force in Peekskill?
There are 14,857 People in the Labor Forcein in Peekskill.
What is the Percentage of People in the Labor Force in Peekskill?
68.8% of People are in the Labor Force in Peekskill.
What is the Unemployment Rate in Peekskill?
Unemployment Rate in Peekskill is 9.2%.