Shirley, NY Map & Demographics
Shirley Map
Shirley Overview
$48,537
PER CAPITA INCOME
$123,269
AVG FAMILY INCOME
$109,821
AVG HOUSEHOLD INCOME
21.2%
WAGE / INCOME GAP [ % ]
78.8¢/ $1
WAGE / INCOME GAP [ $ ]
0.49
INEQUALITY / GINI INDEX
26,498
TOTAL POPULATION
13,600
MALE POPULATION
12,898
FEMALE POPULATION
105.44
MALES / 100 FEMALES
94.84
FEMALES / 100 MALES
40.4
MEDIAN AGE
3.7
AVG FAMILY SIZE
3.2
AVG HOUSEHOLD SIZE
13,528
LABOR FORCE [ PEOPLE ]
63.9%
PERCENT IN LABOR FORCE
6.4%
UNEMPLOYMENT RATE
Shirley Zip Codes
Shirley Area Codes
Income in Shirley
Income Overview in Shirley
Per Capita Income in Shirley is $48,537, while median incomes of families and households are $123,269 and $109,821 respectively.
| Characteristic | Number | Measure |
| Per Capita Income | 26,498 | $48,537 |
| Median Family Income | 6,158 | $123,269 |
| Mean Family Income | 6,158 | $176,341 |
| Median Household Income | 8,090 | $109,821 |
| Mean Household Income | 8,090 | $156,964 |
| Income Deficit | 6,158 | $0 |
| Wage / Income Gap (%) | 26,498 | 21.19% |
| Wage / Income Gap ($) | 26,498 | 78.81¢ per $1 |
| Gini / Inequality Index | 26,498 | 0.49 |
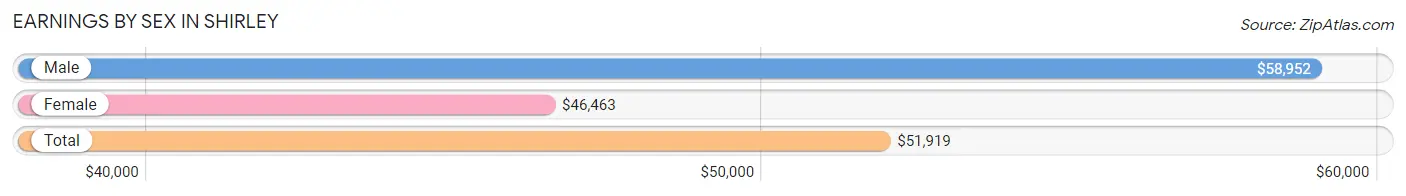
Earnings by Sex in Shirley
Average Earnings in Shirley are $51,919, $58,952 for men and $46,463 for women, a difference of 21.2%.
| Sex | Number | Average Earnings |
| Male | 7,377 (52.8%) | $58,952 |
| Female | 6,603 (47.2%) | $46,463 |
| Total | 13,980 (100.0%) | $51,919 |
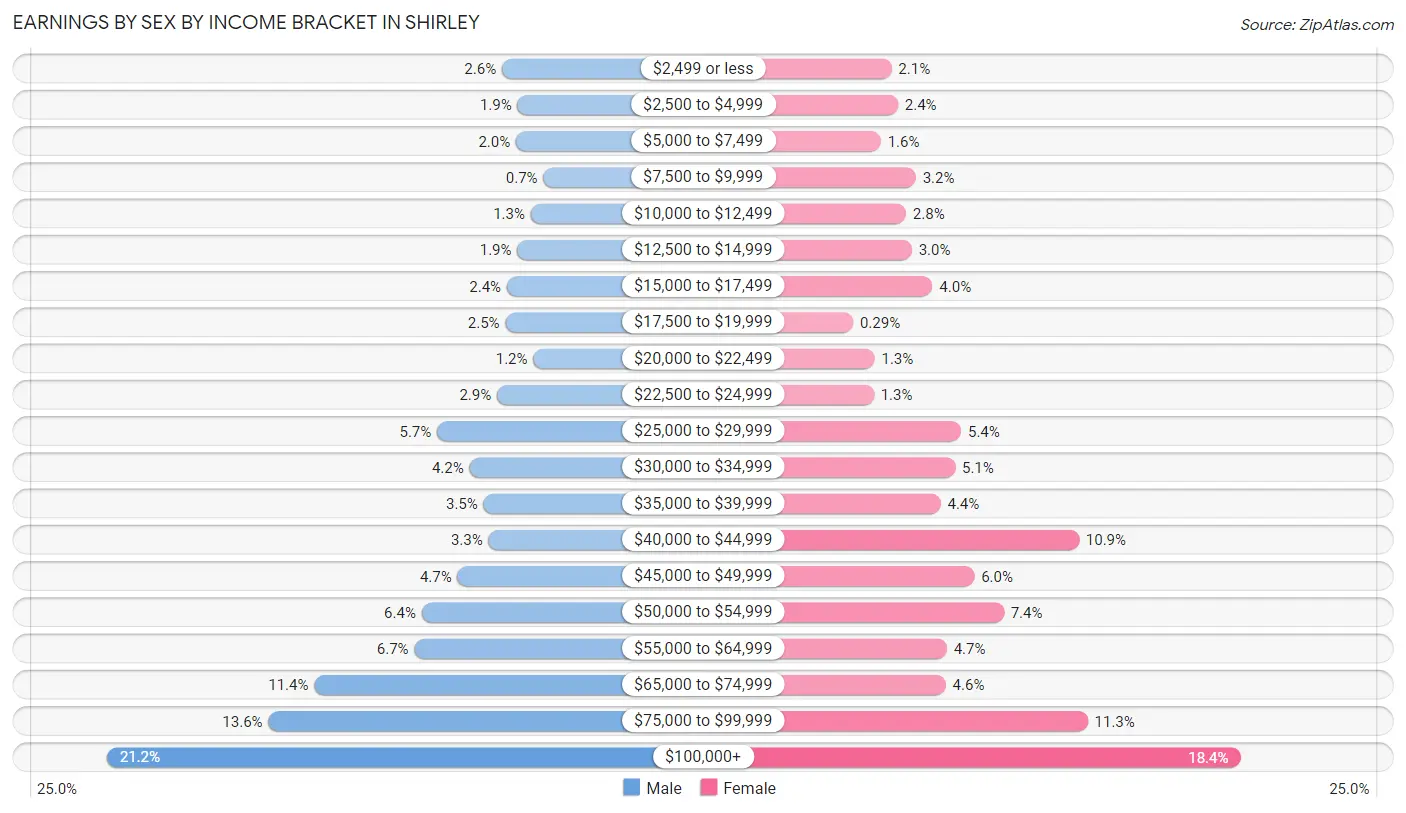
Earnings by Sex by Income Bracket in Shirley
The most common earnings brackets in Shirley are $100,000+ for men (1,560 | 21.1%) and $100,000+ for women (1,217 | 18.4%).
| Income | Male | Female |
| $2,499 or less | 195 (2.6%) | 138 (2.1%) |
| $2,500 to $4,999 | 141 (1.9%) | 158 (2.4%) |
| $5,000 to $7,499 | 146 (2.0%) | 105 (1.6%) |
| $7,500 to $9,999 | 52 (0.7%) | 213 (3.2%) |
| $10,000 to $12,499 | 95 (1.3%) | 183 (2.8%) |
| $12,500 to $14,999 | 142 (1.9%) | 201 (3.0%) |
| $15,000 to $17,499 | 178 (2.4%) | 265 (4.0%) |
| $17,500 to $19,999 | 183 (2.5%) | 19 (0.3%) |
| $20,000 to $22,499 | 86 (1.2%) | 86 (1.3%) |
| $22,500 to $24,999 | 212 (2.9%) | 83 (1.3%) |
| $25,000 to $29,999 | 419 (5.7%) | 353 (5.3%) |
| $30,000 to $34,999 | 307 (4.2%) | 335 (5.1%) |
| $35,000 to $39,999 | 258 (3.5%) | 290 (4.4%) |
| $40,000 to $44,999 | 241 (3.3%) | 718 (10.9%) |
| $45,000 to $49,999 | 348 (4.7%) | 394 (6.0%) |
| $50,000 to $54,999 | 472 (6.4%) | 485 (7.3%) |
| $55,000 to $64,999 | 497 (6.7%) | 309 (4.7%) |
| $65,000 to $74,999 | 843 (11.4%) | 306 (4.6%) |
| $75,000 to $99,999 | 1,002 (13.6%) | 745 (11.3%) |
| $100,000+ | 1,560 (21.1%) | 1,217 (18.4%) |
| Total | 7,377 (100.0%) | 6,603 (100.0%) |
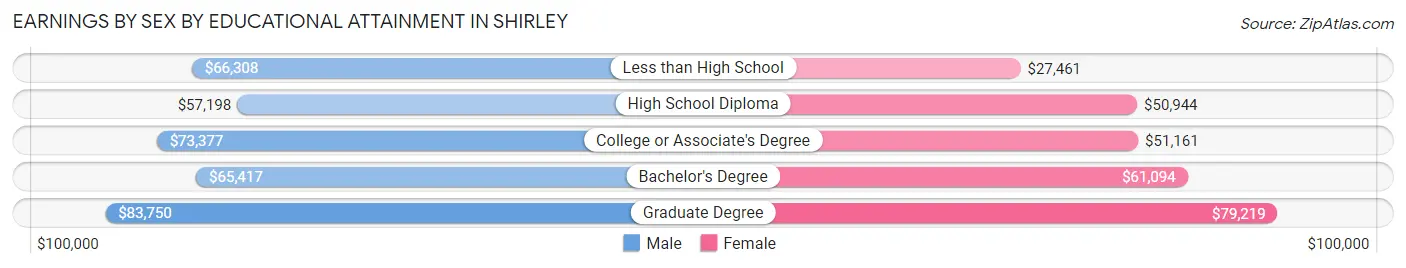
Earnings by Sex by Educational Attainment in Shirley
Average earnings in Shirley are $67,978 for men and $51,084 for women, a difference of 24.8%. Men with an educational attainment of graduate degree enjoy the highest average annual earnings of $83,750, while those with high school diploma education earn the least with $57,198. Women with an educational attainment of graduate degree earn the most with the average annual earnings of $79,219, while those with less than high school education have the smallest earnings of $27,461.
| Educational Attainment | Male Income | Female Income |
| Less than High School | $66,308 | $27,461 |
| High School Diploma | $57,198 | $50,944 |
| College or Associate's Degree | $73,377 | $51,161 |
| Bachelor's Degree | $65,417 | $61,094 |
| Graduate Degree | $83,750 | $79,219 |
| Total | $67,978 | $51,084 |
Family Income in Shirley
Family Income Brackets in Shirley
According to the Shirley family income data, there are 1,398 families falling into the $200,000+ income range, which is the most common income bracket and makes up 22.7% of all families. Conversely, the $10,000 to $14,999 income bracket is the least frequent group with only 37 families (0.6%) belonging to this category.
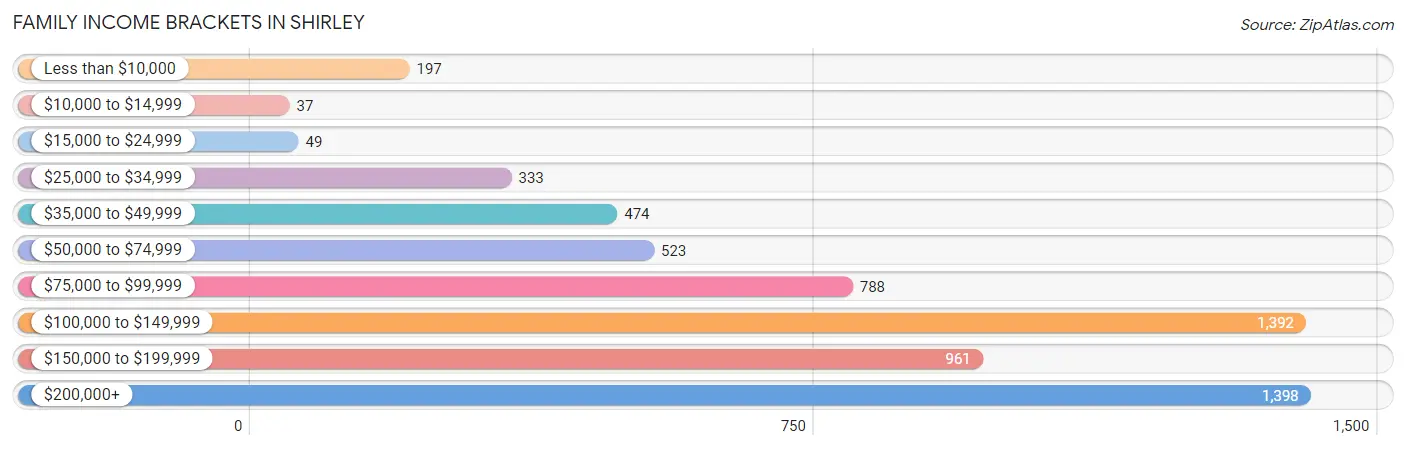
| Income Bracket | # Families | % Families |
| Less than $10,000 | 197 | 3.2% |
| $10,000 to $14,999 | 37 | 0.6% |
| $15,000 to $24,999 | 49 | 0.8% |
| $25,000 to $34,999 | 333 | 5.4% |
| $35,000 to $49,999 | 474 | 7.7% |
| $50,000 to $74,999 | 523 | 8.5% |
| $75,000 to $99,999 | 788 | 12.8% |
| $100,000 to $149,999 | 1,392 | 22.6% |
| $150,000 to $199,999 | 961 | 15.6% |
| $200,000+ | 1,398 | 22.7% |
Family Income by Famaliy Size in Shirley
7+ person families (90 | 1.5%) account for the highest median family income in Shirley with $196,250 per family, while 2-person families (1,945 | 31.6%) have the highest median income of $45,814 per family member.
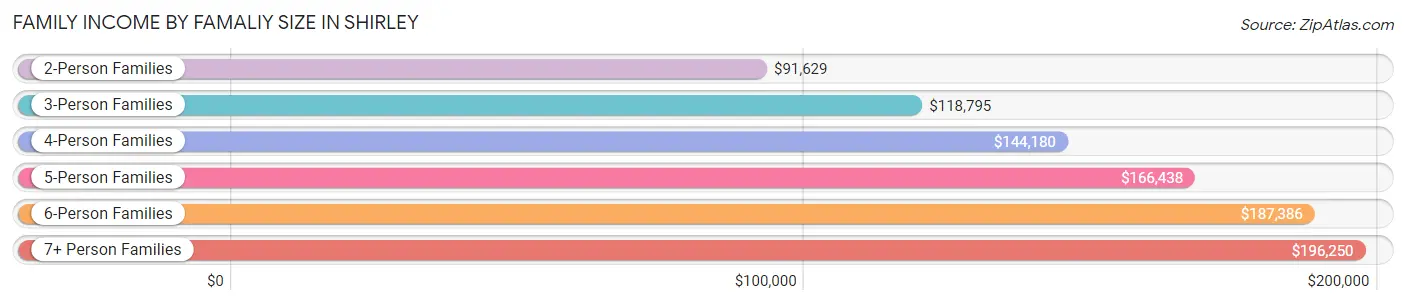
| Income Bracket | # Families | Median Income |
| 2-Person Families | 1,945 (31.6%) | $91,629 |
| 3-Person Families | 1,635 (26.6%) | $118,795 |
| 4-Person Families | 1,233 (20.0%) | $144,180 |
| 5-Person Families | 843 (13.7%) | $166,438 |
| 6-Person Families | 412 (6.7%) | $187,386 |
| 7+ Person Families | 90 (1.5%) | $196,250 |
| Total | 6,158 (100.0%) | $123,269 |
Family Income by Number of Earners in Shirley
The median family income in Shirley is $123,269, with families comprising 3+ earners (1,245) having the highest median family income of $208,750, while families with no earners (759) have the lowest median family income of $43,624, accounting for 20.2% and 12.3% of families, respectively.
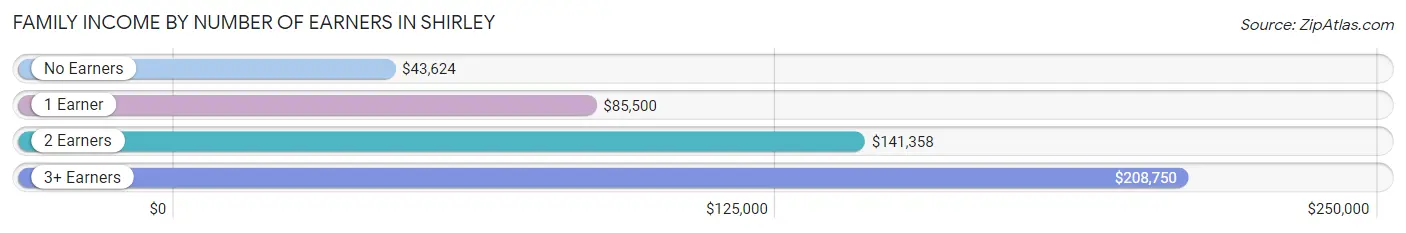
| Number of Earners | # Families | Median Income |
| No Earners | 759 (12.3%) | $43,624 |
| 1 Earner | 1,702 (27.6%) | $85,500 |
| 2 Earners | 2,452 (39.8%) | $141,358 |
| 3+ Earners | 1,245 (20.2%) | $208,750 |
| Total | 6,158 (100.0%) | $123,269 |
Household Income in Shirley
Household Income Brackets in Shirley
With 1,634 households falling in the category, the $100,000 to $149,999 income range is the most frequent in Shirley, accounting for 20.2% of all households. In contrast, only 81 households (1.0%) fall into the $10,000 to $14,999 income bracket, making it the least populous group.
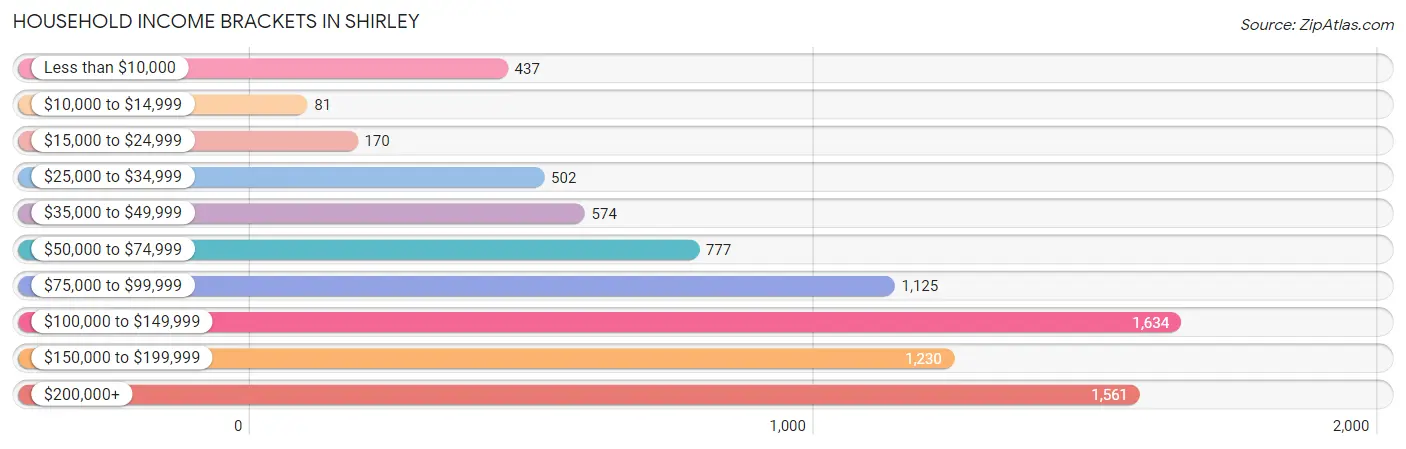
| Income Bracket | # Households | % Households |
| Less than $10,000 | 437 | 5.4% |
| $10,000 to $14,999 | 81 | 1.0% |
| $15,000 to $24,999 | 170 | 2.1% |
| $25,000 to $34,999 | 502 | 6.2% |
| $35,000 to $49,999 | 574 | 7.1% |
| $50,000 to $74,999 | 777 | 9.6% |
| $75,000 to $99,999 | 1,125 | 13.9% |
| $100,000 to $149,999 | 1,634 | 20.2% |
| $150,000 to $199,999 | 1,230 | 15.2% |
| $200,000+ | 1,561 | 19.3% |
Household Income by Householder Age in Shirley
The median household income in Shirley is $109,821, with the highest median household income of $134,340 found in the 45 to 64 years age bracket for the primary householder. A total of 3,755 households (46.4%) fall into this category. Meanwhile, the 15 to 24 years age bracket for the primary householder has the lowest median household income of $0, with 197 households (2.4%) in this group.
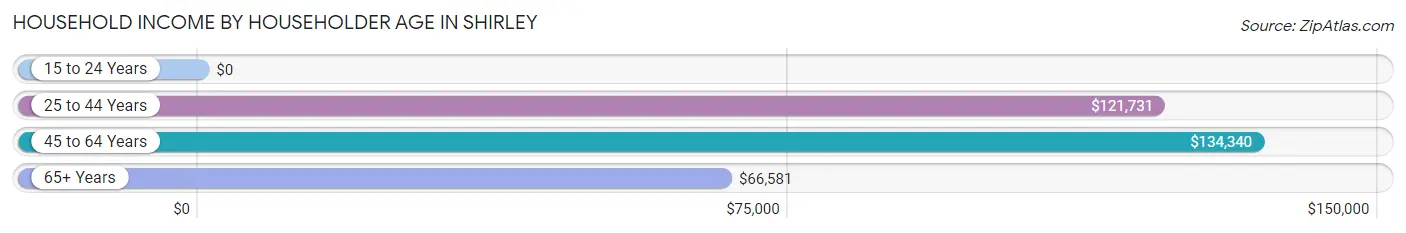
| Income Bracket | # Households | Median Income |
| 15 to 24 Years | 197 (2.4%) | $0 |
| 25 to 44 Years | 2,076 (25.7%) | $121,731 |
| 45 to 64 Years | 3,755 (46.4%) | $134,340 |
| 65+ Years | 2,062 (25.5%) | $66,581 |
| Total | 8,090 (100.0%) | $109,821 |
Poverty in Shirley
Income Below Poverty by Sex and Age in Shirley
With 7.4% poverty level for males and 9.0% for females among the residents of Shirley, 5 year old males and 16 and 17 year old females are the most vulnerable to poverty, with 28 males (27.7%) and 82 females (36.0%) in their respective age groups living below the poverty level.
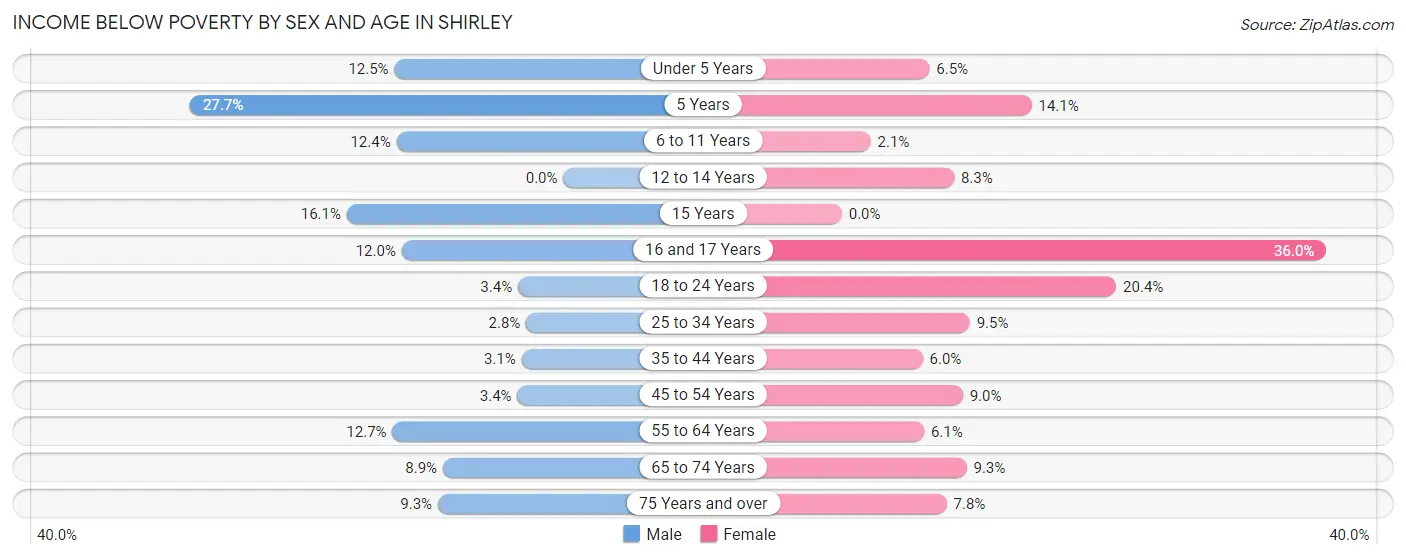
| Age Bracket | Male | Female |
| Under 5 Years | 105 (12.5%) | 36 (6.5%) |
| 5 Years | 28 (27.7%) | 31 (14.1%) |
| 6 to 11 Years | 145 (12.4%) | 20 (2.1%) |
| 12 to 14 Years | 0 (0.0%) | 17 (8.3%) |
| 15 Years | 23 (16.1%) | 0 (0.0%) |
| 16 and 17 Years | 45 (12.0%) | 82 (36.0%) |
| 18 to 24 Years | 33 (3.4%) | 240 (20.4%) |
| 25 to 34 Years | 43 (2.8%) | 172 (9.5%) |
| 35 to 44 Years | 55 (3.1%) | 96 (6.0%) |
| 45 to 54 Years | 58 (3.4%) | 150 (9.0%) |
| 55 to 64 Years | 309 (12.7%) | 132 (6.1%) |
| 65 to 74 Years | 117 (8.9%) | 129 (9.3%) |
| 75 Years and over | 31 (9.3%) | 36 (7.8%) |
| Total | 992 (7.4%) | 1,141 (9.0%) |
Income Above Poverty by Sex and Age in Shirley
According to the poverty statistics in Shirley, males aged 12 to 14 years and females aged 15 years are the age groups that are most secure financially, with 100.0% of males and 100.0% of females in these age groups living above the poverty line.
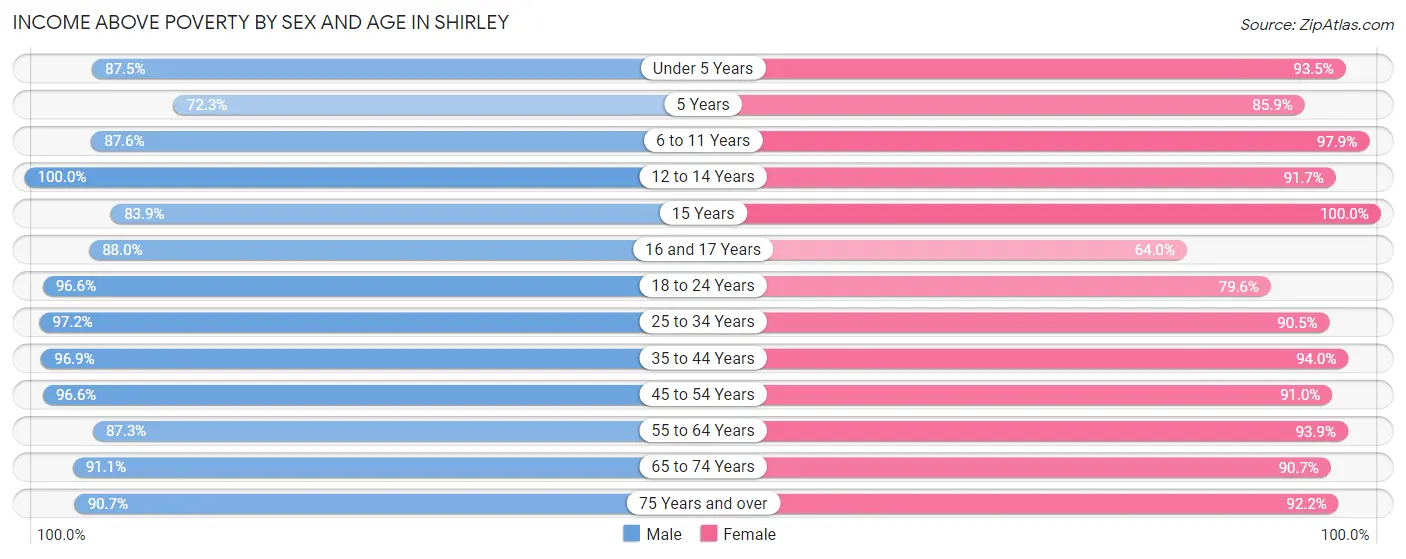
| Age Bracket | Male | Female |
| Under 5 Years | 732 (87.5%) | 518 (93.5%) |
| 5 Years | 73 (72.3%) | 189 (85.9%) |
| 6 to 11 Years | 1,025 (87.6%) | 913 (97.9%) |
| 12 to 14 Years | 753 (100.0%) | 187 (91.7%) |
| 15 Years | 120 (83.9%) | 251 (100.0%) |
| 16 and 17 Years | 330 (88.0%) | 146 (64.0%) |
| 18 to 24 Years | 946 (96.6%) | 938 (79.6%) |
| 25 to 34 Years | 1,513 (97.2%) | 1,638 (90.5%) |
| 35 to 44 Years | 1,718 (96.9%) | 1,505 (94.0%) |
| 45 to 54 Years | 1,643 (96.6%) | 1,520 (91.0%) |
| 55 to 64 Years | 2,126 (87.3%) | 2,033 (93.9%) |
| 65 to 74 Years | 1,191 (91.1%) | 1,264 (90.7%) |
| 75 Years and over | 302 (90.7%) | 427 (92.2%) |
| Total | 12,472 (92.6%) | 11,529 (91.0%) |
Income Below Poverty Among Married-Couple Families in Shirley
The poverty statistics for married-couple families in Shirley show that 1.9% or 83 of the total 4,466 families live below the poverty line. Families with no children have the highest poverty rate of 2.1%, comprising of 49 families. On the other hand, families with 3 or 4 children have the lowest poverty rate of 0.0%, which includes 0 families.
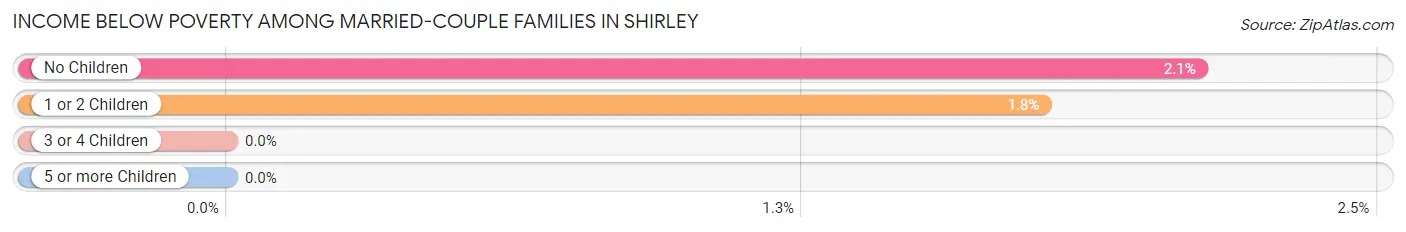
| Children | Above Poverty | Below Poverty |
| No Children | 2,277 (97.9%) | 49 (2.1%) |
| 1 or 2 Children | 1,887 (98.2%) | 34 (1.8%) |
| 3 or 4 Children | 169 (100.0%) | 0 (0.0%) |
| 5 or more Children | 50 (100.0%) | 0 (0.0%) |
| Total | 4,383 (98.1%) | 83 (1.9%) |
Income Below Poverty Among Single-Parent Households in Shirley
According to the poverty data in Shirley, 8.2% or 48 single-father households and 16.9% or 187 single-mother households are living below the poverty line. Among single-father households, those with 1 or 2 children have the highest poverty rate, with 33 households (12.0%) experiencing poverty. Likewise, among single-mother households, those with 3 or 4 children have the highest poverty rate, with 60 households (45.5%) falling below the poverty line.
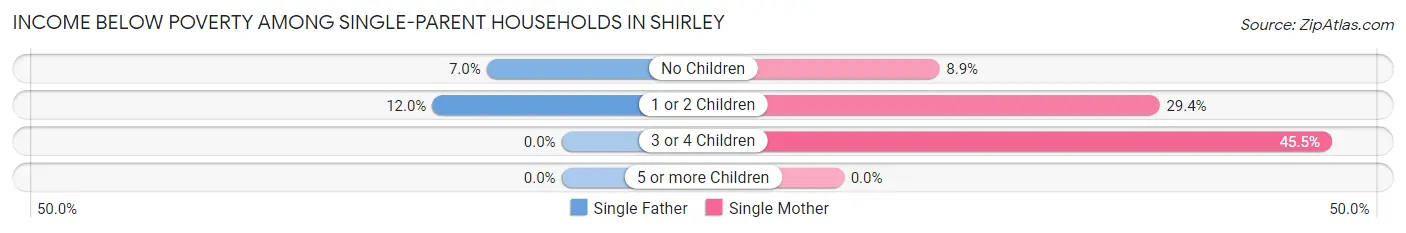
| Children | Single Father | Single Mother |
| No Children | 15 (7.0%) | 62 (8.9%) |
| 1 or 2 Children | 33 (12.0%) | 65 (29.4%) |
| 3 or 4 Children | 0 (0.0%) | 60 (45.5%) |
| 5 or more Children | 0 (0.0%) | 0 (0.0%) |
| Total | 48 (8.2%) | 187 (16.9%) |
Income Below Poverty Among Married-Couple vs Single-Parent Households in Shirley
The poverty data for Shirley shows that 83 of the married-couple family households (1.9%) and 235 of the single-parent households (13.9%) are living below the poverty level. Within the married-couple family households, those with no children have the highest poverty rate, with 49 households (2.1%) falling below the poverty line. Among the single-parent households, those with 3 or 4 children have the highest poverty rate, with 60 household (27.9%) living below poverty.
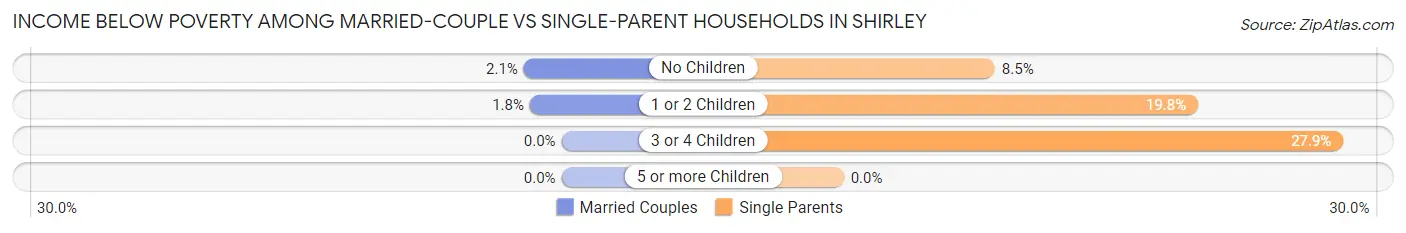
| Children | Married-Couple Families | Single-Parent Households |
| No Children | 49 (2.1%) | 77 (8.5%) |
| 1 or 2 Children | 34 (1.8%) | 98 (19.8%) |
| 3 or 4 Children | 0 (0.0%) | 60 (27.9%) |
| 5 or more Children | 0 (0.0%) | 0 (0.0%) |
| Total | 83 (1.9%) | 235 (13.9%) |
Race in Shirley
The most populous races in Shirley are White / Caucasian (19,470 | 73.5%), Hispanic or Latino (6,211 | 23.4%), and Two or more Races (2,137 | 8.1%).
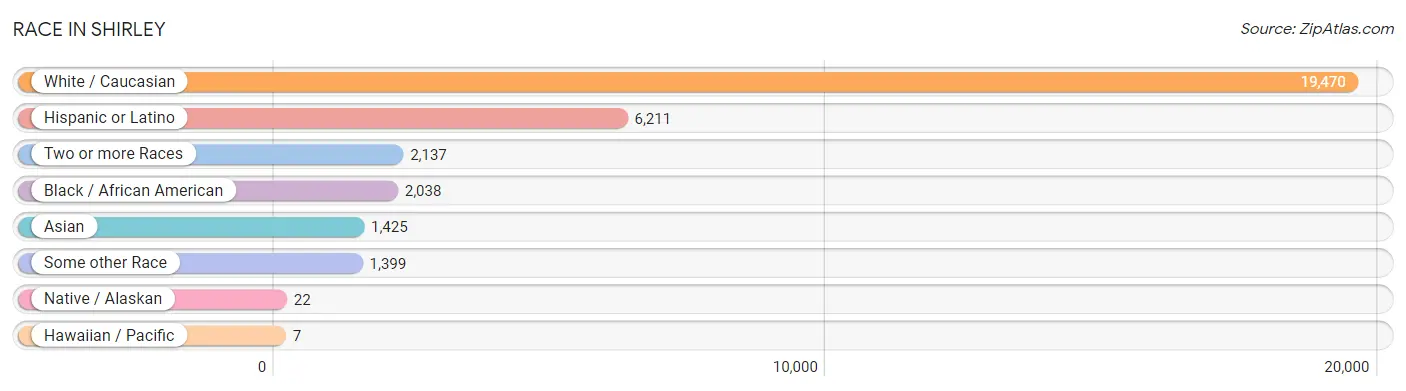
| Race | # Population | % Population |
| Asian | 1,425 | 5.4% |
| Black / African American | 2,038 | 7.7% |
| Hawaiian / Pacific | 7 | 0.0% |
| Hispanic or Latino | 6,211 | 23.4% |
| Native / Alaskan | 22 | 0.1% |
| White / Caucasian | 19,470 | 73.5% |
| Two or more Races | 2,137 | 8.1% |
| Some other Race | 1,399 | 5.3% |
| Total | 26,498 | 100.0% |
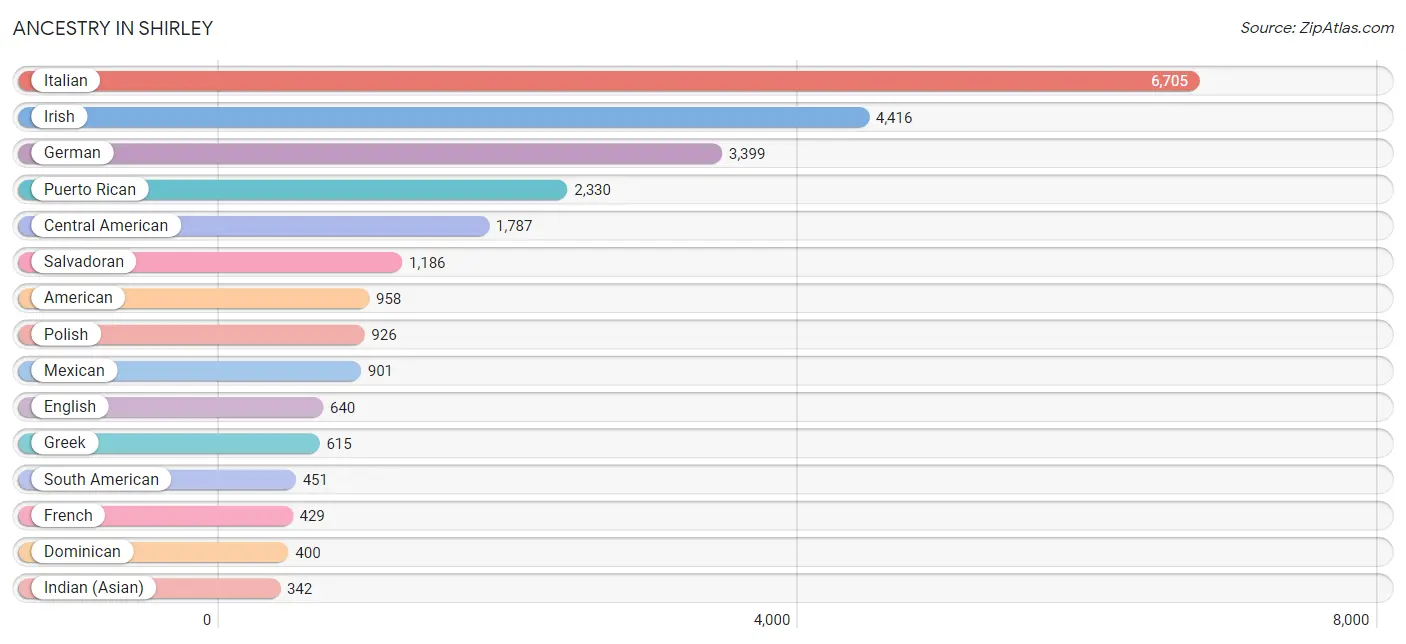
Ancestry in Shirley
The most populous ancestries reported in Shirley are Italian (6,705 | 25.3%), Irish (4,416 | 16.7%), German (3,399 | 12.8%), Puerto Rican (2,330 | 8.8%), and Central American (1,787 | 6.7%), together accounting for 70.3% of all Shirley residents.
| Ancestry | # Population | % Population |
| African | 28 | 0.1% |
| Albanian | 26 | 0.1% |
| American | 958 | 3.6% |
| Arab | 56 | 0.2% |
| Armenian | 7 | 0.0% |
| Australian | 5 | 0.0% |
| Austrian | 53 | 0.2% |
| Bhutanese | 14 | 0.1% |
| British West Indian | 158 | 0.6% |
| Bulgarian | 14 | 0.1% |
| Canadian | 26 | 0.1% |
| Central American | 1,787 | 6.7% |
| Central American Indian | 128 | 0.5% |
| Cherokee | 18 | 0.1% |
| Colombian | 249 | 0.9% |
| Costa Rican | 24 | 0.1% |
| Creek | 6 | 0.0% |
| Croatian | 9 | 0.0% |
| Cuban | 11 | 0.0% |
| Czech | 108 | 0.4% |
| Czechoslovakian | 164 | 0.6% |
| Danish | 129 | 0.5% |
| Dominican | 400 | 1.5% |
| Dutch | 63 | 0.2% |
| Eastern European | 23 | 0.1% |
| Ecuadorian | 143 | 0.5% |
| Egyptian | 33 | 0.1% |
| English | 640 | 2.4% |
| European | 175 | 0.7% |
| Filipino | 154 | 0.6% |
| Finnish | 23 | 0.1% |
| French | 429 | 1.6% |
| French Canadian | 29 | 0.1% |
| German | 3,399 | 12.8% |
| Greek | 615 | 2.3% |
| Guatemalan | 270 | 1.0% |
| Guyanese | 234 | 0.9% |
| Haitian | 18 | 0.1% |
| Honduran | 232 | 0.9% |
| Hungarian | 105 | 0.4% |
| Indian (Asian) | 342 | 1.3% |
| Irish | 4,416 | 16.7% |
| Italian | 6,705 | 25.3% |
| Jamaican | 102 | 0.4% |
| Japanese | 14 | 0.1% |
| Korean | 85 | 0.3% |
| Lebanese | 23 | 0.1% |
| Lithuanian | 38 | 0.1% |
| Mexican | 901 | 3.4% |
| Native Hawaiian | 7 | 0.0% |
| Nicaraguan | 26 | 0.1% |
| Norwegian | 53 | 0.2% |
| Panamanian | 49 | 0.2% |
| Peruvian | 9 | 0.0% |
| Polish | 926 | 3.5% |
| Portuguese | 27 | 0.1% |
| Puerto Rican | 2,330 | 8.8% |
| Romanian | 53 | 0.2% |
| Russian | 165 | 0.6% |
| Salvadoran | 1,186 | 4.5% |
| Scandinavian | 52 | 0.2% |
| Scotch-Irish | 20 | 0.1% |
| Scottish | 83 | 0.3% |
| Slavic | 19 | 0.1% |
| South American | 451 | 1.7% |
| Spaniard | 191 | 0.7% |
| Spanish | 70 | 0.3% |
| Sri Lankan | 75 | 0.3% |
| Subsaharan African | 28 | 0.1% |
| Swedish | 109 | 0.4% |
| Swiss | 13 | 0.1% |
| Thai | 285 | 1.1% |
| Trinidadian and Tobagonian | 29 | 0.1% |
| Turkish | 58 | 0.2% |
| Ukrainian | 79 | 0.3% |
| Venezuelan | 50 | 0.2% |
| Welsh | 10 | 0.0% |
| West Indian | 22 | 0.1% |
| Yugoslavian | 12 | 0.1% | View All 79 Rows |
Immigrants in Shirley
The most numerous immigrant groups reported in Shirley came from Latin America (1,902 | 7.2%), Central America (1,177 | 4.4%), Asia (907 | 3.4%), South Central Asia (551 | 2.1%), and El Salvador (463 | 1.8%), together accounting for 18.9% of all Shirley residents.
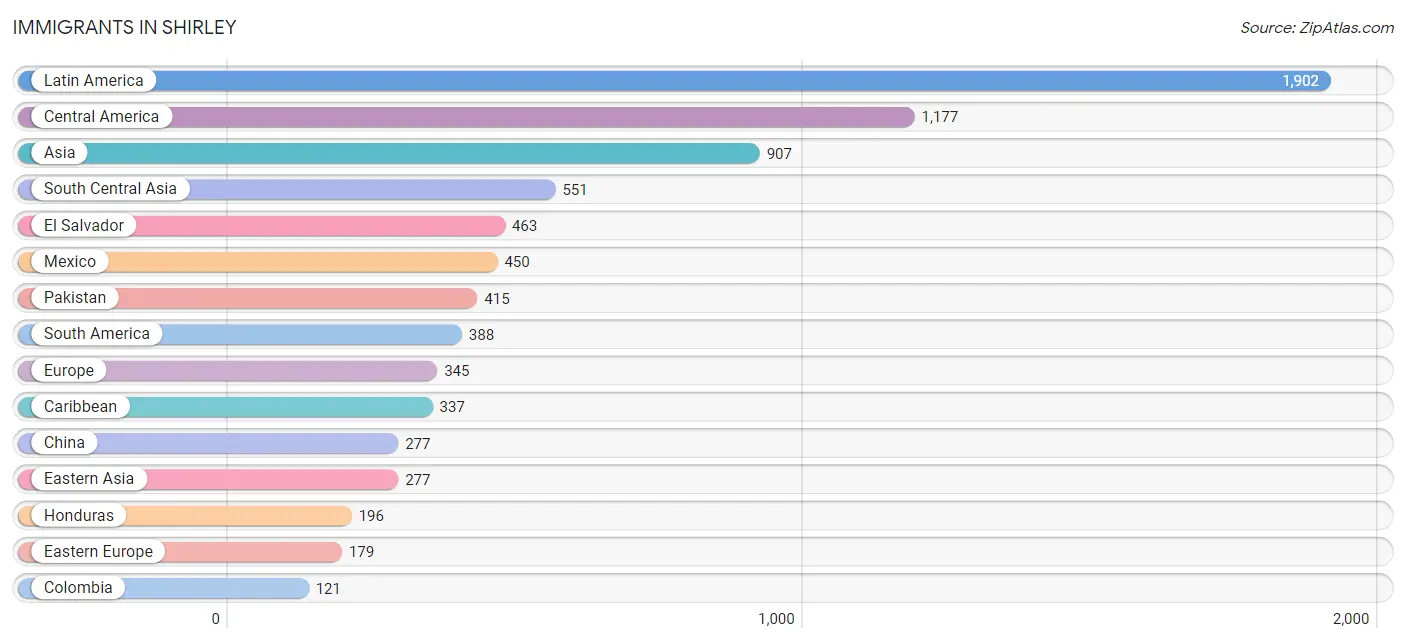
| Immigration Origin | # Population | % Population |
| Africa | 33 | 0.1% |
| Albania | 18 | 0.1% |
| Asia | 907 | 3.4% |
| Bangladesh | 10 | 0.0% |
| Bulgaria | 14 | 0.1% |
| Canada | 55 | 0.2% |
| Caribbean | 337 | 1.3% |
| Central America | 1,177 | 4.4% |
| China | 277 | 1.1% |
| Colombia | 121 | 0.5% |
| Costa Rica | 24 | 0.1% |
| Croatia | 9 | 0.0% |
| Cuba | 7 | 0.0% |
| Dominican Republic | 110 | 0.4% |
| Eastern Asia | 277 | 1.1% |
| Eastern Europe | 179 | 0.7% |
| Ecuador | 84 | 0.3% |
| Egypt | 33 | 0.1% |
| El Salvador | 463 | 1.8% |
| England | 15 | 0.1% |
| Europe | 345 | 1.3% |
| France | 13 | 0.1% |
| Germany | 10 | 0.0% |
| Guatemala | 18 | 0.1% |
| Guyana | 98 | 0.4% |
| Haiti | 79 | 0.3% |
| Honduras | 196 | 0.7% |
| Hong Kong | 7 | 0.0% |
| India | 98 | 0.4% |
| Iran | 28 | 0.1% |
| Ireland | 10 | 0.0% |
| Italy | 52 | 0.2% |
| Jamaica | 112 | 0.4% |
| Latin America | 1,902 | 7.2% |
| Malaysia | 34 | 0.1% |
| Mexico | 450 | 1.7% |
| Netherlands | 12 | 0.1% |
| Nicaragua | 26 | 0.1% |
| Northern Africa | 33 | 0.1% |
| Northern Europe | 39 | 0.2% |
| Pakistan | 415 | 1.6% |
| Philippines | 29 | 0.1% |
| Poland | 63 | 0.2% |
| Portugal | 15 | 0.1% |
| Romania | 53 | 0.2% |
| Russia | 16 | 0.1% |
| Scotland | 14 | 0.1% |
| South America | 388 | 1.5% |
| South Central Asia | 551 | 2.1% |
| South Eastern Asia | 79 | 0.3% |
| Southern Europe | 92 | 0.4% |
| Taiwan | 84 | 0.3% |
| Trinidad and Tobago | 29 | 0.1% |
| Venezuela | 85 | 0.3% |
| Vietnam | 16 | 0.1% |
| Western Europe | 35 | 0.1% | View All 56 Rows |
Sex and Age in Shirley
Sex and Age in Shirley
The most populous age groups in Shirley are 55 to 59 Years (1,582 | 11.6%) for men and 55 to 59 Years (1,276 | 9.9%) for women.
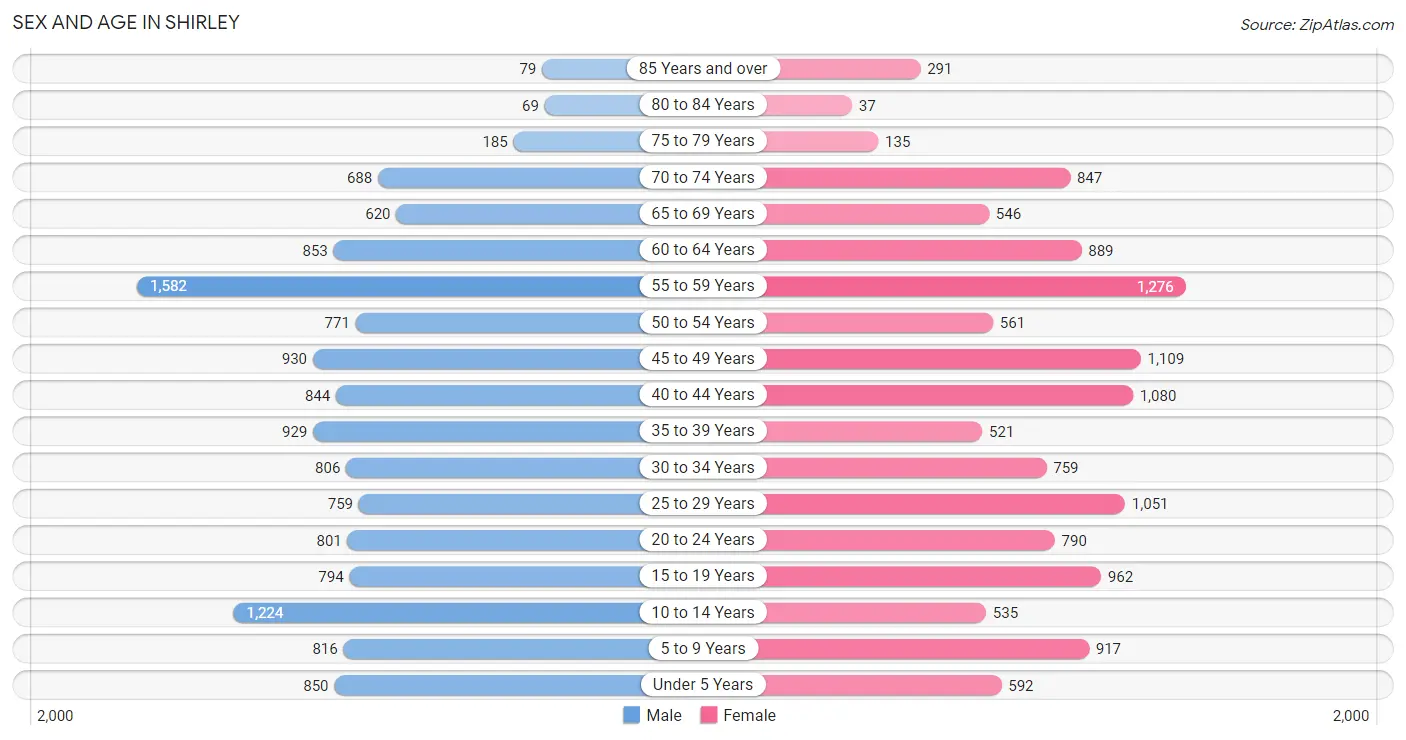
| Age Bracket | Male | Female |
| Under 5 Years | 850 (6.2%) | 592 (4.6%) |
| 5 to 9 Years | 816 (6.0%) | 917 (7.1%) |
| 10 to 14 Years | 1,224 (9.0%) | 535 (4.2%) |
| 15 to 19 Years | 794 (5.8%) | 962 (7.5%) |
| 20 to 24 Years | 801 (5.9%) | 790 (6.1%) |
| 25 to 29 Years | 759 (5.6%) | 1,051 (8.2%) |
| 30 to 34 Years | 806 (5.9%) | 759 (5.9%) |
| 35 to 39 Years | 929 (6.8%) | 521 (4.0%) |
| 40 to 44 Years | 844 (6.2%) | 1,080 (8.4%) |
| 45 to 49 Years | 930 (6.8%) | 1,109 (8.6%) |
| 50 to 54 Years | 771 (5.7%) | 561 (4.3%) |
| 55 to 59 Years | 1,582 (11.6%) | 1,276 (9.9%) |
| 60 to 64 Years | 853 (6.3%) | 889 (6.9%) |
| 65 to 69 Years | 620 (4.6%) | 546 (4.2%) |
| 70 to 74 Years | 688 (5.1%) | 847 (6.6%) |
| 75 to 79 Years | 185 (1.4%) | 135 (1.1%) |
| 80 to 84 Years | 69 (0.5%) | 37 (0.3%) |
| 85 Years and over | 79 (0.6%) | 291 (2.3%) |
| Total | 13,600 (100.0%) | 12,898 (100.0%) |
Families and Households in Shirley
Median Family Size in Shirley
The median family size in Shirley is 3.66 persons per family, with single male/father families (588 | 9.6%) accounting for the largest median family size of 3.82 persons per family. On the other hand, single female/mother families (1,104 | 17.9%) represent the smallest median family size with 3.56 persons per family.
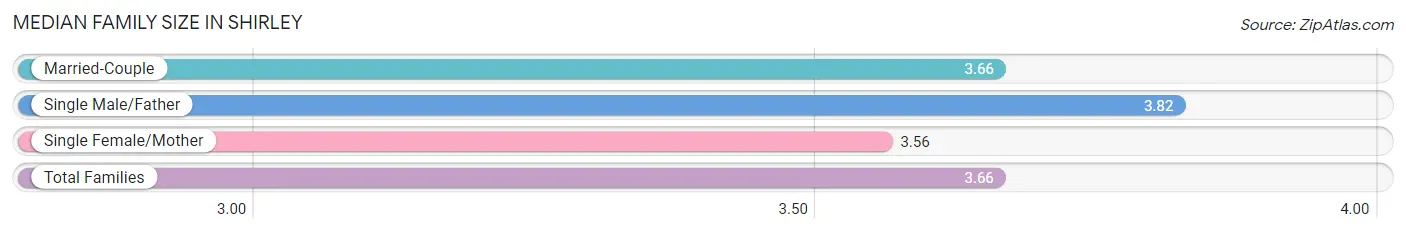
| Family Type | # Families | Family Size |
| Married-Couple | 4,466 (72.5%) | 3.66 |
| Single Male/Father | 588 (9.6%) | 3.82 |
| Single Female/Mother | 1,104 (17.9%) | 3.56 |
| Total Families | 6,158 (100.0%) | 3.66 |
Median Household Size in Shirley
The median household size in Shirley is 3.24 persons per household, with single male/father households (588 | 7.3%) accounting for the largest median household size of 4.6 persons per household. non-family households (1,932 | 23.9%) represent the smallest median household size with 1.51 persons per household.
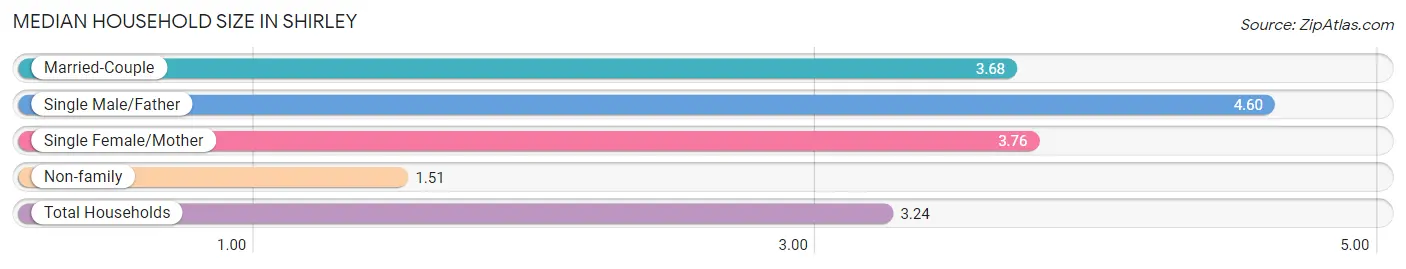
| Household Type | # Households | Household Size |
| Married-Couple | 4,466 (55.2%) | 3.68 |
| Single Male/Father | 588 (7.3%) | 4.60 |
| Single Female/Mother | 1,104 (13.7%) | 3.76 |
| Non-family | 1,932 (23.9%) | 1.51 |
| Total Households | 8,090 (100.0%) | 3.24 |
Household Size by Marriage Status in Shirley
Out of a total of 8,090 households in Shirley, 6,158 (76.1%) are family households, while 1,932 (23.9%) are nonfamily households. The most numerous type of family households are 2-person households, comprising 1,734, and the most common type of nonfamily households are 1-person households, comprising 1,319.
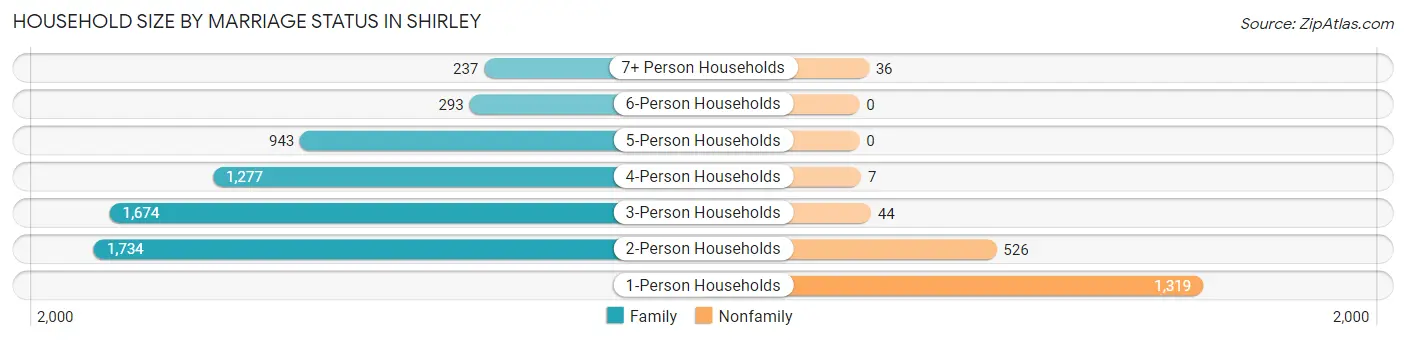
| Household Size | Family Households | Nonfamily Households |
| 1-Person Households | - | 1,319 (16.3%) |
| 2-Person Households | 1,734 (21.4%) | 526 (6.5%) |
| 3-Person Households | 1,674 (20.7%) | 44 (0.5%) |
| 4-Person Households | 1,277 (15.8%) | 7 (0.1%) |
| 5-Person Households | 943 (11.7%) | 0 (0.0%) |
| 6-Person Households | 293 (3.6%) | 0 (0.0%) |
| 7+ Person Households | 237 (2.9%) | 36 (0.4%) |
| Total | 6,158 (76.1%) | 1,932 (23.9%) |
Female Fertility in Shirley
Fertility by Age in Shirley
Average fertility rate in Shirley is 66.0 births per 1,000 women. Women in the age bracket of 20 to 34 years have the highest fertility rate with 127.0 births per 1,000 women. Women in the age bracket of 20 to 34 years acount for 78.8% of all women with births.
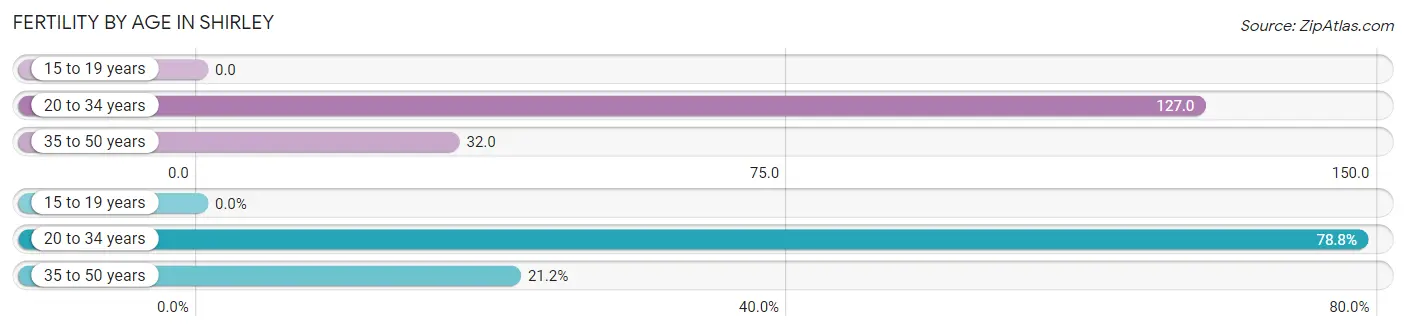
| Age Bracket | Women with Births | Births / 1,000 Women |
| 15 to 19 years | 0 (0.0%) | 0.0 |
| 20 to 34 years | 330 (78.8%) | 127.0 |
| 35 to 50 years | 89 (21.2%) | 32.0 |
| Total | 419 (100.0%) | 66.0 |
Fertility by Age by Marriage Status in Shirley
38.9% of women with births (419) in Shirley are married. The highest percentage of unmarried women with births falls into 20 to 34 years age bracket with 66.7% of them unmarried at the time of birth, while the lowest percentage of unmarried women with births belong to 35 to 50 years age bracket with 40.4% of them unmarried.
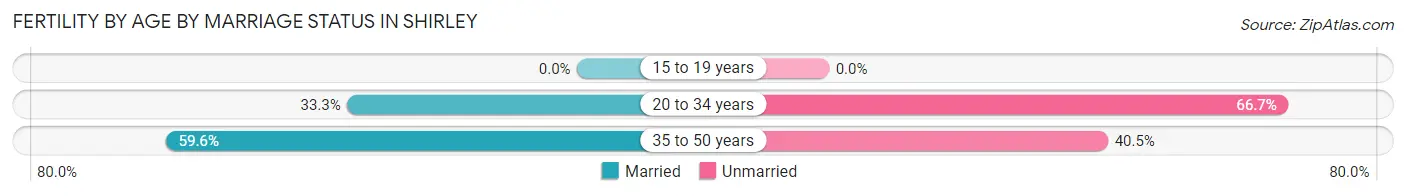
| Age Bracket | Married | Unmarried |
| 15 to 19 years | 0 (0.0%) | 0 (0.0%) |
| 20 to 34 years | 110 (33.3%) | 220 (66.7%) |
| 35 to 50 years | 53 (59.6%) | 36 (40.5%) |
| Total | 163 (38.9%) | 256 (61.1%) |
Fertility by Education in Shirley
Average fertility rate in Shirley is 66.0 births per 1,000 women. Women with the education attainment of bachelor's degree have the highest fertility rate of 142.0 births per 1,000 women, while women with the education attainment of graduate degree have the lowest fertility at 22.0 births per 1,000 women. Women with the education attainment of bachelor's degree represent 32.7% of all women with births.
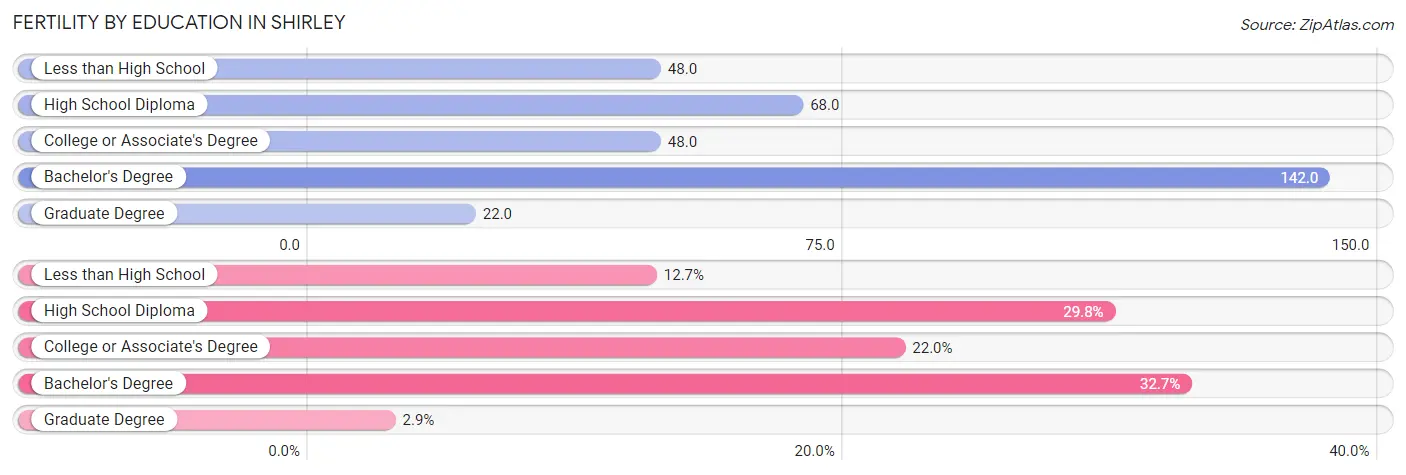
| Educational Attainment | Women with Births | Births / 1,000 Women |
| Less than High School | 53 (12.7%) | 48.0 |
| High School Diploma | 125 (29.8%) | 68.0 |
| College or Associate's Degree | 92 (22.0%) | 48.0 |
| Bachelor's Degree | 137 (32.7%) | 142.0 |
| Graduate Degree | 12 (2.9%) | 22.0 |
| Total | 419 (100.0%) | 66.0 |
Fertility by Education by Marriage Status in Shirley
61.1% of women with births in Shirley are unmarried. Women with the educational attainment of graduate degree are most likely to be married with 100.0% of them married at childbirth, while women with the educational attainment of less than high school are least likely to be married with 98.1% of them unmarried at childbirth.
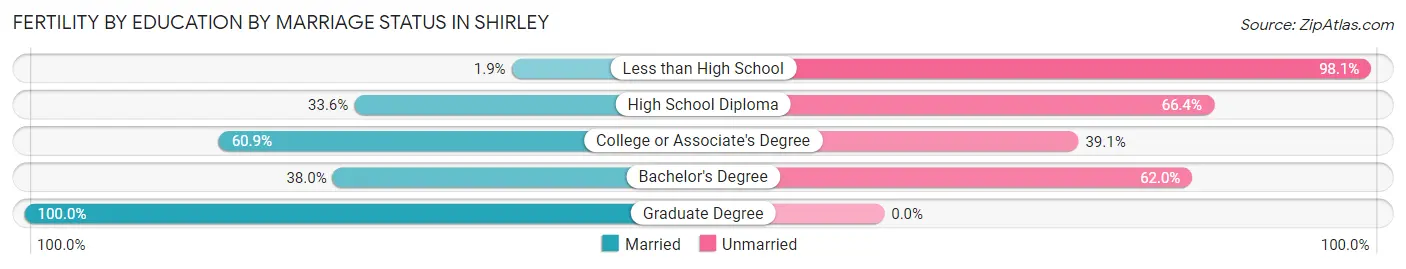
| Educational Attainment | Married | Unmarried |
| Less than High School | 1 (1.9%) | 52 (98.1%) |
| High School Diploma | 42 (33.6%) | 83 (66.4%) |
| College or Associate's Degree | 56 (60.9%) | 36 (39.1%) |
| Bachelor's Degree | 52 (38.0%) | 85 (62.0%) |
| Graduate Degree | 12 (100.0%) | 0 (0.0%) |
| Total | 163 (38.9%) | 256 (61.1%) |
Employment Characteristics in Shirley
Employment by Class of Employer in Shirley
Among the 12,464 employed individuals in Shirley, private company employees (8,479 | 68.0%), local government employees (1,091 | 8.7%), and not-for-profit organizations (838 | 6.7%) make up the most common classes of employment.
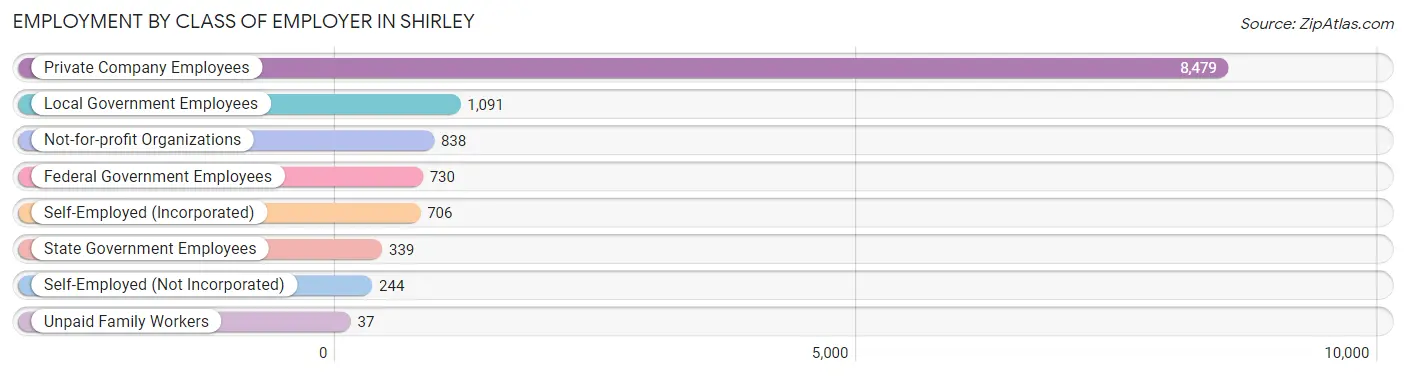
| Employer Class | # Employees | % Employees |
| Private Company Employees | 8,479 | 68.0% |
| Self-Employed (Incorporated) | 706 | 5.7% |
| Self-Employed (Not Incorporated) | 244 | 2.0% |
| Not-for-profit Organizations | 838 | 6.7% |
| Local Government Employees | 1,091 | 8.7% |
| State Government Employees | 339 | 2.7% |
| Federal Government Employees | 730 | 5.9% |
| Unpaid Family Workers | 37 | 0.3% |
| Total | 12,464 | 100.0% |
Employment Status by Age in Shirley
According to the labor force statistics for Shirley, out of the total population over 16 years of age (21,170), 63.9% or 13,528 individuals are in the labor force, with 6.4% or 866 of them unemployed. The age group with the highest labor force participation rate is 30 to 34 years, with 88.2% or 1,380 individuals in the labor force. Within the labor force, the 20 to 24 years age range has the highest percentage of unemployed individuals, with 26.0% or 335 of them being unemployed.
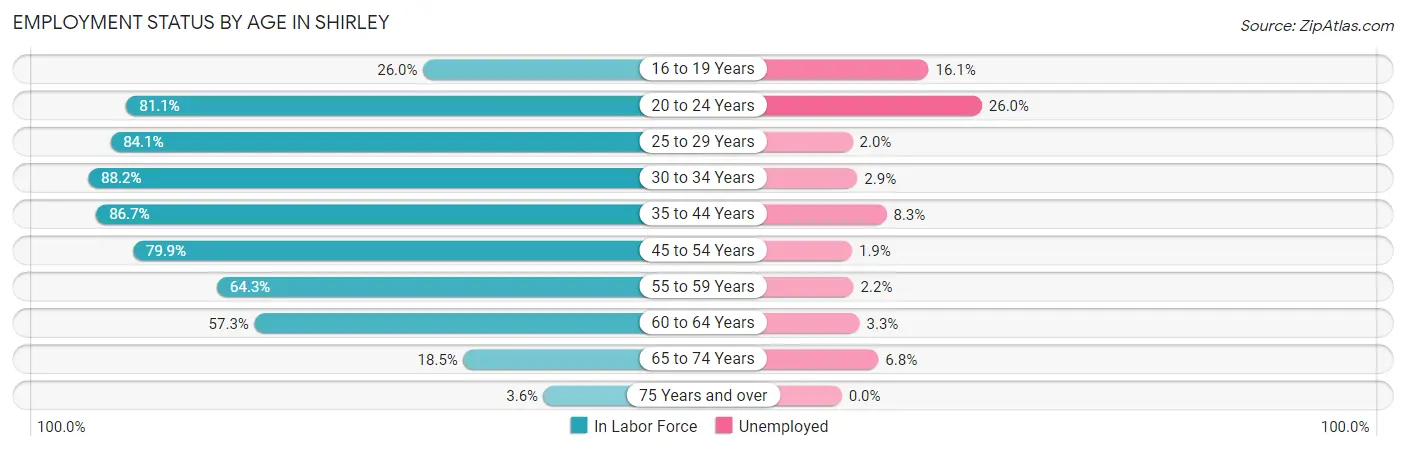
| Age Bracket | In Labor Force | Unemployed |
| 16 to 19 Years | 354 (26.0%) | 57 (16.1%) |
| 20 to 24 Years | 1,290 (81.1%) | 335 (26.0%) |
| 25 to 29 Years | 1,522 (84.1%) | 30 (2.0%) |
| 30 to 34 Years | 1,380 (88.2%) | 40 (2.9%) |
| 35 to 44 Years | 2,925 (86.7%) | 243 (8.3%) |
| 45 to 54 Years | 2,693 (79.9%) | 51 (1.9%) |
| 55 to 59 Years | 1,838 (64.3%) | 40 (2.2%) |
| 60 to 64 Years | 998 (57.3%) | 33 (3.3%) |
| 65 to 74 Years | 500 (18.5%) | 34 (6.8%) |
| 75 Years and over | 29 (3.6%) | 0 (0.0%) |
| Total | 13,528 (63.9%) | 866 (6.4%) |
Employment Status by Educational Attainment in Shirley
According to labor force statistics for Shirley, 77.2% of individuals (11,364) out of the total population between 25 and 64 years of age (14,720) are in the labor force, with 3.8% or 432 of them being unemployed. The group with the highest labor force participation rate are those with the educational attainment of bachelor's degree or higher, with 88.9% or 2,685 individuals in the labor force. Within the labor force, individuals with high school diploma education have the highest percentage of unemployment, with 8.1% or 288 of them being unemployed.
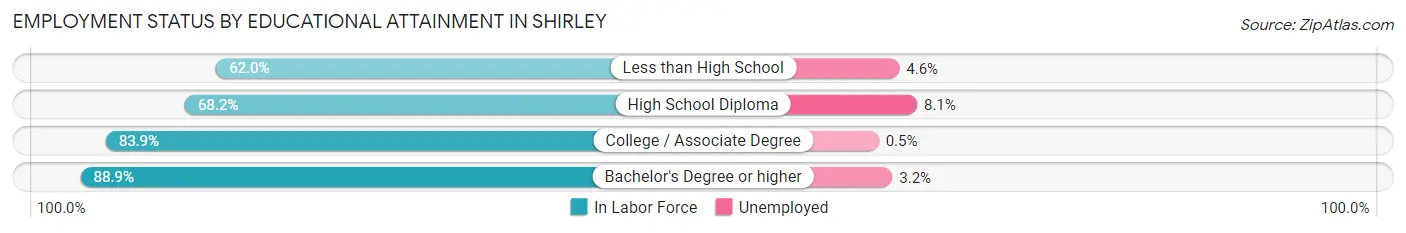
| Educational Attainment | In Labor Force | Unemployed |
| Less than High School | 914 (62.0%) | 68 (4.6%) |
| High School Diploma | 3,550 (68.2%) | 422 (8.1%) |
| College / Associate Degree | 4,211 (83.9%) | 25 (0.5%) |
| Bachelor's Degree or higher | 2,685 (88.9%) | 97 (3.2%) |
| Total | 11,364 (77.2%) | 559 (3.8%) |
Employment Occupations by Sex in Shirley
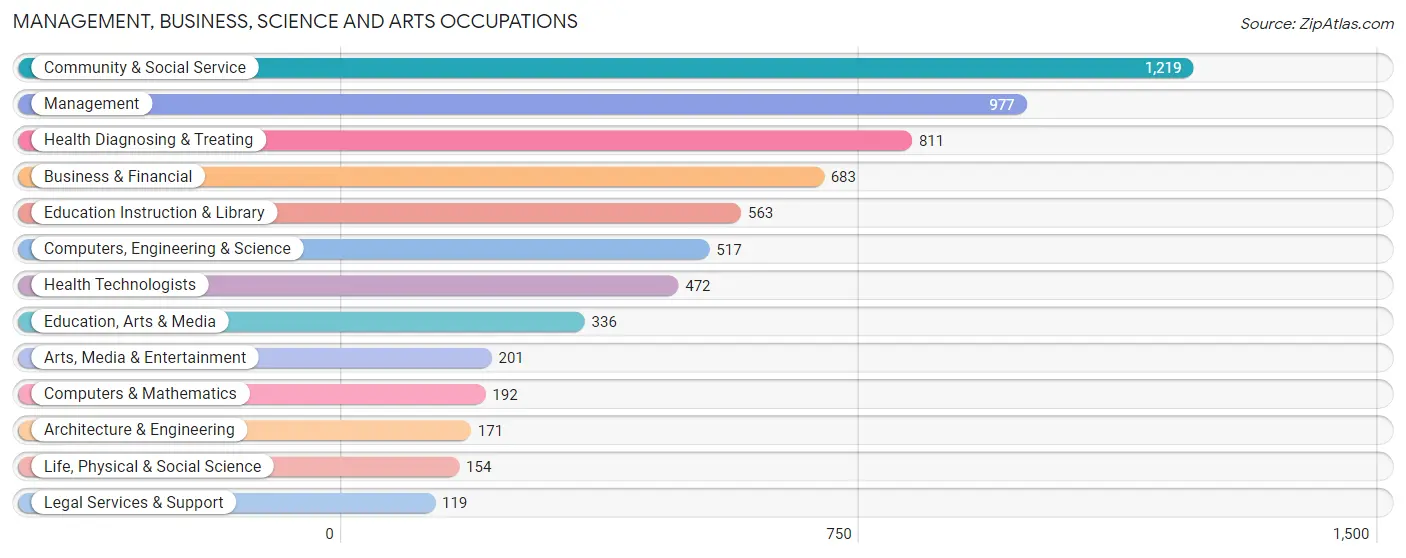
Management, Business, Science and Arts Occupations
The most common Management, Business, Science and Arts occupations in Shirley are Community & Social Service (1,219 | 9.6%), Management (977 | 7.7%), Health Diagnosing & Treating (811 | 6.4%), Business & Financial (683 | 5.4%), and Education Instruction & Library (563 | 4.4%).
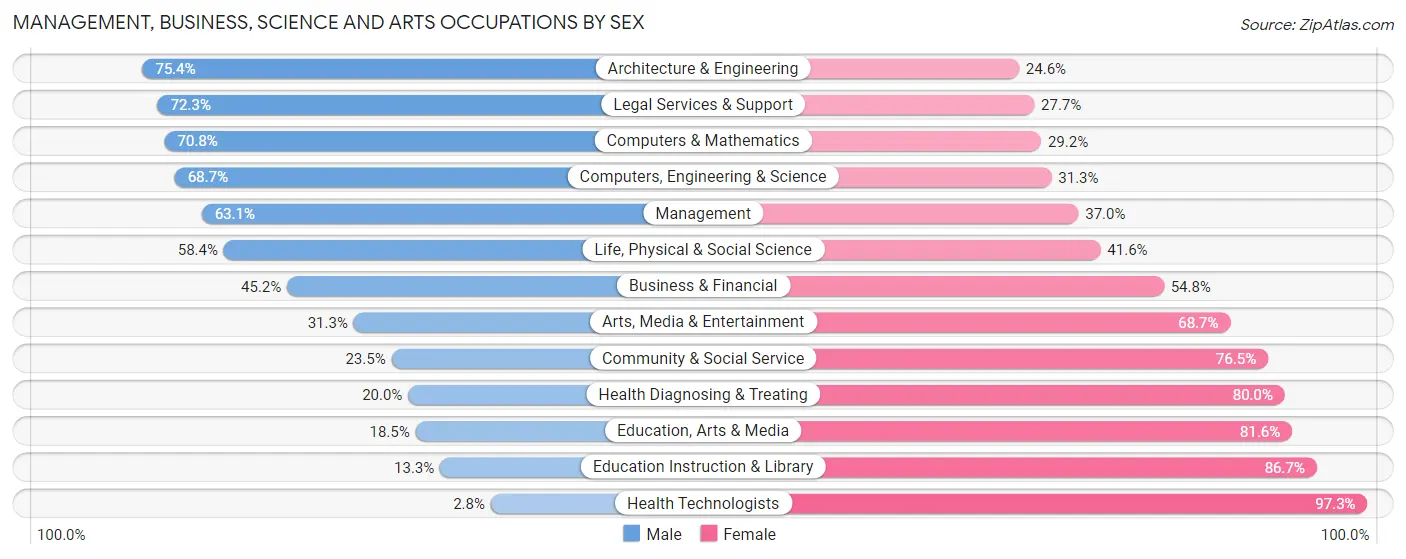
Management, Business, Science and Arts Occupations by Sex
Within the Management, Business, Science and Arts occupations in Shirley, the most male-oriented occupations are Architecture & Engineering (75.4%), Legal Services & Support (72.3%), and Computers & Mathematics (70.8%), while the most female-oriented occupations are Health Technologists (97.3%), Education Instruction & Library (86.7%), and Education, Arts & Media (81.6%).
| Occupation | Male | Female |
| Management | 616 (63.0%) | 361 (36.9%) |
| Business & Financial | 309 (45.2%) | 374 (54.8%) |
| Computers, Engineering & Science | 355 (68.7%) | 162 (31.3%) |
| Computers & Mathematics | 136 (70.8%) | 56 (29.2%) |
| Architecture & Engineering | 129 (75.4%) | 42 (24.6%) |
| Life, Physical & Social Science | 90 (58.4%) | 64 (41.6%) |
| Community & Social Service | 286 (23.5%) | 933 (76.5%) |
| Education, Arts & Media | 62 (18.4%) | 274 (81.6%) |
| Legal Services & Support | 86 (72.3%) | 33 (27.7%) |
| Education Instruction & Library | 75 (13.3%) | 488 (86.7%) |
| Arts, Media & Entertainment | 63 (31.3%) | 138 (68.7%) |
| Health Diagnosing & Treating | 162 (20.0%) | 649 (80.0%) |
| Health Technologists | 13 (2.8%) | 459 (97.3%) |
| Total (Category) | 1,728 (41.1%) | 2,479 (58.9%) |
| Total (Overall) | 6,724 (53.2%) | 5,921 (46.8%) |
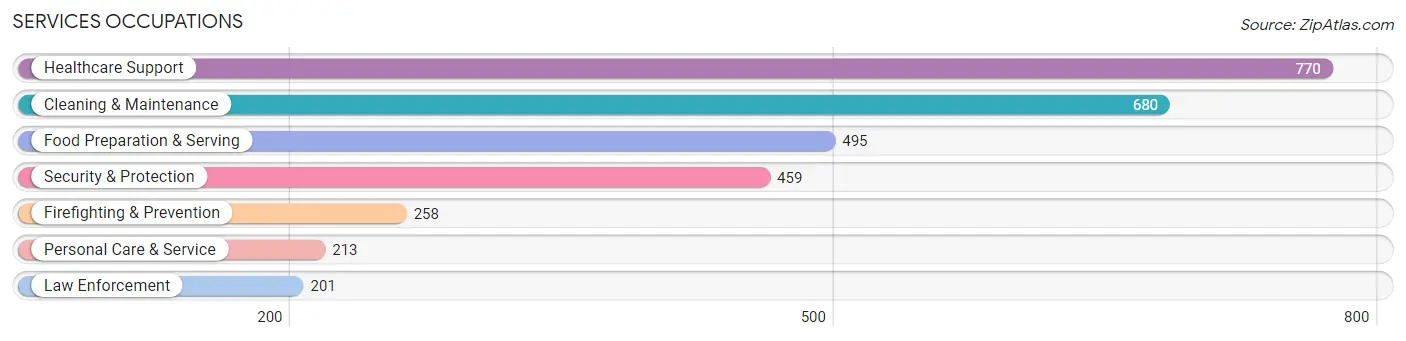
Services Occupations
The most common Services occupations in Shirley are Healthcare Support (770 | 6.1%), Cleaning & Maintenance (680 | 5.4%), Food Preparation & Serving (495 | 3.9%), Security & Protection (459 | 3.6%), and Firefighting & Prevention (258 | 2.0%).
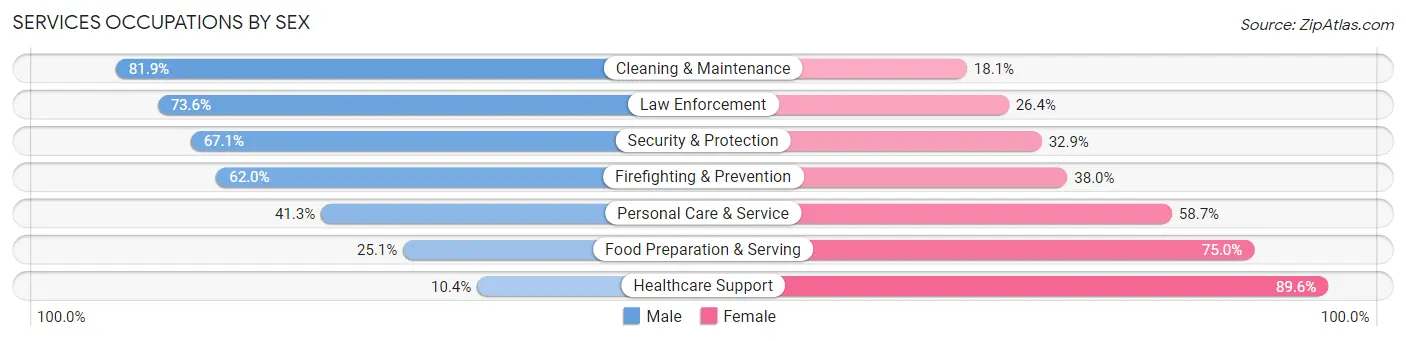
Services Occupations by Sex
Within the Services occupations in Shirley, the most male-oriented occupations are Cleaning & Maintenance (81.9%), Law Enforcement (73.6%), and Security & Protection (67.1%), while the most female-oriented occupations are Healthcare Support (89.6%), Food Preparation & Serving (75.0%), and Personal Care & Service (58.7%).
| Occupation | Male | Female |
| Healthcare Support | 80 (10.4%) | 690 (89.6%) |
| Security & Protection | 308 (67.1%) | 151 (32.9%) |
| Firefighting & Prevention | 160 (62.0%) | 98 (38.0%) |
| Law Enforcement | 148 (73.6%) | 53 (26.4%) |
| Food Preparation & Serving | 124 (25.1%) | 371 (75.0%) |
| Cleaning & Maintenance | 557 (81.9%) | 123 (18.1%) |
| Personal Care & Service | 88 (41.3%) | 125 (58.7%) |
| Total (Category) | 1,157 (44.2%) | 1,460 (55.8%) |
| Total (Overall) | 6,724 (53.2%) | 5,921 (46.8%) |
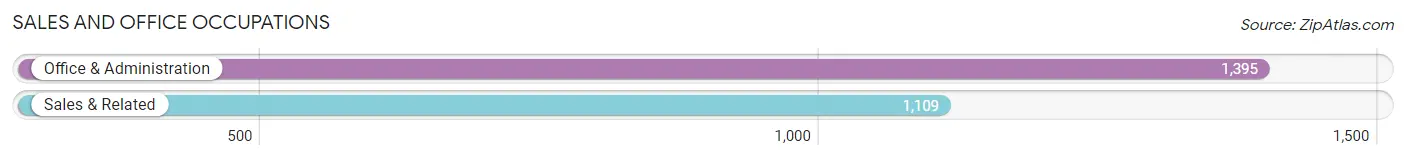
Sales and Office Occupations
The most common Sales and Office occupations in Shirley are Office & Administration (1,395 | 11.0%), and Sales & Related (1,109 | 8.8%).
Sales and Office Occupations by Sex
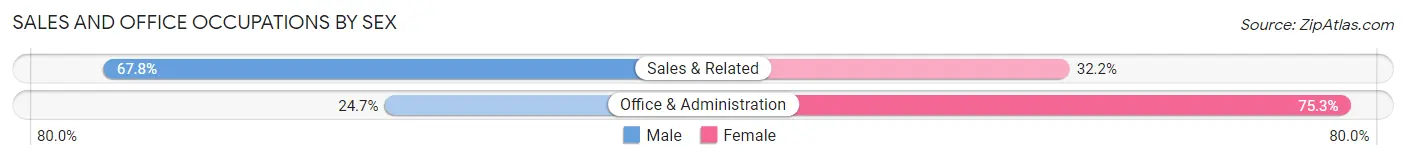
| Occupation | Male | Female |
| Sales & Related | 752 (67.8%) | 357 (32.2%) |
| Office & Administration | 344 (24.7%) | 1,051 (75.3%) |
| Total (Category) | 1,096 (43.8%) | 1,408 (56.2%) |
| Total (Overall) | 6,724 (53.2%) | 5,921 (46.8%) |
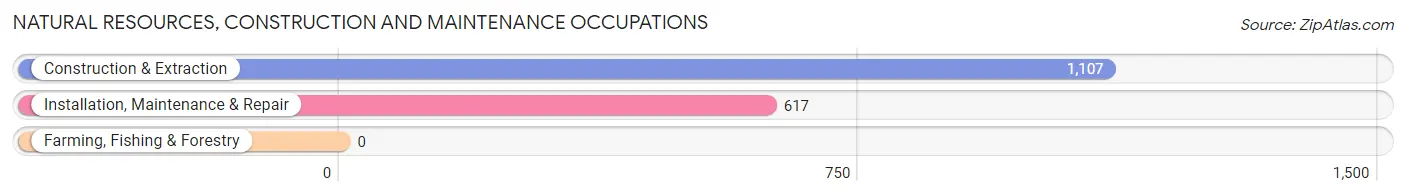
Natural Resources, Construction and Maintenance Occupations
The most common Natural Resources, Construction and Maintenance occupations in Shirley are Construction & Extraction (1,107 | 8.7%), and Installation, Maintenance & Repair (617 | 4.9%).
Natural Resources, Construction and Maintenance Occupations by Sex
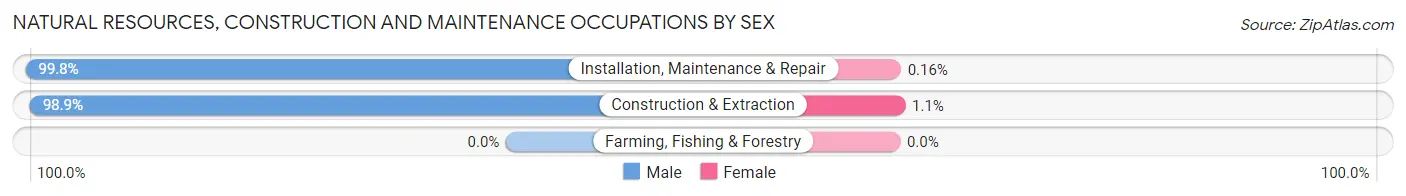
| Occupation | Male | Female |
| Farming, Fishing & Forestry | 0 (0.0%) | 0 (0.0%) |
| Construction & Extraction | 1,095 (98.9%) | 12 (1.1%) |
| Installation, Maintenance & Repair | 616 (99.8%) | 1 (0.2%) |
| Total (Category) | 1,711 (99.3%) | 13 (0.7%) |
| Total (Overall) | 6,724 (53.2%) | 5,921 (46.8%) |
Production, Transportation and Moving Occupations
The most common Production, Transportation and Moving occupations in Shirley are Transportation (641 | 5.1%), Production (563 | 4.4%), and Material Moving (389 | 3.1%).
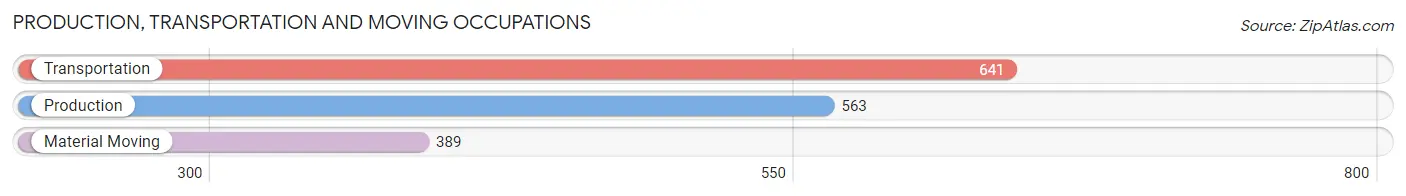
Production, Transportation and Moving Occupations by Sex
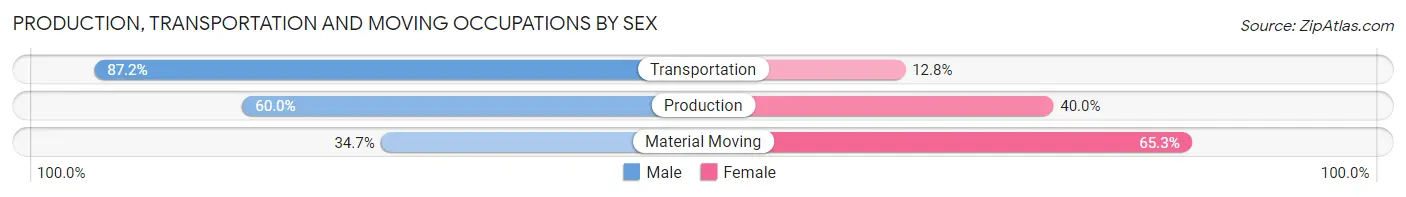
| Occupation | Male | Female |
| Production | 338 (60.0%) | 225 (40.0%) |
| Transportation | 559 (87.2%) | 82 (12.8%) |
| Material Moving | 135 (34.7%) | 254 (65.3%) |
| Total (Category) | 1,032 (64.8%) | 561 (35.2%) |
| Total (Overall) | 6,724 (53.2%) | 5,921 (46.8%) |
Employment Industries by Sex in Shirley
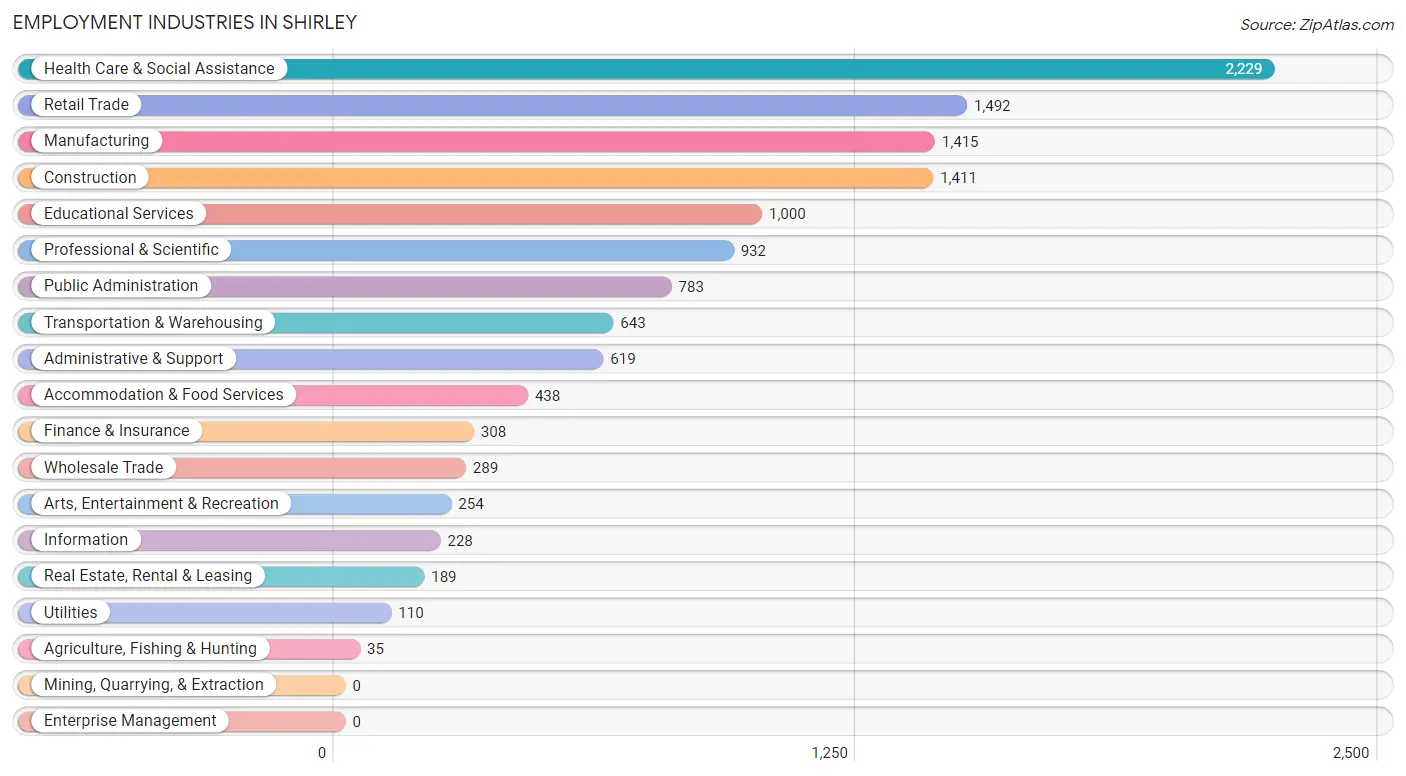
Employment Industries in Shirley
The major employment industries in Shirley include Health Care & Social Assistance (2,229 | 17.6%), Retail Trade (1,492 | 11.8%), Manufacturing (1,415 | 11.2%), Construction (1,411 | 11.2%), and Educational Services (1,000 | 7.9%).
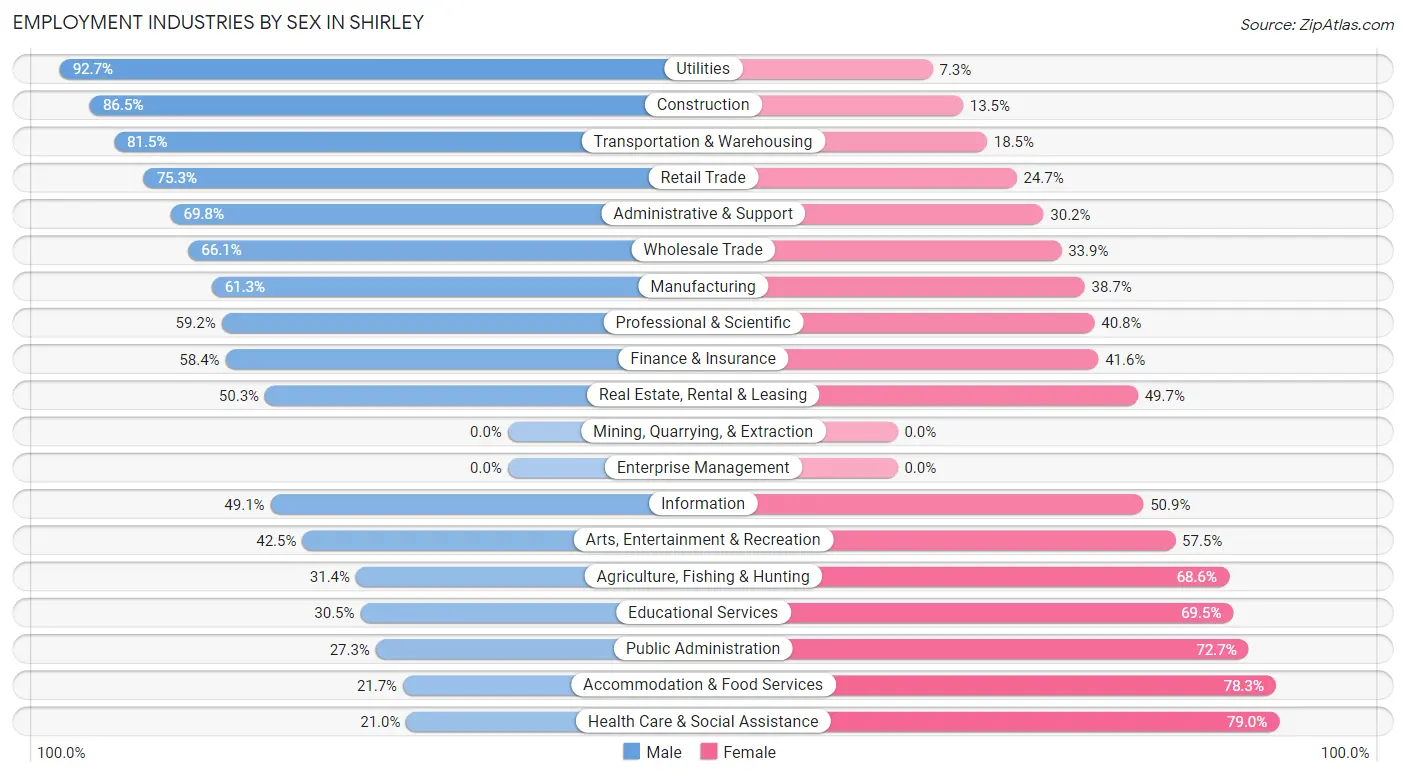
Employment Industries by Sex in Shirley
The Shirley industries that see more men than women are Utilities (92.7%), Construction (86.5%), and Transportation & Warehousing (81.5%), whereas the industries that tend to have a higher number of women are Health Care & Social Assistance (79.0%), Accommodation & Food Services (78.3%), and Public Administration (72.7%).
| Industry | Male | Female |
| Agriculture, Fishing & Hunting | 11 (31.4%) | 24 (68.6%) |
| Mining, Quarrying, & Extraction | 0 (0.0%) | 0 (0.0%) |
| Construction | 1,220 (86.5%) | 191 (13.5%) |
| Manufacturing | 867 (61.3%) | 548 (38.7%) |
| Wholesale Trade | 191 (66.1%) | 98 (33.9%) |
| Retail Trade | 1,124 (75.3%) | 368 (24.7%) |
| Transportation & Warehousing | 524 (81.5%) | 119 (18.5%) |
| Utilities | 102 (92.7%) | 8 (7.3%) |
| Information | 112 (49.1%) | 116 (50.9%) |
| Finance & Insurance | 180 (58.4%) | 128 (41.6%) |
| Real Estate, Rental & Leasing | 95 (50.3%) | 94 (49.7%) |
| Professional & Scientific | 552 (59.2%) | 380 (40.8%) |
| Enterprise Management | 0 (0.0%) | 0 (0.0%) |
| Administrative & Support | 432 (69.8%) | 187 (30.2%) |
| Educational Services | 305 (30.5%) | 695 (69.5%) |
| Health Care & Social Assistance | 468 (21.0%) | 1,761 (79.0%) |
| Arts, Entertainment & Recreation | 108 (42.5%) | 146 (57.5%) |
| Accommodation & Food Services | 95 (21.7%) | 343 (78.3%) |
| Public Administration | 214 (27.3%) | 569 (72.7%) |
| Total | 6,724 (53.2%) | 5,921 (46.8%) |
Education in Shirley
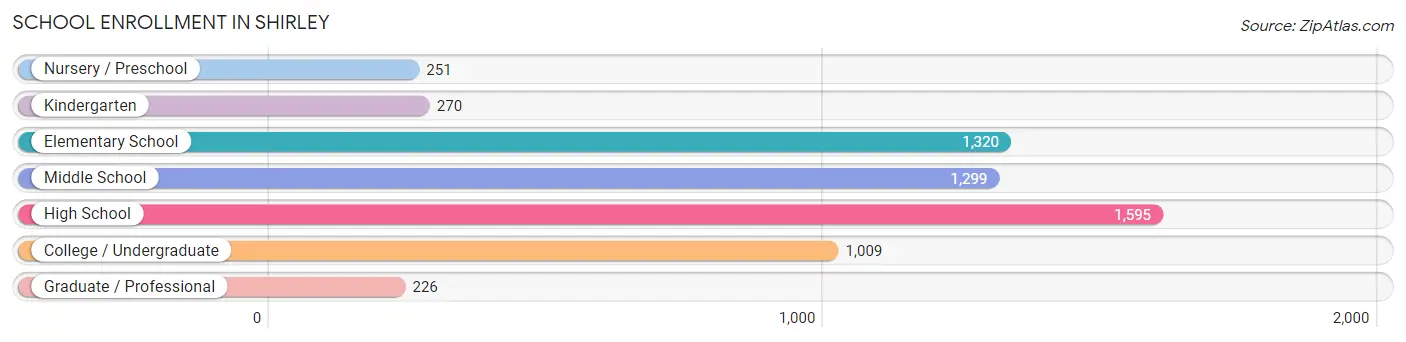
School Enrollment in Shirley
The most common levels of schooling among the 5,970 students in Shirley are high school (1,595 | 26.7%), elementary school (1,320 | 22.1%), and middle school (1,299 | 21.8%).
| School Level | # Students | % Students |
| Nursery / Preschool | 251 | 4.2% |
| Kindergarten | 270 | 4.5% |
| Elementary School | 1,320 | 22.1% |
| Middle School | 1,299 | 21.8% |
| High School | 1,595 | 26.7% |
| College / Undergraduate | 1,009 | 16.9% |
| Graduate / Professional | 226 | 3.8% |
| Total | 5,970 | 100.0% |
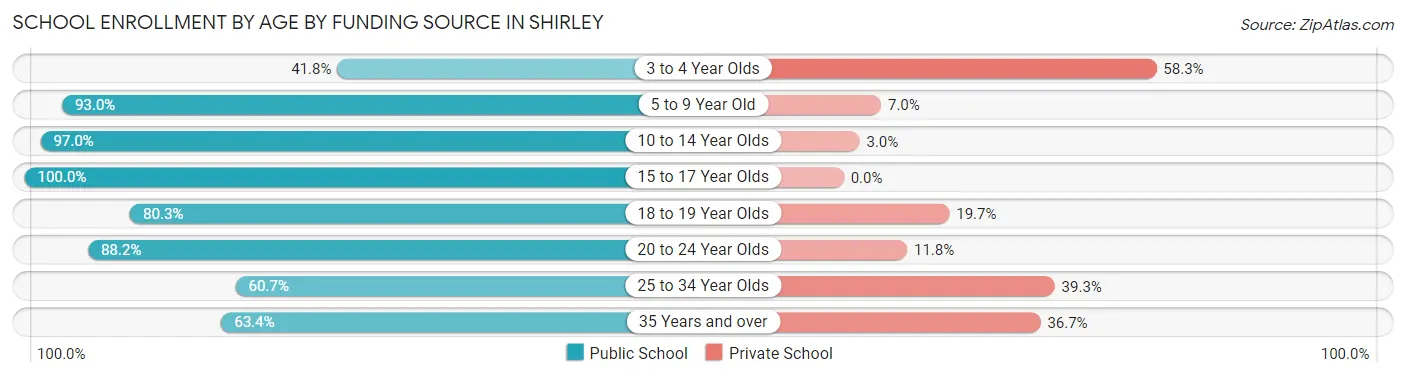
School Enrollment by Age by Funding Source in Shirley
Out of a total of 5,970 students who are enrolled in schools in Shirley, 597 (10.0%) attend a private institution, while the remaining 5,373 (90.0%) are enrolled in public schools. The age group of 3 to 4 year olds has the highest likelihood of being enrolled in private schools, with 120 (58.3% in the age bracket) enrolled. Conversely, the age group of 15 to 17 year olds has the lowest likelihood of being enrolled in a private school, with 969 (100.0% in the age bracket) attending a public institution.
| Age Bracket | Public School | Private School |
| 3 to 4 Year Olds | 86 (41.7%) | 120 (58.3%) |
| 5 to 9 Year Old | 1,510 (93.0%) | 113 (7.0%) |
| 10 to 14 Year Olds | 1,707 (97.0%) | 52 (3.0%) |
| 15 to 17 Year Olds | 969 (100.0%) | 0 (0.0%) |
| 18 to 19 Year Olds | 441 (80.3%) | 108 (19.7%) |
| 20 to 24 Year Olds | 418 (88.2%) | 56 (11.8%) |
| 25 to 34 Year Olds | 139 (60.7%) | 90 (39.3%) |
| 35 Years and over | 102 (63.3%) | 59 (36.6%) |
| Total | 5,373 (90.0%) | 597 (10.0%) |
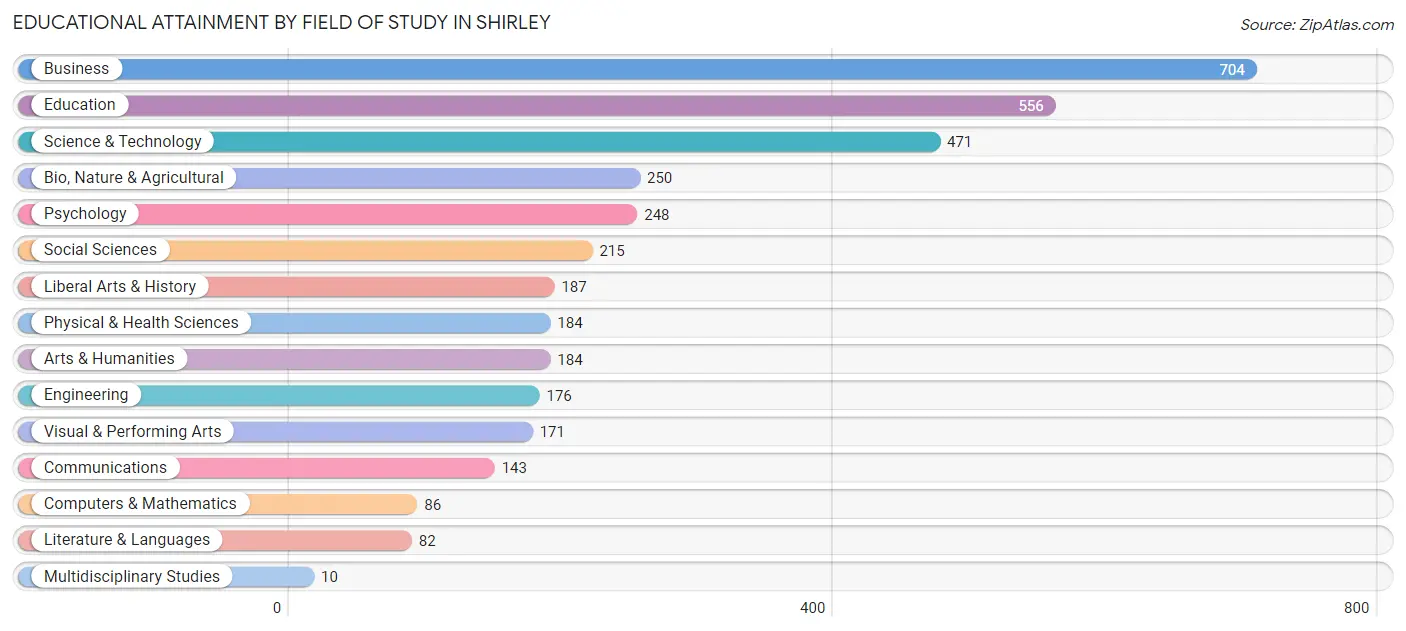
Educational Attainment by Field of Study in Shirley
Business (704 | 19.2%), education (556 | 15.2%), science & technology (471 | 12.8%), bio, nature & agricultural (250 | 6.8%), and psychology (248 | 6.8%) are the most common fields of study among 3,667 individuals in Shirley who have obtained a bachelor's degree or higher.
| Field of Study | # Graduates | % Graduates |
| Computers & Mathematics | 86 | 2.4% |
| Bio, Nature & Agricultural | 250 | 6.8% |
| Physical & Health Sciences | 184 | 5.0% |
| Psychology | 248 | 6.8% |
| Social Sciences | 215 | 5.9% |
| Engineering | 176 | 4.8% |
| Multidisciplinary Studies | 10 | 0.3% |
| Science & Technology | 471 | 12.8% |
| Business | 704 | 19.2% |
| Education | 556 | 15.2% |
| Literature & Languages | 82 | 2.2% |
| Liberal Arts & History | 187 | 5.1% |
| Visual & Performing Arts | 171 | 4.7% |
| Communications | 143 | 3.9% |
| Arts & Humanities | 184 | 5.0% |
| Total | 3,667 | 100.0% |
Transportation & Commute in Shirley
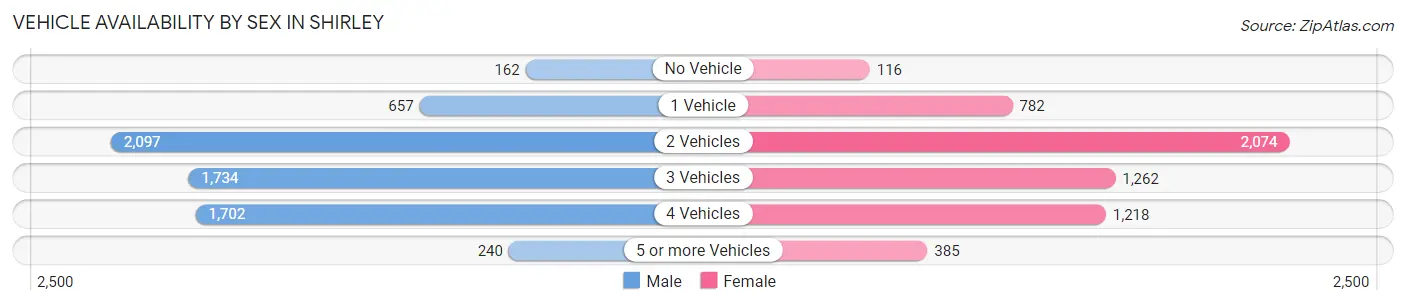
Vehicle Availability by Sex in Shirley
The most prevalent vehicle ownership categories in Shirley are males with 2 vehicles (2,097, accounting for 31.8%) and females with 2 vehicles (2,074, making up 35.9%).
| Vehicles Available | Male | Female |
| No Vehicle | 162 (2.5%) | 116 (2.0%) |
| 1 Vehicle | 657 (10.0%) | 782 (13.4%) |
| 2 Vehicles | 2,097 (31.8%) | 2,074 (35.5%) |
| 3 Vehicles | 1,734 (26.3%) | 1,262 (21.6%) |
| 4 Vehicles | 1,702 (25.8%) | 1,218 (20.9%) |
| 5 or more Vehicles | 240 (3.6%) | 385 (6.6%) |
| Total | 6,592 (100.0%) | 5,837 (100.0%) |
Commute Time in Shirley
The most frequently occuring commute durations in Shirley are 30 to 34 minutes (2,265 commuters, 19.0%), 20 to 24 minutes (1,791 commuters, 15.0%), and 45 to 59 minutes (1,367 commuters, 11.5%).
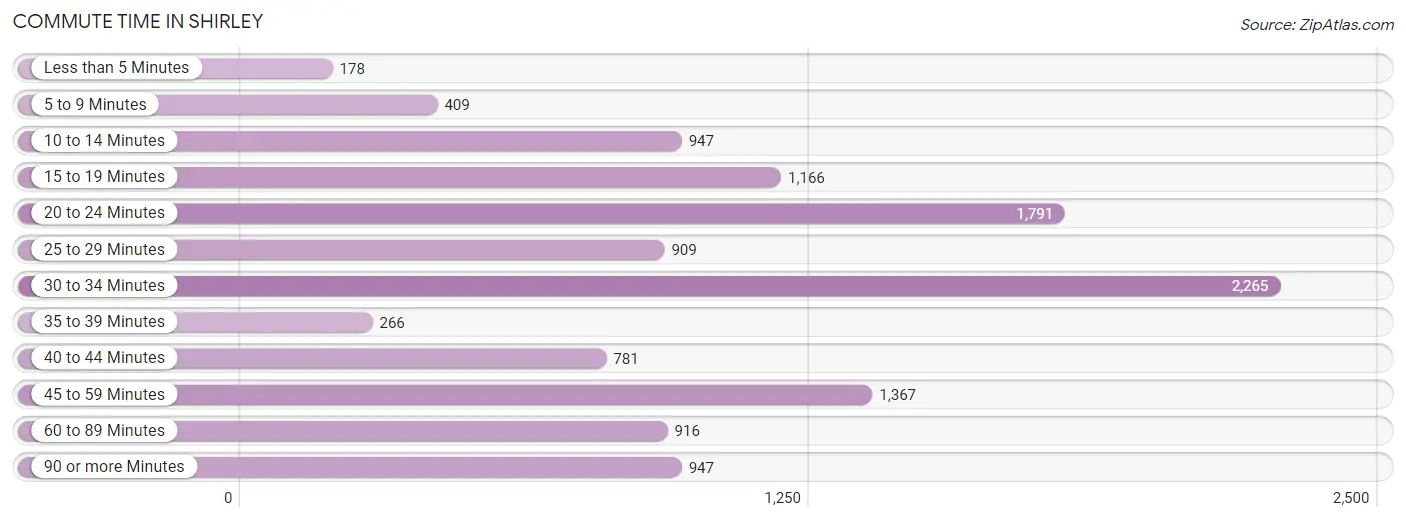
| Commute Time | # Commuters | % Commuters |
| Less than 5 Minutes | 178 | 1.5% |
| 5 to 9 Minutes | 409 | 3.4% |
| 10 to 14 Minutes | 947 | 7.9% |
| 15 to 19 Minutes | 1,166 | 9.8% |
| 20 to 24 Minutes | 1,791 | 15.0% |
| 25 to 29 Minutes | 909 | 7.6% |
| 30 to 34 Minutes | 2,265 | 19.0% |
| 35 to 39 Minutes | 266 | 2.2% |
| 40 to 44 Minutes | 781 | 6.5% |
| 45 to 59 Minutes | 1,367 | 11.5% |
| 60 to 89 Minutes | 916 | 7.7% |
| 90 or more Minutes | 947 | 7.9% |
Commute Time by Sex in Shirley
The most common commute times in Shirley are 30 to 34 minutes (1,024 commuters, 16.3%) for males and 30 to 34 minutes (1,241 commuters, 22.0%) for females.
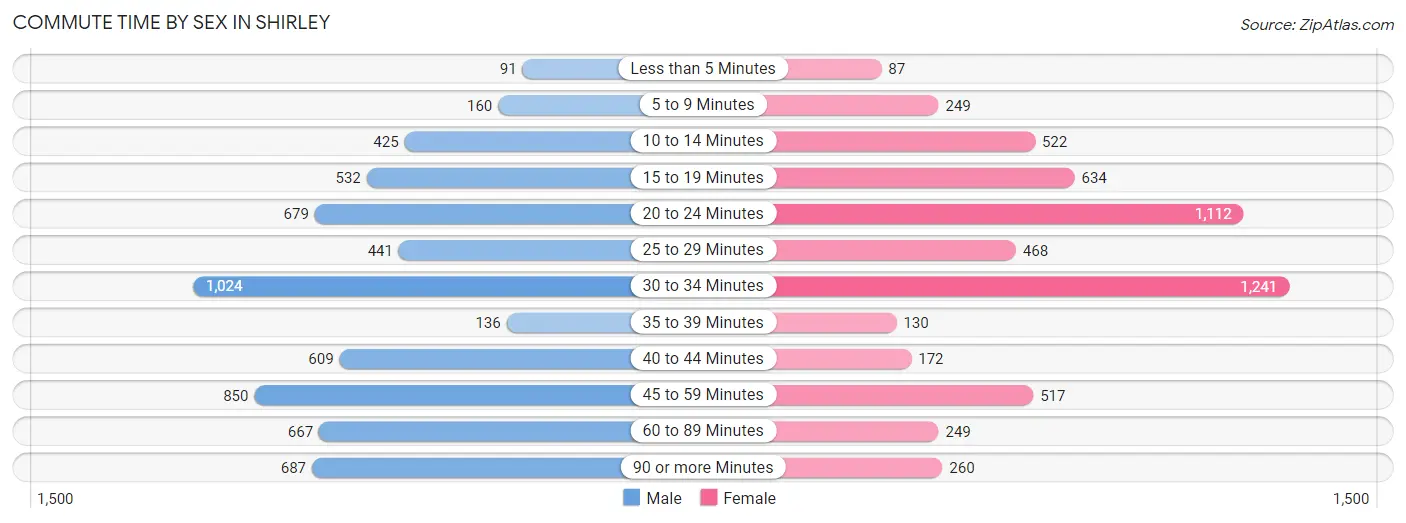
| Commute Time | Male | Female |
| Less than 5 Minutes | 91 (1.4%) | 87 (1.5%) |
| 5 to 9 Minutes | 160 (2.5%) | 249 (4.4%) |
| 10 to 14 Minutes | 425 (6.7%) | 522 (9.2%) |
| 15 to 19 Minutes | 532 (8.4%) | 634 (11.2%) |
| 20 to 24 Minutes | 679 (10.8%) | 1,112 (19.7%) |
| 25 to 29 Minutes | 441 (7.0%) | 468 (8.3%) |
| 30 to 34 Minutes | 1,024 (16.3%) | 1,241 (22.0%) |
| 35 to 39 Minutes | 136 (2.2%) | 130 (2.3%) |
| 40 to 44 Minutes | 609 (9.7%) | 172 (3.0%) |
| 45 to 59 Minutes | 850 (13.5%) | 517 (9.2%) |
| 60 to 89 Minutes | 667 (10.6%) | 249 (4.4%) |
| 90 or more Minutes | 687 (10.9%) | 260 (4.6%) |
Time of Departure to Work by Sex in Shirley
The most frequent times of departure to work in Shirley are 7:00 AM to 7:29 AM (1,011, 16.1%) for males and 7:00 AM to 7:29 AM (951, 16.9%) for females.
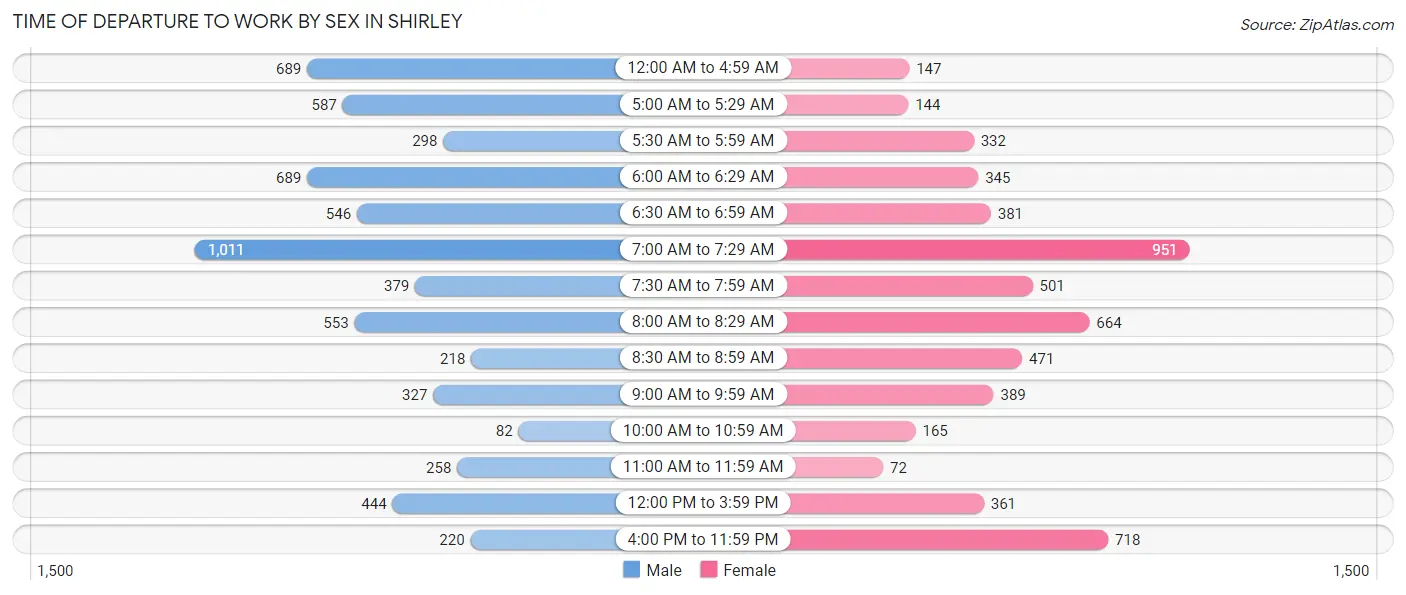
| Time of Departure | Male | Female |
| 12:00 AM to 4:59 AM | 689 (10.9%) | 147 (2.6%) |
| 5:00 AM to 5:29 AM | 587 (9.3%) | 144 (2.5%) |
| 5:30 AM to 5:59 AM | 298 (4.7%) | 332 (5.9%) |
| 6:00 AM to 6:29 AM | 689 (10.9%) | 345 (6.1%) |
| 6:30 AM to 6:59 AM | 546 (8.7%) | 381 (6.8%) |
| 7:00 AM to 7:29 AM | 1,011 (16.1%) | 951 (16.9%) |
| 7:30 AM to 7:59 AM | 379 (6.0%) | 501 (8.9%) |
| 8:00 AM to 8:29 AM | 553 (8.8%) | 664 (11.8%) |
| 8:30 AM to 8:59 AM | 218 (3.5%) | 471 (8.4%) |
| 9:00 AM to 9:59 AM | 327 (5.2%) | 389 (6.9%) |
| 10:00 AM to 10:59 AM | 82 (1.3%) | 165 (2.9%) |
| 11:00 AM to 11:59 AM | 258 (4.1%) | 72 (1.3%) |
| 12:00 PM to 3:59 PM | 444 (7.0%) | 361 (6.4%) |
| 4:00 PM to 11:59 PM | 220 (3.5%) | 718 (12.7%) |
| Total | 6,301 (100.0%) | 5,641 (100.0%) |
Housing Occupancy in Shirley
Occupancy by Ownership in Shirley
Of the total 8,090 dwellings in Shirley, owner-occupied units account for 7,376 (91.2%), while renter-occupied units make up 714 (8.8%).
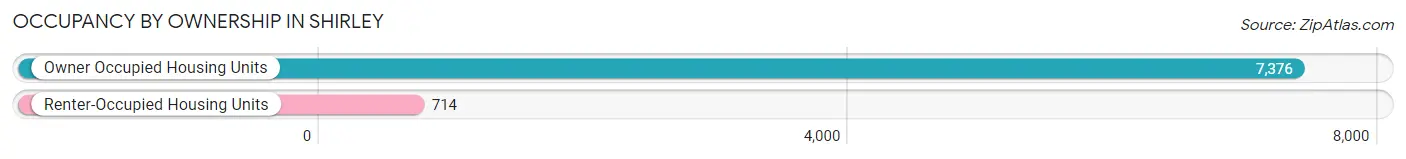
| Occupancy | # Housing Units | % Housing Units |
| Owner Occupied Housing Units | 7,376 | 91.2% |
| Renter-Occupied Housing Units | 714 | 8.8% |
| Total Occupied Housing Units | 8,090 | 100.0% |
Occupancy by Household Size in Shirley
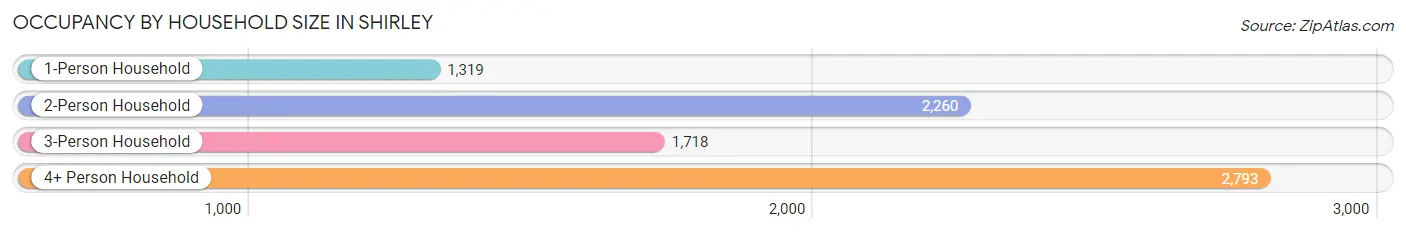
| Household Size | # Housing Units | % Housing Units |
| 1-Person Household | 1,319 | 16.3% |
| 2-Person Household | 2,260 | 27.9% |
| 3-Person Household | 1,718 | 21.2% |
| 4+ Person Household | 2,793 | 34.5% |
| Total Housing Units | 8,090 | 100.0% |
Occupancy by Ownership by Household Size in Shirley
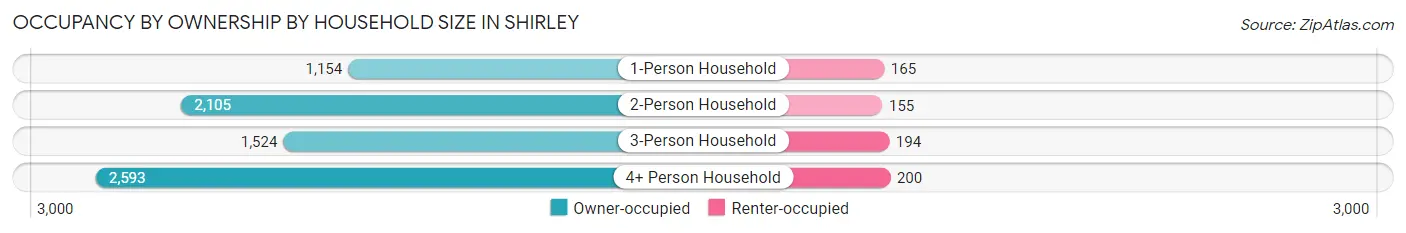
| Household Size | Owner-occupied | Renter-occupied |
| 1-Person Household | 1,154 (87.5%) | 165 (12.5%) |
| 2-Person Household | 2,105 (93.1%) | 155 (6.9%) |
| 3-Person Household | 1,524 (88.7%) | 194 (11.3%) |
| 4+ Person Household | 2,593 (92.8%) | 200 (7.2%) |
| Total Housing Units | 7,376 (91.2%) | 714 (8.8%) |
Occupancy by Educational Attainment in Shirley
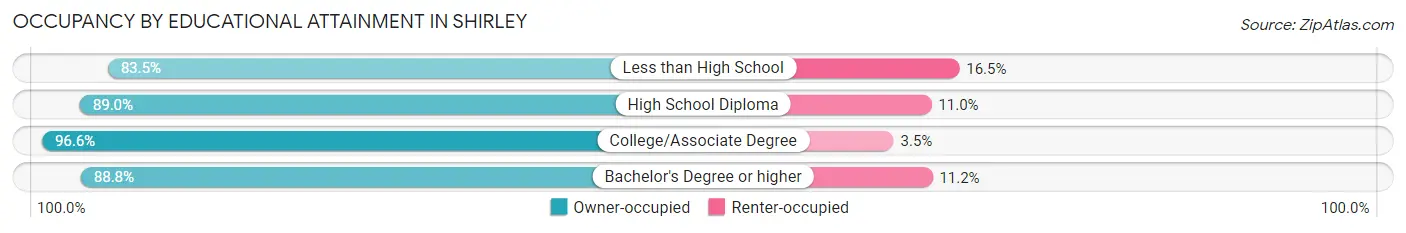
| Household Size | Owner-occupied | Renter-occupied |
| Less than High School | 593 (83.5%) | 117 (16.5%) |
| High School Diploma | 2,420 (89.0%) | 298 (11.0%) |
| College/Associate Degree | 2,771 (96.6%) | 99 (3.5%) |
| Bachelor's Degree or higher | 1,592 (88.8%) | 200 (11.2%) |
Occupancy by Age of Householder in Shirley
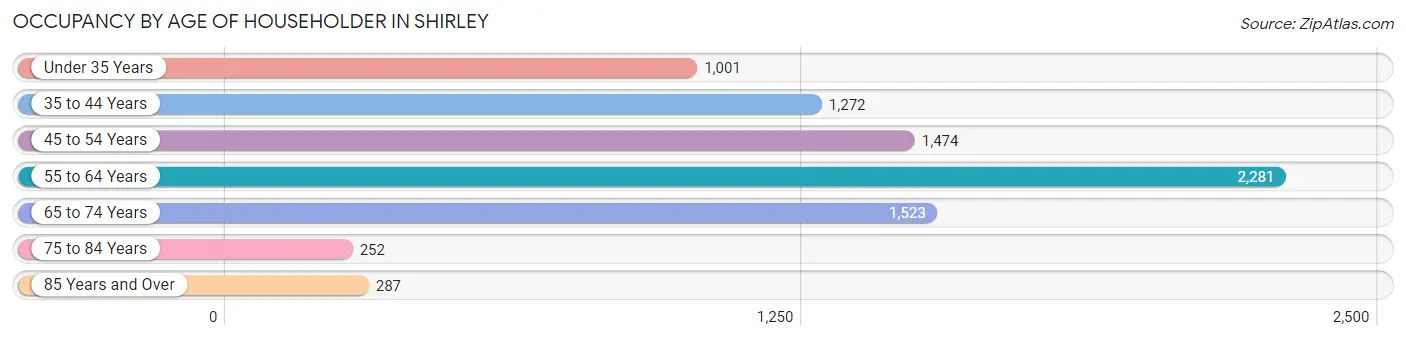
| Age Bracket | # Households | % Households |
| Under 35 Years | 1,001 | 12.4% |
| 35 to 44 Years | 1,272 | 15.7% |
| 45 to 54 Years | 1,474 | 18.2% |
| 55 to 64 Years | 2,281 | 28.2% |
| 65 to 74 Years | 1,523 | 18.8% |
| 75 to 84 Years | 252 | 3.1% |
| 85 Years and Over | 287 | 3.5% |
| Total | 8,090 | 100.0% |
Housing Finances in Shirley
Median Income by Occupancy in Shirley
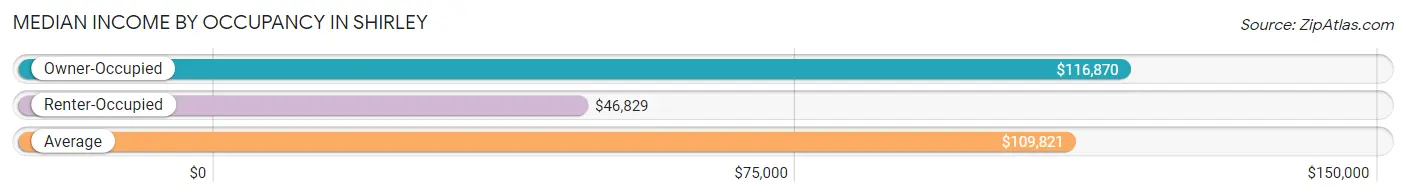
| Occupancy Type | # Households | Median Income |
| Owner-Occupied | 7,376 (91.2%) | $116,870 |
| Renter-Occupied | 714 (8.8%) | $46,829 |
| Average | 8,090 (100.0%) | $109,821 |
Occupancy by Householder Income Bracket in Shirley
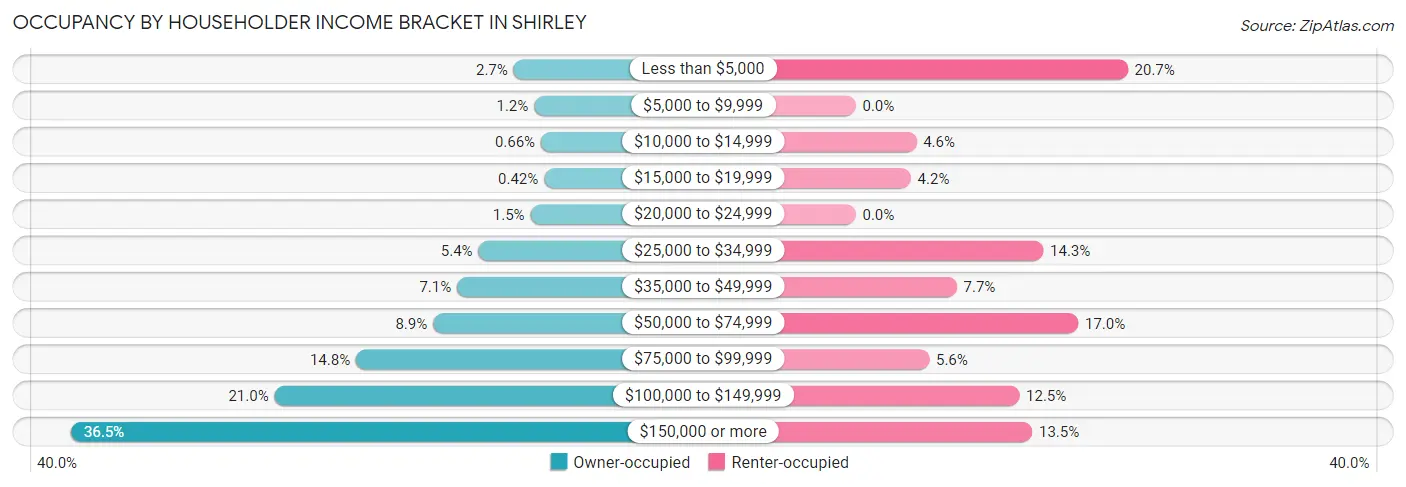
| Income Bracket | Owner-occupied | Renter-occupied |
| Less than $5,000 | 202 (2.7%) | 148 (20.7%) |
| $5,000 to $9,999 | 87 (1.2%) | 0 (0.0%) |
| $10,000 to $14,999 | 49 (0.7%) | 33 (4.6%) |
| $15,000 to $19,999 | 31 (0.4%) | 30 (4.2%) |
| $20,000 to $24,999 | 108 (1.5%) | 0 (0.0%) |
| $25,000 to $34,999 | 400 (5.4%) | 102 (14.3%) |
| $35,000 to $49,999 | 520 (7.0%) | 55 (7.7%) |
| $50,000 to $74,999 | 655 (8.9%) | 121 (17.0%) |
| $75,000 to $99,999 | 1,088 (14.7%) | 40 (5.6%) |
| $100,000 to $149,999 | 1,546 (21.0%) | 89 (12.5%) |
| $150,000 or more | 2,690 (36.5%) | 96 (13.5%) |
| Total | 7,376 (100.0%) | 714 (100.0%) |
Monthly Housing Cost Tiers in Shirley
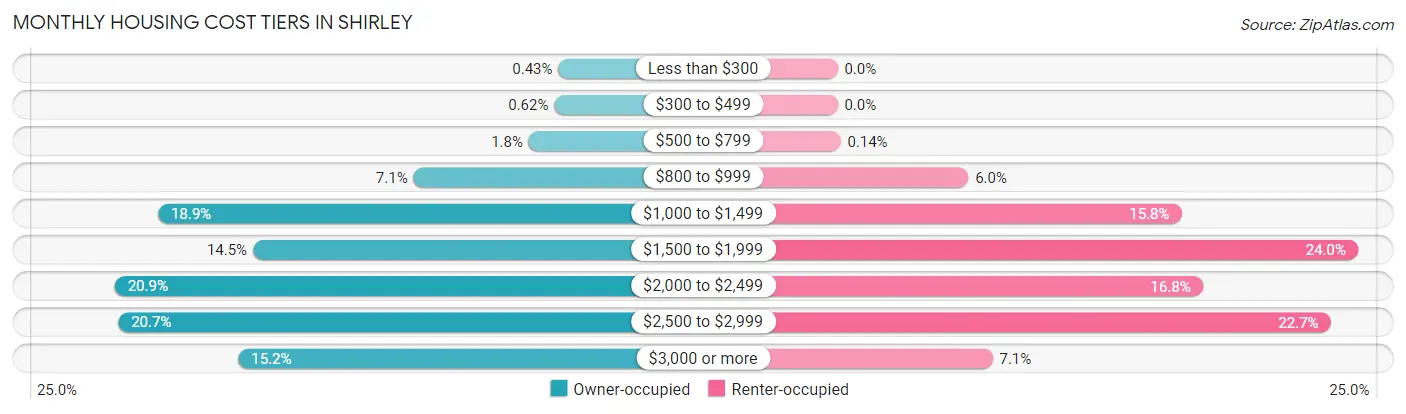
| Monthly Cost | Owner-occupied | Renter-occupied |
| Less than $300 | 32 (0.4%) | 0 (0.0%) |
| $300 to $499 | 46 (0.6%) | 0 (0.0%) |
| $500 to $799 | 132 (1.8%) | 1 (0.1%) |
| $800 to $999 | 524 (7.1%) | 43 (6.0%) |
| $1,000 to $1,499 | 1,391 (18.9%) | 113 (15.8%) |
| $1,500 to $1,999 | 1,069 (14.5%) | 171 (23.9%) |
| $2,000 to $2,499 | 1,538 (20.8%) | 120 (16.8%) |
| $2,500 to $2,999 | 1,526 (20.7%) | 162 (22.7%) |
| $3,000 or more | 1,118 (15.2%) | 51 (7.1%) |
| Total | 7,376 (100.0%) | 714 (100.0%) |
Physical Housing Characteristics in Shirley
Housing Structures in Shirley
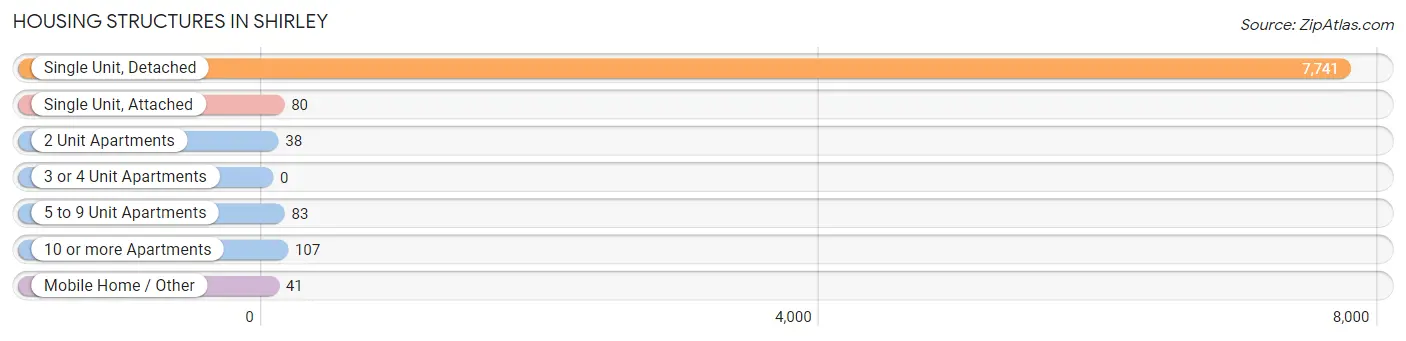
| Structure Type | # Housing Units | % Housing Units |
| Single Unit, Detached | 7,741 | 95.7% |
| Single Unit, Attached | 80 | 1.0% |
| 2 Unit Apartments | 38 | 0.5% |
| 3 or 4 Unit Apartments | 0 | 0.0% |
| 5 to 9 Unit Apartments | 83 | 1.0% |
| 10 or more Apartments | 107 | 1.3% |
| Mobile Home / Other | 41 | 0.5% |
| Total | 8,090 | 100.0% |
Housing Structures by Occupancy in Shirley
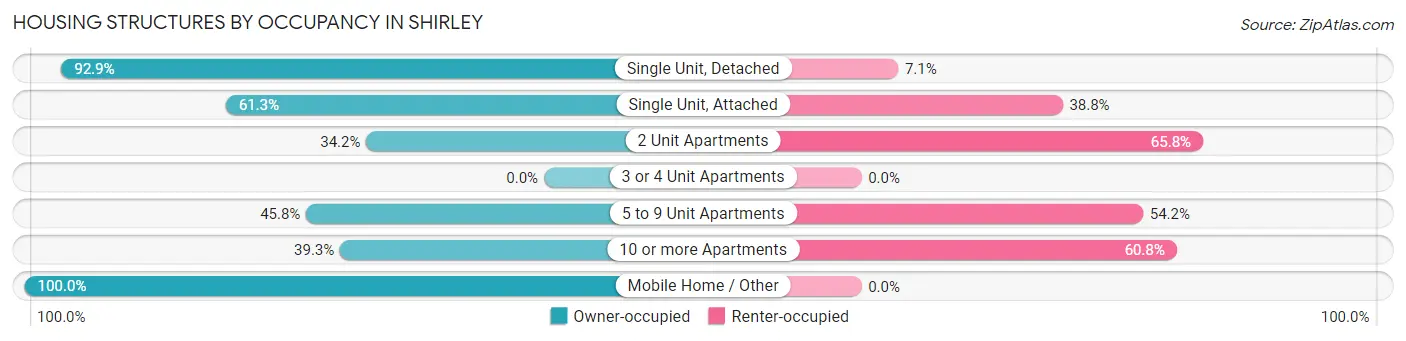
| Structure Type | Owner-occupied | Renter-occupied |
| Single Unit, Detached | 7,193 (92.9%) | 548 (7.1%) |
| Single Unit, Attached | 49 (61.3%) | 31 (38.8%) |
| 2 Unit Apartments | 13 (34.2%) | 25 (65.8%) |
| 3 or 4 Unit Apartments | 0 (0.0%) | 0 (0.0%) |
| 5 to 9 Unit Apartments | 38 (45.8%) | 45 (54.2%) |
| 10 or more Apartments | 42 (39.3%) | 65 (60.8%) |
| Mobile Home / Other | 41 (100.0%) | 0 (0.0%) |
| Total | 7,376 (91.2%) | 714 (8.8%) |
Housing Structures by Number of Rooms in Shirley
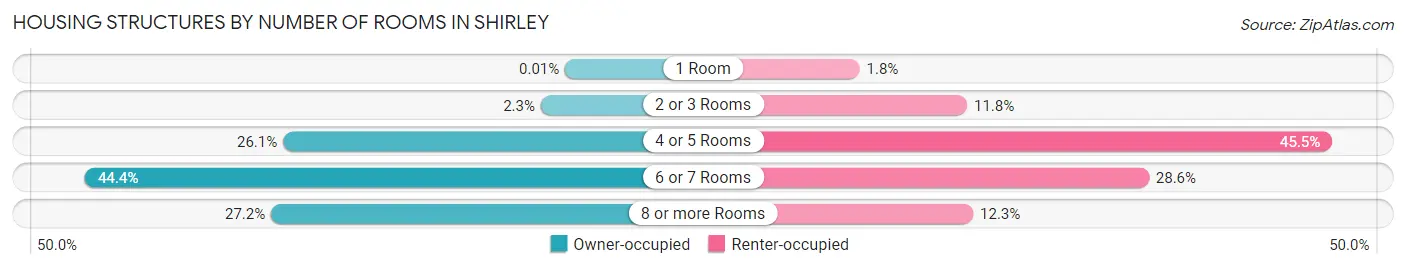
| Number of Rooms | Owner-occupied | Renter-occupied |
| 1 Room | 1 (0.0%) | 13 (1.8%) |
| 2 or 3 Rooms | 167 (2.3%) | 84 (11.8%) |
| 4 or 5 Rooms | 1,925 (26.1%) | 325 (45.5%) |
| 6 or 7 Rooms | 3,276 (44.4%) | 204 (28.6%) |
| 8 or more Rooms | 2,007 (27.2%) | 88 (12.3%) |
| Total | 7,376 (100.0%) | 714 (100.0%) |
Housing Structure by Heating Type in Shirley
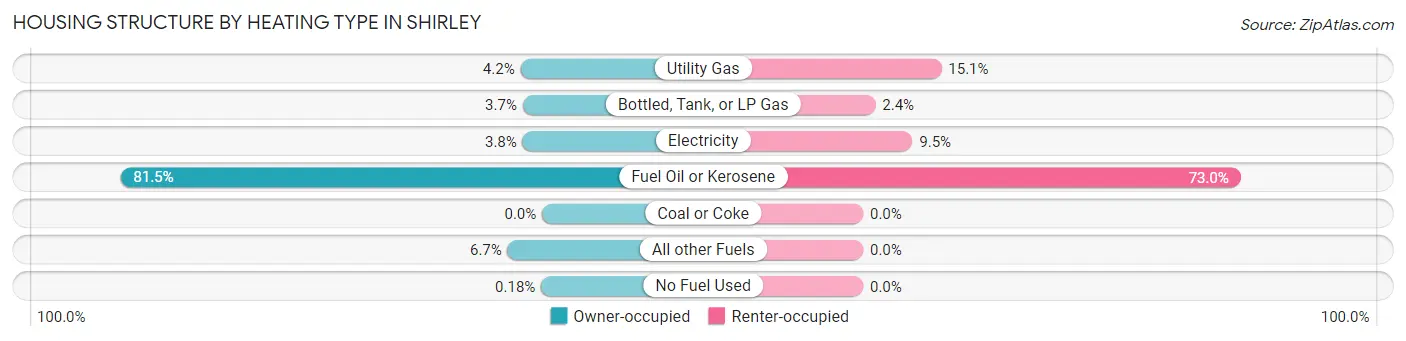
| Heating Type | Owner-occupied | Renter-occupied |
| Utility Gas | 308 (4.2%) | 108 (15.1%) |
| Bottled, Tank, or LP Gas | 276 (3.7%) | 17 (2.4%) |
| Electricity | 277 (3.8%) | 68 (9.5%) |
| Fuel Oil or Kerosene | 6,011 (81.5%) | 521 (73.0%) |
| Coal or Coke | 0 (0.0%) | 0 (0.0%) |
| All other Fuels | 491 (6.7%) | 0 (0.0%) |
| No Fuel Used | 13 (0.2%) | 0 (0.0%) |
| Total | 7,376 (100.0%) | 714 (100.0%) |
Household Vehicle Usage in Shirley
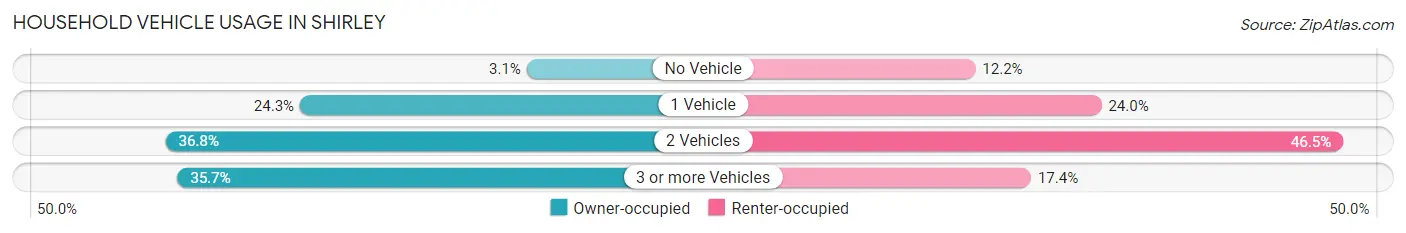
| Vehicles per Household | Owner-occupied | Renter-occupied |
| No Vehicle | 231 (3.1%) | 87 (12.2%) |
| 1 Vehicle | 1,792 (24.3%) | 171 (23.9%) |
| 2 Vehicles | 2,717 (36.8%) | 332 (46.5%) |
| 3 or more Vehicles | 2,636 (35.7%) | 124 (17.4%) |
| Total | 7,376 (100.0%) | 714 (100.0%) |
Real Estate & Mortgages in Shirley
Real Estate and Mortgage Overview in Shirley
| Characteristic | Without Mortgage | With Mortgage |
| Housing Units | 2,283 | 5,093 |
| Median Property Value | $335,300 | $366,200 |
| Median Household Income | $72,351 | $2,180 |
| Monthly Housing Costs | $1,204 | $1,101 |
| Real Estate Taxes | $8,442 | $45 |
Property Value by Mortgage Status in Shirley
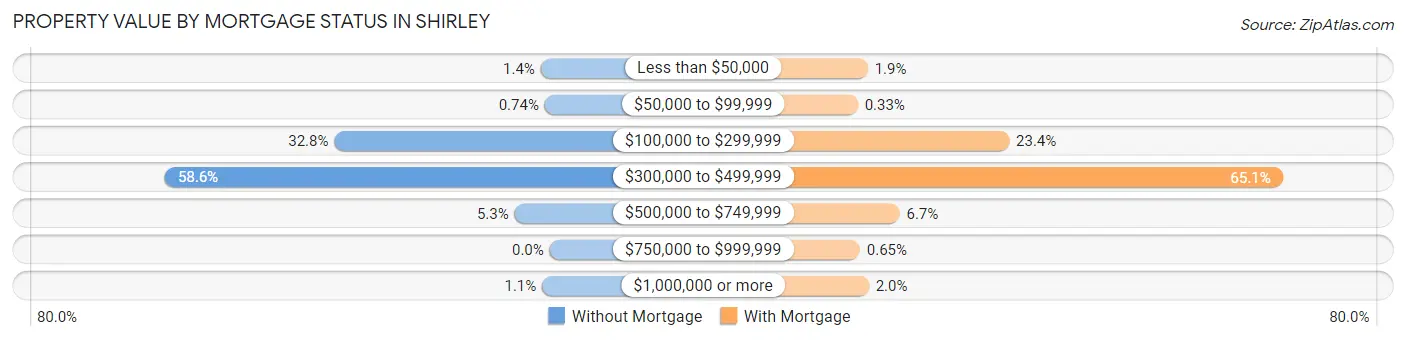
| Property Value | Without Mortgage | With Mortgage |
| Less than $50,000 | 31 (1.4%) | 94 (1.8%) |
| $50,000 to $99,999 | 17 (0.7%) | 17 (0.3%) |
| $100,000 to $299,999 | 749 (32.8%) | 1,192 (23.4%) |
| $300,000 to $499,999 | 1,338 (58.6%) | 3,314 (65.1%) |
| $500,000 to $749,999 | 122 (5.3%) | 341 (6.7%) |
| $750,000 to $999,999 | 0 (0.0%) | 33 (0.6%) |
| $1,000,000 or more | 26 (1.1%) | 102 (2.0%) |
| Total | 2,283 (100.0%) | 5,093 (100.0%) |
Household Income by Mortgage Status in Shirley
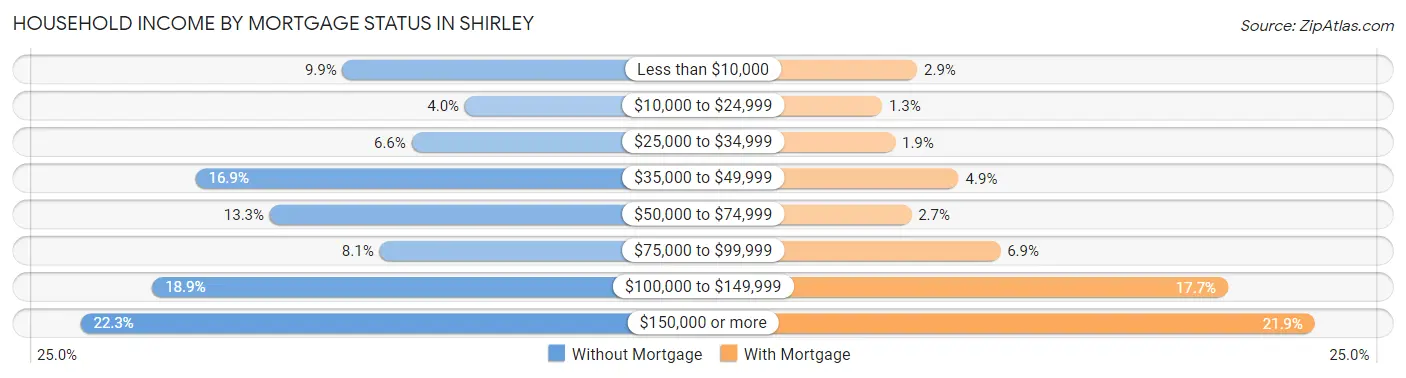
| Household Income | Without Mortgage | With Mortgage |
| Less than $10,000 | 225 (9.9%) | 149 (2.9%) |
| $10,000 to $24,999 | 92 (4.0%) | 64 (1.3%) |
| $25,000 to $34,999 | 150 (6.6%) | 96 (1.9%) |
| $35,000 to $49,999 | 385 (16.9%) | 250 (4.9%) |
| $50,000 to $74,999 | 304 (13.3%) | 135 (2.6%) |
| $75,000 to $99,999 | 185 (8.1%) | 351 (6.9%) |
| $100,000 to $149,999 | 432 (18.9%) | 903 (17.7%) |
| $150,000 or more | 510 (22.3%) | 1,114 (21.9%) |
| Total | 2,283 (100.0%) | 5,093 (100.0%) |
Property Value to Household Income Ratio in Shirley
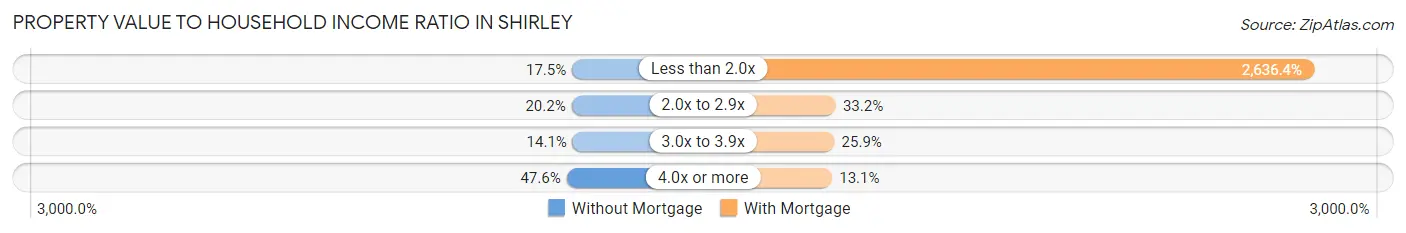
| Value-to-Income Ratio | Without Mortgage | With Mortgage |
| Less than 2.0x | 399 (17.5%) | 134,273 (2,636.4%) |
| 2.0x to 2.9x | 462 (20.2%) | 1,690 (33.2%) |
| 3.0x to 3.9x | 322 (14.1%) | 1,318 (25.9%) |
| 4.0x or more | 1,086 (47.6%) | 669 (13.1%) |
| Total | 2,283 (100.0%) | 5,093 (100.0%) |
Real Estate Taxes by Mortgage Status in Shirley
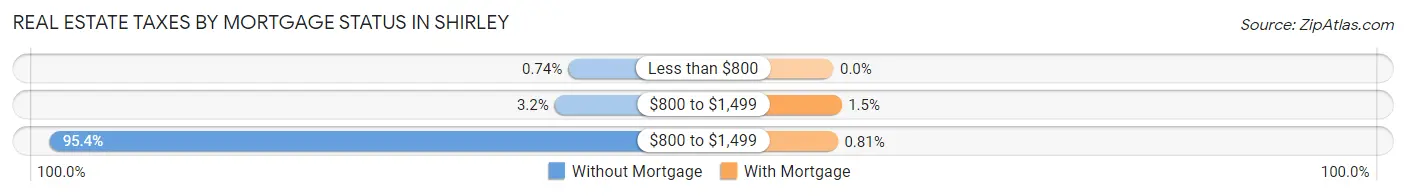
| Property Taxes | Without Mortgage | With Mortgage |
| Less than $800 | 17 (0.7%) | 0 (0.0%) |
| $800 to $1,499 | 73 (3.2%) | 76 (1.5%) |
| $800 to $1,499 | 2,178 (95.4%) | 41 (0.8%) |
| Total | 2,283 (100.0%) | 5,093 (100.0%) |
Health & Disability in Shirley
Health Insurance Coverage by Age in Shirley
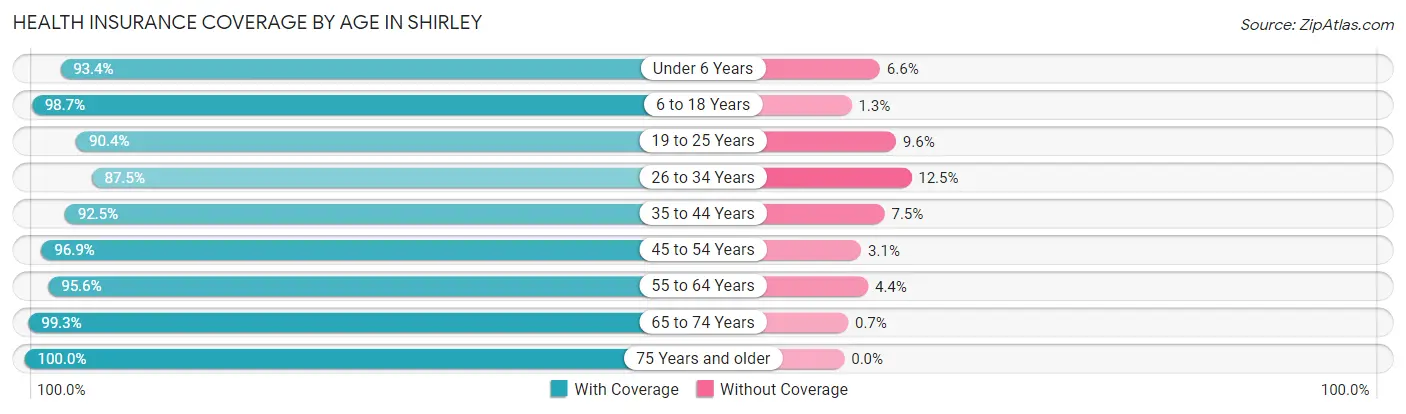
| Age Bracket | With Coverage | Without Coverage |
| Under 6 Years | 1,646 (93.4%) | 117 (6.6%) |
| 6 to 18 Years | 4,570 (98.7%) | 62 (1.3%) |
| 19 to 25 Years | 2,020 (90.4%) | 215 (9.6%) |
| 26 to 34 Years | 2,627 (87.5%) | 375 (12.5%) |
| 35 to 44 Years | 3,121 (92.5%) | 253 (7.5%) |
| 45 to 54 Years | 3,265 (96.9%) | 106 (3.1%) |
| 55 to 64 Years | 4,396 (95.6%) | 204 (4.4%) |
| 65 to 74 Years | 2,682 (99.3%) | 19 (0.7%) |
| 75 Years and older | 796 (100.0%) | 0 (0.0%) |
| Total | 25,123 (94.9%) | 1,351 (5.1%) |
Health Insurance Coverage by Citizenship Status in Shirley
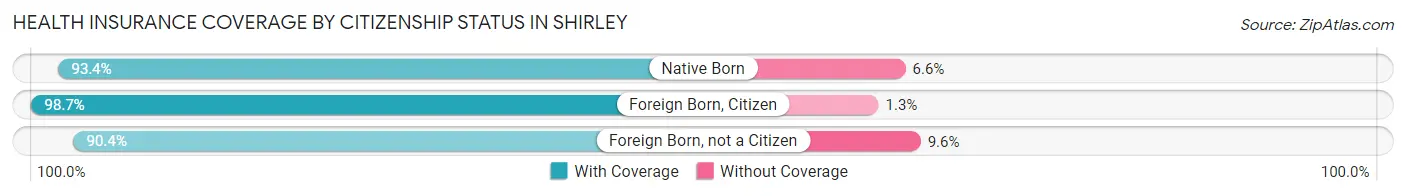
| Citizenship Status | With Coverage | Without Coverage |
| Native Born | 1,646 (93.4%) | 117 (6.6%) |
| Foreign Born, Citizen | 4,570 (98.7%) | 62 (1.3%) |
| Foreign Born, not a Citizen | 2,020 (90.4%) | 215 (9.6%) |
Health Insurance Coverage by Household Income in Shirley
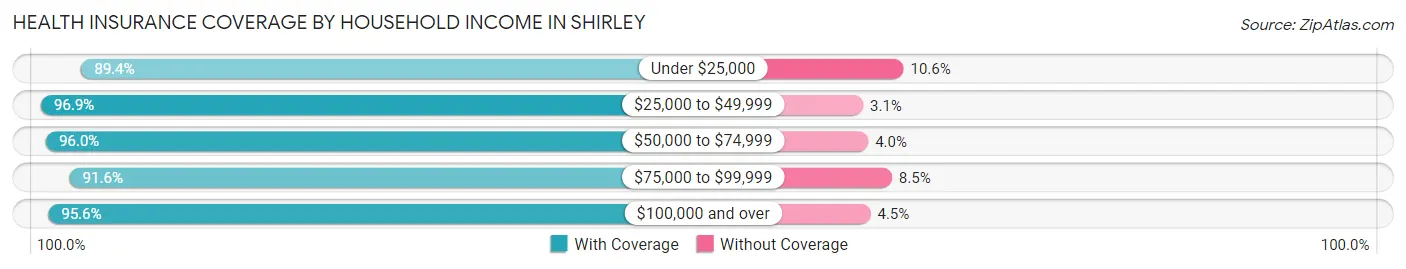
| Household Income | With Coverage | Without Coverage |
| Under $25,000 | 1,312 (89.4%) | 156 (10.6%) |
| $25,000 to $49,999 | 2,665 (96.9%) | 84 (3.1%) |
| $50,000 to $74,999 | 1,818 (96.0%) | 76 (4.0%) |
| $75,000 to $99,999 | 2,806 (91.5%) | 259 (8.5%) |
| $100,000 and over | 16,268 (95.6%) | 757 (4.4%) |
Public vs Private Health Insurance Coverage by Age in Shirley
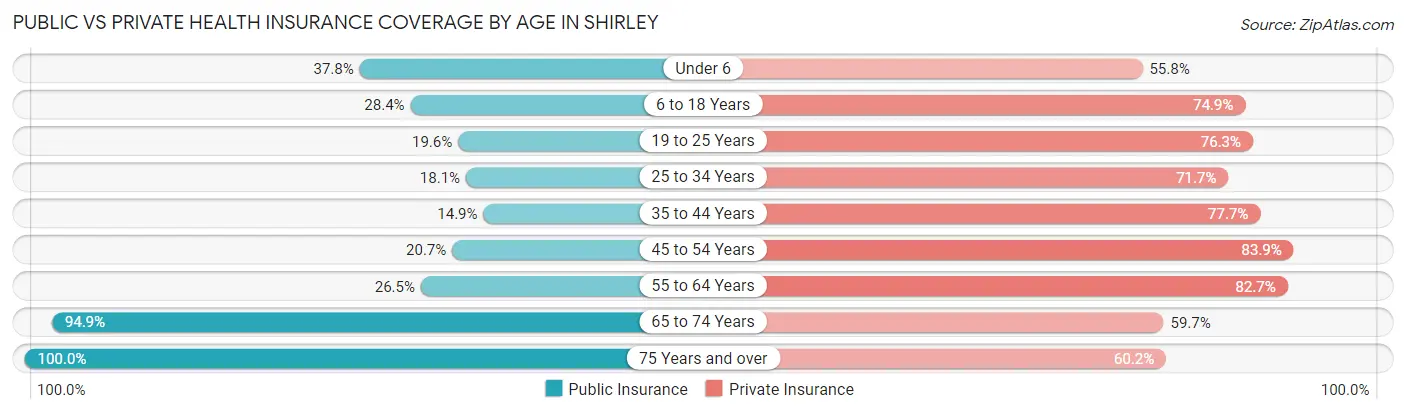
| Age Bracket | Public Insurance | Private Insurance |
| Under 6 | 667 (37.8%) | 984 (55.8%) |
| 6 to 18 Years | 1,315 (28.4%) | 3,469 (74.9%) |
| 19 to 25 Years | 437 (19.6%) | 1,705 (76.3%) |
| 25 to 34 Years | 543 (18.1%) | 2,153 (71.7%) |
| 35 to 44 Years | 501 (14.8%) | 2,620 (77.6%) |
| 45 to 54 Years | 696 (20.6%) | 2,827 (83.9%) |
| 55 to 64 Years | 1,217 (26.5%) | 3,806 (82.7%) |
| 65 to 74 Years | 2,564 (94.9%) | 1,613 (59.7%) |
| 75 Years and over | 796 (100.0%) | 479 (60.2%) |
| Total | 8,736 (33.0%) | 19,656 (74.3%) |
Disability Status by Sex by Age in Shirley
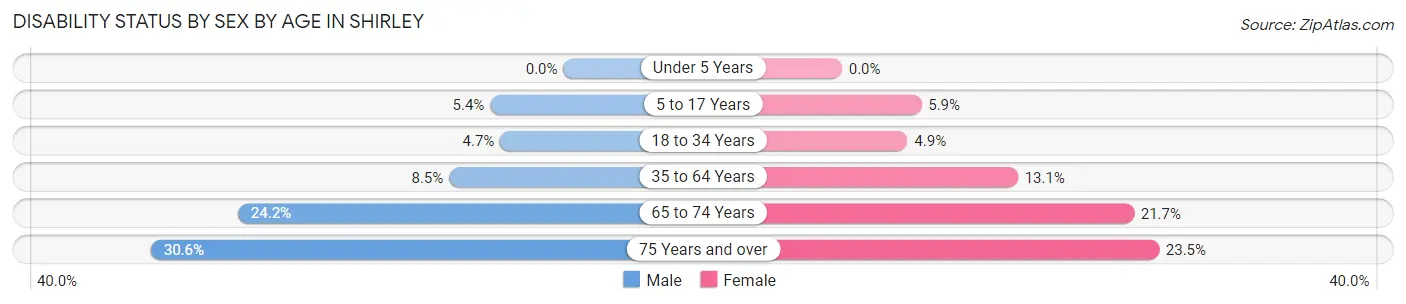
| Age Bracket | Male | Female |
| Under 5 Years | 0 (0.0%) | 0 (0.0%) |
| 5 to 17 Years | 139 (5.4%) | 114 (5.9%) |
| 18 to 34 Years | 124 (4.7%) | 149 (4.9%) |
| 35 to 64 Years | 501 (8.5%) | 710 (13.1%) |
| 65 to 74 Years | 316 (24.2%) | 302 (21.7%) |
| 75 Years and over | 102 (30.6%) | 109 (23.5%) |
Disability Class by Sex by Age in Shirley
Disability Class: Hearing Difficulty
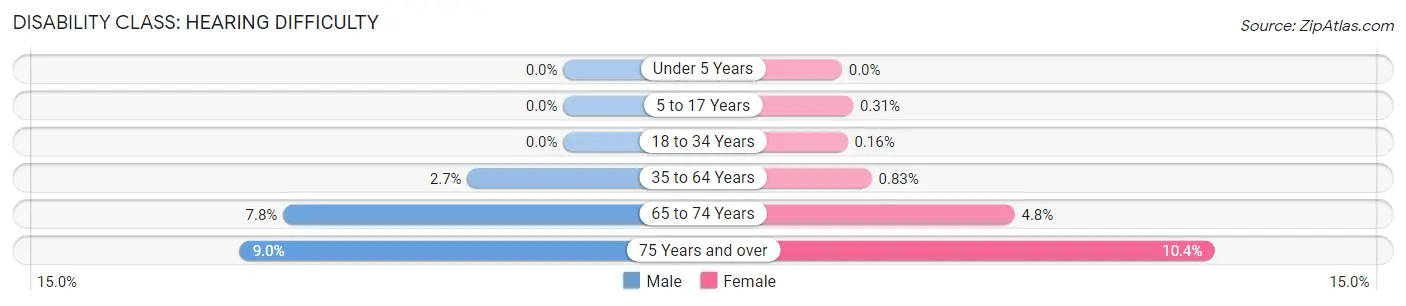
| Age Bracket | Male | Female |
| Under 5 Years | 0 (0.0%) | 0 (0.0%) |
| 5 to 17 Years | 0 (0.0%) | 6 (0.3%) |
| 18 to 34 Years | 0 (0.0%) | 5 (0.2%) |
| 35 to 64 Years | 158 (2.7%) | 45 (0.8%) |
| 65 to 74 Years | 102 (7.8%) | 67 (4.8%) |
| 75 Years and over | 30 (9.0%) | 48 (10.4%) |
Disability Class: Vision Difficulty
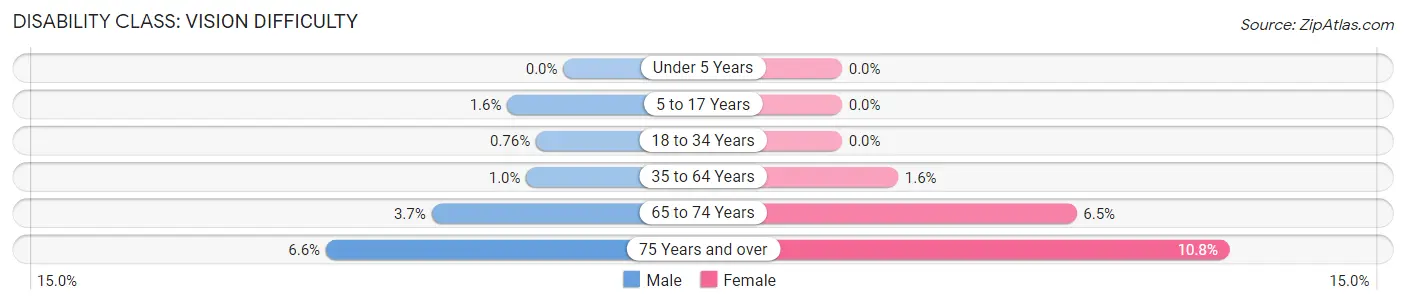
| Age Bracket | Male | Female |
| Under 5 Years | 0 (0.0%) | 0 (0.0%) |
| 5 to 17 Years | 40 (1.6%) | 0 (0.0%) |
| 18 to 34 Years | 20 (0.8%) | 0 (0.0%) |
| 35 to 64 Years | 61 (1.0%) | 85 (1.6%) |
| 65 to 74 Years | 48 (3.7%) | 91 (6.5%) |
| 75 Years and over | 22 (6.6%) | 50 (10.8%) |
Disability Class: Cognitive Difficulty
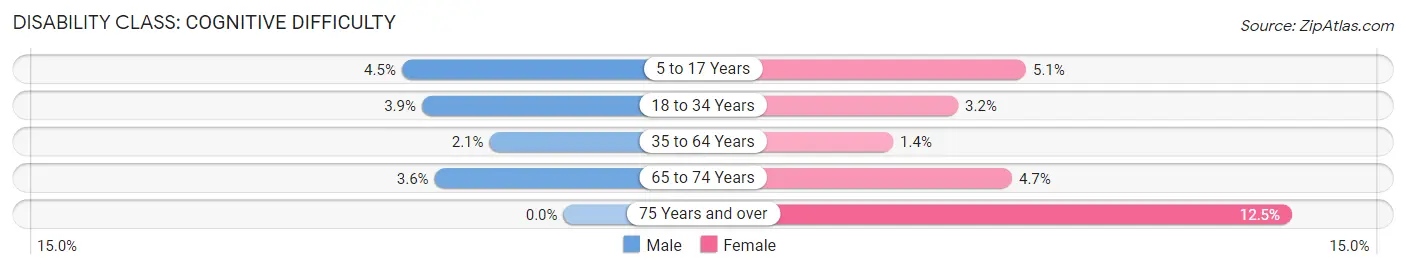
| Age Bracket | Male | Female |
| 5 to 17 Years | 115 (4.5%) | 99 (5.1%) |
| 18 to 34 Years | 104 (3.9%) | 99 (3.2%) |
| 35 to 64 Years | 122 (2.1%) | 78 (1.4%) |
| 65 to 74 Years | 47 (3.6%) | 66 (4.7%) |
| 75 Years and over | 0 (0.0%) | 58 (12.5%) |
Disability Class: Ambulatory Difficulty
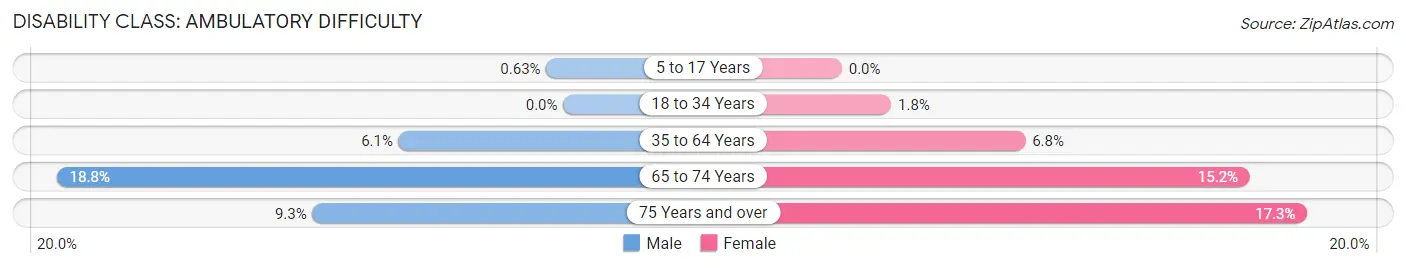
| Age Bracket | Male | Female |
| 5 to 17 Years | 16 (0.6%) | 0 (0.0%) |
| 18 to 34 Years | 0 (0.0%) | 56 (1.8%) |
| 35 to 64 Years | 361 (6.1%) | 370 (6.8%) |
| 65 to 74 Years | 246 (18.8%) | 211 (15.1%) |
| 75 Years and over | 31 (9.3%) | 80 (17.3%) |
Disability Class: Self-Care Difficulty
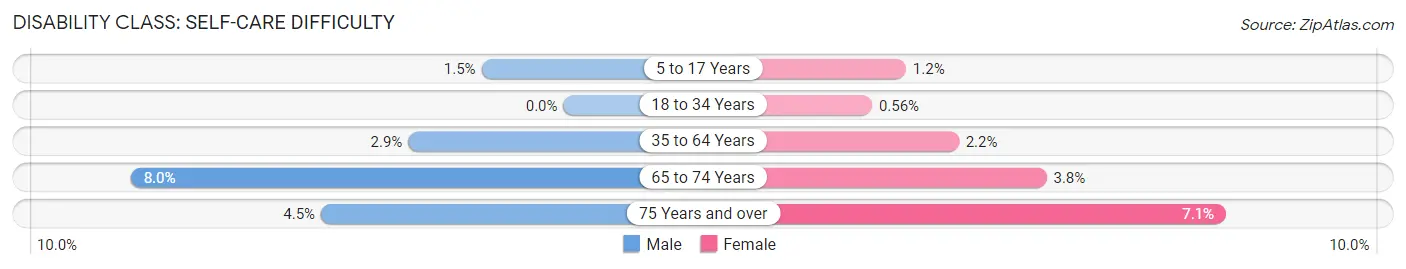
| Age Bracket | Male | Female |
| 5 to 17 Years | 39 (1.5%) | 23 (1.2%) |
| 18 to 34 Years | 0 (0.0%) | 17 (0.6%) |
| 35 to 64 Years | 170 (2.9%) | 118 (2.2%) |
| 65 to 74 Years | 105 (8.0%) | 53 (3.8%) |
| 75 Years and over | 15 (4.5%) | 33 (7.1%) |
Technology Access in Shirley
Computing Device Access in Shirley
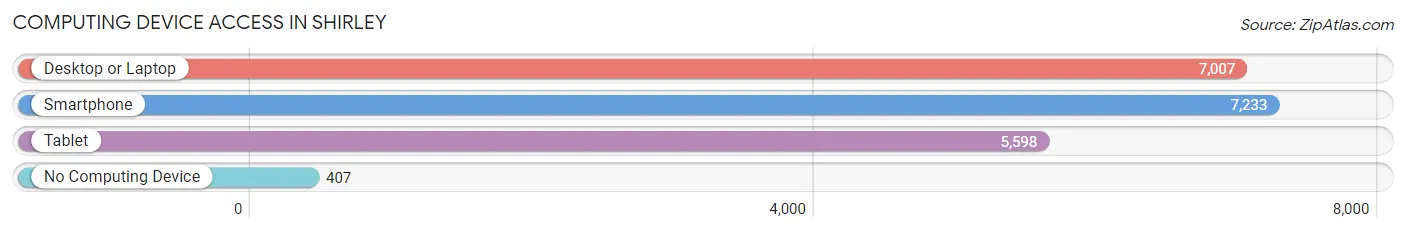
| Device Type | # Households | % Households |
| Desktop or Laptop | 7,007 | 86.6% |
| Smartphone | 7,233 | 89.4% |
| Tablet | 5,598 | 69.2% |
| No Computing Device | 407 | 5.0% |
| Total | 8,090 | 100.0% |
Internet Access in Shirley
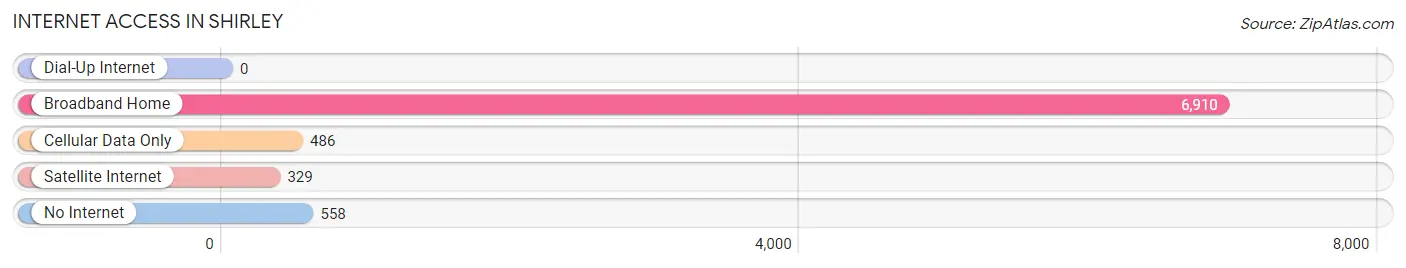
| Internet Type | # Households | % Households |
| Dial-Up Internet | 0 | 0.0% |
| Broadband Home | 6,910 | 85.4% |
| Cellular Data Only | 486 | 6.0% |
| Satellite Internet | 329 | 4.1% |
| No Internet | 558 | 6.9% |
| Total | 8,090 | 100.0% |
Shirley Summary
Shirley, New York is a hamlet located in the Town of Brookhaven in Suffolk County, New York. It is situated on the south shore of Long Island, approximately 60 miles east of New York City. The hamlet is bordered by the hamlets of Mastic Beach to the east, Yaphank to the west, and Mastic to the north.
History
Shirley was originally inhabited by the Secatogue Indians, a branch of the Algonquin tribe. The area was first settled by Europeans in the mid-17th century, and the hamlet was named after the Shirley family, who were among the first settlers. The Shirley family owned a large tract of land in the area, and the hamlet was officially established in 1790.
In the 19th century, the hamlet was a popular summer resort destination for wealthy New Yorkers. The area was known for its beaches, fishing, and hunting. In the early 20th century, the hamlet began to develop into a residential community, and by the 1950s, it had become a popular bedroom community for commuters to New York City.
Geography
Shirley is located on the south shore of Long Island, approximately 60 miles east of New York City. The hamlet is bordered by the hamlets of Mastic Beach to the east, Yaphank to the west, and Mastic to the north. The hamlet is situated on the south shore of Long Island, and is surrounded by the Great South Bay and the Carmans River.
The terrain of Shirley is mostly flat, with some rolling hills. The hamlet is located in the Pine Barrens, a large area of pine forest and wetlands. The area is known for its diverse wildlife, including white-tailed deer, foxes, and various species of birds.
Economy
Shirley’s economy is largely based on tourism and retail. The hamlet is home to several popular tourist attractions, including the Long Island Game Farm, the Long Island Aquarium, and the Splish Splash Water Park. The hamlet is also home to several retail stores, including a Walmart Supercenter, a Lowe’s Home Improvement store, and a Target.
The hamlet is also home to several industrial and manufacturing businesses, including a concrete plant, a lumber yard, and a metal fabrication plant. The hamlet is also home to several small businesses, including restaurants, bars, and shops.
Demographics
As of the 2010 census, the population of Shirley was 20,217. The racial makeup of the hamlet was 79.3% White, 11.2% African American, 0.3% Native American, 2.2% Asian, 0.1% Pacific Islander, 4.2% from other races, and 2.9% from two or more races. Hispanic or Latino of any race were 8.7% of the population.
The median household income in Shirley was $68,945, and the median family income was $76,945. The per capita income was $30,945. About 4.3% of families and 5.7% of the population were below the poverty line, including 8.2% of those under age 18 and 4.2% of those age 65 or over.
Common Questions
What is Per Capita Income in Shirley?
Per Capita income in Shirley is $48,537.
What is the Median Family Income in Shirley?
Median Family Income in Shirley is $123,269.
What is the Median Household income in Shirley?
Median Household Income in Shirley is $109,821.
What is Income or Wage Gap in Shirley?
Income or Wage Gap in Shirley is 21.2%.
Women in Shirley earn 78.8 cents for every dollar earned by a man.
What is Inequality or Gini Index in Shirley?
Inequality or Gini Index in Shirley is 0.49.
What is the Total Population of Shirley?
Total Population of Shirley is 26,498.
What is the Total Male Population of Shirley?
Total Male Population of Shirley is 13,600.
What is the Total Female Population of Shirley?
Total Female Population of Shirley is 12,898.
What is the Ratio of Males per 100 Females in Shirley?
There are 105.44 Males per 100 Females in Shirley.
What is the Ratio of Females per 100 Males in Shirley?
There are 94.84 Females per 100 Males in Shirley.
What is the Median Population Age in Shirley?
Median Population Age in Shirley is 40.4 Years.
What is the Average Family Size in Shirley
Average Family Size in Shirley is 3.7 People.
What is the Average Household Size in Shirley
Average Household Size in Shirley is 3.2 People.
How Large is the Labor Force in Shirley?
There are 13,528 People in the Labor Forcein in Shirley.
What is the Percentage of People in the Labor Force in Shirley?
63.9% of People are in the Labor Force in Shirley.
What is the Unemployment Rate in Shirley?
Unemployment Rate in Shirley is 6.4%.