Nanuet, NY Map & Demographics
Nanuet Map
Nanuet Overview
$49,479
PER CAPITA INCOME
$128,819
AVG FAMILY INCOME
$114,498
AVG HOUSEHOLD INCOME
37.6%
WAGE / INCOME GAP [ % ]
62.4¢/ $1
WAGE / INCOME GAP [ $ ]
$9,960
FAMILY INCOME DEFICIT
0.47
INEQUALITY / GINI INDEX
20,586
TOTAL POPULATION
10,251
MALE POPULATION
10,335
FEMALE POPULATION
99.19
MALES / 100 FEMALES
100.82
FEMALES / 100 MALES
41.0
MEDIAN AGE
3.3
AVG FAMILY SIZE
2.9
AVG HOUSEHOLD SIZE
10,554
LABOR FORCE [ PEOPLE ]
62.3%
PERCENT IN LABOR FORCE
3.0%
UNEMPLOYMENT RATE
Nanuet Zip Codes
Income in Nanuet
Income Overview in Nanuet
Per Capita Income in Nanuet is $49,479, while median incomes of families and households are $128,819 and $114,498 respectively.
| Characteristic | Number | Measure |
| Per Capita Income | 20,586 | $49,479 |
| Median Family Income | 4,899 | $128,819 |
| Mean Family Income | 4,899 | $186,316 |
| Median Household Income | 7,021 | $114,498 |
| Mean Household Income | 7,021 | $156,203 |
| Income Deficit | 4,899 | $9,960 |
| Wage / Income Gap (%) | 20,586 | 37.60% |
| Wage / Income Gap ($) | 20,586 | 62.40¢ per $1 |
| Gini / Inequality Index | 20,586 | 0.47 |
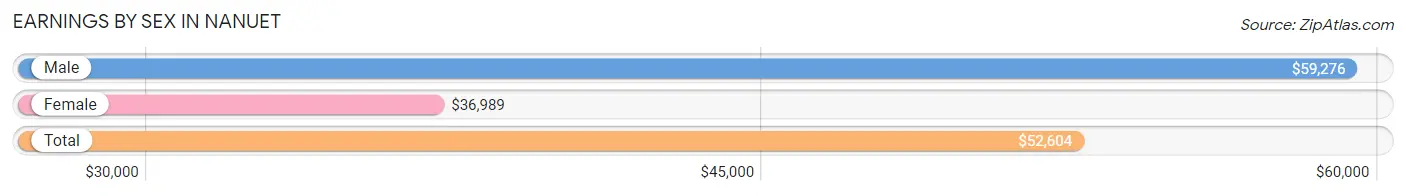
Earnings by Sex in Nanuet
Average Earnings in Nanuet are $52,604, $59,276 for men and $36,989 for women, a difference of 37.6%.
| Sex | Number | Average Earnings |
| Male | 5,568 (50.8%) | $59,276 |
| Female | 5,397 (49.2%) | $36,989 |
| Total | 10,965 (100.0%) | $52,604 |
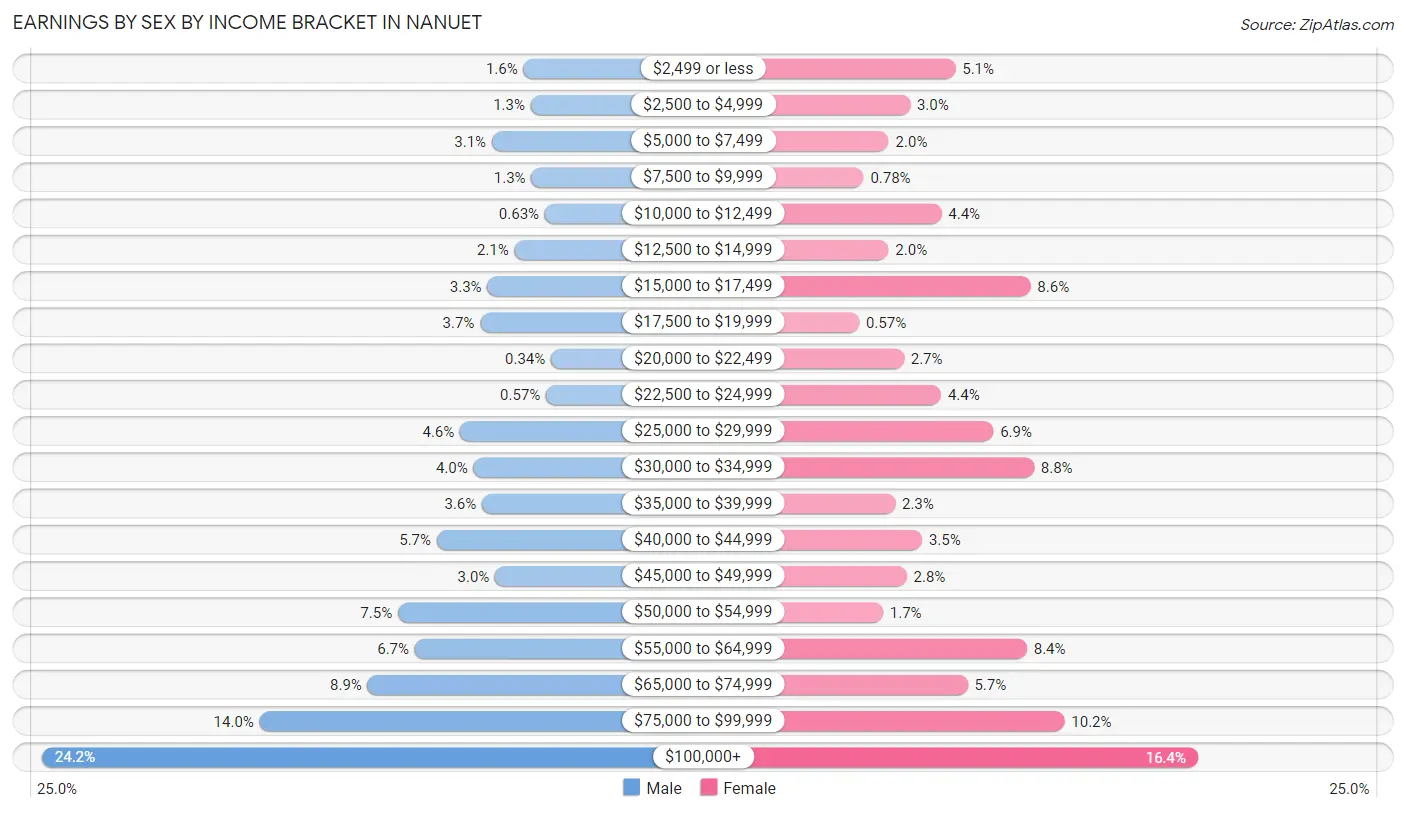
Earnings by Sex by Income Bracket in Nanuet
The most common earnings brackets in Nanuet are $100,000+ for men (1,347 | 24.2%) and $100,000+ for women (887 | 16.4%).
| Income | Male | Female |
| $2,499 or less | 91 (1.6%) | 274 (5.1%) |
| $2,500 to $4,999 | 72 (1.3%) | 160 (3.0%) |
| $5,000 to $7,499 | 173 (3.1%) | 106 (2.0%) |
| $7,500 to $9,999 | 70 (1.3%) | 42 (0.8%) |
| $10,000 to $12,499 | 35 (0.6%) | 239 (4.4%) |
| $12,500 to $14,999 | 114 (2.1%) | 105 (1.9%) |
| $15,000 to $17,499 | 185 (3.3%) | 464 (8.6%) |
| $17,500 to $19,999 | 204 (3.7%) | 31 (0.6%) |
| $20,000 to $22,499 | 19 (0.3%) | 144 (2.7%) |
| $22,500 to $24,999 | 32 (0.6%) | 238 (4.4%) |
| $25,000 to $29,999 | 256 (4.6%) | 370 (6.9%) |
| $30,000 to $34,999 | 221 (4.0%) | 473 (8.8%) |
| $35,000 to $39,999 | 199 (3.6%) | 122 (2.3%) |
| $40,000 to $44,999 | 317 (5.7%) | 190 (3.5%) |
| $45,000 to $49,999 | 165 (3.0%) | 151 (2.8%) |
| $50,000 to $54,999 | 418 (7.5%) | 91 (1.7%) |
| $55,000 to $64,999 | 374 (6.7%) | 455 (8.4%) |
| $65,000 to $74,999 | 497 (8.9%) | 305 (5.7%) |
| $75,000 to $99,999 | 779 (14.0%) | 550 (10.2%) |
| $100,000+ | 1,347 (24.2%) | 887 (16.4%) |
| Total | 5,568 (100.0%) | 5,397 (100.0%) |
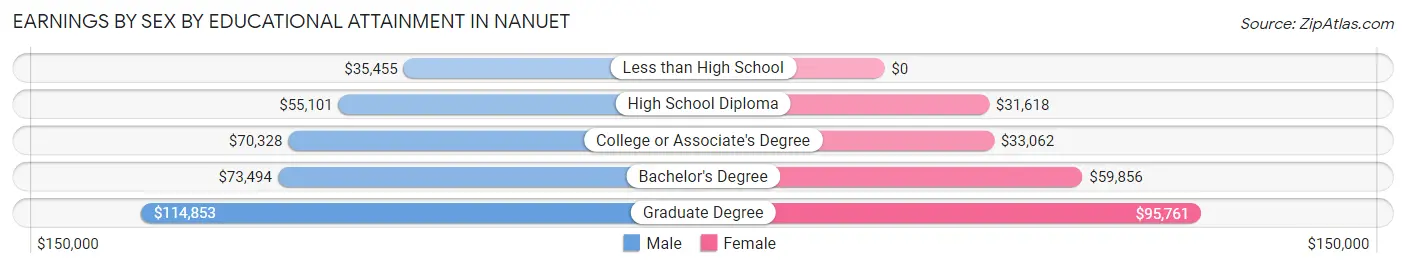
Earnings by Sex by Educational Attainment in Nanuet
Average earnings in Nanuet are $68,769 for men and $47,807 for women, a difference of 30.5%. Men with an educational attainment of graduate degree enjoy the highest average annual earnings of $114,853, while those with less than high school education earn the least with $35,455. Women with an educational attainment of graduate degree earn the most with the average annual earnings of $95,761, while those with high school diploma education have the smallest earnings of $31,618.
| Educational Attainment | Male Income | Female Income |
| Less than High School | $35,455 | $0 |
| High School Diploma | $55,101 | $31,618 |
| College or Associate's Degree | $70,328 | $33,062 |
| Bachelor's Degree | $73,494 | $59,856 |
| Graduate Degree | $114,853 | $95,761 |
| Total | $68,769 | $47,807 |
Family Income in Nanuet
Family Income Brackets in Nanuet
According to the Nanuet family income data, there are 1,416 families falling into the $200,000+ income range, which is the most common income bracket and makes up 28.9% of all families. Conversely, the $10,000 to $14,999 income bracket is the least frequent group with only 39 families (0.8%) belonging to this category.
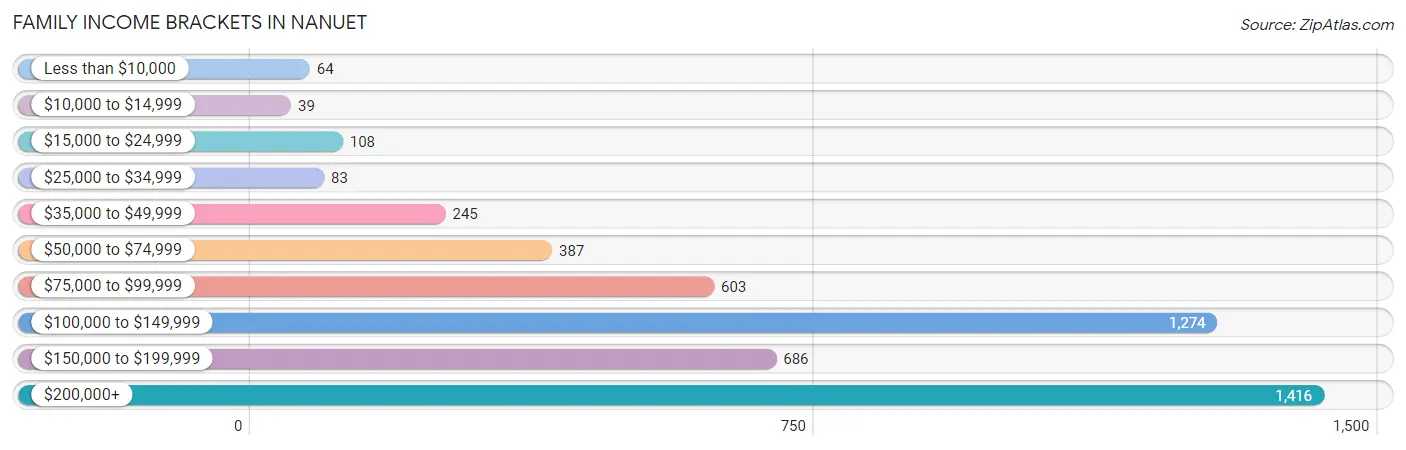
| Income Bracket | # Families | % Families |
| Less than $10,000 | 64 | 1.3% |
| $10,000 to $14,999 | 39 | 0.8% |
| $15,000 to $24,999 | 108 | 2.2% |
| $25,000 to $34,999 | 83 | 1.7% |
| $35,000 to $49,999 | 245 | 5.0% |
| $50,000 to $74,999 | 387 | 7.9% |
| $75,000 to $99,999 | 603 | 12.3% |
| $100,000 to $149,999 | 1,274 | 26.0% |
| $150,000 to $199,999 | 686 | 14.0% |
| $200,000+ | 1,416 | 28.9% |
Family Income by Famaliy Size in Nanuet
4-person families (1,246 | 25.4%) account for the highest median family income in Nanuet with $182,045 per family, while 2-person families (1,747 | 35.7%) have the highest median income of $58,570 per family member.
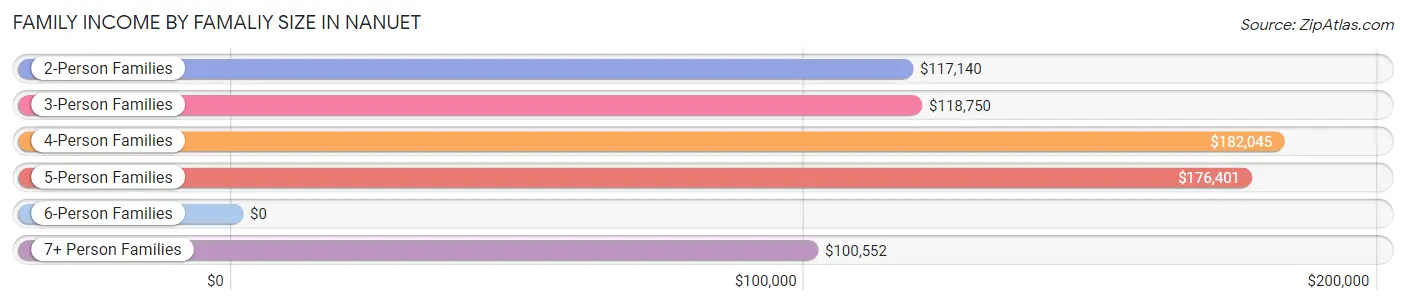
| Income Bracket | # Families | Median Income |
| 2-Person Families | 1,747 (35.7%) | $117,140 |
| 3-Person Families | 1,122 (22.9%) | $118,750 |
| 4-Person Families | 1,246 (25.4%) | $182,045 |
| 5-Person Families | 413 (8.4%) | $176,401 |
| 6-Person Families | 256 (5.2%) | $0 |
| 7+ Person Families | 115 (2.4%) | $100,552 |
| Total | 4,899 (100.0%) | $128,819 |
Family Income by Number of Earners in Nanuet
The median family income in Nanuet is $128,819, with families comprising 3+ earners (853) having the highest median family income of $171,118, while families with no earners (488) have the lowest median family income of $77,115, accounting for 17.4% and 10.0% of families, respectively.
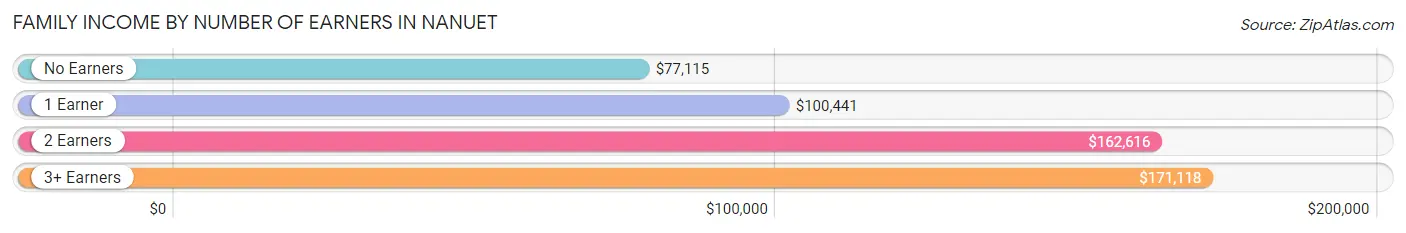
| Number of Earners | # Families | Median Income |
| No Earners | 488 (10.0%) | $77,115 |
| 1 Earner | 1,452 (29.6%) | $100,441 |
| 2 Earners | 2,106 (43.0%) | $162,616 |
| 3+ Earners | 853 (17.4%) | $171,118 |
| Total | 4,899 (100.0%) | $128,819 |
Household Income in Nanuet
Household Income Brackets in Nanuet
With 1,629 households falling in the category, the $100,000 to $149,999 income range is the most frequent in Nanuet, accounting for 23.2% of all households. In contrast, only 91 households (1.3%) fall into the $10,000 to $14,999 income bracket, making it the least populous group.
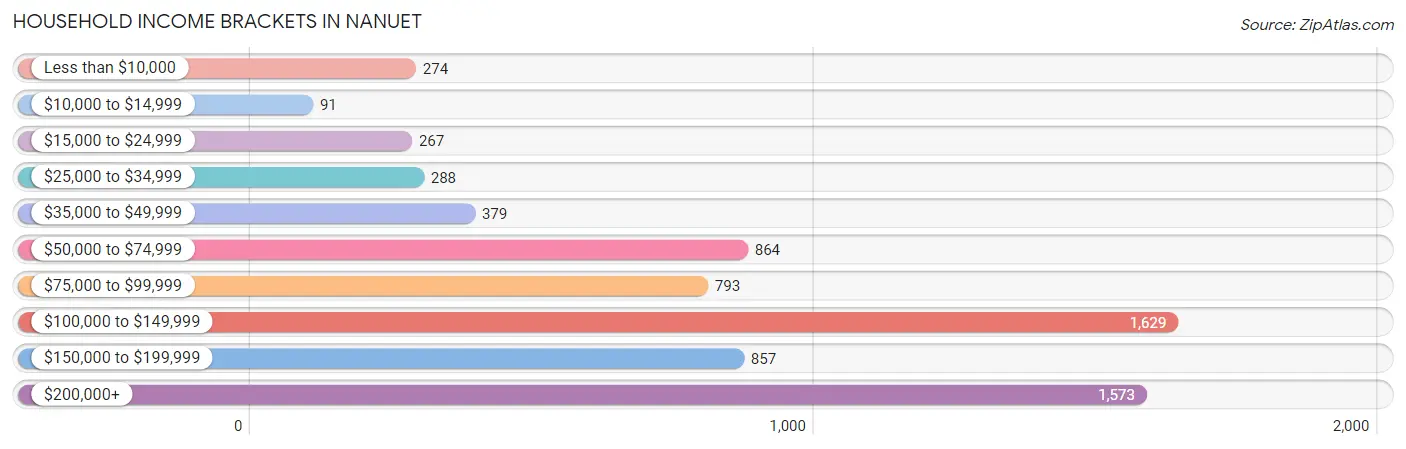
| Income Bracket | # Households | % Households |
| Less than $10,000 | 274 | 3.9% |
| $10,000 to $14,999 | 91 | 1.3% |
| $15,000 to $24,999 | 267 | 3.8% |
| $25,000 to $34,999 | 288 | 4.1% |
| $35,000 to $49,999 | 379 | 5.4% |
| $50,000 to $74,999 | 864 | 12.3% |
| $75,000 to $99,999 | 793 | 11.3% |
| $100,000 to $149,999 | 1,629 | 23.2% |
| $150,000 to $199,999 | 857 | 12.2% |
| $200,000+ | 1,573 | 22.4% |
Household Income by Householder Age in Nanuet
The median household income in Nanuet is $114,498, with the highest median household income of $144,306 found in the 25 to 44 years age bracket for the primary householder. A total of 1,720 households (24.5%) fall into this category.
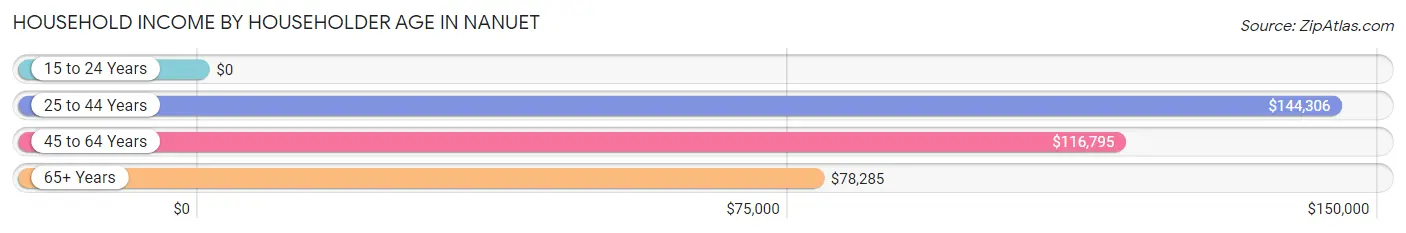
| Income Bracket | # Households | Median Income |
| 15 to 24 Years | 0 (0.0%) | $0 |
| 25 to 44 Years | 1,720 (24.5%) | $144,306 |
| 45 to 64 Years | 3,062 (43.6%) | $116,795 |
| 65+ Years | 2,239 (31.9%) | $78,285 |
| Total | 7,021 (100.0%) | $114,498 |
Poverty in Nanuet
Income Below Poverty by Sex and Age in Nanuet
With 5.0% poverty level for males and 8.1% for females among the residents of Nanuet, 5 year old males and 35 to 44 year old females are the most vulnerable to poverty, with 44 males (40.0%) and 218 females (18.4%) in their respective age groups living below the poverty level.
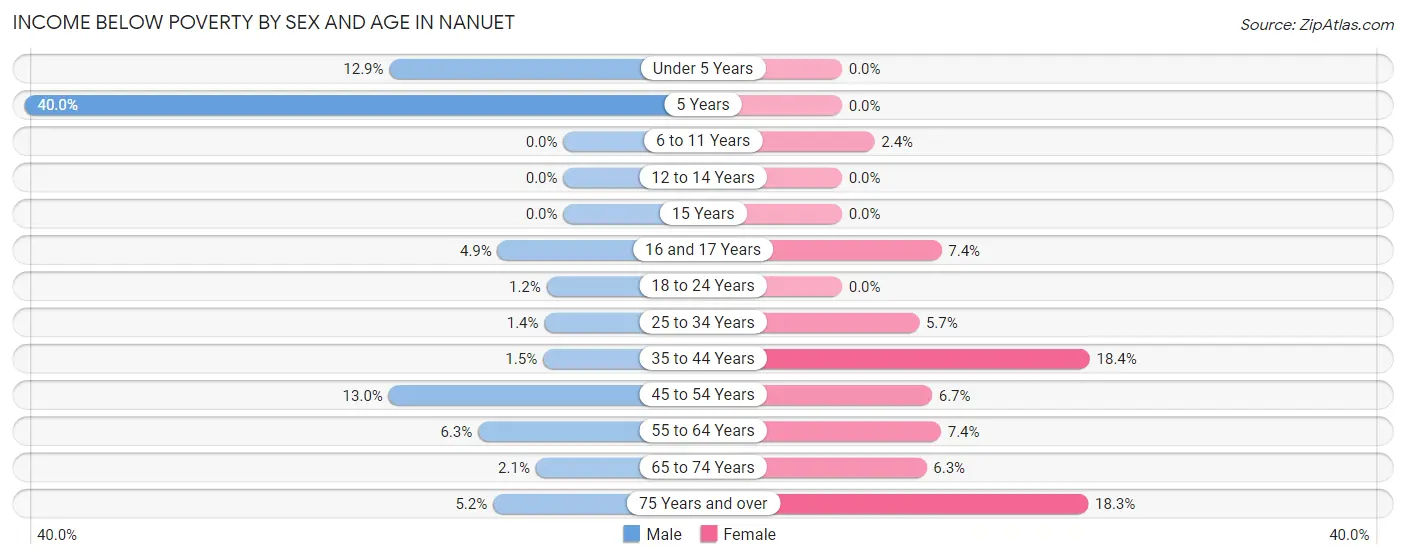
| Age Bracket | Male | Female |
| Under 5 Years | 58 (12.9%) | 0 (0.0%) |
| 5 Years | 44 (40.0%) | 0 (0.0%) |
| 6 to 11 Years | 0 (0.0%) | 13 (2.4%) |
| 12 to 14 Years | 0 (0.0%) | 0 (0.0%) |
| 15 Years | 0 (0.0%) | 0 (0.0%) |
| 16 and 17 Years | 16 (4.9%) | 15 (7.4%) |
| 18 to 24 Years | 10 (1.2%) | 0 (0.0%) |
| 25 to 34 Years | 18 (1.4%) | 80 (5.7%) |
| 35 to 44 Years | 21 (1.5%) | 218 (18.4%) |
| 45 to 54 Years | 216 (13.0%) | 73 (6.7%) |
| 55 to 64 Years | 76 (6.3%) | 121 (7.3%) |
| 65 to 74 Years | 20 (2.1%) | 72 (6.3%) |
| 75 Years and over | 25 (5.2%) | 225 (18.3%) |
| Total | 504 (5.0%) | 817 (8.1%) |
Income Above Poverty by Sex and Age in Nanuet
According to the poverty statistics in Nanuet, males aged 6 to 11 years and females aged under 5 years are the age groups that are most secure financially, with 100.0% of males and 100.0% of females in these age groups living above the poverty line.
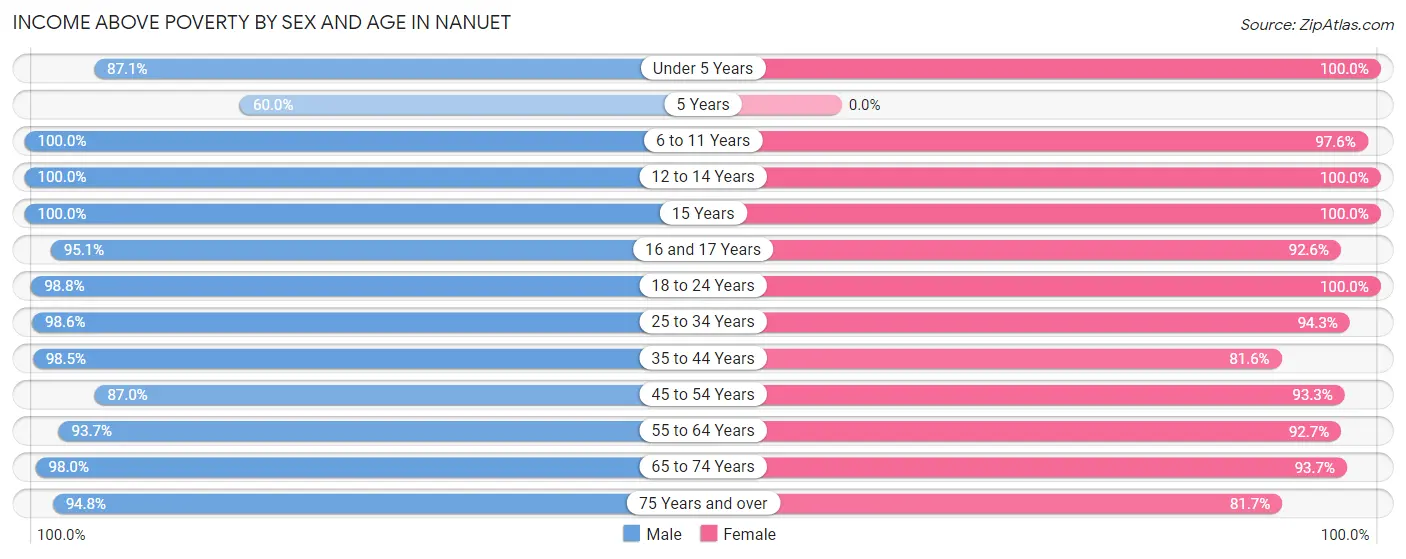
| Age Bracket | Male | Female |
| Under 5 Years | 391 (87.1%) | 540 (100.0%) |
| 5 Years | 66 (60.0%) | 0 (0.0%) |
| 6 to 11 Years | 784 (100.0%) | 524 (97.6%) |
| 12 to 14 Years | 460 (100.0%) | 219 (100.0%) |
| 15 Years | 207 (100.0%) | 178 (100.0%) |
| 16 and 17 Years | 312 (95.1%) | 188 (92.6%) |
| 18 to 24 Years | 794 (98.8%) | 707 (100.0%) |
| 25 to 34 Years | 1,263 (98.6%) | 1,317 (94.3%) |
| 35 to 44 Years | 1,371 (98.5%) | 967 (81.6%) |
| 45 to 54 Years | 1,450 (87.0%) | 1,019 (93.3%) |
| 55 to 64 Years | 1,125 (93.7%) | 1,525 (92.6%) |
| 65 to 74 Years | 955 (98.0%) | 1,074 (93.7%) |
| 75 Years and over | 454 (94.8%) | 1,005 (81.7%) |
| Total | 9,632 (95.0%) | 9,263 (91.9%) |
Income Below Poverty Among Married-Couple Families in Nanuet
The poverty statistics for married-couple families in Nanuet show that 2.3% or 82 of the total 3,525 families live below the poverty line. Families with no children have the highest poverty rate of 4.4%, comprising of 82 families. On the other hand, families with 1 or 2 children have the lowest poverty rate of 0.0%, which includes 0 families.
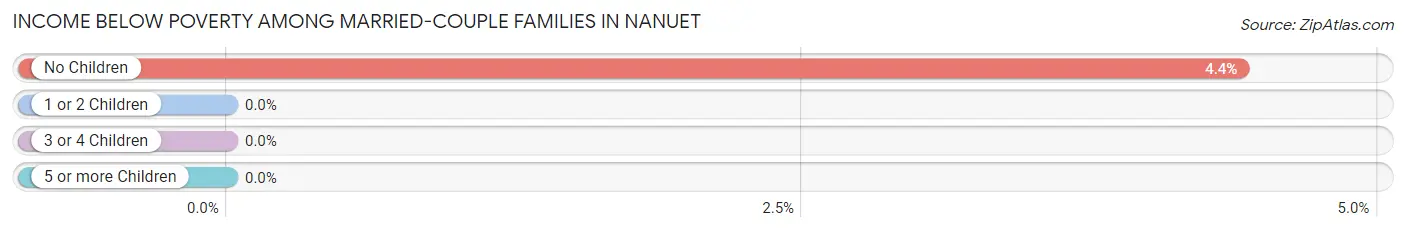
| Children | Above Poverty | Below Poverty |
| No Children | 1,781 (95.6%) | 82 (4.4%) |
| 1 or 2 Children | 1,340 (100.0%) | 0 (0.0%) |
| 3 or 4 Children | 315 (100.0%) | 0 (0.0%) |
| 5 or more Children | 7 (100.0%) | 0 (0.0%) |
| Total | 3,443 (97.7%) | 82 (2.3%) |
Income Below Poverty Among Single-Parent Households in Nanuet
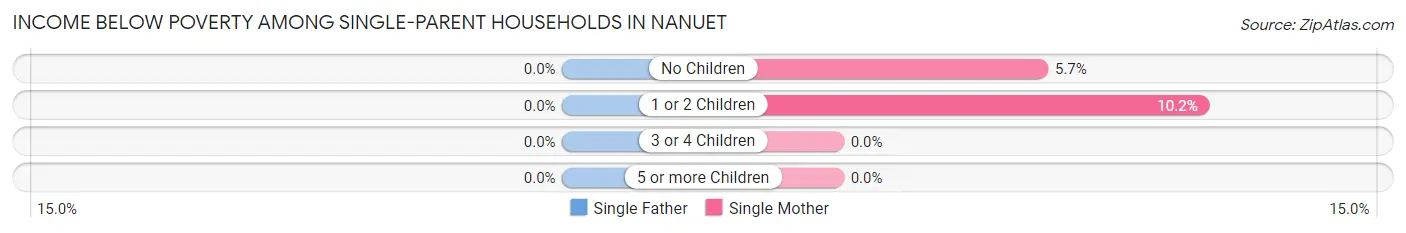
| Children | Single Father | Single Mother |
| No Children | 0 (0.0%) | 35 (5.7%) |
| 1 or 2 Children | 0 (0.0%) | 32 (10.2%) |
| 3 or 4 Children | 0 (0.0%) | 0 (0.0%) |
| 5 or more Children | 0 (0.0%) | 0 (0.0%) |
| Total | 0 (0.0%) | 67 (7.2%) |
Income Below Poverty Among Married-Couple vs Single-Parent Households in Nanuet
The poverty data for Nanuet shows that 82 of the married-couple family households (2.3%) and 67 of the single-parent households (4.9%) are living below the poverty level. Within the married-couple family households, those with no children have the highest poverty rate, with 82 households (4.4%) falling below the poverty line. Among the single-parent households, those with 1 or 2 children have the highest poverty rate, with 32 household (5.3%) living below poverty.
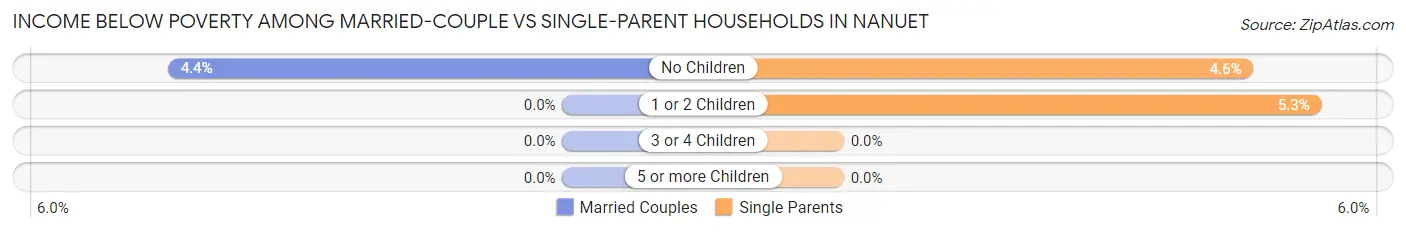
| Children | Married-Couple Families | Single-Parent Households |
| No Children | 82 (4.4%) | 35 (4.6%) |
| 1 or 2 Children | 0 (0.0%) | 32 (5.3%) |
| 3 or 4 Children | 0 (0.0%) | 0 (0.0%) |
| 5 or more Children | 0 (0.0%) | 0 (0.0%) |
| Total | 82 (2.3%) | 67 (4.9%) |
Race in Nanuet
The most populous races in Nanuet are White / Caucasian (10,912 | 53.0%), Hispanic or Latino (5,060 | 24.6%), and Black / African American (3,082 | 15.0%).
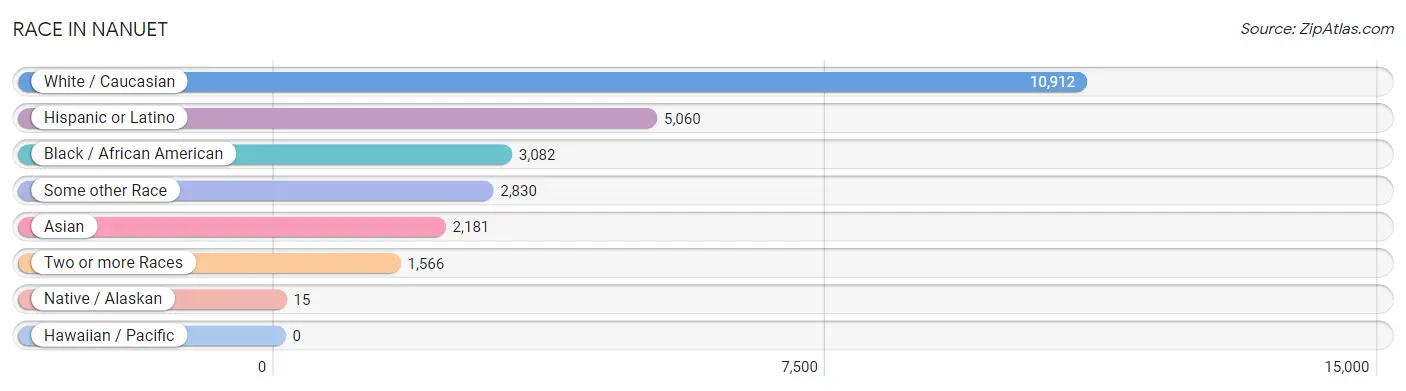
| Race | # Population | % Population |
| Asian | 2,181 | 10.6% |
| Black / African American | 3,082 | 15.0% |
| Hawaiian / Pacific | 0 | 0.0% |
| Hispanic or Latino | 5,060 | 24.6% |
| Native / Alaskan | 15 | 0.1% |
| White / Caucasian | 10,912 | 53.0% |
| Two or more Races | 1,566 | 7.6% |
| Some other Race | 2,830 | 13.8% |
| Total | 20,586 | 100.0% |
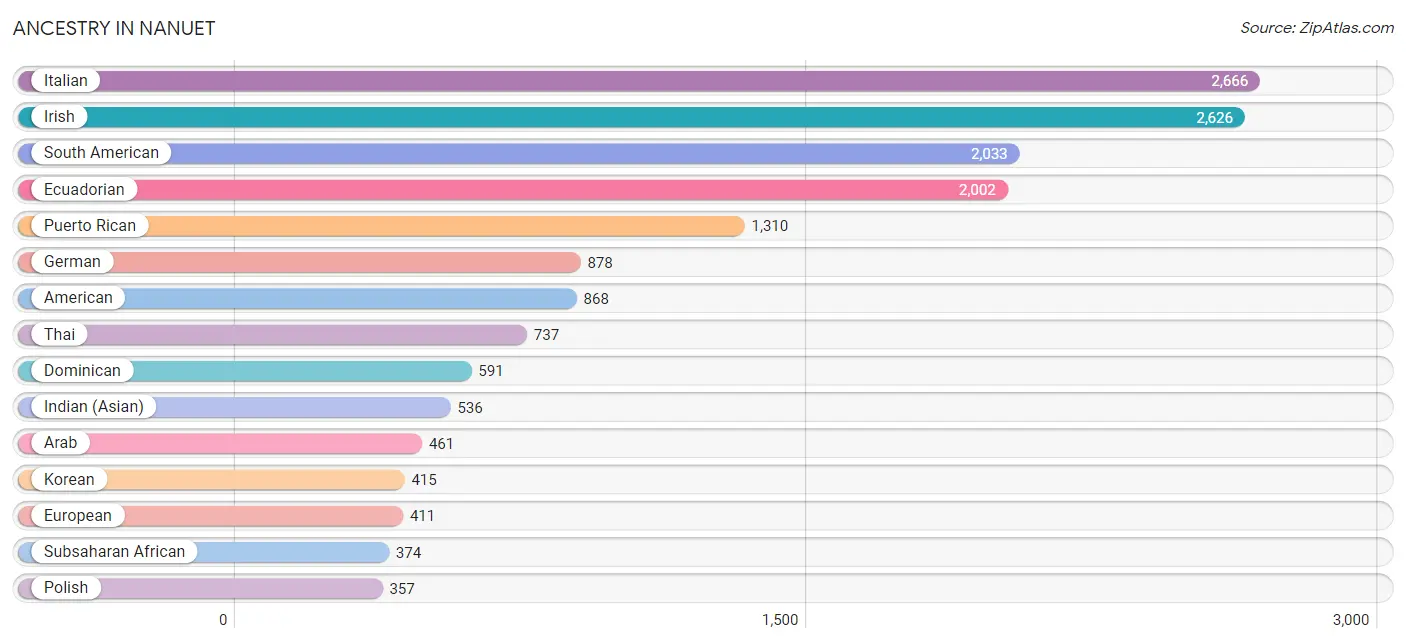
Ancestry in Nanuet
The most populous ancestries reported in Nanuet are Italian (2,666 | 13.0%), Irish (2,626 | 12.8%), South American (2,033 | 9.9%), Ecuadorian (2,002 | 9.7%), and Puerto Rican (1,310 | 6.4%), together accounting for 51.7% of all Nanuet residents.
| Ancestry | # Population | % Population |
| African | 219 | 1.1% |
| Albanian | 22 | 0.1% |
| American | 868 | 4.2% |
| Arab | 461 | 2.2% |
| Argentinean | 19 | 0.1% |
| Austrian | 51 | 0.3% |
| Bhutanese | 69 | 0.3% |
| Brazilian | 119 | 0.6% |
| British | 42 | 0.2% |
| Burmese | 235 | 1.1% |
| Canadian | 18 | 0.1% |
| Central American | 218 | 1.1% |
| Cuban | 119 | 0.6% |
| Czech | 42 | 0.2% |
| Czechoslovakian | 8 | 0.0% |
| Danish | 9 | 0.0% |
| Delaware | 8 | 0.0% |
| Dominican | 591 | 2.9% |
| Dutch | 153 | 0.7% |
| Eastern European | 159 | 0.8% |
| Ecuadorian | 2,002 | 9.7% |
| Egyptian | 18 | 0.1% |
| English | 299 | 1.5% |
| European | 411 | 2.0% |
| Finnish | 15 | 0.1% |
| French | 140 | 0.7% |
| French Canadian | 22 | 0.1% |
| German | 878 | 4.3% |
| Ghanaian | 348 | 1.7% |
| Greek | 181 | 0.9% |
| Guatemalan | 101 | 0.5% |
| Haitian | 335 | 1.6% |
| Honduran | 31 | 0.2% |
| Hungarian | 305 | 1.5% |
| Indian (Asian) | 536 | 2.6% |
| Irish | 2,626 | 12.8% |
| Israeli | 163 | 0.8% |
| Italian | 2,666 | 13.0% |
| Jamaican | 168 | 0.8% |
| Jordanian | 16 | 0.1% |
| Korean | 415 | 2.0% |
| Lebanese | 35 | 0.2% |
| Lithuanian | 37 | 0.2% |
| Mexican | 256 | 1.2% |
| Northern European | 57 | 0.3% |
| Norwegian | 71 | 0.3% |
| Pakistani | 10 | 0.1% |
| Palestinian | 279 | 1.4% |
| Polish | 357 | 1.7% |
| Portuguese | 22 | 0.1% |
| Puerto Rican | 1,310 | 6.4% |
| Romanian | 116 | 0.6% |
| Russian | 230 | 1.1% |
| Salvadoran | 86 | 0.4% |
| Scotch-Irish | 24 | 0.1% |
| Scottish | 117 | 0.6% |
| Slovak | 10 | 0.1% |
| South African | 4 | 0.0% |
| South American | 2,033 | 9.9% |
| Spaniard | 35 | 0.2% |
| Subsaharan African | 374 | 1.8% |
| Swedish | 40 | 0.2% |
| Syrian | 45 | 0.2% |
| Thai | 737 | 3.6% |
| Turkish | 20 | 0.1% |
| Ukrainian | 71 | 0.3% |
| Uruguayan | 12 | 0.1% |
| Vietnamese | 13 | 0.1% |
| Welsh | 47 | 0.2% |
| West Indian | 29 | 0.1% |
| Yugoslavian | 20 | 0.1% | View All 71 Rows |
Immigrants in Nanuet
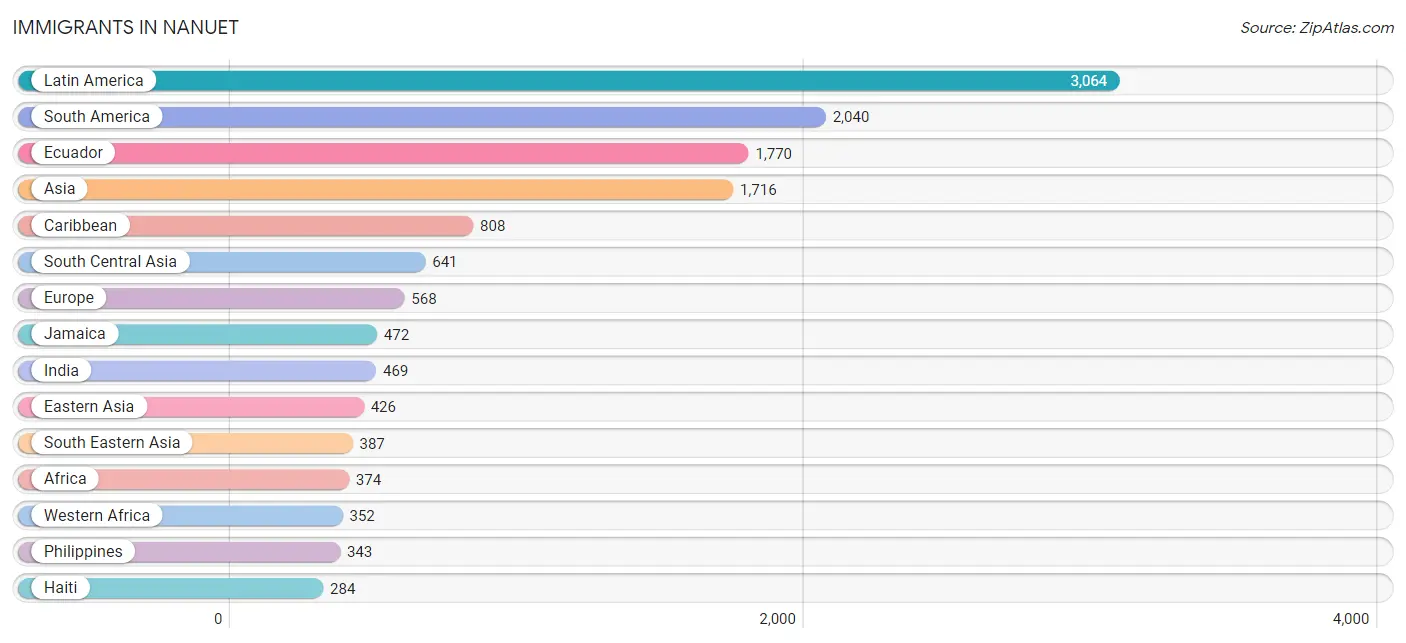
The most numerous immigrant groups reported in Nanuet came from Latin America (3,064 | 14.9%), South America (2,040 | 9.9%), Ecuador (1,770 | 8.6%), Asia (1,716 | 8.3%), and Caribbean (808 | 3.9%), together accounting for 45.7% of all Nanuet residents.
| Immigration Origin | # Population | % Population |
| Africa | 374 | 1.8% |
| Asia | 1,716 | 8.3% |
| Bangladesh | 13 | 0.1% |
| Barbados | 8 | 0.0% |
| Brazil | 270 | 1.3% |
| Canada | 71 | 0.3% |
| Caribbean | 808 | 3.9% |
| Central America | 216 | 1.1% |
| China | 205 | 1.0% |
| Czechoslovakia | 41 | 0.2% |
| Dominican Republic | 26 | 0.1% |
| Eastern Asia | 426 | 2.1% |
| Eastern Europe | 141 | 0.7% |
| Ecuador | 1,770 | 8.6% |
| Egypt | 18 | 0.1% |
| El Salvador | 98 | 0.5% |
| England | 9 | 0.0% |
| Europe | 568 | 2.8% |
| France | 74 | 0.4% |
| Germany | 28 | 0.1% |
| Ghana | 206 | 1.0% |
| Greece | 9 | 0.0% |
| Grenada | 9 | 0.0% |
| Guatemala | 98 | 0.5% |
| Haiti | 284 | 1.4% |
| Honduras | 20 | 0.1% |
| Hong Kong | 49 | 0.2% |
| India | 469 | 2.3% |
| Ireland | 158 | 0.8% |
| Israel | 110 | 0.5% |
| Italy | 86 | 0.4% |
| Jamaica | 472 | 2.3% |
| Japan | 69 | 0.3% |
| Jordan | 100 | 0.5% |
| Korea | 152 | 0.7% |
| Latin America | 3,064 | 14.9% |
| Nepal | 46 | 0.2% |
| Nigeria | 146 | 0.7% |
| Northern Africa | 18 | 0.1% |
| Northern Europe | 214 | 1.0% |
| Pakistan | 76 | 0.4% |
| Philippines | 343 | 1.7% |
| Poland | 11 | 0.1% |
| Portugal | 7 | 0.0% |
| Romania | 14 | 0.1% |
| Russia | 44 | 0.2% |
| Saudi Arabia | 3 | 0.0% |
| Scotland | 9 | 0.0% |
| Singapore | 13 | 0.1% |
| South Africa | 4 | 0.0% |
| South America | 2,040 | 9.9% |
| South Central Asia | 641 | 3.1% |
| South Eastern Asia | 387 | 1.9% |
| Southern Europe | 102 | 0.5% |
| Sri Lanka | 14 | 0.1% |
| Syria | 36 | 0.2% |
| Thailand | 10 | 0.1% |
| Turkey | 13 | 0.1% |
| Ukraine | 9 | 0.0% |
| Vietnam | 21 | 0.1% |
| Western Africa | 352 | 1.7% |
| Western Asia | 262 | 1.3% |
| Western Europe | 102 | 0.5% | View All 63 Rows |
Sex and Age in Nanuet
Sex and Age in Nanuet
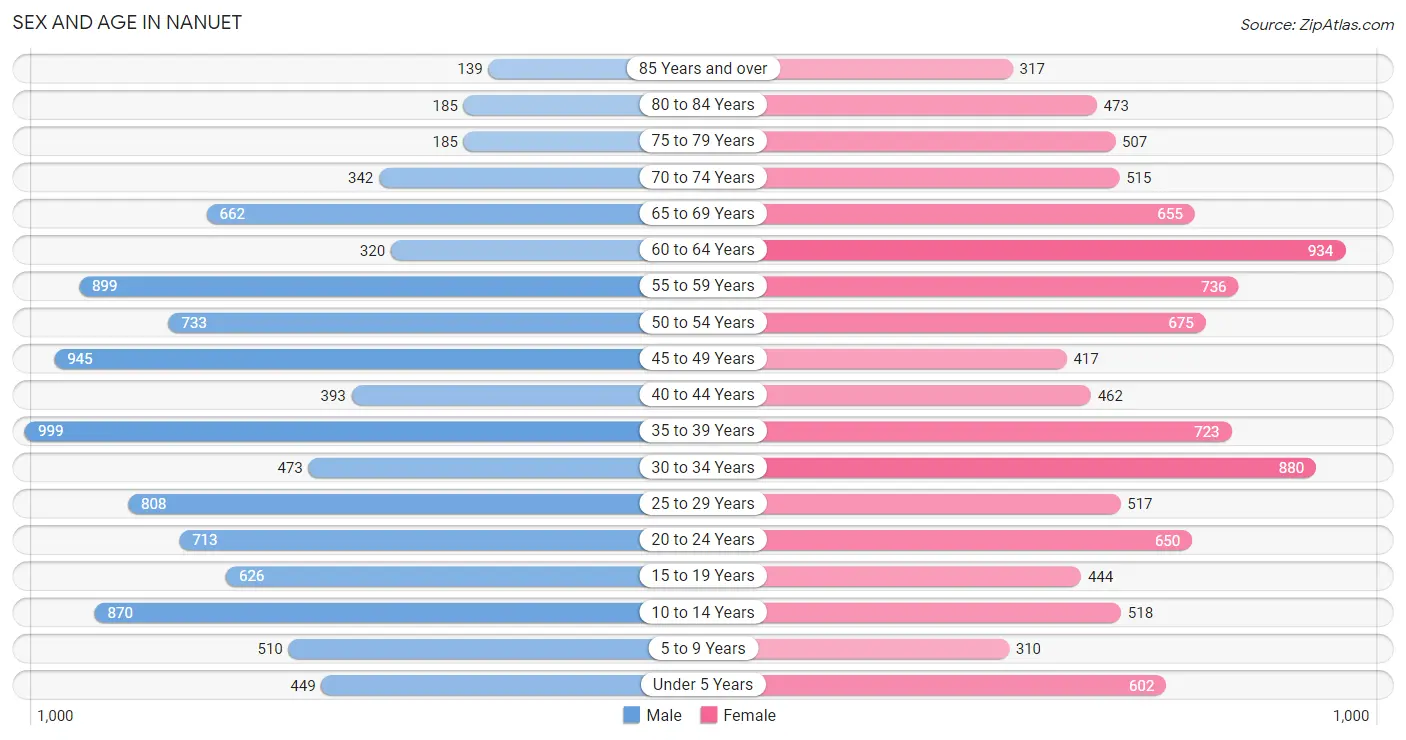
The most populous age groups in Nanuet are 35 to 39 Years (999 | 9.8%) for men and 60 to 64 Years (934 | 9.0%) for women.
| Age Bracket | Male | Female |
| Under 5 Years | 449 (4.4%) | 602 (5.8%) |
| 5 to 9 Years | 510 (5.0%) | 310 (3.0%) |
| 10 to 14 Years | 870 (8.5%) | 518 (5.0%) |
| 15 to 19 Years | 626 (6.1%) | 444 (4.3%) |
| 20 to 24 Years | 713 (7.0%) | 650 (6.3%) |
| 25 to 29 Years | 808 (7.9%) | 517 (5.0%) |
| 30 to 34 Years | 473 (4.6%) | 880 (8.5%) |
| 35 to 39 Years | 999 (9.8%) | 723 (7.0%) |
| 40 to 44 Years | 393 (3.8%) | 462 (4.5%) |
| 45 to 49 Years | 945 (9.2%) | 417 (4.0%) |
| 50 to 54 Years | 733 (7.1%) | 675 (6.5%) |
| 55 to 59 Years | 899 (8.8%) | 736 (7.1%) |
| 60 to 64 Years | 320 (3.1%) | 934 (9.0%) |
| 65 to 69 Years | 662 (6.5%) | 655 (6.3%) |
| 70 to 74 Years | 342 (3.3%) | 515 (5.0%) |
| 75 to 79 Years | 185 (1.8%) | 507 (4.9%) |
| 80 to 84 Years | 185 (1.8%) | 473 (4.6%) |
| 85 Years and over | 139 (1.4%) | 317 (3.1%) |
| Total | 10,251 (100.0%) | 10,335 (100.0%) |
Families and Households in Nanuet
Median Family Size in Nanuet
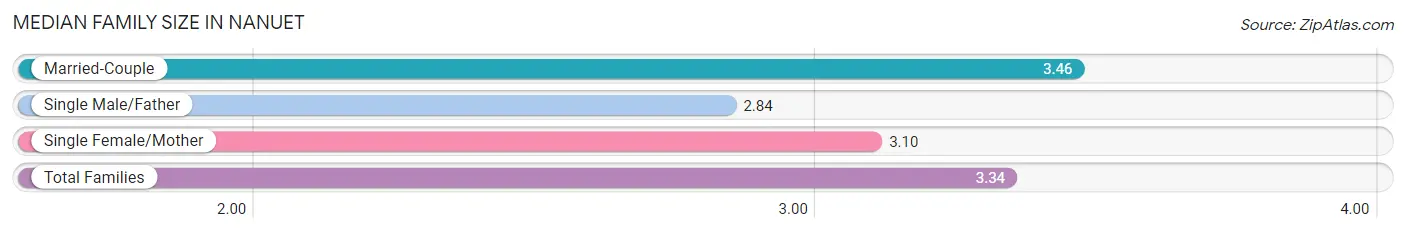
The median family size in Nanuet is 3.34 persons per family, with married-couple families (3,525 | 72.0%) accounting for the largest median family size of 3.46 persons per family. On the other hand, single male/father families (438 | 8.9%) represent the smallest median family size with 2.84 persons per family.
| Family Type | # Families | Family Size |
| Married-Couple | 3,525 (72.0%) | 3.46 |
| Single Male/Father | 438 (8.9%) | 2.84 |
| Single Female/Mother | 936 (19.1%) | 3.10 |
| Total Families | 4,899 (100.0%) | 3.34 |
Median Household Size in Nanuet
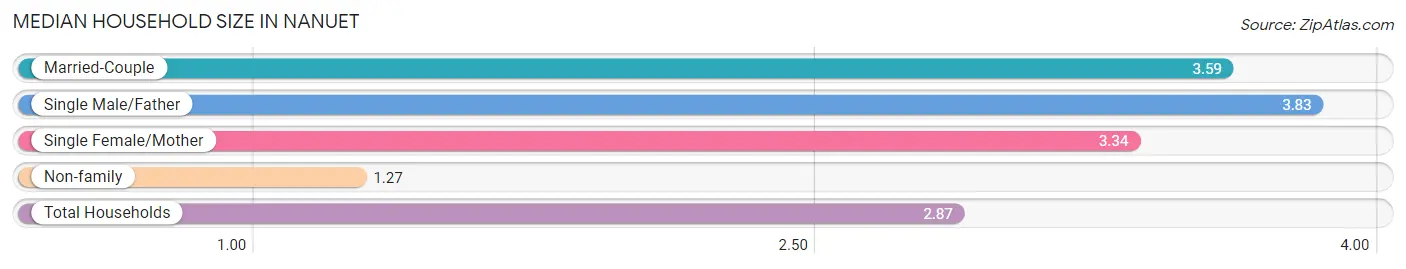
The median household size in Nanuet is 2.87 persons per household, with single male/father households (438 | 6.2%) accounting for the largest median household size of 3.83 persons per household. non-family households (2,122 | 30.2%) represent the smallest median household size with 1.27 persons per household.
| Household Type | # Households | Household Size |
| Married-Couple | 3,525 (50.2%) | 3.59 |
| Single Male/Father | 438 (6.2%) | 3.83 |
| Single Female/Mother | 936 (13.3%) | 3.34 |
| Non-family | 2,122 (30.2%) | 1.27 |
| Total Households | 7,021 (100.0%) | 2.87 |
Household Size by Marriage Status in Nanuet
Out of a total of 7,021 households in Nanuet, 4,899 (69.8%) are family households, while 2,122 (30.2%) are nonfamily households. The most numerous type of family households are 2-person households, comprising 1,648, and the most common type of nonfamily households are 1-person households, comprising 1,859.
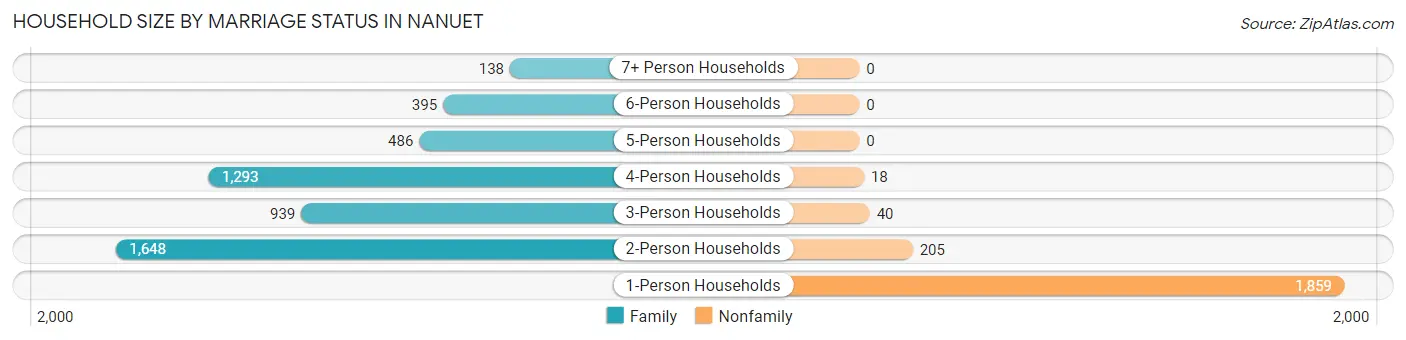
| Household Size | Family Households | Nonfamily Households |
| 1-Person Households | - | 1,859 (26.5%) |
| 2-Person Households | 1,648 (23.5%) | 205 (2.9%) |
| 3-Person Households | 939 (13.4%) | 40 (0.6%) |
| 4-Person Households | 1,293 (18.4%) | 18 (0.3%) |
| 5-Person Households | 486 (6.9%) | 0 (0.0%) |
| 6-Person Households | 395 (5.6%) | 0 (0.0%) |
| 7+ Person Households | 138 (2.0%) | 0 (0.0%) |
| Total | 4,899 (69.8%) | 2,122 (30.2%) |
Female Fertility in Nanuet
Fertility by Age in Nanuet
Average fertility rate in Nanuet is 47.0 births per 1,000 women. Women in the age bracket of 20 to 34 years have the highest fertility rate with 82.0 births per 1,000 women. Women in the age bracket of 20 to 34 years acount for 83.5% of all women with births.
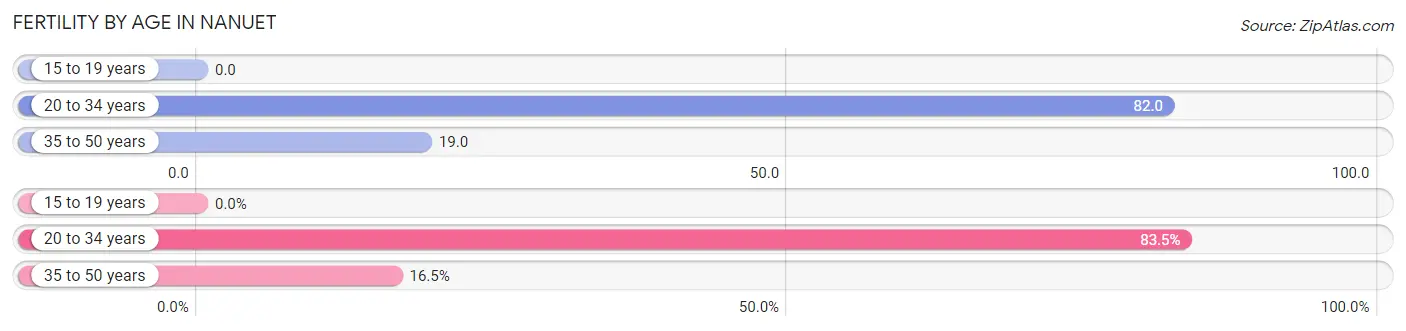
| Age Bracket | Women with Births | Births / 1,000 Women |
| 15 to 19 years | 0 (0.0%) | 0.0 |
| 20 to 34 years | 167 (83.5%) | 82.0 |
| 35 to 50 years | 33 (16.5%) | 19.0 |
| Total | 200 (100.0%) | 47.0 |
Fertility by Age by Marriage Status in Nanuet
86.5% of women with births (200) in Nanuet are married. The highest percentage of unmarried women with births falls into 20 to 34 years age bracket with 16.2% of them unmarried at the time of birth, while the lowest percentage of unmarried women with births belong to 35 to 50 years age bracket with 0.0% of them unmarried.
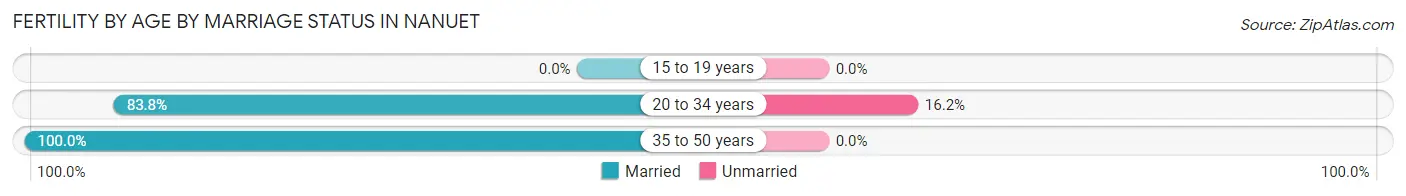
| Age Bracket | Married | Unmarried |
| 15 to 19 years | 0 (0.0%) | 0 (0.0%) |
| 20 to 34 years | 140 (83.8%) | 27 (16.2%) |
| 35 to 50 years | 33 (100.0%) | 0 (0.0%) |
| Total | 173 (86.5%) | 27 (13.5%) |
Fertility by Education in Nanuet
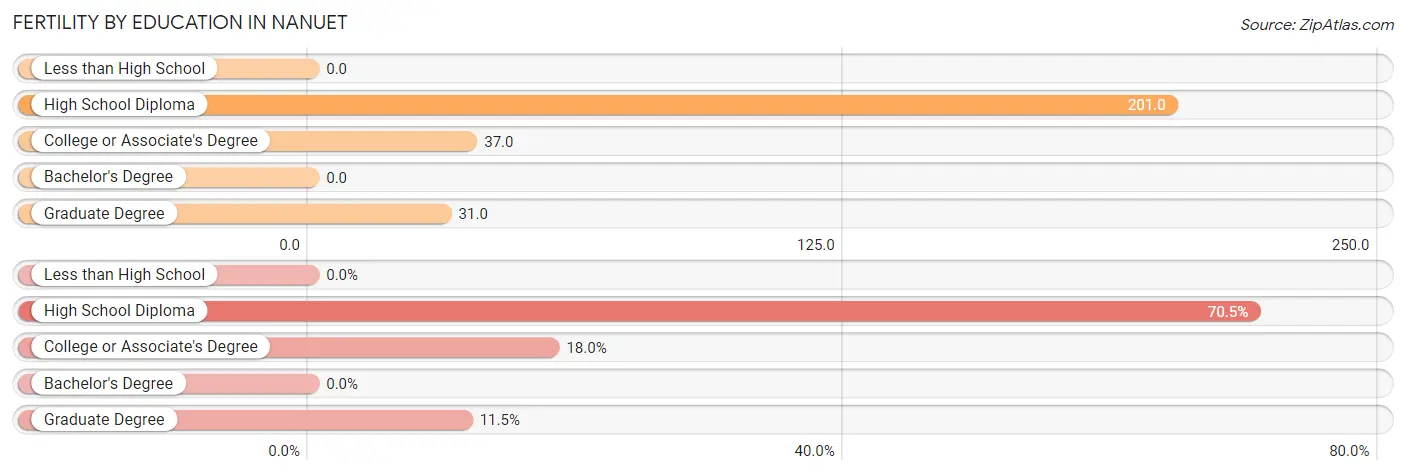
| Educational Attainment | Women with Births | Births / 1,000 Women |
| Less than High School | 0 (0.0%) | 0.0 |
| High School Diploma | 141 (70.5%) | 201.0 |
| College or Associate's Degree | 36 (18.0%) | 37.0 |
| Bachelor's Degree | 0 (0.0%) | 0.0 |
| Graduate Degree | 23 (11.5%) | 31.0 |
| Total | 200 (100.0%) | 47.0 |
Fertility by Education by Marriage Status in Nanuet
13.5% of women with births in Nanuet are unmarried. Women with the educational attainment of college or associate's degree are most likely to be married with 100.0% of them married at childbirth, while women with the educational attainment of high school diploma are least likely to be married with 19.2% of them unmarried at childbirth.
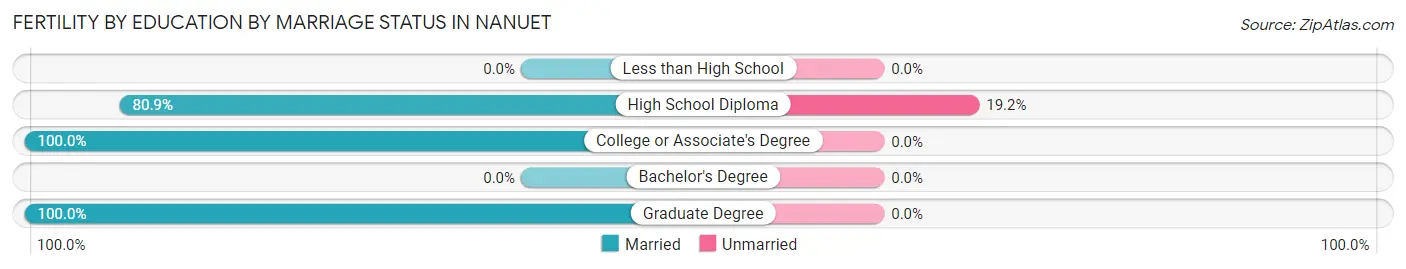
| Educational Attainment | Married | Unmarried |
| Less than High School | 0 (0.0%) | 0 (0.0%) |
| High School Diploma | 114 (80.8%) | 27 (19.2%) |
| College or Associate's Degree | 36 (100.0%) | 0 (0.0%) |
| Bachelor's Degree | 0 (0.0%) | 0 (0.0%) |
| Graduate Degree | 23 (100.0%) | 0 (0.0%) |
| Total | 173 (86.5%) | 27 (13.5%) |
Employment Characteristics in Nanuet
Employment by Class of Employer in Nanuet
Among the 9,886 employed individuals in Nanuet, private company employees (5,860 | 59.3%), local government employees (1,399 | 14.1%), and not-for-profit organizations (1,126 | 11.4%) make up the most common classes of employment.
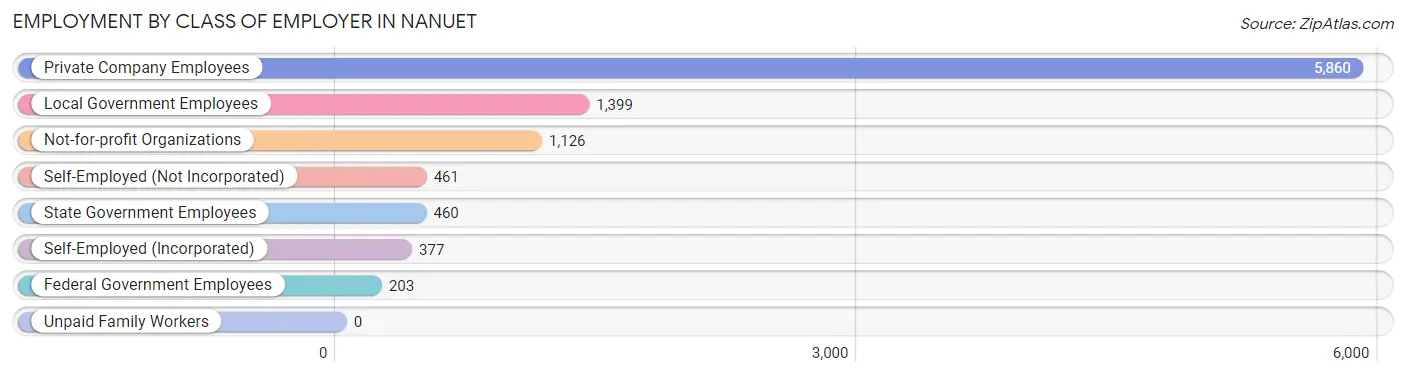
| Employer Class | # Employees | % Employees |
| Private Company Employees | 5,860 | 59.3% |
| Self-Employed (Incorporated) | 377 | 3.8% |
| Self-Employed (Not Incorporated) | 461 | 4.7% |
| Not-for-profit Organizations | 1,126 | 11.4% |
| Local Government Employees | 1,399 | 14.1% |
| State Government Employees | 460 | 4.6% |
| Federal Government Employees | 203 | 2.1% |
| Unpaid Family Workers | 0 | 0.0% |
| Total | 9,886 | 100.0% |
Employment Status by Age in Nanuet
According to the labor force statistics for Nanuet, out of the total population over 16 years of age (16,940), 62.3% or 10,554 individuals are in the labor force, with 3.0% or 317 of them unemployed. The age group with the highest labor force participation rate is 30 to 34 years, with 88.1% or 1,192 individuals in the labor force. Within the labor force, the 20 to 24 years age range has the highest percentage of unemployed individuals, with 6.5% or 70 of them being unemployed.
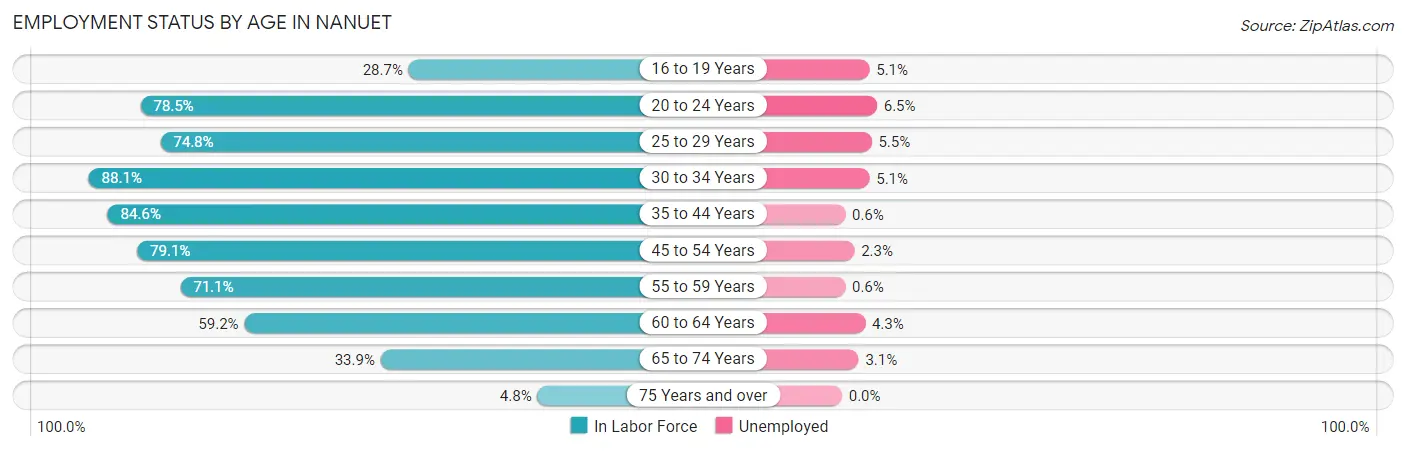
| Age Bracket | In Labor Force | Unemployed |
| 16 to 19 Years | 196 (28.7%) | 10 (5.1%) |
| 20 to 24 Years | 1,070 (78.5%) | 70 (6.5%) |
| 25 to 29 Years | 991 (74.8%) | 55 (5.5%) |
| 30 to 34 Years | 1,192 (88.1%) | 61 (5.1%) |
| 35 to 44 Years | 2,180 (84.6%) | 13 (0.6%) |
| 45 to 54 Years | 2,191 (79.1%) | 50 (2.3%) |
| 55 to 59 Years | 1,162 (71.1%) | 7 (0.6%) |
| 60 to 64 Years | 742 (59.2%) | 32 (4.3%) |
| 65 to 74 Years | 737 (33.9%) | 23 (3.1%) |
| 75 Years and over | 87 (4.8%) | 0 (0.0%) |
| Total | 10,554 (62.3%) | 317 (3.0%) |
Employment Status by Educational Attainment in Nanuet
According to labor force statistics for Nanuet, 77.5% of individuals (8,458) out of the total population between 25 and 64 years of age (10,914) are in the labor force, with 2.6% or 220 of them being unemployed. The group with the highest labor force participation rate are those with the educational attainment of college / associate degree, with 86.7% or 2,281 individuals in the labor force. Within the labor force, individuals with high school diploma education have the highest percentage of unemployment, with 6.6% or 114 of them being unemployed.
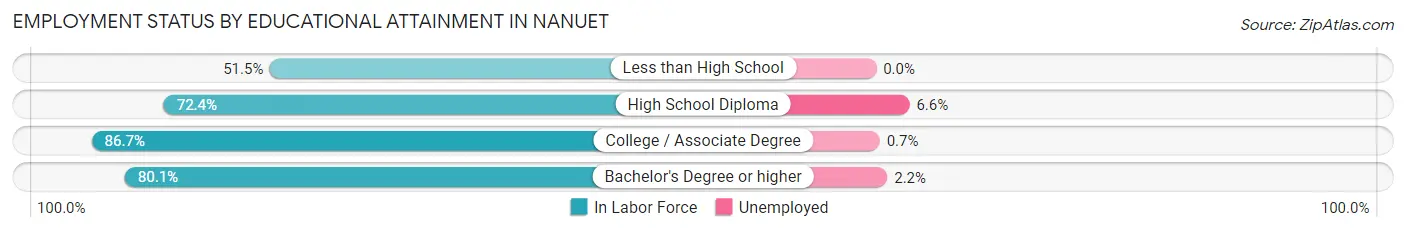
| Educational Attainment | In Labor Force | Unemployed |
| Less than High School | 495 (51.5%) | 0 (0.0%) |
| High School Diploma | 1,728 (72.4%) | 158 (6.6%) |
| College / Associate Degree | 2,281 (86.7%) | 18 (0.7%) |
| Bachelor's Degree or higher | 3,953 (80.1%) | 109 (2.2%) |
| Total | 8,458 (77.5%) | 284 (2.6%) |
Employment Occupations by Sex in Nanuet
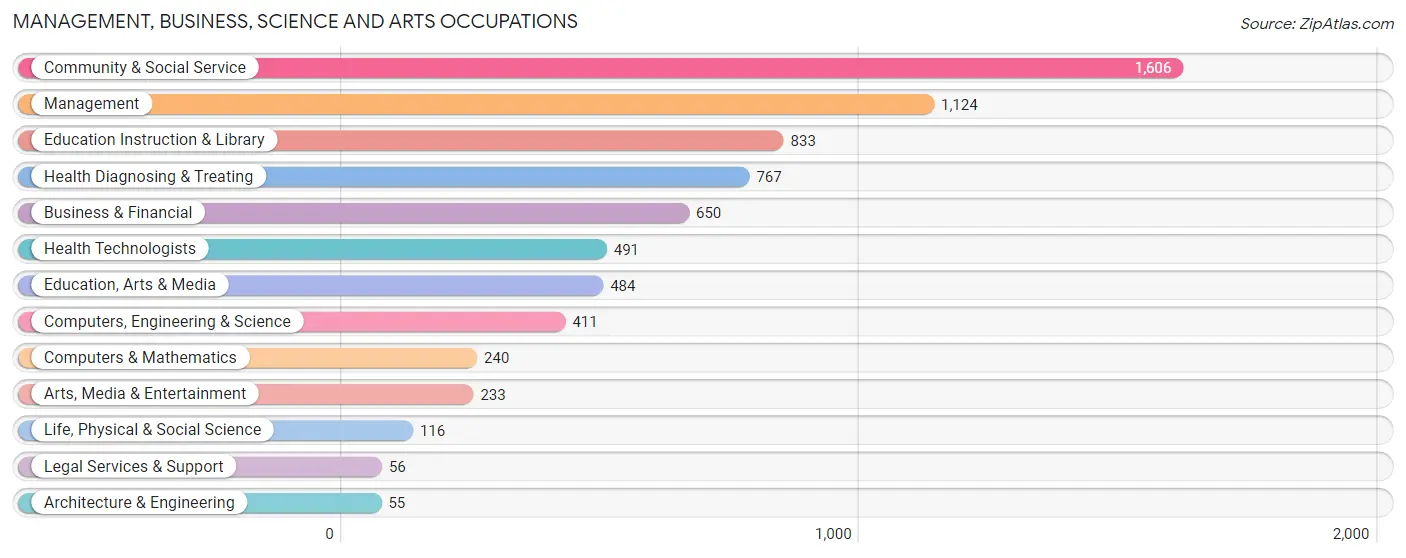
Management, Business, Science and Arts Occupations
The most common Management, Business, Science and Arts occupations in Nanuet are Community & Social Service (1,606 | 15.7%), Management (1,124 | 11.0%), Education Instruction & Library (833 | 8.1%), Health Diagnosing & Treating (767 | 7.5%), and Business & Financial (650 | 6.4%).
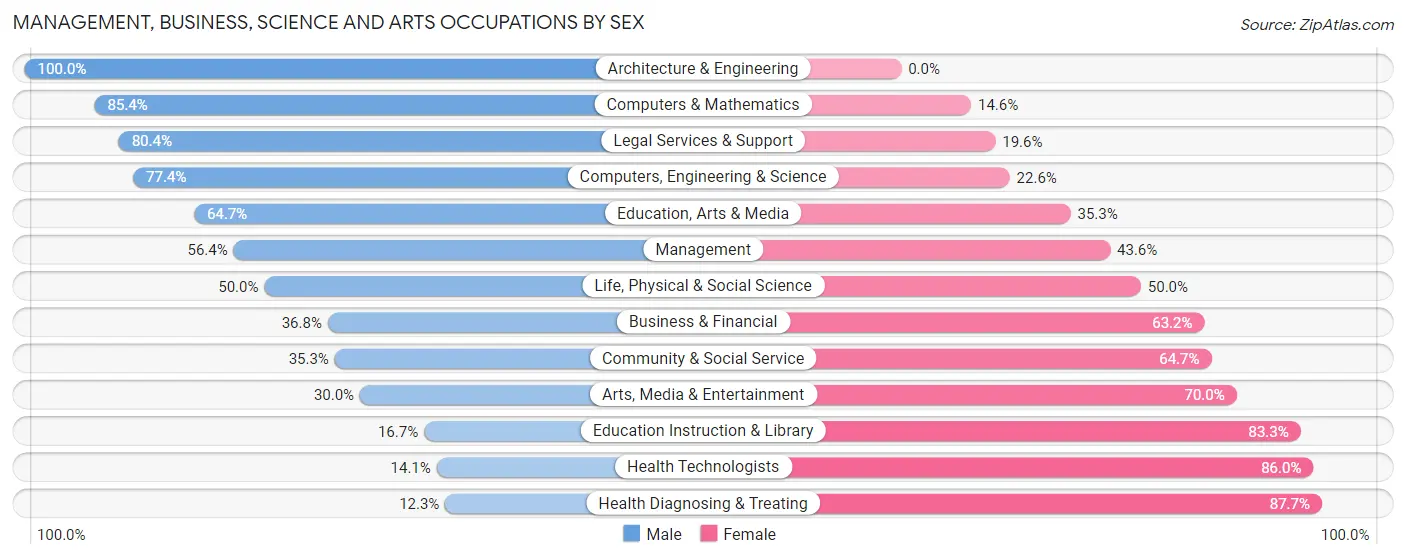
Management, Business, Science and Arts Occupations by Sex
Within the Management, Business, Science and Arts occupations in Nanuet, the most male-oriented occupations are Architecture & Engineering (100.0%), Computers & Mathematics (85.4%), and Legal Services & Support (80.4%), while the most female-oriented occupations are Health Diagnosing & Treating (87.7%), Health Technologists (86.0%), and Education Instruction & Library (83.3%).
| Occupation | Male | Female |
| Management | 634 (56.4%) | 490 (43.6%) |
| Business & Financial | 239 (36.8%) | 411 (63.2%) |
| Computers, Engineering & Science | 318 (77.4%) | 93 (22.6%) |
| Computers & Mathematics | 205 (85.4%) | 35 (14.6%) |
| Architecture & Engineering | 55 (100.0%) | 0 (0.0%) |
| Life, Physical & Social Science | 58 (50.0%) | 58 (50.0%) |
| Community & Social Service | 567 (35.3%) | 1,039 (64.7%) |
| Education, Arts & Media | 313 (64.7%) | 171 (35.3%) |
| Legal Services & Support | 45 (80.4%) | 11 (19.6%) |
| Education Instruction & Library | 139 (16.7%) | 694 (83.3%) |
| Arts, Media & Entertainment | 70 (30.0%) | 163 (70.0%) |
| Health Diagnosing & Treating | 94 (12.3%) | 673 (87.7%) |
| Health Technologists | 69 (14.1%) | 422 (86.0%) |
| Total (Category) | 1,852 (40.6%) | 2,706 (59.4%) |
| Total (Overall) | 5,121 (50.1%) | 5,108 (49.9%) |
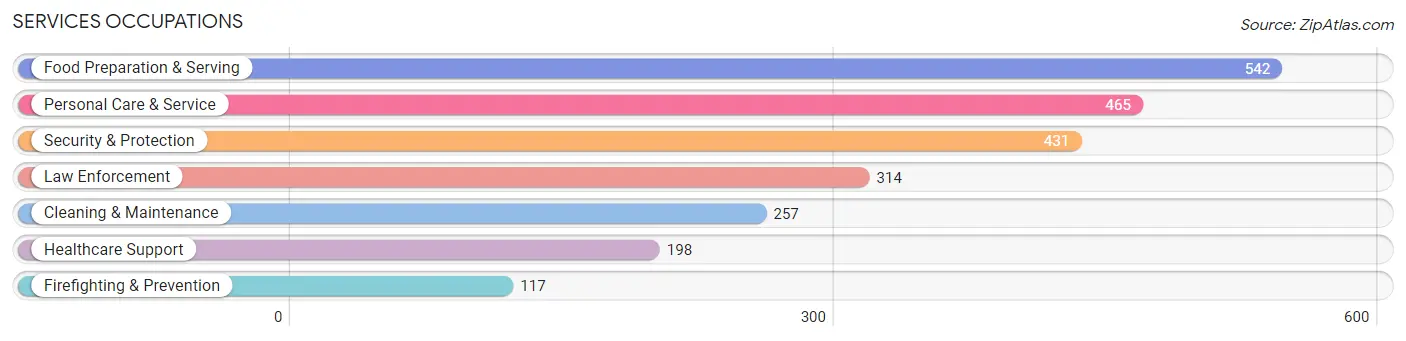
Services Occupations
The most common Services occupations in Nanuet are Food Preparation & Serving (542 | 5.3%), Personal Care & Service (465 | 4.5%), Security & Protection (431 | 4.2%), Law Enforcement (314 | 3.1%), and Cleaning & Maintenance (257 | 2.5%).
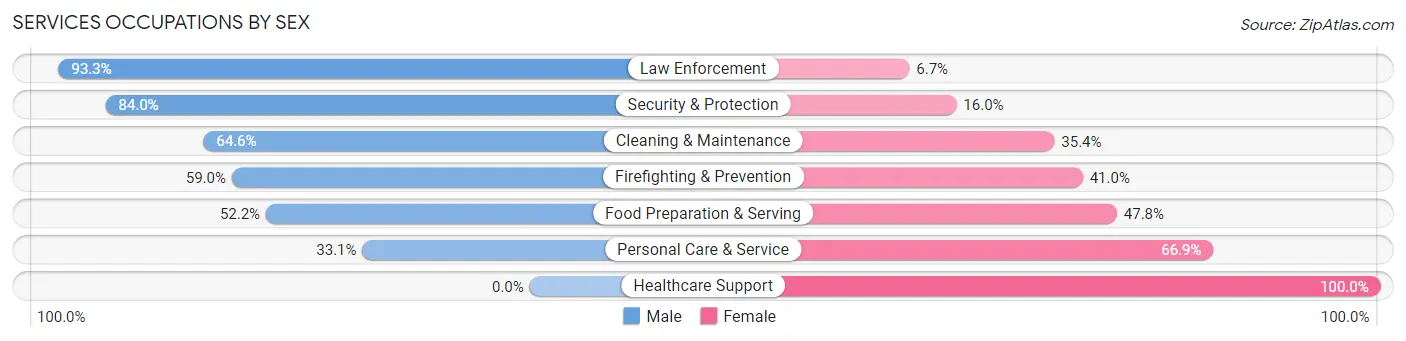
Services Occupations by Sex
Within the Services occupations in Nanuet, the most male-oriented occupations are Law Enforcement (93.3%), Security & Protection (84.0%), and Cleaning & Maintenance (64.6%), while the most female-oriented occupations are Healthcare Support (100.0%), Personal Care & Service (66.9%), and Food Preparation & Serving (47.8%).
| Occupation | Male | Female |
| Healthcare Support | 0 (0.0%) | 198 (100.0%) |
| Security & Protection | 362 (84.0%) | 69 (16.0%) |
| Firefighting & Prevention | 69 (59.0%) | 48 (41.0%) |
| Law Enforcement | 293 (93.3%) | 21 (6.7%) |
| Food Preparation & Serving | 283 (52.2%) | 259 (47.8%) |
| Cleaning & Maintenance | 166 (64.6%) | 91 (35.4%) |
| Personal Care & Service | 154 (33.1%) | 311 (66.9%) |
| Total (Category) | 965 (51.0%) | 928 (49.0%) |
| Total (Overall) | 5,121 (50.1%) | 5,108 (49.9%) |
Sales and Office Occupations
The most common Sales and Office occupations in Nanuet are Office & Administration (1,065 | 10.4%), and Sales & Related (942 | 9.2%).
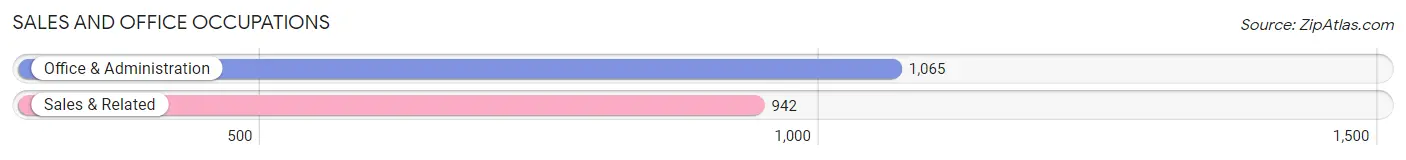
Sales and Office Occupations by Sex
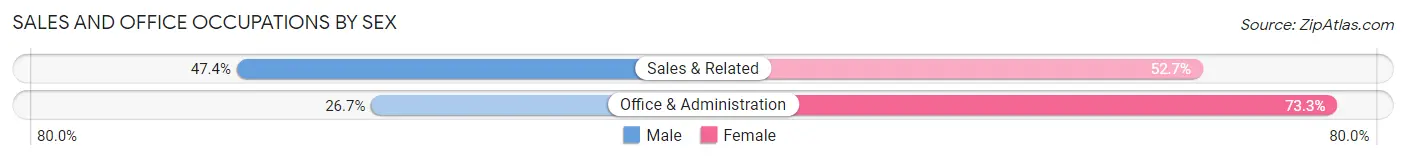
| Occupation | Male | Female |
| Sales & Related | 446 (47.3%) | 496 (52.6%) |
| Office & Administration | 284 (26.7%) | 781 (73.3%) |
| Total (Category) | 730 (36.4%) | 1,277 (63.6%) |
| Total (Overall) | 5,121 (50.1%) | 5,108 (49.9%) |
Natural Resources, Construction and Maintenance Occupations
The most common Natural Resources, Construction and Maintenance occupations in Nanuet are Construction & Extraction (566 | 5.5%), Installation, Maintenance & Repair (180 | 1.8%), and Farming, Fishing & Forestry (91 | 0.9%).
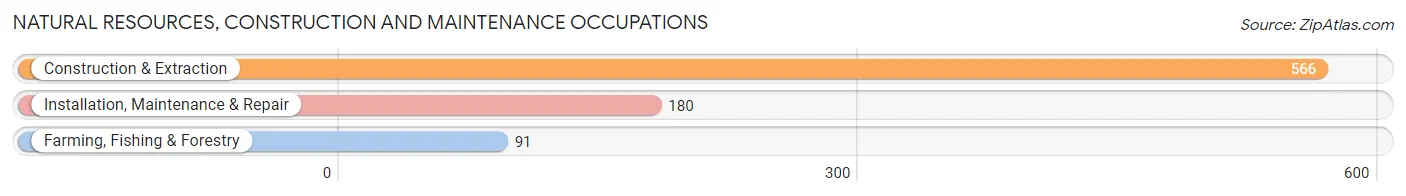
Natural Resources, Construction and Maintenance Occupations by Sex
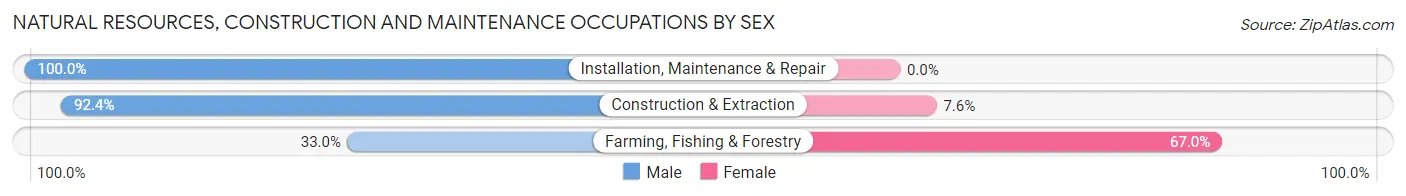
| Occupation | Male | Female |
| Farming, Fishing & Forestry | 30 (33.0%) | 61 (67.0%) |
| Construction & Extraction | 523 (92.4%) | 43 (7.6%) |
| Installation, Maintenance & Repair | 180 (100.0%) | 0 (0.0%) |
| Total (Category) | 733 (87.6%) | 104 (12.4%) |
| Total (Overall) | 5,121 (50.1%) | 5,108 (49.9%) |
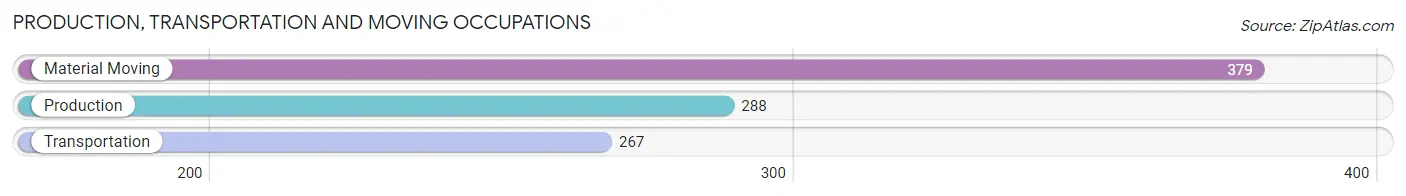
Production, Transportation and Moving Occupations
The most common Production, Transportation and Moving occupations in Nanuet are Material Moving (379 | 3.7%), Production (288 | 2.8%), and Transportation (267 | 2.6%).
Production, Transportation and Moving Occupations by Sex
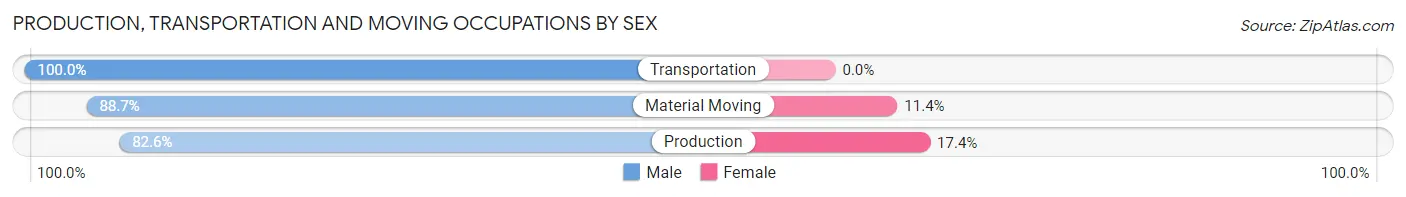
| Occupation | Male | Female |
| Production | 238 (82.6%) | 50 (17.4%) |
| Transportation | 267 (100.0%) | 0 (0.0%) |
| Material Moving | 336 (88.6%) | 43 (11.4%) |
| Total (Category) | 841 (90.0%) | 93 (10.0%) |
| Total (Overall) | 5,121 (50.1%) | 5,108 (49.9%) |
Employment Industries by Sex in Nanuet
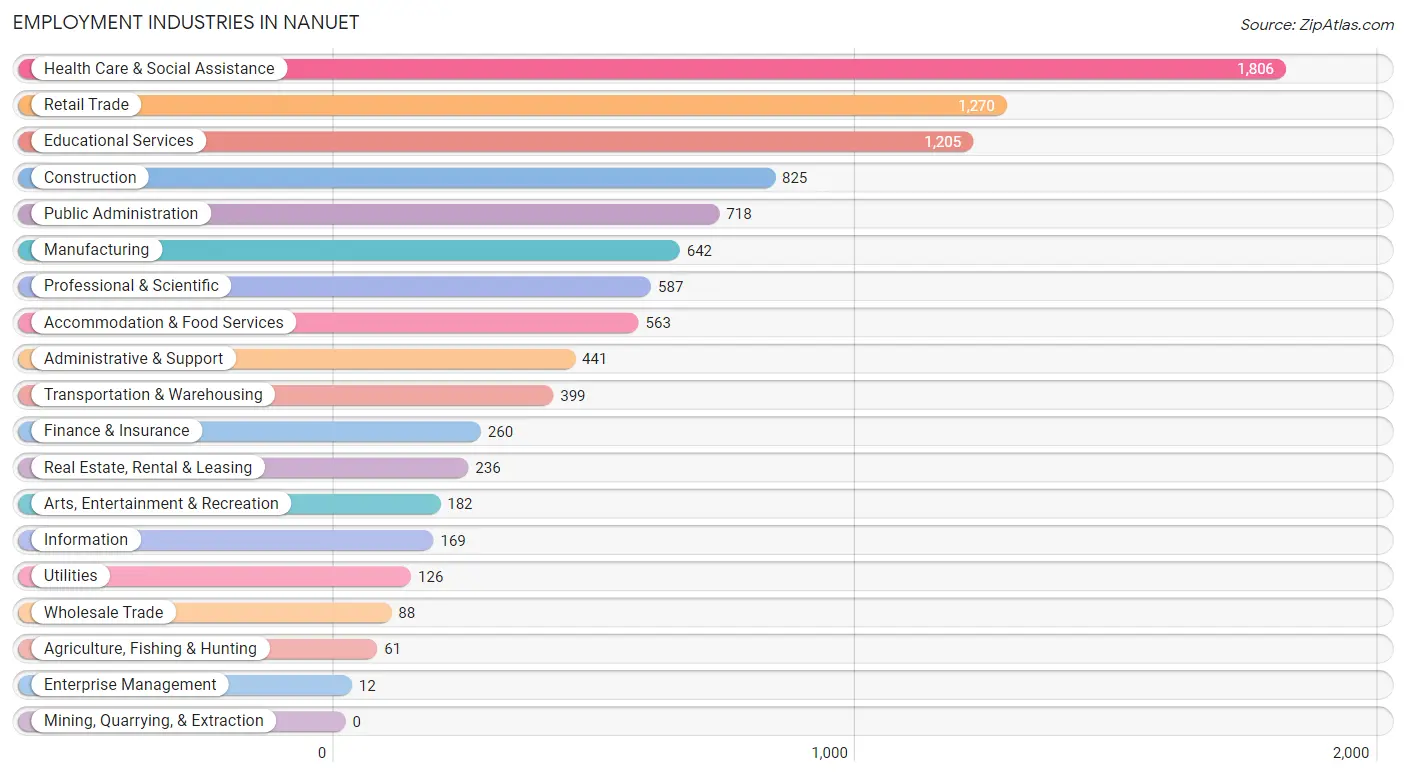
Employment Industries in Nanuet
The major employment industries in Nanuet include Health Care & Social Assistance (1,806 | 17.7%), Retail Trade (1,270 | 12.4%), Educational Services (1,205 | 11.8%), Construction (825 | 8.1%), and Public Administration (718 | 7.0%).
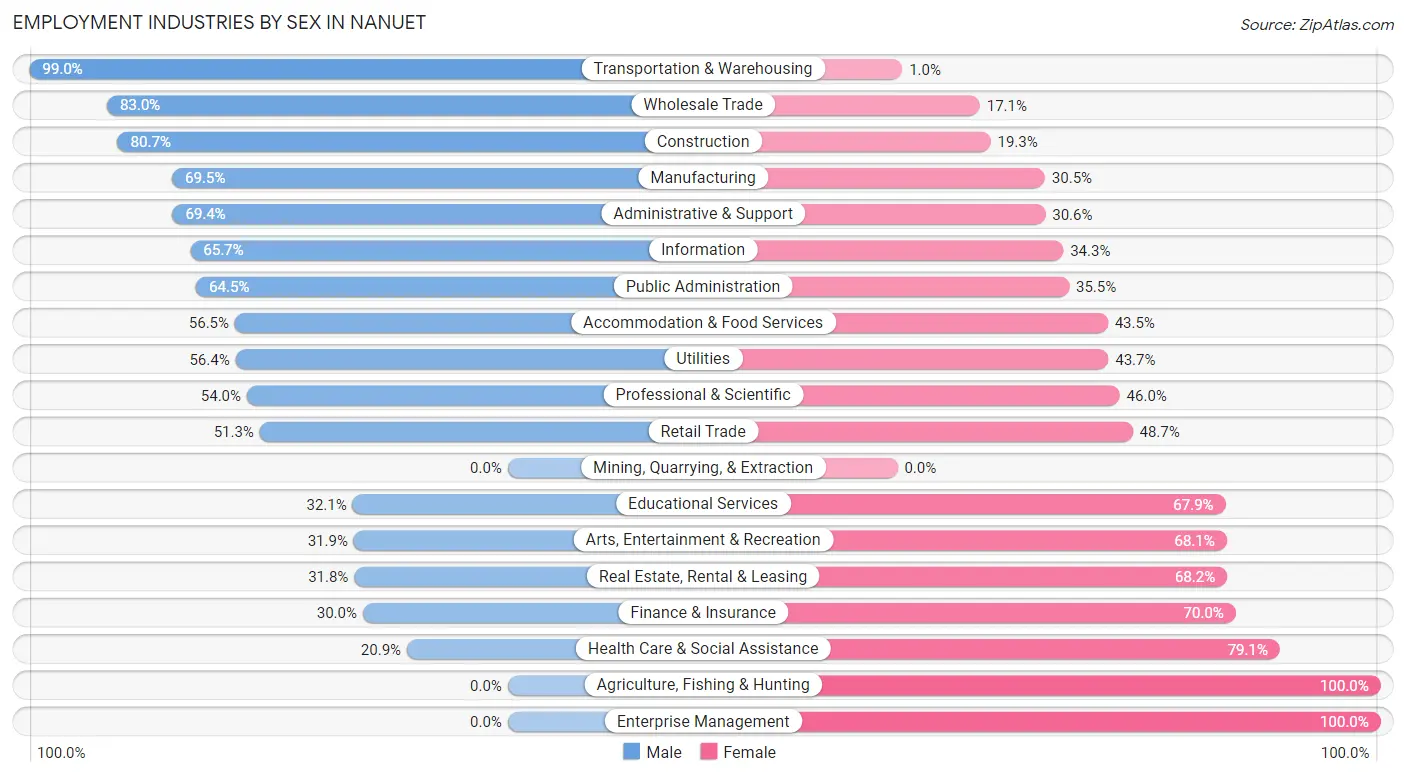
Employment Industries by Sex in Nanuet
The Nanuet industries that see more men than women are Transportation & Warehousing (99.0%), Wholesale Trade (83.0%), and Construction (80.7%), whereas the industries that tend to have a higher number of women are Agriculture, Fishing & Hunting (100.0%), Enterprise Management (100.0%), and Health Care & Social Assistance (79.1%).
| Industry | Male | Female |
| Agriculture, Fishing & Hunting | 0 (0.0%) | 61 (100.0%) |
| Mining, Quarrying, & Extraction | 0 (0.0%) | 0 (0.0%) |
| Construction | 666 (80.7%) | 159 (19.3%) |
| Manufacturing | 446 (69.5%) | 196 (30.5%) |
| Wholesale Trade | 73 (83.0%) | 15 (17.1%) |
| Retail Trade | 652 (51.3%) | 618 (48.7%) |
| Transportation & Warehousing | 395 (99.0%) | 4 (1.0%) |
| Utilities | 71 (56.4%) | 55 (43.6%) |
| Information | 111 (65.7%) | 58 (34.3%) |
| Finance & Insurance | 78 (30.0%) | 182 (70.0%) |
| Real Estate, Rental & Leasing | 75 (31.8%) | 161 (68.2%) |
| Professional & Scientific | 317 (54.0%) | 270 (46.0%) |
| Enterprise Management | 0 (0.0%) | 12 (100.0%) |
| Administrative & Support | 306 (69.4%) | 135 (30.6%) |
| Educational Services | 387 (32.1%) | 818 (67.9%) |
| Health Care & Social Assistance | 377 (20.9%) | 1,429 (79.1%) |
| Arts, Entertainment & Recreation | 58 (31.9%) | 124 (68.1%) |
| Accommodation & Food Services | 318 (56.5%) | 245 (43.5%) |
| Public Administration | 463 (64.5%) | 255 (35.5%) |
| Total | 5,121 (50.1%) | 5,108 (49.9%) |
Education in Nanuet
School Enrollment in Nanuet
The most common levels of schooling among the 4,747 students in Nanuet are middle school (1,207 | 25.4%), high school (1,007 | 21.2%), and college / undergraduate (931 | 19.6%).
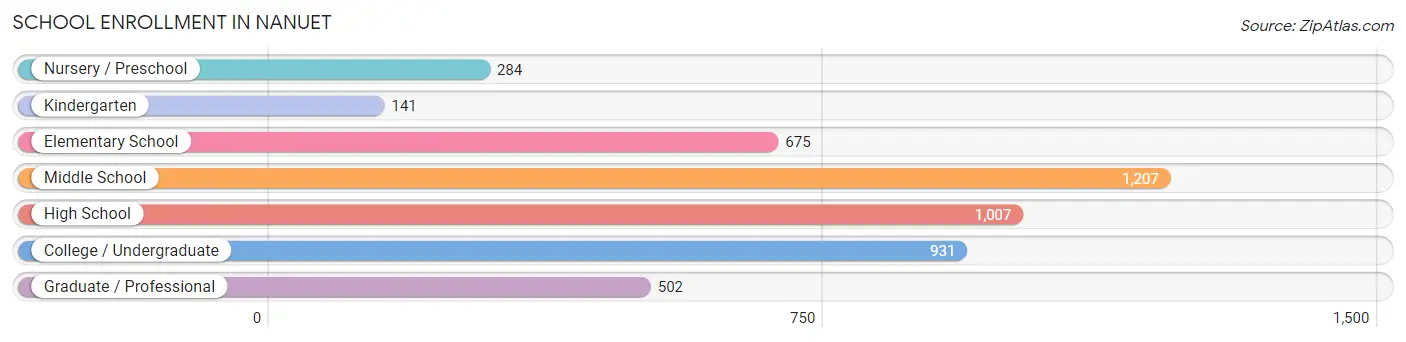
| School Level | # Students | % Students |
| Nursery / Preschool | 284 | 6.0% |
| Kindergarten | 141 | 3.0% |
| Elementary School | 675 | 14.2% |
| Middle School | 1,207 | 25.4% |
| High School | 1,007 | 21.2% |
| College / Undergraduate | 931 | 19.6% |
| Graduate / Professional | 502 | 10.6% |
| Total | 4,747 | 100.0% |
School Enrollment by Age by Funding Source in Nanuet
Out of a total of 4,747 students who are enrolled in schools in Nanuet, 926 (19.5%) attend a private institution, while the remaining 3,821 (80.5%) are enrolled in public schools. The age group of 25 to 34 year olds has the highest likelihood of being enrolled in private schools, with 101 (60.8% in the age bracket) enrolled. Conversely, the age group of 15 to 17 year olds has the lowest likelihood of being enrolled in a private school, with 877 (99.0% in the age bracket) attending a public institution.
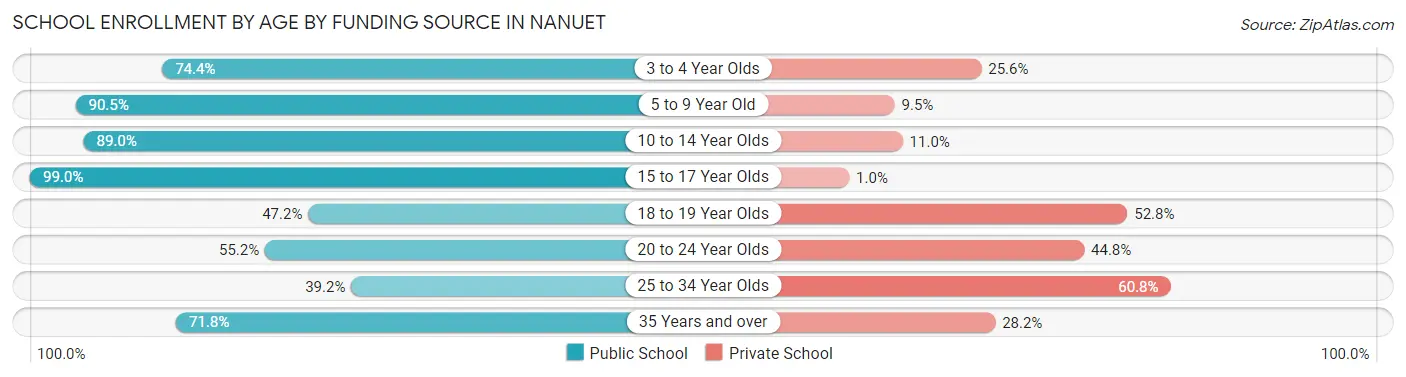
| Age Bracket | Public School | Private School |
| 3 to 4 Year Olds | 203 (74.4%) | 70 (25.6%) |
| 5 to 9 Year Old | 725 (90.5%) | 76 (9.5%) |
| 10 to 14 Year Olds | 1,207 (89.0%) | 149 (11.0%) |
| 15 to 17 Year Olds | 877 (99.0%) | 9 (1.0%) |
| 18 to 19 Year Olds | 50 (47.2%) | 56 (52.8%) |
| 20 to 24 Year Olds | 460 (55.2%) | 373 (44.8%) |
| 25 to 34 Year Olds | 65 (39.2%) | 101 (60.8%) |
| 35 Years and over | 234 (71.8%) | 92 (28.2%) |
| Total | 3,821 (80.5%) | 926 (19.5%) |
Educational Attainment by Field of Study in Nanuet
Business (1,313 | 19.7%), science & technology (839 | 12.6%), education (706 | 10.6%), arts & humanities (628 | 9.4%), and social sciences (568 | 8.5%) are the most common fields of study among 6,681 individuals in Nanuet who have obtained a bachelor's degree or higher.
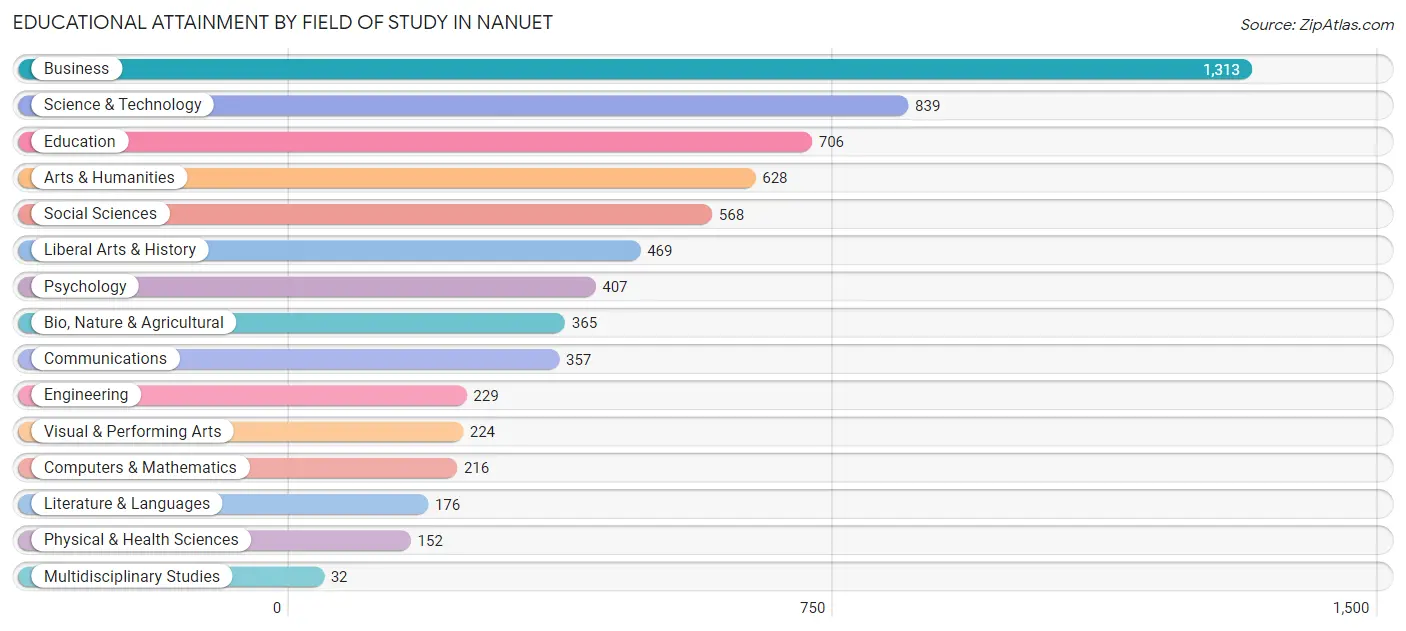
| Field of Study | # Graduates | % Graduates |
| Computers & Mathematics | 216 | 3.2% |
| Bio, Nature & Agricultural | 365 | 5.5% |
| Physical & Health Sciences | 152 | 2.3% |
| Psychology | 407 | 6.1% |
| Social Sciences | 568 | 8.5% |
| Engineering | 229 | 3.4% |
| Multidisciplinary Studies | 32 | 0.5% |
| Science & Technology | 839 | 12.6% |
| Business | 1,313 | 19.7% |
| Education | 706 | 10.6% |
| Literature & Languages | 176 | 2.6% |
| Liberal Arts & History | 469 | 7.0% |
| Visual & Performing Arts | 224 | 3.4% |
| Communications | 357 | 5.3% |
| Arts & Humanities | 628 | 9.4% |
| Total | 6,681 | 100.0% |
Transportation & Commute in Nanuet
Vehicle Availability by Sex in Nanuet
The most prevalent vehicle ownership categories in Nanuet are males with 2 vehicles (1,860, accounting for 37.6%) and females with 2 vehicles (1,940, making up 37.9%).
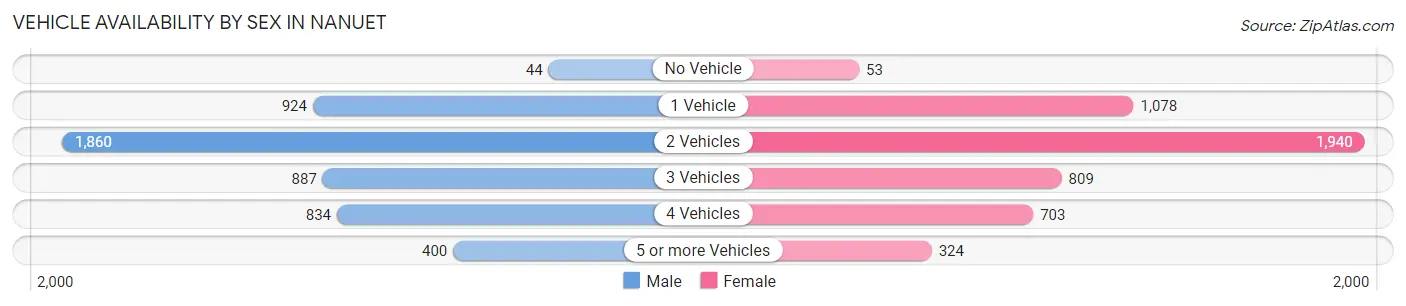
| Vehicles Available | Male | Female |
| No Vehicle | 44 (0.9%) | 53 (1.1%) |
| 1 Vehicle | 924 (18.7%) | 1,078 (22.0%) |
| 2 Vehicles | 1,860 (37.6%) | 1,940 (39.5%) |
| 3 Vehicles | 887 (17.9%) | 809 (16.5%) |
| 4 Vehicles | 834 (16.9%) | 703 (14.3%) |
| 5 or more Vehicles | 400 (8.1%) | 324 (6.6%) |
| Total | 4,949 (100.0%) | 4,907 (100.0%) |
Commute Time in Nanuet
The most frequently occuring commute durations in Nanuet are 10 to 14 minutes (1,379 commuters, 15.7%), 15 to 19 minutes (1,151 commuters, 13.1%), and 20 to 24 minutes (1,010 commuters, 11.5%).
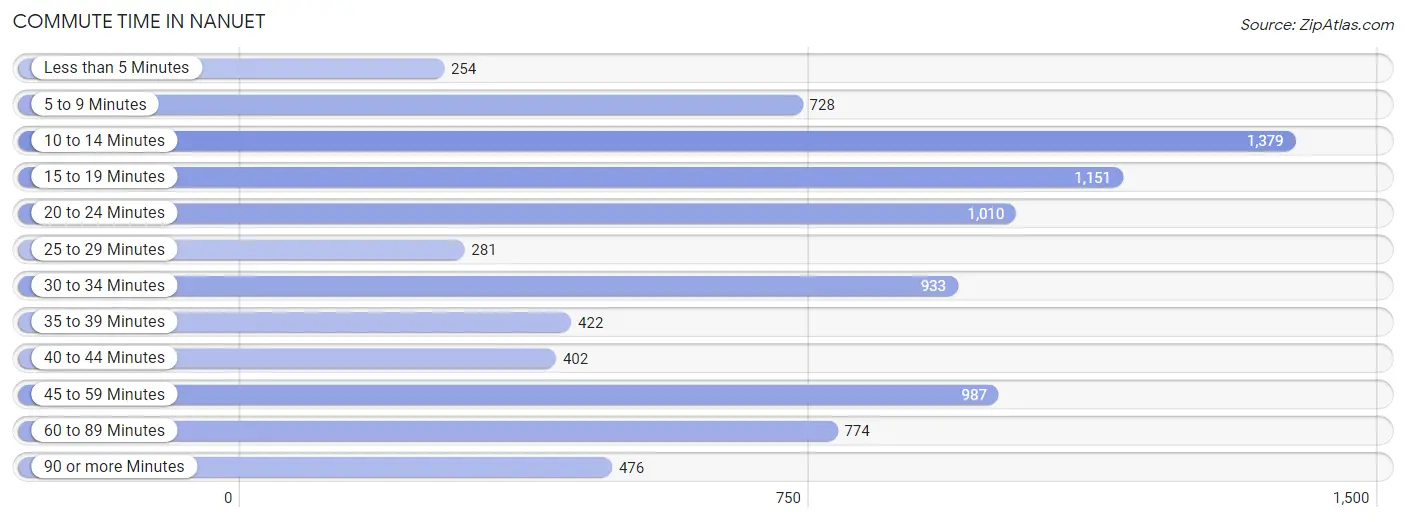
| Commute Time | # Commuters | % Commuters |
| Less than 5 Minutes | 254 | 2.9% |
| 5 to 9 Minutes | 728 | 8.3% |
| 10 to 14 Minutes | 1,379 | 15.7% |
| 15 to 19 Minutes | 1,151 | 13.1% |
| 20 to 24 Minutes | 1,010 | 11.5% |
| 25 to 29 Minutes | 281 | 3.2% |
| 30 to 34 Minutes | 933 | 10.6% |
| 35 to 39 Minutes | 422 | 4.8% |
| 40 to 44 Minutes | 402 | 4.6% |
| 45 to 59 Minutes | 987 | 11.2% |
| 60 to 89 Minutes | 774 | 8.8% |
| 90 or more Minutes | 476 | 5.4% |
Commute Time by Sex in Nanuet
The most common commute times in Nanuet are 45 to 59 minutes (776 commuters, 17.3%) for males and 10 to 14 minutes (974 commuters, 22.5%) for females.
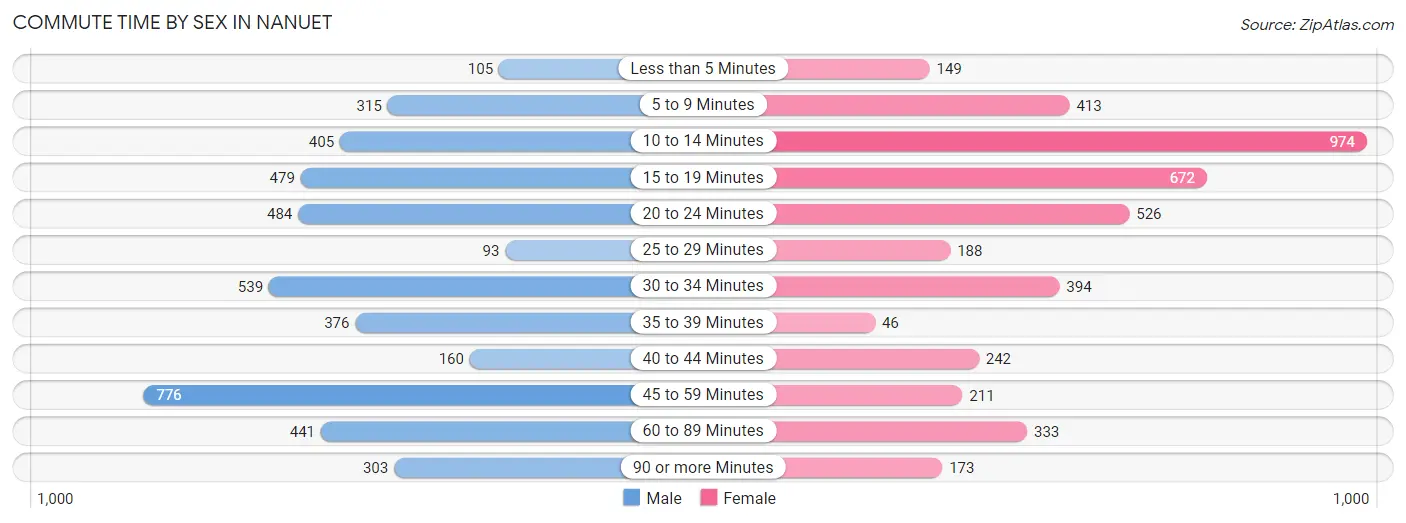
| Commute Time | Male | Female |
| Less than 5 Minutes | 105 (2.4%) | 149 (3.5%) |
| 5 to 9 Minutes | 315 (7.0%) | 413 (9.6%) |
| 10 to 14 Minutes | 405 (9.0%) | 974 (22.5%) |
| 15 to 19 Minutes | 479 (10.7%) | 672 (15.5%) |
| 20 to 24 Minutes | 484 (10.8%) | 526 (12.2%) |
| 25 to 29 Minutes | 93 (2.1%) | 188 (4.3%) |
| 30 to 34 Minutes | 539 (12.0%) | 394 (9.1%) |
| 35 to 39 Minutes | 376 (8.4%) | 46 (1.1%) |
| 40 to 44 Minutes | 160 (3.6%) | 242 (5.6%) |
| 45 to 59 Minutes | 776 (17.3%) | 211 (4.9%) |
| 60 to 89 Minutes | 441 (9.9%) | 333 (7.7%) |
| 90 or more Minutes | 303 (6.8%) | 173 (4.0%) |
Time of Departure to Work by Sex in Nanuet
The most frequent times of departure to work in Nanuet are 7:00 AM to 7:29 AM (880, 19.7%) for males and 7:30 AM to 7:59 AM (1,116, 25.8%) for females.
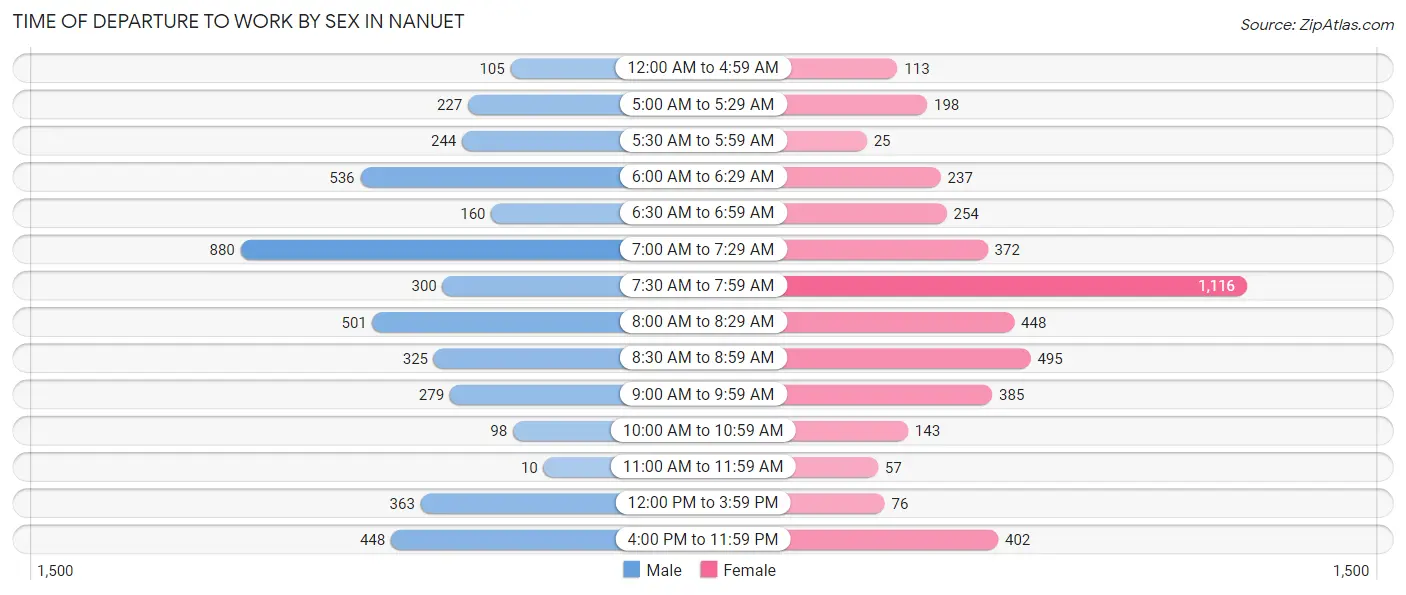
| Time of Departure | Male | Female |
| 12:00 AM to 4:59 AM | 105 (2.4%) | 113 (2.6%) |
| 5:00 AM to 5:29 AM | 227 (5.1%) | 198 (4.6%) |
| 5:30 AM to 5:59 AM | 244 (5.4%) | 25 (0.6%) |
| 6:00 AM to 6:29 AM | 536 (12.0%) | 237 (5.5%) |
| 6:30 AM to 6:59 AM | 160 (3.6%) | 254 (5.9%) |
| 7:00 AM to 7:29 AM | 880 (19.7%) | 372 (8.6%) |
| 7:30 AM to 7:59 AM | 300 (6.7%) | 1,116 (25.8%) |
| 8:00 AM to 8:29 AM | 501 (11.2%) | 448 (10.4%) |
| 8:30 AM to 8:59 AM | 325 (7.3%) | 495 (11.5%) |
| 9:00 AM to 9:59 AM | 279 (6.2%) | 385 (8.9%) |
| 10:00 AM to 10:59 AM | 98 (2.2%) | 143 (3.3%) |
| 11:00 AM to 11:59 AM | 10 (0.2%) | 57 (1.3%) |
| 12:00 PM to 3:59 PM | 363 (8.1%) | 76 (1.8%) |
| 4:00 PM to 11:59 PM | 448 (10.0%) | 402 (9.3%) |
| Total | 4,476 (100.0%) | 4,321 (100.0%) |
Housing Occupancy in Nanuet
Occupancy by Ownership in Nanuet
Of the total 7,021 dwellings in Nanuet, owner-occupied units account for 4,669 (66.5%), while renter-occupied units make up 2,352 (33.5%).
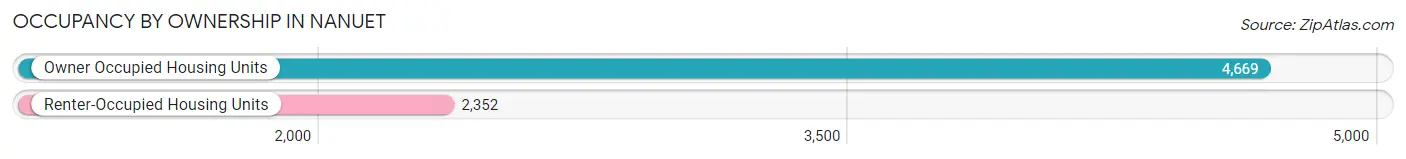
| Occupancy | # Housing Units | % Housing Units |
| Owner Occupied Housing Units | 4,669 | 66.5% |
| Renter-Occupied Housing Units | 2,352 | 33.5% |
| Total Occupied Housing Units | 7,021 | 100.0% |
Occupancy by Household Size in Nanuet
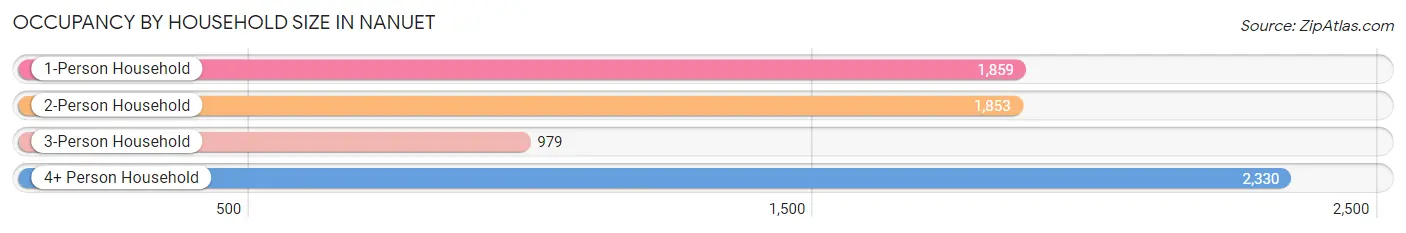
| Household Size | # Housing Units | % Housing Units |
| 1-Person Household | 1,859 | 26.5% |
| 2-Person Household | 1,853 | 26.4% |
| 3-Person Household | 979 | 13.9% |
| 4+ Person Household | 2,330 | 33.2% |
| Total Housing Units | 7,021 | 100.0% |
Occupancy by Ownership by Household Size in Nanuet
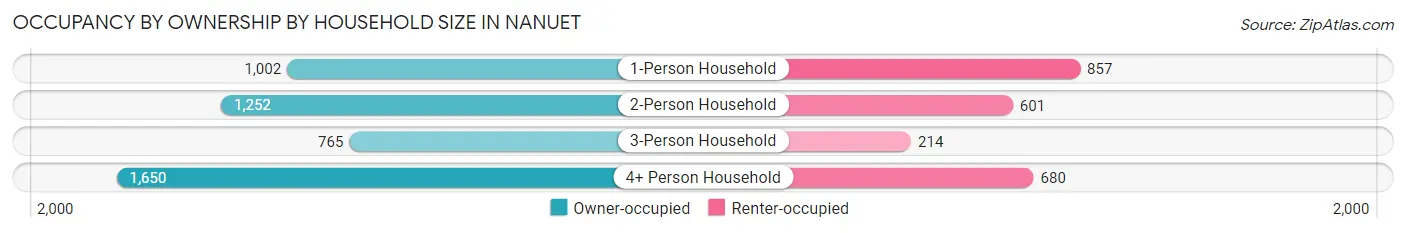
| Household Size | Owner-occupied | Renter-occupied |
| 1-Person Household | 1,002 (53.9%) | 857 (46.1%) |
| 2-Person Household | 1,252 (67.6%) | 601 (32.4%) |
| 3-Person Household | 765 (78.1%) | 214 (21.9%) |
| 4+ Person Household | 1,650 (70.8%) | 680 (29.2%) |
| Total Housing Units | 4,669 (66.5%) | 2,352 (33.5%) |
Occupancy by Educational Attainment in Nanuet
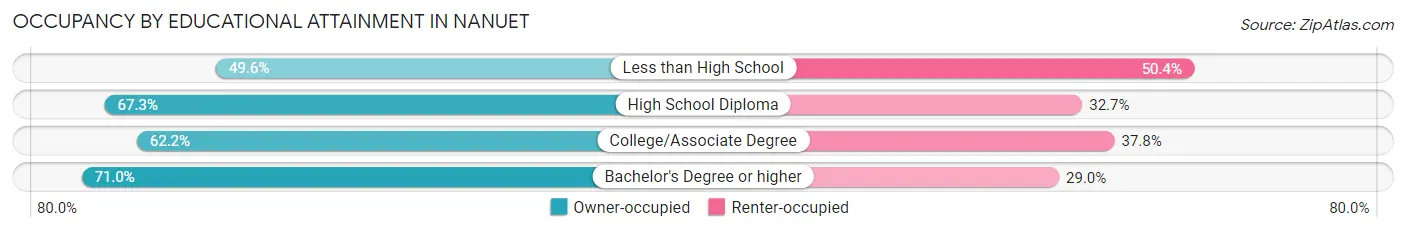
| Household Size | Owner-occupied | Renter-occupied |
| Less than High School | 274 (49.6%) | 278 (50.4%) |
| High School Diploma | 990 (67.3%) | 481 (32.7%) |
| College/Associate Degree | 1,010 (62.2%) | 614 (37.8%) |
| Bachelor's Degree or higher | 2,395 (71.0%) | 979 (29.0%) |
Occupancy by Age of Householder in Nanuet
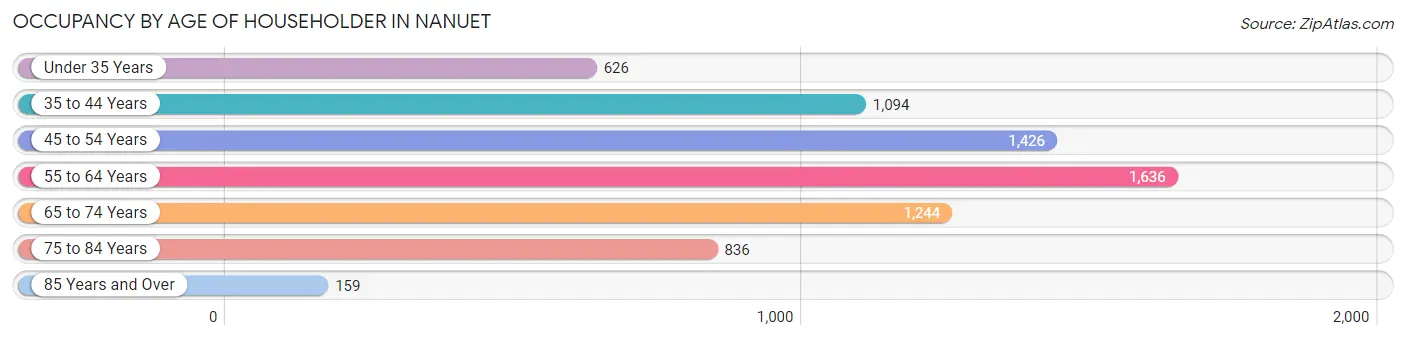
| Age Bracket | # Households | % Households |
| Under 35 Years | 626 | 8.9% |
| 35 to 44 Years | 1,094 | 15.6% |
| 45 to 54 Years | 1,426 | 20.3% |
| 55 to 64 Years | 1,636 | 23.3% |
| 65 to 74 Years | 1,244 | 17.7% |
| 75 to 84 Years | 836 | 11.9% |
| 85 Years and Over | 159 | 2.3% |
| Total | 7,021 | 100.0% |
Housing Finances in Nanuet
Median Income by Occupancy in Nanuet
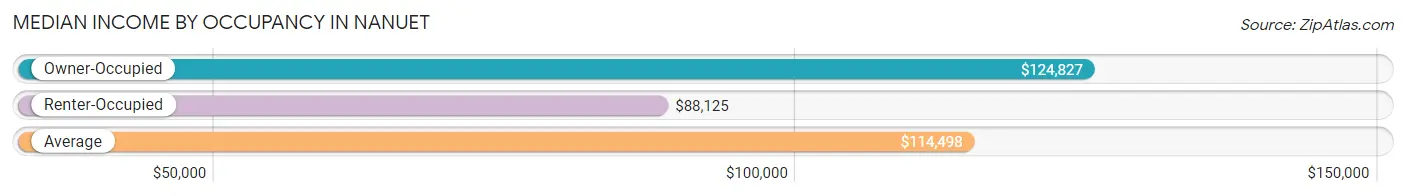
| Occupancy Type | # Households | Median Income |
| Owner-Occupied | 4,669 (66.5%) | $124,827 |
| Renter-Occupied | 2,352 (33.5%) | $88,125 |
| Average | 7,021 (100.0%) | $114,498 |
Occupancy by Householder Income Bracket in Nanuet
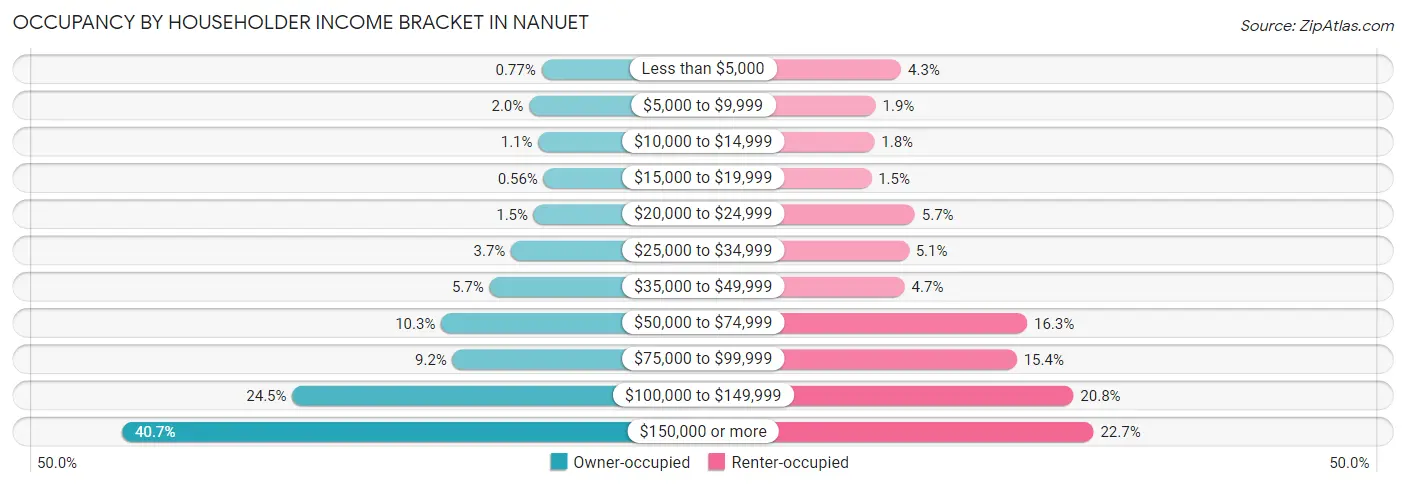
| Income Bracket | Owner-occupied | Renter-occupied |
| Less than $5,000 | 36 (0.8%) | 102 (4.3%) |
| $5,000 to $9,999 | 91 (1.9%) | 45 (1.9%) |
| $10,000 to $14,999 | 50 (1.1%) | 42 (1.8%) |
| $15,000 to $19,999 | 26 (0.6%) | 35 (1.5%) |
| $20,000 to $24,999 | 70 (1.5%) | 133 (5.7%) |
| $25,000 to $34,999 | 171 (3.7%) | 119 (5.1%) |
| $35,000 to $49,999 | 267 (5.7%) | 110 (4.7%) |
| $50,000 to $74,999 | 482 (10.3%) | 384 (16.3%) |
| $75,000 to $99,999 | 431 (9.2%) | 361 (15.3%) |
| $100,000 to $149,999 | 1,144 (24.5%) | 488 (20.7%) |
| $150,000 or more | 1,901 (40.7%) | 533 (22.7%) |
| Total | 4,669 (100.0%) | 2,352 (100.0%) |
Monthly Housing Cost Tiers in Nanuet
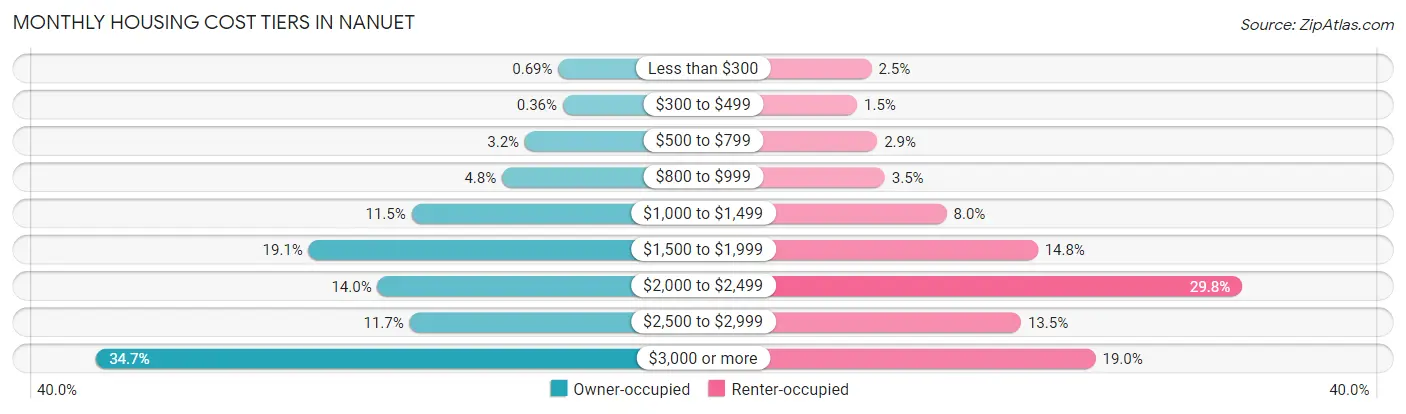
| Monthly Cost | Owner-occupied | Renter-occupied |
| Less than $300 | 32 (0.7%) | 59 (2.5%) |
| $300 to $499 | 17 (0.4%) | 34 (1.5%) |
| $500 to $799 | 147 (3.2%) | 69 (2.9%) |
| $800 to $999 | 226 (4.8%) | 82 (3.5%) |
| $1,000 to $1,499 | 537 (11.5%) | 189 (8.0%) |
| $1,500 to $1,999 | 891 (19.1%) | 347 (14.7%) |
| $2,000 to $2,499 | 654 (14.0%) | 701 (29.8%) |
| $2,500 to $2,999 | 544 (11.7%) | 318 (13.5%) |
| $3,000 or more | 1,621 (34.7%) | 447 (19.0%) |
| Total | 4,669 (100.0%) | 2,352 (100.0%) |
Physical Housing Characteristics in Nanuet
Housing Structures in Nanuet
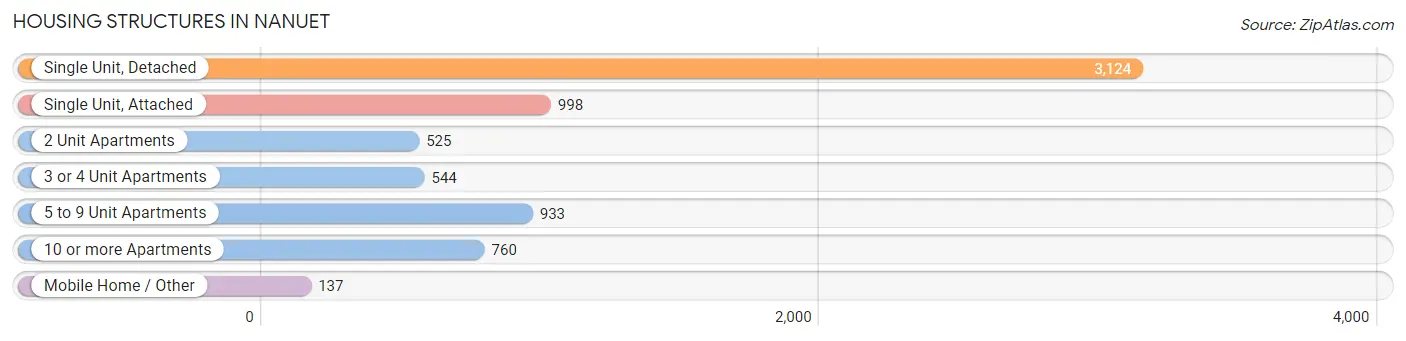
| Structure Type | # Housing Units | % Housing Units |
| Single Unit, Detached | 3,124 | 44.5% |
| Single Unit, Attached | 998 | 14.2% |
| 2 Unit Apartments | 525 | 7.5% |
| 3 or 4 Unit Apartments | 544 | 7.7% |
| 5 to 9 Unit Apartments | 933 | 13.3% |
| 10 or more Apartments | 760 | 10.8% |
| Mobile Home / Other | 137 | 1.9% |
| Total | 7,021 | 100.0% |
Housing Structures by Occupancy in Nanuet
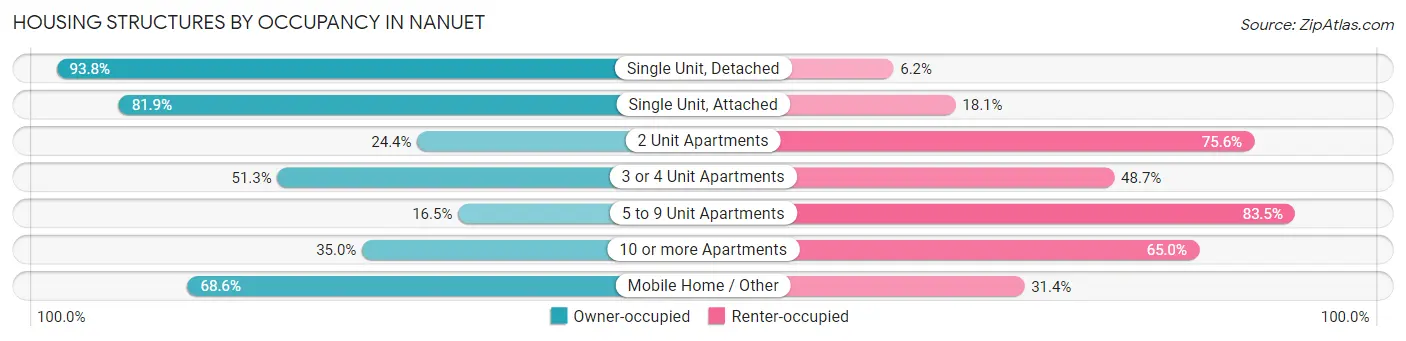
| Structure Type | Owner-occupied | Renter-occupied |
| Single Unit, Detached | 2,931 (93.8%) | 193 (6.2%) |
| Single Unit, Attached | 817 (81.9%) | 181 (18.1%) |
| 2 Unit Apartments | 128 (24.4%) | 397 (75.6%) |
| 3 or 4 Unit Apartments | 279 (51.3%) | 265 (48.7%) |
| 5 to 9 Unit Apartments | 154 (16.5%) | 779 (83.5%) |
| 10 or more Apartments | 266 (35.0%) | 494 (65.0%) |
| Mobile Home / Other | 94 (68.6%) | 43 (31.4%) |
| Total | 4,669 (66.5%) | 2,352 (33.5%) |
Housing Structures by Number of Rooms in Nanuet
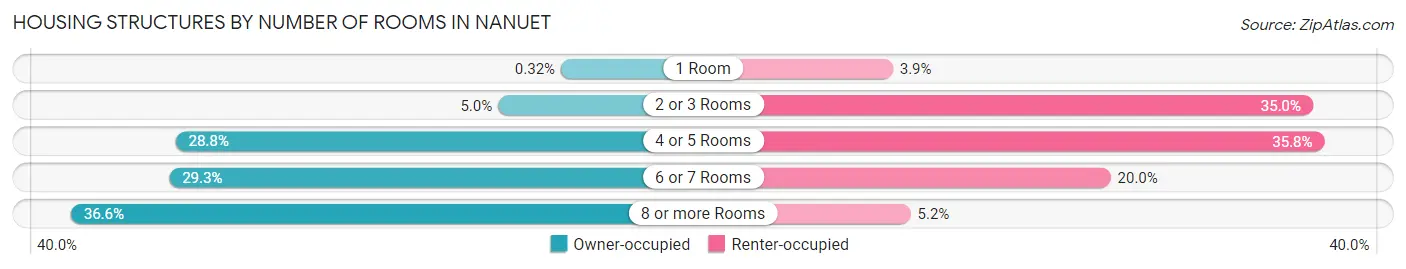
| Number of Rooms | Owner-occupied | Renter-occupied |
| 1 Room | 15 (0.3%) | 92 (3.9%) |
| 2 or 3 Rooms | 232 (5.0%) | 823 (35.0%) |
| 4 or 5 Rooms | 1,346 (28.8%) | 843 (35.8%) |
| 6 or 7 Rooms | 1,368 (29.3%) | 471 (20.0%) |
| 8 or more Rooms | 1,708 (36.6%) | 123 (5.2%) |
| Total | 4,669 (100.0%) | 2,352 (100.0%) |
Housing Structure by Heating Type in Nanuet
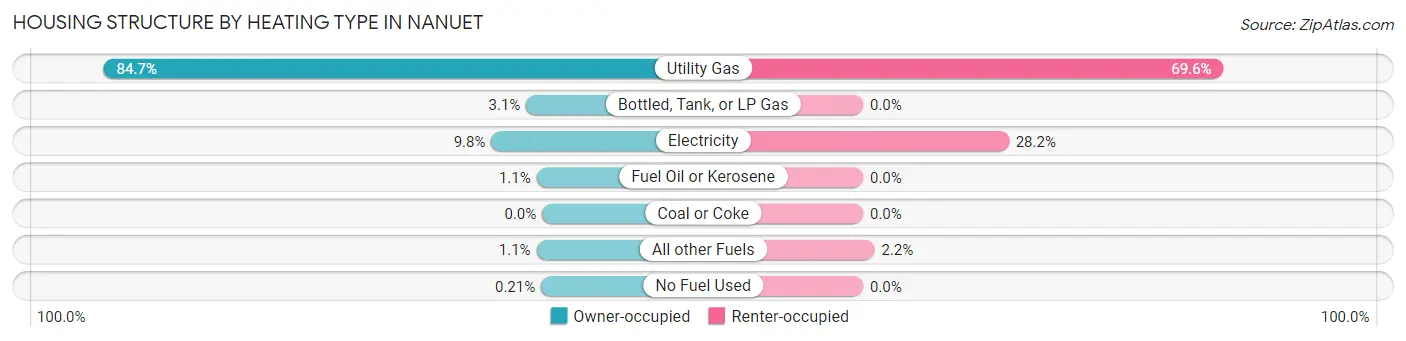
| Heating Type | Owner-occupied | Renter-occupied |
| Utility Gas | 3,956 (84.7%) | 1,638 (69.6%) |
| Bottled, Tank, or LP Gas | 144 (3.1%) | 0 (0.0%) |
| Electricity | 458 (9.8%) | 662 (28.1%) |
| Fuel Oil or Kerosene | 50 (1.1%) | 0 (0.0%) |
| Coal or Coke | 0 (0.0%) | 0 (0.0%) |
| All other Fuels | 51 (1.1%) | 52 (2.2%) |
| No Fuel Used | 10 (0.2%) | 0 (0.0%) |
| Total | 4,669 (100.0%) | 2,352 (100.0%) |
Household Vehicle Usage in Nanuet
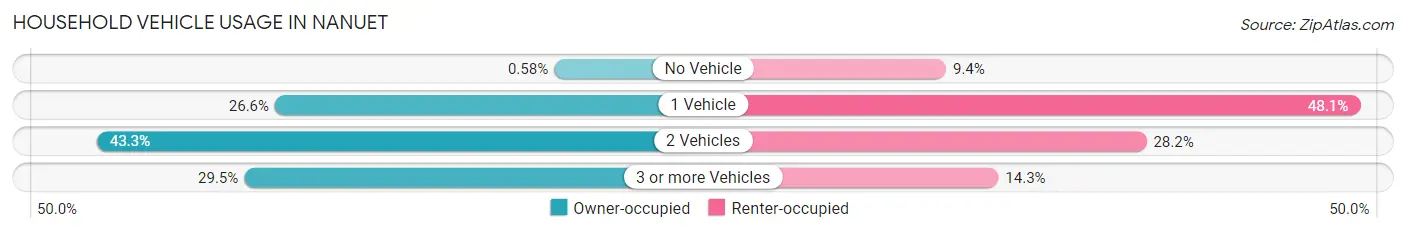
| Vehicles per Household | Owner-occupied | Renter-occupied |
| No Vehicle | 27 (0.6%) | 222 (9.4%) |
| 1 Vehicle | 1,244 (26.6%) | 1,131 (48.1%) |
| 2 Vehicles | 2,020 (43.3%) | 662 (28.1%) |
| 3 or more Vehicles | 1,378 (29.5%) | 337 (14.3%) |
| Total | 4,669 (100.0%) | 2,352 (100.0%) |
Real Estate & Mortgages in Nanuet
Real Estate and Mortgage Overview in Nanuet
| Characteristic | Without Mortgage | With Mortgage |
| Housing Units | 1,672 | 2,997 |
| Median Property Value | $416,600 | $478,300 |
| Median Household Income | $102,030 | $1,348 |
| Monthly Housing Costs | $1,482 | $1,602 |
| Real Estate Taxes | $10,001 | $11 |
Property Value by Mortgage Status in Nanuet
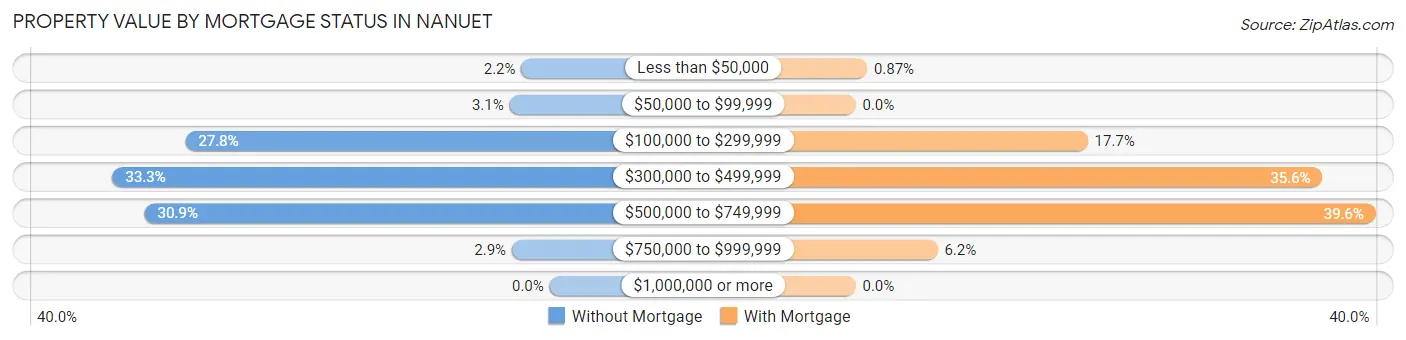
| Property Value | Without Mortgage | With Mortgage |
| Less than $50,000 | 36 (2.1%) | 26 (0.9%) |
| $50,000 to $99,999 | 51 (3.0%) | 0 (0.0%) |
| $100,000 to $299,999 | 464 (27.8%) | 530 (17.7%) |
| $300,000 to $499,999 | 557 (33.3%) | 1,066 (35.6%) |
| $500,000 to $749,999 | 516 (30.9%) | 1,188 (39.6%) |
| $750,000 to $999,999 | 48 (2.9%) | 187 (6.2%) |
| $1,000,000 or more | 0 (0.0%) | 0 (0.0%) |
| Total | 1,672 (100.0%) | 2,997 (100.0%) |
Household Income by Mortgage Status in Nanuet
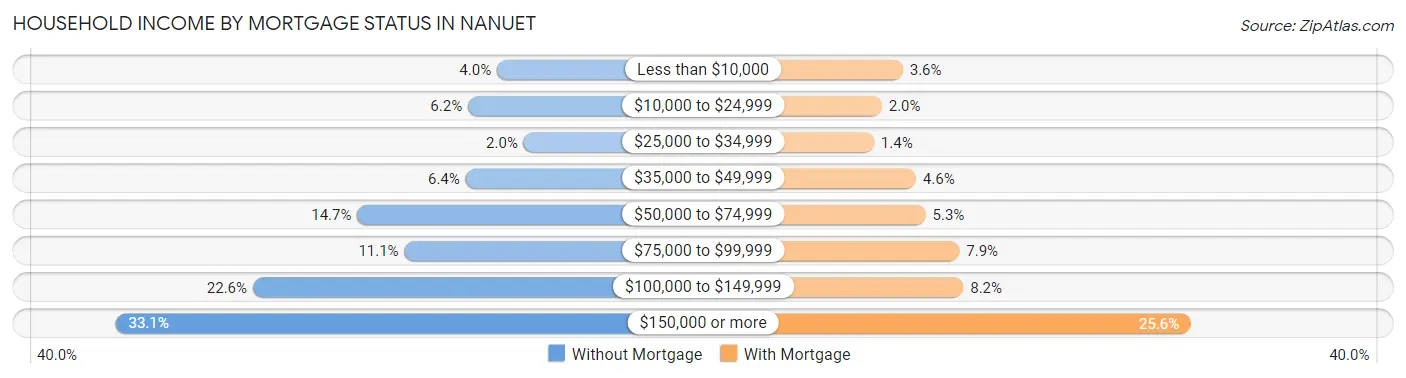
| Household Income | Without Mortgage | With Mortgage |
| Less than $10,000 | 67 (4.0%) | 108 (3.6%) |
| $10,000 to $24,999 | 104 (6.2%) | 60 (2.0%) |
| $25,000 to $34,999 | 33 (2.0%) | 42 (1.4%) |
| $35,000 to $49,999 | 107 (6.4%) | 138 (4.6%) |
| $50,000 to $74,999 | 245 (14.6%) | 160 (5.3%) |
| $75,000 to $99,999 | 185 (11.1%) | 237 (7.9%) |
| $100,000 to $149,999 | 378 (22.6%) | 246 (8.2%) |
| $150,000 or more | 553 (33.1%) | 766 (25.6%) |
| Total | 1,672 (100.0%) | 2,997 (100.0%) |
Property Value to Household Income Ratio in Nanuet
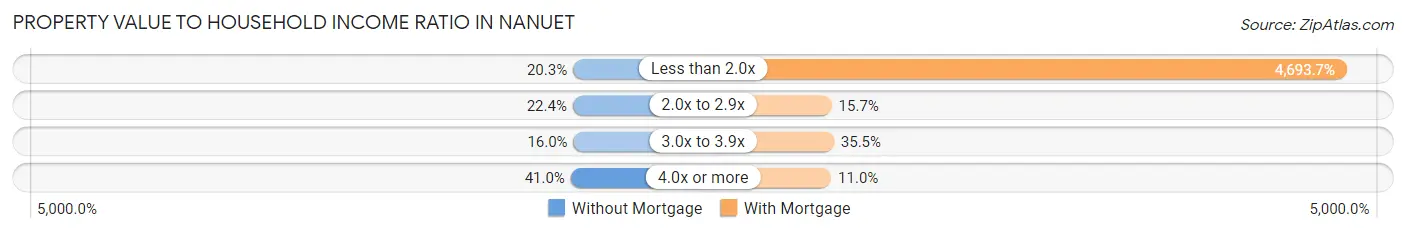
| Value-to-Income Ratio | Without Mortgage | With Mortgage |
| Less than 2.0x | 340 (20.3%) | 140,671 (4,693.7%) |
| 2.0x to 2.9x | 374 (22.4%) | 470 (15.7%) |
| 3.0x to 3.9x | 267 (16.0%) | 1,065 (35.5%) |
| 4.0x or more | 686 (41.0%) | 330 (11.0%) |
| Total | 1,672 (100.0%) | 2,997 (100.0%) |
Real Estate Taxes by Mortgage Status in Nanuet
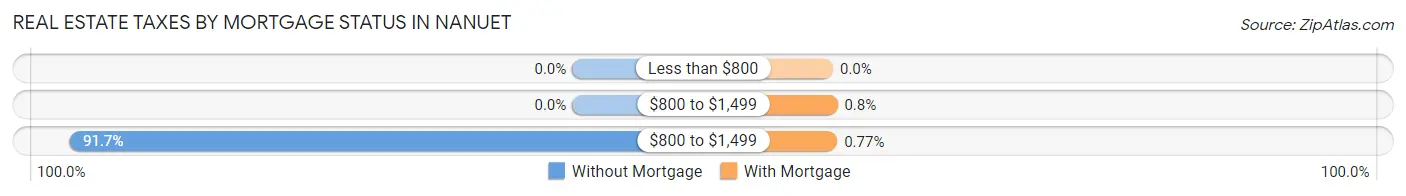
| Property Taxes | Without Mortgage | With Mortgage |
| Less than $800 | 0 (0.0%) | 0 (0.0%) |
| $800 to $1,499 | 0 (0.0%) | 24 (0.8%) |
| $800 to $1,499 | 1,533 (91.7%) | 23 (0.8%) |
| Total | 1,672 (100.0%) | 2,997 (100.0%) |
Health & Disability in Nanuet
Health Insurance Coverage by Age in Nanuet
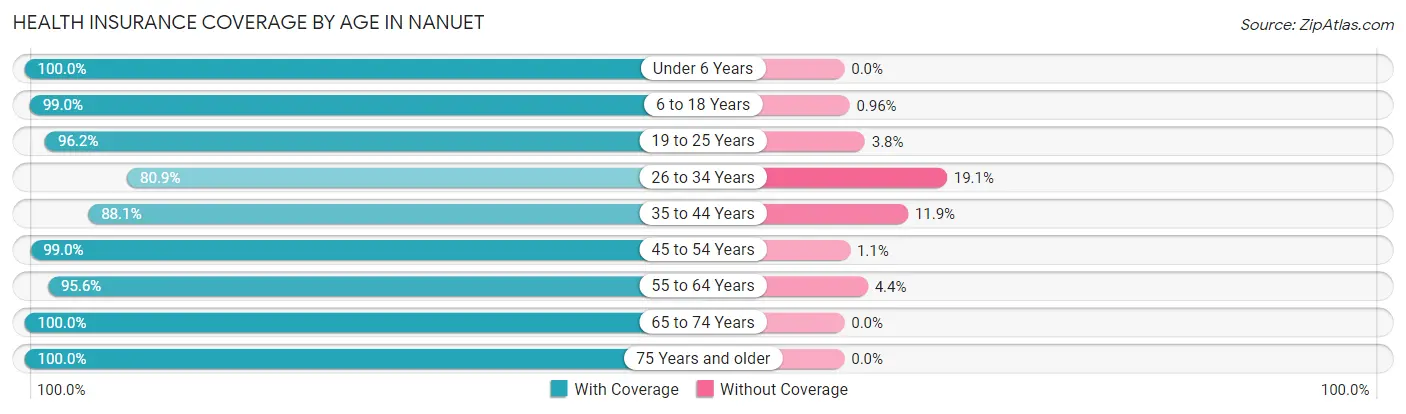
| Age Bracket | With Coverage | Without Coverage |
| Under 6 Years | 1,161 (100.0%) | 0 (0.0%) |
| 6 to 18 Years | 3,006 (99.0%) | 29 (1.0%) |
| 19 to 25 Years | 1,789 (96.2%) | 71 (3.8%) |
| 26 to 34 Years | 1,866 (80.9%) | 441 (19.1%) |
| 35 to 44 Years | 2,271 (88.1%) | 306 (11.9%) |
| 45 to 54 Years | 2,729 (99.0%) | 29 (1.1%) |
| 55 to 64 Years | 2,723 (95.6%) | 124 (4.4%) |
| 65 to 74 Years | 2,121 (100.0%) | 0 (0.0%) |
| 75 Years and older | 1,709 (100.0%) | 0 (0.0%) |
| Total | 19,375 (95.1%) | 1,000 (4.9%) |
Health Insurance Coverage by Citizenship Status in Nanuet
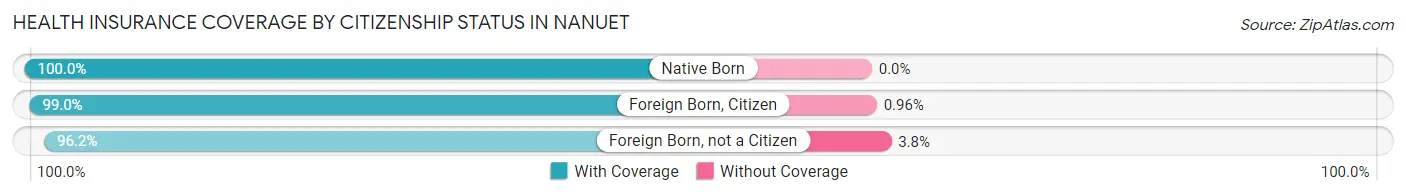
| Citizenship Status | With Coverage | Without Coverage |
| Native Born | 1,161 (100.0%) | 0 (0.0%) |
| Foreign Born, Citizen | 3,006 (99.0%) | 29 (1.0%) |
| Foreign Born, not a Citizen | 1,789 (96.2%) | 71 (3.8%) |
Health Insurance Coverage by Household Income in Nanuet
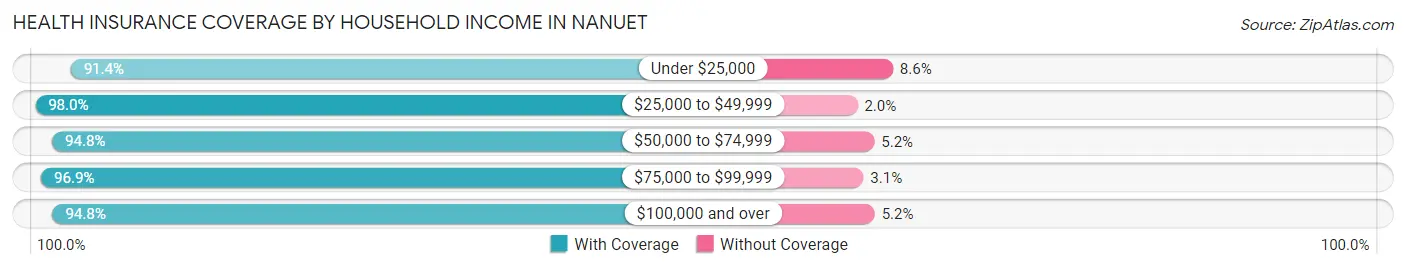
| Household Income | With Coverage | Without Coverage |
| Under $25,000 | 984 (91.4%) | 93 (8.6%) |
| $25,000 to $49,999 | 1,227 (98.0%) | 25 (2.0%) |
| $50,000 to $74,999 | 1,799 (94.8%) | 98 (5.2%) |
| $75,000 to $99,999 | 2,178 (96.9%) | 70 (3.1%) |
| $100,000 and over | 12,949 (94.8%) | 714 (5.2%) |
Public vs Private Health Insurance Coverage by Age in Nanuet
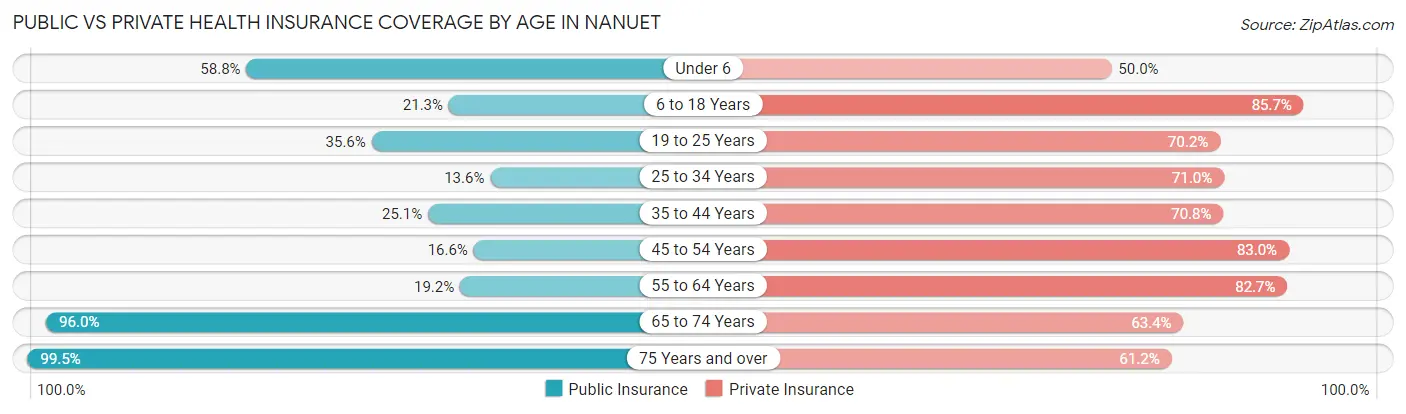
| Age Bracket | Public Insurance | Private Insurance |
| Under 6 | 683 (58.8%) | 581 (50.0%) |
| 6 to 18 Years | 645 (21.2%) | 2,602 (85.7%) |
| 19 to 25 Years | 662 (35.6%) | 1,306 (70.2%) |
| 25 to 34 Years | 313 (13.6%) | 1,637 (71.0%) |
| 35 to 44 Years | 647 (25.1%) | 1,825 (70.8%) |
| 45 to 54 Years | 459 (16.6%) | 2,289 (83.0%) |
| 55 to 64 Years | 546 (19.2%) | 2,354 (82.7%) |
| 65 to 74 Years | 2,036 (96.0%) | 1,345 (63.4%) |
| 75 Years and over | 1,700 (99.5%) | 1,046 (61.2%) |
| Total | 7,691 (37.8%) | 14,985 (73.6%) |
Disability Status by Sex by Age in Nanuet
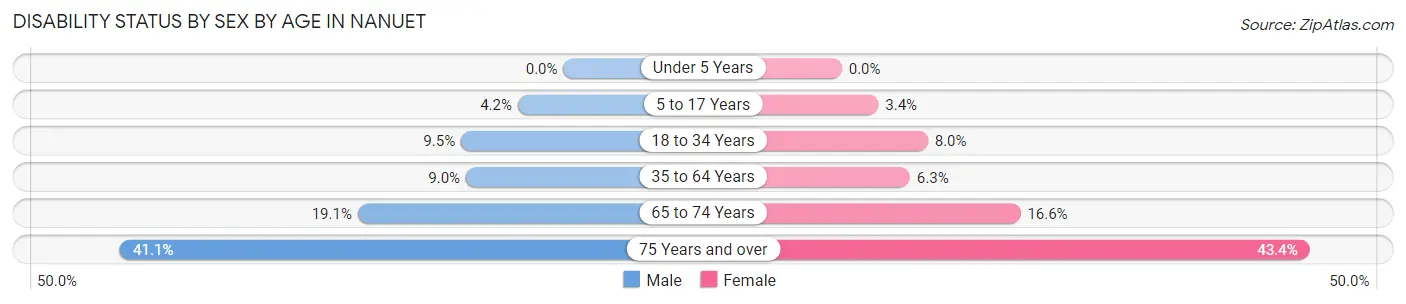
| Age Bracket | Male | Female |
| Under 5 Years | 0 (0.0%) | 0 (0.0%) |
| 5 to 17 Years | 81 (4.2%) | 41 (3.4%) |
| 18 to 34 Years | 198 (9.5%) | 168 (8.0%) |
| 35 to 64 Years | 385 (9.0%) | 248 (6.3%) |
| 65 to 74 Years | 186 (19.1%) | 190 (16.6%) |
| 75 Years and over | 197 (41.1%) | 534 (43.4%) |
Disability Class by Sex by Age in Nanuet
Disability Class: Hearing Difficulty
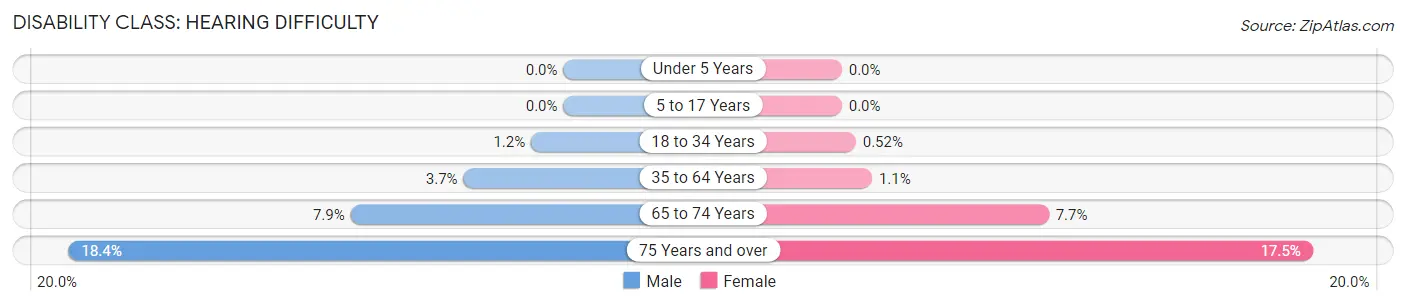
| Age Bracket | Male | Female |
| Under 5 Years | 0 (0.0%) | 0 (0.0%) |
| 5 to 17 Years | 0 (0.0%) | 0 (0.0%) |
| 18 to 34 Years | 25 (1.2%) | 11 (0.5%) |
| 35 to 64 Years | 158 (3.7%) | 44 (1.1%) |
| 65 to 74 Years | 77 (7.9%) | 88 (7.7%) |
| 75 Years and over | 88 (18.4%) | 215 (17.5%) |
Disability Class: Vision Difficulty
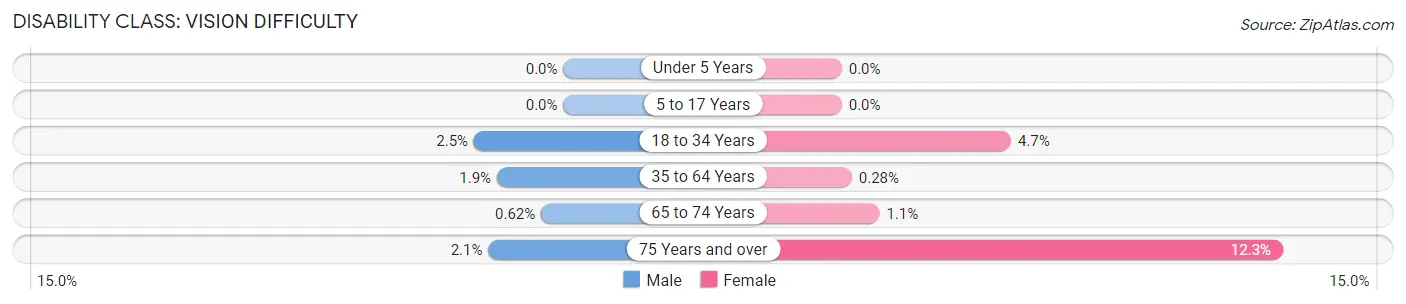
| Age Bracket | Male | Female |
| Under 5 Years | 0 (0.0%) | 0 (0.0%) |
| 5 to 17 Years | 0 (0.0%) | 0 (0.0%) |
| 18 to 34 Years | 52 (2.5%) | 99 (4.7%) |
| 35 to 64 Years | 79 (1.8%) | 11 (0.3%) |
| 65 to 74 Years | 6 (0.6%) | 12 (1.1%) |
| 75 Years and over | 10 (2.1%) | 151 (12.3%) |
Disability Class: Cognitive Difficulty
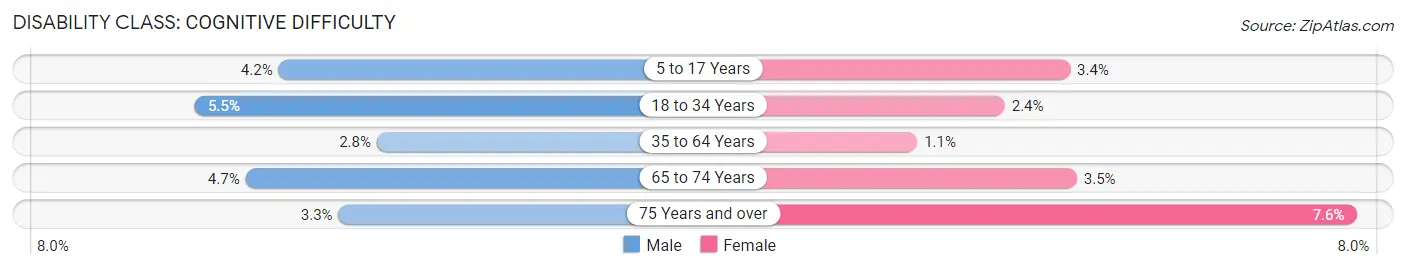
| Age Bracket | Male | Female |
| 5 to 17 Years | 81 (4.2%) | 41 (3.4%) |
| 18 to 34 Years | 114 (5.5%) | 51 (2.4%) |
| 35 to 64 Years | 118 (2.8%) | 44 (1.1%) |
| 65 to 74 Years | 46 (4.7%) | 40 (3.5%) |
| 75 Years and over | 16 (3.3%) | 94 (7.6%) |
Disability Class: Ambulatory Difficulty
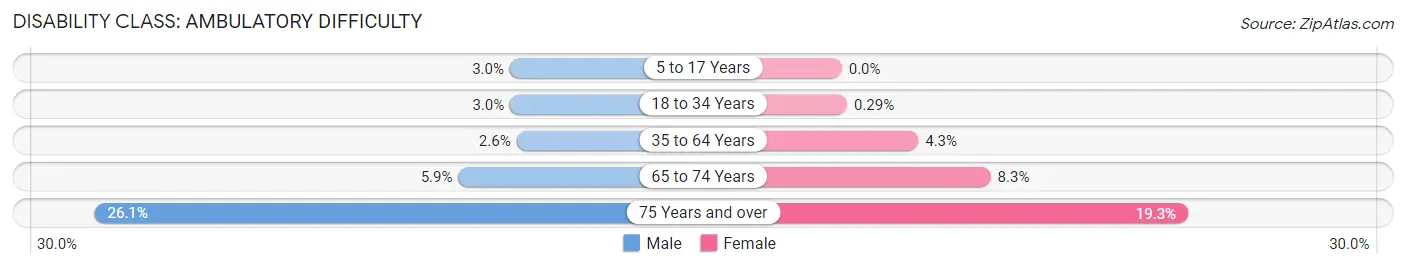
| Age Bracket | Male | Female |
| 5 to 17 Years | 57 (3.0%) | 0 (0.0%) |
| 18 to 34 Years | 62 (3.0%) | 6 (0.3%) |
| 35 to 64 Years | 111 (2.6%) | 167 (4.3%) |
| 65 to 74 Years | 57 (5.9%) | 95 (8.3%) |
| 75 Years and over | 125 (26.1%) | 237 (19.3%) |
Disability Class: Self-Care Difficulty
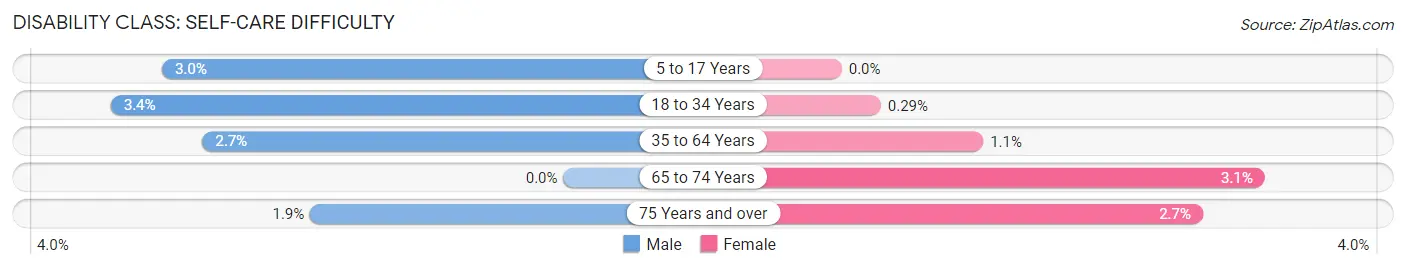
| Age Bracket | Male | Female |
| 5 to 17 Years | 57 (3.0%) | 0 (0.0%) |
| 18 to 34 Years | 70 (3.4%) | 6 (0.3%) |
| 35 to 64 Years | 114 (2.7%) | 41 (1.1%) |
| 65 to 74 Years | 0 (0.0%) | 36 (3.1%) |
| 75 Years and over | 9 (1.9%) | 33 (2.7%) |
Technology Access in Nanuet
Computing Device Access in Nanuet
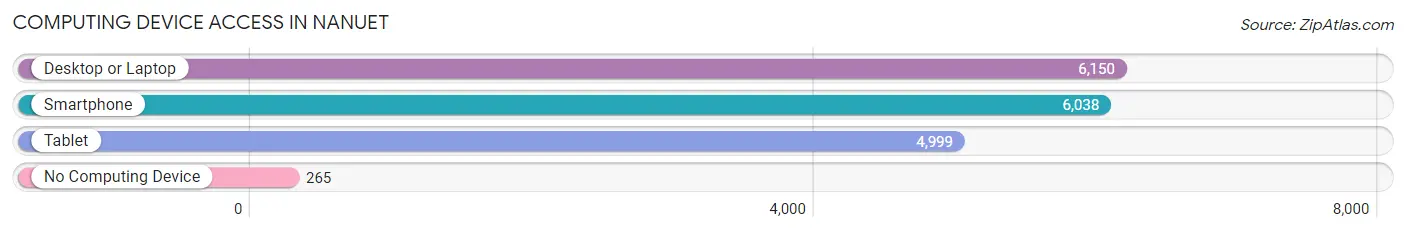
| Device Type | # Households | % Households |
| Desktop or Laptop | 6,150 | 87.6% |
| Smartphone | 6,038 | 86.0% |
| Tablet | 4,999 | 71.2% |
| No Computing Device | 265 | 3.8% |
| Total | 7,021 | 100.0% |
Internet Access in Nanuet
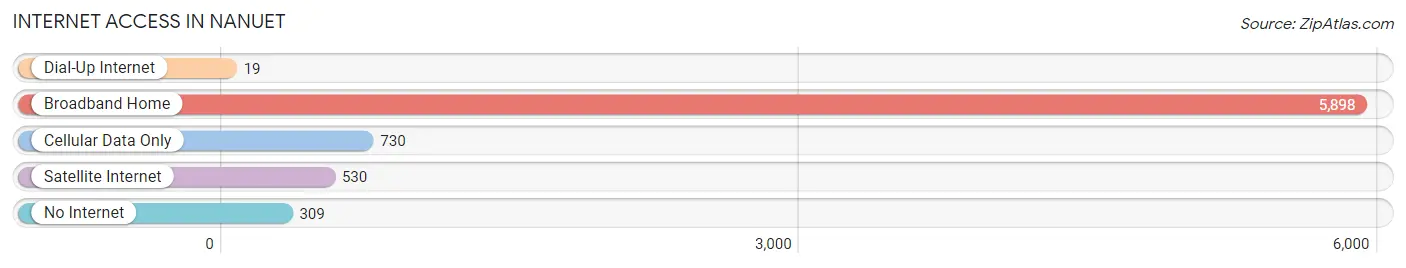
| Internet Type | # Households | % Households |
| Dial-Up Internet | 19 | 0.3% |
| Broadband Home | 5,898 | 84.0% |
| Cellular Data Only | 730 | 10.4% |
| Satellite Internet | 530 | 7.5% |
| No Internet | 309 | 4.4% |
| Total | 7,021 | 100.0% |
Nanuet Summary
Nanuet is a hamlet located in the town of Clarkstown in Rockland County, New York. It is located approximately 25 miles north of New York City and is part of the New York metropolitan area. The hamlet is situated on the west bank of the Hudson River and is bordered by the towns of Orangetown and Ramapo.
History
The area that is now Nanuet was originally inhabited by the Munsee Native Americans. The first European settlers arrived in the area in the late 17th century and the hamlet was officially established in 1764. The name Nanuet is derived from the Munsee word for “stream” or “valley”.
In the 19th century, the hamlet was a popular summer resort destination for wealthy New Yorkers. The area was also home to several large farms and a number of small businesses. In the early 20th century, the hamlet began to experience rapid growth as a result of the construction of the New York State Thruway and the Tappan Zee Bridge.
Geography
Nanuet is located in the town of Clarkstown in Rockland County, New York. It is situated on the west bank of the Hudson River and is bordered by the towns of Orangetown and Ramapo. The hamlet is located approximately 25 miles north of New York City and is part of the New York metropolitan area.
The hamlet has a total area of 2.2 square miles, all of which is land. The terrain is mostly flat and the area is home to several small lakes and ponds. The hamlet is located in a temperate climate zone and experiences four distinct seasons.
Economy
Nanuet’s economy is largely based on retail and services. The hamlet is home to several large shopping centers, including the Nanuet Mall and the Shops at Nanuet. The hamlet is also home to a number of small businesses, including restaurants, banks, and professional services.
The hamlet is also home to several large employers, including the Palisades Center Mall, the Shops at Nanuet, and the Nanuet Mall. The hamlet is also home to a number of corporate offices, including those of the pharmaceutical company Pfizer and the financial services company MetLife.
Demographics
As of the 2010 census, the population of Nanuet was 17,882. The racial makeup of the hamlet was 79.3% White, 11.2% African American, 0.3% Native American, 4.2% Asian, and 4.9% from other races. The median household income was $77,837 and the median family income was $90,945.
The hamlet is home to a large Jewish population, with approximately 25% of the population identifying as Jewish. The hamlet is also home to a large Italian-American population, with approximately 15% of the population identifying as Italian-American. The hamlet is also home to a large Irish-American population, with approximately 10% of the population identifying as Irish-American.
Common Questions
What is Per Capita Income in Nanuet?
Per Capita income in Nanuet is $49,479.
What is the Median Family Income in Nanuet?
Median Family Income in Nanuet is $128,819.
What is the Median Household income in Nanuet?
Median Household Income in Nanuet is $114,498.
What is Income or Wage Gap in Nanuet?
Income or Wage Gap in Nanuet is 37.6%.
Women in Nanuet earn 62.4 cents for every dollar earned by a man.
What is Family Income Deficit in Nanuet?
Family Income Deficit in Nanuet is $9,960.
Families that are below poverty line in Nanuet earn $9,960 less on average than the poverty threshold level.
What is Inequality or Gini Index in Nanuet?
Inequality or Gini Index in Nanuet is 0.47.
What is the Total Population of Nanuet?
Total Population of Nanuet is 20,586.
What is the Total Male Population of Nanuet?
Total Male Population of Nanuet is 10,251.
What is the Total Female Population of Nanuet?
Total Female Population of Nanuet is 10,335.
What is the Ratio of Males per 100 Females in Nanuet?
There are 99.19 Males per 100 Females in Nanuet.
What is the Ratio of Females per 100 Males in Nanuet?
There are 100.82 Females per 100 Males in Nanuet.
What is the Median Population Age in Nanuet?
Median Population Age in Nanuet is 41.0 Years.
What is the Average Family Size in Nanuet
Average Family Size in Nanuet is 3.3 People.
What is the Average Household Size in Nanuet
Average Household Size in Nanuet is 2.9 People.
How Large is the Labor Force in Nanuet?
There are 10,554 People in the Labor Forcein in Nanuet.
What is the Percentage of People in the Labor Force in Nanuet?
62.3% of People are in the Labor Force in Nanuet.
What is the Unemployment Rate in Nanuet?
Unemployment Rate in Nanuet is 3.0%.