Hortonville, NY Map & Demographics
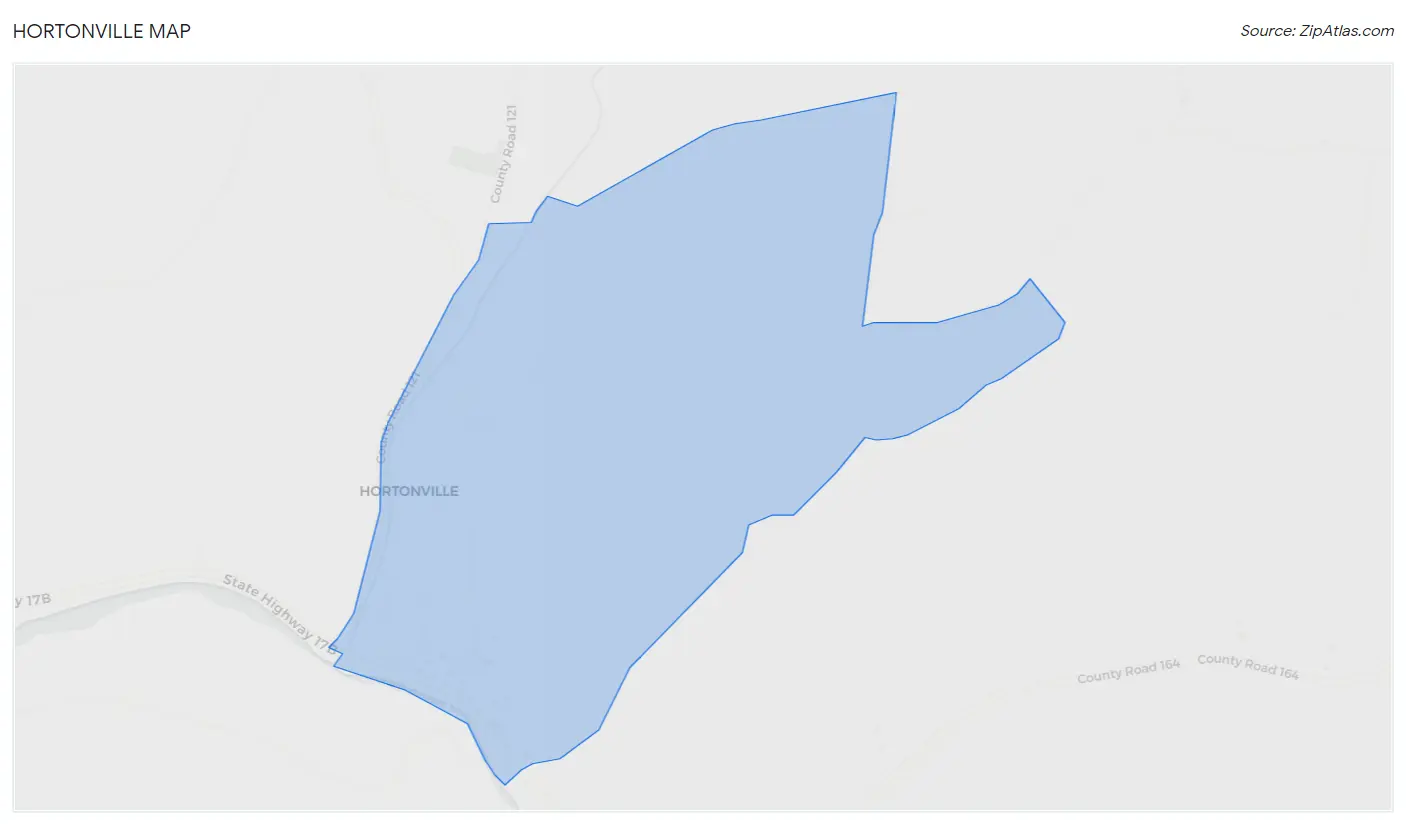
Hortonville Map
Hortonville Overview
$39,955
PER CAPITA INCOME
$103,135
AVG FAMILY INCOME
$96,250
AVG HOUSEHOLD INCOME
0.25
INEQUALITY / GINI INDEX
282
TOTAL POPULATION
125
MALE POPULATION
157
FEMALE POPULATION
79.62
MALES / 100 FEMALES
125.60
FEMALES / 100 MALES
45.9
MEDIAN AGE
2.3
AVG FAMILY SIZE
2.0
AVG HOUSEHOLD SIZE
98
LABOR FORCE [ PEOPLE ]
37.4%
PERCENT IN LABOR FORCE
Hortonville Zip Codes
Hortonville Area Codes
Income in Hortonville
Income Overview in Hortonville
Per Capita Income in Hortonville is $39,955, while median incomes of families and households are $103,135 and $96,250 respectively.
| Characteristic | Number | Measure |
| Per Capita Income | 282 | $39,955 |
| Median Family Income | 94 | $103,135 |
| Mean Family Income | 94 | $91,607 |
| Median Household Income | 140 | $96,250 |
| Mean Household Income | 140 | $82,529 |
| Income Deficit | 94 | $0 |
| Wage / Income Gap (%) | 282 | 0.00% |
| Wage / Income Gap ($) | 282 | 100.00¢ per $1 |
| Gini / Inequality Index | 282 | 0.25 |
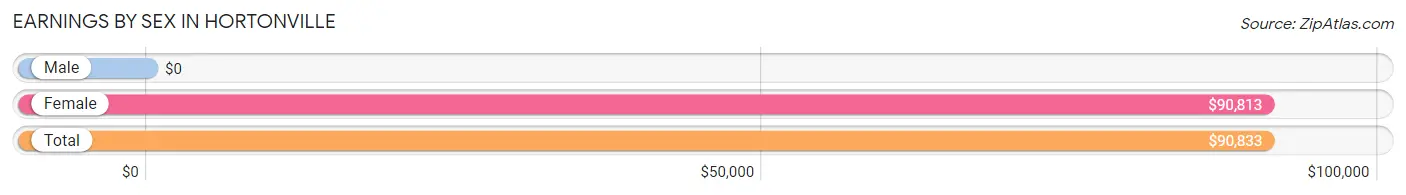
Earnings by Sex in Hortonville
| Sex | Number | Average Earnings |
| Male | 13 (13.3%) | $0 |
| Female | 85 (86.7%) | $90,813 |
| Total | 98 (100.0%) | $90,833 |
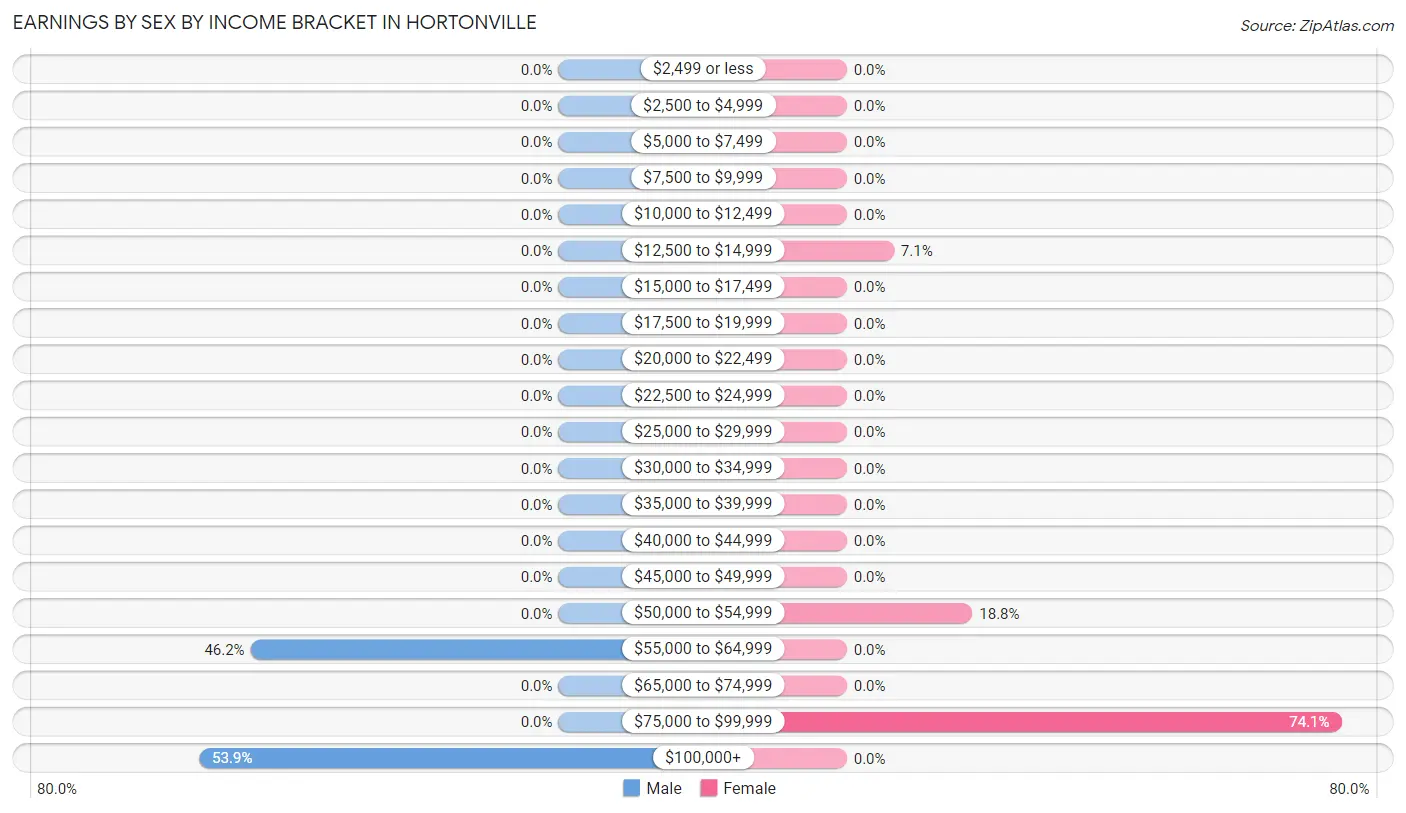
Earnings by Sex by Income Bracket in Hortonville
The most common earnings brackets in Hortonville are $100,000+ for men (7 | 53.8%) and $75,000 to $99,999 for women (63 | 74.1%).
| Income | Male | Female |
| $2,499 or less | 0 (0.0%) | 0 (0.0%) |
| $2,500 to $4,999 | 0 (0.0%) | 0 (0.0%) |
| $5,000 to $7,499 | 0 (0.0%) | 0 (0.0%) |
| $7,500 to $9,999 | 0 (0.0%) | 0 (0.0%) |
| $10,000 to $12,499 | 0 (0.0%) | 0 (0.0%) |
| $12,500 to $14,999 | 0 (0.0%) | 6 (7.1%) |
| $15,000 to $17,499 | 0 (0.0%) | 0 (0.0%) |
| $17,500 to $19,999 | 0 (0.0%) | 0 (0.0%) |
| $20,000 to $22,499 | 0 (0.0%) | 0 (0.0%) |
| $22,500 to $24,999 | 0 (0.0%) | 0 (0.0%) |
| $25,000 to $29,999 | 0 (0.0%) | 0 (0.0%) |
| $30,000 to $34,999 | 0 (0.0%) | 0 (0.0%) |
| $35,000 to $39,999 | 0 (0.0%) | 0 (0.0%) |
| $40,000 to $44,999 | 0 (0.0%) | 0 (0.0%) |
| $45,000 to $49,999 | 0 (0.0%) | 0 (0.0%) |
| $50,000 to $54,999 | 0 (0.0%) | 16 (18.8%) |
| $55,000 to $64,999 | 6 (46.2%) | 0 (0.0%) |
| $65,000 to $74,999 | 0 (0.0%) | 0 (0.0%) |
| $75,000 to $99,999 | 0 (0.0%) | 63 (74.1%) |
| $100,000+ | 7 (53.8%) | 0 (0.0%) |
| Total | 13 (100.0%) | 85 (100.0%) |
Earnings by Sex by Educational Attainment in Hortonville
| Educational Attainment | Male Income | Female Income |
| Less than High School | - | - |
| High School Diploma | - | - |
| College or Associate's Degree | - | - |
| Bachelor's Degree | - | - |
| Graduate Degree | - | - |
| Total | - | - |
Family Income in Hortonville
Family Income Brackets in Hortonville
According to the Hortonville family income data, there are 63 families falling into the $100,000 to $149,999 income range, which is the most common income bracket and makes up 67.0% of all families.
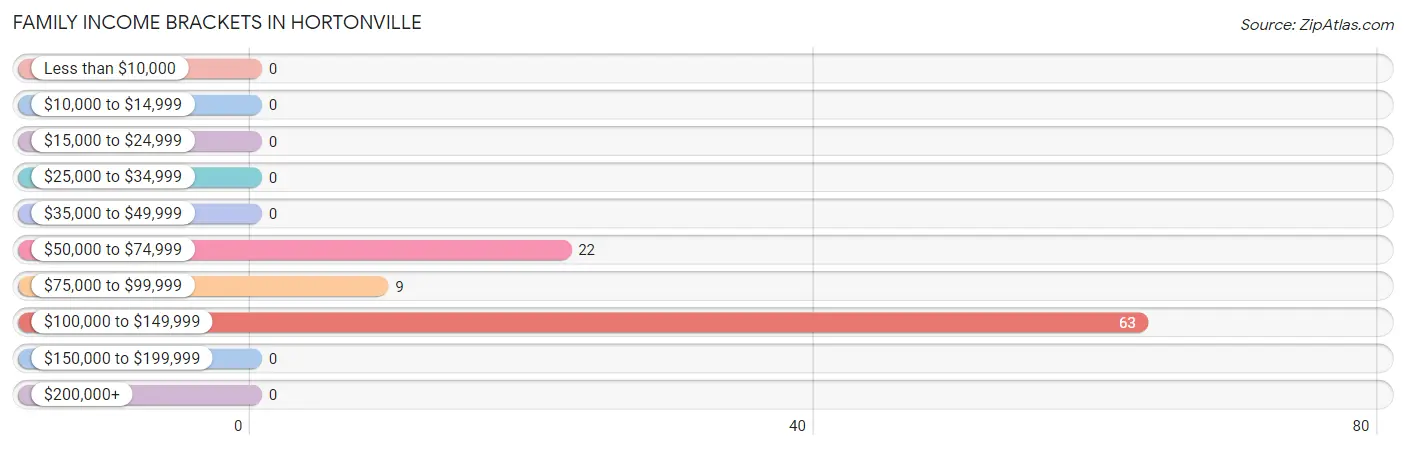
| Income Bracket | # Families | % Families |
| Less than $10,000 | 0 | 0.0% |
| $10,000 to $14,999 | 0 | 0.0% |
| $15,000 to $24,999 | 0 | 0.0% |
| $25,000 to $34,999 | 0 | 0.0% |
| $35,000 to $49,999 | 0 | 0.0% |
| $50,000 to $74,999 | 22 | 23.4% |
| $75,000 to $99,999 | 9 | 9.6% |
| $100,000 to $149,999 | 63 | 67.0% |
| $150,000 to $199,999 | 0 | 0.0% |
| $200,000+ | 0 | 0.0% |
Family Income by Famaliy Size in Hortonville
2-person families (15 | 16.0%) account for the highest median family income in Hortonville with $85,750 per family, while 2-person families (15 | 16.0%) have the highest median income of $42,875 per family member.
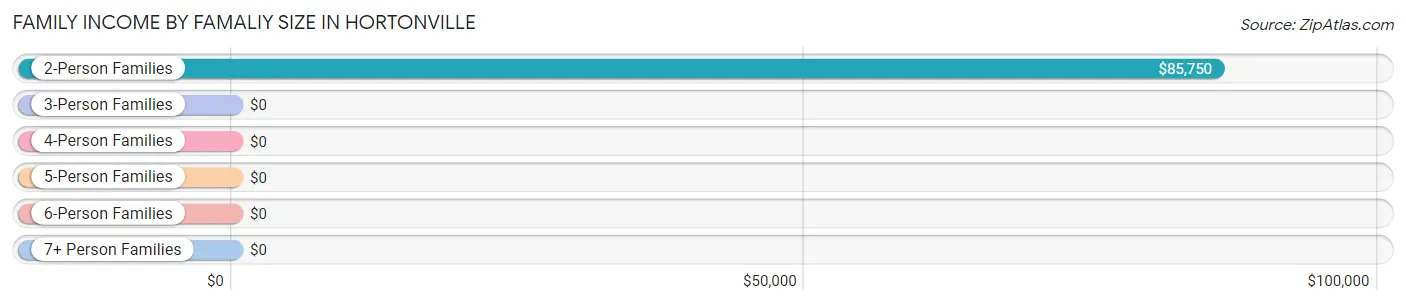
| Income Bracket | # Families | Median Income |
| 2-Person Families | 15 (16.0%) | $85,750 |
| 3-Person Families | 79 (84.0%) | $0 |
| 4-Person Families | 0 (0.0%) | $0 |
| 5-Person Families | 0 (0.0%) | $0 |
| 6-Person Families | 0 (0.0%) | $0 |
| 7+ Person Families | 0 (0.0%) | $0 |
| Total | 94 (100.0%) | $103,135 |
Family Income by Number of Earners in Hortonville
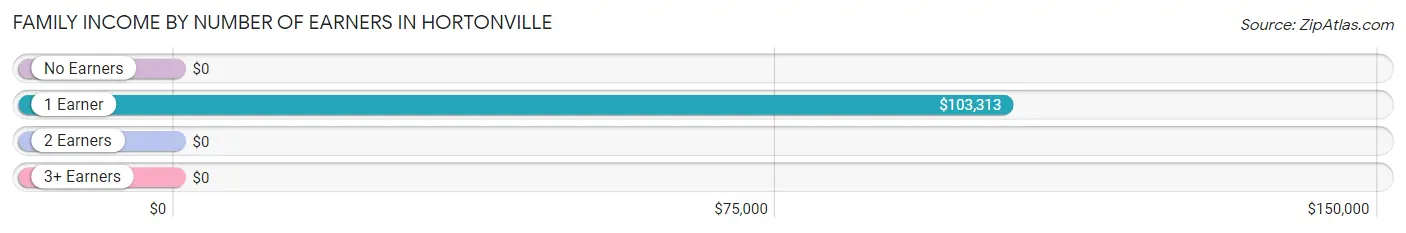
| Number of Earners | # Families | Median Income |
| No Earners | 9 (9.6%) | $0 |
| 1 Earner | 85 (90.4%) | $103,313 |
| 2 Earners | 0 (0.0%) | $0 |
| 3+ Earners | 0 (0.0%) | $0 |
| Total | 94 (100.0%) | $103,135 |
Household Income in Hortonville
Household Income Brackets in Hortonville
With 63 households falling in the category, the $100,000 to $149,999 income range is the most frequent in Hortonville, accounting for 45.0% of all households.
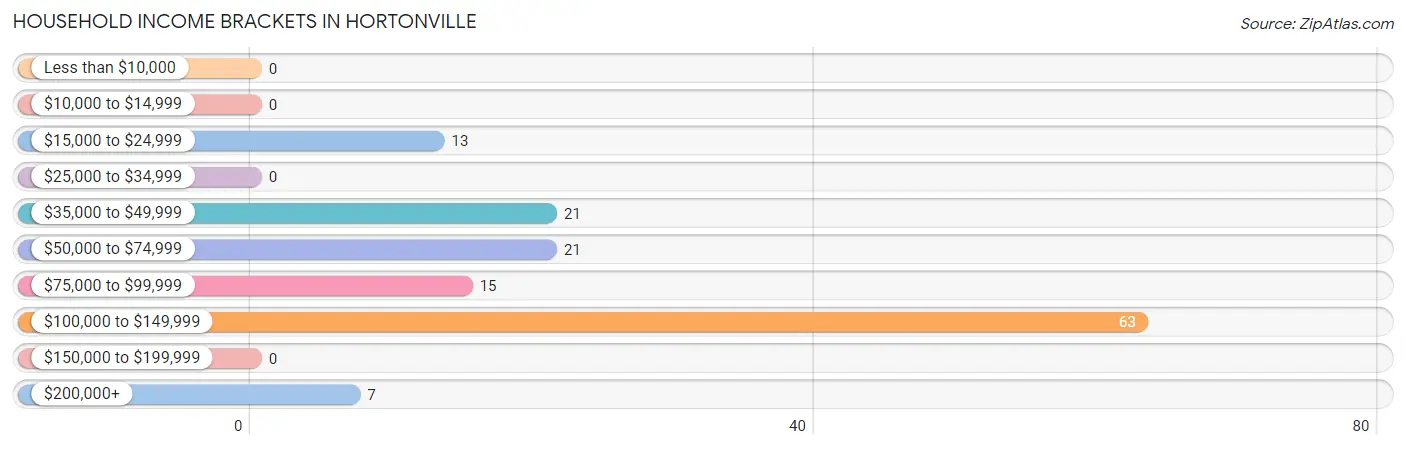
| Income Bracket | # Households | % Households |
| Less than $10,000 | 0 | 0.0% |
| $10,000 to $14,999 | 0 | 0.0% |
| $15,000 to $24,999 | 13 | 9.3% |
| $25,000 to $34,999 | 0 | 0.0% |
| $35,000 to $49,999 | 21 | 15.0% |
| $50,000 to $74,999 | 21 | 15.0% |
| $75,000 to $99,999 | 15 | 10.7% |
| $100,000 to $149,999 | 63 | 45.0% |
| $150,000 to $199,999 | 0 | 0.0% |
| $200,000+ | 7 | 5.0% |
Household Income by Householder Age in Hortonville
The median household income in Hortonville is $96,250, with the highest median household income of $103,313 found in the 25 to 44 years age bracket for the primary householder. A total of 85 households (60.7%) fall into this category.
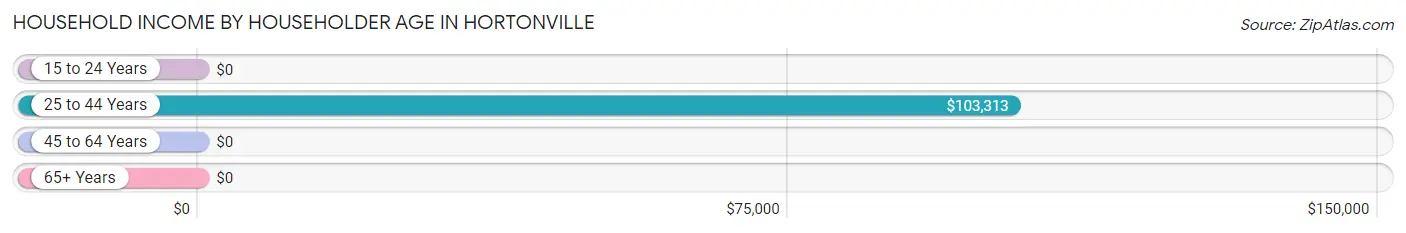
| Income Bracket | # Households | Median Income |
| 15 to 24 Years | 0 (0.0%) | $0 |
| 25 to 44 Years | 85 (60.7%) | $103,313 |
| 45 to 64 Years | 28 (20.0%) | $0 |
| 65+ Years | 27 (19.3%) | $0 |
| Total | 140 (100.0%) | $96,250 |
Poverty in Hortonville
Income Below Poverty by Sex and Age in Hortonville
With 8.0% poverty level for males and 5.7% for females among the residents of Hortonville, 45 to 54 year old males and 25 to 34 year old females are the most vulnerable to poverty, with 10 males (32.3%) and 6 females (100.0%) in their respective age groups living below the poverty level.
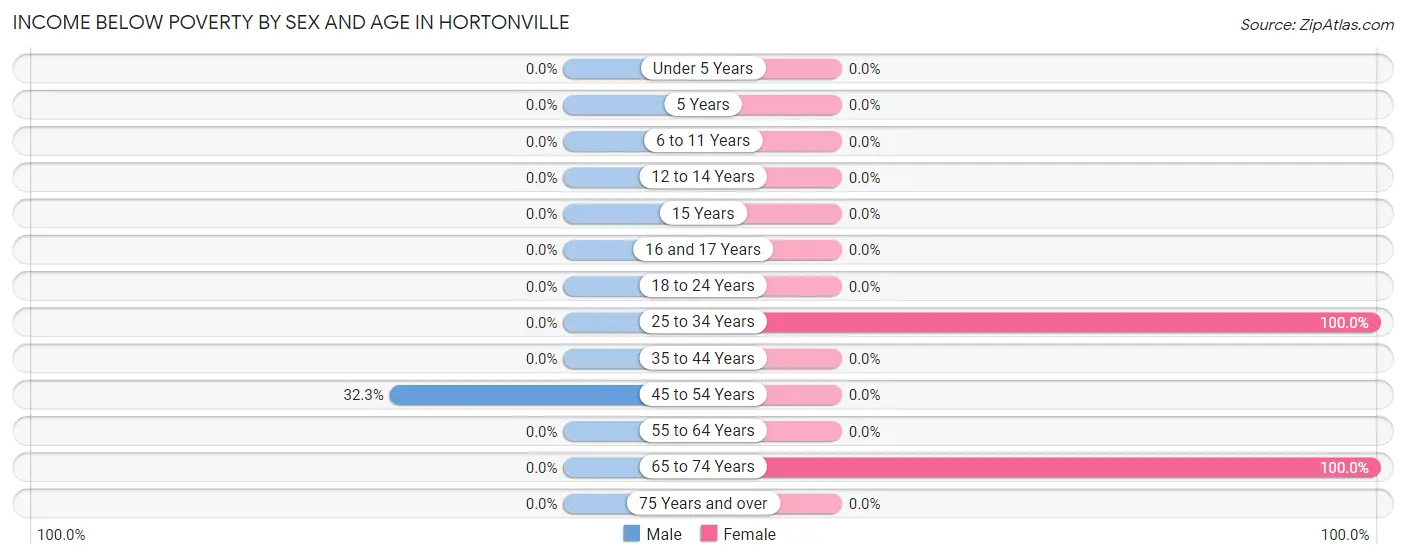
| Age Bracket | Male | Female |
| Under 5 Years | 0 (0.0%) | 0 (0.0%) |
| 5 Years | 0 (0.0%) | 0 (0.0%) |
| 6 to 11 Years | 0 (0.0%) | 0 (0.0%) |
| 12 to 14 Years | 0 (0.0%) | 0 (0.0%) |
| 15 Years | 0 (0.0%) | 0 (0.0%) |
| 16 and 17 Years | 0 (0.0%) | 0 (0.0%) |
| 18 to 24 Years | 0 (0.0%) | 0 (0.0%) |
| 25 to 34 Years | 0 (0.0%) | 6 (100.0%) |
| 35 to 44 Years | 0 (0.0%) | 0 (0.0%) |
| 45 to 54 Years | 10 (32.3%) | 0 (0.0%) |
| 55 to 64 Years | 0 (0.0%) | 0 (0.0%) |
| 65 to 74 Years | 0 (0.0%) | 3 (100.0%) |
| 75 Years and over | 0 (0.0%) | 0 (0.0%) |
| Total | 10 (8.0%) | 9 (5.7%) |
Income Above Poverty by Sex and Age in Hortonville
According to the poverty statistics in Hortonville, males aged 5 years and females aged 5 years are the age groups that are most secure financially, with 100.0% of males and 100.0% of females in these age groups living above the poverty line.
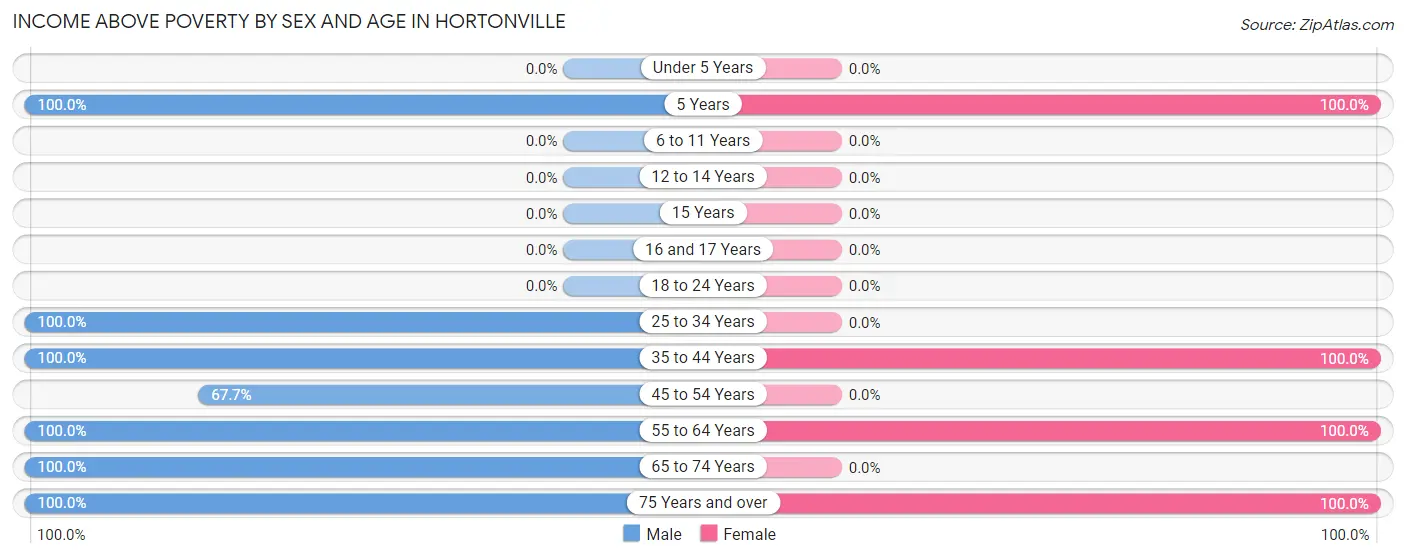
| Age Bracket | Male | Female |
| Under 5 Years | 0 (0.0%) | 0 (0.0%) |
| 5 Years | 4 (100.0%) | 16 (100.0%) |
| 6 to 11 Years | 0 (0.0%) | 0 (0.0%) |
| 12 to 14 Years | 0 (0.0%) | 0 (0.0%) |
| 15 Years | 0 (0.0%) | 0 (0.0%) |
| 16 and 17 Years | 0 (0.0%) | 0 (0.0%) |
| 18 to 24 Years | 0 (0.0%) | 0 (0.0%) |
| 25 to 34 Years | 6 (100.0%) | 0 (0.0%) |
| 35 to 44 Years | 21 (100.0%) | 79 (100.0%) |
| 45 to 54 Years | 21 (67.7%) | 0 (0.0%) |
| 55 to 64 Years | 7 (100.0%) | 35 (100.0%) |
| 65 to 74 Years | 45 (100.0%) | 0 (0.0%) |
| 75 Years and over | 11 (100.0%) | 18 (100.0%) |
| Total | 115 (92.0%) | 148 (94.3%) |
Income Below Poverty Among Married-Couple Families in Hortonville
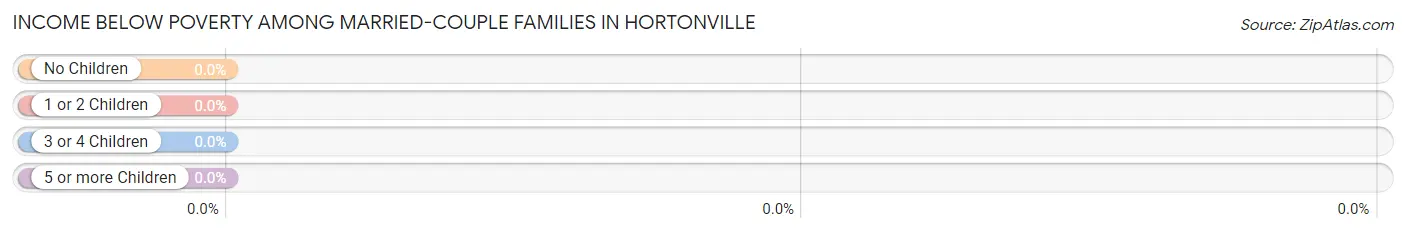
| Children | Above Poverty | Below Poverty |
| No Children | 5 (100.0%) | 0 (0.0%) |
| 1 or 2 Children | 16 (100.0%) | 0 (0.0%) |
| 3 or 4 Children | 0 (0.0%) | 0 (0.0%) |
| 5 or more Children | 0 (0.0%) | 0 (0.0%) |
| Total | 21 (100.0%) | 0 (0.0%) |
Income Below Poverty Among Single-Parent Households in Hortonville
| Children | Single Father | Single Mother |
| No Children | 0 (0.0%) | 0 (0.0%) |
| 1 or 2 Children | 0 (0.0%) | 0 (0.0%) |
| 3 or 4 Children | 0 (0.0%) | 0 (0.0%) |
| 5 or more Children | 0 (0.0%) | 0 (0.0%) |
| Total | 0 (0.0%) | 0 (0.0%) |
Income Below Poverty Among Married-Couple vs Single-Parent Households in Hortonville
| Children | Married-Couple Families | Single-Parent Households |
| No Children | 0 (0.0%) | 0 (0.0%) |
| 1 or 2 Children | 0 (0.0%) | 0 (0.0%) |
| 3 or 4 Children | 0 (0.0%) | 0 (0.0%) |
| 5 or more Children | 0 (0.0%) | 0 (0.0%) |
| Total | 0 (0.0%) | 0 (0.0%) |
Race in Hortonville
The most populous races in Hortonville are White / Caucasian (274 | 97.2%), and Two or more Races (8 | 2.8%).
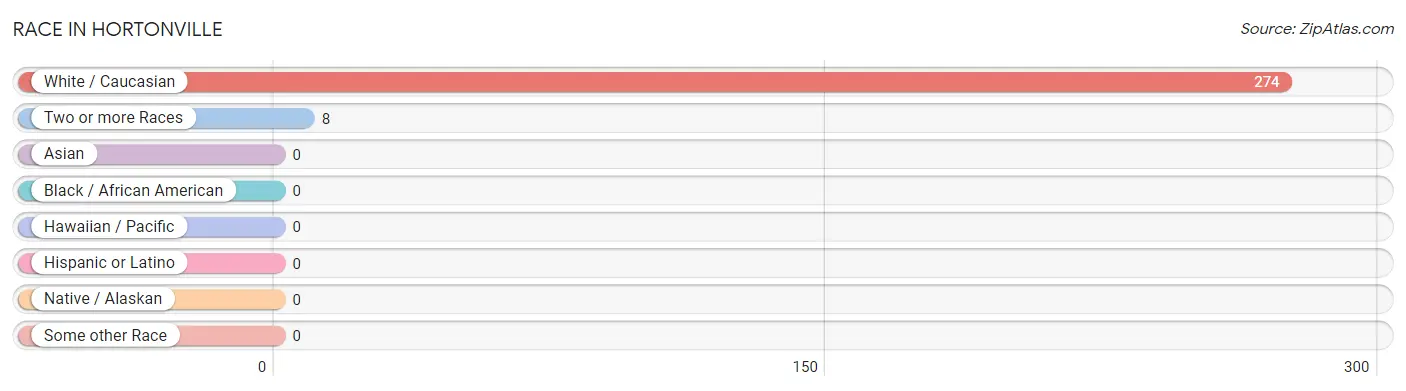
| Race | # Population | % Population |
| Asian | 0 | 0.0% |
| Black / African American | 0 | 0.0% |
| Hawaiian / Pacific | 0 | 0.0% |
| Hispanic or Latino | 0 | 0.0% |
| Native / Alaskan | 0 | 0.0% |
| White / Caucasian | 274 | 97.2% |
| Two or more Races | 8 | 2.8% |
| Some other Race | 0 | 0.0% |
| Total | 282 | 100.0% |
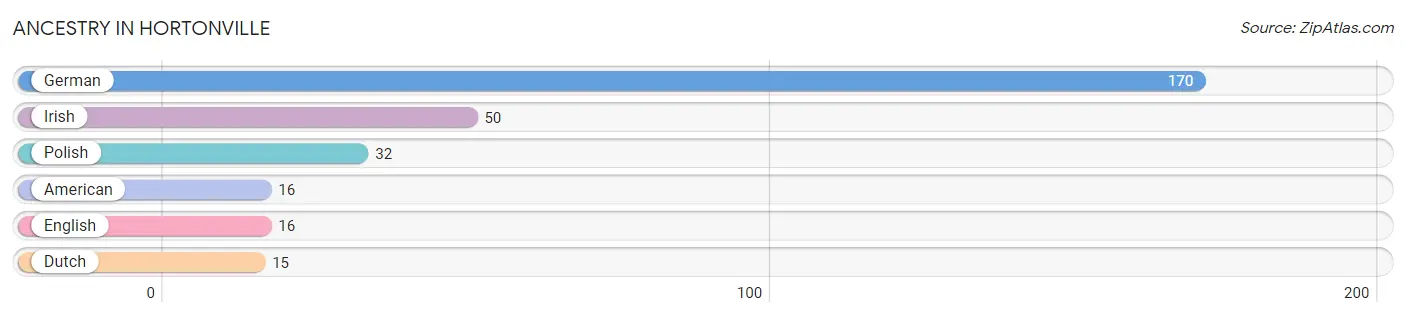
Ancestry in Hortonville
The most populous ancestries reported in Hortonville are German (170 | 60.3%), Irish (50 | 17.7%), Polish (32 | 11.4%), American (16 | 5.7%), and English (16 | 5.7%), together accounting for 100.7% of all Hortonville residents.
| Ancestry | # Population | % Population |
| American | 16 | 5.7% |
| Dutch | 15 | 5.3% |
| English | 16 | 5.7% |
| German | 170 | 60.3% |
| Irish | 50 | 17.7% |
| Polish | 32 | 11.4% | View All 6 Rows |
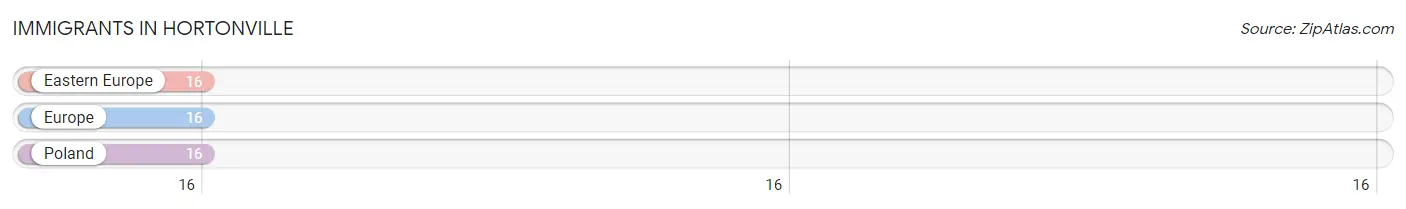
Immigrants in Hortonville
The most numerous immigrant groups reported in Hortonville came from Eastern Europe (16 | 5.7%), Europe (16 | 5.7%), and Poland (16 | 5.7%), together accounting for 17.0% of all Hortonville residents.
| Immigration Origin | # Population | % Population |
| Eastern Europe | 16 | 5.7% |
| Europe | 16 | 5.7% |
| Poland | 16 | 5.7% | View All 3 Rows |
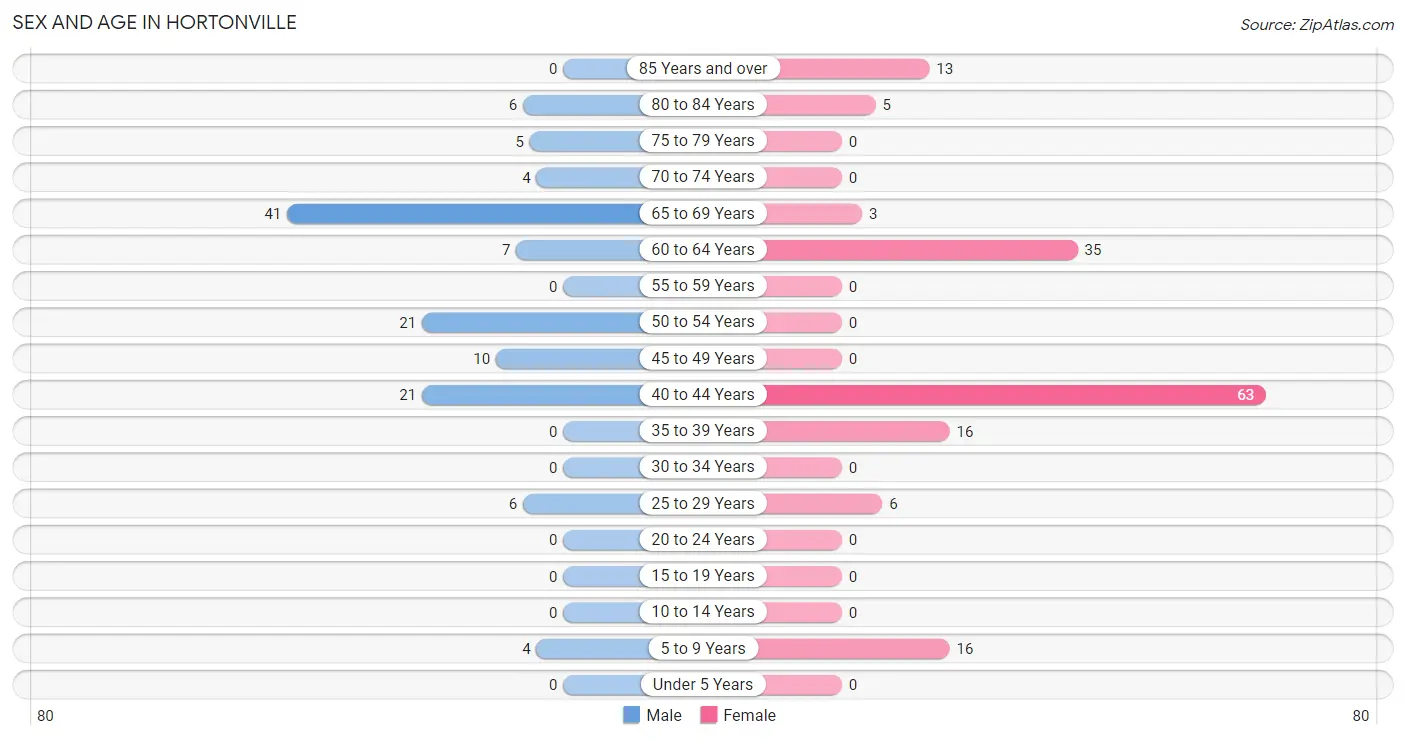
Sex and Age in Hortonville
Sex and Age in Hortonville
The most populous age groups in Hortonville are 65 to 69 Years (41 | 32.8%) for men and 40 to 44 Years (63 | 40.1%) for women.
| Age Bracket | Male | Female |
| Under 5 Years | 0 (0.0%) | 0 (0.0%) |
| 5 to 9 Years | 4 (3.2%) | 16 (10.2%) |
| 10 to 14 Years | 0 (0.0%) | 0 (0.0%) |
| 15 to 19 Years | 0 (0.0%) | 0 (0.0%) |
| 20 to 24 Years | 0 (0.0%) | 0 (0.0%) |
| 25 to 29 Years | 6 (4.8%) | 6 (3.8%) |
| 30 to 34 Years | 0 (0.0%) | 0 (0.0%) |
| 35 to 39 Years | 0 (0.0%) | 16 (10.2%) |
| 40 to 44 Years | 21 (16.8%) | 63 (40.1%) |
| 45 to 49 Years | 10 (8.0%) | 0 (0.0%) |
| 50 to 54 Years | 21 (16.8%) | 0 (0.0%) |
| 55 to 59 Years | 0 (0.0%) | 0 (0.0%) |
| 60 to 64 Years | 7 (5.6%) | 35 (22.3%) |
| 65 to 69 Years | 41 (32.8%) | 3 (1.9%) |
| 70 to 74 Years | 4 (3.2%) | 0 (0.0%) |
| 75 to 79 Years | 5 (4.0%) | 0 (0.0%) |
| 80 to 84 Years | 6 (4.8%) | 5 (3.2%) |
| 85 Years and over | 0 (0.0%) | 13 (8.3%) |
| Total | 125 (100.0%) | 157 (100.0%) |
Families and Households in Hortonville
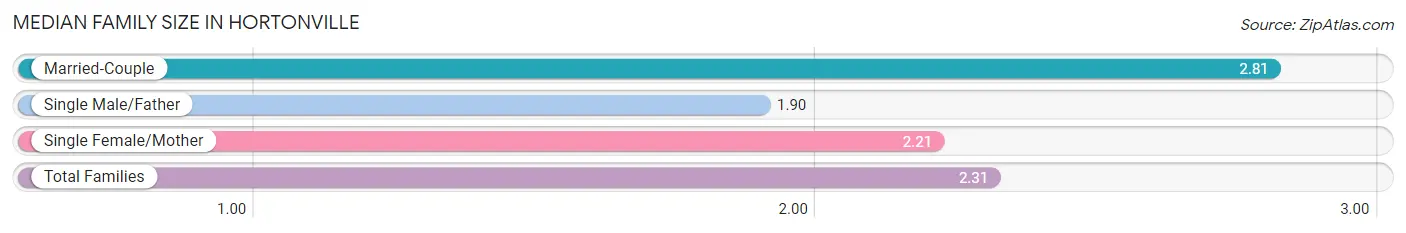
Median Family Size in Hortonville
The median family size in Hortonville is 2.31 persons per family, with married-couple families (21 | 22.3%) accounting for the largest median family size of 2.81 persons per family. On the other hand, single male/father families (10 | 10.6%) represent the smallest median family size with 1.90 persons per family.
| Family Type | # Families | Family Size |
| Married-Couple | 21 (22.3%) | 2.81 |
| Single Male/Father | 10 (10.6%) | 1.90 |
| Single Female/Mother | 63 (67.0%) | 2.21 |
| Total Families | 94 (100.0%) | 2.31 |
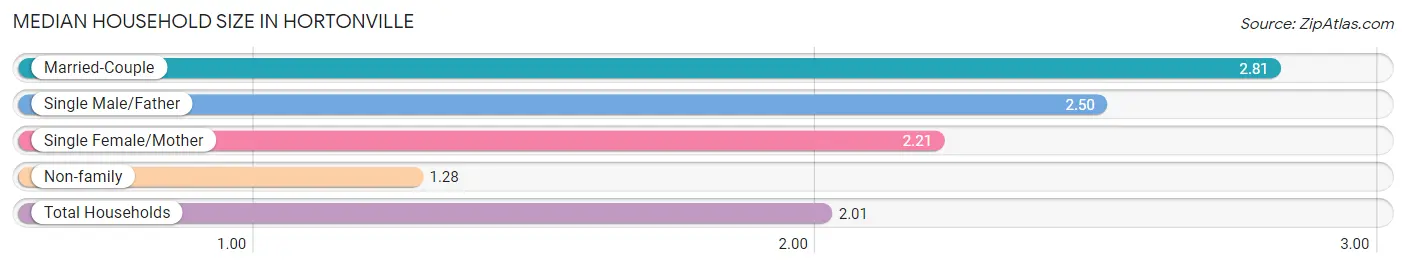
Median Household Size in Hortonville
The median household size in Hortonville is 2.01 persons per household, with married-couple households (21 | 15.0%) accounting for the largest median household size of 2.81 persons per household. non-family households (46 | 32.9%) represent the smallest median household size with 1.28 persons per household.
| Household Type | # Households | Household Size |
| Married-Couple | 21 (15.0%) | 2.81 |
| Single Male/Father | 10 (7.1%) | 2.50 |
| Single Female/Mother | 63 (45.0%) | 2.21 |
| Non-family | 46 (32.9%) | 1.28 |
| Total Households | 140 (100.0%) | 2.01 |
Household Size by Marriage Status in Hortonville
Out of a total of 140 households in Hortonville, 94 (67.1%) are family households, while 46 (32.9%) are nonfamily households. The most numerous type of family households are 3-person households, comprising 85, and the most common type of nonfamily households are 1-person households, comprising 39.
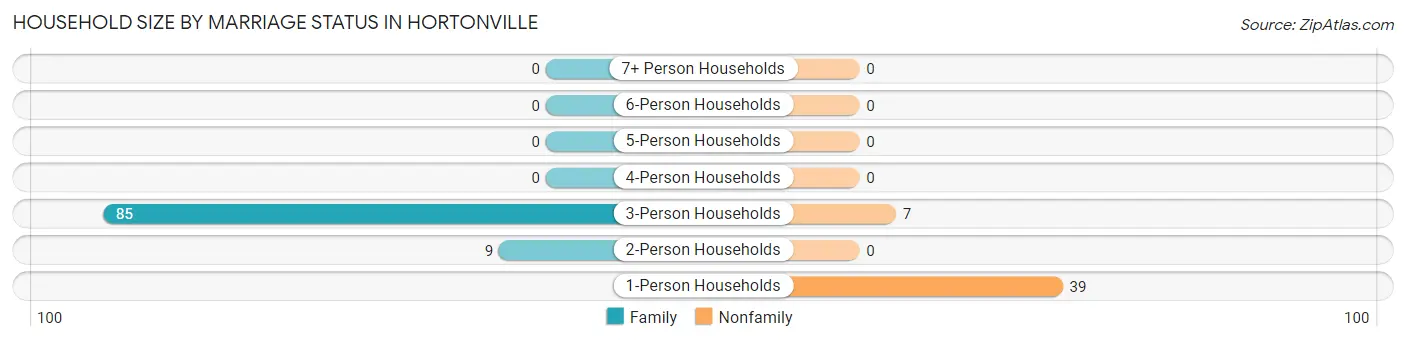
| Household Size | Family Households | Nonfamily Households |
| 1-Person Households | - | 39 (27.9%) |
| 2-Person Households | 9 (6.4%) | 0 (0.0%) |
| 3-Person Households | 85 (60.7%) | 7 (5.0%) |
| 4-Person Households | 0 (0.0%) | 0 (0.0%) |
| 5-Person Households | 0 (0.0%) | 0 (0.0%) |
| 6-Person Households | 0 (0.0%) | 0 (0.0%) |
| 7+ Person Households | 0 (0.0%) | 0 (0.0%) |
| Total | 94 (67.1%) | 46 (32.9%) |
Female Fertility in Hortonville
Fertility by Age in Hortonville
| Age Bracket | Women with Births | Births / 1,000 Women |
| 15 to 19 years | 0 (0.0%) | 0.0 |
| 20 to 34 years | 0 (0.0%) | 0.0 |
| 35 to 50 years | 0 (0.0%) | 0.0 |
| Total | 0 (0.0%) | 0.0 |
Fertility by Age by Marriage Status in Hortonville
| Age Bracket | Married | Unmarried |
| 15 to 19 years | 0 (0.0%) | 0 (0.0%) |
| 20 to 34 years | 0 (0.0%) | 0 (0.0%) |
| 35 to 50 years | 0 (0.0%) | 0 (0.0%) |
| Total | 0 (0.0%) | 0 (0.0%) |
Fertility by Education in Hortonville

| Educational Attainment | Women with Births | Births / 1,000 Women |
| Less than High School | 0 (0.0%) | 0.0 |
| High School Diploma | 0 (0.0%) | 0.0 |
| College or Associate's Degree | 0 (0.0%) | 0.0 |
| Bachelor's Degree | 0 (0.0%) | 0.0 |
| Graduate Degree | 0 (0.0%) | 0.0 |
| Total | 0 (0.0%) | 0.0 |
Fertility by Education by Marriage Status in Hortonville
| Educational Attainment | Married | Unmarried |
| Less than High School | 0 (0.0%) | 0 (0.0%) |
| High School Diploma | 0 (0.0%) | 0 (0.0%) |
| College or Associate's Degree | 0 (0.0%) | 0 (0.0%) |
| Bachelor's Degree | 0 (0.0%) | 0 (0.0%) |
| Graduate Degree | 0 (0.0%) | 0 (0.0%) |
| Total | 0 (0.0%) | 0 (0.0%) |
Employment Characteristics in Hortonville
Employment by Class of Employer in Hortonville
Among the 98 employed individuals in Hortonville, local government employees (63 | 64.3%), and private company employees (35 | 35.7%) make up the most common classes of employment.
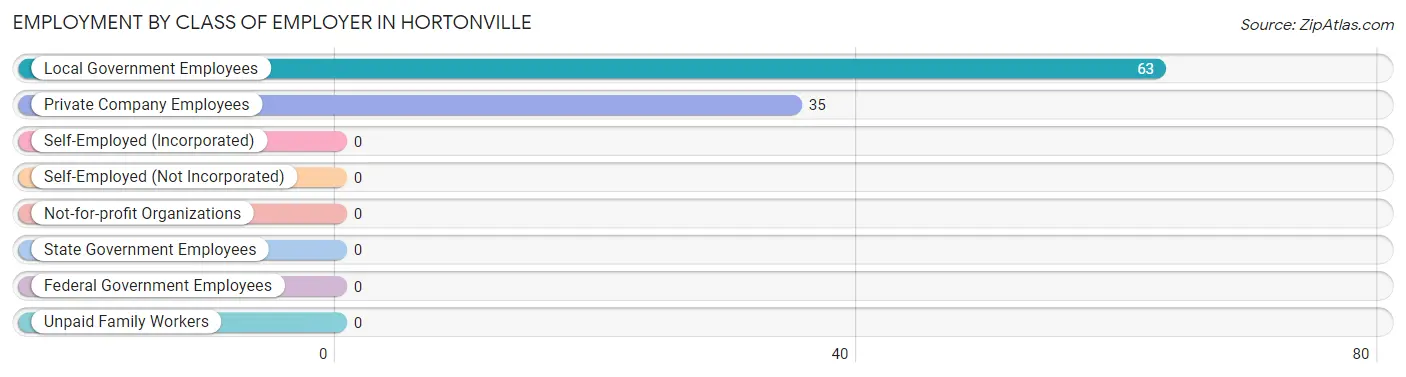
| Employer Class | # Employees | % Employees |
| Private Company Employees | 35 | 35.7% |
| Self-Employed (Incorporated) | 0 | 0.0% |
| Self-Employed (Not Incorporated) | 0 | 0.0% |
| Not-for-profit Organizations | 0 | 0.0% |
| Local Government Employees | 63 | 64.3% |
| State Government Employees | 0 | 0.0% |
| Federal Government Employees | 0 | 0.0% |
| Unpaid Family Workers | 0 | 0.0% |
| Total | 98 | 100.0% |
Employment Status by Age in Hortonville
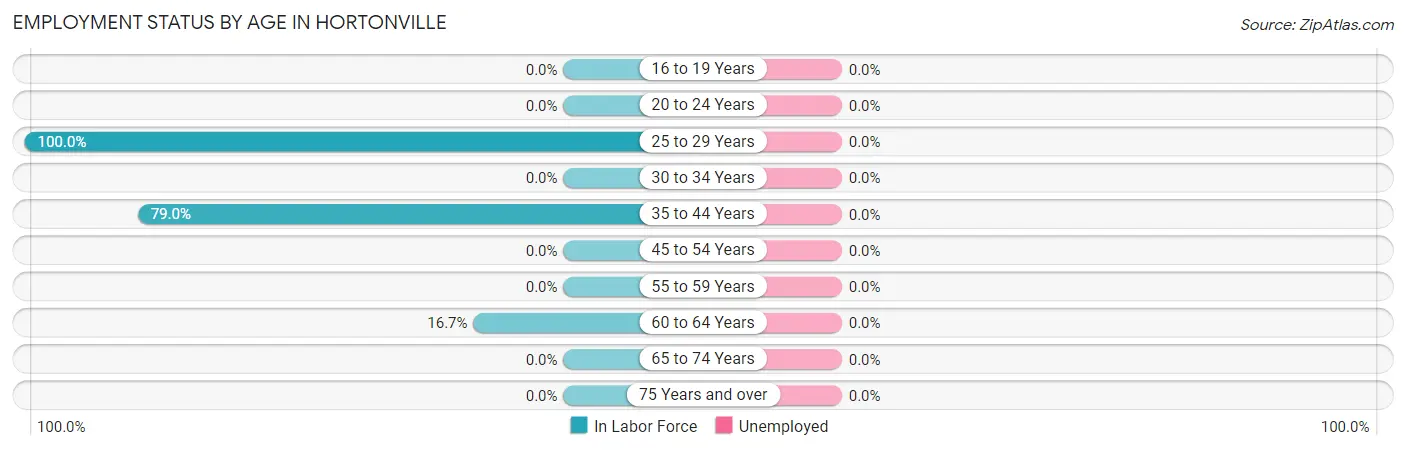
| Age Bracket | In Labor Force | Unemployed |
| 16 to 19 Years | 0 (0.0%) | 0 (0.0%) |
| 20 to 24 Years | 0 (0.0%) | 0 (0.0%) |
| 25 to 29 Years | 12 (100.0%) | 0 (0.0%) |
| 30 to 34 Years | 0 (0.0%) | 0 (0.0%) |
| 35 to 44 Years | 79 (79.0%) | 0 (0.0%) |
| 45 to 54 Years | 0 (0.0%) | 0 (0.0%) |
| 55 to 59 Years | 0 (0.0%) | 0 (0.0%) |
| 60 to 64 Years | 7 (16.7%) | 0 (0.0%) |
| 65 to 74 Years | 0 (0.0%) | 0 (0.0%) |
| 75 Years and over | 0 (0.0%) | 0 (0.0%) |
| Total | 98 (37.4%) | 0 (0.0%) |
Employment Status by Educational Attainment in Hortonville
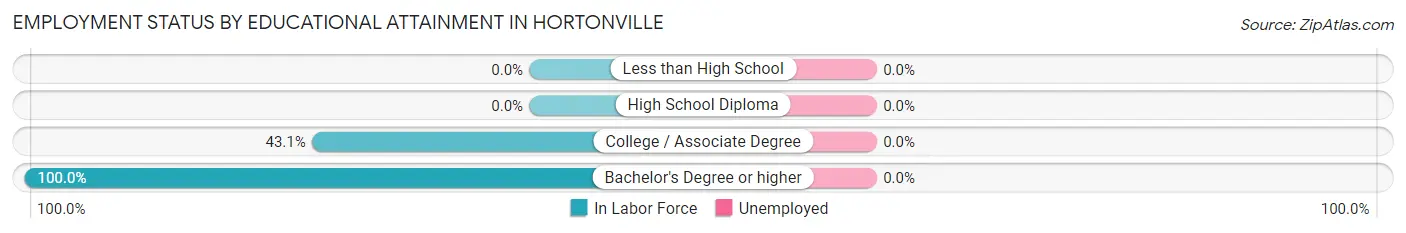
| Educational Attainment | In Labor Force | Unemployed |
| Less than High School | 0 (0.0%) | 0 (0.0%) |
| High School Diploma | 0 (0.0%) | 0 (0.0%) |
| College / Associate Degree | 28 (43.1%) | 0 (0.0%) |
| Bachelor's Degree or higher | 70 (100.0%) | 0 (0.0%) |
| Total | 98 (53.0%) | 0 (0.0%) |
Employment Occupations by Sex in Hortonville
Management, Business, Science and Arts Occupations
The most common Management, Business, Science and Arts occupations in Hortonville are Community & Social Service (63 | 64.3%), Education Instruction & Library (63 | 64.3%), Health Diagnosing & Treating (16 | 16.3%), and Business & Financial (7 | 7.1%).
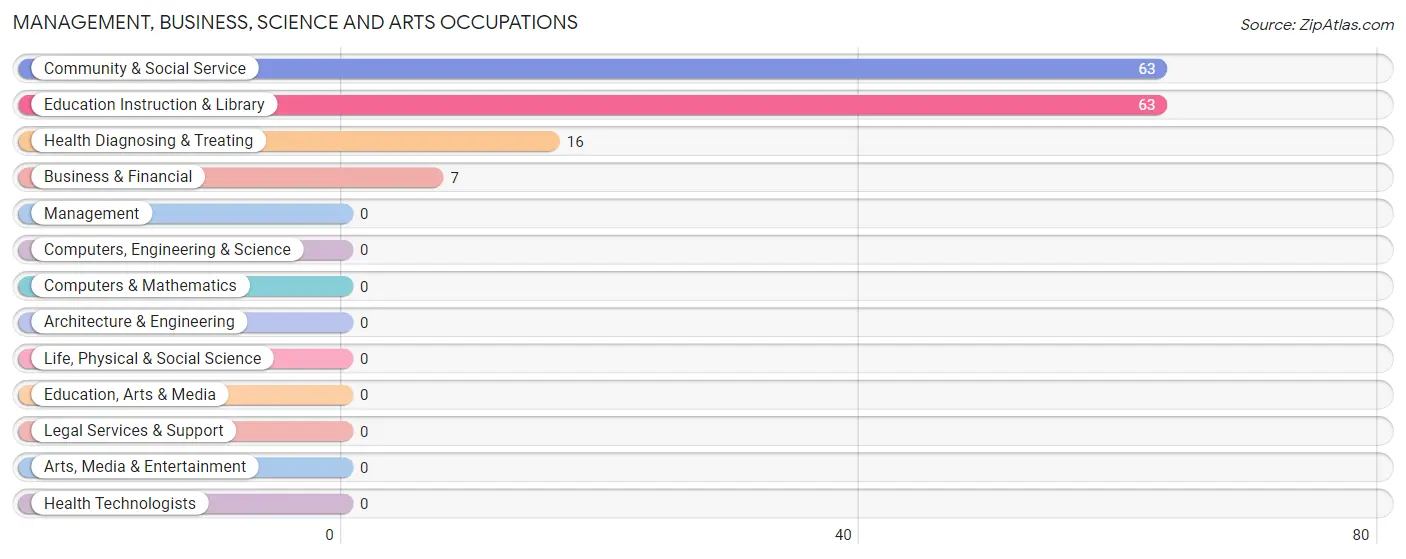
Management, Business, Science and Arts Occupations by Sex
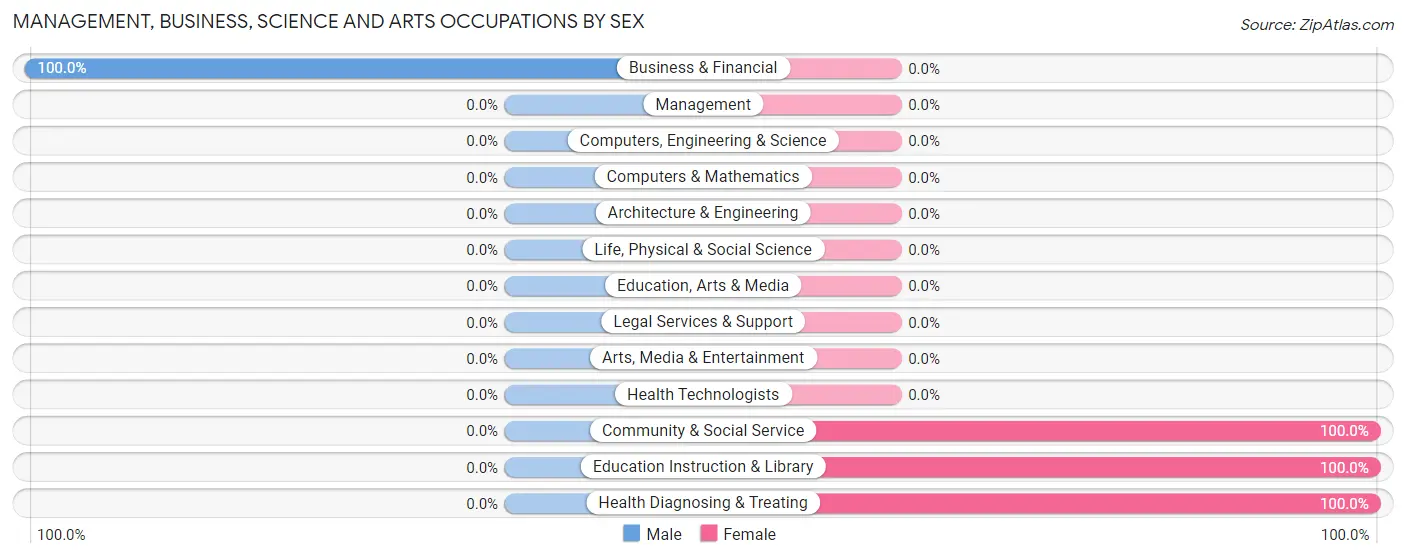
| Occupation | Male | Female |
| Management | 0 (0.0%) | 0 (0.0%) |
| Business & Financial | 7 (100.0%) | 0 (0.0%) |
| Computers, Engineering & Science | 0 (0.0%) | 0 (0.0%) |
| Computers & Mathematics | 0 (0.0%) | 0 (0.0%) |
| Architecture & Engineering | 0 (0.0%) | 0 (0.0%) |
| Life, Physical & Social Science | 0 (0.0%) | 0 (0.0%) |
| Community & Social Service | 0 (0.0%) | 63 (100.0%) |
| Education, Arts & Media | 0 (0.0%) | 0 (0.0%) |
| Legal Services & Support | 0 (0.0%) | 0 (0.0%) |
| Education Instruction & Library | 0 (0.0%) | 63 (100.0%) |
| Arts, Media & Entertainment | 0 (0.0%) | 0 (0.0%) |
| Health Diagnosing & Treating | 0 (0.0%) | 16 (100.0%) |
| Health Technologists | 0 (0.0%) | 0 (0.0%) |
| Total (Category) | 7 (8.1%) | 79 (91.9%) |
| Total (Overall) | 13 (13.3%) | 85 (86.7%) |
Services Occupations
Services Occupations by Sex
| Occupation | Male | Female |
| Healthcare Support | 0 (0.0%) | 0 (0.0%) |
| Security & Protection | 0 (0.0%) | 0 (0.0%) |
| Firefighting & Prevention | 0 (0.0%) | 0 (0.0%) |
| Law Enforcement | 0 (0.0%) | 0 (0.0%) |
| Food Preparation & Serving | 0 (0.0%) | 0 (0.0%) |
| Cleaning & Maintenance | 0 (0.0%) | 0 (0.0%) |
| Personal Care & Service | 0 (0.0%) | 0 (0.0%) |
| Total (Category) | 0 (0.0%) | 0 (0.0%) |
| Total (Overall) | 13 (13.3%) | 85 (86.7%) |
Sales and Office Occupations
The most common Sales and Office occupations in Hortonville are , and Office & Administration (6 | 6.1%).
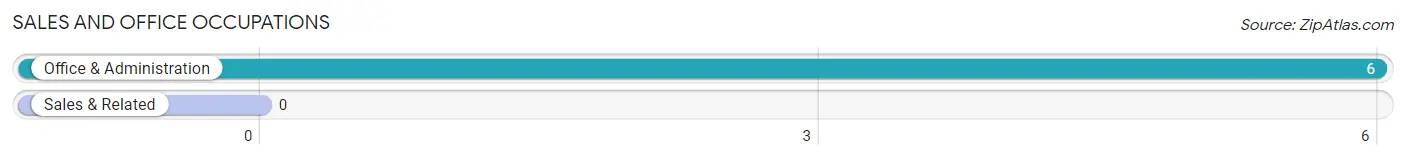
Sales and Office Occupations by Sex
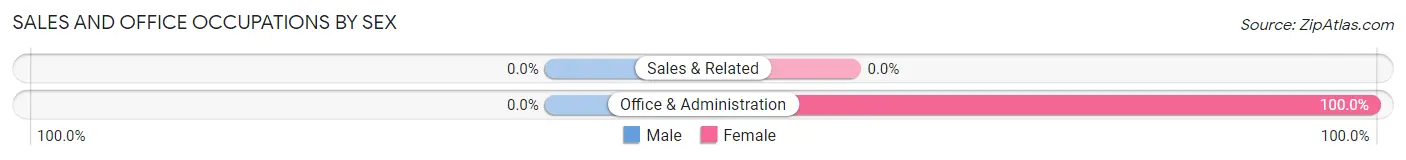
| Occupation | Male | Female |
| Sales & Related | 0 (0.0%) | 0 (0.0%) |
| Office & Administration | 0 (0.0%) | 6 (100.0%) |
| Total (Category) | 0 (0.0%) | 6 (100.0%) |
| Total (Overall) | 13 (13.3%) | 85 (86.7%) |
Natural Resources, Construction and Maintenance Occupations
The most common Natural Resources, Construction and Maintenance occupations in Hortonville are , and Construction & Extraction (6 | 6.1%).
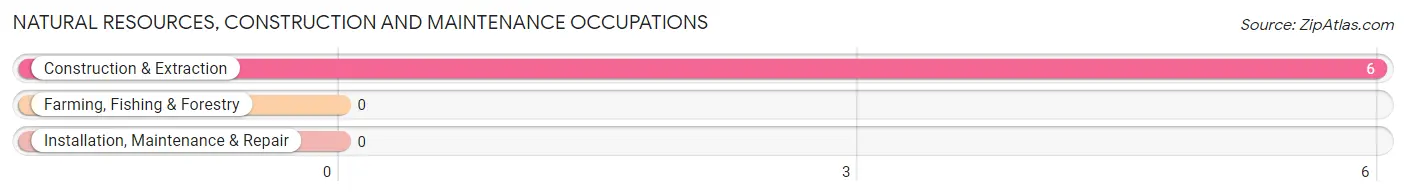
Natural Resources, Construction and Maintenance Occupations by Sex
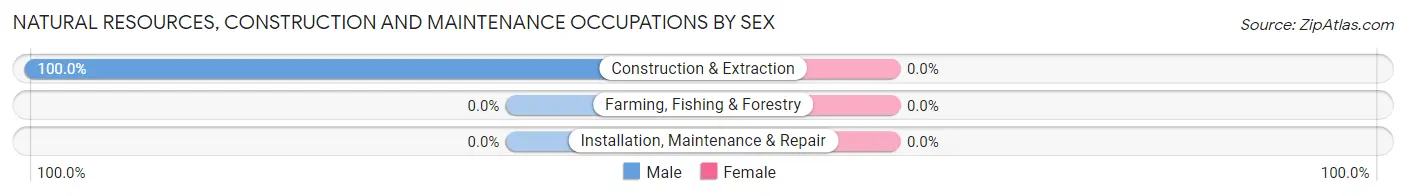
| Occupation | Male | Female |
| Farming, Fishing & Forestry | 0 (0.0%) | 0 (0.0%) |
| Construction & Extraction | 6 (100.0%) | 0 (0.0%) |
| Installation, Maintenance & Repair | 0 (0.0%) | 0 (0.0%) |
| Total (Category) | 6 (100.0%) | 0 (0.0%) |
| Total (Overall) | 13 (13.3%) | 85 (86.7%) |
Production, Transportation and Moving Occupations
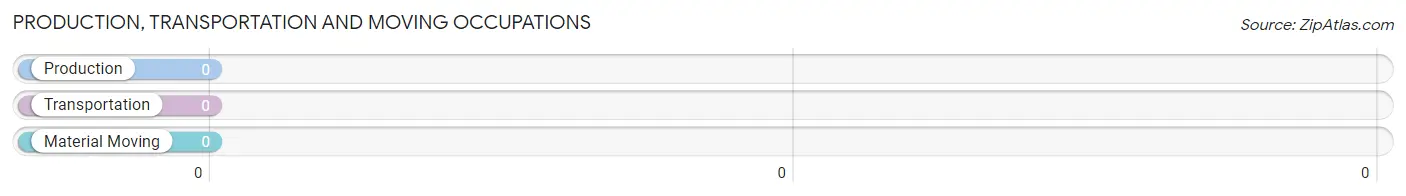
Production, Transportation and Moving Occupations by Sex
| Occupation | Male | Female |
| Production | 0 (0.0%) | 0 (0.0%) |
| Transportation | 0 (0.0%) | 0 (0.0%) |
| Material Moving | 0 (0.0%) | 0 (0.0%) |
| Total (Category) | 0 (0.0%) | 0 (0.0%) |
| Total (Overall) | 13 (13.3%) | 85 (86.7%) |
Employment Industries by Sex in Hortonville
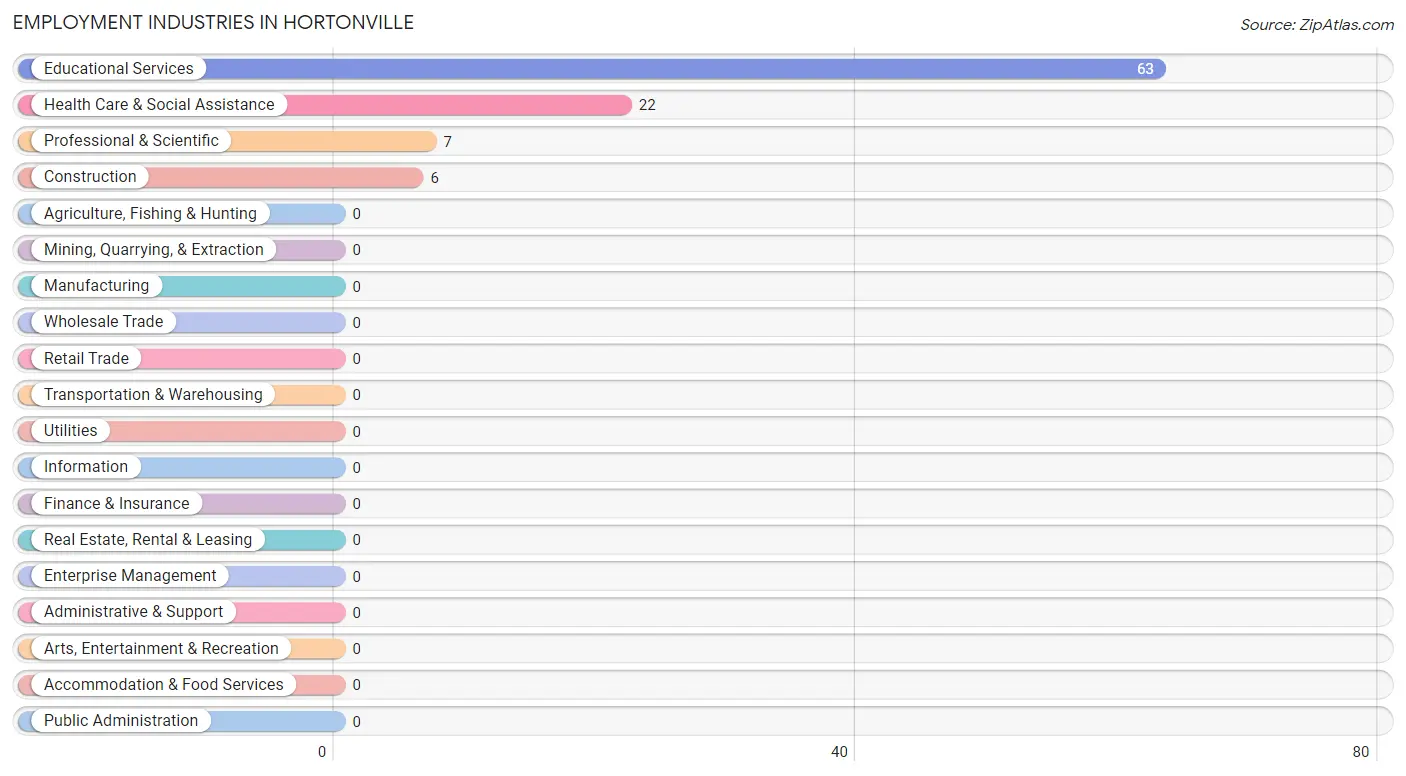
Employment Industries in Hortonville
The major employment industries in Hortonville include Educational Services (63 | 64.3%), Health Care & Social Assistance (22 | 22.5%), Professional & Scientific (7 | 7.1%), and Construction (6 | 6.1%).
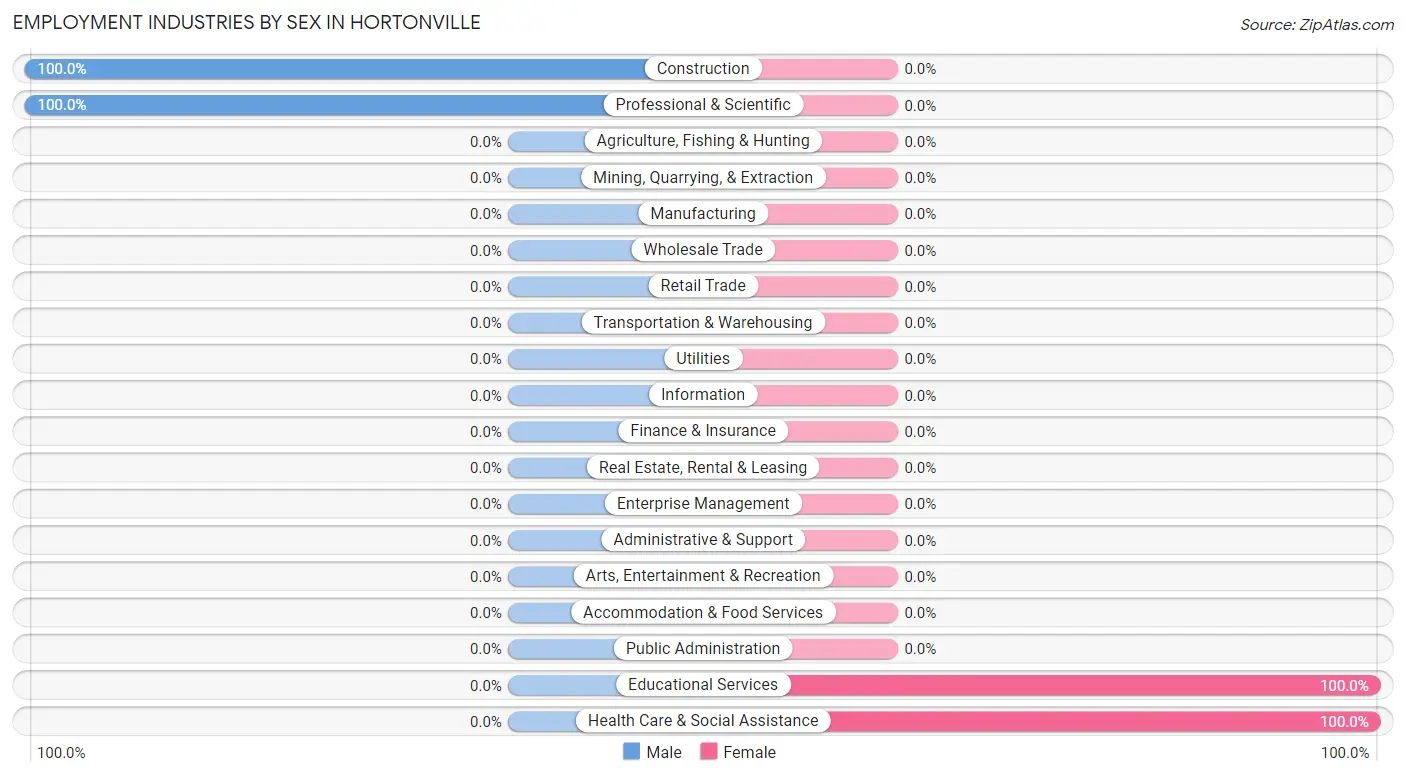
Employment Industries by Sex in Hortonville
The Hortonville industries that see more men than women are Construction (100.0%), and Professional & Scientific (100.0%), whereas the industries that tend to have a higher number of women are Educational Services (100.0%), and Health Care & Social Assistance (100.0%).
| Industry | Male | Female |
| Agriculture, Fishing & Hunting | 0 (0.0%) | 0 (0.0%) |
| Mining, Quarrying, & Extraction | 0 (0.0%) | 0 (0.0%) |
| Construction | 6 (100.0%) | 0 (0.0%) |
| Manufacturing | 0 (0.0%) | 0 (0.0%) |
| Wholesale Trade | 0 (0.0%) | 0 (0.0%) |
| Retail Trade | 0 (0.0%) | 0 (0.0%) |
| Transportation & Warehousing | 0 (0.0%) | 0 (0.0%) |
| Utilities | 0 (0.0%) | 0 (0.0%) |
| Information | 0 (0.0%) | 0 (0.0%) |
| Finance & Insurance | 0 (0.0%) | 0 (0.0%) |
| Real Estate, Rental & Leasing | 0 (0.0%) | 0 (0.0%) |
| Professional & Scientific | 7 (100.0%) | 0 (0.0%) |
| Enterprise Management | 0 (0.0%) | 0 (0.0%) |
| Administrative & Support | 0 (0.0%) | 0 (0.0%) |
| Educational Services | 0 (0.0%) | 63 (100.0%) |
| Health Care & Social Assistance | 0 (0.0%) | 22 (100.0%) |
| Arts, Entertainment & Recreation | 0 (0.0%) | 0 (0.0%) |
| Accommodation & Food Services | 0 (0.0%) | 0 (0.0%) |
| Public Administration | 0 (0.0%) | 0 (0.0%) |
| Total | 13 (13.3%) | 85 (86.7%) |
Education in Hortonville
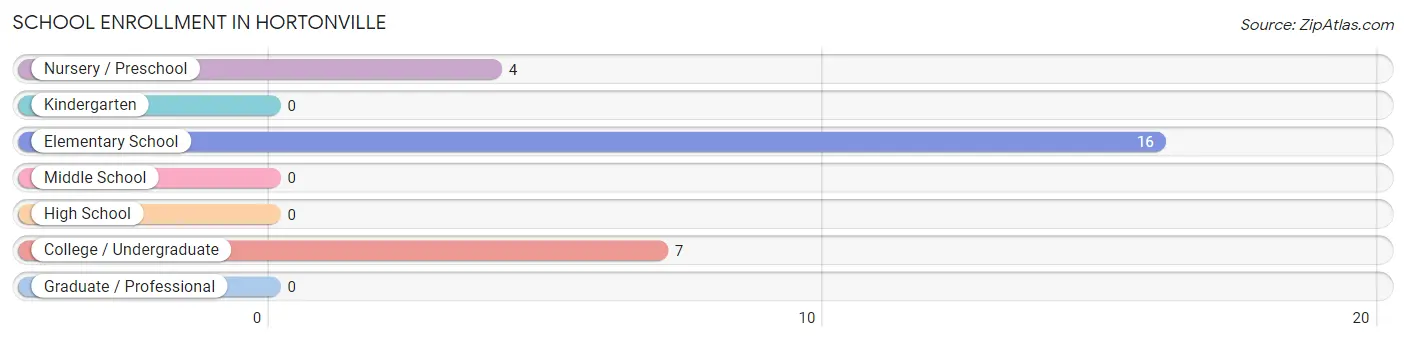
School Enrollment in Hortonville
The most common levels of schooling among the 27 students in Hortonville are elementary school (16 | 59.3%), college / undergraduate (7 | 25.9%), and nursery / preschool (4 | 14.8%).
| School Level | # Students | % Students |
| Nursery / Preschool | 4 | 14.8% |
| Kindergarten | 0 | 0.0% |
| Elementary School | 16 | 59.3% |
| Middle School | 0 | 0.0% |
| High School | 0 | 0.0% |
| College / Undergraduate | 7 | 25.9% |
| Graduate / Professional | 0 | 0.0% |
| Total | 27 | 100.0% |
School Enrollment by Age by Funding Source in Hortonville
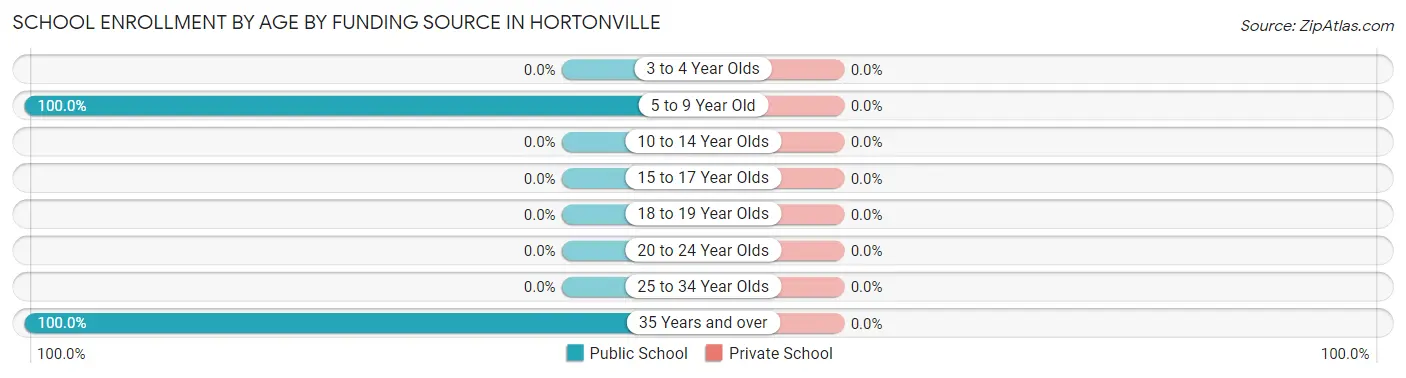
| Age Bracket | Public School | Private School |
| 3 to 4 Year Olds | 0 (0.0%) | 0 (0.0%) |
| 5 to 9 Year Old | 20 (100.0%) | 0 (0.0%) |
| 10 to 14 Year Olds | 0 (0.0%) | 0 (0.0%) |
| 15 to 17 Year Olds | 0 (0.0%) | 0 (0.0%) |
| 18 to 19 Year Olds | 0 (0.0%) | 0 (0.0%) |
| 20 to 24 Year Olds | 0 (0.0%) | 0 (0.0%) |
| 25 to 34 Year Olds | 0 (0.0%) | 0 (0.0%) |
| 35 Years and over | 7 (100.0%) | 0 (0.0%) |
| Total | 27 (100.0%) | 0 (0.0%) |
Educational Attainment by Field of Study in Hortonville
Computers & mathematics (63 | 75.9%), education (13 | 15.7%), and business (7 | 8.4%) are the most common fields of study among 83 individuals in Hortonville who have obtained a bachelor's degree or higher.
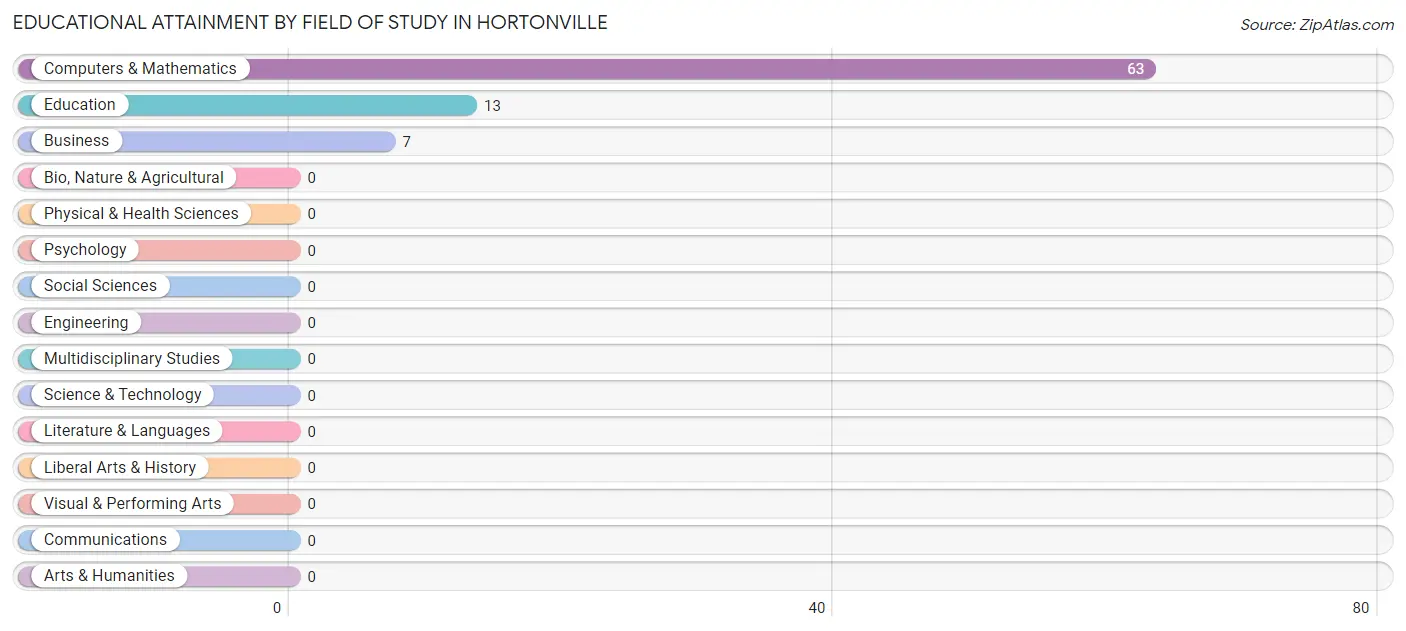
| Field of Study | # Graduates | % Graduates |
| Computers & Mathematics | 63 | 75.9% |
| Bio, Nature & Agricultural | 0 | 0.0% |
| Physical & Health Sciences | 0 | 0.0% |
| Psychology | 0 | 0.0% |
| Social Sciences | 0 | 0.0% |
| Engineering | 0 | 0.0% |
| Multidisciplinary Studies | 0 | 0.0% |
| Science & Technology | 0 | 0.0% |
| Business | 7 | 8.4% |
| Education | 13 | 15.7% |
| Literature & Languages | 0 | 0.0% |
| Liberal Arts & History | 0 | 0.0% |
| Visual & Performing Arts | 0 | 0.0% |
| Communications | 0 | 0.0% |
| Arts & Humanities | 0 | 0.0% |
| Total | 83 | 100.0% |
Transportation & Commute in Hortonville
Vehicle Availability by Sex in Hortonville
The most prevalent vehicle ownership categories in Hortonville are males with 2 vehicles (13, accounting for 100.0%) and females with 2 vehicles (69, making up 15.3%).
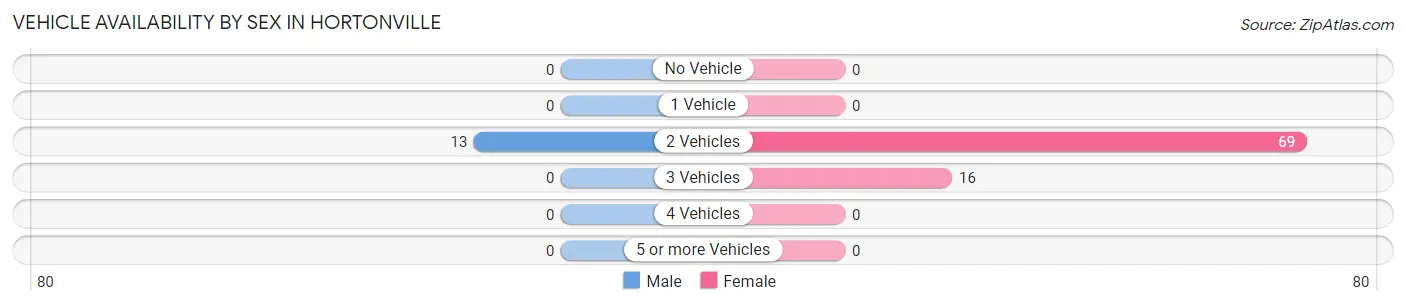
| Vehicles Available | Male | Female |
| No Vehicle | 0 (0.0%) | 0 (0.0%) |
| 1 Vehicle | 0 (0.0%) | 0 (0.0%) |
| 2 Vehicles | 13 (100.0%) | 69 (81.2%) |
| 3 Vehicles | 0 (0.0%) | 16 (18.8%) |
| 4 Vehicles | 0 (0.0%) | 0 (0.0%) |
| 5 or more Vehicles | 0 (0.0%) | 0 (0.0%) |
| Total | 13 (100.0%) | 85 (100.0%) |
Commute Time in Hortonville
The most frequently occuring commute durations in Hortonville are 45 to 59 minutes (22 commuters, 62.9%), 30 to 34 minutes (7 commuters, 20.0%), and 5 to 9 minutes (6 commuters, 17.1%).
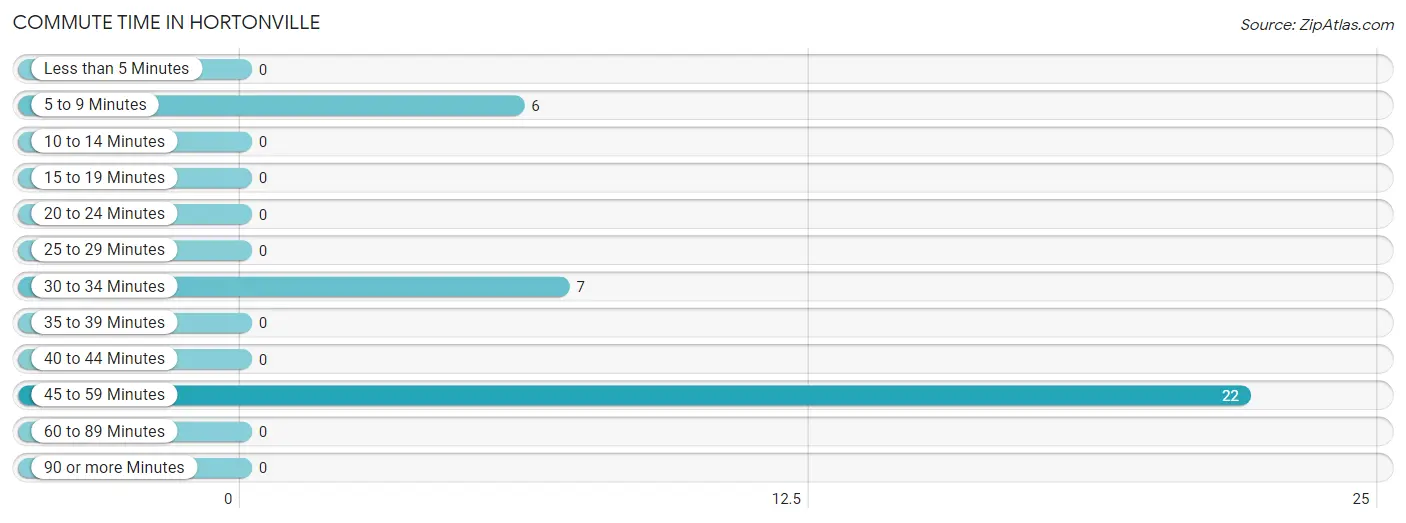
| Commute Time | # Commuters | % Commuters |
| Less than 5 Minutes | 0 | 0.0% |
| 5 to 9 Minutes | 6 | 17.1% |
| 10 to 14 Minutes | 0 | 0.0% |
| 15 to 19 Minutes | 0 | 0.0% |
| 20 to 24 Minutes | 0 | 0.0% |
| 25 to 29 Minutes | 0 | 0.0% |
| 30 to 34 Minutes | 7 | 20.0% |
| 35 to 39 Minutes | 0 | 0.0% |
| 40 to 44 Minutes | 0 | 0.0% |
| 45 to 59 Minutes | 22 | 62.9% |
| 60 to 89 Minutes | 0 | 0.0% |
| 90 or more Minutes | 0 | 0.0% |
Commute Time by Sex in Hortonville
The most common commute times in Hortonville are 30 to 34 minutes (7 commuters, 53.8%) for males and 45 to 59 minutes (22 commuters, 100.0%) for females.
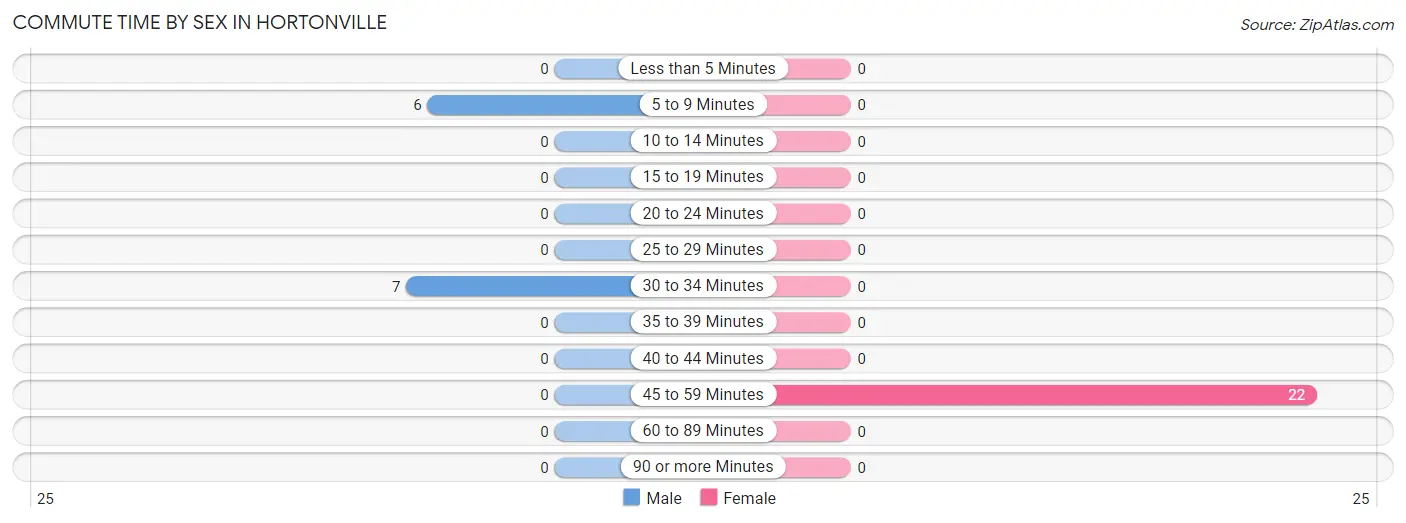
| Commute Time | Male | Female |
| Less than 5 Minutes | 0 (0.0%) | 0 (0.0%) |
| 5 to 9 Minutes | 6 (46.2%) | 0 (0.0%) |
| 10 to 14 Minutes | 0 (0.0%) | 0 (0.0%) |
| 15 to 19 Minutes | 0 (0.0%) | 0 (0.0%) |
| 20 to 24 Minutes | 0 (0.0%) | 0 (0.0%) |
| 25 to 29 Minutes | 0 (0.0%) | 0 (0.0%) |
| 30 to 34 Minutes | 7 (53.8%) | 0 (0.0%) |
| 35 to 39 Minutes | 0 (0.0%) | 0 (0.0%) |
| 40 to 44 Minutes | 0 (0.0%) | 0 (0.0%) |
| 45 to 59 Minutes | 0 (0.0%) | 22 (100.0%) |
| 60 to 89 Minutes | 0 (0.0%) | 0 (0.0%) |
| 90 or more Minutes | 0 (0.0%) | 0 (0.0%) |
Time of Departure to Work by Sex in Hortonville
The most frequent times of departure to work in Hortonville are 5:00 AM to 5:29 AM (7, 53.8%) for males and 7:00 AM to 7:29 AM (16, 72.7%) for females.
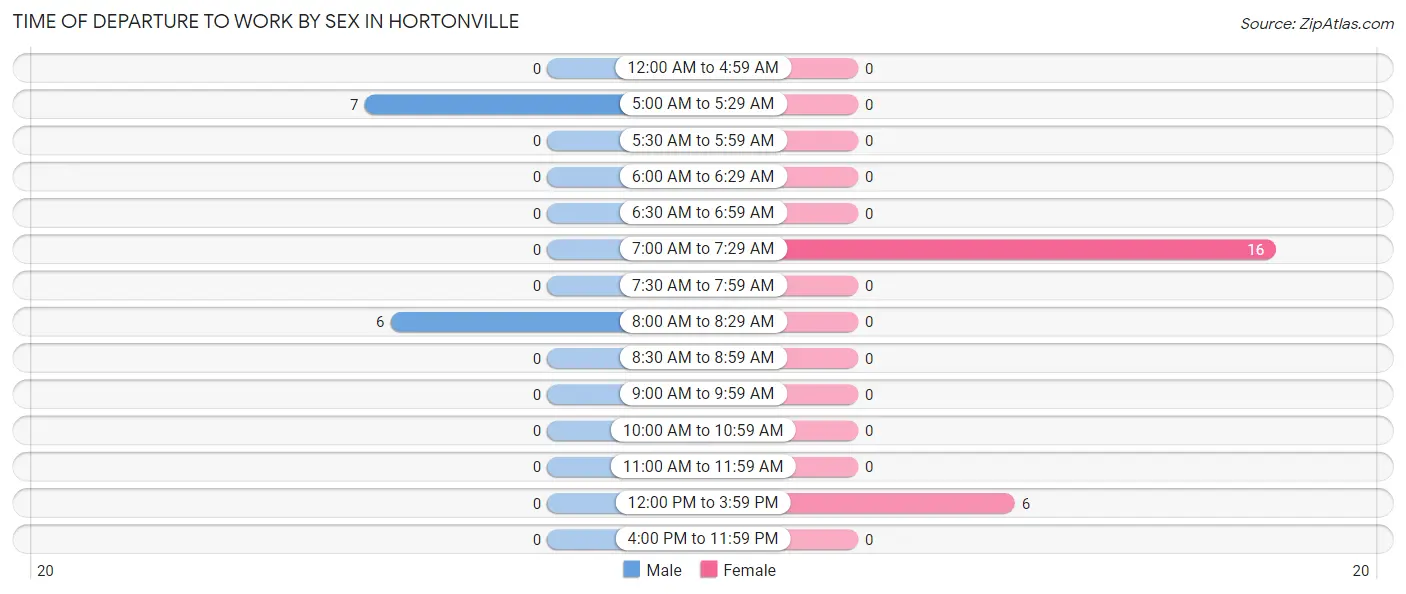
| Time of Departure | Male | Female |
| 12:00 AM to 4:59 AM | 0 (0.0%) | 0 (0.0%) |
| 5:00 AM to 5:29 AM | 7 (53.8%) | 0 (0.0%) |
| 5:30 AM to 5:59 AM | 0 (0.0%) | 0 (0.0%) |
| 6:00 AM to 6:29 AM | 0 (0.0%) | 0 (0.0%) |
| 6:30 AM to 6:59 AM | 0 (0.0%) | 0 (0.0%) |
| 7:00 AM to 7:29 AM | 0 (0.0%) | 16 (72.7%) |
| 7:30 AM to 7:59 AM | 0 (0.0%) | 0 (0.0%) |
| 8:00 AM to 8:29 AM | 6 (46.2%) | 0 (0.0%) |
| 8:30 AM to 8:59 AM | 0 (0.0%) | 0 (0.0%) |
| 9:00 AM to 9:59 AM | 0 (0.0%) | 0 (0.0%) |
| 10:00 AM to 10:59 AM | 0 (0.0%) | 0 (0.0%) |
| 11:00 AM to 11:59 AM | 0 (0.0%) | 0 (0.0%) |
| 12:00 PM to 3:59 PM | 0 (0.0%) | 6 (27.3%) |
| 4:00 PM to 11:59 PM | 0 (0.0%) | 0 (0.0%) |
| Total | 13 (100.0%) | 22 (100.0%) |
Housing Occupancy in Hortonville
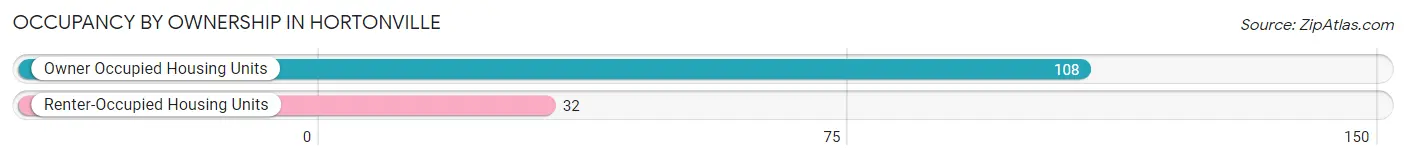
Occupancy by Ownership in Hortonville
Of the total 140 dwellings in Hortonville, owner-occupied units account for 108 (77.1%), while renter-occupied units make up 32 (22.9%).
| Occupancy | # Housing Units | % Housing Units |
| Owner Occupied Housing Units | 108 | 77.1% |
| Renter-Occupied Housing Units | 32 | 22.9% |
| Total Occupied Housing Units | 140 | 100.0% |
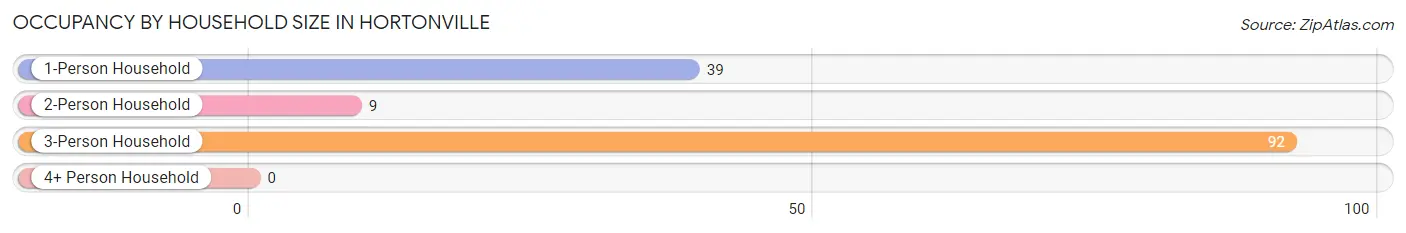
Occupancy by Household Size in Hortonville
| Household Size | # Housing Units | % Housing Units |
| 1-Person Household | 39 | 27.9% |
| 2-Person Household | 9 | 6.4% |
| 3-Person Household | 92 | 65.7% |
| 4+ Person Household | 0 | 0.0% |
| Total Housing Units | 140 | 100.0% |
Occupancy by Ownership by Household Size in Hortonville
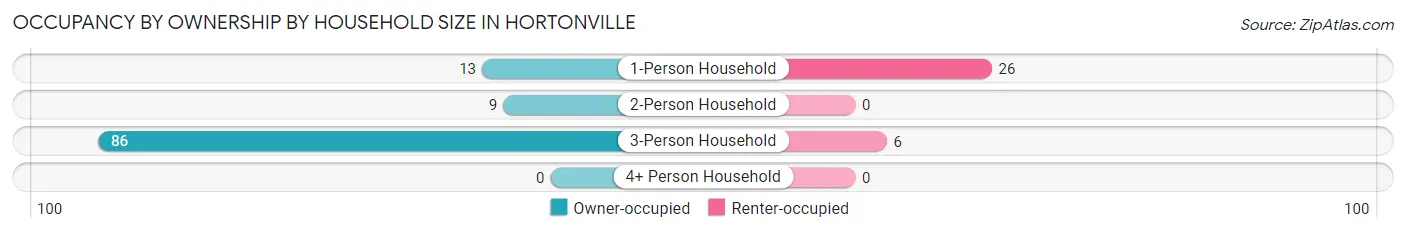
| Household Size | Owner-occupied | Renter-occupied |
| 1-Person Household | 13 (33.3%) | 26 (66.7%) |
| 2-Person Household | 9 (100.0%) | 0 (0.0%) |
| 3-Person Household | 86 (93.5%) | 6 (6.5%) |
| 4+ Person Household | 0 (0.0%) | 0 (0.0%) |
| Total Housing Units | 108 (77.1%) | 32 (22.9%) |
Occupancy by Educational Attainment in Hortonville
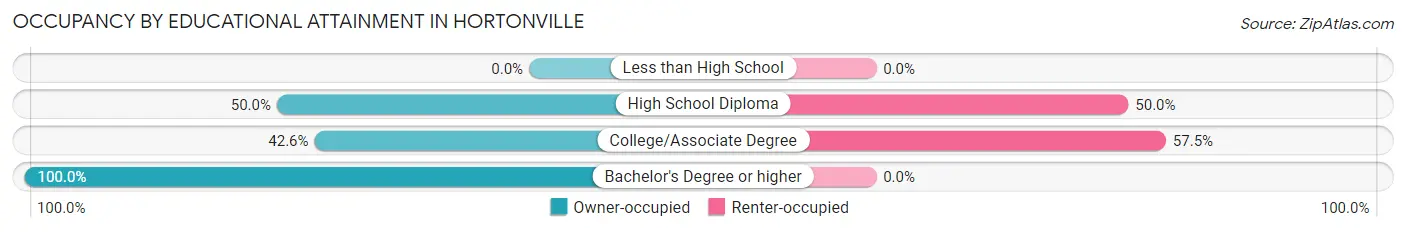
| Household Size | Owner-occupied | Renter-occupied |
| Less than High School | 0 (0.0%) | 0 (0.0%) |
| High School Diploma | 5 (50.0%) | 5 (50.0%) |
| College/Associate Degree | 20 (42.5%) | 27 (57.5%) |
| Bachelor's Degree or higher | 83 (100.0%) | 0 (0.0%) |
Occupancy by Age of Householder in Hortonville
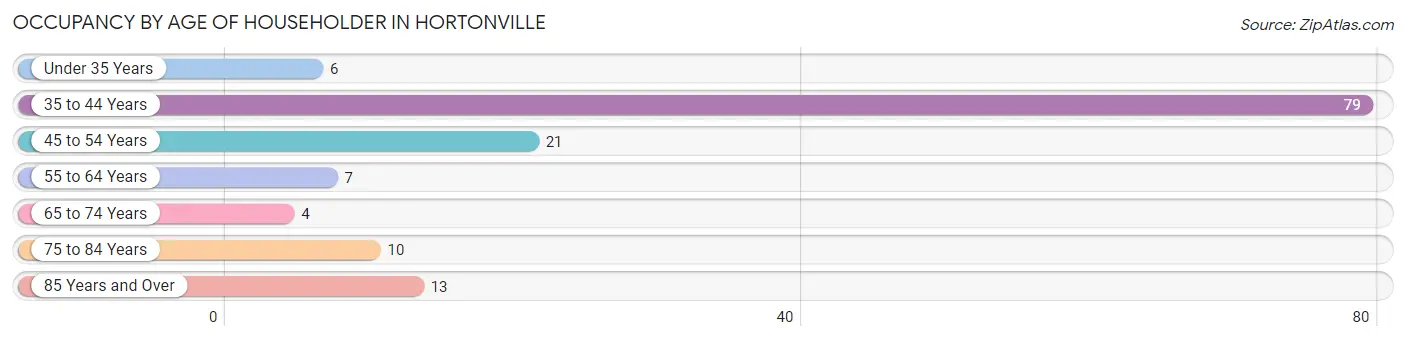
| Age Bracket | # Households | % Households |
| Under 35 Years | 6 | 4.3% |
| 35 to 44 Years | 79 | 56.4% |
| 45 to 54 Years | 21 | 15.0% |
| 55 to 64 Years | 7 | 5.0% |
| 65 to 74 Years | 4 | 2.9% |
| 75 to 84 Years | 10 | 7.1% |
| 85 Years and Over | 13 | 9.3% |
| Total | 140 | 100.0% |
Housing Finances in Hortonville
Median Income by Occupancy in Hortonville
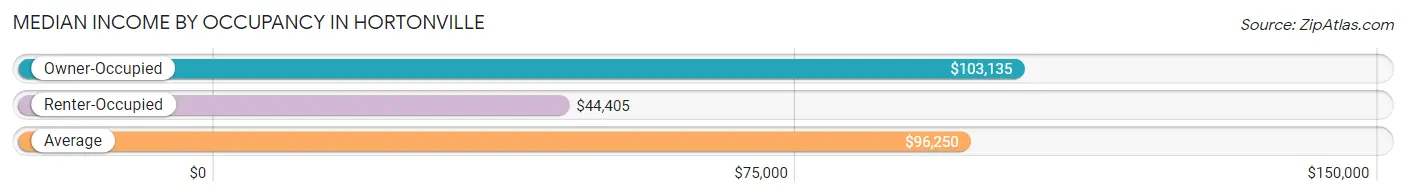
| Occupancy Type | # Households | Median Income |
| Owner-Occupied | 108 (77.1%) | $103,135 |
| Renter-Occupied | 32 (22.9%) | $44,405 |
| Average | 140 (100.0%) | $96,250 |
Occupancy by Householder Income Bracket in Hortonville
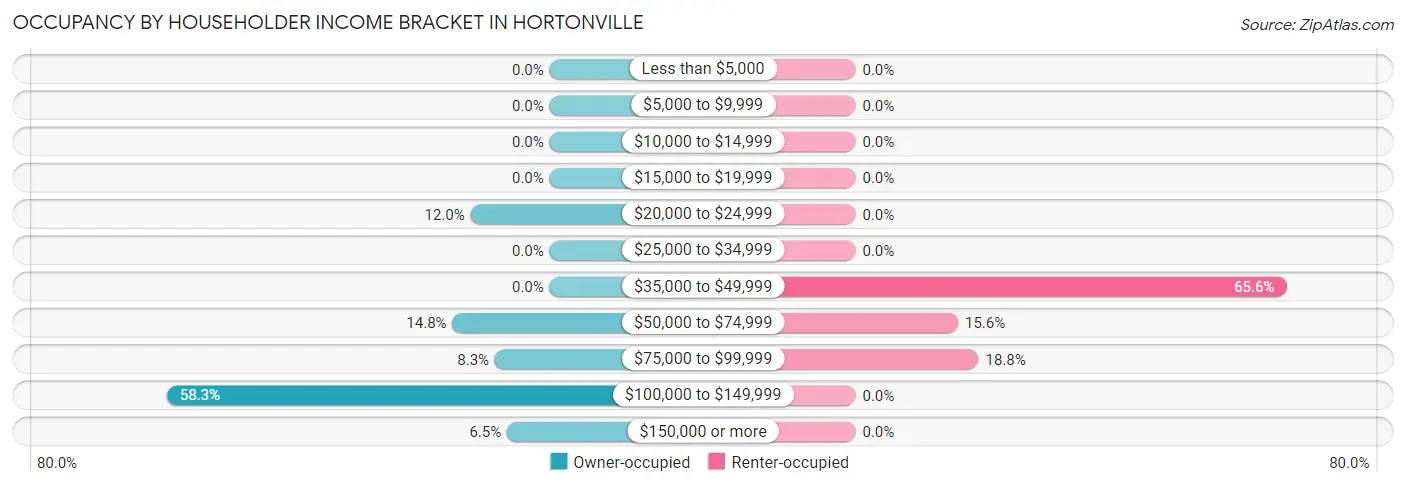
| Income Bracket | Owner-occupied | Renter-occupied |
| Less than $5,000 | 0 (0.0%) | 0 (0.0%) |
| $5,000 to $9,999 | 0 (0.0%) | 0 (0.0%) |
| $10,000 to $14,999 | 0 (0.0%) | 0 (0.0%) |
| $15,000 to $19,999 | 0 (0.0%) | 0 (0.0%) |
| $20,000 to $24,999 | 13 (12.0%) | 0 (0.0%) |
| $25,000 to $34,999 | 0 (0.0%) | 0 (0.0%) |
| $35,000 to $49,999 | 0 (0.0%) | 21 (65.6%) |
| $50,000 to $74,999 | 16 (14.8%) | 5 (15.6%) |
| $75,000 to $99,999 | 9 (8.3%) | 6 (18.8%) |
| $100,000 to $149,999 | 63 (58.3%) | 0 (0.0%) |
| $150,000 or more | 7 (6.5%) | 0 (0.0%) |
| Total | 108 (100.0%) | 32 (100.0%) |
Monthly Housing Cost Tiers in Hortonville
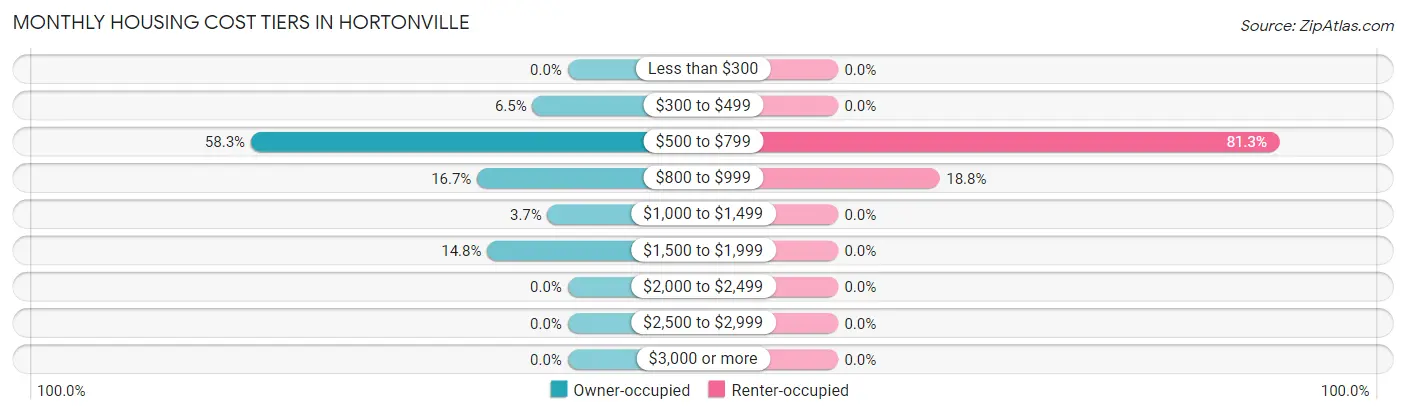
| Monthly Cost | Owner-occupied | Renter-occupied |
| Less than $300 | 0 (0.0%) | 0 (0.0%) |
| $300 to $499 | 7 (6.5%) | 0 (0.0%) |
| $500 to $799 | 63 (58.3%) | 26 (81.2%) |
| $800 to $999 | 18 (16.7%) | 6 (18.8%) |
| $1,000 to $1,499 | 4 (3.7%) | 0 (0.0%) |
| $1,500 to $1,999 | 16 (14.8%) | 0 (0.0%) |
| $2,000 to $2,499 | 0 (0.0%) | 0 (0.0%) |
| $2,500 to $2,999 | 0 (0.0%) | 0 (0.0%) |
| $3,000 or more | 0 (0.0%) | 0 (0.0%) |
| Total | 108 (100.0%) | 32 (100.0%) |
Physical Housing Characteristics in Hortonville
Housing Structures in Hortonville
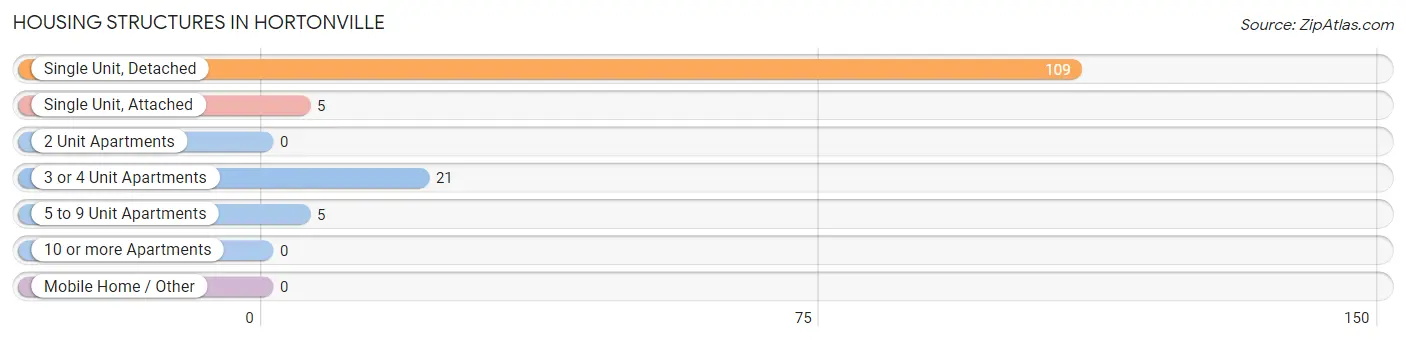
| Structure Type | # Housing Units | % Housing Units |
| Single Unit, Detached | 109 | 77.9% |
| Single Unit, Attached | 5 | 3.6% |
| 2 Unit Apartments | 0 | 0.0% |
| 3 or 4 Unit Apartments | 21 | 15.0% |
| 5 to 9 Unit Apartments | 5 | 3.6% |
| 10 or more Apartments | 0 | 0.0% |
| Mobile Home / Other | 0 | 0.0% |
| Total | 140 | 100.0% |
Housing Structures by Occupancy in Hortonville
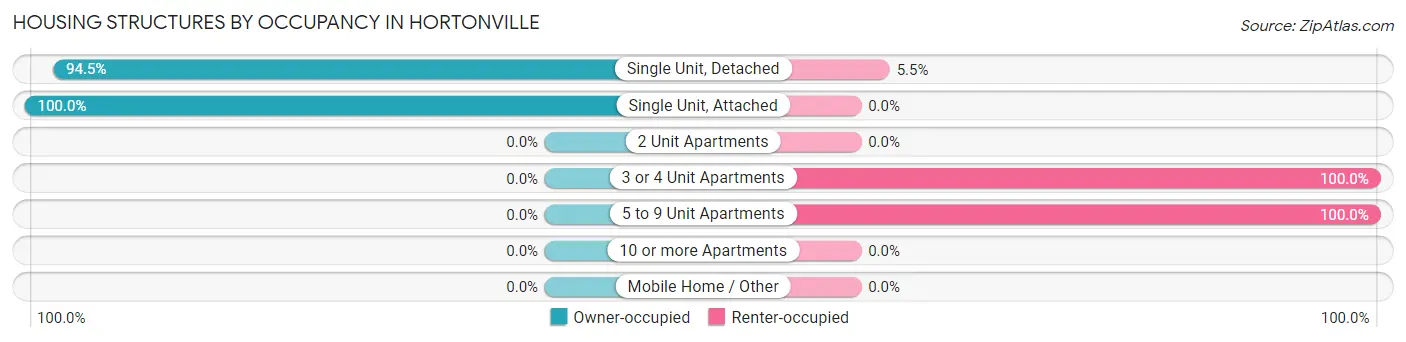
| Structure Type | Owner-occupied | Renter-occupied |
| Single Unit, Detached | 103 (94.5%) | 6 (5.5%) |
| Single Unit, Attached | 5 (100.0%) | 0 (0.0%) |
| 2 Unit Apartments | 0 (0.0%) | 0 (0.0%) |
| 3 or 4 Unit Apartments | 0 (0.0%) | 21 (100.0%) |
| 5 to 9 Unit Apartments | 0 (0.0%) | 5 (100.0%) |
| 10 or more Apartments | 0 (0.0%) | 0 (0.0%) |
| Mobile Home / Other | 0 (0.0%) | 0 (0.0%) |
| Total | 108 (77.1%) | 32 (22.9%) |
Housing Structures by Number of Rooms in Hortonville
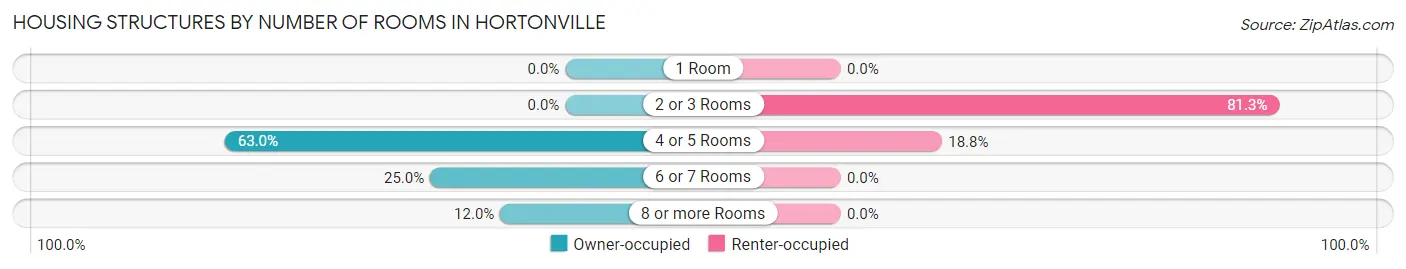
| Number of Rooms | Owner-occupied | Renter-occupied |
| 1 Room | 0 (0.0%) | 0 (0.0%) |
| 2 or 3 Rooms | 0 (0.0%) | 26 (81.2%) |
| 4 or 5 Rooms | 68 (63.0%) | 6 (18.8%) |
| 6 or 7 Rooms | 27 (25.0%) | 0 (0.0%) |
| 8 or more Rooms | 13 (12.0%) | 0 (0.0%) |
| Total | 108 (100.0%) | 32 (100.0%) |
Housing Structure by Heating Type in Hortonville
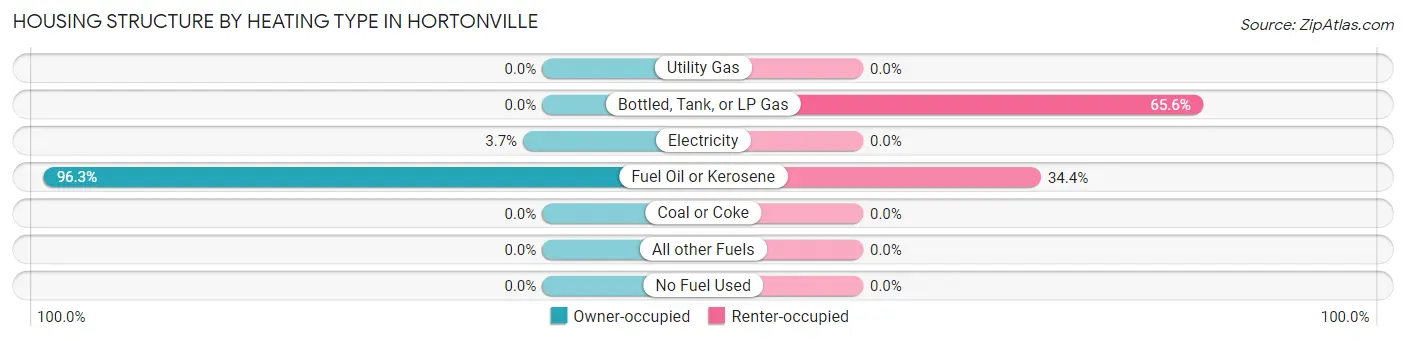
| Heating Type | Owner-occupied | Renter-occupied |
| Utility Gas | 0 (0.0%) | 0 (0.0%) |
| Bottled, Tank, or LP Gas | 0 (0.0%) | 21 (65.6%) |
| Electricity | 4 (3.7%) | 0 (0.0%) |
| Fuel Oil or Kerosene | 104 (96.3%) | 11 (34.4%) |
| Coal or Coke | 0 (0.0%) | 0 (0.0%) |
| All other Fuels | 0 (0.0%) | 0 (0.0%) |
| No Fuel Used | 0 (0.0%) | 0 (0.0%) |
| Total | 108 (100.0%) | 32 (100.0%) |
Household Vehicle Usage in Hortonville
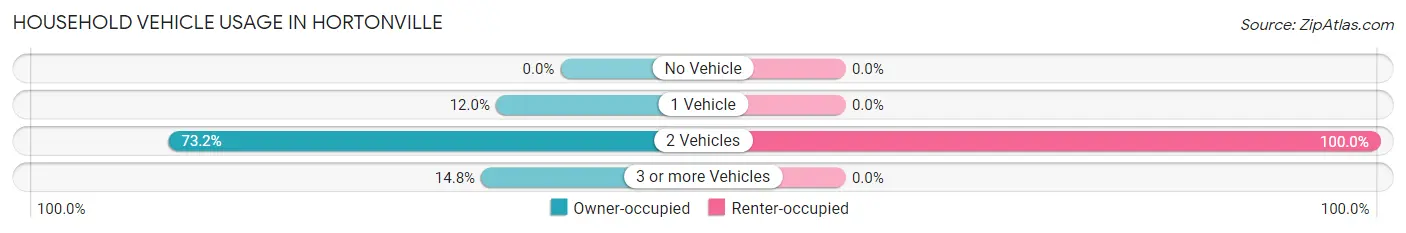
| Vehicles per Household | Owner-occupied | Renter-occupied |
| No Vehicle | 0 (0.0%) | 0 (0.0%) |
| 1 Vehicle | 13 (12.0%) | 0 (0.0%) |
| 2 Vehicles | 79 (73.2%) | 32 (100.0%) |
| 3 or more Vehicles | 16 (14.8%) | 0 (0.0%) |
| Total | 108 (100.0%) | 32 (100.0%) |
Real Estate & Mortgages in Hortonville
Real Estate and Mortgage Overview in Hortonville
| Characteristic | Without Mortgage | With Mortgage |
| Housing Units | 75 | 33 |
| Median Property Value | $163,400 | $149,300 |
| Median Household Income | $103,790 | $0 |
| Monthly Housing Costs | $548 | $0 |
| Real Estate Taxes | $3,464 | $0 |
Property Value by Mortgage Status in Hortonville
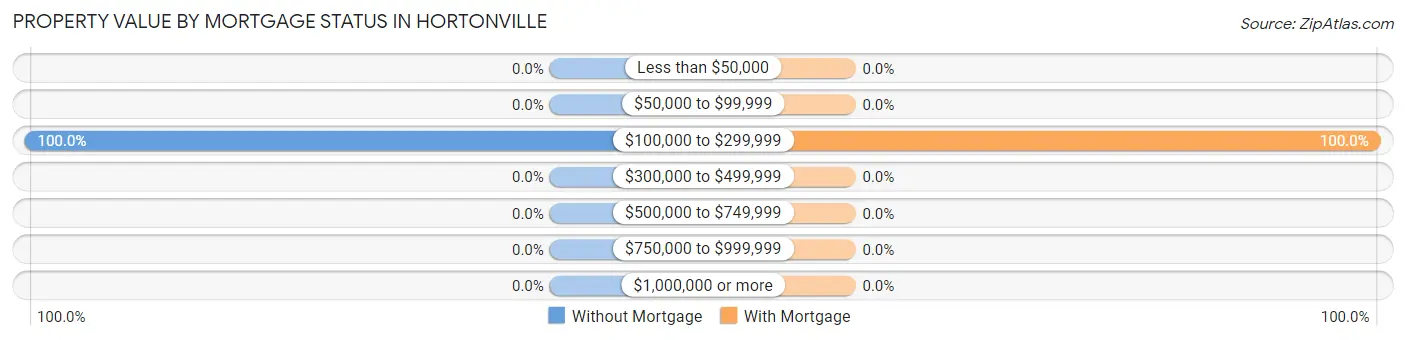
| Property Value | Without Mortgage | With Mortgage |
| Less than $50,000 | 0 (0.0%) | 0 (0.0%) |
| $50,000 to $99,999 | 0 (0.0%) | 0 (0.0%) |
| $100,000 to $299,999 | 75 (100.0%) | 33 (100.0%) |
| $300,000 to $499,999 | 0 (0.0%) | 0 (0.0%) |
| $500,000 to $749,999 | 0 (0.0%) | 0 (0.0%) |
| $750,000 to $999,999 | 0 (0.0%) | 0 (0.0%) |
| $1,000,000 or more | 0 (0.0%) | 0 (0.0%) |
| Total | 75 (100.0%) | 33 (100.0%) |
Household Income by Mortgage Status in Hortonville
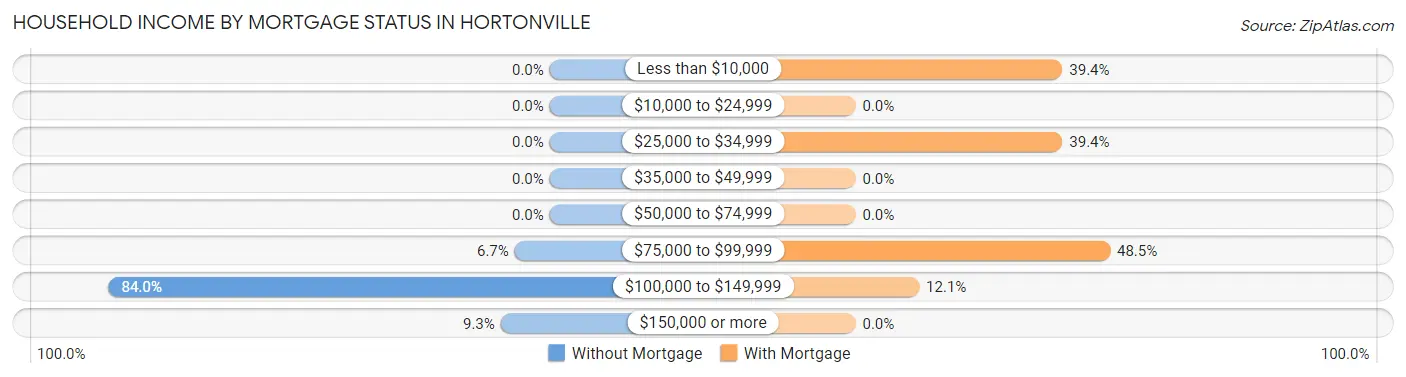
| Household Income | Without Mortgage | With Mortgage |
| Less than $10,000 | 0 (0.0%) | 13 (39.4%) |
| $10,000 to $24,999 | 0 (0.0%) | 0 (0.0%) |
| $25,000 to $34,999 | 0 (0.0%) | 13 (39.4%) |
| $35,000 to $49,999 | 0 (0.0%) | 0 (0.0%) |
| $50,000 to $74,999 | 0 (0.0%) | 0 (0.0%) |
| $75,000 to $99,999 | 5 (6.7%) | 16 (48.5%) |
| $100,000 to $149,999 | 63 (84.0%) | 4 (12.1%) |
| $150,000 or more | 7 (9.3%) | 0 (0.0%) |
| Total | 75 (100.0%) | 33 (100.0%) |
Property Value to Household Income Ratio in Hortonville
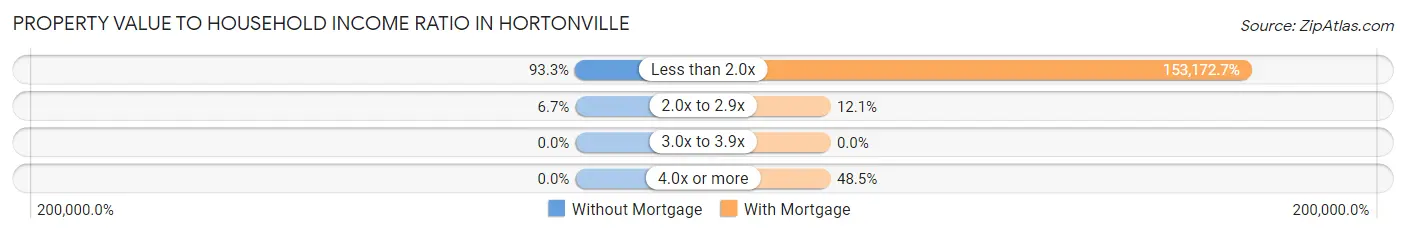
| Value-to-Income Ratio | Without Mortgage | With Mortgage |
| Less than 2.0x | 70 (93.3%) | 50,547 (153,172.7%) |
| 2.0x to 2.9x | 5 (6.7%) | 4 (12.1%) |
| 3.0x to 3.9x | 0 (0.0%) | 0 (0.0%) |
| 4.0x or more | 0 (0.0%) | 16 (48.5%) |
| Total | 75 (100.0%) | 33 (100.0%) |
Real Estate Taxes by Mortgage Status in Hortonville
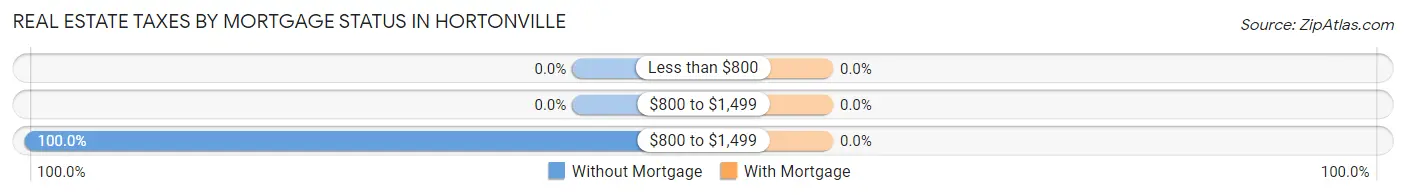
| Property Taxes | Without Mortgage | With Mortgage |
| Less than $800 | 0 (0.0%) | 0 (0.0%) |
| $800 to $1,499 | 0 (0.0%) | 0 (0.0%) |
| $800 to $1,499 | 75 (100.0%) | 0 (0.0%) |
| Total | 75 (100.0%) | 33 (100.0%) |
Health & Disability in Hortonville
Health Insurance Coverage by Age in Hortonville
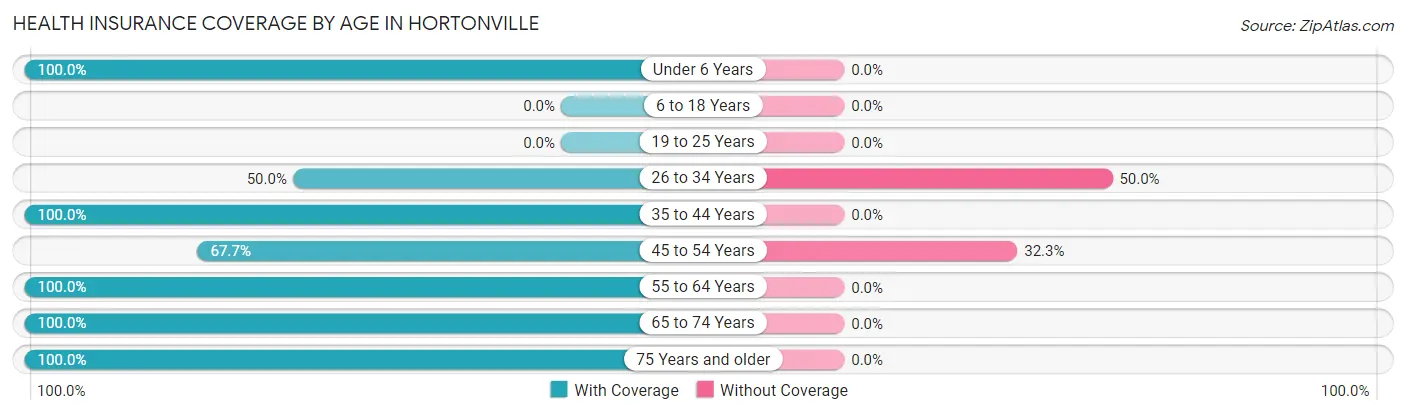
| Age Bracket | With Coverage | Without Coverage |
| Under 6 Years | 20 (100.0%) | 0 (0.0%) |
| 6 to 18 Years | 0 (0.0%) | 0 (0.0%) |
| 19 to 25 Years | 0 (0.0%) | 0 (0.0%) |
| 26 to 34 Years | 6 (50.0%) | 6 (50.0%) |
| 35 to 44 Years | 100 (100.0%) | 0 (0.0%) |
| 45 to 54 Years | 21 (67.7%) | 10 (32.3%) |
| 55 to 64 Years | 42 (100.0%) | 0 (0.0%) |
| 65 to 74 Years | 48 (100.0%) | 0 (0.0%) |
| 75 Years and older | 29 (100.0%) | 0 (0.0%) |
| Total | 266 (94.3%) | 16 (5.7%) |
Health Insurance Coverage by Citizenship Status in Hortonville
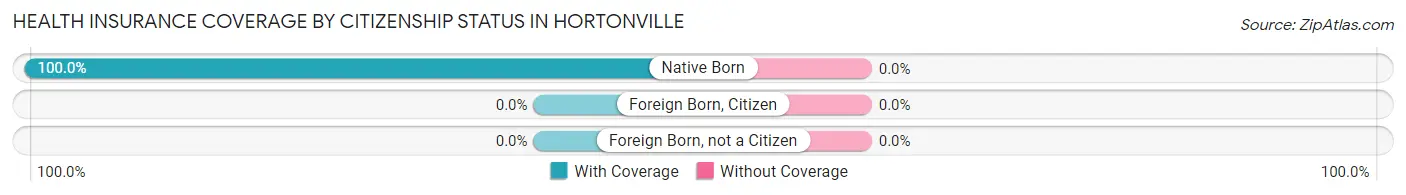
| Citizenship Status | With Coverage | Without Coverage |
| Native Born | 20 (100.0%) | 0 (0.0%) |
| Foreign Born, Citizen | 0 (0.0%) | 0 (0.0%) |
| Foreign Born, not a Citizen | 0 (0.0%) | 0 (0.0%) |
Health Insurance Coverage by Household Income in Hortonville
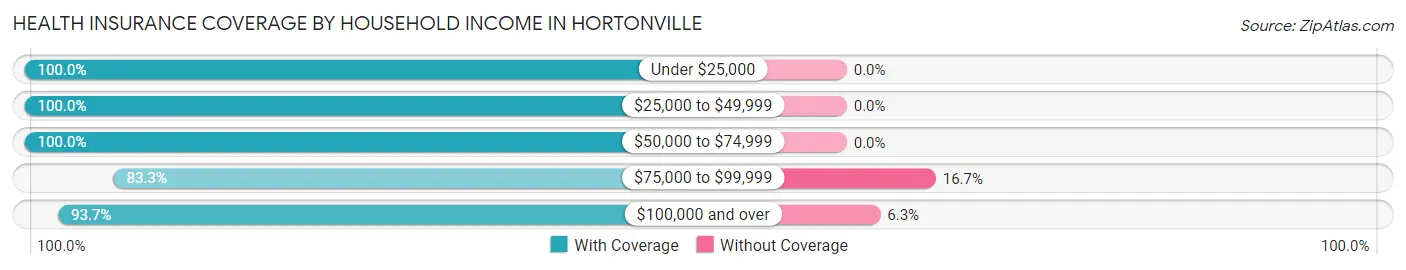
| Household Income | With Coverage | Without Coverage |
| Under $25,000 | 13 (100.0%) | 0 (0.0%) |
| $25,000 to $49,999 | 21 (100.0%) | 0 (0.0%) |
| $50,000 to $74,999 | 53 (100.0%) | 0 (0.0%) |
| $75,000 to $99,999 | 30 (83.3%) | 6 (16.7%) |
| $100,000 and over | 149 (93.7%) | 10 (6.3%) |
Public vs Private Health Insurance Coverage by Age in Hortonville
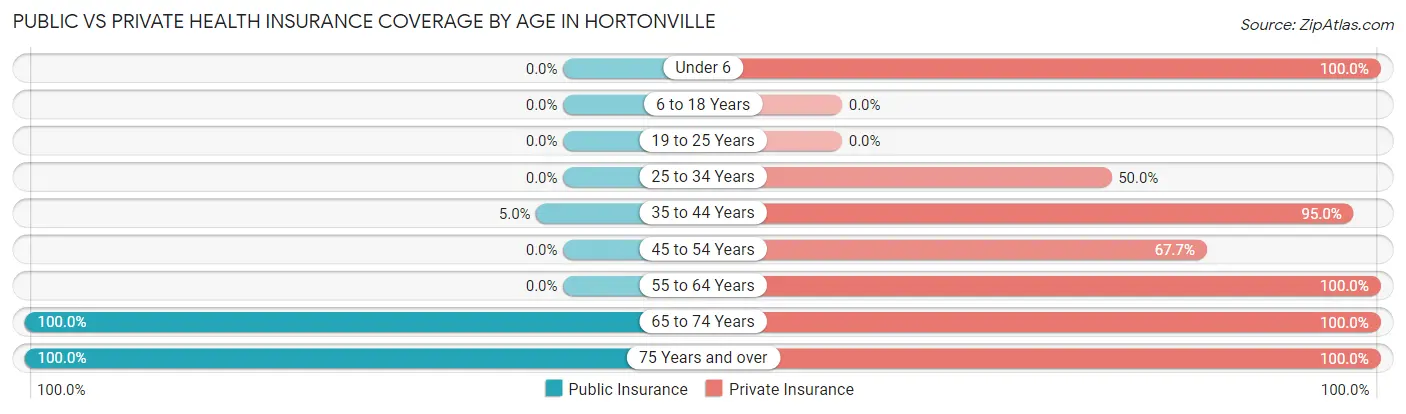
| Age Bracket | Public Insurance | Private Insurance |
| Under 6 | 0 (0.0%) | 20 (100.0%) |
| 6 to 18 Years | 0 (0.0%) | 0 (0.0%) |
| 19 to 25 Years | 0 (0.0%) | 0 (0.0%) |
| 25 to 34 Years | 0 (0.0%) | 6 (50.0%) |
| 35 to 44 Years | 5 (5.0%) | 95 (95.0%) |
| 45 to 54 Years | 0 (0.0%) | 21 (67.7%) |
| 55 to 64 Years | 0 (0.0%) | 42 (100.0%) |
| 65 to 74 Years | 48 (100.0%) | 48 (100.0%) |
| 75 Years and over | 29 (100.0%) | 29 (100.0%) |
| Total | 82 (29.1%) | 261 (92.5%) |
Disability Status by Sex by Age in Hortonville
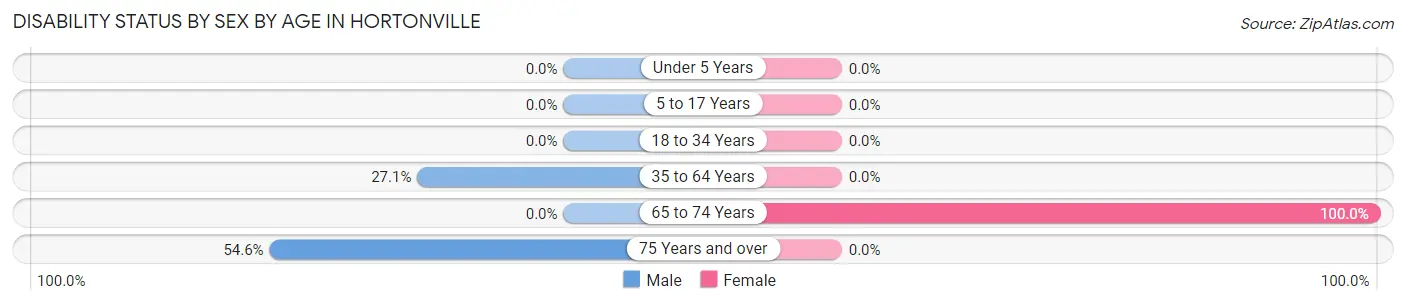
| Age Bracket | Male | Female |
| Under 5 Years | 0 (0.0%) | 0 (0.0%) |
| 5 to 17 Years | 0 (0.0%) | 0 (0.0%) |
| 18 to 34 Years | 0 (0.0%) | 0 (0.0%) |
| 35 to 64 Years | 16 (27.1%) | 0 (0.0%) |
| 65 to 74 Years | 0 (0.0%) | 3 (100.0%) |
| 75 Years and over | 6 (54.5%) | 0 (0.0%) |
Disability Class by Sex by Age in Hortonville
Disability Class: Hearing Difficulty
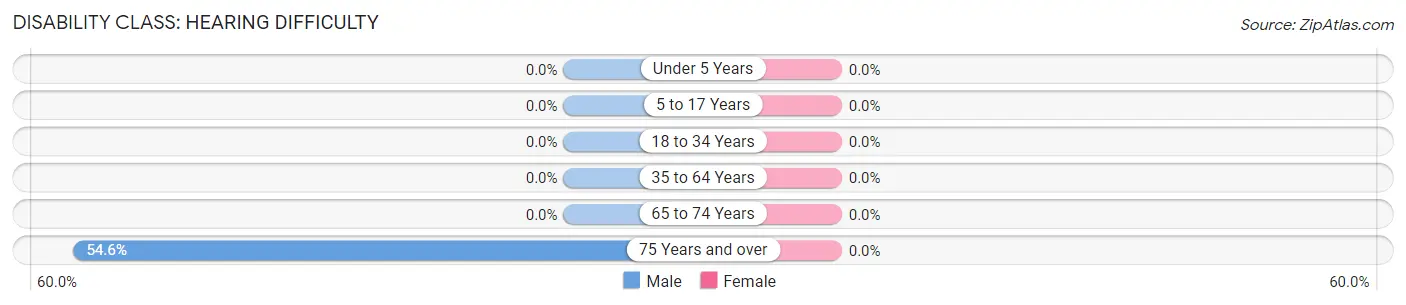
| Age Bracket | Male | Female |
| Under 5 Years | 0 (0.0%) | 0 (0.0%) |
| 5 to 17 Years | 0 (0.0%) | 0 (0.0%) |
| 18 to 34 Years | 0 (0.0%) | 0 (0.0%) |
| 35 to 64 Years | 0 (0.0%) | 0 (0.0%) |
| 65 to 74 Years | 0 (0.0%) | 0 (0.0%) |
| 75 Years and over | 6 (54.5%) | 0 (0.0%) |
Disability Class: Vision Difficulty
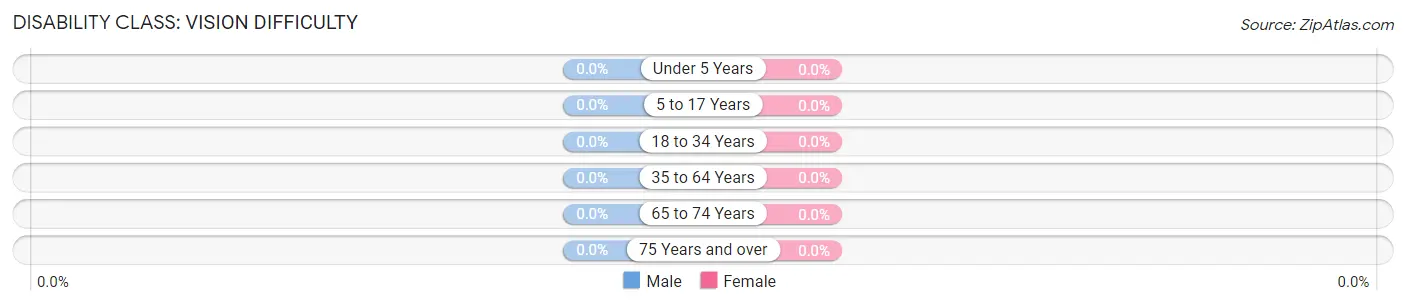
| Age Bracket | Male | Female |
| Under 5 Years | 0 (0.0%) | 0 (0.0%) |
| 5 to 17 Years | 0 (0.0%) | 0 (0.0%) |
| 18 to 34 Years | 0 (0.0%) | 0 (0.0%) |
| 35 to 64 Years | 0 (0.0%) | 0 (0.0%) |
| 65 to 74 Years | 0 (0.0%) | 0 (0.0%) |
| 75 Years and over | 0 (0.0%) | 0 (0.0%) |
Disability Class: Cognitive Difficulty
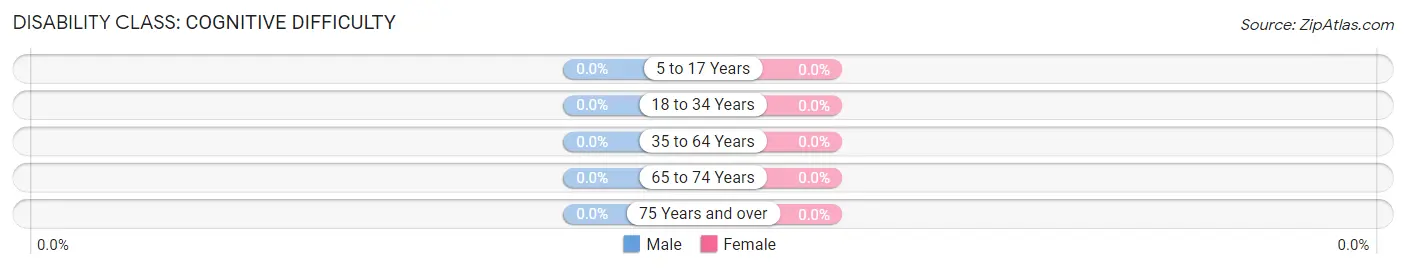
| Age Bracket | Male | Female |
| 5 to 17 Years | 0 (0.0%) | 0 (0.0%) |
| 18 to 34 Years | 0 (0.0%) | 0 (0.0%) |
| 35 to 64 Years | 0 (0.0%) | 0 (0.0%) |
| 65 to 74 Years | 0 (0.0%) | 0 (0.0%) |
| 75 Years and over | 0 (0.0%) | 0 (0.0%) |
Disability Class: Ambulatory Difficulty
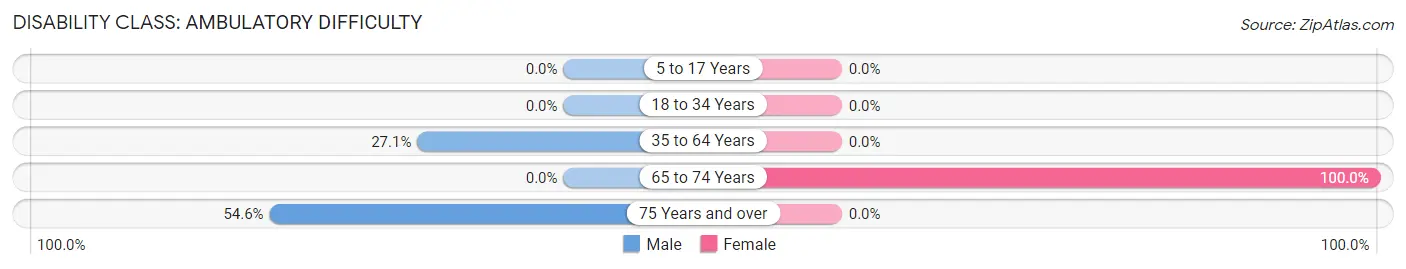
| Age Bracket | Male | Female |
| 5 to 17 Years | 0 (0.0%) | 0 (0.0%) |
| 18 to 34 Years | 0 (0.0%) | 0 (0.0%) |
| 35 to 64 Years | 16 (27.1%) | 0 (0.0%) |
| 65 to 74 Years | 0 (0.0%) | 3 (100.0%) |
| 75 Years and over | 6 (54.5%) | 0 (0.0%) |
Disability Class: Self-Care Difficulty
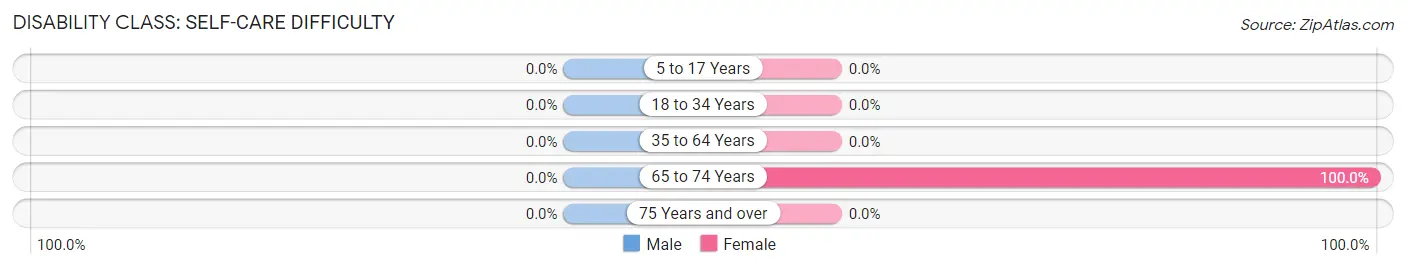
| Age Bracket | Male | Female |
| 5 to 17 Years | 0 (0.0%) | 0 (0.0%) |
| 18 to 34 Years | 0 (0.0%) | 0 (0.0%) |
| 35 to 64 Years | 0 (0.0%) | 0 (0.0%) |
| 65 to 74 Years | 0 (0.0%) | 3 (100.0%) |
| 75 Years and over | 0 (0.0%) | 0 (0.0%) |
Technology Access in Hortonville
Computing Device Access in Hortonville
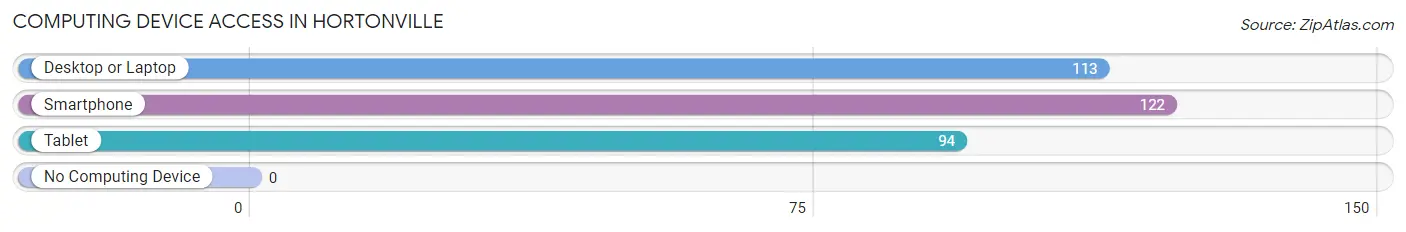
| Device Type | # Households | % Households |
| Desktop or Laptop | 113 | 80.7% |
| Smartphone | 122 | 87.1% |
| Tablet | 94 | 67.1% |
| No Computing Device | 0 | 0.0% |
| Total | 140 | 100.0% |
Internet Access in Hortonville
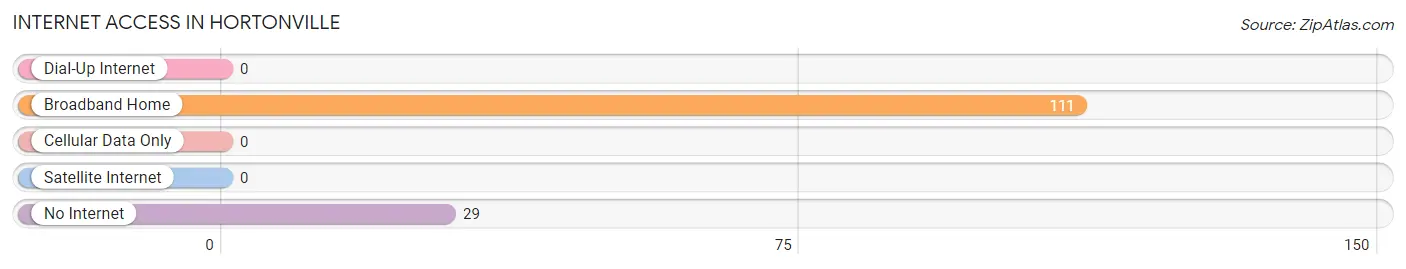
| Internet Type | # Households | % Households |
| Dial-Up Internet | 0 | 0.0% |
| Broadband Home | 111 | 79.3% |
| Cellular Data Only | 0 | 0.0% |
| Satellite Internet | 0 | 0.0% |
| No Internet | 29 | 20.7% |
| Total | 140 | 100.0% |
Hortonville Summary
Hortonville is a hamlet located in the town of Crawford in Orange County, New York. It is situated on the Shawangunk Ridge, a ridge of the Appalachian Mountains, and is located about 50 miles northwest of New York City. The hamlet is home to a population of about 1,000 people and is known for its rural charm and scenic beauty.
History
Hortonville was first settled in the late 1700s by the Horton family, who were among the first settlers in the area. The hamlet was originally known as “Horton’s Corners” and was later renamed “Hortonville” in 1845. The hamlet was an important stop on the Newburgh-Cochecton Turnpike, which was a major transportation route in the area.
In the late 1800s, the hamlet was home to a number of businesses, including a blacksmith shop, a general store, a post office, and a hotel. The hamlet also had a school, which was built in 1876 and is still in use today.
Geography
Hortonville is located in the town of Crawford in Orange County, New York. It is situated on the Shawangunk Ridge, a ridge of the Appalachian Mountains, and is located about 50 miles northwest of New York City. The hamlet is surrounded by the towns of Wallkill, Montgomery, and Mamakating.
The hamlet is located in a rural area and is known for its scenic beauty. The area is home to a number of parks and nature preserves, including the Shawangunk Ridge State Park, the Minnewaska State Park Preserve, and the Mohonk Preserve.
Economy
Hortonville is a small, rural community and the economy is largely based on agriculture and tourism. The hamlet is home to a number of farms, which produce a variety of crops, including apples, peaches, and pumpkins. The hamlet is also home to a number of bed and breakfasts, which attract visitors from all over the world.
Demographics
As of the 2010 census, the population of Hortonville was 1,000. The racial makeup of the hamlet was 97.2% White, 0.7% African American, 0.2% Native American, 0.2% Asian, 0.2% from other races, and 1.7% from two or more races. Hispanic or Latino of any race were 1.7% of the population.
The median household income in Hortonville was $50,000, and the median family income was $54,000. The per capita income for the hamlet was $21,000. About 8.3% of families and 10.2% of the population were below the poverty line, including 14.3% of those under age 18 and none of those age 65 or over.
Common Questions
What is Per Capita Income in Hortonville?
Per Capita income in Hortonville is $39,955.
What is the Median Family Income in Hortonville?
Median Family Income in Hortonville is $103,135.
What is the Median Household income in Hortonville?
Median Household Income in Hortonville is $96,250.
What is Inequality or Gini Index in Hortonville?
Inequality or Gini Index in Hortonville is 0.25.
What is the Total Population of Hortonville?
Total Population of Hortonville is 282.
What is the Total Male Population of Hortonville?
Total Male Population of Hortonville is 125.
What is the Total Female Population of Hortonville?
Total Female Population of Hortonville is 157.
What is the Ratio of Males per 100 Females in Hortonville?
There are 79.62 Males per 100 Females in Hortonville.
What is the Ratio of Females per 100 Males in Hortonville?
There are 125.60 Females per 100 Males in Hortonville.
What is the Median Population Age in Hortonville?
Median Population Age in Hortonville is 45.9 Years.
What is the Average Family Size in Hortonville
Average Family Size in Hortonville is 2.3 People.
What is the Average Household Size in Hortonville
Average Household Size in Hortonville is 2.0 People.
How Large is the Labor Force in Hortonville?
There are 98 People in the Labor Forcein in Hortonville.
What is the Percentage of People in the Labor Force in Hortonville?
37.4% of People are in the Labor Force in Hortonville.