Rhinebeck, NY Map & Demographics
Rhinebeck Map
Rhinebeck Overview
$62,887
PER CAPITA INCOME
$119,695
AVG FAMILY INCOME
$73,910
AVG HOUSEHOLD INCOME
27.1%
WAGE / INCOME GAP [ % ]
72.9¢/ $1
WAGE / INCOME GAP [ $ ]
0.49
INEQUALITY / GINI INDEX
2,693
TOTAL POPULATION
1,182
MALE POPULATION
1,511
FEMALE POPULATION
78.23
MALES / 100 FEMALES
127.83
FEMALES / 100 MALES
52.1
MEDIAN AGE
2.4
AVG FAMILY SIZE
1.8
AVG HOUSEHOLD SIZE
1,373
LABOR FORCE [ PEOPLE ]
58.2%
PERCENT IN LABOR FORCE
6.0%
UNEMPLOYMENT RATE
Rhinebeck Zip Codes
Rhinebeck Area Codes
Income in Rhinebeck
Income Overview in Rhinebeck
Per Capita Income in Rhinebeck is $62,887, while median incomes of families and households are $119,695 and $73,910 respectively.
| Characteristic | Number | Measure |
| Per Capita Income | 2,693 | $62,887 |
| Median Family Income | 722 | $119,695 |
| Mean Family Income | 722 | $156,000 |
| Median Household Income | 1,452 | $73,910 |
| Mean Household Income | 1,452 | $115,292 |
| Income Deficit | 722 | $0 |
| Wage / Income Gap (%) | 2,693 | 27.07% |
| Wage / Income Gap ($) | 2,693 | 72.93¢ per $1 |
| Gini / Inequality Index | 2,693 | 0.49 |
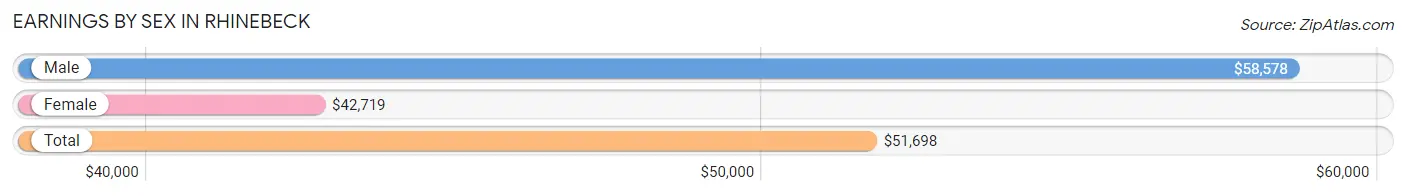
Earnings by Sex in Rhinebeck
Average Earnings in Rhinebeck are $51,698, $58,578 for men and $42,719 for women, a difference of 27.1%.
| Sex | Number | Average Earnings |
| Male | 713 (49.0%) | $58,578 |
| Female | 741 (51.0%) | $42,719 |
| Total | 1,454 (100.0%) | $51,698 |
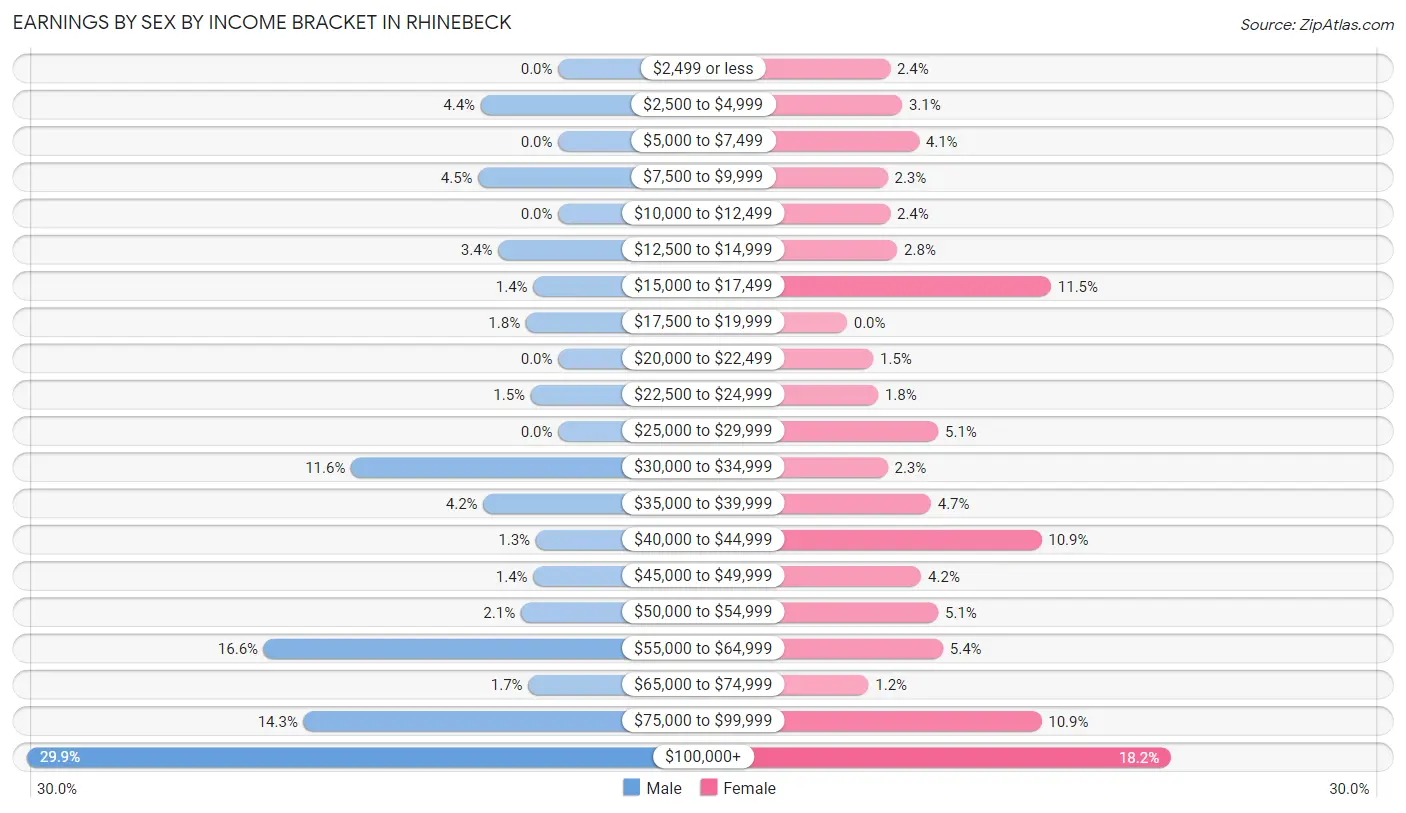
Earnings by Sex by Income Bracket in Rhinebeck
The most common earnings brackets in Rhinebeck are $100,000+ for men (213 | 29.9%) and $100,000+ for women (135 | 18.2%).
| Income | Male | Female |
| $2,499 or less | 0 (0.0%) | 18 (2.4%) |
| $2,500 to $4,999 | 31 (4.3%) | 23 (3.1%) |
| $5,000 to $7,499 | 0 (0.0%) | 30 (4.1%) |
| $7,500 to $9,999 | 32 (4.5%) | 17 (2.3%) |
| $10,000 to $12,499 | 0 (0.0%) | 18 (2.4%) |
| $12,500 to $14,999 | 24 (3.4%) | 21 (2.8%) |
| $15,000 to $17,499 | 10 (1.4%) | 85 (11.5%) |
| $17,500 to $19,999 | 13 (1.8%) | 0 (0.0%) |
| $20,000 to $22,499 | 0 (0.0%) | 11 (1.5%) |
| $22,500 to $24,999 | 11 (1.5%) | 13 (1.8%) |
| $25,000 to $29,999 | 0 (0.0%) | 38 (5.1%) |
| $30,000 to $34,999 | 83 (11.6%) | 17 (2.3%) |
| $35,000 to $39,999 | 30 (4.2%) | 35 (4.7%) |
| $40,000 to $44,999 | 9 (1.3%) | 81 (10.9%) |
| $45,000 to $49,999 | 10 (1.4%) | 31 (4.2%) |
| $50,000 to $54,999 | 15 (2.1%) | 38 (5.1%) |
| $55,000 to $64,999 | 118 (16.6%) | 40 (5.4%) |
| $65,000 to $74,999 | 12 (1.7%) | 9 (1.2%) |
| $75,000 to $99,999 | 102 (14.3%) | 81 (10.9%) |
| $100,000+ | 213 (29.9%) | 135 (18.2%) |
| Total | 713 (100.0%) | 741 (100.0%) |
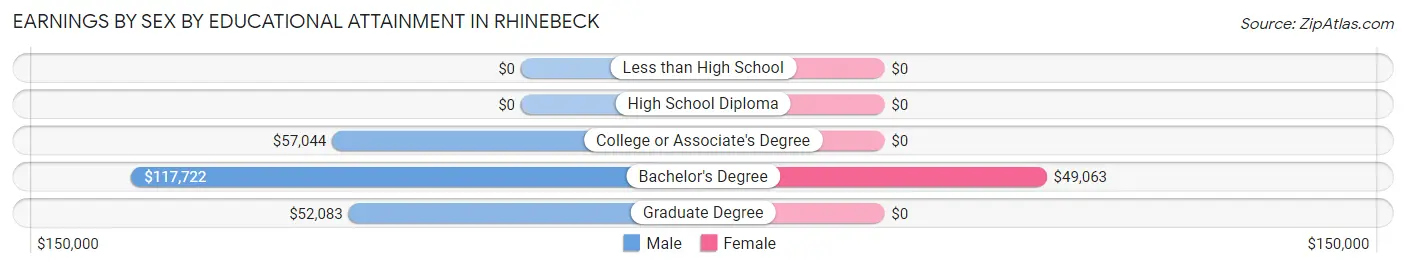
Earnings by Sex by Educational Attainment in Rhinebeck
Average earnings in Rhinebeck are $61,250 for men and $43,250 for women, a difference of 29.4%. Men with an educational attainment of bachelor's degree enjoy the highest average annual earnings of $117,722, while those with graduate degree education earn the least with $52,083. Women with an educational attainment of bachelor's degree earn the most with the average annual earnings of $49,063, while those with bachelor's degree education have the smallest earnings of $49,063.
| Educational Attainment | Male Income | Female Income |
| Less than High School | - | - |
| High School Diploma | - | - |
| College or Associate's Degree | $57,044 | $0 |
| Bachelor's Degree | $117,722 | $49,063 |
| Graduate Degree | $52,083 | $0 |
| Total | $61,250 | $43,250 |
Family Income in Rhinebeck
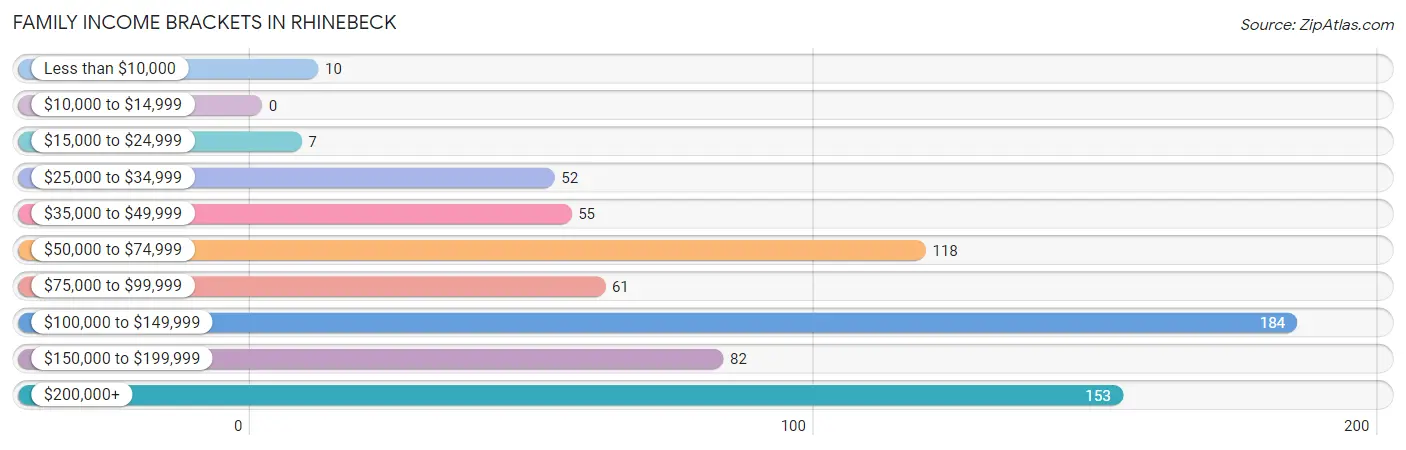
Family Income Brackets in Rhinebeck
According to the Rhinebeck family income data, there are 184 families falling into the $100,000 to $149,999 income range, which is the most common income bracket and makes up 25.5% of all families.
| Income Bracket | # Families | % Families |
| Less than $10,000 | 10 | 1.4% |
| $10,000 to $14,999 | 0 | 0.0% |
| $15,000 to $24,999 | 7 | 1.0% |
| $25,000 to $34,999 | 52 | 7.2% |
| $35,000 to $49,999 | 55 | 7.6% |
| $50,000 to $74,999 | 118 | 16.3% |
| $75,000 to $99,999 | 61 | 8.4% |
| $100,000 to $149,999 | 184 | 25.5% |
| $150,000 to $199,999 | 82 | 11.4% |
| $200,000+ | 153 | 21.2% |
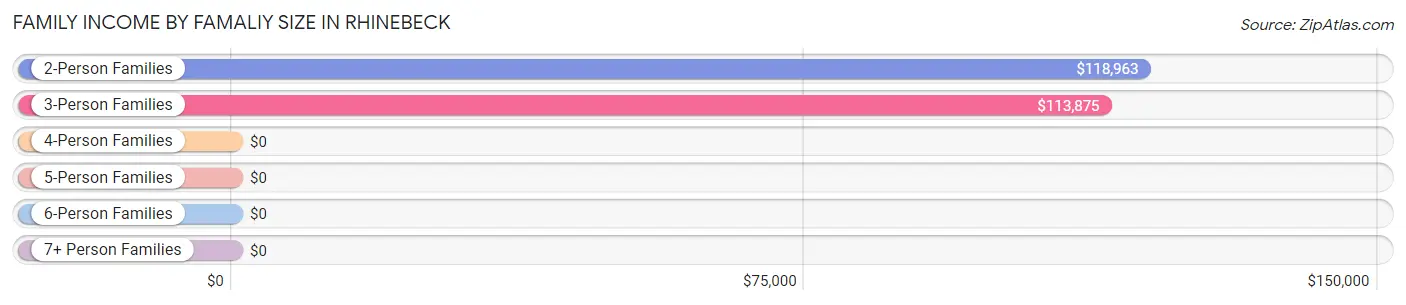
Family Income by Famaliy Size in Rhinebeck
2-person families (526 | 72.9%) account for the highest median family income in Rhinebeck with $118,963 per family, while 2-person families (526 | 72.9%) have the highest median income of $59,482 per family member.
| Income Bracket | # Families | Median Income |
| 2-Person Families | 526 (72.9%) | $118,963 |
| 3-Person Families | 85 (11.8%) | $113,875 |
| 4-Person Families | 111 (15.4%) | $0 |
| 5-Person Families | 0 (0.0%) | $0 |
| 6-Person Families | 0 (0.0%) | $0 |
| 7+ Person Families | 0 (0.0%) | $0 |
| Total | 722 (100.0%) | $119,695 |
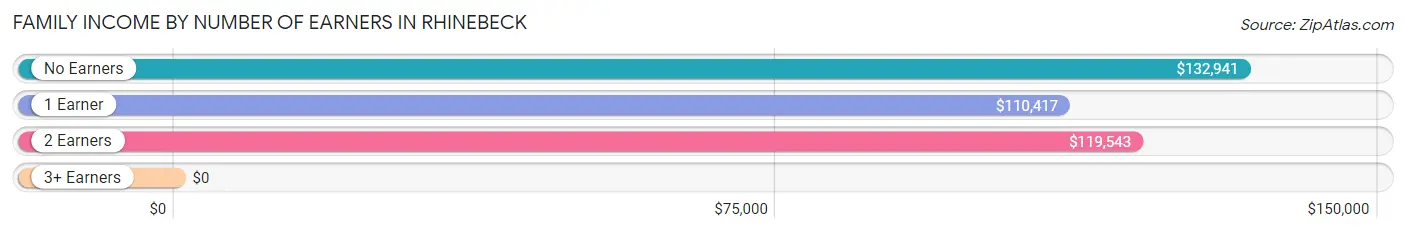
Family Income by Number of Earners in Rhinebeck
| Number of Earners | # Families | Median Income |
| No Earners | 96 (13.3%) | $132,941 |
| 1 Earner | 234 (32.4%) | $110,417 |
| 2 Earners | 373 (51.7%) | $119,543 |
| 3+ Earners | 19 (2.6%) | $0 |
| Total | 722 (100.0%) | $119,695 |
Household Income in Rhinebeck
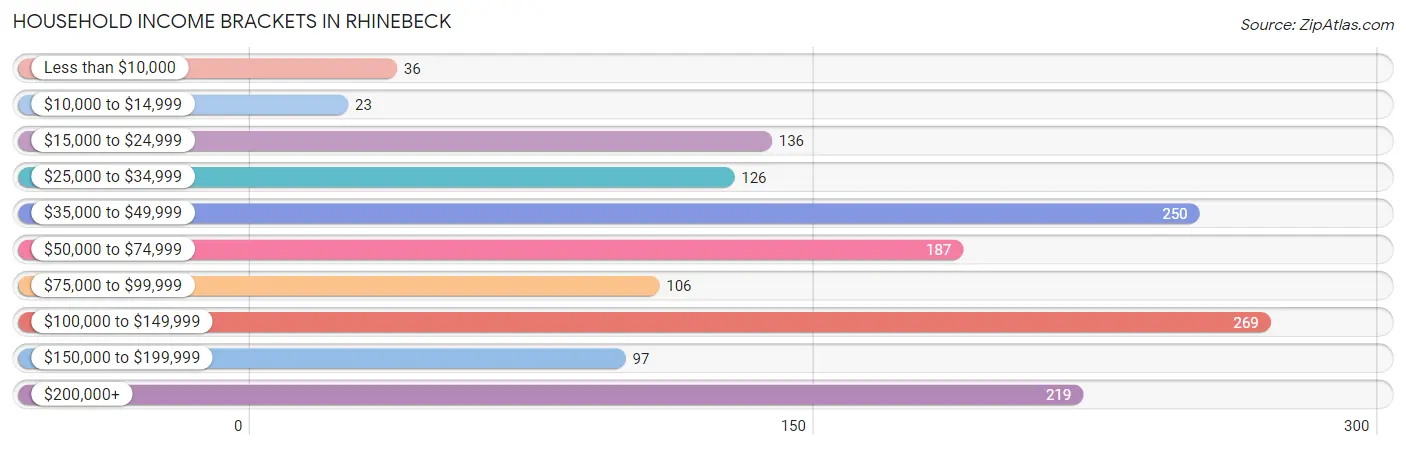
Household Income Brackets in Rhinebeck
With 269 households falling in the category, the $100,000 to $149,999 income range is the most frequent in Rhinebeck, accounting for 18.5% of all households. In contrast, only 23 households (1.6%) fall into the $10,000 to $14,999 income bracket, making it the least populous group.
| Income Bracket | # Households | % Households |
| Less than $10,000 | 36 | 2.5% |
| $10,000 to $14,999 | 23 | 1.6% |
| $15,000 to $24,999 | 136 | 9.4% |
| $25,000 to $34,999 | 126 | 8.7% |
| $35,000 to $49,999 | 250 | 17.2% |
| $50,000 to $74,999 | 187 | 12.9% |
| $75,000 to $99,999 | 106 | 7.3% |
| $100,000 to $149,999 | 269 | 18.5% |
| $150,000 to $199,999 | 97 | 6.7% |
| $200,000+ | 219 | 15.1% |
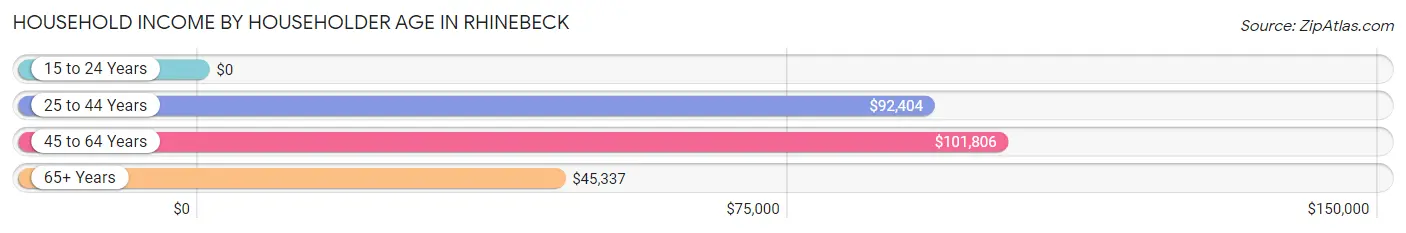
Household Income by Householder Age in Rhinebeck
The median household income in Rhinebeck is $73,910, with the highest median household income of $101,806 found in the 45 to 64 years age bracket for the primary householder. A total of 489 households (33.7%) fall into this category.
| Income Bracket | # Households | Median Income |
| 15 to 24 Years | 0 (0.0%) | $0 |
| 25 to 44 Years | 410 (28.2%) | $92,404 |
| 45 to 64 Years | 489 (33.7%) | $101,806 |
| 65+ Years | 553 (38.1%) | $45,337 |
| Total | 1,452 (100.0%) | $73,910 |
Poverty in Rhinebeck
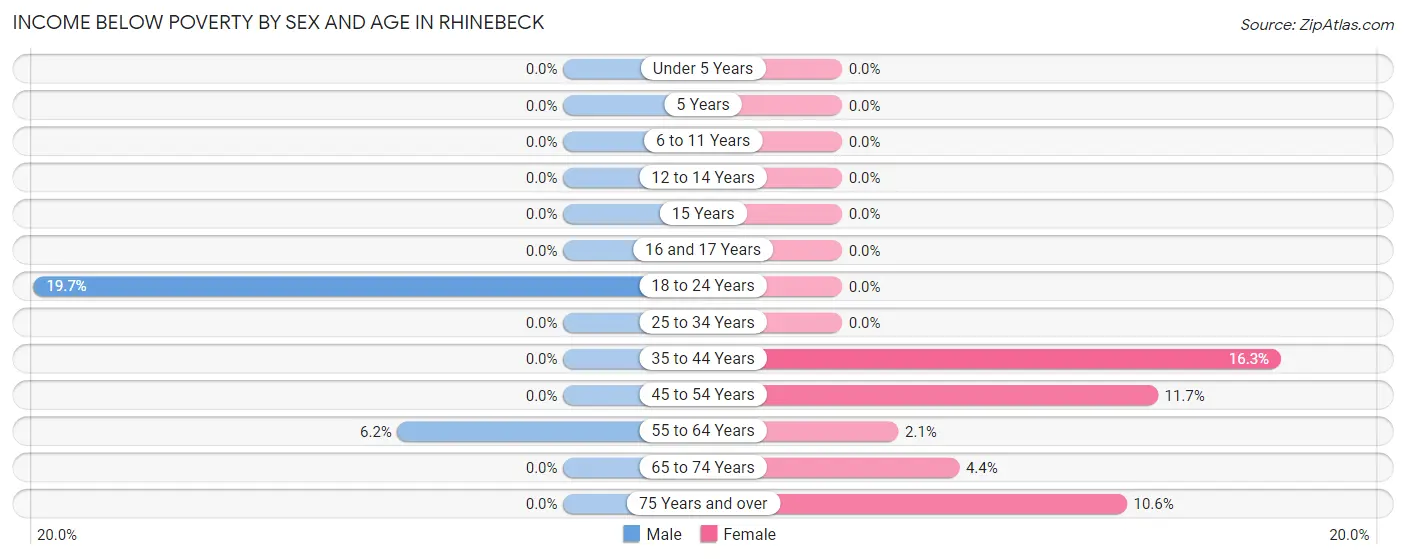
Income Below Poverty by Sex and Age in Rhinebeck
With 2.0% poverty level for males and 5.7% for females among the residents of Rhinebeck, 18 to 24 year old males and 35 to 44 year old females are the most vulnerable to poverty, with 12 males (19.7%) and 22 females (16.3%) in their respective age groups living below the poverty level.
| Age Bracket | Male | Female |
| Under 5 Years | 0 (0.0%) | 0 (0.0%) |
| 5 Years | 0 (0.0%) | 0 (0.0%) |
| 6 to 11 Years | 0 (0.0%) | 0 (0.0%) |
| 12 to 14 Years | 0 (0.0%) | 0 (0.0%) |
| 15 Years | 0 (0.0%) | 0 (0.0%) |
| 16 and 17 Years | 0 (0.0%) | 0 (0.0%) |
| 18 to 24 Years | 12 (19.7%) | 0 (0.0%) |
| 25 to 34 Years | 0 (0.0%) | 0 (0.0%) |
| 35 to 44 Years | 0 (0.0%) | 22 (16.3%) |
| 45 to 54 Years | 0 (0.0%) | 17 (11.7%) |
| 55 to 64 Years | 11 (6.1%) | 5 (2.1%) |
| 65 to 74 Years | 0 (0.0%) | 11 (4.3%) |
| 75 Years and over | 0 (0.0%) | 26 (10.6%) |
| Total | 23 (2.0%) | 81 (5.7%) |
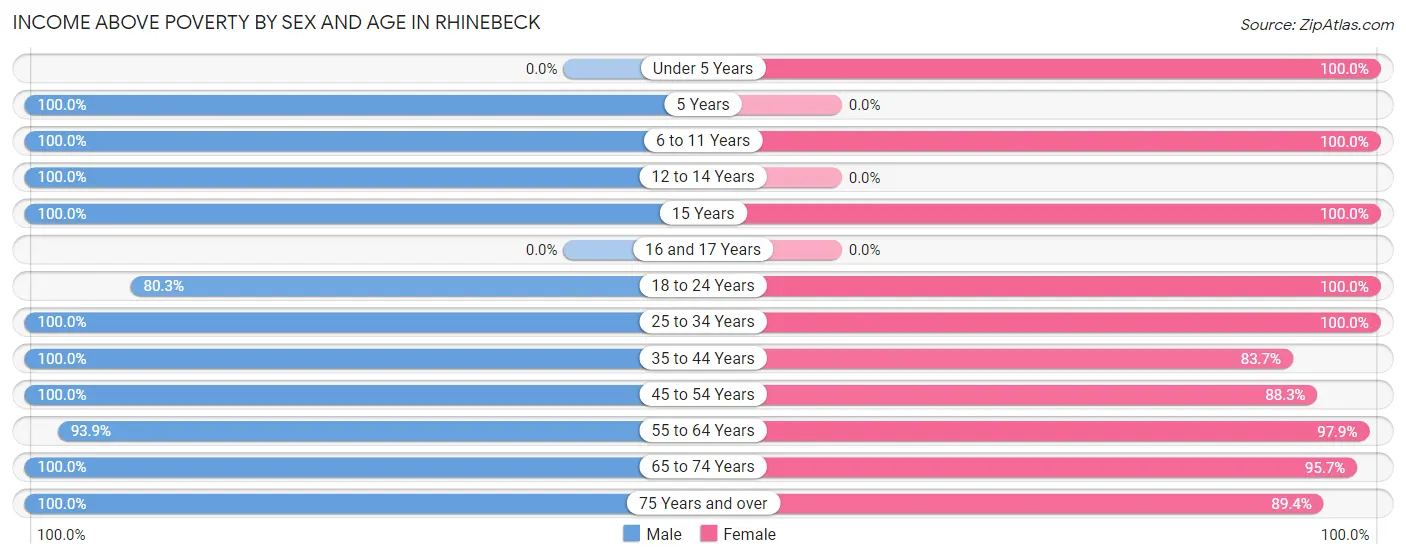
Income Above Poverty by Sex and Age in Rhinebeck
According to the poverty statistics in Rhinebeck, males aged 5 years and females aged under 5 years are the age groups that are most secure financially, with 100.0% of males and 100.0% of females in these age groups living above the poverty line.
| Age Bracket | Male | Female |
| Under 5 Years | 0 (0.0%) | 28 (100.0%) |
| 5 Years | 50 (100.0%) | 0 (0.0%) |
| 6 to 11 Years | 89 (100.0%) | 85 (100.0%) |
| 12 to 14 Years | 18 (100.0%) | 0 (0.0%) |
| 15 Years | 12 (100.0%) | 28 (100.0%) |
| 16 and 17 Years | 0 (0.0%) | 0 (0.0%) |
| 18 to 24 Years | 49 (80.3%) | 37 (100.0%) |
| 25 to 34 Years | 189 (100.0%) | 233 (100.0%) |
| 35 to 44 Years | 148 (100.0%) | 113 (83.7%) |
| 45 to 54 Years | 121 (100.0%) | 128 (88.3%) |
| 55 to 64 Years | 168 (93.9%) | 234 (97.9%) |
| 65 to 74 Years | 196 (100.0%) | 242 (95.7%) |
| 75 Years and over | 68 (100.0%) | 220 (89.4%) |
| Total | 1,108 (98.0%) | 1,348 (94.3%) |
Income Below Poverty Among Married-Couple Families in Rhinebeck
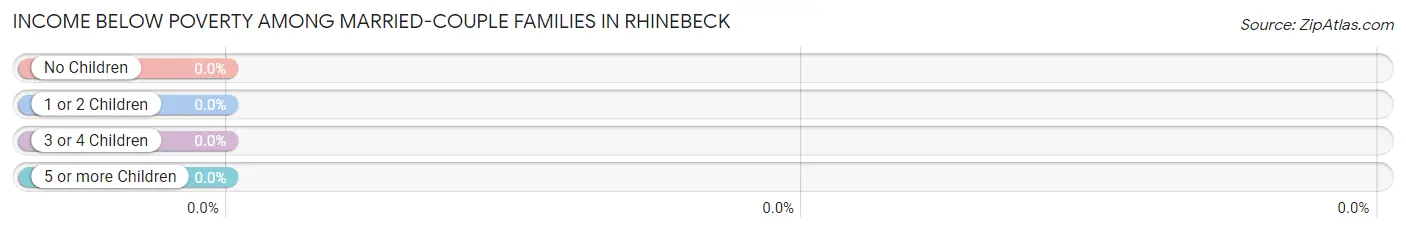
| Children | Above Poverty | Below Poverty |
| No Children | 466 (100.0%) | 0 (0.0%) |
| 1 or 2 Children | 82 (100.0%) | 0 (0.0%) |
| 3 or 4 Children | 0 (0.0%) | 0 (0.0%) |
| 5 or more Children | 0 (0.0%) | 0 (0.0%) |
| Total | 548 (100.0%) | 0 (0.0%) |
Income Below Poverty Among Single-Parent Households in Rhinebeck
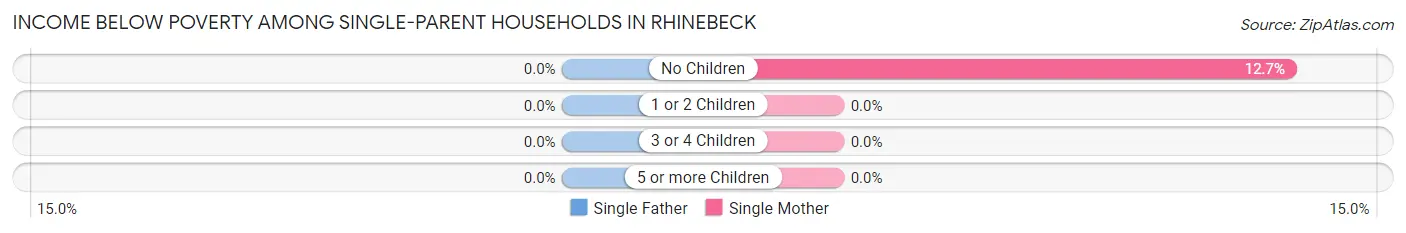
| Children | Single Father | Single Mother |
| No Children | 0 (0.0%) | 10 (12.7%) |
| 1 or 2 Children | 0 (0.0%) | 0 (0.0%) |
| 3 or 4 Children | 0 (0.0%) | 0 (0.0%) |
| 5 or more Children | 0 (0.0%) | 0 (0.0%) |
| Total | 0 (0.0%) | 10 (7.9%) |
Income Below Poverty Among Married-Couple vs Single-Parent Households in Rhinebeck
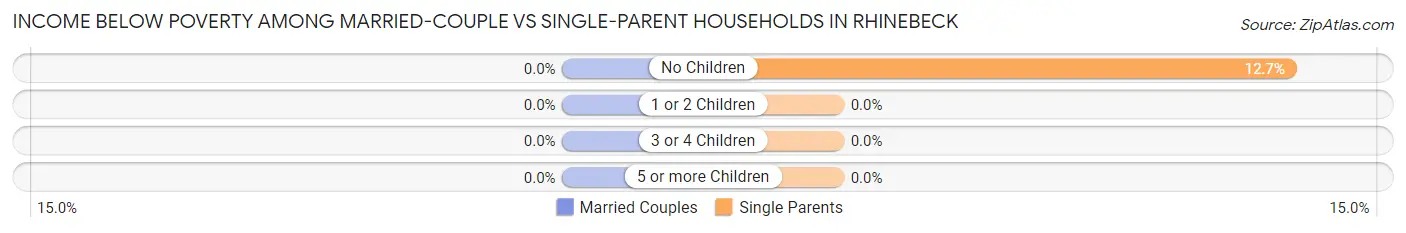
| Children | Married-Couple Families | Single-Parent Households |
| No Children | 0 (0.0%) | 10 (12.7%) |
| 1 or 2 Children | 0 (0.0%) | 0 (0.0%) |
| 3 or 4 Children | 0 (0.0%) | 0 (0.0%) |
| 5 or more Children | 0 (0.0%) | 0 (0.0%) |
| Total | 0 (0.0%) | 10 (5.8%) |
Race in Rhinebeck
The most populous races in Rhinebeck are White / Caucasian (2,278 | 84.6%), Some other Race (250 | 9.3%), and Hispanic or Latino (249 | 9.2%).
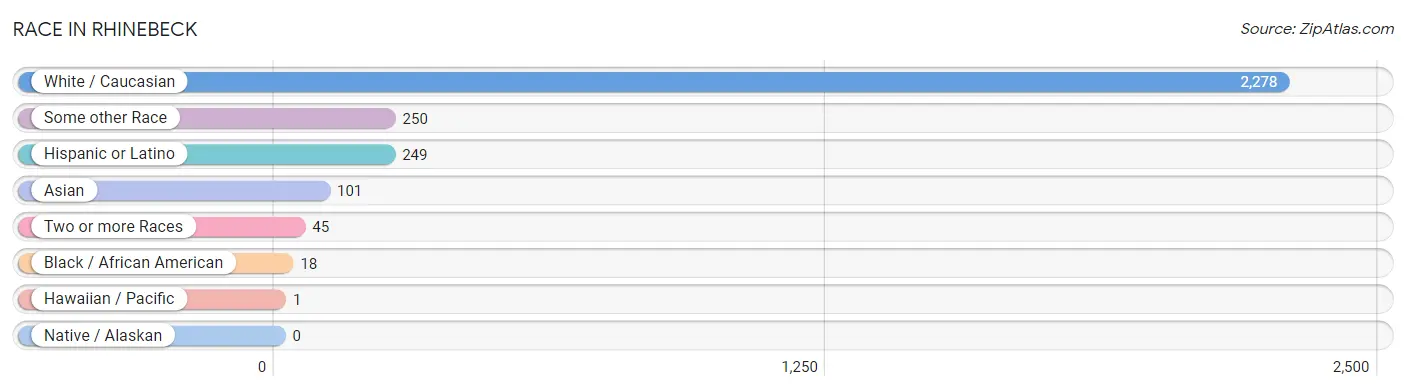
| Race | # Population | % Population |
| Asian | 101 | 3.7% |
| Black / African American | 18 | 0.7% |
| Hawaiian / Pacific | 1 | 0.0% |
| Hispanic or Latino | 249 | 9.2% |
| Native / Alaskan | 0 | 0.0% |
| White / Caucasian | 2,278 | 84.6% |
| Two or more Races | 45 | 1.7% |
| Some other Race | 250 | 9.3% |
| Total | 2,693 | 100.0% |
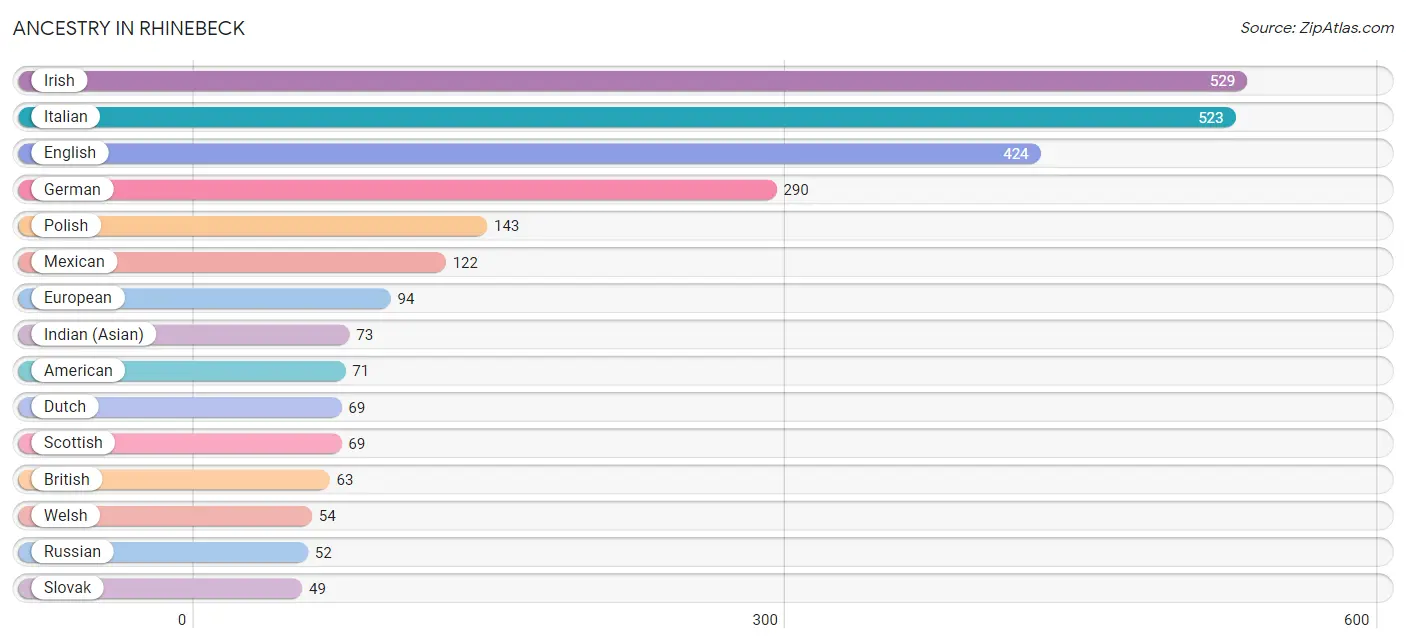
Ancestry in Rhinebeck
The most populous ancestries reported in Rhinebeck are Irish (529 | 19.6%), Italian (523 | 19.4%), English (424 | 15.7%), German (290 | 10.8%), and Polish (143 | 5.3%), together accounting for 70.9% of all Rhinebeck residents.
| Ancestry | # Population | % Population |
| Albanian | 3 | 0.1% |
| American | 71 | 2.6% |
| Apache | 3 | 0.1% |
| Arab | 19 | 0.7% |
| Austrian | 19 | 0.7% |
| British | 63 | 2.3% |
| Burmese | 5 | 0.2% |
| Colombian | 17 | 0.6% |
| Croatian | 29 | 1.1% |
| Czech | 21 | 0.8% |
| Danish | 9 | 0.3% |
| Dutch | 69 | 2.6% |
| Eastern European | 20 | 0.7% |
| English | 424 | 15.7% |
| European | 94 | 3.5% |
| German | 290 | 10.8% |
| Hungarian | 9 | 0.3% |
| Indian (Asian) | 73 | 2.7% |
| Irish | 529 | 19.6% |
| Italian | 523 | 19.4% |
| Lebanese | 19 | 0.7% |
| Lithuanian | 6 | 0.2% |
| Mexican | 122 | 4.5% |
| Norwegian | 42 | 1.6% |
| Polish | 143 | 5.3% |
| Puerto Rican | 11 | 0.4% |
| Romanian | 3 | 0.1% |
| Russian | 52 | 1.9% |
| Scotch-Irish | 46 | 1.7% |
| Scottish | 69 | 2.6% |
| Slovak | 49 | 1.8% |
| Slovene | 9 | 0.3% |
| South American | 17 | 0.6% |
| Spaniard | 40 | 1.5% |
| Spanish | 11 | 0.4% |
| Sri Lankan | 13 | 0.5% |
| Swedish | 9 | 0.3% |
| Thai | 34 | 1.3% |
| Ukrainian | 40 | 1.5% |
| Welsh | 54 | 2.0% | View All 40 Rows |
Immigrants in Rhinebeck
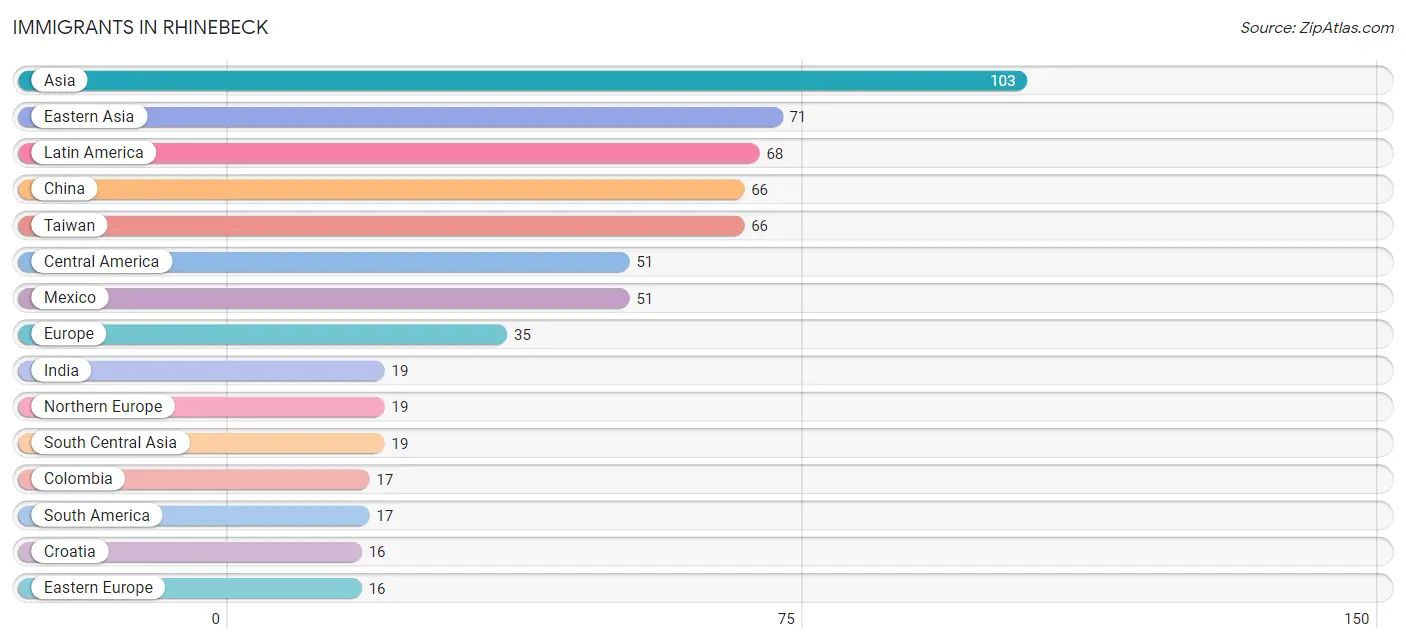
The most numerous immigrant groups reported in Rhinebeck came from Asia (103 | 3.8%), Eastern Asia (71 | 2.6%), Latin America (68 | 2.5%), China (66 | 2.5%), and Taiwan (66 | 2.5%), together accounting for 13.9% of all Rhinebeck residents.
| Immigration Origin | # Population | % Population |
| Asia | 103 | 3.8% |
| Canada | 10 | 0.4% |
| Central America | 51 | 1.9% |
| China | 66 | 2.5% |
| Colombia | 17 | 0.6% |
| Croatia | 16 | 0.6% |
| Eastern Asia | 71 | 2.6% |
| Eastern Europe | 16 | 0.6% |
| England | 9 | 0.3% |
| Europe | 35 | 1.3% |
| India | 19 | 0.7% |
| Korea | 5 | 0.2% |
| Latin America | 68 | 2.5% |
| Mexico | 51 | 1.9% |
| Northern Europe | 19 | 0.7% |
| South America | 17 | 0.6% |
| South Central Asia | 19 | 0.7% |
| South Eastern Asia | 13 | 0.5% |
| Taiwan | 66 | 2.5% |
| Vietnam | 13 | 0.5% | View All 20 Rows |
Sex and Age in Rhinebeck
Sex and Age in Rhinebeck
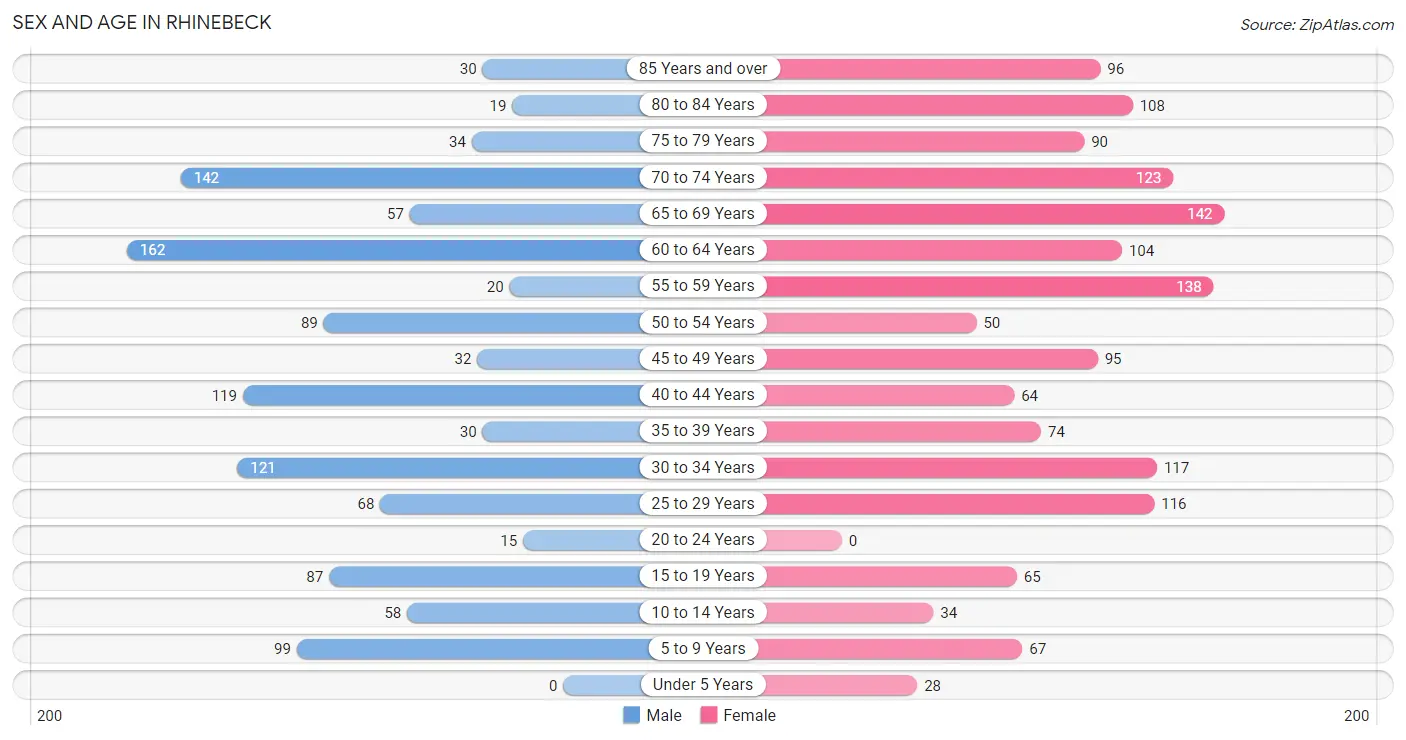
The most populous age groups in Rhinebeck are 60 to 64 Years (162 | 13.7%) for men and 65 to 69 Years (142 | 9.4%) for women.
| Age Bracket | Male | Female |
| Under 5 Years | 0 (0.0%) | 28 (1.8%) |
| 5 to 9 Years | 99 (8.4%) | 67 (4.4%) |
| 10 to 14 Years | 58 (4.9%) | 34 (2.2%) |
| 15 to 19 Years | 87 (7.4%) | 65 (4.3%) |
| 20 to 24 Years | 15 (1.3%) | 0 (0.0%) |
| 25 to 29 Years | 68 (5.8%) | 116 (7.7%) |
| 30 to 34 Years | 121 (10.2%) | 117 (7.7%) |
| 35 to 39 Years | 30 (2.5%) | 74 (4.9%) |
| 40 to 44 Years | 119 (10.1%) | 64 (4.2%) |
| 45 to 49 Years | 32 (2.7%) | 95 (6.3%) |
| 50 to 54 Years | 89 (7.5%) | 50 (3.3%) |
| 55 to 59 Years | 20 (1.7%) | 138 (9.1%) |
| 60 to 64 Years | 162 (13.7%) | 104 (6.9%) |
| 65 to 69 Years | 57 (4.8%) | 142 (9.4%) |
| 70 to 74 Years | 142 (12.0%) | 123 (8.1%) |
| 75 to 79 Years | 34 (2.9%) | 90 (6.0%) |
| 80 to 84 Years | 19 (1.6%) | 108 (7.1%) |
| 85 Years and over | 30 (2.5%) | 96 (6.4%) |
| Total | 1,182 (100.0%) | 1,511 (100.0%) |
Families and Households in Rhinebeck
Median Family Size in Rhinebeck
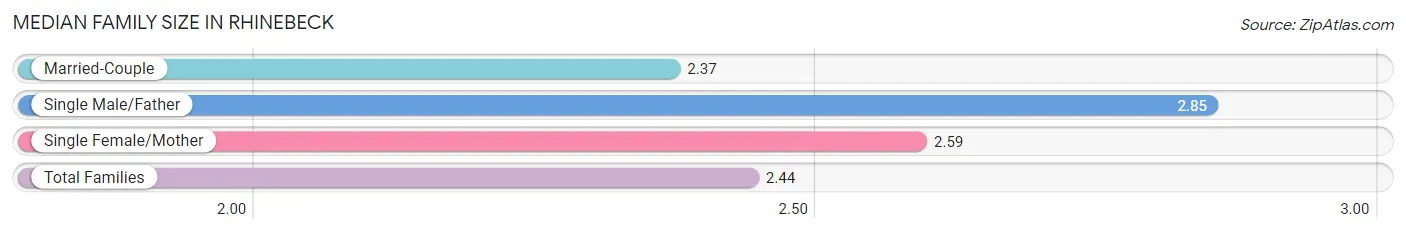
The median family size in Rhinebeck is 2.44 persons per family, with single male/father families (47 | 6.5%) accounting for the largest median family size of 2.85 persons per family. On the other hand, married-couple families (548 | 75.9%) represent the smallest median family size with 2.37 persons per family.
| Family Type | # Families | Family Size |
| Married-Couple | 548 (75.9%) | 2.37 |
| Single Male/Father | 47 (6.5%) | 2.85 |
| Single Female/Mother | 127 (17.6%) | 2.59 |
| Total Families | 722 (100.0%) | 2.44 |
Median Household Size in Rhinebeck
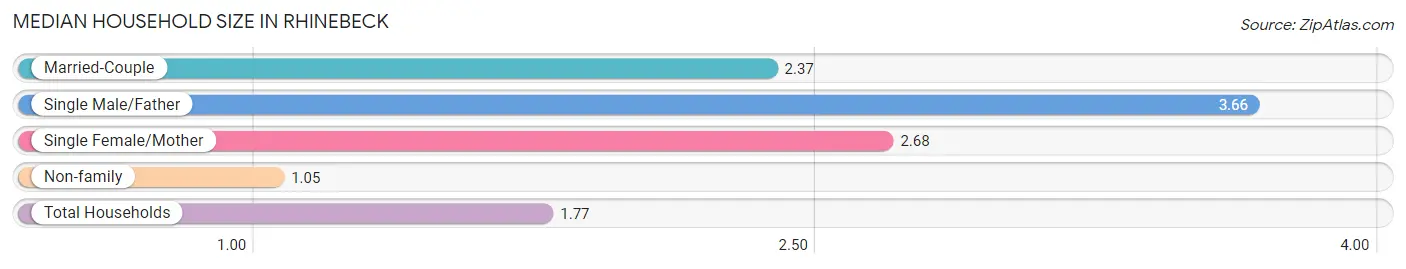
The median household size in Rhinebeck is 1.77 persons per household, with single male/father households (47 | 3.2%) accounting for the largest median household size of 3.66 persons per household. non-family households (730 | 50.3%) represent the smallest median household size with 1.05 persons per household.
| Household Type | # Households | Household Size |
| Married-Couple | 548 (37.7%) | 2.37 |
| Single Male/Father | 47 (3.2%) | 3.66 |
| Single Female/Mother | 127 (8.7%) | 2.68 |
| Non-family | 730 (50.3%) | 1.05 |
| Total Households | 1,452 (100.0%) | 1.77 |
Household Size by Marriage Status in Rhinebeck
Out of a total of 1,452 households in Rhinebeck, 722 (49.7%) are family households, while 730 (50.3%) are nonfamily households. The most numerous type of family households are 2-person households, comprising 508, and the most common type of nonfamily households are 1-person households, comprising 690.
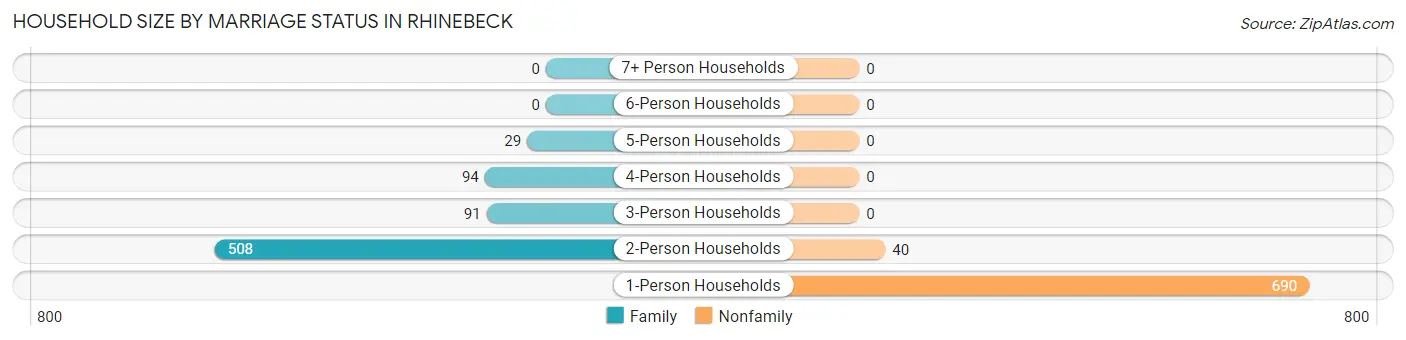
| Household Size | Family Households | Nonfamily Households |
| 1-Person Households | - | 690 (47.5%) |
| 2-Person Households | 508 (35.0%) | 40 (2.8%) |
| 3-Person Households | 91 (6.3%) | 0 (0.0%) |
| 4-Person Households | 94 (6.5%) | 0 (0.0%) |
| 5-Person Households | 29 (2.0%) | 0 (0.0%) |
| 6-Person Households | 0 (0.0%) | 0 (0.0%) |
| 7+ Person Households | 0 (0.0%) | 0 (0.0%) |
| Total | 722 (49.7%) | 730 (50.3%) |
Female Fertility in Rhinebeck
Fertility by Age in Rhinebeck
| Age Bracket | Women with Births | Births / 1,000 Women |
| 15 to 19 years | 0 (0.0%) | 0.0 |
| 20 to 34 years | 0 (0.0%) | 0.0 |
| 35 to 50 years | 0 (0.0%) | 0.0 |
| Total | 0 (0.0%) | 0.0 |
Fertility by Age by Marriage Status in Rhinebeck
| Age Bracket | Married | Unmarried |
| 15 to 19 years | 0 (0.0%) | 0 (0.0%) |
| 20 to 34 years | 0 (0.0%) | 0 (0.0%) |
| 35 to 50 years | 0 (0.0%) | 0 (0.0%) |
| Total | 0 (0.0%) | 0 (0.0%) |
Fertility by Education in Rhinebeck
| Educational Attainment | Women with Births | Births / 1,000 Women |
| Less than High School | 0 (0.0%) | 0.0 |
| High School Diploma | 0 (0.0%) | 0.0 |
| College or Associate's Degree | 0 (0.0%) | 0.0 |
| Bachelor's Degree | 0 (0.0%) | 0.0 |
| Graduate Degree | 0 (0.0%) | 0.0 |
| Total | 0 (0.0%) | 0.0 |
Fertility by Education by Marriage Status in Rhinebeck
| Educational Attainment | Married | Unmarried |
| Less than High School | 0 (0.0%) | 0 (0.0%) |
| High School Diploma | 0 (0.0%) | 0 (0.0%) |
| College or Associate's Degree | 0 (0.0%) | 0 (0.0%) |
| Bachelor's Degree | 0 (0.0%) | 0 (0.0%) |
| Graduate Degree | 0 (0.0%) | 0 (0.0%) |
| Total | 0 (0.0%) | 0 (0.0%) |
Employment Characteristics in Rhinebeck
Employment by Class of Employer in Rhinebeck
Among the 1,255 employed individuals in Rhinebeck, private company employees (720 | 57.4%), not-for-profit organizations (215 | 17.1%), and self-employed (not incorporated) (152 | 12.1%) make up the most common classes of employment.
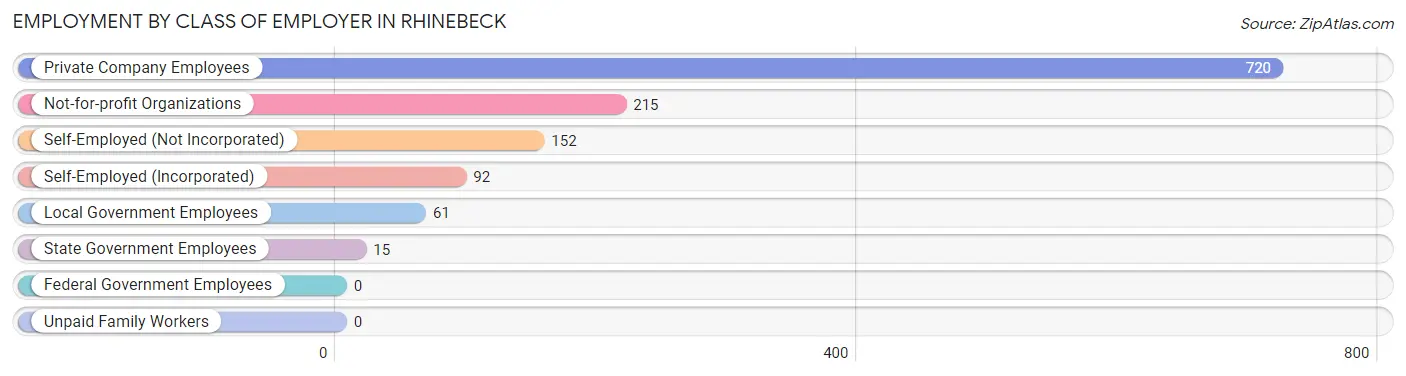
| Employer Class | # Employees | % Employees |
| Private Company Employees | 720 | 57.4% |
| Self-Employed (Incorporated) | 92 | 7.3% |
| Self-Employed (Not Incorporated) | 152 | 12.1% |
| Not-for-profit Organizations | 215 | 17.1% |
| Local Government Employees | 61 | 4.9% |
| State Government Employees | 15 | 1.2% |
| Federal Government Employees | 0 | 0.0% |
| Unpaid Family Workers | 0 | 0.0% |
| Total | 1,255 | 100.0% |
Employment Status by Age in Rhinebeck
According to the labor force statistics for Rhinebeck, out of the total population over 16 years of age (2,359), 58.2% or 1,373 individuals are in the labor force, with 6.0% or 82 of them unemployed. The age group with the highest labor force participation rate is 25 to 29 years, with 100.0% or 184 individuals in the labor force. Within the labor force, the 16 to 19 years age range has the highest percentage of unemployed individuals, with 30.0% or 12 of them being unemployed.
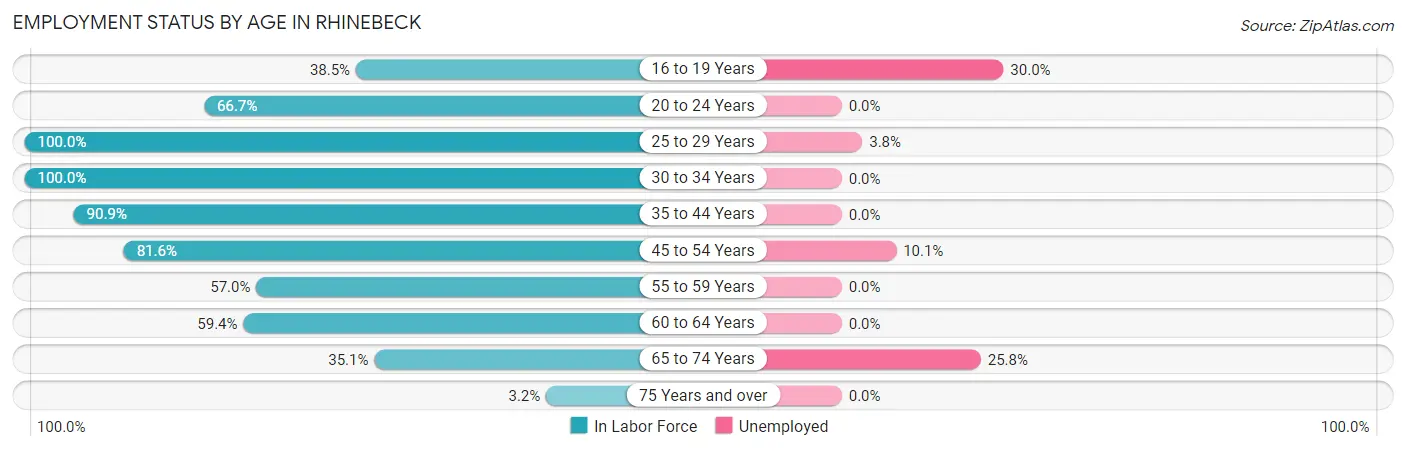
| Age Bracket | In Labor Force | Unemployed |
| 16 to 19 Years | 40 (38.5%) | 12 (30.0%) |
| 20 to 24 Years | 10 (66.7%) | 0 (0.0%) |
| 25 to 29 Years | 184 (100.0%) | 7 (3.8%) |
| 30 to 34 Years | 238 (100.0%) | 0 (0.0%) |
| 35 to 44 Years | 261 (90.9%) | 0 (0.0%) |
| 45 to 54 Years | 217 (81.6%) | 22 (10.1%) |
| 55 to 59 Years | 90 (57.0%) | 0 (0.0%) |
| 60 to 64 Years | 158 (59.4%) | 0 (0.0%) |
| 65 to 74 Years | 163 (35.1%) | 42 (25.8%) |
| 75 Years and over | 12 (3.2%) | 0 (0.0%) |
| Total | 1,373 (58.2%) | 82 (6.0%) |
Employment Status by Educational Attainment in Rhinebeck
According to labor force statistics for Rhinebeck, 82.1% of individuals (1,149) out of the total population between 25 and 64 years of age (1,399) are in the labor force, with 2.5% or 29 of them being unemployed. The group with the highest labor force participation rate are those with the educational attainment of less than high school, with 96.7% or 29 individuals in the labor force. Within the labor force, individuals with bachelor's degree or higher education have the highest percentage of unemployment, with 4.8% or 29 of them being unemployed.
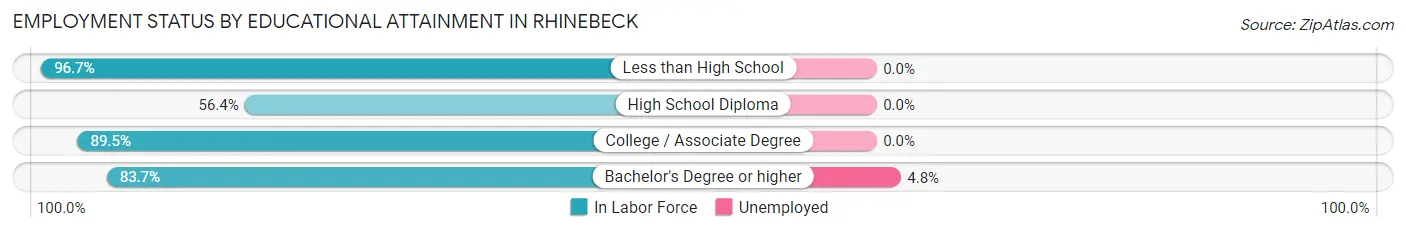
| Educational Attainment | In Labor Force | Unemployed |
| Less than High School | 29 (96.7%) | 0 (0.0%) |
| High School Diploma | 110 (56.4%) | 0 (0.0%) |
| College / Associate Degree | 410 (89.5%) | 0 (0.0%) |
| Bachelor's Degree or higher | 599 (83.7%) | 34 (4.8%) |
| Total | 1,149 (82.1%) | 35 (2.5%) |
Employment Occupations by Sex in Rhinebeck
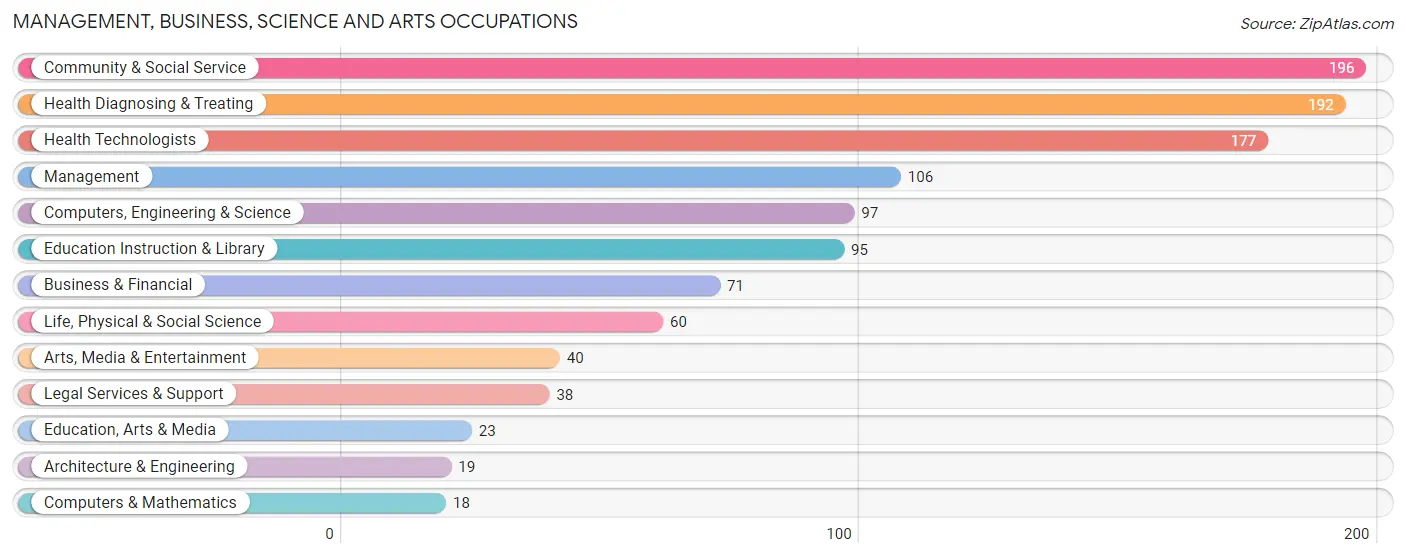
Management, Business, Science and Arts Occupations
The most common Management, Business, Science and Arts occupations in Rhinebeck are Community & Social Service (196 | 15.2%), Health Diagnosing & Treating (192 | 14.9%), Health Technologists (177 | 13.7%), Management (106 | 8.2%), and Computers, Engineering & Science (97 | 7.5%).
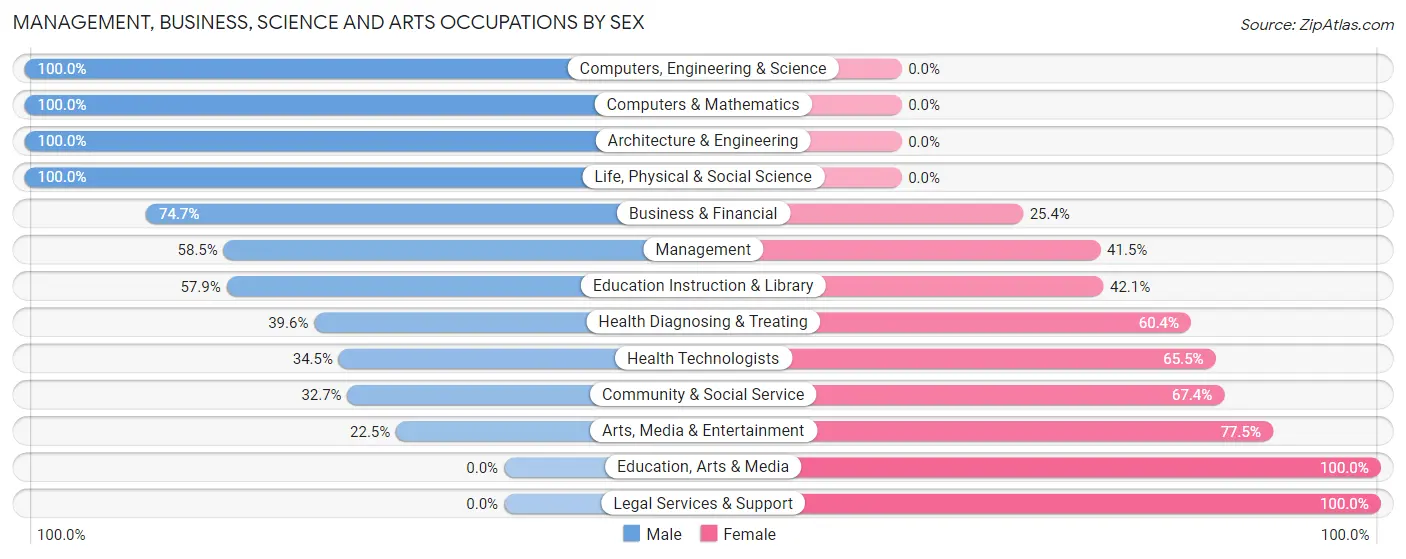
Management, Business, Science and Arts Occupations by Sex
Within the Management, Business, Science and Arts occupations in Rhinebeck, the most male-oriented occupations are Computers, Engineering & Science (100.0%), Computers & Mathematics (100.0%), and Architecture & Engineering (100.0%), while the most female-oriented occupations are Education, Arts & Media (100.0%), Legal Services & Support (100.0%), and Arts, Media & Entertainment (77.5%).
| Occupation | Male | Female |
| Management | 62 (58.5%) | 44 (41.5%) |
| Business & Financial | 53 (74.7%) | 18 (25.4%) |
| Computers, Engineering & Science | 97 (100.0%) | 0 (0.0%) |
| Computers & Mathematics | 18 (100.0%) | 0 (0.0%) |
| Architecture & Engineering | 19 (100.0%) | 0 (0.0%) |
| Life, Physical & Social Science | 60 (100.0%) | 0 (0.0%) |
| Community & Social Service | 64 (32.7%) | 132 (67.3%) |
| Education, Arts & Media | 0 (0.0%) | 23 (100.0%) |
| Legal Services & Support | 0 (0.0%) | 38 (100.0%) |
| Education Instruction & Library | 55 (57.9%) | 40 (42.1%) |
| Arts, Media & Entertainment | 9 (22.5%) | 31 (77.5%) |
| Health Diagnosing & Treating | 76 (39.6%) | 116 (60.4%) |
| Health Technologists | 61 (34.5%) | 116 (65.5%) |
| Total (Category) | 352 (53.2%) | 310 (46.8%) |
| Total (Overall) | 651 (50.5%) | 639 (49.5%) |
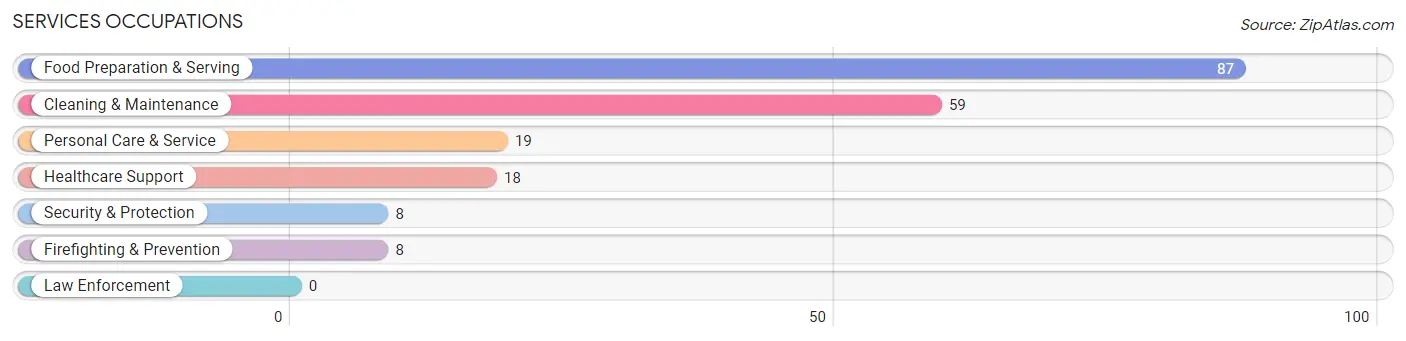
Services Occupations
The most common Services occupations in Rhinebeck are Food Preparation & Serving (87 | 6.7%), Cleaning & Maintenance (59 | 4.6%), Personal Care & Service (19 | 1.5%), Healthcare Support (18 | 1.4%), and Security & Protection (8 | 0.6%).
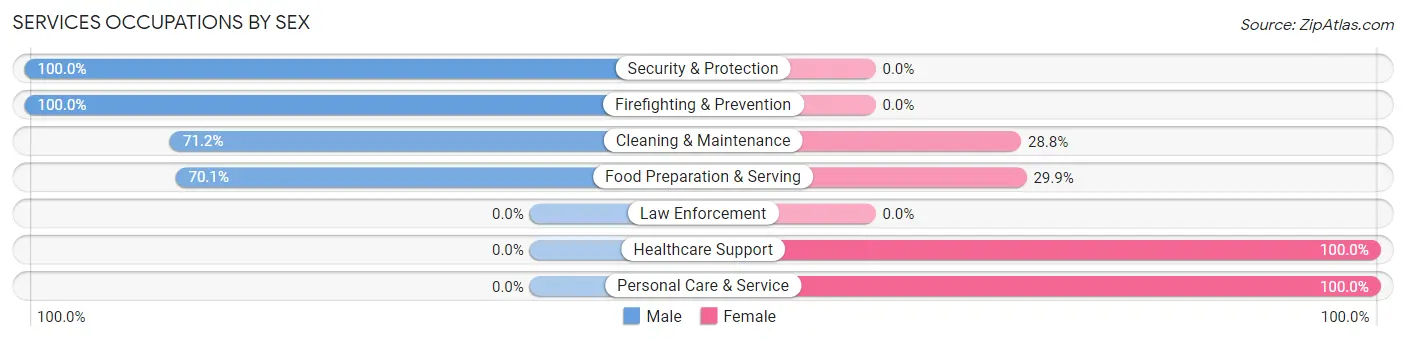
Services Occupations by Sex
Within the Services occupations in Rhinebeck, the most male-oriented occupations are Security & Protection (100.0%), Firefighting & Prevention (100.0%), and Cleaning & Maintenance (71.2%), while the most female-oriented occupations are Healthcare Support (100.0%), Personal Care & Service (100.0%), and Food Preparation & Serving (29.9%).
| Occupation | Male | Female |
| Healthcare Support | 0 (0.0%) | 18 (100.0%) |
| Security & Protection | 8 (100.0%) | 0 (0.0%) |
| Firefighting & Prevention | 8 (100.0%) | 0 (0.0%) |
| Law Enforcement | 0 (0.0%) | 0 (0.0%) |
| Food Preparation & Serving | 61 (70.1%) | 26 (29.9%) |
| Cleaning & Maintenance | 42 (71.2%) | 17 (28.8%) |
| Personal Care & Service | 0 (0.0%) | 19 (100.0%) |
| Total (Category) | 111 (58.1%) | 80 (41.9%) |
| Total (Overall) | 651 (50.5%) | 639 (49.5%) |
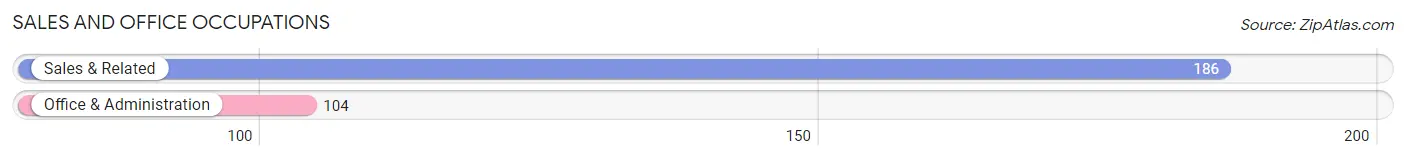
Sales and Office Occupations
The most common Sales and Office occupations in Rhinebeck are Sales & Related (186 | 14.4%), and Office & Administration (104 | 8.1%).
Sales and Office Occupations by Sex
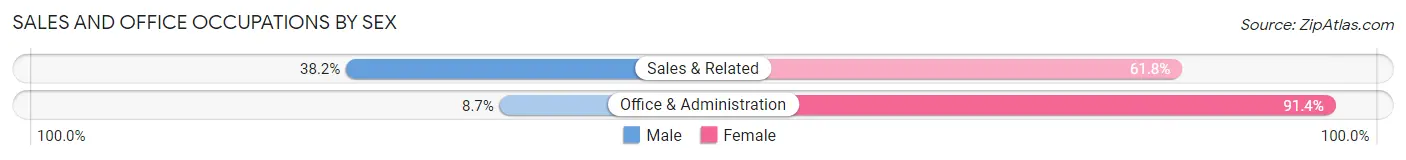
| Occupation | Male | Female |
| Sales & Related | 71 (38.2%) | 115 (61.8%) |
| Office & Administration | 9 (8.6%) | 95 (91.3%) |
| Total (Category) | 80 (27.6%) | 210 (72.4%) |
| Total (Overall) | 651 (50.5%) | 639 (49.5%) |
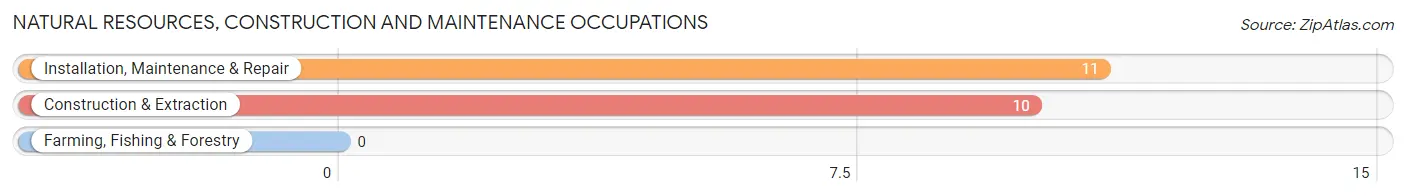
Natural Resources, Construction and Maintenance Occupations
The most common Natural Resources, Construction and Maintenance occupations in Rhinebeck are Installation, Maintenance & Repair (11 | 0.9%), and Construction & Extraction (10 | 0.8%).
Natural Resources, Construction and Maintenance Occupations by Sex
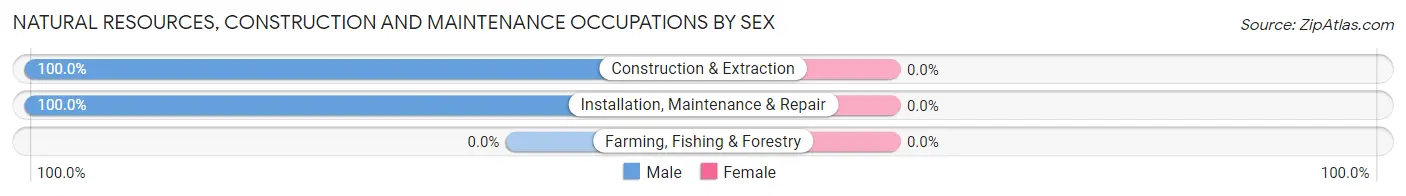
| Occupation | Male | Female |
| Farming, Fishing & Forestry | 0 (0.0%) | 0 (0.0%) |
| Construction & Extraction | 10 (100.0%) | 0 (0.0%) |
| Installation, Maintenance & Repair | 11 (100.0%) | 0 (0.0%) |
| Total (Category) | 21 (100.0%) | 0 (0.0%) |
| Total (Overall) | 651 (50.5%) | 639 (49.5%) |
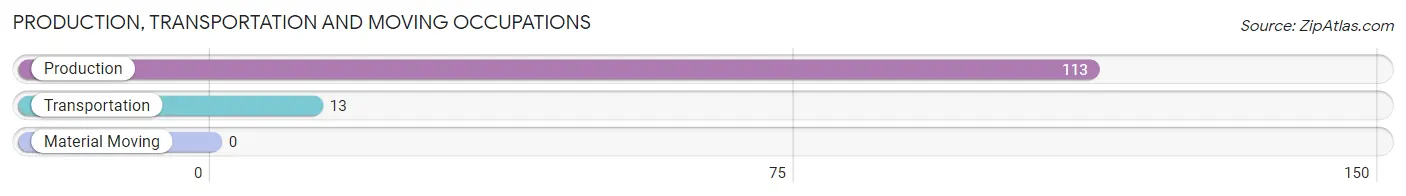
Production, Transportation and Moving Occupations
The most common Production, Transportation and Moving occupations in Rhinebeck are Production (113 | 8.8%), and Transportation (13 | 1.0%).
Production, Transportation and Moving Occupations by Sex
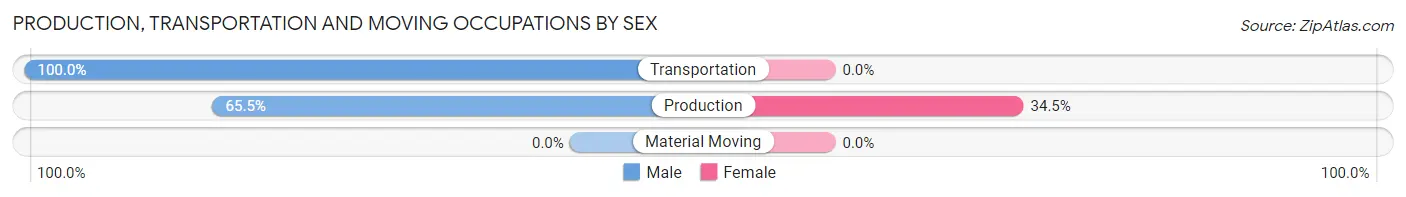
| Occupation | Male | Female |
| Production | 74 (65.5%) | 39 (34.5%) |
| Transportation | 13 (100.0%) | 0 (0.0%) |
| Material Moving | 0 (0.0%) | 0 (0.0%) |
| Total (Category) | 87 (69.1%) | 39 (30.9%) |
| Total (Overall) | 651 (50.5%) | 639 (49.5%) |
Employment Industries by Sex in Rhinebeck
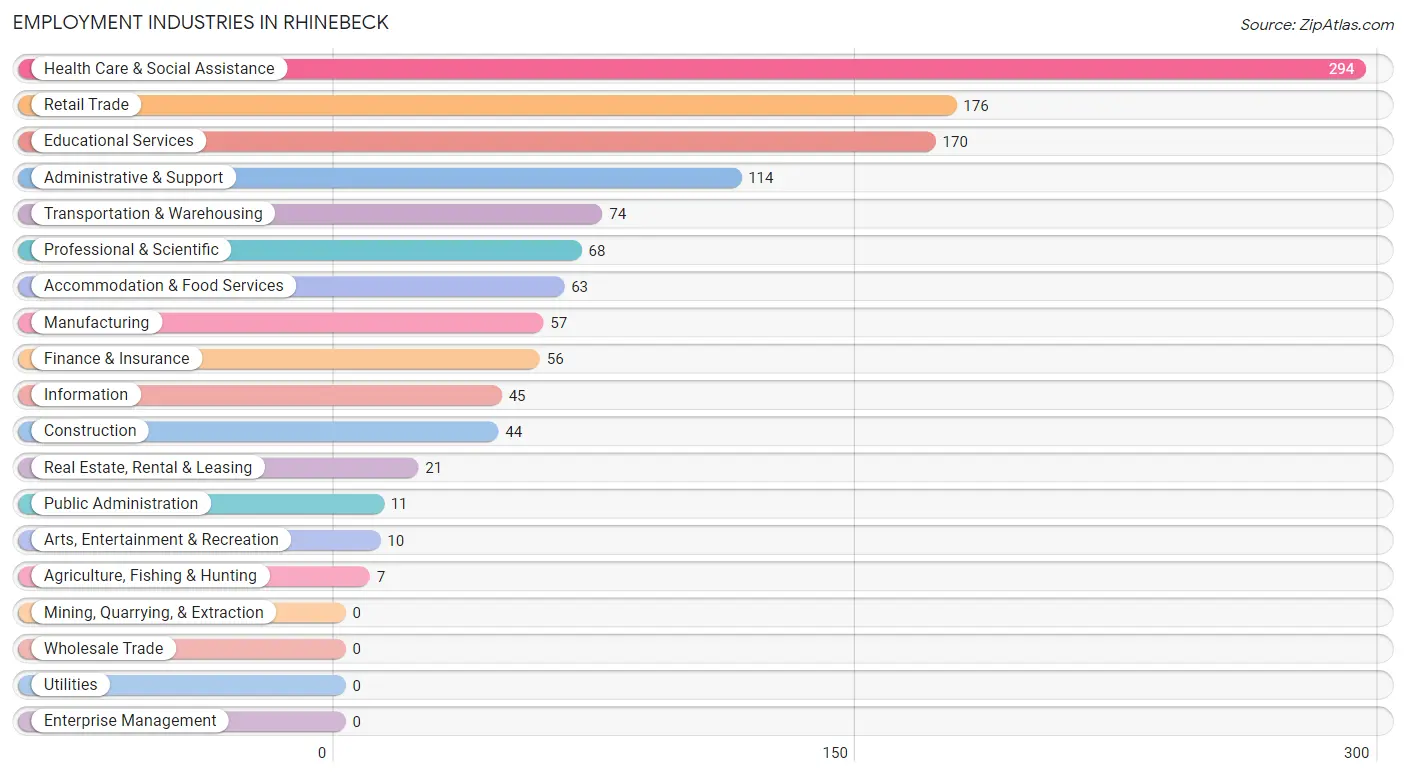
Employment Industries in Rhinebeck
The major employment industries in Rhinebeck include Health Care & Social Assistance (294 | 22.8%), Retail Trade (176 | 13.6%), Educational Services (170 | 13.2%), Administrative & Support (114 | 8.8%), and Transportation & Warehousing (74 | 5.7%).
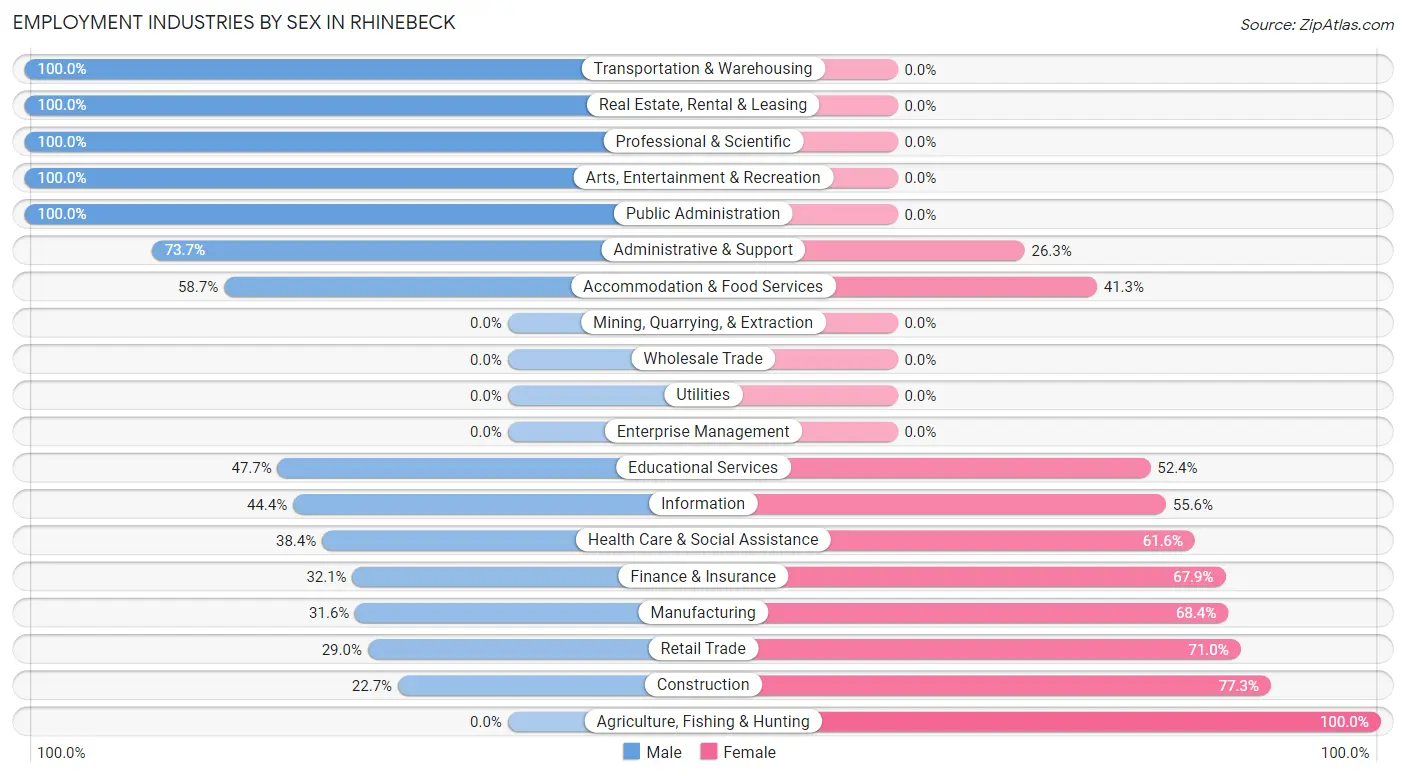
Employment Industries by Sex in Rhinebeck
The Rhinebeck industries that see more men than women are Transportation & Warehousing (100.0%), Real Estate, Rental & Leasing (100.0%), and Professional & Scientific (100.0%), whereas the industries that tend to have a higher number of women are Agriculture, Fishing & Hunting (100.0%), Construction (77.3%), and Retail Trade (71.0%).
| Industry | Male | Female |
| Agriculture, Fishing & Hunting | 0 (0.0%) | 7 (100.0%) |
| Mining, Quarrying, & Extraction | 0 (0.0%) | 0 (0.0%) |
| Construction | 10 (22.7%) | 34 (77.3%) |
| Manufacturing | 18 (31.6%) | 39 (68.4%) |
| Wholesale Trade | 0 (0.0%) | 0 (0.0%) |
| Retail Trade | 51 (29.0%) | 125 (71.0%) |
| Transportation & Warehousing | 74 (100.0%) | 0 (0.0%) |
| Utilities | 0 (0.0%) | 0 (0.0%) |
| Information | 20 (44.4%) | 25 (55.6%) |
| Finance & Insurance | 18 (32.1%) | 38 (67.9%) |
| Real Estate, Rental & Leasing | 21 (100.0%) | 0 (0.0%) |
| Professional & Scientific | 68 (100.0%) | 0 (0.0%) |
| Enterprise Management | 0 (0.0%) | 0 (0.0%) |
| Administrative & Support | 84 (73.7%) | 30 (26.3%) |
| Educational Services | 81 (47.6%) | 89 (52.3%) |
| Health Care & Social Assistance | 113 (38.4%) | 181 (61.6%) |
| Arts, Entertainment & Recreation | 10 (100.0%) | 0 (0.0%) |
| Accommodation & Food Services | 37 (58.7%) | 26 (41.3%) |
| Public Administration | 11 (100.0%) | 0 (0.0%) |
| Total | 651 (50.5%) | 639 (49.5%) |
Education in Rhinebeck
School Enrollment in Rhinebeck
The most common levels of schooling among the 445 students in Rhinebeck are elementary school (166 | 37.3%), high school (95 | 21.3%), and nursery / preschool (78 | 17.5%).
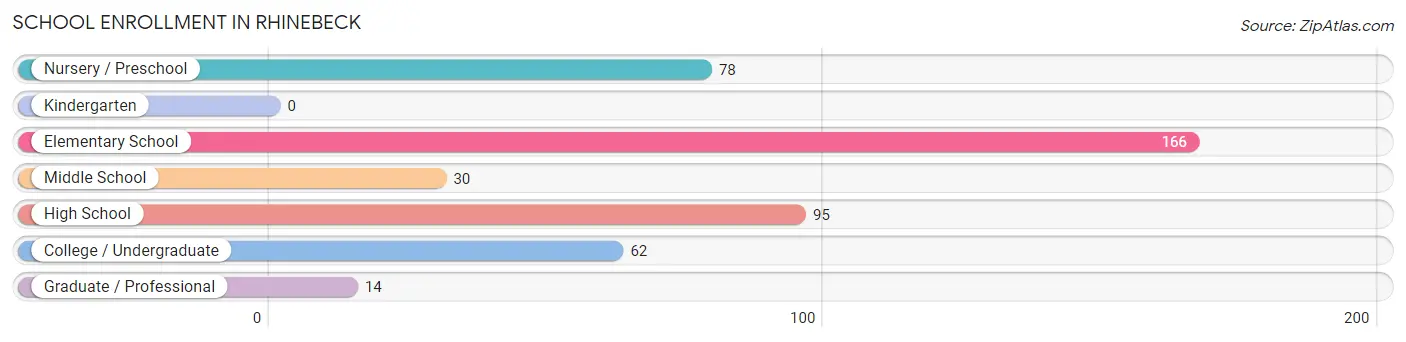
| School Level | # Students | % Students |
| Nursery / Preschool | 78 | 17.5% |
| Kindergarten | 0 | 0.0% |
| Elementary School | 166 | 37.3% |
| Middle School | 30 | 6.7% |
| High School | 95 | 21.3% |
| College / Undergraduate | 62 | 13.9% |
| Graduate / Professional | 14 | 3.2% |
| Total | 445 | 100.0% |
School Enrollment by Age by Funding Source in Rhinebeck
Out of a total of 445 students who are enrolled in schools in Rhinebeck, 54 (12.1%) attend a private institution, while the remaining 391 (87.9%) are enrolled in public schools. The age group of 18 to 19 year olds has the highest likelihood of being enrolled in private schools, with 40 (56.3% in the age bracket) enrolled. Conversely, the age group of 3 to 4 year olds has the lowest likelihood of being enrolled in a private school, with 28 (100.0% in the age bracket) attending a public institution.
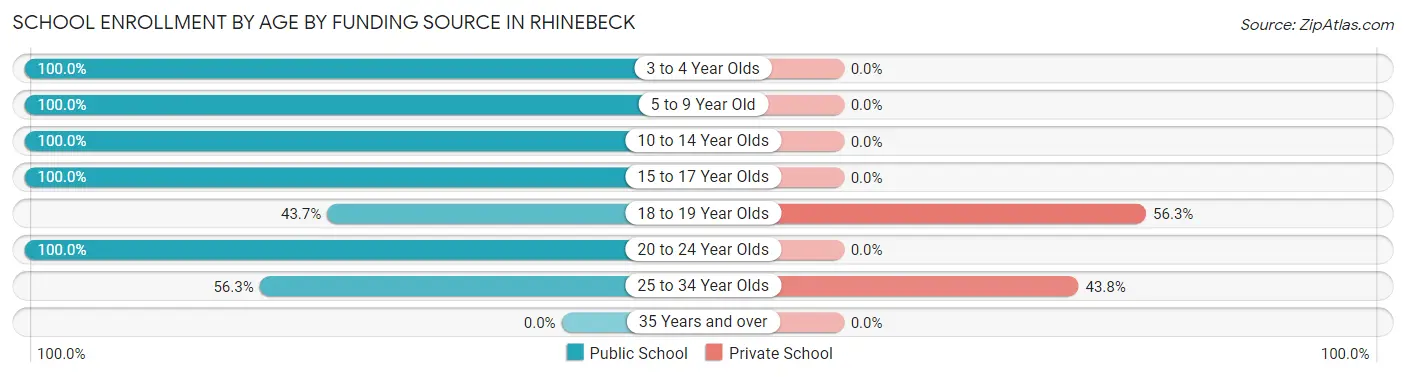
| Age Bracket | Public School | Private School |
| 3 to 4 Year Olds | 28 (100.0%) | 0 (0.0%) |
| 5 to 9 Year Old | 166 (100.0%) | 0 (0.0%) |
| 10 to 14 Year Olds | 80 (100.0%) | 0 (0.0%) |
| 15 to 17 Year Olds | 58 (100.0%) | 0 (0.0%) |
| 18 to 19 Year Olds | 31 (43.7%) | 40 (56.3%) |
| 20 to 24 Year Olds | 10 (100.0%) | 0 (0.0%) |
| 25 to 34 Year Olds | 18 (56.2%) | 14 (43.8%) |
| 35 Years and over | 0 (0.0%) | 0 (0.0%) |
| Total | 391 (87.9%) | 54 (12.1%) |
Educational Attainment by Field of Study in Rhinebeck
Social sciences (121 | 10.3%), education (118 | 10.0%), business (117 | 9.9%), literature & languages (115 | 9.8%), and bio, nature & agricultural (114 | 9.7%) are the most common fields of study among 1,179 individuals in Rhinebeck who have obtained a bachelor's degree or higher.
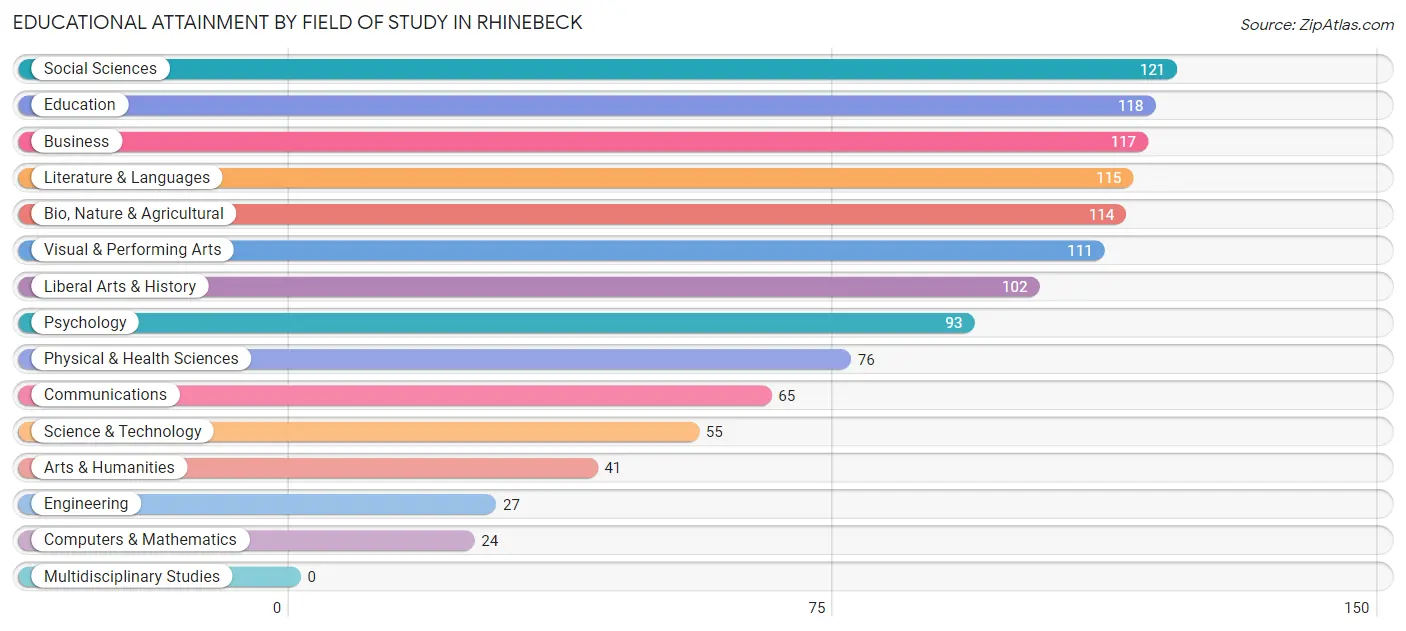
| Field of Study | # Graduates | % Graduates |
| Computers & Mathematics | 24 | 2.0% |
| Bio, Nature & Agricultural | 114 | 9.7% |
| Physical & Health Sciences | 76 | 6.5% |
| Psychology | 93 | 7.9% |
| Social Sciences | 121 | 10.3% |
| Engineering | 27 | 2.3% |
| Multidisciplinary Studies | 0 | 0.0% |
| Science & Technology | 55 | 4.7% |
| Business | 117 | 9.9% |
| Education | 118 | 10.0% |
| Literature & Languages | 115 | 9.8% |
| Liberal Arts & History | 102 | 8.6% |
| Visual & Performing Arts | 111 | 9.4% |
| Communications | 65 | 5.5% |
| Arts & Humanities | 41 | 3.5% |
| Total | 1,179 | 100.0% |
Transportation & Commute in Rhinebeck
Vehicle Availability by Sex in Rhinebeck
The most prevalent vehicle ownership categories in Rhinebeck are males with 2 vehicles (252, accounting for 40.9%) and females with 2 vehicles (251, making up 39.4%).
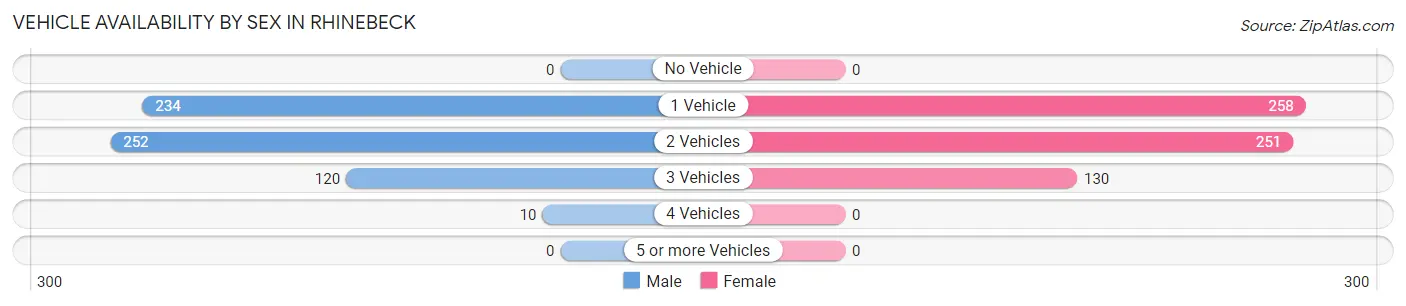
| Vehicles Available | Male | Female |
| No Vehicle | 0 (0.0%) | 0 (0.0%) |
| 1 Vehicle | 234 (38.0%) | 258 (40.4%) |
| 2 Vehicles | 252 (40.9%) | 251 (39.3%) |
| 3 Vehicles | 120 (19.5%) | 130 (20.3%) |
| 4 Vehicles | 10 (1.6%) | 0 (0.0%) |
| 5 or more Vehicles | 0 (0.0%) | 0 (0.0%) |
| Total | 616 (100.0%) | 639 (100.0%) |
Commute Time in Rhinebeck
The most frequently occuring commute durations in Rhinebeck are 90 or more minutes (232 commuters, 21.0%), 5 to 9 minutes (197 commuters, 17.8%), and 30 to 34 minutes (116 commuters, 10.5%).
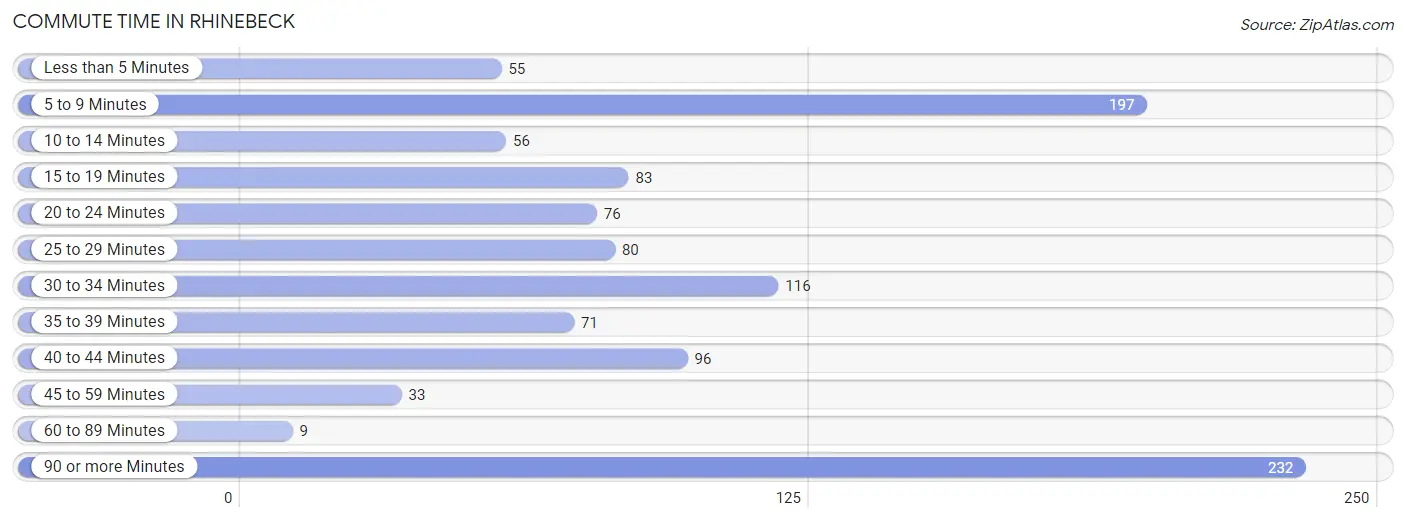
| Commute Time | # Commuters | % Commuters |
| Less than 5 Minutes | 55 | 5.0% |
| 5 to 9 Minutes | 197 | 17.8% |
| 10 to 14 Minutes | 56 | 5.1% |
| 15 to 19 Minutes | 83 | 7.5% |
| 20 to 24 Minutes | 76 | 6.9% |
| 25 to 29 Minutes | 80 | 7.2% |
| 30 to 34 Minutes | 116 | 10.5% |
| 35 to 39 Minutes | 71 | 6.4% |
| 40 to 44 Minutes | 96 | 8.7% |
| 45 to 59 Minutes | 33 | 3.0% |
| 60 to 89 Minutes | 9 | 0.8% |
| 90 or more Minutes | 232 | 21.0% |
Commute Time by Sex in Rhinebeck
The most common commute times in Rhinebeck are 90 or more minutes (227 commuters, 38.7%) for males and 5 to 9 minutes (139 commuters, 26.8%) for females.
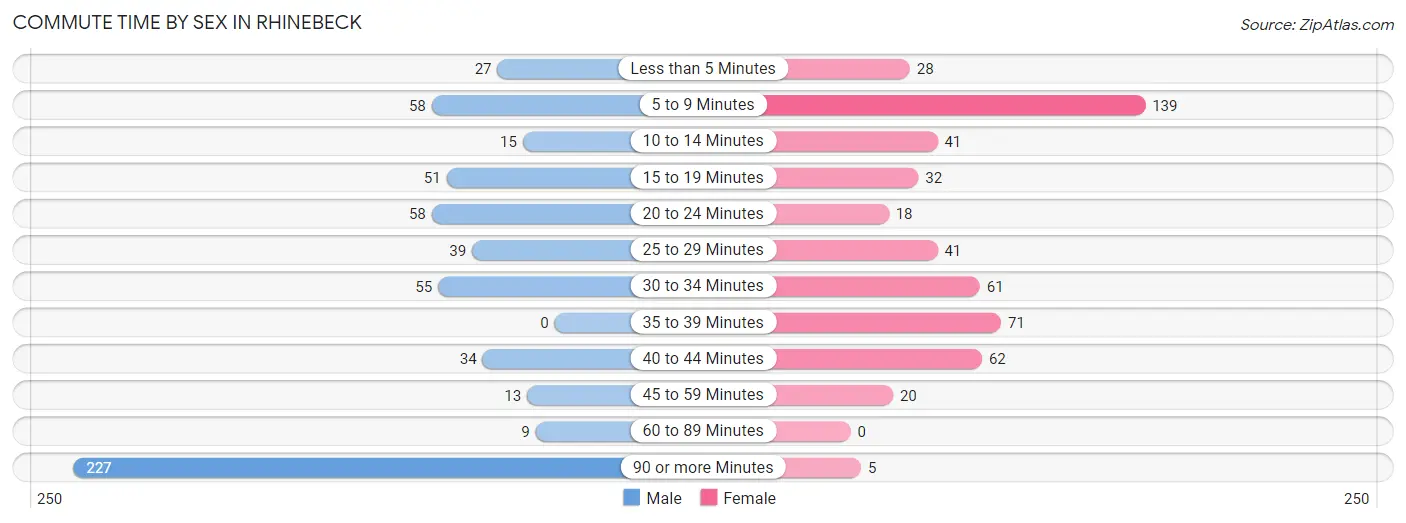
| Commute Time | Male | Female |
| Less than 5 Minutes | 27 (4.6%) | 28 (5.4%) |
| 5 to 9 Minutes | 58 (9.9%) | 139 (26.8%) |
| 10 to 14 Minutes | 15 (2.6%) | 41 (7.9%) |
| 15 to 19 Minutes | 51 (8.7%) | 32 (6.2%) |
| 20 to 24 Minutes | 58 (9.9%) | 18 (3.5%) |
| 25 to 29 Minutes | 39 (6.7%) | 41 (7.9%) |
| 30 to 34 Minutes | 55 (9.4%) | 61 (11.8%) |
| 35 to 39 Minutes | 0 (0.0%) | 71 (13.7%) |
| 40 to 44 Minutes | 34 (5.8%) | 62 (12.0%) |
| 45 to 59 Minutes | 13 (2.2%) | 20 (3.9%) |
| 60 to 89 Minutes | 9 (1.5%) | 0 (0.0%) |
| 90 or more Minutes | 227 (38.7%) | 5 (1.0%) |
Time of Departure to Work by Sex in Rhinebeck
The most frequent times of departure to work in Rhinebeck are 7:00 AM to 7:29 AM (119, 20.3%) for males and 7:00 AM to 7:29 AM (119, 23.0%) for females.
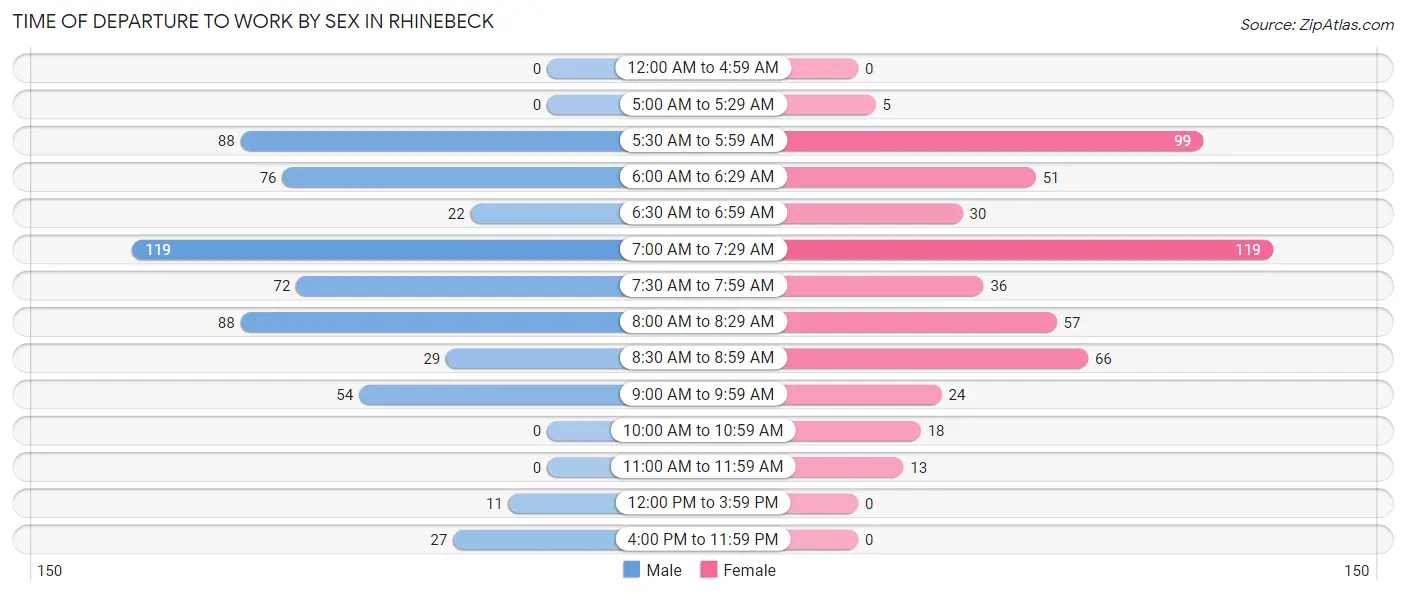
| Time of Departure | Male | Female |
| 12:00 AM to 4:59 AM | 0 (0.0%) | 0 (0.0%) |
| 5:00 AM to 5:29 AM | 0 (0.0%) | 5 (1.0%) |
| 5:30 AM to 5:59 AM | 88 (15.0%) | 99 (19.1%) |
| 6:00 AM to 6:29 AM | 76 (13.0%) | 51 (9.9%) |
| 6:30 AM to 6:59 AM | 22 (3.7%) | 30 (5.8%) |
| 7:00 AM to 7:29 AM | 119 (20.3%) | 119 (23.0%) |
| 7:30 AM to 7:59 AM | 72 (12.3%) | 36 (7.0%) |
| 8:00 AM to 8:29 AM | 88 (15.0%) | 57 (11.0%) |
| 8:30 AM to 8:59 AM | 29 (5.0%) | 66 (12.7%) |
| 9:00 AM to 9:59 AM | 54 (9.2%) | 24 (4.6%) |
| 10:00 AM to 10:59 AM | 0 (0.0%) | 18 (3.5%) |
| 11:00 AM to 11:59 AM | 0 (0.0%) | 13 (2.5%) |
| 12:00 PM to 3:59 PM | 11 (1.9%) | 0 (0.0%) |
| 4:00 PM to 11:59 PM | 27 (4.6%) | 0 (0.0%) |
| Total | 586 (100.0%) | 518 (100.0%) |
Housing Occupancy in Rhinebeck
Occupancy by Ownership in Rhinebeck
Of the total 1,452 dwellings in Rhinebeck, owner-occupied units account for 813 (56.0%), while renter-occupied units make up 639 (44.0%).
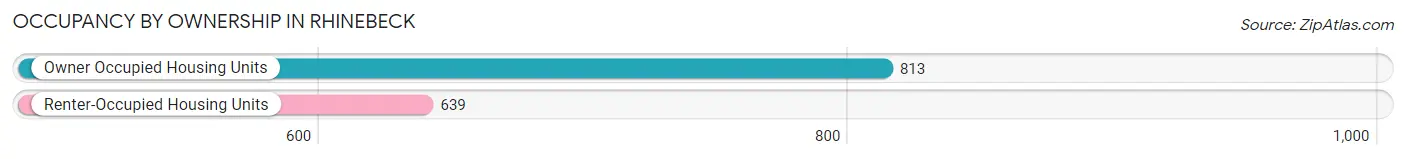
| Occupancy | # Housing Units | % Housing Units |
| Owner Occupied Housing Units | 813 | 56.0% |
| Renter-Occupied Housing Units | 639 | 44.0% |
| Total Occupied Housing Units | 1,452 | 100.0% |
Occupancy by Household Size in Rhinebeck
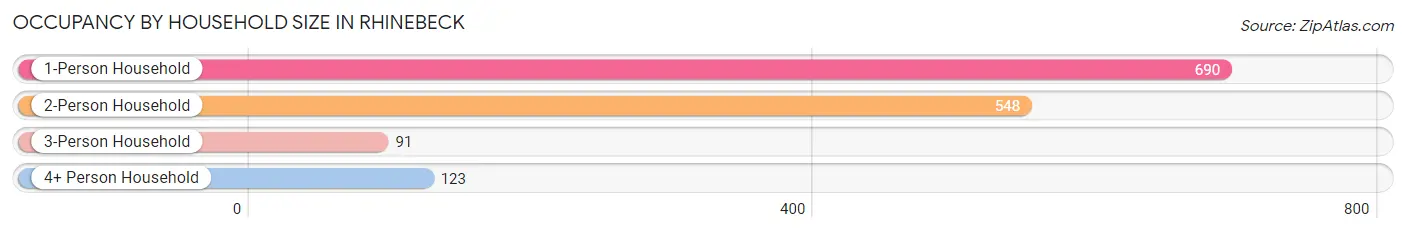
| Household Size | # Housing Units | % Housing Units |
| 1-Person Household | 690 | 47.5% |
| 2-Person Household | 548 | 37.7% |
| 3-Person Household | 91 | 6.3% |
| 4+ Person Household | 123 | 8.5% |
| Total Housing Units | 1,452 | 100.0% |
Occupancy by Ownership by Household Size in Rhinebeck
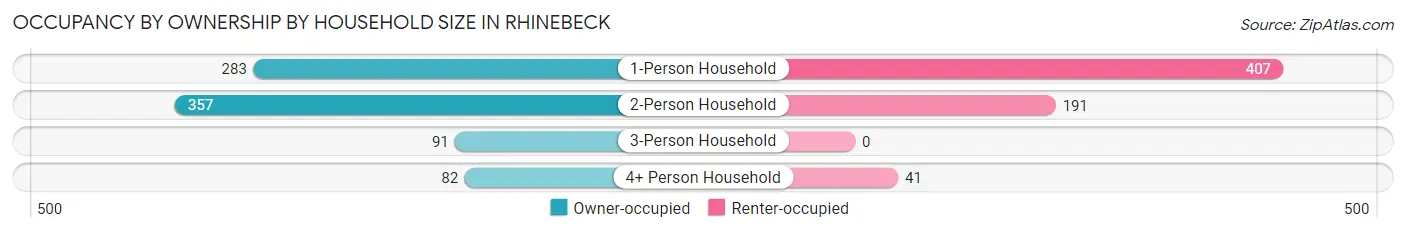
| Household Size | Owner-occupied | Renter-occupied |
| 1-Person Household | 283 (41.0%) | 407 (59.0%) |
| 2-Person Household | 357 (65.1%) | 191 (34.8%) |
| 3-Person Household | 91 (100.0%) | 0 (0.0%) |
| 4+ Person Household | 82 (66.7%) | 41 (33.3%) |
| Total Housing Units | 813 (56.0%) | 639 (44.0%) |
Occupancy by Educational Attainment in Rhinebeck
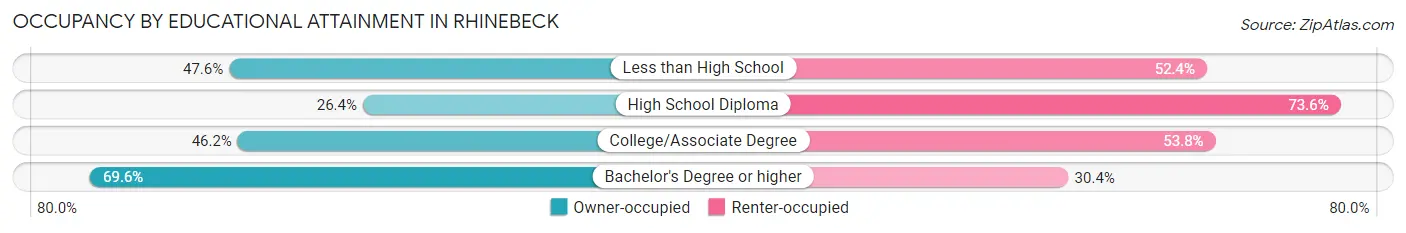
| Household Size | Owner-occupied | Renter-occupied |
| Less than High School | 49 (47.6%) | 54 (52.4%) |
| High School Diploma | 58 (26.4%) | 162 (73.6%) |
| College/Associate Degree | 158 (46.2%) | 184 (53.8%) |
| Bachelor's Degree or higher | 548 (69.6%) | 239 (30.4%) |
Occupancy by Age of Householder in Rhinebeck
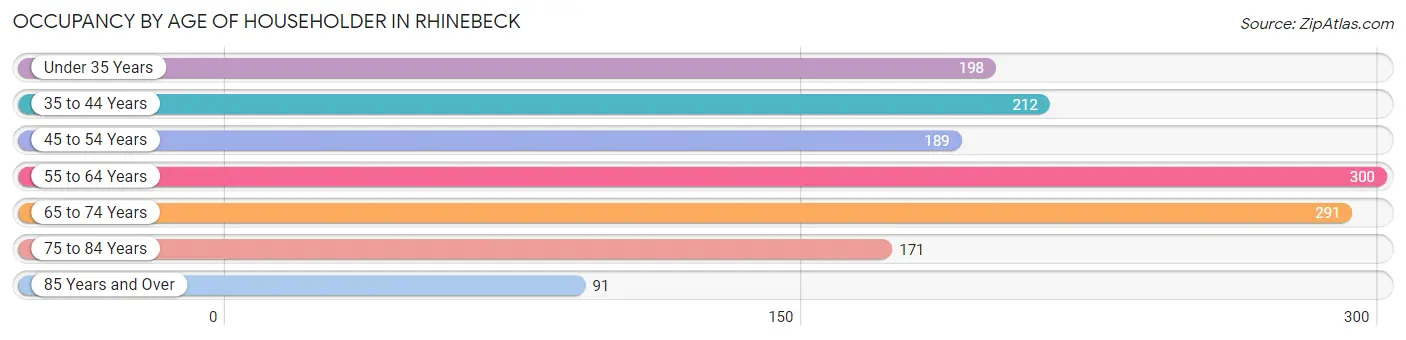
| Age Bracket | # Households | % Households |
| Under 35 Years | 198 | 13.6% |
| 35 to 44 Years | 212 | 14.6% |
| 45 to 54 Years | 189 | 13.0% |
| 55 to 64 Years | 300 | 20.7% |
| 65 to 74 Years | 291 | 20.0% |
| 75 to 84 Years | 171 | 11.8% |
| 85 Years and Over | 91 | 6.3% |
| Total | 1,452 | 100.0% |
Housing Finances in Rhinebeck
Median Income by Occupancy in Rhinebeck
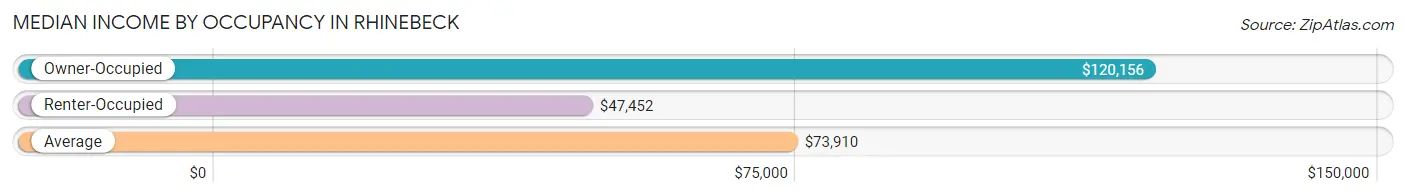
| Occupancy Type | # Households | Median Income |
| Owner-Occupied | 813 (56.0%) | $120,156 |
| Renter-Occupied | 639 (44.0%) | $47,452 |
| Average | 1,452 (100.0%) | $73,910 |
Occupancy by Householder Income Bracket in Rhinebeck
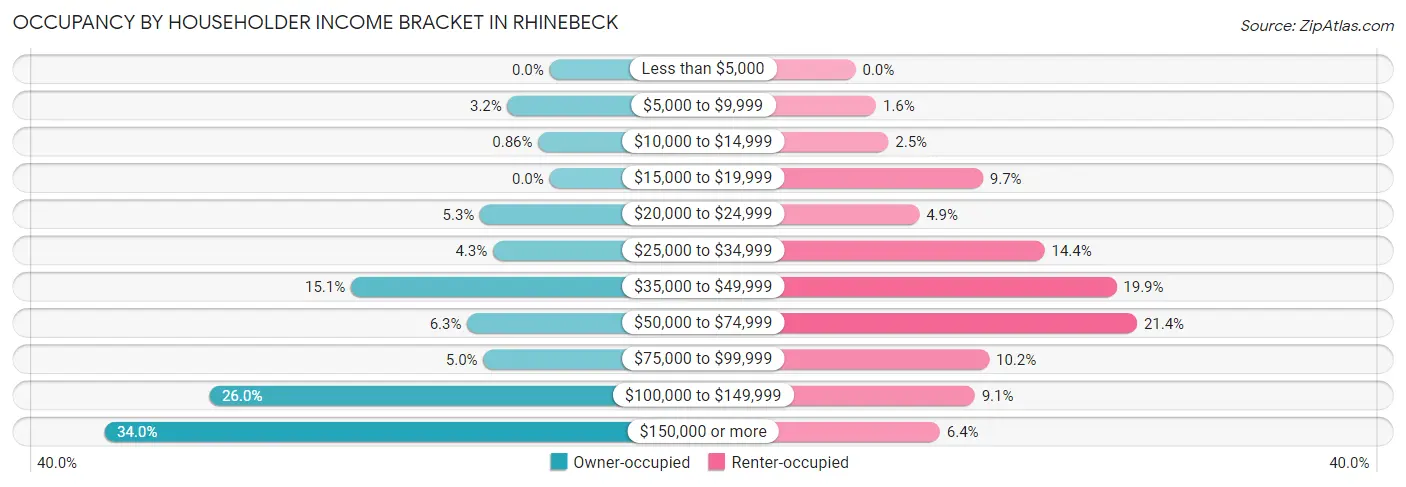
| Income Bracket | Owner-occupied | Renter-occupied |
| Less than $5,000 | 0 (0.0%) | 0 (0.0%) |
| $5,000 to $9,999 | 26 (3.2%) | 10 (1.6%) |
| $10,000 to $14,999 | 7 (0.9%) | 16 (2.5%) |
| $15,000 to $19,999 | 0 (0.0%) | 62 (9.7%) |
| $20,000 to $24,999 | 43 (5.3%) | 31 (4.9%) |
| $25,000 to $34,999 | 35 (4.3%) | 92 (14.4%) |
| $35,000 to $49,999 | 123 (15.1%) | 127 (19.9%) |
| $50,000 to $74,999 | 51 (6.3%) | 137 (21.4%) |
| $75,000 to $99,999 | 41 (5.0%) | 65 (10.2%) |
| $100,000 to $149,999 | 211 (26.0%) | 58 (9.1%) |
| $150,000 or more | 276 (34.0%) | 41 (6.4%) |
| Total | 813 (100.0%) | 639 (100.0%) |
Monthly Housing Cost Tiers in Rhinebeck
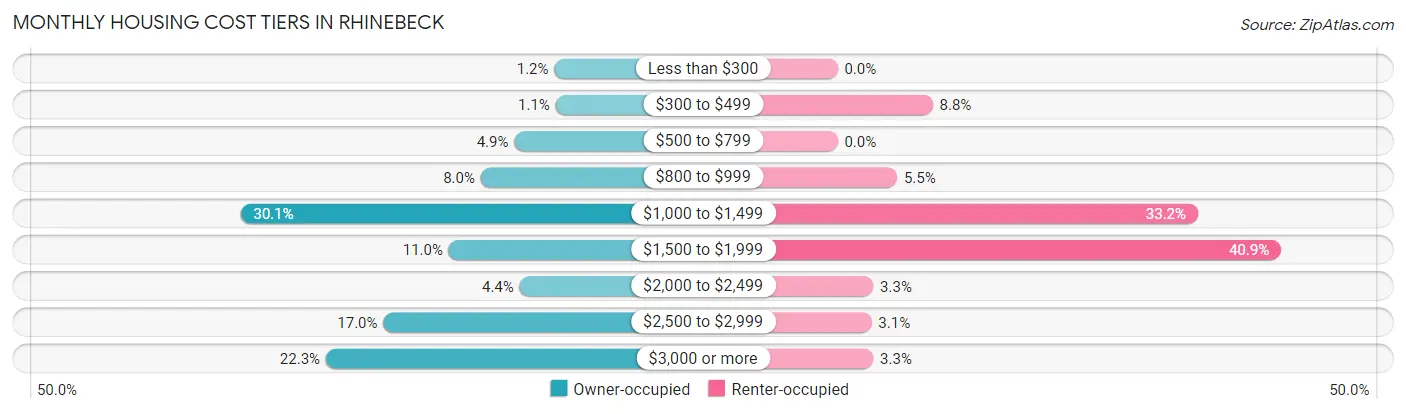
| Monthly Cost | Owner-occupied | Renter-occupied |
| Less than $300 | 10 (1.2%) | 0 (0.0%) |
| $300 to $499 | 9 (1.1%) | 56 (8.8%) |
| $500 to $799 | 40 (4.9%) | 0 (0.0%) |
| $800 to $999 | 65 (8.0%) | 35 (5.5%) |
| $1,000 to $1,499 | 245 (30.1%) | 212 (33.2%) |
| $1,500 to $1,999 | 89 (11.0%) | 261 (40.8%) |
| $2,000 to $2,499 | 36 (4.4%) | 21 (3.3%) |
| $2,500 to $2,999 | 138 (17.0%) | 20 (3.1%) |
| $3,000 or more | 181 (22.3%) | 21 (3.3%) |
| Total | 813 (100.0%) | 639 (100.0%) |
Physical Housing Characteristics in Rhinebeck
Housing Structures in Rhinebeck
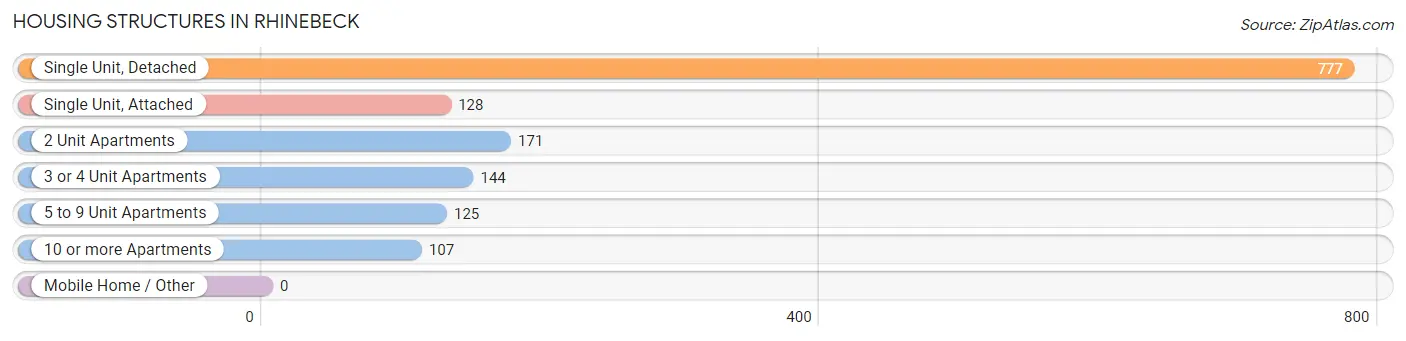
| Structure Type | # Housing Units | % Housing Units |
| Single Unit, Detached | 777 | 53.5% |
| Single Unit, Attached | 128 | 8.8% |
| 2 Unit Apartments | 171 | 11.8% |
| 3 or 4 Unit Apartments | 144 | 9.9% |
| 5 to 9 Unit Apartments | 125 | 8.6% |
| 10 or more Apartments | 107 | 7.4% |
| Mobile Home / Other | 0 | 0.0% |
| Total | 1,452 | 100.0% |
Housing Structures by Occupancy in Rhinebeck
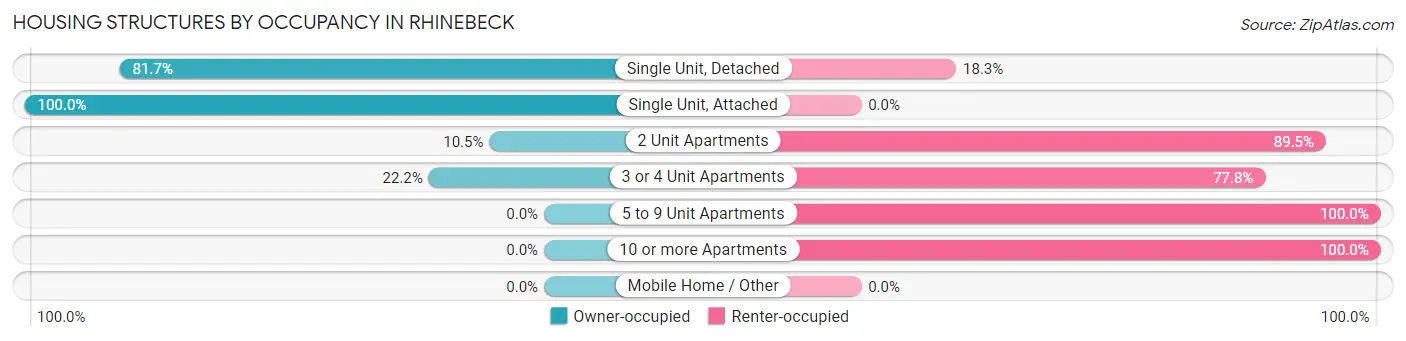
| Structure Type | Owner-occupied | Renter-occupied |
| Single Unit, Detached | 635 (81.7%) | 142 (18.3%) |
| Single Unit, Attached | 128 (100.0%) | 0 (0.0%) |
| 2 Unit Apartments | 18 (10.5%) | 153 (89.5%) |
| 3 or 4 Unit Apartments | 32 (22.2%) | 112 (77.8%) |
| 5 to 9 Unit Apartments | 0 (0.0%) | 125 (100.0%) |
| 10 or more Apartments | 0 (0.0%) | 107 (100.0%) |
| Mobile Home / Other | 0 (0.0%) | 0 (0.0%) |
| Total | 813 (56.0%) | 639 (44.0%) |
Housing Structures by Number of Rooms in Rhinebeck
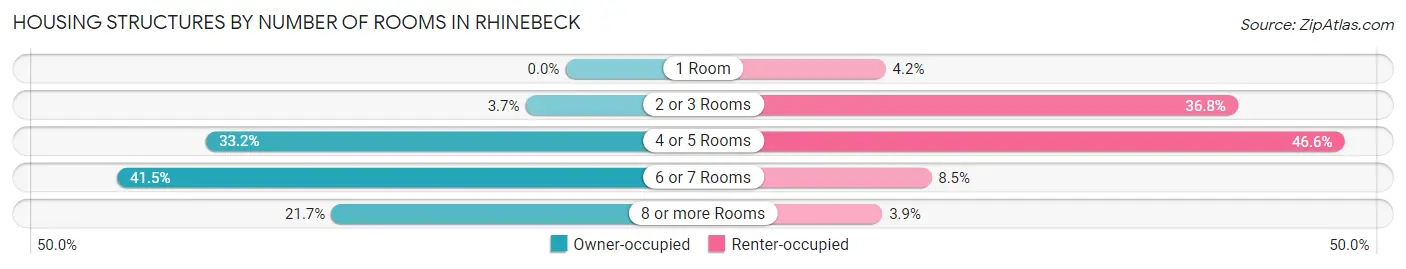
| Number of Rooms | Owner-occupied | Renter-occupied |
| 1 Room | 0 (0.0%) | 27 (4.2%) |
| 2 or 3 Rooms | 30 (3.7%) | 235 (36.8%) |
| 4 or 5 Rooms | 270 (33.2%) | 298 (46.6%) |
| 6 or 7 Rooms | 337 (41.4%) | 54 (8.5%) |
| 8 or more Rooms | 176 (21.6%) | 25 (3.9%) |
| Total | 813 (100.0%) | 639 (100.0%) |
Housing Structure by Heating Type in Rhinebeck
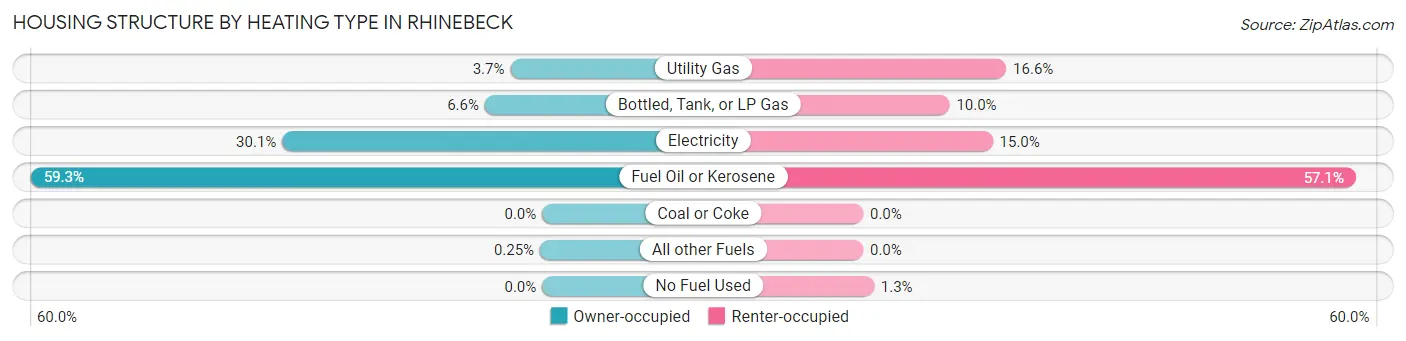
| Heating Type | Owner-occupied | Renter-occupied |
| Utility Gas | 30 (3.7%) | 106 (16.6%) |
| Bottled, Tank, or LP Gas | 54 (6.6%) | 64 (10.0%) |
| Electricity | 245 (30.1%) | 96 (15.0%) |
| Fuel Oil or Kerosene | 482 (59.3%) | 365 (57.1%) |
| Coal or Coke | 0 (0.0%) | 0 (0.0%) |
| All other Fuels | 2 (0.3%) | 0 (0.0%) |
| No Fuel Used | 0 (0.0%) | 8 (1.3%) |
| Total | 813 (100.0%) | 639 (100.0%) |
Household Vehicle Usage in Rhinebeck
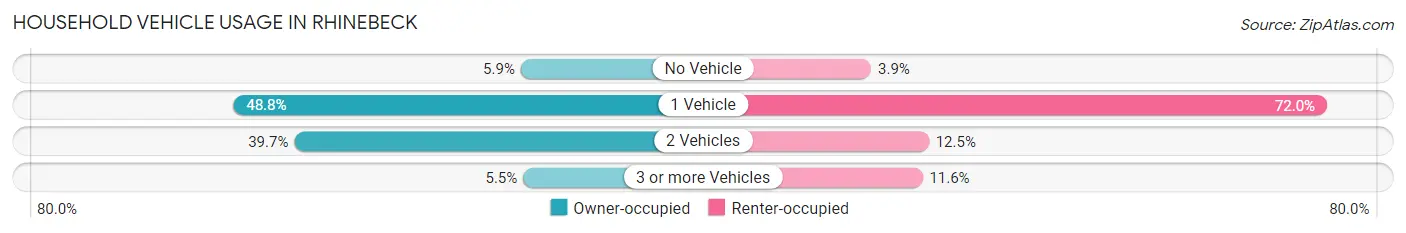
| Vehicles per Household | Owner-occupied | Renter-occupied |
| No Vehicle | 48 (5.9%) | 25 (3.9%) |
| 1 Vehicle | 397 (48.8%) | 460 (72.0%) |
| 2 Vehicles | 323 (39.7%) | 80 (12.5%) |
| 3 or more Vehicles | 45 (5.5%) | 74 (11.6%) |
| Total | 813 (100.0%) | 639 (100.0%) |
Real Estate & Mortgages in Rhinebeck
Real Estate and Mortgage Overview in Rhinebeck
| Characteristic | Without Mortgage | With Mortgage |
| Housing Units | 396 | 417 |
| Median Property Value | $457,900 | $500,700 |
| Median Household Income | $94,868 | $179 |
| Monthly Housing Costs | $1,239 | $181 |
| Real Estate Taxes | $7,670 | $0 |
Property Value by Mortgage Status in Rhinebeck
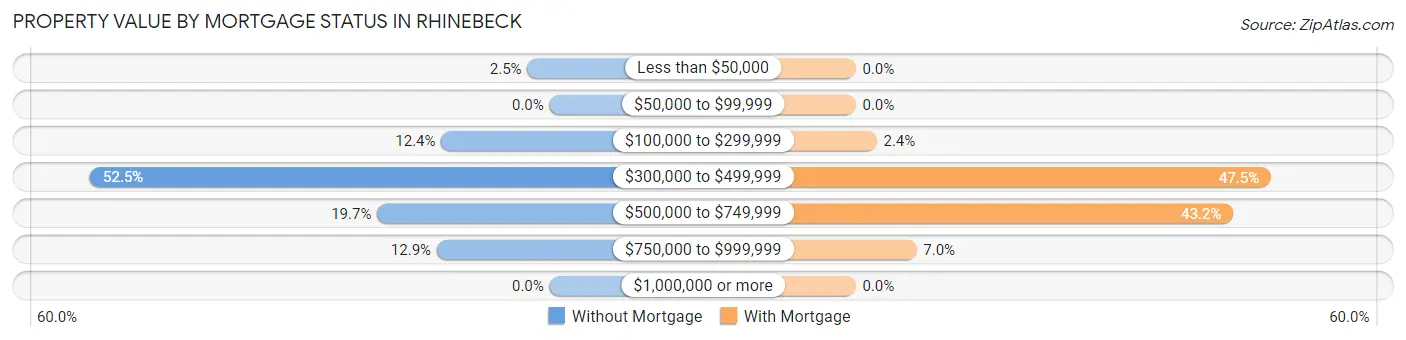
| Property Value | Without Mortgage | With Mortgage |
| Less than $50,000 | 10 (2.5%) | 0 (0.0%) |
| $50,000 to $99,999 | 0 (0.0%) | 0 (0.0%) |
| $100,000 to $299,999 | 49 (12.4%) | 10 (2.4%) |
| $300,000 to $499,999 | 208 (52.5%) | 198 (47.5%) |
| $500,000 to $749,999 | 78 (19.7%) | 180 (43.2%) |
| $750,000 to $999,999 | 51 (12.9%) | 29 (7.0%) |
| $1,000,000 or more | 0 (0.0%) | 0 (0.0%) |
| Total | 396 (100.0%) | 417 (100.0%) |
Household Income by Mortgage Status in Rhinebeck
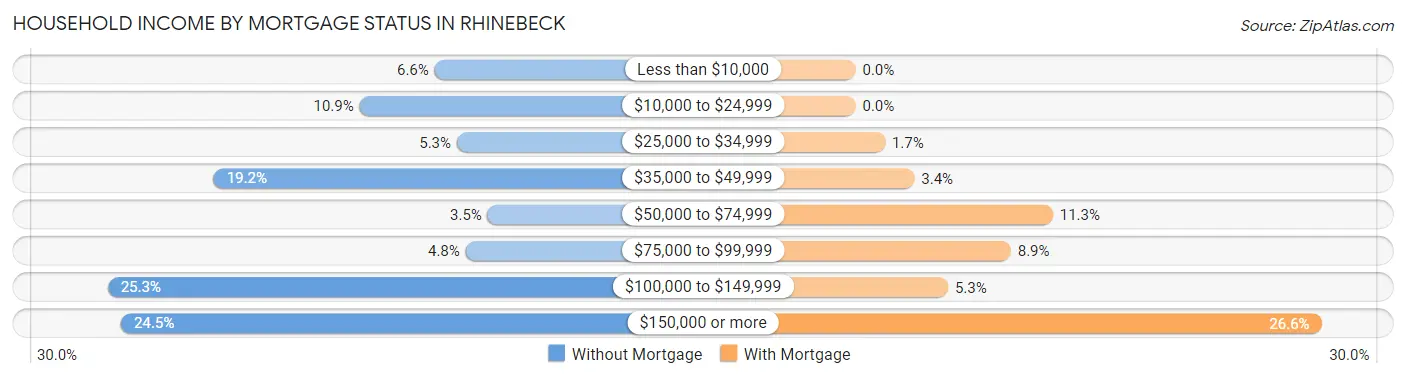
| Household Income | Without Mortgage | With Mortgage |
| Less than $10,000 | 26 (6.6%) | 0 (0.0%) |
| $10,000 to $24,999 | 43 (10.9%) | 0 (0.0%) |
| $25,000 to $34,999 | 21 (5.3%) | 7 (1.7%) |
| $35,000 to $49,999 | 76 (19.2%) | 14 (3.4%) |
| $50,000 to $74,999 | 14 (3.5%) | 47 (11.3%) |
| $75,000 to $99,999 | 19 (4.8%) | 37 (8.9%) |
| $100,000 to $149,999 | 100 (25.3%) | 22 (5.3%) |
| $150,000 or more | 97 (24.5%) | 111 (26.6%) |
| Total | 396 (100.0%) | 417 (100.0%) |
Property Value to Household Income Ratio in Rhinebeck
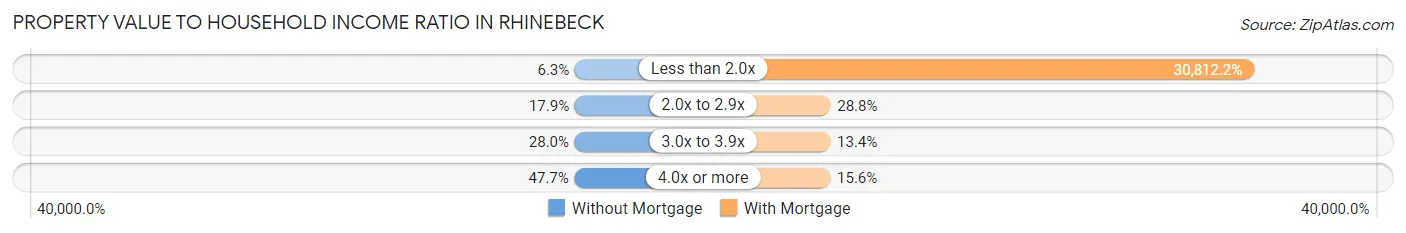
| Value-to-Income Ratio | Without Mortgage | With Mortgage |
| Less than 2.0x | 25 (6.3%) | 128,487 (30,812.2%) |
| 2.0x to 2.9x | 71 (17.9%) | 120 (28.8%) |
| 3.0x to 3.9x | 111 (28.0%) | 56 (13.4%) |
| 4.0x or more | 189 (47.7%) | 65 (15.6%) |
| Total | 396 (100.0%) | 417 (100.0%) |
Real Estate Taxes by Mortgage Status in Rhinebeck
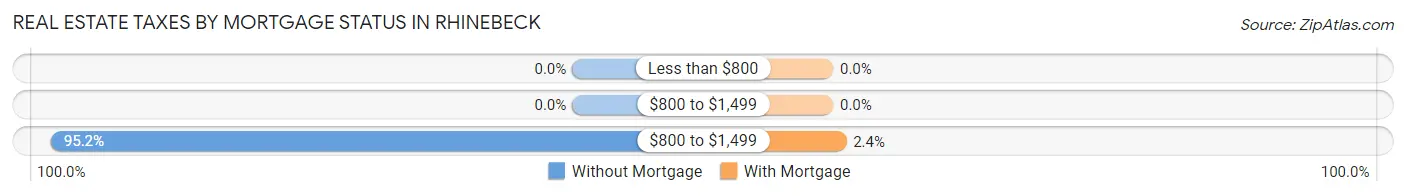
| Property Taxes | Without Mortgage | With Mortgage |
| Less than $800 | 0 (0.0%) | 0 (0.0%) |
| $800 to $1,499 | 0 (0.0%) | 0 (0.0%) |
| $800 to $1,499 | 377 (95.2%) | 10 (2.4%) |
| Total | 396 (100.0%) | 417 (100.0%) |
Health & Disability in Rhinebeck
Health Insurance Coverage by Age in Rhinebeck
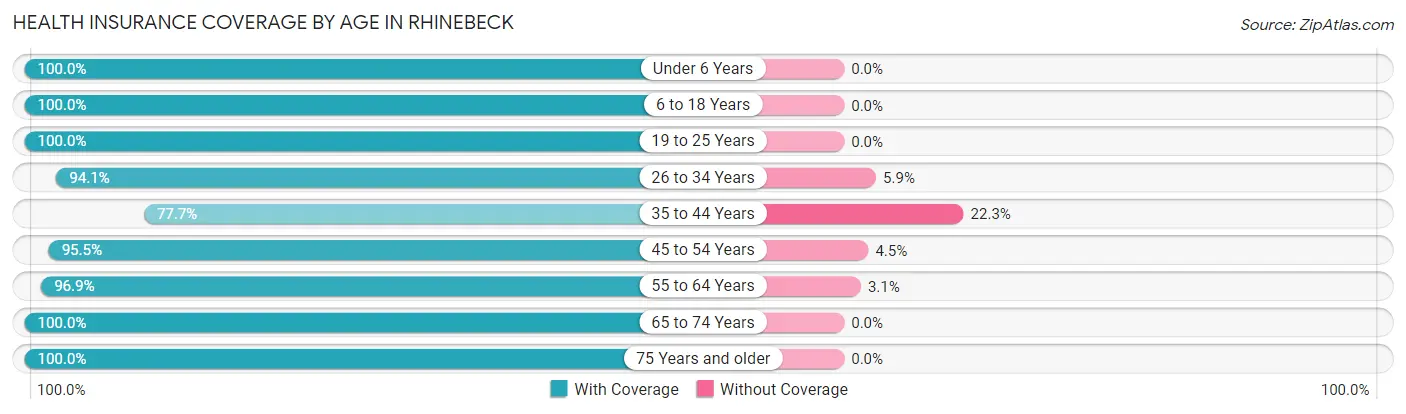
| Age Bracket | With Coverage | Without Coverage |
| Under 6 Years | 78 (100.0%) | 0 (0.0%) |
| 6 to 18 Years | 308 (100.0%) | 0 (0.0%) |
| 19 to 25 Years | 56 (100.0%) | 0 (0.0%) |
| 26 to 34 Years | 380 (94.1%) | 24 (5.9%) |
| 35 to 44 Years | 220 (77.7%) | 63 (22.3%) |
| 45 to 54 Years | 254 (95.5%) | 12 (4.5%) |
| 55 to 64 Years | 405 (96.9%) | 13 (3.1%) |
| 65 to 74 Years | 449 (100.0%) | 0 (0.0%) |
| 75 Years and older | 314 (100.0%) | 0 (0.0%) |
| Total | 2,464 (95.7%) | 112 (4.3%) |
Health Insurance Coverage by Citizenship Status in Rhinebeck
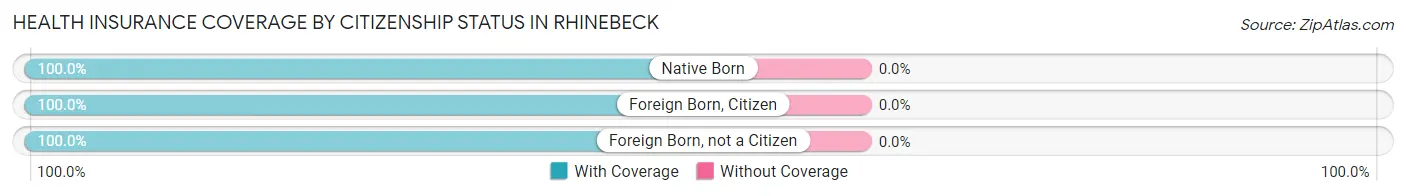
| Citizenship Status | With Coverage | Without Coverage |
| Native Born | 78 (100.0%) | 0 (0.0%) |
| Foreign Born, Citizen | 308 (100.0%) | 0 (0.0%) |
| Foreign Born, not a Citizen | 56 (100.0%) | 0 (0.0%) |
Health Insurance Coverage by Household Income in Rhinebeck
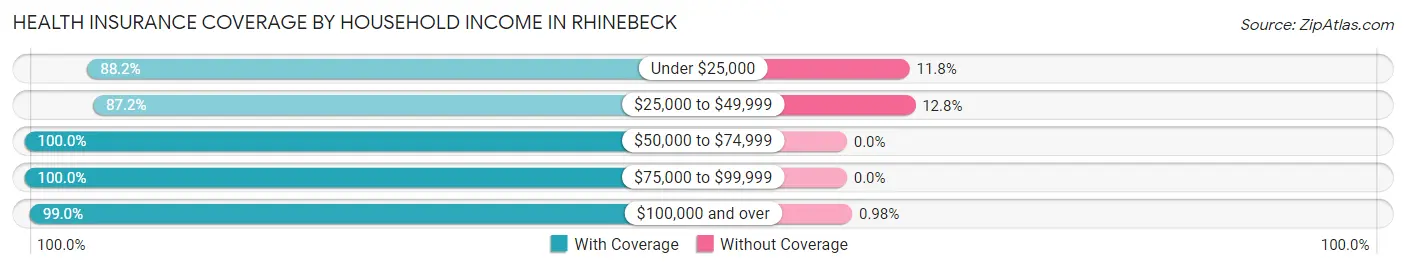
| Household Income | With Coverage | Without Coverage |
| Under $25,000 | 195 (88.2%) | 26 (11.8%) |
| $25,000 to $49,999 | 503 (87.2%) | 74 (12.8%) |
| $50,000 to $74,999 | 327 (100.0%) | 0 (0.0%) |
| $75,000 to $99,999 | 220 (100.0%) | 0 (0.0%) |
| $100,000 and over | 1,218 (99.0%) | 12 (1.0%) |
Public vs Private Health Insurance Coverage by Age in Rhinebeck
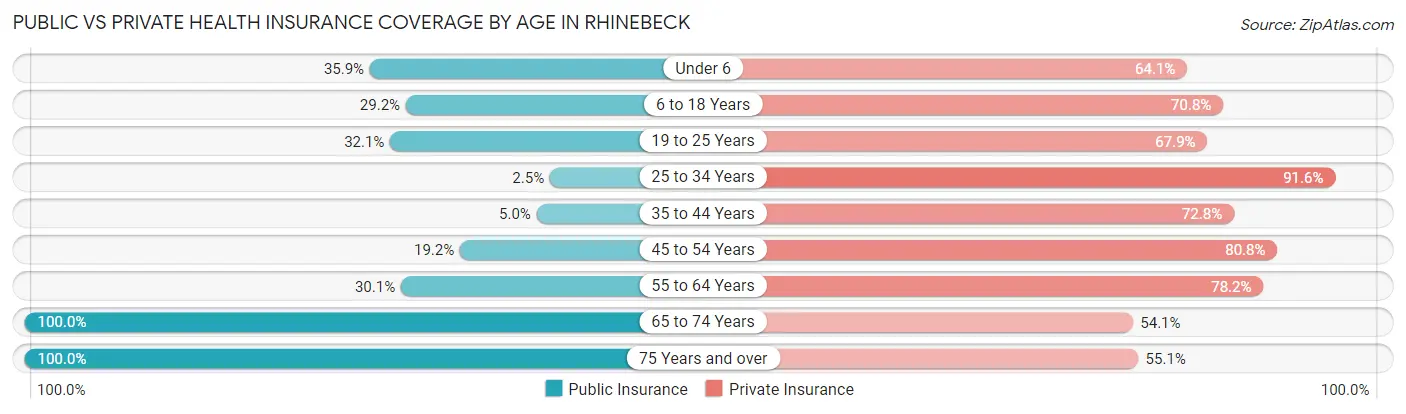
| Age Bracket | Public Insurance | Private Insurance |
| Under 6 | 28 (35.9%) | 50 (64.1%) |
| 6 to 18 Years | 90 (29.2%) | 218 (70.8%) |
| 19 to 25 Years | 18 (32.1%) | 38 (67.9%) |
| 25 to 34 Years | 10 (2.5%) | 370 (91.6%) |
| 35 to 44 Years | 14 (5.0%) | 206 (72.8%) |
| 45 to 54 Years | 51 (19.2%) | 215 (80.8%) |
| 55 to 64 Years | 126 (30.1%) | 327 (78.2%) |
| 65 to 74 Years | 449 (100.0%) | 243 (54.1%) |
| 75 Years and over | 314 (100.0%) | 173 (55.1%) |
| Total | 1,100 (42.7%) | 1,840 (71.4%) |
Disability Status by Sex by Age in Rhinebeck
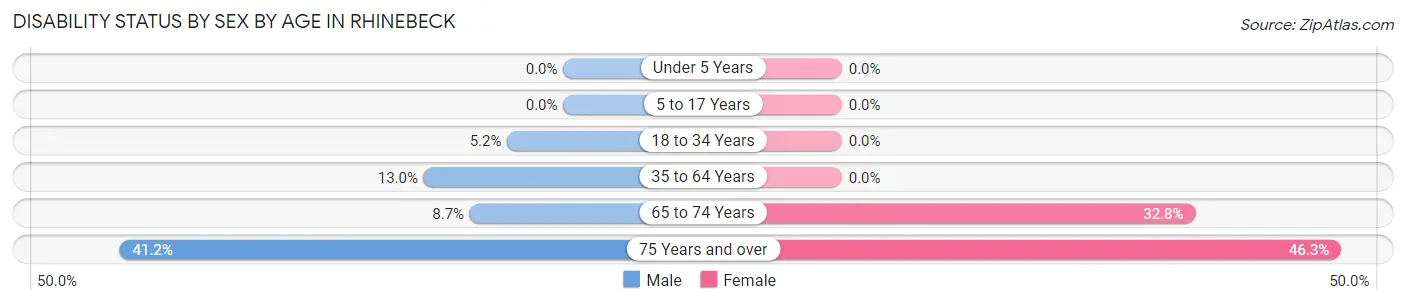
| Age Bracket | Male | Female |
| Under 5 Years | 0 (0.0%) | 0 (0.0%) |
| 5 to 17 Years | 0 (0.0%) | 0 (0.0%) |
| 18 to 34 Years | 13 (5.2%) | 0 (0.0%) |
| 35 to 64 Years | 58 (13.0%) | 0 (0.0%) |
| 65 to 74 Years | 17 (8.7%) | 83 (32.8%) |
| 75 Years and over | 28 (41.2%) | 114 (46.3%) |
Disability Class by Sex by Age in Rhinebeck
Disability Class: Hearing Difficulty
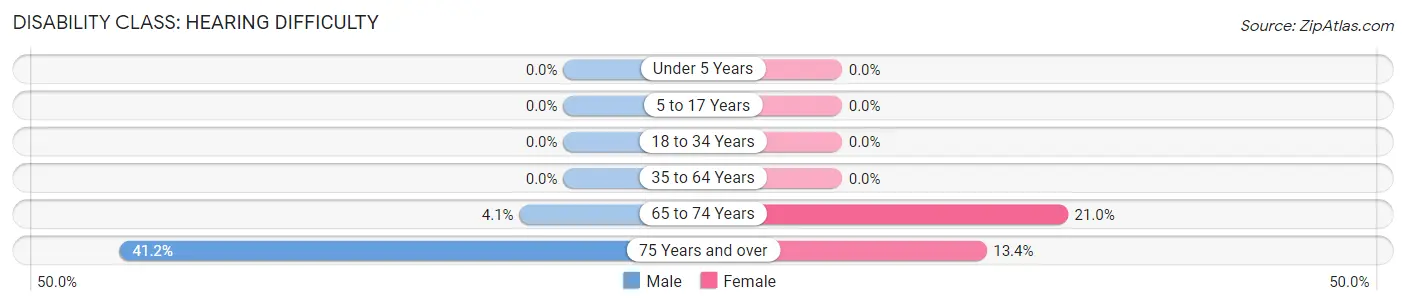
| Age Bracket | Male | Female |
| Under 5 Years | 0 (0.0%) | 0 (0.0%) |
| 5 to 17 Years | 0 (0.0%) | 0 (0.0%) |
| 18 to 34 Years | 0 (0.0%) | 0 (0.0%) |
| 35 to 64 Years | 0 (0.0%) | 0 (0.0%) |
| 65 to 74 Years | 8 (4.1%) | 53 (20.9%) |
| 75 Years and over | 28 (41.2%) | 33 (13.4%) |
Disability Class: Vision Difficulty
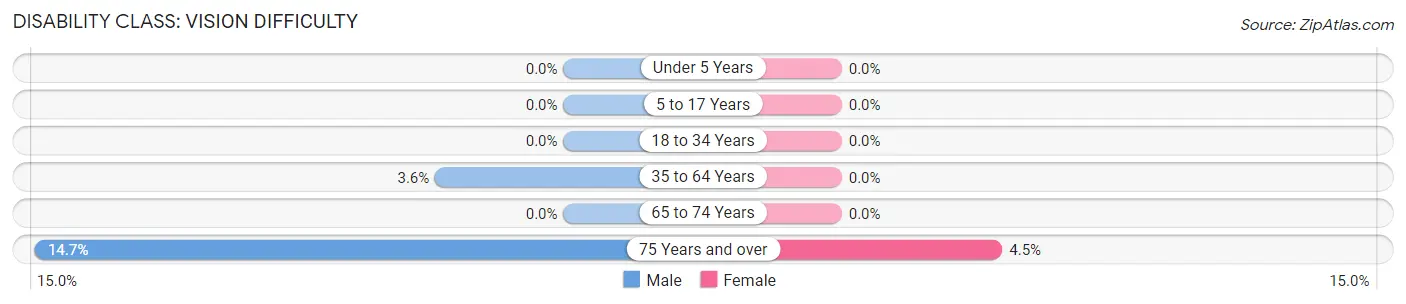
| Age Bracket | Male | Female |
| Under 5 Years | 0 (0.0%) | 0 (0.0%) |
| 5 to 17 Years | 0 (0.0%) | 0 (0.0%) |
| 18 to 34 Years | 0 (0.0%) | 0 (0.0%) |
| 35 to 64 Years | 16 (3.6%) | 0 (0.0%) |
| 65 to 74 Years | 0 (0.0%) | 0 (0.0%) |
| 75 Years and over | 10 (14.7%) | 11 (4.5%) |
Disability Class: Cognitive Difficulty
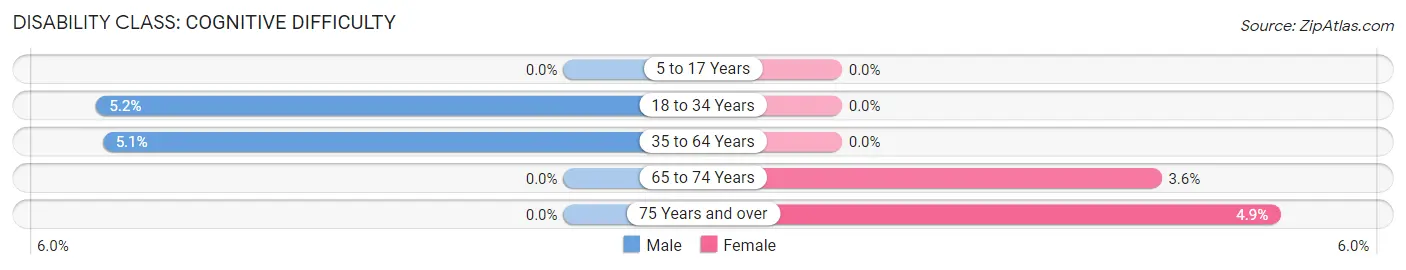
| Age Bracket | Male | Female |
| 5 to 17 Years | 0 (0.0%) | 0 (0.0%) |
| 18 to 34 Years | 13 (5.2%) | 0 (0.0%) |
| 35 to 64 Years | 23 (5.1%) | 0 (0.0%) |
| 65 to 74 Years | 0 (0.0%) | 9 (3.6%) |
| 75 Years and over | 0 (0.0%) | 12 (4.9%) |
Disability Class: Ambulatory Difficulty
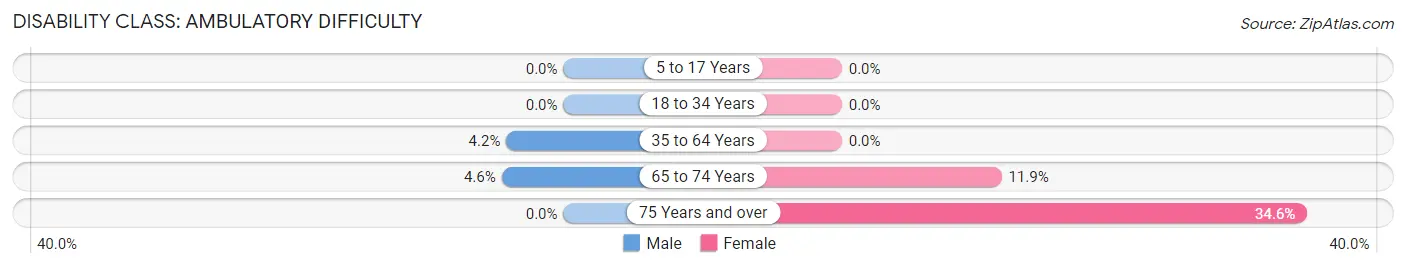
| Age Bracket | Male | Female |
| 5 to 17 Years | 0 (0.0%) | 0 (0.0%) |
| 18 to 34 Years | 0 (0.0%) | 0 (0.0%) |
| 35 to 64 Years | 19 (4.2%) | 0 (0.0%) |
| 65 to 74 Years | 9 (4.6%) | 30 (11.9%) |
| 75 Years and over | 0 (0.0%) | 85 (34.5%) |
Disability Class: Self-Care Difficulty
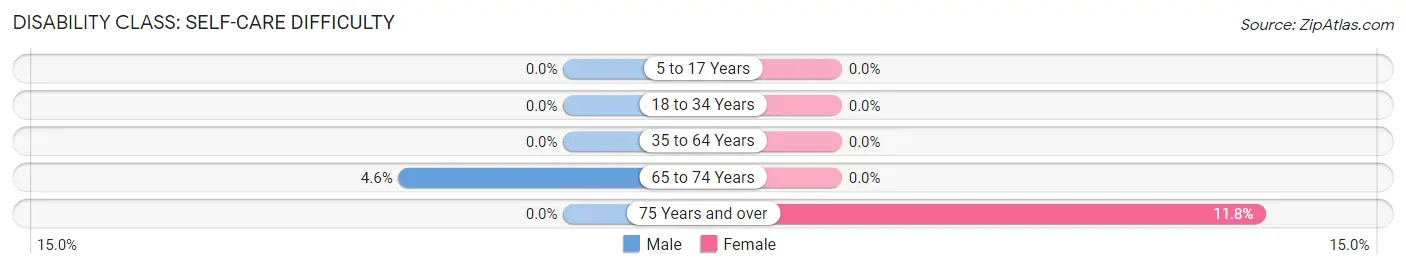
| Age Bracket | Male | Female |
| 5 to 17 Years | 0 (0.0%) | 0 (0.0%) |
| 18 to 34 Years | 0 (0.0%) | 0 (0.0%) |
| 35 to 64 Years | 0 (0.0%) | 0 (0.0%) |
| 65 to 74 Years | 9 (4.6%) | 0 (0.0%) |
| 75 Years and over | 0 (0.0%) | 29 (11.8%) |
Technology Access in Rhinebeck
Computing Device Access in Rhinebeck
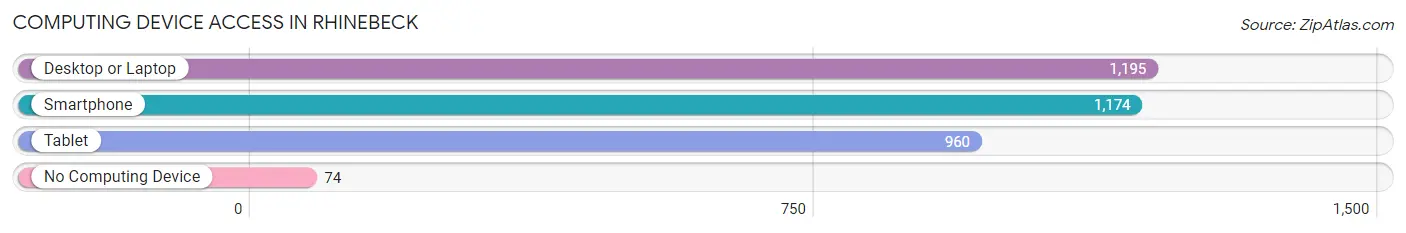
| Device Type | # Households | % Households |
| Desktop or Laptop | 1,195 | 82.3% |
| Smartphone | 1,174 | 80.8% |
| Tablet | 960 | 66.1% |
| No Computing Device | 74 | 5.1% |
| Total | 1,452 | 100.0% |
Internet Access in Rhinebeck
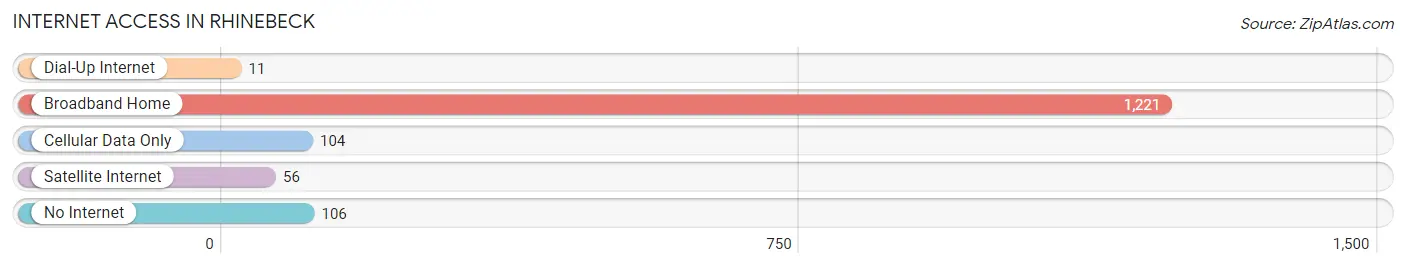
| Internet Type | # Households | % Households |
| Dial-Up Internet | 11 | 0.8% |
| Broadband Home | 1,221 | 84.1% |
| Cellular Data Only | 104 | 7.2% |
| Satellite Internet | 56 | 3.9% |
| No Internet | 106 | 7.3% |
| Total | 1,452 | 100.0% |
Rhinebeck Summary
Rhinebeck, NY is a small town located in the Hudson Valley region of New York State. It is situated in Dutchess County, approximately 90 miles north of New York City. The town has a population of approximately 2,700 people and covers an area of 8.2 square miles.
History
Rhinebeck was first settled in 1686 by Dutch settlers who named it “Ryn Beck” after the nearby creek. The town was officially incorporated in 1737 and was named after the Rhine River in Germany. During the Revolutionary War, Rhinebeck was the site of a major battle between the British and American forces. The town was also the site of the first presidential inauguration of George Washington in 1789.
In the 19th century, Rhinebeck became a popular summer destination for wealthy New Yorkers. The town was home to several grand estates, including the Vanderbilt Mansion and the Astor Estate. The town also became a center for the arts, with several prominent artists and writers living in the area.
Geography
Rhinebeck is located in the Hudson Valley region of New York State. The town is situated in Dutchess County, approximately 90 miles north of New York City. The town is bordered by the towns of Red Hook to the north, Milan to the east, Clinton to the south, and Hyde Park to the west.
The town is situated on the east bank of the Hudson River and is surrounded by rolling hills and forests. The town is home to several parks and nature preserves, including the Rhinecliff-Kingston State Park and the Hudson Highlands State Park.
Economy
Rhinebeck’s economy is largely based on tourism and agriculture. The town is home to several wineries, breweries, and distilleries, as well as several farms and orchards. The town is also home to several antique shops and art galleries.
The town is also home to several small businesses, including restaurants, cafes, and retail stores. The town is also home to several historic sites, including the Vanderbilt Mansion and the Astor Estate.
Demographics
As of the 2010 census, Rhinebeck had a population of 2,749 people. The racial makeup of the town was 94.3% White, 2.2% African American, 0.3% Native American, 0.7% Asian, 0.1% Pacific Islander, and 2.4% from other races. Hispanic or Latino of any race were 4.2% of the population.
The median household income in Rhinebeck was $60,972, and the median family income was $71,917. The per capita income for the town was $30,945. About 5.3% of families and 8.2% of the population were below the poverty line, including 10.2% of those under age 18 and 5.2% of those age 65 or over.
Common Questions
What is Per Capita Income in Rhinebeck?
Per Capita income in Rhinebeck is $62,887.
What is the Median Family Income in Rhinebeck?
Median Family Income in Rhinebeck is $119,695.
What is the Median Household income in Rhinebeck?
Median Household Income in Rhinebeck is $73,910.
What is Income or Wage Gap in Rhinebeck?
Income or Wage Gap in Rhinebeck is 27.1%.
Women in Rhinebeck earn 72.9 cents for every dollar earned by a man.
What is Inequality or Gini Index in Rhinebeck?
Inequality or Gini Index in Rhinebeck is 0.49.
What is the Total Population of Rhinebeck?
Total Population of Rhinebeck is 2,693.
What is the Total Male Population of Rhinebeck?
Total Male Population of Rhinebeck is 1,182.
What is the Total Female Population of Rhinebeck?
Total Female Population of Rhinebeck is 1,511.
What is the Ratio of Males per 100 Females in Rhinebeck?
There are 78.23 Males per 100 Females in Rhinebeck.
What is the Ratio of Females per 100 Males in Rhinebeck?
There are 127.83 Females per 100 Males in Rhinebeck.
What is the Median Population Age in Rhinebeck?
Median Population Age in Rhinebeck is 52.1 Years.
What is the Average Family Size in Rhinebeck
Average Family Size in Rhinebeck is 2.4 People.
What is the Average Household Size in Rhinebeck
Average Household Size in Rhinebeck is 1.8 People.
How Large is the Labor Force in Rhinebeck?
There are 1,373 People in the Labor Forcein in Rhinebeck.
What is the Percentage of People in the Labor Force in Rhinebeck?
58.2% of People are in the Labor Force in Rhinebeck.
What is the Unemployment Rate in Rhinebeck?
Unemployment Rate in Rhinebeck is 6.0%.