East Ithaca, NY Map & Demographics
East Ithaca Map
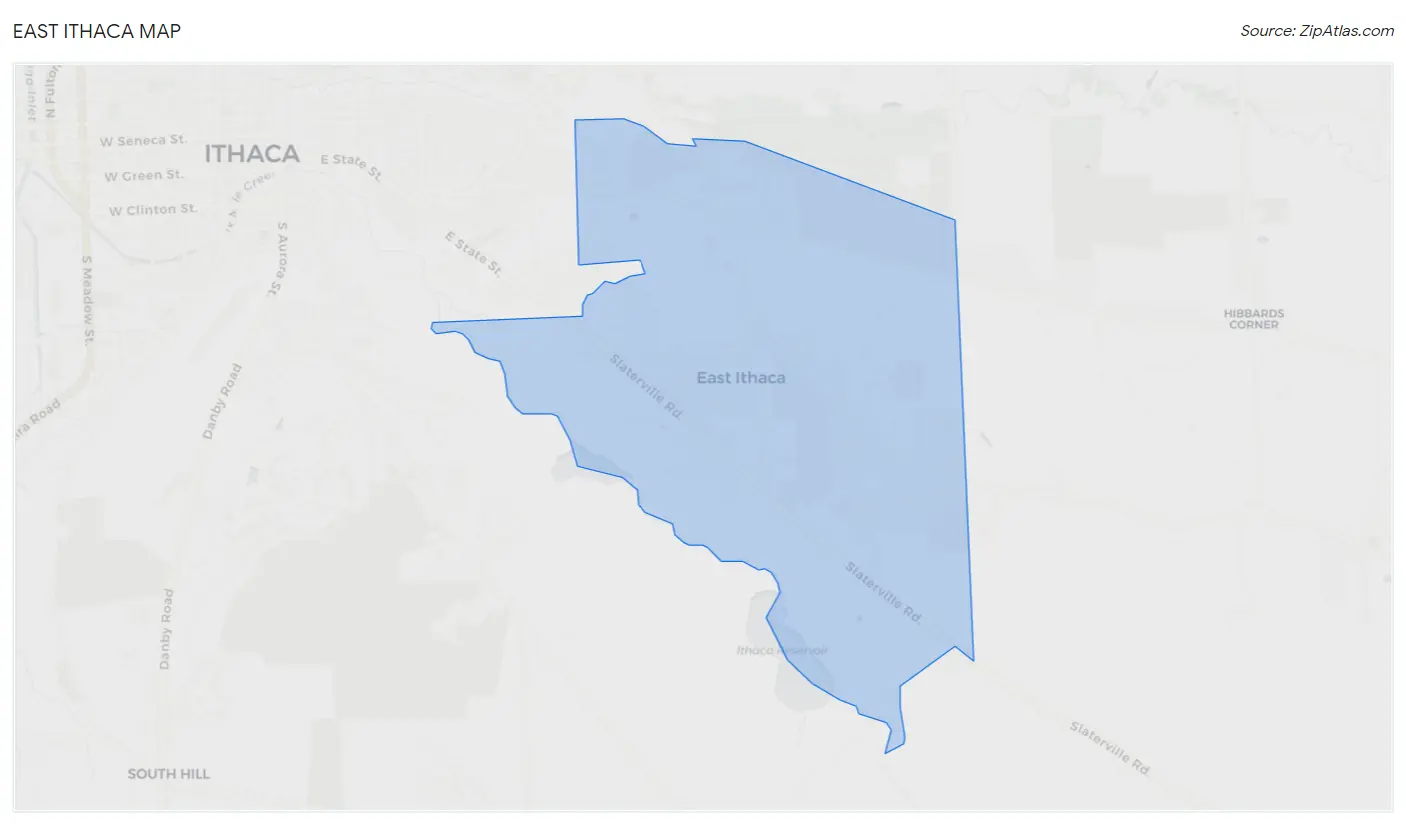
East Ithaca Overview
$61,221
PER CAPITA INCOME
$114,885
AVG FAMILY INCOME
$115,449
AVG HOUSEHOLD INCOME
44.0%
WAGE / INCOME GAP [ % ]
56.0¢/ $1
WAGE / INCOME GAP [ $ ]
0.46
INEQUALITY / GINI INDEX
2,135
TOTAL POPULATION
979
MALE POPULATION
1,156
FEMALE POPULATION
84.69
MALES / 100 FEMALES
118.08
FEMALES / 100 MALES
39.1
MEDIAN AGE
2.2
AVG FAMILY SIZE
1.9
AVG HOUSEHOLD SIZE
1,216
LABOR FORCE [ PEOPLE ]
62.8%
PERCENT IN LABOR FORCE
3.3%
UNEMPLOYMENT RATE
Income in East Ithaca
Income Overview in East Ithaca
Per Capita Income in East Ithaca is $61,221, while median incomes of families and households are $114,885 and $115,449 respectively.
| Characteristic | Number | Measure |
| Per Capita Income | 2,135 | $61,221 |
| Median Family Income | 597 | $114,885 |
| Mean Family Income | 597 | $159,102 |
| Median Household Income | 1,110 | $115,449 |
| Mean Household Income | 1,110 | $130,635 |
| Income Deficit | 597 | $0 |
| Wage / Income Gap (%) | 2,135 | 44.01% |
| Wage / Income Gap ($) | 2,135 | 55.99¢ per $1 |
| Gini / Inequality Index | 2,135 | 0.46 |
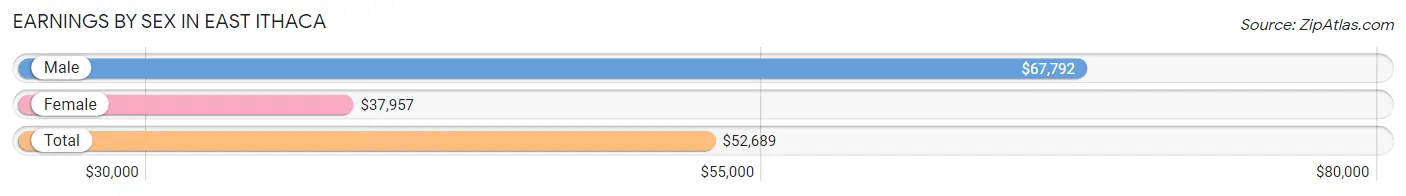
Earnings by Sex in East Ithaca
Average Earnings in East Ithaca are $52,689, $67,792 for men and $37,957 for women, a difference of 44.0%.
| Sex | Number | Average Earnings |
| Male | 606 (45.3%) | $67,792 |
| Female | 731 (54.7%) | $37,957 |
| Total | 1,337 (100.0%) | $52,689 |
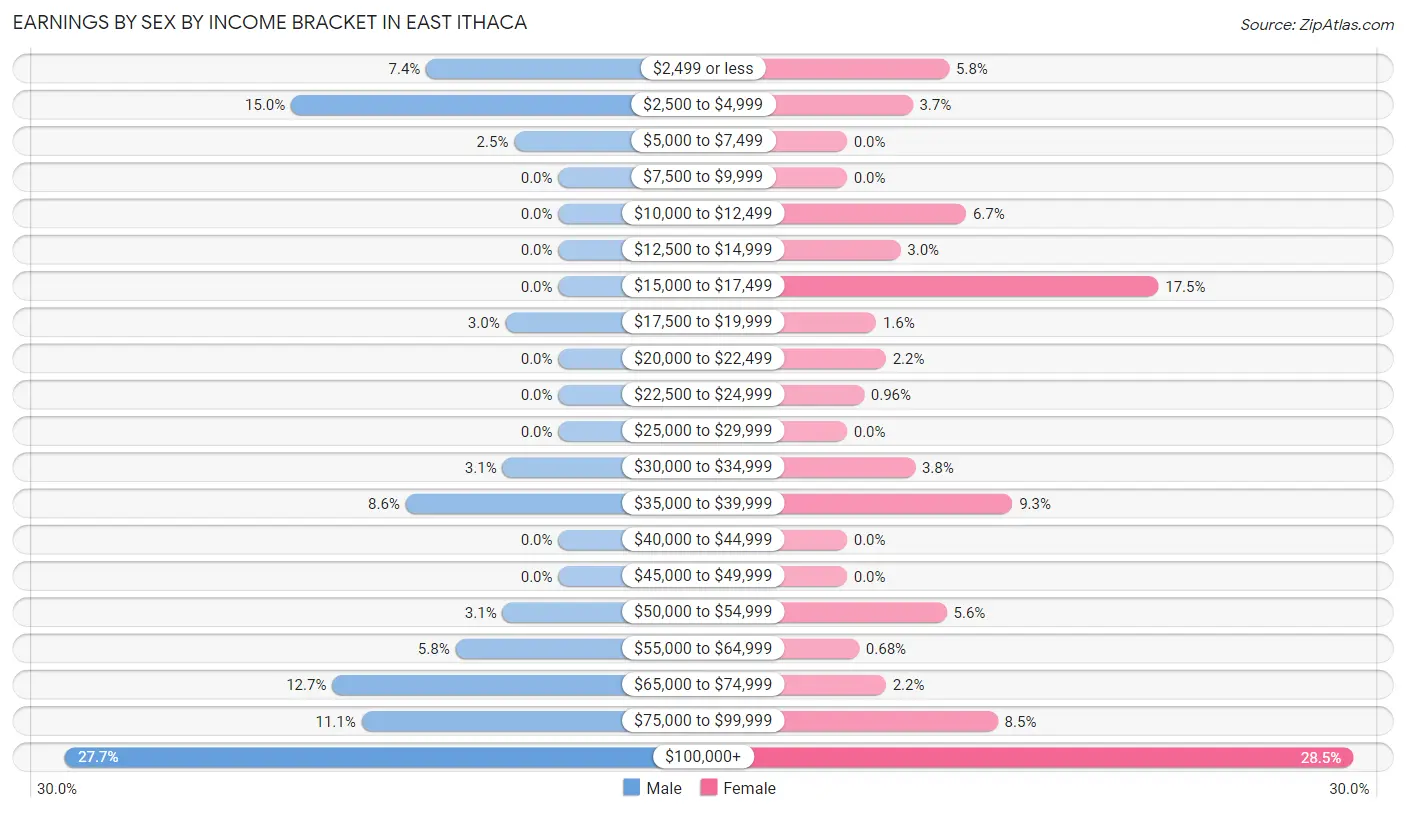
Earnings by Sex by Income Bracket in East Ithaca
The most common earnings brackets in East Ithaca are $100,000+ for men (168 | 27.7%) and $100,000+ for women (208 | 28.4%).
| Income | Male | Female |
| $2,499 or less | 45 (7.4%) | 42 (5.8%) |
| $2,500 to $4,999 | 91 (15.0%) | 27 (3.7%) |
| $5,000 to $7,499 | 15 (2.5%) | 0 (0.0%) |
| $7,500 to $9,999 | 0 (0.0%) | 0 (0.0%) |
| $10,000 to $12,499 | 0 (0.0%) | 49 (6.7%) |
| $12,500 to $14,999 | 0 (0.0%) | 22 (3.0%) |
| $15,000 to $17,499 | 0 (0.0%) | 128 (17.5%) |
| $17,500 to $19,999 | 18 (3.0%) | 12 (1.6%) |
| $20,000 to $22,499 | 0 (0.0%) | 16 (2.2%) |
| $22,500 to $24,999 | 0 (0.0%) | 7 (1.0%) |
| $25,000 to $29,999 | 0 (0.0%) | 0 (0.0%) |
| $30,000 to $34,999 | 19 (3.1%) | 28 (3.8%) |
| $35,000 to $39,999 | 52 (8.6%) | 68 (9.3%) |
| $40,000 to $44,999 | 0 (0.0%) | 0 (0.0%) |
| $45,000 to $49,999 | 0 (0.0%) | 0 (0.0%) |
| $50,000 to $54,999 | 19 (3.1%) | 41 (5.6%) |
| $55,000 to $64,999 | 35 (5.8%) | 5 (0.7%) |
| $65,000 to $74,999 | 77 (12.7%) | 16 (2.2%) |
| $75,000 to $99,999 | 67 (11.1%) | 62 (8.5%) |
| $100,000+ | 168 (27.7%) | 208 (28.4%) |
| Total | 606 (100.0%) | 731 (100.0%) |
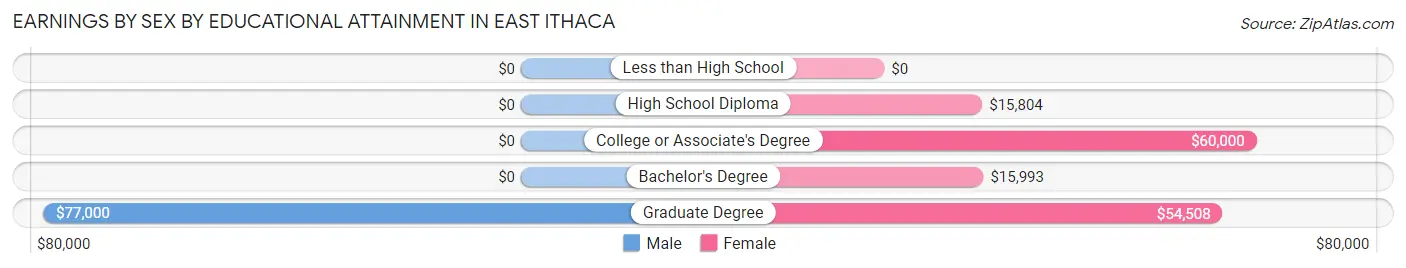
Earnings by Sex by Educational Attainment in East Ithaca
Average earnings in East Ithaca are $68,571 for men and $37,454 for women, a difference of 45.4%. Men with an educational attainment of graduate degree enjoy the highest average annual earnings of $77,000, while those with graduate degree education earn the least with $77,000. Women with an educational attainment of college or associate's degree earn the most with the average annual earnings of $60,000, while those with high school diploma education have the smallest earnings of $15,804.
| Educational Attainment | Male Income | Female Income |
| Less than High School | - | - |
| High School Diploma | - | - |
| College or Associate's Degree | - | - |
| Bachelor's Degree | - | - |
| Graduate Degree | $77,000 | $54,508 |
| Total | $68,571 | $37,454 |
Family Income in East Ithaca
Family Income Brackets in East Ithaca
According to the East Ithaca family income data, there are 221 families falling into the $100,000 to $149,999 income range, which is the most common income bracket and makes up 37.0% of all families.
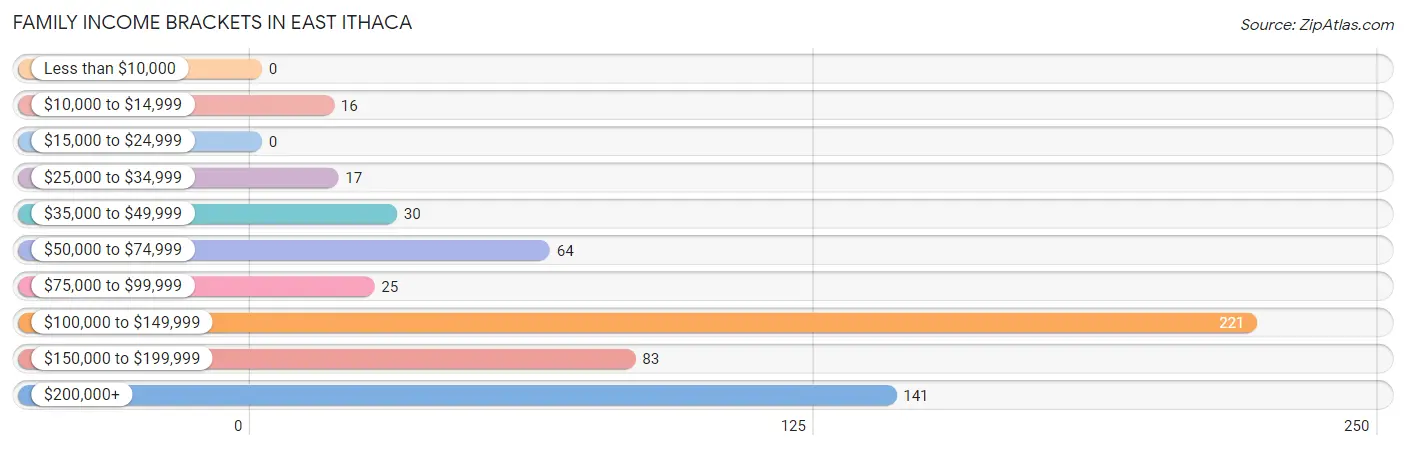
| Income Bracket | # Families | % Families |
| Less than $10,000 | 0 | 0.0% |
| $10,000 to $14,999 | 16 | 2.7% |
| $15,000 to $24,999 | 0 | 0.0% |
| $25,000 to $34,999 | 17 | 2.8% |
| $35,000 to $49,999 | 30 | 5.0% |
| $50,000 to $74,999 | 64 | 10.7% |
| $75,000 to $99,999 | 25 | 4.2% |
| $100,000 to $149,999 | 221 | 37.0% |
| $150,000 to $199,999 | 83 | 13.9% |
| $200,000+ | 141 | 23.6% |
Family Income by Famaliy Size in East Ithaca
3-person families (102 | 17.1%) account for the highest median family income in East Ithaca with $154,063 per family, while 2-person families (411 | 68.8%) have the highest median income of $56,640 per family member.
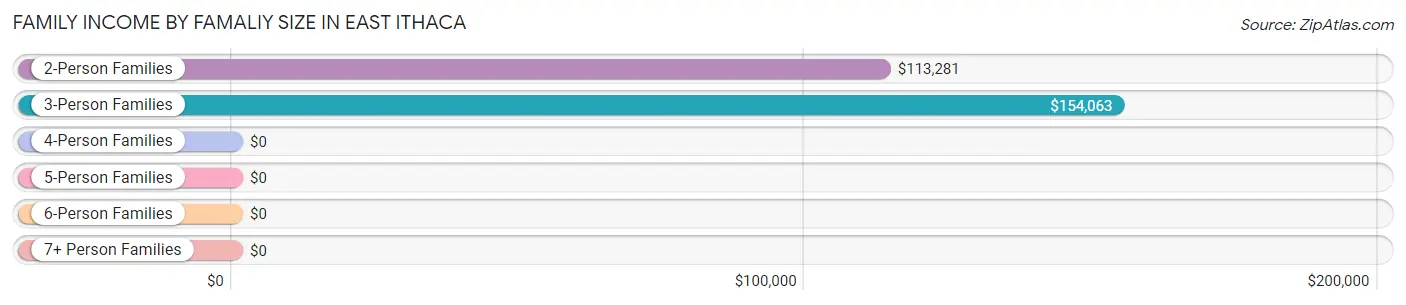
| Income Bracket | # Families | Median Income |
| 2-Person Families | 411 (68.8%) | $113,281 |
| 3-Person Families | 102 (17.1%) | $154,063 |
| 4-Person Families | 84 (14.1%) | $0 |
| 5-Person Families | 0 (0.0%) | $0 |
| 6-Person Families | 0 (0.0%) | $0 |
| 7+ Person Families | 0 (0.0%) | $0 |
| Total | 597 (100.0%) | $114,885 |
Family Income by Number of Earners in East Ithaca
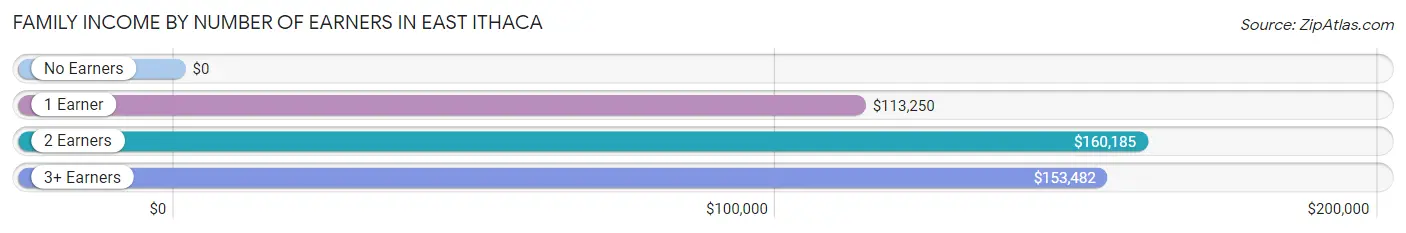
| Number of Earners | # Families | Median Income |
| No Earners | 97 (16.3%) | $0 |
| 1 Earner | 234 (39.2%) | $113,250 |
| 2 Earners | 164 (27.5%) | $160,185 |
| 3+ Earners | 102 (17.1%) | $153,482 |
| Total | 597 (100.0%) | $114,885 |
Household Income in East Ithaca
Household Income Brackets in East Ithaca
With 216 households falling in the category, the $200,000+ income range is the most frequent in East Ithaca, accounting for 19.5% of all households. In contrast, only 32 households (2.9%) fall into the $10,000 to $14,999 income bracket, making it the least populous group.
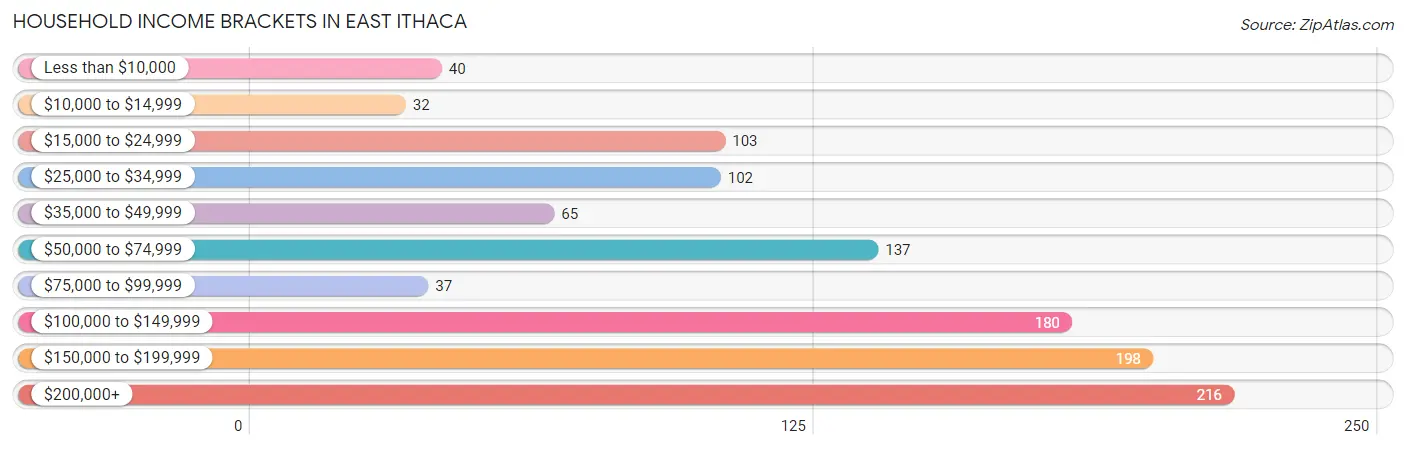
| Income Bracket | # Households | % Households |
| Less than $10,000 | 40 | 3.6% |
| $10,000 to $14,999 | 32 | 2.9% |
| $15,000 to $24,999 | 103 | 9.3% |
| $25,000 to $34,999 | 102 | 9.2% |
| $35,000 to $49,999 | 65 | 5.9% |
| $50,000 to $74,999 | 137 | 12.3% |
| $75,000 to $99,999 | 37 | 3.3% |
| $100,000 to $149,999 | 180 | 16.2% |
| $150,000 to $199,999 | 198 | 17.8% |
| $200,000+ | 216 | 19.5% |
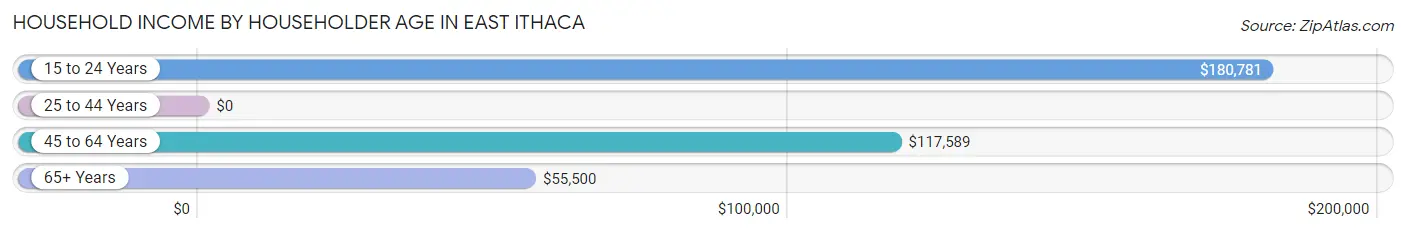
Household Income by Householder Age in East Ithaca
The median household income in East Ithaca is $115,449, with the highest median household income of $180,781 found in the 15 to 24 years age bracket for the primary householder. A total of 211 households (19.0%) fall into this category. Meanwhile, the 25 to 44 years age bracket for the primary householder has the lowest median household income of $0, with 234 households (21.1%) in this group.
| Income Bracket | # Households | Median Income |
| 15 to 24 Years | 211 (19.0%) | $180,781 |
| 25 to 44 Years | 234 (21.1%) | $0 |
| 45 to 64 Years | 321 (28.9%) | $117,589 |
| 65+ Years | 344 (31.0%) | $55,500 |
| Total | 1,110 (100.0%) | $115,449 |
Poverty in East Ithaca
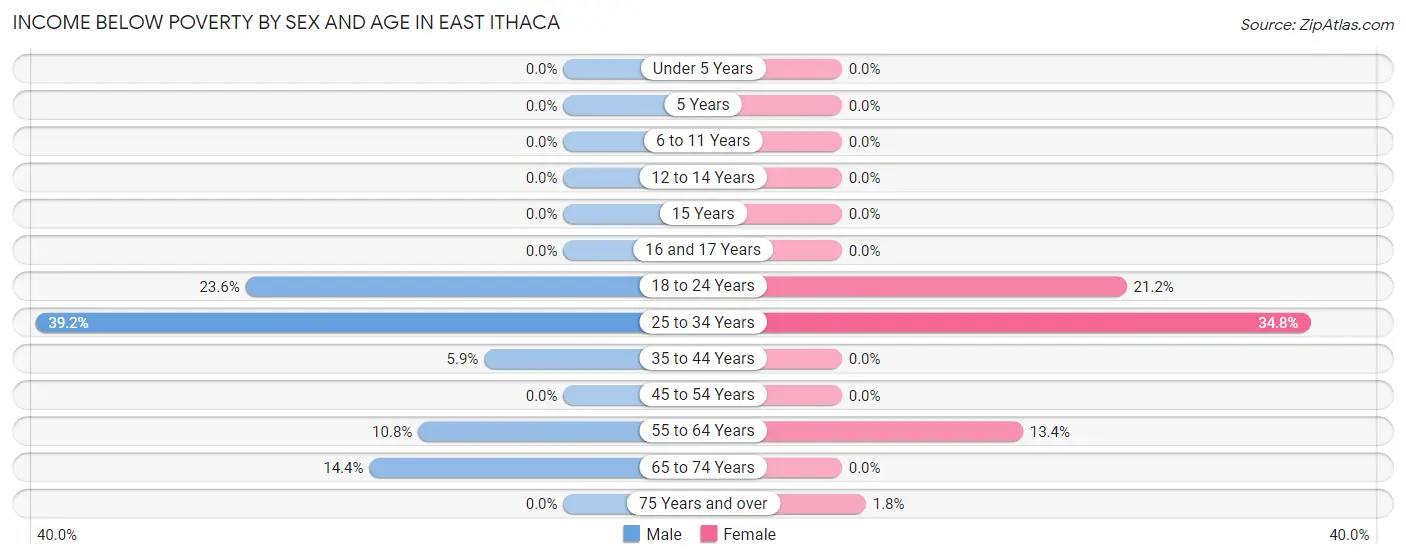
Income Below Poverty by Sex and Age in East Ithaca
With 12.6% poverty level for males and 13.3% for females among the residents of East Ithaca, 25 to 34 year old males and 25 to 34 year old females are the most vulnerable to poverty, with 49 males (39.2%) and 56 females (34.8%) in their respective age groups living below the poverty level.
| Age Bracket | Male | Female |
| Under 5 Years | 0 (0.0%) | 0 (0.0%) |
| 5 Years | 0 (0.0%) | 0 (0.0%) |
| 6 to 11 Years | 0 (0.0%) | 0 (0.0%) |
| 12 to 14 Years | 0 (0.0%) | 0 (0.0%) |
| 15 Years | 0 (0.0%) | 0 (0.0%) |
| 16 and 17 Years | 0 (0.0%) | 0 (0.0%) |
| 18 to 24 Years | 42 (23.6%) | 70 (21.1%) |
| 25 to 34 Years | 49 (39.2%) | 56 (34.8%) |
| 35 to 44 Years | 5 (5.9%) | 0 (0.0%) |
| 45 to 54 Years | 0 (0.0%) | 0 (0.0%) |
| 55 to 64 Years | 11 (10.8%) | 25 (13.4%) |
| 65 to 74 Years | 16 (14.4%) | 0 (0.0%) |
| 75 Years and over | 0 (0.0%) | 3 (1.8%) |
| Total | 123 (12.6%) | 154 (13.3%) |
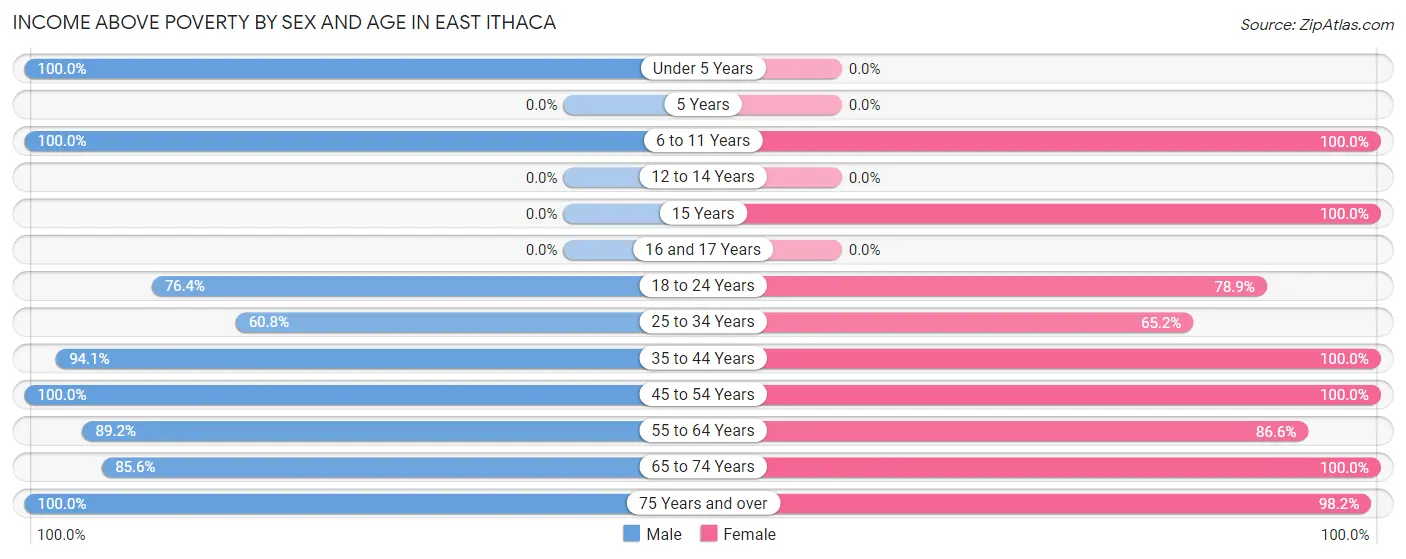
Income Above Poverty by Sex and Age in East Ithaca
According to the poverty statistics in East Ithaca, males aged under 5 years and females aged 6 to 11 years are the age groups that are most secure financially, with 100.0% of males and 100.0% of females in these age groups living above the poverty line.
| Age Bracket | Male | Female |
| Under 5 Years | 103 (100.0%) | 0 (0.0%) |
| 5 Years | 0 (0.0%) | 0 (0.0%) |
| 6 to 11 Years | 73 (100.0%) | 11 (100.0%) |
| 12 to 14 Years | 0 (0.0%) | 0 (0.0%) |
| 15 Years | 0 (0.0%) | 12 (100.0%) |
| 16 and 17 Years | 0 (0.0%) | 0 (0.0%) |
| 18 to 24 Years | 136 (76.4%) | 261 (78.8%) |
| 25 to 34 Years | 76 (60.8%) | 105 (65.2%) |
| 35 to 44 Years | 80 (94.1%) | 74 (100.0%) |
| 45 to 54 Years | 118 (100.0%) | 61 (100.0%) |
| 55 to 64 Years | 91 (89.2%) | 161 (86.6%) |
| 65 to 74 Years | 95 (85.6%) | 151 (100.0%) |
| 75 Years and over | 84 (100.0%) | 166 (98.2%) |
| Total | 856 (87.4%) | 1,002 (86.7%) |
Income Below Poverty Among Married-Couple Families in East Ithaca
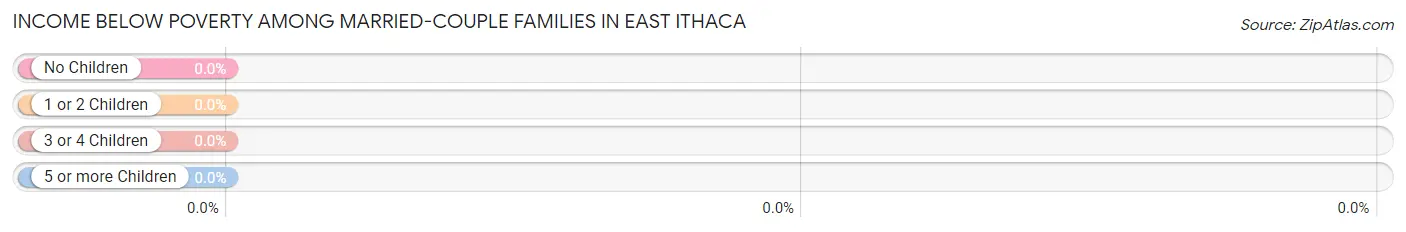
| Children | Above Poverty | Below Poverty |
| No Children | 364 (100.0%) | 0 (0.0%) |
| 1 or 2 Children | 49 (100.0%) | 0 (0.0%) |
| 3 or 4 Children | 0 (0.0%) | 0 (0.0%) |
| 5 or more Children | 0 (0.0%) | 0 (0.0%) |
| Total | 413 (100.0%) | 0 (0.0%) |
Income Below Poverty Among Single-Parent Households in East Ithaca
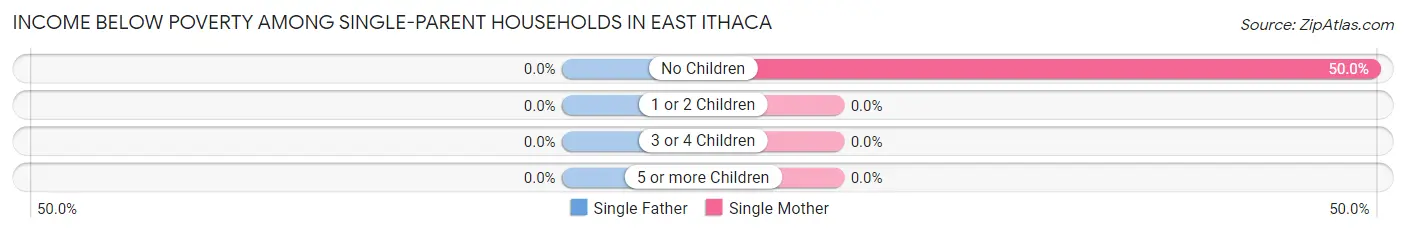
| Children | Single Father | Single Mother |
| No Children | 0 (0.0%) | 16 (50.0%) |
| 1 or 2 Children | 0 (0.0%) | 0 (0.0%) |
| 3 or 4 Children | 0 (0.0%) | 0 (0.0%) |
| 5 or more Children | 0 (0.0%) | 0 (0.0%) |
| Total | 0 (0.0%) | 16 (8.7%) |
Income Below Poverty Among Married-Couple vs Single-Parent Households in East Ithaca
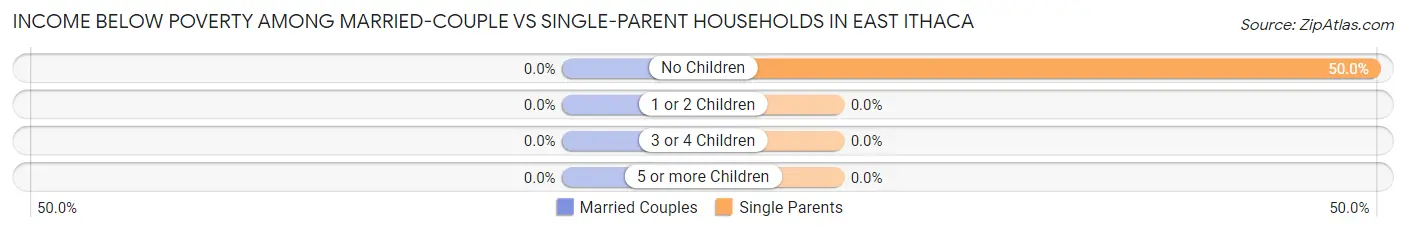
| Children | Married-Couple Families | Single-Parent Households |
| No Children | 0 (0.0%) | 16 (50.0%) |
| 1 or 2 Children | 0 (0.0%) | 0 (0.0%) |
| 3 or 4 Children | 0 (0.0%) | 0 (0.0%) |
| 5 or more Children | 0 (0.0%) | 0 (0.0%) |
| Total | 0 (0.0%) | 16 (8.7%) |
Race in East Ithaca
The most populous races in East Ithaca are White / Caucasian (1,514 | 70.9%), Asian (396 | 18.5%), and Two or more Races (198 | 9.3%).
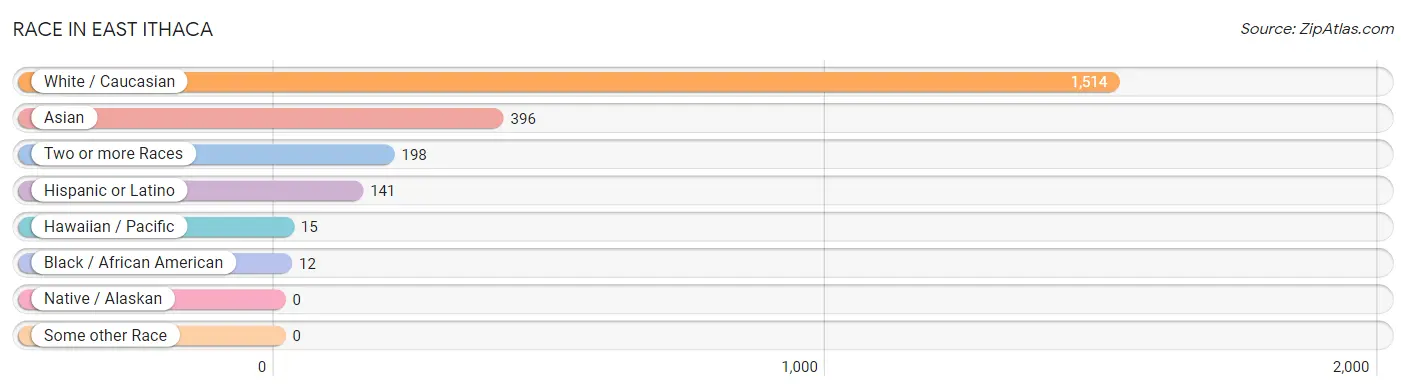
| Race | # Population | % Population |
| Asian | 396 | 18.5% |
| Black / African American | 12 | 0.6% |
| Hawaiian / Pacific | 15 | 0.7% |
| Hispanic or Latino | 141 | 6.6% |
| Native / Alaskan | 0 | 0.0% |
| White / Caucasian | 1,514 | 70.9% |
| Two or more Races | 198 | 9.3% |
| Some other Race | 0 | 0.0% |
| Total | 2,135 | 100.0% |
Ancestry in East Ithaca
The most populous ancestries reported in East Ithaca are English (422 | 19.8%), German (342 | 16.0%), Indian (Asian) (257 | 12.0%), Irish (201 | 9.4%), and Italian (185 | 8.7%), together accounting for 65.9% of all East Ithaca residents.
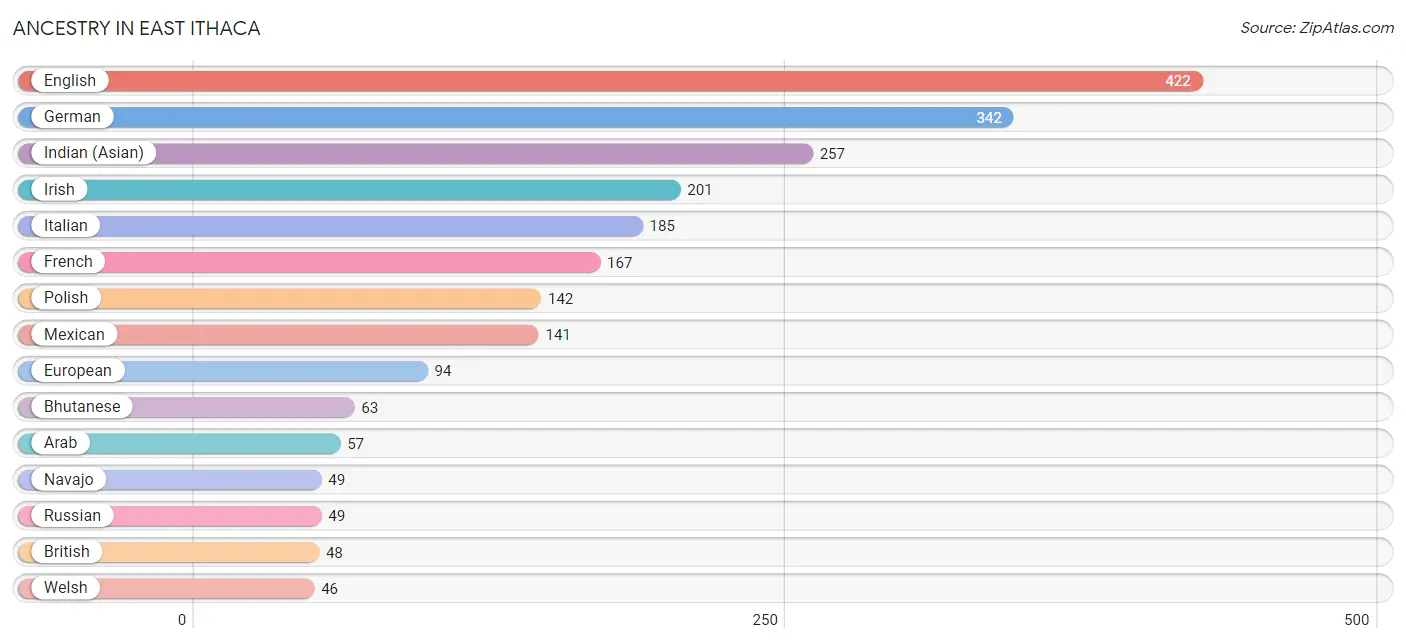
| Ancestry | # Population | % Population |
| American | 40 | 1.9% |
| Arab | 57 | 2.7% |
| Belgian | 26 | 1.2% |
| Bhutanese | 63 | 2.9% |
| British | 48 | 2.2% |
| Burmese | 18 | 0.8% |
| Egyptian | 40 | 1.9% |
| English | 422 | 19.8% |
| European | 94 | 4.4% |
| Finnish | 15 | 0.7% |
| French | 167 | 7.8% |
| German | 342 | 16.0% |
| Ghanaian | 5 | 0.2% |
| Greek | 8 | 0.4% |
| Indian (Asian) | 257 | 12.0% |
| Irish | 201 | 9.4% |
| Italian | 185 | 8.7% |
| Korean | 40 | 1.9% |
| Latvian | 19 | 0.9% |
| Lebanese | 17 | 0.8% |
| Mexican | 141 | 6.6% |
| Native Hawaiian | 15 | 0.7% |
| Navajo | 49 | 2.3% |
| Norwegian | 14 | 0.7% |
| Polish | 142 | 6.7% |
| Romanian | 31 | 1.5% |
| Russian | 49 | 2.3% |
| Scotch-Irish | 11 | 0.5% |
| Scottish | 11 | 0.5% |
| Subsaharan African | 5 | 0.2% |
| Thai | 18 | 0.8% |
| Ukrainian | 17 | 0.8% |
| Welsh | 46 | 2.1% | View All 33 Rows |
Immigrants in East Ithaca
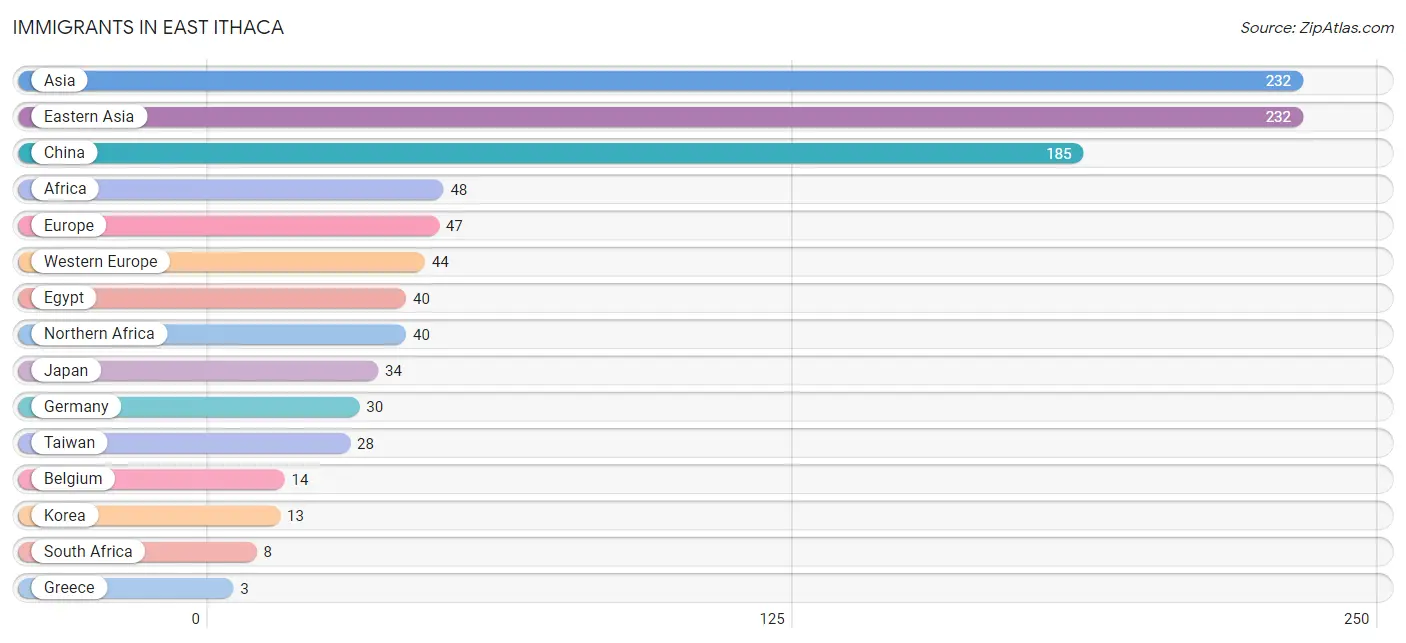
The most numerous immigrant groups reported in East Ithaca came from Asia (232 | 10.9%), Eastern Asia (232 | 10.9%), China (185 | 8.7%), Africa (48 | 2.2%), and Europe (47 | 2.2%), together accounting for 34.9% of all East Ithaca residents.
| Immigration Origin | # Population | % Population |
| Africa | 48 | 2.2% |
| Asia | 232 | 10.9% |
| Belgium | 14 | 0.7% |
| China | 185 | 8.7% |
| Eastern Asia | 232 | 10.9% |
| Egypt | 40 | 1.9% |
| Europe | 47 | 2.2% |
| Germany | 30 | 1.4% |
| Greece | 3 | 0.1% |
| Japan | 34 | 1.6% |
| Korea | 13 | 0.6% |
| Northern Africa | 40 | 1.9% |
| South Africa | 8 | 0.4% |
| Southern Europe | 3 | 0.1% |
| Taiwan | 28 | 1.3% |
| Western Europe | 44 | 2.1% | View All 16 Rows |
Sex and Age in East Ithaca
Sex and Age in East Ithaca
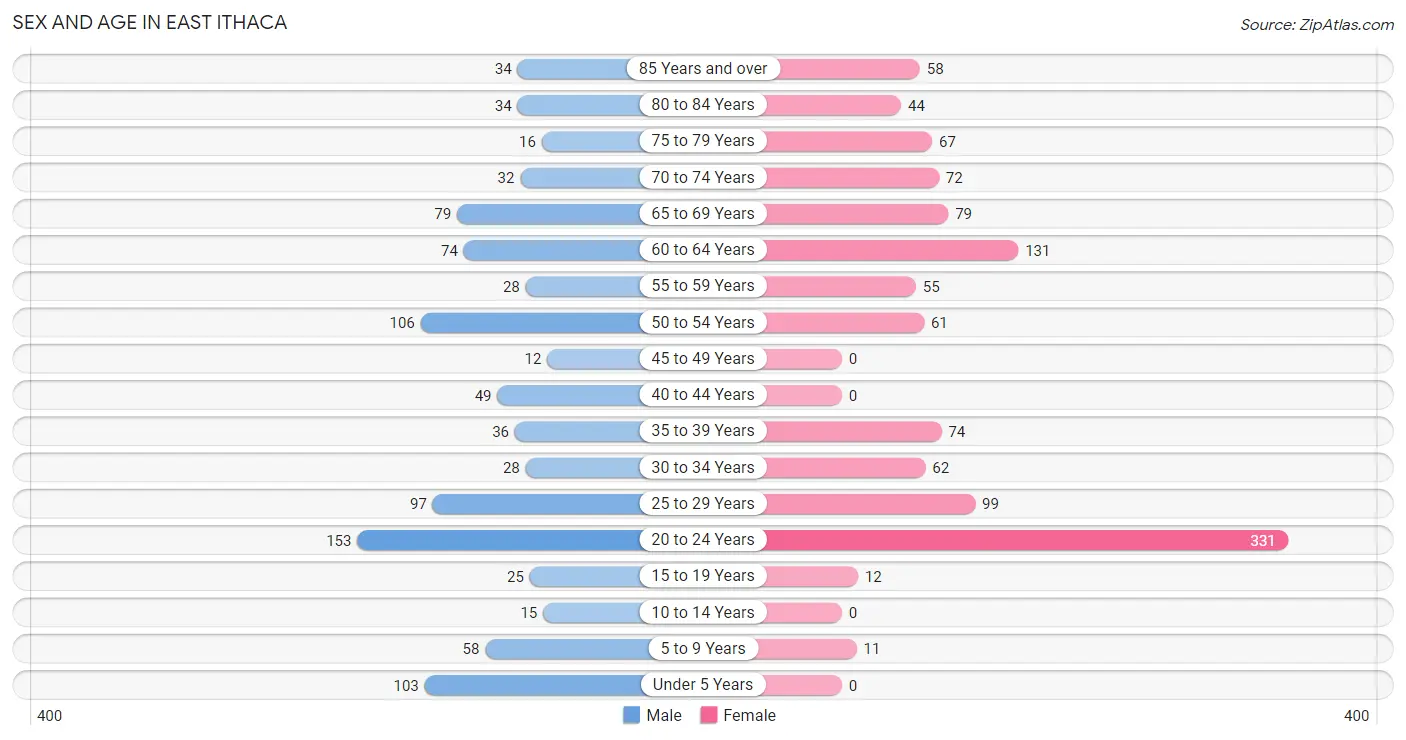
The most populous age groups in East Ithaca are 20 to 24 Years (153 | 15.6%) for men and 20 to 24 Years (331 | 28.6%) for women.
| Age Bracket | Male | Female |
| Under 5 Years | 103 (10.5%) | 0 (0.0%) |
| 5 to 9 Years | 58 (5.9%) | 11 (0.9%) |
| 10 to 14 Years | 15 (1.5%) | 0 (0.0%) |
| 15 to 19 Years | 25 (2.5%) | 12 (1.0%) |
| 20 to 24 Years | 153 (15.6%) | 331 (28.6%) |
| 25 to 29 Years | 97 (9.9%) | 99 (8.6%) |
| 30 to 34 Years | 28 (2.9%) | 62 (5.4%) |
| 35 to 39 Years | 36 (3.7%) | 74 (6.4%) |
| 40 to 44 Years | 49 (5.0%) | 0 (0.0%) |
| 45 to 49 Years | 12 (1.2%) | 0 (0.0%) |
| 50 to 54 Years | 106 (10.8%) | 61 (5.3%) |
| 55 to 59 Years | 28 (2.9%) | 55 (4.8%) |
| 60 to 64 Years | 74 (7.6%) | 131 (11.3%) |
| 65 to 69 Years | 79 (8.1%) | 79 (6.8%) |
| 70 to 74 Years | 32 (3.3%) | 72 (6.2%) |
| 75 to 79 Years | 16 (1.6%) | 67 (5.8%) |
| 80 to 84 Years | 34 (3.5%) | 44 (3.8%) |
| 85 Years and over | 34 (3.5%) | 58 (5.0%) |
| Total | 979 (100.0%) | 1,156 (100.0%) |
Families and Households in East Ithaca
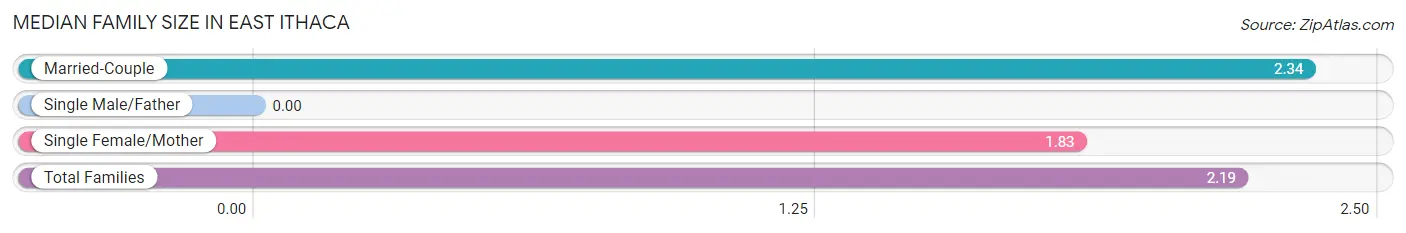
Median Family Size in East Ithaca
| Family Type | # Families | Family Size |
| Married-Couple | 413 (69.2%) | 2.34 |
| Single Male/Father | 0 (0.0%) | - |
| Single Female/Mother | 184 (30.8%) | 1.83 |
| Total Families | 597 (100.0%) | 2.19 |
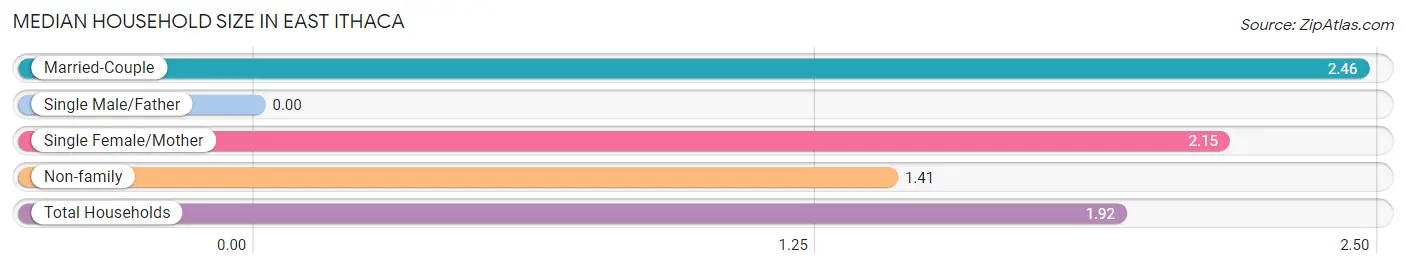
Median Household Size in East Ithaca
| Household Type | # Households | Household Size |
| Married-Couple | 413 (37.2%) | 2.46 |
| Single Male/Father | 0 (0.0%) | - |
| Single Female/Mother | 184 (16.6%) | 2.15 |
| Non-family | 513 (46.2%) | 1.41 |
| Total Households | 1,110 (100.0%) | 1.92 |
Household Size by Marriage Status in East Ithaca
Out of a total of 1,110 households in East Ithaca, 597 (53.8%) are family households, while 513 (46.2%) are nonfamily households. The most numerous type of family households are 3-person households, comprising 280, and the most common type of nonfamily households are 1-person households, comprising 340.
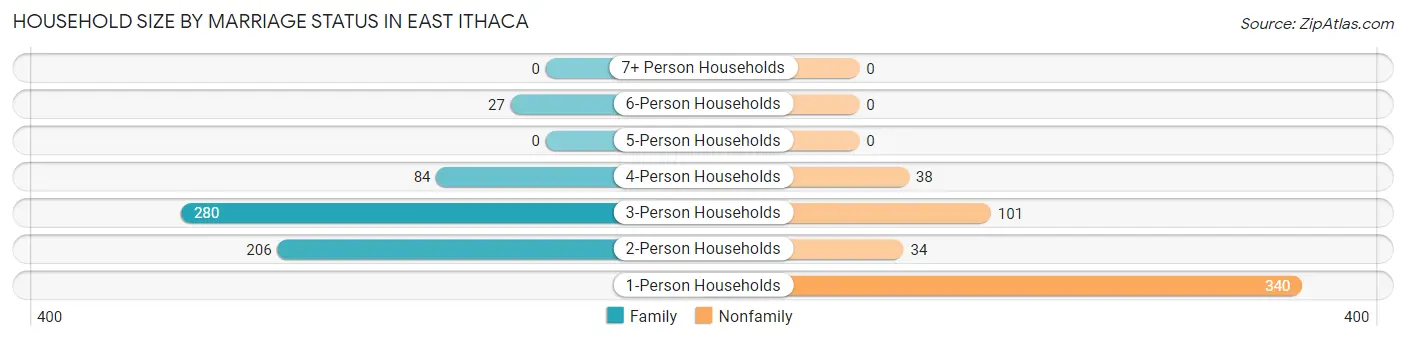
| Household Size | Family Households | Nonfamily Households |
| 1-Person Households | - | 340 (30.6%) |
| 2-Person Households | 206 (18.6%) | 34 (3.1%) |
| 3-Person Households | 280 (25.2%) | 101 (9.1%) |
| 4-Person Households | 84 (7.6%) | 38 (3.4%) |
| 5-Person Households | 0 (0.0%) | 0 (0.0%) |
| 6-Person Households | 27 (2.4%) | 0 (0.0%) |
| 7+ Person Households | 0 (0.0%) | 0 (0.0%) |
| Total | 597 (53.8%) | 513 (46.2%) |
Female Fertility in East Ithaca
Fertility by Age in East Ithaca
| Age Bracket | Women with Births | Births / 1,000 Women |
| 15 to 19 years | 0 (0.0%) | 0.0 |
| 20 to 34 years | 0 (0.0%) | 0.0 |
| 35 to 50 years | 0 (0.0%) | 0.0 |
| Total | 0 (0.0%) | 0.0 |
Fertility by Age by Marriage Status in East Ithaca
| Age Bracket | Married | Unmarried |
| 15 to 19 years | 0 (0.0%) | 0 (0.0%) |
| 20 to 34 years | 0 (0.0%) | 0 (0.0%) |
| 35 to 50 years | 0 (0.0%) | 0 (0.0%) |
| Total | 0 (0.0%) | 0 (0.0%) |
Fertility by Education in East Ithaca
| Educational Attainment | Women with Births | Births / 1,000 Women |
| Less than High School | 0 (0.0%) | 0.0 |
| High School Diploma | 0 (0.0%) | 0.0 |
| College or Associate's Degree | 0 (0.0%) | 0.0 |
| Bachelor's Degree | 0 (0.0%) | 0.0 |
| Graduate Degree | 0 (0.0%) | 0.0 |
| Total | 0 (0.0%) | 0.0 |
Fertility by Education by Marriage Status in East Ithaca
| Educational Attainment | Married | Unmarried |
| Less than High School | 0 (0.0%) | 0 (0.0%) |
| High School Diploma | 0 (0.0%) | 0 (0.0%) |
| College or Associate's Degree | 0 (0.0%) | 0 (0.0%) |
| Bachelor's Degree | 0 (0.0%) | 0 (0.0%) |
| Graduate Degree | 0 (0.0%) | 0 (0.0%) |
| Total | 0 (0.0%) | 0 (0.0%) |
Employment Characteristics in East Ithaca
Employment by Class of Employer in East Ithaca
Among the 1,176 employed individuals in East Ithaca, private company employees (443 | 37.7%), not-for-profit organizations (346 | 29.4%), and local government employees (182 | 15.5%) make up the most common classes of employment.
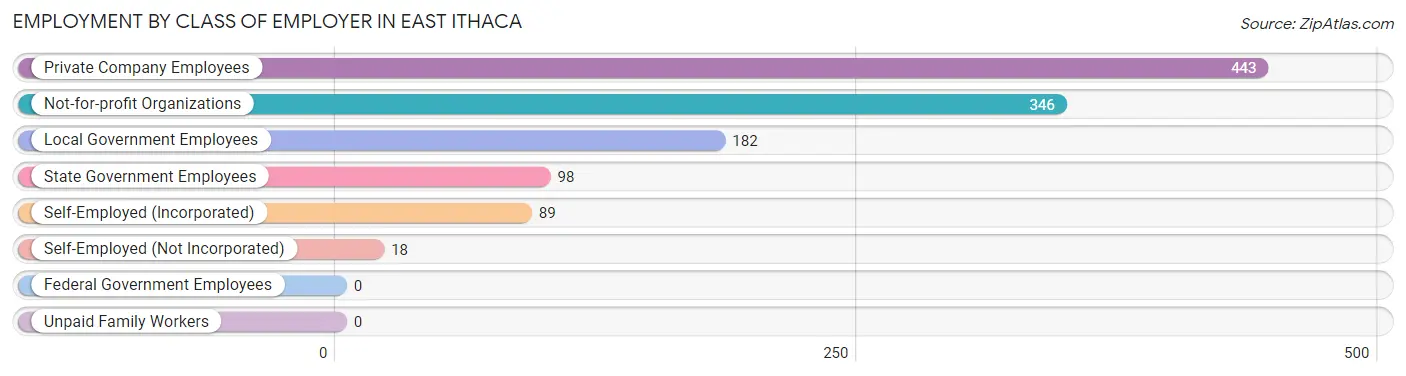
| Employer Class | # Employees | % Employees |
| Private Company Employees | 443 | 37.7% |
| Self-Employed (Incorporated) | 89 | 7.6% |
| Self-Employed (Not Incorporated) | 18 | 1.5% |
| Not-for-profit Organizations | 346 | 29.4% |
| Local Government Employees | 182 | 15.5% |
| State Government Employees | 98 | 8.3% |
| Federal Government Employees | 0 | 0.0% |
| Unpaid Family Workers | 0 | 0.0% |
| Total | 1,176 | 100.0% |
Employment Status by Age in East Ithaca
According to the labor force statistics for East Ithaca, out of the total population over 16 years of age (1,936), 62.8% or 1,216 individuals are in the labor force, with 3.3% or 40 of them unemployed. The age group with the highest labor force participation rate is 30 to 34 years, with 100.0% or 90 individuals in the labor force. Within the labor force, the 65 to 74 years age range has the highest percentage of unemployed individuals, with 20.0% or 16 of them being unemployed.
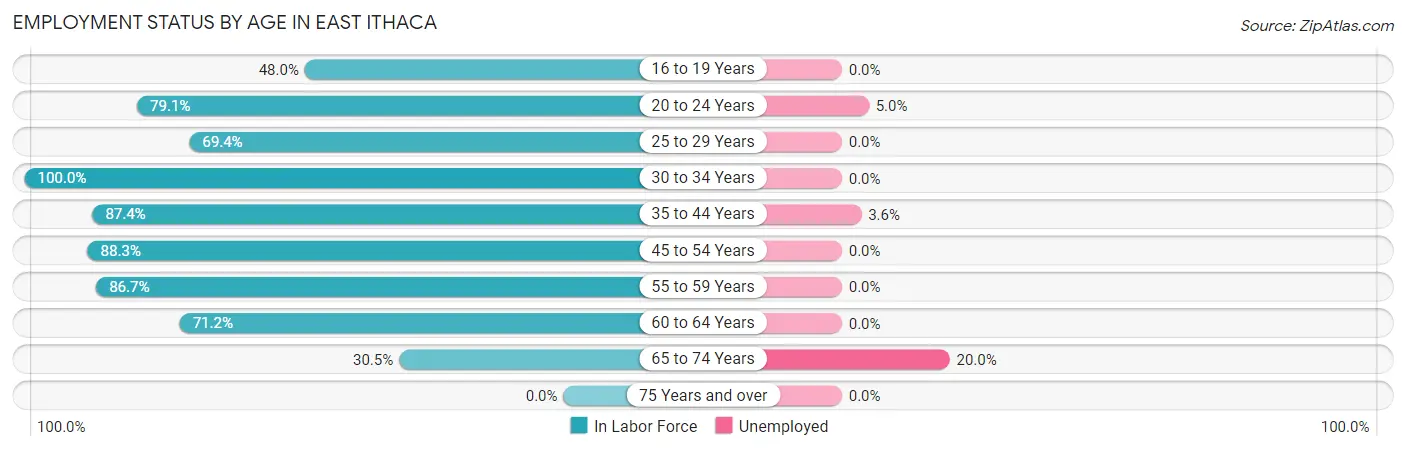
| Age Bracket | In Labor Force | Unemployed |
| 16 to 19 Years | 12 (48.0%) | 0 (0.0%) |
| 20 to 24 Years | 383 (79.1%) | 19 (5.0%) |
| 25 to 29 Years | 136 (69.4%) | 0 (0.0%) |
| 30 to 34 Years | 90 (100.0%) | 0 (0.0%) |
| 35 to 44 Years | 139 (87.4%) | 5 (3.6%) |
| 45 to 54 Years | 158 (88.3%) | 0 (0.0%) |
| 55 to 59 Years | 72 (86.7%) | 0 (0.0%) |
| 60 to 64 Years | 146 (71.2%) | 0 (0.0%) |
| 65 to 74 Years | 80 (30.5%) | 16 (20.0%) |
| 75 Years and over | 0 (0.0%) | 0 (0.0%) |
| Total | 1,216 (62.8%) | 40 (3.3%) |
Employment Status by Educational Attainment in East Ithaca
According to labor force statistics for East Ithaca, 81.3% of individuals (741) out of the total population between 25 and 64 years of age (912) are in the labor force, with 0.7% or 5 of them being unemployed. The group with the highest labor force participation rate are those with the educational attainment of high school diploma, with 100.0% or 77 individuals in the labor force. Within the labor force, individuals with bachelor's degree or higher education have the highest percentage of unemployment, with 0.9% or 5 of them being unemployed.
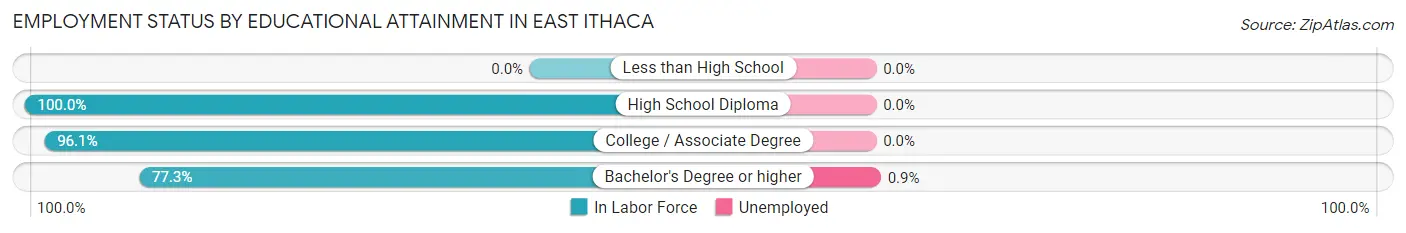
| Educational Attainment | In Labor Force | Unemployed |
| Less than High School | 0 (0.0%) | 0 (0.0%) |
| High School Diploma | 77 (100.0%) | 0 (0.0%) |
| College / Associate Degree | 122 (96.1%) | 0 (0.0%) |
| Bachelor's Degree or higher | 542 (77.3%) | 6 (0.9%) |
| Total | 741 (81.3%) | 6 (0.7%) |
Employment Occupations by Sex in East Ithaca
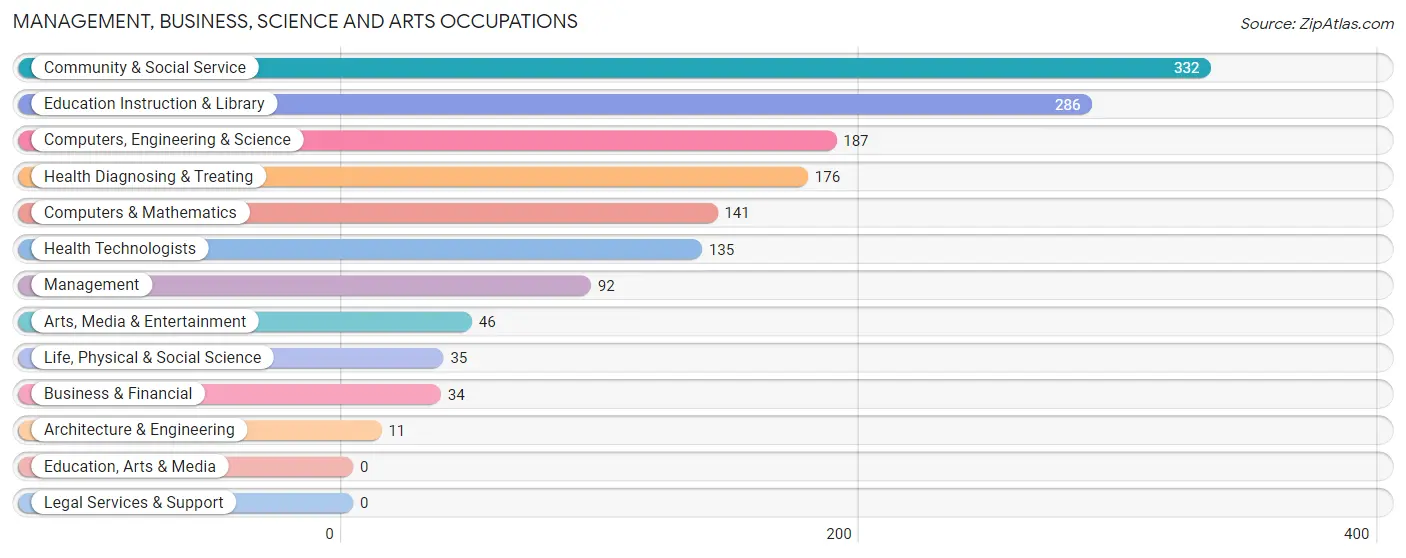
Management, Business, Science and Arts Occupations
The most common Management, Business, Science and Arts occupations in East Ithaca are Community & Social Service (332 | 28.2%), Education Instruction & Library (286 | 24.3%), Computers, Engineering & Science (187 | 15.9%), Health Diagnosing & Treating (176 | 15.0%), and Computers & Mathematics (141 | 12.0%).
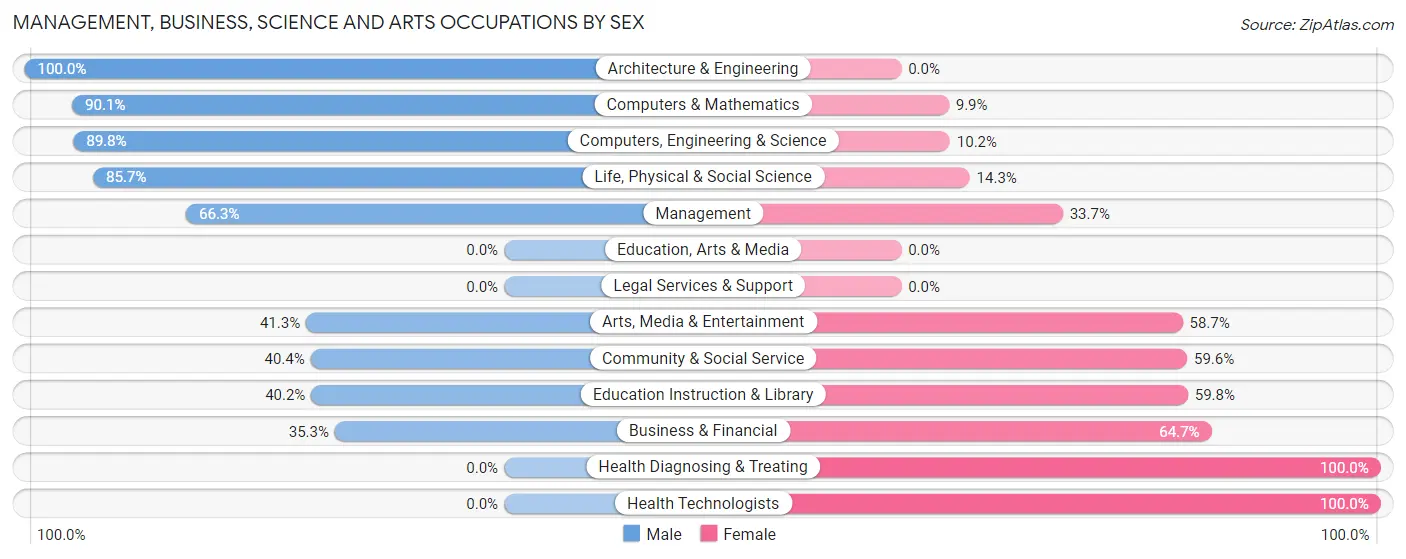
Management, Business, Science and Arts Occupations by Sex
Within the Management, Business, Science and Arts occupations in East Ithaca, the most male-oriented occupations are Architecture & Engineering (100.0%), Computers & Mathematics (90.1%), and Computers, Engineering & Science (89.8%), while the most female-oriented occupations are Health Diagnosing & Treating (100.0%), Health Technologists (100.0%), and Business & Financial (64.7%).
| Occupation | Male | Female |
| Management | 61 (66.3%) | 31 (33.7%) |
| Business & Financial | 12 (35.3%) | 22 (64.7%) |
| Computers, Engineering & Science | 168 (89.8%) | 19 (10.2%) |
| Computers & Mathematics | 127 (90.1%) | 14 (9.9%) |
| Architecture & Engineering | 11 (100.0%) | 0 (0.0%) |
| Life, Physical & Social Science | 30 (85.7%) | 5 (14.3%) |
| Community & Social Service | 134 (40.4%) | 198 (59.6%) |
| Education, Arts & Media | 0 (0.0%) | 0 (0.0%) |
| Legal Services & Support | 0 (0.0%) | 0 (0.0%) |
| Education Instruction & Library | 115 (40.2%) | 171 (59.8%) |
| Arts, Media & Entertainment | 19 (41.3%) | 27 (58.7%) |
| Health Diagnosing & Treating | 0 (0.0%) | 176 (100.0%) |
| Health Technologists | 0 (0.0%) | 135 (100.0%) |
| Total (Category) | 375 (45.7%) | 446 (54.3%) |
| Total (Overall) | 474 (40.3%) | 702 (59.7%) |
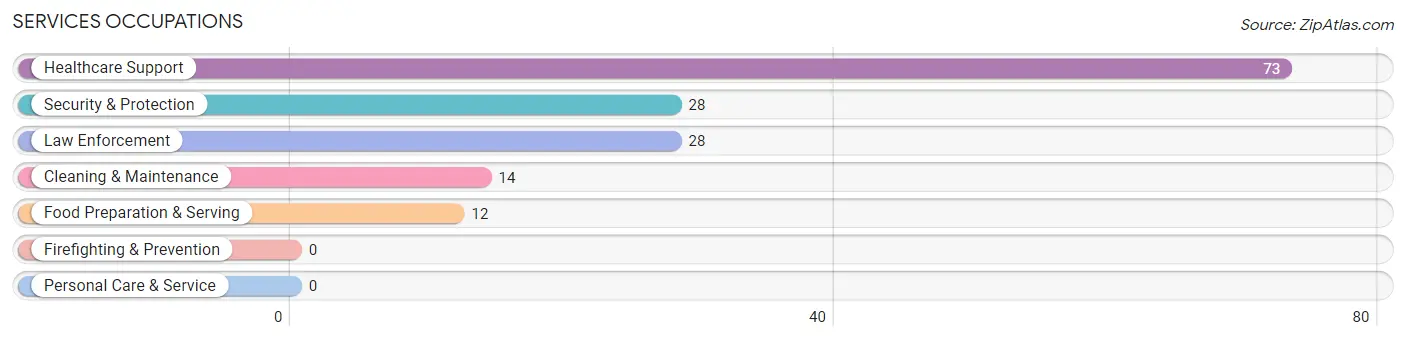
Services Occupations
The most common Services occupations in East Ithaca are Healthcare Support (73 | 6.2%), Security & Protection (28 | 2.4%), Law Enforcement (28 | 2.4%), Cleaning & Maintenance (14 | 1.2%), and Food Preparation & Serving (12 | 1.0%).
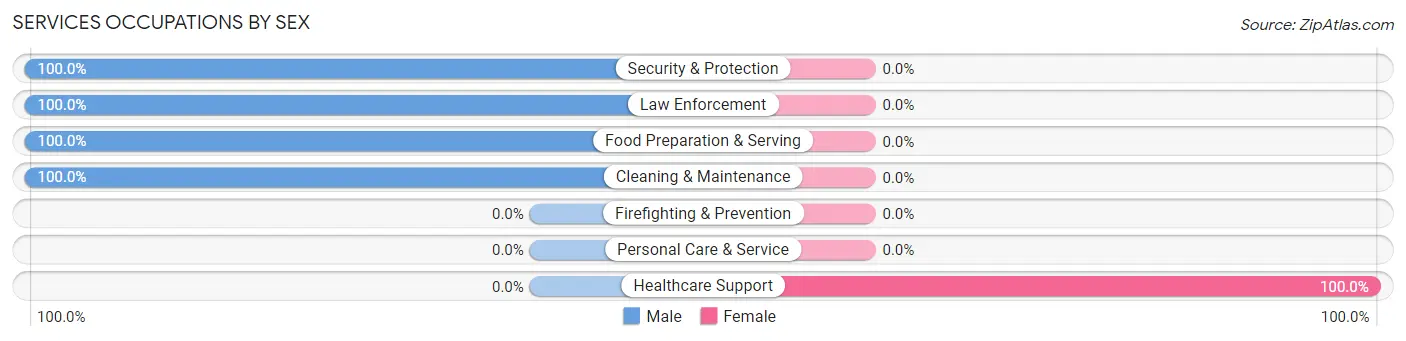
Services Occupations by Sex
| Occupation | Male | Female |
| Healthcare Support | 0 (0.0%) | 73 (100.0%) |
| Security & Protection | 28 (100.0%) | 0 (0.0%) |
| Firefighting & Prevention | 0 (0.0%) | 0 (0.0%) |
| Law Enforcement | 28 (100.0%) | 0 (0.0%) |
| Food Preparation & Serving | 12 (100.0%) | 0 (0.0%) |
| Cleaning & Maintenance | 14 (100.0%) | 0 (0.0%) |
| Personal Care & Service | 0 (0.0%) | 0 (0.0%) |
| Total (Category) | 54 (42.5%) | 73 (57.5%) |
| Total (Overall) | 474 (40.3%) | 702 (59.7%) |
Sales and Office Occupations
The most common Sales and Office occupations in East Ithaca are Sales & Related (97 | 8.3%), and Office & Administration (75 | 6.4%).
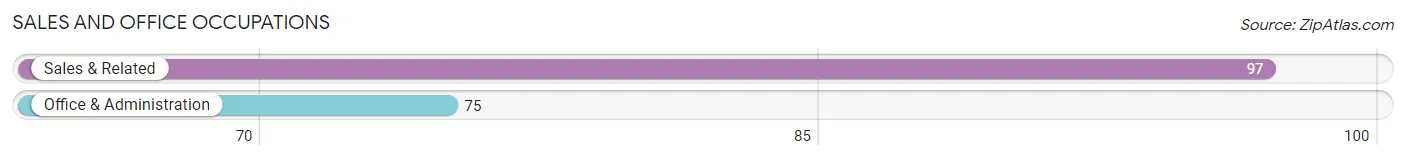
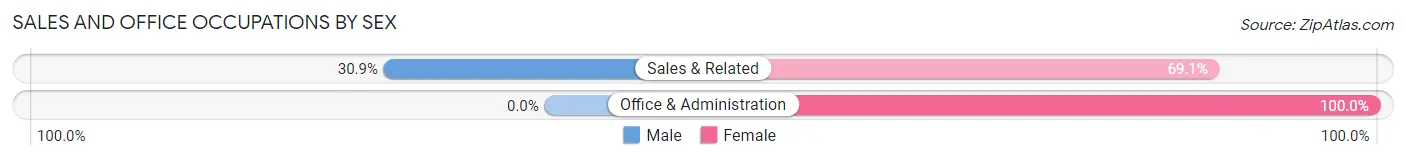
Sales and Office Occupations by Sex
| Occupation | Male | Female |
| Sales & Related | 30 (30.9%) | 67 (69.1%) |
| Office & Administration | 0 (0.0%) | 75 (100.0%) |
| Total (Category) | 30 (17.4%) | 142 (82.6%) |
| Total (Overall) | 474 (40.3%) | 702 (59.7%) |
Natural Resources, Construction and Maintenance Occupations
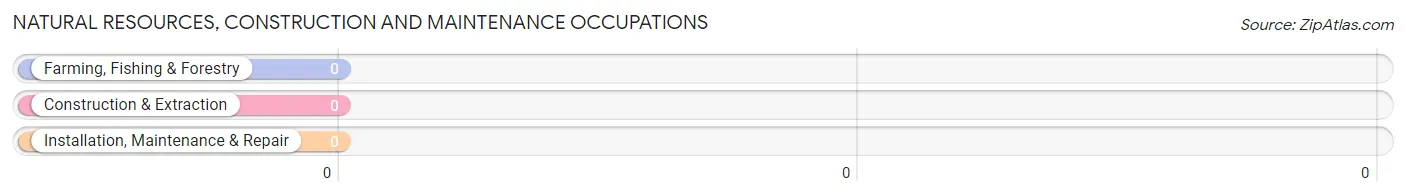
Natural Resources, Construction and Maintenance Occupations by Sex
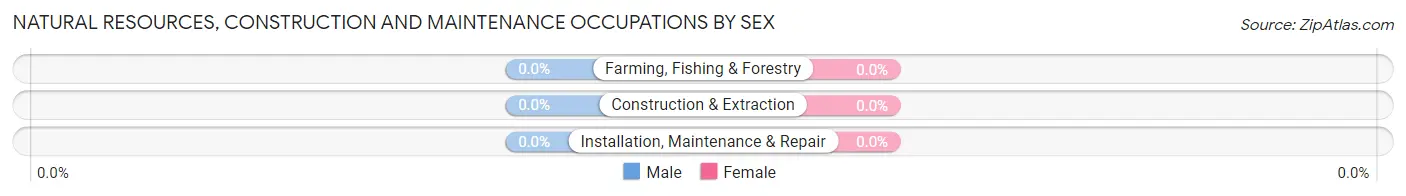
| Occupation | Male | Female |
| Farming, Fishing & Forestry | 0 (0.0%) | 0 (0.0%) |
| Construction & Extraction | 0 (0.0%) | 0 (0.0%) |
| Installation, Maintenance & Repair | 0 (0.0%) | 0 (0.0%) |
| Total (Category) | 0 (0.0%) | 0 (0.0%) |
| Total (Overall) | 474 (40.3%) | 702 (59.7%) |
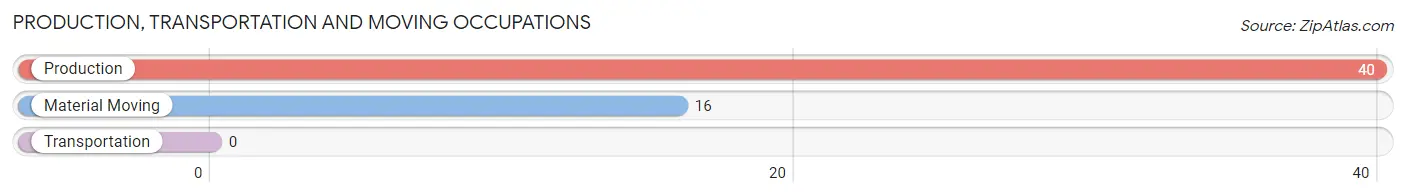
Production, Transportation and Moving Occupations
The most common Production, Transportation and Moving occupations in East Ithaca are Production (40 | 3.4%), and Material Moving (16 | 1.4%).
Production, Transportation and Moving Occupations by Sex
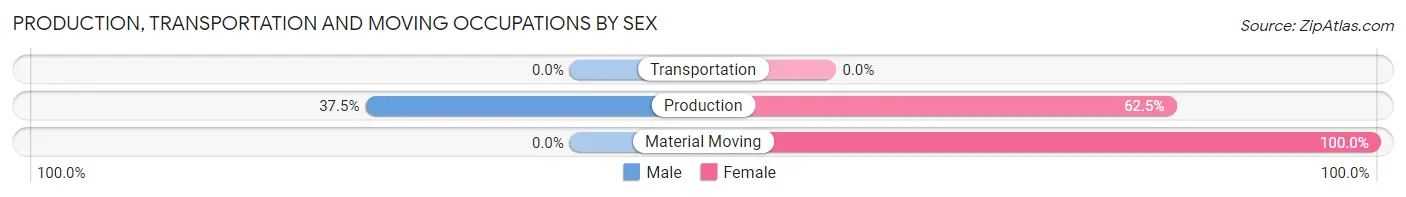
| Occupation | Male | Female |
| Production | 15 (37.5%) | 25 (62.5%) |
| Transportation | 0 (0.0%) | 0 (0.0%) |
| Material Moving | 0 (0.0%) | 16 (100.0%) |
| Total (Category) | 15 (26.8%) | 41 (73.2%) |
| Total (Overall) | 474 (40.3%) | 702 (59.7%) |
Employment Industries by Sex in East Ithaca
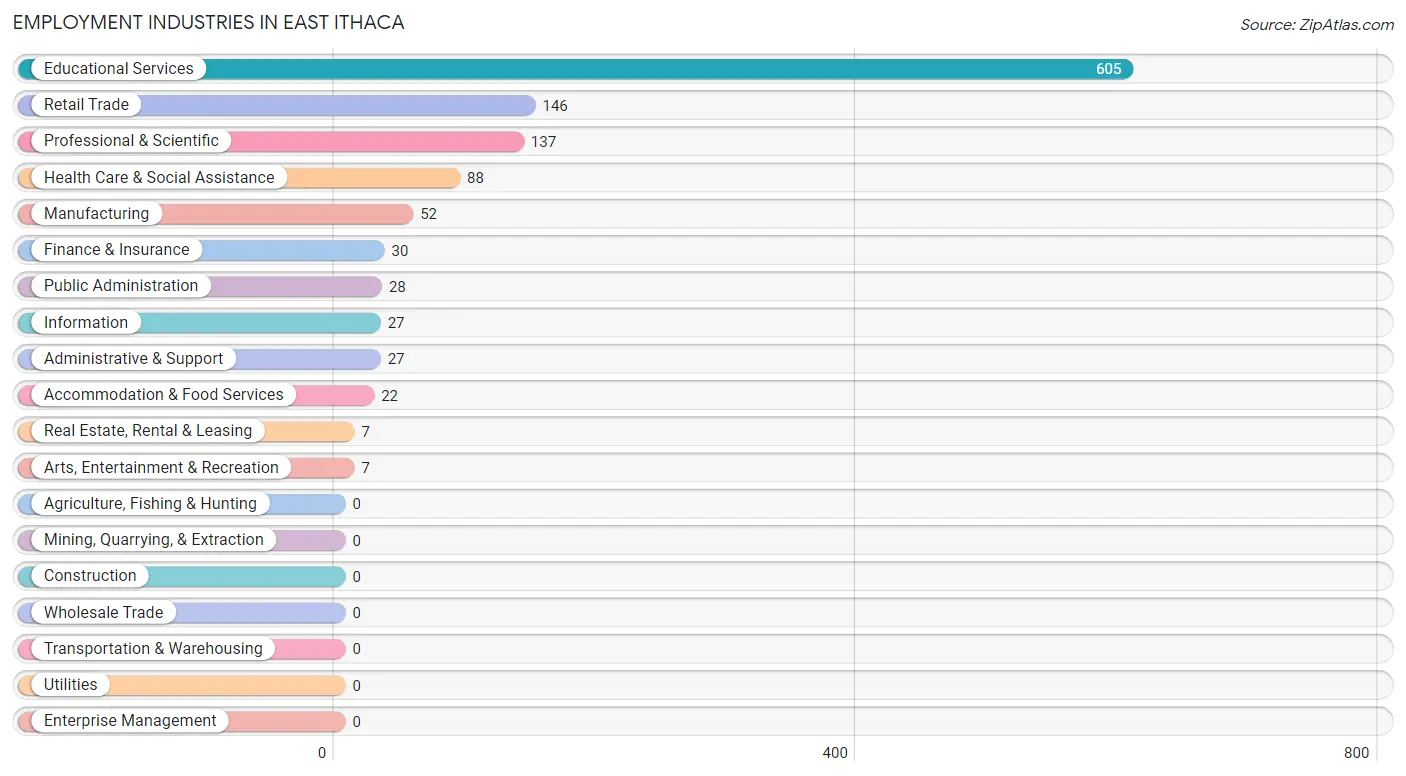
Employment Industries in East Ithaca
The major employment industries in East Ithaca include Educational Services (605 | 51.4%), Retail Trade (146 | 12.4%), Professional & Scientific (137 | 11.7%), Health Care & Social Assistance (88 | 7.5%), and Manufacturing (52 | 4.4%).
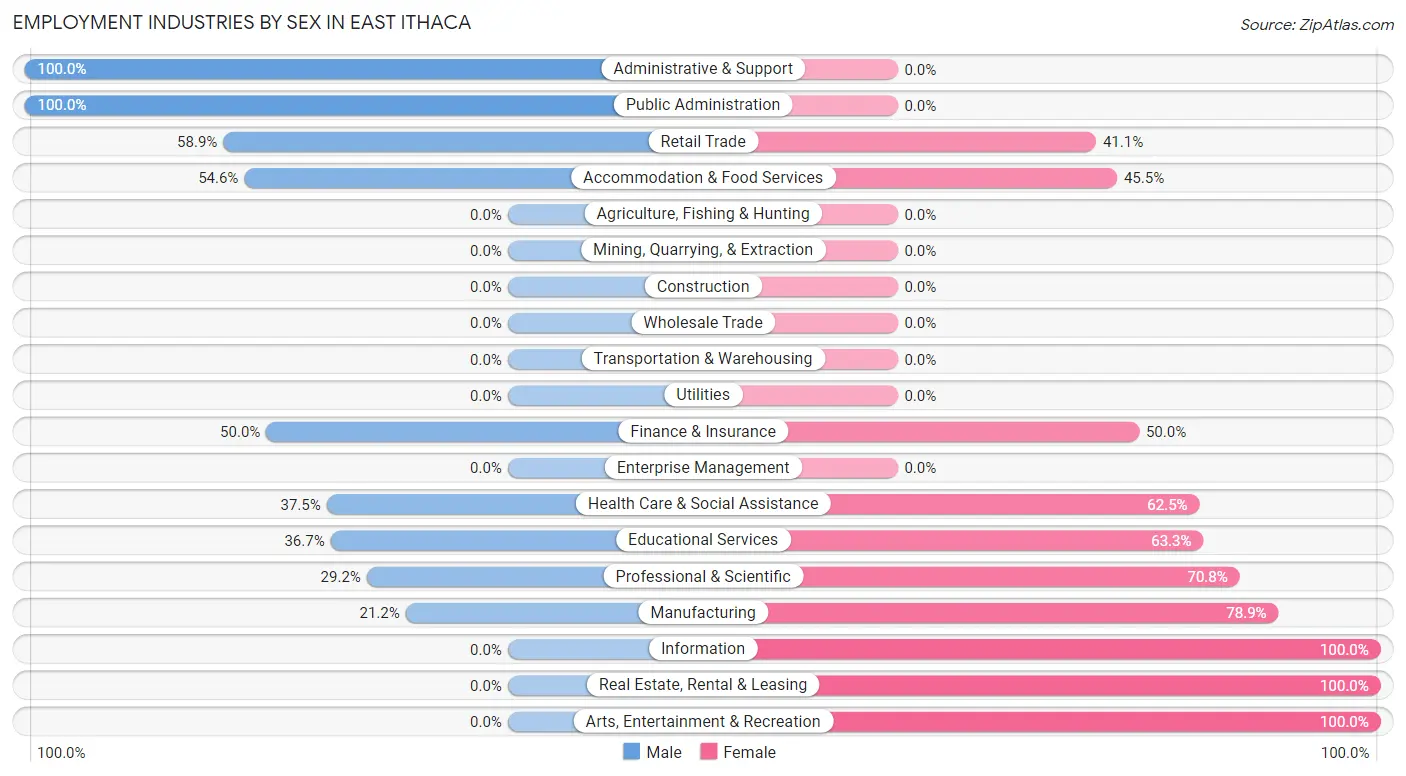
Employment Industries by Sex in East Ithaca
The East Ithaca industries that see more men than women are Administrative & Support (100.0%), Public Administration (100.0%), and Retail Trade (58.9%), whereas the industries that tend to have a higher number of women are Information (100.0%), Real Estate, Rental & Leasing (100.0%), and Arts, Entertainment & Recreation (100.0%).
| Industry | Male | Female |
| Agriculture, Fishing & Hunting | 0 (0.0%) | 0 (0.0%) |
| Mining, Quarrying, & Extraction | 0 (0.0%) | 0 (0.0%) |
| Construction | 0 (0.0%) | 0 (0.0%) |
| Manufacturing | 11 (21.1%) | 41 (78.8%) |
| Wholesale Trade | 0 (0.0%) | 0 (0.0%) |
| Retail Trade | 86 (58.9%) | 60 (41.1%) |
| Transportation & Warehousing | 0 (0.0%) | 0 (0.0%) |
| Utilities | 0 (0.0%) | 0 (0.0%) |
| Information | 0 (0.0%) | 27 (100.0%) |
| Finance & Insurance | 15 (50.0%) | 15 (50.0%) |
| Real Estate, Rental & Leasing | 0 (0.0%) | 7 (100.0%) |
| Professional & Scientific | 40 (29.2%) | 97 (70.8%) |
| Enterprise Management | 0 (0.0%) | 0 (0.0%) |
| Administrative & Support | 27 (100.0%) | 0 (0.0%) |
| Educational Services | 222 (36.7%) | 383 (63.3%) |
| Health Care & Social Assistance | 33 (37.5%) | 55 (62.5%) |
| Arts, Entertainment & Recreation | 0 (0.0%) | 7 (100.0%) |
| Accommodation & Food Services | 12 (54.5%) | 10 (45.5%) |
| Public Administration | 28 (100.0%) | 0 (0.0%) |
| Total | 474 (40.3%) | 702 (59.7%) |
Education in East Ithaca
School Enrollment in East Ithaca
The most common levels of schooling among the 548 students in East Ithaca are graduate / professional (379 | 69.2%), elementary school (69 | 12.6%), and college / undergraduate (51 | 9.3%).
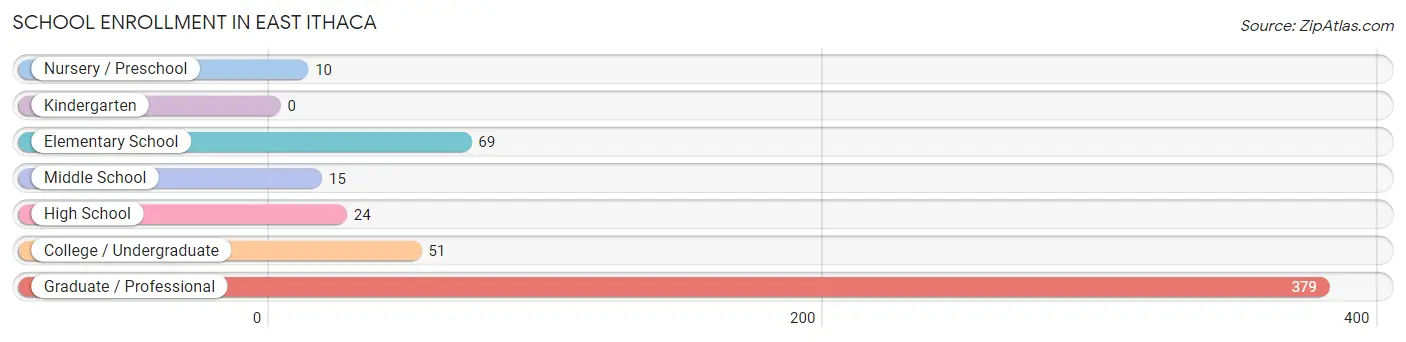
| School Level | # Students | % Students |
| Nursery / Preschool | 10 | 1.8% |
| Kindergarten | 0 | 0.0% |
| Elementary School | 69 | 12.6% |
| Middle School | 15 | 2.7% |
| High School | 24 | 4.4% |
| College / Undergraduate | 51 | 9.3% |
| Graduate / Professional | 379 | 69.2% |
| Total | 548 | 100.0% |
School Enrollment by Age by Funding Source in East Ithaca
Out of a total of 548 students who are enrolled in schools in East Ithaca, 202 (36.9%) attend a private institution, while the remaining 346 (63.1%) are enrolled in public schools. The age group of 3 to 4 year olds has the highest likelihood of being enrolled in private schools, with 10 (100.0% in the age bracket) enrolled. Conversely, the age group of 5 to 9 year old has the lowest likelihood of being enrolled in a private school, with 69 (100.0% in the age bracket) attending a public institution.
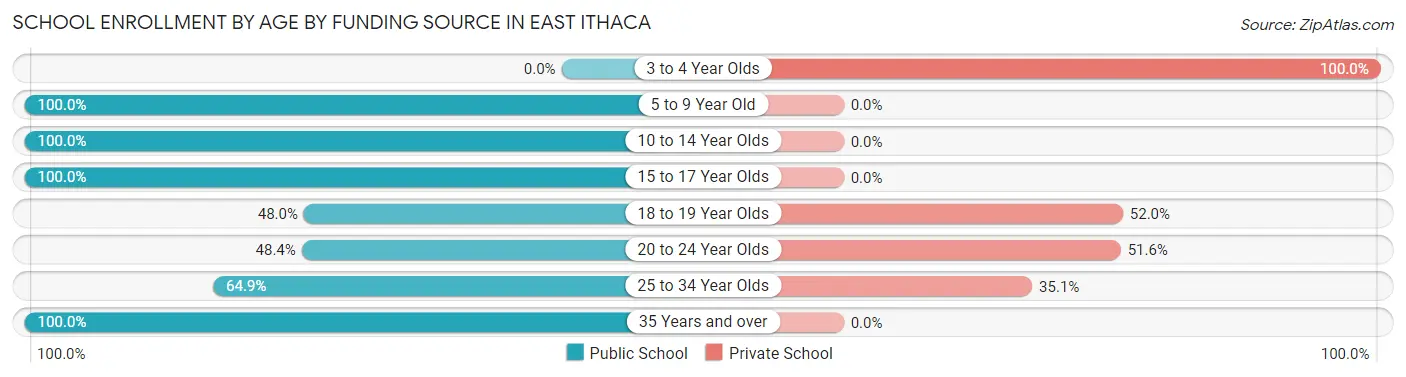
| Age Bracket | Public School | Private School |
| 3 to 4 Year Olds | 0 (0.0%) | 10 (100.0%) |
| 5 to 9 Year Old | 69 (100.0%) | 0 (0.0%) |
| 10 to 14 Year Olds | 15 (100.0%) | 0 (0.0%) |
| 15 to 17 Year Olds | 12 (100.0%) | 0 (0.0%) |
| 18 to 19 Year Olds | 12 (48.0%) | 13 (52.0%) |
| 20 to 24 Year Olds | 106 (48.4%) | 113 (51.6%) |
| 25 to 34 Year Olds | 122 (64.9%) | 66 (35.1%) |
| 35 Years and over | 10 (100.0%) | 0 (0.0%) |
| Total | 346 (63.1%) | 202 (36.9%) |
Educational Attainment by Field of Study in East Ithaca
Literature & languages (211 | 19.0%), bio, nature & agricultural (147 | 13.3%), social sciences (114 | 10.3%), computers & mathematics (106 | 9.6%), and science & technology (93 | 8.4%) are the most common fields of study among 1,109 individuals in East Ithaca who have obtained a bachelor's degree or higher.
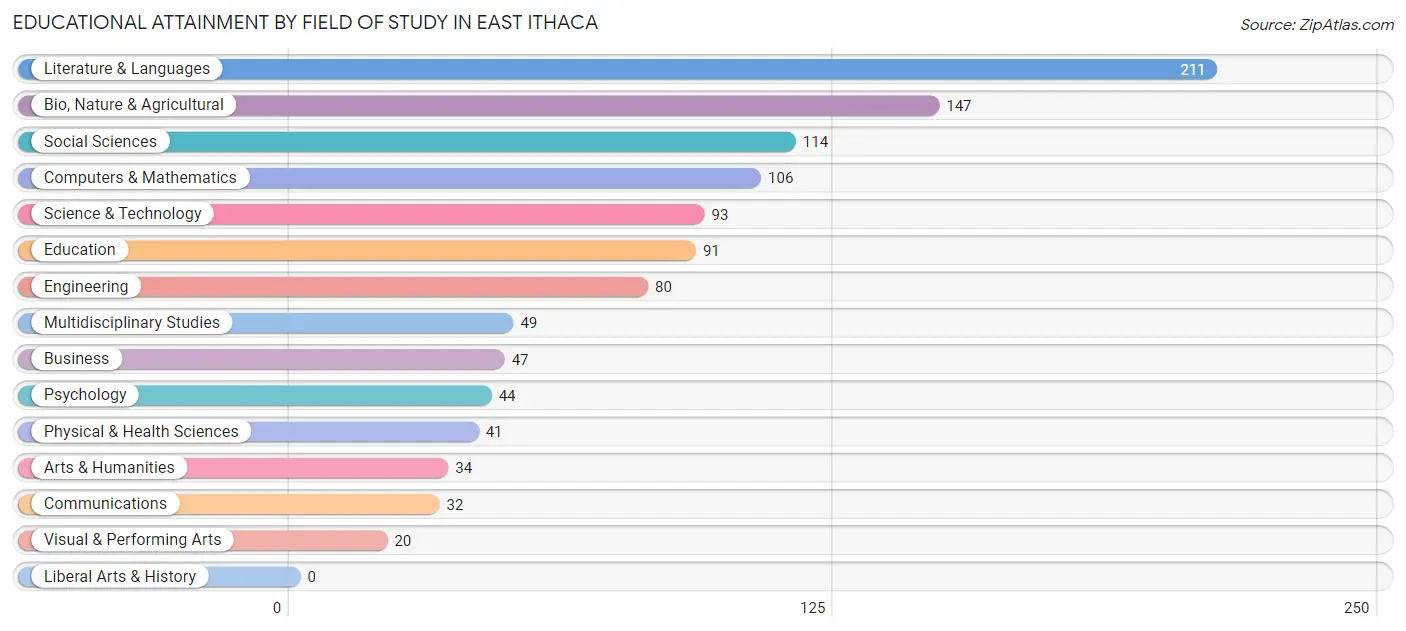
| Field of Study | # Graduates | % Graduates |
| Computers & Mathematics | 106 | 9.6% |
| Bio, Nature & Agricultural | 147 | 13.3% |
| Physical & Health Sciences | 41 | 3.7% |
| Psychology | 44 | 4.0% |
| Social Sciences | 114 | 10.3% |
| Engineering | 80 | 7.2% |
| Multidisciplinary Studies | 49 | 4.4% |
| Science & Technology | 93 | 8.4% |
| Business | 47 | 4.2% |
| Education | 91 | 8.2% |
| Literature & Languages | 211 | 19.0% |
| Liberal Arts & History | 0 | 0.0% |
| Visual & Performing Arts | 20 | 1.8% |
| Communications | 32 | 2.9% |
| Arts & Humanities | 34 | 3.1% |
| Total | 1,109 | 100.0% |
Transportation & Commute in East Ithaca
Vehicle Availability by Sex in East Ithaca
The most prevalent vehicle ownership categories in East Ithaca are males with 2 vehicles (315, accounting for 66.5%) and females with 2 vehicles (461, making up 44.9%).
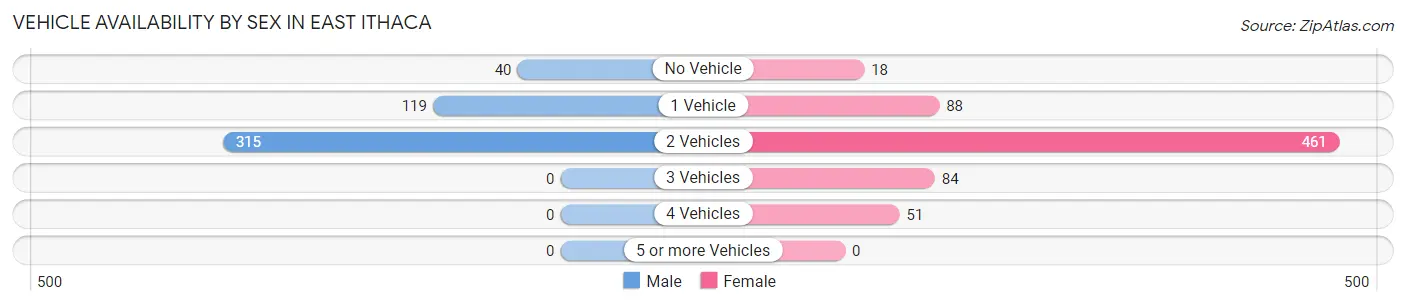
| Vehicles Available | Male | Female |
| No Vehicle | 40 (8.4%) | 18 (2.6%) |
| 1 Vehicle | 119 (25.1%) | 88 (12.5%) |
| 2 Vehicles | 315 (66.5%) | 461 (65.7%) |
| 3 Vehicles | 0 (0.0%) | 84 (12.0%) |
| 4 Vehicles | 0 (0.0%) | 51 (7.3%) |
| 5 or more Vehicles | 0 (0.0%) | 0 (0.0%) |
| Total | 474 (100.0%) | 702 (100.0%) |
Commute Time in East Ithaca
The most frequently occuring commute durations in East Ithaca are 15 to 19 minutes (312 commuters, 32.0%), 10 to 14 minutes (240 commuters, 24.6%), and 5 to 9 minutes (170 commuters, 17.4%).
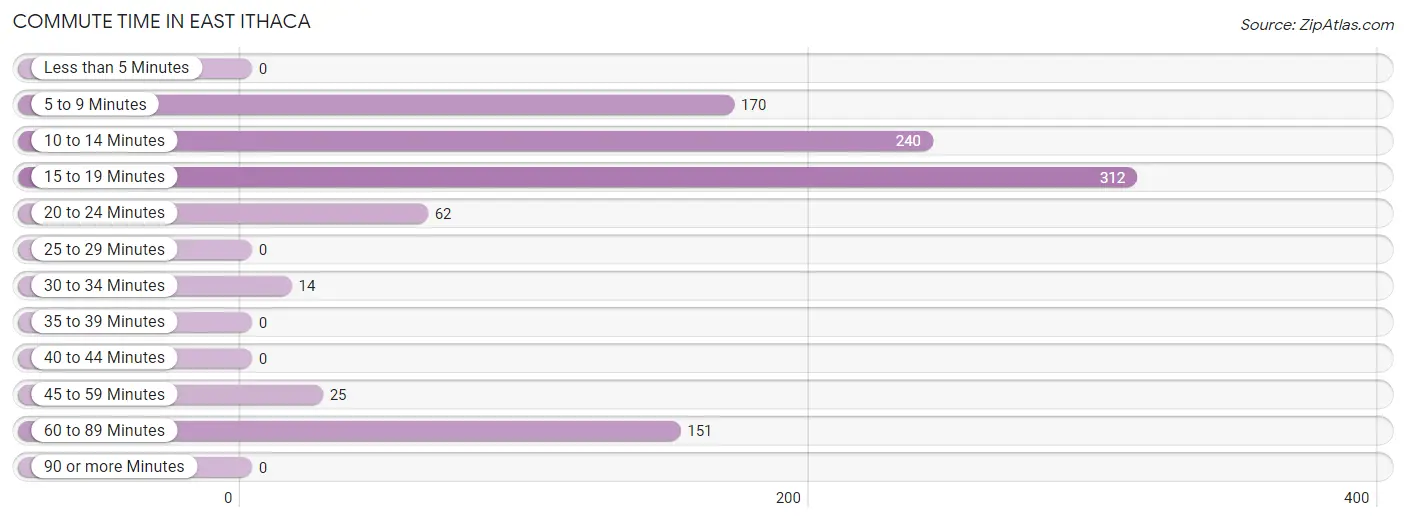
| Commute Time | # Commuters | % Commuters |
| Less than 5 Minutes | 0 | 0.0% |
| 5 to 9 Minutes | 170 | 17.4% |
| 10 to 14 Minutes | 240 | 24.6% |
| 15 to 19 Minutes | 312 | 32.0% |
| 20 to 24 Minutes | 62 | 6.4% |
| 25 to 29 Minutes | 0 | 0.0% |
| 30 to 34 Minutes | 14 | 1.4% |
| 35 to 39 Minutes | 0 | 0.0% |
| 40 to 44 Minutes | 0 | 0.0% |
| 45 to 59 Minutes | 25 | 2.6% |
| 60 to 89 Minutes | 151 | 15.5% |
| 90 or more Minutes | 0 | 0.0% |
Commute Time by Sex in East Ithaca
The most common commute times in East Ithaca are 15 to 19 minutes (138 commuters, 42.5%) for males and 10 to 14 minutes (194 commuters, 29.9%) for females.
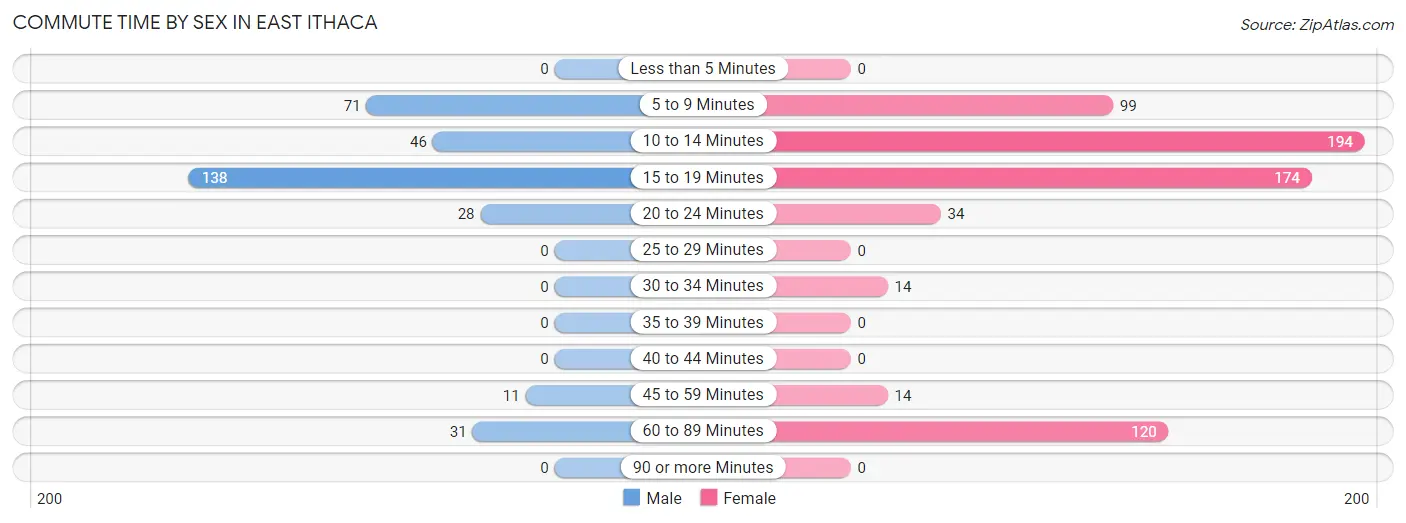
| Commute Time | Male | Female |
| Less than 5 Minutes | 0 (0.0%) | 0 (0.0%) |
| 5 to 9 Minutes | 71 (21.8%) | 99 (15.2%) |
| 10 to 14 Minutes | 46 (14.1%) | 194 (29.9%) |
| 15 to 19 Minutes | 138 (42.5%) | 174 (26.8%) |
| 20 to 24 Minutes | 28 (8.6%) | 34 (5.2%) |
| 25 to 29 Minutes | 0 (0.0%) | 0 (0.0%) |
| 30 to 34 Minutes | 0 (0.0%) | 14 (2.2%) |
| 35 to 39 Minutes | 0 (0.0%) | 0 (0.0%) |
| 40 to 44 Minutes | 0 (0.0%) | 0 (0.0%) |
| 45 to 59 Minutes | 11 (3.4%) | 14 (2.2%) |
| 60 to 89 Minutes | 31 (9.5%) | 120 (18.5%) |
| 90 or more Minutes | 0 (0.0%) | 0 (0.0%) |
Time of Departure to Work by Sex in East Ithaca
The most frequent times of departure to work in East Ithaca are 8:30 AM to 8:59 AM (58, 17.8%) for males and 7:00 AM to 7:29 AM (170, 26.2%) for females.
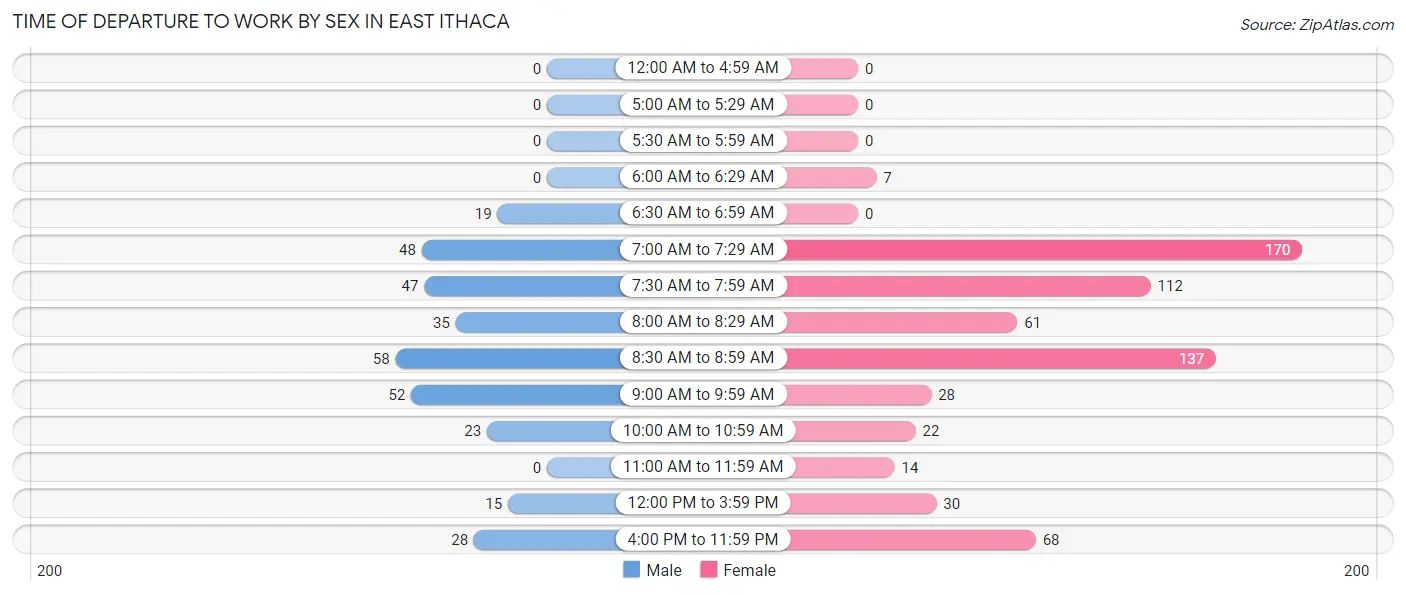
| Time of Departure | Male | Female |
| 12:00 AM to 4:59 AM | 0 (0.0%) | 0 (0.0%) |
| 5:00 AM to 5:29 AM | 0 (0.0%) | 0 (0.0%) |
| 5:30 AM to 5:59 AM | 0 (0.0%) | 0 (0.0%) |
| 6:00 AM to 6:29 AM | 0 (0.0%) | 7 (1.1%) |
| 6:30 AM to 6:59 AM | 19 (5.9%) | 0 (0.0%) |
| 7:00 AM to 7:29 AM | 48 (14.8%) | 170 (26.2%) |
| 7:30 AM to 7:59 AM | 47 (14.5%) | 112 (17.3%) |
| 8:00 AM to 8:29 AM | 35 (10.8%) | 61 (9.4%) |
| 8:30 AM to 8:59 AM | 58 (17.8%) | 137 (21.1%) |
| 9:00 AM to 9:59 AM | 52 (16.0%) | 28 (4.3%) |
| 10:00 AM to 10:59 AM | 23 (7.1%) | 22 (3.4%) |
| 11:00 AM to 11:59 AM | 0 (0.0%) | 14 (2.2%) |
| 12:00 PM to 3:59 PM | 15 (4.6%) | 30 (4.6%) |
| 4:00 PM to 11:59 PM | 28 (8.6%) | 68 (10.5%) |
| Total | 325 (100.0%) | 649 (100.0%) |
Housing Occupancy in East Ithaca
Occupancy by Ownership in East Ithaca
Of the total 1,110 dwellings in East Ithaca, owner-occupied units account for 612 (55.1%), while renter-occupied units make up 498 (44.9%).
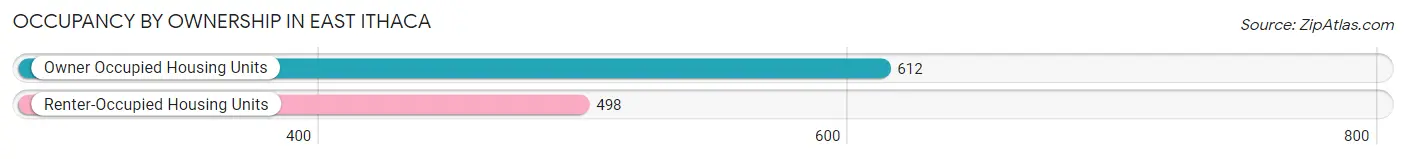
| Occupancy | # Housing Units | % Housing Units |
| Owner Occupied Housing Units | 612 | 55.1% |
| Renter-Occupied Housing Units | 498 | 44.9% |
| Total Occupied Housing Units | 1,110 | 100.0% |
Occupancy by Household Size in East Ithaca
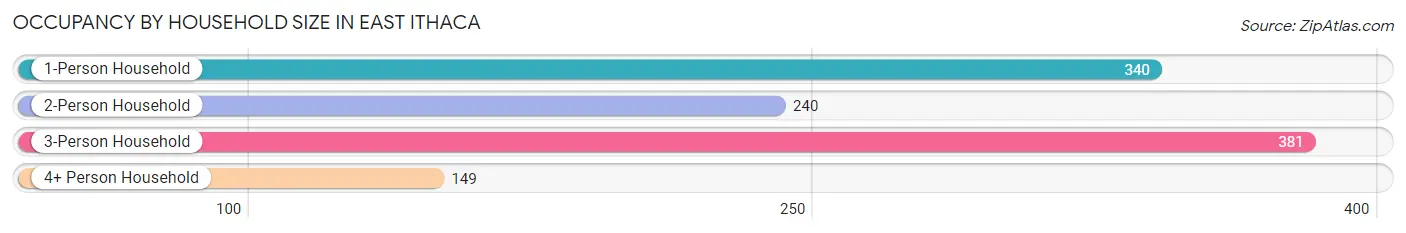
| Household Size | # Housing Units | % Housing Units |
| 1-Person Household | 340 | 30.6% |
| 2-Person Household | 240 | 21.6% |
| 3-Person Household | 381 | 34.3% |
| 4+ Person Household | 149 | 13.4% |
| Total Housing Units | 1,110 | 100.0% |
Occupancy by Ownership by Household Size in East Ithaca
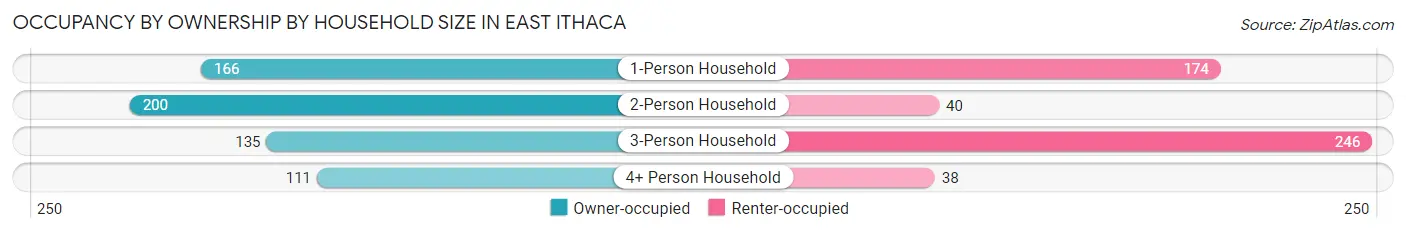
| Household Size | Owner-occupied | Renter-occupied |
| 1-Person Household | 166 (48.8%) | 174 (51.2%) |
| 2-Person Household | 200 (83.3%) | 40 (16.7%) |
| 3-Person Household | 135 (35.4%) | 246 (64.6%) |
| 4+ Person Household | 111 (74.5%) | 38 (25.5%) |
| Total Housing Units | 612 (55.1%) | 498 (44.9%) |
Occupancy by Educational Attainment in East Ithaca
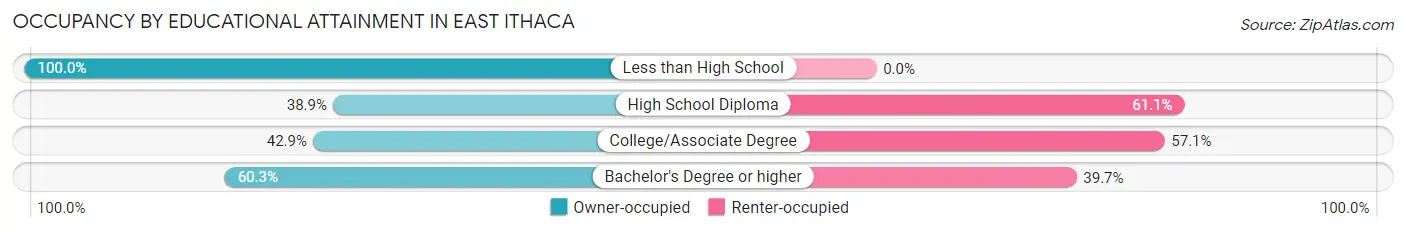
| Household Size | Owner-occupied | Renter-occupied |
| Less than High School | 27 (100.0%) | 0 (0.0%) |
| High School Diploma | 35 (38.9%) | 55 (61.1%) |
| College/Associate Degree | 120 (42.9%) | 160 (57.1%) |
| Bachelor's Degree or higher | 430 (60.3%) | 283 (39.7%) |
Occupancy by Age of Householder in East Ithaca
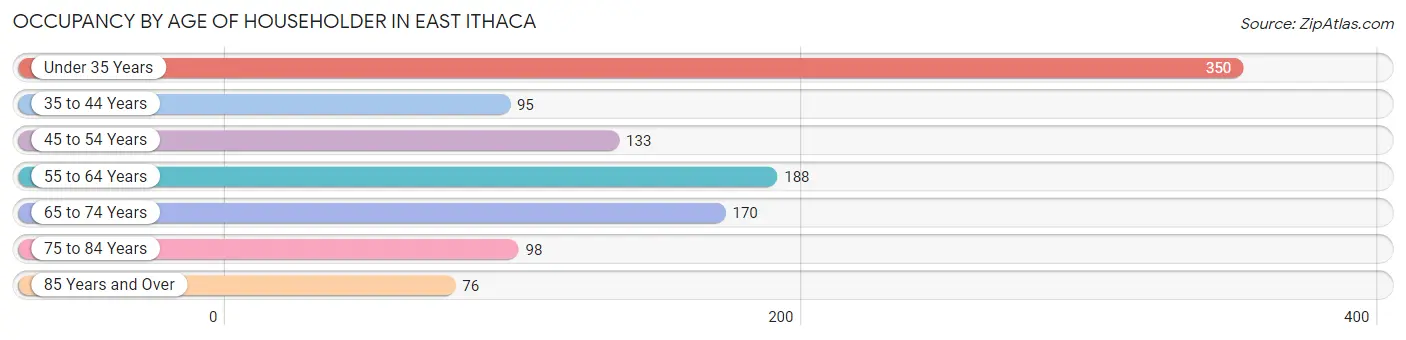
| Age Bracket | # Households | % Households |
| Under 35 Years | 350 | 31.5% |
| 35 to 44 Years | 95 | 8.6% |
| 45 to 54 Years | 133 | 12.0% |
| 55 to 64 Years | 188 | 16.9% |
| 65 to 74 Years | 170 | 15.3% |
| 75 to 84 Years | 98 | 8.8% |
| 85 Years and Over | 76 | 6.9% |
| Total | 1,110 | 100.0% |
Housing Finances in East Ithaca
Median Income by Occupancy in East Ithaca
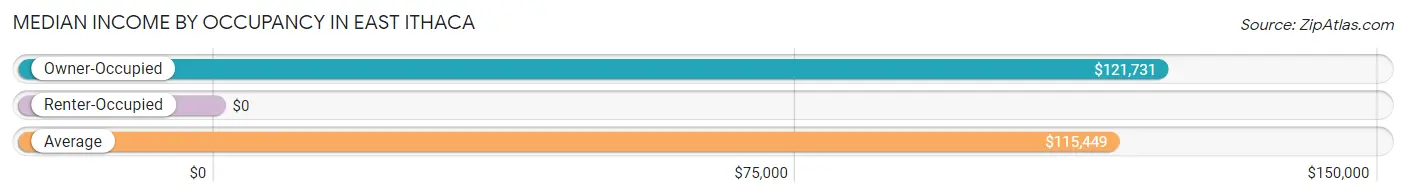
| Occupancy Type | # Households | Median Income |
| Owner-Occupied | 612 (55.1%) | $121,731 |
| Renter-Occupied | 498 (44.9%) | $0 |
| Average | 1,110 (100.0%) | $115,449 |
Occupancy by Householder Income Bracket in East Ithaca
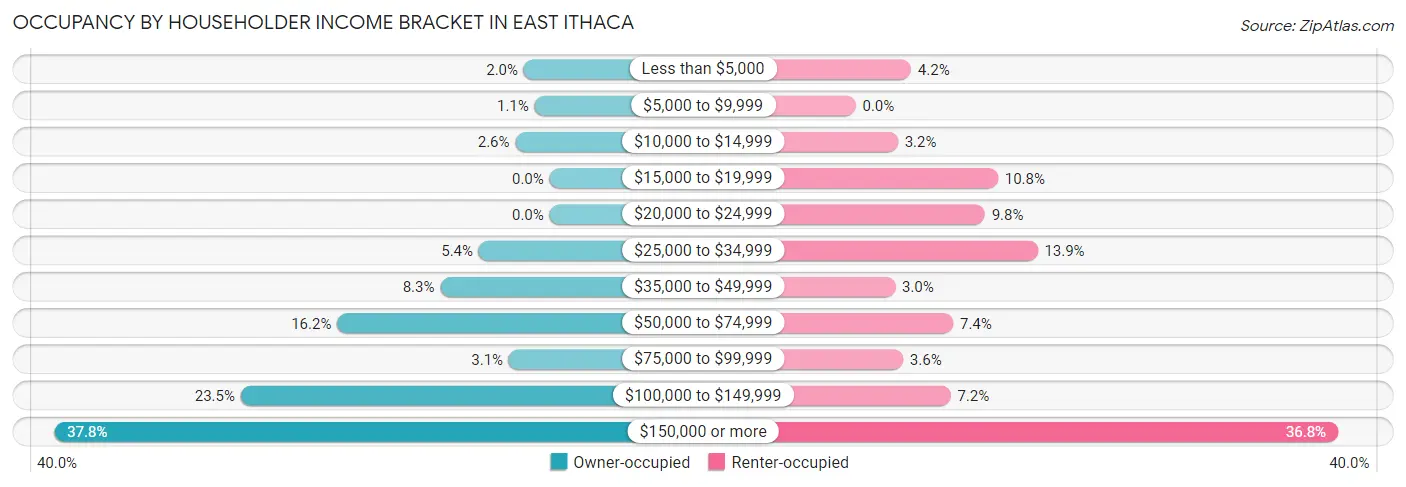
| Income Bracket | Owner-occupied | Renter-occupied |
| Less than $5,000 | 12 (2.0%) | 21 (4.2%) |
| $5,000 to $9,999 | 7 (1.1%) | 0 (0.0%) |
| $10,000 to $14,999 | 16 (2.6%) | 16 (3.2%) |
| $15,000 to $19,999 | 0 (0.0%) | 54 (10.8%) |
| $20,000 to $24,999 | 0 (0.0%) | 49 (9.8%) |
| $25,000 to $34,999 | 33 (5.4%) | 69 (13.9%) |
| $35,000 to $49,999 | 51 (8.3%) | 15 (3.0%) |
| $50,000 to $74,999 | 99 (16.2%) | 37 (7.4%) |
| $75,000 to $99,999 | 19 (3.1%) | 18 (3.6%) |
| $100,000 to $149,999 | 144 (23.5%) | 36 (7.2%) |
| $150,000 or more | 231 (37.8%) | 183 (36.7%) |
| Total | 612 (100.0%) | 498 (100.0%) |
Monthly Housing Cost Tiers in East Ithaca
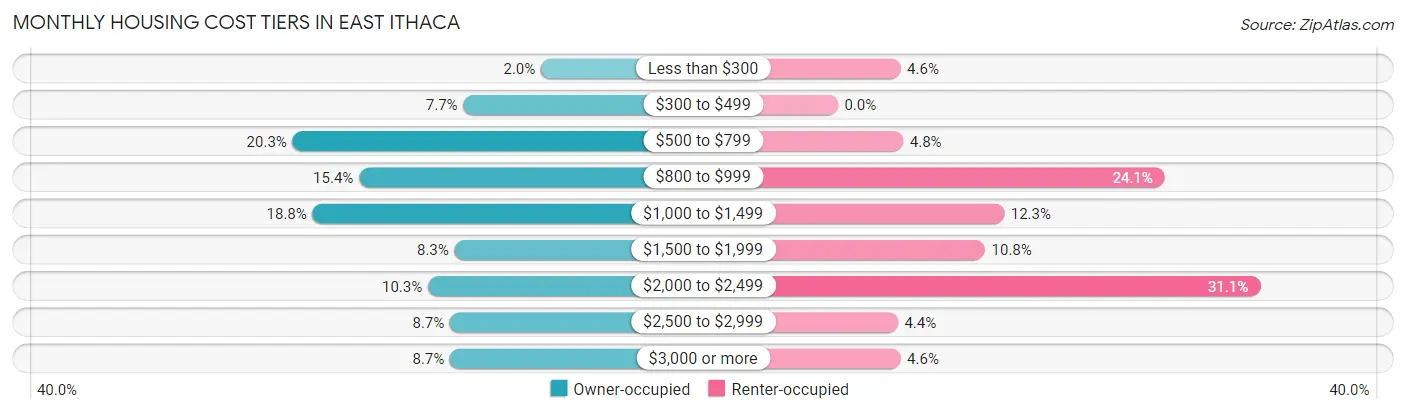
| Monthly Cost | Owner-occupied | Renter-occupied |
| Less than $300 | 12 (2.0%) | 23 (4.6%) |
| $300 to $499 | 47 (7.7%) | 0 (0.0%) |
| $500 to $799 | 124 (20.3%) | 24 (4.8%) |
| $800 to $999 | 94 (15.4%) | 120 (24.1%) |
| $1,000 to $1,499 | 115 (18.8%) | 61 (12.2%) |
| $1,500 to $1,999 | 51 (8.3%) | 54 (10.8%) |
| $2,000 to $2,499 | 63 (10.3%) | 155 (31.1%) |
| $2,500 to $2,999 | 53 (8.7%) | 22 (4.4%) |
| $3,000 or more | 53 (8.7%) | 23 (4.6%) |
| Total | 612 (100.0%) | 498 (100.0%) |
Physical Housing Characteristics in East Ithaca
Housing Structures in East Ithaca
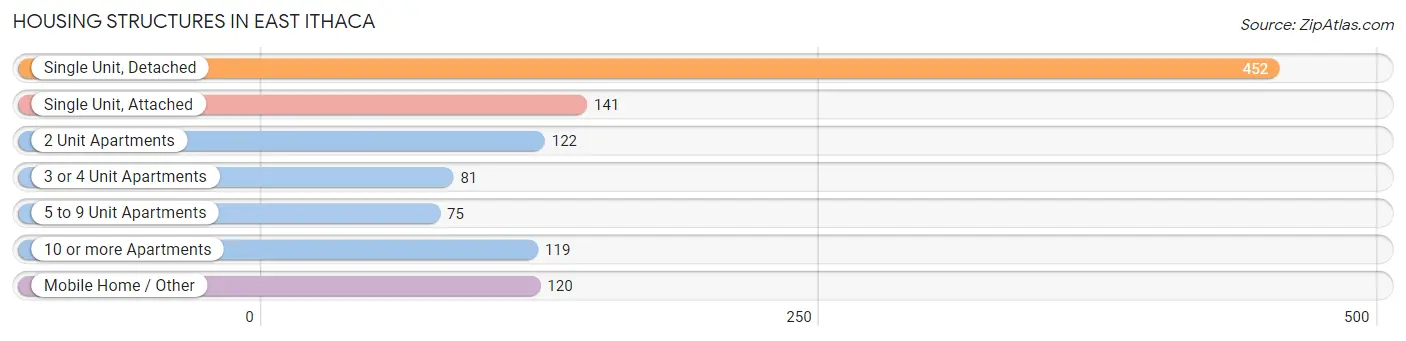
| Structure Type | # Housing Units | % Housing Units |
| Single Unit, Detached | 452 | 40.7% |
| Single Unit, Attached | 141 | 12.7% |
| 2 Unit Apartments | 122 | 11.0% |
| 3 or 4 Unit Apartments | 81 | 7.3% |
| 5 to 9 Unit Apartments | 75 | 6.8% |
| 10 or more Apartments | 119 | 10.7% |
| Mobile Home / Other | 120 | 10.8% |
| Total | 1,110 | 100.0% |
Housing Structures by Occupancy in East Ithaca
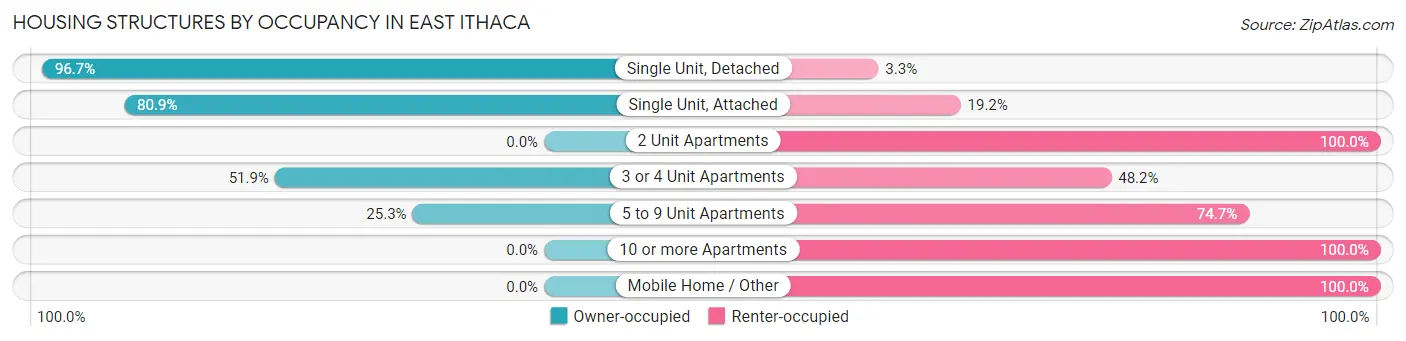
| Structure Type | Owner-occupied | Renter-occupied |
| Single Unit, Detached | 437 (96.7%) | 15 (3.3%) |
| Single Unit, Attached | 114 (80.8%) | 27 (19.2%) |
| 2 Unit Apartments | 0 (0.0%) | 122 (100.0%) |
| 3 or 4 Unit Apartments | 42 (51.8%) | 39 (48.1%) |
| 5 to 9 Unit Apartments | 19 (25.3%) | 56 (74.7%) |
| 10 or more Apartments | 0 (0.0%) | 119 (100.0%) |
| Mobile Home / Other | 0 (0.0%) | 120 (100.0%) |
| Total | 612 (55.1%) | 498 (44.9%) |
Housing Structures by Number of Rooms in East Ithaca
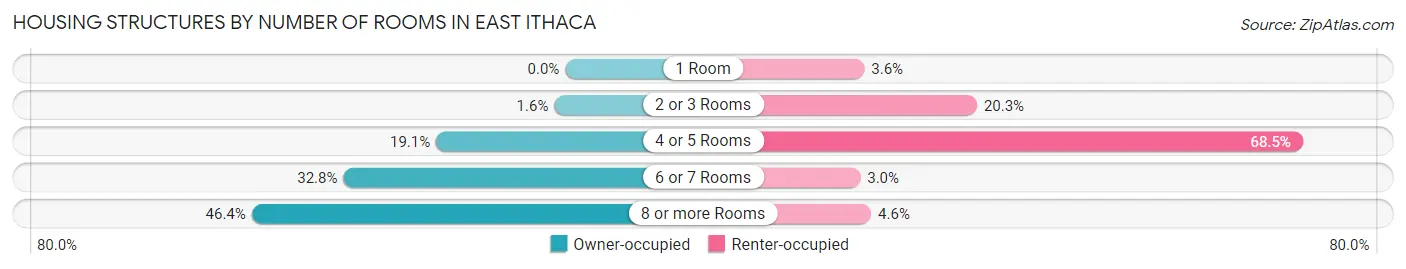
| Number of Rooms | Owner-occupied | Renter-occupied |
| 1 Room | 0 (0.0%) | 18 (3.6%) |
| 2 or 3 Rooms | 10 (1.6%) | 101 (20.3%) |
| 4 or 5 Rooms | 117 (19.1%) | 341 (68.5%) |
| 6 or 7 Rooms | 201 (32.8%) | 15 (3.0%) |
| 8 or more Rooms | 284 (46.4%) | 23 (4.6%) |
| Total | 612 (100.0%) | 498 (100.0%) |
Housing Structure by Heating Type in East Ithaca
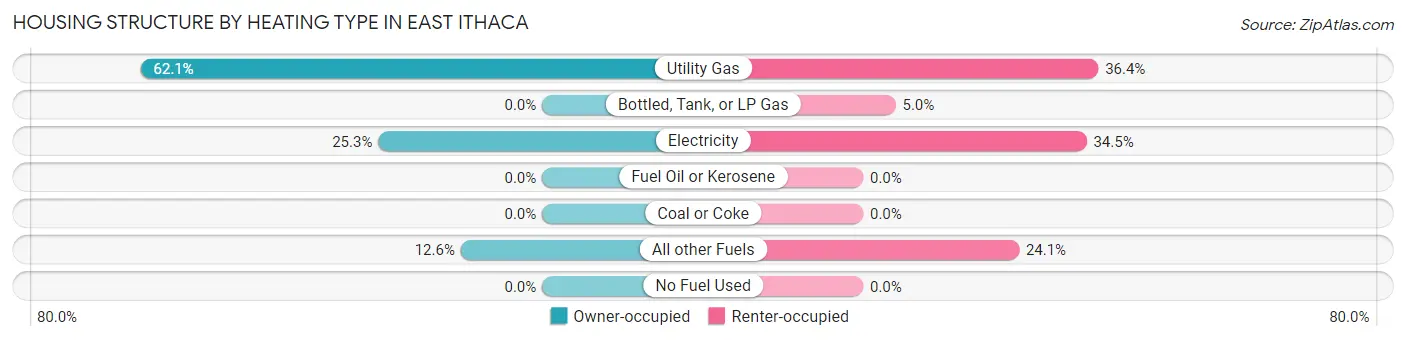
| Heating Type | Owner-occupied | Renter-occupied |
| Utility Gas | 380 (62.1%) | 181 (36.3%) |
| Bottled, Tank, or LP Gas | 0 (0.0%) | 25 (5.0%) |
| Electricity | 155 (25.3%) | 172 (34.5%) |
| Fuel Oil or Kerosene | 0 (0.0%) | 0 (0.0%) |
| Coal or Coke | 0 (0.0%) | 0 (0.0%) |
| All other Fuels | 77 (12.6%) | 120 (24.1%) |
| No Fuel Used | 0 (0.0%) | 0 (0.0%) |
| Total | 612 (100.0%) | 498 (100.0%) |
Household Vehicle Usage in East Ithaca
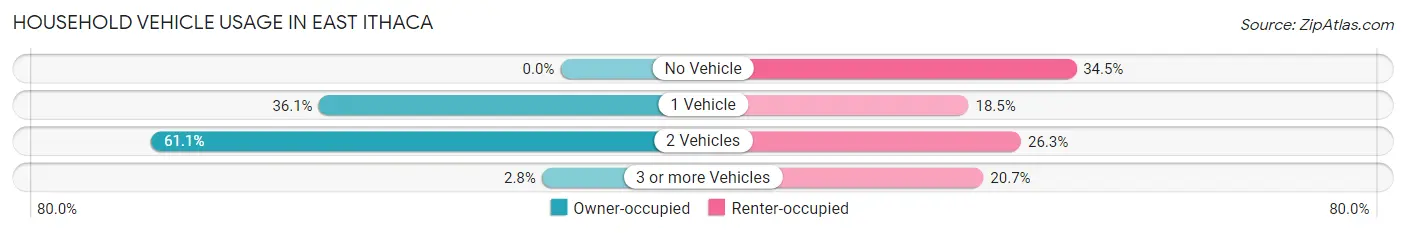
| Vehicles per Household | Owner-occupied | Renter-occupied |
| No Vehicle | 0 (0.0%) | 172 (34.5%) |
| 1 Vehicle | 221 (36.1%) | 92 (18.5%) |
| 2 Vehicles | 374 (61.1%) | 131 (26.3%) |
| 3 or more Vehicles | 17 (2.8%) | 103 (20.7%) |
| Total | 612 (100.0%) | 498 (100.0%) |
Real Estate & Mortgages in East Ithaca
Real Estate and Mortgage Overview in East Ithaca
| Characteristic | Without Mortgage | With Mortgage |
| Housing Units | 431 | 181 |
| Median Property Value | $264,600 | $299,700 |
| Median Household Income | $107,109 | $75 |
| Monthly Housing Costs | $846 | $53 |
| Real Estate Taxes | $6,423 | $0 |
Property Value by Mortgage Status in East Ithaca
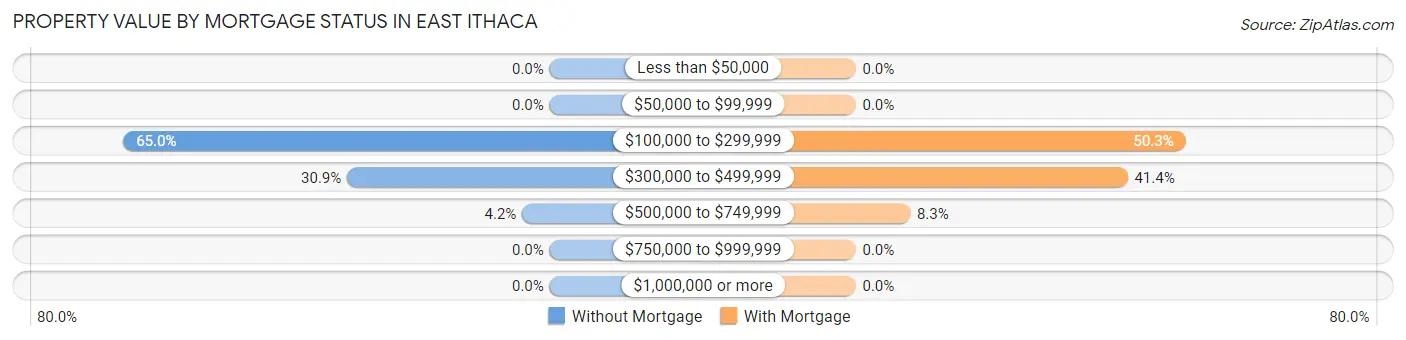
| Property Value | Without Mortgage | With Mortgage |
| Less than $50,000 | 0 (0.0%) | 0 (0.0%) |
| $50,000 to $99,999 | 0 (0.0%) | 0 (0.0%) |
| $100,000 to $299,999 | 280 (65.0%) | 91 (50.3%) |
| $300,000 to $499,999 | 133 (30.9%) | 75 (41.4%) |
| $500,000 to $749,999 | 18 (4.2%) | 15 (8.3%) |
| $750,000 to $999,999 | 0 (0.0%) | 0 (0.0%) |
| $1,000,000 or more | 0 (0.0%) | 0 (0.0%) |
| Total | 431 (100.0%) | 181 (100.0%) |
Household Income by Mortgage Status in East Ithaca
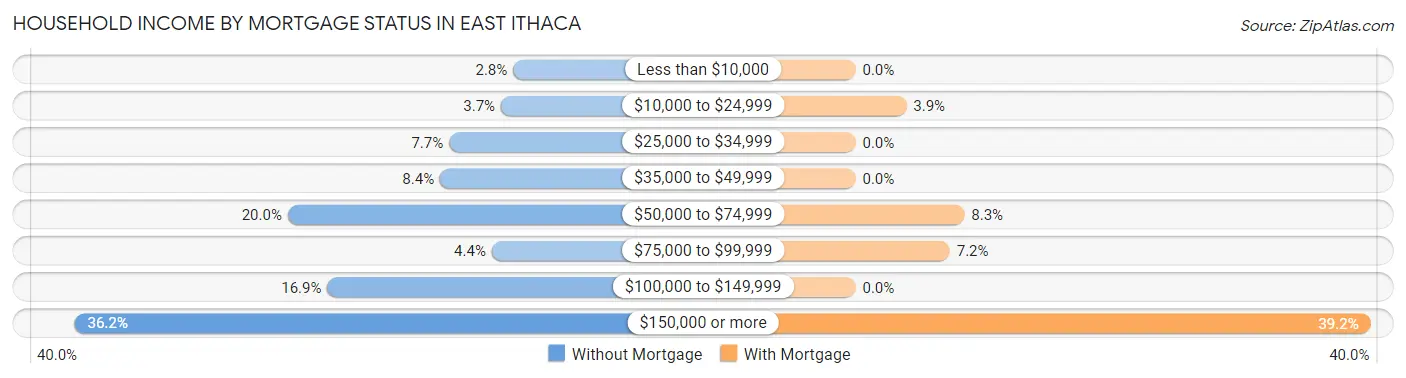
| Household Income | Without Mortgage | With Mortgage |
| Less than $10,000 | 12 (2.8%) | 0 (0.0%) |
| $10,000 to $24,999 | 16 (3.7%) | 7 (3.9%) |
| $25,000 to $34,999 | 33 (7.7%) | 0 (0.0%) |
| $35,000 to $49,999 | 36 (8.4%) | 0 (0.0%) |
| $50,000 to $74,999 | 86 (20.0%) | 15 (8.3%) |
| $75,000 to $99,999 | 19 (4.4%) | 13 (7.2%) |
| $100,000 to $149,999 | 73 (16.9%) | 0 (0.0%) |
| $150,000 or more | 156 (36.2%) | 71 (39.2%) |
| Total | 431 (100.0%) | 181 (100.0%) |
Property Value to Household Income Ratio in East Ithaca
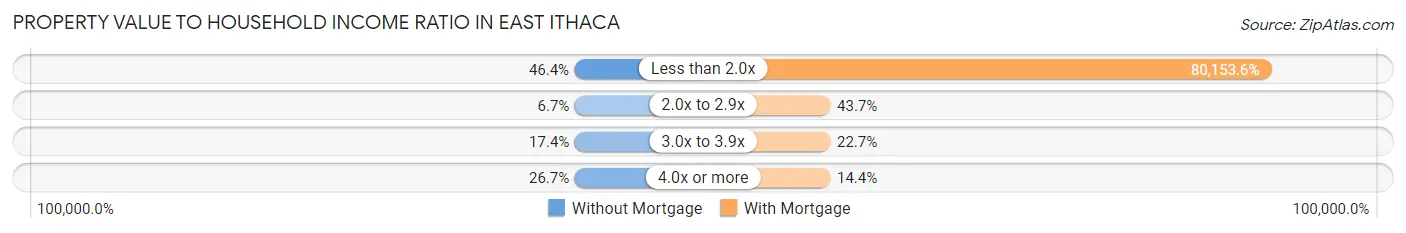
| Value-to-Income Ratio | Without Mortgage | With Mortgage |
| Less than 2.0x | 200 (46.4%) | 145,078 (80,153.6%) |
| 2.0x to 2.9x | 29 (6.7%) | 79 (43.6%) |
| 3.0x to 3.9x | 75 (17.4%) | 41 (22.7%) |
| 4.0x or more | 115 (26.7%) | 26 (14.4%) |
| Total | 431 (100.0%) | 181 (100.0%) |
Real Estate Taxes by Mortgage Status in East Ithaca
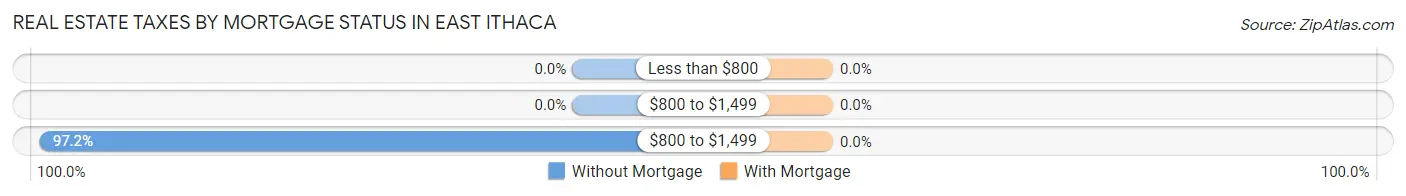
| Property Taxes | Without Mortgage | With Mortgage |
| Less than $800 | 0 (0.0%) | 0 (0.0%) |
| $800 to $1,499 | 0 (0.0%) | 0 (0.0%) |
| $800 to $1,499 | 419 (97.2%) | 0 (0.0%) |
| Total | 431 (100.0%) | 181 (100.0%) |
Health & Disability in East Ithaca
Health Insurance Coverage by Age in East Ithaca
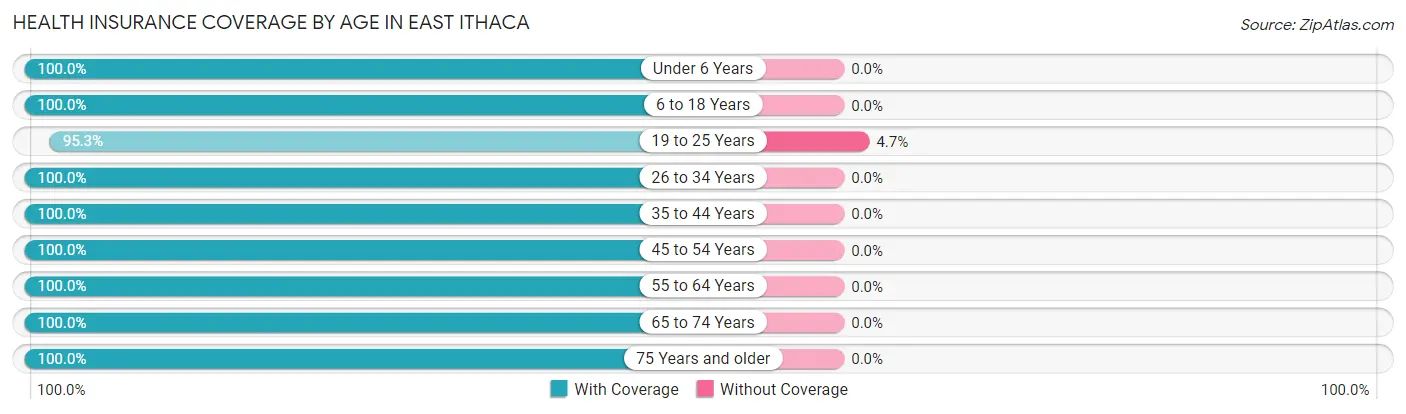
| Age Bracket | With Coverage | Without Coverage |
| Under 6 Years | 103 (100.0%) | 0 (0.0%) |
| 6 to 18 Years | 108 (100.0%) | 0 (0.0%) |
| 19 to 25 Years | 547 (95.3%) | 27 (4.7%) |
| 26 to 34 Years | 209 (100.0%) | 0 (0.0%) |
| 35 to 44 Years | 159 (100.0%) | 0 (0.0%) |
| 45 to 54 Years | 179 (100.0%) | 0 (0.0%) |
| 55 to 64 Years | 288 (100.0%) | 0 (0.0%) |
| 65 to 74 Years | 262 (100.0%) | 0 (0.0%) |
| 75 Years and older | 253 (100.0%) | 0 (0.0%) |
| Total | 2,108 (98.7%) | 27 (1.3%) |
Health Insurance Coverage by Citizenship Status in East Ithaca
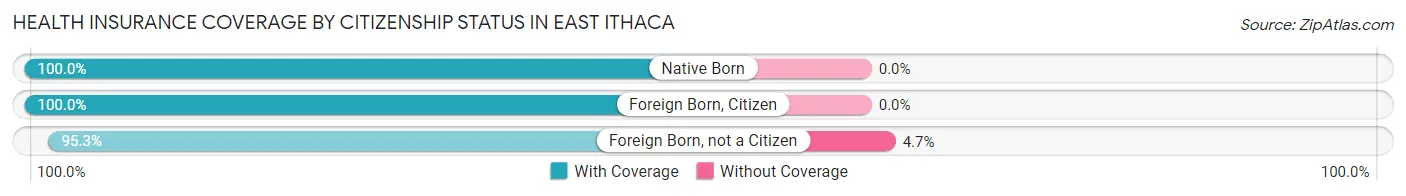
| Citizenship Status | With Coverage | Without Coverage |
| Native Born | 103 (100.0%) | 0 (0.0%) |
| Foreign Born, Citizen | 108 (100.0%) | 0 (0.0%) |
| Foreign Born, not a Citizen | 547 (95.3%) | 27 (4.7%) |
Health Insurance Coverage by Household Income in East Ithaca
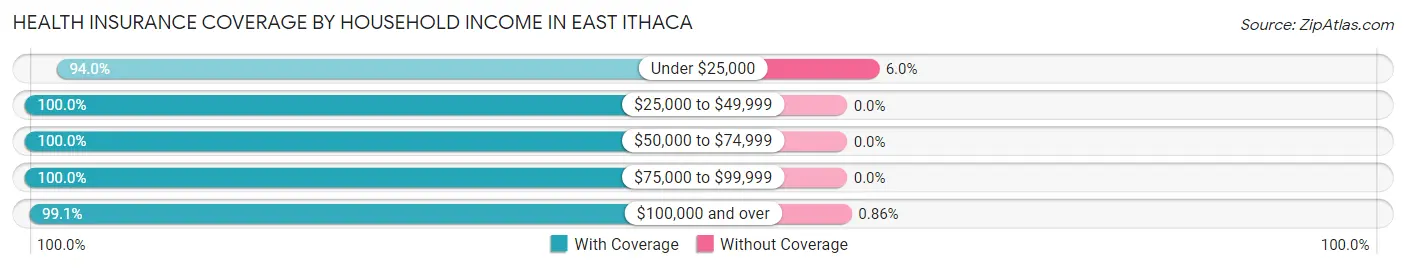
| Household Income | With Coverage | Without Coverage |
| Under $25,000 | 236 (94.0%) | 15 (6.0%) |
| $25,000 to $49,999 | 249 (100.0%) | 0 (0.0%) |
| $50,000 to $74,999 | 201 (100.0%) | 0 (0.0%) |
| $75,000 to $99,999 | 37 (100.0%) | 0 (0.0%) |
| $100,000 and over | 1,385 (99.1%) | 12 (0.9%) |
Public vs Private Health Insurance Coverage by Age in East Ithaca
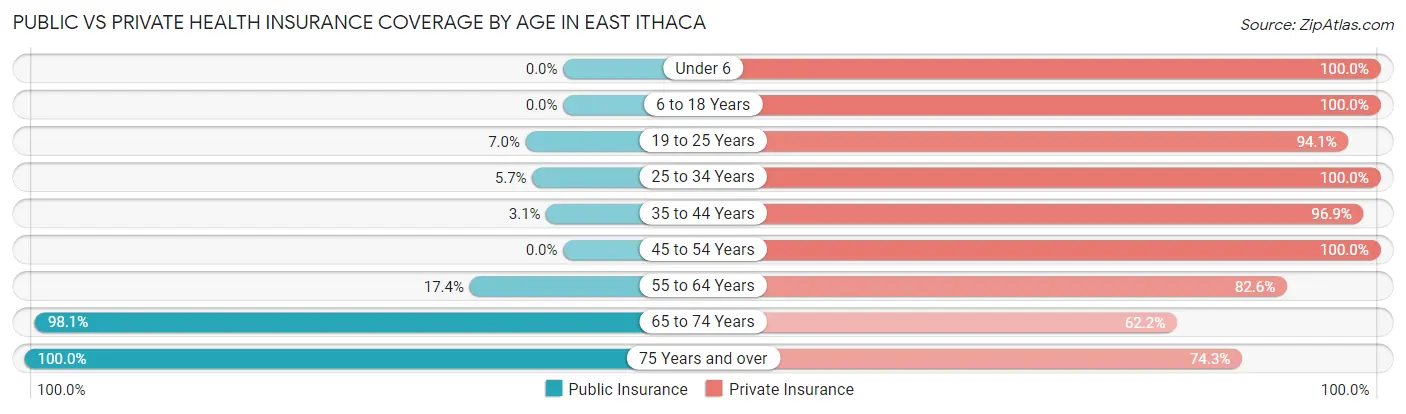
| Age Bracket | Public Insurance | Private Insurance |
| Under 6 | 0 (0.0%) | 103 (100.0%) |
| 6 to 18 Years | 0 (0.0%) | 108 (100.0%) |
| 19 to 25 Years | 40 (7.0%) | 540 (94.1%) |
| 25 to 34 Years | 12 (5.7%) | 209 (100.0%) |
| 35 to 44 Years | 5 (3.1%) | 154 (96.9%) |
| 45 to 54 Years | 0 (0.0%) | 179 (100.0%) |
| 55 to 64 Years | 50 (17.4%) | 238 (82.6%) |
| 65 to 74 Years | 257 (98.1%) | 163 (62.2%) |
| 75 Years and over | 253 (100.0%) | 188 (74.3%) |
| Total | 617 (28.9%) | 1,882 (88.1%) |
Disability Status by Sex by Age in East Ithaca
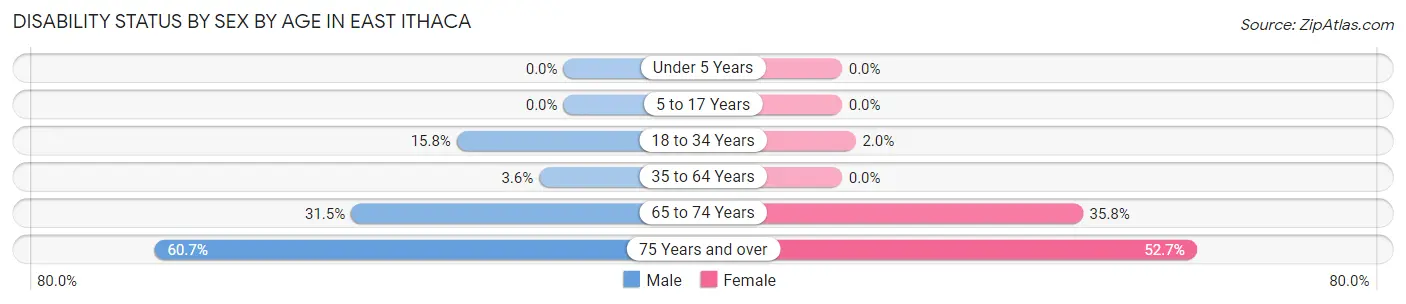
| Age Bracket | Male | Female |
| Under 5 Years | 0 (0.0%) | 0 (0.0%) |
| 5 to 17 Years | 0 (0.0%) | 0 (0.0%) |
| 18 to 34 Years | 48 (15.8%) | 10 (2.0%) |
| 35 to 64 Years | 11 (3.6%) | 0 (0.0%) |
| 65 to 74 Years | 35 (31.5%) | 54 (35.8%) |
| 75 Years and over | 51 (60.7%) | 89 (52.7%) |
Disability Class by Sex by Age in East Ithaca
Disability Class: Hearing Difficulty
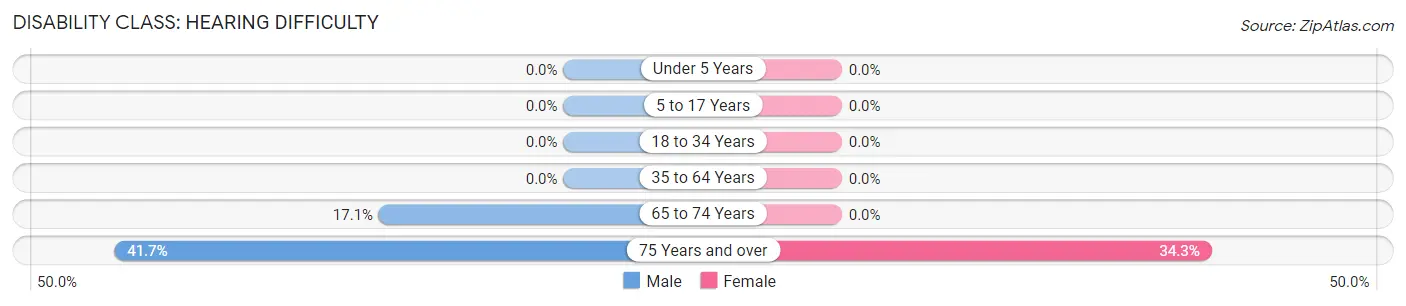
| Age Bracket | Male | Female |
| Under 5 Years | 0 (0.0%) | 0 (0.0%) |
| 5 to 17 Years | 0 (0.0%) | 0 (0.0%) |
| 18 to 34 Years | 0 (0.0%) | 0 (0.0%) |
| 35 to 64 Years | 0 (0.0%) | 0 (0.0%) |
| 65 to 74 Years | 19 (17.1%) | 0 (0.0%) |
| 75 Years and over | 35 (41.7%) | 58 (34.3%) |
Disability Class: Vision Difficulty
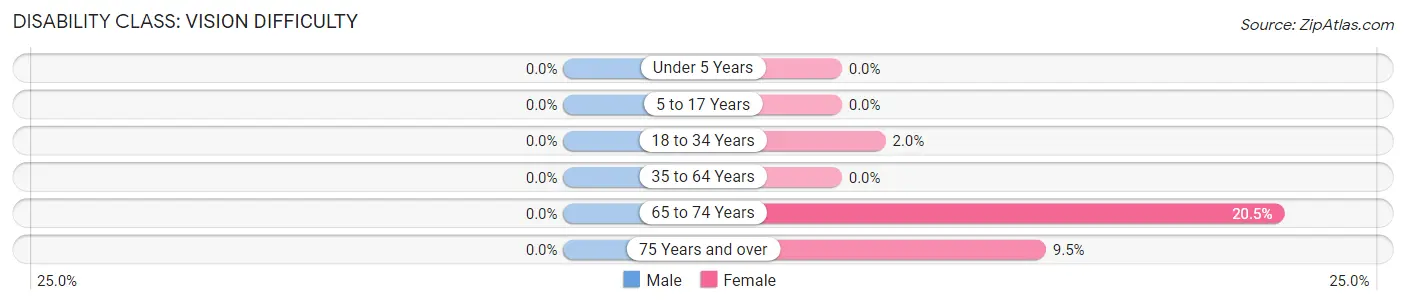
| Age Bracket | Male | Female |
| Under 5 Years | 0 (0.0%) | 0 (0.0%) |
| 5 to 17 Years | 0 (0.0%) | 0 (0.0%) |
| 18 to 34 Years | 0 (0.0%) | 10 (2.0%) |
| 35 to 64 Years | 0 (0.0%) | 0 (0.0%) |
| 65 to 74 Years | 0 (0.0%) | 31 (20.5%) |
| 75 Years and over | 0 (0.0%) | 16 (9.5%) |
Disability Class: Cognitive Difficulty
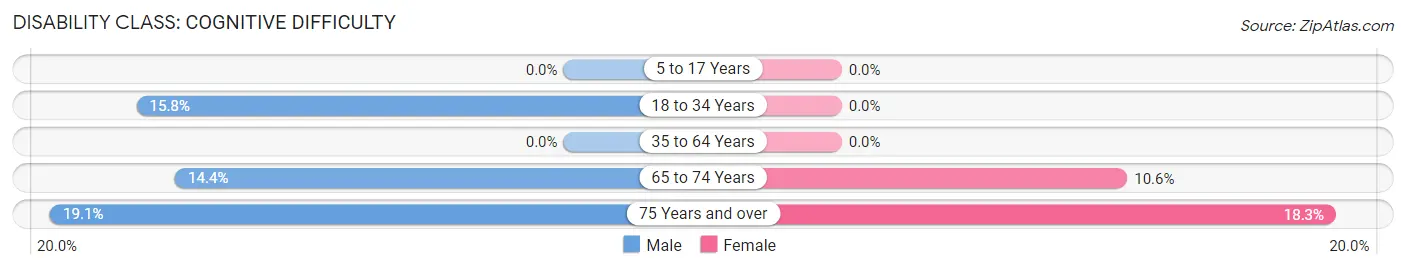
| Age Bracket | Male | Female |
| 5 to 17 Years | 0 (0.0%) | 0 (0.0%) |
| 18 to 34 Years | 48 (15.8%) | 0 (0.0%) |
| 35 to 64 Years | 0 (0.0%) | 0 (0.0%) |
| 65 to 74 Years | 16 (14.4%) | 16 (10.6%) |
| 75 Years and over | 16 (19.1%) | 31 (18.3%) |
Disability Class: Ambulatory Difficulty
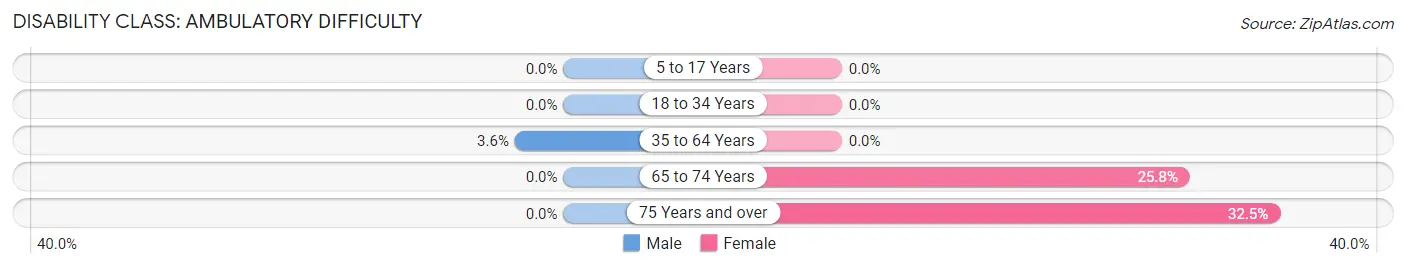
| Age Bracket | Male | Female |
| 5 to 17 Years | 0 (0.0%) | 0 (0.0%) |
| 18 to 34 Years | 0 (0.0%) | 0 (0.0%) |
| 35 to 64 Years | 11 (3.6%) | 0 (0.0%) |
| 65 to 74 Years | 0 (0.0%) | 39 (25.8%) |
| 75 Years and over | 0 (0.0%) | 55 (32.5%) |
Disability Class: Self-Care Difficulty
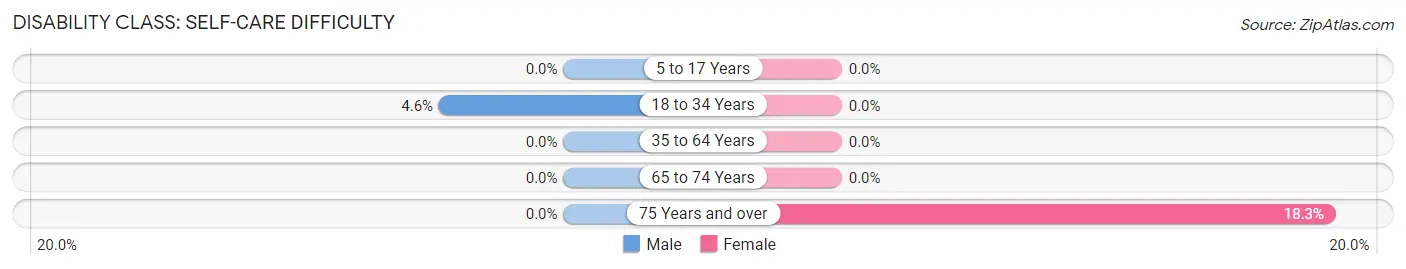
| Age Bracket | Male | Female |
| 5 to 17 Years | 0 (0.0%) | 0 (0.0%) |
| 18 to 34 Years | 14 (4.6%) | 0 (0.0%) |
| 35 to 64 Years | 0 (0.0%) | 0 (0.0%) |
| 65 to 74 Years | 0 (0.0%) | 0 (0.0%) |
| 75 Years and over | 0 (0.0%) | 31 (18.3%) |
Technology Access in East Ithaca
Computing Device Access in East Ithaca
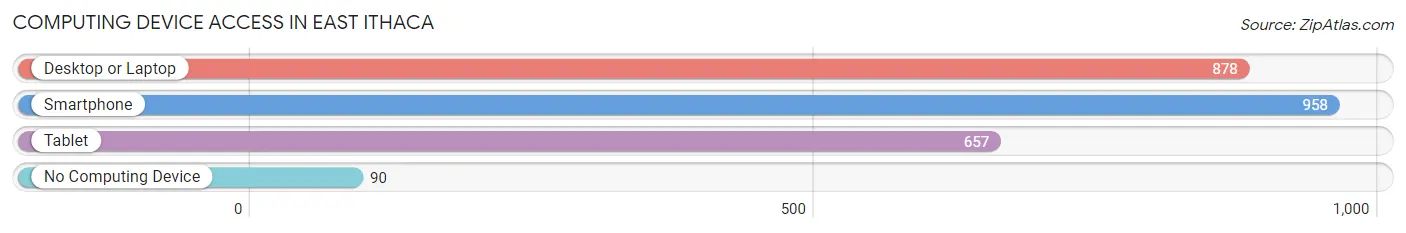
| Device Type | # Households | % Households |
| Desktop or Laptop | 878 | 79.1% |
| Smartphone | 958 | 86.3% |
| Tablet | 657 | 59.2% |
| No Computing Device | 90 | 8.1% |
| Total | 1,110 | 100.0% |
Internet Access in East Ithaca
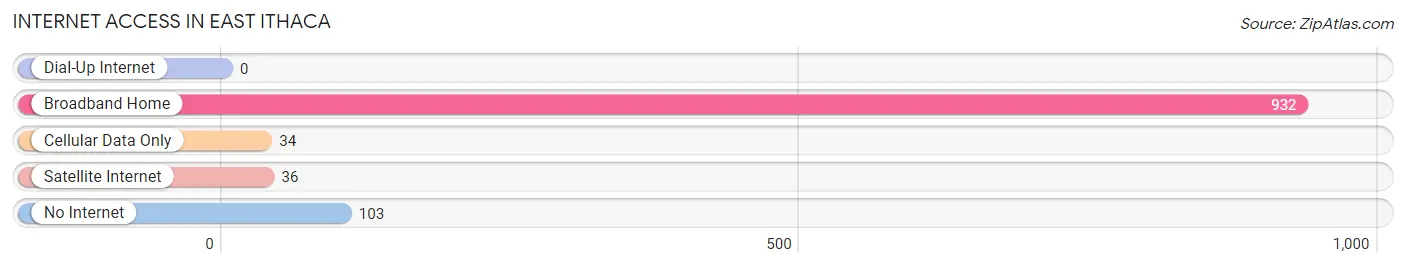
| Internet Type | # Households | % Households |
| Dial-Up Internet | 0 | 0.0% |
| Broadband Home | 932 | 84.0% |
| Cellular Data Only | 34 | 3.1% |
| Satellite Internet | 36 | 3.2% |
| No Internet | 103 | 9.3% |
| Total | 1,110 | 100.0% |
East Ithaca Summary
Ithaca, New York is a city located in the Finger Lakes region of New York State. It is the county seat of Tompkins County and is located on the southern shore of Cayuga Lake. Ithaca is home to Cornell University and Ithaca College, two of the most prestigious universities in the United States. The city has a population of approximately 30,000 people and is known for its vibrant culture, natural beauty, and progressive politics.
History
The area that is now Ithaca was originally inhabited by the Cayuga Nation, a member of the Iroquois Confederacy. The first European settlers arrived in the area in the late 1790s and the town of Ithaca was officially founded in 1794. The town was named after the Greek island of Ithaca, which was the home of the hero Odysseus in Homer’s epic poem The Odyssey.
In the early 19th century, Ithaca became an important center for the abolitionist movement. The city was home to several prominent abolitionists, including William Lloyd Garrison and Harriet Tubman. In 1868, Cornell University was founded in Ithaca, making it the first university in the United States to be founded by a woman.
In the late 19th and early 20th centuries, Ithaca experienced a period of rapid growth and industrialization. The city was home to several factories and mills, including the Ithaca Gun Company, which produced firearms for the U.S. military.
Geography
Ithaca is located in the Finger Lakes region of New York State. The city is situated on the southern shore of Cayuga Lake, the longest of the Finger Lakes. The city is surrounded by rolling hills and is located at the base of several gorges, including the famous Ithaca Falls.
The city has a total area of 10.3 square miles, of which 9.9 square miles is land and 0.4 square miles is water. The city is located approximately 30 miles south of Syracuse and 150 miles northwest of New York City.
Economy
Ithaca’s economy is largely driven by the presence of Cornell University and Ithaca College. The two universities are the largest employers in the city, providing jobs for thousands of people. The city is also home to several technology companies, including Agava Software and Cayuga Networks.
The city’s economy is also supported by tourism. Ithaca is a popular destination for outdoor enthusiasts, who come to take advantage of the city’s numerous parks and trails. The city is also home to several wineries and breweries, which attract visitors from all over the world.
Demographics
As of the 2010 census, Ithaca had a population of 30,014 people. The city has a diverse population, with people from all walks of life. The city’s population is approximately 55% white, 22% African American, 8% Asian, and 15% Hispanic or Latino.
The median household income in Ithaca is $45,845, which is higher than the national average. The city’s poverty rate is 17.2%, which is slightly higher than the national average. The city’s unemployment rate is 4.2%, which is lower than the national average.
Conclusion
Ithaca, New York is a vibrant city located in the Finger Lakes region of New York State. The city is home to two of the most prestigious universities in the United States, Cornell University and Ithaca College. The city has a diverse population and a strong economy, driven by the presence of the two universities and several technology companies. Ithaca is also a popular destination for outdoor enthusiasts and tourists, who come to take advantage of the city’s numerous parks and trails.
Common Questions
What is Per Capita Income in East Ithaca?
Per Capita income in East Ithaca is $61,221.
What is the Median Family Income in East Ithaca?
Median Family Income in East Ithaca is $114,885.
What is the Median Household income in East Ithaca?
Median Household Income in East Ithaca is $115,449.
What is Income or Wage Gap in East Ithaca?
Income or Wage Gap in East Ithaca is 44.0%.
Women in East Ithaca earn 56.0 cents for every dollar earned by a man.
What is Inequality or Gini Index in East Ithaca?
Inequality or Gini Index in East Ithaca is 0.46.
What is the Total Population of East Ithaca?
Total Population of East Ithaca is 2,135.
What is the Total Male Population of East Ithaca?
Total Male Population of East Ithaca is 979.
What is the Total Female Population of East Ithaca?
Total Female Population of East Ithaca is 1,156.
What is the Ratio of Males per 100 Females in East Ithaca?
There are 84.69 Males per 100 Females in East Ithaca.
What is the Ratio of Females per 100 Males in East Ithaca?
There are 118.08 Females per 100 Males in East Ithaca.
What is the Median Population Age in East Ithaca?
Median Population Age in East Ithaca is 39.1 Years.
What is the Average Family Size in East Ithaca
Average Family Size in East Ithaca is 2.2 People.
What is the Average Household Size in East Ithaca
Average Household Size in East Ithaca is 1.9 People.
How Large is the Labor Force in East Ithaca?
There are 1,216 People in the Labor Forcein in East Ithaca.
What is the Percentage of People in the Labor Force in East Ithaca?
62.8% of People are in the Labor Force in East Ithaca.
What is the Unemployment Rate in East Ithaca?
Unemployment Rate in East Ithaca is 3.3%.