Cuylerville, NY Map & Demographics
Cuylerville Map
Cuylerville Overview
$44,313
PER CAPITA INCOME
$72,857
AVG FAMILY INCOME
$99,750
AVG HOUSEHOLD INCOME
9.9%
WAGE / INCOME GAP [ % ]
90.1¢/ $1
WAGE / INCOME GAP [ $ ]
0.36
INEQUALITY / GINI INDEX
324
TOTAL POPULATION
156
MALE POPULATION
168
FEMALE POPULATION
92.86
MALES / 100 FEMALES
107.69
FEMALES / 100 MALES
39.6
MEDIAN AGE
2.6
AVG FAMILY SIZE
2.6
AVG HOUSEHOLD SIZE
178
LABOR FORCE [ PEOPLE ]
72.4%
PERCENT IN LABOR FORCE
Income in Cuylerville
Income Overview in Cuylerville
Per Capita Income in Cuylerville is $44,313, while median incomes of families and households are $72,857 and $99,750 respectively.
| Characteristic | Number | Measure |
| Per Capita Income | 324 | $44,313 |
| Median Family Income | 92 | $72,857 |
| Mean Family Income | 92 | $106,093 |
| Median Household Income | 125 | $99,750 |
| Mean Household Income | 125 | $108,922 |
| Income Deficit | 92 | $0 |
| Wage / Income Gap (%) | 324 | 9.92% |
| Wage / Income Gap ($) | 324 | 90.08¢ per $1 |
| Gini / Inequality Index | 324 | 0.36 |
Earnings by Sex in Cuylerville
Average Earnings in Cuylerville are $53,900, $58,447 for men and $52,650 for women, a difference of 9.9%.
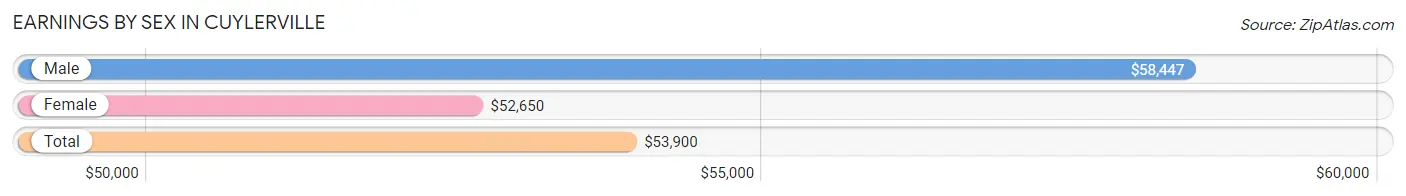
| Sex | Number | Average Earnings |
| Male | 97 (50.5%) | $58,447 |
| Female | 95 (49.5%) | $52,650 |
| Total | 192 (100.0%) | $53,900 |
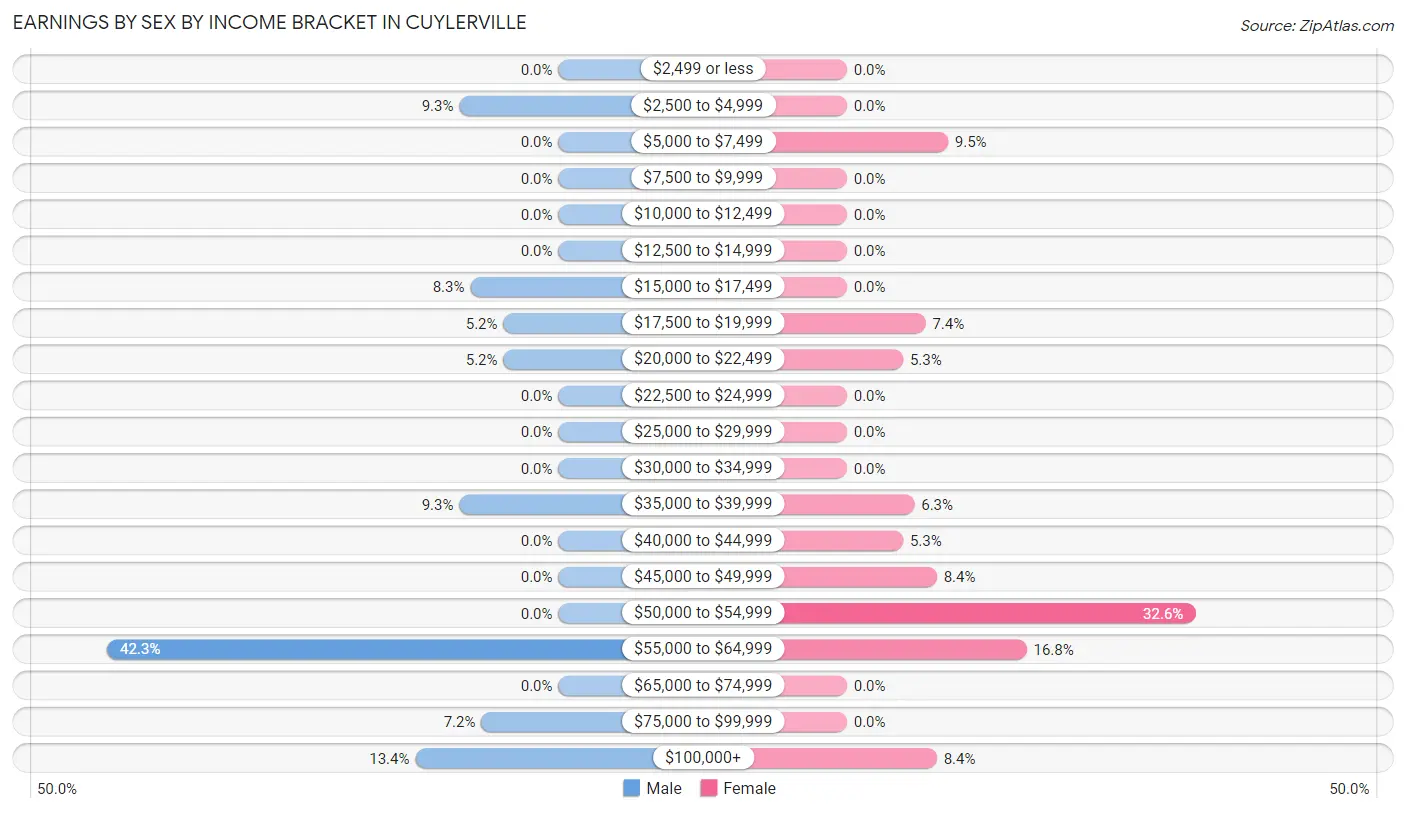
Earnings by Sex by Income Bracket in Cuylerville
The most common earnings brackets in Cuylerville are $55,000 to $64,999 for men (41 | 42.3%) and $50,000 to $54,999 for women (31 | 32.6%).
| Income | Male | Female |
| $2,499 or less | 0 (0.0%) | 0 (0.0%) |
| $2,500 to $4,999 | 9 (9.3%) | 0 (0.0%) |
| $5,000 to $7,499 | 0 (0.0%) | 9 (9.5%) |
| $7,500 to $9,999 | 0 (0.0%) | 0 (0.0%) |
| $10,000 to $12,499 | 0 (0.0%) | 0 (0.0%) |
| $12,500 to $14,999 | 0 (0.0%) | 0 (0.0%) |
| $15,000 to $17,499 | 8 (8.3%) | 0 (0.0%) |
| $17,500 to $19,999 | 5 (5.1%) | 7 (7.4%) |
| $20,000 to $22,499 | 5 (5.1%) | 5 (5.3%) |
| $22,500 to $24,999 | 0 (0.0%) | 0 (0.0%) |
| $25,000 to $29,999 | 0 (0.0%) | 0 (0.0%) |
| $30,000 to $34,999 | 0 (0.0%) | 0 (0.0%) |
| $35,000 to $39,999 | 9 (9.3%) | 6 (6.3%) |
| $40,000 to $44,999 | 0 (0.0%) | 5 (5.3%) |
| $45,000 to $49,999 | 0 (0.0%) | 8 (8.4%) |
| $50,000 to $54,999 | 0 (0.0%) | 31 (32.6%) |
| $55,000 to $64,999 | 41 (42.3%) | 16 (16.8%) |
| $65,000 to $74,999 | 0 (0.0%) | 0 (0.0%) |
| $75,000 to $99,999 | 7 (7.2%) | 0 (0.0%) |
| $100,000+ | 13 (13.4%) | 8 (8.4%) |
| Total | 97 (100.0%) | 95 (100.0%) |
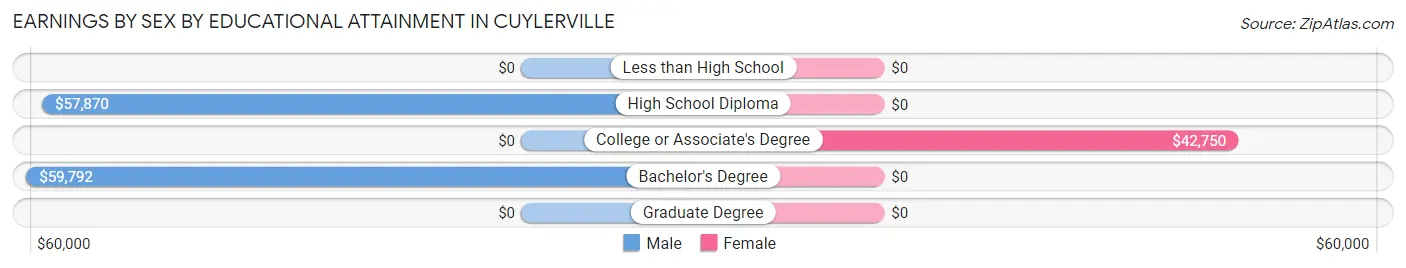
Earnings by Sex by Educational Attainment in Cuylerville
Average earnings in Cuylerville are $58,447 for men and $53,100 for women, a difference of 9.1%. Men with an educational attainment of bachelor's degree enjoy the highest average annual earnings of $59,792, while those with high school diploma education earn the least with $57,870. Women with an educational attainment of college or associate's degree earn the most with the average annual earnings of $42,750, while those with college or associate's degree education have the smallest earnings of $42,750.
| Educational Attainment | Male Income | Female Income |
| Less than High School | - | - |
| High School Diploma | $57,870 | $0 |
| College or Associate's Degree | - | - |
| Bachelor's Degree | $59,792 | $0 |
| Graduate Degree | - | - |
| Total | $58,447 | $53,100 |
Family Income in Cuylerville
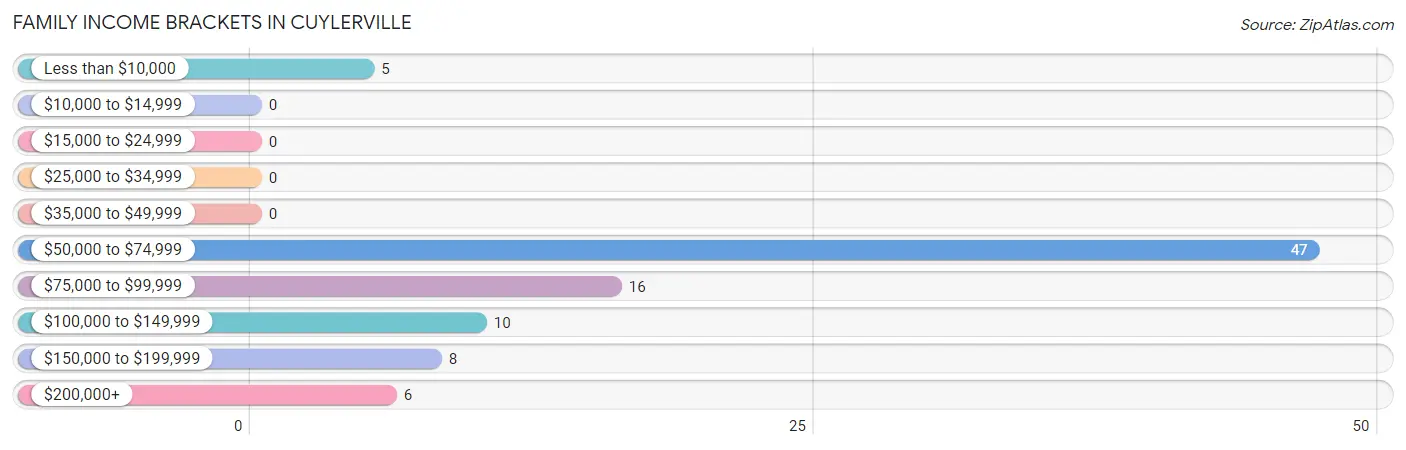
Family Income Brackets in Cuylerville
According to the Cuylerville family income data, there are 47 families falling into the $50,000 to $74,999 income range, which is the most common income bracket and makes up 51.1% of all families.
| Income Bracket | # Families | % Families |
| Less than $10,000 | 5 | 5.4% |
| $10,000 to $14,999 | 0 | 0.0% |
| $15,000 to $24,999 | 0 | 0.0% |
| $25,000 to $34,999 | 0 | 0.0% |
| $35,000 to $49,999 | 0 | 0.0% |
| $50,000 to $74,999 | 47 | 51.1% |
| $75,000 to $99,999 | 16 | 17.4% |
| $100,000 to $149,999 | 10 | 10.9% |
| $150,000 to $199,999 | 8 | 8.7% |
| $200,000+ | 6 | 6.5% |
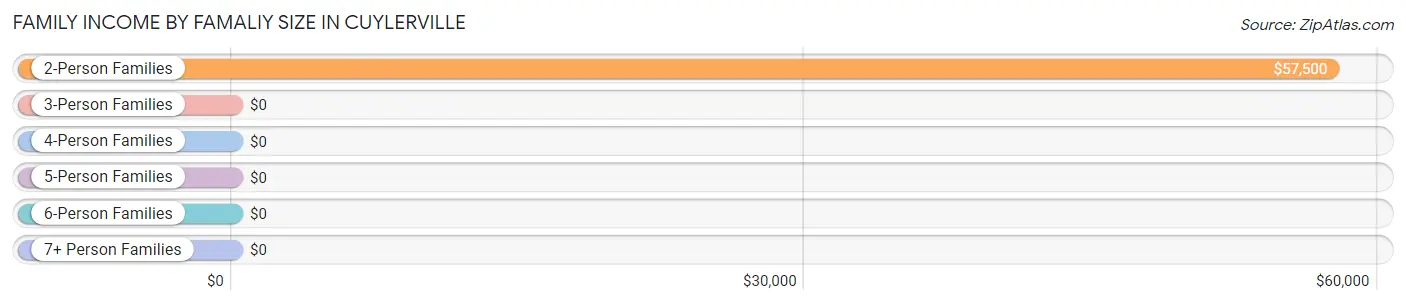
Family Income by Famaliy Size in Cuylerville
2-person families (68 | 73.9%) account for the highest median family income in Cuylerville with $57,500 per family, while 2-person families (68 | 73.9%) have the highest median income of $28,750 per family member.
| Income Bracket | # Families | Median Income |
| 2-Person Families | 68 (73.9%) | $57,500 |
| 3-Person Families | 7 (7.6%) | $0 |
| 4-Person Families | 11 (12.0%) | $0 |
| 5-Person Families | 6 (6.5%) | $0 |
| 6-Person Families | 0 (0.0%) | $0 |
| 7+ Person Families | 0 (0.0%) | $0 |
| Total | 92 (100.0%) | $72,857 |
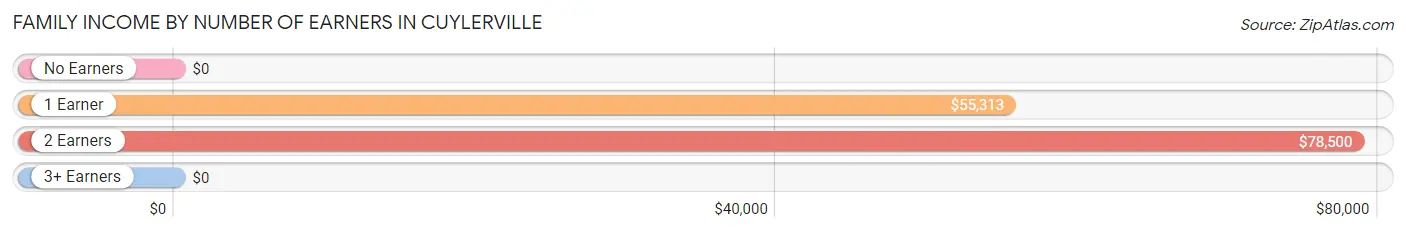
Family Income by Number of Earners in Cuylerville
| Number of Earners | # Families | Median Income |
| No Earners | 9 (9.8%) | $0 |
| 1 Earner | 51 (55.4%) | $55,313 |
| 2 Earners | 32 (34.8%) | $78,500 |
| 3+ Earners | 0 (0.0%) | $0 |
| Total | 92 (100.0%) | $72,857 |
Household Income in Cuylerville
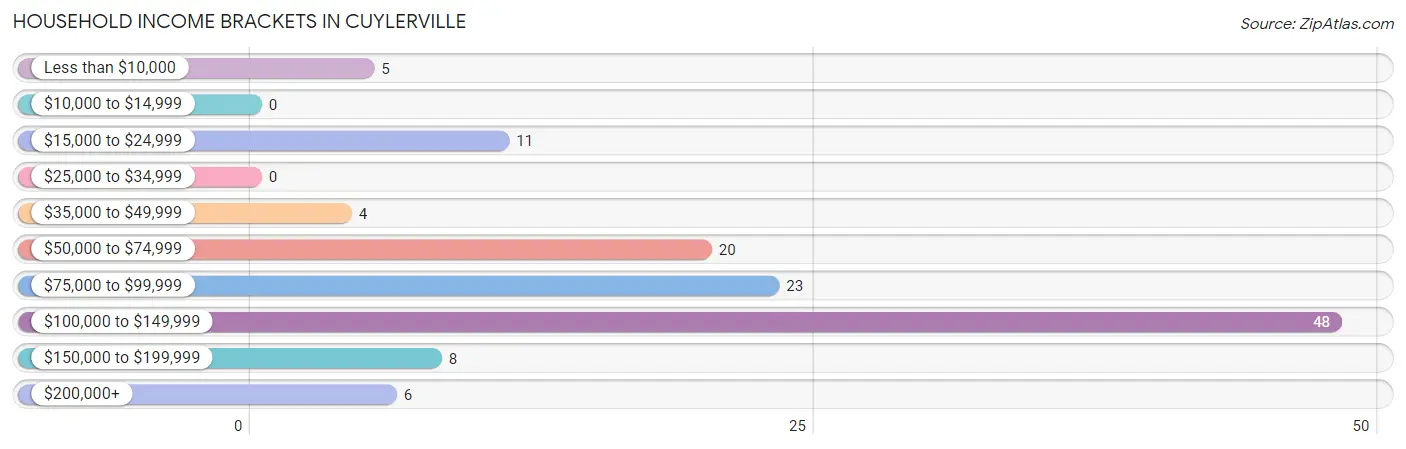
Household Income Brackets in Cuylerville
With 48 households falling in the category, the $100,000 to $149,999 income range is the most frequent in Cuylerville, accounting for 38.4% of all households.
| Income Bracket | # Households | % Households |
| Less than $10,000 | 5 | 4.0% |
| $10,000 to $14,999 | 0 | 0.0% |
| $15,000 to $24,999 | 11 | 8.8% |
| $25,000 to $34,999 | 0 | 0.0% |
| $35,000 to $49,999 | 4 | 3.2% |
| $50,000 to $74,999 | 20 | 16.0% |
| $75,000 to $99,999 | 23 | 18.4% |
| $100,000 to $149,999 | 48 | 38.4% |
| $150,000 to $199,999 | 8 | 6.4% |
| $200,000+ | 6 | 4.8% |
Household Income by Householder Age in Cuylerville
The median household income in Cuylerville is $99,750, with the highest median household income of $102,000 found in the 45 to 64 years age bracket for the primary householder. A total of 76 households (60.8%) fall into this category.
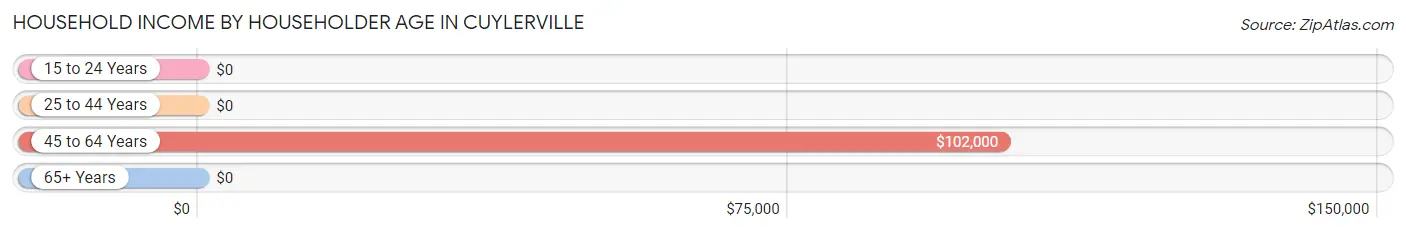
| Income Bracket | # Households | Median Income |
| 15 to 24 Years | 0 (0.0%) | $0 |
| 25 to 44 Years | 32 (25.6%) | $0 |
| 45 to 64 Years | 76 (60.8%) | $102,000 |
| 65+ Years | 17 (13.6%) | $0 |
| Total | 125 (100.0%) | $99,750 |
Poverty in Cuylerville
Income Below Poverty by Sex and Age in Cuylerville
With 2.6% poverty level for males and 5.9% for females among the residents of Cuylerville, 12 to 14 year old males and 75 year old and over females are the most vulnerable to poverty, with 4 males (36.4%) and 10 females (100.0%) in their respective age groups living below the poverty level.
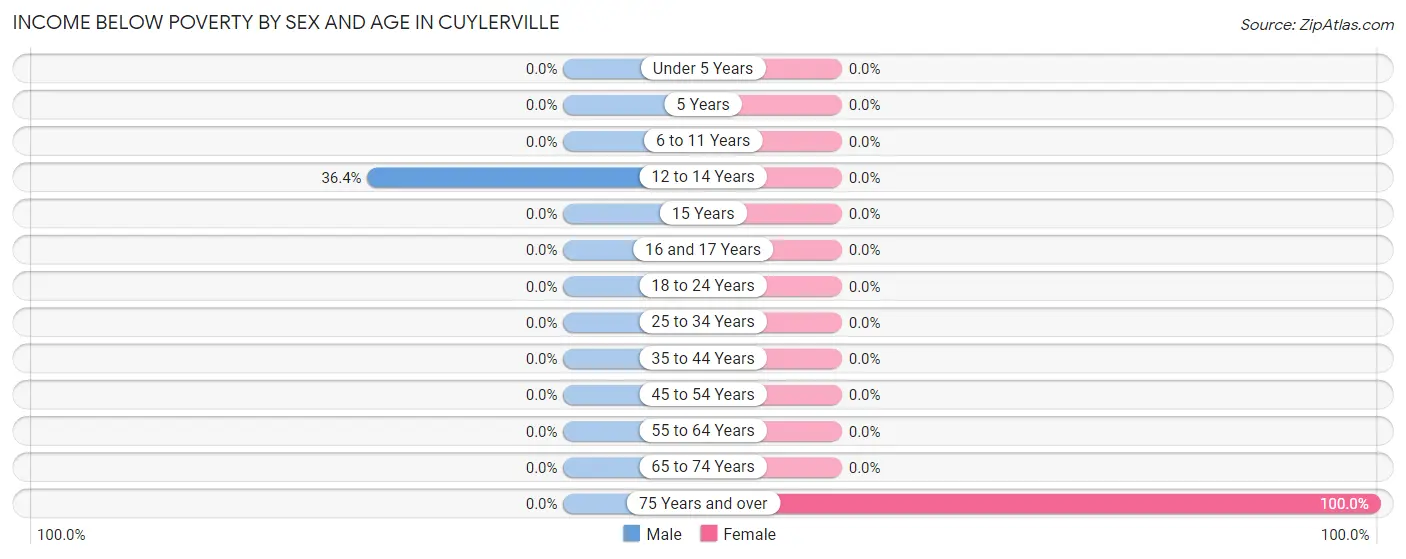
| Age Bracket | Male | Female |
| Under 5 Years | 0 (0.0%) | 0 (0.0%) |
| 5 Years | 0 (0.0%) | 0 (0.0%) |
| 6 to 11 Years | 0 (0.0%) | 0 (0.0%) |
| 12 to 14 Years | 4 (36.4%) | 0 (0.0%) |
| 15 Years | 0 (0.0%) | 0 (0.0%) |
| 16 and 17 Years | 0 (0.0%) | 0 (0.0%) |
| 18 to 24 Years | 0 (0.0%) | 0 (0.0%) |
| 25 to 34 Years | 0 (0.0%) | 0 (0.0%) |
| 35 to 44 Years | 0 (0.0%) | 0 (0.0%) |
| 45 to 54 Years | 0 (0.0%) | 0 (0.0%) |
| 55 to 64 Years | 0 (0.0%) | 0 (0.0%) |
| 65 to 74 Years | 0 (0.0%) | 0 (0.0%) |
| 75 Years and over | 0 (0.0%) | 10 (100.0%) |
| Total | 4 (2.6%) | 10 (5.9%) |
Income Above Poverty by Sex and Age in Cuylerville
According to the poverty statistics in Cuylerville, males aged 6 to 11 years and females aged under 5 years are the age groups that are most secure financially, with 100.0% of males and 100.0% of females in these age groups living above the poverty line.
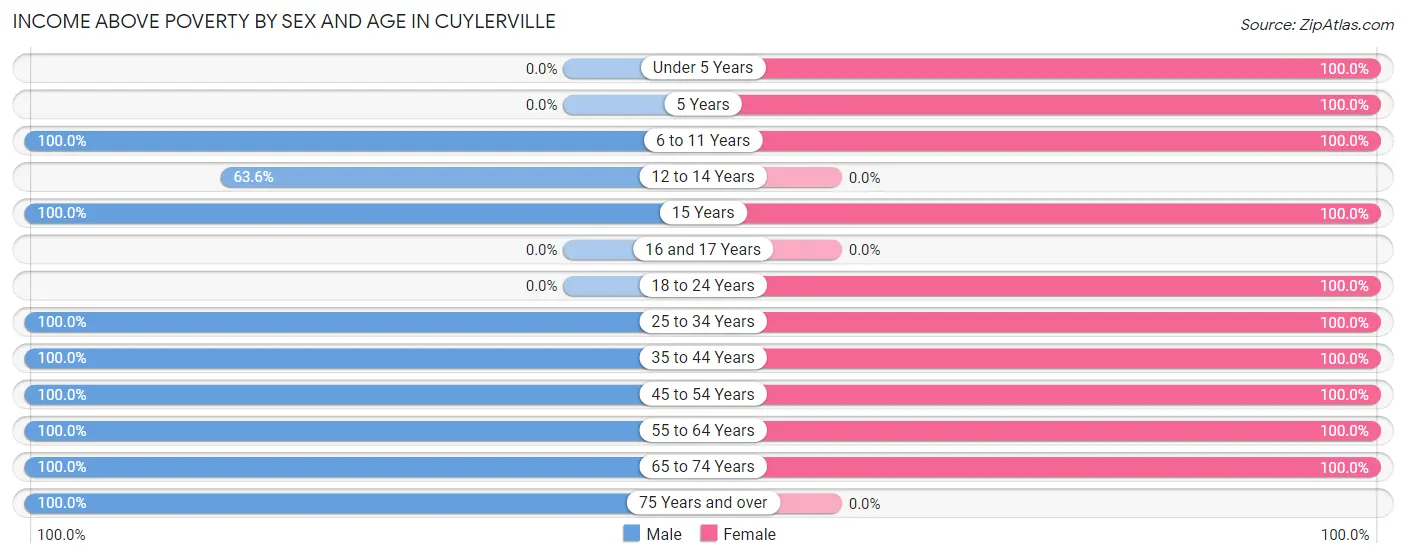
| Age Bracket | Male | Female |
| Under 5 Years | 0 (0.0%) | 5 (100.0%) |
| 5 Years | 0 (0.0%) | 9 (100.0%) |
| 6 to 11 Years | 16 (100.0%) | 27 (100.0%) |
| 12 to 14 Years | 7 (63.6%) | 0 (0.0%) |
| 15 Years | 6 (100.0%) | 4 (100.0%) |
| 16 and 17 Years | 0 (0.0%) | 0 (0.0%) |
| 18 to 24 Years | 0 (0.0%) | 9 (100.0%) |
| 25 to 34 Years | 25 (100.0%) | 19 (100.0%) |
| 35 to 44 Years | 14 (100.0%) | 24 (100.0%) |
| 45 to 54 Years | 22 (100.0%) | 32 (100.0%) |
| 55 to 64 Years | 44 (100.0%) | 21 (100.0%) |
| 65 to 74 Years | 10 (100.0%) | 8 (100.0%) |
| 75 Years and over | 8 (100.0%) | 0 (0.0%) |
| Total | 152 (97.4%) | 158 (94.1%) |
Income Below Poverty Among Married-Couple Families in Cuylerville
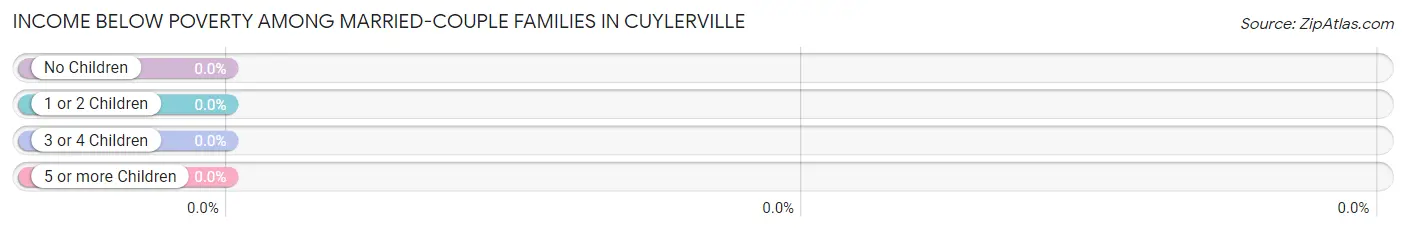
| Children | Above Poverty | Below Poverty |
| No Children | 31 (100.0%) | 0 (0.0%) |
| 1 or 2 Children | 11 (100.0%) | 0 (0.0%) |
| 3 or 4 Children | 6 (100.0%) | 0 (0.0%) |
| 5 or more Children | 0 (0.0%) | 0 (0.0%) |
| Total | 48 (100.0%) | 0 (0.0%) |
Income Below Poverty Among Single-Parent Households in Cuylerville
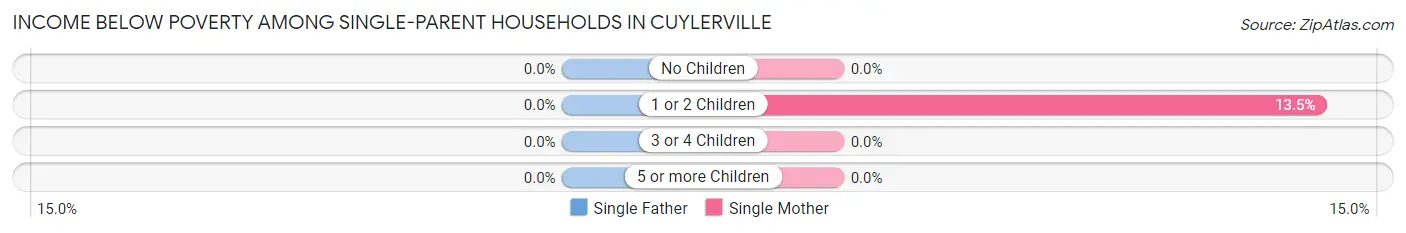
| Children | Single Father | Single Mother |
| No Children | 0 (0.0%) | 0 (0.0%) |
| 1 or 2 Children | 0 (0.0%) | 5 (13.5%) |
| 3 or 4 Children | 0 (0.0%) | 0 (0.0%) |
| 5 or more Children | 0 (0.0%) | 0 (0.0%) |
| Total | 0 (0.0%) | 5 (11.4%) |
Income Below Poverty Among Married-Couple vs Single-Parent Households in Cuylerville
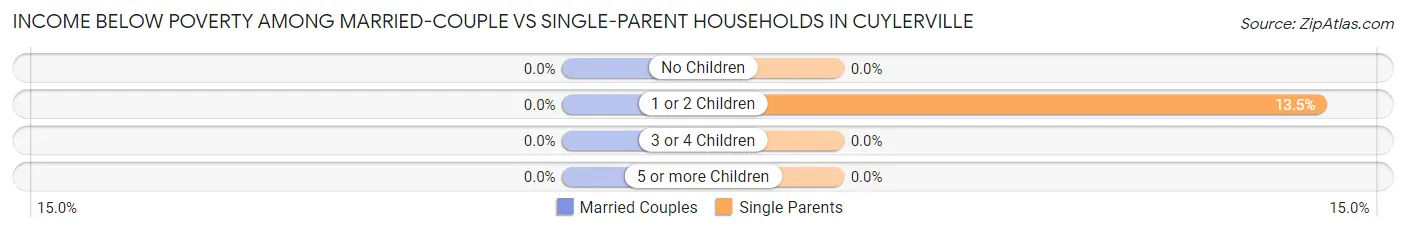
| Children | Married-Couple Families | Single-Parent Households |
| No Children | 0 (0.0%) | 0 (0.0%) |
| 1 or 2 Children | 0 (0.0%) | 5 (13.5%) |
| 3 or 4 Children | 0 (0.0%) | 0 (0.0%) |
| 5 or more Children | 0 (0.0%) | 0 (0.0%) |
| Total | 0 (0.0%) | 5 (11.4%) |
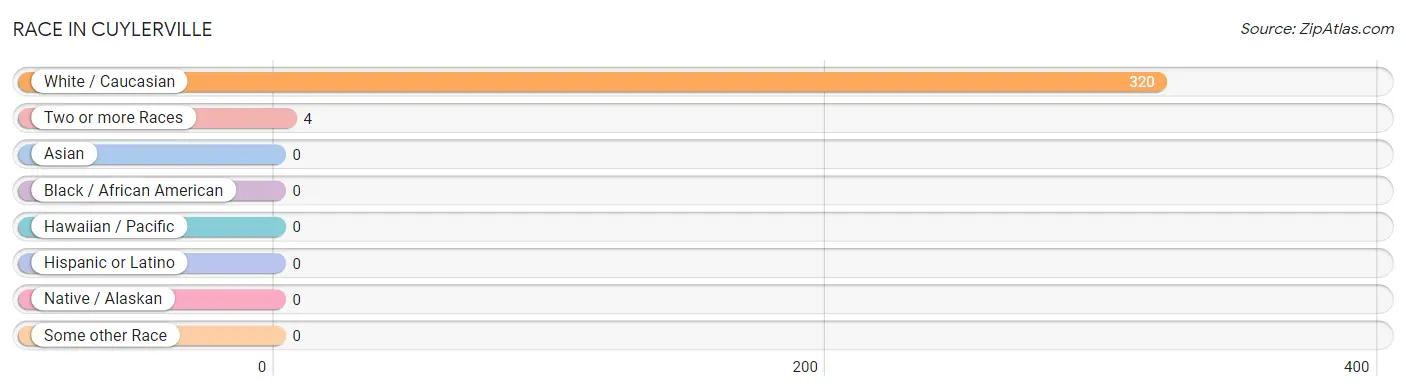
Race in Cuylerville
The most populous races in Cuylerville are White / Caucasian (320 | 98.8%), and Two or more Races (4 | 1.2%).
| Race | # Population | % Population |
| Asian | 0 | 0.0% |
| Black / African American | 0 | 0.0% |
| Hawaiian / Pacific | 0 | 0.0% |
| Hispanic or Latino | 0 | 0.0% |
| Native / Alaskan | 0 | 0.0% |
| White / Caucasian | 320 | 98.8% |
| Two or more Races | 4 | 1.2% |
| Some other Race | 0 | 0.0% |
| Total | 324 | 100.0% |
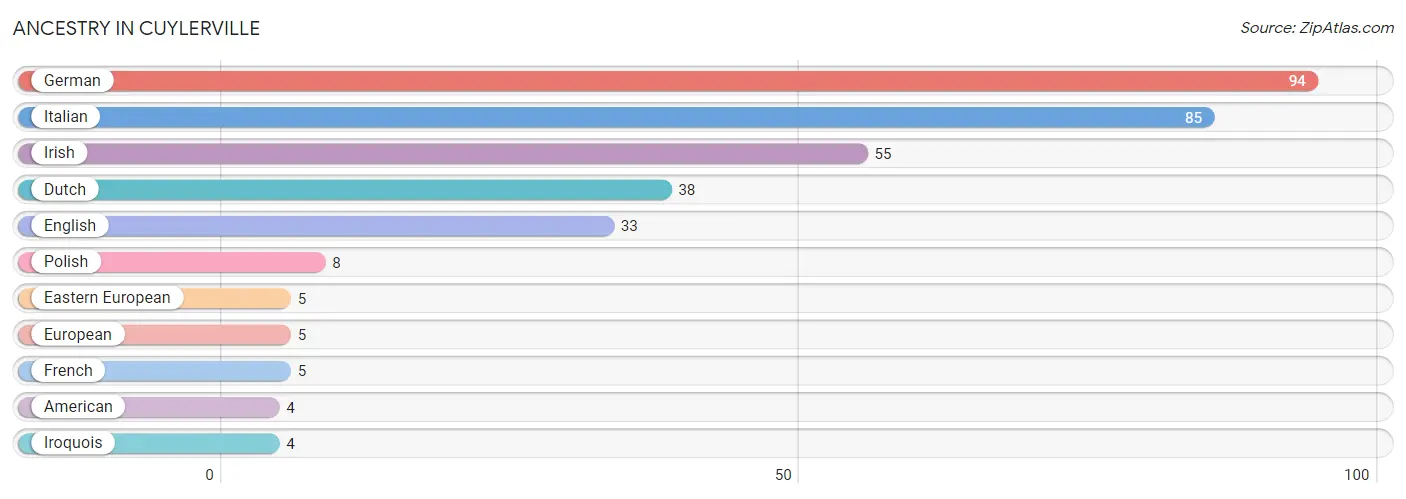
Ancestry in Cuylerville
The most populous ancestries reported in Cuylerville are German (94 | 29.0%), Italian (85 | 26.2%), Irish (55 | 17.0%), Dutch (38 | 11.7%), and English (33 | 10.2%), together accounting for 94.1% of all Cuylerville residents.
| Ancestry | # Population | % Population |
| American | 4 | 1.2% |
| Dutch | 38 | 11.7% |
| Eastern European | 5 | 1.5% |
| English | 33 | 10.2% |
| European | 5 | 1.5% |
| French | 5 | 1.5% |
| German | 94 | 29.0% |
| Irish | 55 | 17.0% |
| Iroquois | 4 | 1.2% |
| Italian | 85 | 26.2% |
| Polish | 8 | 2.5% | View All 11 Rows |
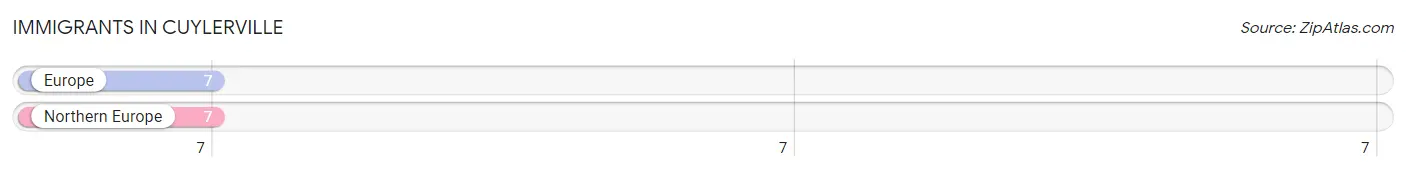
Immigrants in Cuylerville
The most numerous immigrant groups reported in Cuylerville came from Europe (7 | 2.2%), and Northern Europe (7 | 2.2%), together accounting for 4.3% of all Cuylerville residents.
| Immigration Origin | # Population | % Population |
| Europe | 7 | 2.2% |
| Northern Europe | 7 | 2.2% | View All 2 Rows |
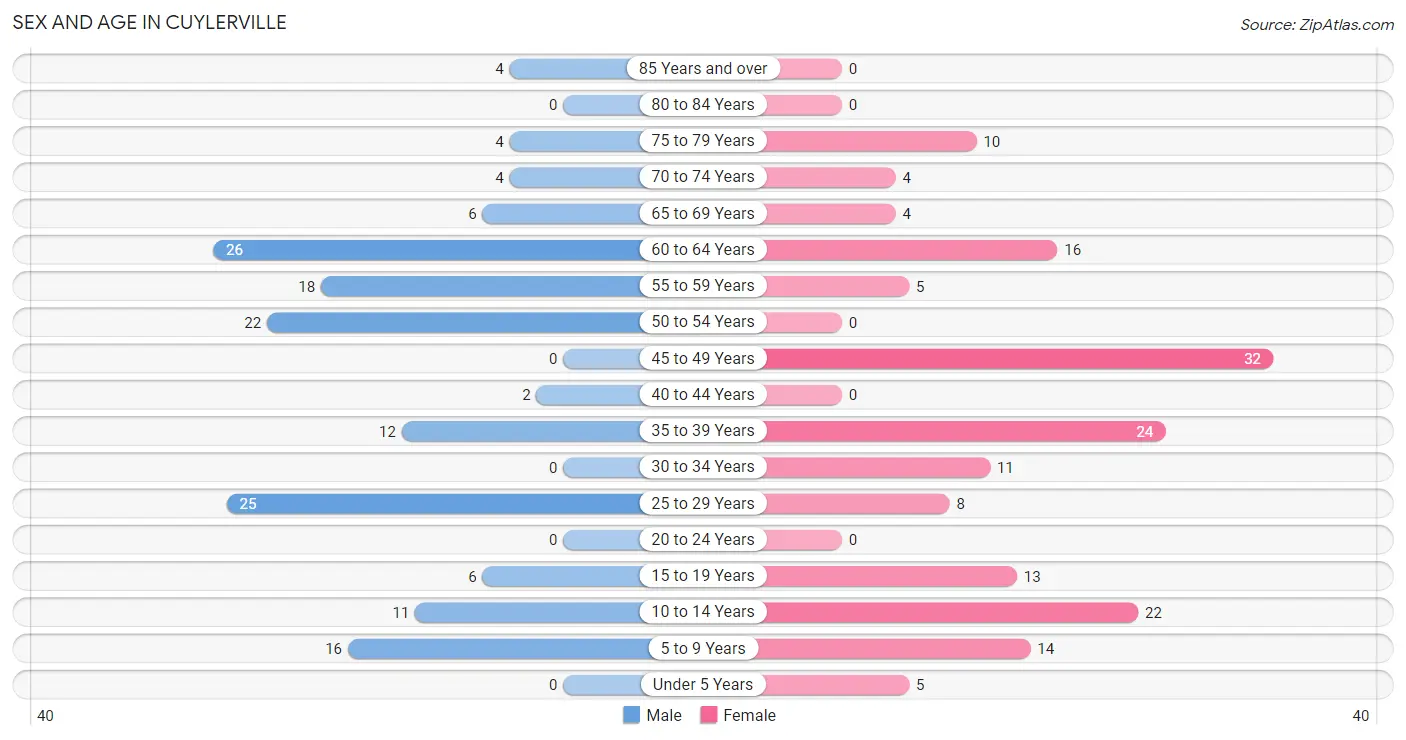
Sex and Age in Cuylerville
Sex and Age in Cuylerville
The most populous age groups in Cuylerville are 60 to 64 Years (26 | 16.7%) for men and 45 to 49 Years (32 | 19.1%) for women.
| Age Bracket | Male | Female |
| Under 5 Years | 0 (0.0%) | 5 (3.0%) |
| 5 to 9 Years | 16 (10.3%) | 14 (8.3%) |
| 10 to 14 Years | 11 (7.0%) | 22 (13.1%) |
| 15 to 19 Years | 6 (3.8%) | 13 (7.7%) |
| 20 to 24 Years | 0 (0.0%) | 0 (0.0%) |
| 25 to 29 Years | 25 (16.0%) | 8 (4.8%) |
| 30 to 34 Years | 0 (0.0%) | 11 (6.6%) |
| 35 to 39 Years | 12 (7.7%) | 24 (14.3%) |
| 40 to 44 Years | 2 (1.3%) | 0 (0.0%) |
| 45 to 49 Years | 0 (0.0%) | 32 (19.1%) |
| 50 to 54 Years | 22 (14.1%) | 0 (0.0%) |
| 55 to 59 Years | 18 (11.5%) | 5 (3.0%) |
| 60 to 64 Years | 26 (16.7%) | 16 (9.5%) |
| 65 to 69 Years | 6 (3.8%) | 4 (2.4%) |
| 70 to 74 Years | 4 (2.6%) | 4 (2.4%) |
| 75 to 79 Years | 4 (2.6%) | 10 (5.9%) |
| 80 to 84 Years | 0 (0.0%) | 0 (0.0%) |
| 85 Years and over | 4 (2.6%) | 0 (0.0%) |
| Total | 156 (100.0%) | 168 (100.0%) |
Families and Households in Cuylerville
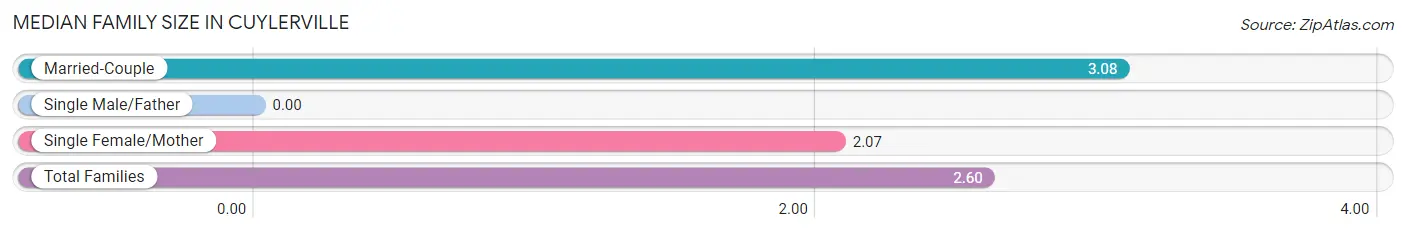
Median Family Size in Cuylerville
| Family Type | # Families | Family Size |
| Married-Couple | 48 (52.2%) | 3.08 |
| Single Male/Father | 0 (0.0%) | - |
| Single Female/Mother | 44 (47.8%) | 2.07 |
| Total Families | 92 (100.0%) | 2.60 |
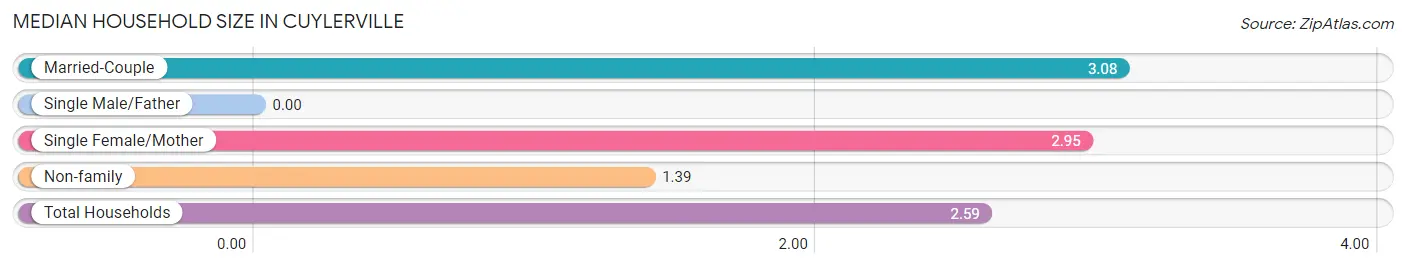
Median Household Size in Cuylerville
| Household Type | # Households | Household Size |
| Married-Couple | 48 (38.4%) | 3.08 |
| Single Male/Father | 0 (0.0%) | - |
| Single Female/Mother | 44 (35.2%) | 2.95 |
| Non-family | 33 (26.4%) | 1.39 |
| Total Households | 125 (100.0%) | 2.59 |
Household Size by Marriage Status in Cuylerville
Out of a total of 125 households in Cuylerville, 92 (73.6%) are family households, while 33 (26.4%) are nonfamily households. The most numerous type of family households are 2-person households, comprising 36, and the most common type of nonfamily households are 1-person households, comprising 23.
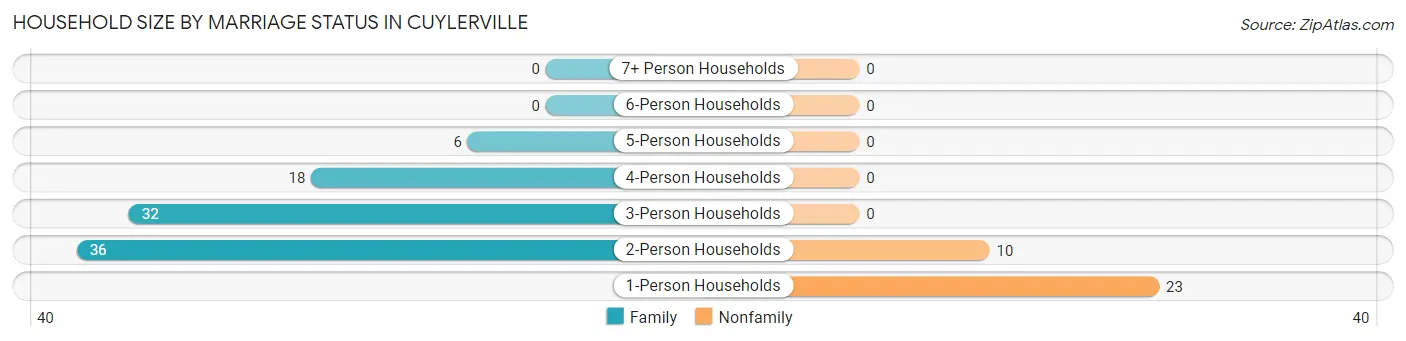
| Household Size | Family Households | Nonfamily Households |
| 1-Person Households | - | 23 (18.4%) |
| 2-Person Households | 36 (28.8%) | 10 (8.0%) |
| 3-Person Households | 32 (25.6%) | 0 (0.0%) |
| 4-Person Households | 18 (14.4%) | 0 (0.0%) |
| 5-Person Households | 6 (4.8%) | 0 (0.0%) |
| 6-Person Households | 0 (0.0%) | 0 (0.0%) |
| 7+ Person Households | 0 (0.0%) | 0 (0.0%) |
| Total | 92 (73.6%) | 33 (26.4%) |
Female Fertility in Cuylerville
Fertility by Age in Cuylerville
| Age Bracket | Women with Births | Births / 1,000 Women |
| 15 to 19 years | 0 (0.0%) | 0.0 |
| 20 to 34 years | 0 (0.0%) | 0.0 |
| 35 to 50 years | 0 (0.0%) | 0.0 |
| Total | 0 (0.0%) | 0.0 |
Fertility by Age by Marriage Status in Cuylerville
| Age Bracket | Married | Unmarried |
| 15 to 19 years | 0 (0.0%) | 0 (0.0%) |
| 20 to 34 years | 0 (0.0%) | 0 (0.0%) |
| 35 to 50 years | 0 (0.0%) | 0 (0.0%) |
| Total | 0 (0.0%) | 0 (0.0%) |
Fertility by Education in Cuylerville
| Educational Attainment | Women with Births | Births / 1,000 Women |
| Less than High School | 0 (0.0%) | 0.0 |
| High School Diploma | 0 (0.0%) | 0.0 |
| College or Associate's Degree | 0 (0.0%) | 0.0 |
| Bachelor's Degree | 0 (0.0%) | 0.0 |
| Graduate Degree | 0 (0.0%) | 0.0 |
| Total | 0 (0.0%) | 0.0 |
Fertility by Education by Marriage Status in Cuylerville
| Educational Attainment | Married | Unmarried |
| Less than High School | 0 (0.0%) | 0 (0.0%) |
| High School Diploma | 0 (0.0%) | 0 (0.0%) |
| College or Associate's Degree | 0 (0.0%) | 0 (0.0%) |
| Bachelor's Degree | 0 (0.0%) | 0 (0.0%) |
| Graduate Degree | 0 (0.0%) | 0 (0.0%) |
| Total | 0 (0.0%) | 0 (0.0%) |
Employment Characteristics in Cuylerville
Employment by Class of Employer in Cuylerville
Among the 178 employed individuals in Cuylerville, private company employees (74 | 41.6%), local government employees (43 | 24.2%), and federal government employees (34 | 19.1%) make up the most common classes of employment.
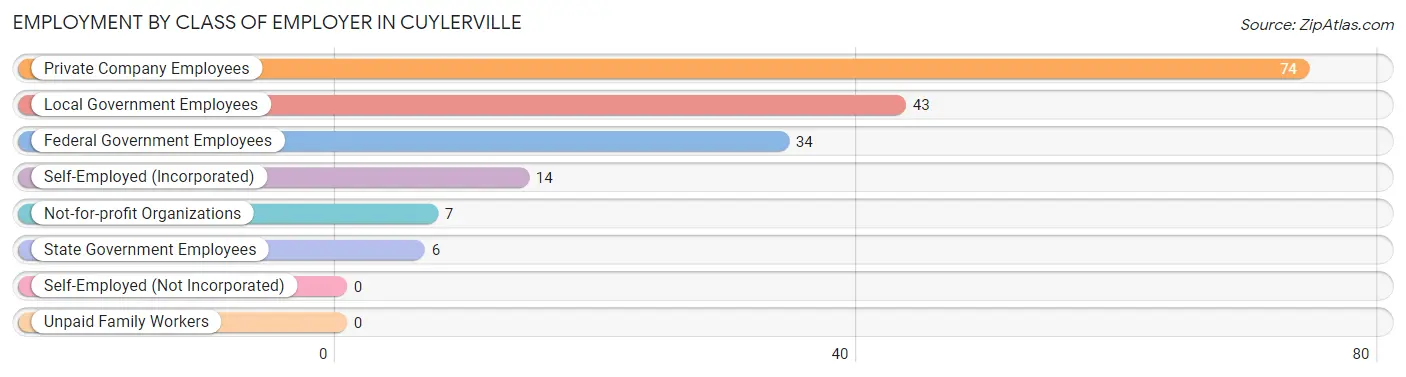
| Employer Class | # Employees | % Employees |
| Private Company Employees | 74 | 41.6% |
| Self-Employed (Incorporated) | 14 | 7.9% |
| Self-Employed (Not Incorporated) | 0 | 0.0% |
| Not-for-profit Organizations | 7 | 3.9% |
| Local Government Employees | 43 | 24.2% |
| State Government Employees | 6 | 3.4% |
| Federal Government Employees | 34 | 19.1% |
| Unpaid Family Workers | 0 | 0.0% |
| Total | 178 | 100.0% |
Employment Status by Age in Cuylerville
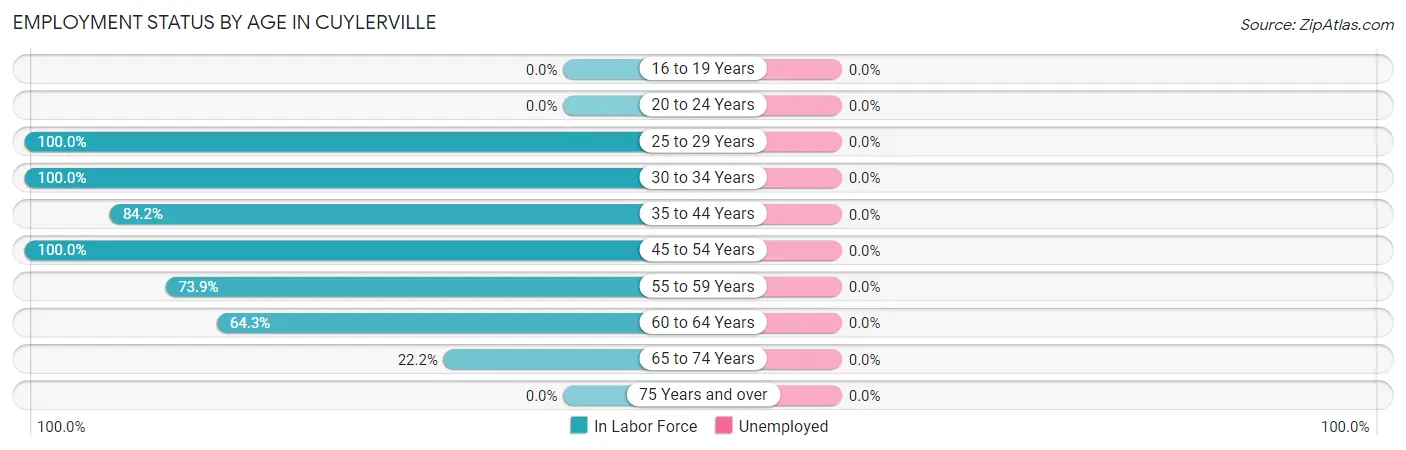
| Age Bracket | In Labor Force | Unemployed |
| 16 to 19 Years | 0 (0.0%) | 0 (0.0%) |
| 20 to 24 Years | 0 (0.0%) | 0 (0.0%) |
| 25 to 29 Years | 33 (100.0%) | 0 (0.0%) |
| 30 to 34 Years | 11 (100.0%) | 0 (0.0%) |
| 35 to 44 Years | 32 (84.2%) | 0 (0.0%) |
| 45 to 54 Years | 54 (100.0%) | 0 (0.0%) |
| 55 to 59 Years | 17 (73.9%) | 0 (0.0%) |
| 60 to 64 Years | 27 (64.3%) | 0 (0.0%) |
| 65 to 74 Years | 4 (22.2%) | 0 (0.0%) |
| 75 Years and over | 0 (0.0%) | 0 (0.0%) |
| Total | 178 (72.4%) | 0 (0.0%) |
Employment Status by Educational Attainment in Cuylerville
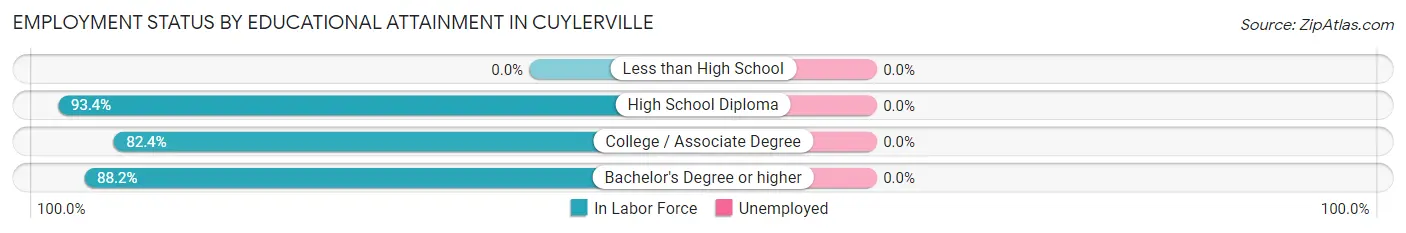
| Educational Attainment | In Labor Force | Unemployed |
| Less than High School | 0 (0.0%) | 0 (0.0%) |
| High School Diploma | 71 (93.4%) | 0 (0.0%) |
| College / Associate Degree | 28 (82.4%) | 0 (0.0%) |
| Bachelor's Degree or higher | 75 (88.2%) | 0 (0.0%) |
| Total | 174 (86.6%) | 0 (0.0%) |
Employment Occupations by Sex in Cuylerville
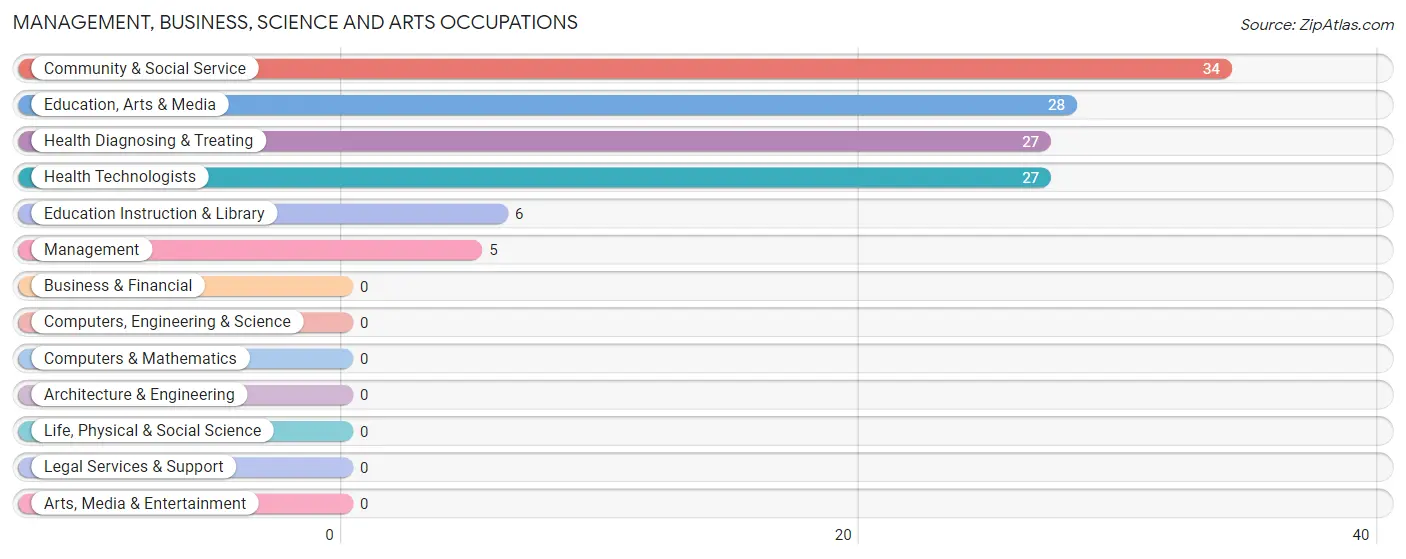
Management, Business, Science and Arts Occupations
The most common Management, Business, Science and Arts occupations in Cuylerville are Community & Social Service (34 | 19.9%), Education, Arts & Media (28 | 16.4%), Health Diagnosing & Treating (27 | 15.8%), Health Technologists (27 | 15.8%), and Education Instruction & Library (6 | 3.5%).
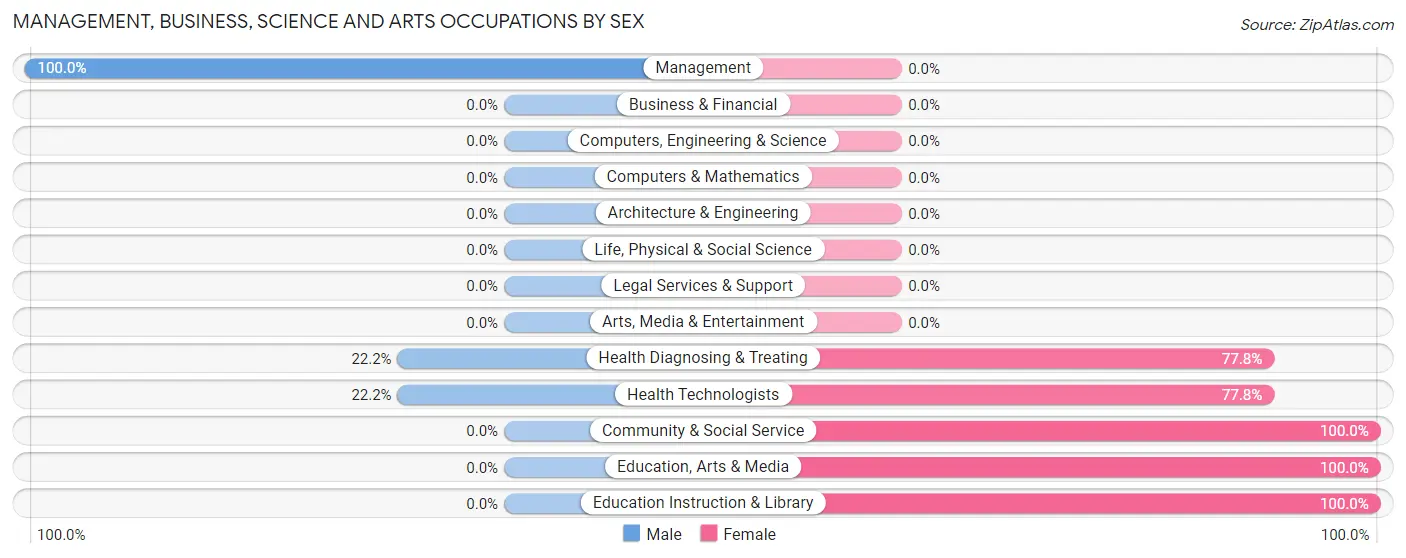
Management, Business, Science and Arts Occupations by Sex
Within the Management, Business, Science and Arts occupations in Cuylerville, the most male-oriented occupations are Management (100.0%), Health Diagnosing & Treating (22.2%), and Health Technologists (22.2%), while the most female-oriented occupations are Community & Social Service (100.0%), Education, Arts & Media (100.0%), and Education Instruction & Library (100.0%).
| Occupation | Male | Female |
| Management | 5 (100.0%) | 0 (0.0%) |
| Business & Financial | 0 (0.0%) | 0 (0.0%) |
| Computers, Engineering & Science | 0 (0.0%) | 0 (0.0%) |
| Computers & Mathematics | 0 (0.0%) | 0 (0.0%) |
| Architecture & Engineering | 0 (0.0%) | 0 (0.0%) |
| Life, Physical & Social Science | 0 (0.0%) | 0 (0.0%) |
| Community & Social Service | 0 (0.0%) | 34 (100.0%) |
| Education, Arts & Media | 0 (0.0%) | 28 (100.0%) |
| Legal Services & Support | 0 (0.0%) | 0 (0.0%) |
| Education Instruction & Library | 0 (0.0%) | 6 (100.0%) |
| Arts, Media & Entertainment | 0 (0.0%) | 0 (0.0%) |
| Health Diagnosing & Treating | 6 (22.2%) | 21 (77.8%) |
| Health Technologists | 6 (22.2%) | 21 (77.8%) |
| Total (Category) | 11 (16.7%) | 55 (83.3%) |
| Total (Overall) | 85 (49.7%) | 86 (50.3%) |
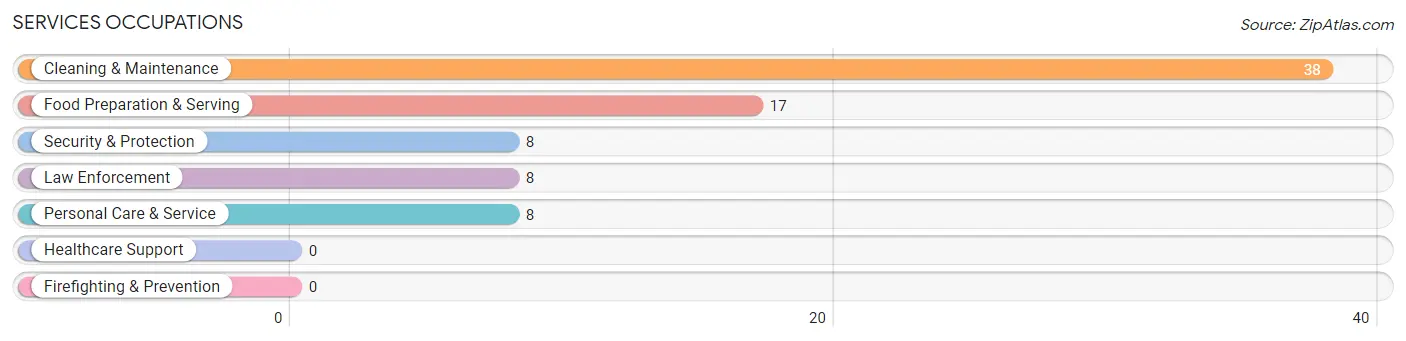
Services Occupations
The most common Services occupations in Cuylerville are Cleaning & Maintenance (38 | 22.2%), Food Preparation & Serving (17 | 9.9%), Security & Protection (8 | 4.7%), Law Enforcement (8 | 4.7%), and Personal Care & Service (8 | 4.7%).
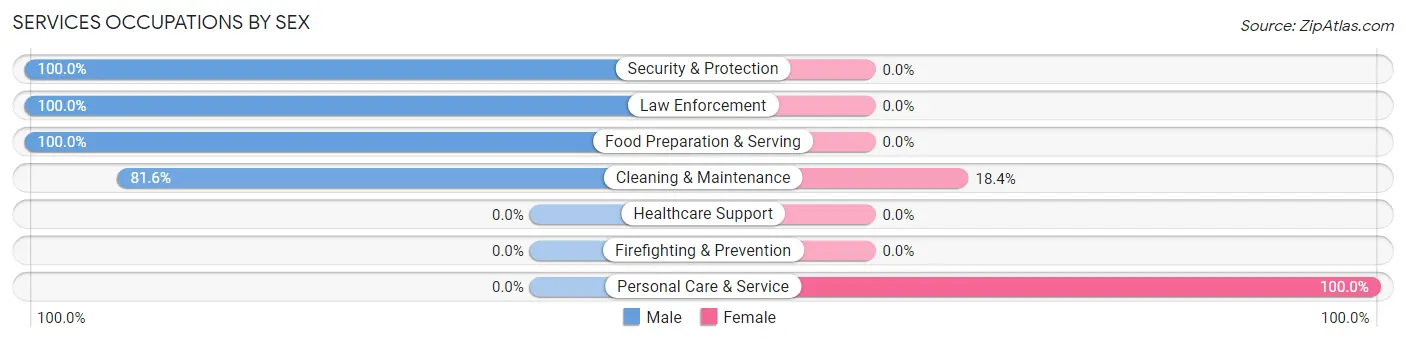
Services Occupations by Sex
Within the Services occupations in Cuylerville, the most male-oriented occupations are Security & Protection (100.0%), Law Enforcement (100.0%), and Food Preparation & Serving (100.0%), while the most female-oriented occupations are Personal Care & Service (100.0%), and Cleaning & Maintenance (18.4%).
| Occupation | Male | Female |
| Healthcare Support | 0 (0.0%) | 0 (0.0%) |
| Security & Protection | 8 (100.0%) | 0 (0.0%) |
| Firefighting & Prevention | 0 (0.0%) | 0 (0.0%) |
| Law Enforcement | 8 (100.0%) | 0 (0.0%) |
| Food Preparation & Serving | 17 (100.0%) | 0 (0.0%) |
| Cleaning & Maintenance | 31 (81.6%) | 7 (18.4%) |
| Personal Care & Service | 0 (0.0%) | 8 (100.0%) |
| Total (Category) | 56 (78.9%) | 15 (21.1%) |
| Total (Overall) | 85 (49.7%) | 86 (50.3%) |
Sales and Office Occupations
The most common Sales and Office occupations in Cuylerville are Office & Administration (17 | 9.9%), and Sales & Related (7 | 4.1%).
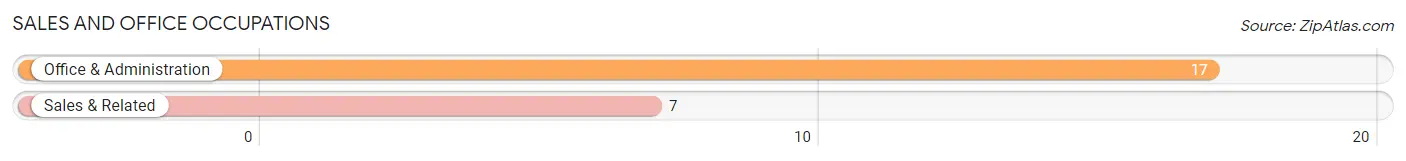
Sales and Office Occupations by Sex

| Occupation | Male | Female |
| Sales & Related | 7 (100.0%) | 0 (0.0%) |
| Office & Administration | 6 (35.3%) | 11 (64.7%) |
| Total (Category) | 13 (54.2%) | 11 (45.8%) |
| Total (Overall) | 85 (49.7%) | 86 (50.3%) |
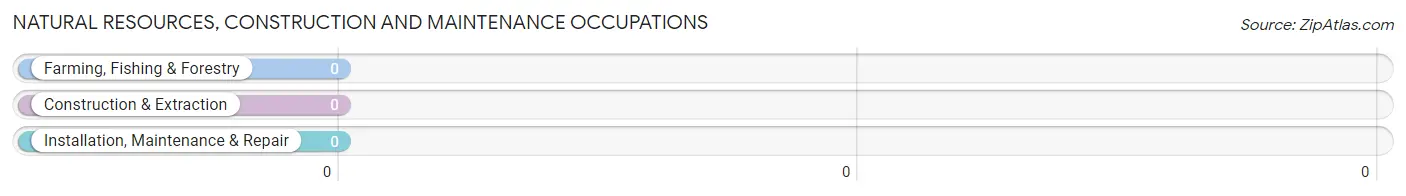
Natural Resources, Construction and Maintenance Occupations
Natural Resources, Construction and Maintenance Occupations by Sex
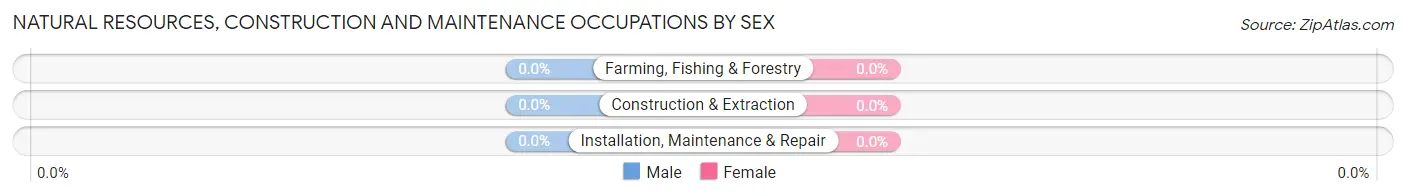
| Occupation | Male | Female |
| Farming, Fishing & Forestry | 0 (0.0%) | 0 (0.0%) |
| Construction & Extraction | 0 (0.0%) | 0 (0.0%) |
| Installation, Maintenance & Repair | 0 (0.0%) | 0 (0.0%) |
| Total (Category) | 0 (0.0%) | 0 (0.0%) |
| Total (Overall) | 85 (49.7%) | 86 (50.3%) |
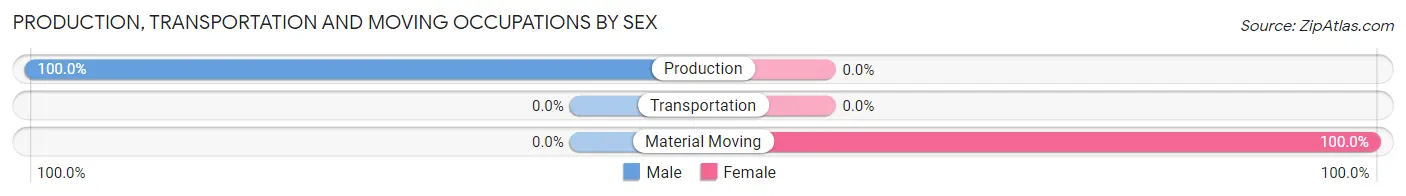
Production, Transportation and Moving Occupations
The most common Production, Transportation and Moving occupations in Cuylerville are Production (5 | 2.9%), and Material Moving (5 | 2.9%).
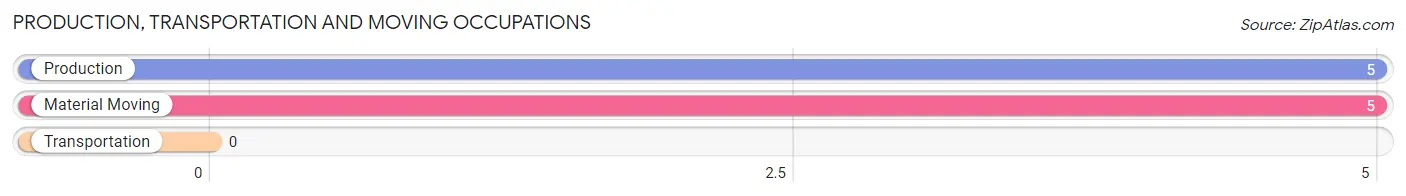
Production, Transportation and Moving Occupations by Sex
| Occupation | Male | Female |
| Production | 5 (100.0%) | 0 (0.0%) |
| Transportation | 0 (0.0%) | 0 (0.0%) |
| Material Moving | 0 (0.0%) | 5 (100.0%) |
| Total (Category) | 5 (50.0%) | 5 (50.0%) |
| Total (Overall) | 85 (49.7%) | 86 (50.3%) |
Employment Industries by Sex in Cuylerville
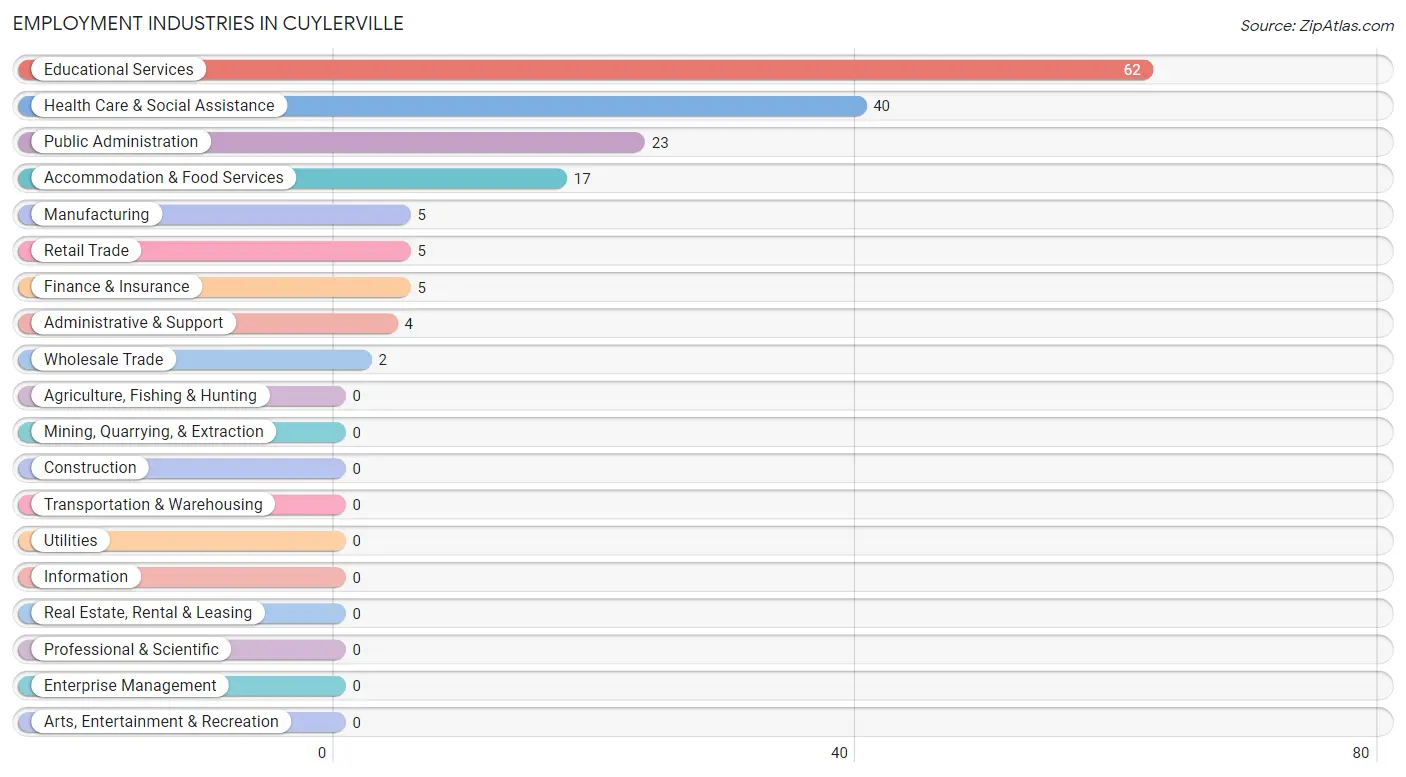
Employment Industries in Cuylerville
The major employment industries in Cuylerville include Educational Services (62 | 36.3%), Health Care & Social Assistance (40 | 23.4%), Public Administration (23 | 13.5%), Accommodation & Food Services (17 | 9.9%), and Manufacturing (5 | 2.9%).
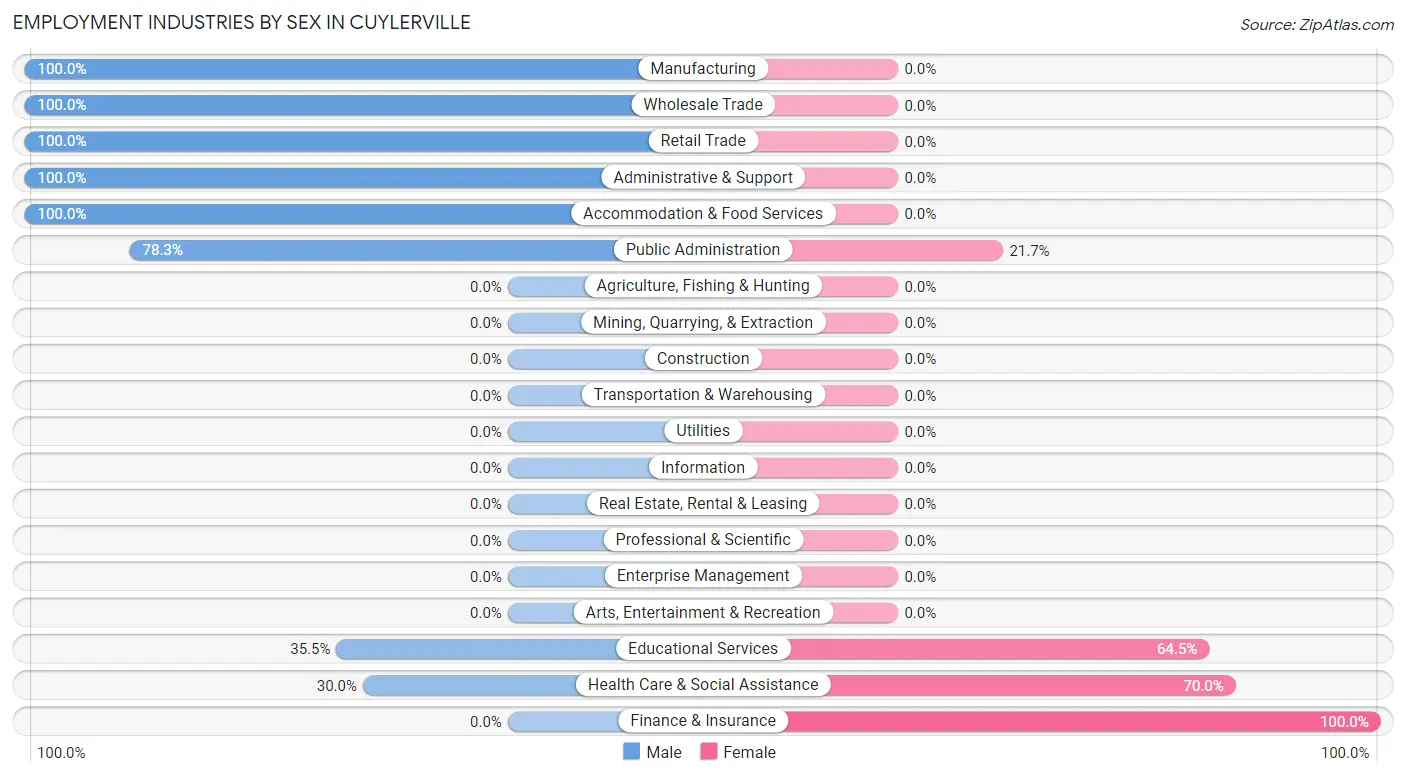
Employment Industries by Sex in Cuylerville
The Cuylerville industries that see more men than women are Manufacturing (100.0%), Wholesale Trade (100.0%), and Retail Trade (100.0%), whereas the industries that tend to have a higher number of women are Finance & Insurance (100.0%), Health Care & Social Assistance (70.0%), and Educational Services (64.5%).
| Industry | Male | Female |
| Agriculture, Fishing & Hunting | 0 (0.0%) | 0 (0.0%) |
| Mining, Quarrying, & Extraction | 0 (0.0%) | 0 (0.0%) |
| Construction | 0 (0.0%) | 0 (0.0%) |
| Manufacturing | 5 (100.0%) | 0 (0.0%) |
| Wholesale Trade | 2 (100.0%) | 0 (0.0%) |
| Retail Trade | 5 (100.0%) | 0 (0.0%) |
| Transportation & Warehousing | 0 (0.0%) | 0 (0.0%) |
| Utilities | 0 (0.0%) | 0 (0.0%) |
| Information | 0 (0.0%) | 0 (0.0%) |
| Finance & Insurance | 0 (0.0%) | 5 (100.0%) |
| Real Estate, Rental & Leasing | 0 (0.0%) | 0 (0.0%) |
| Professional & Scientific | 0 (0.0%) | 0 (0.0%) |
| Enterprise Management | 0 (0.0%) | 0 (0.0%) |
| Administrative & Support | 4 (100.0%) | 0 (0.0%) |
| Educational Services | 22 (35.5%) | 40 (64.5%) |
| Health Care & Social Assistance | 12 (30.0%) | 28 (70.0%) |
| Arts, Entertainment & Recreation | 0 (0.0%) | 0 (0.0%) |
| Accommodation & Food Services | 17 (100.0%) | 0 (0.0%) |
| Public Administration | 18 (78.3%) | 5 (21.7%) |
| Total | 85 (49.7%) | 86 (50.3%) |
Education in Cuylerville
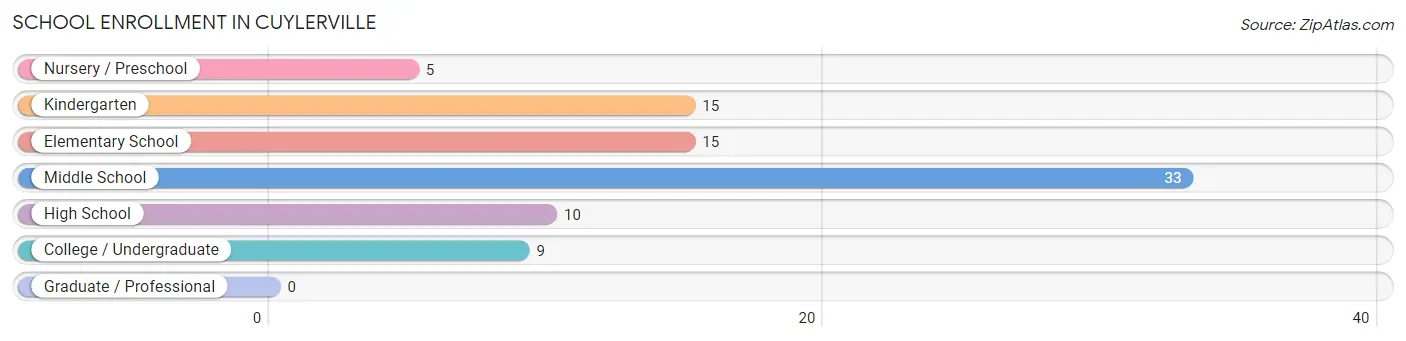
School Enrollment in Cuylerville
The most common levels of schooling among the 87 students in Cuylerville are middle school (33 | 37.9%), kindergarten (15 | 17.2%), and elementary school (15 | 17.2%).
| School Level | # Students | % Students |
| Nursery / Preschool | 5 | 5.8% |
| Kindergarten | 15 | 17.2% |
| Elementary School | 15 | 17.2% |
| Middle School | 33 | 37.9% |
| High School | 10 | 11.5% |
| College / Undergraduate | 9 | 10.3% |
| Graduate / Professional | 0 | 0.0% |
| Total | 87 | 100.0% |
School Enrollment by Age by Funding Source in Cuylerville
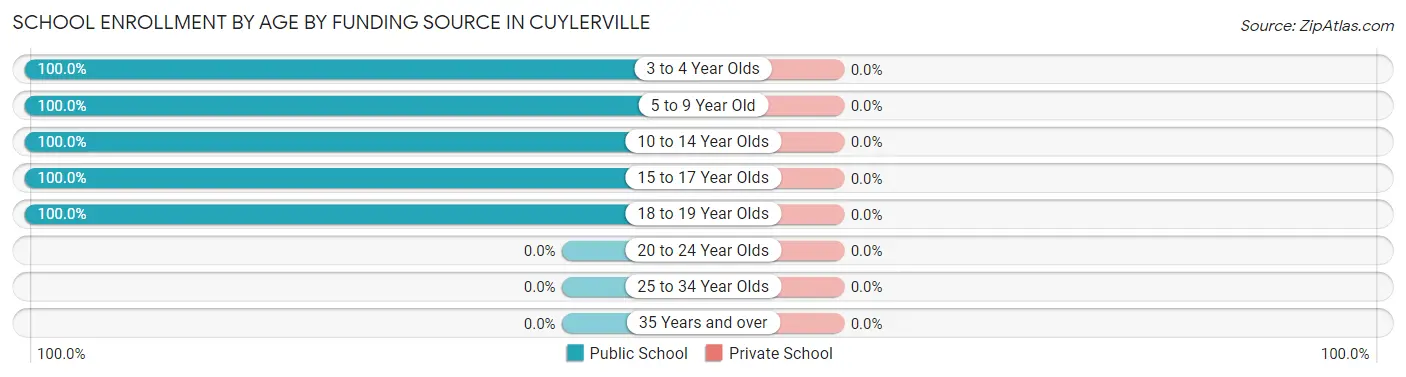
| Age Bracket | Public School | Private School |
| 3 to 4 Year Olds | 5 (100.0%) | 0 (0.0%) |
| 5 to 9 Year Old | 30 (100.0%) | 0 (0.0%) |
| 10 to 14 Year Olds | 33 (100.0%) | 0 (0.0%) |
| 15 to 17 Year Olds | 10 (100.0%) | 0 (0.0%) |
| 18 to 19 Year Olds | 9 (100.0%) | 0 (0.0%) |
| 20 to 24 Year Olds | 0 (0.0%) | 0 (0.0%) |
| 25 to 34 Year Olds | 0 (0.0%) | 0 (0.0%) |
| 35 Years and over | 0 (0.0%) | 0 (0.0%) |
| Total | 87 (100.0%) | 0 (0.0%) |
Educational Attainment by Field of Study in Cuylerville
Business (30 | 33.7%), bio, nature & agricultural (21 | 23.6%), education (11 | 12.4%), arts & humanities (11 | 12.4%), and science & technology (6 | 6.7%) are the most common fields of study among 89 individuals in Cuylerville who have obtained a bachelor's degree or higher.
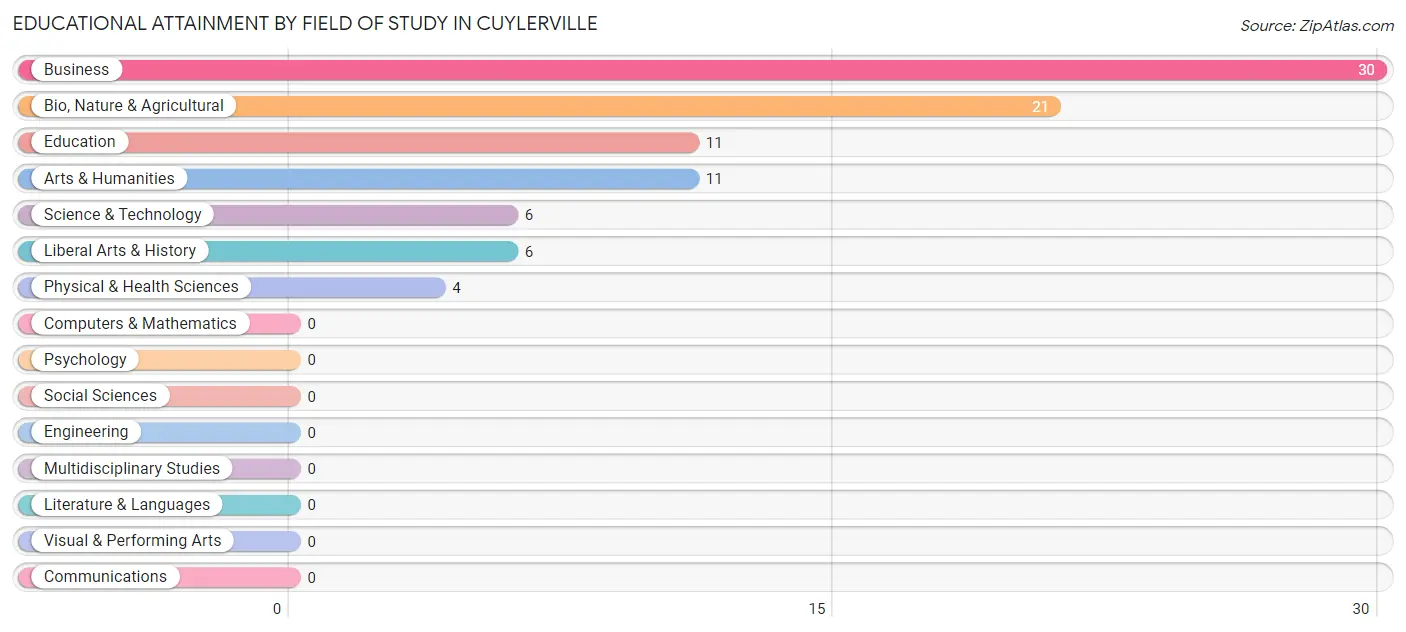
| Field of Study | # Graduates | % Graduates |
| Computers & Mathematics | 0 | 0.0% |
| Bio, Nature & Agricultural | 21 | 23.6% |
| Physical & Health Sciences | 4 | 4.5% |
| Psychology | 0 | 0.0% |
| Social Sciences | 0 | 0.0% |
| Engineering | 0 | 0.0% |
| Multidisciplinary Studies | 0 | 0.0% |
| Science & Technology | 6 | 6.7% |
| Business | 30 | 33.7% |
| Education | 11 | 12.4% |
| Literature & Languages | 0 | 0.0% |
| Liberal Arts & History | 6 | 6.7% |
| Visual & Performing Arts | 0 | 0.0% |
| Communications | 0 | 0.0% |
| Arts & Humanities | 11 | 12.4% |
| Total | 89 | 100.0% |
Transportation & Commute in Cuylerville
Vehicle Availability by Sex in Cuylerville
The most prevalent vehicle ownership categories in Cuylerville are males with 2 vehicles (52, accounting for 56.5%) and females with 2 vehicles (48, making up 60.5%).
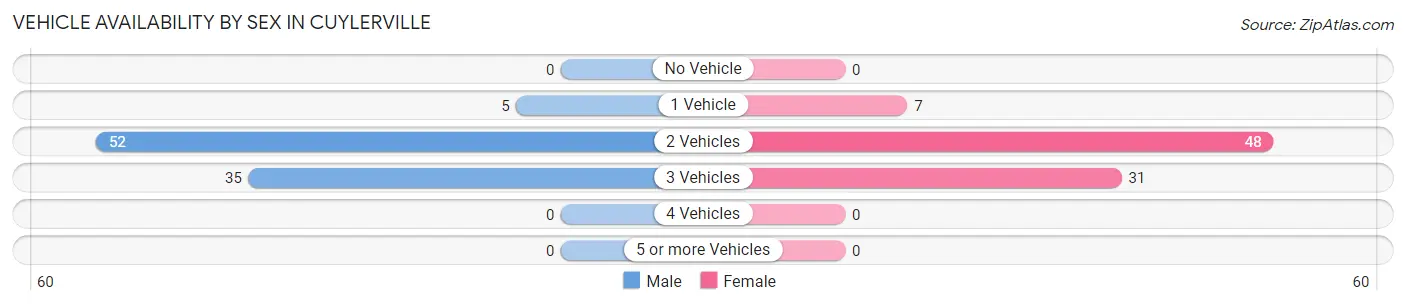
| Vehicles Available | Male | Female |
| No Vehicle | 0 (0.0%) | 0 (0.0%) |
| 1 Vehicle | 5 (5.4%) | 7 (8.1%) |
| 2 Vehicles | 52 (56.5%) | 48 (55.8%) |
| 3 Vehicles | 35 (38.0%) | 31 (36.0%) |
| 4 Vehicles | 0 (0.0%) | 0 (0.0%) |
| 5 or more Vehicles | 0 (0.0%) | 0 (0.0%) |
| Total | 92 (100.0%) | 86 (100.0%) |
Commute Time in Cuylerville
The most frequently occuring commute durations in Cuylerville are 10 to 14 minutes (95 commuters, 54.0%), 40 to 44 minutes (28 commuters, 15.9%), and 5 to 9 minutes (18 commuters, 10.2%).
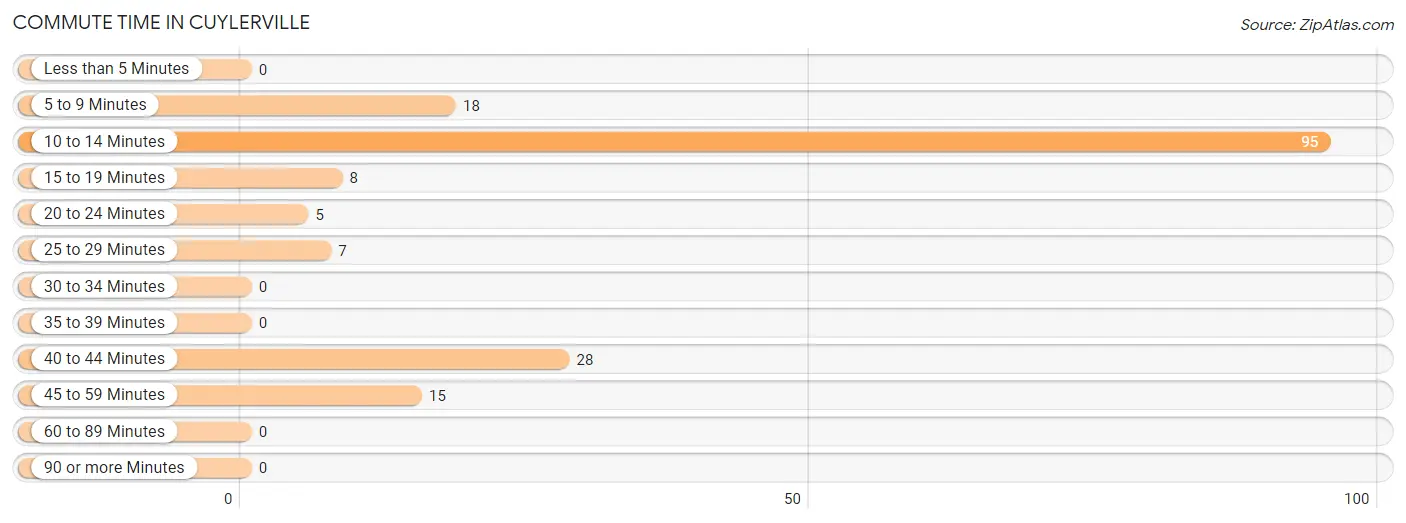
| Commute Time | # Commuters | % Commuters |
| Less than 5 Minutes | 0 | 0.0% |
| 5 to 9 Minutes | 18 | 10.2% |
| 10 to 14 Minutes | 95 | 54.0% |
| 15 to 19 Minutes | 8 | 4.5% |
| 20 to 24 Minutes | 5 | 2.8% |
| 25 to 29 Minutes | 7 | 4.0% |
| 30 to 34 Minutes | 0 | 0.0% |
| 35 to 39 Minutes | 0 | 0.0% |
| 40 to 44 Minutes | 28 | 15.9% |
| 45 to 59 Minutes | 15 | 8.5% |
| 60 to 89 Minutes | 0 | 0.0% |
| 90 or more Minutes | 0 | 0.0% |
Commute Time by Sex in Cuylerville
The most common commute times in Cuylerville are 10 to 14 minutes (44 commuters, 48.9%) for males and 10 to 14 minutes (51 commuters, 59.3%) for females.
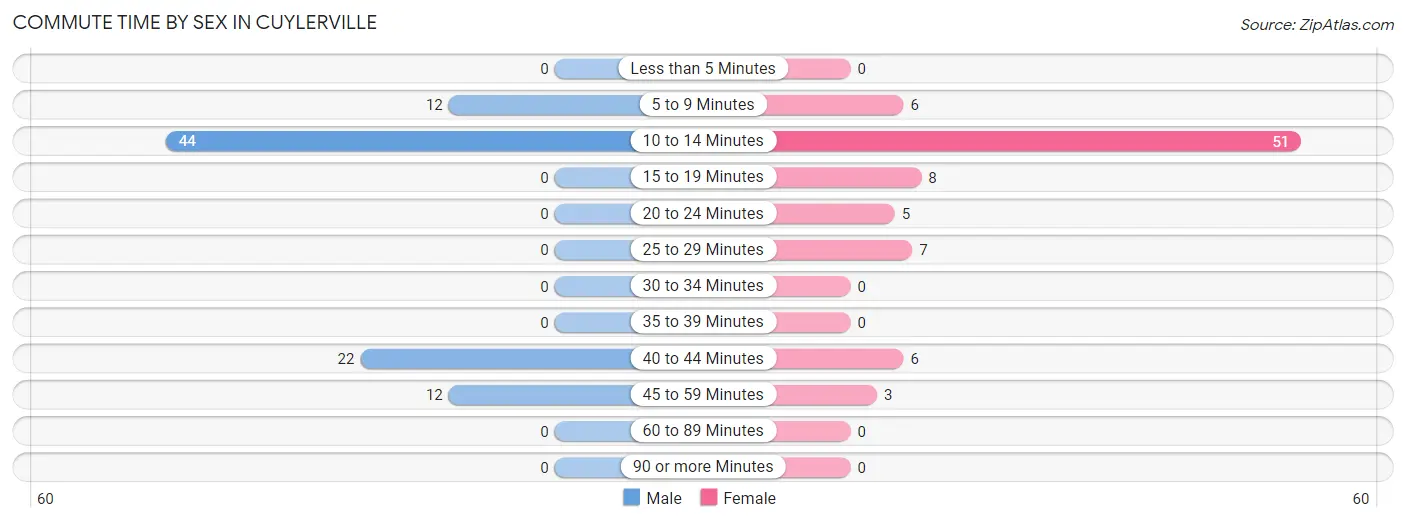
| Commute Time | Male | Female |
| Less than 5 Minutes | 0 (0.0%) | 0 (0.0%) |
| 5 to 9 Minutes | 12 (13.3%) | 6 (7.0%) |
| 10 to 14 Minutes | 44 (48.9%) | 51 (59.3%) |
| 15 to 19 Minutes | 0 (0.0%) | 8 (9.3%) |
| 20 to 24 Minutes | 0 (0.0%) | 5 (5.8%) |
| 25 to 29 Minutes | 0 (0.0%) | 7 (8.1%) |
| 30 to 34 Minutes | 0 (0.0%) | 0 (0.0%) |
| 35 to 39 Minutes | 0 (0.0%) | 0 (0.0%) |
| 40 to 44 Minutes | 22 (24.4%) | 6 (7.0%) |
| 45 to 59 Minutes | 12 (13.3%) | 3 (3.5%) |
| 60 to 89 Minutes | 0 (0.0%) | 0 (0.0%) |
| 90 or more Minutes | 0 (0.0%) | 0 (0.0%) |
Time of Departure to Work by Sex in Cuylerville
The most frequent times of departure to work in Cuylerville are 10:00 AM to 10:59 AM (22, 24.4%) for males and 8:30 AM to 8:59 AM (38, 44.2%) for females.
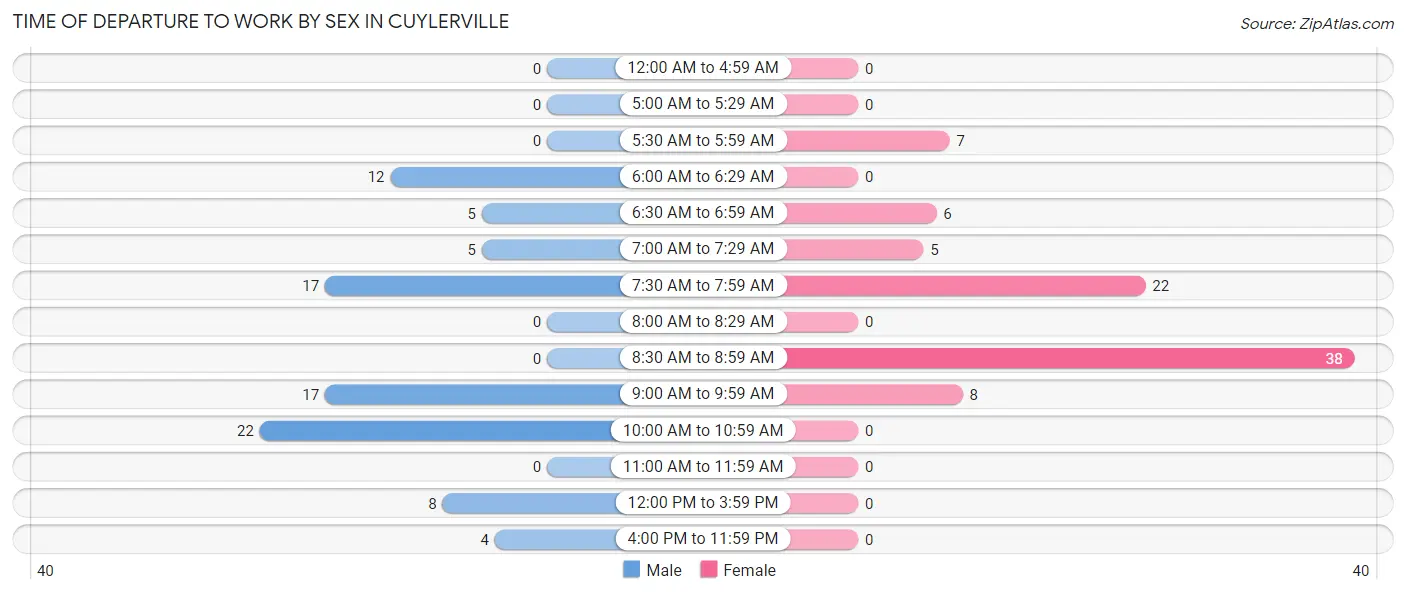
| Time of Departure | Male | Female |
| 12:00 AM to 4:59 AM | 0 (0.0%) | 0 (0.0%) |
| 5:00 AM to 5:29 AM | 0 (0.0%) | 0 (0.0%) |
| 5:30 AM to 5:59 AM | 0 (0.0%) | 7 (8.1%) |
| 6:00 AM to 6:29 AM | 12 (13.3%) | 0 (0.0%) |
| 6:30 AM to 6:59 AM | 5 (5.6%) | 6 (7.0%) |
| 7:00 AM to 7:29 AM | 5 (5.6%) | 5 (5.8%) |
| 7:30 AM to 7:59 AM | 17 (18.9%) | 22 (25.6%) |
| 8:00 AM to 8:29 AM | 0 (0.0%) | 0 (0.0%) |
| 8:30 AM to 8:59 AM | 0 (0.0%) | 38 (44.2%) |
| 9:00 AM to 9:59 AM | 17 (18.9%) | 8 (9.3%) |
| 10:00 AM to 10:59 AM | 22 (24.4%) | 0 (0.0%) |
| 11:00 AM to 11:59 AM | 0 (0.0%) | 0 (0.0%) |
| 12:00 PM to 3:59 PM | 8 (8.9%) | 0 (0.0%) |
| 4:00 PM to 11:59 PM | 4 (4.4%) | 0 (0.0%) |
| Total | 90 (100.0%) | 86 (100.0%) |
Housing Occupancy in Cuylerville
Occupancy by Ownership in Cuylerville
Of the total 125 dwellings in Cuylerville, owner-occupied units account for 103 (82.4%), while renter-occupied units make up 22 (17.6%).
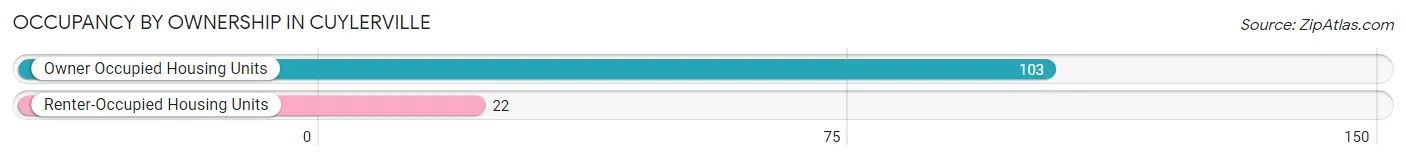
| Occupancy | # Housing Units | % Housing Units |
| Owner Occupied Housing Units | 103 | 82.4% |
| Renter-Occupied Housing Units | 22 | 17.6% |
| Total Occupied Housing Units | 125 | 100.0% |
Occupancy by Household Size in Cuylerville
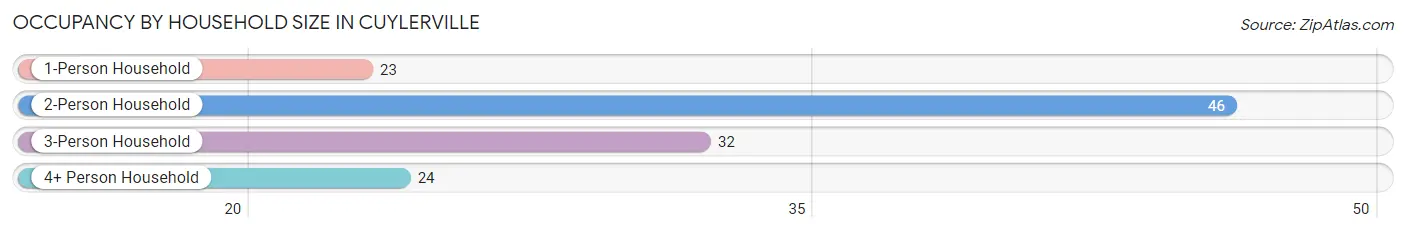
| Household Size | # Housing Units | % Housing Units |
| 1-Person Household | 23 | 18.4% |
| 2-Person Household | 46 | 36.8% |
| 3-Person Household | 32 | 25.6% |
| 4+ Person Household | 24 | 19.2% |
| Total Housing Units | 125 | 100.0% |
Occupancy by Ownership by Household Size in Cuylerville
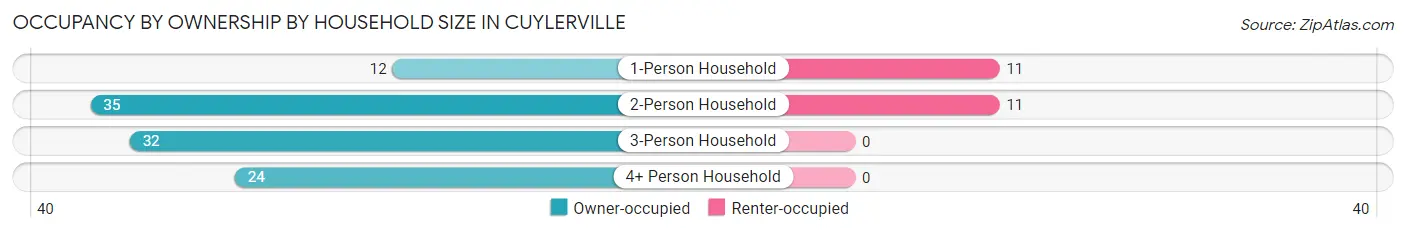
| Household Size | Owner-occupied | Renter-occupied |
| 1-Person Household | 12 (52.2%) | 11 (47.8%) |
| 2-Person Household | 35 (76.1%) | 11 (23.9%) |
| 3-Person Household | 32 (100.0%) | 0 (0.0%) |
| 4+ Person Household | 24 (100.0%) | 0 (0.0%) |
| Total Housing Units | 103 (82.4%) | 22 (17.6%) |
Occupancy by Educational Attainment in Cuylerville
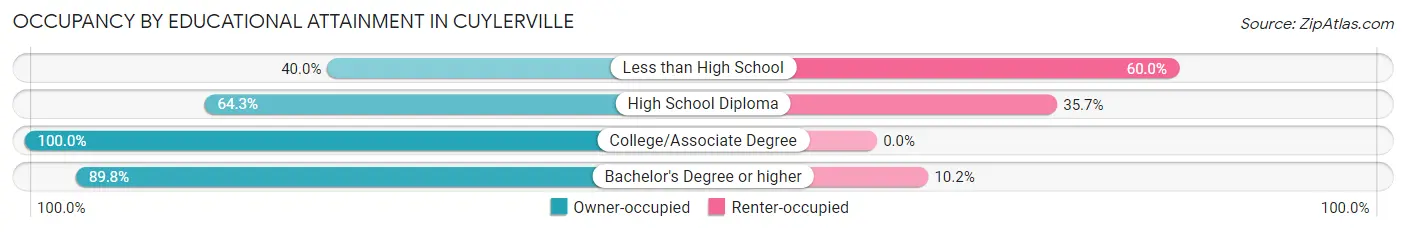
| Household Size | Owner-occupied | Renter-occupied |
| Less than High School | 4 (40.0%) | 6 (60.0%) |
| High School Diploma | 18 (64.3%) | 10 (35.7%) |
| College/Associate Degree | 28 (100.0%) | 0 (0.0%) |
| Bachelor's Degree or higher | 53 (89.8%) | 6 (10.2%) |
Occupancy by Age of Householder in Cuylerville
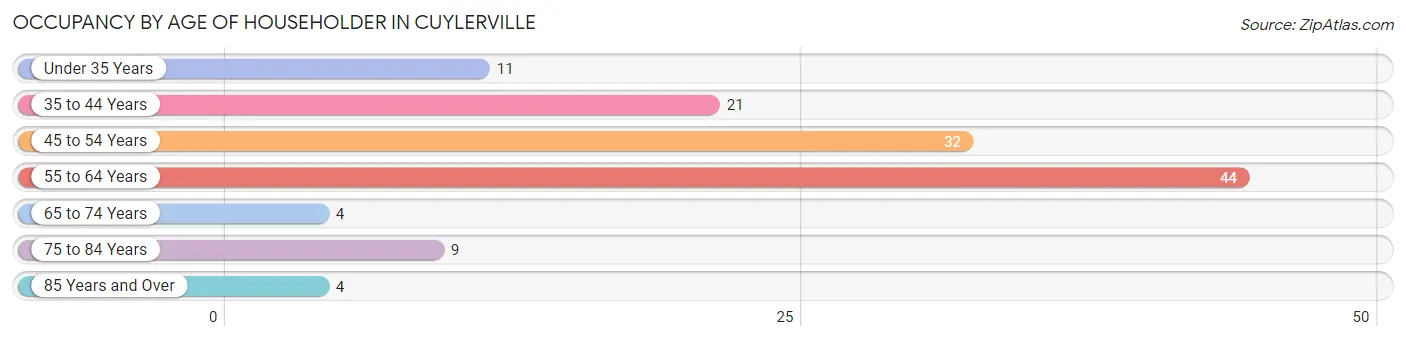
| Age Bracket | # Households | % Households |
| Under 35 Years | 11 | 8.8% |
| 35 to 44 Years | 21 | 16.8% |
| 45 to 54 Years | 32 | 25.6% |
| 55 to 64 Years | 44 | 35.2% |
| 65 to 74 Years | 4 | 3.2% |
| 75 to 84 Years | 9 | 7.2% |
| 85 Years and Over | 4 | 3.2% |
| Total | 125 | 100.0% |
Housing Finances in Cuylerville
Median Income by Occupancy in Cuylerville
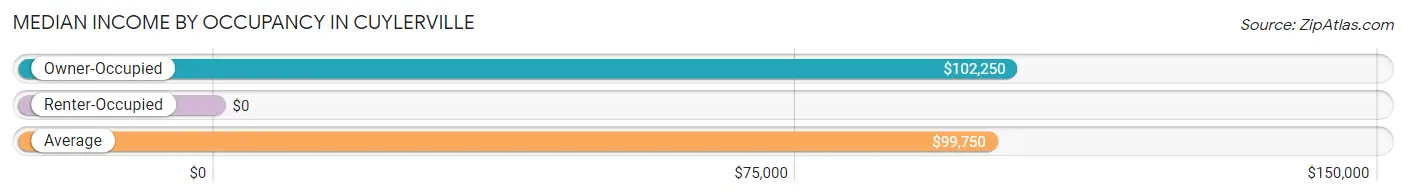
| Occupancy Type | # Households | Median Income |
| Owner-Occupied | 103 (82.4%) | $102,250 |
| Renter-Occupied | 22 (17.6%) | $0 |
| Average | 125 (100.0%) | $99,750 |
Occupancy by Householder Income Bracket in Cuylerville
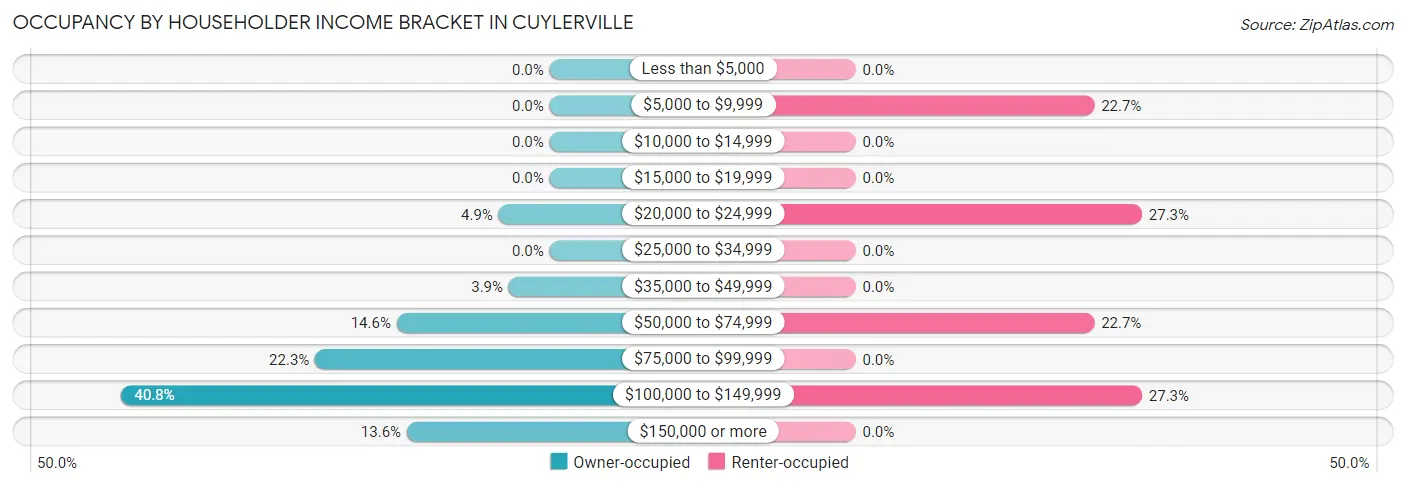
| Income Bracket | Owner-occupied | Renter-occupied |
| Less than $5,000 | 0 (0.0%) | 0 (0.0%) |
| $5,000 to $9,999 | 0 (0.0%) | 5 (22.7%) |
| $10,000 to $14,999 | 0 (0.0%) | 0 (0.0%) |
| $15,000 to $19,999 | 0 (0.0%) | 0 (0.0%) |
| $20,000 to $24,999 | 5 (4.9%) | 6 (27.3%) |
| $25,000 to $34,999 | 0 (0.0%) | 0 (0.0%) |
| $35,000 to $49,999 | 4 (3.9%) | 0 (0.0%) |
| $50,000 to $74,999 | 15 (14.6%) | 5 (22.7%) |
| $75,000 to $99,999 | 23 (22.3%) | 0 (0.0%) |
| $100,000 to $149,999 | 42 (40.8%) | 6 (27.3%) |
| $150,000 or more | 14 (13.6%) | 0 (0.0%) |
| Total | 103 (100.0%) | 22 (100.0%) |
Monthly Housing Cost Tiers in Cuylerville
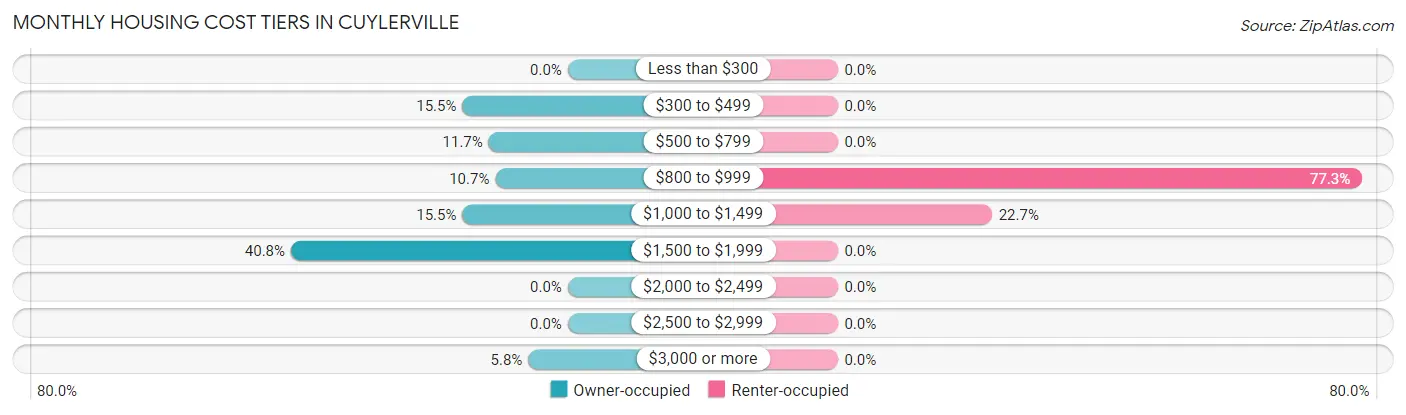
| Monthly Cost | Owner-occupied | Renter-occupied |
| Less than $300 | 0 (0.0%) | 0 (0.0%) |
| $300 to $499 | 16 (15.5%) | 0 (0.0%) |
| $500 to $799 | 12 (11.7%) | 0 (0.0%) |
| $800 to $999 | 11 (10.7%) | 17 (77.3%) |
| $1,000 to $1,499 | 16 (15.5%) | 5 (22.7%) |
| $1,500 to $1,999 | 42 (40.8%) | 0 (0.0%) |
| $2,000 to $2,499 | 0 (0.0%) | 0 (0.0%) |
| $2,500 to $2,999 | 0 (0.0%) | 0 (0.0%) |
| $3,000 or more | 6 (5.8%) | 0 (0.0%) |
| Total | 103 (100.0%) | 22 (100.0%) |
Physical Housing Characteristics in Cuylerville
Housing Structures in Cuylerville
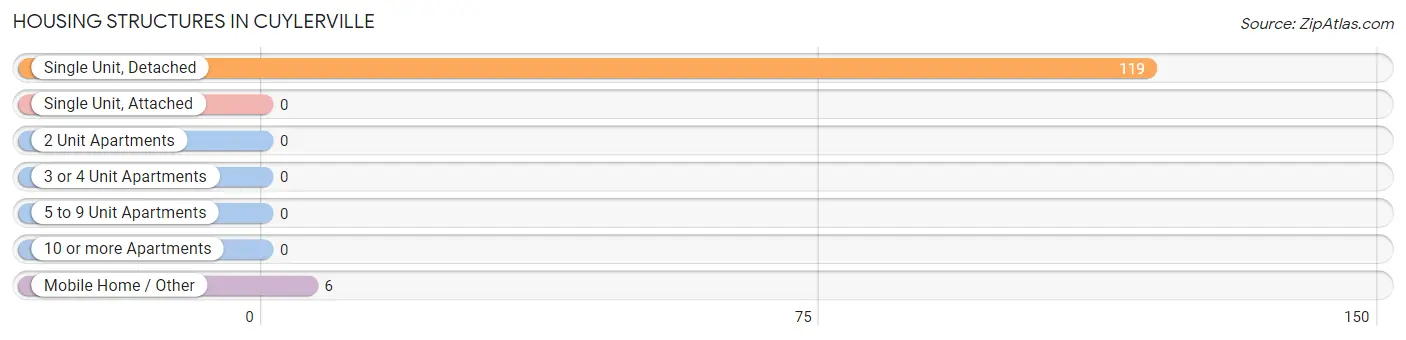
| Structure Type | # Housing Units | % Housing Units |
| Single Unit, Detached | 119 | 95.2% |
| Single Unit, Attached | 0 | 0.0% |
| 2 Unit Apartments | 0 | 0.0% |
| 3 or 4 Unit Apartments | 0 | 0.0% |
| 5 to 9 Unit Apartments | 0 | 0.0% |
| 10 or more Apartments | 0 | 0.0% |
| Mobile Home / Other | 6 | 4.8% |
| Total | 125 | 100.0% |
Housing Structures by Occupancy in Cuylerville
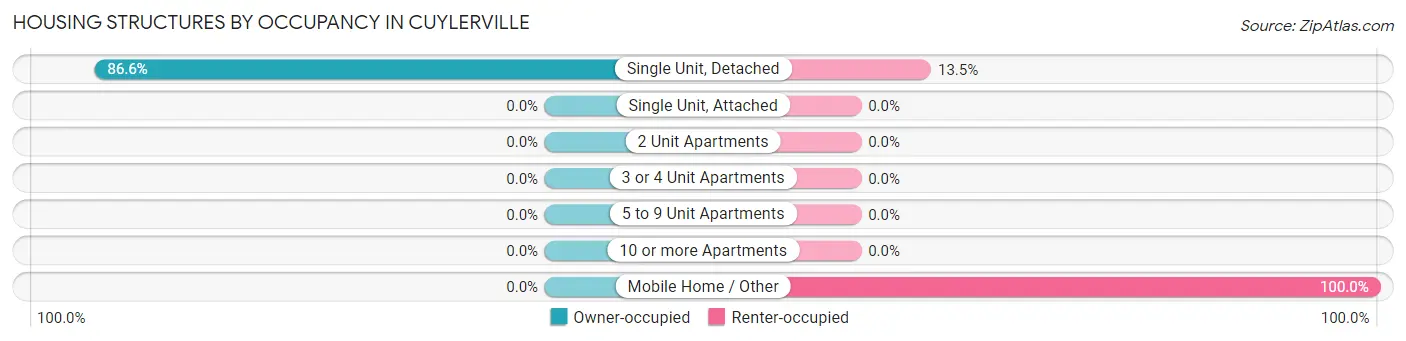
| Structure Type | Owner-occupied | Renter-occupied |
| Single Unit, Detached | 103 (86.6%) | 16 (13.5%) |
| Single Unit, Attached | 0 (0.0%) | 0 (0.0%) |
| 2 Unit Apartments | 0 (0.0%) | 0 (0.0%) |
| 3 or 4 Unit Apartments | 0 (0.0%) | 0 (0.0%) |
| 5 to 9 Unit Apartments | 0 (0.0%) | 0 (0.0%) |
| 10 or more Apartments | 0 (0.0%) | 0 (0.0%) |
| Mobile Home / Other | 0 (0.0%) | 6 (100.0%) |
| Total | 103 (82.4%) | 22 (17.6%) |
Housing Structures by Number of Rooms in Cuylerville
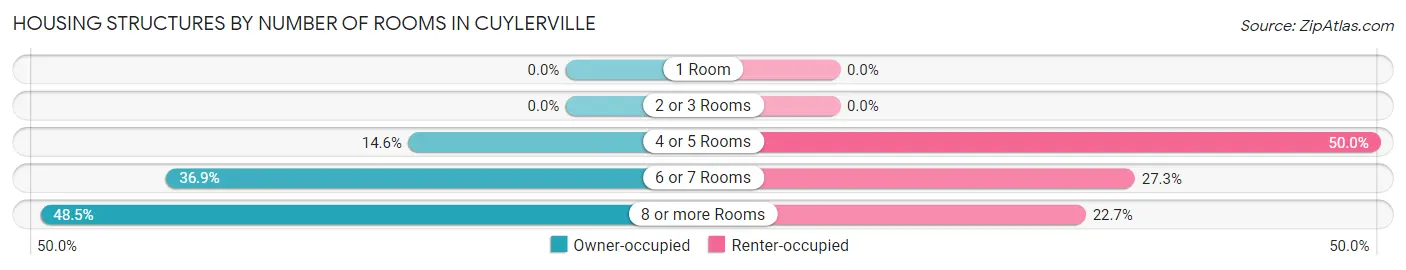
| Number of Rooms | Owner-occupied | Renter-occupied |
| 1 Room | 0 (0.0%) | 0 (0.0%) |
| 2 or 3 Rooms | 0 (0.0%) | 0 (0.0%) |
| 4 or 5 Rooms | 15 (14.6%) | 11 (50.0%) |
| 6 or 7 Rooms | 38 (36.9%) | 6 (27.3%) |
| 8 or more Rooms | 50 (48.5%) | 5 (22.7%) |
| Total | 103 (100.0%) | 22 (100.0%) |
Housing Structure by Heating Type in Cuylerville
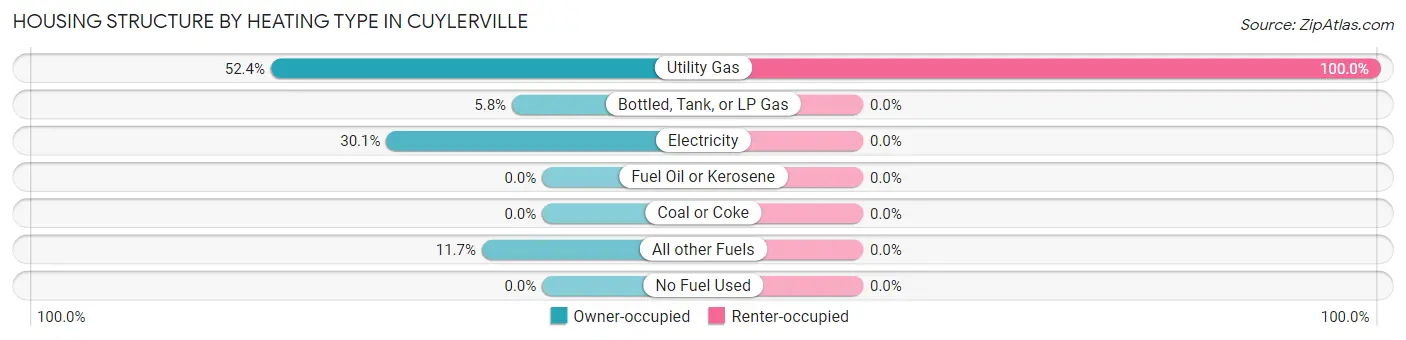
| Heating Type | Owner-occupied | Renter-occupied |
| Utility Gas | 54 (52.4%) | 22 (100.0%) |
| Bottled, Tank, or LP Gas | 6 (5.8%) | 0 (0.0%) |
| Electricity | 31 (30.1%) | 0 (0.0%) |
| Fuel Oil or Kerosene | 0 (0.0%) | 0 (0.0%) |
| Coal or Coke | 0 (0.0%) | 0 (0.0%) |
| All other Fuels | 12 (11.7%) | 0 (0.0%) |
| No Fuel Used | 0 (0.0%) | 0 (0.0%) |
| Total | 103 (100.0%) | 22 (100.0%) |
Household Vehicle Usage in Cuylerville
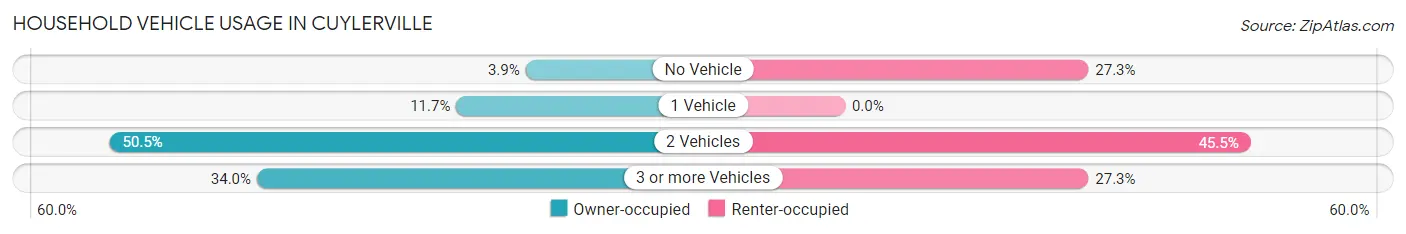
| Vehicles per Household | Owner-occupied | Renter-occupied |
| No Vehicle | 4 (3.9%) | 6 (27.3%) |
| 1 Vehicle | 12 (11.7%) | 0 (0.0%) |
| 2 Vehicles | 52 (50.5%) | 10 (45.5%) |
| 3 or more Vehicles | 35 (34.0%) | 6 (27.3%) |
| Total | 103 (100.0%) | 22 (100.0%) |
Real Estate & Mortgages in Cuylerville
Real Estate and Mortgage Overview in Cuylerville
| Characteristic | Without Mortgage | With Mortgage |
| Housing Units | 27 | 76 |
| Median Property Value | $109,400 | $270,000 |
| Median Household Income | $101,750 | $14 |
| Monthly Housing Costs | - | - |
| Real Estate Taxes | - | - |
Property Value by Mortgage Status in Cuylerville
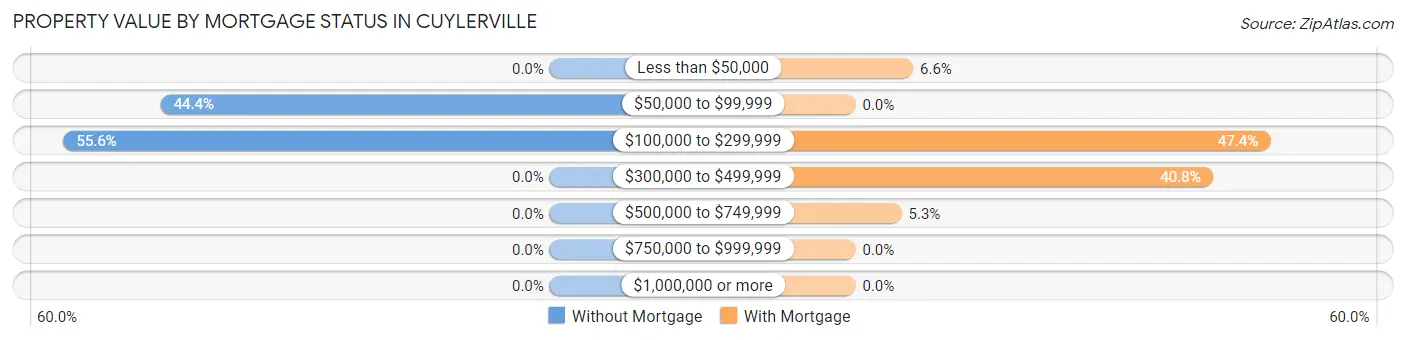
| Property Value | Without Mortgage | With Mortgage |
| Less than $50,000 | 0 (0.0%) | 5 (6.6%) |
| $50,000 to $99,999 | 12 (44.4%) | 0 (0.0%) |
| $100,000 to $299,999 | 15 (55.6%) | 36 (47.4%) |
| $300,000 to $499,999 | 0 (0.0%) | 31 (40.8%) |
| $500,000 to $749,999 | 0 (0.0%) | 4 (5.3%) |
| $750,000 to $999,999 | 0 (0.0%) | 0 (0.0%) |
| $1,000,000 or more | 0 (0.0%) | 0 (0.0%) |
| Total | 27 (100.0%) | 76 (100.0%) |
Household Income by Mortgage Status in Cuylerville
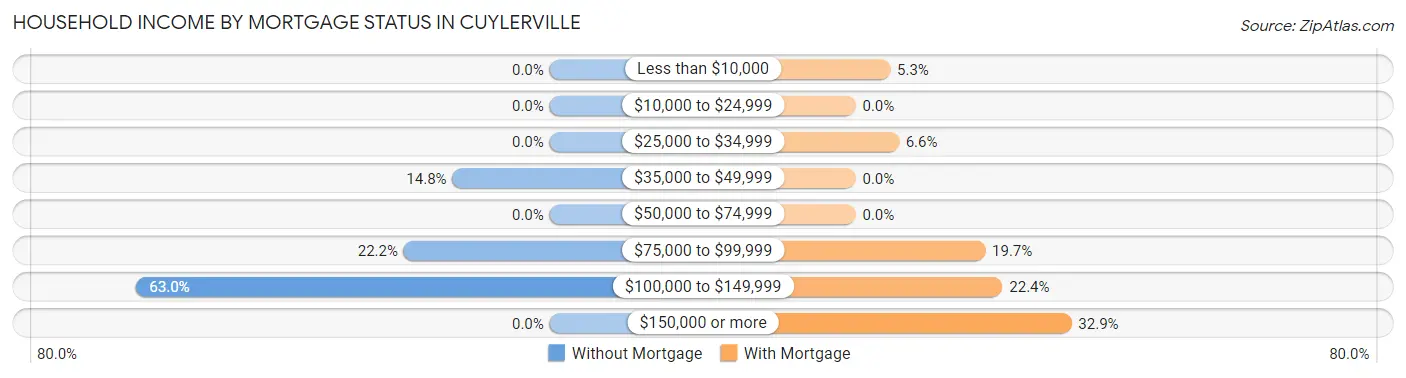
| Household Income | Without Mortgage | With Mortgage |
| Less than $10,000 | 0 (0.0%) | 4 (5.3%) |
| $10,000 to $24,999 | 0 (0.0%) | 0 (0.0%) |
| $25,000 to $34,999 | 0 (0.0%) | 5 (6.6%) |
| $35,000 to $49,999 | 4 (14.8%) | 0 (0.0%) |
| $50,000 to $74,999 | 0 (0.0%) | 0 (0.0%) |
| $75,000 to $99,999 | 6 (22.2%) | 15 (19.7%) |
| $100,000 to $149,999 | 17 (63.0%) | 17 (22.4%) |
| $150,000 or more | 0 (0.0%) | 25 (32.9%) |
| Total | 27 (100.0%) | 76 (100.0%) |
Property Value to Household Income Ratio in Cuylerville
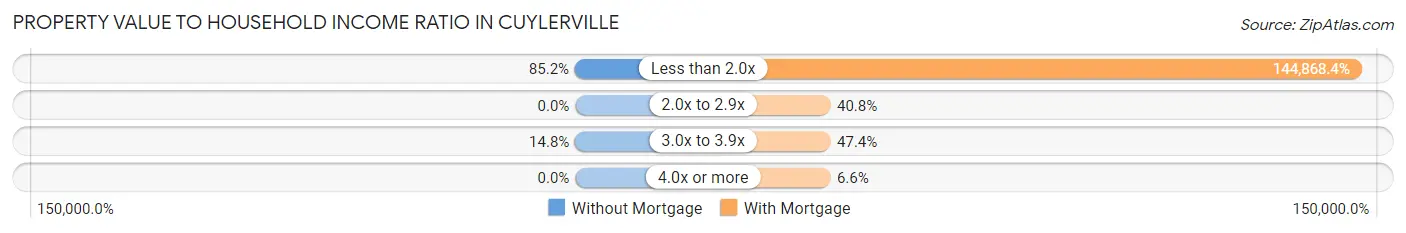
| Value-to-Income Ratio | Without Mortgage | With Mortgage |
| Less than 2.0x | 23 (85.2%) | 110,100 (144,868.4%) |
| 2.0x to 2.9x | 0 (0.0%) | 31 (40.8%) |
| 3.0x to 3.9x | 4 (14.8%) | 36 (47.4%) |
| 4.0x or more | 0 (0.0%) | 5 (6.6%) |
| Total | 27 (100.0%) | 76 (100.0%) |
Real Estate Taxes by Mortgage Status in Cuylerville
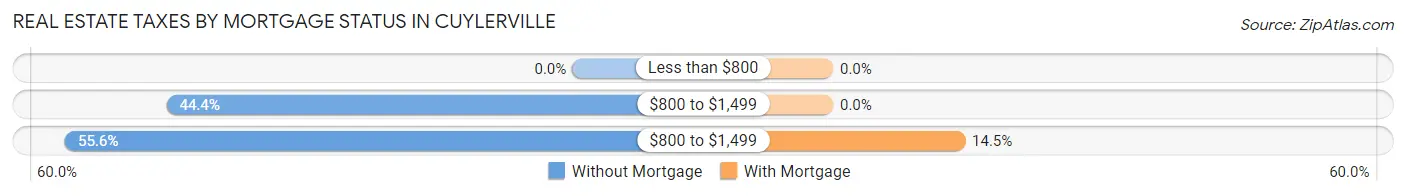
| Property Taxes | Without Mortgage | With Mortgage |
| Less than $800 | 0 (0.0%) | 0 (0.0%) |
| $800 to $1,499 | 12 (44.4%) | 0 (0.0%) |
| $800 to $1,499 | 15 (55.6%) | 11 (14.5%) |
| Total | 27 (100.0%) | 76 (100.0%) |
Health & Disability in Cuylerville
Health Insurance Coverage by Age in Cuylerville
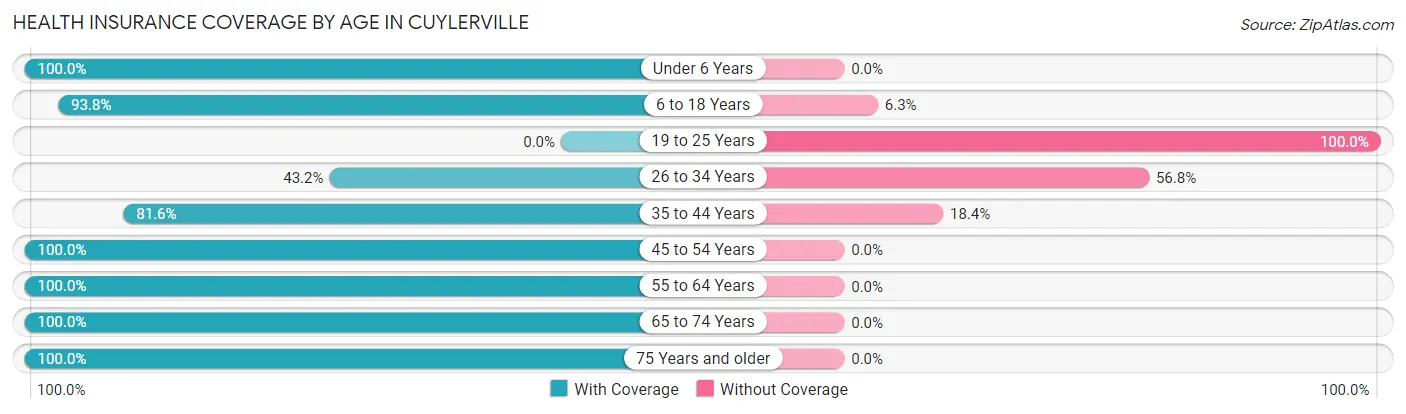
| Age Bracket | With Coverage | Without Coverage |
| Under 6 Years | 14 (100.0%) | 0 (0.0%) |
| 6 to 18 Years | 60 (93.8%) | 4 (6.2%) |
| 19 to 25 Years | 0 (0.0%) | 9 (100.0%) |
| 26 to 34 Years | 19 (43.2%) | 25 (56.8%) |
| 35 to 44 Years | 31 (81.6%) | 7 (18.4%) |
| 45 to 54 Years | 54 (100.0%) | 0 (0.0%) |
| 55 to 64 Years | 58 (100.0%) | 0 (0.0%) |
| 65 to 74 Years | 18 (100.0%) | 0 (0.0%) |
| 75 Years and older | 18 (100.0%) | 0 (0.0%) |
| Total | 272 (85.8%) | 45 (14.2%) |
Health Insurance Coverage by Citizenship Status in Cuylerville
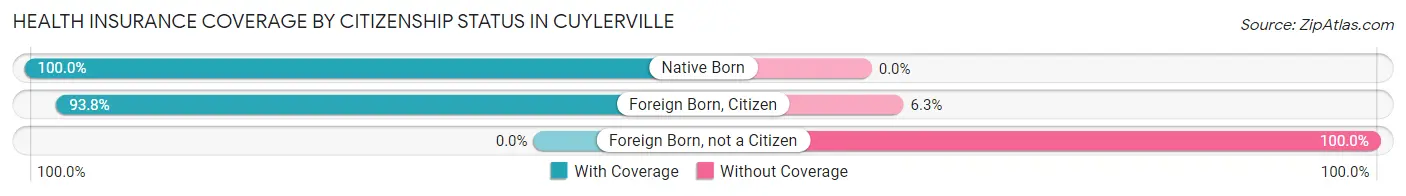
| Citizenship Status | With Coverage | Without Coverage |
| Native Born | 14 (100.0%) | 0 (0.0%) |
| Foreign Born, Citizen | 60 (93.8%) | 4 (6.2%) |
| Foreign Born, not a Citizen | 0 (0.0%) | 9 (100.0%) |
Health Insurance Coverage by Household Income in Cuylerville
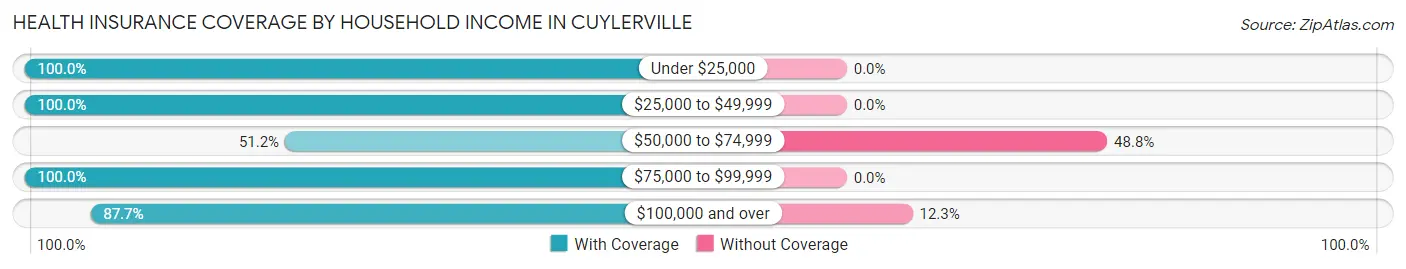
| Household Income | With Coverage | Without Coverage |
| Under $25,000 | 20 (100.0%) | 0 (0.0%) |
| $25,000 to $49,999 | 9 (100.0%) | 0 (0.0%) |
| $50,000 to $74,999 | 21 (51.2%) | 20 (48.8%) |
| $75,000 to $99,999 | 44 (100.0%) | 0 (0.0%) |
| $100,000 and over | 178 (87.7%) | 25 (12.3%) |
Public vs Private Health Insurance Coverage by Age in Cuylerville
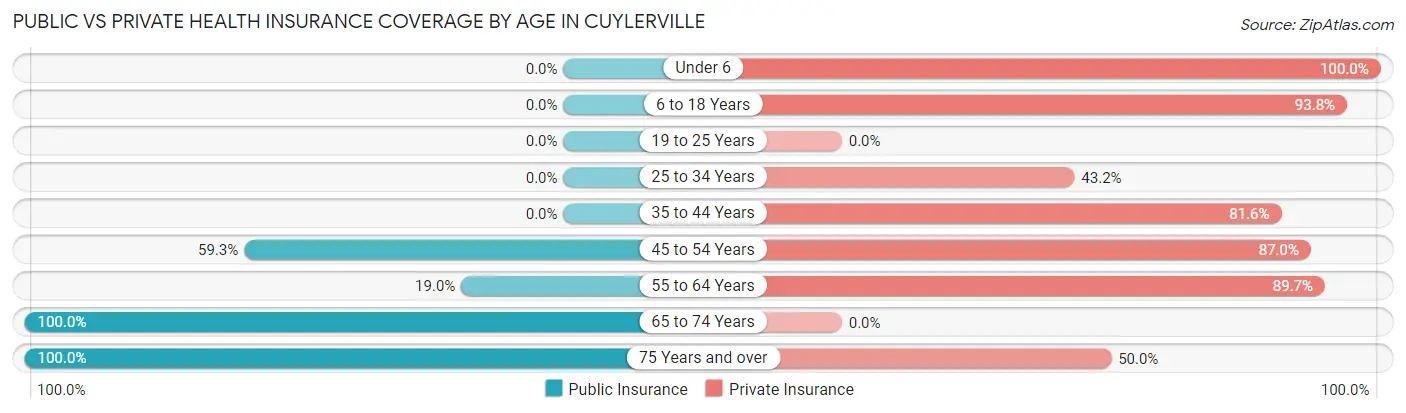
| Age Bracket | Public Insurance | Private Insurance |
| Under 6 | 0 (0.0%) | 14 (100.0%) |
| 6 to 18 Years | 0 (0.0%) | 60 (93.8%) |
| 19 to 25 Years | 0 (0.0%) | 0 (0.0%) |
| 25 to 34 Years | 0 (0.0%) | 19 (43.2%) |
| 35 to 44 Years | 0 (0.0%) | 31 (81.6%) |
| 45 to 54 Years | 32 (59.3%) | 47 (87.0%) |
| 55 to 64 Years | 11 (19.0%) | 52 (89.7%) |
| 65 to 74 Years | 18 (100.0%) | 0 (0.0%) |
| 75 Years and over | 18 (100.0%) | 9 (50.0%) |
| Total | 79 (24.9%) | 232 (73.2%) |
Disability Status by Sex by Age in Cuylerville
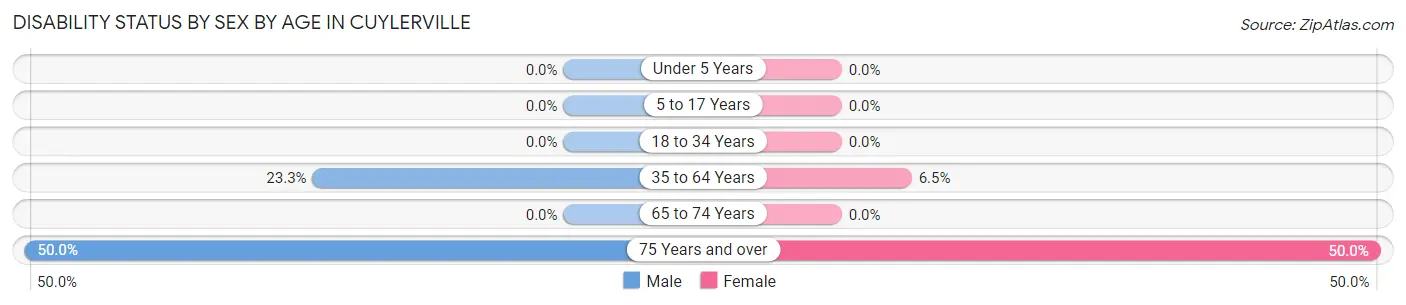
| Age Bracket | Male | Female |
| Under 5 Years | 0 (0.0%) | 0 (0.0%) |
| 5 to 17 Years | 0 (0.0%) | 0 (0.0%) |
| 18 to 34 Years | 0 (0.0%) | 0 (0.0%) |
| 35 to 64 Years | 17 (23.3%) | 5 (6.5%) |
| 65 to 74 Years | 0 (0.0%) | 0 (0.0%) |
| 75 Years and over | 4 (50.0%) | 5 (50.0%) |
Disability Class by Sex by Age in Cuylerville
Disability Class: Hearing Difficulty
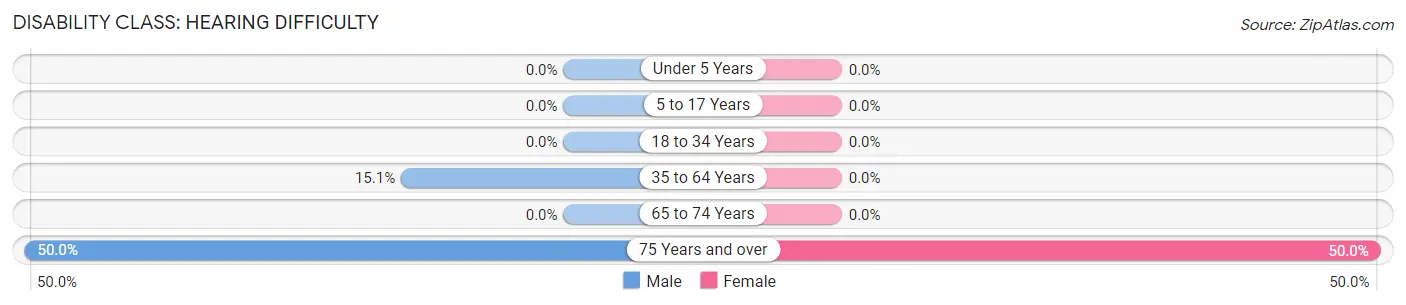
| Age Bracket | Male | Female |
| Under 5 Years | 0 (0.0%) | 0 (0.0%) |
| 5 to 17 Years | 0 (0.0%) | 0 (0.0%) |
| 18 to 34 Years | 0 (0.0%) | 0 (0.0%) |
| 35 to 64 Years | 11 (15.1%) | 0 (0.0%) |
| 65 to 74 Years | 0 (0.0%) | 0 (0.0%) |
| 75 Years and over | 4 (50.0%) | 5 (50.0%) |
Disability Class: Vision Difficulty
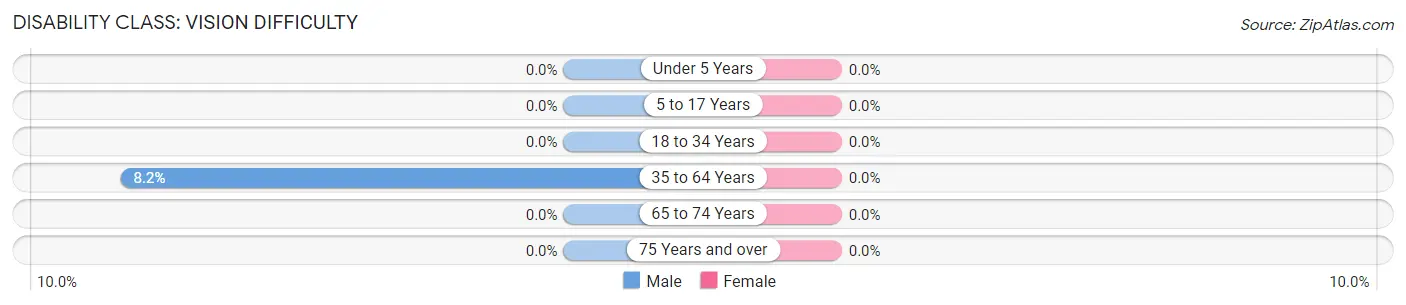
| Age Bracket | Male | Female |
| Under 5 Years | 0 (0.0%) | 0 (0.0%) |
| 5 to 17 Years | 0 (0.0%) | 0 (0.0%) |
| 18 to 34 Years | 0 (0.0%) | 0 (0.0%) |
| 35 to 64 Years | 6 (8.2%) | 0 (0.0%) |
| 65 to 74 Years | 0 (0.0%) | 0 (0.0%) |
| 75 Years and over | 0 (0.0%) | 0 (0.0%) |
Disability Class: Cognitive Difficulty
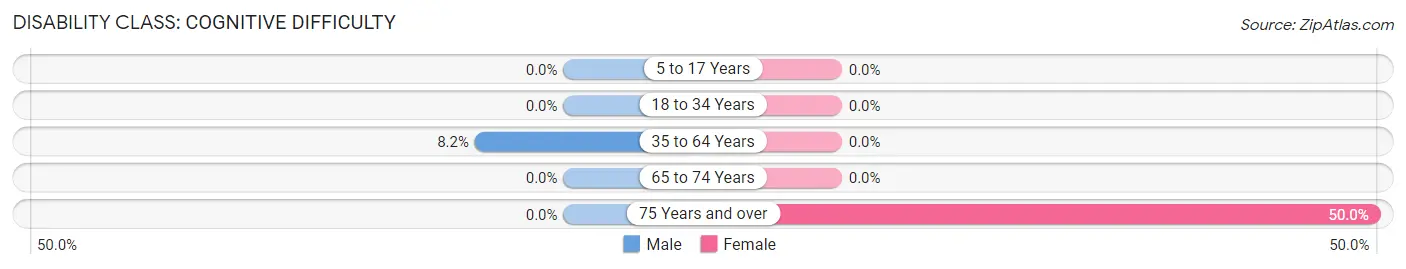
| Age Bracket | Male | Female |
| 5 to 17 Years | 0 (0.0%) | 0 (0.0%) |
| 18 to 34 Years | 0 (0.0%) | 0 (0.0%) |
| 35 to 64 Years | 6 (8.2%) | 0 (0.0%) |
| 65 to 74 Years | 0 (0.0%) | 0 (0.0%) |
| 75 Years and over | 0 (0.0%) | 5 (50.0%) |
Disability Class: Ambulatory Difficulty
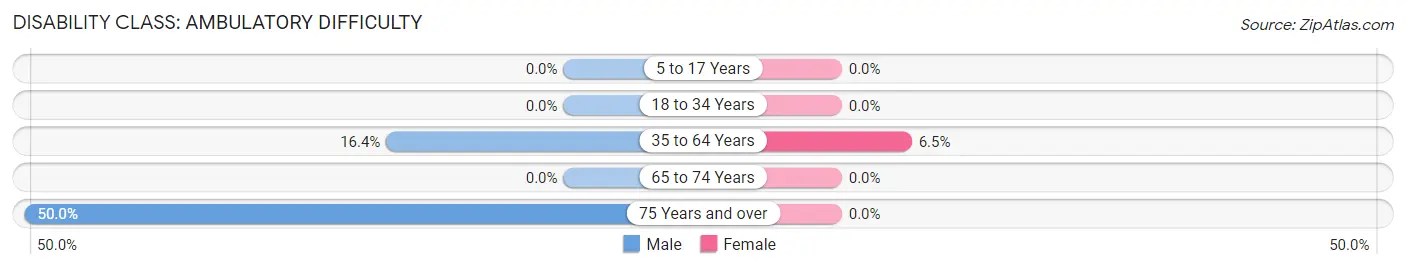
| Age Bracket | Male | Female |
| 5 to 17 Years | 0 (0.0%) | 0 (0.0%) |
| 18 to 34 Years | 0 (0.0%) | 0 (0.0%) |
| 35 to 64 Years | 12 (16.4%) | 5 (6.5%) |
| 65 to 74 Years | 0 (0.0%) | 0 (0.0%) |
| 75 Years and over | 4 (50.0%) | 0 (0.0%) |
Disability Class: Self-Care Difficulty
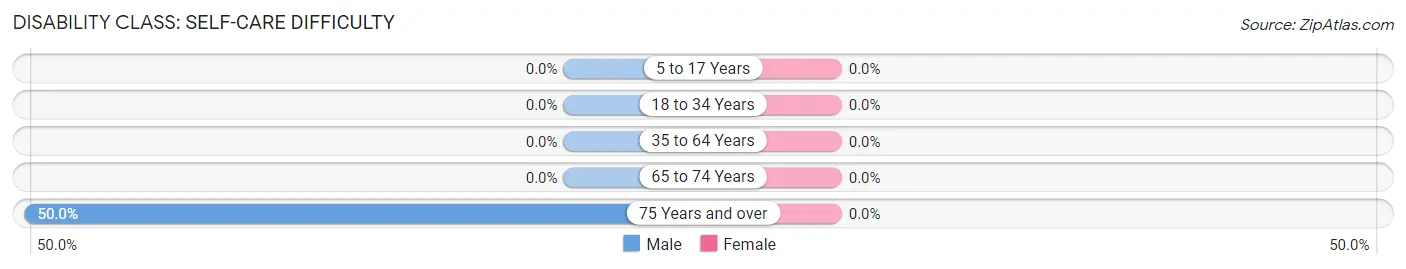
| Age Bracket | Male | Female |
| 5 to 17 Years | 0 (0.0%) | 0 (0.0%) |
| 18 to 34 Years | 0 (0.0%) | 0 (0.0%) |
| 35 to 64 Years | 0 (0.0%) | 0 (0.0%) |
| 65 to 74 Years | 0 (0.0%) | 0 (0.0%) |
| 75 Years and over | 4 (50.0%) | 0 (0.0%) |
Technology Access in Cuylerville
Computing Device Access in Cuylerville
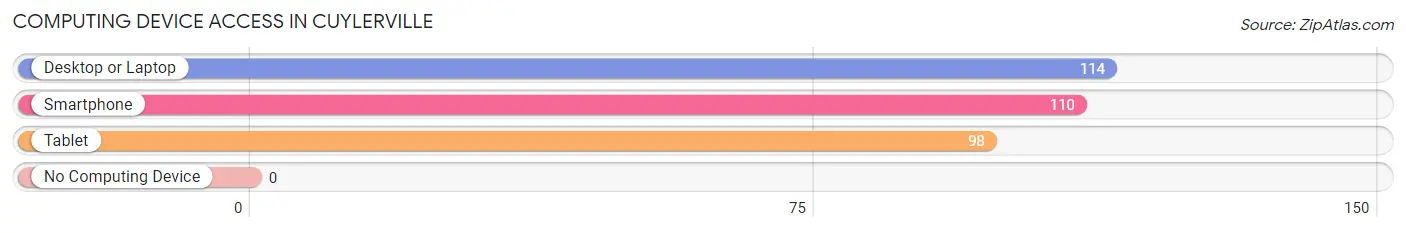
| Device Type | # Households | % Households |
| Desktop or Laptop | 114 | 91.2% |
| Smartphone | 110 | 88.0% |
| Tablet | 98 | 78.4% |
| No Computing Device | 0 | 0.0% |
| Total | 125 | 100.0% |
Internet Access in Cuylerville
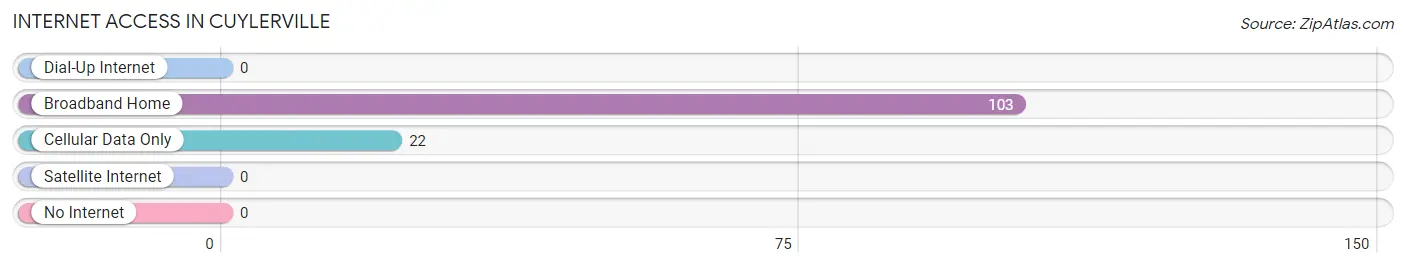
| Internet Type | # Households | % Households |
| Dial-Up Internet | 0 | 0.0% |
| Broadband Home | 103 | 82.4% |
| Cellular Data Only | 22 | 17.6% |
| Satellite Internet | 0 | 0.0% |
| No Internet | 0 | 0.0% |
| Total | 125 | 100.0% |
Cuylerville Summary
Cuylerville is a small hamlet located in Livingston County, New York. It is situated in the Town of Leicester, and is part of the Rochester Metropolitan Statistical Area. The hamlet is located on the banks of the Genesee River, and is home to a population of approximately 500 people.
History
Cuylerville was first settled in the early 19th century by the Cuylers, a family of Dutch immigrants. The hamlet was originally known as Cuylersville, and was named after the family. The hamlet was officially incorporated in 1845, and was the first settlement in the Town of Leicester.
The hamlet was an important stop on the Genesee Valley Canal, which ran through the area from 1836 to 1878. The canal was used to transport goods and passengers between Rochester and Buffalo. The hamlet was also home to a number of mills, including a grist mill, a saw mill, and a woolen mill.
Geography
Cuylerville is located in the Finger Lakes region of New York State. The hamlet is situated on the banks of the Genesee River, and is surrounded by rolling hills and farmland. The hamlet is located approximately 25 miles south of Rochester, and is accessible via State Route 36.
Economy
Cuylerville is a small, rural community with a limited economy. The hamlet is home to a number of small businesses, including a grocery store, a hardware store, and a few restaurants. The hamlet is also home to a number of farms, which produce a variety of crops, including corn, soybeans, and hay.
Demographics
As of the 2010 census, the population of Cuylerville was 498. The racial makeup of the hamlet was 97.2% White, 0.6% African American, 0.2% Native American, 0.2% Asian, 0.2% from other races, and 1.8% from two or more races. Hispanic or Latino of any race were 1.2% of the population.
The median household income in Cuylerville was $45,833, and the median family income was $50,000. The per capita income for the hamlet was $20,845. About 8.3% of families and 10.2% of the population were below the poverty line, including 14.3% of those under age 18 and 4.2% of those age 65 or over.
Common Questions
What is Per Capita Income in Cuylerville?
Per Capita income in Cuylerville is $44,313.
What is the Median Family Income in Cuylerville?
Median Family Income in Cuylerville is $72,857.
What is the Median Household income in Cuylerville?
Median Household Income in Cuylerville is $99,750.
What is Income or Wage Gap in Cuylerville?
Income or Wage Gap in Cuylerville is 9.9%.
Women in Cuylerville earn 90.1 cents for every dollar earned by a man.
What is Inequality or Gini Index in Cuylerville?
Inequality or Gini Index in Cuylerville is 0.36.
What is the Total Population of Cuylerville?
Total Population of Cuylerville is 324.
What is the Total Male Population of Cuylerville?
Total Male Population of Cuylerville is 156.
What is the Total Female Population of Cuylerville?
Total Female Population of Cuylerville is 168.
What is the Ratio of Males per 100 Females in Cuylerville?
There are 92.86 Males per 100 Females in Cuylerville.
What is the Ratio of Females per 100 Males in Cuylerville?
There are 107.69 Females per 100 Males in Cuylerville.
What is the Median Population Age in Cuylerville?
Median Population Age in Cuylerville is 39.6 Years.
What is the Average Family Size in Cuylerville
Average Family Size in Cuylerville is 2.6 People.
What is the Average Household Size in Cuylerville
Average Household Size in Cuylerville is 2.6 People.
How Large is the Labor Force in Cuylerville?
There are 178 People in the Labor Forcein in Cuylerville.
What is the Percentage of People in the Labor Force in Cuylerville?
72.4% of People are in the Labor Force in Cuylerville.