Garden City Park, NY Map & Demographics
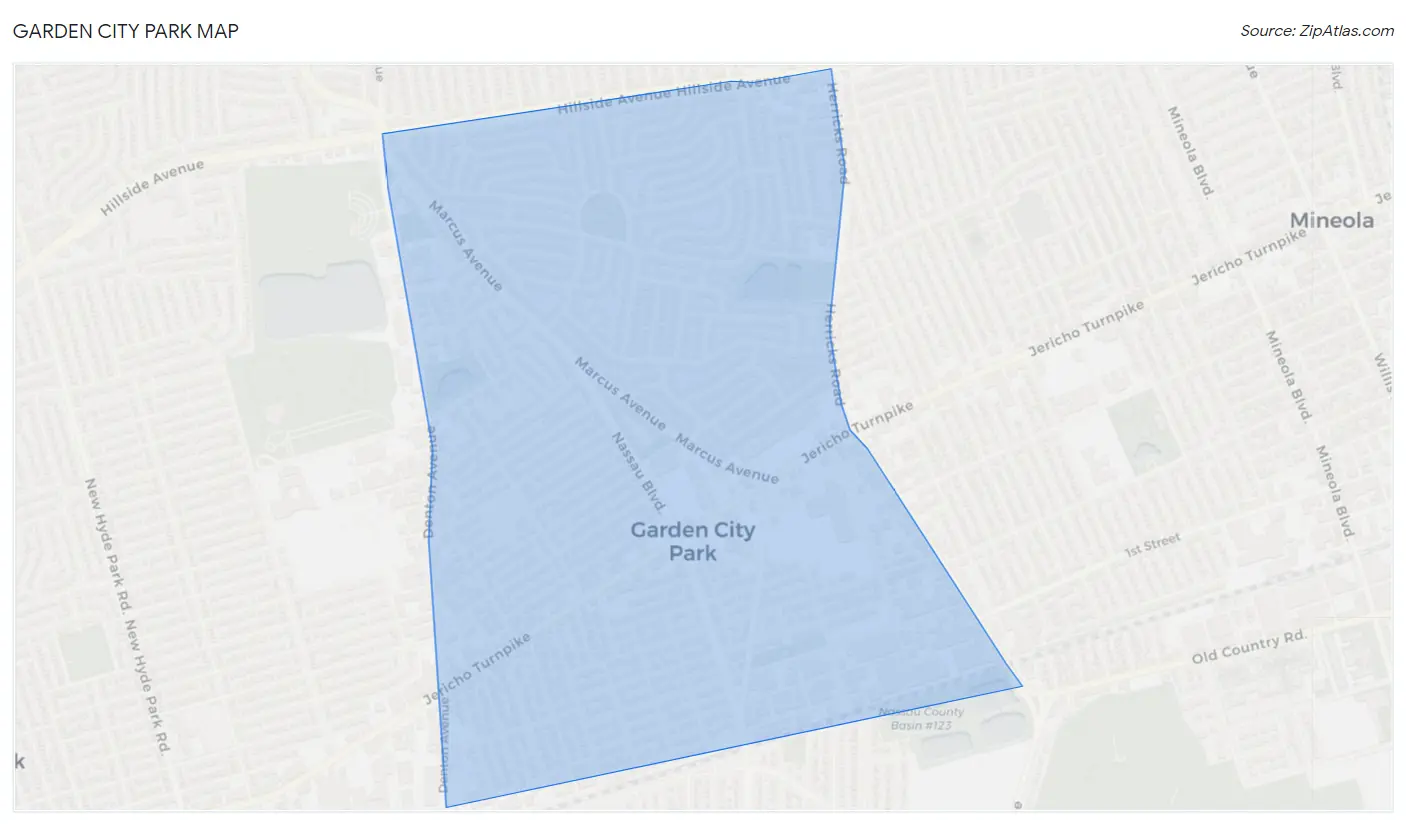
Garden City Park Map
Garden City Park Overview
$47,917
PER CAPITA INCOME
$137,500
AVG FAMILY INCOME
$115,156
AVG HOUSEHOLD INCOME
20.1%
WAGE / INCOME GAP [ % ]
79.9¢/ $1
WAGE / INCOME GAP [ $ ]
0.39
INEQUALITY / GINI INDEX
7,775
TOTAL POPULATION
4,058
MALE POPULATION
3,717
FEMALE POPULATION
109.17
MALES / 100 FEMALES
91.60
FEMALES / 100 MALES
40.9
MEDIAN AGE
3.5
AVG FAMILY SIZE
3.1
AVG HOUSEHOLD SIZE
3,950
LABOR FORCE [ PEOPLE ]
63.3%
PERCENT IN LABOR FORCE
5.9%
UNEMPLOYMENT RATE
Garden City Park Area Codes
Income in Garden City Park
Income Overview in Garden City Park
Per Capita Income in Garden City Park is $47,917, while median incomes of families and households are $137,500 and $115,156 respectively.
| Characteristic | Number | Measure |
| Per Capita Income | 7,775 | $47,917 |
| Median Family Income | 2,054 | $137,500 |
| Mean Family Income | 2,054 | $164,456 |
| Median Household Income | 2,481 | $115,156 |
| Mean Household Income | 2,481 | $150,250 |
| Income Deficit | 2,054 | $0 |
| Wage / Income Gap (%) | 7,775 | 20.07% |
| Wage / Income Gap ($) | 7,775 | 79.93¢ per $1 |
| Gini / Inequality Index | 7,775 | 0.39 |
Earnings by Sex in Garden City Park
Average Earnings in Garden City Park are $58,201, $64,286 for men and $51,385 for women, a difference of 20.1%.
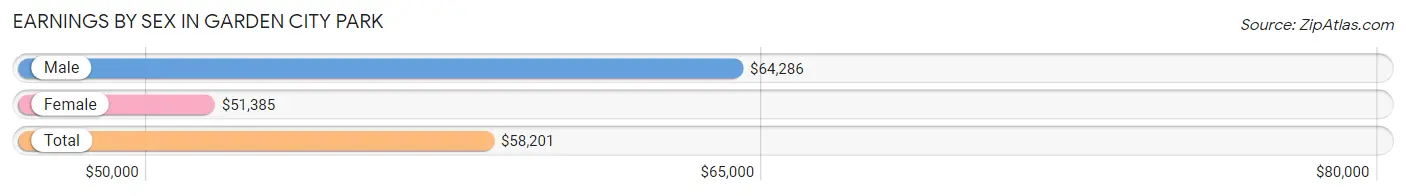
| Sex | Number | Average Earnings |
| Male | 2,346 (58.4%) | $64,286 |
| Female | 1,671 (41.6%) | $51,385 |
| Total | 4,017 (100.0%) | $58,201 |
Earnings by Sex by Income Bracket in Garden City Park
The most common earnings brackets in Garden City Park are $100,000+ for men (622 | 26.5%) and $100,000+ for women (356 | 21.3%).
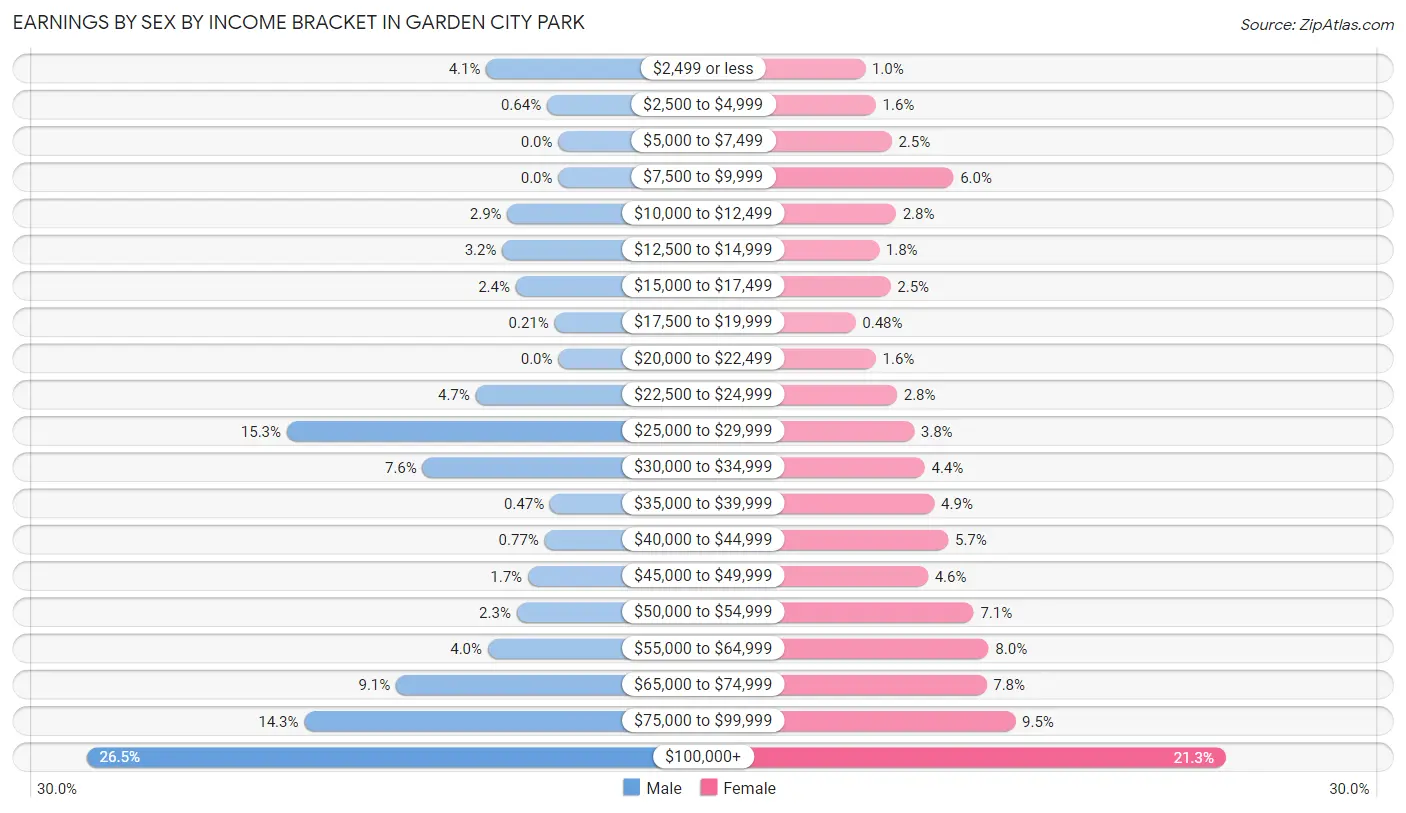
| Income | Male | Female |
| $2,499 or less | 95 (4.1%) | 17 (1.0%) |
| $2,500 to $4,999 | 15 (0.6%) | 27 (1.6%) |
| $5,000 to $7,499 | 0 (0.0%) | 42 (2.5%) |
| $7,500 to $9,999 | 0 (0.0%) | 100 (6.0%) |
| $10,000 to $12,499 | 67 (2.9%) | 46 (2.8%) |
| $12,500 to $14,999 | 74 (3.2%) | 30 (1.8%) |
| $15,000 to $17,499 | 56 (2.4%) | 41 (2.5%) |
| $17,500 to $19,999 | 5 (0.2%) | 8 (0.5%) |
| $20,000 to $22,499 | 0 (0.0%) | 27 (1.6%) |
| $22,500 to $24,999 | 109 (4.6%) | 47 (2.8%) |
| $25,000 to $29,999 | 358 (15.3%) | 63 (3.8%) |
| $30,000 to $34,999 | 179 (7.6%) | 73 (4.4%) |
| $35,000 to $39,999 | 11 (0.5%) | 82 (4.9%) |
| $40,000 to $44,999 | 18 (0.8%) | 95 (5.7%) |
| $45,000 to $49,999 | 40 (1.7%) | 76 (4.5%) |
| $50,000 to $54,999 | 55 (2.3%) | 119 (7.1%) |
| $55,000 to $64,999 | 93 (4.0%) | 133 (8.0%) |
| $65,000 to $74,999 | 214 (9.1%) | 131 (7.8%) |
| $75,000 to $99,999 | 335 (14.3%) | 158 (9.5%) |
| $100,000+ | 622 (26.5%) | 356 (21.3%) |
| Total | 2,346 (100.0%) | 1,671 (100.0%) |
Earnings by Sex by Educational Attainment in Garden City Park
Average earnings in Garden City Park are $75,439 for men and $52,309 for women, a difference of 30.7%. Men with an educational attainment of graduate degree enjoy the highest average annual earnings of $116,563, while those with less than high school education earn the least with $33,262. Women with an educational attainment of graduate degree earn the most with the average annual earnings of $108,000, while those with high school diploma education have the smallest earnings of $40,357.
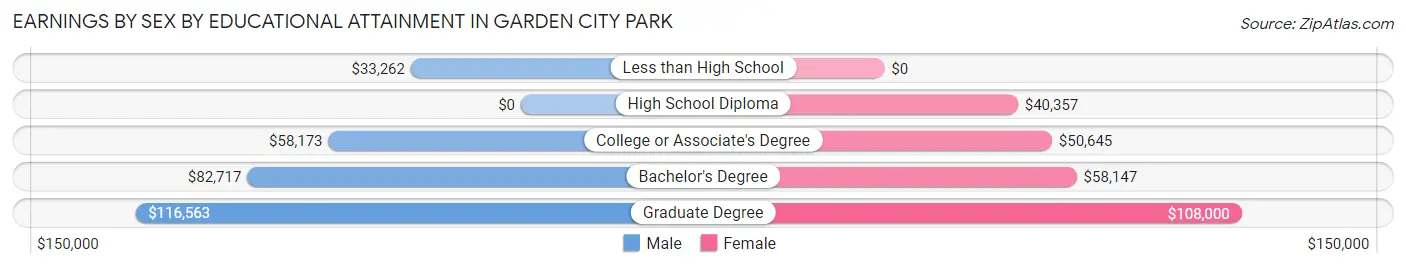
| Educational Attainment | Male Income | Female Income |
| Less than High School | $33,262 | $0 |
| High School Diploma | - | - |
| College or Associate's Degree | $58,173 | $50,645 |
| Bachelor's Degree | $82,717 | $58,147 |
| Graduate Degree | $116,563 | $108,000 |
| Total | $75,439 | $52,309 |
Family Income in Garden City Park
Family Income Brackets in Garden City Park
According to the Garden City Park family income data, there are 573 families falling into the $200,000+ income range, which is the most common income bracket and makes up 27.9% of all families.
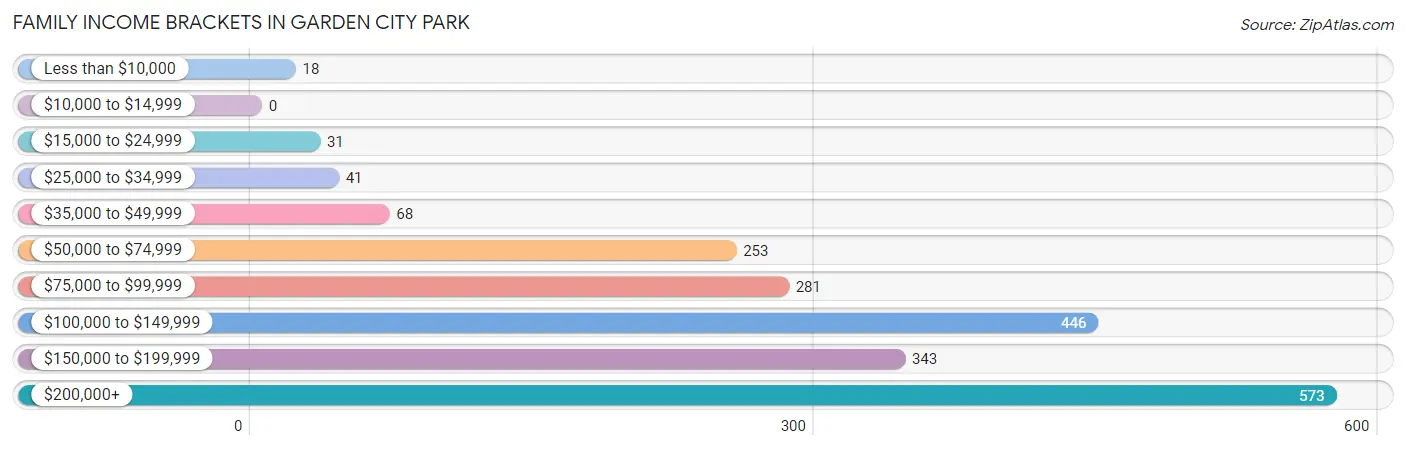
| Income Bracket | # Families | % Families |
| Less than $10,000 | 18 | 0.9% |
| $10,000 to $14,999 | 0 | 0.0% |
| $15,000 to $24,999 | 31 | 1.5% |
| $25,000 to $34,999 | 41 | 2.0% |
| $35,000 to $49,999 | 68 | 3.3% |
| $50,000 to $74,999 | 253 | 12.3% |
| $75,000 to $99,999 | 281 | 13.7% |
| $100,000 to $149,999 | 446 | 21.7% |
| $150,000 to $199,999 | 343 | 16.7% |
| $200,000+ | 573 | 27.9% |
Family Income by Famaliy Size in Garden City Park
5-person families (296 | 14.4%) account for the highest median family income in Garden City Park with $180,333 per family, while 3-person families (514 | 25.0%) have the highest median income of $48,167 per family member.
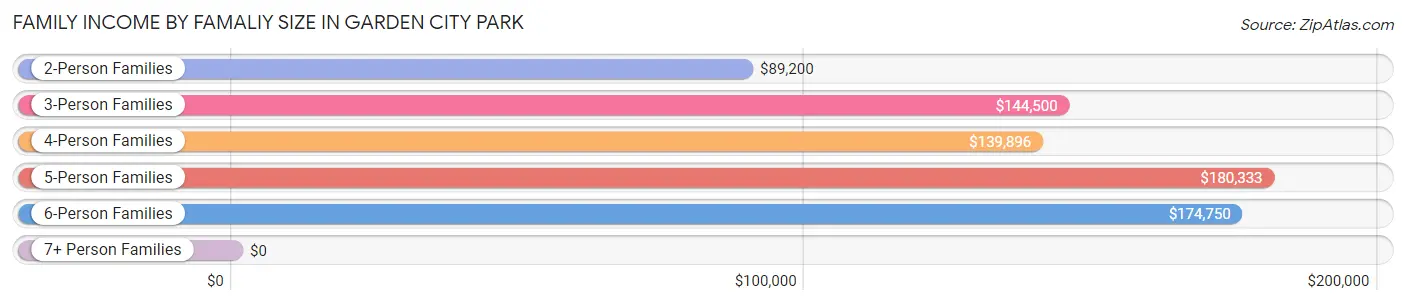
| Income Bracket | # Families | Median Income |
| 2-Person Families | 642 (31.3%) | $89,200 |
| 3-Person Families | 514 (25.0%) | $144,500 |
| 4-Person Families | 487 (23.7%) | $139,896 |
| 5-Person Families | 296 (14.4%) | $180,333 |
| 6-Person Families | 103 (5.0%) | $174,750 |
| 7+ Person Families | 12 (0.6%) | $0 |
| Total | 2,054 (100.0%) | $137,500 |
Family Income by Number of Earners in Garden City Park
The median family income in Garden City Park is $137,500, with families comprising 3+ earners (372) having the highest median family income of $161,944, while families with no earners (262) have the lowest median family income of $65,938, accounting for 18.1% and 12.8% of families, respectively.
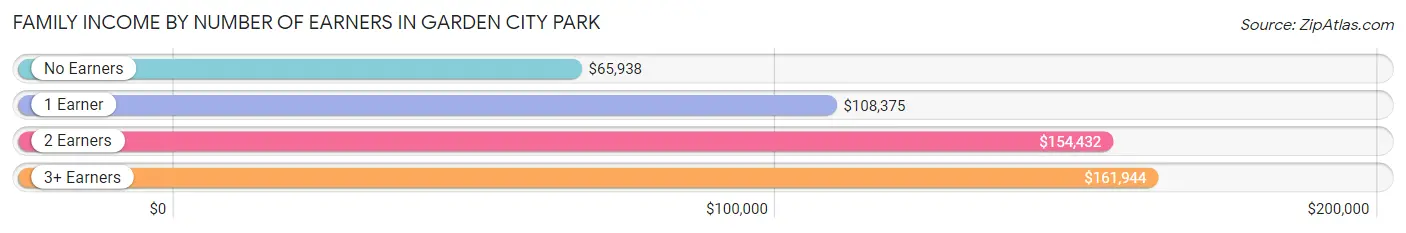
| Number of Earners | # Families | Median Income |
| No Earners | 262 (12.8%) | $65,938 |
| 1 Earner | 519 (25.3%) | $108,375 |
| 2 Earners | 901 (43.9%) | $154,432 |
| 3+ Earners | 372 (18.1%) | $161,944 |
| Total | 2,054 (100.0%) | $137,500 |
Household Income in Garden City Park
Household Income Brackets in Garden City Park
With 618 households falling in the category, the $200,000+ income range is the most frequent in Garden City Park, accounting for 24.9% of all households. In contrast, only 10 households (0.4%) fall into the $10,000 to $14,999 income bracket, making it the least populous group.
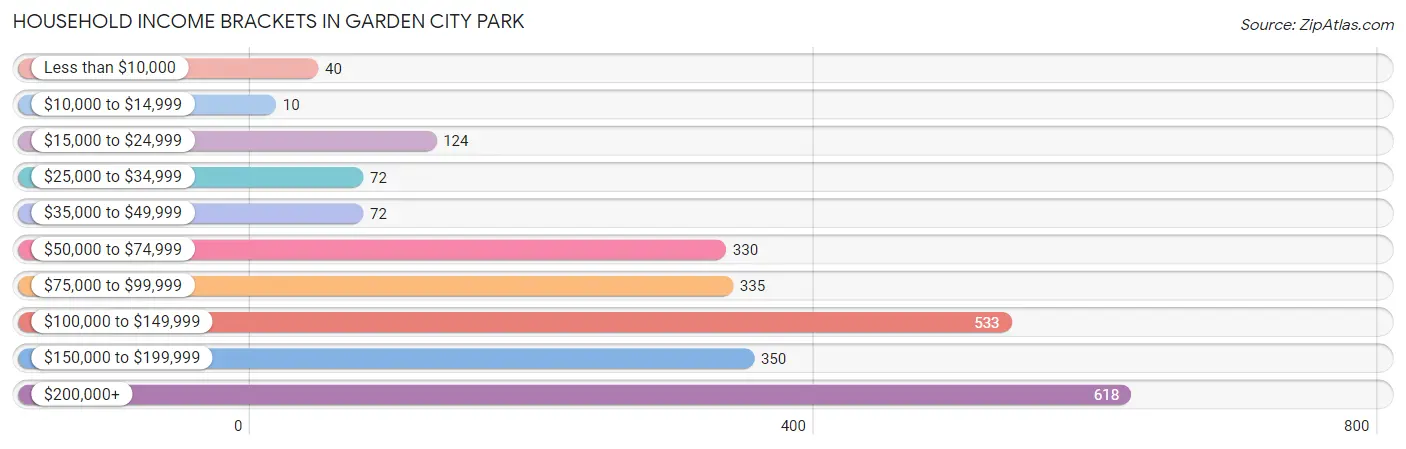
| Income Bracket | # Households | % Households |
| Less than $10,000 | 40 | 1.6% |
| $10,000 to $14,999 | 10 | 0.4% |
| $15,000 to $24,999 | 124 | 5.0% |
| $25,000 to $34,999 | 72 | 2.9% |
| $35,000 to $49,999 | 72 | 2.9% |
| $50,000 to $74,999 | 330 | 13.3% |
| $75,000 to $99,999 | 335 | 13.5% |
| $100,000 to $149,999 | 533 | 21.5% |
| $150,000 to $199,999 | 350 | 14.1% |
| $200,000+ | 618 | 24.9% |
Household Income by Householder Age in Garden City Park
The median household income in Garden City Park is $115,156, with the highest median household income of $141,080 found in the 45 to 64 years age bracket for the primary householder. A total of 863 households (34.8%) fall into this category. Meanwhile, the 15 to 24 years age bracket for the primary householder has the lowest median household income of $0, with 36 households (1.5%) in this group.
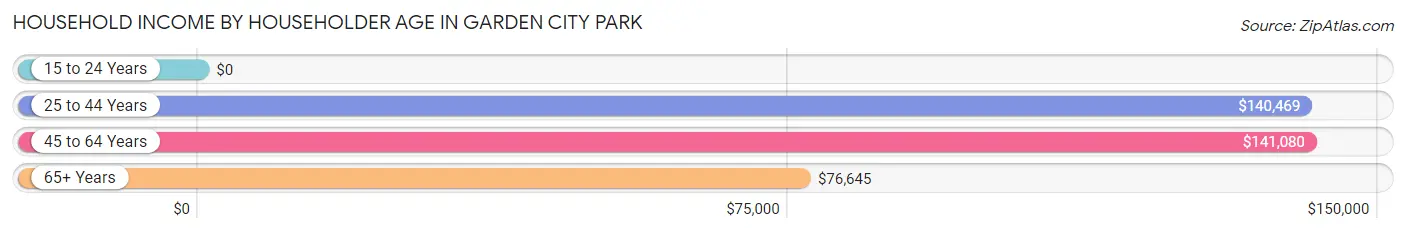
| Income Bracket | # Households | Median Income |
| 15 to 24 Years | 36 (1.5%) | $0 |
| 25 to 44 Years | 763 (30.7%) | $140,469 |
| 45 to 64 Years | 863 (34.8%) | $141,080 |
| 65+ Years | 819 (33.0%) | $76,645 |
| Total | 2,481 (100.0%) | $115,156 |
Poverty in Garden City Park
Income Below Poverty by Sex and Age in Garden City Park
With 1.1% poverty level for males and 1.8% for females among the residents of Garden City Park, 65 to 74 year old males and 75 year old and over females are the most vulnerable to poverty, with 24 males (7.4%) and 31 females (6.0%) in their respective age groups living below the poverty level.
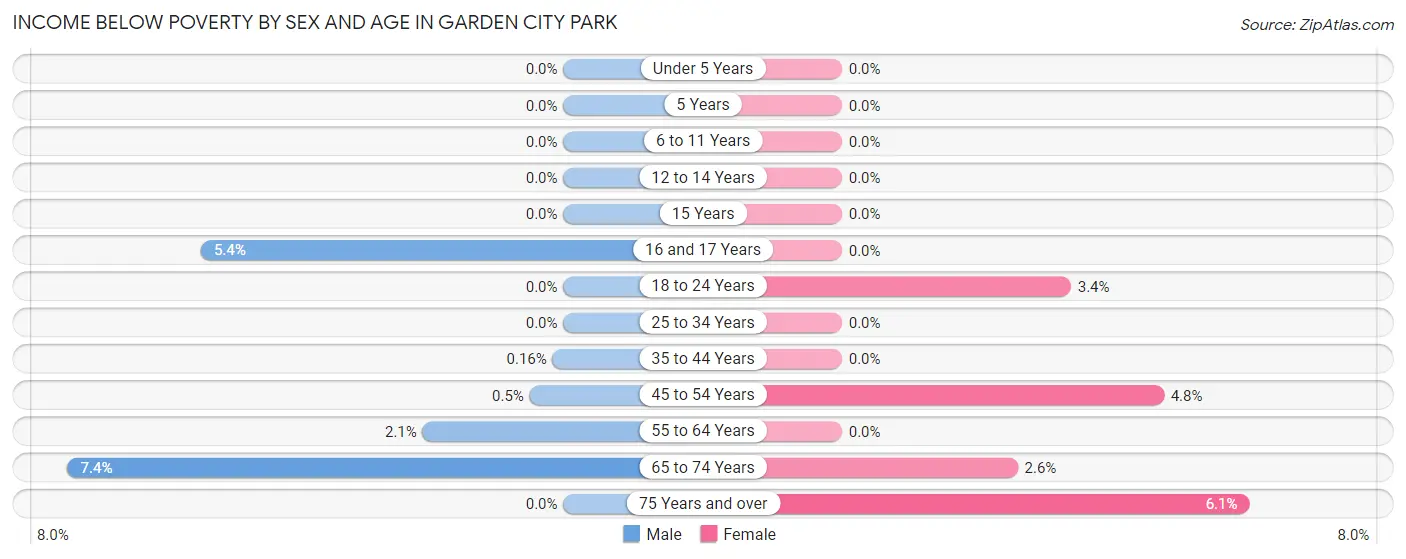
| Age Bracket | Male | Female |
| Under 5 Years | 0 (0.0%) | 0 (0.0%) |
| 5 Years | 0 (0.0%) | 0 (0.0%) |
| 6 to 11 Years | 0 (0.0%) | 0 (0.0%) |
| 12 to 14 Years | 0 (0.0%) | 0 (0.0%) |
| 15 Years | 0 (0.0%) | 0 (0.0%) |
| 16 and 17 Years | 7 (5.4%) | 0 (0.0%) |
| 18 to 24 Years | 0 (0.0%) | 8 (3.4%) |
| 25 to 34 Years | 0 (0.0%) | 0 (0.0%) |
| 35 to 44 Years | 1 (0.2%) | 0 (0.0%) |
| 45 to 54 Years | 2 (0.5%) | 16 (4.8%) |
| 55 to 64 Years | 11 (2.1%) | 0 (0.0%) |
| 65 to 74 Years | 24 (7.4%) | 11 (2.6%) |
| 75 Years and over | 0 (0.0%) | 31 (6.0%) |
| Total | 45 (1.1%) | 66 (1.8%) |
Income Above Poverty by Sex and Age in Garden City Park
According to the poverty statistics in Garden City Park, males aged under 5 years and females aged under 5 years are the age groups that are most secure financially, with 100.0% of males and 100.0% of females in these age groups living above the poverty line.
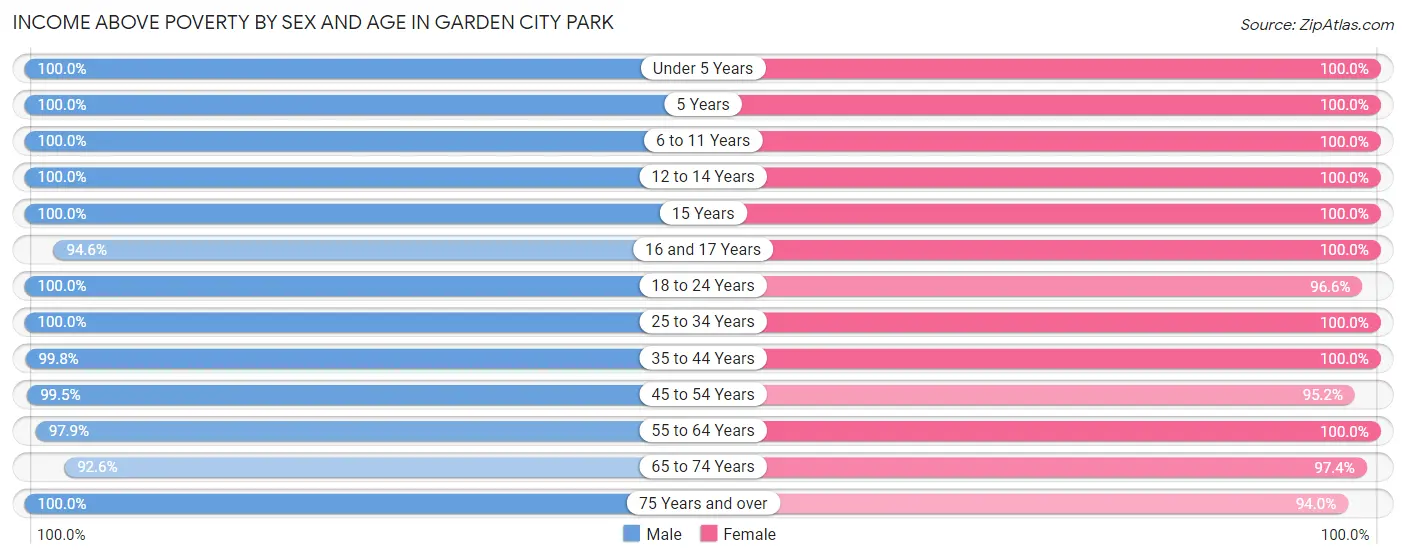
| Age Bracket | Male | Female |
| Under 5 Years | 223 (100.0%) | 175 (100.0%) |
| 5 Years | 37 (100.0%) | 34 (100.0%) |
| 6 to 11 Years | 475 (100.0%) | 296 (100.0%) |
| 12 to 14 Years | 103 (100.0%) | 101 (100.0%) |
| 15 Years | 59 (100.0%) | 32 (100.0%) |
| 16 and 17 Years | 123 (94.6%) | 30 (100.0%) |
| 18 to 24 Years | 528 (100.0%) | 227 (96.6%) |
| 25 to 34 Years | 367 (100.0%) | 386 (100.0%) |
| 35 to 44 Years | 608 (99.8%) | 562 (100.0%) |
| 45 to 54 Years | 401 (99.5%) | 319 (95.2%) |
| 55 to 64 Years | 516 (97.9%) | 597 (100.0%) |
| 65 to 74 Years | 302 (92.6%) | 411 (97.4%) |
| 75 Years and over | 271 (100.0%) | 481 (94.0%) |
| Total | 4,013 (98.9%) | 3,651 (98.2%) |
Income Below Poverty Among Married-Couple Families in Garden City Park
The poverty statistics for married-couple families in Garden City Park show that 1.0% or 18 of the total 1,830 families live below the poverty line. Families with no children have the highest poverty rate of 1.2%, comprising of 11 families. On the other hand, families with 3 or 4 children have the lowest poverty rate of 0.0%, which includes 0 families.
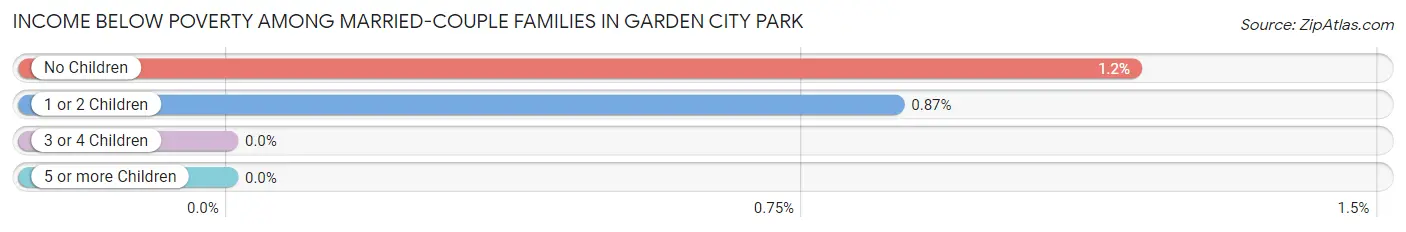
| Children | Above Poverty | Below Poverty |
| No Children | 923 (98.8%) | 11 (1.2%) |
| 1 or 2 Children | 802 (99.1%) | 7 (0.9%) |
| 3 or 4 Children | 87 (100.0%) | 0 (0.0%) |
| 5 or more Children | 0 (0.0%) | 0 (0.0%) |
| Total | 1,812 (99.0%) | 18 (1.0%) |
Income Below Poverty Among Single-Parent Households in Garden City Park
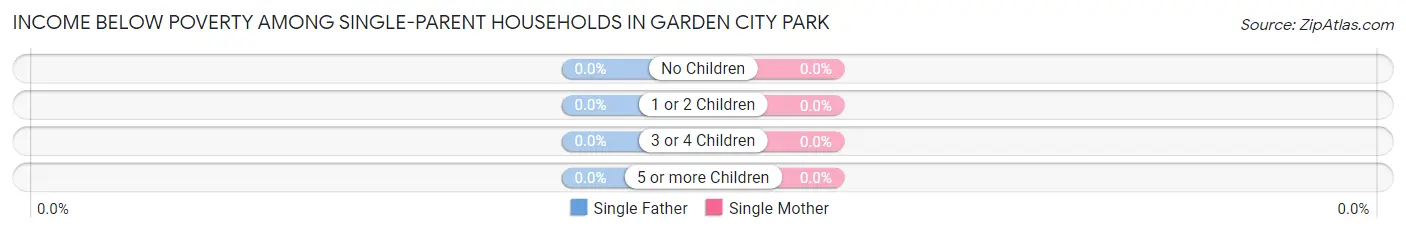
| Children | Single Father | Single Mother |
| No Children | 0 (0.0%) | 0 (0.0%) |
| 1 or 2 Children | 0 (0.0%) | 0 (0.0%) |
| 3 or 4 Children | 0 (0.0%) | 0 (0.0%) |
| 5 or more Children | 0 (0.0%) | 0 (0.0%) |
| Total | 0 (0.0%) | 0 (0.0%) |
Income Below Poverty Among Married-Couple vs Single-Parent Households in Garden City Park
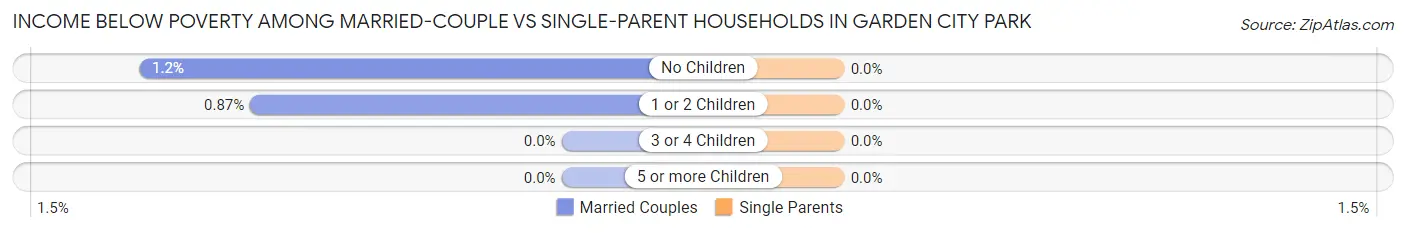
| Children | Married-Couple Families | Single-Parent Households |
| No Children | 11 (1.2%) | 0 (0.0%) |
| 1 or 2 Children | 7 (0.9%) | 0 (0.0%) |
| 3 or 4 Children | 0 (0.0%) | 0 (0.0%) |
| 5 or more Children | 0 (0.0%) | 0 (0.0%) |
| Total | 18 (1.0%) | 0 (0.0%) |
Race in Garden City Park
The most populous races in Garden City Park are Asian (3,781 | 48.6%), White / Caucasian (2,849 | 36.6%), and Hispanic or Latino (890 | 11.5%).
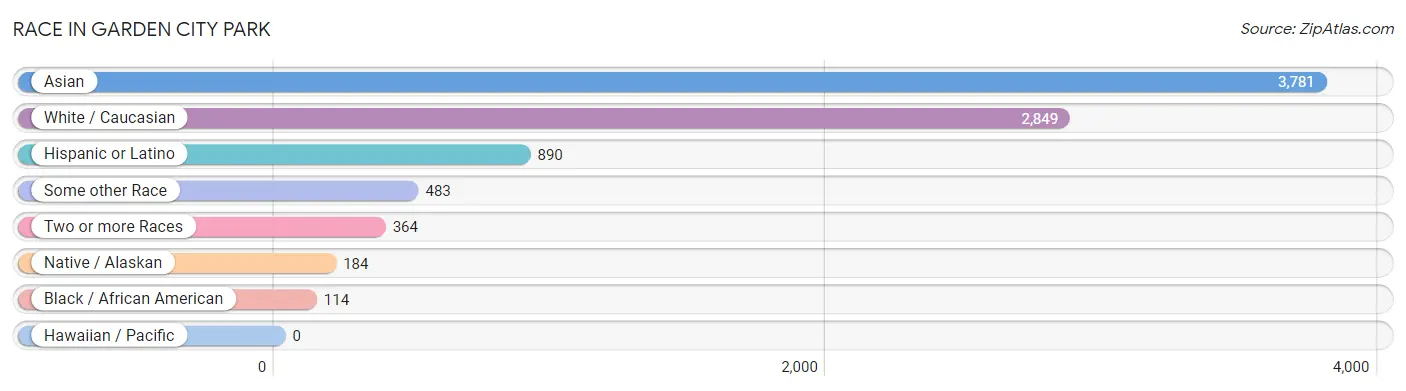
| Race | # Population | % Population |
| Asian | 3,781 | 48.6% |
| Black / African American | 114 | 1.5% |
| Hawaiian / Pacific | 0 | 0.0% |
| Hispanic or Latino | 890 | 11.5% |
| Native / Alaskan | 184 | 2.4% |
| White / Caucasian | 2,849 | 36.6% |
| Two or more Races | 364 | 4.7% |
| Some other Race | 483 | 6.2% |
| Total | 7,775 | 100.0% |
Ancestry in Garden City Park
The most populous ancestries reported in Garden City Park are Thai (1,464 | 18.8%), Indian (Asian) (1,133 | 14.6%), Italian (1,120 | 14.4%), Irish (557 | 7.2%), and German (498 | 6.4%), together accounting for 61.4% of all Garden City Park residents.
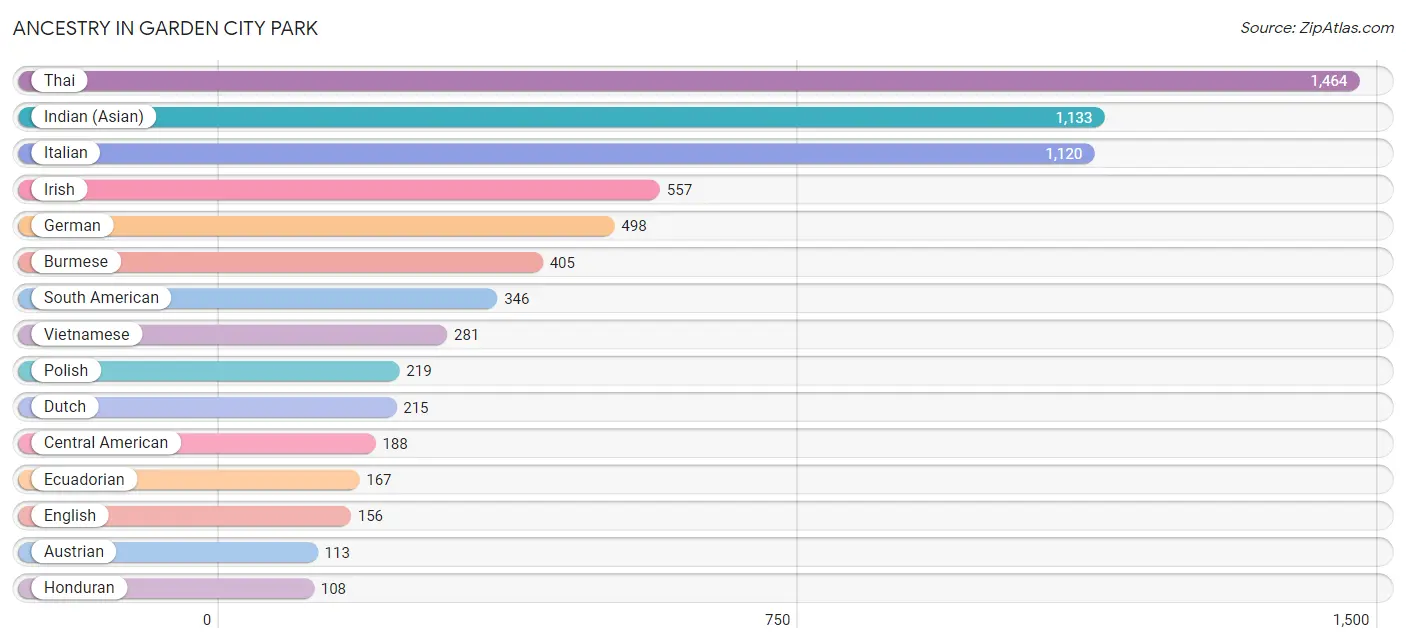
| Ancestry | # Population | % Population |
| Albanian | 16 | 0.2% |
| American | 47 | 0.6% |
| Arab | 46 | 0.6% |
| Argentinean | 15 | 0.2% |
| Armenian | 7 | 0.1% |
| Austrian | 113 | 1.5% |
| Bhutanese | 39 | 0.5% |
| Brazilian | 85 | 1.1% |
| Burmese | 405 | 5.2% |
| Celtic | 8 | 0.1% |
| Central American | 188 | 2.4% |
| Central American Indian | 6 | 0.1% |
| Colombian | 97 | 1.3% |
| Costa Rican | 6 | 0.1% |
| Croatian | 87 | 1.1% |
| Cuban | 25 | 0.3% |
| Czech | 20 | 0.3% |
| Dominican | 32 | 0.4% |
| Dutch | 215 | 2.8% |
| Eastern European | 40 | 0.5% |
| Ecuadorian | 167 | 2.1% |
| Egyptian | 46 | 0.6% |
| English | 156 | 2.0% |
| European | 37 | 0.5% |
| Filipino | 33 | 0.4% |
| French American Indian | 19 | 0.2% |
| German | 498 | 6.4% |
| Greek | 47 | 0.6% |
| Guyanese | 82 | 1.1% |
| Honduran | 108 | 1.4% |
| Hungarian | 7 | 0.1% |
| Indian (Asian) | 1,133 | 14.6% |
| Irish | 557 | 7.2% |
| Italian | 1,120 | 14.4% |
| Korean | 55 | 0.7% |
| Lithuanian | 12 | 0.2% |
| Nicaraguan | 26 | 0.3% |
| Northern European | 24 | 0.3% |
| Pakistani | 26 | 0.3% |
| Paraguayan | 8 | 0.1% |
| Peruvian | 59 | 0.8% |
| Polish | 219 | 2.8% |
| Portuguese | 59 | 0.8% |
| Puerto Rican | 67 | 0.9% |
| Romanian | 31 | 0.4% |
| Russian | 29 | 0.4% |
| Salvadoran | 48 | 0.6% |
| Scotch-Irish | 21 | 0.3% |
| Scottish | 8 | 0.1% |
| Slavic | 6 | 0.1% |
| South American | 346 | 4.4% |
| South American Indian | 6 | 0.1% |
| Spaniard | 87 | 1.1% |
| Sri Lankan | 23 | 0.3% |
| Swedish | 12 | 0.2% |
| Thai | 1,464 | 18.8% |
| Ukrainian | 18 | 0.2% |
| Vietnamese | 281 | 3.6% |
| Welsh | 9 | 0.1% | View All 59 Rows |
Immigrants in Garden City Park
The most numerous immigrant groups reported in Garden City Park came from Asia (1,968 | 25.3%), South Central Asia (1,101 | 14.2%), India (853 | 11.0%), Eastern Asia (788 | 10.1%), and China (599 | 7.7%), together accounting for 68.3% of all Garden City Park residents.
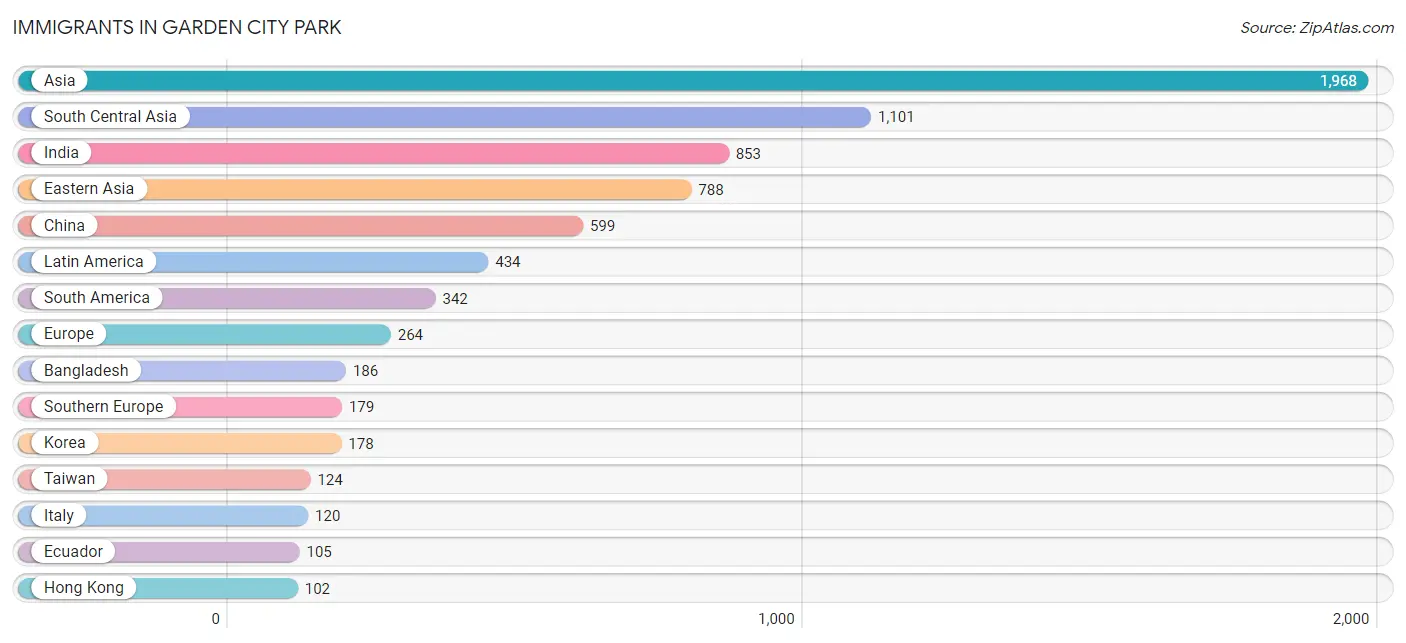
| Immigration Origin | # Population | % Population |
| Africa | 47 | 0.6% |
| Asia | 1,968 | 25.3% |
| Bangladesh | 186 | 2.4% |
| Brazil | 48 | 0.6% |
| Canada | 7 | 0.1% |
| Caribbean | 32 | 0.4% |
| Central America | 60 | 0.8% |
| China | 599 | 7.7% |
| Colombia | 42 | 0.5% |
| Croatia | 27 | 0.4% |
| Dominica | 12 | 0.2% |
| Dominican Republic | 11 | 0.1% |
| Eastern Asia | 788 | 10.1% |
| Eastern Europe | 52 | 0.7% |
| Ecuador | 105 | 1.3% |
| Egypt | 31 | 0.4% |
| El Salvador | 48 | 0.6% |
| Europe | 264 | 3.4% |
| Germany | 33 | 0.4% |
| Guyana | 74 | 0.9% |
| Hong Kong | 102 | 1.3% |
| India | 853 | 11.0% |
| Italy | 120 | 1.5% |
| Japan | 11 | 0.1% |
| Korea | 178 | 2.3% |
| Latin America | 434 | 5.6% |
| Malaysia | 13 | 0.2% |
| Nicaragua | 12 | 0.2% |
| Northern Africa | 31 | 0.4% |
| Peru | 45 | 0.6% |
| Philippines | 20 | 0.3% |
| Poland | 19 | 0.2% |
| Portugal | 59 | 0.8% |
| South Africa | 16 | 0.2% |
| South America | 342 | 4.4% |
| South Central Asia | 1,101 | 14.2% |
| South Eastern Asia | 79 | 1.0% |
| Southern Europe | 179 | 2.3% |
| Sri Lanka | 62 | 0.8% |
| Taiwan | 124 | 1.6% |
| Thailand | 26 | 0.3% |
| Venezuela | 10 | 0.1% |
| Vietnam | 20 | 0.3% |
| Western Europe | 33 | 0.4% | View All 44 Rows |
Sex and Age in Garden City Park
Sex and Age in Garden City Park
The most populous age groups in Garden City Park are 20 to 24 Years (456 | 11.2%) for men and 40 to 44 Years (311 | 8.4%) for women.
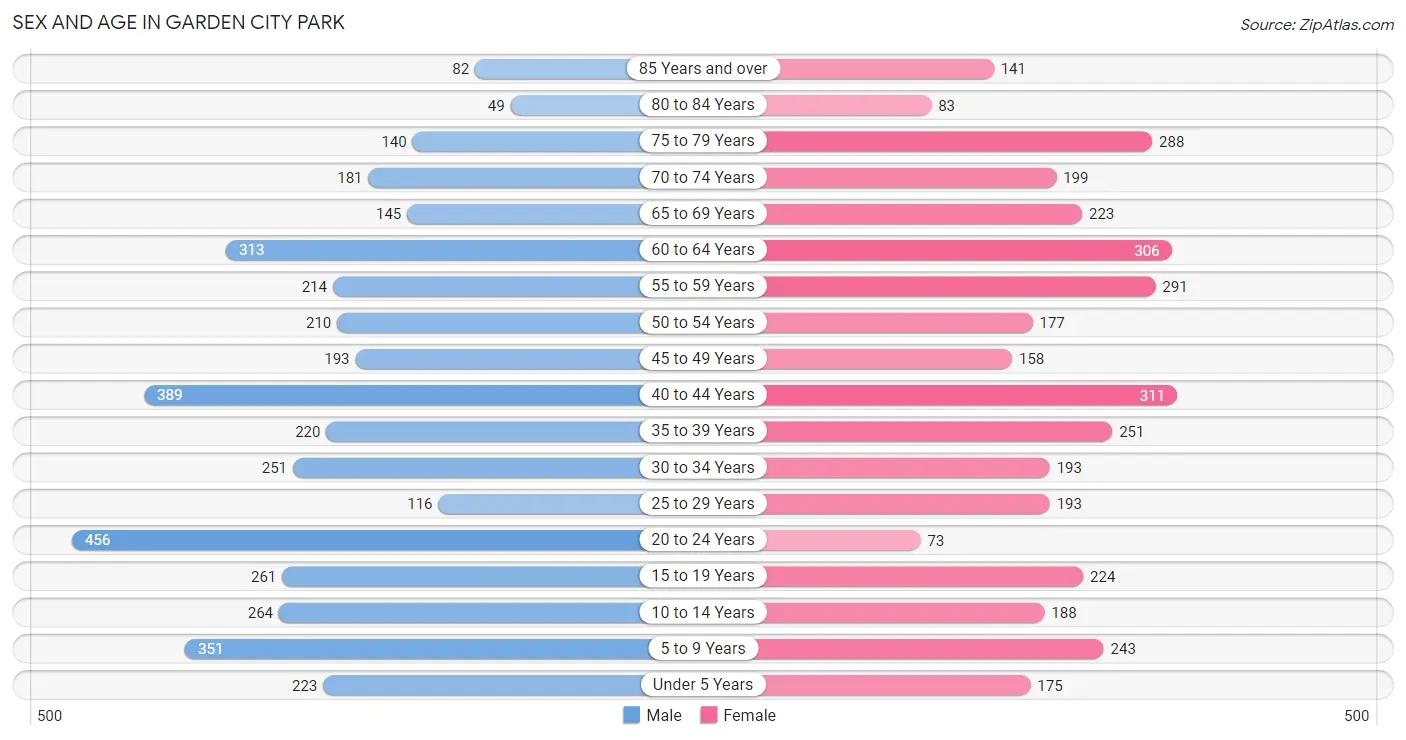
| Age Bracket | Male | Female |
| Under 5 Years | 223 (5.5%) | 175 (4.7%) |
| 5 to 9 Years | 351 (8.6%) | 243 (6.5%) |
| 10 to 14 Years | 264 (6.5%) | 188 (5.1%) |
| 15 to 19 Years | 261 (6.4%) | 224 (6.0%) |
| 20 to 24 Years | 456 (11.2%) | 73 (2.0%) |
| 25 to 29 Years | 116 (2.9%) | 193 (5.2%) |
| 30 to 34 Years | 251 (6.2%) | 193 (5.2%) |
| 35 to 39 Years | 220 (5.4%) | 251 (6.8%) |
| 40 to 44 Years | 389 (9.6%) | 311 (8.4%) |
| 45 to 49 Years | 193 (4.8%) | 158 (4.3%) |
| 50 to 54 Years | 210 (5.2%) | 177 (4.8%) |
| 55 to 59 Years | 214 (5.3%) | 291 (7.8%) |
| 60 to 64 Years | 313 (7.7%) | 306 (8.2%) |
| 65 to 69 Years | 145 (3.6%) | 223 (6.0%) |
| 70 to 74 Years | 181 (4.5%) | 199 (5.3%) |
| 75 to 79 Years | 140 (3.5%) | 288 (7.7%) |
| 80 to 84 Years | 49 (1.2%) | 83 (2.2%) |
| 85 Years and over | 82 (2.0%) | 141 (3.8%) |
| Total | 4,058 (100.0%) | 3,717 (100.0%) |
Families and Households in Garden City Park
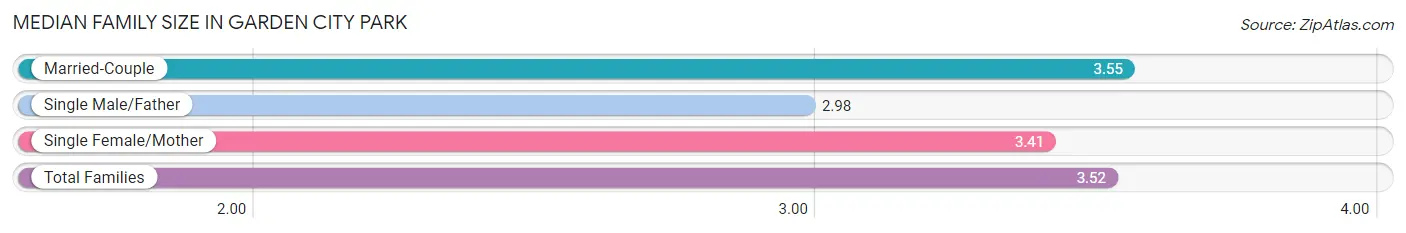
Median Family Size in Garden City Park
The median family size in Garden City Park is 3.52 persons per family, with married-couple families (1,830 | 89.1%) accounting for the largest median family size of 3.55 persons per family. On the other hand, single male/father families (93 | 4.5%) represent the smallest median family size with 2.98 persons per family.
| Family Type | # Families | Family Size |
| Married-Couple | 1,830 (89.1%) | 3.55 |
| Single Male/Father | 93 (4.5%) | 2.98 |
| Single Female/Mother | 131 (6.4%) | 3.41 |
| Total Families | 2,054 (100.0%) | 3.52 |
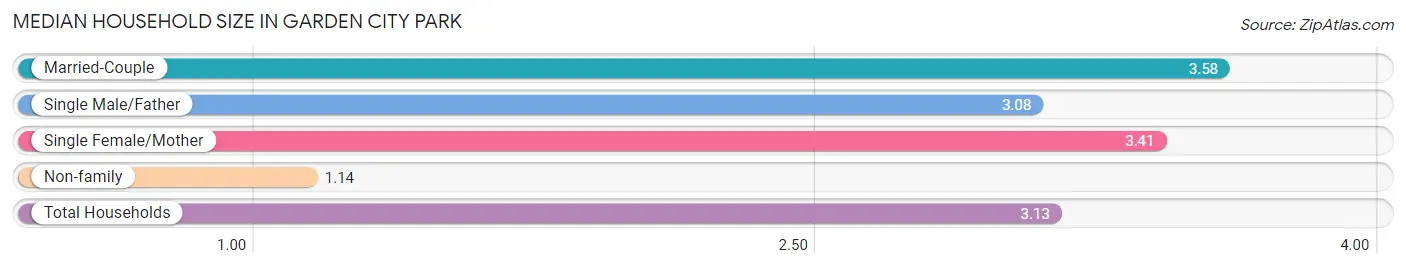
Median Household Size in Garden City Park
The median household size in Garden City Park is 3.13 persons per household, with married-couple households (1,830 | 73.8%) accounting for the largest median household size of 3.58 persons per household. non-family households (427 | 17.2%) represent the smallest median household size with 1.14 persons per household.
| Household Type | # Households | Household Size |
| Married-Couple | 1,830 (73.8%) | 3.58 |
| Single Male/Father | 93 (3.7%) | 3.08 |
| Single Female/Mother | 131 (5.3%) | 3.41 |
| Non-family | 427 (17.2%) | 1.14 |
| Total Households | 2,481 (100.0%) | 3.13 |
Household Size by Marriage Status in Garden City Park
Out of a total of 2,481 households in Garden City Park, 2,054 (82.8%) are family households, while 427 (17.2%) are nonfamily households. The most numerous type of family households are 2-person households, comprising 642, and the most common type of nonfamily households are 1-person households, comprising 371.
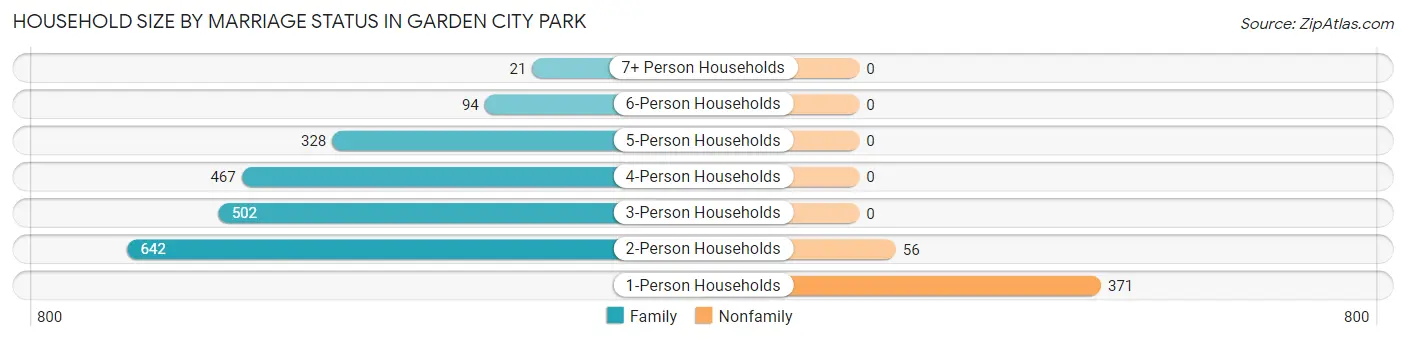
| Household Size | Family Households | Nonfamily Households |
| 1-Person Households | - | 371 (14.9%) |
| 2-Person Households | 642 (25.9%) | 56 (2.3%) |
| 3-Person Households | 502 (20.2%) | 0 (0.0%) |
| 4-Person Households | 467 (18.8%) | 0 (0.0%) |
| 5-Person Households | 328 (13.2%) | 0 (0.0%) |
| 6-Person Households | 94 (3.8%) | 0 (0.0%) |
| 7+ Person Households | 21 (0.9%) | 0 (0.0%) |
| Total | 2,054 (82.8%) | 427 (17.2%) |
Female Fertility in Garden City Park
Fertility by Age in Garden City Park
Average fertility rate in Garden City Park is 45.0 births per 1,000 women. Women in the age bracket of 20 to 34 years have the highest fertility rate with 78.0 births per 1,000 women. Women in the age bracket of 20 to 34 years acount for 55.4% of all women with births.
| Age Bracket | Women with Births | Births / 1,000 Women |
| 15 to 19 years | 0 (0.0%) | 0.0 |
| 20 to 34 years | 36 (55.4%) | 78.0 |
| 35 to 50 years | 29 (44.6%) | 39.0 |
| Total | 65 (100.0%) | 45.0 |
Fertility by Age by Marriage Status in Garden City Park
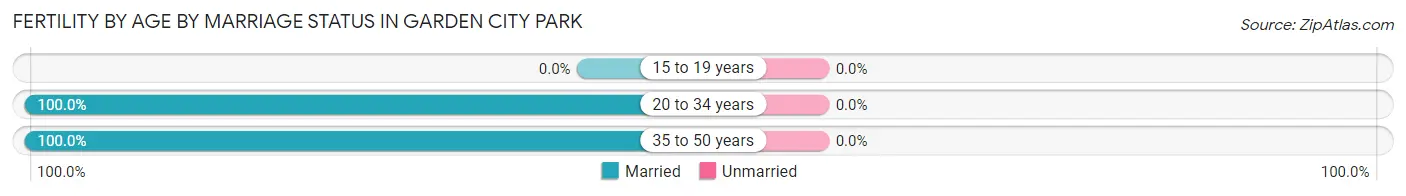
| Age Bracket | Married | Unmarried |
| 15 to 19 years | 0 (0.0%) | 0 (0.0%) |
| 20 to 34 years | 36 (100.0%) | 0 (0.0%) |
| 35 to 50 years | 29 (100.0%) | 0 (0.0%) |
| Total | 65 (100.0%) | 0 (0.0%) |
Fertility by Education in Garden City Park
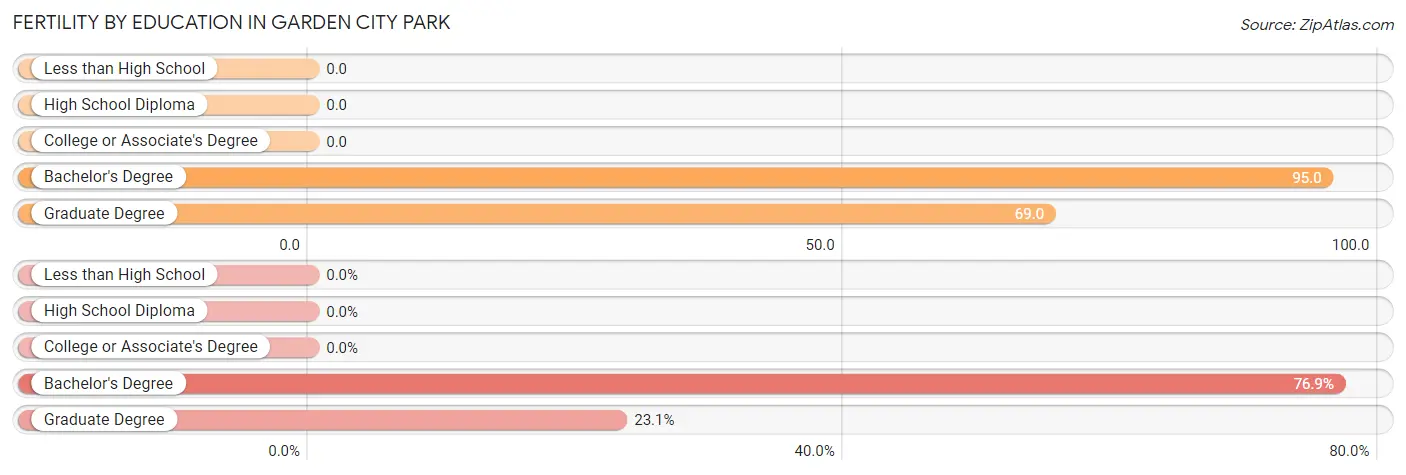
| Educational Attainment | Women with Births | Births / 1,000 Women |
| Less than High School | 0 (0.0%) | 0.0 |
| High School Diploma | 0 (0.0%) | 0.0 |
| College or Associate's Degree | 0 (0.0%) | 0.0 |
| Bachelor's Degree | 50 (76.9%) | 95.0 |
| Graduate Degree | 15 (23.1%) | 69.0 |
| Total | 65 (100.0%) | 45.0 |
Fertility by Education by Marriage Status in Garden City Park
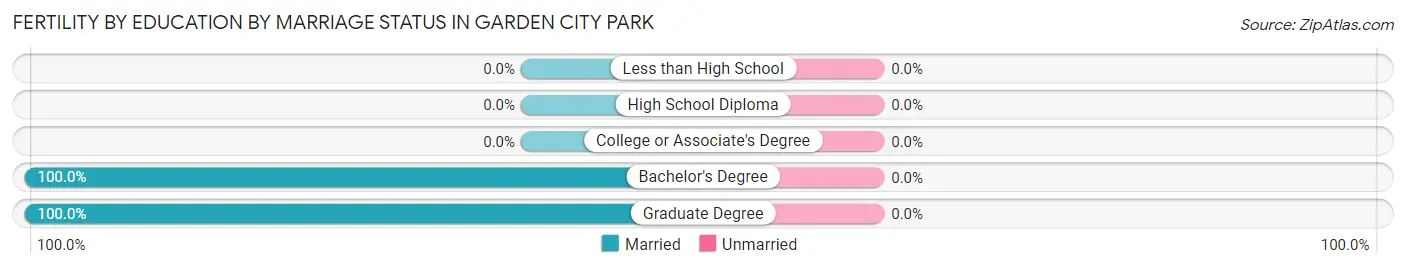
| Educational Attainment | Married | Unmarried |
| Less than High School | 0 (0.0%) | 0 (0.0%) |
| High School Diploma | 0 (0.0%) | 0 (0.0%) |
| College or Associate's Degree | 0 (0.0%) | 0 (0.0%) |
| Bachelor's Degree | 50 (100.0%) | 0 (0.0%) |
| Graduate Degree | 15 (100.0%) | 0 (0.0%) |
| Total | 65 (100.0%) | 0 (0.0%) |
Employment Characteristics in Garden City Park
Employment by Class of Employer in Garden City Park
Among the 3,683 employed individuals in Garden City Park, private company employees (2,266 | 61.5%), self-employed (incorporated) (488 | 13.3%), and local government employees (375 | 10.2%) make up the most common classes of employment.
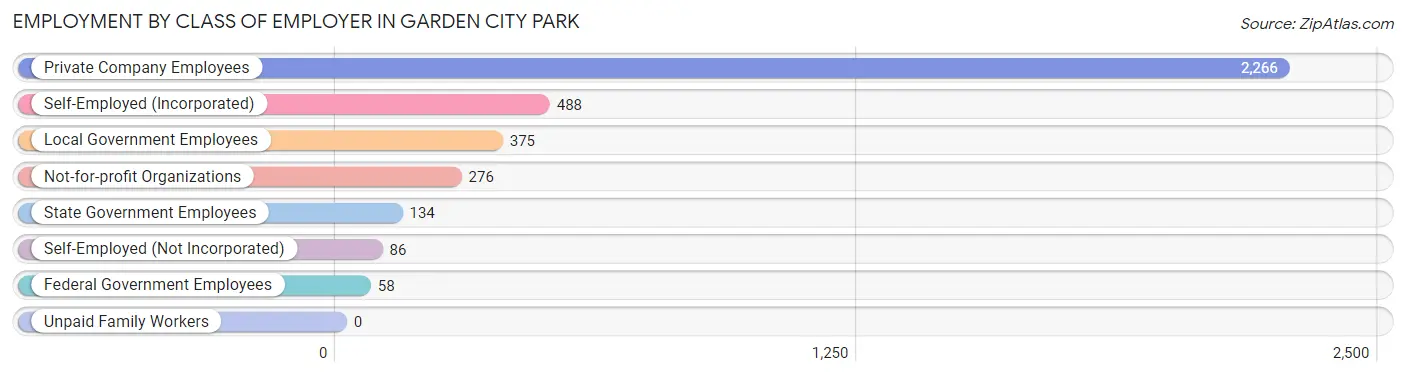
| Employer Class | # Employees | % Employees |
| Private Company Employees | 2,266 | 61.5% |
| Self-Employed (Incorporated) | 488 | 13.3% |
| Self-Employed (Not Incorporated) | 86 | 2.3% |
| Not-for-profit Organizations | 276 | 7.5% |
| Local Government Employees | 375 | 10.2% |
| State Government Employees | 134 | 3.6% |
| Federal Government Employees | 58 | 1.6% |
| Unpaid Family Workers | 0 | 0.0% |
| Total | 3,683 | 100.0% |
Employment Status by Age in Garden City Park
According to the labor force statistics for Garden City Park, out of the total population over 16 years of age (6,240), 63.3% or 3,950 individuals are in the labor force, with 5.9% or 233 of them unemployed. The age group with the highest labor force participation rate is 20 to 24 years, with 97.0% or 513 individuals in the labor force. Within the labor force, the 16 to 19 years age range has the highest percentage of unemployed individuals, with 17.4% or 4 of them being unemployed.
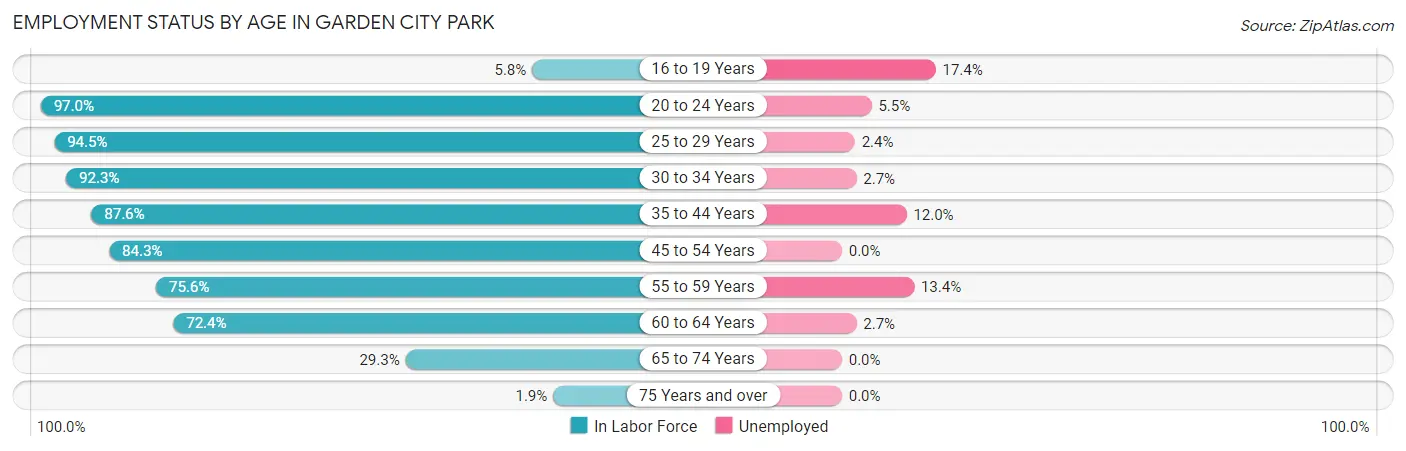
| Age Bracket | In Labor Force | Unemployed |
| 16 to 19 Years | 23 (5.8%) | 4 (17.4%) |
| 20 to 24 Years | 513 (97.0%) | 28 (5.5%) |
| 25 to 29 Years | 292 (94.5%) | 7 (2.4%) |
| 30 to 34 Years | 410 (92.3%) | 11 (2.7%) |
| 35 to 44 Years | 1,026 (87.6%) | 123 (12.0%) |
| 45 to 54 Years | 622 (84.3%) | 0 (0.0%) |
| 55 to 59 Years | 382 (75.6%) | 51 (13.4%) |
| 60 to 64 Years | 448 (72.4%) | 12 (2.7%) |
| 65 to 74 Years | 219 (29.3%) | 0 (0.0%) |
| 75 Years and over | 15 (1.9%) | 0 (0.0%) |
| Total | 3,950 (63.3%) | 233 (5.9%) |
Employment Status by Educational Attainment in Garden City Park
According to labor force statistics for Garden City Park, 84.0% of individuals (3,180) out of the total population between 25 and 64 years of age (3,786) are in the labor force, with 6.4% or 204 of them being unemployed. The group with the highest labor force participation rate are those with the educational attainment of college / associate degree, with 88.4% or 799 individuals in the labor force. Within the labor force, individuals with college / associate degree education have the highest percentage of unemployment, with 8.1% or 65 of them being unemployed.
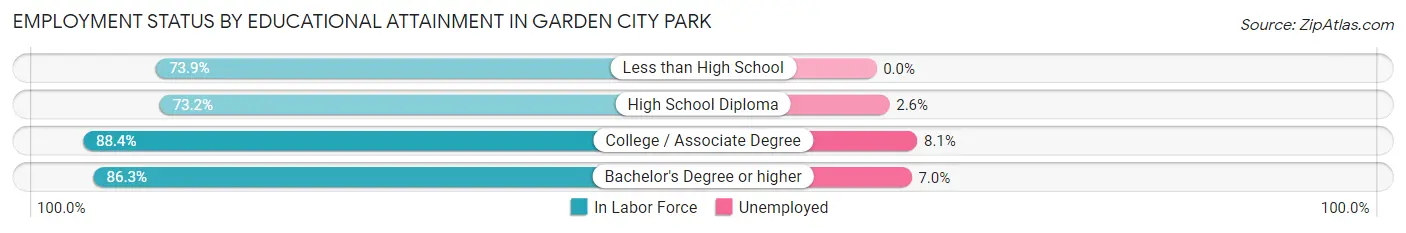
| Educational Attainment | In Labor Force | Unemployed |
| Less than High School | 119 (73.9%) | 0 (0.0%) |
| High School Diploma | 486 (73.2%) | 17 (2.6%) |
| College / Associate Degree | 799 (88.4%) | 73 (8.1%) |
| Bachelor's Degree or higher | 1,775 (86.3%) | 144 (7.0%) |
| Total | 3,180 (84.0%) | 242 (6.4%) |
Employment Occupations by Sex in Garden City Park
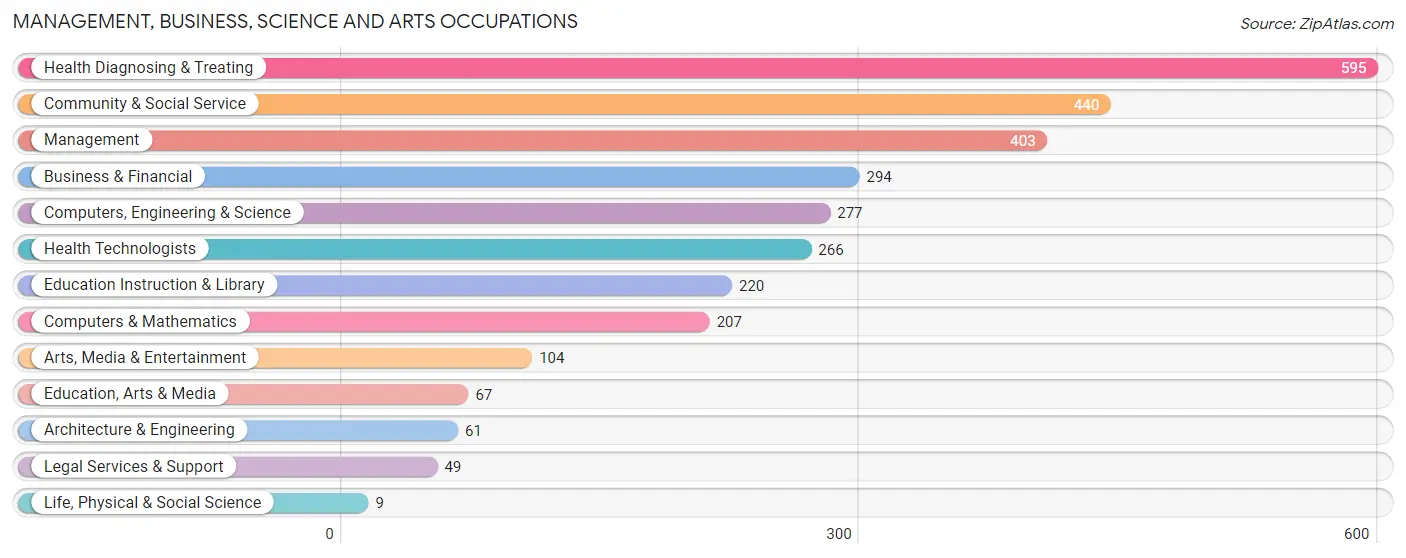
Management, Business, Science and Arts Occupations
The most common Management, Business, Science and Arts occupations in Garden City Park are Health Diagnosing & Treating (595 | 16.1%), Community & Social Service (440 | 11.9%), Management (403 | 10.9%), Business & Financial (294 | 8.0%), and Computers, Engineering & Science (277 | 7.5%).
Management, Business, Science and Arts Occupations by Sex
Within the Management, Business, Science and Arts occupations in Garden City Park, the most male-oriented occupations are Life, Physical & Social Science (100.0%), Computers & Mathematics (89.9%), and Computers, Engineering & Science (88.8%), while the most female-oriented occupations are Education, Arts & Media (83.6%), Education Instruction & Library (78.2%), and Health Technologists (77.8%).
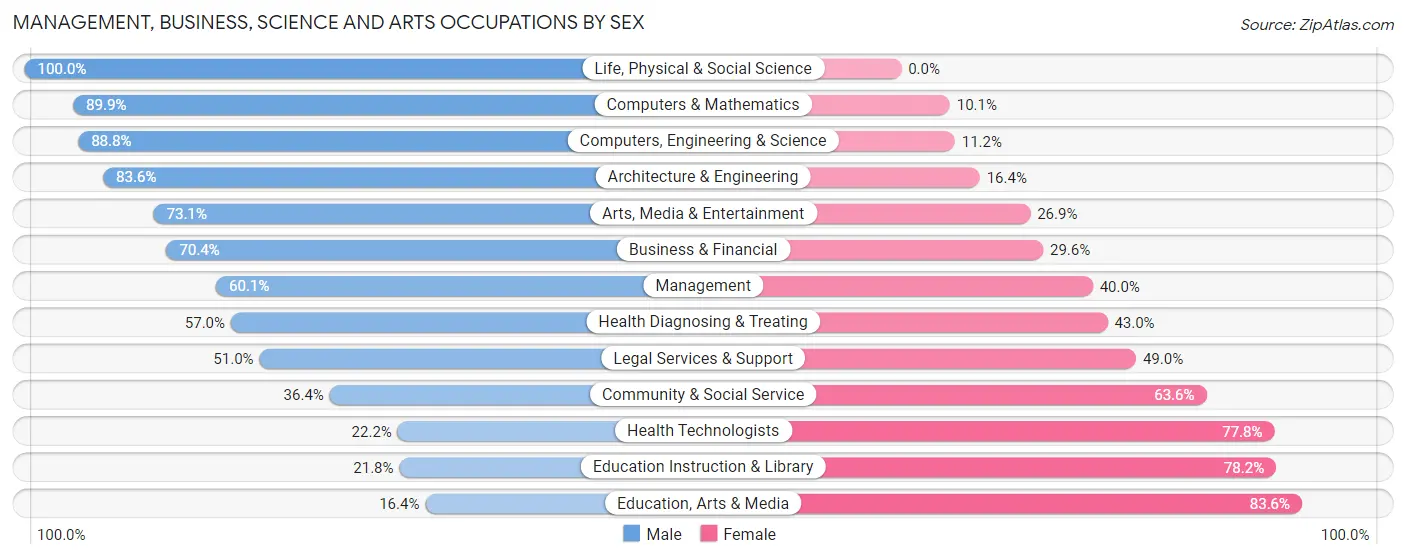
| Occupation | Male | Female |
| Management | 242 (60.1%) | 161 (40.0%) |
| Business & Financial | 207 (70.4%) | 87 (29.6%) |
| Computers, Engineering & Science | 246 (88.8%) | 31 (11.2%) |
| Computers & Mathematics | 186 (89.9%) | 21 (10.1%) |
| Architecture & Engineering | 51 (83.6%) | 10 (16.4%) |
| Life, Physical & Social Science | 9 (100.0%) | 0 (0.0%) |
| Community & Social Service | 160 (36.4%) | 280 (63.6%) |
| Education, Arts & Media | 11 (16.4%) | 56 (83.6%) |
| Legal Services & Support | 25 (51.0%) | 24 (49.0%) |
| Education Instruction & Library | 48 (21.8%) | 172 (78.2%) |
| Arts, Media & Entertainment | 76 (73.1%) | 28 (26.9%) |
| Health Diagnosing & Treating | 339 (57.0%) | 256 (43.0%) |
| Health Technologists | 59 (22.2%) | 207 (77.8%) |
| Total (Category) | 1,194 (59.4%) | 815 (40.6%) |
| Total (Overall) | 2,116 (57.3%) | 1,575 (42.7%) |
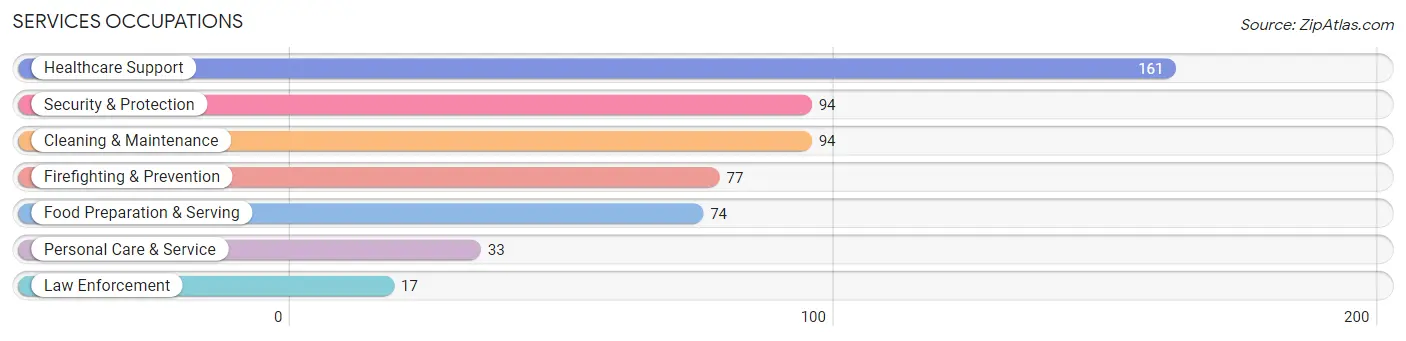
Services Occupations
The most common Services occupations in Garden City Park are Healthcare Support (161 | 4.4%), Security & Protection (94 | 2.5%), Cleaning & Maintenance (94 | 2.5%), Firefighting & Prevention (77 | 2.1%), and Food Preparation & Serving (74 | 2.0%).
Services Occupations by Sex
Within the Services occupations in Garden City Park, the most male-oriented occupations are Law Enforcement (100.0%), Cleaning & Maintenance (84.0%), and Security & Protection (72.3%), while the most female-oriented occupations are Personal Care & Service (100.0%), Healthcare Support (82.6%), and Food Preparation & Serving (66.2%).
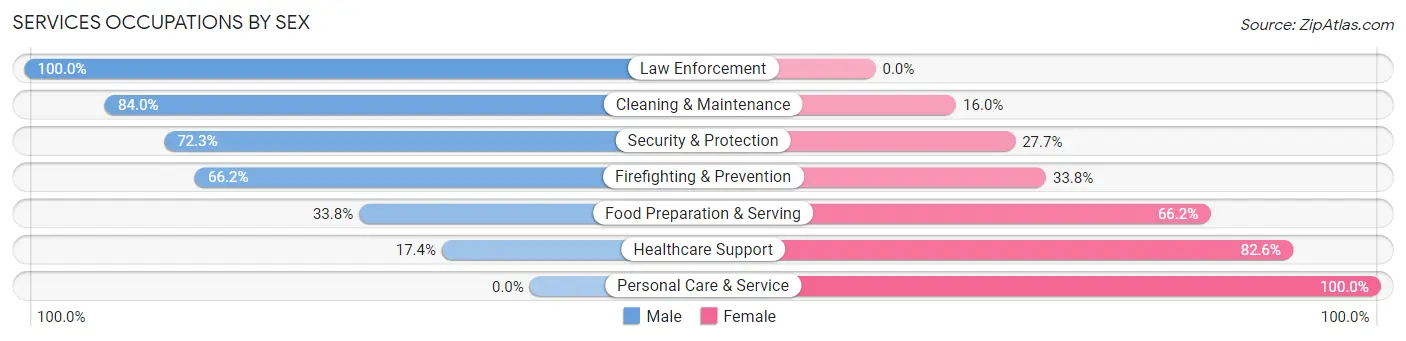
| Occupation | Male | Female |
| Healthcare Support | 28 (17.4%) | 133 (82.6%) |
| Security & Protection | 68 (72.3%) | 26 (27.7%) |
| Firefighting & Prevention | 51 (66.2%) | 26 (33.8%) |
| Law Enforcement | 17 (100.0%) | 0 (0.0%) |
| Food Preparation & Serving | 25 (33.8%) | 49 (66.2%) |
| Cleaning & Maintenance | 79 (84.0%) | 15 (16.0%) |
| Personal Care & Service | 0 (0.0%) | 33 (100.0%) |
| Total (Category) | 200 (43.9%) | 256 (56.1%) |
| Total (Overall) | 2,116 (57.3%) | 1,575 (42.7%) |
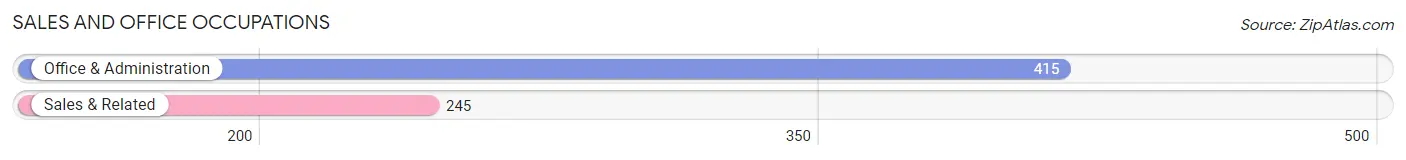
Sales and Office Occupations
The most common Sales and Office occupations in Garden City Park are Office & Administration (415 | 11.2%), and Sales & Related (245 | 6.6%).
Sales and Office Occupations by Sex
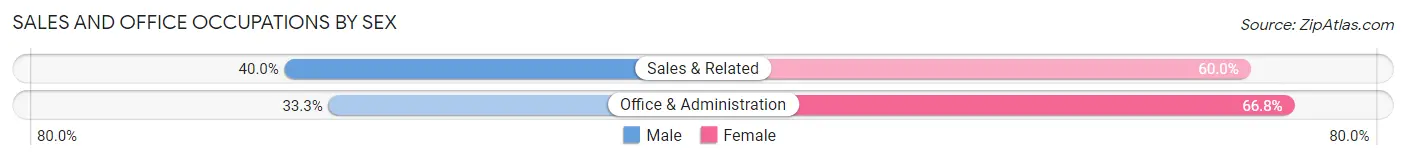
| Occupation | Male | Female |
| Sales & Related | 98 (40.0%) | 147 (60.0%) |
| Office & Administration | 138 (33.3%) | 277 (66.7%) |
| Total (Category) | 236 (35.8%) | 424 (64.2%) |
| Total (Overall) | 2,116 (57.3%) | 1,575 (42.7%) |
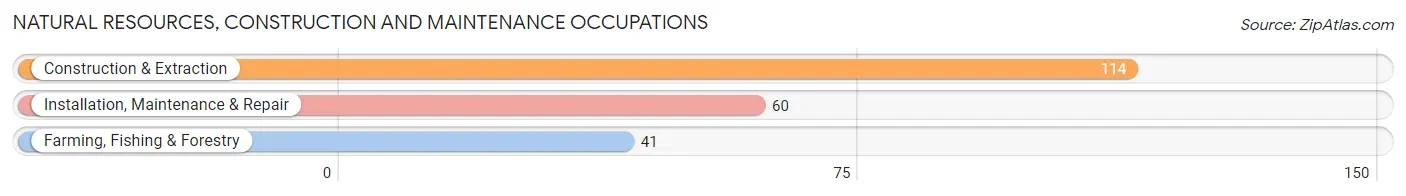
Natural Resources, Construction and Maintenance Occupations
The most common Natural Resources, Construction and Maintenance occupations in Garden City Park are Construction & Extraction (114 | 3.1%), Installation, Maintenance & Repair (60 | 1.6%), and Farming, Fishing & Forestry (41 | 1.1%).
Natural Resources, Construction and Maintenance Occupations by Sex
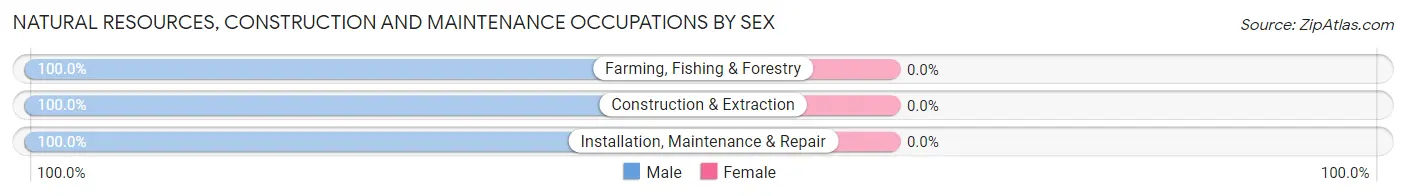
| Occupation | Male | Female |
| Farming, Fishing & Forestry | 41 (100.0%) | 0 (0.0%) |
| Construction & Extraction | 114 (100.0%) | 0 (0.0%) |
| Installation, Maintenance & Repair | 60 (100.0%) | 0 (0.0%) |
| Total (Category) | 215 (100.0%) | 0 (0.0%) |
| Total (Overall) | 2,116 (57.3%) | 1,575 (42.7%) |
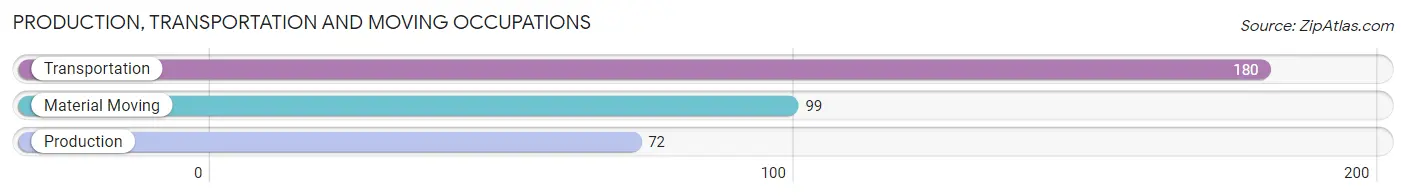
Production, Transportation and Moving Occupations
The most common Production, Transportation and Moving occupations in Garden City Park are Transportation (180 | 4.9%), Material Moving (99 | 2.7%), and Production (72 | 1.9%).
Production, Transportation and Moving Occupations by Sex
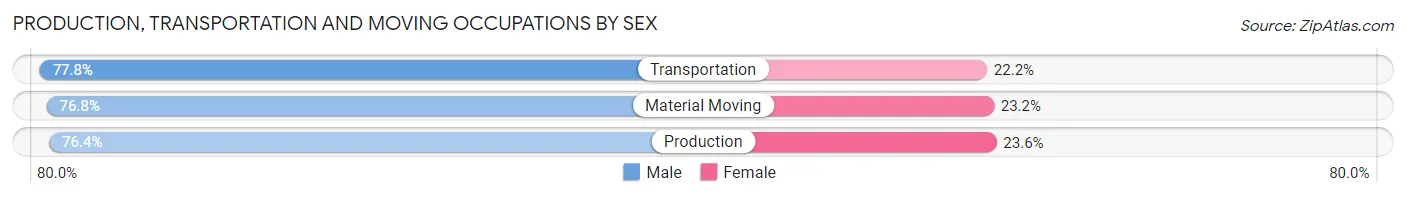
| Occupation | Male | Female |
| Production | 55 (76.4%) | 17 (23.6%) |
| Transportation | 140 (77.8%) | 40 (22.2%) |
| Material Moving | 76 (76.8%) | 23 (23.2%) |
| Total (Category) | 271 (77.2%) | 80 (22.8%) |
| Total (Overall) | 2,116 (57.3%) | 1,575 (42.7%) |
Employment Industries by Sex in Garden City Park
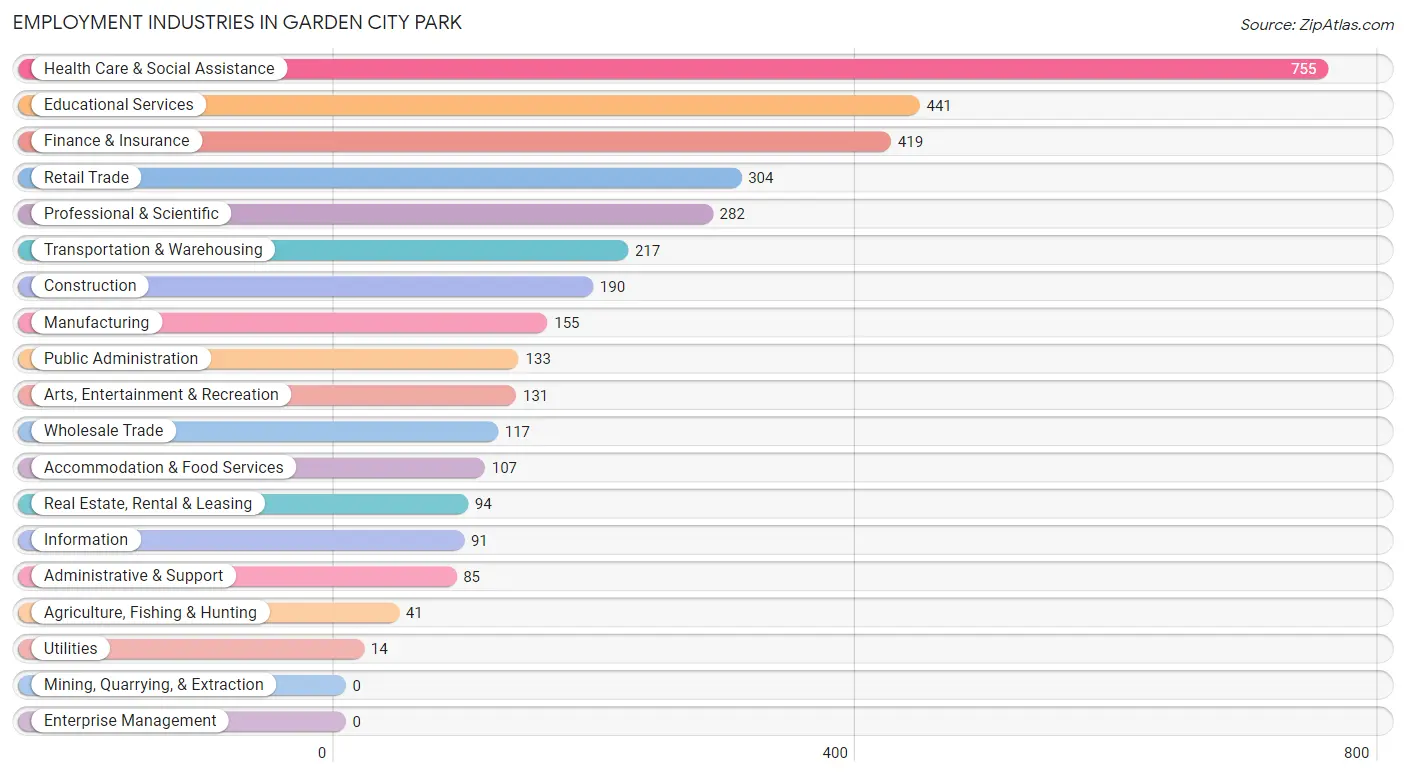
Employment Industries in Garden City Park
The major employment industries in Garden City Park include Health Care & Social Assistance (755 | 20.5%), Educational Services (441 | 11.9%), Finance & Insurance (419 | 11.4%), Retail Trade (304 | 8.2%), and Professional & Scientific (282 | 7.6%).
Employment Industries by Sex in Garden City Park
The Garden City Park industries that see more men than women are Agriculture, Fishing & Hunting (100.0%), Utilities (100.0%), and Information (100.0%), whereas the industries that tend to have a higher number of women are Wholesale Trade (72.7%), Educational Services (66.9%), and Accommodation & Food Services (63.5%).
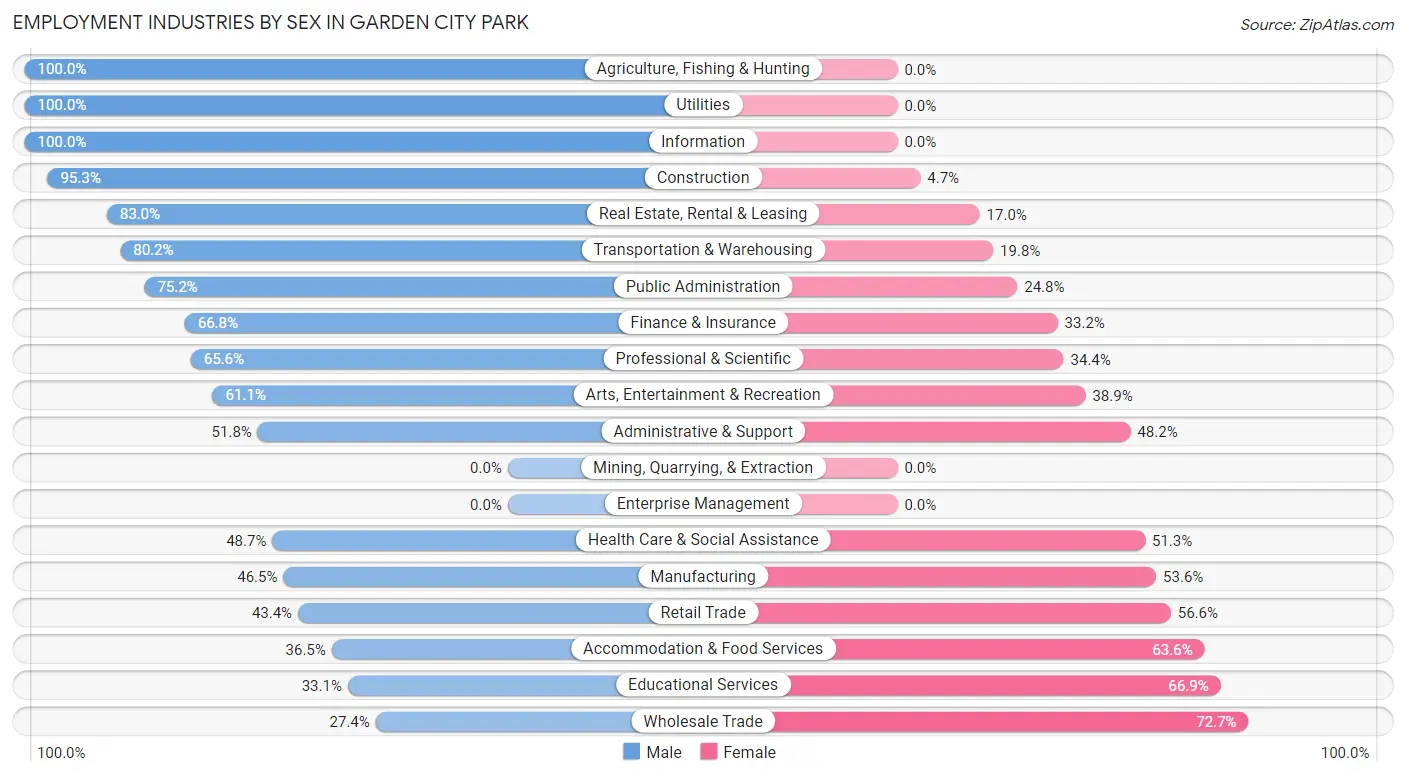
| Industry | Male | Female |
| Agriculture, Fishing & Hunting | 41 (100.0%) | 0 (0.0%) |
| Mining, Quarrying, & Extraction | 0 (0.0%) | 0 (0.0%) |
| Construction | 181 (95.3%) | 9 (4.7%) |
| Manufacturing | 72 (46.5%) | 83 (53.5%) |
| Wholesale Trade | 32 (27.4%) | 85 (72.7%) |
| Retail Trade | 132 (43.4%) | 172 (56.6%) |
| Transportation & Warehousing | 174 (80.2%) | 43 (19.8%) |
| Utilities | 14 (100.0%) | 0 (0.0%) |
| Information | 91 (100.0%) | 0 (0.0%) |
| Finance & Insurance | 280 (66.8%) | 139 (33.2%) |
| Real Estate, Rental & Leasing | 78 (83.0%) | 16 (17.0%) |
| Professional & Scientific | 185 (65.6%) | 97 (34.4%) |
| Enterprise Management | 0 (0.0%) | 0 (0.0%) |
| Administrative & Support | 44 (51.8%) | 41 (48.2%) |
| Educational Services | 146 (33.1%) | 295 (66.9%) |
| Health Care & Social Assistance | 368 (48.7%) | 387 (51.3%) |
| Arts, Entertainment & Recreation | 80 (61.1%) | 51 (38.9%) |
| Accommodation & Food Services | 39 (36.4%) | 68 (63.5%) |
| Public Administration | 100 (75.2%) | 33 (24.8%) |
| Total | 2,116 (57.3%) | 1,575 (42.7%) |
Education in Garden City Park
School Enrollment in Garden City Park
The most common levels of schooling among the 2,234 students in Garden City Park are elementary school (479 | 21.4%), graduate / professional (431 | 19.3%), and high school (404 | 18.1%).
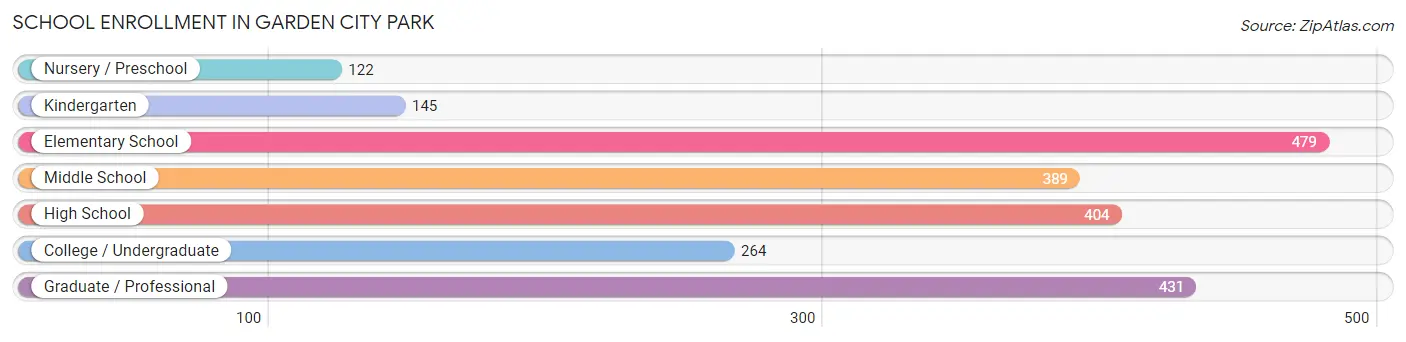
| School Level | # Students | % Students |
| Nursery / Preschool | 122 | 5.5% |
| Kindergarten | 145 | 6.5% |
| Elementary School | 479 | 21.4% |
| Middle School | 389 | 17.4% |
| High School | 404 | 18.1% |
| College / Undergraduate | 264 | 11.8% |
| Graduate / Professional | 431 | 19.3% |
| Total | 2,234 | 100.0% |
School Enrollment by Age by Funding Source in Garden City Park
Out of a total of 2,234 students who are enrolled in schools in Garden City Park, 663 (29.7%) attend a private institution, while the remaining 1,571 (70.3%) are enrolled in public schools. The age group of 35 years and over has the highest likelihood of being enrolled in private schools, with 151 (97.4% in the age bracket) enrolled. Conversely, the age group of 3 to 4 year olds has the lowest likelihood of being enrolled in a private school, with 97 (100.0% in the age bracket) attending a public institution.
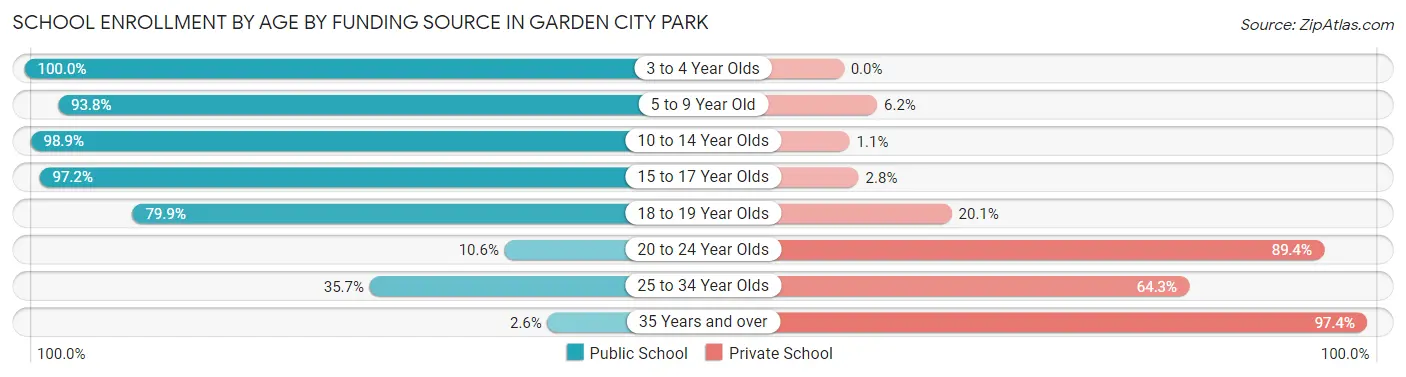
| Age Bracket | Public School | Private School |
| 3 to 4 Year Olds | 97 (100.0%) | 0 (0.0%) |
| 5 to 9 Year Old | 557 (93.8%) | 37 (6.2%) |
| 10 to 14 Year Olds | 447 (98.9%) | 5 (1.1%) |
| 15 to 17 Year Olds | 244 (97.2%) | 7 (2.8%) |
| 18 to 19 Year Olds | 155 (79.9%) | 39 (20.1%) |
| 20 to 24 Year Olds | 46 (10.6%) | 389 (89.4%) |
| 25 to 34 Year Olds | 20 (35.7%) | 36 (64.3%) |
| 35 Years and over | 4 (2.6%) | 151 (97.4%) |
| Total | 1,571 (70.3%) | 663 (29.7%) |
Educational Attainment by Field of Study in Garden City Park
Business (716 | 25.1%), science & technology (442 | 15.5%), computers & mathematics (275 | 9.7%), social sciences (252 | 8.8%), and education (159 | 5.6%) are the most common fields of study among 2,849 individuals in Garden City Park who have obtained a bachelor's degree or higher.
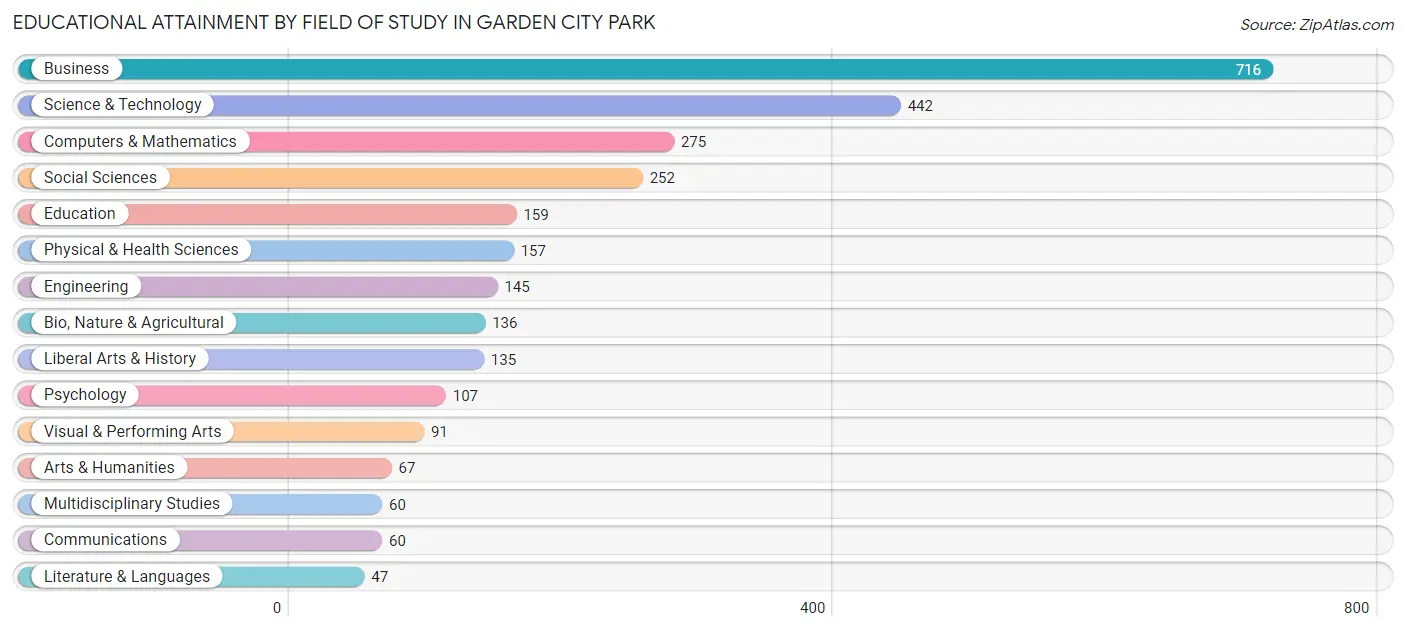
| Field of Study | # Graduates | % Graduates |
| Computers & Mathematics | 275 | 9.7% |
| Bio, Nature & Agricultural | 136 | 4.8% |
| Physical & Health Sciences | 157 | 5.5% |
| Psychology | 107 | 3.8% |
| Social Sciences | 252 | 8.8% |
| Engineering | 145 | 5.1% |
| Multidisciplinary Studies | 60 | 2.1% |
| Science & Technology | 442 | 15.5% |
| Business | 716 | 25.1% |
| Education | 159 | 5.6% |
| Literature & Languages | 47 | 1.7% |
| Liberal Arts & History | 135 | 4.7% |
| Visual & Performing Arts | 91 | 3.2% |
| Communications | 60 | 2.1% |
| Arts & Humanities | 67 | 2.4% |
| Total | 2,849 | 100.0% |
Transportation & Commute in Garden City Park
Vehicle Availability by Sex in Garden City Park
The most prevalent vehicle ownership categories in Garden City Park are males with 2 vehicles (882, accounting for 41.6%) and females with 2 vehicles (791, making up 56.5%).
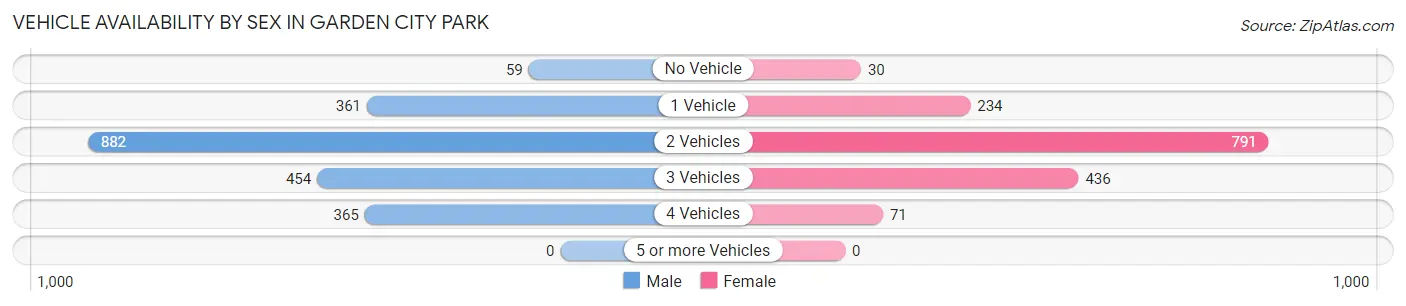
| Vehicles Available | Male | Female |
| No Vehicle | 59 (2.8%) | 30 (1.9%) |
| 1 Vehicle | 361 (17.0%) | 234 (15.0%) |
| 2 Vehicles | 882 (41.6%) | 791 (50.6%) |
| 3 Vehicles | 454 (21.4%) | 436 (27.9%) |
| 4 Vehicles | 365 (17.2%) | 71 (4.5%) |
| 5 or more Vehicles | 0 (0.0%) | 0 (0.0%) |
| Total | 2,121 (100.0%) | 1,562 (100.0%) |
Commute Time in Garden City Park
The most frequently occuring commute durations in Garden City Park are 20 to 24 minutes (644 commuters, 19.5%), 30 to 34 minutes (566 commuters, 17.2%), and 60 to 89 minutes (465 commuters, 14.1%).
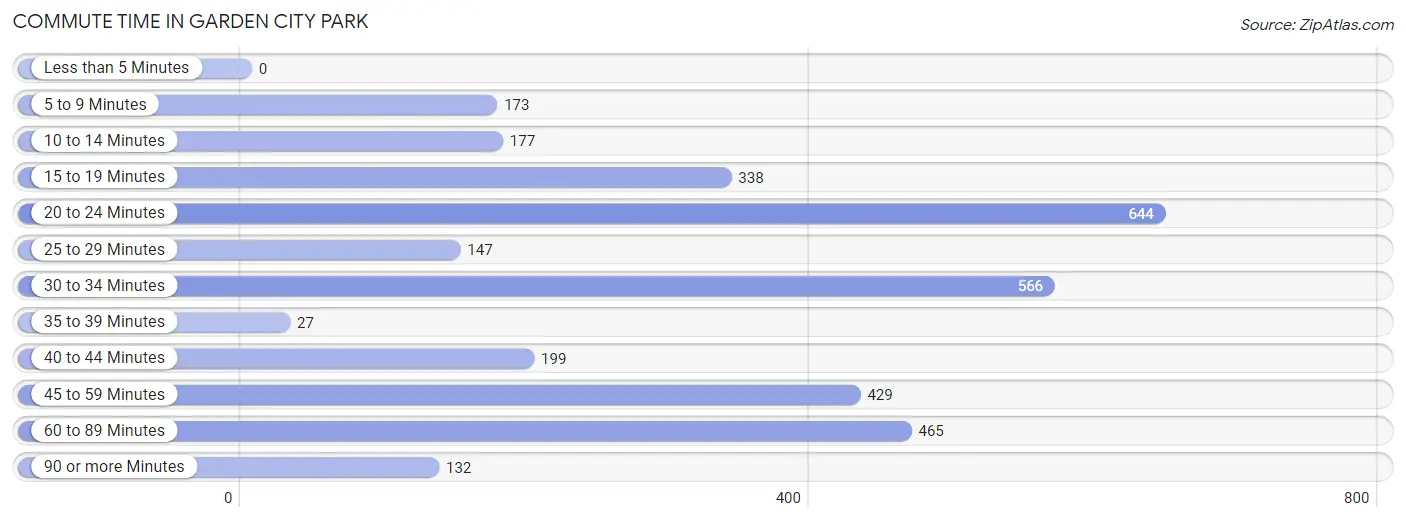
| Commute Time | # Commuters | % Commuters |
| Less than 5 Minutes | 0 | 0.0% |
| 5 to 9 Minutes | 173 | 5.2% |
| 10 to 14 Minutes | 177 | 5.4% |
| 15 to 19 Minutes | 338 | 10.2% |
| 20 to 24 Minutes | 644 | 19.5% |
| 25 to 29 Minutes | 147 | 4.5% |
| 30 to 34 Minutes | 566 | 17.2% |
| 35 to 39 Minutes | 27 | 0.8% |
| 40 to 44 Minutes | 199 | 6.0% |
| 45 to 59 Minutes | 429 | 13.0% |
| 60 to 89 Minutes | 465 | 14.1% |
| 90 or more Minutes | 132 | 4.0% |
Commute Time by Sex in Garden City Park
The most common commute times in Garden City Park are 20 to 24 minutes (367 commuters, 19.8%) for males and 20 to 24 minutes (277 commuters, 19.3%) for females.
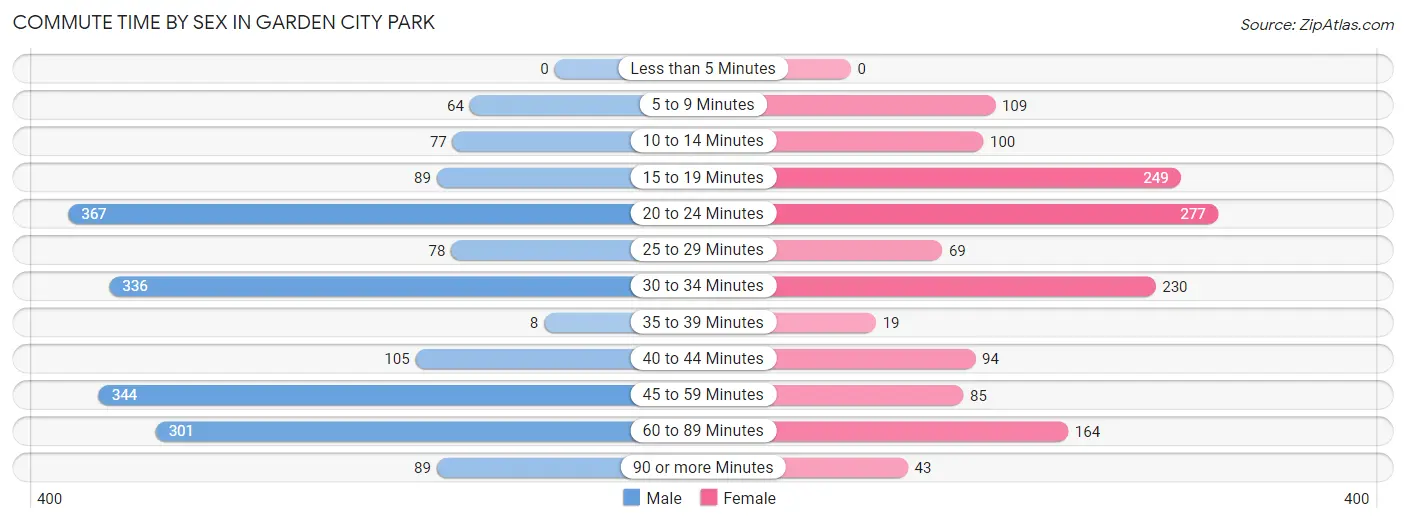
| Commute Time | Male | Female |
| Less than 5 Minutes | 0 (0.0%) | 0 (0.0%) |
| 5 to 9 Minutes | 64 (3.4%) | 109 (7.6%) |
| 10 to 14 Minutes | 77 (4.1%) | 100 (7.0%) |
| 15 to 19 Minutes | 89 (4.8%) | 249 (17.3%) |
| 20 to 24 Minutes | 367 (19.8%) | 277 (19.3%) |
| 25 to 29 Minutes | 78 (4.2%) | 69 (4.8%) |
| 30 to 34 Minutes | 336 (18.1%) | 230 (16.0%) |
| 35 to 39 Minutes | 8 (0.4%) | 19 (1.3%) |
| 40 to 44 Minutes | 105 (5.7%) | 94 (6.5%) |
| 45 to 59 Minutes | 344 (18.5%) | 85 (5.9%) |
| 60 to 89 Minutes | 301 (16.2%) | 164 (11.4%) |
| 90 or more Minutes | 89 (4.8%) | 43 (3.0%) |
Time of Departure to Work by Sex in Garden City Park
The most frequent times of departure to work in Garden City Park are 7:00 AM to 7:29 AM (349, 18.8%) for males and 8:30 AM to 8:59 AM (226, 15.7%) for females.
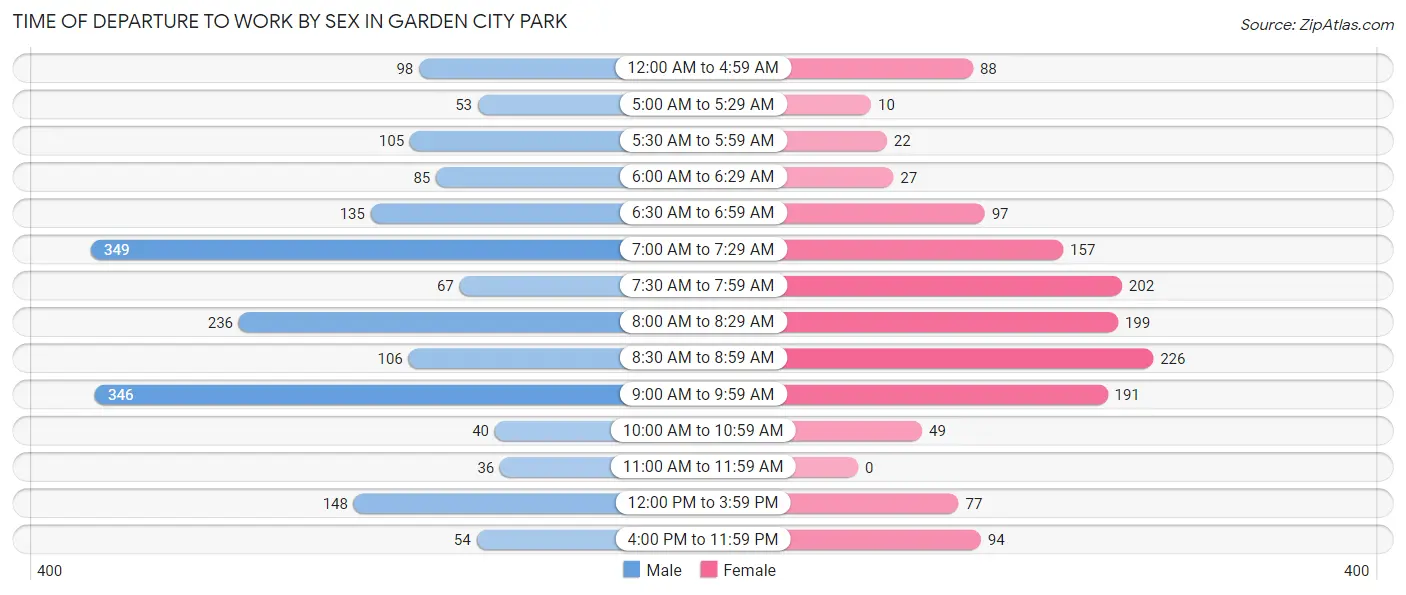
| Time of Departure | Male | Female |
| 12:00 AM to 4:59 AM | 98 (5.3%) | 88 (6.1%) |
| 5:00 AM to 5:29 AM | 53 (2.9%) | 10 (0.7%) |
| 5:30 AM to 5:59 AM | 105 (5.7%) | 22 (1.5%) |
| 6:00 AM to 6:29 AM | 85 (4.6%) | 27 (1.9%) |
| 6:30 AM to 6:59 AM | 135 (7.3%) | 97 (6.7%) |
| 7:00 AM to 7:29 AM | 349 (18.8%) | 157 (10.9%) |
| 7:30 AM to 7:59 AM | 67 (3.6%) | 202 (14.0%) |
| 8:00 AM to 8:29 AM | 236 (12.7%) | 199 (13.8%) |
| 8:30 AM to 8:59 AM | 106 (5.7%) | 226 (15.7%) |
| 9:00 AM to 9:59 AM | 346 (18.6%) | 191 (13.3%) |
| 10:00 AM to 10:59 AM | 40 (2.1%) | 49 (3.4%) |
| 11:00 AM to 11:59 AM | 36 (1.9%) | 0 (0.0%) |
| 12:00 PM to 3:59 PM | 148 (8.0%) | 77 (5.3%) |
| 4:00 PM to 11:59 PM | 54 (2.9%) | 94 (6.5%) |
| Total | 1,858 (100.0%) | 1,439 (100.0%) |
Housing Occupancy in Garden City Park
Occupancy by Ownership in Garden City Park
Of the total 2,481 dwellings in Garden City Park, owner-occupied units account for 2,067 (83.3%), while renter-occupied units make up 414 (16.7%).
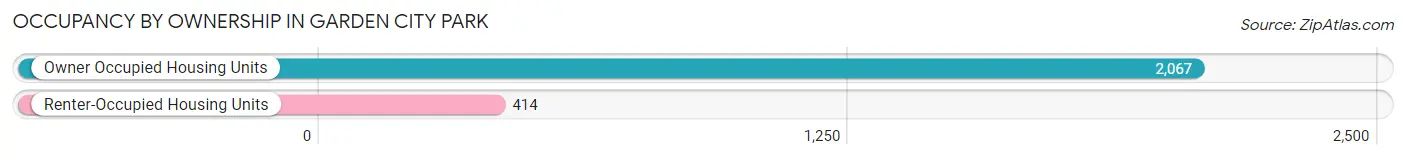
| Occupancy | # Housing Units | % Housing Units |
| Owner Occupied Housing Units | 2,067 | 83.3% |
| Renter-Occupied Housing Units | 414 | 16.7% |
| Total Occupied Housing Units | 2,481 | 100.0% |
Occupancy by Household Size in Garden City Park
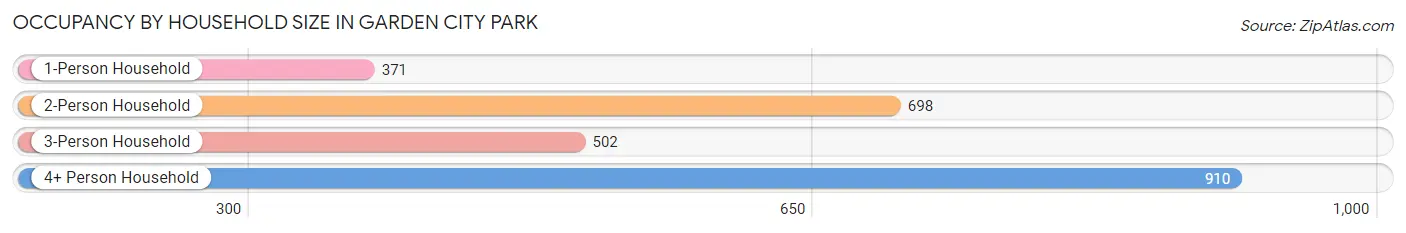
| Household Size | # Housing Units | % Housing Units |
| 1-Person Household | 371 | 14.9% |
| 2-Person Household | 698 | 28.1% |
| 3-Person Household | 502 | 20.2% |
| 4+ Person Household | 910 | 36.7% |
| Total Housing Units | 2,481 | 100.0% |
Occupancy by Ownership by Household Size in Garden City Park
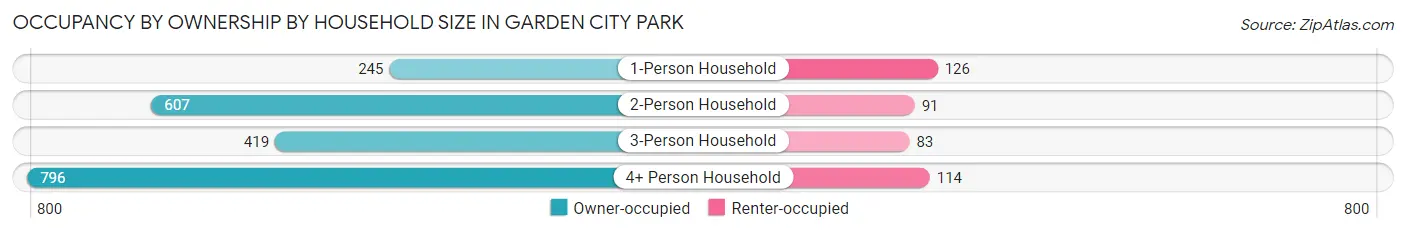
| Household Size | Owner-occupied | Renter-occupied |
| 1-Person Household | 245 (66.0%) | 126 (34.0%) |
| 2-Person Household | 607 (87.0%) | 91 (13.0%) |
| 3-Person Household | 419 (83.5%) | 83 (16.5%) |
| 4+ Person Household | 796 (87.5%) | 114 (12.5%) |
| Total Housing Units | 2,067 (83.3%) | 414 (16.7%) |
Occupancy by Educational Attainment in Garden City Park
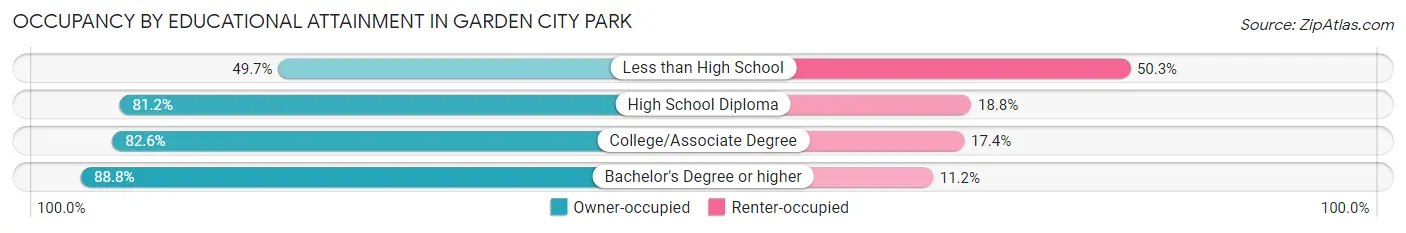
| Household Size | Owner-occupied | Renter-occupied |
| Less than High School | 80 (49.7%) | 81 (50.3%) |
| High School Diploma | 453 (81.2%) | 105 (18.8%) |
| College/Associate Degree | 403 (82.6%) | 85 (17.4%) |
| Bachelor's Degree or higher | 1,131 (88.8%) | 143 (11.2%) |
Occupancy by Age of Householder in Garden City Park
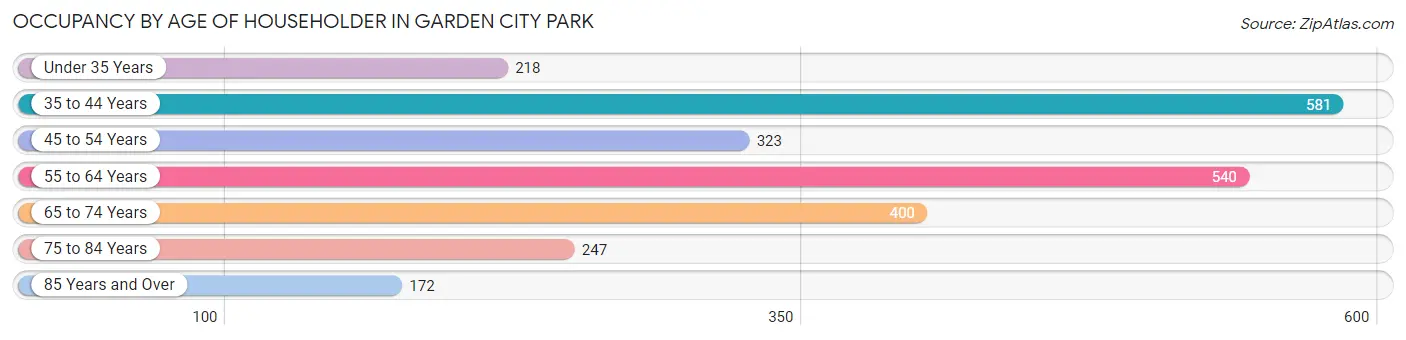
| Age Bracket | # Households | % Households |
| Under 35 Years | 218 | 8.8% |
| 35 to 44 Years | 581 | 23.4% |
| 45 to 54 Years | 323 | 13.0% |
| 55 to 64 Years | 540 | 21.8% |
| 65 to 74 Years | 400 | 16.1% |
| 75 to 84 Years | 247 | 10.0% |
| 85 Years and Over | 172 | 6.9% |
| Total | 2,481 | 100.0% |
Housing Finances in Garden City Park
Median Income by Occupancy in Garden City Park
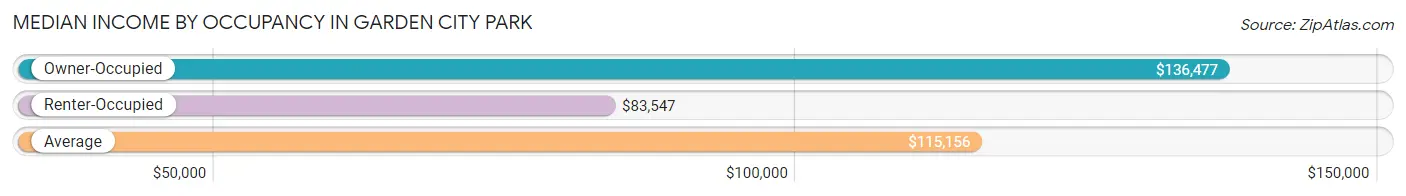
| Occupancy Type | # Households | Median Income |
| Owner-Occupied | 2,067 (83.3%) | $136,477 |
| Renter-Occupied | 414 (16.7%) | $83,547 |
| Average | 2,481 (100.0%) | $115,156 |
Occupancy by Householder Income Bracket in Garden City Park
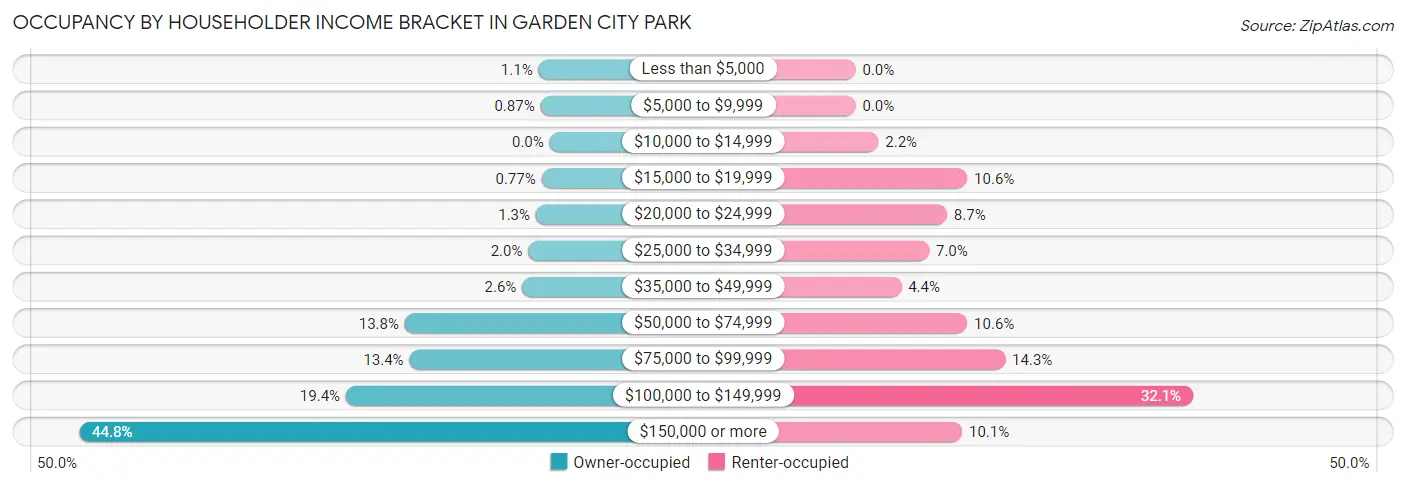
| Income Bracket | Owner-occupied | Renter-occupied |
| Less than $5,000 | 22 (1.1%) | 0 (0.0%) |
| $5,000 to $9,999 | 18 (0.9%) | 0 (0.0%) |
| $10,000 to $14,999 | 0 (0.0%) | 9 (2.2%) |
| $15,000 to $19,999 | 16 (0.8%) | 44 (10.6%) |
| $20,000 to $24,999 | 27 (1.3%) | 36 (8.7%) |
| $25,000 to $34,999 | 42 (2.0%) | 29 (7.0%) |
| $35,000 to $49,999 | 54 (2.6%) | 18 (4.3%) |
| $50,000 to $74,999 | 285 (13.8%) | 44 (10.6%) |
| $75,000 to $99,999 | 276 (13.4%) | 59 (14.2%) |
| $100,000 to $149,999 | 401 (19.4%) | 133 (32.1%) |
| $150,000 or more | 926 (44.8%) | 42 (10.1%) |
| Total | 2,067 (100.0%) | 414 (100.0%) |
Monthly Housing Cost Tiers in Garden City Park
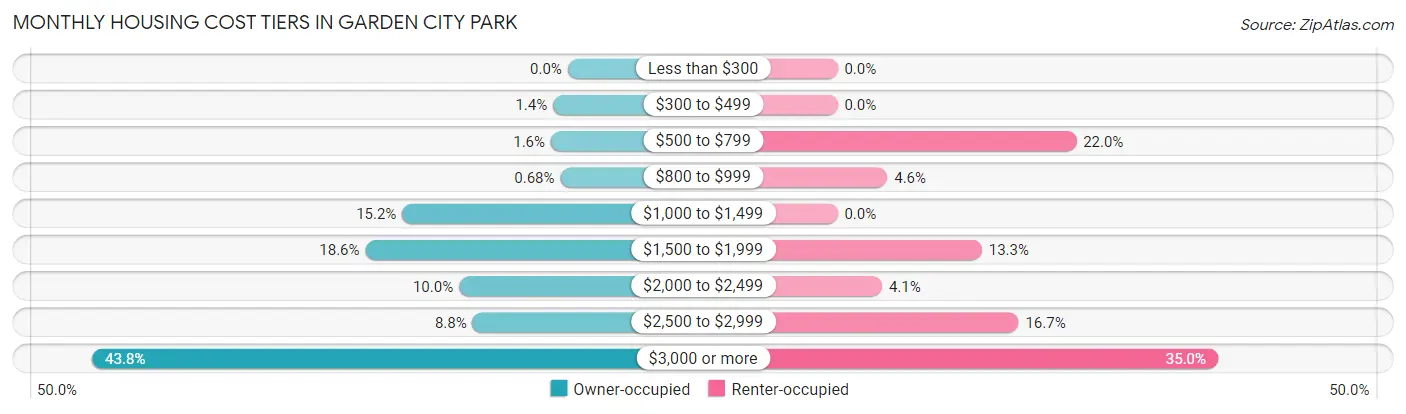
| Monthly Cost | Owner-occupied | Renter-occupied |
| Less than $300 | 0 (0.0%) | 0 (0.0%) |
| $300 to $499 | 28 (1.3%) | 0 (0.0%) |
| $500 to $799 | 32 (1.5%) | 91 (22.0%) |
| $800 to $999 | 14 (0.7%) | 19 (4.6%) |
| $1,000 to $1,499 | 315 (15.2%) | 0 (0.0%) |
| $1,500 to $1,999 | 385 (18.6%) | 55 (13.3%) |
| $2,000 to $2,499 | 207 (10.0%) | 17 (4.1%) |
| $2,500 to $2,999 | 181 (8.8%) | 69 (16.7%) |
| $3,000 or more | 905 (43.8%) | 145 (35.0%) |
| Total | 2,067 (100.0%) | 414 (100.0%) |
Physical Housing Characteristics in Garden City Park
Housing Structures in Garden City Park
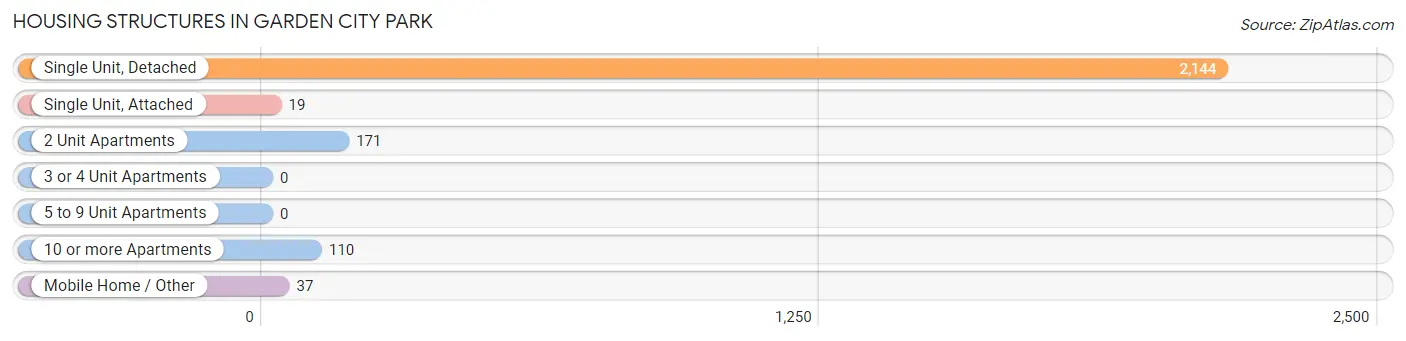
| Structure Type | # Housing Units | % Housing Units |
| Single Unit, Detached | 2,144 | 86.4% |
| Single Unit, Attached | 19 | 0.8% |
| 2 Unit Apartments | 171 | 6.9% |
| 3 or 4 Unit Apartments | 0 | 0.0% |
| 5 to 9 Unit Apartments | 0 | 0.0% |
| 10 or more Apartments | 110 | 4.4% |
| Mobile Home / Other | 37 | 1.5% |
| Total | 2,481 | 100.0% |
Housing Structures by Occupancy in Garden City Park
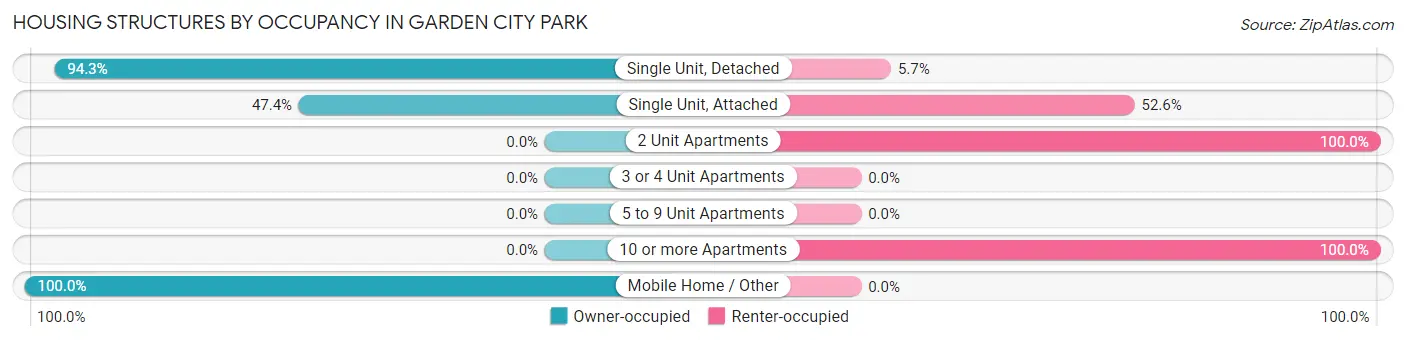
| Structure Type | Owner-occupied | Renter-occupied |
| Single Unit, Detached | 2,021 (94.3%) | 123 (5.7%) |
| Single Unit, Attached | 9 (47.4%) | 10 (52.6%) |
| 2 Unit Apartments | 0 (0.0%) | 171 (100.0%) |
| 3 or 4 Unit Apartments | 0 (0.0%) | 0 (0.0%) |
| 5 to 9 Unit Apartments | 0 (0.0%) | 0 (0.0%) |
| 10 or more Apartments | 0 (0.0%) | 110 (100.0%) |
| Mobile Home / Other | 37 (100.0%) | 0 (0.0%) |
| Total | 2,067 (83.3%) | 414 (16.7%) |
Housing Structures by Number of Rooms in Garden City Park
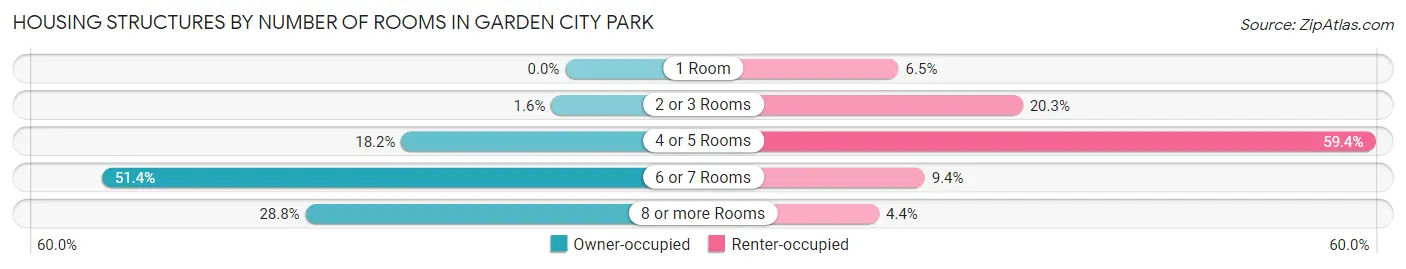
| Number of Rooms | Owner-occupied | Renter-occupied |
| 1 Room | 0 (0.0%) | 27 (6.5%) |
| 2 or 3 Rooms | 32 (1.5%) | 84 (20.3%) |
| 4 or 5 Rooms | 376 (18.2%) | 246 (59.4%) |
| 6 or 7 Rooms | 1,063 (51.4%) | 39 (9.4%) |
| 8 or more Rooms | 596 (28.8%) | 18 (4.3%) |
| Total | 2,067 (100.0%) | 414 (100.0%) |
Housing Structure by Heating Type in Garden City Park
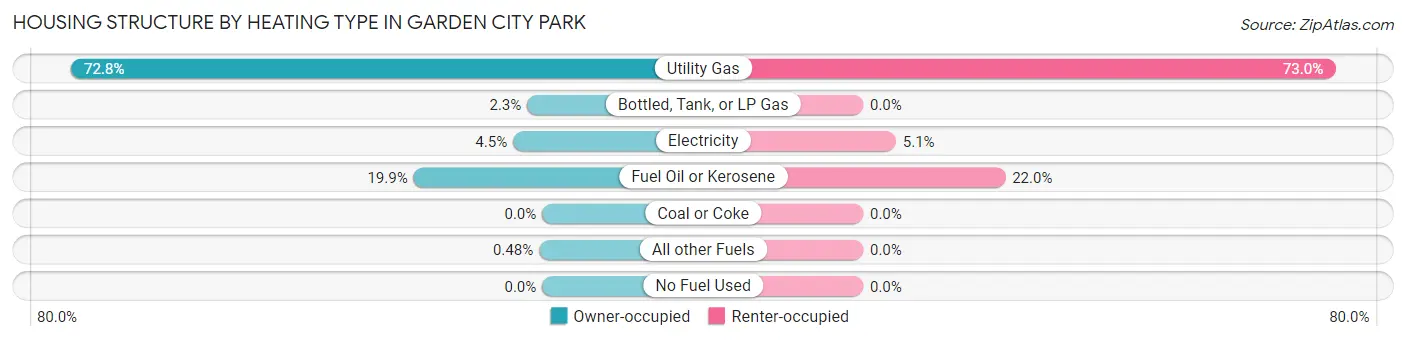
| Heating Type | Owner-occupied | Renter-occupied |
| Utility Gas | 1,505 (72.8%) | 302 (73.0%) |
| Bottled, Tank, or LP Gas | 48 (2.3%) | 0 (0.0%) |
| Electricity | 93 (4.5%) | 21 (5.1%) |
| Fuel Oil or Kerosene | 411 (19.9%) | 91 (22.0%) |
| Coal or Coke | 0 (0.0%) | 0 (0.0%) |
| All other Fuels | 10 (0.5%) | 0 (0.0%) |
| No Fuel Used | 0 (0.0%) | 0 (0.0%) |
| Total | 2,067 (100.0%) | 414 (100.0%) |
Household Vehicle Usage in Garden City Park
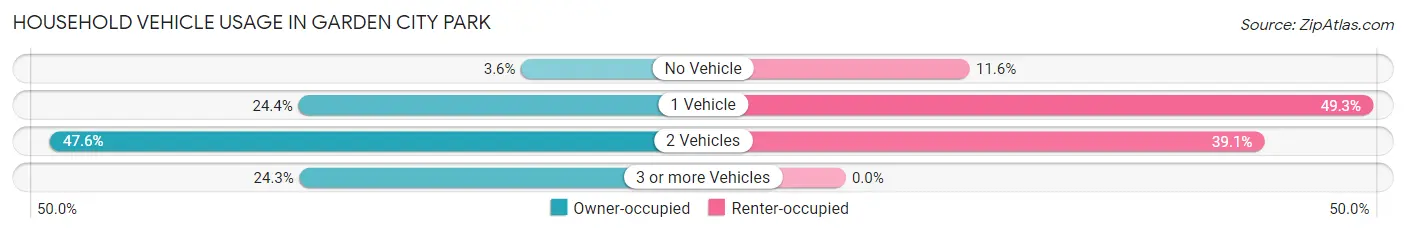
| Vehicles per Household | Owner-occupied | Renter-occupied |
| No Vehicle | 75 (3.6%) | 48 (11.6%) |
| 1 Vehicle | 505 (24.4%) | 204 (49.3%) |
| 2 Vehicles | 984 (47.6%) | 162 (39.1%) |
| 3 or more Vehicles | 503 (24.3%) | 0 (0.0%) |
| Total | 2,067 (100.0%) | 414 (100.0%) |
Real Estate & Mortgages in Garden City Park
Real Estate and Mortgage Overview in Garden City Park
| Characteristic | Without Mortgage | With Mortgage |
| Housing Units | 878 | 1,189 |
| Median Property Value | $697,800 | $775,300 |
| Median Household Income | $98,816 | $628 |
| Monthly Housing Costs | $1,501 | $893 |
| Real Estate Taxes | $10,001 | $6 |
Property Value by Mortgage Status in Garden City Park
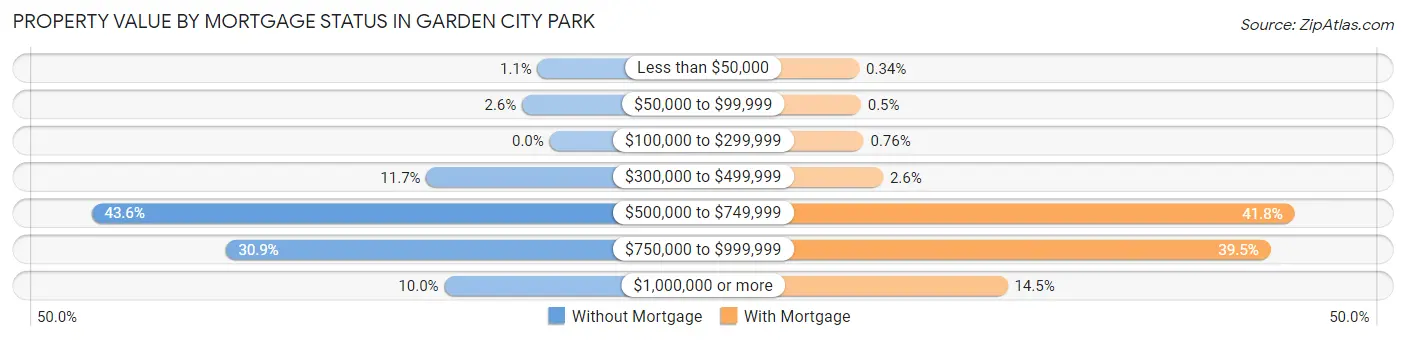
| Property Value | Without Mortgage | With Mortgage |
| Less than $50,000 | 10 (1.1%) | 4 (0.3%) |
| $50,000 to $99,999 | 23 (2.6%) | 6 (0.5%) |
| $100,000 to $299,999 | 0 (0.0%) | 9 (0.8%) |
| $300,000 to $499,999 | 103 (11.7%) | 31 (2.6%) |
| $500,000 to $749,999 | 383 (43.6%) | 497 (41.8%) |
| $750,000 to $999,999 | 271 (30.9%) | 470 (39.5%) |
| $1,000,000 or more | 88 (10.0%) | 172 (14.5%) |
| Total | 878 (100.0%) | 1,189 (100.0%) |
Household Income by Mortgage Status in Garden City Park
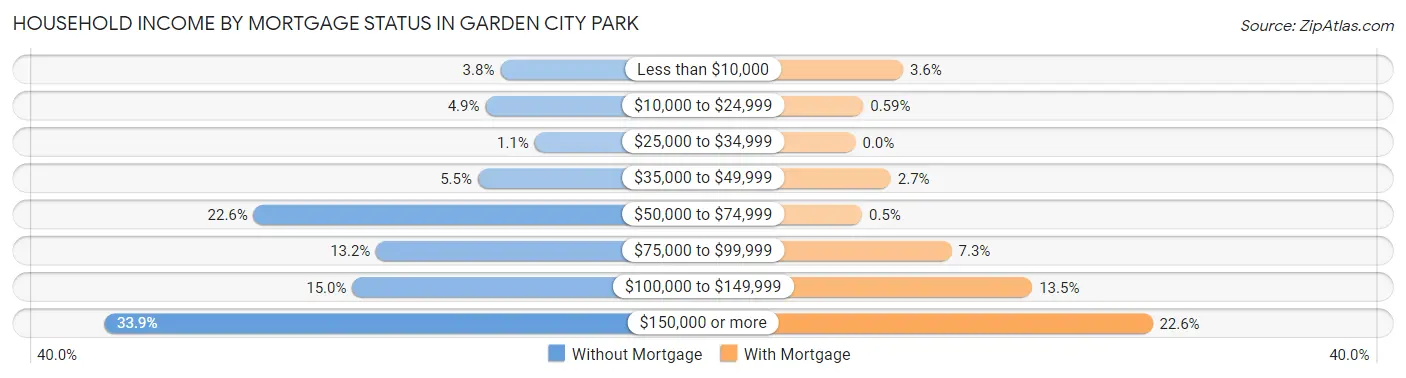
| Household Income | Without Mortgage | With Mortgage |
| Less than $10,000 | 33 (3.8%) | 43 (3.6%) |
| $10,000 to $24,999 | 43 (4.9%) | 7 (0.6%) |
| $25,000 to $34,999 | 10 (1.1%) | 0 (0.0%) |
| $35,000 to $49,999 | 48 (5.5%) | 32 (2.7%) |
| $50,000 to $74,999 | 198 (22.6%) | 6 (0.5%) |
| $75,000 to $99,999 | 116 (13.2%) | 87 (7.3%) |
| $100,000 to $149,999 | 132 (15.0%) | 160 (13.5%) |
| $150,000 or more | 298 (33.9%) | 269 (22.6%) |
| Total | 878 (100.0%) | 1,189 (100.0%) |
Property Value to Household Income Ratio in Garden City Park
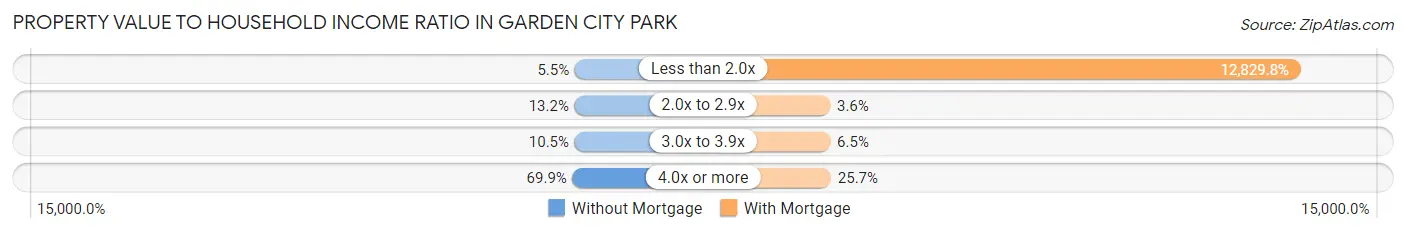
| Value-to-Income Ratio | Without Mortgage | With Mortgage |
| Less than 2.0x | 48 (5.5%) | 152,546 (12,829.8%) |
| 2.0x to 2.9x | 116 (13.2%) | 43 (3.6%) |
| 3.0x to 3.9x | 92 (10.5%) | 77 (6.5%) |
| 4.0x or more | 614 (69.9%) | 306 (25.7%) |
| Total | 878 (100.0%) | 1,189 (100.0%) |
Real Estate Taxes by Mortgage Status in Garden City Park
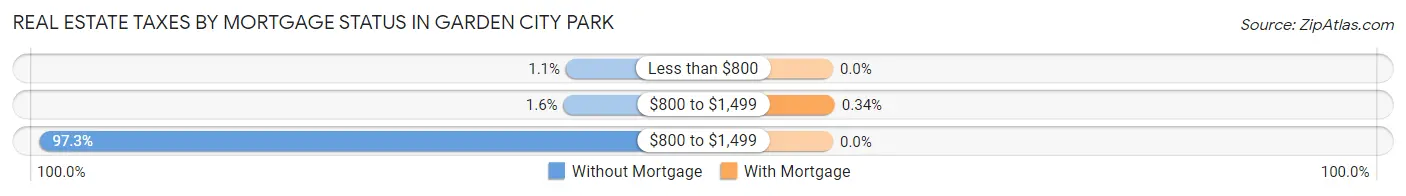
| Property Taxes | Without Mortgage | With Mortgage |
| Less than $800 | 10 (1.1%) | 0 (0.0%) |
| $800 to $1,499 | 14 (1.6%) | 4 (0.3%) |
| $800 to $1,499 | 854 (97.3%) | 0 (0.0%) |
| Total | 878 (100.0%) | 1,189 (100.0%) |
Health & Disability in Garden City Park
Health Insurance Coverage by Age in Garden City Park
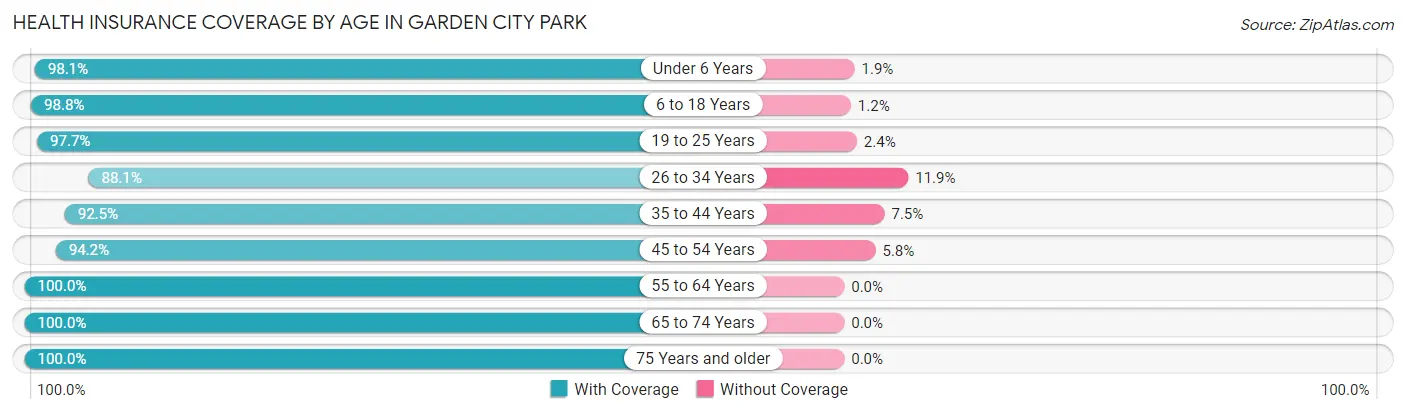
| Age Bracket | With Coverage | Without Coverage |
| Under 6 Years | 460 (98.1%) | 9 (1.9%) |
| 6 to 18 Years | 1,365 (98.8%) | 17 (1.2%) |
| 19 to 25 Years | 624 (97.7%) | 15 (2.4%) |
| 26 to 34 Years | 635 (88.1%) | 86 (11.9%) |
| 35 to 44 Years | 1,059 (92.5%) | 86 (7.5%) |
| 45 to 54 Years | 695 (94.2%) | 43 (5.8%) |
| 55 to 64 Years | 1,124 (100.0%) | 0 (0.0%) |
| 65 to 74 Years | 748 (100.0%) | 0 (0.0%) |
| 75 Years and older | 783 (100.0%) | 0 (0.0%) |
| Total | 7,493 (96.7%) | 256 (3.3%) |
Health Insurance Coverage by Citizenship Status in Garden City Park
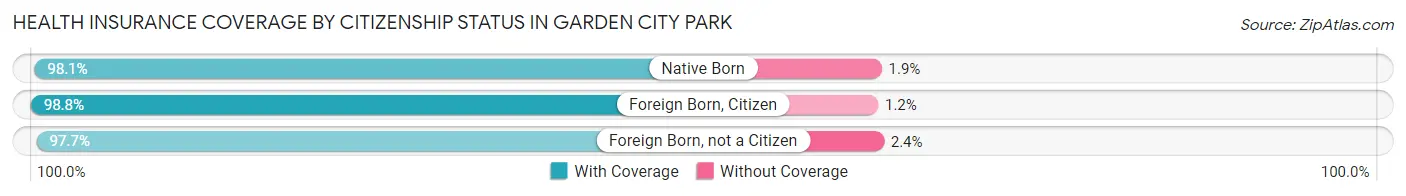
| Citizenship Status | With Coverage | Without Coverage |
| Native Born | 460 (98.1%) | 9 (1.9%) |
| Foreign Born, Citizen | 1,365 (98.8%) | 17 (1.2%) |
| Foreign Born, not a Citizen | 624 (97.7%) | 15 (2.4%) |
Health Insurance Coverage by Household Income in Garden City Park
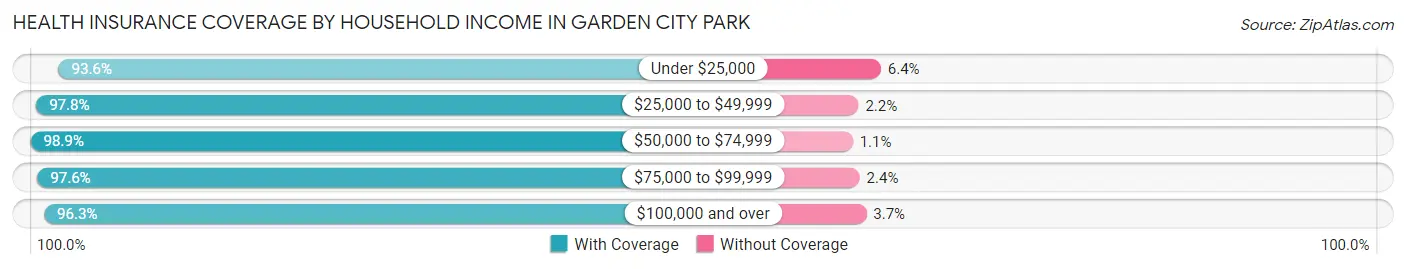
| Household Income | With Coverage | Without Coverage |
| Under $25,000 | 220 (93.6%) | 15 (6.4%) |
| $25,000 to $49,999 | 313 (97.8%) | 7 (2.2%) |
| $50,000 to $74,999 | 715 (98.9%) | 8 (1.1%) |
| $75,000 to $99,999 | 850 (97.6%) | 21 (2.4%) |
| $100,000 and over | 5,386 (96.3%) | 205 (3.7%) |
Public vs Private Health Insurance Coverage by Age in Garden City Park
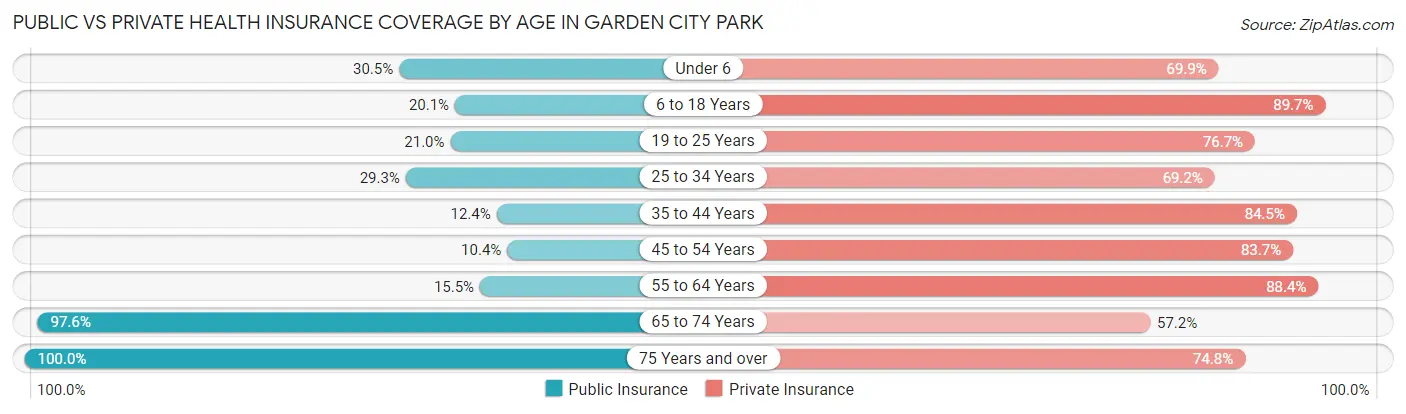
| Age Bracket | Public Insurance | Private Insurance |
| Under 6 | 143 (30.5%) | 328 (69.9%) |
| 6 to 18 Years | 278 (20.1%) | 1,240 (89.7%) |
| 19 to 25 Years | 134 (21.0%) | 490 (76.7%) |
| 25 to 34 Years | 211 (29.3%) | 499 (69.2%) |
| 35 to 44 Years | 142 (12.4%) | 967 (84.5%) |
| 45 to 54 Years | 77 (10.4%) | 618 (83.7%) |
| 55 to 64 Years | 174 (15.5%) | 994 (88.4%) |
| 65 to 74 Years | 730 (97.6%) | 428 (57.2%) |
| 75 Years and over | 783 (100.0%) | 586 (74.8%) |
| Total | 2,672 (34.5%) | 6,150 (79.4%) |
Disability Status by Sex by Age in Garden City Park
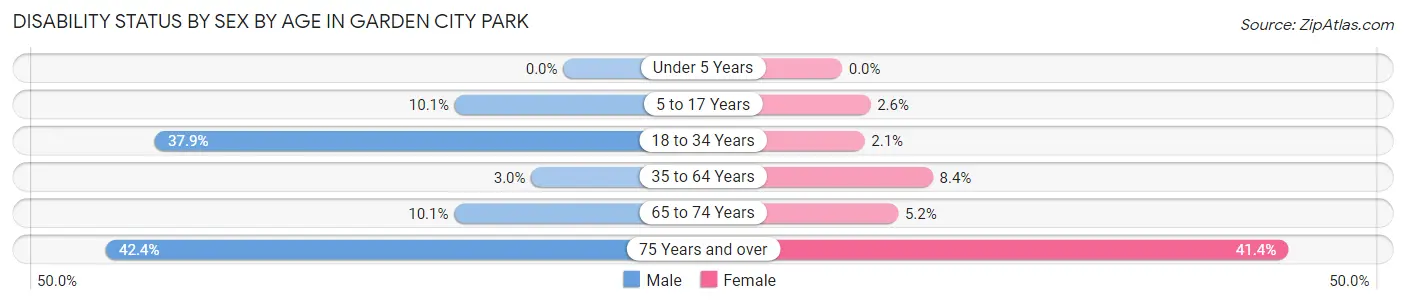
| Age Bracket | Male | Female |
| Under 5 Years | 0 (0.0%) | 0 (0.0%) |
| 5 to 17 Years | 81 (10.1%) | 13 (2.6%) |
| 18 to 34 Years | 339 (37.9%) | 13 (2.1%) |
| 35 to 64 Years | 45 (3.0%) | 126 (8.4%) |
| 65 to 74 Years | 33 (10.1%) | 22 (5.2%) |
| 75 Years and over | 115 (42.4%) | 212 (41.4%) |
Disability Class by Sex by Age in Garden City Park
Disability Class: Hearing Difficulty
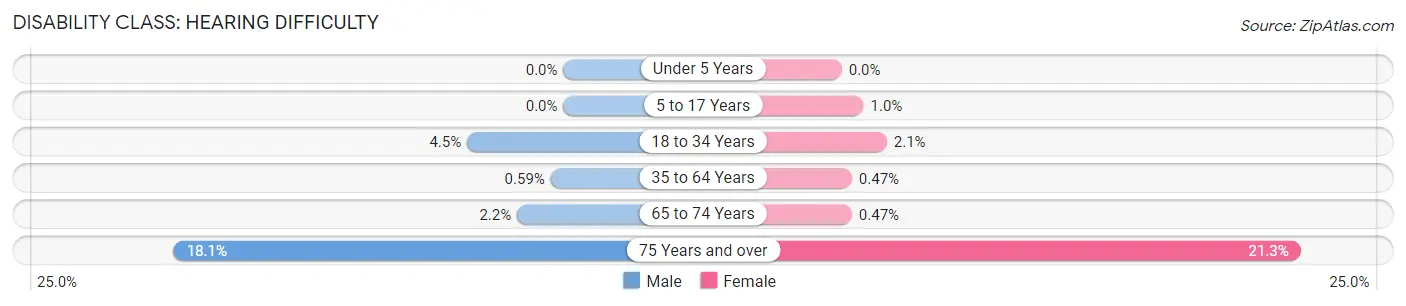
| Age Bracket | Male | Female |
| Under 5 Years | 0 (0.0%) | 0 (0.0%) |
| 5 to 17 Years | 0 (0.0%) | 5 (1.0%) |
| 18 to 34 Years | 40 (4.5%) | 13 (2.1%) |
| 35 to 64 Years | 9 (0.6%) | 7 (0.5%) |
| 65 to 74 Years | 7 (2.1%) | 2 (0.5%) |
| 75 Years and over | 49 (18.1%) | 109 (21.3%) |
Disability Class: Vision Difficulty
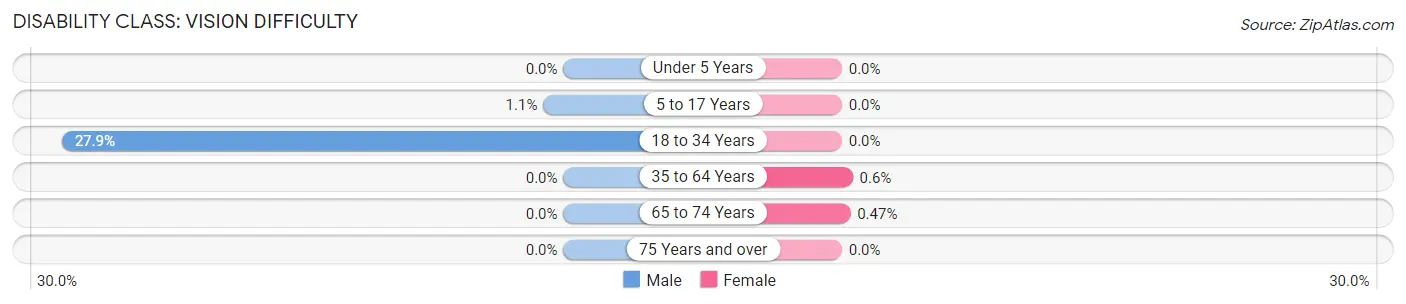
| Age Bracket | Male | Female |
| Under 5 Years | 0 (0.0%) | 0 (0.0%) |
| 5 to 17 Years | 9 (1.1%) | 0 (0.0%) |
| 18 to 34 Years | 250 (27.9%) | 0 (0.0%) |
| 35 to 64 Years | 0 (0.0%) | 9 (0.6%) |
| 65 to 74 Years | 0 (0.0%) | 2 (0.5%) |
| 75 Years and over | 0 (0.0%) | 0 (0.0%) |
Disability Class: Cognitive Difficulty
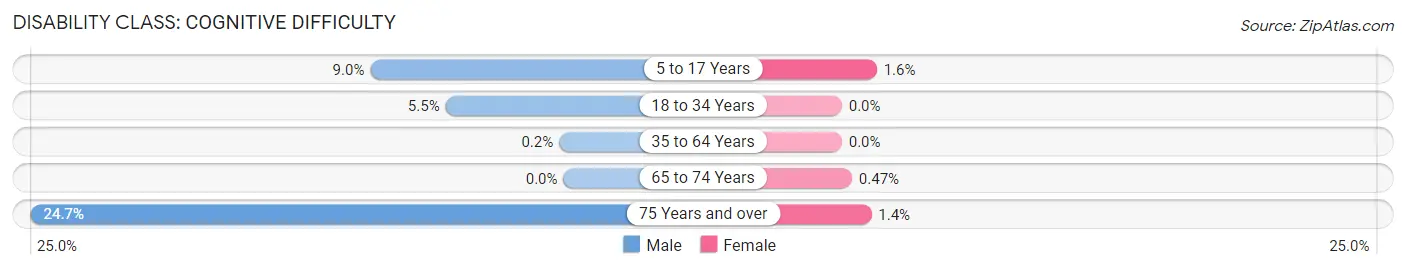
| Age Bracket | Male | Female |
| 5 to 17 Years | 72 (9.0%) | 8 (1.6%) |
| 18 to 34 Years | 49 (5.5%) | 0 (0.0%) |
| 35 to 64 Years | 3 (0.2%) | 0 (0.0%) |
| 65 to 74 Years | 0 (0.0%) | 2 (0.5%) |
| 75 Years and over | 67 (24.7%) | 7 (1.4%) |
Disability Class: Ambulatory Difficulty
| Age Bracket | Male | Female |
| 5 to 17 Years | 0 (0.0%) | 0 (0.0%) |
| 18 to 34 Years | 0 (0.0%) | 0 (0.0%) |
| 35 to 64 Years | 37 (2.5%) | 90 (6.0%) |
| 65 to 74 Years | 26 (8.0%) | 22 (5.2%) |
| 75 Years and over | 99 (36.5%) | 124 (24.2%) |
Disability Class: Self-Care Difficulty
| Age Bracket | Male | Female |
| 5 to 17 Years | 0 (0.0%) | 8 (1.6%) |
| 18 to 34 Years | 0 (0.0%) | 0 (0.0%) |
| 35 to 64 Years | 23 (1.5%) | 26 (1.7%) |
| 65 to 74 Years | 0 (0.0%) | 2 (0.5%) |
| 75 Years and over | 80 (29.5%) | 27 (5.3%) |
Technology Access in Garden City Park
Computing Device Access in Garden City Park
| Device Type | # Households | % Households |
| Desktop or Laptop | 2,158 | 87.0% |
| Smartphone | 2,212 | 89.2% |
| Tablet | 1,896 | 76.4% |
| No Computing Device | 117 | 4.7% |
| Total | 2,481 | 100.0% |
Internet Access in Garden City Park
| Internet Type | # Households | % Households |
| Dial-Up Internet | 0 | 0.0% |
| Broadband Home | 2,171 | 87.5% |
| Cellular Data Only | 101 | 4.1% |
| Satellite Internet | 92 | 3.7% |
| No Internet | 186 | 7.5% |
| Total | 2,481 | 100.0% |
Garden City Park Summary
Garden City Park is a hamlet located in the Town of North Hempstead in Nassau County, New York. It is located on the south side of the Hempstead Turnpike, between New Hyde Park and Franklin Square. The hamlet is home to a diverse population of approximately 8,000 people.
History
Garden City Park was originally part of the Hempstead Plains, a large grassland that stretched from the Atlantic Ocean to the Hempstead Plains. The area was first settled by the Dutch in the 1600s, and the area was known as Hempstead Plains. In the late 1800s, the area was developed as a farming community. The area was known as Garden City Park in the early 1900s, and the name was officially adopted in 1925.
The hamlet was home to a number of small farms, and the area was known for its produce. In the 1950s, the area began to experience rapid growth as the Long Island Expressway was built, connecting Garden City Park to New York City. The area also experienced an influx of new residents, as many people moved to the area from New York City.
Geography
Garden City Park is located in the Town of North Hempstead in Nassau County, New York. It is located on the south side of the Hempstead Turnpike, between New Hyde Park and Franklin Square. The hamlet is bordered by the Long Island Expressway to the north, New Hyde Park to the east, Franklin Square to the south, and Elmont to the west.
The area is mostly flat, with some rolling hills. The area is home to a number of parks, including Garden City Park, which is located in the center of the hamlet. The park features a playground, basketball courts, and a baseball field.
Economy
Garden City Park is home to a number of businesses, including restaurants, retail stores, and professional services. The area is also home to a number of industrial businesses, including a printing company, a metal fabrication company, and a food processing plant.
The area is also home to a number of medical facilities, including a hospital, a nursing home, and a number of medical offices. The area is also home to a number of educational institutions, including a public elementary school, a middle school, and a high school.
Demographics
As of the 2010 census, the population of Garden City Park was 8,000. The population is diverse, with a mix of races and ethnicities. The majority of the population is white (63%), followed by Hispanic (17%), Asian (10%), and African American (7%).
The median household income in Garden City Park is $76,000, and the median home value is $521,000. The area is home to a number of families, with the majority of households (60%) consisting of married couples. The area is also home to a number of young professionals, with the median age being 38.
Conclusion
Garden City Park is a hamlet located in the Town of North Hempstead in Nassau County, New York. It is located on the south side of the Hempstead Turnpike, between New Hyde Park and Franklin Square. The hamlet is home to a diverse population of approximately 8,000 people. The area is mostly flat, with some rolling hills, and is home to a number of businesses, medical facilities, and educational institutions. The population is diverse, with a mix of races and ethnicities, and the median household income is $76,000. Garden City Park is a vibrant community with a rich history and a bright future.
Common Questions
What is Per Capita Income in Garden City Park?
Per Capita income in Garden City Park is $47,917.
What is the Median Family Income in Garden City Park?
Median Family Income in Garden City Park is $137,500.
What is the Median Household income in Garden City Park?
Median Household Income in Garden City Park is $115,156.
What is Income or Wage Gap in Garden City Park?
Income or Wage Gap in Garden City Park is 20.1%.
Women in Garden City Park earn 79.9 cents for every dollar earned by a man.
What is Inequality or Gini Index in Garden City Park?
Inequality or Gini Index in Garden City Park is 0.39.
What is the Total Population of Garden City Park?
Total Population of Garden City Park is 7,775.
What is the Total Male Population of Garden City Park?
Total Male Population of Garden City Park is 4,058.
What is the Total Female Population of Garden City Park?
Total Female Population of Garden City Park is 3,717.
What is the Ratio of Males per 100 Females in Garden City Park?
There are 109.17 Males per 100 Females in Garden City Park.
What is the Ratio of Females per 100 Males in Garden City Park?
There are 91.60 Females per 100 Males in Garden City Park.
What is the Median Population Age in Garden City Park?
Median Population Age in Garden City Park is 40.9 Years.
What is the Average Family Size in Garden City Park
Average Family Size in Garden City Park is 3.5 People.
What is the Average Household Size in Garden City Park
Average Household Size in Garden City Park is 3.1 People.
How Large is the Labor Force in Garden City Park?
There are 3,950 People in the Labor Forcein in Garden City Park.
What is the Percentage of People in the Labor Force in Garden City Park?
63.3% of People are in the Labor Force in Garden City Park.
What is the Unemployment Rate in Garden City Park?
Unemployment Rate in Garden City Park is 5.9%.