Titusville, NY Map & Demographics
Titusville Map
Titusville Overview
$61,641
PER CAPITA INCOME
$136,964
AVG FAMILY INCOME
$108,472
AVG HOUSEHOLD INCOME
0.38
INEQUALITY / GINI INDEX
613
TOTAL POPULATION
276
MALE POPULATION
337
FEMALE POPULATION
81.90
MALES / 100 FEMALES
122.10
FEMALES / 100 MALES
58.6
MEDIAN AGE
2.5
AVG FAMILY SIZE
2.0
AVG HOUSEHOLD SIZE
289
LABOR FORCE [ PEOPLE ]
54.5%
PERCENT IN LABOR FORCE
Income in Titusville
Income Overview in Titusville
Per Capita Income in Titusville is $61,641, while median incomes of families and households are $136,964 and $108,472 respectively.
| Characteristic | Number | Measure |
| Per Capita Income | 613 | $61,641 |
| Median Family Income | 188 | $136,964 |
| Mean Family Income | 188 | $159,897 |
| Median Household Income | 311 | $108,472 |
| Mean Household Income | 311 | $124,909 |
| Income Deficit | 188 | $0 |
| Wage / Income Gap (%) | 613 | 0.00% |
| Wage / Income Gap ($) | 613 | 100.00¢ per $1 |
| Gini / Inequality Index | 613 | 0.38 |
Earnings by Sex in Titusville
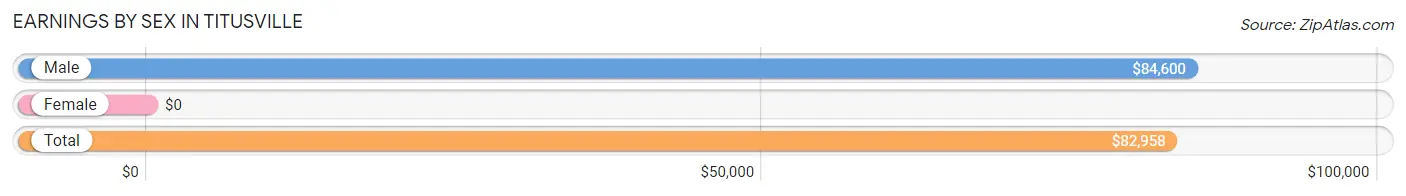
| Sex | Number | Average Earnings |
| Male | 200 (67.3%) | $84,600 |
| Female | 97 (32.7%) | $0 |
| Total | 297 (100.0%) | $82,958 |
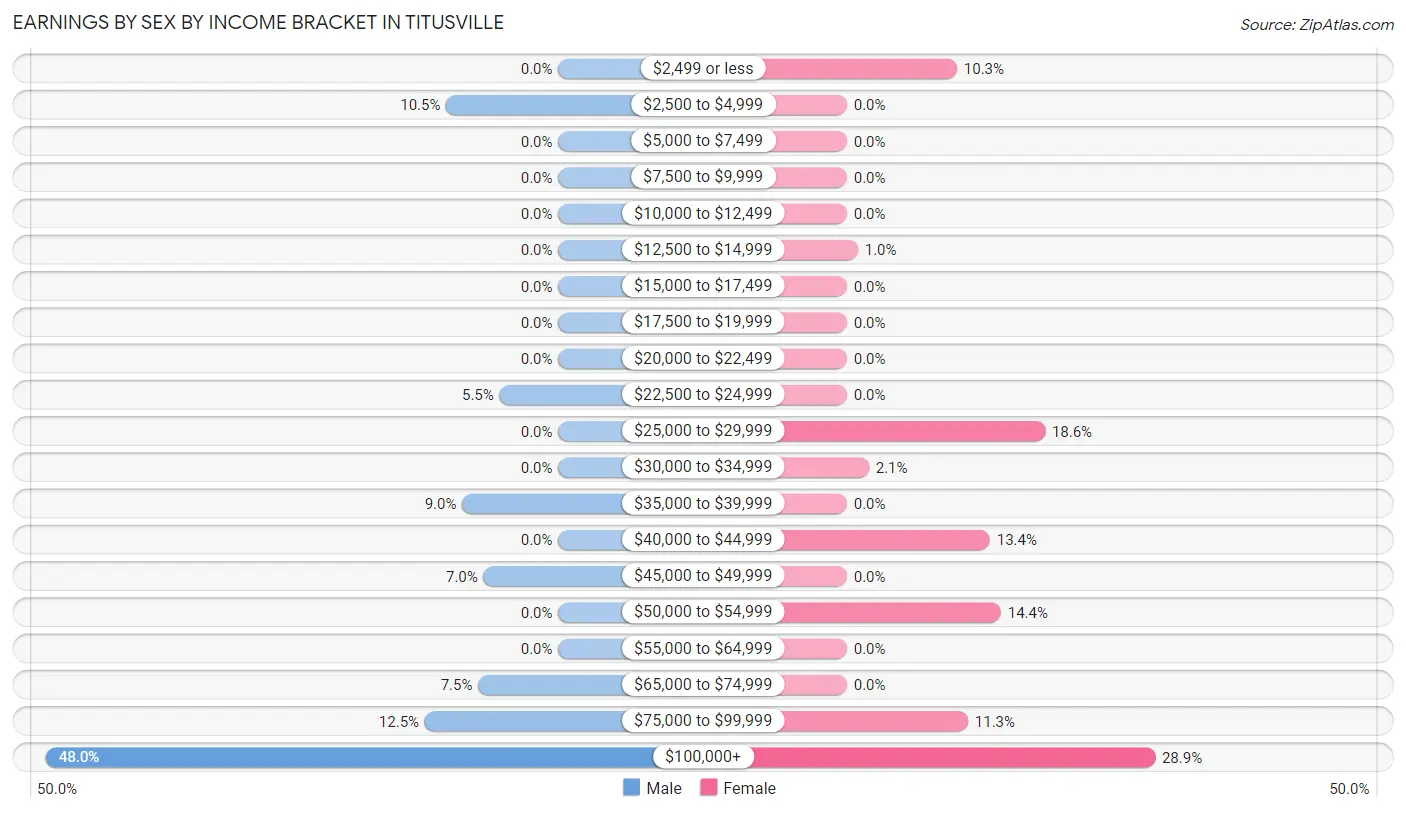
Earnings by Sex by Income Bracket in Titusville
The most common earnings brackets in Titusville are $100,000+ for men (96 | 48.0%) and $100,000+ for women (28 | 28.9%).
| Income | Male | Female |
| $2,499 or less | 0 (0.0%) | 10 (10.3%) |
| $2,500 to $4,999 | 21 (10.5%) | 0 (0.0%) |
| $5,000 to $7,499 | 0 (0.0%) | 0 (0.0%) |
| $7,500 to $9,999 | 0 (0.0%) | 0 (0.0%) |
| $10,000 to $12,499 | 0 (0.0%) | 0 (0.0%) |
| $12,500 to $14,999 | 0 (0.0%) | 1 (1.0%) |
| $15,000 to $17,499 | 0 (0.0%) | 0 (0.0%) |
| $17,500 to $19,999 | 0 (0.0%) | 0 (0.0%) |
| $20,000 to $22,499 | 0 (0.0%) | 0 (0.0%) |
| $22,500 to $24,999 | 11 (5.5%) | 0 (0.0%) |
| $25,000 to $29,999 | 0 (0.0%) | 18 (18.6%) |
| $30,000 to $34,999 | 0 (0.0%) | 2 (2.1%) |
| $35,000 to $39,999 | 18 (9.0%) | 0 (0.0%) |
| $40,000 to $44,999 | 0 (0.0%) | 13 (13.4%) |
| $45,000 to $49,999 | 14 (7.0%) | 0 (0.0%) |
| $50,000 to $54,999 | 0 (0.0%) | 14 (14.4%) |
| $55,000 to $64,999 | 0 (0.0%) | 0 (0.0%) |
| $65,000 to $74,999 | 15 (7.5%) | 0 (0.0%) |
| $75,000 to $99,999 | 25 (12.5%) | 11 (11.3%) |
| $100,000+ | 96 (48.0%) | 28 (28.9%) |
| Total | 200 (100.0%) | 97 (100.0%) |
Earnings by Sex by Educational Attainment in Titusville
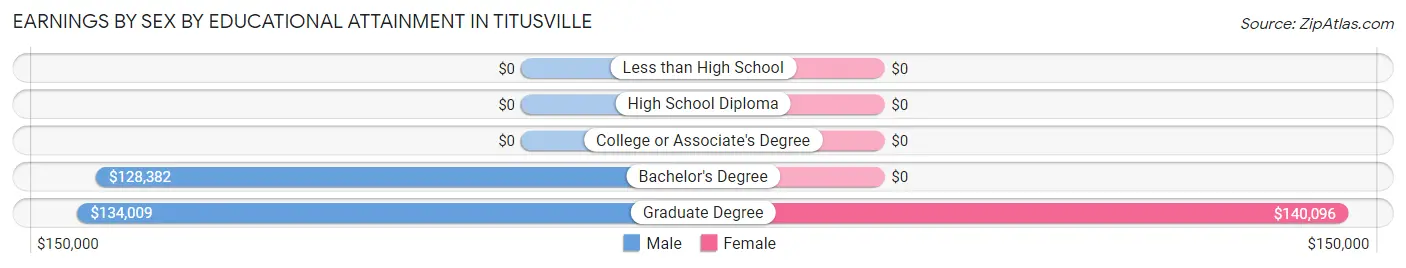
| Educational Attainment | Male Income | Female Income |
| Less than High School | - | - |
| High School Diploma | - | - |
| College or Associate's Degree | - | - |
| Bachelor's Degree | $128,382 | $0 |
| Graduate Degree | $134,009 | $140,096 |
| Total | $128,676 | $0 |
Family Income in Titusville
Family Income Brackets in Titusville
According to the Titusville family income data, there are 100 families falling into the $100,000 to $149,999 income range, which is the most common income bracket and makes up 53.2% of all families.
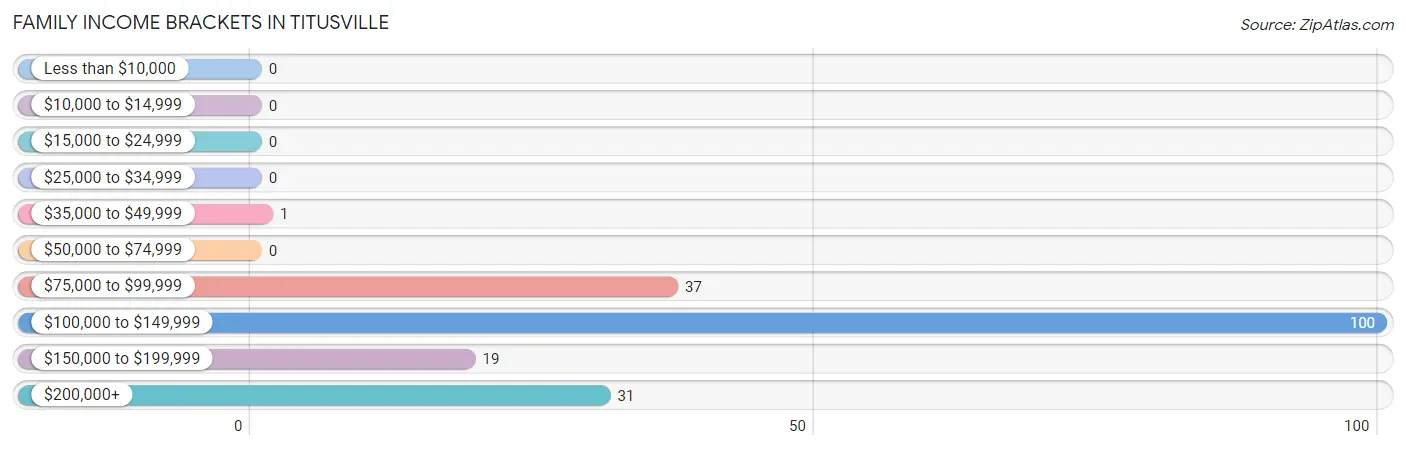
| Income Bracket | # Families | % Families |
| Less than $10,000 | 0 | 0.0% |
| $10,000 to $14,999 | 0 | 0.0% |
| $15,000 to $24,999 | 0 | 0.0% |
| $25,000 to $34,999 | 0 | 0.0% |
| $35,000 to $49,999 | 1 | 0.5% |
| $50,000 to $74,999 | 0 | 0.0% |
| $75,000 to $99,999 | 37 | 19.7% |
| $100,000 to $149,999 | 100 | 53.2% |
| $150,000 to $199,999 | 19 | 10.1% |
| $200,000+ | 31 | 16.5% |
Family Income by Famaliy Size in Titusville
3-person families (56 | 29.8%) account for the highest median family income in Titusville with $170,962 per family, while 3-person families (56 | 29.8%) have the highest median income of $56,987 per family member.
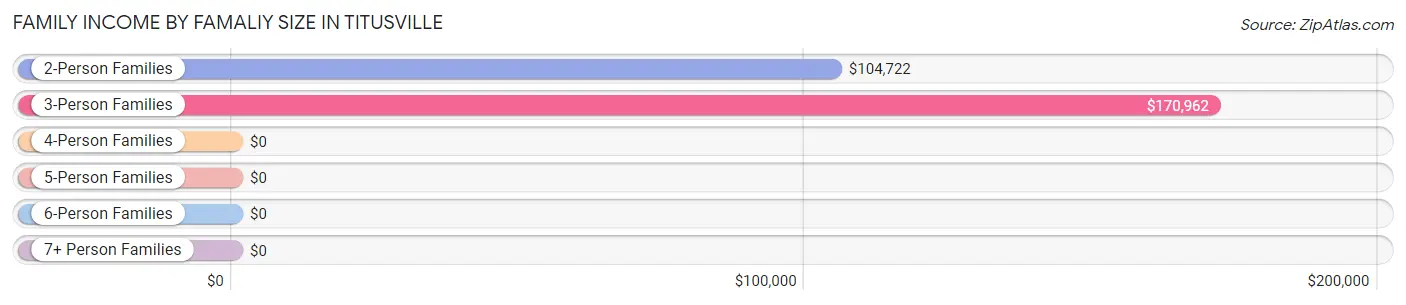
| Income Bracket | # Families | Median Income |
| 2-Person Families | 86 (45.7%) | $104,722 |
| 3-Person Families | 56 (29.8%) | $170,962 |
| 4-Person Families | 46 (24.5%) | $0 |
| 5-Person Families | 0 (0.0%) | $0 |
| 6-Person Families | 0 (0.0%) | $0 |
| 7+ Person Families | 0 (0.0%) | $0 |
| Total | 188 (100.0%) | $136,964 |
Family Income by Number of Earners in Titusville
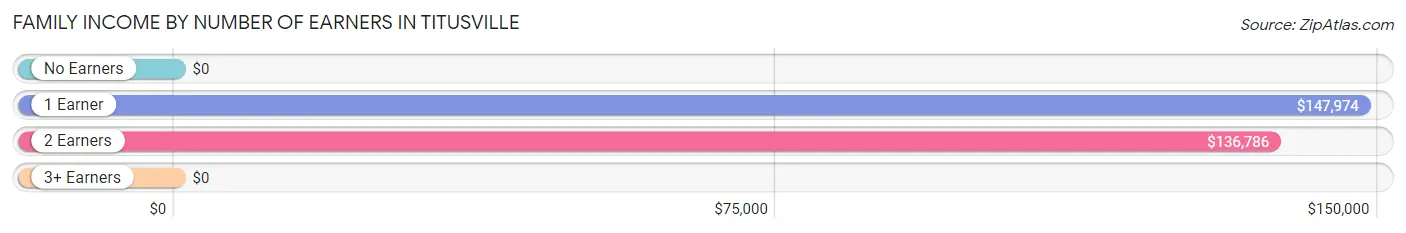
| Number of Earners | # Families | Median Income |
| No Earners | 22 (11.7%) | $0 |
| 1 Earner | 69 (36.7%) | $147,974 |
| 2 Earners | 84 (44.7%) | $136,786 |
| 3+ Earners | 13 (6.9%) | $0 |
| Total | 188 (100.0%) | $136,964 |
Household Income in Titusville
Household Income Brackets in Titusville
With 117 households falling in the category, the $100,000 to $149,999 income range is the most frequent in Titusville, accounting for 37.6% of all households.
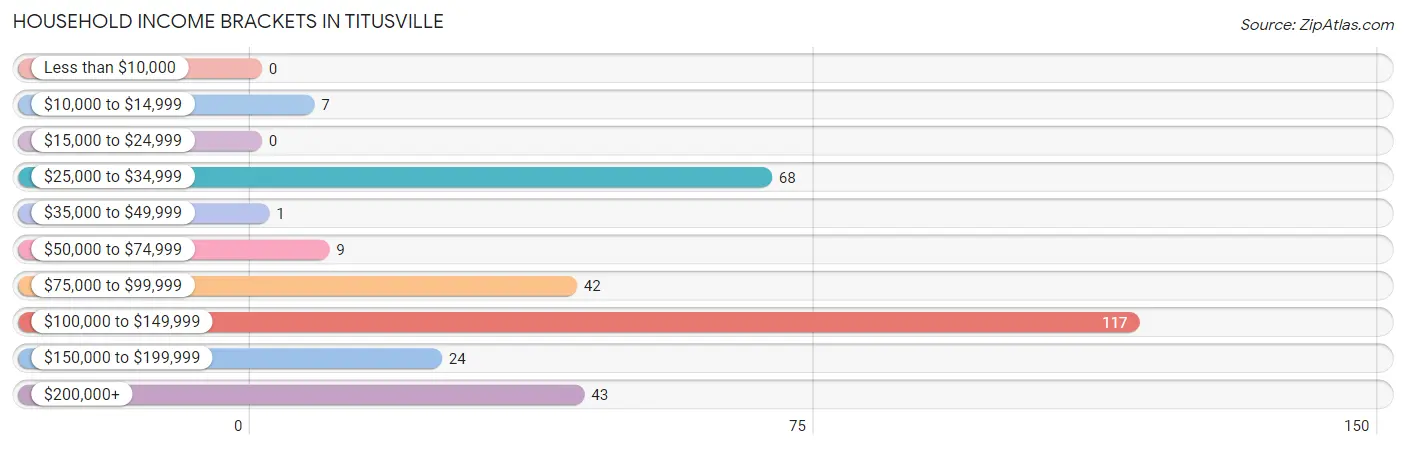
| Income Bracket | # Households | % Households |
| Less than $10,000 | 0 | 0.0% |
| $10,000 to $14,999 | 7 | 2.3% |
| $15,000 to $24,999 | 0 | 0.0% |
| $25,000 to $34,999 | 68 | 21.9% |
| $35,000 to $49,999 | 1 | 0.3% |
| $50,000 to $74,999 | 9 | 2.9% |
| $75,000 to $99,999 | 42 | 13.5% |
| $100,000 to $149,999 | 117 | 37.6% |
| $150,000 to $199,999 | 24 | 7.7% |
| $200,000+ | 43 | 13.8% |
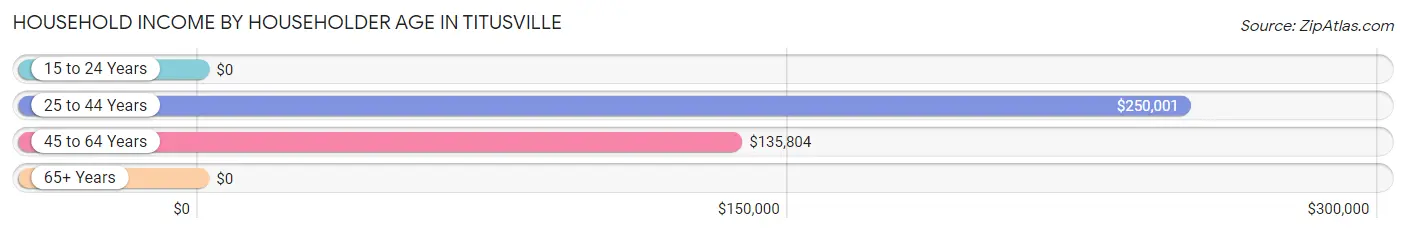
Household Income by Householder Age in Titusville
The median household income in Titusville is $108,472, with the highest median household income of $250,001 found in the 25 to 44 years age bracket for the primary householder. A total of 27 households (8.7%) fall into this category.
| Income Bracket | # Households | Median Income |
| 15 to 24 Years | 0 (0.0%) | $0 |
| 25 to 44 Years | 27 (8.7%) | $250,001 |
| 45 to 64 Years | 137 (44.1%) | $135,804 |
| 65+ Years | 147 (47.3%) | $0 |
| Total | 311 (100.0%) | $108,472 |
Poverty in Titusville
Income Below Poverty by Sex and Age in Titusville
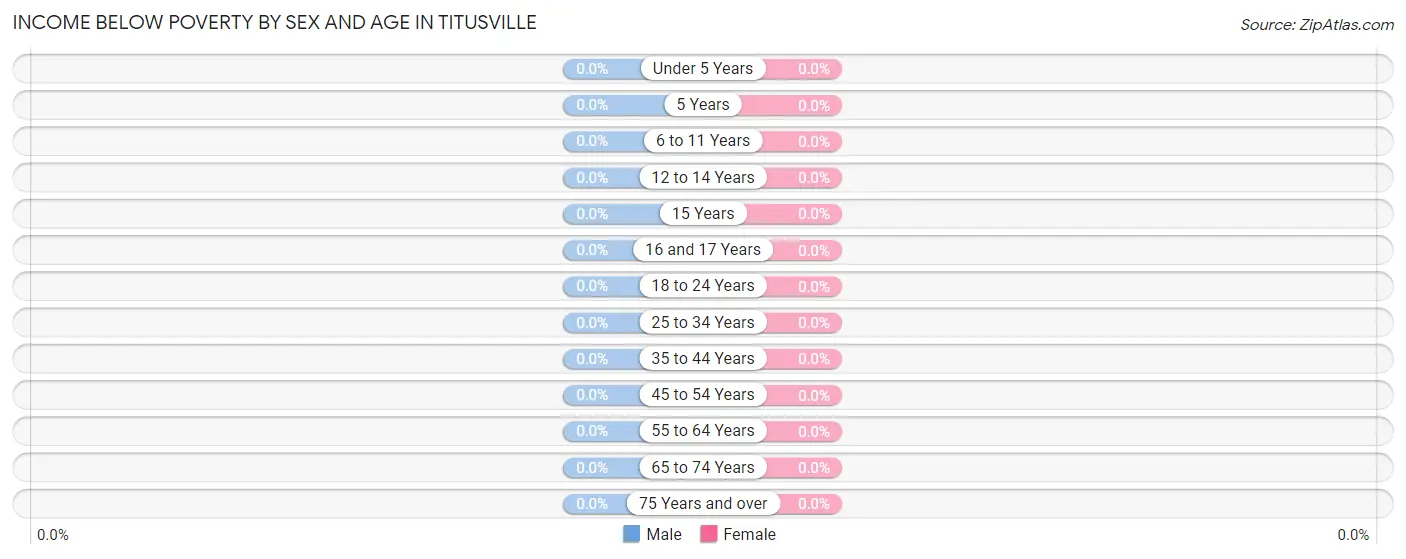
| Age Bracket | Male | Female |
| Under 5 Years | 0 (0.0%) | 0 (0.0%) |
| 5 Years | 0 (0.0%) | 0 (0.0%) |
| 6 to 11 Years | 0 (0.0%) | 0 (0.0%) |
| 12 to 14 Years | 0 (0.0%) | 0 (0.0%) |
| 15 Years | 0 (0.0%) | 0 (0.0%) |
| 16 and 17 Years | 0 (0.0%) | 0 (0.0%) |
| 18 to 24 Years | 0 (0.0%) | 0 (0.0%) |
| 25 to 34 Years | 0 (0.0%) | 0 (0.0%) |
| 35 to 44 Years | 0 (0.0%) | 0 (0.0%) |
| 45 to 54 Years | 0 (0.0%) | 0 (0.0%) |
| 55 to 64 Years | 0 (0.0%) | 0 (0.0%) |
| 65 to 74 Years | 0 (0.0%) | 0 (0.0%) |
| 75 Years and over | 0 (0.0%) | 0 (0.0%) |
| Total | 0 (0.0%) | 0 (0.0%) |
Income Above Poverty by Sex and Age in Titusville
According to the poverty statistics in Titusville, males aged 12 to 14 years and females aged under 5 years are the age groups that are most secure financially, with 100.0% of males and 100.0% of females in these age groups living above the poverty line.
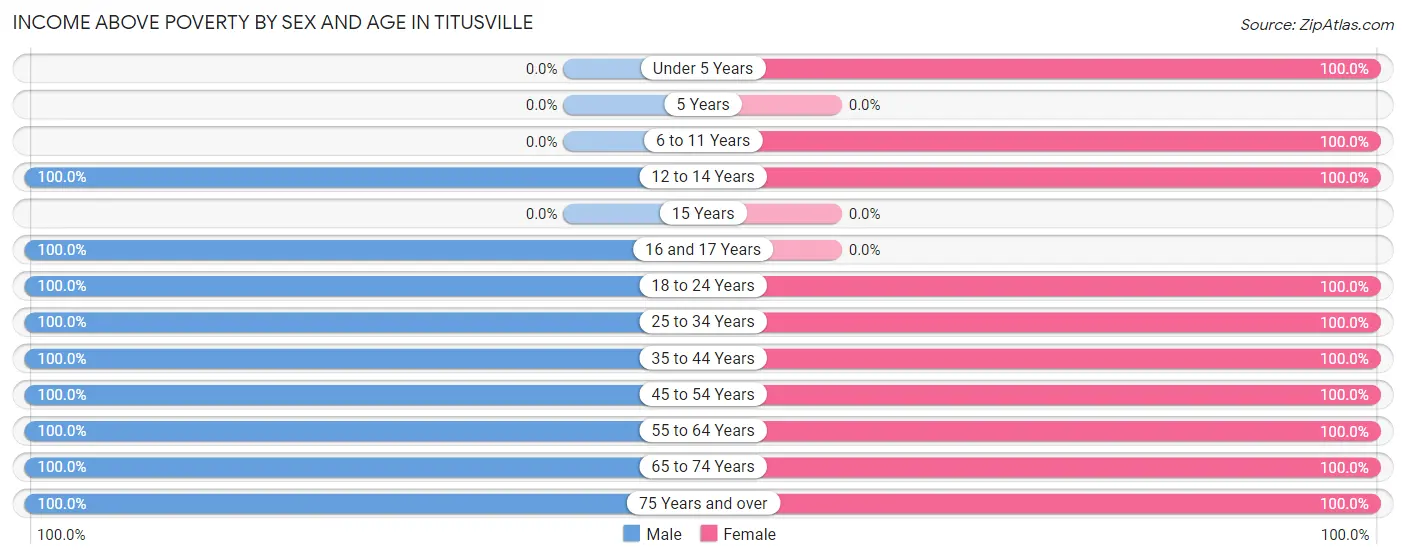
| Age Bracket | Male | Female |
| Under 5 Years | 0 (0.0%) | 10 (100.0%) |
| 5 Years | 0 (0.0%) | 0 (0.0%) |
| 6 to 11 Years | 0 (0.0%) | 30 (100.0%) |
| 12 to 14 Years | 31 (100.0%) | 12 (100.0%) |
| 15 Years | 0 (0.0%) | 0 (0.0%) |
| 16 and 17 Years | 12 (100.0%) | 0 (0.0%) |
| 18 to 24 Years | 36 (100.0%) | 13 (100.0%) |
| 25 to 34 Years | 6 (100.0%) | 6 (100.0%) |
| 35 to 44 Years | 21 (100.0%) | 34 (100.0%) |
| 45 to 54 Years | 46 (100.0%) | 21 (100.0%) |
| 55 to 64 Years | 79 (100.0%) | 77 (100.0%) |
| 65 to 74 Years | 35 (100.0%) | 58 (100.0%) |
| 75 Years and over | 10 (100.0%) | 76 (100.0%) |
| Total | 276 (100.0%) | 337 (100.0%) |
Income Below Poverty Among Married-Couple Families in Titusville
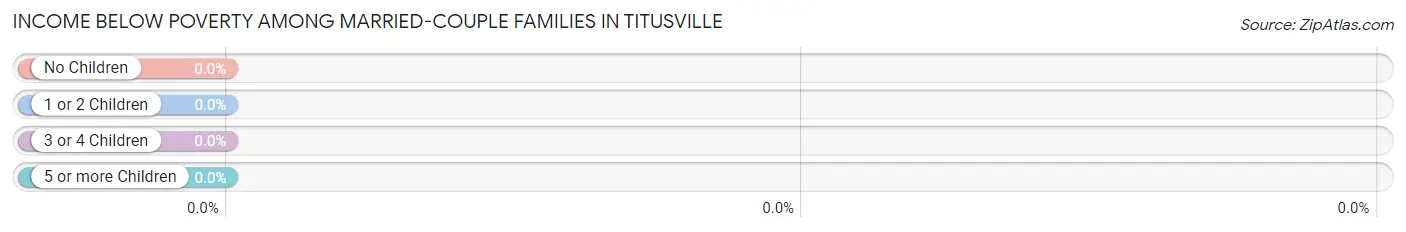
| Children | Above Poverty | Below Poverty |
| No Children | 93 (100.0%) | 0 (0.0%) |
| 1 or 2 Children | 60 (100.0%) | 0 (0.0%) |
| 3 or 4 Children | 0 (0.0%) | 0 (0.0%) |
| 5 or more Children | 0 (0.0%) | 0 (0.0%) |
| Total | 153 (100.0%) | 0 (0.0%) |
Income Below Poverty Among Single-Parent Households in Titusville
| Children | Single Father | Single Mother |
| No Children | 0 (0.0%) | 0 (0.0%) |
| 1 or 2 Children | 0 (0.0%) | 0 (0.0%) |
| 3 or 4 Children | 0 (0.0%) | 0 (0.0%) |
| 5 or more Children | 0 (0.0%) | 0 (0.0%) |
| Total | 0 (0.0%) | 0 (0.0%) |
Income Below Poverty Among Married-Couple vs Single-Parent Households in Titusville
| Children | Married-Couple Families | Single-Parent Households |
| No Children | 0 (0.0%) | 0 (0.0%) |
| 1 or 2 Children | 0 (0.0%) | 0 (0.0%) |
| 3 or 4 Children | 0 (0.0%) | 0 (0.0%) |
| 5 or more Children | 0 (0.0%) | 0 (0.0%) |
| Total | 0 (0.0%) | 0 (0.0%) |
Race in Titusville
The most populous races in Titusville are White / Caucasian (442 | 72.1%), Two or more Races (135 | 22.0%), and Hispanic or Latino (97 | 15.8%).
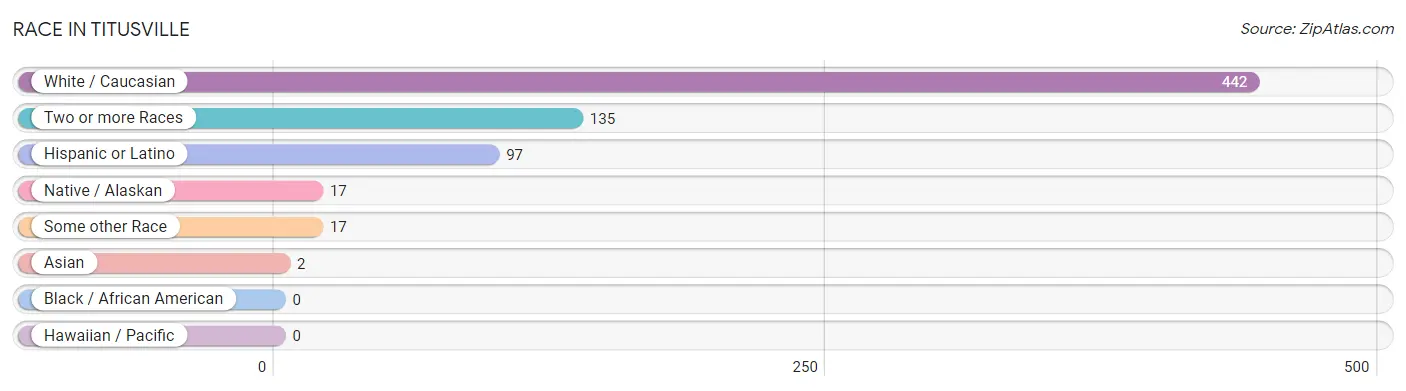
| Race | # Population | % Population |
| Asian | 2 | 0.3% |
| Black / African American | 0 | 0.0% |
| Hawaiian / Pacific | 0 | 0.0% |
| Hispanic or Latino | 97 | 15.8% |
| Native / Alaskan | 17 | 2.8% |
| White / Caucasian | 442 | 72.1% |
| Two or more Races | 135 | 22.0% |
| Some other Race | 17 | 2.8% |
| Total | 613 | 100.0% |
Ancestry in Titusville
The most populous ancestries reported in Titusville are German (147 | 24.0%), Russian (107 | 17.5%), Irish (101 | 16.5%), Ukrainian (92 | 15.0%), and Italian (62 | 10.1%), together accounting for 83.0% of all Titusville residents.
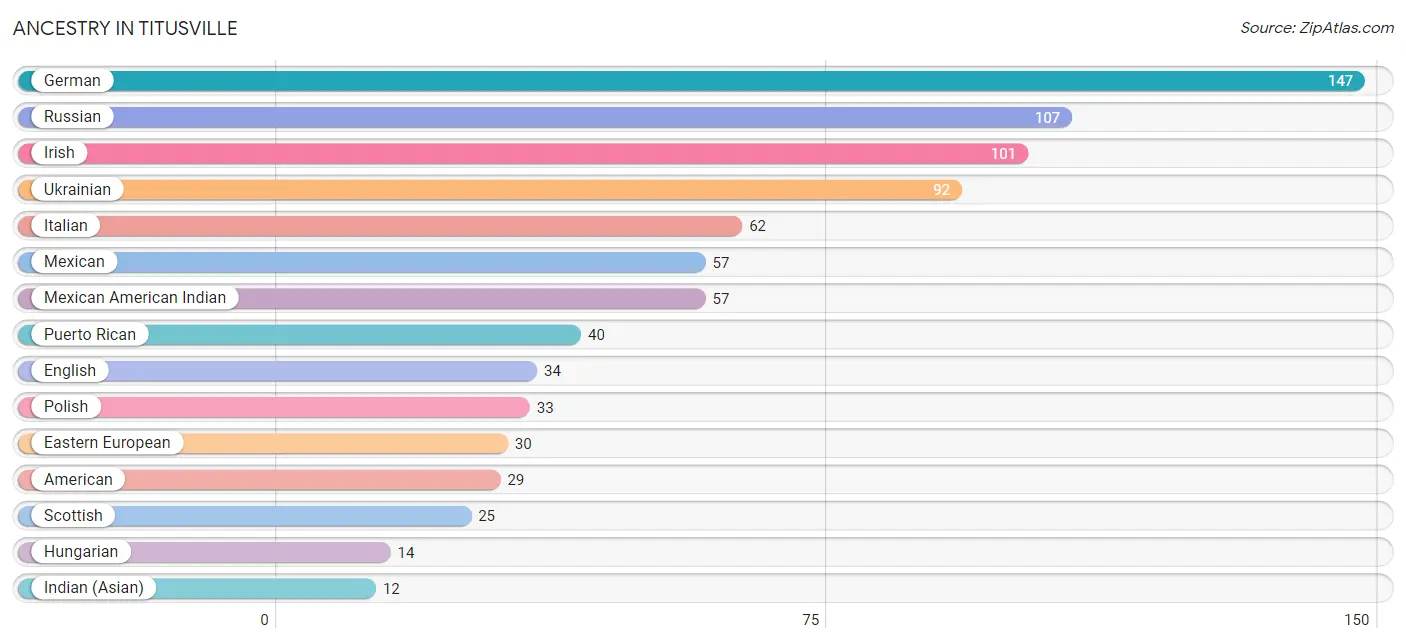
| Ancestry | # Population | % Population |
| American | 29 | 4.7% |
| Dutch | 1 | 0.2% |
| Eastern European | 30 | 4.9% |
| English | 34 | 5.6% |
| French | 7 | 1.1% |
| German | 147 | 24.0% |
| Greek | 6 | 1.0% |
| Hungarian | 14 | 2.3% |
| Indian (Asian) | 12 | 2.0% |
| Irish | 101 | 16.5% |
| Italian | 62 | 10.1% |
| Mexican | 57 | 9.3% |
| Mexican American Indian | 57 | 9.3% |
| Pennsylvania German | 10 | 1.6% |
| Polish | 33 | 5.4% |
| Puerto Rican | 40 | 6.5% |
| Russian | 107 | 17.5% |
| Scotch-Irish | 11 | 1.8% |
| Scottish | 25 | 4.1% |
| Ukrainian | 92 | 15.0% | View All 20 Rows |
Immigrants in Titusville
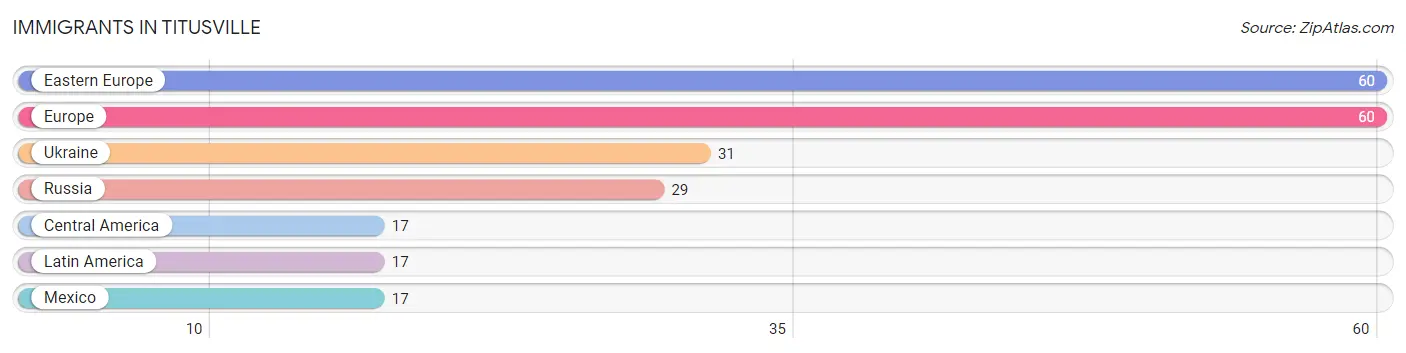
The most numerous immigrant groups reported in Titusville came from Eastern Europe (60 | 9.8%), Europe (60 | 9.8%), Ukraine (31 | 5.1%), Russia (29 | 4.7%), and Central America (17 | 2.8%), together accounting for 32.1% of all Titusville residents.
| Immigration Origin | # Population | % Population |
| Central America | 17 | 2.8% |
| Eastern Europe | 60 | 9.8% |
| Europe | 60 | 9.8% |
| Latin America | 17 | 2.8% |
| Mexico | 17 | 2.8% |
| Russia | 29 | 4.7% |
| Ukraine | 31 | 5.1% | View All 7 Rows |
Sex and Age in Titusville
Sex and Age in Titusville
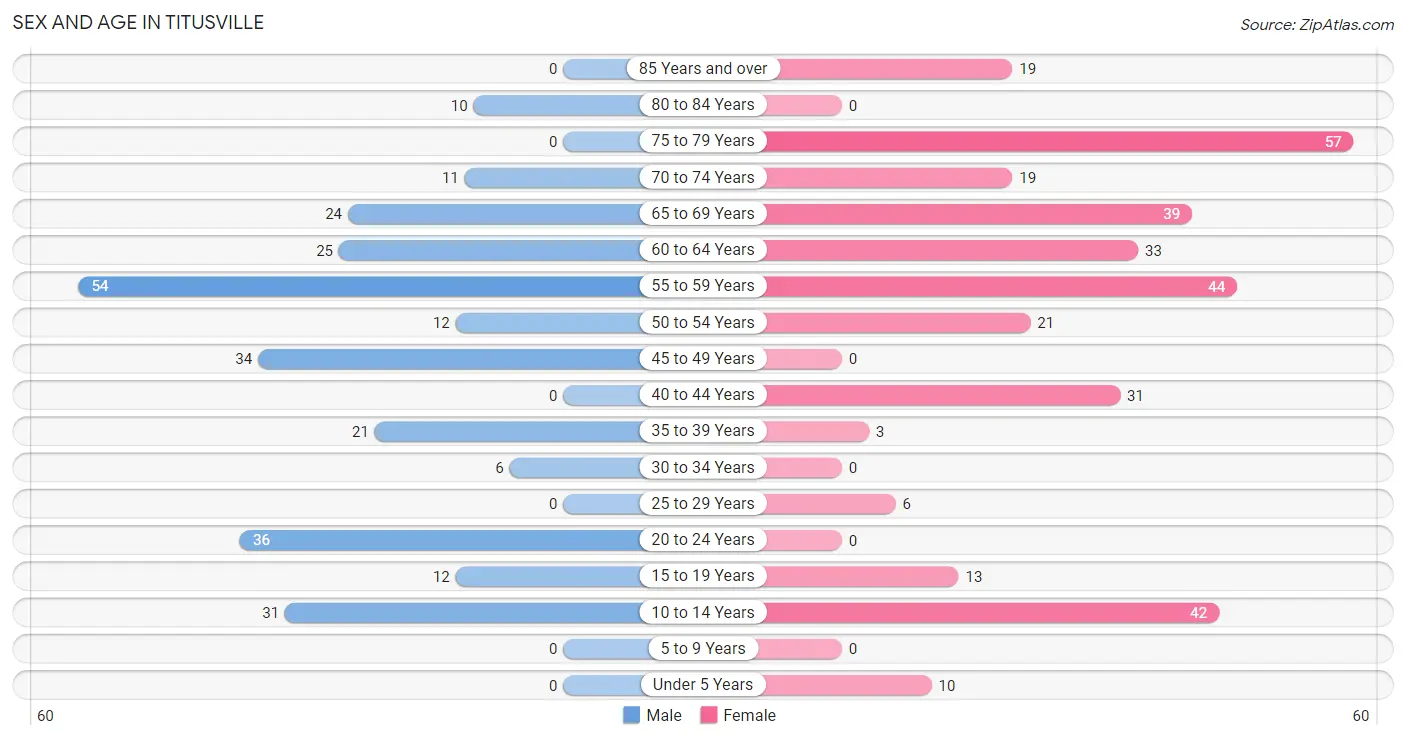
The most populous age groups in Titusville are 55 to 59 Years (54 | 19.6%) for men and 75 to 79 Years (57 | 16.9%) for women.
| Age Bracket | Male | Female |
| Under 5 Years | 0 (0.0%) | 10 (3.0%) |
| 5 to 9 Years | 0 (0.0%) | 0 (0.0%) |
| 10 to 14 Years | 31 (11.2%) | 42 (12.5%) |
| 15 to 19 Years | 12 (4.3%) | 13 (3.9%) |
| 20 to 24 Years | 36 (13.0%) | 0 (0.0%) |
| 25 to 29 Years | 0 (0.0%) | 6 (1.8%) |
| 30 to 34 Years | 6 (2.2%) | 0 (0.0%) |
| 35 to 39 Years | 21 (7.6%) | 3 (0.9%) |
| 40 to 44 Years | 0 (0.0%) | 31 (9.2%) |
| 45 to 49 Years | 34 (12.3%) | 0 (0.0%) |
| 50 to 54 Years | 12 (4.3%) | 21 (6.2%) |
| 55 to 59 Years | 54 (19.6%) | 44 (13.1%) |
| 60 to 64 Years | 25 (9.1%) | 33 (9.8%) |
| 65 to 69 Years | 24 (8.7%) | 39 (11.6%) |
| 70 to 74 Years | 11 (4.0%) | 19 (5.6%) |
| 75 to 79 Years | 0 (0.0%) | 57 (16.9%) |
| 80 to 84 Years | 10 (3.6%) | 0 (0.0%) |
| 85 Years and over | 0 (0.0%) | 19 (5.6%) |
| Total | 276 (100.0%) | 337 (100.0%) |
Families and Households in Titusville
Median Family Size in Titusville
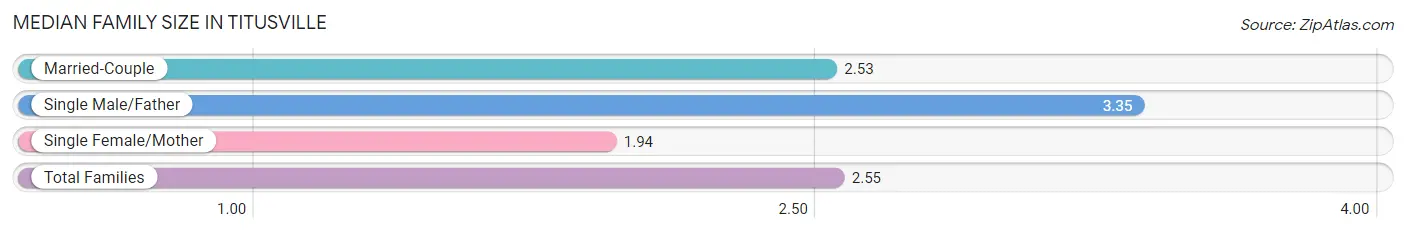
The median family size in Titusville is 2.55 persons per family, with single male/father families (17 | 9.0%) accounting for the largest median family size of 3.35 persons per family. On the other hand, single female/mother families (18 | 9.6%) represent the smallest median family size with 1.94 persons per family.
| Family Type | # Families | Family Size |
| Married-Couple | 153 (81.4%) | 2.53 |
| Single Male/Father | 17 (9.0%) | 3.35 |
| Single Female/Mother | 18 (9.6%) | 1.94 |
| Total Families | 188 (100.0%) | 2.55 |
Median Household Size in Titusville
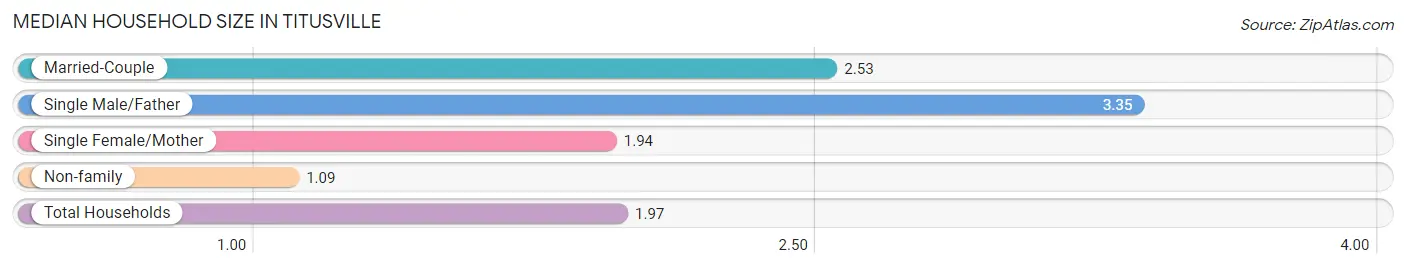
The median household size in Titusville is 1.97 persons per household, with single male/father households (17 | 5.5%) accounting for the largest median household size of 3.35 persons per household. non-family households (123 | 39.6%) represent the smallest median household size with 1.09 persons per household.
| Household Type | # Households | Household Size |
| Married-Couple | 153 (49.2%) | 2.53 |
| Single Male/Father | 17 (5.5%) | 3.35 |
| Single Female/Mother | 18 (5.8%) | 1.94 |
| Non-family | 123 (39.6%) | 1.09 |
| Total Households | 311 (100.0%) | 1.97 |
Household Size by Marriage Status in Titusville
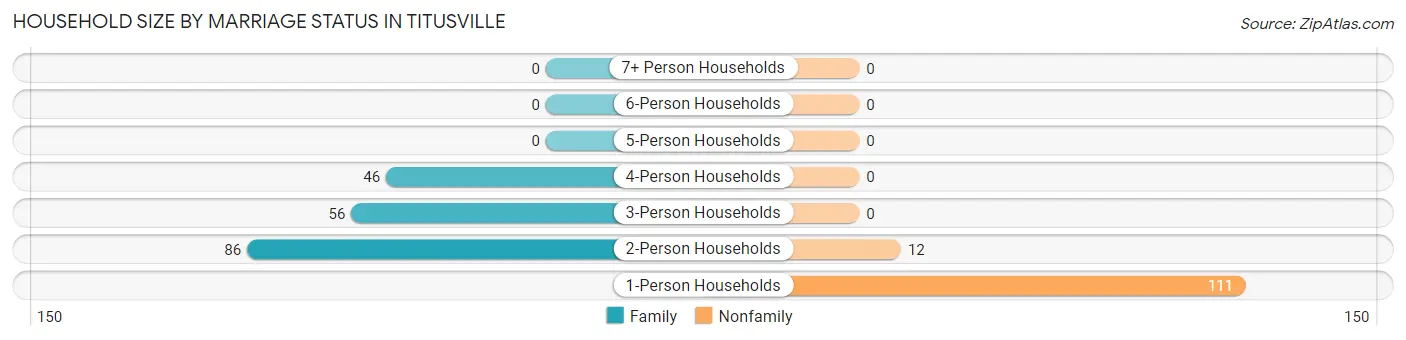
Out of a total of 311 households in Titusville, 188 (60.5%) are family households, while 123 (39.6%) are nonfamily households. The most numerous type of family households are 2-person households, comprising 86, and the most common type of nonfamily households are 1-person households, comprising 111.
| Household Size | Family Households | Nonfamily Households |
| 1-Person Households | - | 111 (35.7%) |
| 2-Person Households | 86 (27.7%) | 12 (3.9%) |
| 3-Person Households | 56 (18.0%) | 0 (0.0%) |
| 4-Person Households | 46 (14.8%) | 0 (0.0%) |
| 5-Person Households | 0 (0.0%) | 0 (0.0%) |
| 6-Person Households | 0 (0.0%) | 0 (0.0%) |
| 7+ Person Households | 0 (0.0%) | 0 (0.0%) |
| Total | 188 (60.5%) | 123 (39.6%) |
Female Fertility in Titusville
Fertility by Age in Titusville
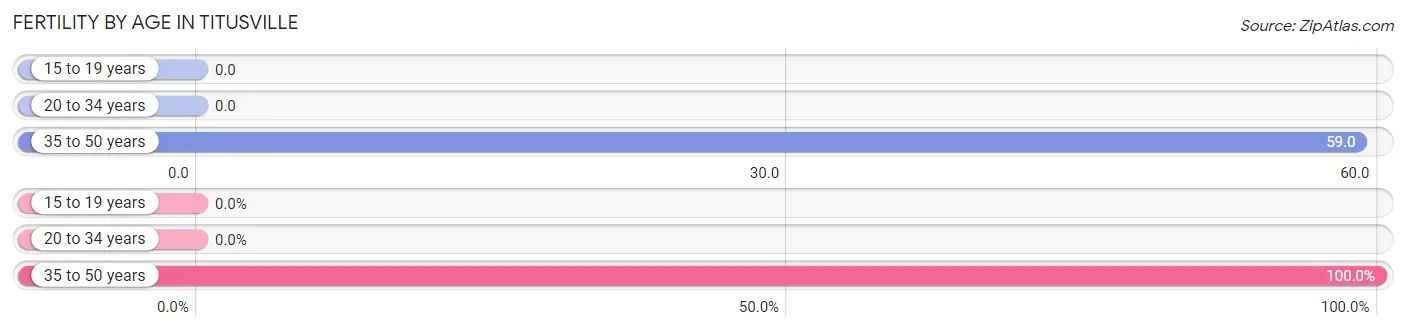
Average fertility rate in Titusville is 38.0 births per 1,000 women. Women in the age bracket of 35 to 50 years have the highest fertility rate with 59.0 births per 1,000 women. Women in the age bracket of 35 to 50 years acount for 100.0% of all women with births.
| Age Bracket | Women with Births | Births / 1,000 Women |
| 15 to 19 years | 0 (0.0%) | 0.0 |
| 20 to 34 years | 0 (0.0%) | 0.0 |
| 35 to 50 years | 2 (100.0%) | 59.0 |
| Total | 2 (100.0%) | 38.0 |
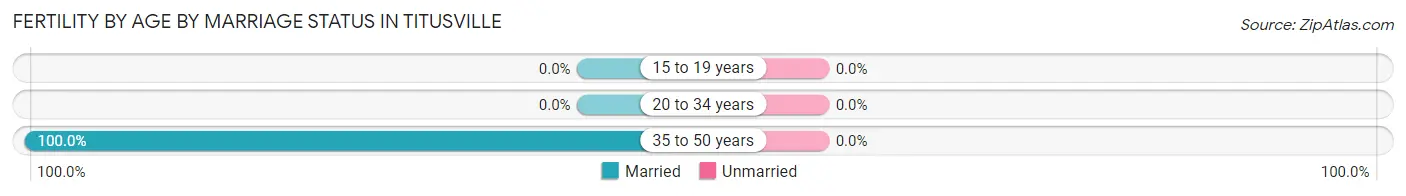
Fertility by Age by Marriage Status in Titusville
| Age Bracket | Married | Unmarried |
| 15 to 19 years | 0 (0.0%) | 0 (0.0%) |
| 20 to 34 years | 0 (0.0%) | 0 (0.0%) |
| 35 to 50 years | 2 (100.0%) | 0 (0.0%) |
| Total | 2 (100.0%) | 0 (0.0%) |
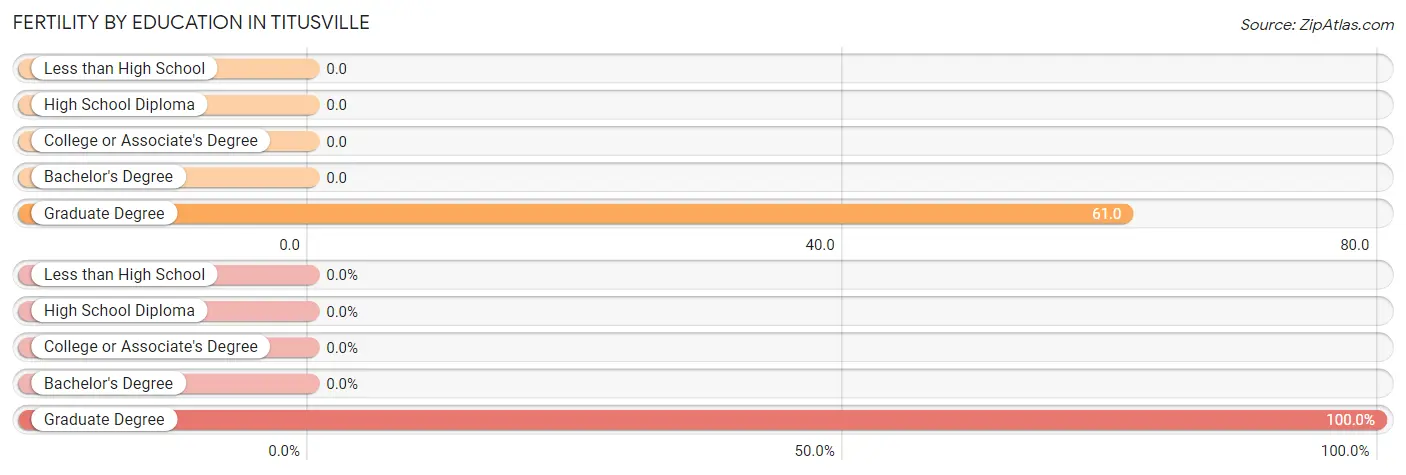
Fertility by Education in Titusville
| Educational Attainment | Women with Births | Births / 1,000 Women |
| Less than High School | 0 (0.0%) | 0.0 |
| High School Diploma | 0 (0.0%) | 0.0 |
| College or Associate's Degree | 0 (0.0%) | 0.0 |
| Bachelor's Degree | 0 (0.0%) | 0.0 |
| Graduate Degree | 2 (100.0%) | 61.0 |
| Total | 2 (100.0%) | 38.0 |
Fertility by Education by Marriage Status in Titusville
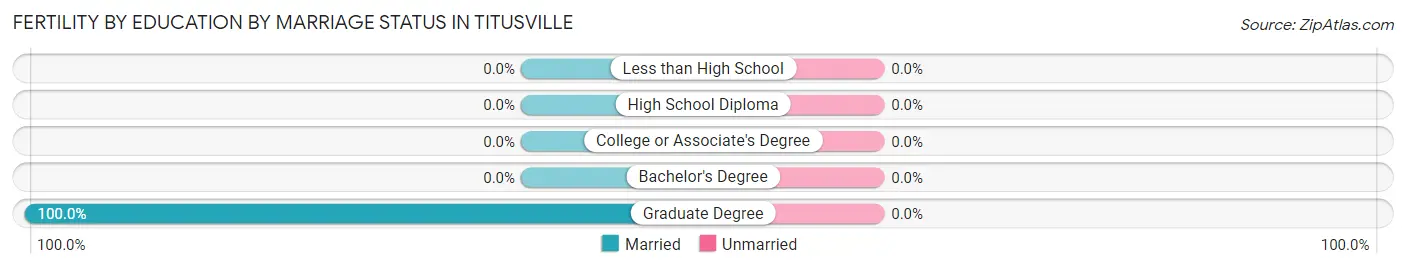
| Educational Attainment | Married | Unmarried |
| Less than High School | 0 (0.0%) | 0 (0.0%) |
| High School Diploma | 0 (0.0%) | 0 (0.0%) |
| College or Associate's Degree | 0 (0.0%) | 0 (0.0%) |
| Bachelor's Degree | 0 (0.0%) | 0 (0.0%) |
| Graduate Degree | 2 (100.0%) | 0 (0.0%) |
| Total | 2 (100.0%) | 0 (0.0%) |
Employment Characteristics in Titusville
Employment by Class of Employer in Titusville
Among the 289 employed individuals in Titusville, private company employees (142 | 49.1%), local government employees (48 | 16.6%), and not-for-profit organizations (45 | 15.6%) make up the most common classes of employment.
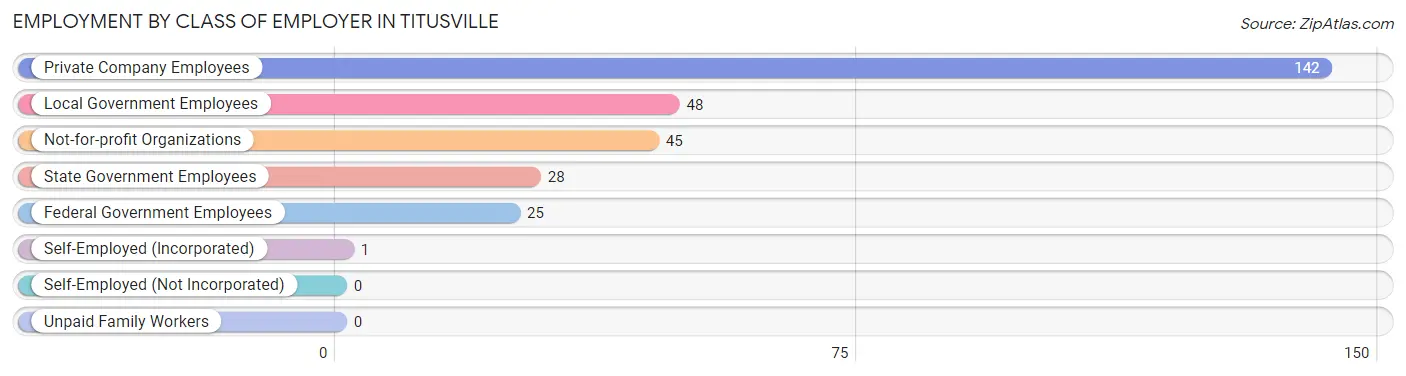
| Employer Class | # Employees | % Employees |
| Private Company Employees | 142 | 49.1% |
| Self-Employed (Incorporated) | 1 | 0.4% |
| Self-Employed (Not Incorporated) | 0 | 0.0% |
| Not-for-profit Organizations | 45 | 15.6% |
| Local Government Employees | 48 | 16.6% |
| State Government Employees | 28 | 9.7% |
| Federal Government Employees | 25 | 8.6% |
| Unpaid Family Workers | 0 | 0.0% |
| Total | 289 | 100.0% |
Employment Status by Age in Titusville
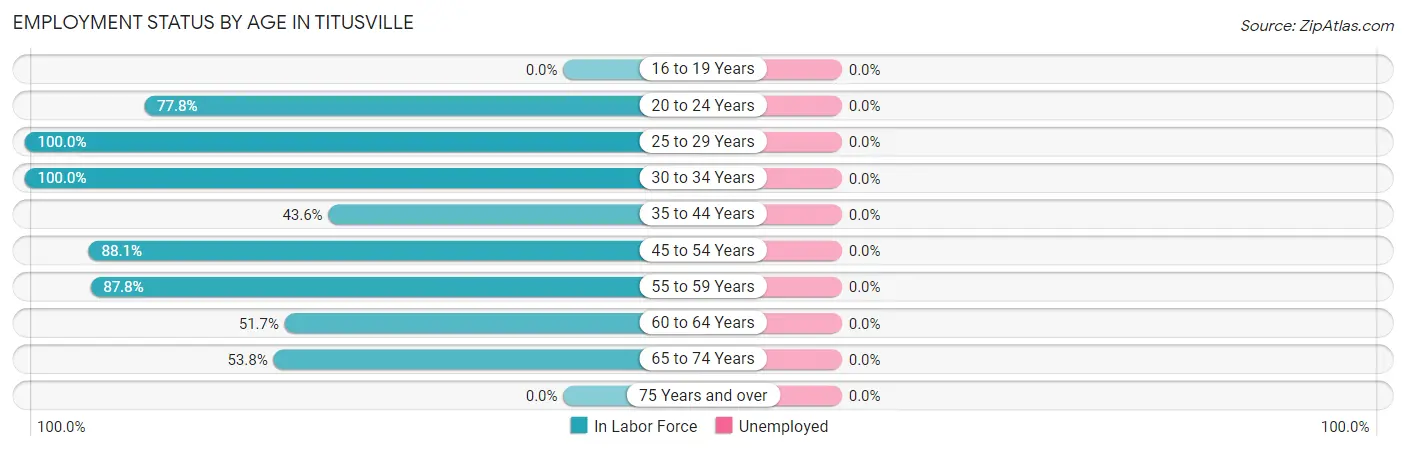
| Age Bracket | In Labor Force | Unemployed |
| 16 to 19 Years | 0 (0.0%) | 0 (0.0%) |
| 20 to 24 Years | 28 (77.8%) | 0 (0.0%) |
| 25 to 29 Years | 6 (100.0%) | 0 (0.0%) |
| 30 to 34 Years | 6 (100.0%) | 0 (0.0%) |
| 35 to 44 Years | 24 (43.6%) | 0 (0.0%) |
| 45 to 54 Years | 59 (88.1%) | 0 (0.0%) |
| 55 to 59 Years | 86 (87.8%) | 0 (0.0%) |
| 60 to 64 Years | 30 (51.7%) | 0 (0.0%) |
| 65 to 74 Years | 50 (53.8%) | 0 (0.0%) |
| 75 Years and over | 0 (0.0%) | 0 (0.0%) |
| Total | 289 (54.5%) | 0 (0.0%) |
Employment Status by Educational Attainment in Titusville
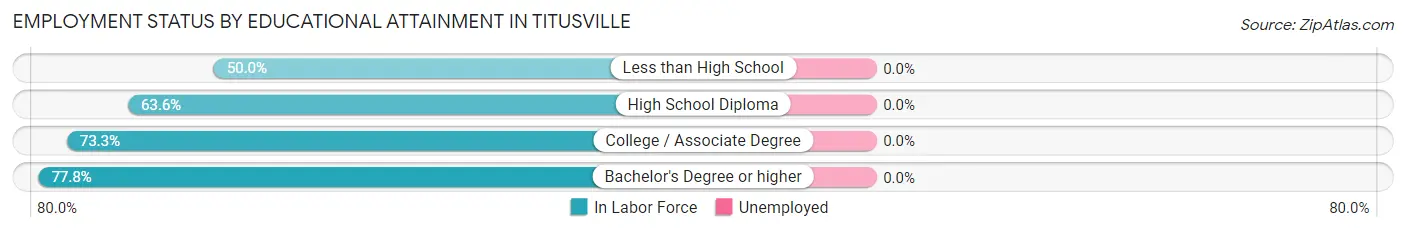
| Educational Attainment | In Labor Force | Unemployed |
| Less than High School | 17 (50.0%) | 0 (0.0%) |
| High School Diploma | 14 (63.6%) | 0 (0.0%) |
| College / Associate Degree | 33 (73.3%) | 0 (0.0%) |
| Bachelor's Degree or higher | 147 (77.8%) | 0 (0.0%) |
| Total | 211 (72.8%) | 0 (0.0%) |
Employment Occupations by Sex in Titusville
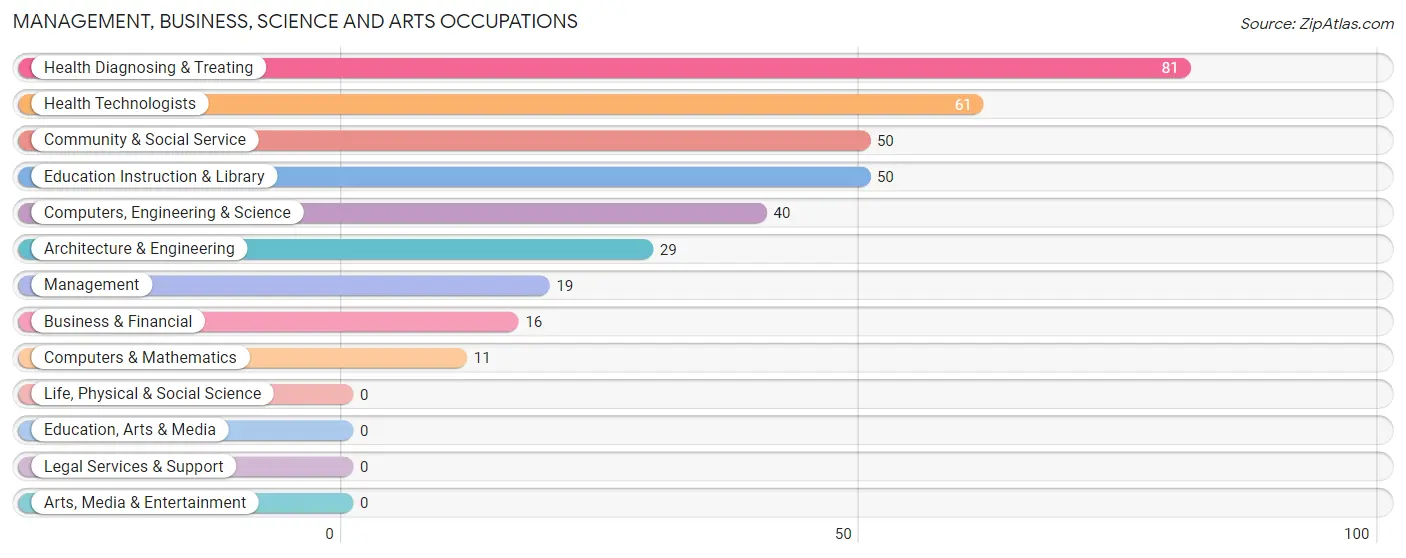
Management, Business, Science and Arts Occupations
The most common Management, Business, Science and Arts occupations in Titusville are Health Diagnosing & Treating (81 | 28.0%), Health Technologists (61 | 21.1%), Community & Social Service (50 | 17.3%), Education Instruction & Library (50 | 17.3%), and Computers, Engineering & Science (40 | 13.8%).
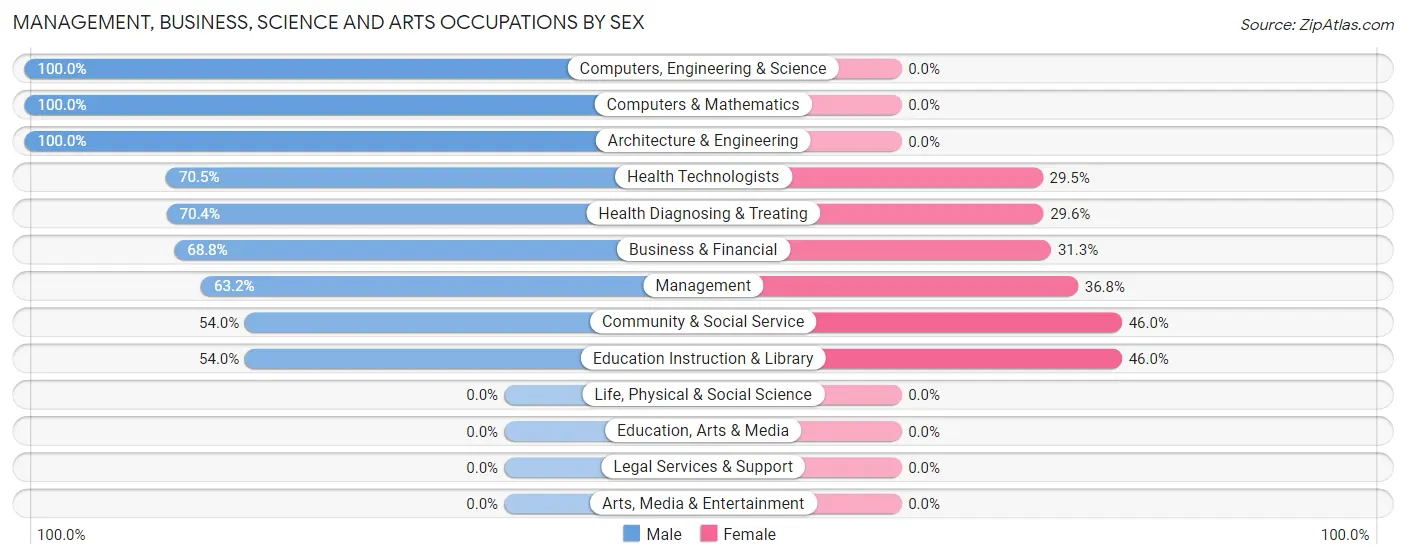
Management, Business, Science and Arts Occupations by Sex
Within the Management, Business, Science and Arts occupations in Titusville, the most male-oriented occupations are Computers, Engineering & Science (100.0%), Computers & Mathematics (100.0%), and Architecture & Engineering (100.0%), while the most female-oriented occupations are Community & Social Service (46.0%), Education Instruction & Library (46.0%), and Management (36.8%).
| Occupation | Male | Female |
| Management | 12 (63.2%) | 7 (36.8%) |
| Business & Financial | 11 (68.8%) | 5 (31.2%) |
| Computers, Engineering & Science | 40 (100.0%) | 0 (0.0%) |
| Computers & Mathematics | 11 (100.0%) | 0 (0.0%) |
| Architecture & Engineering | 29 (100.0%) | 0 (0.0%) |
| Life, Physical & Social Science | 0 (0.0%) | 0 (0.0%) |
| Community & Social Service | 27 (54.0%) | 23 (46.0%) |
| Education, Arts & Media | 0 (0.0%) | 0 (0.0%) |
| Legal Services & Support | 0 (0.0%) | 0 (0.0%) |
| Education Instruction & Library | 27 (54.0%) | 23 (46.0%) |
| Arts, Media & Entertainment | 0 (0.0%) | 0 (0.0%) |
| Health Diagnosing & Treating | 57 (70.4%) | 24 (29.6%) |
| Health Technologists | 43 (70.5%) | 18 (29.5%) |
| Total (Category) | 147 (71.4%) | 59 (28.6%) |
| Total (Overall) | 192 (66.4%) | 97 (33.6%) |
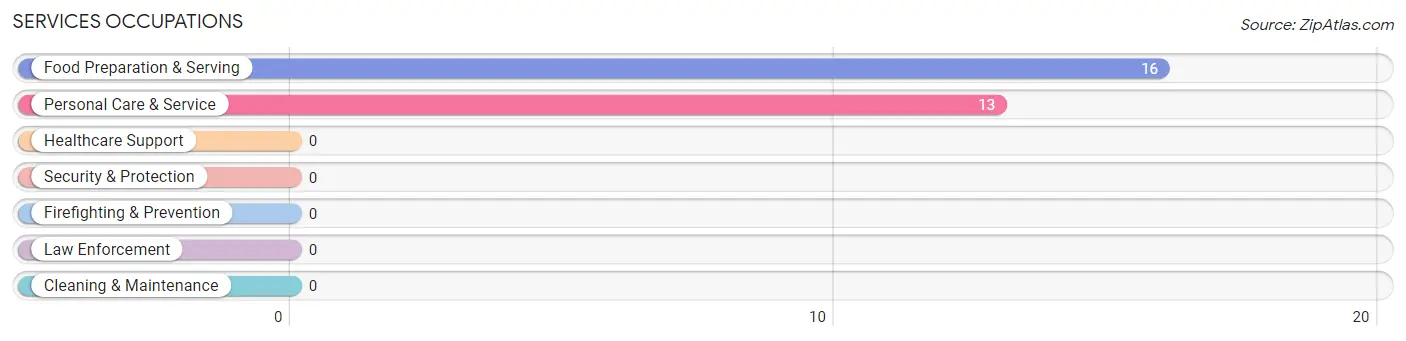
Services Occupations
The most common Services occupations in Titusville are Food Preparation & Serving (16 | 5.5%), and Personal Care & Service (13 | 4.5%).
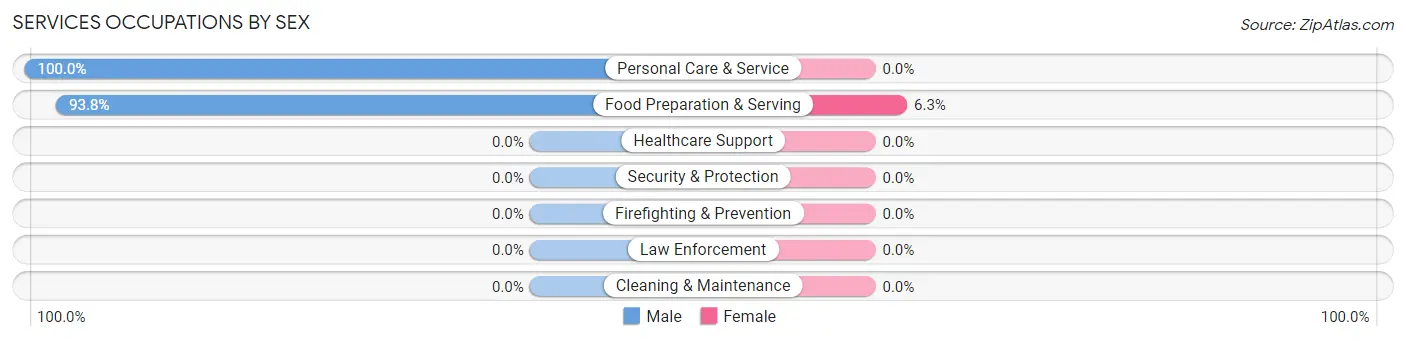
Services Occupations by Sex
| Occupation | Male | Female |
| Healthcare Support | 0 (0.0%) | 0 (0.0%) |
| Security & Protection | 0 (0.0%) | 0 (0.0%) |
| Firefighting & Prevention | 0 (0.0%) | 0 (0.0%) |
| Law Enforcement | 0 (0.0%) | 0 (0.0%) |
| Food Preparation & Serving | 15 (93.8%) | 1 (6.2%) |
| Cleaning & Maintenance | 0 (0.0%) | 0 (0.0%) |
| Personal Care & Service | 13 (100.0%) | 0 (0.0%) |
| Total (Category) | 28 (96.6%) | 1 (3.5%) |
| Total (Overall) | 192 (66.4%) | 97 (33.6%) |
Sales and Office Occupations
The most common Sales and Office occupations in Titusville are Office & Administration (27 | 9.3%), and Sales & Related (10 | 3.5%).
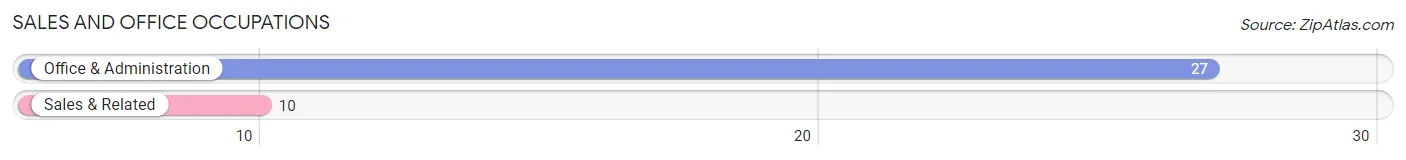
Sales and Office Occupations by Sex
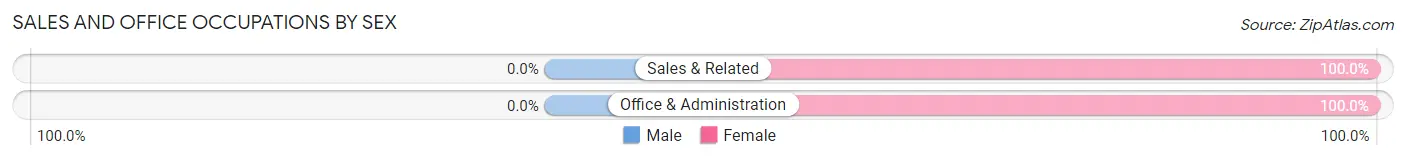
| Occupation | Male | Female |
| Sales & Related | 0 (0.0%) | 10 (100.0%) |
| Office & Administration | 0 (0.0%) | 27 (100.0%) |
| Total (Category) | 0 (0.0%) | 37 (100.0%) |
| Total (Overall) | 192 (66.4%) | 97 (33.6%) |
Natural Resources, Construction and Maintenance Occupations

Natural Resources, Construction and Maintenance Occupations by Sex
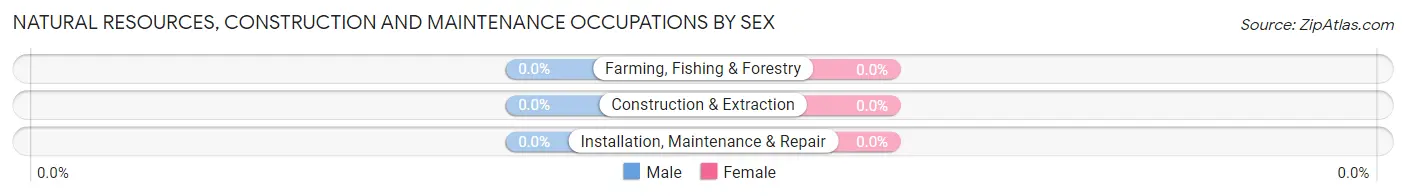
| Occupation | Male | Female |
| Farming, Fishing & Forestry | 0 (0.0%) | 0 (0.0%) |
| Construction & Extraction | 0 (0.0%) | 0 (0.0%) |
| Installation, Maintenance & Repair | 0 (0.0%) | 0 (0.0%) |
| Total (Category) | 0 (0.0%) | 0 (0.0%) |
| Total (Overall) | 192 (66.4%) | 97 (33.6%) |
Production, Transportation and Moving Occupations
The most common Production, Transportation and Moving occupations in Titusville are , and Material Moving (17 | 5.9%).
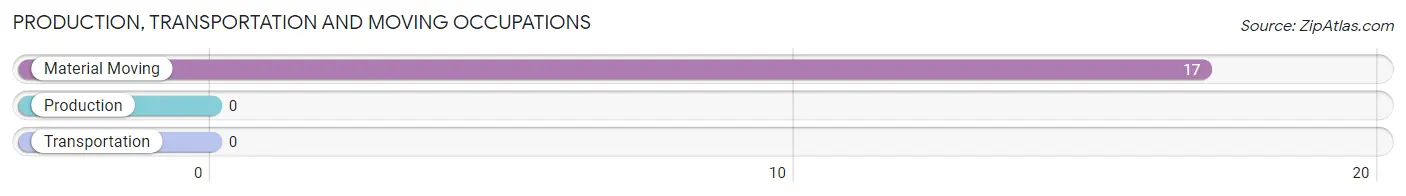
Production, Transportation and Moving Occupations by Sex
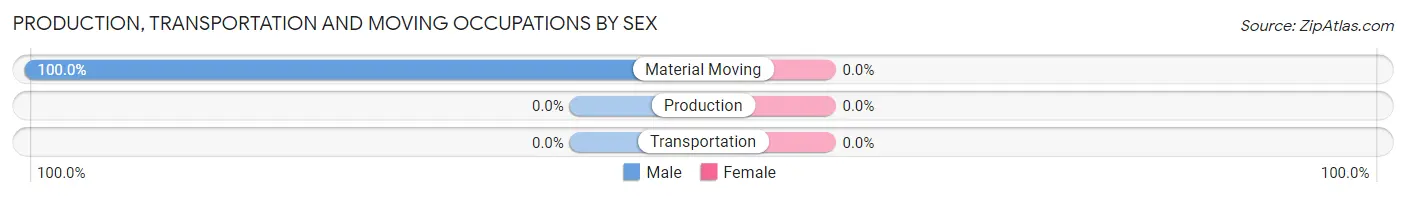
| Occupation | Male | Female |
| Production | 0 (0.0%) | 0 (0.0%) |
| Transportation | 0 (0.0%) | 0 (0.0%) |
| Material Moving | 17 (100.0%) | 0 (0.0%) |
| Total (Category) | 17 (100.0%) | 0 (0.0%) |
| Total (Overall) | 192 (66.4%) | 97 (33.6%) |
Employment Industries by Sex in Titusville
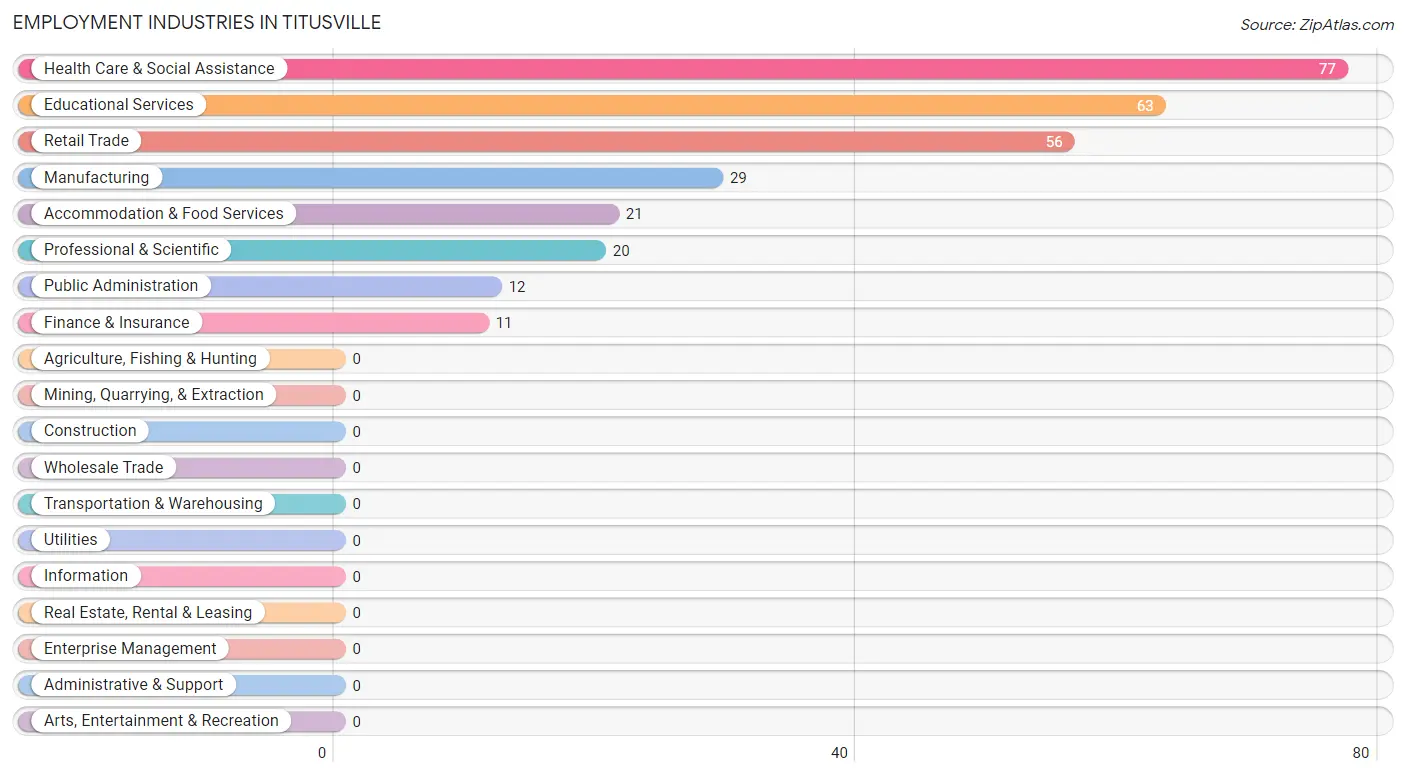
Employment Industries in Titusville
The major employment industries in Titusville include Health Care & Social Assistance (77 | 26.6%), Educational Services (63 | 21.8%), Retail Trade (56 | 19.4%), Manufacturing (29 | 10.0%), and Accommodation & Food Services (21 | 7.3%).
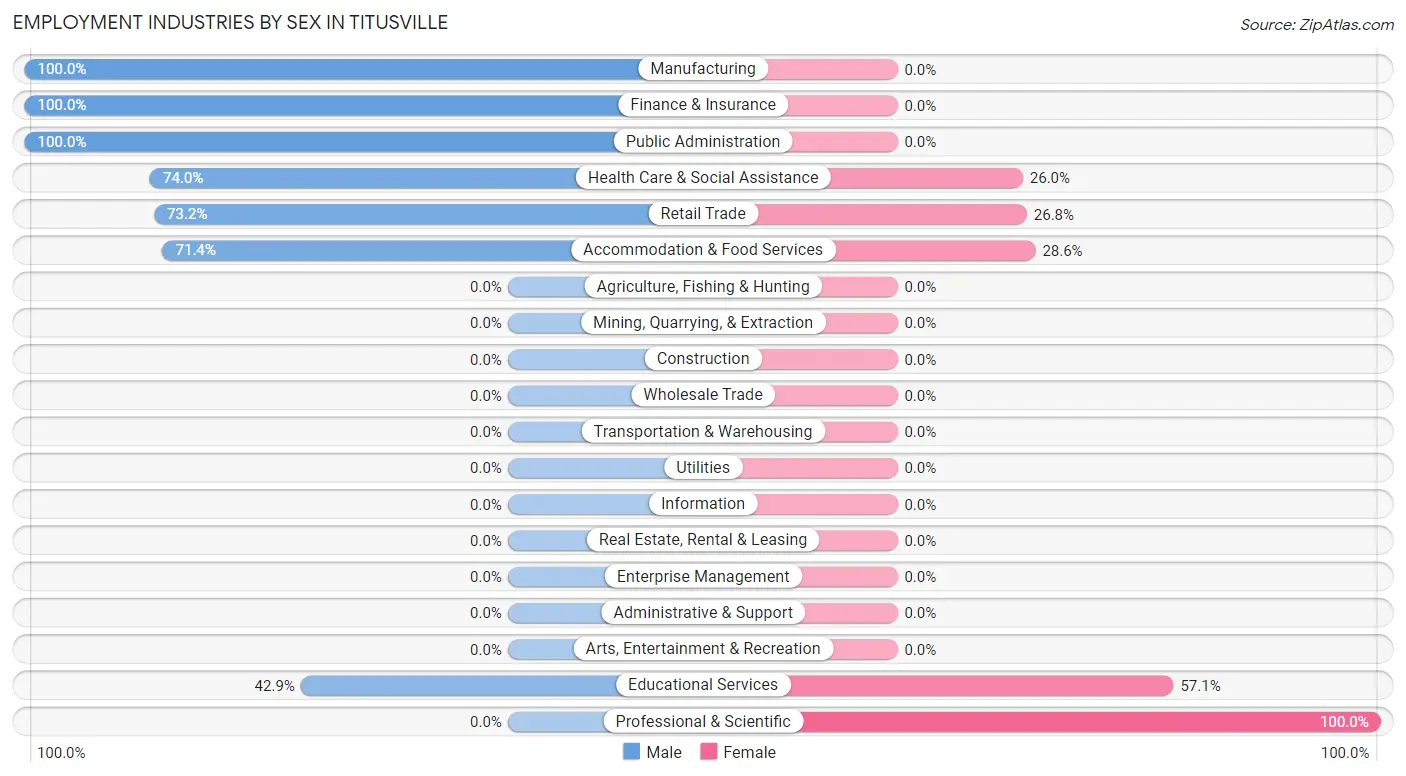
Employment Industries by Sex in Titusville
The Titusville industries that see more men than women are Manufacturing (100.0%), Finance & Insurance (100.0%), and Public Administration (100.0%), whereas the industries that tend to have a higher number of women are Professional & Scientific (100.0%), Educational Services (57.1%), and Accommodation & Food Services (28.6%).
| Industry | Male | Female |
| Agriculture, Fishing & Hunting | 0 (0.0%) | 0 (0.0%) |
| Mining, Quarrying, & Extraction | 0 (0.0%) | 0 (0.0%) |
| Construction | 0 (0.0%) | 0 (0.0%) |
| Manufacturing | 29 (100.0%) | 0 (0.0%) |
| Wholesale Trade | 0 (0.0%) | 0 (0.0%) |
| Retail Trade | 41 (73.2%) | 15 (26.8%) |
| Transportation & Warehousing | 0 (0.0%) | 0 (0.0%) |
| Utilities | 0 (0.0%) | 0 (0.0%) |
| Information | 0 (0.0%) | 0 (0.0%) |
| Finance & Insurance | 11 (100.0%) | 0 (0.0%) |
| Real Estate, Rental & Leasing | 0 (0.0%) | 0 (0.0%) |
| Professional & Scientific | 0 (0.0%) | 20 (100.0%) |
| Enterprise Management | 0 (0.0%) | 0 (0.0%) |
| Administrative & Support | 0 (0.0%) | 0 (0.0%) |
| Educational Services | 27 (42.9%) | 36 (57.1%) |
| Health Care & Social Assistance | 57 (74.0%) | 20 (26.0%) |
| Arts, Entertainment & Recreation | 0 (0.0%) | 0 (0.0%) |
| Accommodation & Food Services | 15 (71.4%) | 6 (28.6%) |
| Public Administration | 12 (100.0%) | 0 (0.0%) |
| Total | 192 (66.4%) | 97 (33.6%) |
Education in Titusville
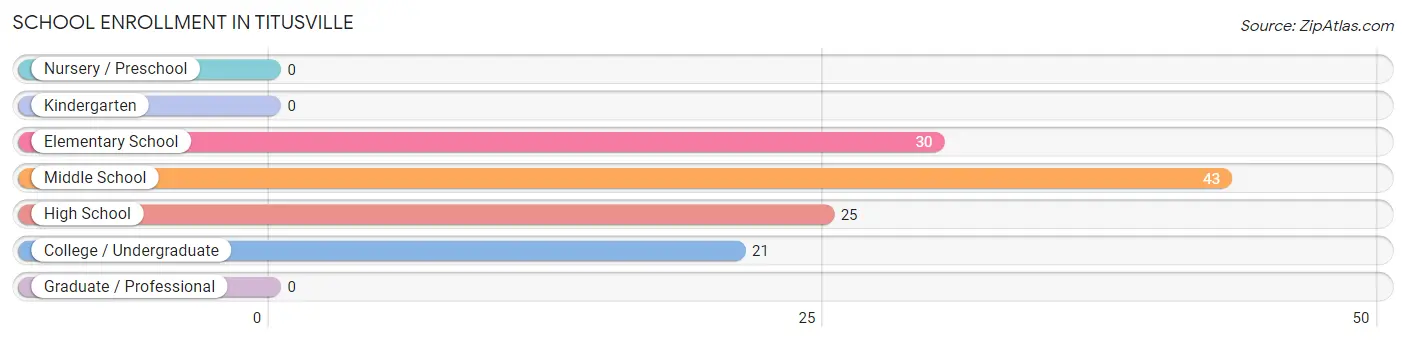
School Enrollment in Titusville
The most common levels of schooling among the 119 students in Titusville are middle school (43 | 36.1%), elementary school (30 | 25.2%), and high school (25 | 21.0%).
| School Level | # Students | % Students |
| Nursery / Preschool | 0 | 0.0% |
| Kindergarten | 0 | 0.0% |
| Elementary School | 30 | 25.2% |
| Middle School | 43 | 36.1% |
| High School | 25 | 21.0% |
| College / Undergraduate | 21 | 17.6% |
| Graduate / Professional | 0 | 0.0% |
| Total | 119 | 100.0% |
School Enrollment by Age by Funding Source in Titusville
Out of a total of 119 students who are enrolled in schools in Titusville, 8 (6.7%) attend a private institution, while the remaining 111 (93.3%) are enrolled in public schools. The age group of 20 to 24 year olds has the highest likelihood of being enrolled in private schools, with 8 (38.1% in the age bracket) enrolled. Conversely, the age group of 10 to 14 year olds has the lowest likelihood of being enrolled in a private school, with 73 (100.0% in the age bracket) attending a public institution.
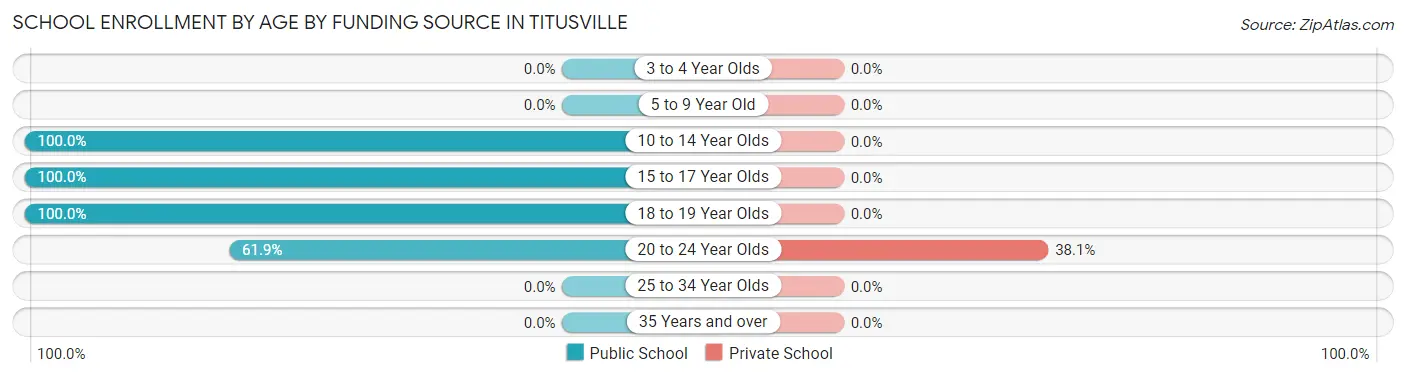
| Age Bracket | Public School | Private School |
| 3 to 4 Year Olds | 0 (0.0%) | 0 (0.0%) |
| 5 to 9 Year Old | 0 (0.0%) | 0 (0.0%) |
| 10 to 14 Year Olds | 73 (100.0%) | 0 (0.0%) |
| 15 to 17 Year Olds | 12 (100.0%) | 0 (0.0%) |
| 18 to 19 Year Olds | 13 (100.0%) | 0 (0.0%) |
| 20 to 24 Year Olds | 13 (61.9%) | 8 (38.1%) |
| 25 to 34 Year Olds | 0 (0.0%) | 0 (0.0%) |
| 35 Years and over | 0 (0.0%) | 0 (0.0%) |
| Total | 111 (93.3%) | 8 (6.7%) |
Educational Attainment by Field of Study in Titusville
Education (55 | 22.6%), engineering (53 | 21.8%), science & technology (41 | 16.9%), computers & mathematics (34 | 14.0%), and social sciences (21 | 8.6%) are the most common fields of study among 243 individuals in Titusville who have obtained a bachelor's degree or higher.

| Field of Study | # Graduates | % Graduates |
| Computers & Mathematics | 34 | 14.0% |
| Bio, Nature & Agricultural | 20 | 8.2% |
| Physical & Health Sciences | 0 | 0.0% |
| Psychology | 0 | 0.0% |
| Social Sciences | 21 | 8.6% |
| Engineering | 53 | 21.8% |
| Multidisciplinary Studies | 0 | 0.0% |
| Science & Technology | 41 | 16.9% |
| Business | 18 | 7.4% |
| Education | 55 | 22.6% |
| Literature & Languages | 0 | 0.0% |
| Liberal Arts & History | 1 | 0.4% |
| Visual & Performing Arts | 0 | 0.0% |
| Communications | 0 | 0.0% |
| Arts & Humanities | 0 | 0.0% |
| Total | 243 | 100.0% |
Transportation & Commute in Titusville
Vehicle Availability by Sex in Titusville
The most prevalent vehicle ownership categories in Titusville are males with 2 vehicles (93, accounting for 48.4%) and females with 2 vehicles (50, making up 95.9%).
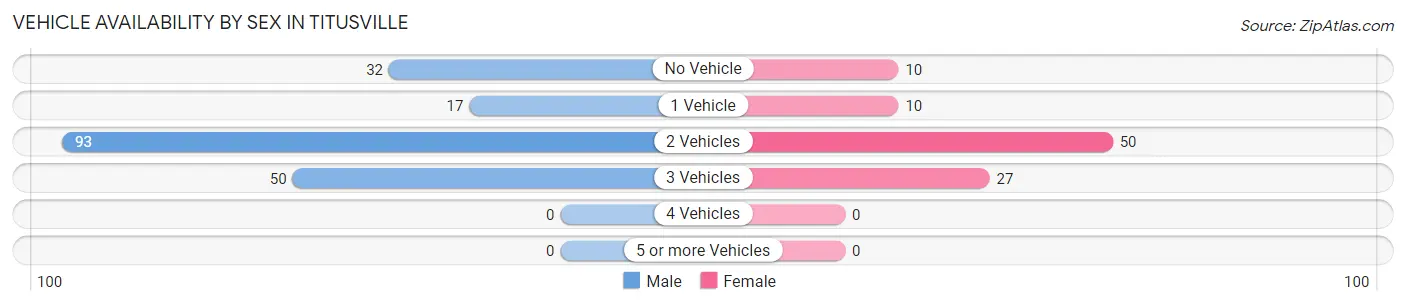
| Vehicles Available | Male | Female |
| No Vehicle | 32 (16.7%) | 10 (10.3%) |
| 1 Vehicle | 17 (8.8%) | 10 (10.3%) |
| 2 Vehicles | 93 (48.4%) | 50 (51.5%) |
| 3 Vehicles | 50 (26.0%) | 27 (27.8%) |
| 4 Vehicles | 0 (0.0%) | 0 (0.0%) |
| 5 or more Vehicles | 0 (0.0%) | 0 (0.0%) |
| Total | 192 (100.0%) | 97 (100.0%) |
Commute Time in Titusville
The most frequently occuring commute durations in Titusville are 15 to 19 minutes (98 commuters, 39.7%), 10 to 14 minutes (36 commuters, 14.6%), and 60 to 89 minutes (35 commuters, 14.2%).
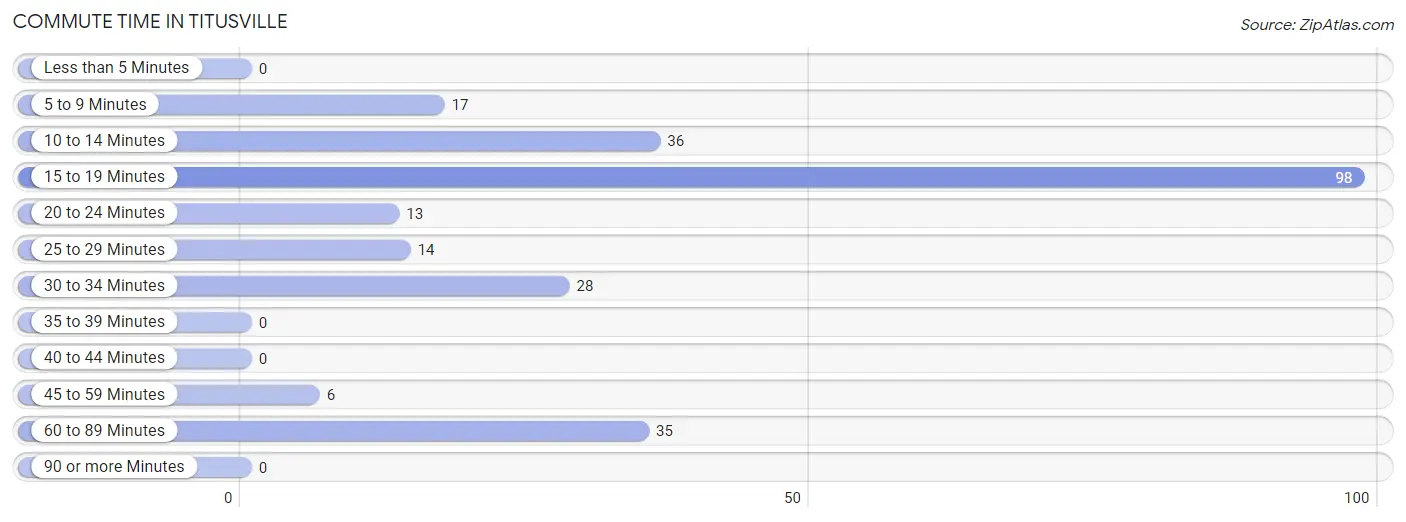
| Commute Time | # Commuters | % Commuters |
| Less than 5 Minutes | 0 | 0.0% |
| 5 to 9 Minutes | 17 | 6.9% |
| 10 to 14 Minutes | 36 | 14.6% |
| 15 to 19 Minutes | 98 | 39.7% |
| 20 to 24 Minutes | 13 | 5.3% |
| 25 to 29 Minutes | 14 | 5.7% |
| 30 to 34 Minutes | 28 | 11.3% |
| 35 to 39 Minutes | 0 | 0.0% |
| 40 to 44 Minutes | 0 | 0.0% |
| 45 to 59 Minutes | 6 | 2.4% |
| 60 to 89 Minutes | 35 | 14.2% |
| 90 or more Minutes | 0 | 0.0% |
Commute Time by Sex in Titusville
The most common commute times in Titusville are 15 to 19 minutes (68 commuters, 44.7%) for males and 15 to 19 minutes (30 commuters, 31.6%) for females.
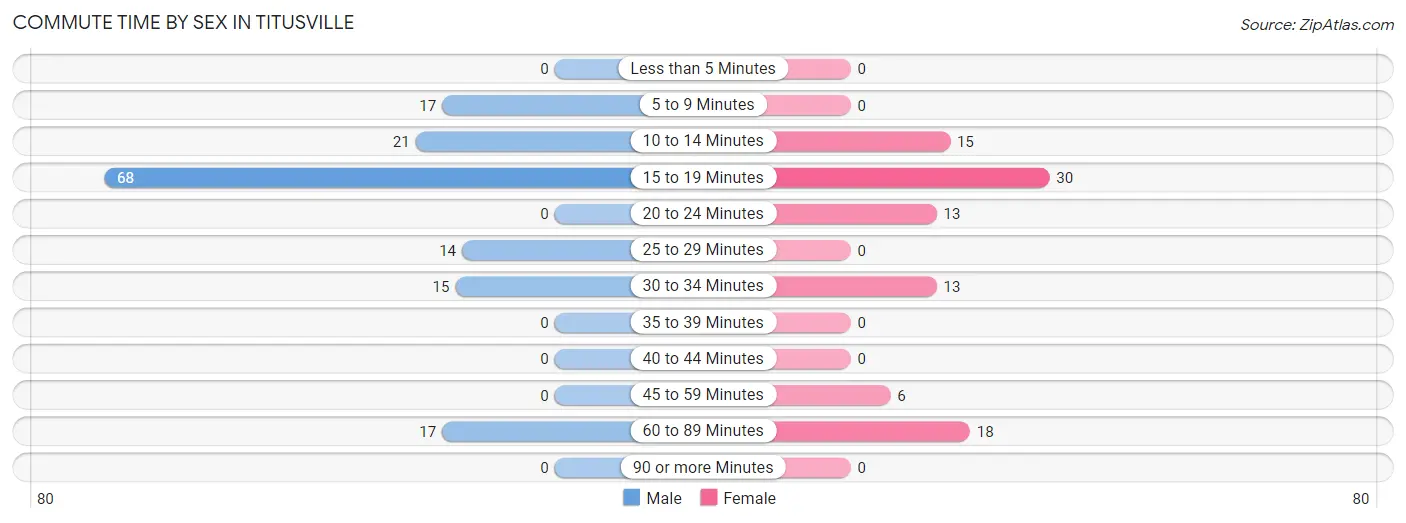
| Commute Time | Male | Female |
| Less than 5 Minutes | 0 (0.0%) | 0 (0.0%) |
| 5 to 9 Minutes | 17 (11.2%) | 0 (0.0%) |
| 10 to 14 Minutes | 21 (13.8%) | 15 (15.8%) |
| 15 to 19 Minutes | 68 (44.7%) | 30 (31.6%) |
| 20 to 24 Minutes | 0 (0.0%) | 13 (13.7%) |
| 25 to 29 Minutes | 14 (9.2%) | 0 (0.0%) |
| 30 to 34 Minutes | 15 (9.9%) | 13 (13.7%) |
| 35 to 39 Minutes | 0 (0.0%) | 0 (0.0%) |
| 40 to 44 Minutes | 0 (0.0%) | 0 (0.0%) |
| 45 to 59 Minutes | 0 (0.0%) | 6 (6.3%) |
| 60 to 89 Minutes | 17 (11.2%) | 18 (19.0%) |
| 90 or more Minutes | 0 (0.0%) | 0 (0.0%) |
Time of Departure to Work by Sex in Titusville
The most frequent times of departure to work in Titusville are 7:00 AM to 7:29 AM (45, 29.6%) for males and 6:30 AM to 6:59 AM (26, 27.4%) for females.
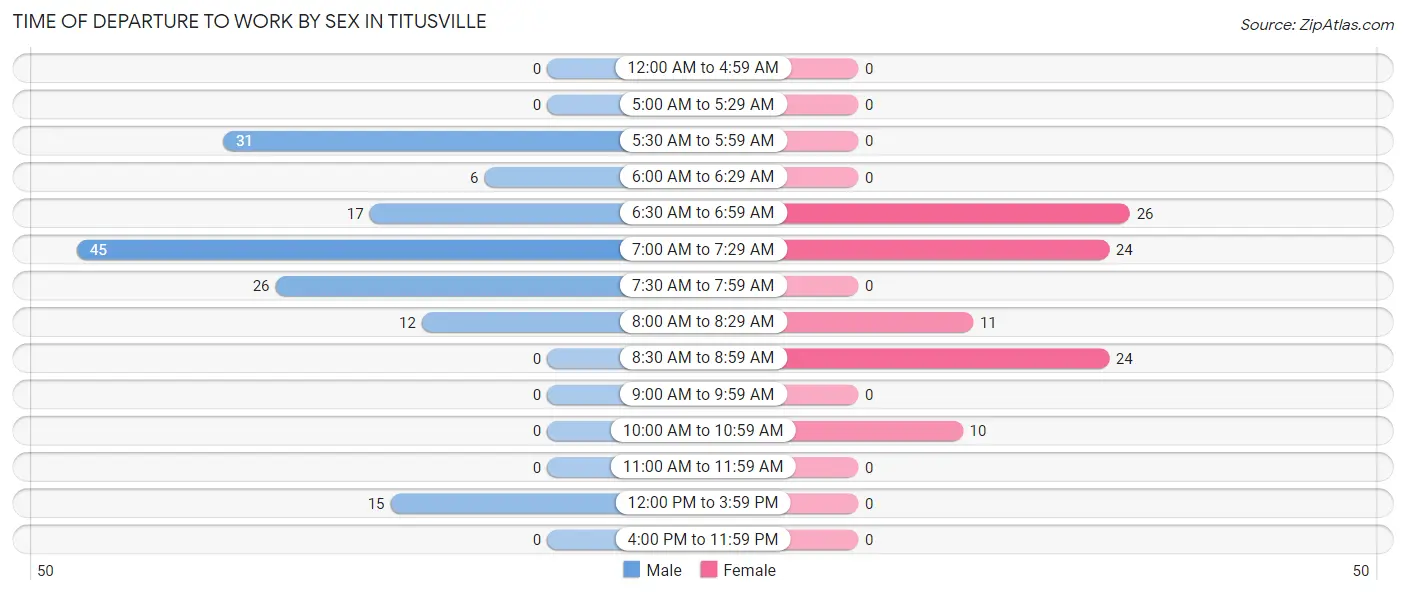
| Time of Departure | Male | Female |
| 12:00 AM to 4:59 AM | 0 (0.0%) | 0 (0.0%) |
| 5:00 AM to 5:29 AM | 0 (0.0%) | 0 (0.0%) |
| 5:30 AM to 5:59 AM | 31 (20.4%) | 0 (0.0%) |
| 6:00 AM to 6:29 AM | 6 (4.0%) | 0 (0.0%) |
| 6:30 AM to 6:59 AM | 17 (11.2%) | 26 (27.4%) |
| 7:00 AM to 7:29 AM | 45 (29.6%) | 24 (25.3%) |
| 7:30 AM to 7:59 AM | 26 (17.1%) | 0 (0.0%) |
| 8:00 AM to 8:29 AM | 12 (7.9%) | 11 (11.6%) |
| 8:30 AM to 8:59 AM | 0 (0.0%) | 24 (25.3%) |
| 9:00 AM to 9:59 AM | 0 (0.0%) | 0 (0.0%) |
| 10:00 AM to 10:59 AM | 0 (0.0%) | 10 (10.5%) |
| 11:00 AM to 11:59 AM | 0 (0.0%) | 0 (0.0%) |
| 12:00 PM to 3:59 PM | 15 (9.9%) | 0 (0.0%) |
| 4:00 PM to 11:59 PM | 0 (0.0%) | 0 (0.0%) |
| Total | 152 (100.0%) | 95 (100.0%) |
Housing Occupancy in Titusville
Occupancy by Ownership in Titusville
Of the total 311 dwellings in Titusville, owner-occupied units account for 294 (94.5%), while renter-occupied units make up 17 (5.5%).
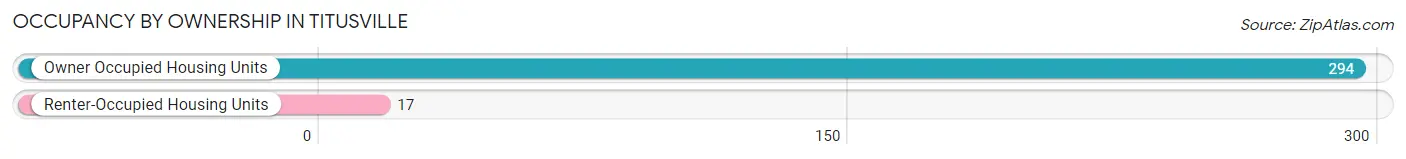
| Occupancy | # Housing Units | % Housing Units |
| Owner Occupied Housing Units | 294 | 94.5% |
| Renter-Occupied Housing Units | 17 | 5.5% |
| Total Occupied Housing Units | 311 | 100.0% |
Occupancy by Household Size in Titusville
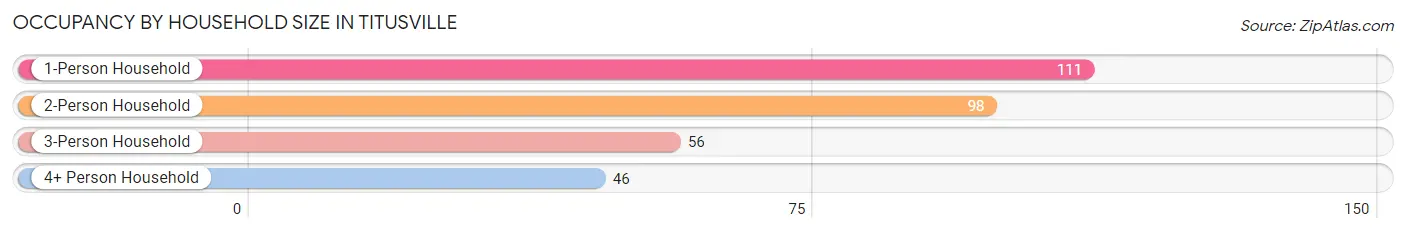
| Household Size | # Housing Units | % Housing Units |
| 1-Person Household | 111 | 35.7% |
| 2-Person Household | 98 | 31.5% |
| 3-Person Household | 56 | 18.0% |
| 4+ Person Household | 46 | 14.8% |
| Total Housing Units | 311 | 100.0% |
Occupancy by Ownership by Household Size in Titusville
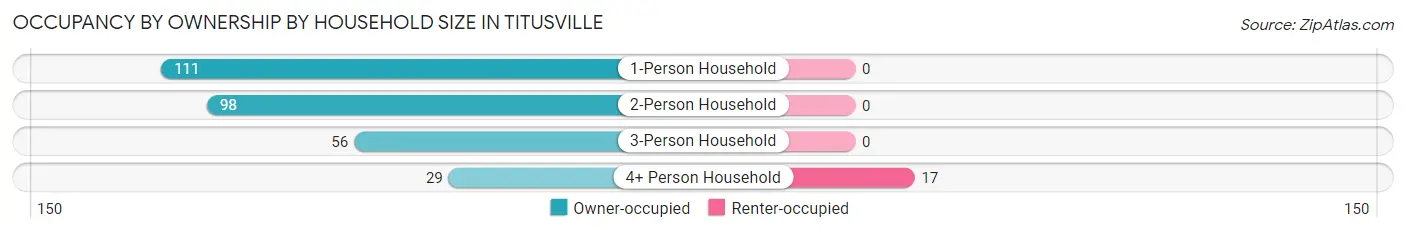
| Household Size | Owner-occupied | Renter-occupied |
| 1-Person Household | 111 (100.0%) | 0 (0.0%) |
| 2-Person Household | 98 (100.0%) | 0 (0.0%) |
| 3-Person Household | 56 (100.0%) | 0 (0.0%) |
| 4+ Person Household | 29 (63.0%) | 17 (37.0%) |
| Total Housing Units | 294 (94.5%) | 17 (5.5%) |
Occupancy by Educational Attainment in Titusville
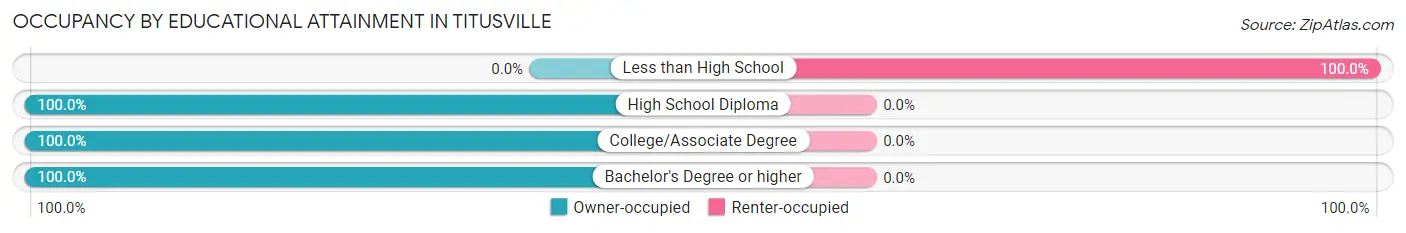
| Household Size | Owner-occupied | Renter-occupied |
| Less than High School | 0 (0.0%) | 17 (100.0%) |
| High School Diploma | 29 (100.0%) | 0 (0.0%) |
| College/Associate Degree | 93 (100.0%) | 0 (0.0%) |
| Bachelor's Degree or higher | 172 (100.0%) | 0 (0.0%) |
Occupancy by Age of Householder in Titusville
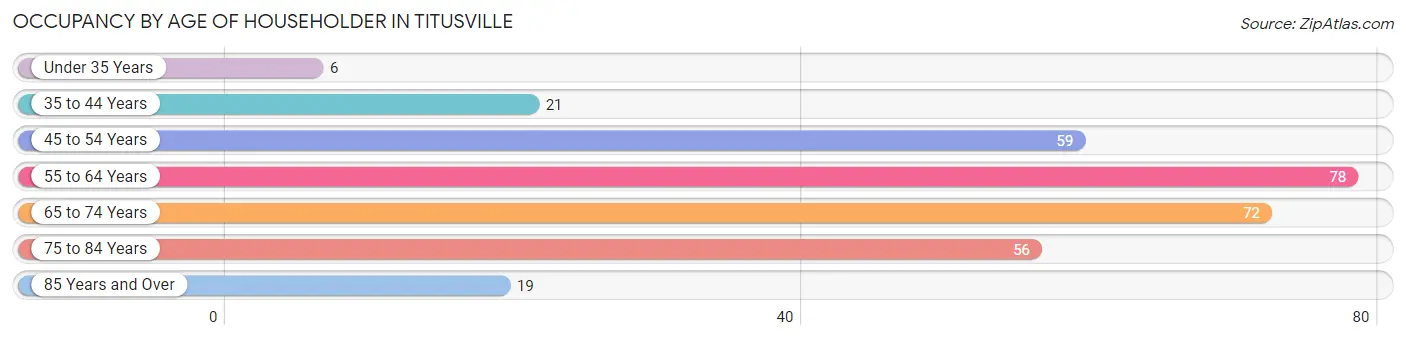
| Age Bracket | # Households | % Households |
| Under 35 Years | 6 | 1.9% |
| 35 to 44 Years | 21 | 6.8% |
| 45 to 54 Years | 59 | 19.0% |
| 55 to 64 Years | 78 | 25.1% |
| 65 to 74 Years | 72 | 23.2% |
| 75 to 84 Years | 56 | 18.0% |
| 85 Years and Over | 19 | 6.1% |
| Total | 311 | 100.0% |
Housing Finances in Titusville
Median Income by Occupancy in Titusville
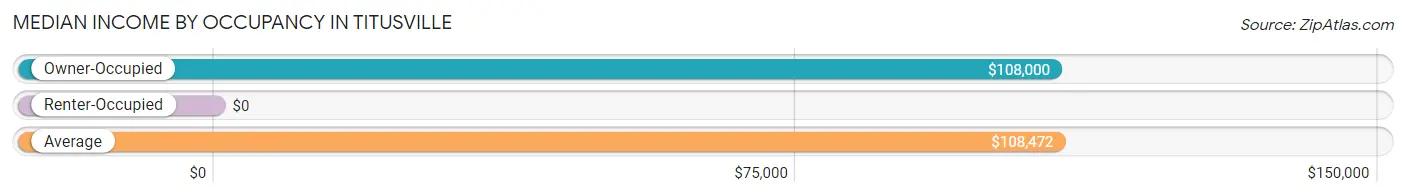
| Occupancy Type | # Households | Median Income |
| Owner-Occupied | 294 (94.5%) | $108,000 |
| Renter-Occupied | 17 (5.5%) | $0 |
| Average | 311 (100.0%) | $108,472 |
Occupancy by Householder Income Bracket in Titusville
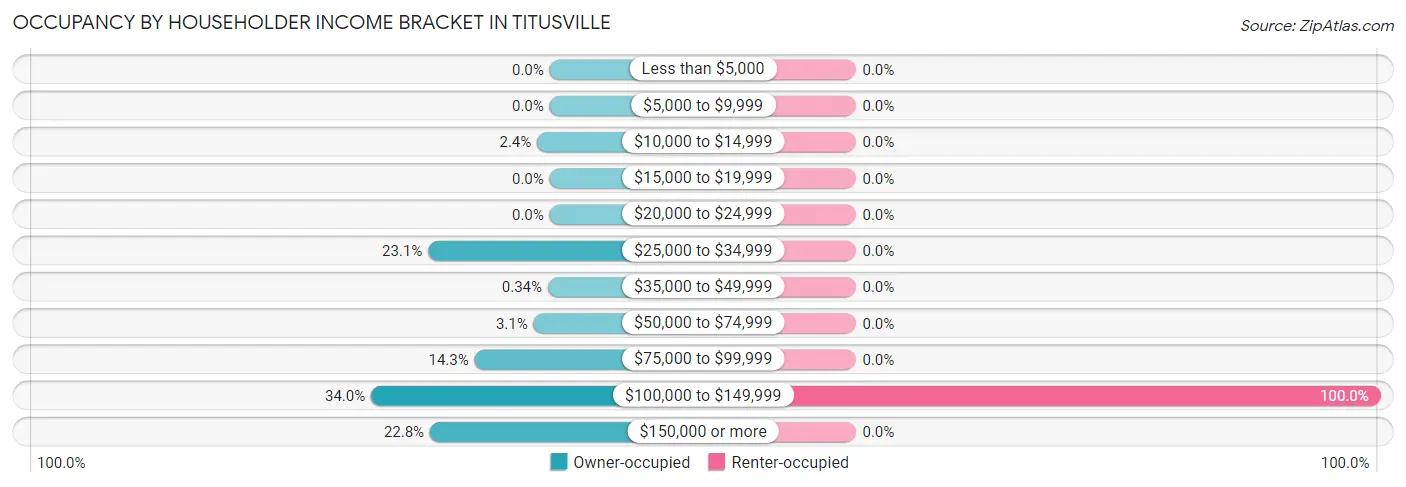
| Income Bracket | Owner-occupied | Renter-occupied |
| Less than $5,000 | 0 (0.0%) | 0 (0.0%) |
| $5,000 to $9,999 | 0 (0.0%) | 0 (0.0%) |
| $10,000 to $14,999 | 7 (2.4%) | 0 (0.0%) |
| $15,000 to $19,999 | 0 (0.0%) | 0 (0.0%) |
| $20,000 to $24,999 | 0 (0.0%) | 0 (0.0%) |
| $25,000 to $34,999 | 68 (23.1%) | 0 (0.0%) |
| $35,000 to $49,999 | 1 (0.3%) | 0 (0.0%) |
| $50,000 to $74,999 | 9 (3.1%) | 0 (0.0%) |
| $75,000 to $99,999 | 42 (14.3%) | 0 (0.0%) |
| $100,000 to $149,999 | 100 (34.0%) | 17 (100.0%) |
| $150,000 or more | 67 (22.8%) | 0 (0.0%) |
| Total | 294 (100.0%) | 17 (100.0%) |
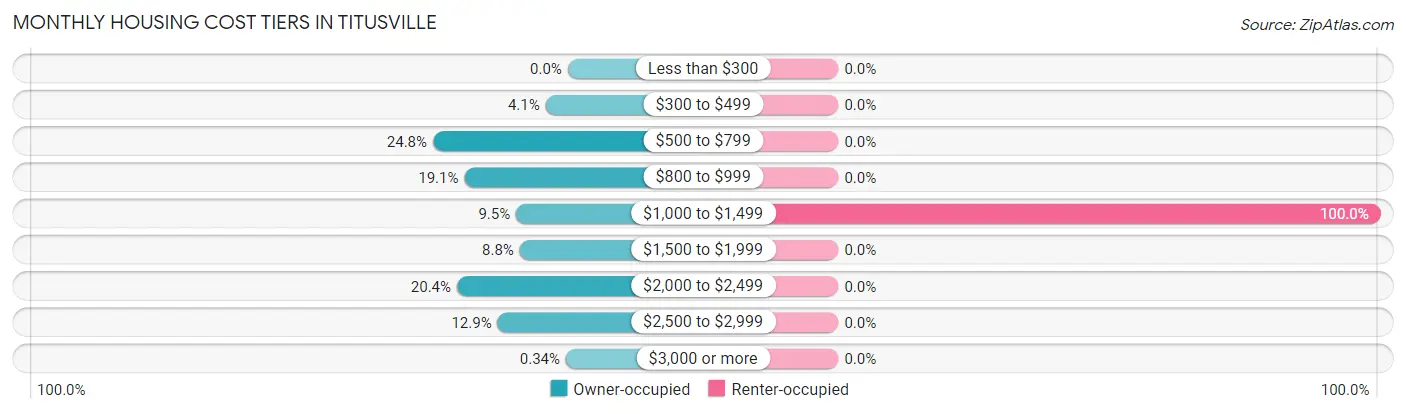
Monthly Housing Cost Tiers in Titusville
| Monthly Cost | Owner-occupied | Renter-occupied |
| Less than $300 | 0 (0.0%) | 0 (0.0%) |
| $300 to $499 | 12 (4.1%) | 0 (0.0%) |
| $500 to $799 | 73 (24.8%) | 0 (0.0%) |
| $800 to $999 | 56 (19.1%) | 0 (0.0%) |
| $1,000 to $1,499 | 28 (9.5%) | 17 (100.0%) |
| $1,500 to $1,999 | 26 (8.8%) | 0 (0.0%) |
| $2,000 to $2,499 | 60 (20.4%) | 0 (0.0%) |
| $2,500 to $2,999 | 38 (12.9%) | 0 (0.0%) |
| $3,000 or more | 1 (0.3%) | 0 (0.0%) |
| Total | 294 (100.0%) | 17 (100.0%) |
Physical Housing Characteristics in Titusville
Housing Structures in Titusville
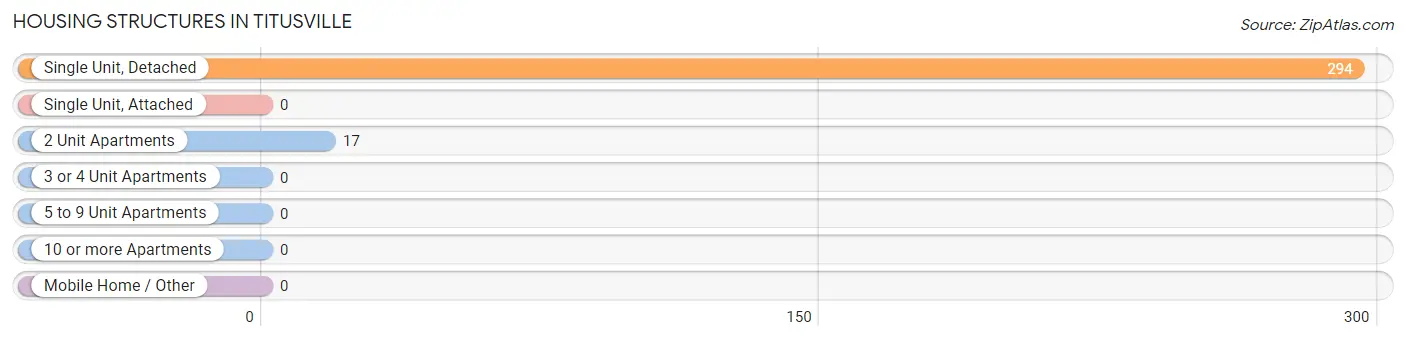
| Structure Type | # Housing Units | % Housing Units |
| Single Unit, Detached | 294 | 94.5% |
| Single Unit, Attached | 0 | 0.0% |
| 2 Unit Apartments | 17 | 5.5% |
| 3 or 4 Unit Apartments | 0 | 0.0% |
| 5 to 9 Unit Apartments | 0 | 0.0% |
| 10 or more Apartments | 0 | 0.0% |
| Mobile Home / Other | 0 | 0.0% |
| Total | 311 | 100.0% |
Housing Structures by Occupancy in Titusville
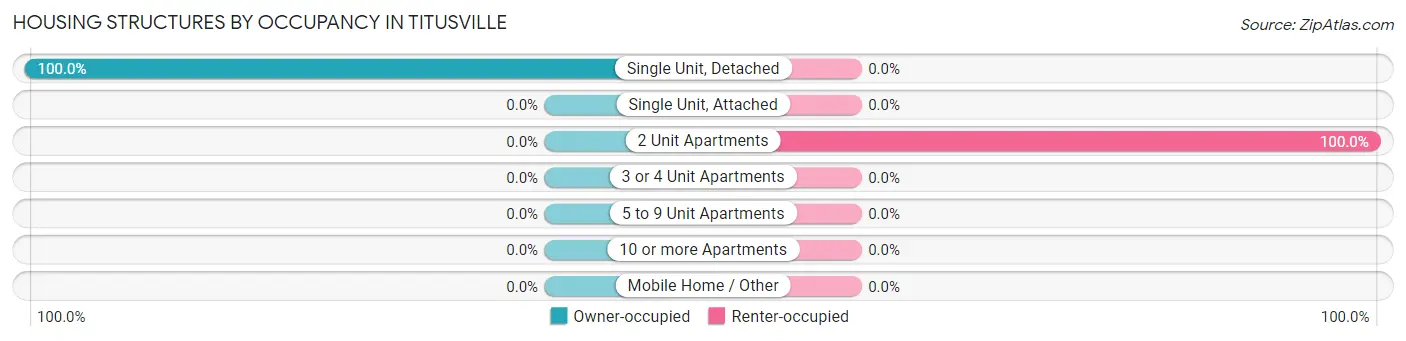
| Structure Type | Owner-occupied | Renter-occupied |
| Single Unit, Detached | 294 (100.0%) | 0 (0.0%) |
| Single Unit, Attached | 0 (0.0%) | 0 (0.0%) |
| 2 Unit Apartments | 0 (0.0%) | 17 (100.0%) |
| 3 or 4 Unit Apartments | 0 (0.0%) | 0 (0.0%) |
| 5 to 9 Unit Apartments | 0 (0.0%) | 0 (0.0%) |
| 10 or more Apartments | 0 (0.0%) | 0 (0.0%) |
| Mobile Home / Other | 0 (0.0%) | 0 (0.0%) |
| Total | 294 (94.5%) | 17 (5.5%) |
Housing Structures by Number of Rooms in Titusville
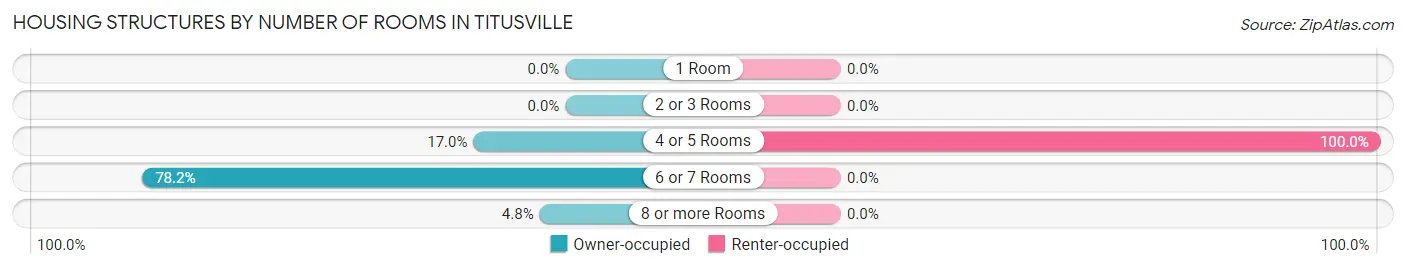
| Number of Rooms | Owner-occupied | Renter-occupied |
| 1 Room | 0 (0.0%) | 0 (0.0%) |
| 2 or 3 Rooms | 0 (0.0%) | 0 (0.0%) |
| 4 or 5 Rooms | 50 (17.0%) | 17 (100.0%) |
| 6 or 7 Rooms | 230 (78.2%) | 0 (0.0%) |
| 8 or more Rooms | 14 (4.8%) | 0 (0.0%) |
| Total | 294 (100.0%) | 17 (100.0%) |
Housing Structure by Heating Type in Titusville
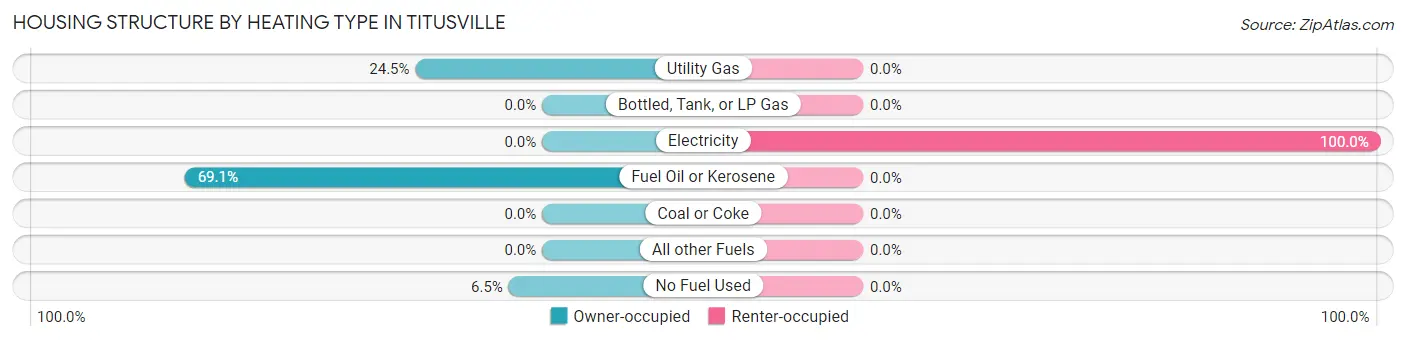
| Heating Type | Owner-occupied | Renter-occupied |
| Utility Gas | 72 (24.5%) | 0 (0.0%) |
| Bottled, Tank, or LP Gas | 0 (0.0%) | 0 (0.0%) |
| Electricity | 0 (0.0%) | 17 (100.0%) |
| Fuel Oil or Kerosene | 203 (69.1%) | 0 (0.0%) |
| Coal or Coke | 0 (0.0%) | 0 (0.0%) |
| All other Fuels | 0 (0.0%) | 0 (0.0%) |
| No Fuel Used | 19 (6.5%) | 0 (0.0%) |
| Total | 294 (100.0%) | 17 (100.0%) |
Household Vehicle Usage in Titusville
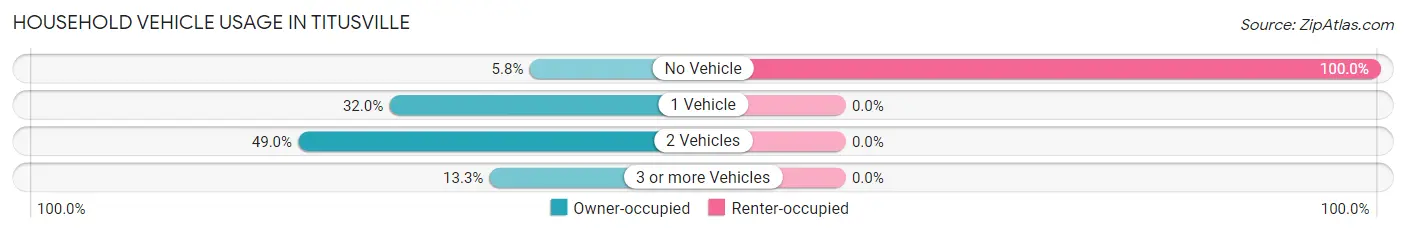
| Vehicles per Household | Owner-occupied | Renter-occupied |
| No Vehicle | 17 (5.8%) | 17 (100.0%) |
| 1 Vehicle | 94 (32.0%) | 0 (0.0%) |
| 2 Vehicles | 144 (49.0%) | 0 (0.0%) |
| 3 or more Vehicles | 39 (13.3%) | 0 (0.0%) |
| Total | 294 (100.0%) | 17 (100.0%) |
Real Estate & Mortgages in Titusville
Real Estate and Mortgage Overview in Titusville
| Characteristic | Without Mortgage | With Mortgage |
| Housing Units | 169 | 125 |
| Median Property Value | $364,800 | $303,800 |
| Median Household Income | - | - |
| Monthly Housing Costs | $798 | $1 |
| Real Estate Taxes | $5,063 | $0 |
Property Value by Mortgage Status in Titusville
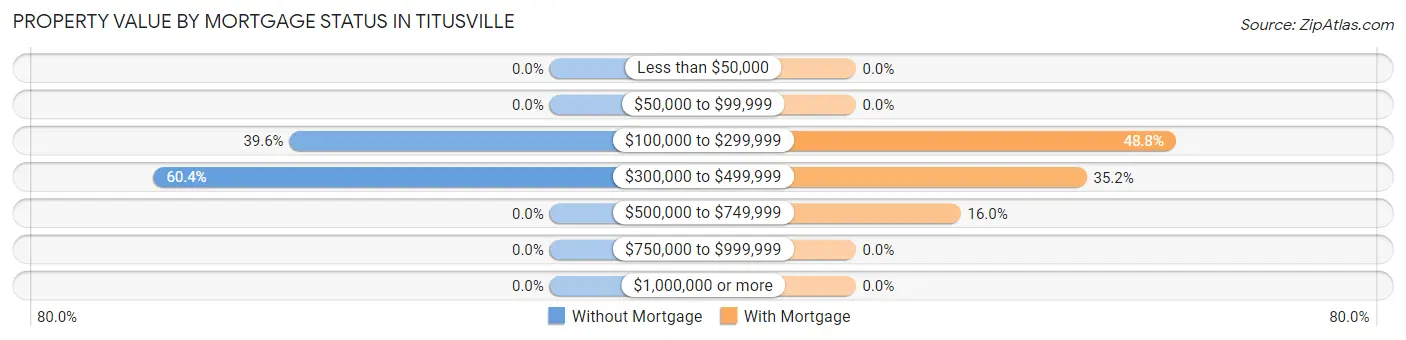
| Property Value | Without Mortgage | With Mortgage |
| Less than $50,000 | 0 (0.0%) | 0 (0.0%) |
| $50,000 to $99,999 | 0 (0.0%) | 0 (0.0%) |
| $100,000 to $299,999 | 67 (39.6%) | 61 (48.8%) |
| $300,000 to $499,999 | 102 (60.4%) | 44 (35.2%) |
| $500,000 to $749,999 | 0 (0.0%) | 20 (16.0%) |
| $750,000 to $999,999 | 0 (0.0%) | 0 (0.0%) |
| $1,000,000 or more | 0 (0.0%) | 0 (0.0%) |
| Total | 169 (100.0%) | 125 (100.0%) |
Household Income by Mortgage Status in Titusville
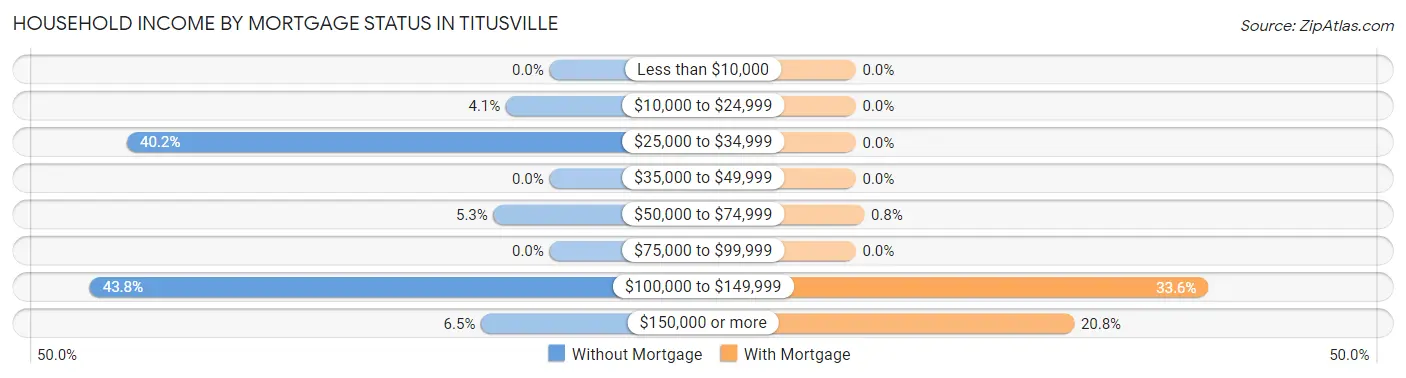
| Household Income | Without Mortgage | With Mortgage |
| Less than $10,000 | 0 (0.0%) | 0 (0.0%) |
| $10,000 to $24,999 | 7 (4.1%) | 0 (0.0%) |
| $25,000 to $34,999 | 68 (40.2%) | 0 (0.0%) |
| $35,000 to $49,999 | 0 (0.0%) | 0 (0.0%) |
| $50,000 to $74,999 | 9 (5.3%) | 1 (0.8%) |
| $75,000 to $99,999 | 0 (0.0%) | 0 (0.0%) |
| $100,000 to $149,999 | 74 (43.8%) | 42 (33.6%) |
| $150,000 or more | 11 (6.5%) | 26 (20.8%) |
| Total | 169 (100.0%) | 125 (100.0%) |
Property Value to Household Income Ratio in Titusville
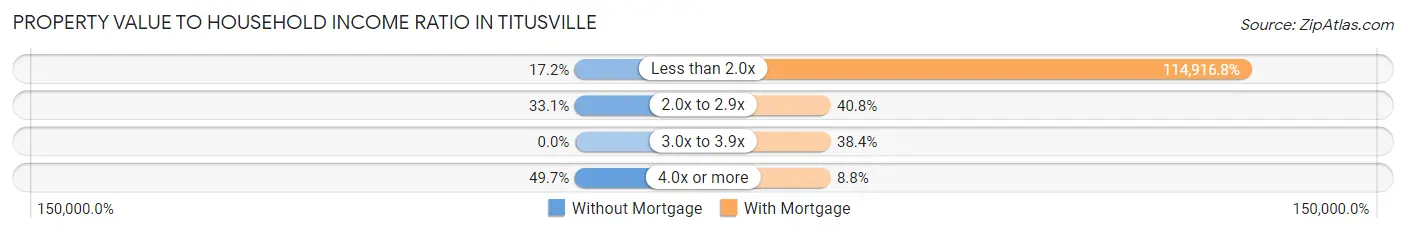
| Value-to-Income Ratio | Without Mortgage | With Mortgage |
| Less than 2.0x | 29 (17.2%) | 143,646 (114,916.8%) |
| 2.0x to 2.9x | 56 (33.1%) | 51 (40.8%) |
| 3.0x to 3.9x | 0 (0.0%) | 48 (38.4%) |
| 4.0x or more | 84 (49.7%) | 11 (8.8%) |
| Total | 169 (100.0%) | 125 (100.0%) |
Real Estate Taxes by Mortgage Status in Titusville

| Property Taxes | Without Mortgage | With Mortgage |
| Less than $800 | 0 (0.0%) | 0 (0.0%) |
| $800 to $1,499 | 0 (0.0%) | 0 (0.0%) |
| $800 to $1,499 | 169 (100.0%) | 0 (0.0%) |
| Total | 169 (100.0%) | 125 (100.0%) |
Health & Disability in Titusville
Health Insurance Coverage by Age in Titusville
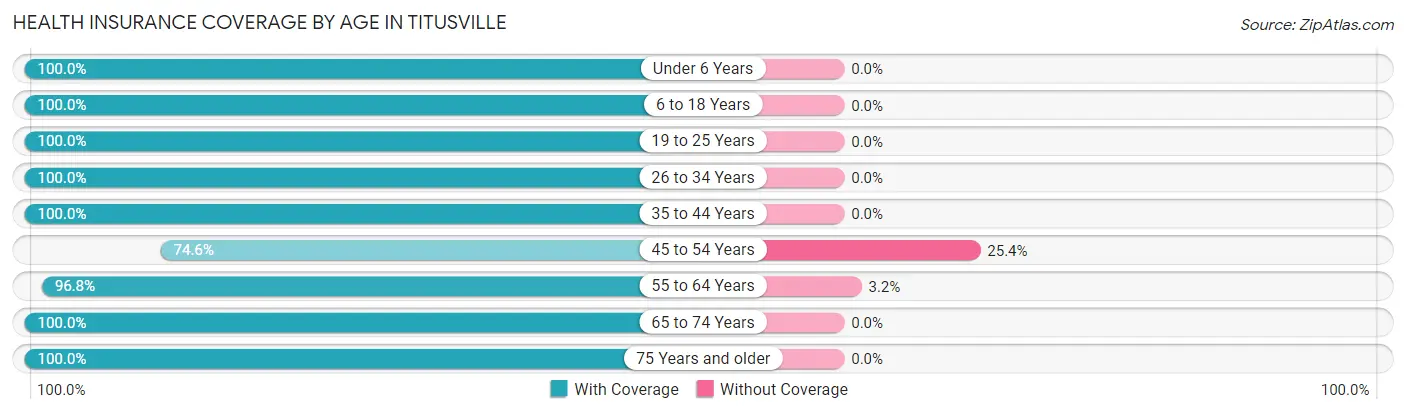
| Age Bracket | With Coverage | Without Coverage |
| Under 6 Years | 10 (100.0%) | 0 (0.0%) |
| 6 to 18 Years | 98 (100.0%) | 0 (0.0%) |
| 19 to 25 Years | 36 (100.0%) | 0 (0.0%) |
| 26 to 34 Years | 12 (100.0%) | 0 (0.0%) |
| 35 to 44 Years | 55 (100.0%) | 0 (0.0%) |
| 45 to 54 Years | 50 (74.6%) | 17 (25.4%) |
| 55 to 64 Years | 151 (96.8%) | 5 (3.2%) |
| 65 to 74 Years | 93 (100.0%) | 0 (0.0%) |
| 75 Years and older | 86 (100.0%) | 0 (0.0%) |
| Total | 591 (96.4%) | 22 (3.6%) |
Health Insurance Coverage by Citizenship Status in Titusville
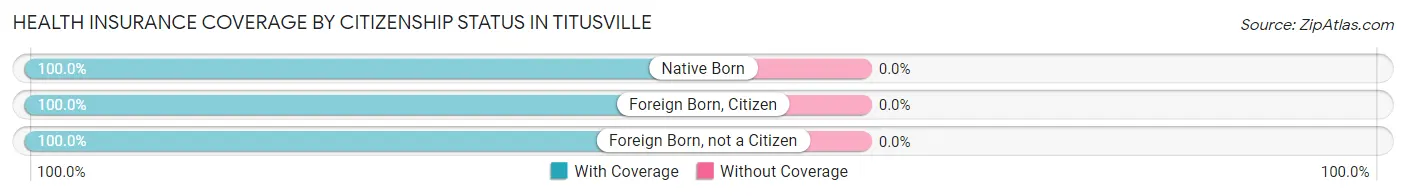
| Citizenship Status | With Coverage | Without Coverage |
| Native Born | 10 (100.0%) | 0 (0.0%) |
| Foreign Born, Citizen | 98 (100.0%) | 0 (0.0%) |
| Foreign Born, not a Citizen | 36 (100.0%) | 0 (0.0%) |
Health Insurance Coverage by Household Income in Titusville
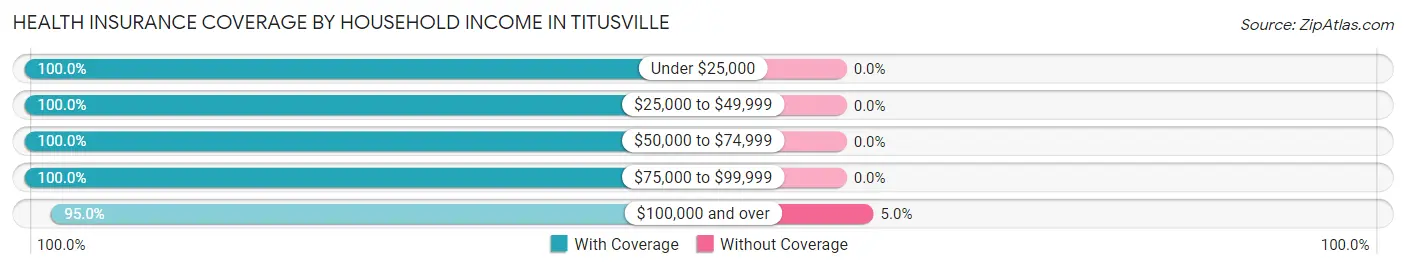
| Household Income | With Coverage | Without Coverage |
| Under $25,000 | 7 (100.0%) | 0 (0.0%) |
| $25,000 to $49,999 | 70 (100.0%) | 0 (0.0%) |
| $50,000 to $74,999 | 9 (100.0%) | 0 (0.0%) |
| $75,000 to $99,999 | 90 (100.0%) | 0 (0.0%) |
| $100,000 and over | 415 (95.0%) | 22 (5.0%) |
Public vs Private Health Insurance Coverage by Age in Titusville
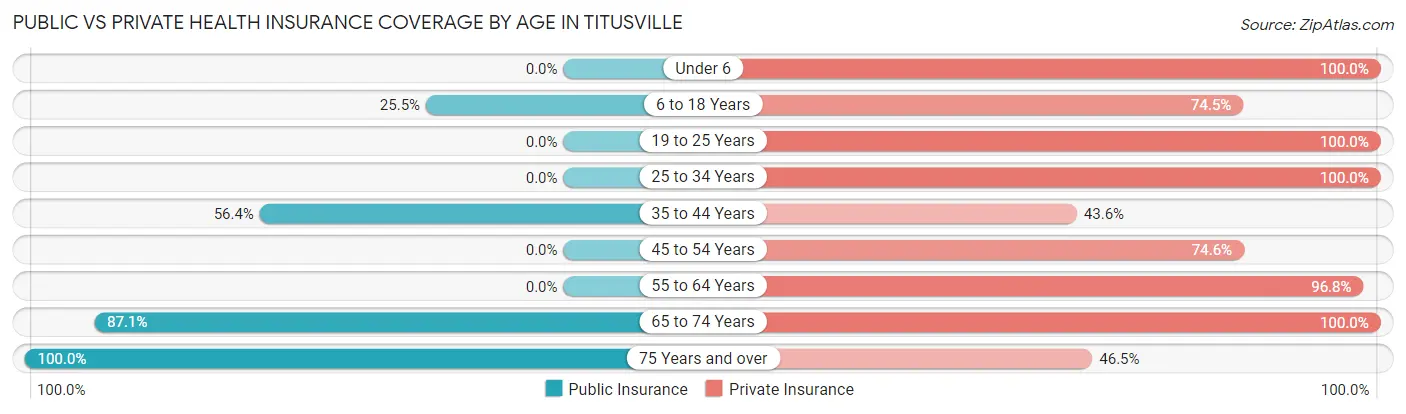
| Age Bracket | Public Insurance | Private Insurance |
| Under 6 | 0 (0.0%) | 10 (100.0%) |
| 6 to 18 Years | 25 (25.5%) | 73 (74.5%) |
| 19 to 25 Years | 0 (0.0%) | 36 (100.0%) |
| 25 to 34 Years | 0 (0.0%) | 12 (100.0%) |
| 35 to 44 Years | 31 (56.4%) | 24 (43.6%) |
| 45 to 54 Years | 0 (0.0%) | 50 (74.6%) |
| 55 to 64 Years | 0 (0.0%) | 151 (96.8%) |
| 65 to 74 Years | 81 (87.1%) | 93 (100.0%) |
| 75 Years and over | 86 (100.0%) | 40 (46.5%) |
| Total | 223 (36.4%) | 489 (79.8%) |
Disability Status by Sex by Age in Titusville
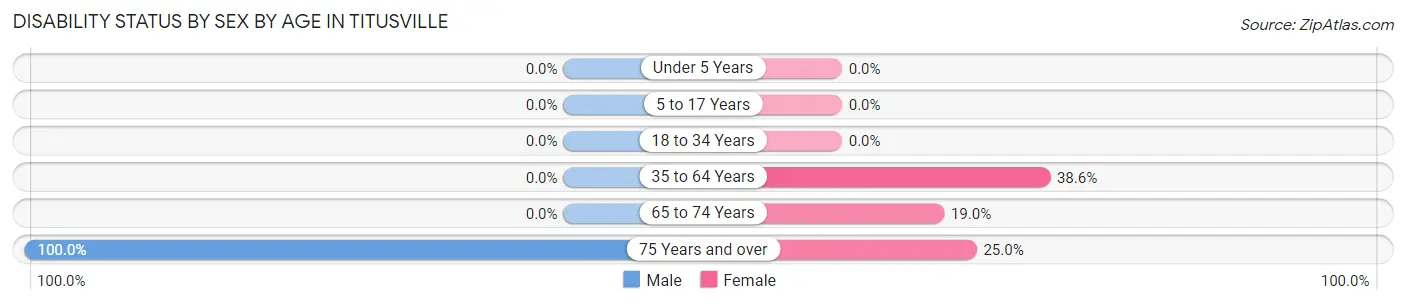
| Age Bracket | Male | Female |
| Under 5 Years | 0 (0.0%) | 0 (0.0%) |
| 5 to 17 Years | 0 (0.0%) | 0 (0.0%) |
| 18 to 34 Years | 0 (0.0%) | 0 (0.0%) |
| 35 to 64 Years | 0 (0.0%) | 51 (38.6%) |
| 65 to 74 Years | 0 (0.0%) | 11 (19.0%) |
| 75 Years and over | 10 (100.0%) | 19 (25.0%) |
Disability Class by Sex by Age in Titusville
Disability Class: Hearing Difficulty
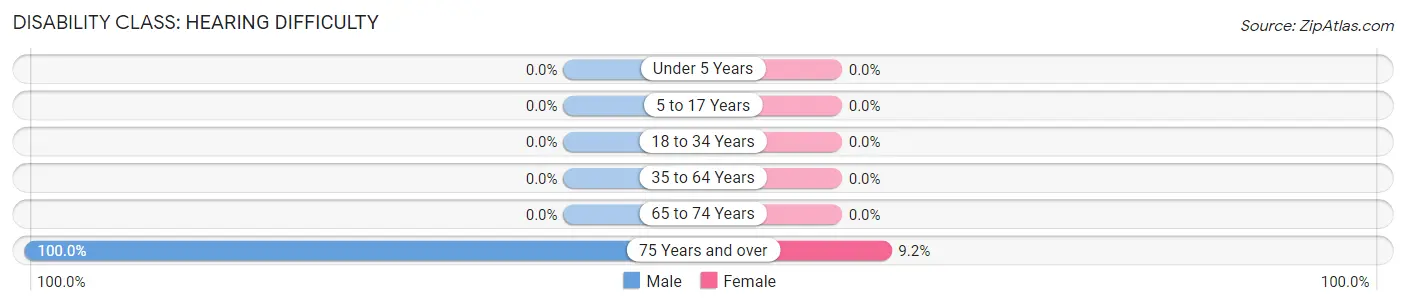
| Age Bracket | Male | Female |
| Under 5 Years | 0 (0.0%) | 0 (0.0%) |
| 5 to 17 Years | 0 (0.0%) | 0 (0.0%) |
| 18 to 34 Years | 0 (0.0%) | 0 (0.0%) |
| 35 to 64 Years | 0 (0.0%) | 0 (0.0%) |
| 65 to 74 Years | 0 (0.0%) | 0 (0.0%) |
| 75 Years and over | 10 (100.0%) | 7 (9.2%) |
Disability Class: Vision Difficulty
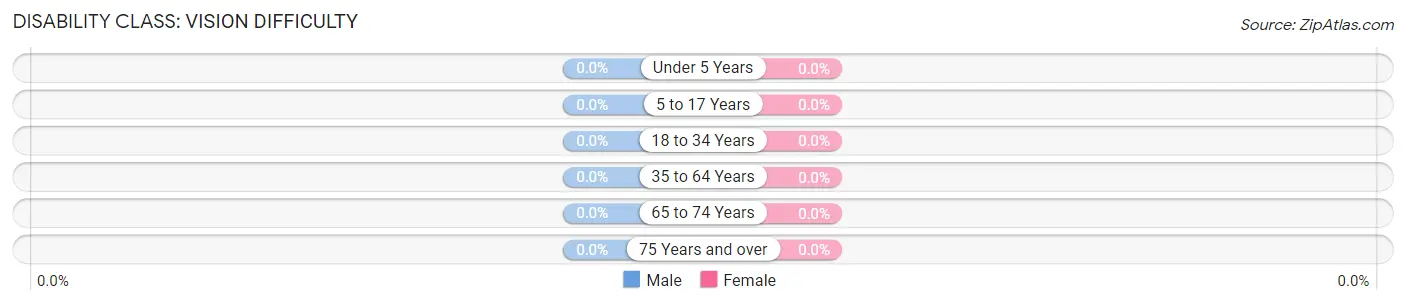
| Age Bracket | Male | Female |
| Under 5 Years | 0 (0.0%) | 0 (0.0%) |
| 5 to 17 Years | 0 (0.0%) | 0 (0.0%) |
| 18 to 34 Years | 0 (0.0%) | 0 (0.0%) |
| 35 to 64 Years | 0 (0.0%) | 0 (0.0%) |
| 65 to 74 Years | 0 (0.0%) | 0 (0.0%) |
| 75 Years and over | 0 (0.0%) | 0 (0.0%) |
Disability Class: Cognitive Difficulty
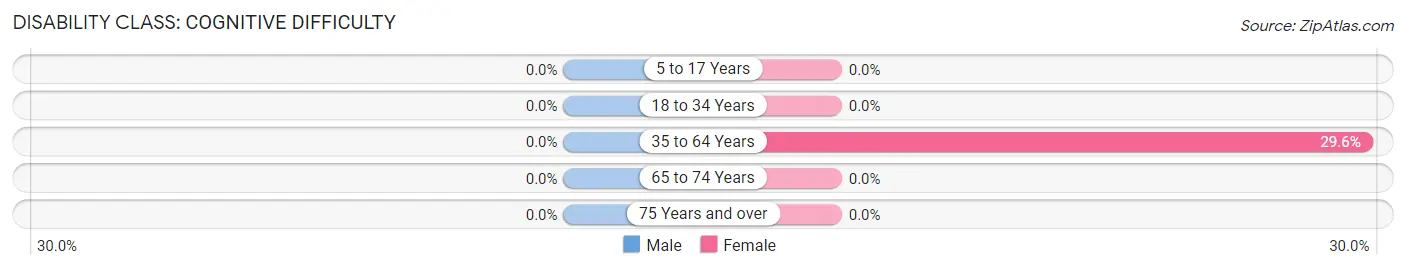
| Age Bracket | Male | Female |
| 5 to 17 Years | 0 (0.0%) | 0 (0.0%) |
| 18 to 34 Years | 0 (0.0%) | 0 (0.0%) |
| 35 to 64 Years | 0 (0.0%) | 39 (29.5%) |
| 65 to 74 Years | 0 (0.0%) | 0 (0.0%) |
| 75 Years and over | 0 (0.0%) | 0 (0.0%) |
Disability Class: Ambulatory Difficulty
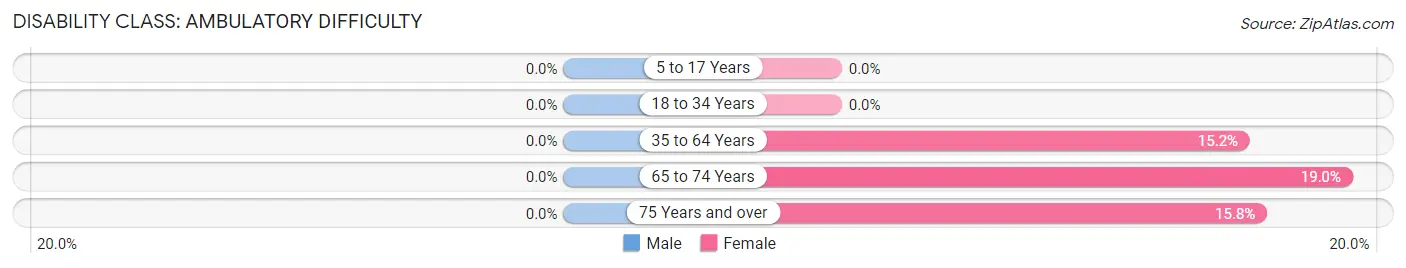
| Age Bracket | Male | Female |
| 5 to 17 Years | 0 (0.0%) | 0 (0.0%) |
| 18 to 34 Years | 0 (0.0%) | 0 (0.0%) |
| 35 to 64 Years | 0 (0.0%) | 20 (15.1%) |
| 65 to 74 Years | 0 (0.0%) | 11 (19.0%) |
| 75 Years and over | 0 (0.0%) | 12 (15.8%) |
Disability Class: Self-Care Difficulty

| Age Bracket | Male | Female |
| 5 to 17 Years | 0 (0.0%) | 0 (0.0%) |
| 18 to 34 Years | 0 (0.0%) | 0 (0.0%) |
| 35 to 64 Years | 0 (0.0%) | 0 (0.0%) |
| 65 to 74 Years | 0 (0.0%) | 0 (0.0%) |
| 75 Years and over | 0 (0.0%) | 7 (9.2%) |
Technology Access in Titusville
Computing Device Access in Titusville
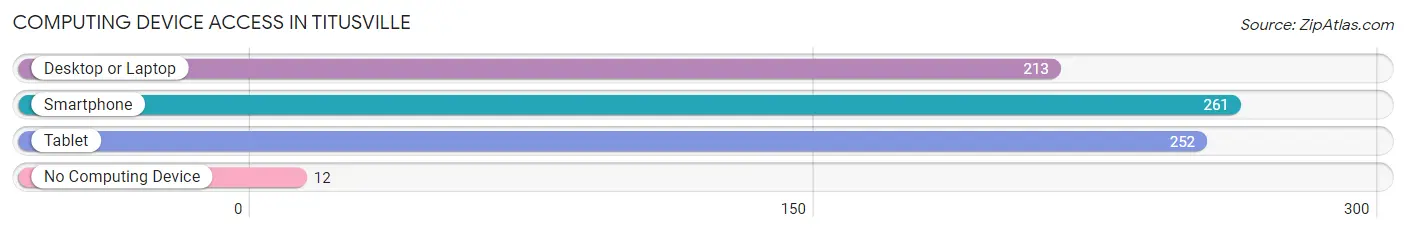
| Device Type | # Households | % Households |
| Desktop or Laptop | 213 | 68.5% |
| Smartphone | 261 | 83.9% |
| Tablet | 252 | 81.0% |
| No Computing Device | 12 | 3.9% |
| Total | 311 | 100.0% |
Internet Access in Titusville
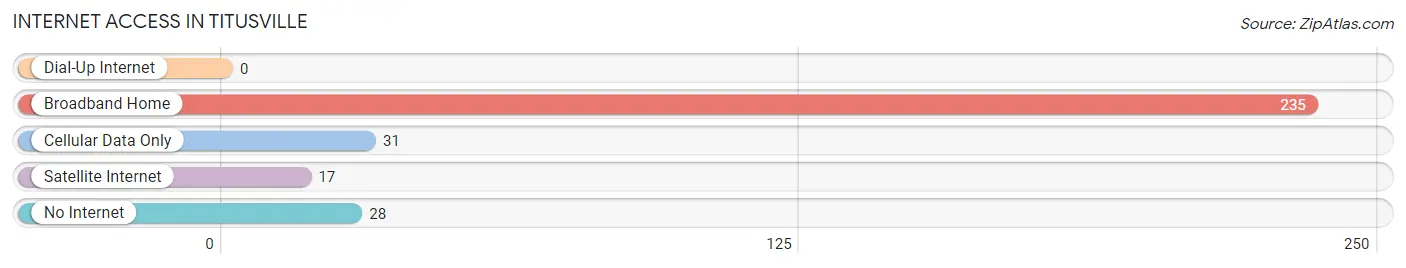
| Internet Type | # Households | % Households |
| Dial-Up Internet | 0 | 0.0% |
| Broadband Home | 235 | 75.6% |
| Cellular Data Only | 31 | 10.0% |
| Satellite Internet | 17 | 5.5% |
| No Internet | 28 | 9.0% |
| Total | 311 | 100.0% |
Titusville Summary
Titusville is a small town located in the Finger Lakes region of New York State. It is situated in the northwest corner of the county of Seneca, and is bordered by the towns of Ovid, Romulus, and Varick. The town was named after Titus Finch, an early settler who arrived in the area in 1802.
History
The area that is now Titusville was originally inhabited by the Seneca Nation of the Iroquois Confederacy. The first European settlers arrived in the area in the late 1700s, and the town was officially established in 1802. The town was named after Titus Finch, an early settler who arrived in the area in 1802.
In the early 19th century, Titusville was a thriving agricultural community. The town was home to several gristmills, sawmills, and a tannery. The town also had a thriving lumber industry, and the local economy was bolstered by the construction of the Seneca-Cayuga Canal in 1825.
The town continued to grow throughout the 19th century, and by the early 20th century, Titusville had become a popular tourist destination. The town was home to several resorts, and the local economy was bolstered by the construction of the Seneca-Cayuga Canal in 1825.
Geography
Titusville is located in the Finger Lakes region of New York State. It is situated in the northwest corner of the county of Seneca, and is bordered by the towns of Ovid, Romulus, and Varick. The town is located on the western shore of Seneca Lake, and is home to several small lakes, including Lake Seneca, Lake Ovid, and Lake Varick.
The town has a total area of 24.2 square miles, of which 22.7 square miles is land and 1.5 square miles is water. The terrain is mostly flat, with some rolling hills in the northern part of the town. The highest point in the town is 890 feet above sea level.
Economy
The economy of Titusville is largely based on agriculture and tourism. The town is home to several wineries, and the local economy is bolstered by the production of wine and other agricultural products. The town is also home to several resorts, and tourism is an important part of the local economy.
Demographics
As of the 2010 census, the town of Titusville had a population of 1,845. The racial makeup of the town was 97.2% White, 0.7% African American, 0.3% Native American, 0.2% Asian, 0.1% Pacific Islander, 0.3% from other races, and 1.2% from two or more races. Hispanic or Latino of any race were 1.2% of the population.
The median household income in Titusville was $45,938, and the median family income was $51,250. The per capita income for the town was $20,945. About 8.3% of families and 10.2% of the population were below the poverty line, including 14.2% of those under age 18 and 5.2% of those age 65 or over.
Common Questions
What is Per Capita Income in Titusville?
Per Capita income in Titusville is $61,641.
What is the Median Family Income in Titusville?
Median Family Income in Titusville is $136,964.
What is the Median Household income in Titusville?
Median Household Income in Titusville is $108,472.
What is Inequality or Gini Index in Titusville?
Inequality or Gini Index in Titusville is 0.38.
What is the Total Population of Titusville?
Total Population of Titusville is 613.
What is the Total Male Population of Titusville?
Total Male Population of Titusville is 276.
What is the Total Female Population of Titusville?
Total Female Population of Titusville is 337.
What is the Ratio of Males per 100 Females in Titusville?
There are 81.90 Males per 100 Females in Titusville.
What is the Ratio of Females per 100 Males in Titusville?
There are 122.10 Females per 100 Males in Titusville.
What is the Median Population Age in Titusville?
Median Population Age in Titusville is 58.6 Years.
What is the Average Family Size in Titusville
Average Family Size in Titusville is 2.5 People.
What is the Average Household Size in Titusville
Average Household Size in Titusville is 2.0 People.
How Large is the Labor Force in Titusville?
There are 289 People in the Labor Forcein in Titusville.
What is the Percentage of People in the Labor Force in Titusville?
54.5% of People are in the Labor Force in Titusville.