Olcott, NY Map & Demographics
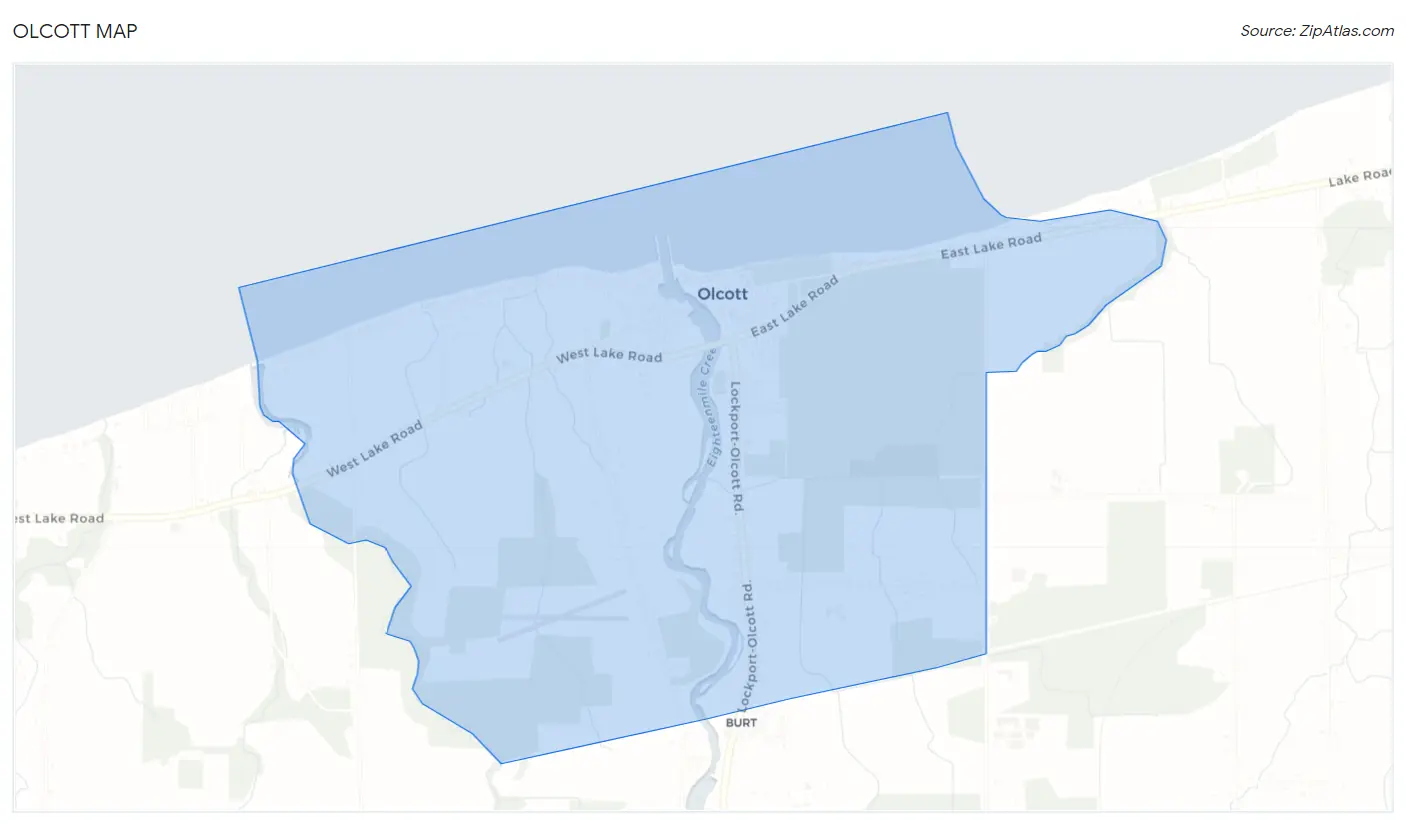
Olcott Map
Olcott Overview
$37,525
PER CAPITA INCOME
$84,688
AVG FAMILY INCOME
$70,606
AVG HOUSEHOLD INCOME
1.9%
WAGE / INCOME GAP [ % ]
98.1¢/ $1
WAGE / INCOME GAP [ $ ]
0.36
INEQUALITY / GINI INDEX
1,041
TOTAL POPULATION
511
MALE POPULATION
530
FEMALE POPULATION
96.42
MALES / 100 FEMALES
103.72
FEMALES / 100 MALES
47.1
MEDIAN AGE
3.0
AVG FAMILY SIZE
2.2
AVG HOUSEHOLD SIZE
635
LABOR FORCE [ PEOPLE ]
71.5%
PERCENT IN LABOR FORCE
8.8%
UNEMPLOYMENT RATE
Olcott Zip Codes
Olcott Area Codes
Income in Olcott
Income Overview in Olcott
Per Capita Income in Olcott is $37,525, while median incomes of families and households are $84,688 and $70,606 respectively.
| Characteristic | Number | Measure |
| Per Capita Income | 1,041 | $37,525 |
| Median Family Income | 242 | $84,688 |
| Mean Family Income | 242 | $86,496 |
| Median Household Income | 480 | $70,606 |
| Mean Household Income | 480 | $80,840 |
| Income Deficit | 242 | $0 |
| Wage / Income Gap (%) | 1,041 | 1.90% |
| Wage / Income Gap ($) | 1,041 | 98.10¢ per $1 |
| Gini / Inequality Index | 1,041 | 0.36 |
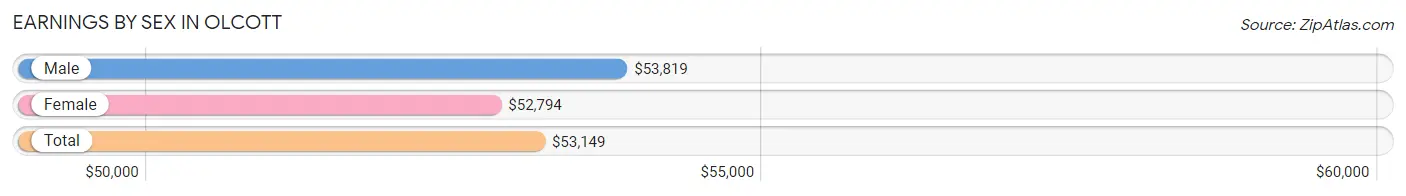
Earnings by Sex in Olcott
Average Earnings in Olcott are $53,149, $53,819 for men and $52,794 for women, a difference of 1.9%.
| Sex | Number | Average Earnings |
| Male | 245 (41.9%) | $53,819 |
| Female | 340 (58.1%) | $52,794 |
| Total | 585 (100.0%) | $53,149 |
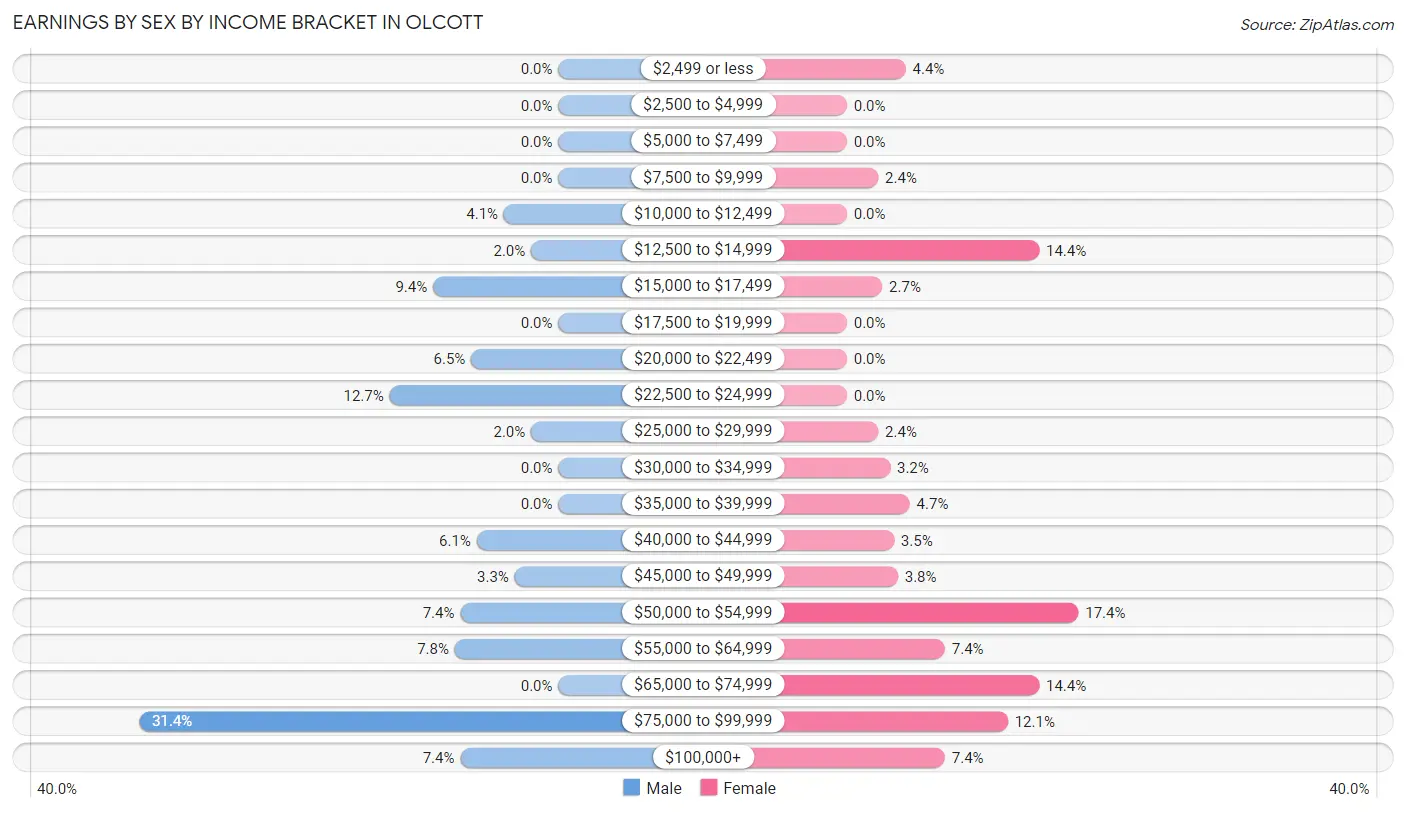
Earnings by Sex by Income Bracket in Olcott
The most common earnings brackets in Olcott are $75,000 to $99,999 for men (77 | 31.4%) and $50,000 to $54,999 for women (59 | 17.3%).
| Income | Male | Female |
| $2,499 or less | 0 (0.0%) | 15 (4.4%) |
| $2,500 to $4,999 | 0 (0.0%) | 0 (0.0%) |
| $5,000 to $7,499 | 0 (0.0%) | 0 (0.0%) |
| $7,500 to $9,999 | 0 (0.0%) | 8 (2.4%) |
| $10,000 to $12,499 | 10 (4.1%) | 0 (0.0%) |
| $12,500 to $14,999 | 5 (2.0%) | 49 (14.4%) |
| $15,000 to $17,499 | 23 (9.4%) | 9 (2.6%) |
| $17,500 to $19,999 | 0 (0.0%) | 0 (0.0%) |
| $20,000 to $22,499 | 16 (6.5%) | 0 (0.0%) |
| $22,500 to $24,999 | 31 (12.7%) | 0 (0.0%) |
| $25,000 to $29,999 | 5 (2.0%) | 8 (2.4%) |
| $30,000 to $34,999 | 0 (0.0%) | 11 (3.2%) |
| $35,000 to $39,999 | 0 (0.0%) | 16 (4.7%) |
| $40,000 to $44,999 | 15 (6.1%) | 12 (3.5%) |
| $45,000 to $49,999 | 8 (3.3%) | 13 (3.8%) |
| $50,000 to $54,999 | 18 (7.3%) | 59 (17.3%) |
| $55,000 to $64,999 | 19 (7.8%) | 25 (7.3%) |
| $65,000 to $74,999 | 0 (0.0%) | 49 (14.4%) |
| $75,000 to $99,999 | 77 (31.4%) | 41 (12.1%) |
| $100,000+ | 18 (7.3%) | 25 (7.3%) |
| Total | 245 (100.0%) | 340 (100.0%) |
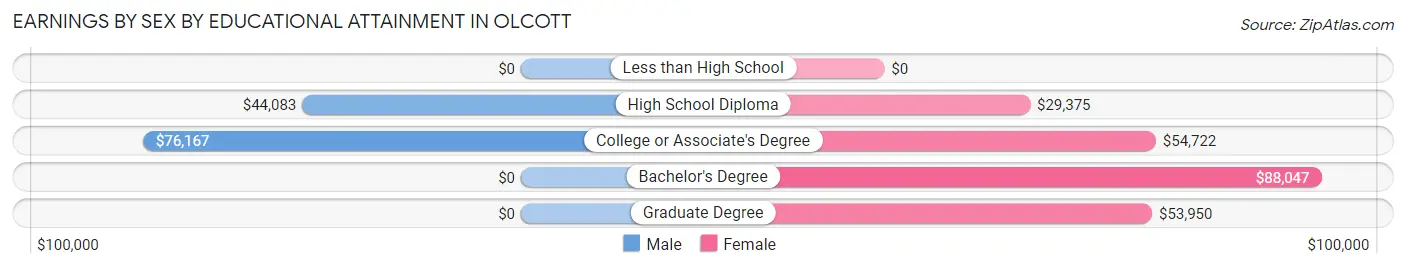
Earnings by Sex by Educational Attainment in Olcott
Average earnings in Olcott are $58,421 for men and $53,346 for women, a difference of 8.7%. Men with an educational attainment of college or associate's degree enjoy the highest average annual earnings of $76,167, while those with high school diploma education earn the least with $44,083. Women with an educational attainment of bachelor's degree earn the most with the average annual earnings of $88,047, while those with high school diploma education have the smallest earnings of $29,375.
| Educational Attainment | Male Income | Female Income |
| Less than High School | - | - |
| High School Diploma | $44,083 | $29,375 |
| College or Associate's Degree | $76,167 | $54,722 |
| Bachelor's Degree | - | - |
| Graduate Degree | - | - |
| Total | $58,421 | $53,346 |
Family Income in Olcott
Family Income Brackets in Olcott
According to the Olcott family income data, there are 95 families falling into the $75,000 to $99,999 income range, which is the most common income bracket and makes up 39.3% of all families.
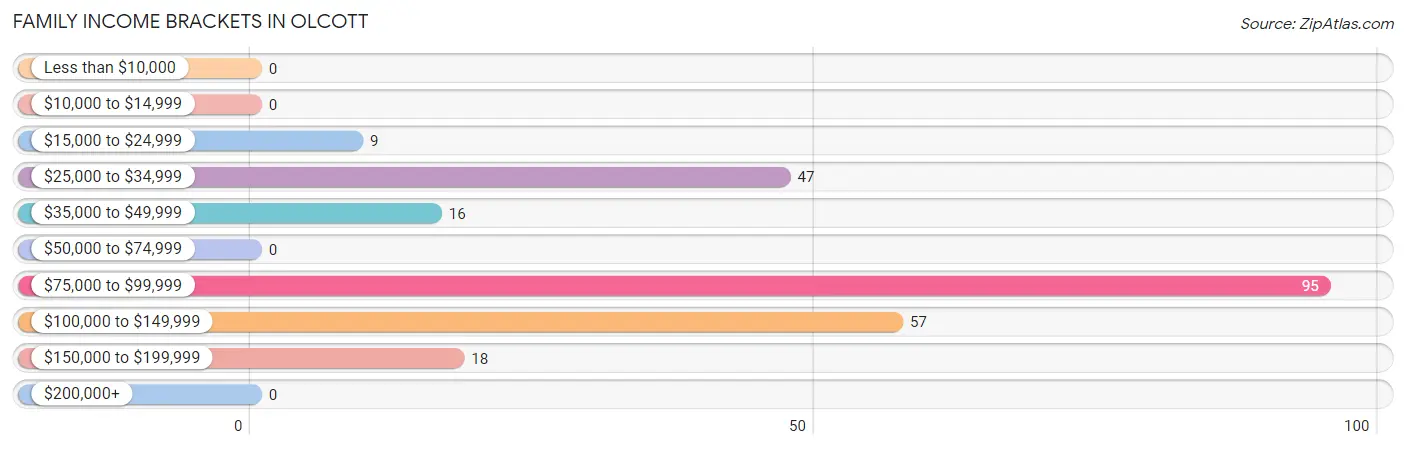
| Income Bracket | # Families | % Families |
| Less than $10,000 | 0 | 0.0% |
| $10,000 to $14,999 | 0 | 0.0% |
| $15,000 to $24,999 | 9 | 3.7% |
| $25,000 to $34,999 | 47 | 19.4% |
| $35,000 to $49,999 | 16 | 6.6% |
| $50,000 to $74,999 | 0 | 0.0% |
| $75,000 to $99,999 | 95 | 39.3% |
| $100,000 to $149,999 | 57 | 23.6% |
| $150,000 to $199,999 | 18 | 7.4% |
| $200,000+ | 0 | 0.0% |
Family Income by Famaliy Size in Olcott
3-person families (38 | 15.7%) account for the highest median family income in Olcott with $89,615 per family, while 2-person families (140 | 57.9%) have the highest median income of $38,421 per family member.
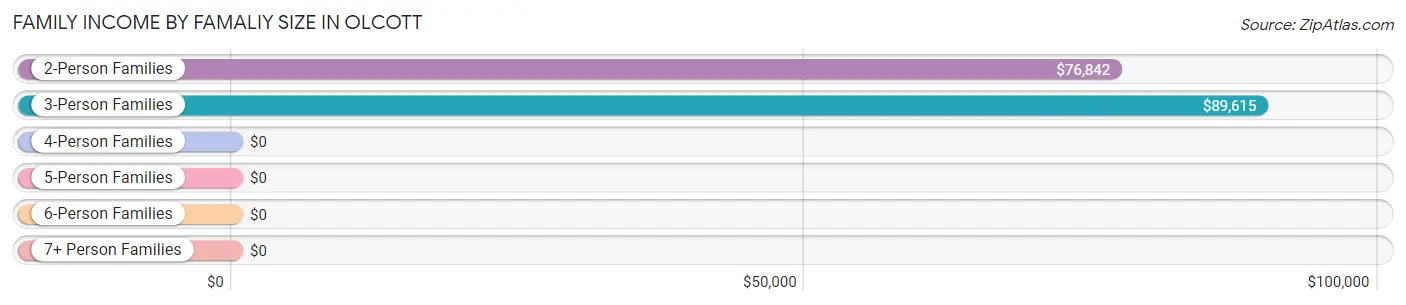
| Income Bracket | # Families | Median Income |
| 2-Person Families | 140 (57.9%) | $76,842 |
| 3-Person Families | 38 (15.7%) | $89,615 |
| 4-Person Families | 33 (13.6%) | $0 |
| 5-Person Families | 8 (3.3%) | $0 |
| 6-Person Families | 0 (0.0%) | $0 |
| 7+ Person Families | 23 (9.5%) | $0 |
| Total | 242 (100.0%) | $84,688 |
Family Income by Number of Earners in Olcott
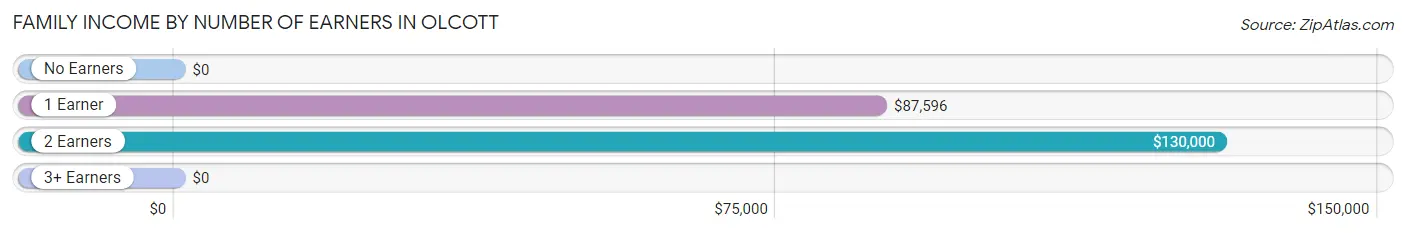
| Number of Earners | # Families | Median Income |
| No Earners | 36 (14.9%) | $0 |
| 1 Earner | 73 (30.2%) | $87,596 |
| 2 Earners | 98 (40.5%) | $130,000 |
| 3+ Earners | 35 (14.5%) | $0 |
| Total | 242 (100.0%) | $84,688 |
Household Income in Olcott
Household Income Brackets in Olcott
With 92 households falling in the category, the $50,000 to $74,999 income range is the most frequent in Olcott, accounting for 19.2% of all households.
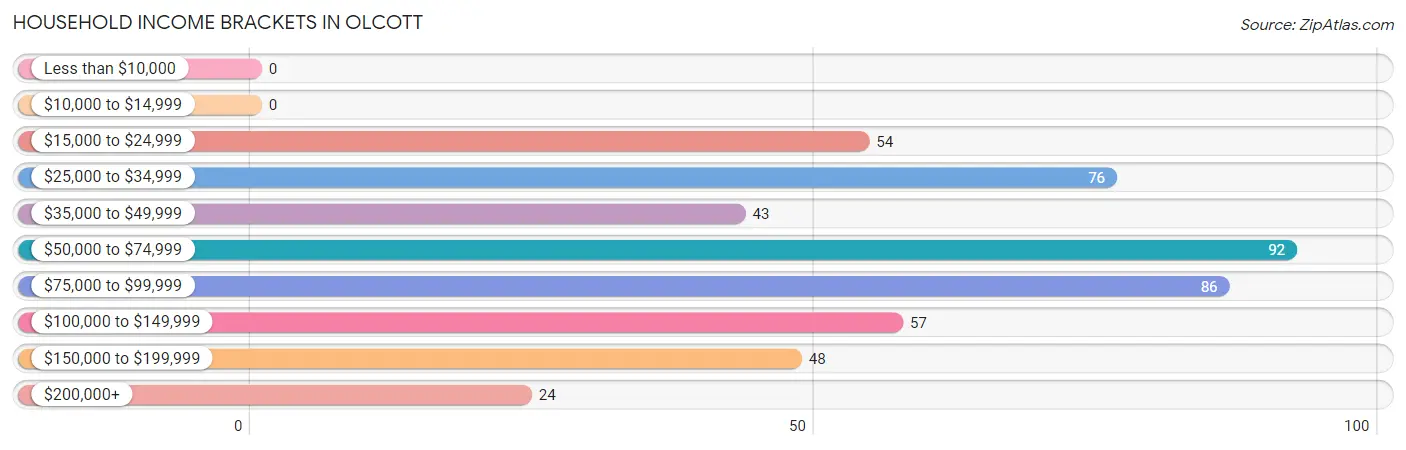
| Income Bracket | # Households | % Households |
| Less than $10,000 | 0 | 0.0% |
| $10,000 to $14,999 | 0 | 0.0% |
| $15,000 to $24,999 | 54 | 11.3% |
| $25,000 to $34,999 | 76 | 15.8% |
| $35,000 to $49,999 | 43 | 9.0% |
| $50,000 to $74,999 | 92 | 19.2% |
| $75,000 to $99,999 | 86 | 17.9% |
| $100,000 to $149,999 | 57 | 11.9% |
| $150,000 to $199,999 | 48 | 10.0% |
| $200,000+ | 24 | 5.0% |
Household Income by Householder Age in Olcott
The median household income in Olcott is $70,606, with the highest median household income of $105,417 found in the 25 to 44 years age bracket for the primary householder. A total of 115 households (24.0%) fall into this category.
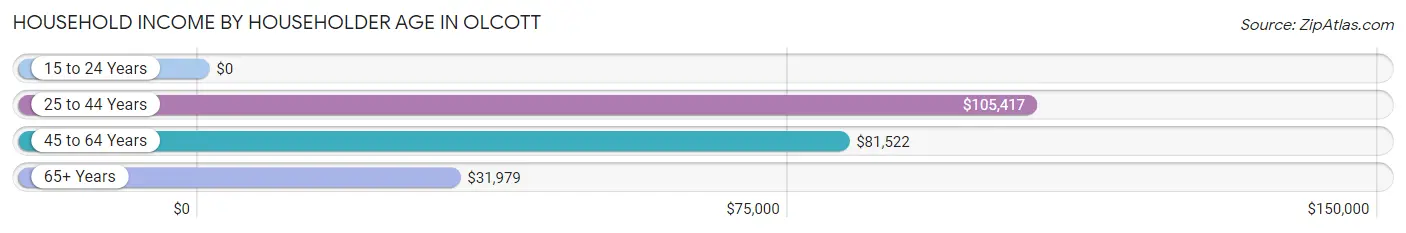
| Income Bracket | # Households | Median Income |
| 15 to 24 Years | 0 (0.0%) | $0 |
| 25 to 44 Years | 115 (24.0%) | $105,417 |
| 45 to 64 Years | 218 (45.4%) | $81,522 |
| 65+ Years | 147 (30.6%) | $31,979 |
| Total | 480 (100.0%) | $70,606 |
Poverty in Olcott
Income Below Poverty by Sex and Age in Olcott
With 1.6% poverty level for males and 1.7% for females among the residents of Olcott, under 5 year old males and 25 to 34 year old females are the most vulnerable to poverty, with 8 males (27.6%) and 9 females (15.5%) in their respective age groups living below the poverty level.
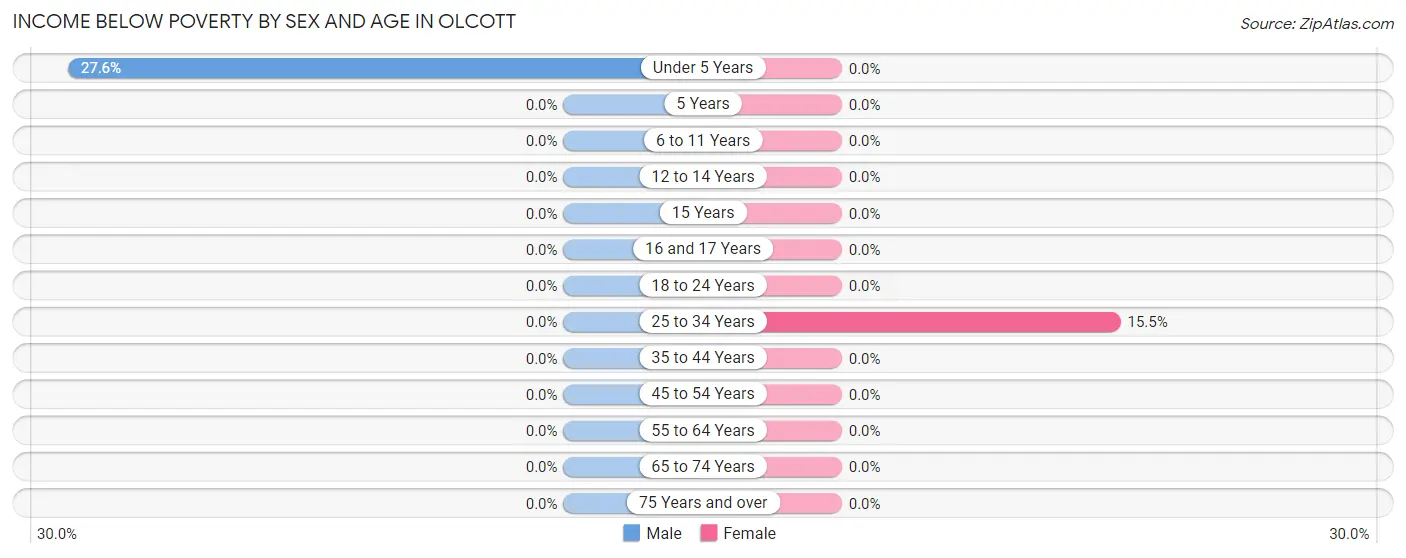
| Age Bracket | Male | Female |
| Under 5 Years | 8 (27.6%) | 0 (0.0%) |
| 5 Years | 0 (0.0%) | 0 (0.0%) |
| 6 to 11 Years | 0 (0.0%) | 0 (0.0%) |
| 12 to 14 Years | 0 (0.0%) | 0 (0.0%) |
| 15 Years | 0 (0.0%) | 0 (0.0%) |
| 16 and 17 Years | 0 (0.0%) | 0 (0.0%) |
| 18 to 24 Years | 0 (0.0%) | 0 (0.0%) |
| 25 to 34 Years | 0 (0.0%) | 9 (15.5%) |
| 35 to 44 Years | 0 (0.0%) | 0 (0.0%) |
| 45 to 54 Years | 0 (0.0%) | 0 (0.0%) |
| 55 to 64 Years | 0 (0.0%) | 0 (0.0%) |
| 65 to 74 Years | 0 (0.0%) | 0 (0.0%) |
| 75 Years and over | 0 (0.0%) | 0 (0.0%) |
| Total | 8 (1.6%) | 9 (1.7%) |
Income Above Poverty by Sex and Age in Olcott
According to the poverty statistics in Olcott, males aged 5 years and females aged 6 to 11 years are the age groups that are most secure financially, with 100.0% of males and 100.0% of females in these age groups living above the poverty line.
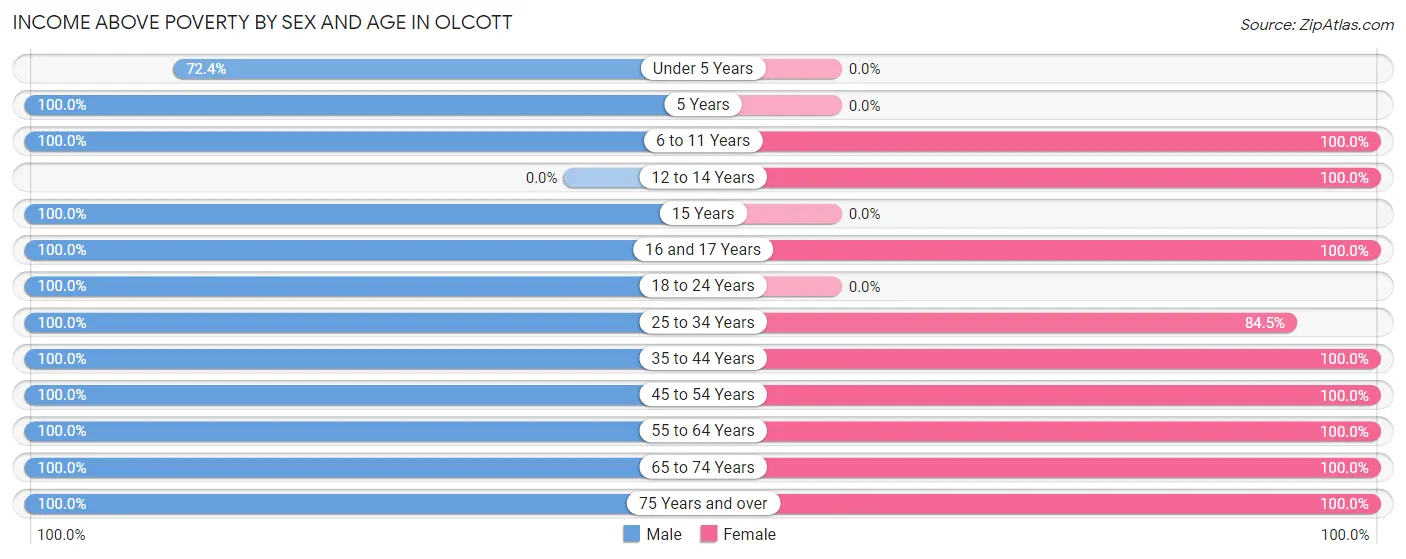
| Age Bracket | Male | Female |
| Under 5 Years | 21 (72.4%) | 0 (0.0%) |
| 5 Years | 8 (100.0%) | 0 (0.0%) |
| 6 to 11 Years | 55 (100.0%) | 14 (100.0%) |
| 12 to 14 Years | 0 (0.0%) | 22 (100.0%) |
| 15 Years | 25 (100.0%) | 0 (0.0%) |
| 16 and 17 Years | 9 (100.0%) | 39 (100.0%) |
| 18 to 24 Years | 57 (100.0%) | 0 (0.0%) |
| 25 to 34 Years | 46 (100.0%) | 49 (84.5%) |
| 35 to 44 Years | 69 (100.0%) | 85 (100.0%) |
| 45 to 54 Years | 73 (100.0%) | 129 (100.0%) |
| 55 to 64 Years | 74 (100.0%) | 87 (100.0%) |
| 65 to 74 Years | 29 (100.0%) | 64 (100.0%) |
| 75 Years and over | 37 (100.0%) | 32 (100.0%) |
| Total | 503 (98.4%) | 521 (98.3%) |
Income Below Poverty Among Married-Couple Families in Olcott
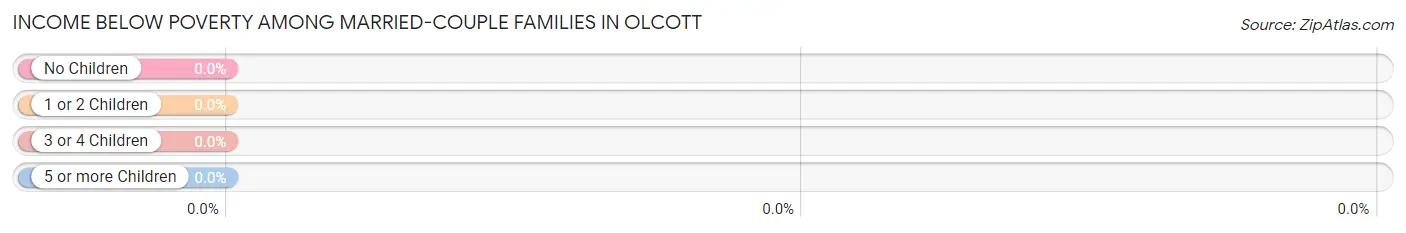
| Children | Above Poverty | Below Poverty |
| No Children | 83 (100.0%) | 0 (0.0%) |
| 1 or 2 Children | 47 (100.0%) | 0 (0.0%) |
| 3 or 4 Children | 23 (100.0%) | 0 (0.0%) |
| 5 or more Children | 0 (0.0%) | 0 (0.0%) |
| Total | 153 (100.0%) | 0 (0.0%) |
Income Below Poverty Among Single-Parent Households in Olcott
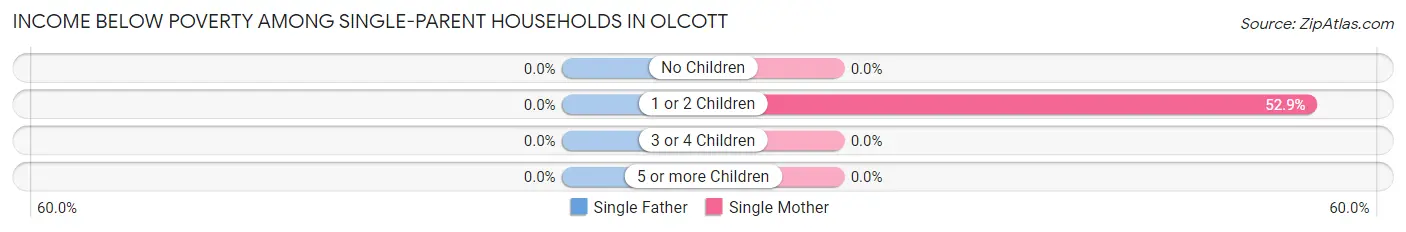
| Children | Single Father | Single Mother |
| No Children | 0 (0.0%) | 0 (0.0%) |
| 1 or 2 Children | 0 (0.0%) | 9 (52.9%) |
| 3 or 4 Children | 0 (0.0%) | 0 (0.0%) |
| 5 or more Children | 0 (0.0%) | 0 (0.0%) |
| Total | 0 (0.0%) | 9 (13.9%) |
Income Below Poverty Among Married-Couple vs Single-Parent Households in Olcott
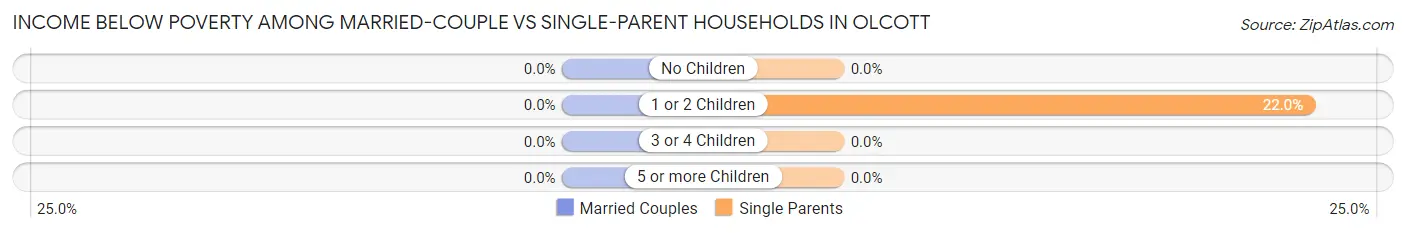
| Children | Married-Couple Families | Single-Parent Households |
| No Children | 0 (0.0%) | 0 (0.0%) |
| 1 or 2 Children | 0 (0.0%) | 9 (22.0%) |
| 3 or 4 Children | 0 (0.0%) | 0 (0.0%) |
| 5 or more Children | 0 (0.0%) | 0 (0.0%) |
| Total | 0 (0.0%) | 9 (10.1%) |
Race in Olcott
The most populous races in Olcott are White / Caucasian (1,041 | 100.0%), and Hispanic or Latino (9 | 0.9%).
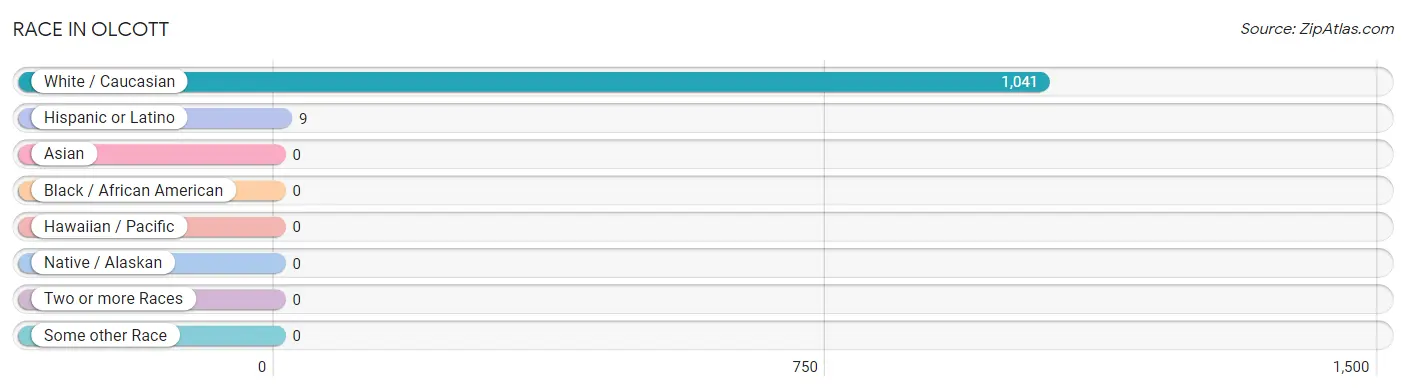
| Race | # Population | % Population |
| Asian | 0 | 0.0% |
| Black / African American | 0 | 0.0% |
| Hawaiian / Pacific | 0 | 0.0% |
| Hispanic or Latino | 9 | 0.9% |
| Native / Alaskan | 0 | 0.0% |
| White / Caucasian | 1,041 | 100.0% |
| Two or more Races | 0 | 0.0% |
| Some other Race | 0 | 0.0% |
| Total | 1,041 | 100.0% |
Ancestry in Olcott
The most populous ancestries reported in Olcott are German (367 | 35.2%), Irish (231 | 22.2%), Polish (138 | 13.3%), English (70 | 6.7%), and European (61 | 5.9%), together accounting for 83.3% of all Olcott residents.
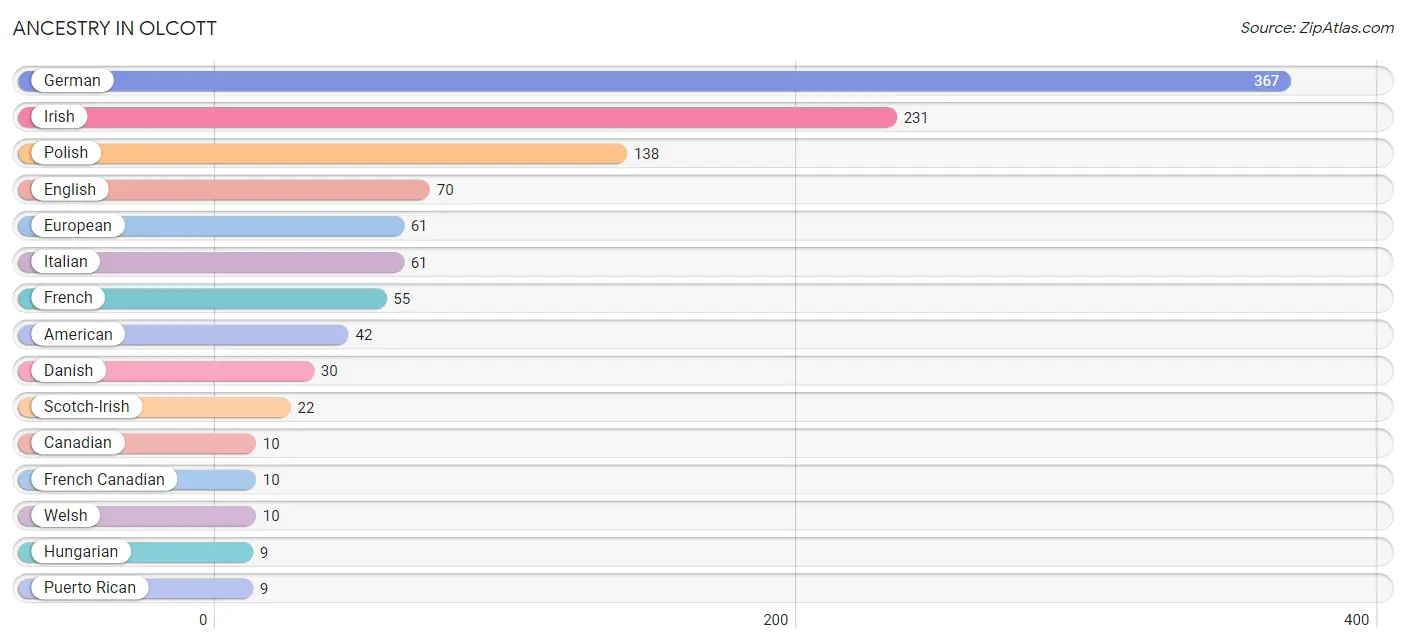
| Ancestry | # Population | % Population |
| American | 42 | 4.0% |
| Canadian | 10 | 1.0% |
| Danish | 30 | 2.9% |
| English | 70 | 6.7% |
| European | 61 | 5.9% |
| French | 55 | 5.3% |
| French Canadian | 10 | 1.0% |
| German | 367 | 35.2% |
| Hungarian | 9 | 0.9% |
| Irish | 231 | 22.2% |
| Italian | 61 | 5.9% |
| Polish | 138 | 13.3% |
| Puerto Rican | 9 | 0.9% |
| Scotch-Irish | 22 | 2.1% |
| Scottish | 6 | 0.6% |
| Welsh | 10 | 1.0% | View All 16 Rows |
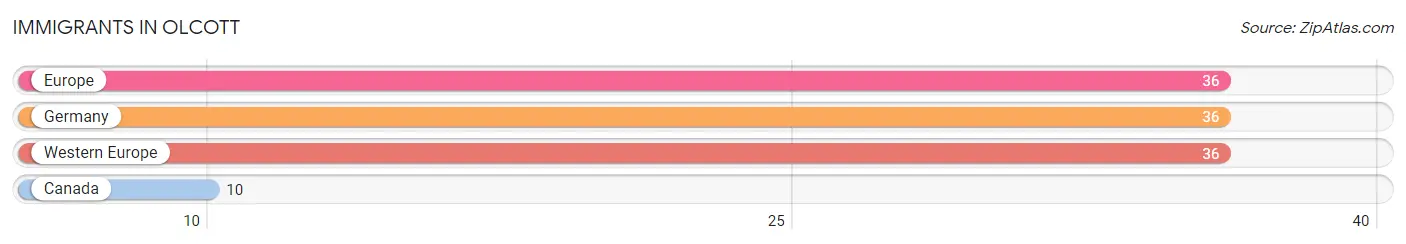
Immigrants in Olcott
The most numerous immigrant groups reported in Olcott came from Europe (36 | 3.5%), Germany (36 | 3.5%), Western Europe (36 | 3.5%), and Canada (10 | 1.0%), together accounting for 11.3% of all Olcott residents.
| Immigration Origin | # Population | % Population |
| Canada | 10 | 1.0% |
| Europe | 36 | 3.5% |
| Germany | 36 | 3.5% |
| Western Europe | 36 | 3.5% | View All 4 Rows |
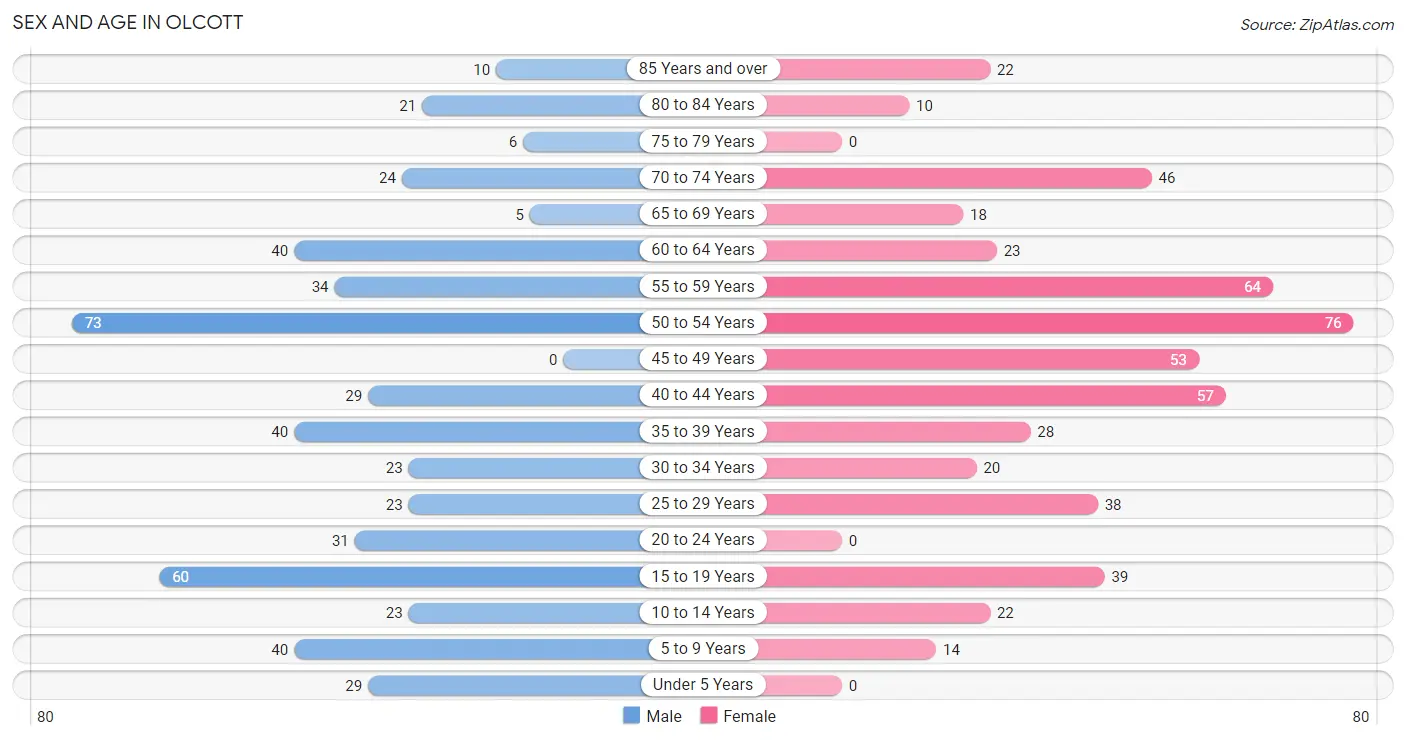
Sex and Age in Olcott
Sex and Age in Olcott
The most populous age groups in Olcott are 50 to 54 Years (73 | 14.3%) for men and 50 to 54 Years (76 | 14.3%) for women.
| Age Bracket | Male | Female |
| Under 5 Years | 29 (5.7%) | 0 (0.0%) |
| 5 to 9 Years | 40 (7.8%) | 14 (2.6%) |
| 10 to 14 Years | 23 (4.5%) | 22 (4.2%) |
| 15 to 19 Years | 60 (11.7%) | 39 (7.4%) |
| 20 to 24 Years | 31 (6.1%) | 0 (0.0%) |
| 25 to 29 Years | 23 (4.5%) | 38 (7.2%) |
| 30 to 34 Years | 23 (4.5%) | 20 (3.8%) |
| 35 to 39 Years | 40 (7.8%) | 28 (5.3%) |
| 40 to 44 Years | 29 (5.7%) | 57 (10.7%) |
| 45 to 49 Years | 0 (0.0%) | 53 (10.0%) |
| 50 to 54 Years | 73 (14.3%) | 76 (14.3%) |
| 55 to 59 Years | 34 (6.7%) | 64 (12.1%) |
| 60 to 64 Years | 40 (7.8%) | 23 (4.3%) |
| 65 to 69 Years | 5 (1.0%) | 18 (3.4%) |
| 70 to 74 Years | 24 (4.7%) | 46 (8.7%) |
| 75 to 79 Years | 6 (1.2%) | 0 (0.0%) |
| 80 to 84 Years | 21 (4.1%) | 10 (1.9%) |
| 85 Years and over | 10 (2.0%) | 22 (4.2%) |
| Total | 511 (100.0%) | 530 (100.0%) |
Families and Households in Olcott
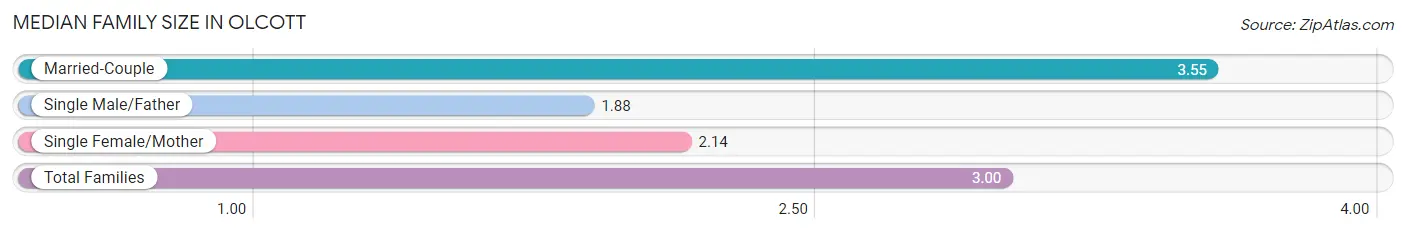
Median Family Size in Olcott
The median family size in Olcott is 3.00 persons per family, with married-couple families (153 | 63.2%) accounting for the largest median family size of 3.55 persons per family. On the other hand, single male/father families (24 | 9.9%) represent the smallest median family size with 1.88 persons per family.
| Family Type | # Families | Family Size |
| Married-Couple | 153 (63.2%) | 3.55 |
| Single Male/Father | 24 (9.9%) | 1.88 |
| Single Female/Mother | 65 (26.9%) | 2.14 |
| Total Families | 242 (100.0%) | 3.00 |
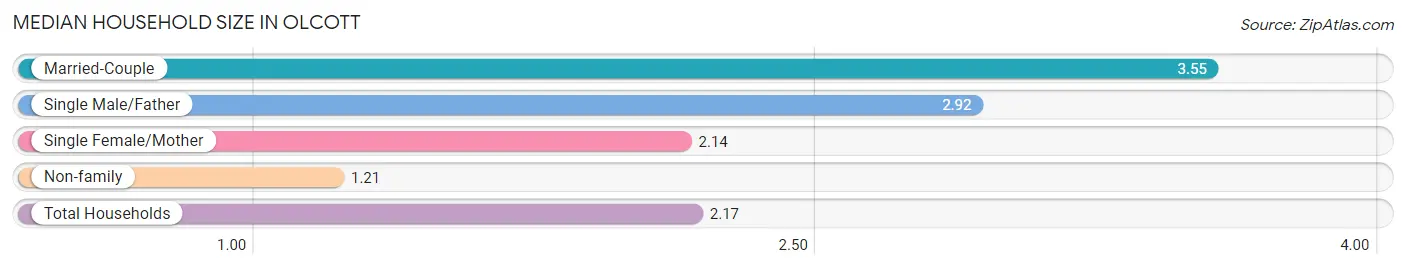
Median Household Size in Olcott
The median household size in Olcott is 2.17 persons per household, with married-couple households (153 | 31.9%) accounting for the largest median household size of 3.55 persons per household. non-family households (238 | 49.6%) represent the smallest median household size with 1.21 persons per household.
| Household Type | # Households | Household Size |
| Married-Couple | 153 (31.9%) | 3.55 |
| Single Male/Father | 24 (5.0%) | 2.92 |
| Single Female/Mother | 65 (13.5%) | 2.14 |
| Non-family | 238 (49.6%) | 1.21 |
| Total Households | 480 (100.0%) | 2.17 |
Household Size by Marriage Status in Olcott
Out of a total of 480 households in Olcott, 242 (50.4%) are family households, while 238 (49.6%) are nonfamily households. The most numerous type of family households are 2-person households, comprising 116, and the most common type of nonfamily households are 1-person households, comprising 185.
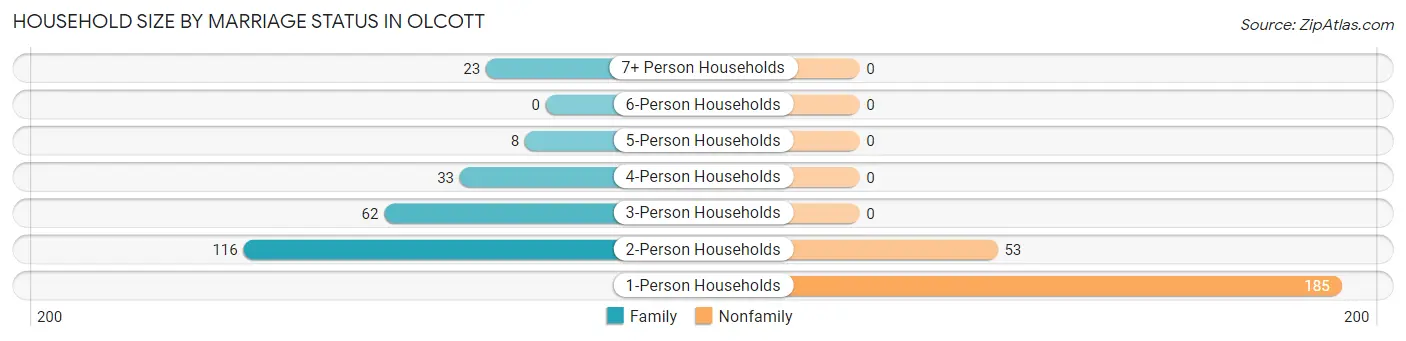
| Household Size | Family Households | Nonfamily Households |
| 1-Person Households | - | 185 (38.5%) |
| 2-Person Households | 116 (24.2%) | 53 (11.0%) |
| 3-Person Households | 62 (12.9%) | 0 (0.0%) |
| 4-Person Households | 33 (6.9%) | 0 (0.0%) |
| 5-Person Households | 8 (1.7%) | 0 (0.0%) |
| 6-Person Households | 0 (0.0%) | 0 (0.0%) |
| 7+ Person Households | 23 (4.8%) | 0 (0.0%) |
| Total | 242 (50.4%) | 238 (49.6%) |
Female Fertility in Olcott
Fertility by Age in Olcott
| Age Bracket | Women with Births | Births / 1,000 Women |
| 15 to 19 years | 0 (0.0%) | 0.0 |
| 20 to 34 years | 0 (0.0%) | 0.0 |
| 35 to 50 years | 0 (0.0%) | 0.0 |
| Total | 0 (0.0%) | 0.0 |
Fertility by Age by Marriage Status in Olcott
| Age Bracket | Married | Unmarried |
| 15 to 19 years | 0 (0.0%) | 0 (0.0%) |
| 20 to 34 years | 0 (0.0%) | 0 (0.0%) |
| 35 to 50 years | 0 (0.0%) | 0 (0.0%) |
| Total | 0 (0.0%) | 0 (0.0%) |
Fertility by Education in Olcott
| Educational Attainment | Women with Births | Births / 1,000 Women |
| Less than High School | 0 (0.0%) | 0.0 |
| High School Diploma | 0 (0.0%) | 0.0 |
| College or Associate's Degree | 0 (0.0%) | 0.0 |
| Bachelor's Degree | 0 (0.0%) | 0.0 |
| Graduate Degree | 0 (0.0%) | 0.0 |
| Total | 0 (0.0%) | 0.0 |
Fertility by Education by Marriage Status in Olcott
| Educational Attainment | Married | Unmarried |
| Less than High School | 0 (0.0%) | 0 (0.0%) |
| High School Diploma | 0 (0.0%) | 0 (0.0%) |
| College or Associate's Degree | 0 (0.0%) | 0 (0.0%) |
| Bachelor's Degree | 0 (0.0%) | 0 (0.0%) |
| Graduate Degree | 0 (0.0%) | 0 (0.0%) |
| Total | 0 (0.0%) | 0 (0.0%) |
Employment Characteristics in Olcott
Employment by Class of Employer in Olcott
Among the 580 employed individuals in Olcott, private company employees (421 | 72.6%), self-employed (not incorporated) (57 | 9.8%), and local government employees (50 | 8.6%) make up the most common classes of employment.
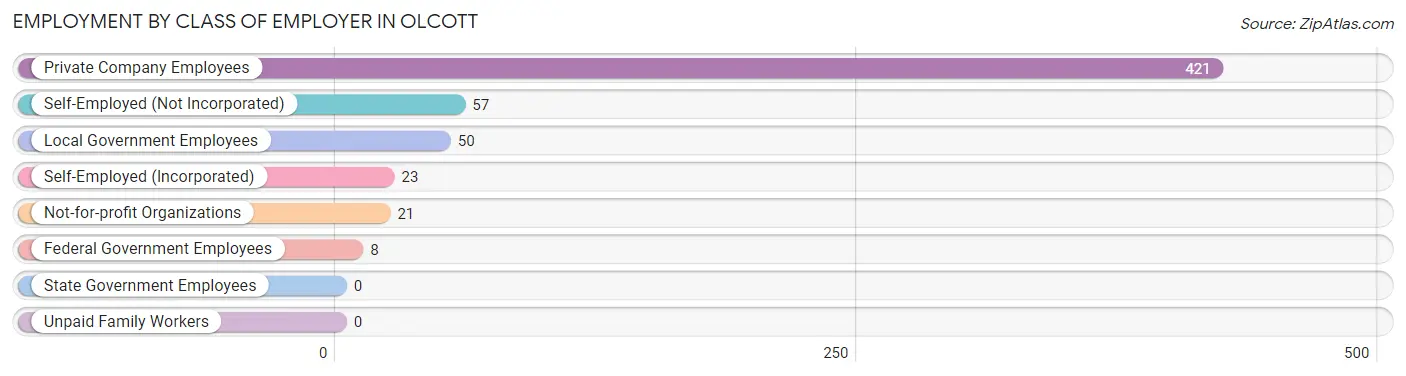
| Employer Class | # Employees | % Employees |
| Private Company Employees | 421 | 72.6% |
| Self-Employed (Incorporated) | 23 | 4.0% |
| Self-Employed (Not Incorporated) | 57 | 9.8% |
| Not-for-profit Organizations | 21 | 3.6% |
| Local Government Employees | 50 | 8.6% |
| State Government Employees | 0 | 0.0% |
| Federal Government Employees | 8 | 1.4% |
| Unpaid Family Workers | 0 | 0.0% |
| Total | 580 | 100.0% |
Employment Status by Age in Olcott
According to the labor force statistics for Olcott, out of the total population over 16 years of age (888), 71.5% or 635 individuals are in the labor force, with 8.8% or 56 of them unemployed. The age group with the highest labor force participation rate is 20 to 24 years, with 100.0% or 31 individuals in the labor force. Within the labor force, the 16 to 19 years age range has the highest percentage of unemployed individuals, with 76.9% or 50 of them being unemployed.
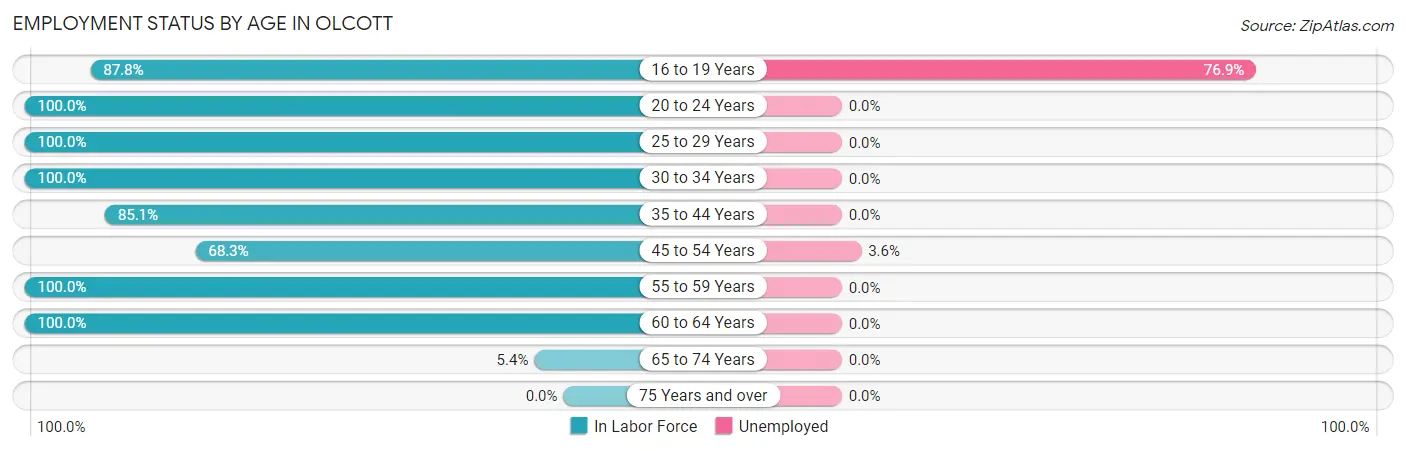
| Age Bracket | In Labor Force | Unemployed |
| 16 to 19 Years | 65 (87.8%) | 50 (76.9%) |
| 20 to 24 Years | 31 (100.0%) | 0 (0.0%) |
| 25 to 29 Years | 61 (100.0%) | 0 (0.0%) |
| 30 to 34 Years | 43 (100.0%) | 0 (0.0%) |
| 35 to 44 Years | 131 (85.1%) | 0 (0.0%) |
| 45 to 54 Years | 138 (68.3%) | 5 (3.6%) |
| 55 to 59 Years | 98 (100.0%) | 0 (0.0%) |
| 60 to 64 Years | 63 (100.0%) | 0 (0.0%) |
| 65 to 74 Years | 5 (5.4%) | 0 (0.0%) |
| 75 Years and over | 0 (0.0%) | 0 (0.0%) |
| Total | 635 (71.5%) | 56 (8.8%) |
Employment Status by Educational Attainment in Olcott
According to labor force statistics for Olcott, 86.0% of individuals (534) out of the total population between 25 and 64 years of age (621) are in the labor force, with 0.9% or 5 of them being unemployed. The group with the highest labor force participation rate are those with the educational attainment of college / associate degree, with 100.0% or 262 individuals in the labor force. Within the labor force, individuals with college / associate degree education have the highest percentage of unemployment, with 1.9% or 5 of them being unemployed.
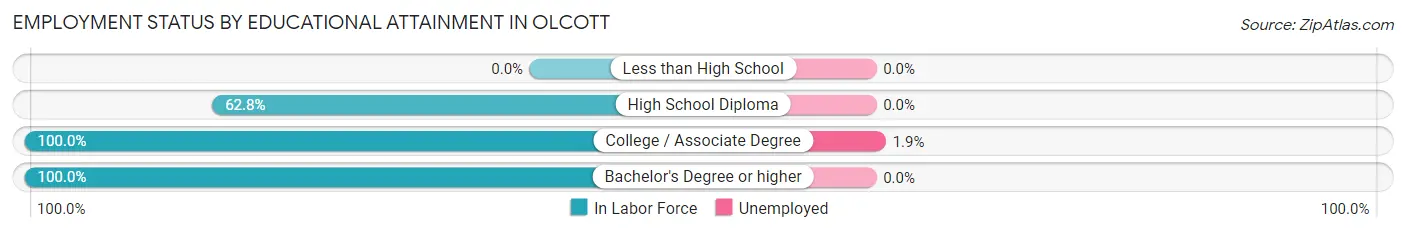
| Educational Attainment | In Labor Force | Unemployed |
| Less than High School | 0 (0.0%) | 0 (0.0%) |
| High School Diploma | 147 (62.8%) | 0 (0.0%) |
| College / Associate Degree | 262 (100.0%) | 5 (1.9%) |
| Bachelor's Degree or higher | 125 (100.0%) | 0 (0.0%) |
| Total | 534 (86.0%) | 6 (0.9%) |
Employment Occupations by Sex in Olcott
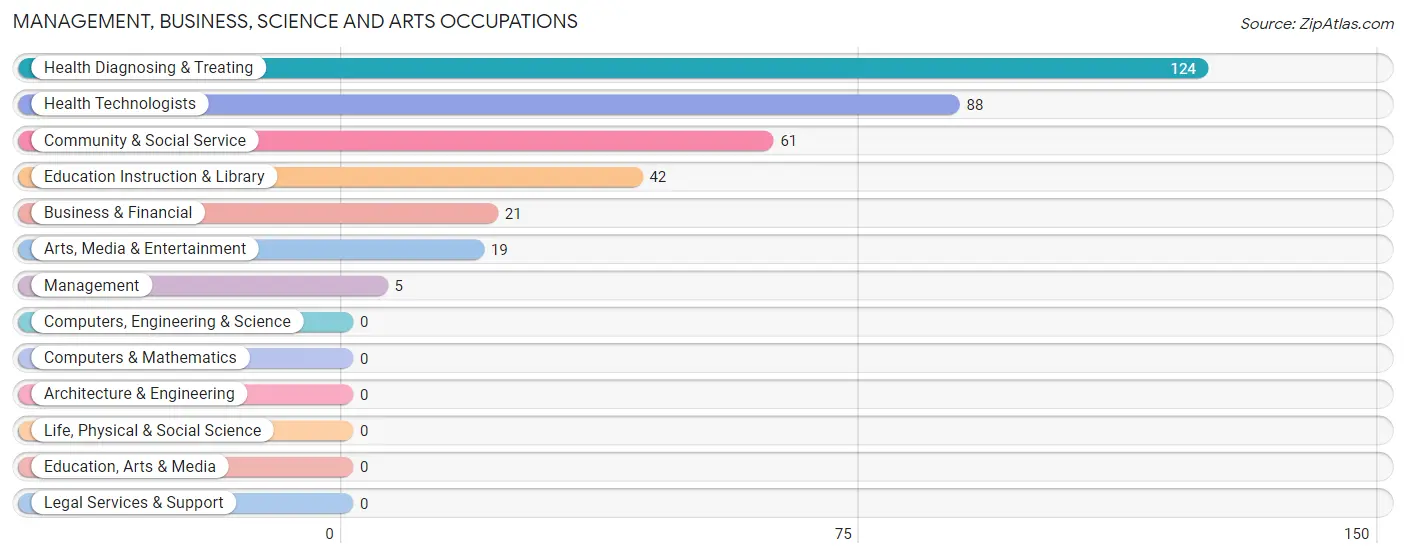
Management, Business, Science and Arts Occupations
The most common Management, Business, Science and Arts occupations in Olcott are Health Diagnosing & Treating (124 | 21.7%), Health Technologists (88 | 15.4%), Community & Social Service (61 | 10.7%), Education Instruction & Library (42 | 7.3%), and Business & Financial (21 | 3.7%).
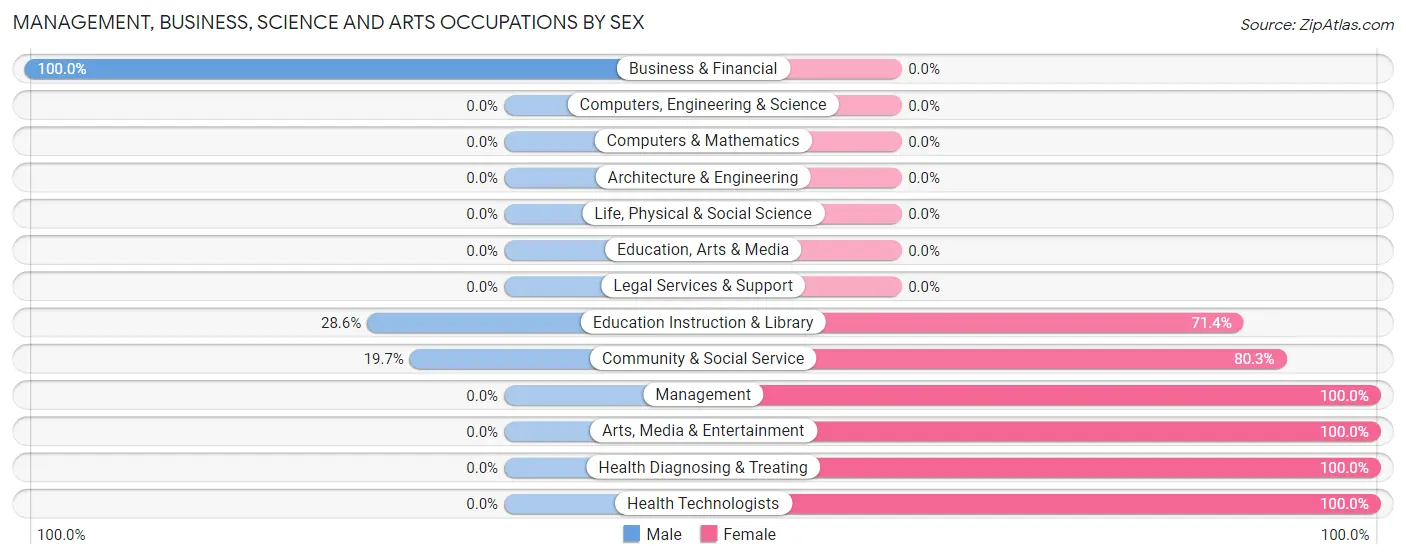
Management, Business, Science and Arts Occupations by Sex
Within the Management, Business, Science and Arts occupations in Olcott, the most male-oriented occupations are Business & Financial (100.0%), Education Instruction & Library (28.6%), and Community & Social Service (19.7%), while the most female-oriented occupations are Management (100.0%), Arts, Media & Entertainment (100.0%), and Health Diagnosing & Treating (100.0%).
| Occupation | Male | Female |
| Management | 0 (0.0%) | 5 (100.0%) |
| Business & Financial | 21 (100.0%) | 0 (0.0%) |
| Computers, Engineering & Science | 0 (0.0%) | 0 (0.0%) |
| Computers & Mathematics | 0 (0.0%) | 0 (0.0%) |
| Architecture & Engineering | 0 (0.0%) | 0 (0.0%) |
| Life, Physical & Social Science | 0 (0.0%) | 0 (0.0%) |
| Community & Social Service | 12 (19.7%) | 49 (80.3%) |
| Education, Arts & Media | 0 (0.0%) | 0 (0.0%) |
| Legal Services & Support | 0 (0.0%) | 0 (0.0%) |
| Education Instruction & Library | 12 (28.6%) | 30 (71.4%) |
| Arts, Media & Entertainment | 0 (0.0%) | 19 (100.0%) |
| Health Diagnosing & Treating | 0 (0.0%) | 124 (100.0%) |
| Health Technologists | 0 (0.0%) | 88 (100.0%) |
| Total (Category) | 33 (15.6%) | 178 (84.4%) |
| Total (Overall) | 232 (40.6%) | 340 (59.4%) |
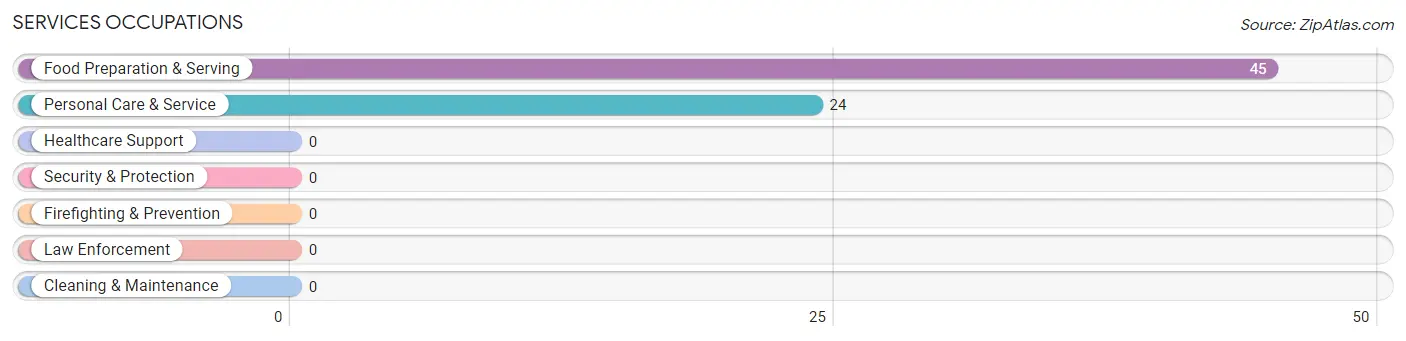
Services Occupations
The most common Services occupations in Olcott are Food Preparation & Serving (45 | 7.9%), and Personal Care & Service (24 | 4.2%).
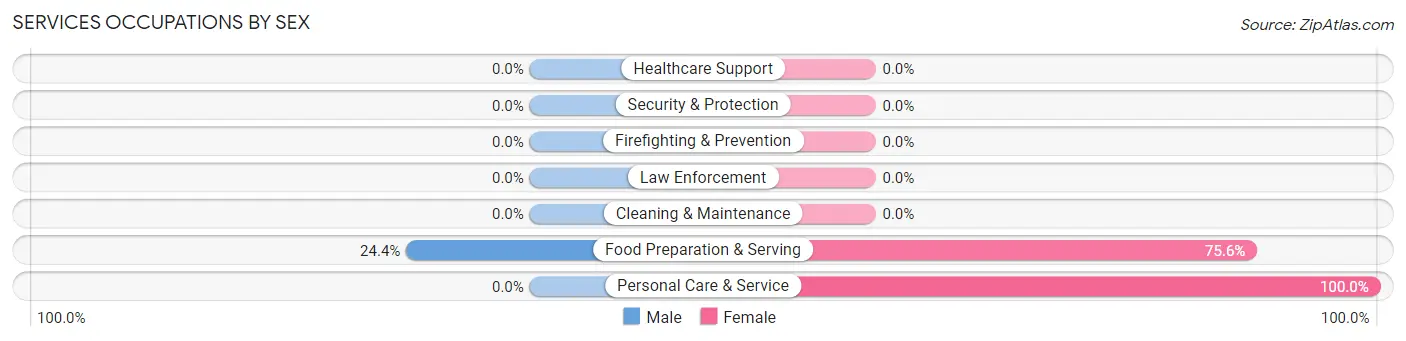
Services Occupations by Sex
| Occupation | Male | Female |
| Healthcare Support | 0 (0.0%) | 0 (0.0%) |
| Security & Protection | 0 (0.0%) | 0 (0.0%) |
| Firefighting & Prevention | 0 (0.0%) | 0 (0.0%) |
| Law Enforcement | 0 (0.0%) | 0 (0.0%) |
| Food Preparation & Serving | 11 (24.4%) | 34 (75.6%) |
| Cleaning & Maintenance | 0 (0.0%) | 0 (0.0%) |
| Personal Care & Service | 0 (0.0%) | 24 (100.0%) |
| Total (Category) | 11 (15.9%) | 58 (84.1%) |
| Total (Overall) | 232 (40.6%) | 340 (59.4%) |
Sales and Office Occupations
The most common Sales and Office occupations in Olcott are Office & Administration (77 | 13.5%), and Sales & Related (18 | 3.2%).
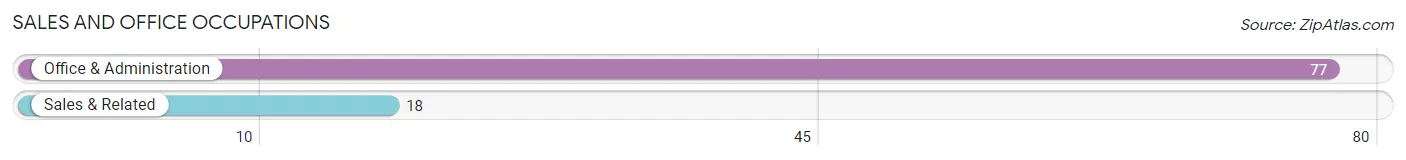
Sales and Office Occupations by Sex
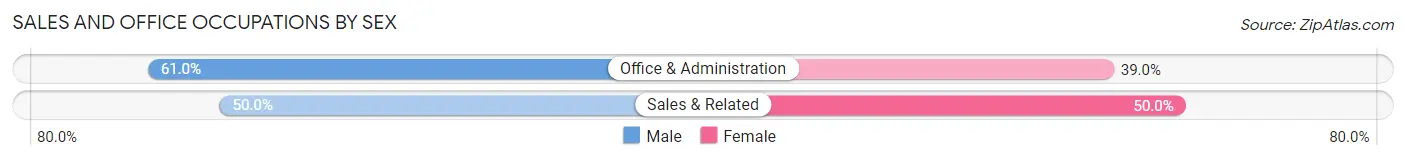
| Occupation | Male | Female |
| Sales & Related | 9 (50.0%) | 9 (50.0%) |
| Office & Administration | 47 (61.0%) | 30 (39.0%) |
| Total (Category) | 56 (59.0%) | 39 (41.0%) |
| Total (Overall) | 232 (40.6%) | 340 (59.4%) |
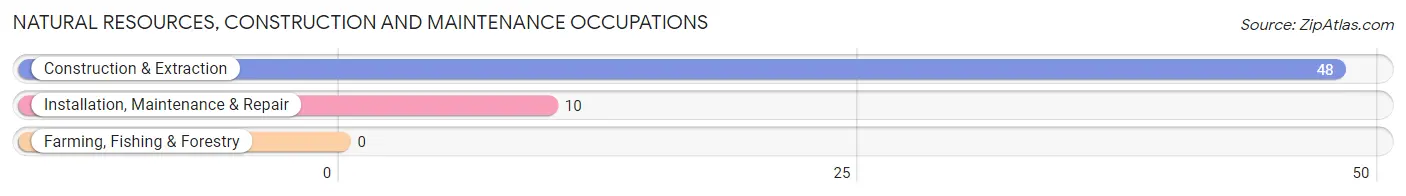
Natural Resources, Construction and Maintenance Occupations
The most common Natural Resources, Construction and Maintenance occupations in Olcott are Construction & Extraction (48 | 8.4%), and Installation, Maintenance & Repair (10 | 1.8%).
Natural Resources, Construction and Maintenance Occupations by Sex
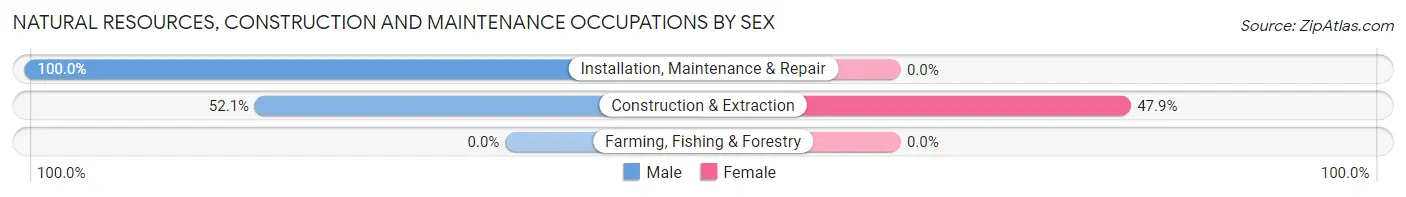
| Occupation | Male | Female |
| Farming, Fishing & Forestry | 0 (0.0%) | 0 (0.0%) |
| Construction & Extraction | 25 (52.1%) | 23 (47.9%) |
| Installation, Maintenance & Repair | 10 (100.0%) | 0 (0.0%) |
| Total (Category) | 35 (60.3%) | 23 (39.7%) |
| Total (Overall) | 232 (40.6%) | 340 (59.4%) |
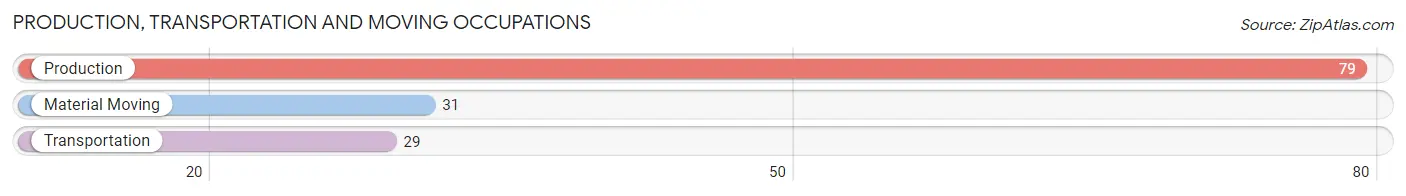
Production, Transportation and Moving Occupations
The most common Production, Transportation and Moving occupations in Olcott are Production (79 | 13.8%), Material Moving (31 | 5.4%), and Transportation (29 | 5.1%).
Production, Transportation and Moving Occupations by Sex
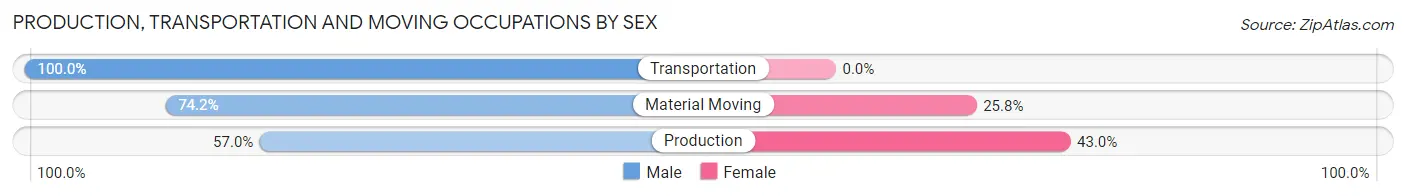
| Occupation | Male | Female |
| Production | 45 (57.0%) | 34 (43.0%) |
| Transportation | 29 (100.0%) | 0 (0.0%) |
| Material Moving | 23 (74.2%) | 8 (25.8%) |
| Total (Category) | 97 (69.8%) | 42 (30.2%) |
| Total (Overall) | 232 (40.6%) | 340 (59.4%) |
Employment Industries by Sex in Olcott
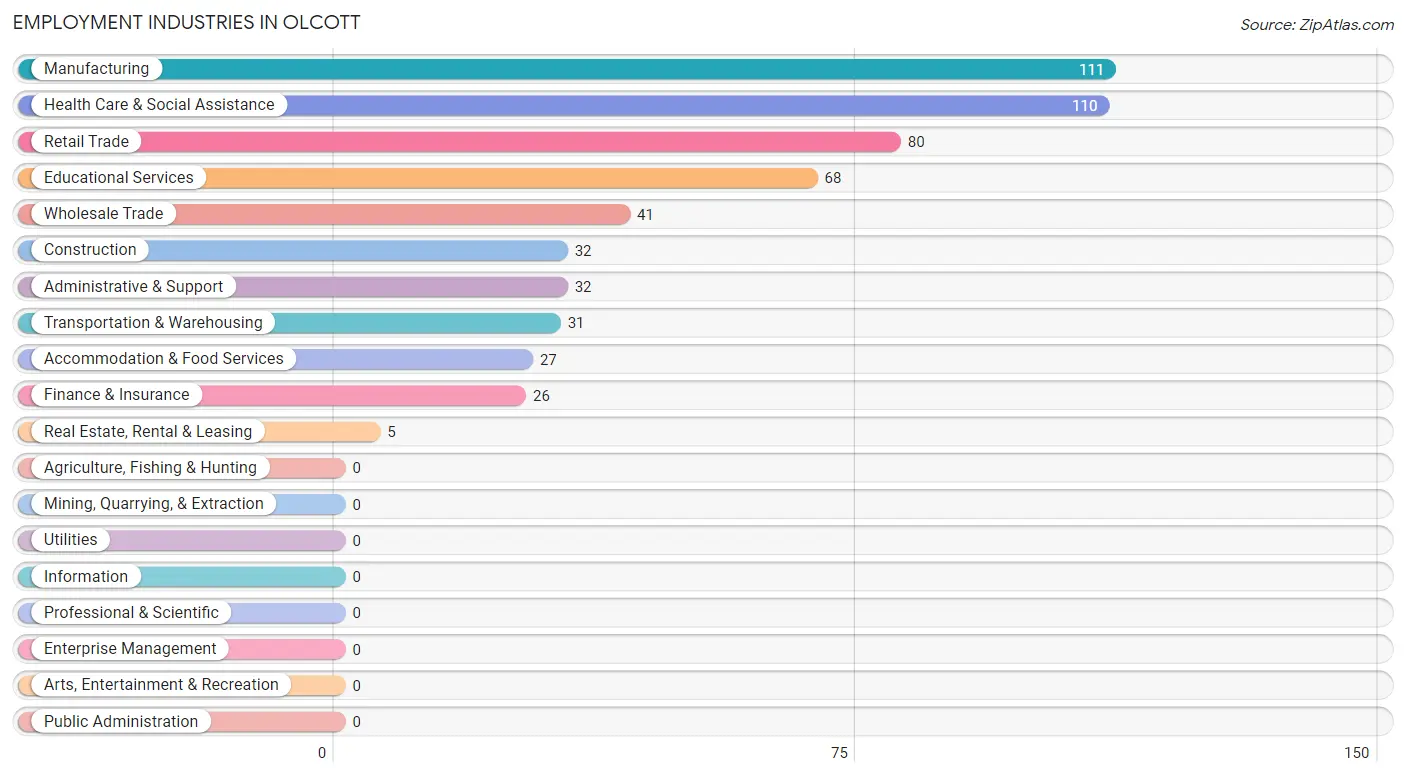
Employment Industries in Olcott
The major employment industries in Olcott include Manufacturing (111 | 19.4%), Health Care & Social Assistance (110 | 19.2%), Retail Trade (80 | 14.0%), Educational Services (68 | 11.9%), and Wholesale Trade (41 | 7.2%).
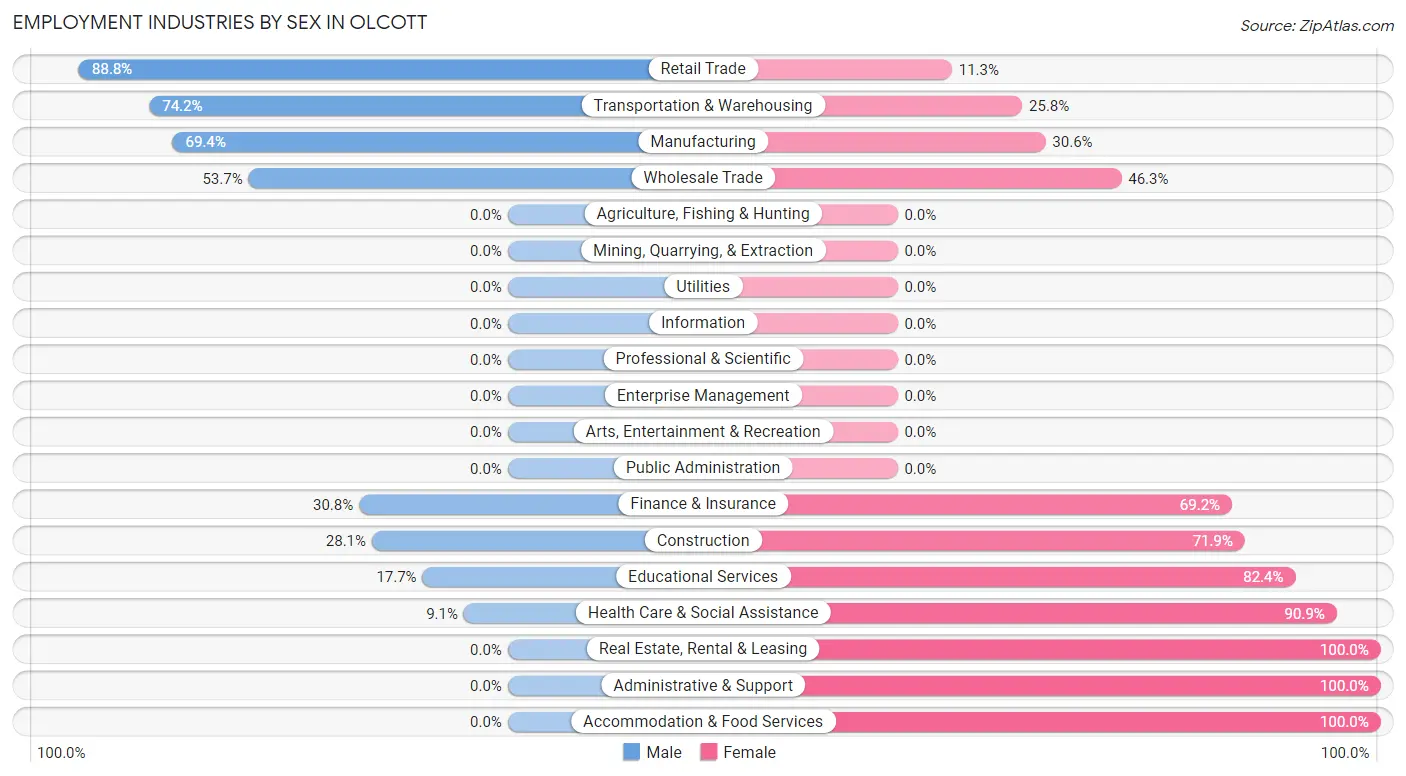
Employment Industries by Sex in Olcott
The Olcott industries that see more men than women are Retail Trade (88.7%), Transportation & Warehousing (74.2%), and Manufacturing (69.4%), whereas the industries that tend to have a higher number of women are Real Estate, Rental & Leasing (100.0%), Administrative & Support (100.0%), and Accommodation & Food Services (100.0%).
| Industry | Male | Female |
| Agriculture, Fishing & Hunting | 0 (0.0%) | 0 (0.0%) |
| Mining, Quarrying, & Extraction | 0 (0.0%) | 0 (0.0%) |
| Construction | 9 (28.1%) | 23 (71.9%) |
| Manufacturing | 77 (69.4%) | 34 (30.6%) |
| Wholesale Trade | 22 (53.7%) | 19 (46.3%) |
| Retail Trade | 71 (88.7%) | 9 (11.3%) |
| Transportation & Warehousing | 23 (74.2%) | 8 (25.8%) |
| Utilities | 0 (0.0%) | 0 (0.0%) |
| Information | 0 (0.0%) | 0 (0.0%) |
| Finance & Insurance | 8 (30.8%) | 18 (69.2%) |
| Real Estate, Rental & Leasing | 0 (0.0%) | 5 (100.0%) |
| Professional & Scientific | 0 (0.0%) | 0 (0.0%) |
| Enterprise Management | 0 (0.0%) | 0 (0.0%) |
| Administrative & Support | 0 (0.0%) | 32 (100.0%) |
| Educational Services | 12 (17.6%) | 56 (82.4%) |
| Health Care & Social Assistance | 10 (9.1%) | 100 (90.9%) |
| Arts, Entertainment & Recreation | 0 (0.0%) | 0 (0.0%) |
| Accommodation & Food Services | 0 (0.0%) | 27 (100.0%) |
| Public Administration | 0 (0.0%) | 0 (0.0%) |
| Total | 232 (40.6%) | 340 (59.4%) |
Education in Olcott
School Enrollment in Olcott
The most common levels of schooling among the 214 students in Olcott are high school (115 | 53.7%), elementary school (46 | 21.5%), and middle school (37 | 17.3%).
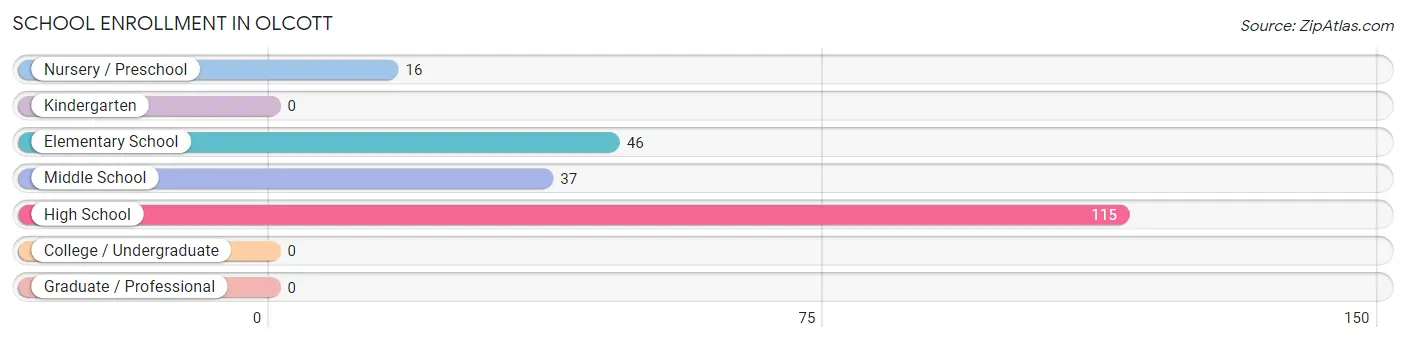
| School Level | # Students | % Students |
| Nursery / Preschool | 16 | 7.5% |
| Kindergarten | 0 | 0.0% |
| Elementary School | 46 | 21.5% |
| Middle School | 37 | 17.3% |
| High School | 115 | 53.7% |
| College / Undergraduate | 0 | 0.0% |
| Graduate / Professional | 0 | 0.0% |
| Total | 214 | 100.0% |
School Enrollment by Age by Funding Source in Olcott
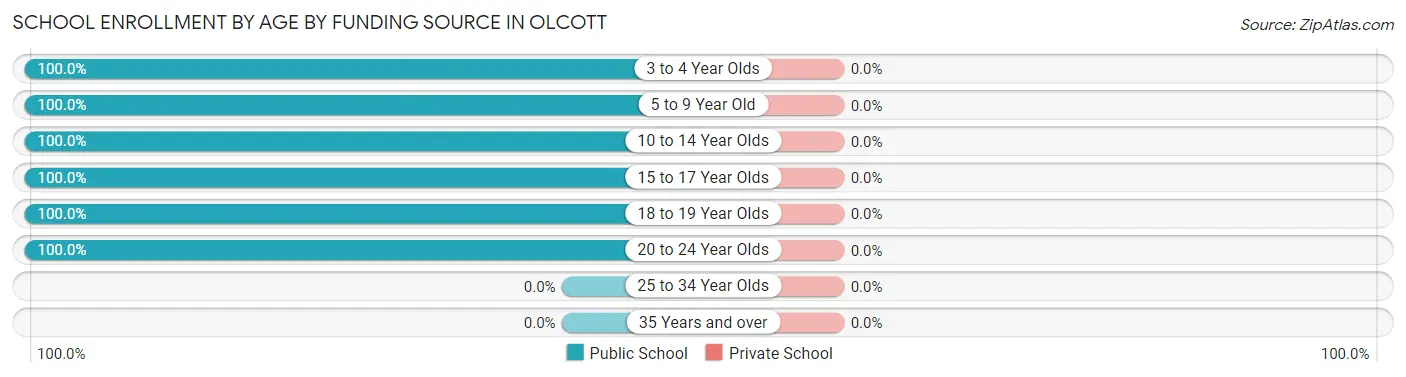
| Age Bracket | Public School | Private School |
| 3 to 4 Year Olds | 8 (100.0%) | 0 (0.0%) |
| 5 to 9 Year Old | 54 (100.0%) | 0 (0.0%) |
| 10 to 14 Year Olds | 45 (100.0%) | 0 (0.0%) |
| 15 to 17 Year Olds | 73 (100.0%) | 0 (0.0%) |
| 18 to 19 Year Olds | 26 (100.0%) | 0 (0.0%) |
| 20 to 24 Year Olds | 8 (100.0%) | 0 (0.0%) |
| 25 to 34 Year Olds | 0 (0.0%) | 0 (0.0%) |
| 35 Years and over | 0 (0.0%) | 0 (0.0%) |
| Total | 214 (100.0%) | 0 (0.0%) |
Educational Attainment by Field of Study in Olcott
Science & technology (32 | 21.0%), physical & health sciences (25 | 16.5%), business (23 | 15.1%), bio, nature & agricultural (22 | 14.5%), and education (20 | 13.2%) are the most common fields of study among 152 individuals in Olcott who have obtained a bachelor's degree or higher.
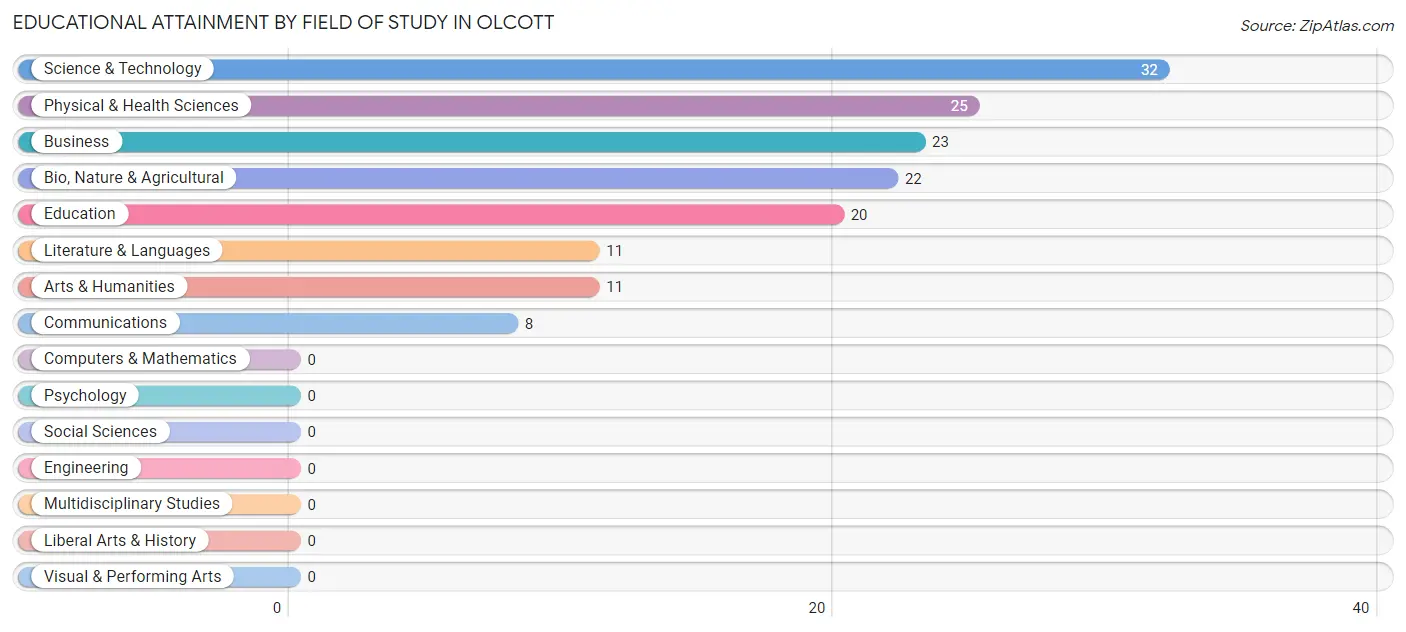
| Field of Study | # Graduates | % Graduates |
| Computers & Mathematics | 0 | 0.0% |
| Bio, Nature & Agricultural | 22 | 14.5% |
| Physical & Health Sciences | 25 | 16.5% |
| Psychology | 0 | 0.0% |
| Social Sciences | 0 | 0.0% |
| Engineering | 0 | 0.0% |
| Multidisciplinary Studies | 0 | 0.0% |
| Science & Technology | 32 | 21.0% |
| Business | 23 | 15.1% |
| Education | 20 | 13.2% |
| Literature & Languages | 11 | 7.2% |
| Liberal Arts & History | 0 | 0.0% |
| Visual & Performing Arts | 0 | 0.0% |
| Communications | 8 | 5.3% |
| Arts & Humanities | 11 | 7.2% |
| Total | 152 | 100.0% |
Transportation & Commute in Olcott
Vehicle Availability by Sex in Olcott
The most prevalent vehicle ownership categories in Olcott are males with 3 vehicles (135, accounting for 56.2%) and females with 3 vehicles (92, making up 39.7%).
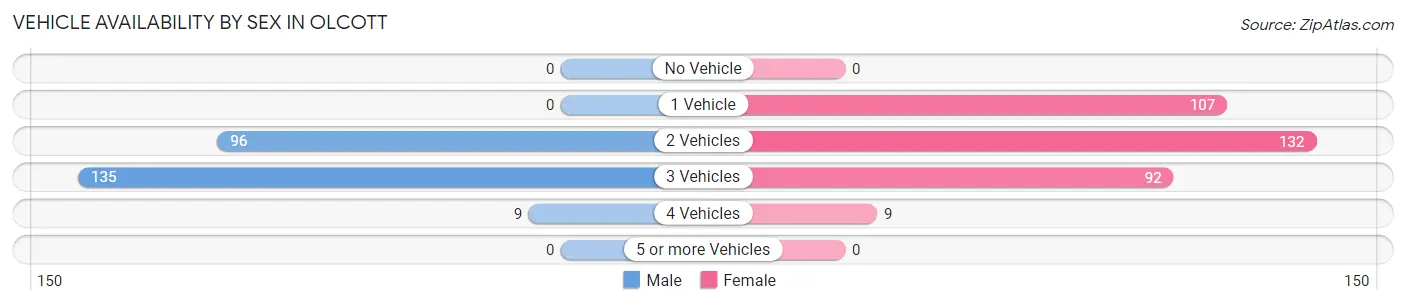
| Vehicles Available | Male | Female |
| No Vehicle | 0 (0.0%) | 0 (0.0%) |
| 1 Vehicle | 0 (0.0%) | 107 (31.5%) |
| 2 Vehicles | 96 (40.0%) | 132 (38.8%) |
| 3 Vehicles | 135 (56.2%) | 92 (27.1%) |
| 4 Vehicles | 9 (3.7%) | 9 (2.6%) |
| 5 or more Vehicles | 0 (0.0%) | 0 (0.0%) |
| Total | 240 (100.0%) | 340 (100.0%) |
Commute Time in Olcott
The most frequently occuring commute durations in Olcott are 45 to 59 minutes (161 commuters, 30.6%), 30 to 34 minutes (142 commuters, 27.0%), and 15 to 19 minutes (54 commuters, 10.3%).
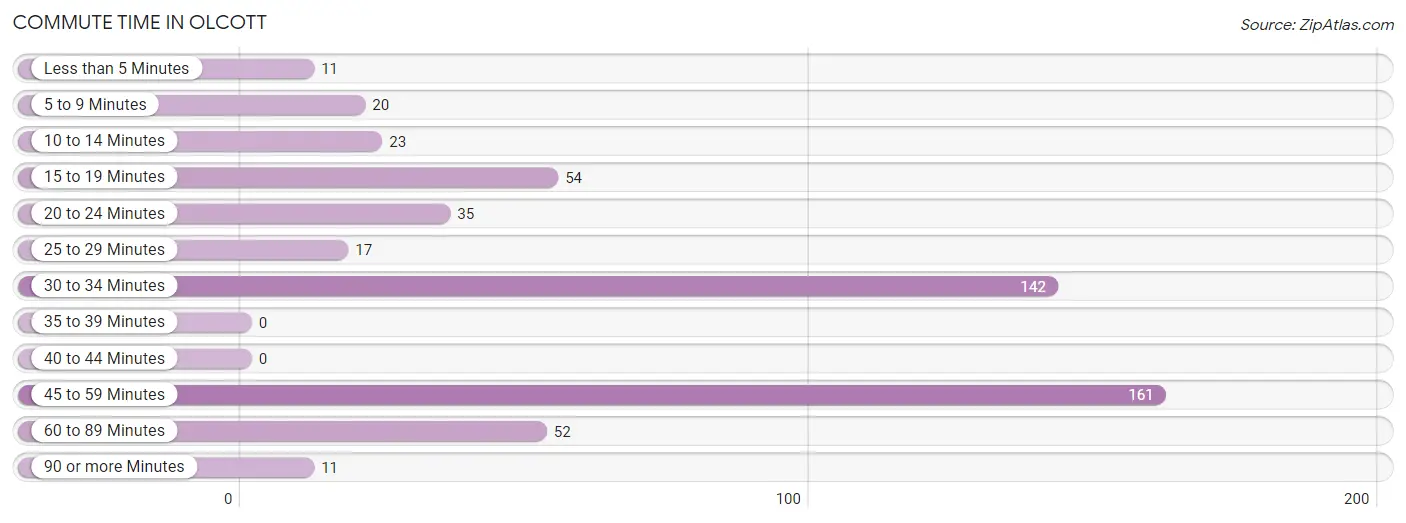
| Commute Time | # Commuters | % Commuters |
| Less than 5 Minutes | 11 | 2.1% |
| 5 to 9 Minutes | 20 | 3.8% |
| 10 to 14 Minutes | 23 | 4.4% |
| 15 to 19 Minutes | 54 | 10.3% |
| 20 to 24 Minutes | 35 | 6.7% |
| 25 to 29 Minutes | 17 | 3.2% |
| 30 to 34 Minutes | 142 | 27.0% |
| 35 to 39 Minutes | 0 | 0.0% |
| 40 to 44 Minutes | 0 | 0.0% |
| 45 to 59 Minutes | 161 | 30.6% |
| 60 to 89 Minutes | 52 | 9.9% |
| 90 or more Minutes | 11 | 2.1% |
Commute Time by Sex in Olcott
The most common commute times in Olcott are 45 to 59 minutes (111 commuters, 47.8%) for males and 30 to 34 minutes (126 commuters, 42.9%) for females.
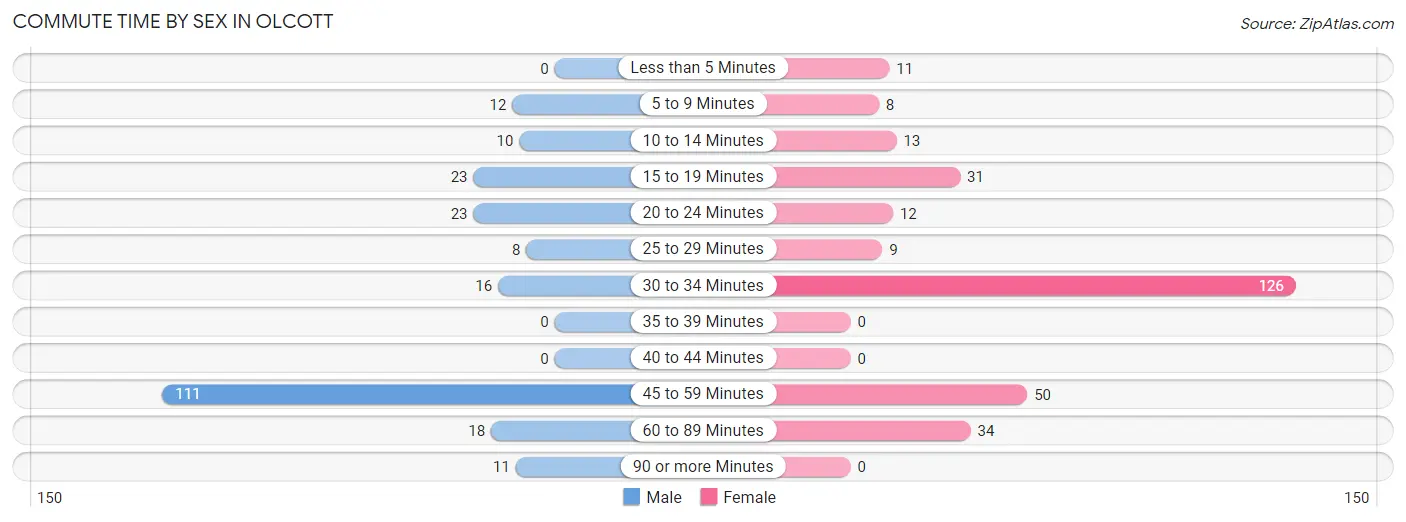
| Commute Time | Male | Female |
| Less than 5 Minutes | 0 (0.0%) | 11 (3.7%) |
| 5 to 9 Minutes | 12 (5.2%) | 8 (2.7%) |
| 10 to 14 Minutes | 10 (4.3%) | 13 (4.4%) |
| 15 to 19 Minutes | 23 (9.9%) | 31 (10.5%) |
| 20 to 24 Minutes | 23 (9.9%) | 12 (4.1%) |
| 25 to 29 Minutes | 8 (3.5%) | 9 (3.1%) |
| 30 to 34 Minutes | 16 (6.9%) | 126 (42.9%) |
| 35 to 39 Minutes | 0 (0.0%) | 0 (0.0%) |
| 40 to 44 Minutes | 0 (0.0%) | 0 (0.0%) |
| 45 to 59 Minutes | 111 (47.8%) | 50 (17.0%) |
| 60 to 89 Minutes | 18 (7.8%) | 34 (11.6%) |
| 90 or more Minutes | 11 (4.7%) | 0 (0.0%) |
Time of Departure to Work by Sex in Olcott
The most frequent times of departure to work in Olcott are 7:00 AM to 7:29 AM (57, 24.6%) for males and 7:00 AM to 7:29 AM (126, 42.9%) for females.
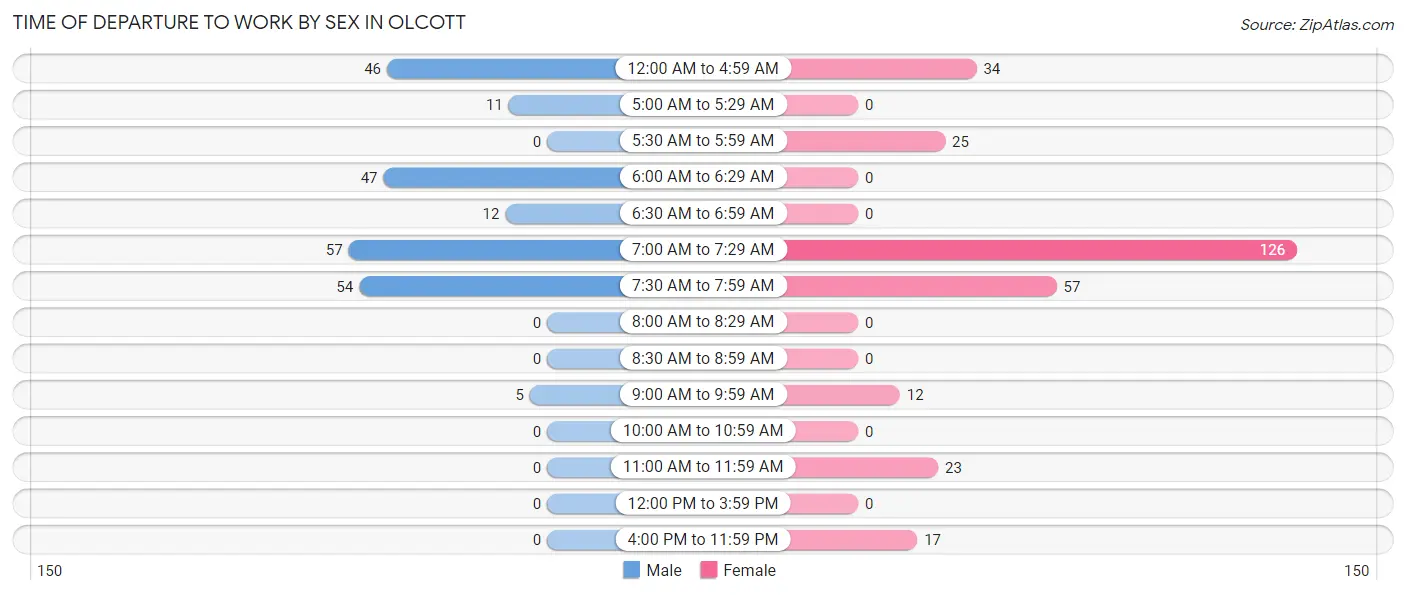
| Time of Departure | Male | Female |
| 12:00 AM to 4:59 AM | 46 (19.8%) | 34 (11.6%) |
| 5:00 AM to 5:29 AM | 11 (4.7%) | 0 (0.0%) |
| 5:30 AM to 5:59 AM | 0 (0.0%) | 25 (8.5%) |
| 6:00 AM to 6:29 AM | 47 (20.3%) | 0 (0.0%) |
| 6:30 AM to 6:59 AM | 12 (5.2%) | 0 (0.0%) |
| 7:00 AM to 7:29 AM | 57 (24.6%) | 126 (42.9%) |
| 7:30 AM to 7:59 AM | 54 (23.3%) | 57 (19.4%) |
| 8:00 AM to 8:29 AM | 0 (0.0%) | 0 (0.0%) |
| 8:30 AM to 8:59 AM | 0 (0.0%) | 0 (0.0%) |
| 9:00 AM to 9:59 AM | 5 (2.2%) | 12 (4.1%) |
| 10:00 AM to 10:59 AM | 0 (0.0%) | 0 (0.0%) |
| 11:00 AM to 11:59 AM | 0 (0.0%) | 23 (7.8%) |
| 12:00 PM to 3:59 PM | 0 (0.0%) | 0 (0.0%) |
| 4:00 PM to 11:59 PM | 0 (0.0%) | 17 (5.8%) |
| Total | 232 (100.0%) | 294 (100.0%) |
Housing Occupancy in Olcott
Occupancy by Ownership in Olcott
Of the total 480 dwellings in Olcott, owner-occupied units account for 423 (88.1%), while renter-occupied units make up 57 (11.9%).
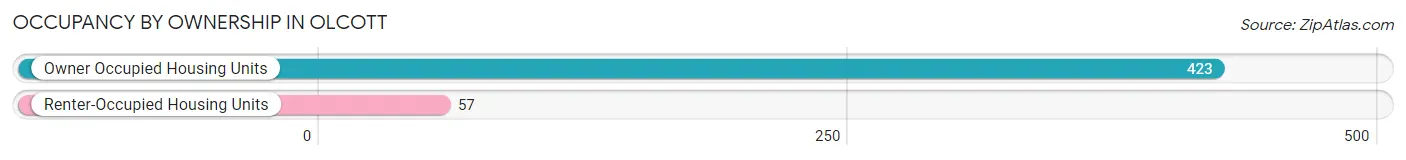
| Occupancy | # Housing Units | % Housing Units |
| Owner Occupied Housing Units | 423 | 88.1% |
| Renter-Occupied Housing Units | 57 | 11.9% |
| Total Occupied Housing Units | 480 | 100.0% |
Occupancy by Household Size in Olcott
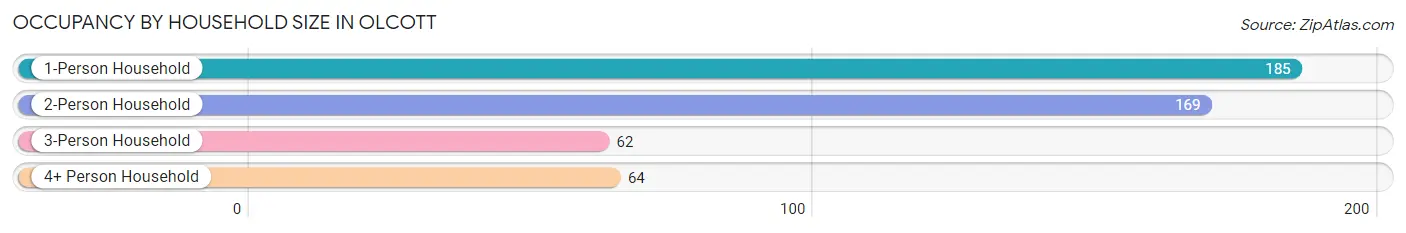
| Household Size | # Housing Units | % Housing Units |
| 1-Person Household | 185 | 38.5% |
| 2-Person Household | 169 | 35.2% |
| 3-Person Household | 62 | 12.9% |
| 4+ Person Household | 64 | 13.3% |
| Total Housing Units | 480 | 100.0% |
Occupancy by Ownership by Household Size in Olcott
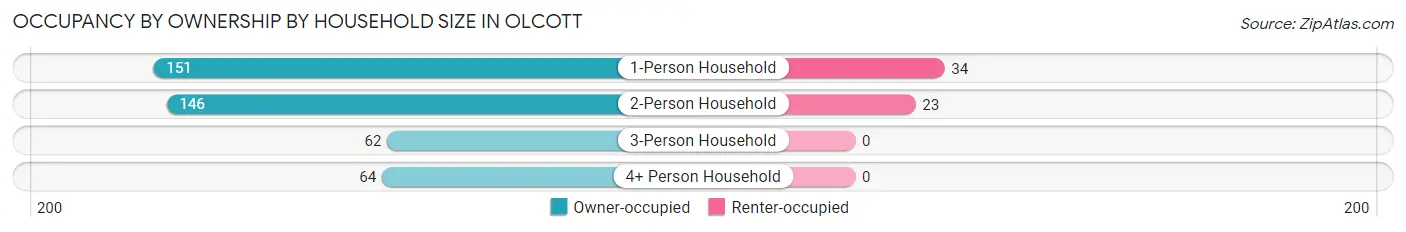
| Household Size | Owner-occupied | Renter-occupied |
| 1-Person Household | 151 (81.6%) | 34 (18.4%) |
| 2-Person Household | 146 (86.4%) | 23 (13.6%) |
| 3-Person Household | 62 (100.0%) | 0 (0.0%) |
| 4+ Person Household | 64 (100.0%) | 0 (0.0%) |
| Total Housing Units | 423 (88.1%) | 57 (11.9%) |
Occupancy by Educational Attainment in Olcott
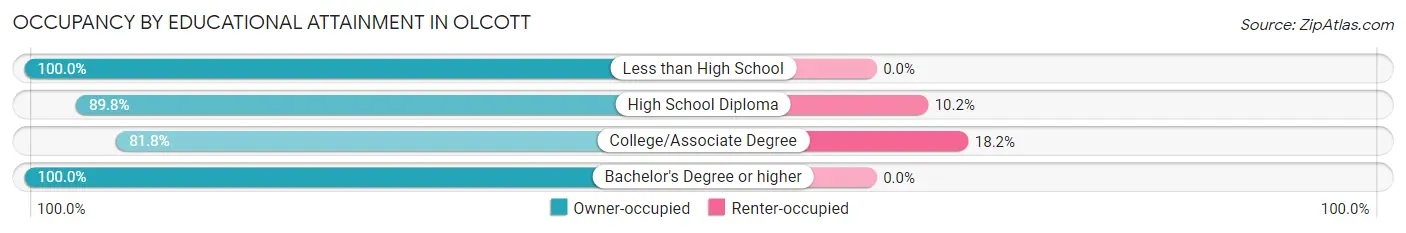
| Household Size | Owner-occupied | Renter-occupied |
| Less than High School | 20 (100.0%) | 0 (0.0%) |
| High School Diploma | 202 (89.8%) | 23 (10.2%) |
| College/Associate Degree | 153 (81.8%) | 34 (18.2%) |
| Bachelor's Degree or higher | 48 (100.0%) | 0 (0.0%) |
Occupancy by Age of Householder in Olcott
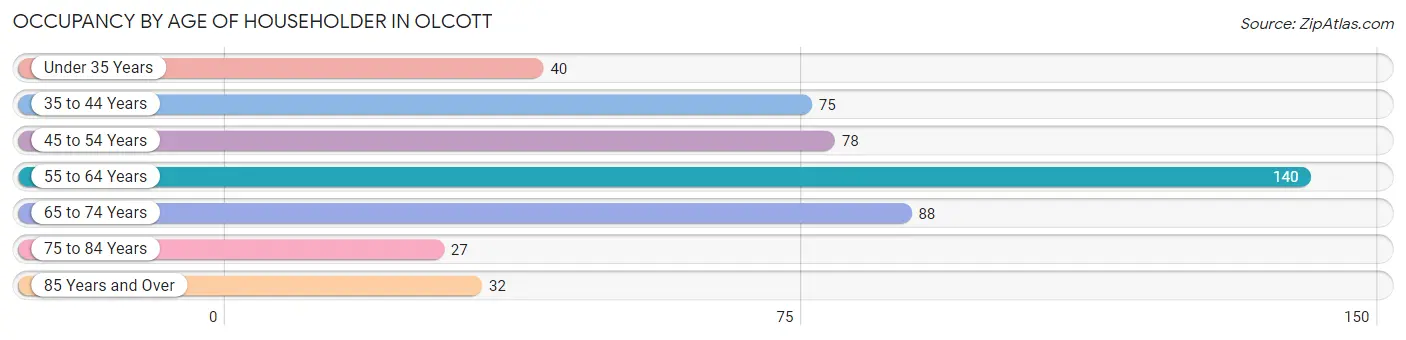
| Age Bracket | # Households | % Households |
| Under 35 Years | 40 | 8.3% |
| 35 to 44 Years | 75 | 15.6% |
| 45 to 54 Years | 78 | 16.3% |
| 55 to 64 Years | 140 | 29.2% |
| 65 to 74 Years | 88 | 18.3% |
| 75 to 84 Years | 27 | 5.6% |
| 85 Years and Over | 32 | 6.7% |
| Total | 480 | 100.0% |
Housing Finances in Olcott
Median Income by Occupancy in Olcott
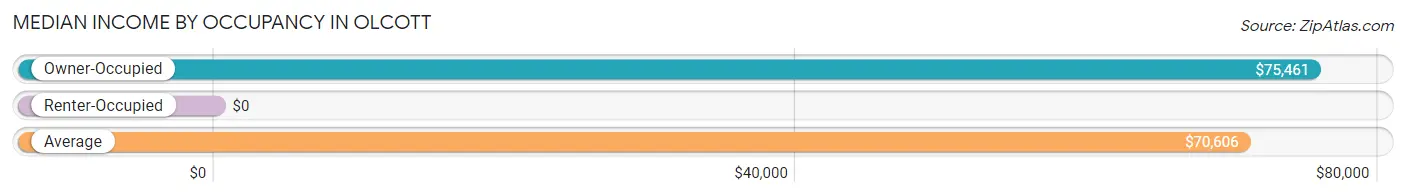
| Occupancy Type | # Households | Median Income |
| Owner-Occupied | 423 (88.1%) | $75,461 |
| Renter-Occupied | 57 (11.9%) | $0 |
| Average | 480 (100.0%) | $70,606 |
Occupancy by Householder Income Bracket in Olcott
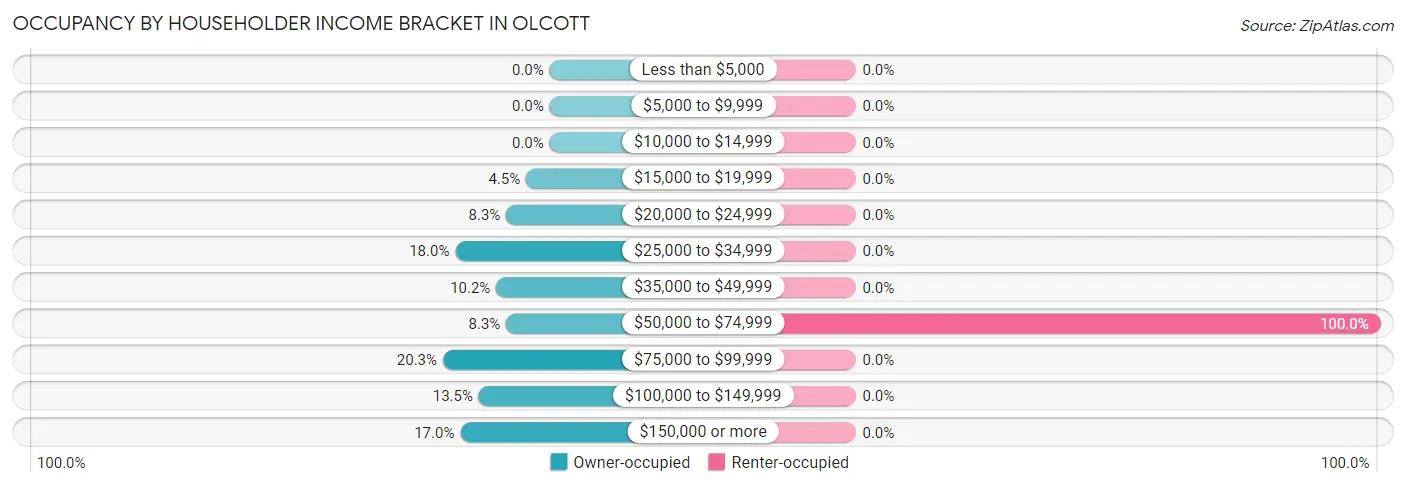
| Income Bracket | Owner-occupied | Renter-occupied |
| Less than $5,000 | 0 (0.0%) | 0 (0.0%) |
| $5,000 to $9,999 | 0 (0.0%) | 0 (0.0%) |
| $10,000 to $14,999 | 0 (0.0%) | 0 (0.0%) |
| $15,000 to $19,999 | 19 (4.5%) | 0 (0.0%) |
| $20,000 to $24,999 | 35 (8.3%) | 0 (0.0%) |
| $25,000 to $34,999 | 76 (18.0%) | 0 (0.0%) |
| $35,000 to $49,999 | 43 (10.2%) | 0 (0.0%) |
| $50,000 to $74,999 | 35 (8.3%) | 57 (100.0%) |
| $75,000 to $99,999 | 86 (20.3%) | 0 (0.0%) |
| $100,000 to $149,999 | 57 (13.5%) | 0 (0.0%) |
| $150,000 or more | 72 (17.0%) | 0 (0.0%) |
| Total | 423 (100.0%) | 57 (100.0%) |
Monthly Housing Cost Tiers in Olcott
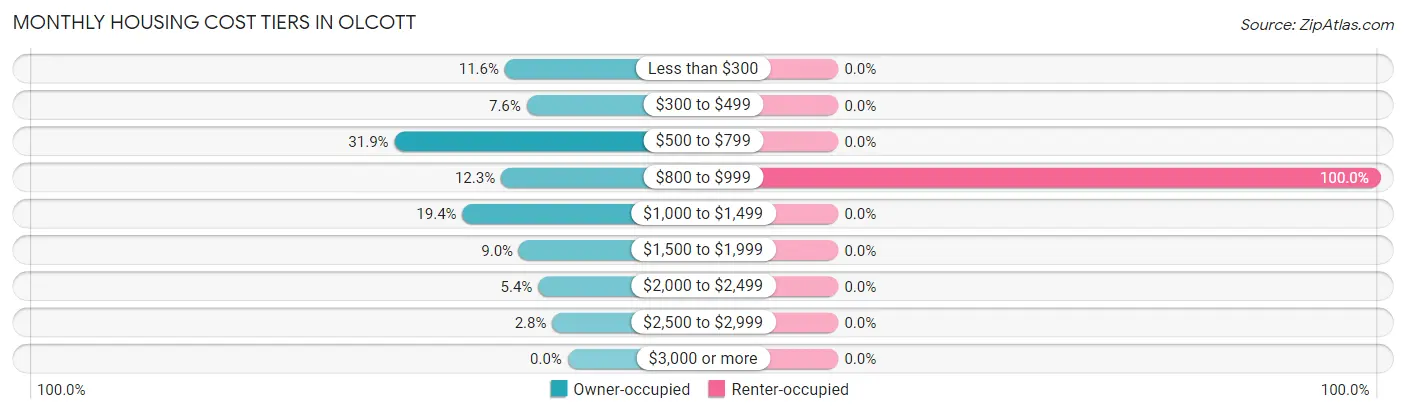
| Monthly Cost | Owner-occupied | Renter-occupied |
| Less than $300 | 49 (11.6%) | 0 (0.0%) |
| $300 to $499 | 32 (7.6%) | 0 (0.0%) |
| $500 to $799 | 135 (31.9%) | 0 (0.0%) |
| $800 to $999 | 52 (12.3%) | 57 (100.0%) |
| $1,000 to $1,499 | 82 (19.4%) | 0 (0.0%) |
| $1,500 to $1,999 | 38 (9.0%) | 0 (0.0%) |
| $2,000 to $2,499 | 23 (5.4%) | 0 (0.0%) |
| $2,500 to $2,999 | 12 (2.8%) | 0 (0.0%) |
| $3,000 or more | 0 (0.0%) | 0 (0.0%) |
| Total | 423 (100.0%) | 57 (100.0%) |
Physical Housing Characteristics in Olcott
Housing Structures in Olcott
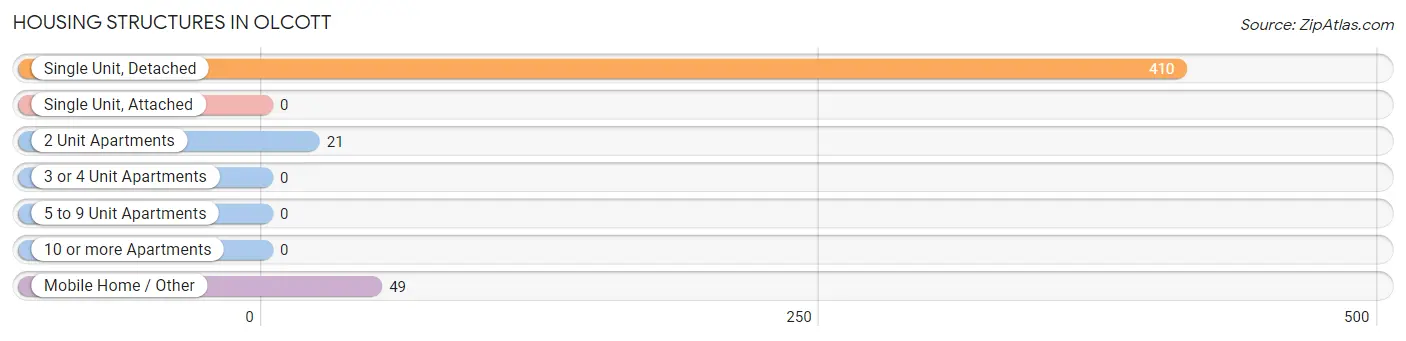
| Structure Type | # Housing Units | % Housing Units |
| Single Unit, Detached | 410 | 85.4% |
| Single Unit, Attached | 0 | 0.0% |
| 2 Unit Apartments | 21 | 4.4% |
| 3 or 4 Unit Apartments | 0 | 0.0% |
| 5 to 9 Unit Apartments | 0 | 0.0% |
| 10 or more Apartments | 0 | 0.0% |
| Mobile Home / Other | 49 | 10.2% |
| Total | 480 | 100.0% |
Housing Structures by Occupancy in Olcott
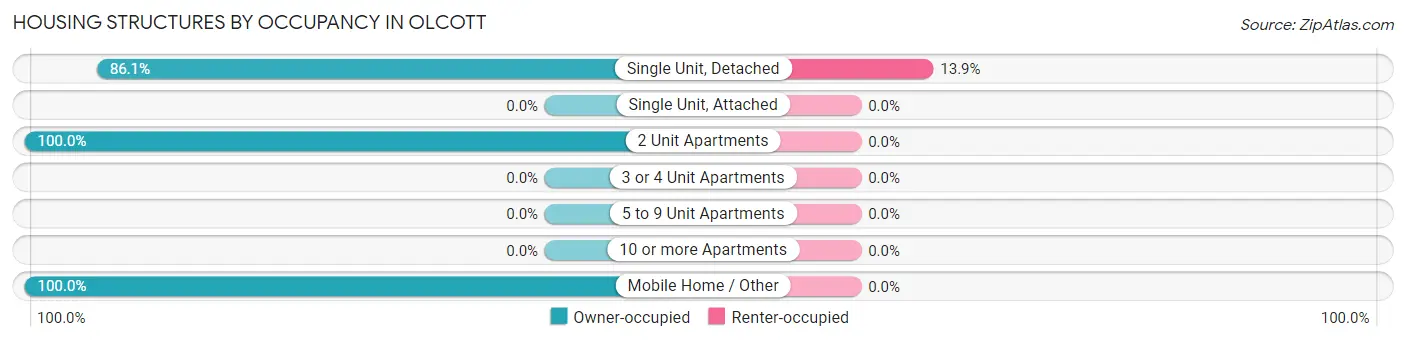
| Structure Type | Owner-occupied | Renter-occupied |
| Single Unit, Detached | 353 (86.1%) | 57 (13.9%) |
| Single Unit, Attached | 0 (0.0%) | 0 (0.0%) |
| 2 Unit Apartments | 21 (100.0%) | 0 (0.0%) |
| 3 or 4 Unit Apartments | 0 (0.0%) | 0 (0.0%) |
| 5 to 9 Unit Apartments | 0 (0.0%) | 0 (0.0%) |
| 10 or more Apartments | 0 (0.0%) | 0 (0.0%) |
| Mobile Home / Other | 49 (100.0%) | 0 (0.0%) |
| Total | 423 (88.1%) | 57 (11.9%) |
Housing Structures by Number of Rooms in Olcott
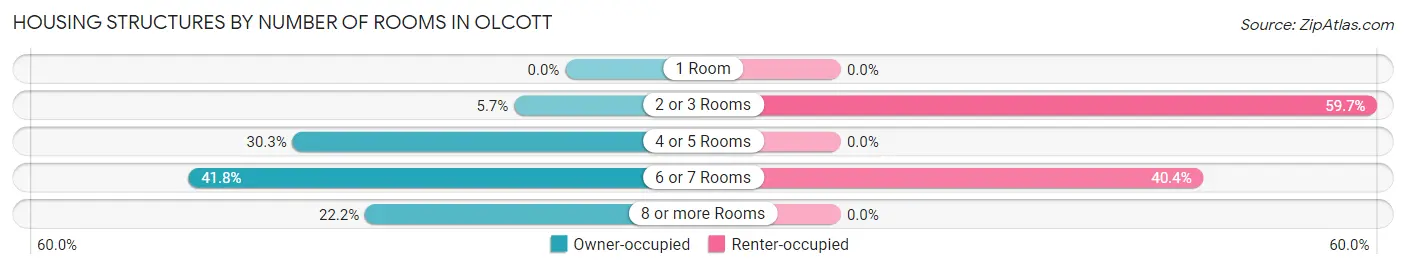
| Number of Rooms | Owner-occupied | Renter-occupied |
| 1 Room | 0 (0.0%) | 0 (0.0%) |
| 2 or 3 Rooms | 24 (5.7%) | 34 (59.7%) |
| 4 or 5 Rooms | 128 (30.3%) | 0 (0.0%) |
| 6 or 7 Rooms | 177 (41.8%) | 23 (40.4%) |
| 8 or more Rooms | 94 (22.2%) | 0 (0.0%) |
| Total | 423 (100.0%) | 57 (100.0%) |
Housing Structure by Heating Type in Olcott
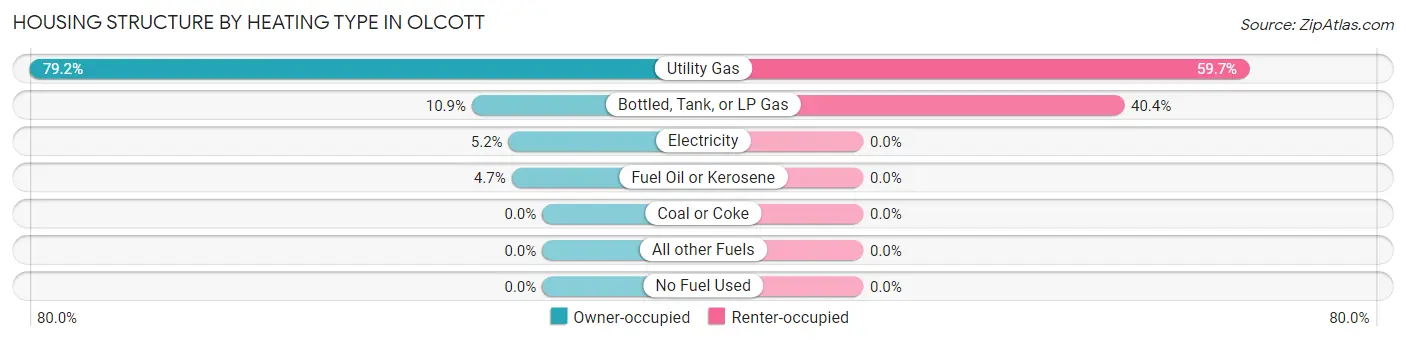
| Heating Type | Owner-occupied | Renter-occupied |
| Utility Gas | 335 (79.2%) | 34 (59.7%) |
| Bottled, Tank, or LP Gas | 46 (10.9%) | 23 (40.4%) |
| Electricity | 22 (5.2%) | 0 (0.0%) |
| Fuel Oil or Kerosene | 20 (4.7%) | 0 (0.0%) |
| Coal or Coke | 0 (0.0%) | 0 (0.0%) |
| All other Fuels | 0 (0.0%) | 0 (0.0%) |
| No Fuel Used | 0 (0.0%) | 0 (0.0%) |
| Total | 423 (100.0%) | 57 (100.0%) |
Household Vehicle Usage in Olcott
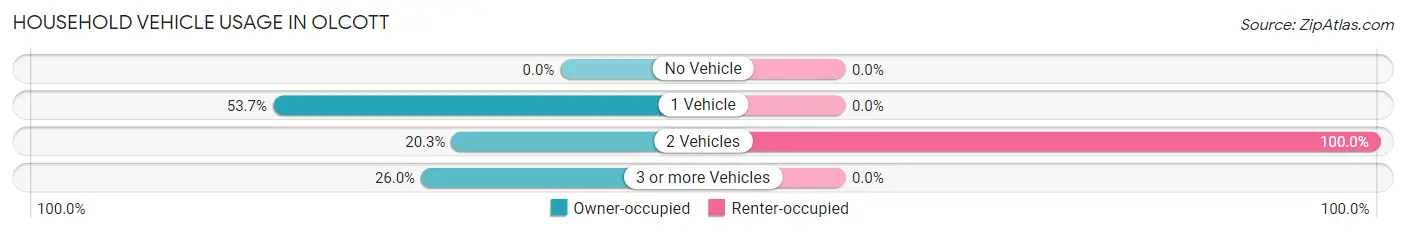
| Vehicles per Household | Owner-occupied | Renter-occupied |
| No Vehicle | 0 (0.0%) | 0 (0.0%) |
| 1 Vehicle | 227 (53.7%) | 0 (0.0%) |
| 2 Vehicles | 86 (20.3%) | 57 (100.0%) |
| 3 or more Vehicles | 110 (26.0%) | 0 (0.0%) |
| Total | 423 (100.0%) | 57 (100.0%) |
Real Estate & Mortgages in Olcott
Real Estate and Mortgage Overview in Olcott
| Characteristic | Without Mortgage | With Mortgage |
| Housing Units | 217 | 206 |
| Median Property Value | $101,800 | $157,100 |
| Median Household Income | $35,625 | $42 |
| Monthly Housing Costs | $555 | $0 |
| Real Estate Taxes | $2,143 | $9 |
Property Value by Mortgage Status in Olcott
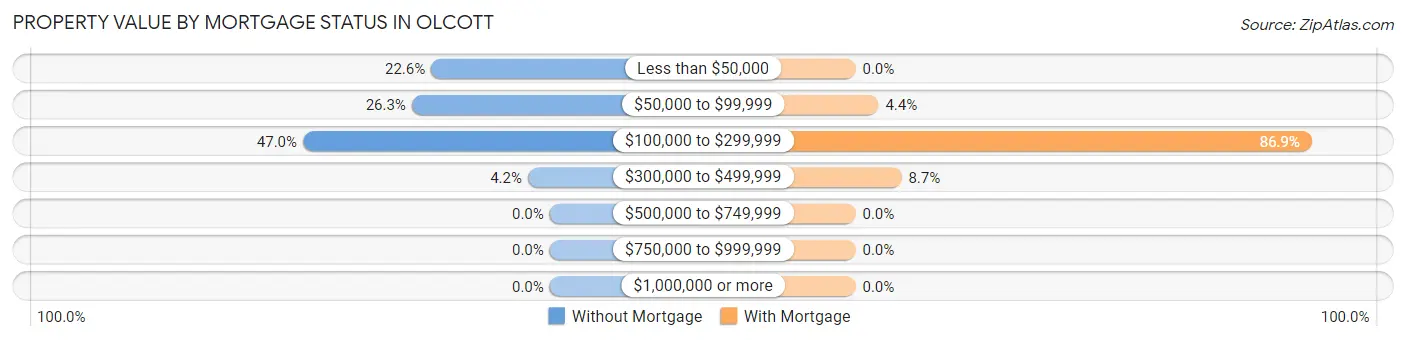
| Property Value | Without Mortgage | With Mortgage |
| Less than $50,000 | 49 (22.6%) | 0 (0.0%) |
| $50,000 to $99,999 | 57 (26.3%) | 9 (4.4%) |
| $100,000 to $299,999 | 102 (47.0%) | 179 (86.9%) |
| $300,000 to $499,999 | 9 (4.2%) | 18 (8.7%) |
| $500,000 to $749,999 | 0 (0.0%) | 0 (0.0%) |
| $750,000 to $999,999 | 0 (0.0%) | 0 (0.0%) |
| $1,000,000 or more | 0 (0.0%) | 0 (0.0%) |
| Total | 217 (100.0%) | 206 (100.0%) |
Household Income by Mortgage Status in Olcott
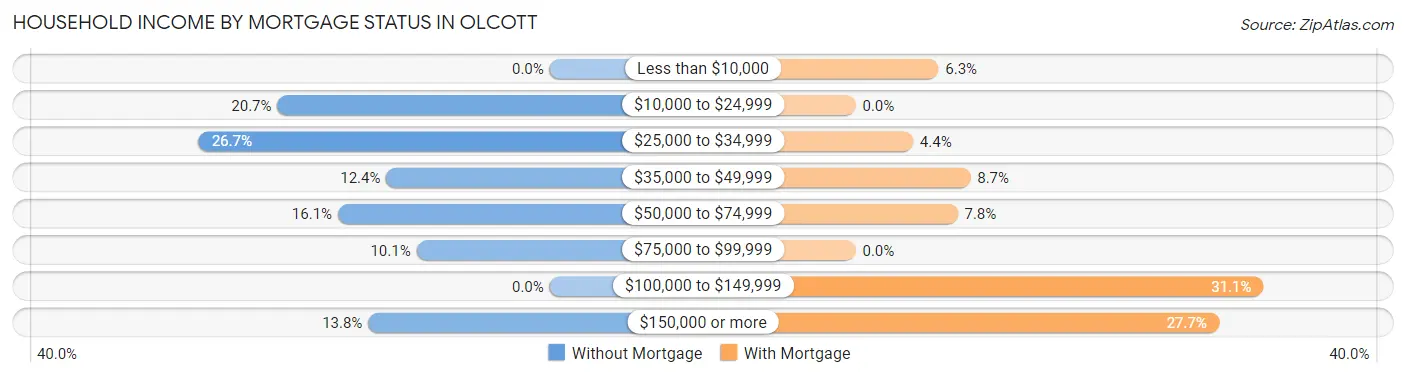
| Household Income | Without Mortgage | With Mortgage |
| Less than $10,000 | 0 (0.0%) | 13 (6.3%) |
| $10,000 to $24,999 | 45 (20.7%) | 0 (0.0%) |
| $25,000 to $34,999 | 58 (26.7%) | 9 (4.4%) |
| $35,000 to $49,999 | 27 (12.4%) | 18 (8.7%) |
| $50,000 to $74,999 | 35 (16.1%) | 16 (7.8%) |
| $75,000 to $99,999 | 22 (10.1%) | 0 (0.0%) |
| $100,000 to $149,999 | 0 (0.0%) | 64 (31.1%) |
| $150,000 or more | 30 (13.8%) | 57 (27.7%) |
| Total | 217 (100.0%) | 206 (100.0%) |
Property Value to Household Income Ratio in Olcott
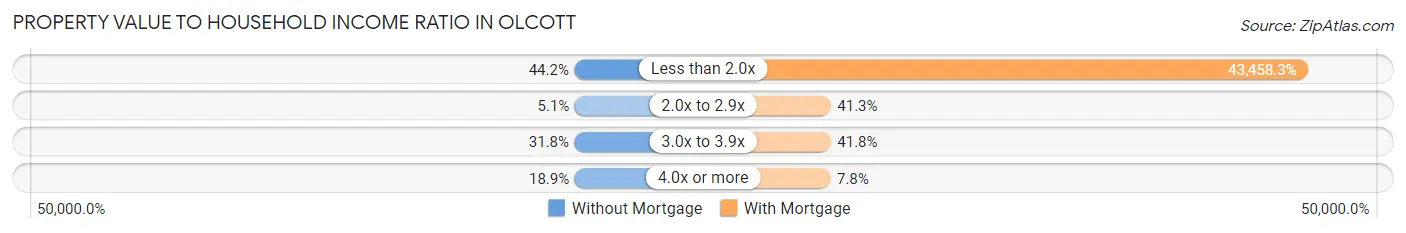
| Value-to-Income Ratio | Without Mortgage | With Mortgage |
| Less than 2.0x | 96 (44.2%) | 89,524 (43,458.2%) |
| 2.0x to 2.9x | 11 (5.1%) | 85 (41.3%) |
| 3.0x to 3.9x | 69 (31.8%) | 86 (41.7%) |
| 4.0x or more | 41 (18.9%) | 16 (7.8%) |
| Total | 217 (100.0%) | 206 (100.0%) |
Real Estate Taxes by Mortgage Status in Olcott
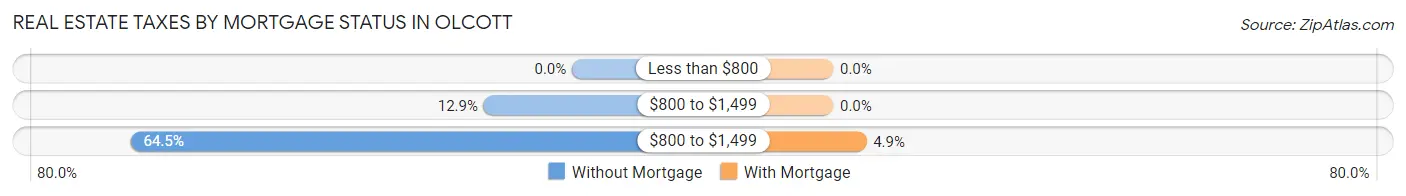
| Property Taxes | Without Mortgage | With Mortgage |
| Less than $800 | 0 (0.0%) | 0 (0.0%) |
| $800 to $1,499 | 28 (12.9%) | 0 (0.0%) |
| $800 to $1,499 | 140 (64.5%) | 10 (4.9%) |
| Total | 217 (100.0%) | 206 (100.0%) |
Health & Disability in Olcott
Health Insurance Coverage by Age in Olcott
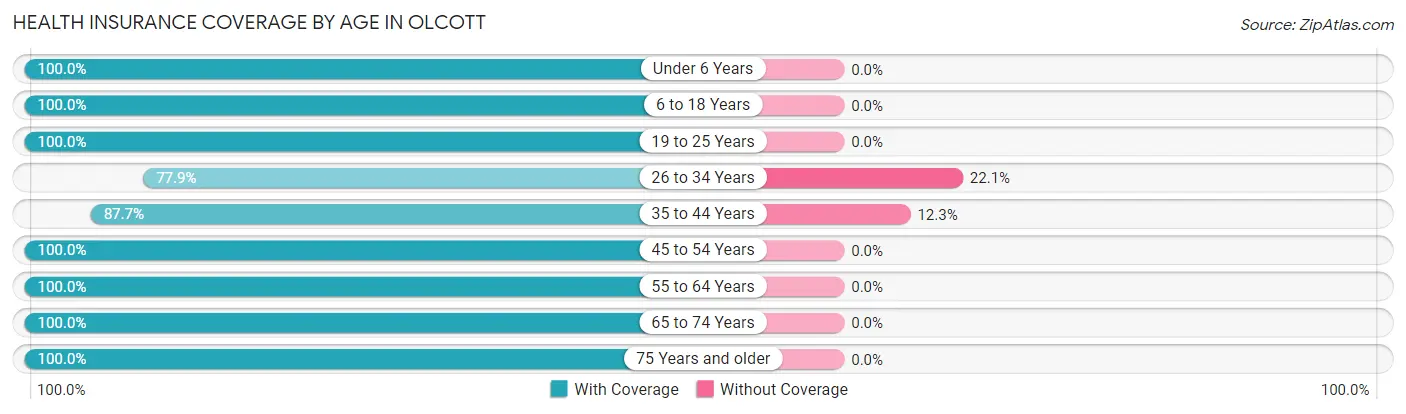
| Age Bracket | With Coverage | Without Coverage |
| Under 6 Years | 37 (100.0%) | 0 (0.0%) |
| 6 to 18 Years | 190 (100.0%) | 0 (0.0%) |
| 19 to 25 Years | 23 (100.0%) | 0 (0.0%) |
| 26 to 34 Years | 81 (77.9%) | 23 (22.1%) |
| 35 to 44 Years | 135 (87.7%) | 19 (12.3%) |
| 45 to 54 Years | 202 (100.0%) | 0 (0.0%) |
| 55 to 64 Years | 161 (100.0%) | 0 (0.0%) |
| 65 to 74 Years | 93 (100.0%) | 0 (0.0%) |
| 75 Years and older | 69 (100.0%) | 0 (0.0%) |
| Total | 991 (95.9%) | 42 (4.1%) |
Health Insurance Coverage by Citizenship Status in Olcott
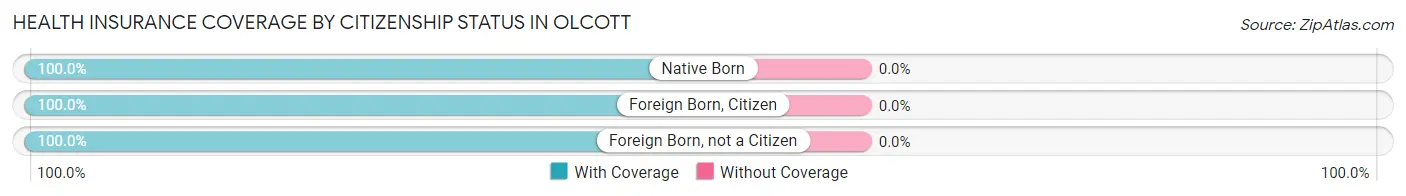
| Citizenship Status | With Coverage | Without Coverage |
| Native Born | 37 (100.0%) | 0 (0.0%) |
| Foreign Born, Citizen | 190 (100.0%) | 0 (0.0%) |
| Foreign Born, not a Citizen | 23 (100.0%) | 0 (0.0%) |
Health Insurance Coverage by Household Income in Olcott
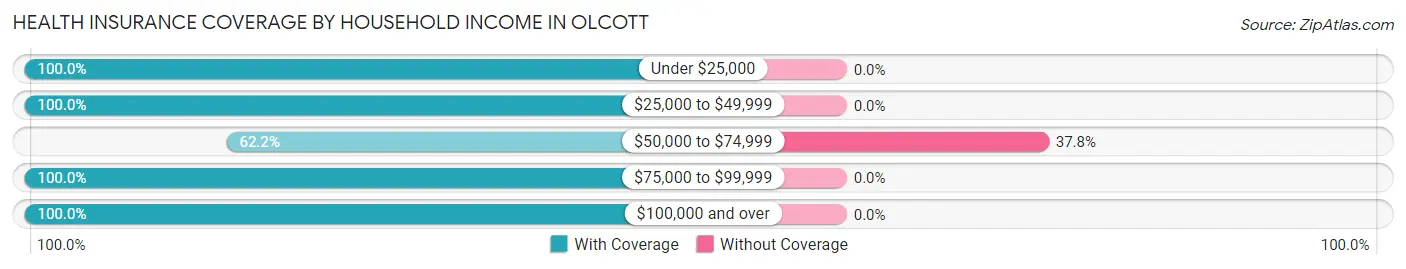
| Household Income | With Coverage | Without Coverage |
| Under $25,000 | 62 (100.0%) | 0 (0.0%) |
| $25,000 to $49,999 | 214 (100.0%) | 0 (0.0%) |
| $50,000 to $74,999 | 69 (62.2%) | 42 (37.8%) |
| $75,000 to $99,999 | 193 (100.0%) | 0 (0.0%) |
| $100,000 and over | 453 (100.0%) | 0 (0.0%) |
Public vs Private Health Insurance Coverage by Age in Olcott
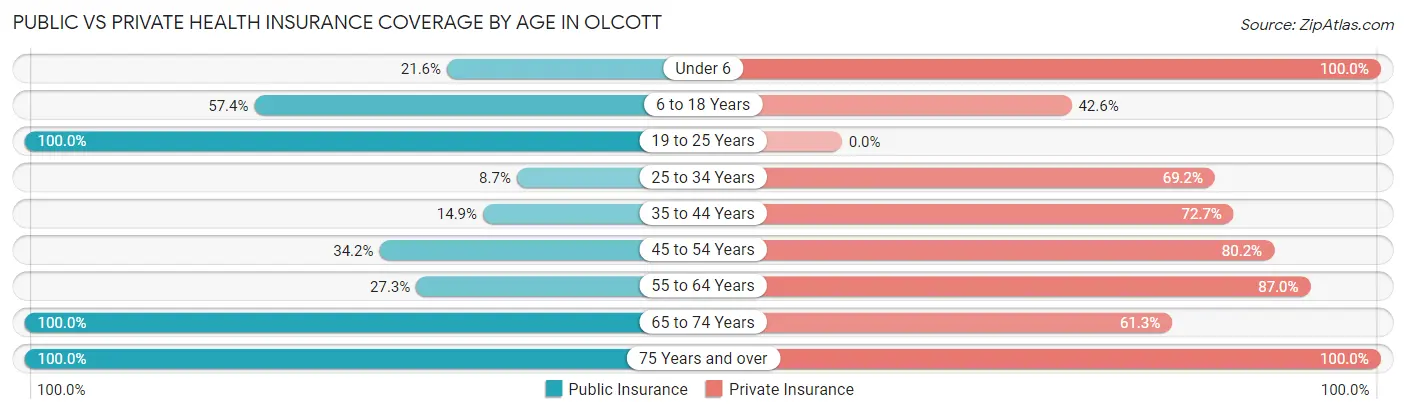
| Age Bracket | Public Insurance | Private Insurance |
| Under 6 | 8 (21.6%) | 37 (100.0%) |
| 6 to 18 Years | 109 (57.4%) | 81 (42.6%) |
| 19 to 25 Years | 23 (100.0%) | 0 (0.0%) |
| 25 to 34 Years | 9 (8.6%) | 72 (69.2%) |
| 35 to 44 Years | 23 (14.9%) | 112 (72.7%) |
| 45 to 54 Years | 69 (34.2%) | 162 (80.2%) |
| 55 to 64 Years | 44 (27.3%) | 140 (87.0%) |
| 65 to 74 Years | 93 (100.0%) | 57 (61.3%) |
| 75 Years and over | 69 (100.0%) | 69 (100.0%) |
| Total | 447 (43.3%) | 730 (70.7%) |
Disability Status by Sex by Age in Olcott
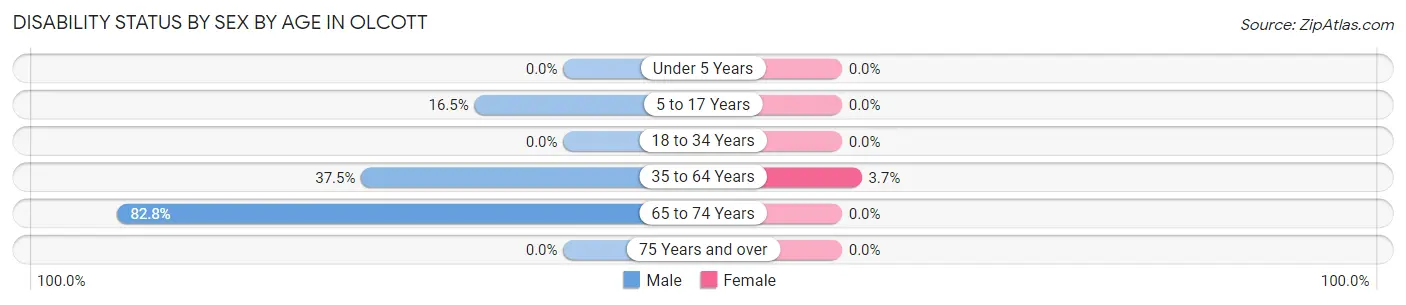
| Age Bracket | Male | Female |
| Under 5 Years | 0 (0.0%) | 0 (0.0%) |
| 5 to 17 Years | 16 (16.5%) | 0 (0.0%) |
| 18 to 34 Years | 0 (0.0%) | 0 (0.0%) |
| 35 to 64 Years | 81 (37.5%) | 11 (3.6%) |
| 65 to 74 Years | 24 (82.8%) | 0 (0.0%) |
| 75 Years and over | 0 (0.0%) | 0 (0.0%) |
Disability Class by Sex by Age in Olcott
Disability Class: Hearing Difficulty
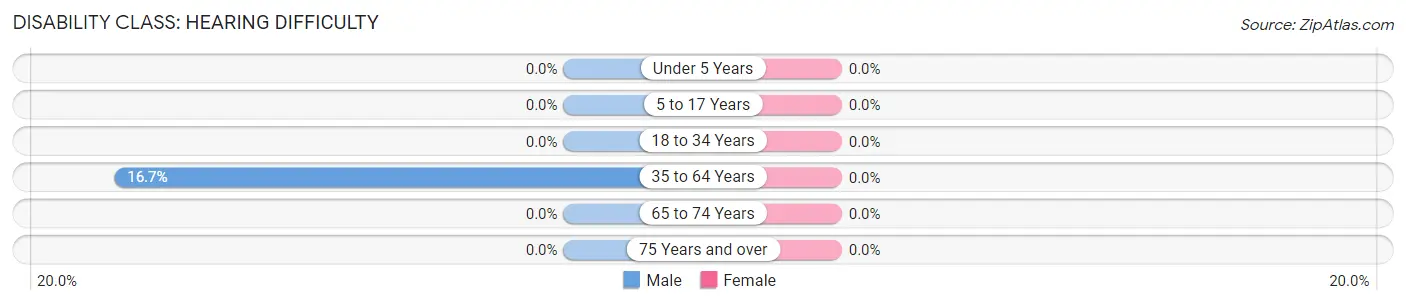
| Age Bracket | Male | Female |
| Under 5 Years | 0 (0.0%) | 0 (0.0%) |
| 5 to 17 Years | 0 (0.0%) | 0 (0.0%) |
| 18 to 34 Years | 0 (0.0%) | 0 (0.0%) |
| 35 to 64 Years | 36 (16.7%) | 0 (0.0%) |
| 65 to 74 Years | 0 (0.0%) | 0 (0.0%) |
| 75 Years and over | 0 (0.0%) | 0 (0.0%) |
Disability Class: Vision Difficulty
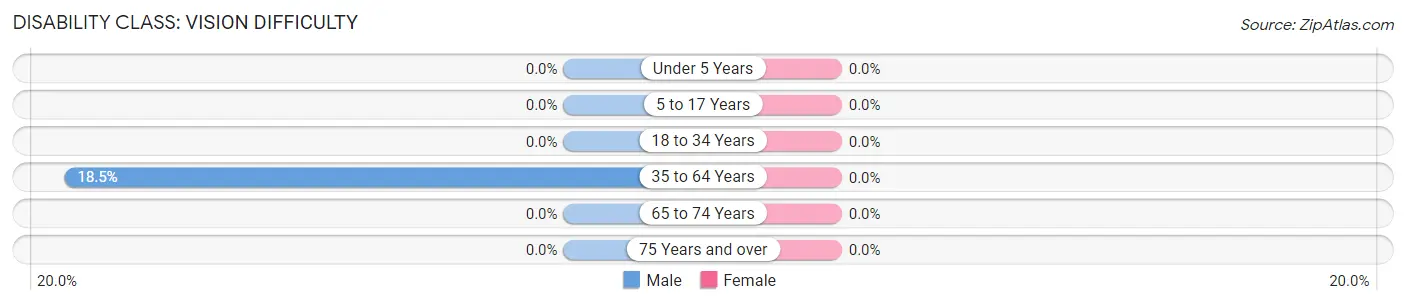
| Age Bracket | Male | Female |
| Under 5 Years | 0 (0.0%) | 0 (0.0%) |
| 5 to 17 Years | 0 (0.0%) | 0 (0.0%) |
| 18 to 34 Years | 0 (0.0%) | 0 (0.0%) |
| 35 to 64 Years | 40 (18.5%) | 0 (0.0%) |
| 65 to 74 Years | 0 (0.0%) | 0 (0.0%) |
| 75 Years and over | 0 (0.0%) | 0 (0.0%) |
Disability Class: Cognitive Difficulty
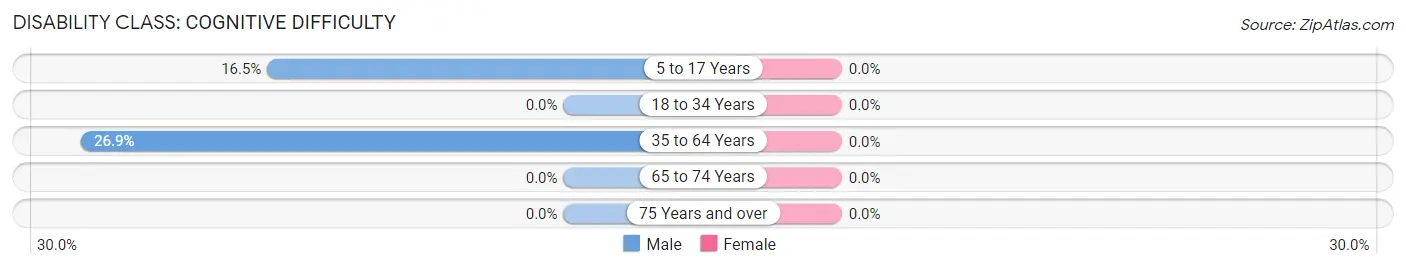
| Age Bracket | Male | Female |
| 5 to 17 Years | 16 (16.5%) | 0 (0.0%) |
| 18 to 34 Years | 0 (0.0%) | 0 (0.0%) |
| 35 to 64 Years | 58 (26.9%) | 0 (0.0%) |
| 65 to 74 Years | 0 (0.0%) | 0 (0.0%) |
| 75 Years and over | 0 (0.0%) | 0 (0.0%) |
Disability Class: Ambulatory Difficulty
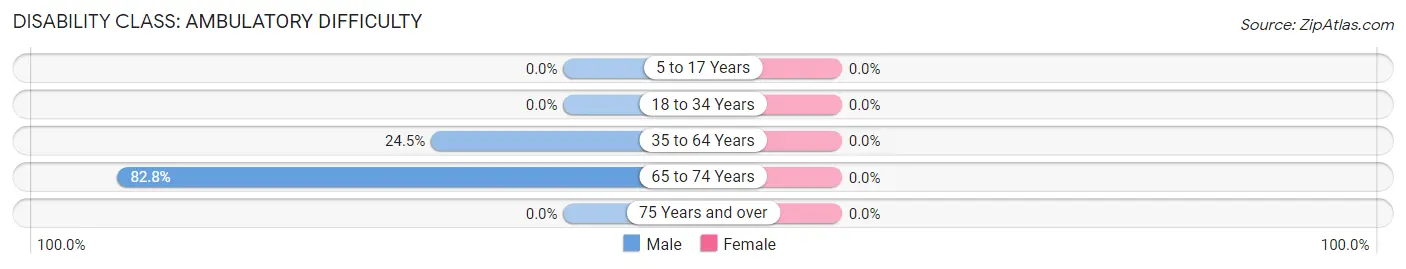
| Age Bracket | Male | Female |
| 5 to 17 Years | 0 (0.0%) | 0 (0.0%) |
| 18 to 34 Years | 0 (0.0%) | 0 (0.0%) |
| 35 to 64 Years | 53 (24.5%) | 0 (0.0%) |
| 65 to 74 Years | 24 (82.8%) | 0 (0.0%) |
| 75 Years and over | 0 (0.0%) | 0 (0.0%) |
Disability Class: Self-Care Difficulty
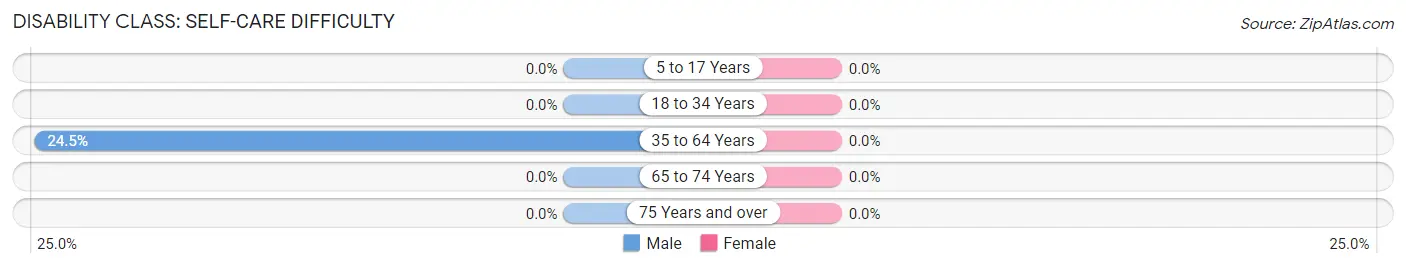
| Age Bracket | Male | Female |
| 5 to 17 Years | 0 (0.0%) | 0 (0.0%) |
| 18 to 34 Years | 0 (0.0%) | 0 (0.0%) |
| 35 to 64 Years | 53 (24.5%) | 0 (0.0%) |
| 65 to 74 Years | 0 (0.0%) | 0 (0.0%) |
| 75 Years and over | 0 (0.0%) | 0 (0.0%) |
Technology Access in Olcott
Computing Device Access in Olcott
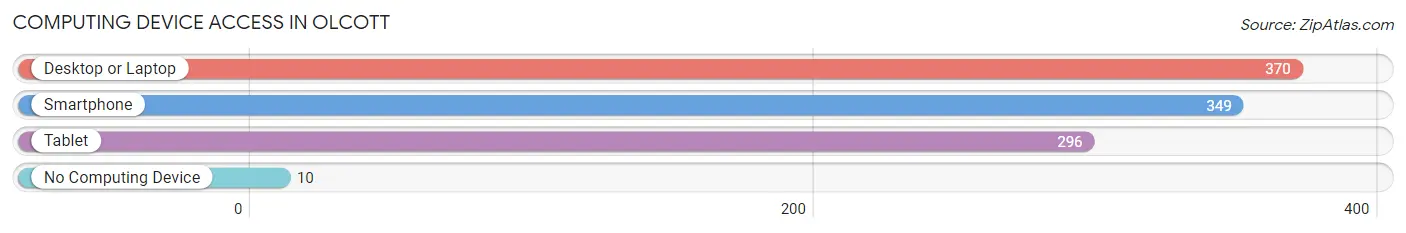
| Device Type | # Households | % Households |
| Desktop or Laptop | 370 | 77.1% |
| Smartphone | 349 | 72.7% |
| Tablet | 296 | 61.7% |
| No Computing Device | 10 | 2.1% |
| Total | 480 | 100.0% |
Internet Access in Olcott
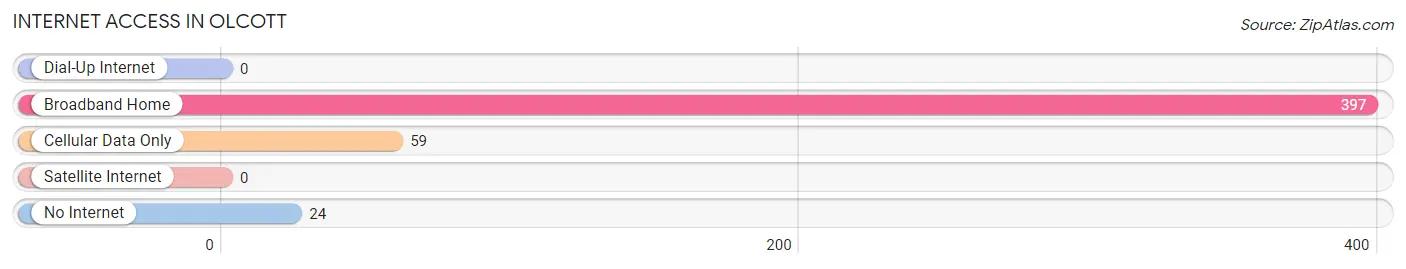
| Internet Type | # Households | % Households |
| Dial-Up Internet | 0 | 0.0% |
| Broadband Home | 397 | 82.7% |
| Cellular Data Only | 59 | 12.3% |
| Satellite Internet | 0 | 0.0% |
| No Internet | 24 | 5.0% |
| Total | 480 | 100.0% |
Olcott Summary
Olcott, NY is a small hamlet located in the town of Newfane in Niagara County, New York. It is situated on the shore of Lake Ontario, approximately 20 miles north of Buffalo. The hamlet is home to a population of approximately 1,000 people and is a popular destination for tourists and locals alike.
Geography
Olcott is located on the eastern shore of Lake Ontario, approximately 20 miles north of Buffalo. The hamlet is situated on a peninsula that juts out into the lake, providing stunning views of the lake and the surrounding area. The area is known for its sandy beaches, which are popular with swimmers, boaters, and fishermen. The hamlet is also home to a number of parks and recreational areas, including the Olcott Beach State Park, which offers camping, fishing, and swimming.
Economy
The economy of Olcott is largely based on tourism. The hamlet is home to a number of restaurants, bars, and shops that cater to visitors. The hamlet is also home to a number of marinas, which provide docking and storage for boats. The hamlet is also home to a number of small businesses, including a grocery store, a hardware store, and a pharmacy.
Demographics
As of the 2010 census, the population of Olcott was 1,000. The population is predominantly white (94.2%), with a small percentage of African Americans (2.2%) and Hispanics (2.2%). The median household income in Olcott is $45,000, which is slightly lower than the national average. The median age of the population is 44.
History
Olcott was first settled in the early 1800s by a group of settlers from Connecticut. The hamlet was originally known as “Newfane”, but was later renamed “Olcott” in honor of the first settler, John Olcott. The hamlet grew steadily throughout the 19th century, and by the early 20th century, it had become a popular tourist destination. The hamlet was home to a number of hotels, restaurants, and shops, and was a popular destination for fishing and boating.
In the late 20th century, the hamlet began to decline as tourism shifted to other areas. However, in recent years, the hamlet has seen a resurgence in popularity, as more people have begun to visit the area for its stunning views and recreational opportunities.
Today, Olcott is a popular destination for tourists and locals alike. The hamlet is home to a number of restaurants, bars, and shops, as well as a number of marinas and recreational areas. The hamlet is also home to a number of small businesses, including a grocery store, a hardware store, and a pharmacy. The hamlet is also home to a number of parks and recreational areas, including the Olcott Beach State Park, which offers camping, fishing, and swimming.
Common Questions
What is Per Capita Income in Olcott?
Per Capita income in Olcott is $37,525.
What is the Median Family Income in Olcott?
Median Family Income in Olcott is $84,688.
What is the Median Household income in Olcott?
Median Household Income in Olcott is $70,606.
What is Income or Wage Gap in Olcott?
Income or Wage Gap in Olcott is 1.9%.
Women in Olcott earn 98.1 cents for every dollar earned by a man.
What is Inequality or Gini Index in Olcott?
Inequality or Gini Index in Olcott is 0.36.
What is the Total Population of Olcott?
Total Population of Olcott is 1,041.
What is the Total Male Population of Olcott?
Total Male Population of Olcott is 511.
What is the Total Female Population of Olcott?
Total Female Population of Olcott is 530.
What is the Ratio of Males per 100 Females in Olcott?
There are 96.42 Males per 100 Females in Olcott.
What is the Ratio of Females per 100 Males in Olcott?
There are 103.72 Females per 100 Males in Olcott.
What is the Median Population Age in Olcott?
Median Population Age in Olcott is 47.1 Years.
What is the Average Family Size in Olcott
Average Family Size in Olcott is 3.0 People.
What is the Average Household Size in Olcott
Average Household Size in Olcott is 2.2 People.
How Large is the Labor Force in Olcott?
There are 635 People in the Labor Forcein in Olcott.
What is the Percentage of People in the Labor Force in Olcott?
71.5% of People are in the Labor Force in Olcott.
What is the Unemployment Rate in Olcott?
Unemployment Rate in Olcott is 8.8%.