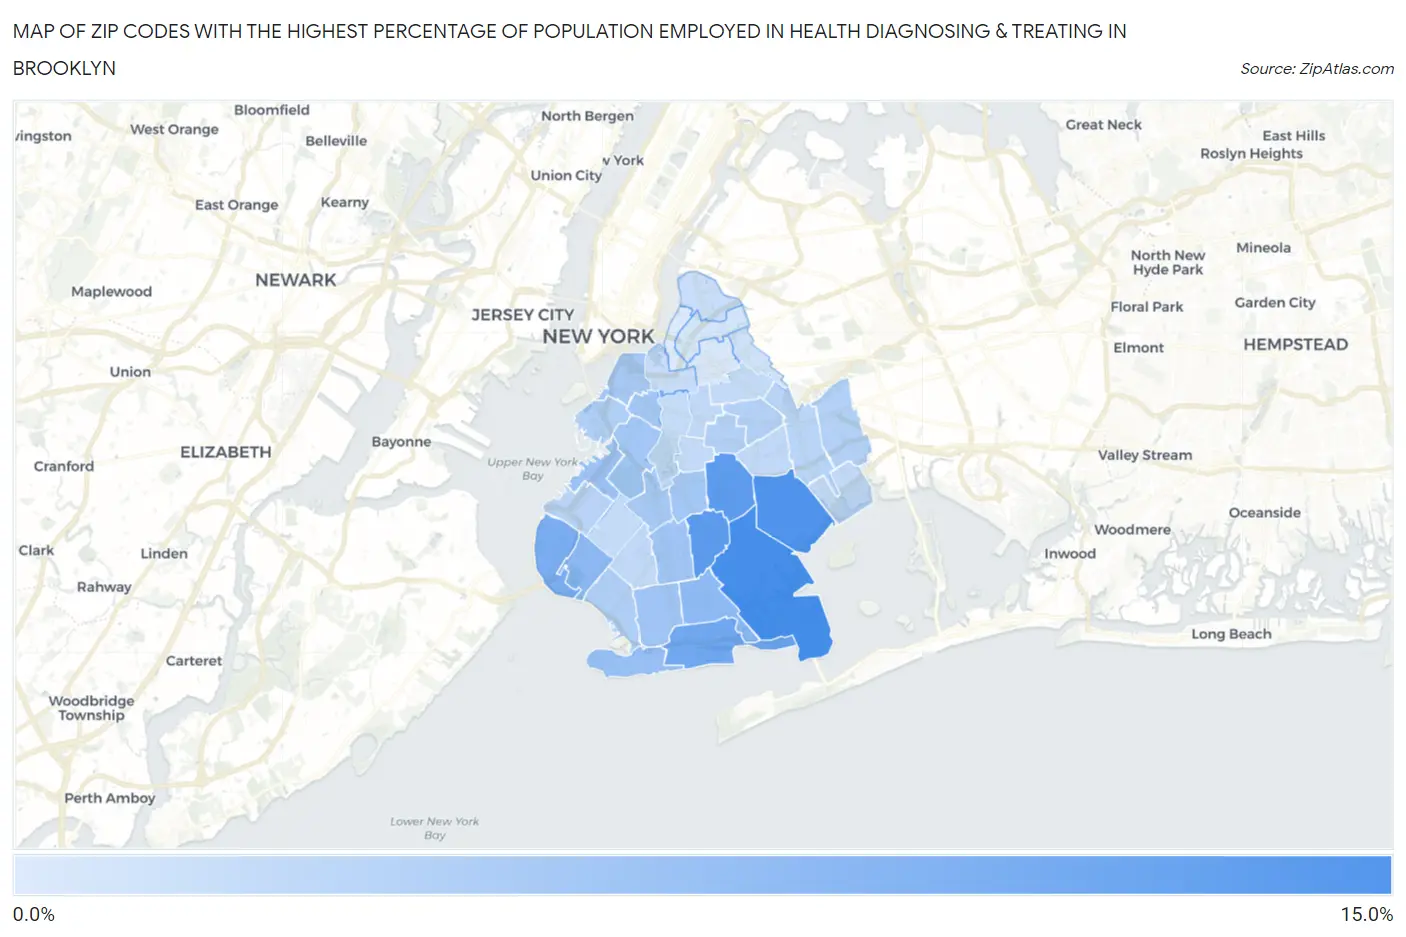
Zip Codes with the Highest Percentage of Population Employed in Health Diagnosing & Treating in Brooklyn, NY
RELATED REPORTS & OPTIONS
Health Diagnosing & Treating
Brooklyn
Compare Zip Codes
Map of Zip Codes with the Highest Percentage of Population Employed in Health Diagnosing & Treating in Brooklyn
2.2%
10.1%
Zip Codes with the Highest Percentage of Population Employed in Health Diagnosing & Treating in Brooklyn, NY
| Zip Code | % Employed | vs State | vs National | |
| 1. | 11234 | 10.1% | 6.6%(+3.54)#267 | 6.2%(+3.86)#3,749 |
| 2. | 11236 | 9.6% | 6.6%(+3.02)#311 | 6.2%(+3.34)#4,414 |
| 3. | 11210 | 9.1% | 6.6%(+2.55)#364 | 6.2%(+2.88)#5,145 |
| 4. | 11203 | 8.8% | 6.6%(+2.26)#400 | 6.2%(+2.59)#5,664 |
| 5. | 11235 | 7.8% | 6.6%(+1.26)#536 | 6.2%(+1.58)#7,929 |
| 6. | 11209 | 7.4% | 6.6%(+0.799)#608 | 6.2%(+1.13)#9,196 |
| 7. | 11228 | 6.3% | 6.6%(-0.236)#805 | 6.2%(+0.091)#12,628 |
| 8. | 11229 | 6.2% | 6.6%(-0.372)#843 | 6.2%(-0.045)#13,151 |
| 9. | 11224 | 5.8% | 6.6%(-0.754)#928 | 6.2%(-0.427)#14,532 |
| 10. | 11232 | 5.6% | 6.6%(-1.01)#983 | 6.2%(-0.682)#15,538 |
| 11. | 11230 | 5.3% | 6.6%(-1.31)#1,042 | 6.2%(-0.985)#16,715 |
| 12. | 11223 | 5.2% | 6.6%(-1.33)#1,044 | 6.2%(-1.00)#16,773 |
| 13. | 11215 | 5.2% | 6.6%(-1.35)#1,049 | 6.2%(-1.02)#16,856 |
| 14. | 11226 | 5.1% | 6.6%(-1.42)#1,061 | 6.2%(-1.10)#17,130 |
| 15. | 11217 | 5.1% | 6.6%(-1.45)#1,070 | 6.2%(-1.12)#17,234 |
| 16. | 11201 | 5.0% | 6.6%(-1.53)#1,083 | 6.2%(-1.20)#17,518 |
| 17. | 11218 | 5.0% | 6.6%(-1.54)#1,085 | 6.2%(-1.21)#17,563 |
| 18. | 11231 | 4.4% | 6.6%(-2.13)#1,187 | 6.2%(-1.80)#19,844 |
| 19. | 11214 | 4.4% | 6.6%(-2.16)#1,193 | 6.2%(-1.84)#19,967 |
| 20. | 11213 | 4.4% | 6.6%(-2.22)#1,204 | 6.2%(-1.89)#20,156 |
| 21. | 11208 | 4.3% | 6.6%(-2.29)#1,217 | 6.2%(-1.96)#20,404 |
| 22. | 11233 | 4.3% | 6.6%(-2.31)#1,221 | 6.2%(-1.98)#20,476 |
| 23. | 11220 | 4.1% | 6.6%(-2.50)#1,255 | 6.2%(-2.17)#21,122 |
| 24. | 11207 | 3.9% | 6.6%(-2.66)#1,283 | 6.2%(-2.33)#21,628 |
| 25. | 11216 | 3.6% | 6.6%(-2.92)#1,317 | 6.2%(-2.60)#22,465 |
| 26. | 11239 | 3.6% | 6.6%(-2.95)#1,319 | 6.2%(-2.62)#22,548 |
| 27. | 11212 | 3.6% | 6.6%(-2.99)#1,323 | 6.2%(-2.66)#22,655 |
| 28. | 11204 | 3.6% | 6.6%(-2.99)#1,326 | 6.2%(-2.67)#22,681 |
| 29. | 11225 | 3.5% | 6.6%(-3.07)#1,336 | 6.2%(-2.74)#22,909 |
| 30. | 11221 | 3.5% | 6.6%(-3.07)#1,337 | 6.2%(-2.74)#22,910 |
| 31. | 11219 | 3.4% | 6.6%(-3.21)#1,350 | 6.2%(-2.88)#23,290 |
| 32. | 11238 | 3.4% | 6.6%(-3.22)#1,351 | 6.2%(-2.89)#23,317 |
| 33. | 11222 | 3.3% | 6.6%(-3.28)#1,361 | 6.2%(-2.95)#23,496 |
| 34. | 11205 | 3.3% | 6.6%(-3.30)#1,363 | 6.2%(-2.97)#23,551 |
| 35. | 11237 | 2.9% | 6.6%(-3.69)#1,426 | 6.2%(-3.36)#24,631 |
| 36. | 11211 | 2.6% | 6.6%(-3.96)#1,448 | 6.2%(-3.64)#25,245 |
| 37. | 11206 | 2.4% | 6.6%(-4.20)#1,466 | 6.2%(-3.87)#25,783 |
| 38. | 11249 | 2.2% | 6.6%(-4.38)#1,482 | 6.2%(-4.06)#26,136 |
1
Common Questions
What are the Top 10 Zip Codes with the Highest Percentage of Population Employed in Health Diagnosing & Treating in Brooklyn, NY?
Top 10 Zip Codes with the Highest Percentage of Population Employed in Health Diagnosing & Treating in Brooklyn, NY are:
What zip code has the Highest Percentage of Population Employed in Health Diagnosing & Treating in Brooklyn, NY?
11234 has the Highest Percentage of Population Employed in Health Diagnosing & Treating in Brooklyn, NY with 10.1%.
What is the Percentage of Population Employed in Health Diagnosing & Treating in New York?
Percentage of Population Employed in Health Diagnosing & Treating in New York is 6.6%.
What is the Percentage of Population Employed in Health Diagnosing & Treating in the United States?
Percentage of Population Employed in Health Diagnosing & Treating in the United States is 6.2%.