East Avon, NY Map & Demographics
East Avon Map
East Avon Overview
$28,768
PER CAPITA INCOME
$105,156
AVG FAMILY INCOME
$105,078
AVG HOUSEHOLD INCOME
9.8%
WAGE / INCOME GAP [ % ]
90.2¢/ $1
WAGE / INCOME GAP [ $ ]
0.24
INEQUALITY / GINI INDEX
568
TOTAL POPULATION
291
MALE POPULATION
277
FEMALE POPULATION
105.05
MALES / 100 FEMALES
95.19
FEMALES / 100 MALES
34.4
MEDIAN AGE
3.4
AVG FAMILY SIZE
3.2
AVG HOUSEHOLD SIZE
291
LABOR FORCE [ PEOPLE ]
79.5%
PERCENT IN LABOR FORCE
6.2%
UNEMPLOYMENT RATE
Income in East Avon
Income Overview in East Avon
Per Capita Income in East Avon is $28,768, while median incomes of families and households are $105,156 and $105,078 respectively.
| Characteristic | Number | Measure |
| Per Capita Income | 568 | $28,768 |
| Median Family Income | 136 | $105,156 |
| Mean Family Income | 136 | $101,773 |
| Median Household Income | 177 | $105,078 |
| Mean Household Income | 177 | $91,144 |
| Income Deficit | 136 | $0 |
| Wage / Income Gap (%) | 568 | 9.84% |
| Wage / Income Gap ($) | 568 | 90.16¢ per $1 |
| Gini / Inequality Index | 568 | 0.24 |
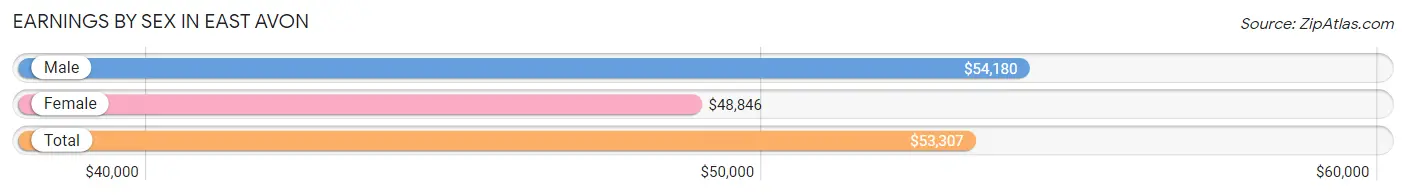
Earnings by Sex in East Avon
Average Earnings in East Avon are $53,307, $54,180 for men and $48,846 for women, a difference of 9.8%.
| Sex | Number | Average Earnings |
| Male | 167 (54.7%) | $54,180 |
| Female | 138 (45.3%) | $48,846 |
| Total | 305 (100.0%) | $53,307 |
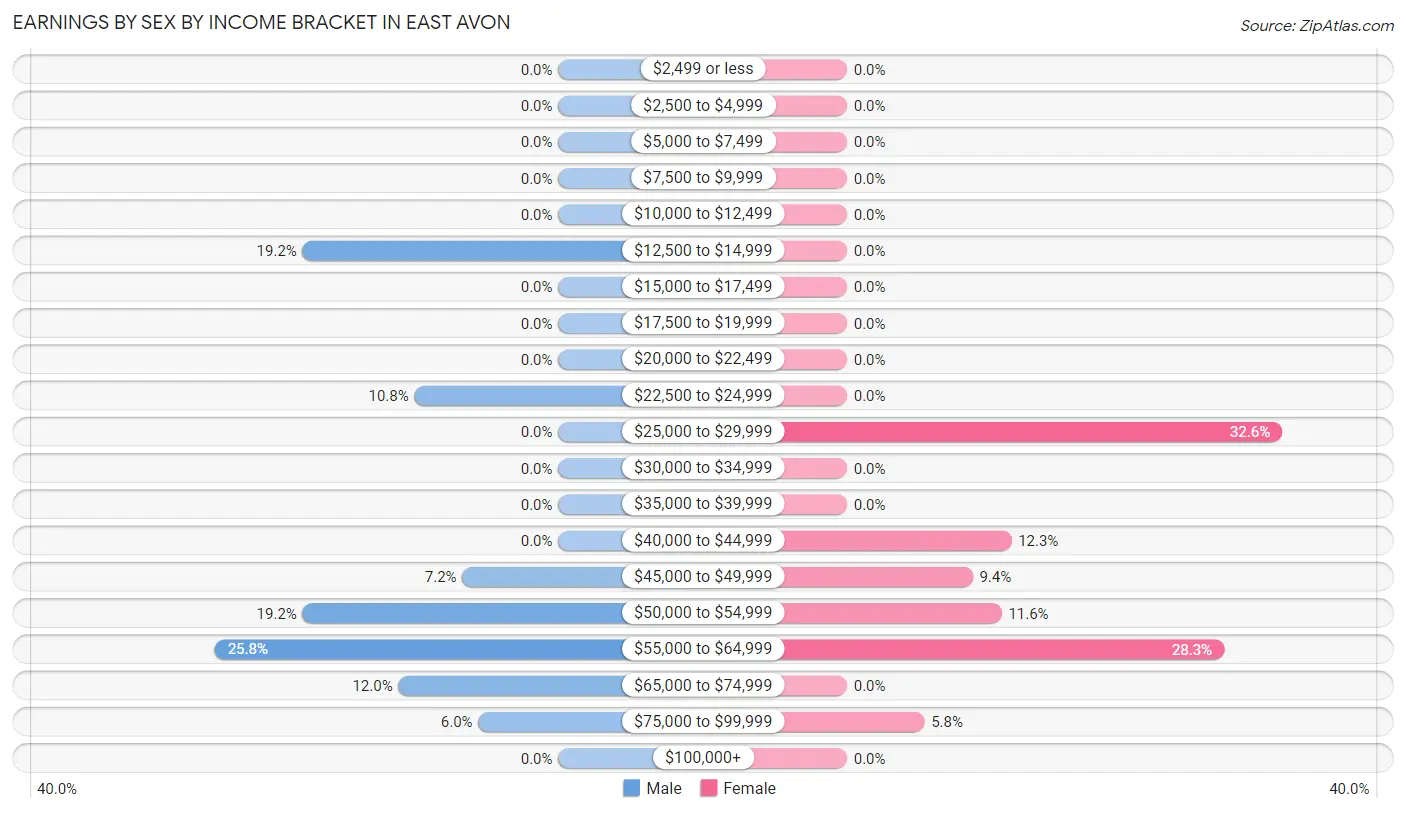
Earnings by Sex by Income Bracket in East Avon
The most common earnings brackets in East Avon are $55,000 to $64,999 for men (43 | 25.8%) and $25,000 to $29,999 for women (45 | 32.6%).
| Income | Male | Female |
| $2,499 or less | 0 (0.0%) | 0 (0.0%) |
| $2,500 to $4,999 | 0 (0.0%) | 0 (0.0%) |
| $5,000 to $7,499 | 0 (0.0%) | 0 (0.0%) |
| $7,500 to $9,999 | 0 (0.0%) | 0 (0.0%) |
| $10,000 to $12,499 | 0 (0.0%) | 0 (0.0%) |
| $12,500 to $14,999 | 32 (19.2%) | 0 (0.0%) |
| $15,000 to $17,499 | 0 (0.0%) | 0 (0.0%) |
| $17,500 to $19,999 | 0 (0.0%) | 0 (0.0%) |
| $20,000 to $22,499 | 0 (0.0%) | 0 (0.0%) |
| $22,500 to $24,999 | 18 (10.8%) | 0 (0.0%) |
| $25,000 to $29,999 | 0 (0.0%) | 45 (32.6%) |
| $30,000 to $34,999 | 0 (0.0%) | 0 (0.0%) |
| $35,000 to $39,999 | 0 (0.0%) | 0 (0.0%) |
| $40,000 to $44,999 | 0 (0.0%) | 17 (12.3%) |
| $45,000 to $49,999 | 12 (7.2%) | 13 (9.4%) |
| $50,000 to $54,999 | 32 (19.2%) | 16 (11.6%) |
| $55,000 to $64,999 | 43 (25.8%) | 39 (28.3%) |
| $65,000 to $74,999 | 20 (12.0%) | 0 (0.0%) |
| $75,000 to $99,999 | 10 (6.0%) | 8 (5.8%) |
| $100,000+ | 0 (0.0%) | 0 (0.0%) |
| Total | 167 (100.0%) | 138 (100.0%) |
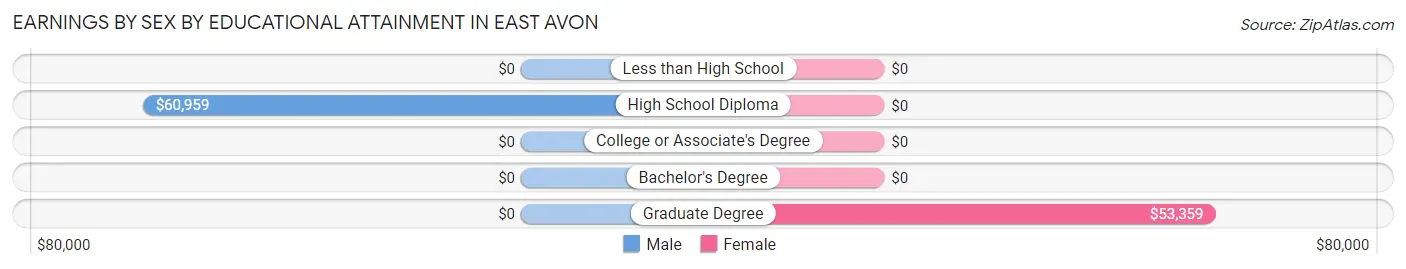
Earnings by Sex by Educational Attainment in East Avon
Average earnings in East Avon are $54,727 for men and $55,032 for women, a difference of 0.5%. Men with an educational attainment of high school diploma enjoy the highest average annual earnings of $60,959, while those with high school diploma education earn the least with $60,959. Women with an educational attainment of graduate degree earn the most with the average annual earnings of $53,359, while those with graduate degree education have the smallest earnings of $53,359.
| Educational Attainment | Male Income | Female Income |
| Less than High School | - | - |
| High School Diploma | $60,959 | $0 |
| College or Associate's Degree | - | - |
| Bachelor's Degree | - | - |
| Graduate Degree | - | - |
| Total | $54,727 | $55,032 |
Family Income in East Avon
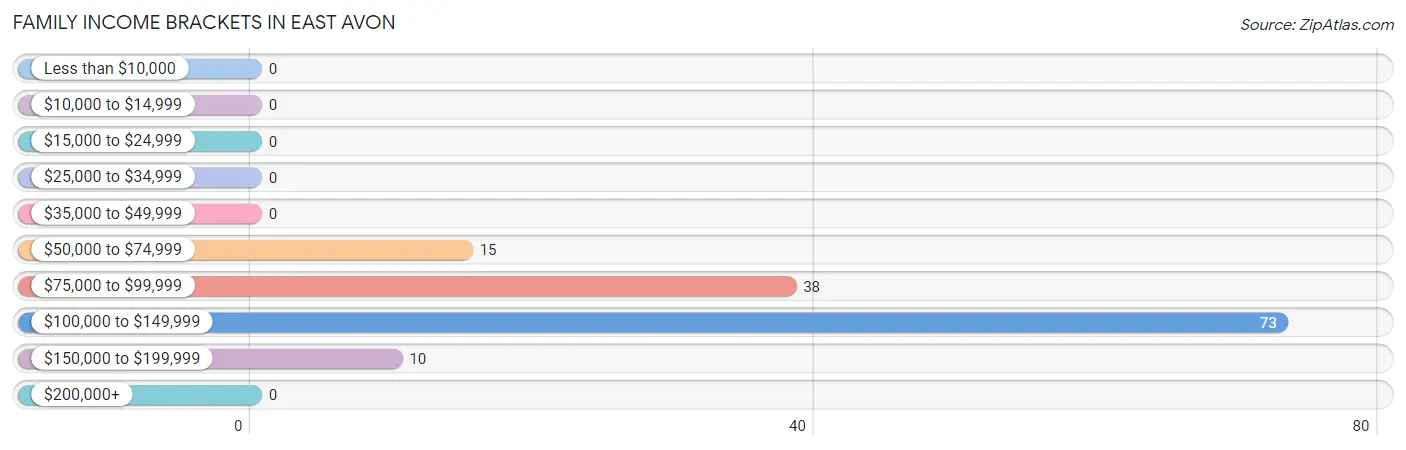
Family Income Brackets in East Avon
According to the East Avon family income data, there are 73 families falling into the $100,000 to $149,999 income range, which is the most common income bracket and makes up 53.7% of all families.
| Income Bracket | # Families | % Families |
| Less than $10,000 | 0 | 0.0% |
| $10,000 to $14,999 | 0 | 0.0% |
| $15,000 to $24,999 | 0 | 0.0% |
| $25,000 to $34,999 | 0 | 0.0% |
| $35,000 to $49,999 | 0 | 0.0% |
| $50,000 to $74,999 | 15 | 11.0% |
| $75,000 to $99,999 | 38 | 27.9% |
| $100,000 to $149,999 | 73 | 53.7% |
| $150,000 to $199,999 | 10 | 7.4% |
| $200,000+ | 0 | 0.0% |
Family Income by Famaliy Size in East Avon
| Income Bracket | # Families | Median Income |
| 2-Person Families | 33 (24.3%) | $0 |
| 3-Person Families | 20 (14.7%) | $0 |
| 4-Person Families | 59 (43.4%) | $0 |
| 5-Person Families | 24 (17.6%) | $0 |
| 6-Person Families | 0 (0.0%) | $0 |
| 7+ Person Families | 0 (0.0%) | $0 |
| Total | 136 (100.0%) | $105,156 |
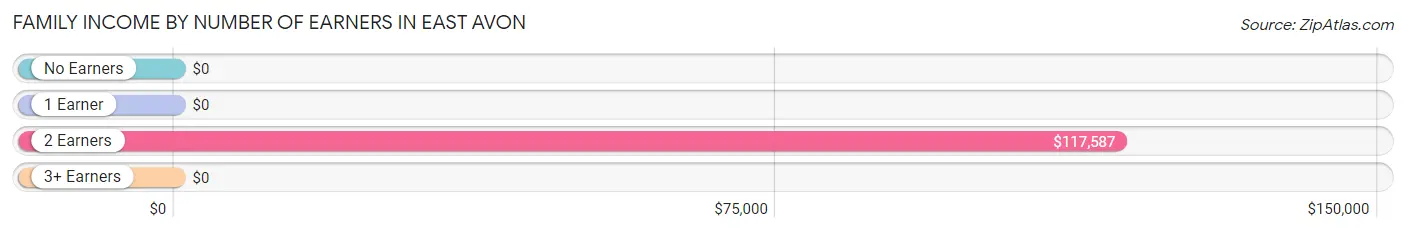
Family Income by Number of Earners in East Avon
| Number of Earners | # Families | Median Income |
| No Earners | 15 (11.0%) | $0 |
| 1 Earner | 18 (13.2%) | $0 |
| 2 Earners | 103 (75.7%) | $117,587 |
| 3+ Earners | 0 (0.0%) | $0 |
| Total | 136 (100.0%) | $105,156 |
Household Income in East Avon
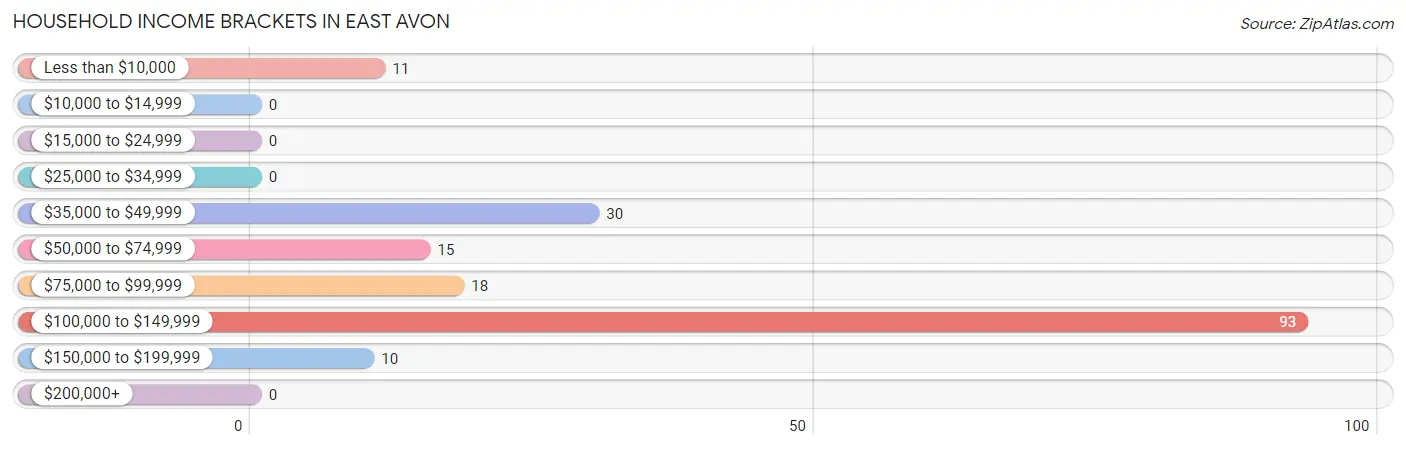
Household Income Brackets in East Avon
With 93 households falling in the category, the $100,000 to $149,999 income range is the most frequent in East Avon, accounting for 52.5% of all households.
| Income Bracket | # Households | % Households |
| Less than $10,000 | 11 | 6.2% |
| $10,000 to $14,999 | 0 | 0.0% |
| $15,000 to $24,999 | 0 | 0.0% |
| $25,000 to $34,999 | 0 | 0.0% |
| $35,000 to $49,999 | 30 | 16.9% |
| $50,000 to $74,999 | 15 | 8.5% |
| $75,000 to $99,999 | 18 | 10.2% |
| $100,000 to $149,999 | 93 | 52.5% |
| $150,000 to $199,999 | 10 | 5.6% |
| $200,000+ | 0 | 0.0% |
Household Income by Householder Age in East Avon
The median household income in East Avon is $105,078, with the highest median household income of $106,094 found in the 25 to 44 years age bracket for the primary householder. A total of 78 households (44.1%) fall into this category.
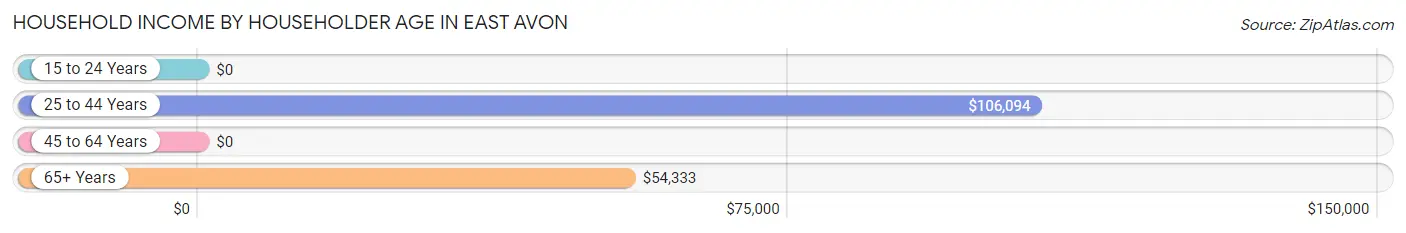
| Income Bracket | # Households | Median Income |
| 15 to 24 Years | 0 (0.0%) | $0 |
| 25 to 44 Years | 78 (44.1%) | $106,094 |
| 45 to 64 Years | 55 (31.1%) | $0 |
| 65+ Years | 44 (24.9%) | $54,333 |
| Total | 177 (100.0%) | $105,078 |
Poverty in East Avon
Income Below Poverty by Sex and Age in East Avon
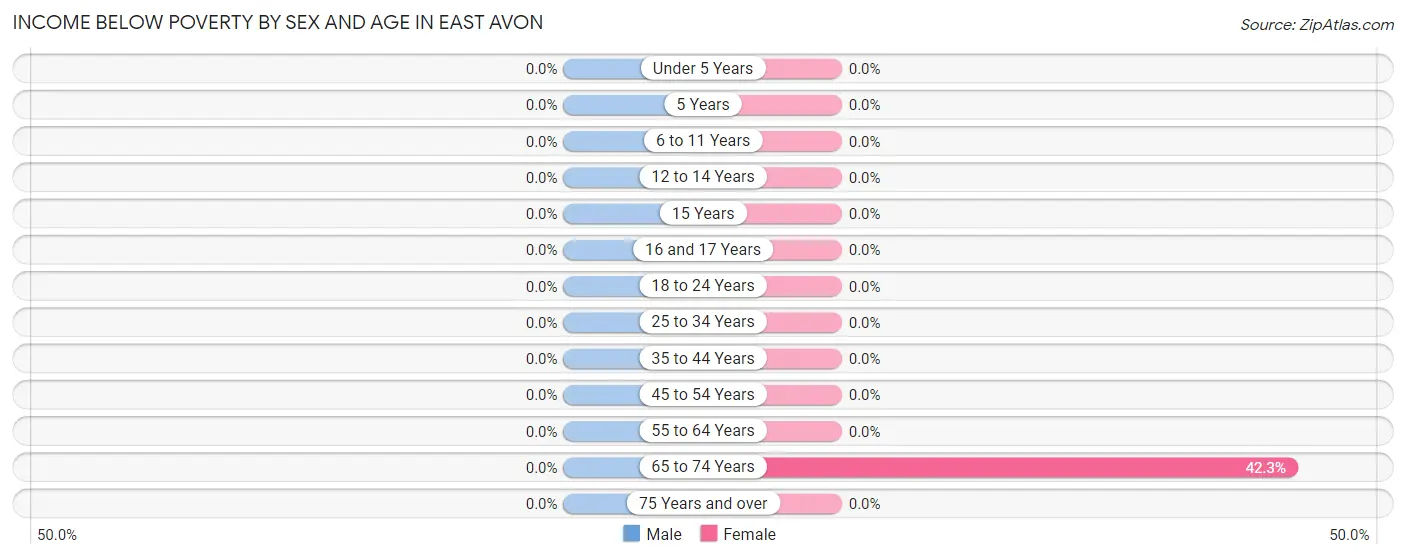
| Age Bracket | Male | Female |
| Under 5 Years | 0 (0.0%) | 0 (0.0%) |
| 5 Years | 0 (0.0%) | 0 (0.0%) |
| 6 to 11 Years | 0 (0.0%) | 0 (0.0%) |
| 12 to 14 Years | 0 (0.0%) | 0 (0.0%) |
| 15 Years | 0 (0.0%) | 0 (0.0%) |
| 16 and 17 Years | 0 (0.0%) | 0 (0.0%) |
| 18 to 24 Years | 0 (0.0%) | 0 (0.0%) |
| 25 to 34 Years | 0 (0.0%) | 0 (0.0%) |
| 35 to 44 Years | 0 (0.0%) | 0 (0.0%) |
| 45 to 54 Years | 0 (0.0%) | 0 (0.0%) |
| 55 to 64 Years | 0 (0.0%) | 0 (0.0%) |
| 65 to 74 Years | 0 (0.0%) | 11 (42.3%) |
| 75 Years and over | 0 (0.0%) | 0 (0.0%) |
| Total | 0 (0.0%) | 11 (4.0%) |
Income Above Poverty by Sex and Age in East Avon
According to the poverty statistics in East Avon, males aged under 5 years and females aged 5 years are the age groups that are most secure financially, with 100.0% of males and 100.0% of females in these age groups living above the poverty line.
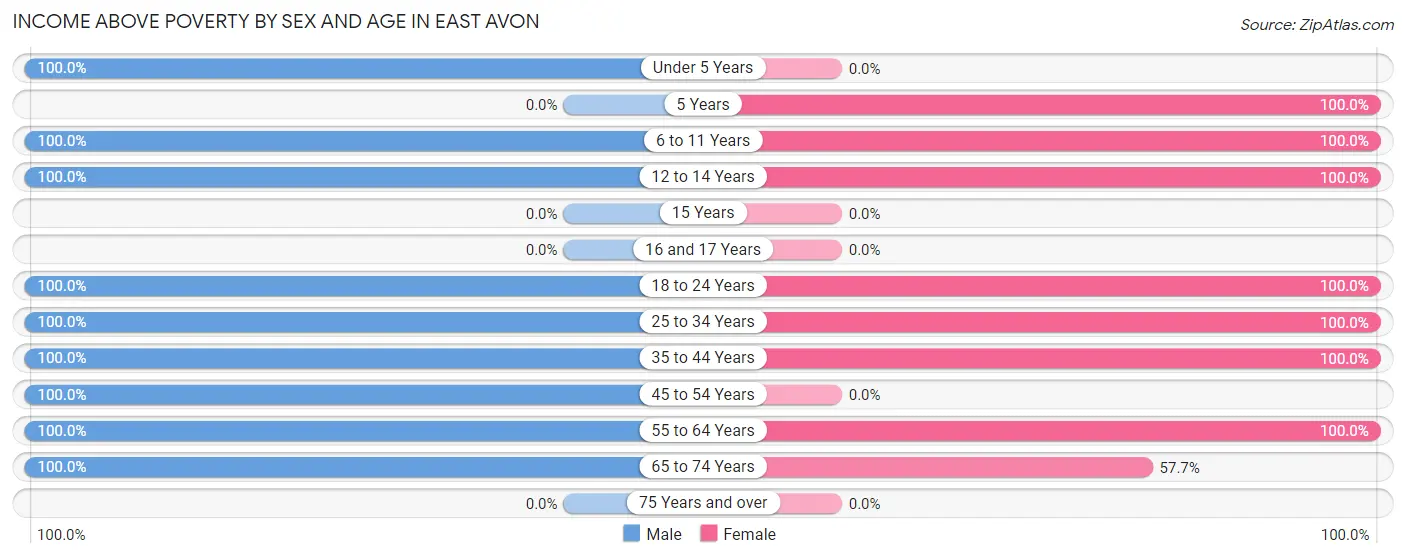
| Age Bracket | Male | Female |
| Under 5 Years | 15 (100.0%) | 0 (0.0%) |
| 5 Years | 0 (0.0%) | 12 (100.0%) |
| 6 to 11 Years | 83 (100.0%) | 49 (100.0%) |
| 12 to 14 Years | 9 (100.0%) | 34 (100.0%) |
| 15 Years | 0 (0.0%) | 0 (0.0%) |
| 16 and 17 Years | 0 (0.0%) | 0 (0.0%) |
| 18 to 24 Years | 14 (100.0%) | 45 (100.0%) |
| 25 to 34 Years | 18 (100.0%) | 13 (100.0%) |
| 35 to 44 Years | 62 (100.0%) | 80 (100.0%) |
| 45 to 54 Years | 55 (100.0%) | 0 (0.0%) |
| 55 to 64 Years | 17 (100.0%) | 18 (100.0%) |
| 65 to 74 Years | 18 (100.0%) | 15 (57.7%) |
| 75 Years and over | 0 (0.0%) | 0 (0.0%) |
| Total | 291 (100.0%) | 266 (96.0%) |
Income Below Poverty Among Married-Couple Families in East Avon
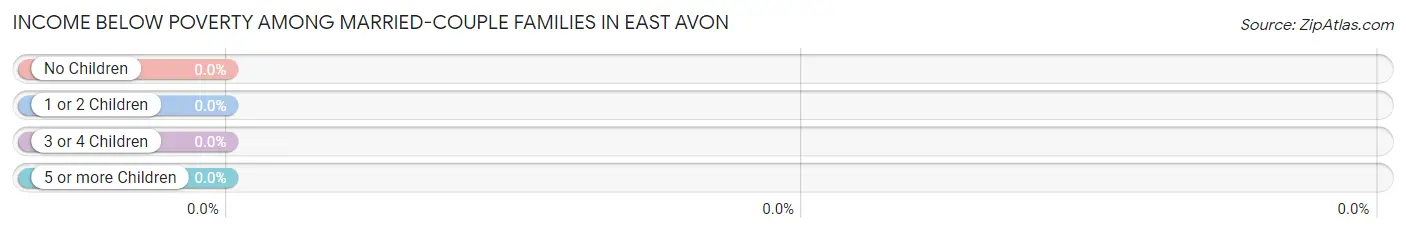
| Children | Above Poverty | Below Poverty |
| No Children | 33 (100.0%) | 0 (0.0%) |
| 1 or 2 Children | 59 (100.0%) | 0 (0.0%) |
| 3 or 4 Children | 24 (100.0%) | 0 (0.0%) |
| 5 or more Children | 0 (0.0%) | 0 (0.0%) |
| Total | 116 (100.0%) | 0 (0.0%) |
Income Below Poverty Among Single-Parent Households in East Avon
| Children | Single Father | Single Mother |
| No Children | 0 (0.0%) | 0 (0.0%) |
| 1 or 2 Children | 0 (0.0%) | 0 (0.0%) |
| 3 or 4 Children | 0 (0.0%) | 0 (0.0%) |
| 5 or more Children | 0 (0.0%) | 0 (0.0%) |
| Total | 0 (0.0%) | 0 (0.0%) |
Income Below Poverty Among Married-Couple vs Single-Parent Households in East Avon
| Children | Married-Couple Families | Single-Parent Households |
| No Children | 0 (0.0%) | 0 (0.0%) |
| 1 or 2 Children | 0 (0.0%) | 0 (0.0%) |
| 3 or 4 Children | 0 (0.0%) | 0 (0.0%) |
| 5 or more Children | 0 (0.0%) | 0 (0.0%) |
| Total | 0 (0.0%) | 0 (0.0%) |
Race in East Avon
The most populous races in East Avon are White / Caucasian (523 | 92.1%), and Two or more Races (45 | 7.9%).
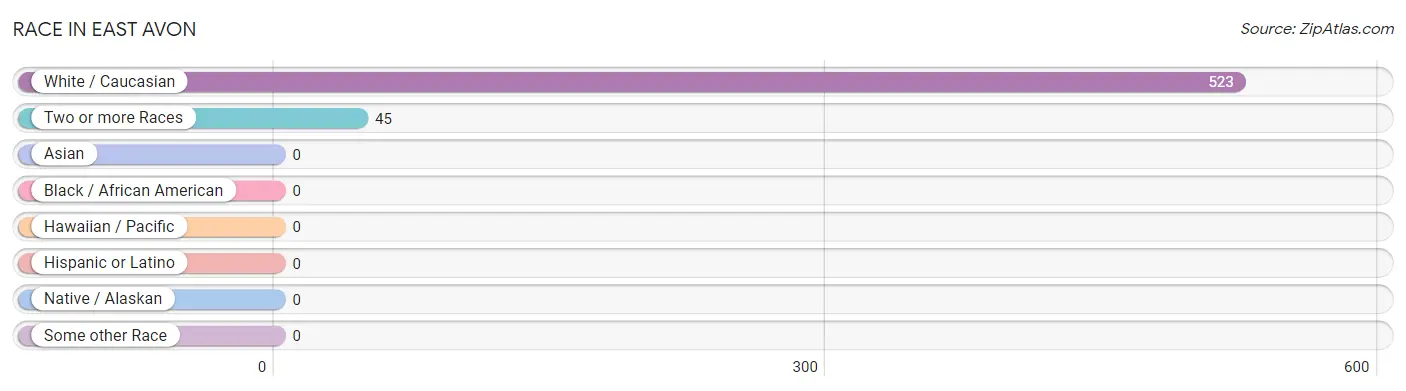
| Race | # Population | % Population |
| Asian | 0 | 0.0% |
| Black / African American | 0 | 0.0% |
| Hawaiian / Pacific | 0 | 0.0% |
| Hispanic or Latino | 0 | 0.0% |
| Native / Alaskan | 0 | 0.0% |
| White / Caucasian | 523 | 92.1% |
| Two or more Races | 45 | 7.9% |
| Some other Race | 0 | 0.0% |
| Total | 568 | 100.0% |
Ancestry in East Avon
The most populous ancestries reported in East Avon are German (324 | 57.0%), Irish (159 | 28.0%), Italian (132 | 23.2%), Norwegian (57 | 10.0%), and Korean (45 | 7.9%), together accounting for 126.2% of all East Avon residents.
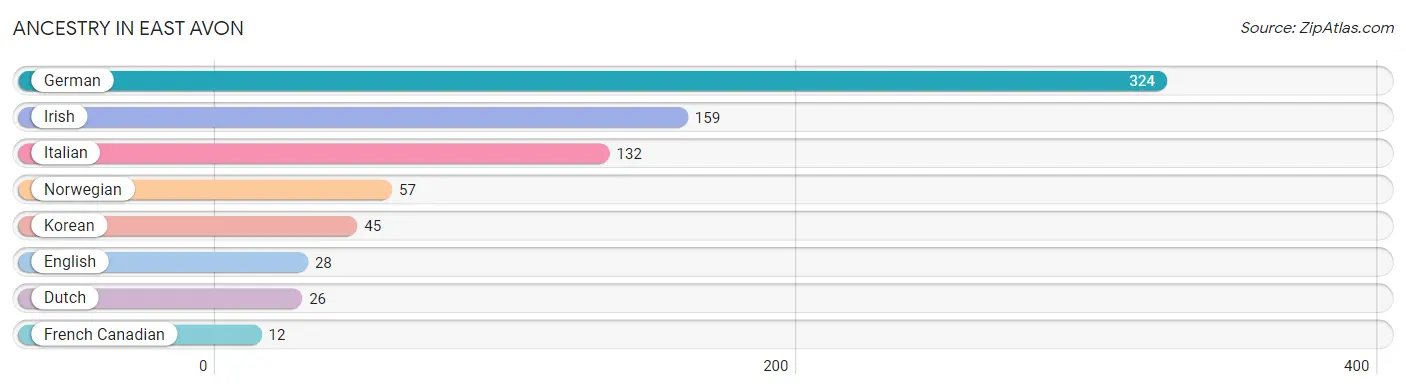
| Ancestry | # Population | % Population |
| Dutch | 26 | 4.6% |
| English | 28 | 4.9% |
| French Canadian | 12 | 2.1% |
| German | 324 | 57.0% |
| Irish | 159 | 28.0% |
| Italian | 132 | 23.2% |
| Korean | 45 | 7.9% |
| Norwegian | 57 | 10.0% | View All 8 Rows |
Immigrants in East Avon

| Immigration Origin | # Population | % Population | View All 0 Rows |
Sex and Age in East Avon
Sex and Age in East Avon
The most populous age groups in East Avon are 35 to 39 Years (62 | 21.3%) for men and 5 to 9 Years (52 | 18.8%) for women.
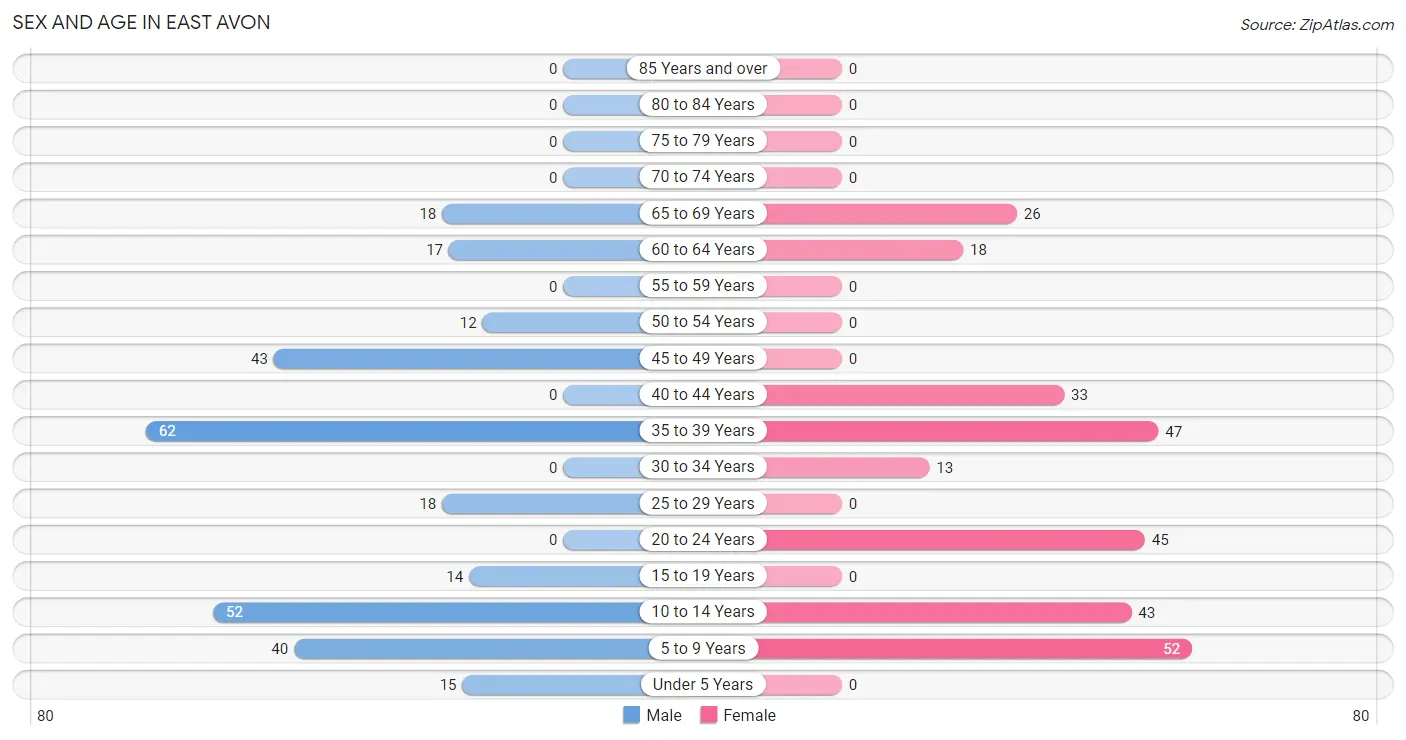
| Age Bracket | Male | Female |
| Under 5 Years | 15 (5.1%) | 0 (0.0%) |
| 5 to 9 Years | 40 (13.8%) | 52 (18.8%) |
| 10 to 14 Years | 52 (17.9%) | 43 (15.5%) |
| 15 to 19 Years | 14 (4.8%) | 0 (0.0%) |
| 20 to 24 Years | 0 (0.0%) | 45 (16.3%) |
| 25 to 29 Years | 18 (6.2%) | 0 (0.0%) |
| 30 to 34 Years | 0 (0.0%) | 13 (4.7%) |
| 35 to 39 Years | 62 (21.3%) | 47 (17.0%) |
| 40 to 44 Years | 0 (0.0%) | 33 (11.9%) |
| 45 to 49 Years | 43 (14.8%) | 0 (0.0%) |
| 50 to 54 Years | 12 (4.1%) | 0 (0.0%) |
| 55 to 59 Years | 0 (0.0%) | 0 (0.0%) |
| 60 to 64 Years | 17 (5.8%) | 18 (6.5%) |
| 65 to 69 Years | 18 (6.2%) | 26 (9.4%) |
| 70 to 74 Years | 0 (0.0%) | 0 (0.0%) |
| 75 to 79 Years | 0 (0.0%) | 0 (0.0%) |
| 80 to 84 Years | 0 (0.0%) | 0 (0.0%) |
| 85 Years and over | 0 (0.0%) | 0 (0.0%) |
| Total | 291 (100.0%) | 277 (100.0%) |
Families and Households in East Avon
Median Family Size in East Avon
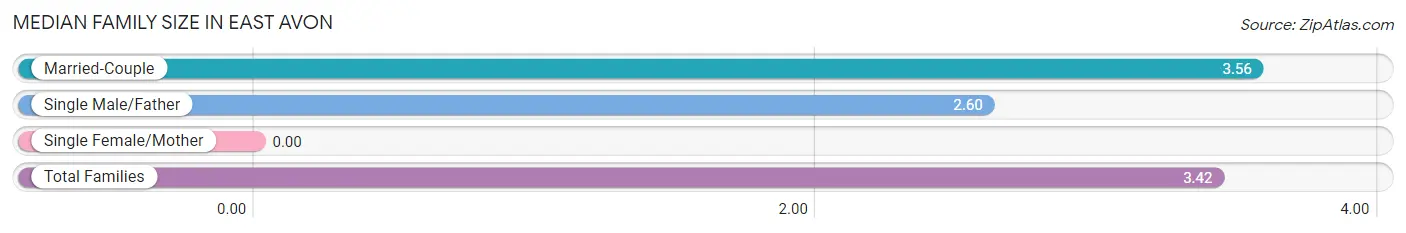
| Family Type | # Families | Family Size |
| Married-Couple | 116 (85.3%) | 3.56 |
| Single Male/Father | 20 (14.7%) | 2.60 |
| Single Female/Mother | 0 (0.0%) | - |
| Total Families | 136 (100.0%) | 3.42 |
Median Household Size in East Avon
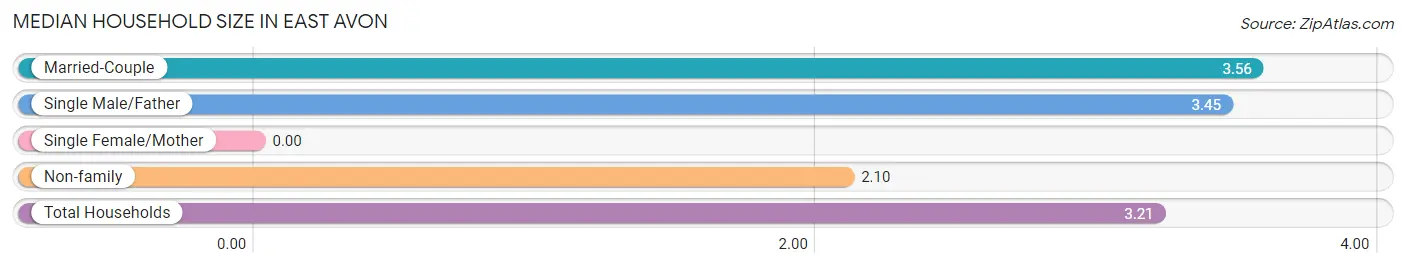
| Household Type | # Households | Household Size |
| Married-Couple | 116 (65.5%) | 3.56 |
| Single Male/Father | 20 (11.3%) | 3.45 |
| Single Female/Mother | 0 (0.0%) | - |
| Non-family | 41 (23.2%) | 2.10 |
| Total Households | 177 (100.0%) | 3.21 |
Household Size by Marriage Status in East Avon
Out of a total of 177 households in East Avon, 136 (76.8%) are family households, while 41 (23.2%) are nonfamily households. The most numerous type of family households are 4-person households, comprising 79, and the most common type of nonfamily households are 1-person households, comprising 23.
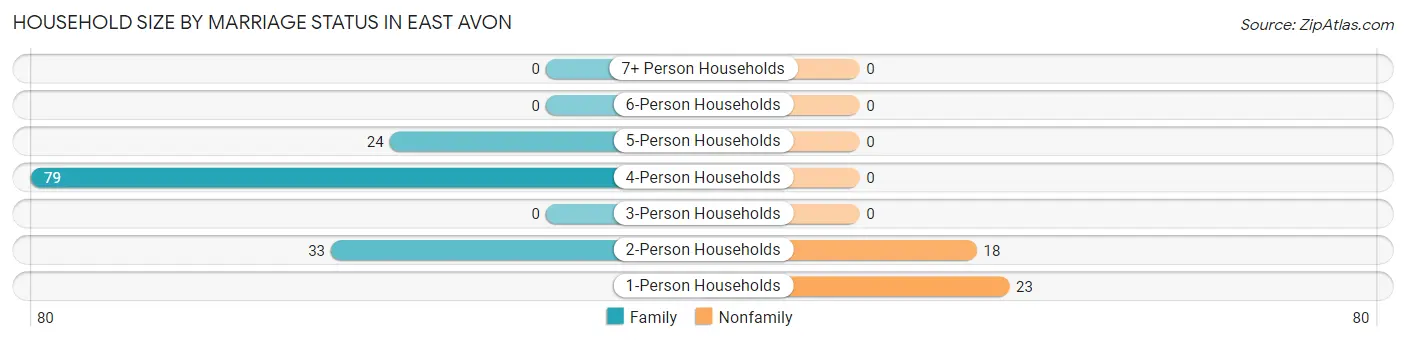
| Household Size | Family Households | Nonfamily Households |
| 1-Person Households | - | 23 (13.0%) |
| 2-Person Households | 33 (18.6%) | 18 (10.2%) |
| 3-Person Households | 0 (0.0%) | 0 (0.0%) |
| 4-Person Households | 79 (44.6%) | 0 (0.0%) |
| 5-Person Households | 24 (13.6%) | 0 (0.0%) |
| 6-Person Households | 0 (0.0%) | 0 (0.0%) |
| 7+ Person Households | 0 (0.0%) | 0 (0.0%) |
| Total | 136 (76.8%) | 41 (23.2%) |
Female Fertility in East Avon
Fertility by Age in East Avon
| Age Bracket | Women with Births | Births / 1,000 Women |
| 15 to 19 years | 0 (0.0%) | 0.0 |
| 20 to 34 years | 0 (0.0%) | 0.0 |
| 35 to 50 years | 0 (0.0%) | 0.0 |
| Total | 0 (0.0%) | 0.0 |
Fertility by Age by Marriage Status in East Avon
| Age Bracket | Married | Unmarried |
| 15 to 19 years | 0 (0.0%) | 0 (0.0%) |
| 20 to 34 years | 0 (0.0%) | 0 (0.0%) |
| 35 to 50 years | 0 (0.0%) | 0 (0.0%) |
| Total | 0 (0.0%) | 0 (0.0%) |
Fertility by Education in East Avon
| Educational Attainment | Women with Births | Births / 1,000 Women |
| Less than High School | 0 (0.0%) | 0.0 |
| High School Diploma | 0 (0.0%) | 0.0 |
| College or Associate's Degree | 0 (0.0%) | 0.0 |
| Bachelor's Degree | 0 (0.0%) | 0.0 |
| Graduate Degree | 0 (0.0%) | 0.0 |
| Total | 0 (0.0%) | 0.0 |
Fertility by Education by Marriage Status in East Avon
| Educational Attainment | Married | Unmarried |
| Less than High School | 0 (0.0%) | 0 (0.0%) |
| High School Diploma | 0 (0.0%) | 0 (0.0%) |
| College or Associate's Degree | 0 (0.0%) | 0 (0.0%) |
| Bachelor's Degree | 0 (0.0%) | 0 (0.0%) |
| Graduate Degree | 0 (0.0%) | 0 (0.0%) |
| Total | 0 (0.0%) | 0 (0.0%) |
Employment Characteristics in East Avon
Employment by Class of Employer in East Avon
Among the 273 employed individuals in East Avon, private company employees (114 | 41.8%), state government employees (53 | 19.4%), and federal government employees (45 | 16.5%) make up the most common classes of employment.
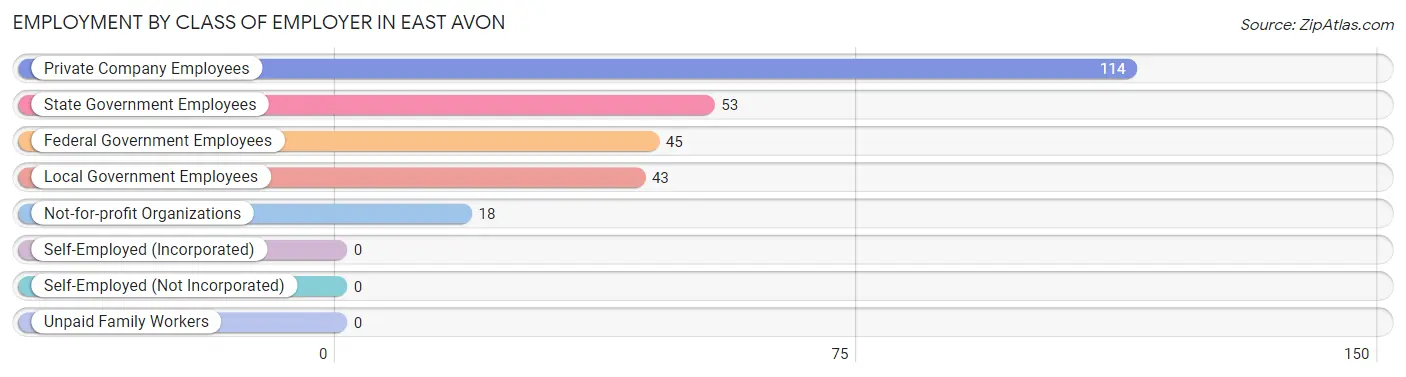
| Employer Class | # Employees | % Employees |
| Private Company Employees | 114 | 41.8% |
| Self-Employed (Incorporated) | 0 | 0.0% |
| Self-Employed (Not Incorporated) | 0 | 0.0% |
| Not-for-profit Organizations | 18 | 6.6% |
| Local Government Employees | 43 | 15.8% |
| State Government Employees | 53 | 19.4% |
| Federal Government Employees | 45 | 16.5% |
| Unpaid Family Workers | 0 | 0.0% |
| Total | 273 | 100.0% |
Employment Status by Age in East Avon
According to the labor force statistics for East Avon, out of the total population over 16 years of age (366), 79.5% or 291 individuals are in the labor force, with 6.2% or 18 of them unemployed. The age group with the highest labor force participation rate is 20 to 24 years, with 100.0% or 45 individuals in the labor force. Within the labor force, the 25 to 29 years age range has the highest percentage of unemployed individuals, with 100.0% or 18 of them being unemployed.
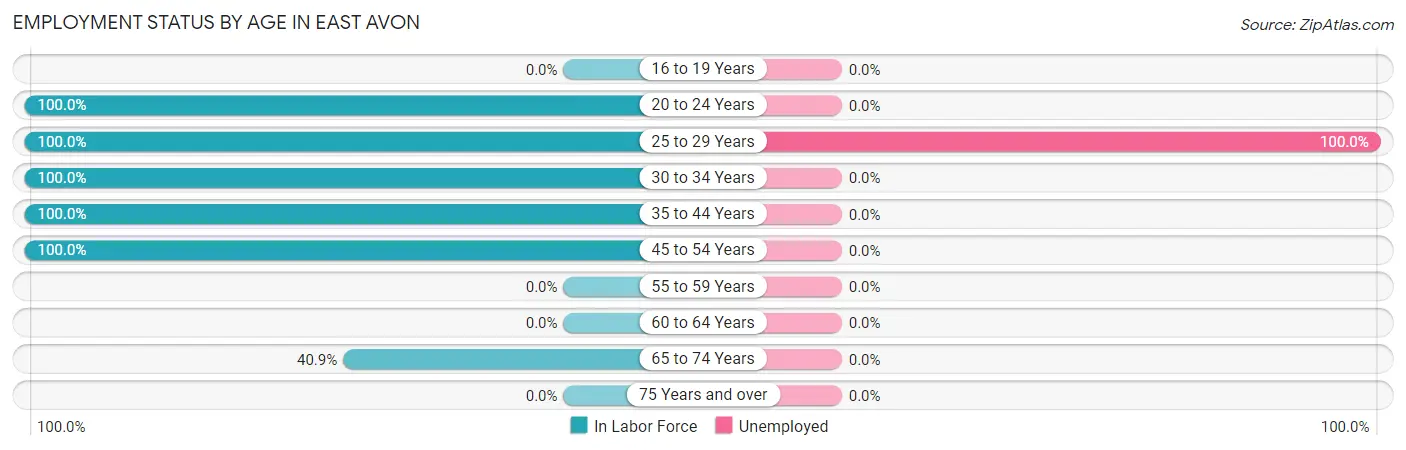
| Age Bracket | In Labor Force | Unemployed |
| 16 to 19 Years | 0 (0.0%) | 0 (0.0%) |
| 20 to 24 Years | 45 (100.0%) | 0 (0.0%) |
| 25 to 29 Years | 18 (100.0%) | 18 (100.0%) |
| 30 to 34 Years | 13 (100.0%) | 0 (0.0%) |
| 35 to 44 Years | 142 (100.0%) | 0 (0.0%) |
| 45 to 54 Years | 55 (100.0%) | 0 (0.0%) |
| 55 to 59 Years | 0 (0.0%) | 0 (0.0%) |
| 60 to 64 Years | 0 (0.0%) | 0 (0.0%) |
| 65 to 74 Years | 18 (40.9%) | 0 (0.0%) |
| 75 Years and over | 0 (0.0%) | 0 (0.0%) |
| Total | 291 (79.5%) | 18 (6.2%) |
Employment Status by Educational Attainment in East Avon
According to labor force statistics for East Avon, 86.7% of individuals (228) out of the total population between 25 and 64 years of age (263) are in the labor force, with 7.9% or 18 of them being unemployed. The group with the highest labor force participation rate are those with the educational attainment of bachelor's degree or higher, with 100.0% or 61 individuals in the labor force. Within the labor force, individuals with college / associate degree education have the highest percentage of unemployment, with 24.0% or 18 of them being unemployed.
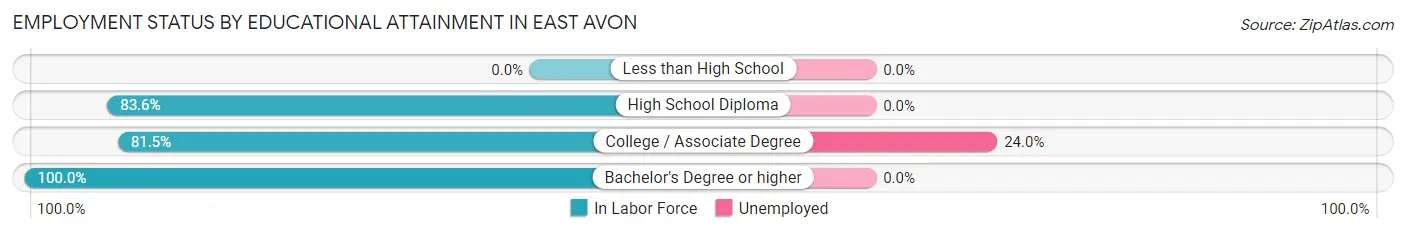
| Educational Attainment | In Labor Force | Unemployed |
| Less than High School | 0 (0.0%) | 0 (0.0%) |
| High School Diploma | 92 (83.6%) | 0 (0.0%) |
| College / Associate Degree | 75 (81.5%) | 22 (24.0%) |
| Bachelor's Degree or higher | 61 (100.0%) | 0 (0.0%) |
| Total | 228 (86.7%) | 21 (7.9%) |
Employment Occupations by Sex in East Avon
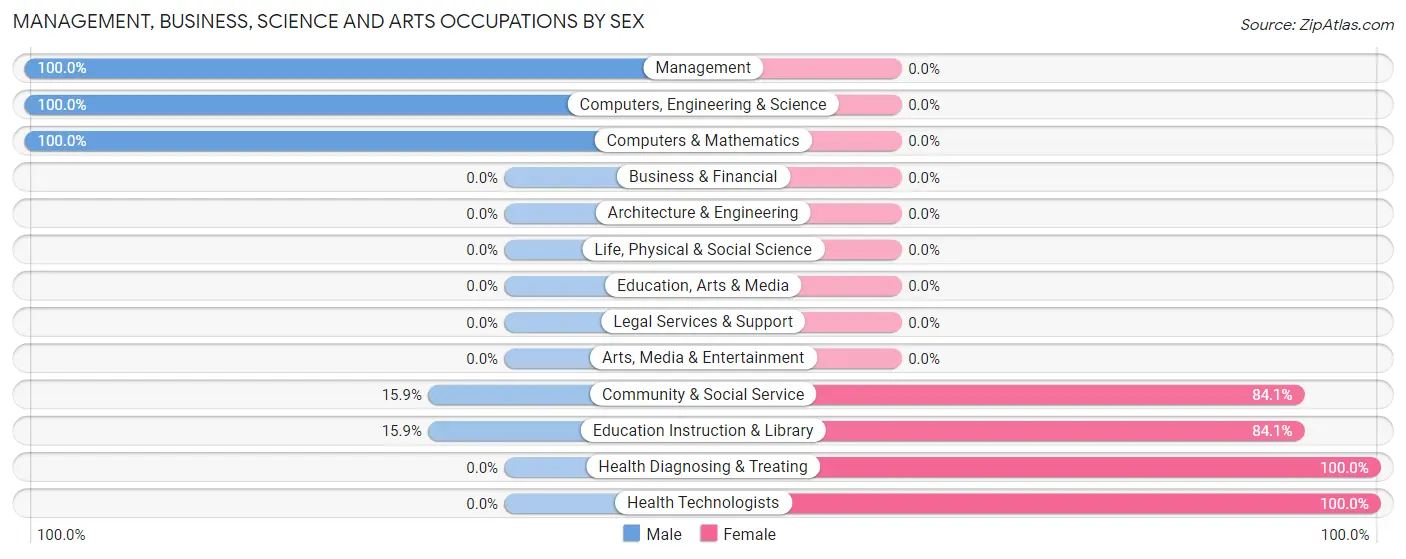
Management, Business, Science and Arts Occupations
The most common Management, Business, Science and Arts occupations in East Avon are Community & Social Service (88 | 32.2%), Education Instruction & Library (88 | 32.2%), Management (63 | 23.1%), Health Diagnosing & Treating (47 | 17.2%), and Health Technologists (47 | 17.2%).
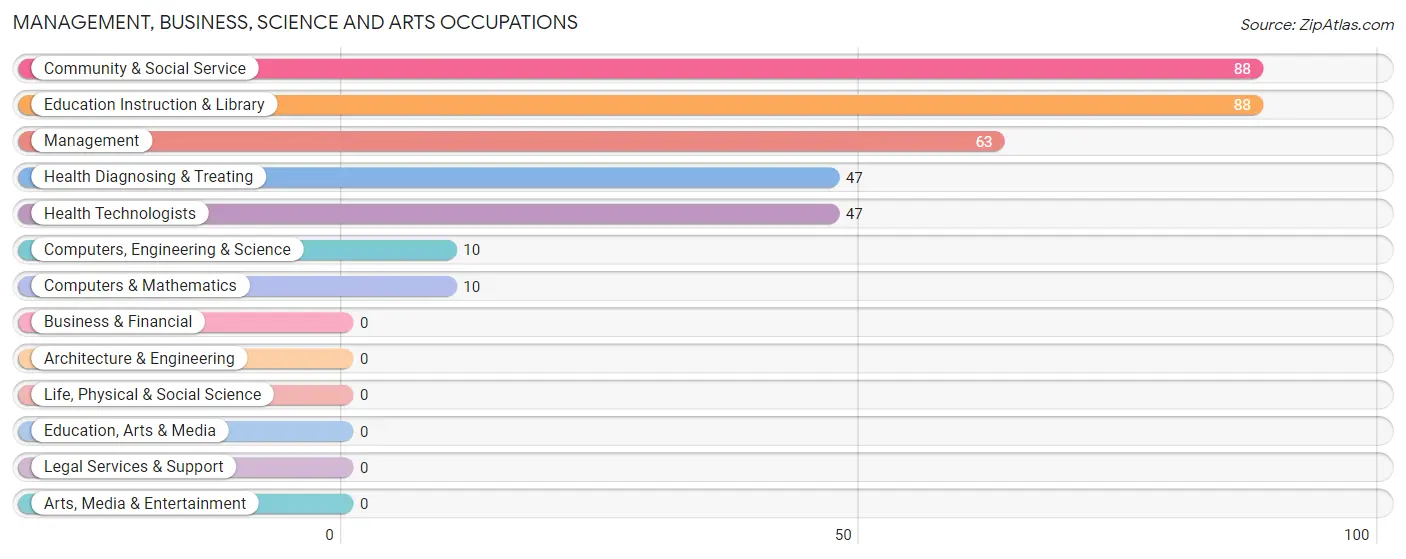
Management, Business, Science and Arts Occupations by Sex
Within the Management, Business, Science and Arts occupations in East Avon, the most male-oriented occupations are Management (100.0%), Computers, Engineering & Science (100.0%), and Computers & Mathematics (100.0%), while the most female-oriented occupations are Health Diagnosing & Treating (100.0%), Health Technologists (100.0%), and Community & Social Service (84.1%).
| Occupation | Male | Female |
| Management | 63 (100.0%) | 0 (0.0%) |
| Business & Financial | 0 (0.0%) | 0 (0.0%) |
| Computers, Engineering & Science | 10 (100.0%) | 0 (0.0%) |
| Computers & Mathematics | 10 (100.0%) | 0 (0.0%) |
| Architecture & Engineering | 0 (0.0%) | 0 (0.0%) |
| Life, Physical & Social Science | 0 (0.0%) | 0 (0.0%) |
| Community & Social Service | 14 (15.9%) | 74 (84.1%) |
| Education, Arts & Media | 0 (0.0%) | 0 (0.0%) |
| Legal Services & Support | 0 (0.0%) | 0 (0.0%) |
| Education Instruction & Library | 14 (15.9%) | 74 (84.1%) |
| Arts, Media & Entertainment | 0 (0.0%) | 0 (0.0%) |
| Health Diagnosing & Treating | 0 (0.0%) | 47 (100.0%) |
| Health Technologists | 0 (0.0%) | 47 (100.0%) |
| Total (Category) | 87 (41.8%) | 121 (58.2%) |
| Total (Overall) | 135 (49.4%) | 138 (50.5%) |
Services Occupations
Services Occupations by Sex
| Occupation | Male | Female |
| Healthcare Support | 0 (0.0%) | 0 (0.0%) |
| Security & Protection | 0 (0.0%) | 0 (0.0%) |
| Firefighting & Prevention | 0 (0.0%) | 0 (0.0%) |
| Law Enforcement | 0 (0.0%) | 0 (0.0%) |
| Food Preparation & Serving | 0 (0.0%) | 0 (0.0%) |
| Cleaning & Maintenance | 0 (0.0%) | 0 (0.0%) |
| Personal Care & Service | 0 (0.0%) | 0 (0.0%) |
| Total (Category) | 0 (0.0%) | 0 (0.0%) |
| Total (Overall) | 135 (49.4%) | 138 (50.5%) |
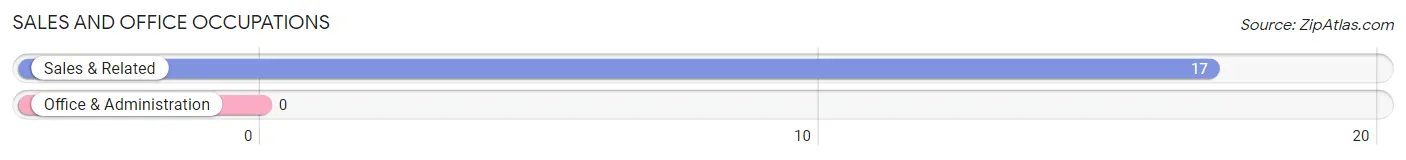
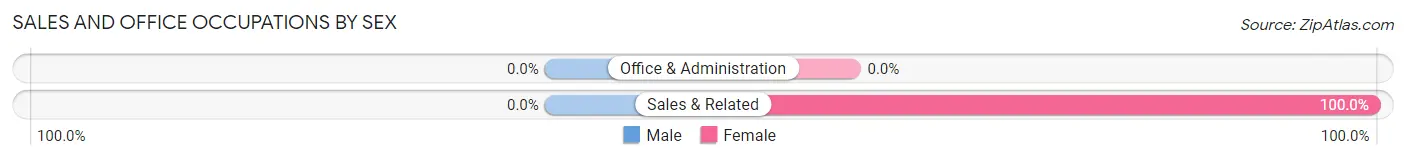
Sales and Office Occupations
The most common Sales and Office occupations in East Avon are , and Sales & Related (17 | 6.2%).
Sales and Office Occupations by Sex
| Occupation | Male | Female |
| Sales & Related | 0 (0.0%) | 17 (100.0%) |
| Office & Administration | 0 (0.0%) | 0 (0.0%) |
| Total (Category) | 0 (0.0%) | 17 (100.0%) |
| Total (Overall) | 135 (49.4%) | 138 (50.5%) |
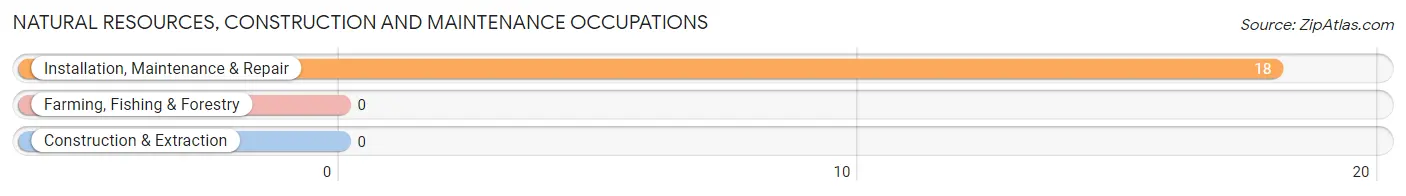
Natural Resources, Construction and Maintenance Occupations
The most common Natural Resources, Construction and Maintenance occupations in East Avon are , and Installation, Maintenance & Repair (18 | 6.6%).
Natural Resources, Construction and Maintenance Occupations by Sex
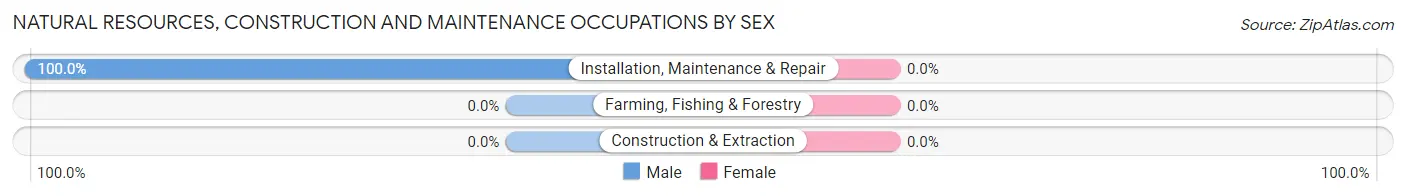
| Occupation | Male | Female |
| Farming, Fishing & Forestry | 0 (0.0%) | 0 (0.0%) |
| Construction & Extraction | 0 (0.0%) | 0 (0.0%) |
| Installation, Maintenance & Repair | 18 (100.0%) | 0 (0.0%) |
| Total (Category) | 18 (100.0%) | 0 (0.0%) |
| Total (Overall) | 135 (49.4%) | 138 (50.5%) |
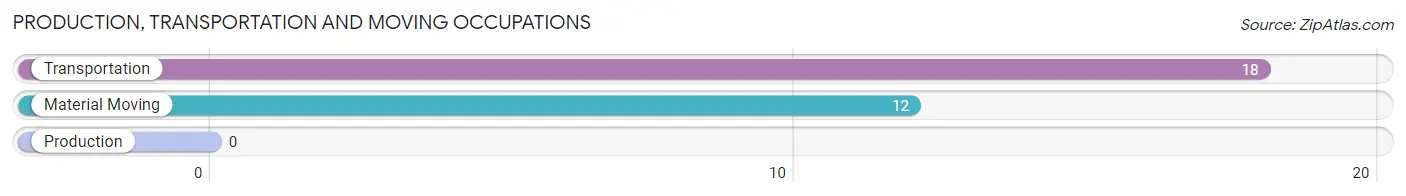
Production, Transportation and Moving Occupations
The most common Production, Transportation and Moving occupations in East Avon are Transportation (18 | 6.6%), and Material Moving (12 | 4.4%).
Production, Transportation and Moving Occupations by Sex
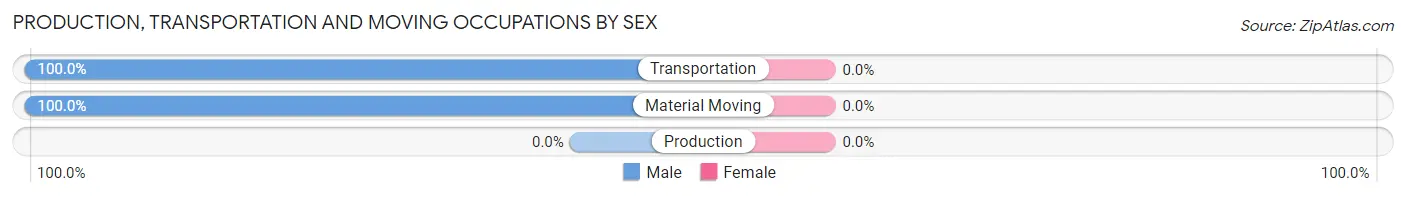
| Occupation | Male | Female |
| Production | 0 (0.0%) | 0 (0.0%) |
| Transportation | 18 (100.0%) | 0 (0.0%) |
| Material Moving | 12 (100.0%) | 0 (0.0%) |
| Total (Category) | 30 (100.0%) | 0 (0.0%) |
| Total (Overall) | 135 (49.4%) | 138 (50.5%) |
Employment Industries by Sex in East Avon
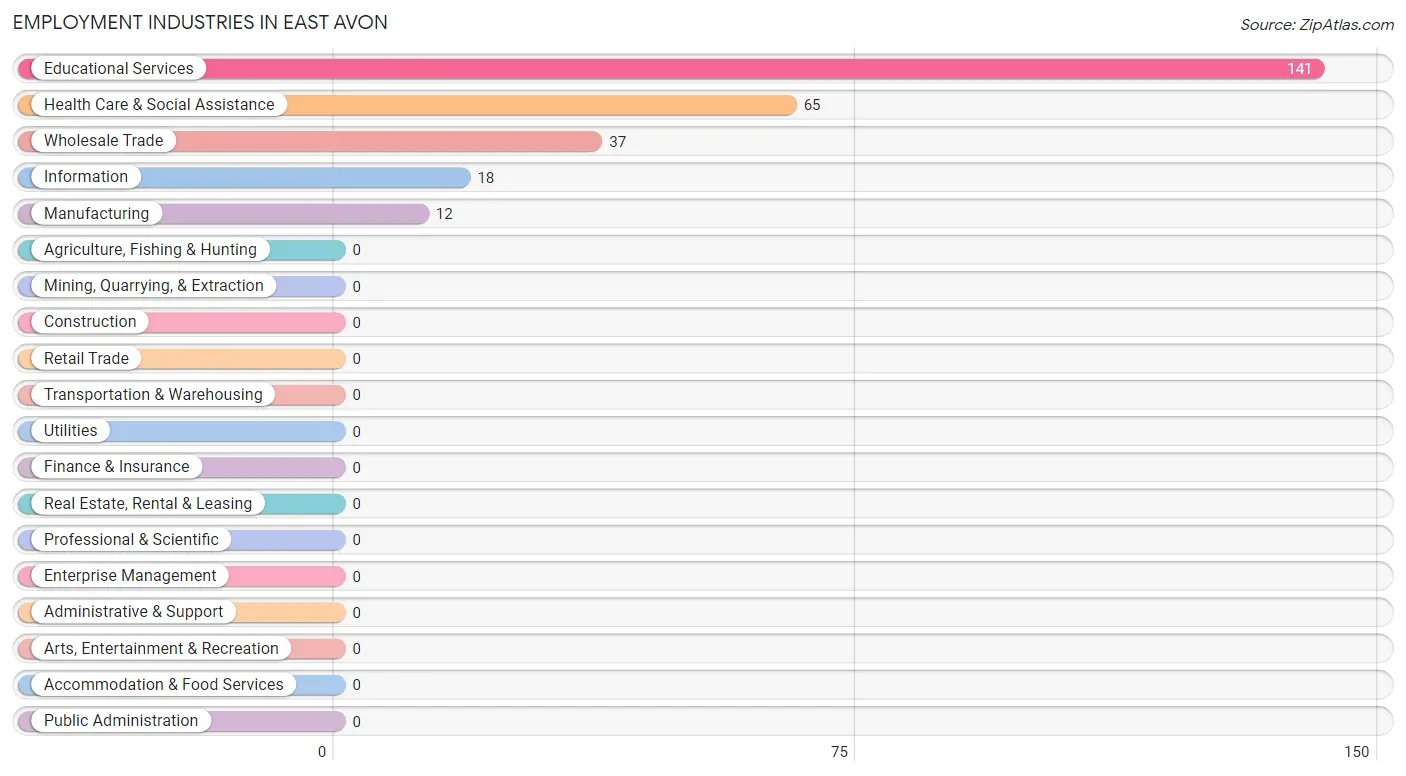
Employment Industries in East Avon
The major employment industries in East Avon include Educational Services (141 | 51.6%), Health Care & Social Assistance (65 | 23.8%), Wholesale Trade (37 | 13.6%), Information (18 | 6.6%), and Manufacturing (12 | 4.4%).
Employment Industries by Sex in East Avon
The East Avon industries that see more men than women are Manufacturing (100.0%), Information (100.0%), and Wholesale Trade (54.0%), whereas the industries that tend to have a higher number of women are Health Care & Social Assistance (72.3%), Educational Services (52.5%), and Wholesale Trade (46.0%).
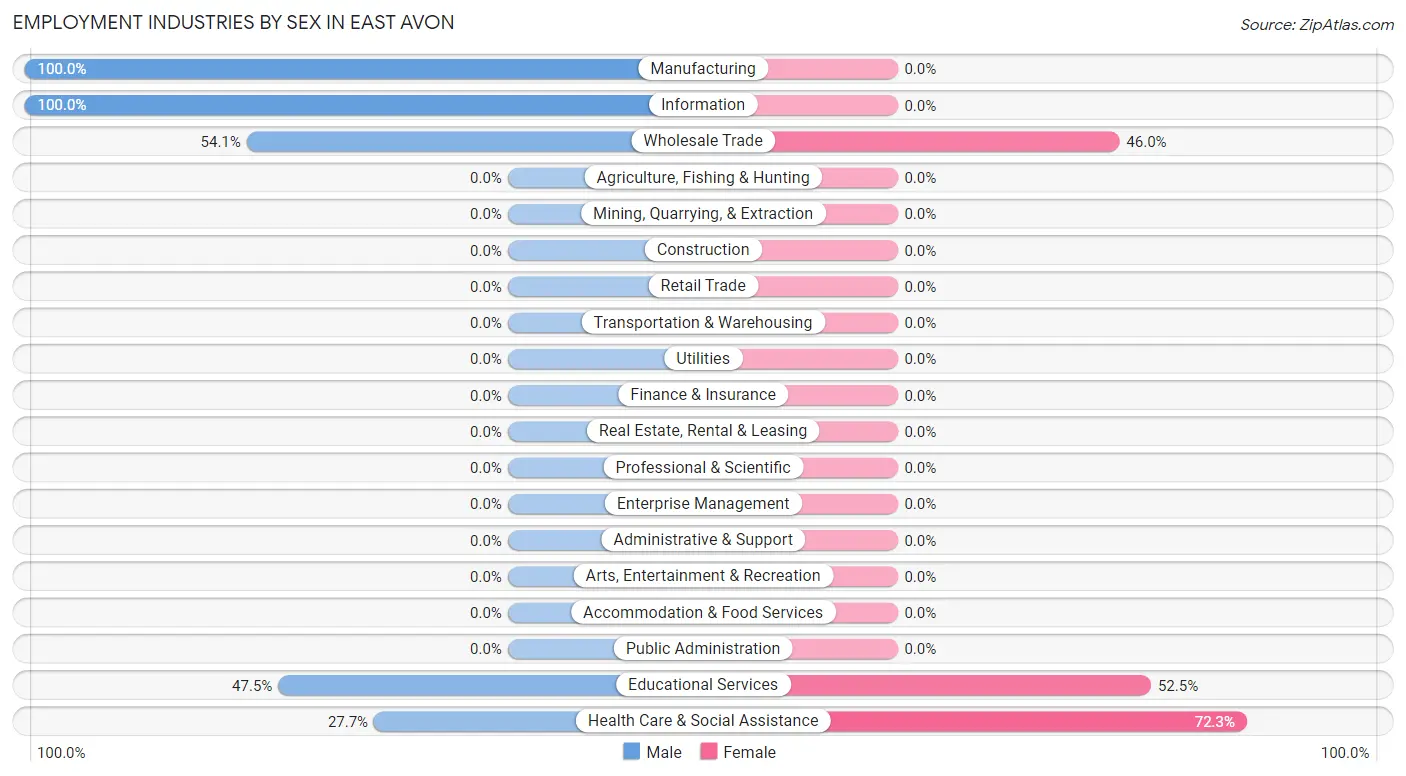
| Industry | Male | Female |
| Agriculture, Fishing & Hunting | 0 (0.0%) | 0 (0.0%) |
| Mining, Quarrying, & Extraction | 0 (0.0%) | 0 (0.0%) |
| Construction | 0 (0.0%) | 0 (0.0%) |
| Manufacturing | 12 (100.0%) | 0 (0.0%) |
| Wholesale Trade | 20 (54.0%) | 17 (46.0%) |
| Retail Trade | 0 (0.0%) | 0 (0.0%) |
| Transportation & Warehousing | 0 (0.0%) | 0 (0.0%) |
| Utilities | 0 (0.0%) | 0 (0.0%) |
| Information | 18 (100.0%) | 0 (0.0%) |
| Finance & Insurance | 0 (0.0%) | 0 (0.0%) |
| Real Estate, Rental & Leasing | 0 (0.0%) | 0 (0.0%) |
| Professional & Scientific | 0 (0.0%) | 0 (0.0%) |
| Enterprise Management | 0 (0.0%) | 0 (0.0%) |
| Administrative & Support | 0 (0.0%) | 0 (0.0%) |
| Educational Services | 67 (47.5%) | 74 (52.5%) |
| Health Care & Social Assistance | 18 (27.7%) | 47 (72.3%) |
| Arts, Entertainment & Recreation | 0 (0.0%) | 0 (0.0%) |
| Accommodation & Food Services | 0 (0.0%) | 0 (0.0%) |
| Public Administration | 0 (0.0%) | 0 (0.0%) |
| Total | 135 (49.4%) | 138 (50.5%) |
Education in East Avon
School Enrollment in East Avon
The most common levels of schooling among the 201 students in East Avon are middle school (86 | 42.8%), elementary school (80 | 39.8%), and high school (14 | 7.0%).
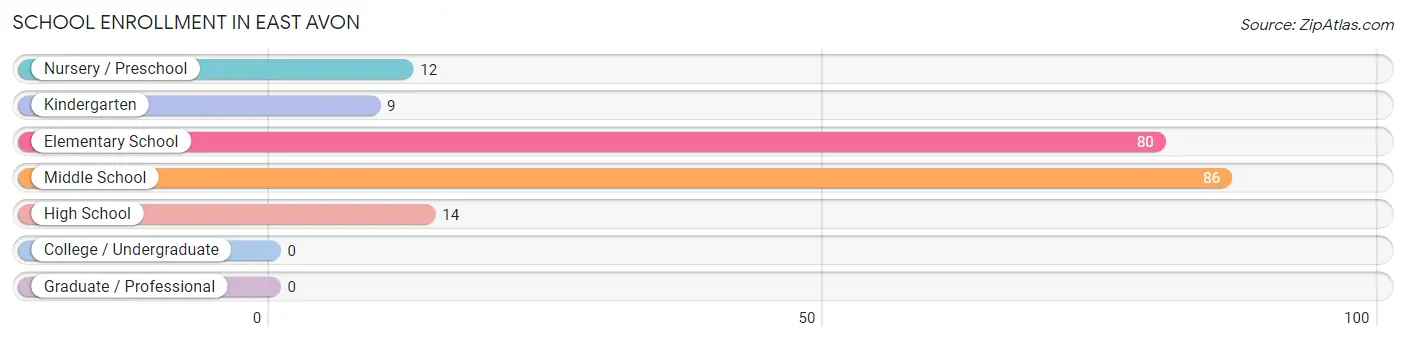
| School Level | # Students | % Students |
| Nursery / Preschool | 12 | 6.0% |
| Kindergarten | 9 | 4.5% |
| Elementary School | 80 | 39.8% |
| Middle School | 86 | 42.8% |
| High School | 14 | 7.0% |
| College / Undergraduate | 0 | 0.0% |
| Graduate / Professional | 0 | 0.0% |
| Total | 201 | 100.0% |
School Enrollment by Age by Funding Source in East Avon
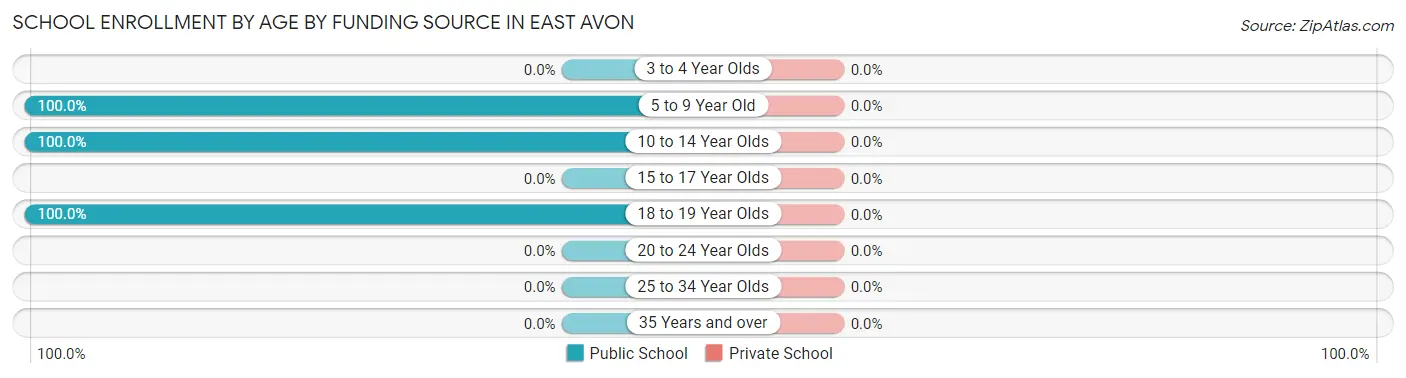
| Age Bracket | Public School | Private School |
| 3 to 4 Year Olds | 0 (0.0%) | 0 (0.0%) |
| 5 to 9 Year Old | 92 (100.0%) | 0 (0.0%) |
| 10 to 14 Year Olds | 95 (100.0%) | 0 (0.0%) |
| 15 to 17 Year Olds | 0 (0.0%) | 0 (0.0%) |
| 18 to 19 Year Olds | 14 (100.0%) | 0 (0.0%) |
| 20 to 24 Year Olds | 0 (0.0%) | 0 (0.0%) |
| 25 to 34 Year Olds | 0 (0.0%) | 0 (0.0%) |
| 35 Years and over | 0 (0.0%) | 0 (0.0%) |
| Total | 201 (100.0%) | 0 (0.0%) |
Educational Attainment by Field of Study in East Avon
Education (45 | 49.4%), literature & languages (15 | 16.5%), physical & health sciences (13 | 14.3%), computers & mathematics (10 | 11.0%), and science & technology (8 | 8.8%) are the most common fields of study among 91 individuals in East Avon who have obtained a bachelor's degree or higher.
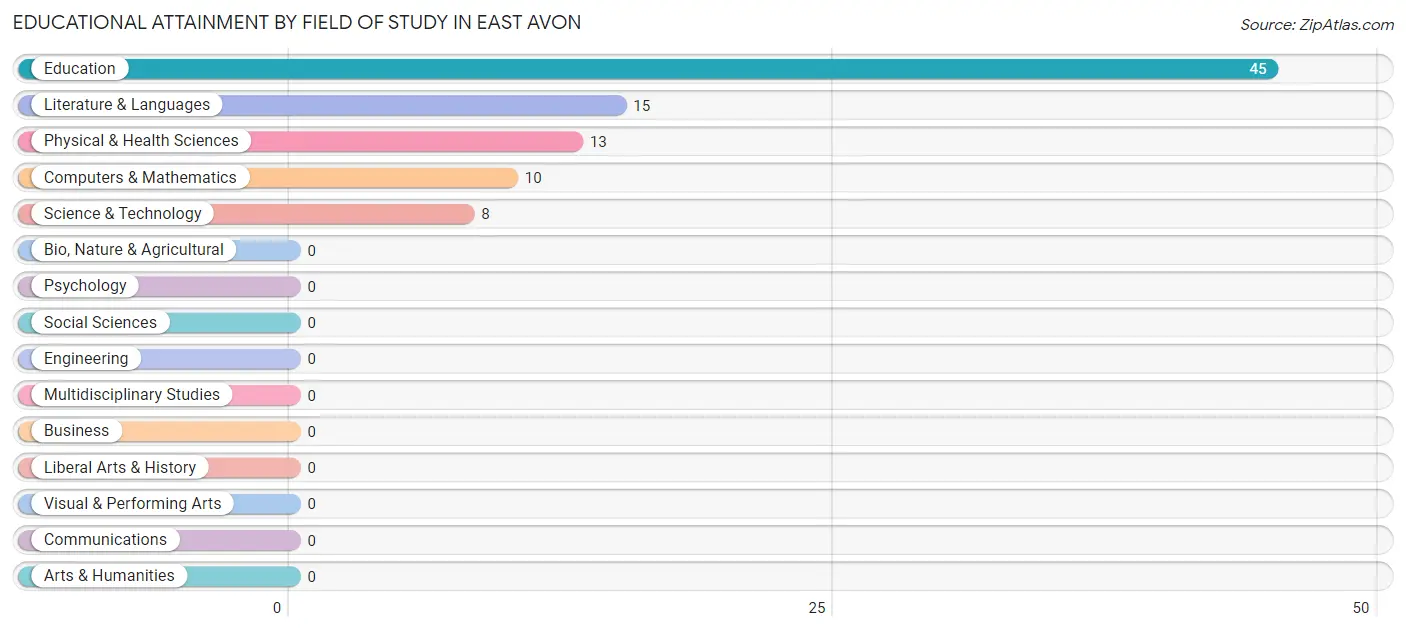
| Field of Study | # Graduates | % Graduates |
| Computers & Mathematics | 10 | 11.0% |
| Bio, Nature & Agricultural | 0 | 0.0% |
| Physical & Health Sciences | 13 | 14.3% |
| Psychology | 0 | 0.0% |
| Social Sciences | 0 | 0.0% |
| Engineering | 0 | 0.0% |
| Multidisciplinary Studies | 0 | 0.0% |
| Science & Technology | 8 | 8.8% |
| Business | 0 | 0.0% |
| Education | 45 | 49.4% |
| Literature & Languages | 15 | 16.5% |
| Liberal Arts & History | 0 | 0.0% |
| Visual & Performing Arts | 0 | 0.0% |
| Communications | 0 | 0.0% |
| Arts & Humanities | 0 | 0.0% |
| Total | 91 | 100.0% |
Transportation & Commute in East Avon
Vehicle Availability by Sex in East Avon
The most prevalent vehicle ownership categories in East Avon are males with 2 vehicles (97, accounting for 71.9%) and females with 2 vehicles (105, making up 70.3%).
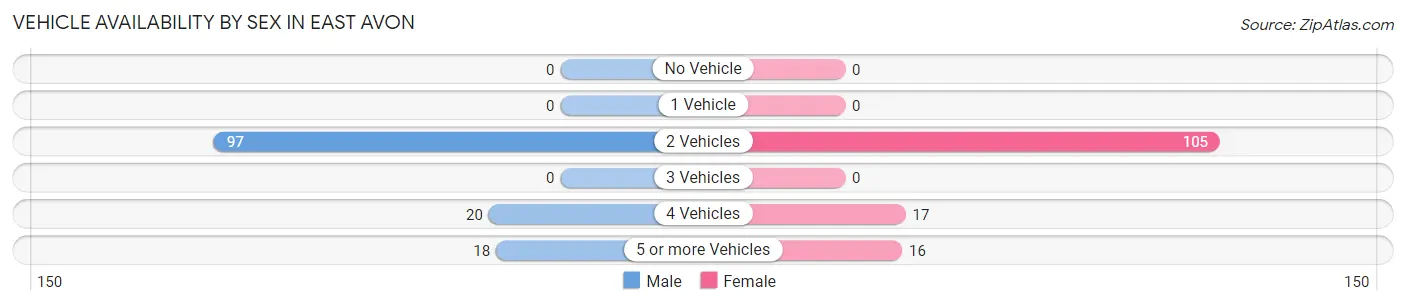
| Vehicles Available | Male | Female |
| No Vehicle | 0 (0.0%) | 0 (0.0%) |
| 1 Vehicle | 0 (0.0%) | 0 (0.0%) |
| 2 Vehicles | 97 (71.9%) | 105 (76.1%) |
| 3 Vehicles | 0 (0.0%) | 0 (0.0%) |
| 4 Vehicles | 20 (14.8%) | 17 (12.3%) |
| 5 or more Vehicles | 18 (13.3%) | 16 (11.6%) |
| Total | 135 (100.0%) | 138 (100.0%) |
Commute Time in East Avon
The most frequently occuring commute durations in East Avon are 25 to 29 minutes (95 commuters, 34.8%), 30 to 34 minutes (64 commuters, 23.4%), and less than 5 minutes (45 commuters, 16.5%).
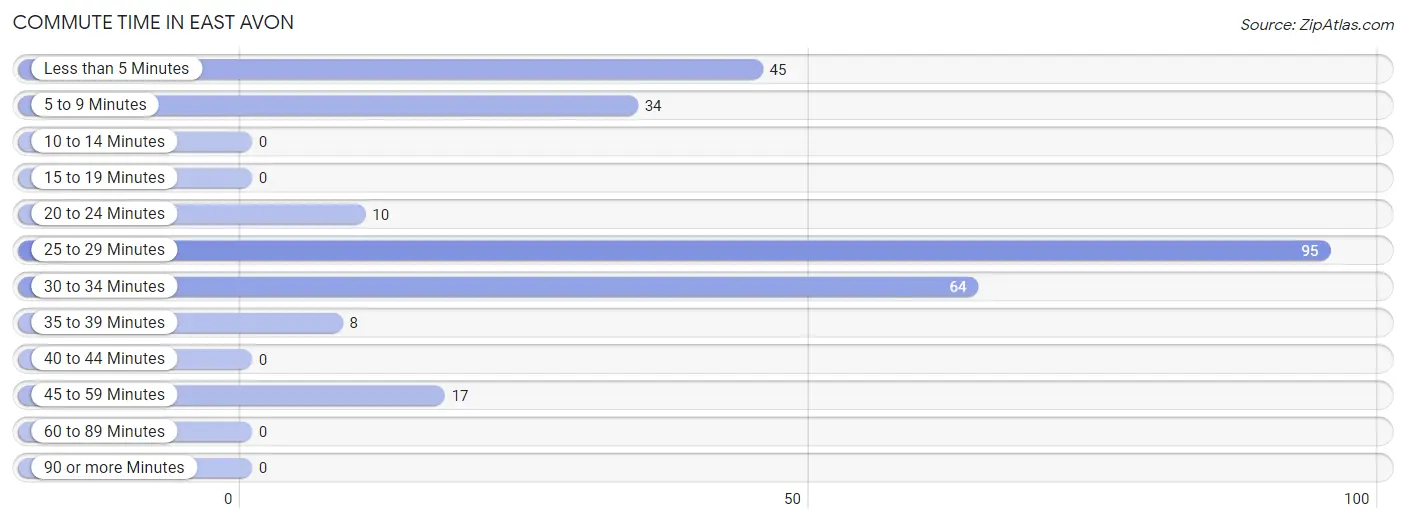
| Commute Time | # Commuters | % Commuters |
| Less than 5 Minutes | 45 | 16.5% |
| 5 to 9 Minutes | 34 | 12.4% |
| 10 to 14 Minutes | 0 | 0.0% |
| 15 to 19 Minutes | 0 | 0.0% |
| 20 to 24 Minutes | 10 | 3.7% |
| 25 to 29 Minutes | 95 | 34.8% |
| 30 to 34 Minutes | 64 | 23.4% |
| 35 to 39 Minutes | 8 | 2.9% |
| 40 to 44 Minutes | 0 | 0.0% |
| 45 to 59 Minutes | 17 | 6.2% |
| 60 to 89 Minutes | 0 | 0.0% |
| 90 or more Minutes | 0 | 0.0% |
Commute Time by Sex in East Avon
The most common commute times in East Avon are 30 to 34 minutes (64 commuters, 47.4%) for males and 25 to 29 minutes (52 commuters, 37.7%) for females.
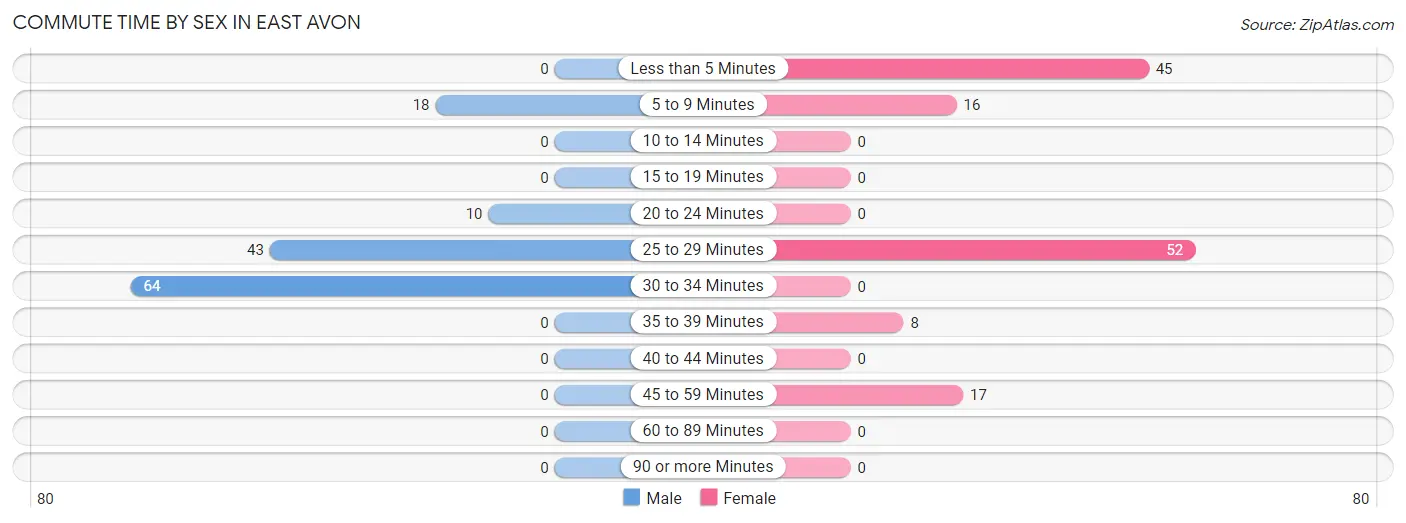
| Commute Time | Male | Female |
| Less than 5 Minutes | 0 (0.0%) | 45 (32.6%) |
| 5 to 9 Minutes | 18 (13.3%) | 16 (11.6%) |
| 10 to 14 Minutes | 0 (0.0%) | 0 (0.0%) |
| 15 to 19 Minutes | 0 (0.0%) | 0 (0.0%) |
| 20 to 24 Minutes | 10 (7.4%) | 0 (0.0%) |
| 25 to 29 Minutes | 43 (31.9%) | 52 (37.7%) |
| 30 to 34 Minutes | 64 (47.4%) | 0 (0.0%) |
| 35 to 39 Minutes | 0 (0.0%) | 8 (5.8%) |
| 40 to 44 Minutes | 0 (0.0%) | 0 (0.0%) |
| 45 to 59 Minutes | 0 (0.0%) | 17 (12.3%) |
| 60 to 89 Minutes | 0 (0.0%) | 0 (0.0%) |
| 90 or more Minutes | 0 (0.0%) | 0 (0.0%) |
Time of Departure to Work by Sex in East Avon
The most frequent times of departure to work in East Avon are 7:00 AM to 7:29 AM (44, 32.6%) for males and 4:00 PM to 11:59 PM (55, 39.9%) for females.
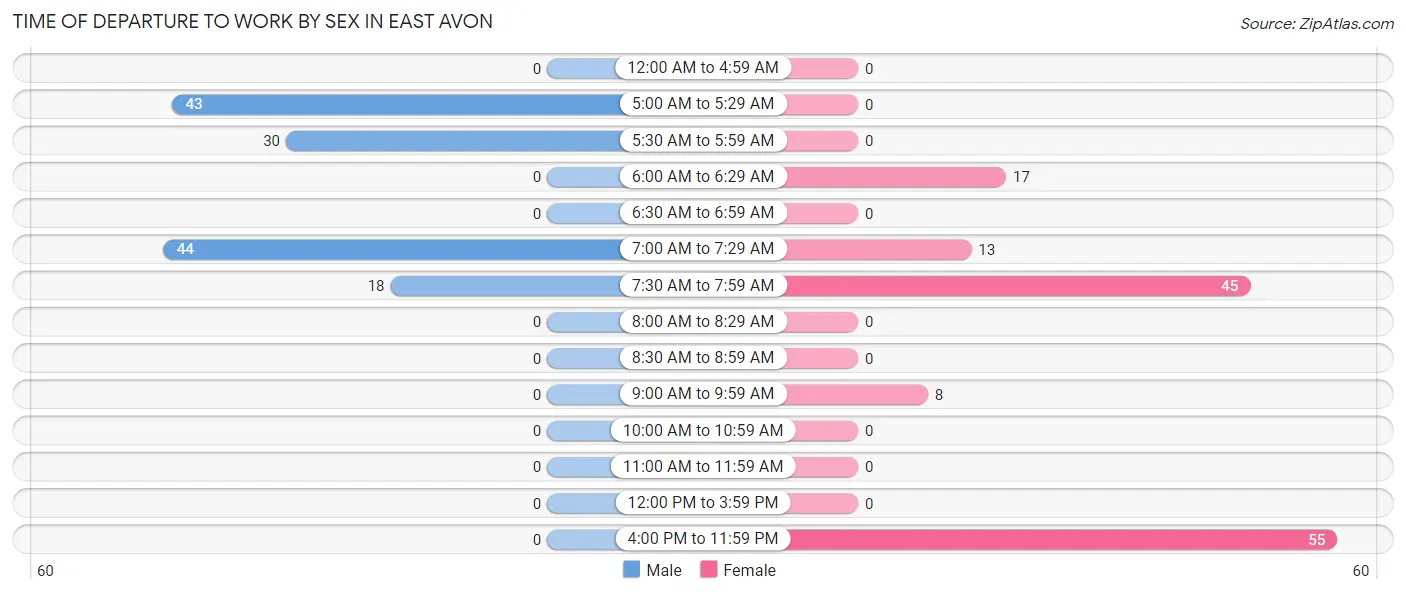
| Time of Departure | Male | Female |
| 12:00 AM to 4:59 AM | 0 (0.0%) | 0 (0.0%) |
| 5:00 AM to 5:29 AM | 43 (31.9%) | 0 (0.0%) |
| 5:30 AM to 5:59 AM | 30 (22.2%) | 0 (0.0%) |
| 6:00 AM to 6:29 AM | 0 (0.0%) | 17 (12.3%) |
| 6:30 AM to 6:59 AM | 0 (0.0%) | 0 (0.0%) |
| 7:00 AM to 7:29 AM | 44 (32.6%) | 13 (9.4%) |
| 7:30 AM to 7:59 AM | 18 (13.3%) | 45 (32.6%) |
| 8:00 AM to 8:29 AM | 0 (0.0%) | 0 (0.0%) |
| 8:30 AM to 8:59 AM | 0 (0.0%) | 0 (0.0%) |
| 9:00 AM to 9:59 AM | 0 (0.0%) | 8 (5.8%) |
| 10:00 AM to 10:59 AM | 0 (0.0%) | 0 (0.0%) |
| 11:00 AM to 11:59 AM | 0 (0.0%) | 0 (0.0%) |
| 12:00 PM to 3:59 PM | 0 (0.0%) | 0 (0.0%) |
| 4:00 PM to 11:59 PM | 0 (0.0%) | 55 (39.9%) |
| Total | 135 (100.0%) | 138 (100.0%) |
Housing Occupancy in East Avon
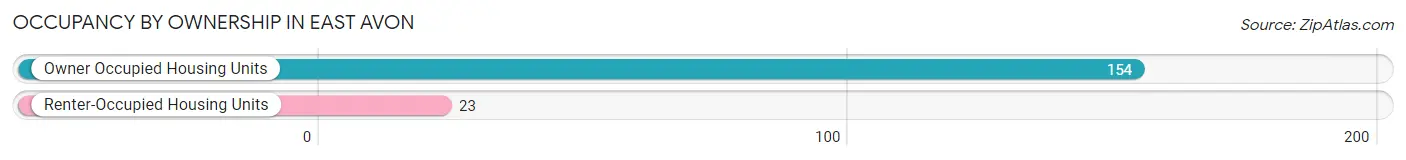
Occupancy by Ownership in East Avon
Of the total 177 dwellings in East Avon, owner-occupied units account for 154 (87.0%), while renter-occupied units make up 23 (13.0%).
| Occupancy | # Housing Units | % Housing Units |
| Owner Occupied Housing Units | 154 | 87.0% |
| Renter-Occupied Housing Units | 23 | 13.0% |
| Total Occupied Housing Units | 177 | 100.0% |
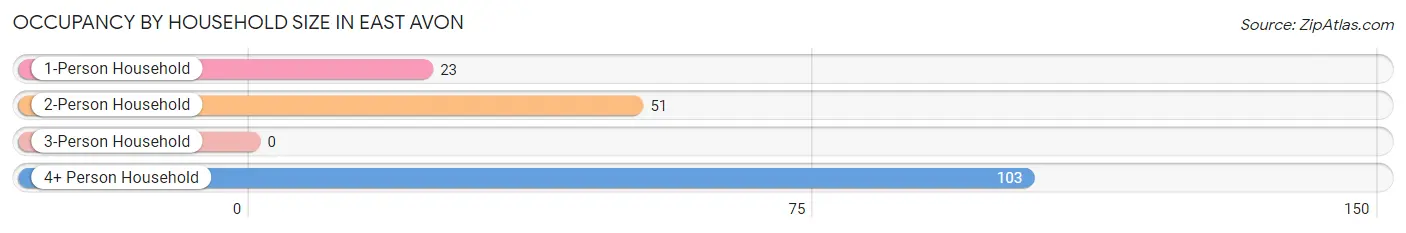
Occupancy by Household Size in East Avon
| Household Size | # Housing Units | % Housing Units |
| 1-Person Household | 23 | 13.0% |
| 2-Person Household | 51 | 28.8% |
| 3-Person Household | 0 | 0.0% |
| 4+ Person Household | 103 | 58.2% |
| Total Housing Units | 177 | 100.0% |
Occupancy by Ownership by Household Size in East Avon
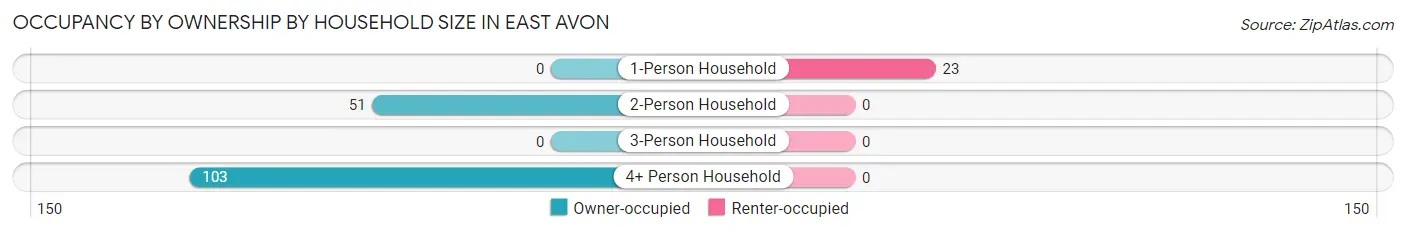
| Household Size | Owner-occupied | Renter-occupied |
| 1-Person Household | 0 (0.0%) | 23 (100.0%) |
| 2-Person Household | 51 (100.0%) | 0 (0.0%) |
| 3-Person Household | 0 (0.0%) | 0 (0.0%) |
| 4+ Person Household | 103 (100.0%) | 0 (0.0%) |
| Total Housing Units | 154 (87.0%) | 23 (13.0%) |
Occupancy by Educational Attainment in East Avon
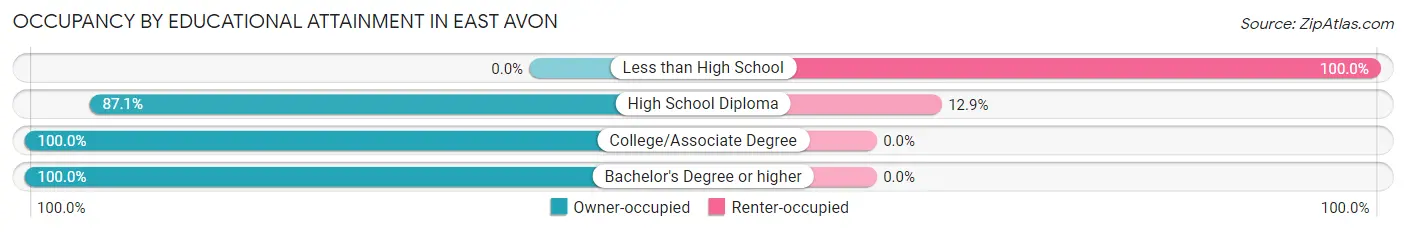
| Household Size | Owner-occupied | Renter-occupied |
| Less than High School | 0 (0.0%) | 11 (100.0%) |
| High School Diploma | 81 (87.1%) | 12 (12.9%) |
| College/Associate Degree | 18 (100.0%) | 0 (0.0%) |
| Bachelor's Degree or higher | 55 (100.0%) | 0 (0.0%) |
Occupancy by Age of Householder in East Avon
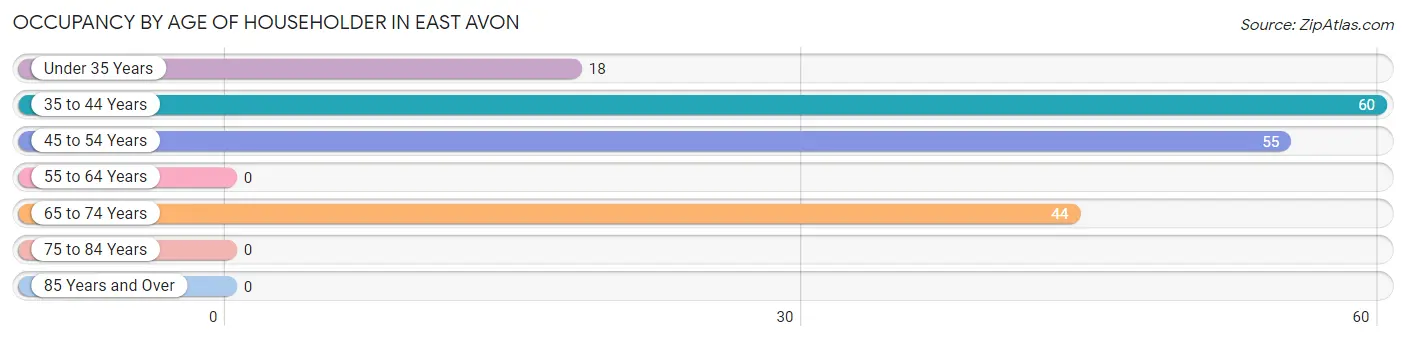
| Age Bracket | # Households | % Households |
| Under 35 Years | 18 | 10.2% |
| 35 to 44 Years | 60 | 33.9% |
| 45 to 54 Years | 55 | 31.1% |
| 55 to 64 Years | 0 | 0.0% |
| 65 to 74 Years | 44 | 24.9% |
| 75 to 84 Years | 0 | 0.0% |
| 85 Years and Over | 0 | 0.0% |
| Total | 177 | 100.0% |
Housing Finances in East Avon
Median Income by Occupancy in East Avon
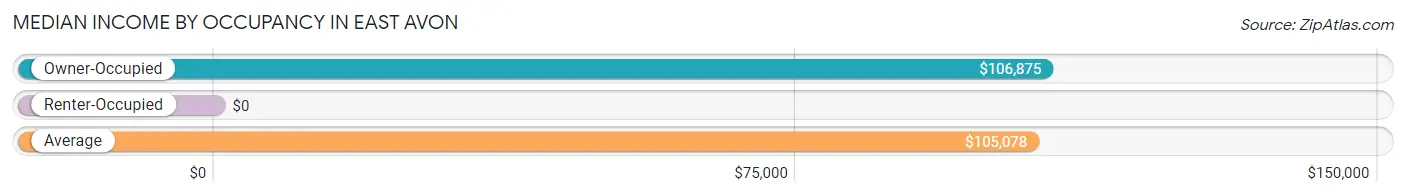
| Occupancy Type | # Households | Median Income |
| Owner-Occupied | 154 (87.0%) | $106,875 |
| Renter-Occupied | 23 (13.0%) | $0 |
| Average | 177 (100.0%) | $105,078 |
Occupancy by Householder Income Bracket in East Avon
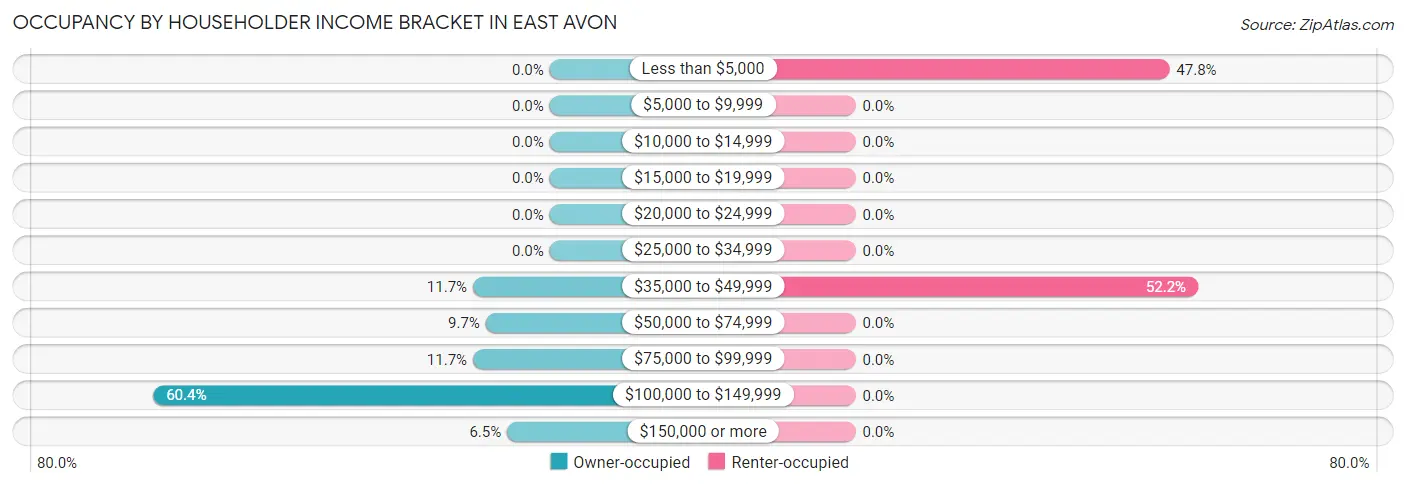
| Income Bracket | Owner-occupied | Renter-occupied |
| Less than $5,000 | 0 (0.0%) | 11 (47.8%) |
| $5,000 to $9,999 | 0 (0.0%) | 0 (0.0%) |
| $10,000 to $14,999 | 0 (0.0%) | 0 (0.0%) |
| $15,000 to $19,999 | 0 (0.0%) | 0 (0.0%) |
| $20,000 to $24,999 | 0 (0.0%) | 0 (0.0%) |
| $25,000 to $34,999 | 0 (0.0%) | 0 (0.0%) |
| $35,000 to $49,999 | 18 (11.7%) | 12 (52.2%) |
| $50,000 to $74,999 | 15 (9.7%) | 0 (0.0%) |
| $75,000 to $99,999 | 18 (11.7%) | 0 (0.0%) |
| $100,000 to $149,999 | 93 (60.4%) | 0 (0.0%) |
| $150,000 or more | 10 (6.5%) | 0 (0.0%) |
| Total | 154 (100.0%) | 23 (100.0%) |
Monthly Housing Cost Tiers in East Avon
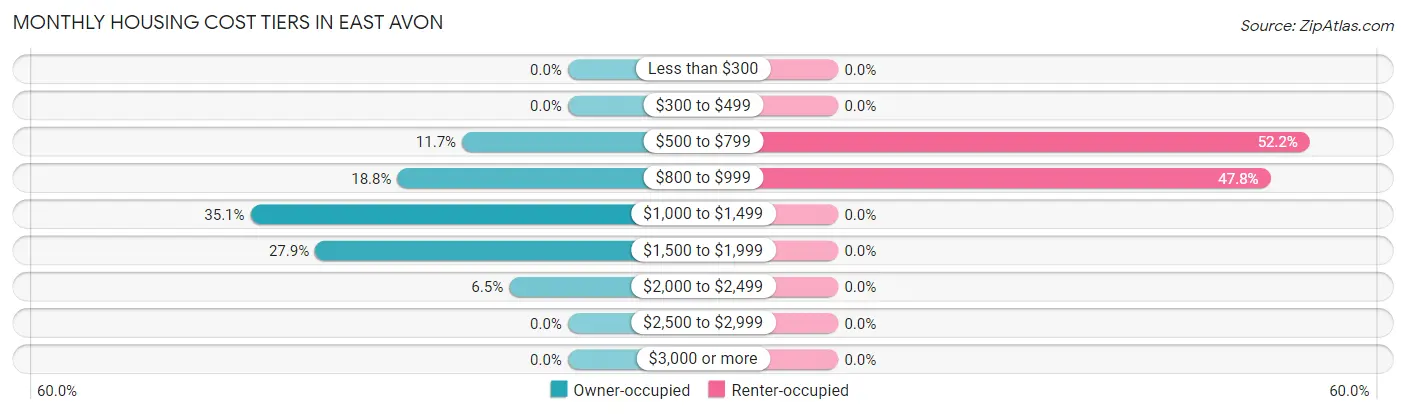
| Monthly Cost | Owner-occupied | Renter-occupied |
| Less than $300 | 0 (0.0%) | 0 (0.0%) |
| $300 to $499 | 0 (0.0%) | 0 (0.0%) |
| $500 to $799 | 18 (11.7%) | 12 (52.2%) |
| $800 to $999 | 29 (18.8%) | 11 (47.8%) |
| $1,000 to $1,499 | 54 (35.1%) | 0 (0.0%) |
| $1,500 to $1,999 | 43 (27.9%) | 0 (0.0%) |
| $2,000 to $2,499 | 10 (6.5%) | 0 (0.0%) |
| $2,500 to $2,999 | 0 (0.0%) | 0 (0.0%) |
| $3,000 or more | 0 (0.0%) | 0 (0.0%) |
| Total | 154 (100.0%) | 23 (100.0%) |
Physical Housing Characteristics in East Avon
Housing Structures in East Avon
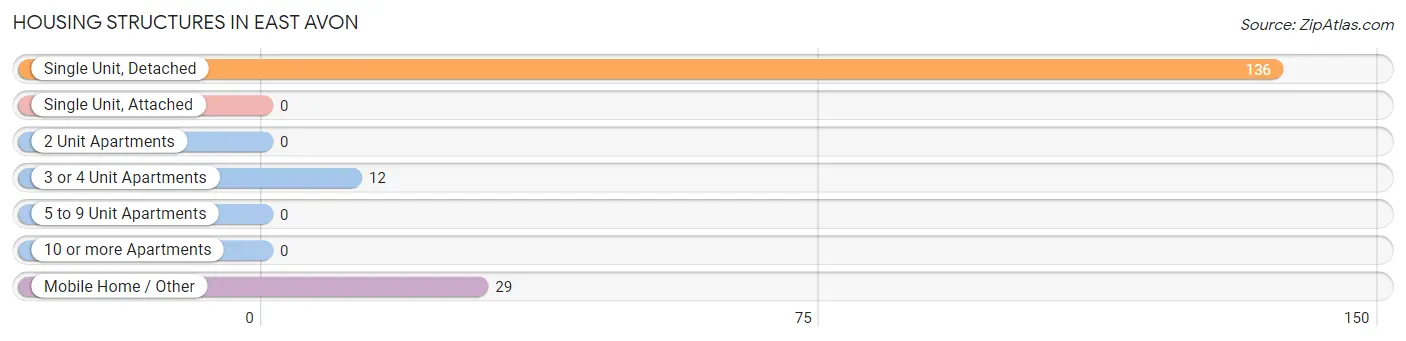
| Structure Type | # Housing Units | % Housing Units |
| Single Unit, Detached | 136 | 76.8% |
| Single Unit, Attached | 0 | 0.0% |
| 2 Unit Apartments | 0 | 0.0% |
| 3 or 4 Unit Apartments | 12 | 6.8% |
| 5 to 9 Unit Apartments | 0 | 0.0% |
| 10 or more Apartments | 0 | 0.0% |
| Mobile Home / Other | 29 | 16.4% |
| Total | 177 | 100.0% |
Housing Structures by Occupancy in East Avon
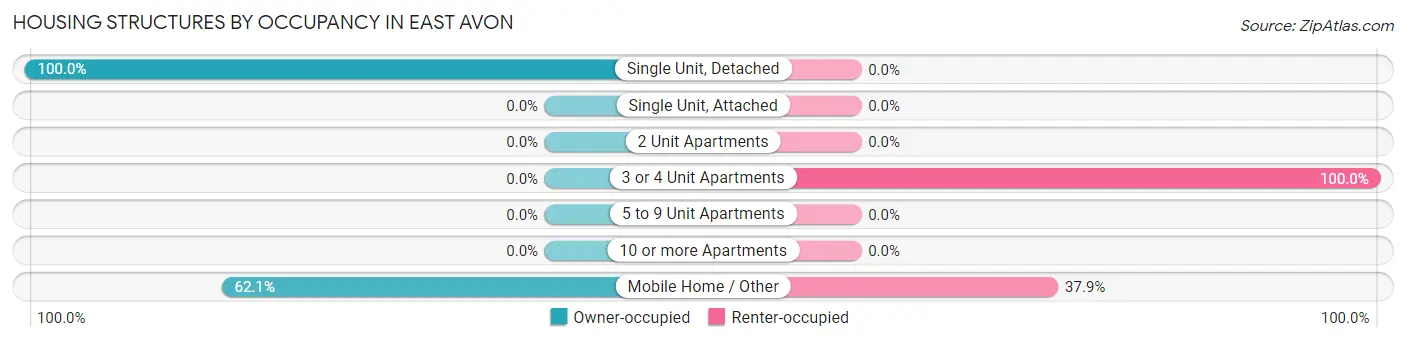
| Structure Type | Owner-occupied | Renter-occupied |
| Single Unit, Detached | 136 (100.0%) | 0 (0.0%) |
| Single Unit, Attached | 0 (0.0%) | 0 (0.0%) |
| 2 Unit Apartments | 0 (0.0%) | 0 (0.0%) |
| 3 or 4 Unit Apartments | 0 (0.0%) | 12 (100.0%) |
| 5 to 9 Unit Apartments | 0 (0.0%) | 0 (0.0%) |
| 10 or more Apartments | 0 (0.0%) | 0 (0.0%) |
| Mobile Home / Other | 18 (62.1%) | 11 (37.9%) |
| Total | 154 (87.0%) | 23 (13.0%) |
Housing Structures by Number of Rooms in East Avon
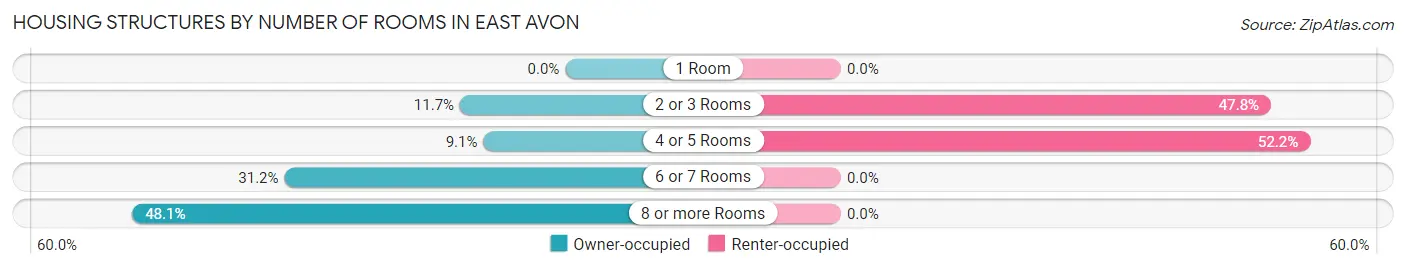
| Number of Rooms | Owner-occupied | Renter-occupied |
| 1 Room | 0 (0.0%) | 0 (0.0%) |
| 2 or 3 Rooms | 18 (11.7%) | 11 (47.8%) |
| 4 or 5 Rooms | 14 (9.1%) | 12 (52.2%) |
| 6 or 7 Rooms | 48 (31.2%) | 0 (0.0%) |
| 8 or more Rooms | 74 (48.0%) | 0 (0.0%) |
| Total | 154 (100.0%) | 23 (100.0%) |
Housing Structure by Heating Type in East Avon
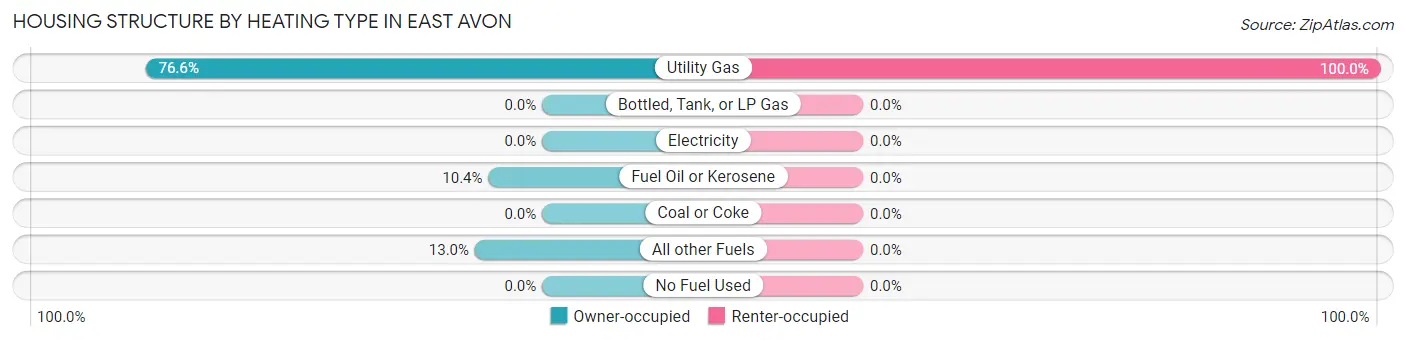
| Heating Type | Owner-occupied | Renter-occupied |
| Utility Gas | 118 (76.6%) | 23 (100.0%) |
| Bottled, Tank, or LP Gas | 0 (0.0%) | 0 (0.0%) |
| Electricity | 0 (0.0%) | 0 (0.0%) |
| Fuel Oil or Kerosene | 16 (10.4%) | 0 (0.0%) |
| Coal or Coke | 0 (0.0%) | 0 (0.0%) |
| All other Fuels | 20 (13.0%) | 0 (0.0%) |
| No Fuel Used | 0 (0.0%) | 0 (0.0%) |
| Total | 154 (100.0%) | 23 (100.0%) |
Household Vehicle Usage in East Avon
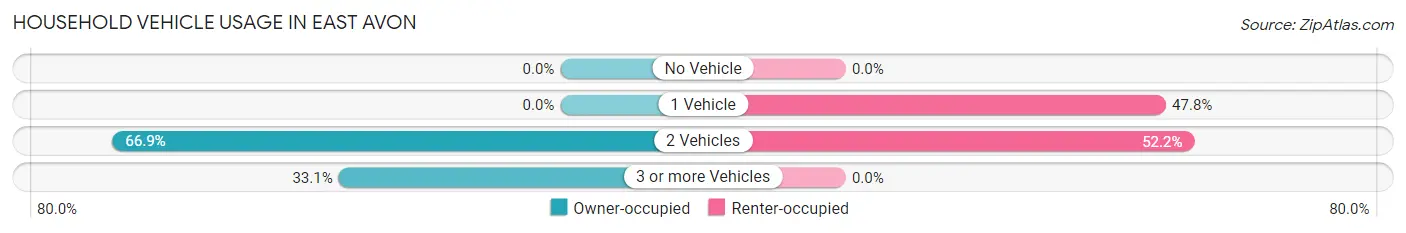
| Vehicles per Household | Owner-occupied | Renter-occupied |
| No Vehicle | 0 (0.0%) | 0 (0.0%) |
| 1 Vehicle | 0 (0.0%) | 11 (47.8%) |
| 2 Vehicles | 103 (66.9%) | 12 (52.2%) |
| 3 or more Vehicles | 51 (33.1%) | 0 (0.0%) |
| Total | 154 (100.0%) | 23 (100.0%) |
Real Estate & Mortgages in East Avon
Real Estate and Mortgage Overview in East Avon
| Characteristic | Without Mortgage | With Mortgage |
| Housing Units | 47 | 107 |
| Median Property Value | - | - |
| Median Household Income | $53,417 | $10 |
| Monthly Housing Costs | $837 | $0 |
| Real Estate Taxes | - | - |
Property Value by Mortgage Status in East Avon
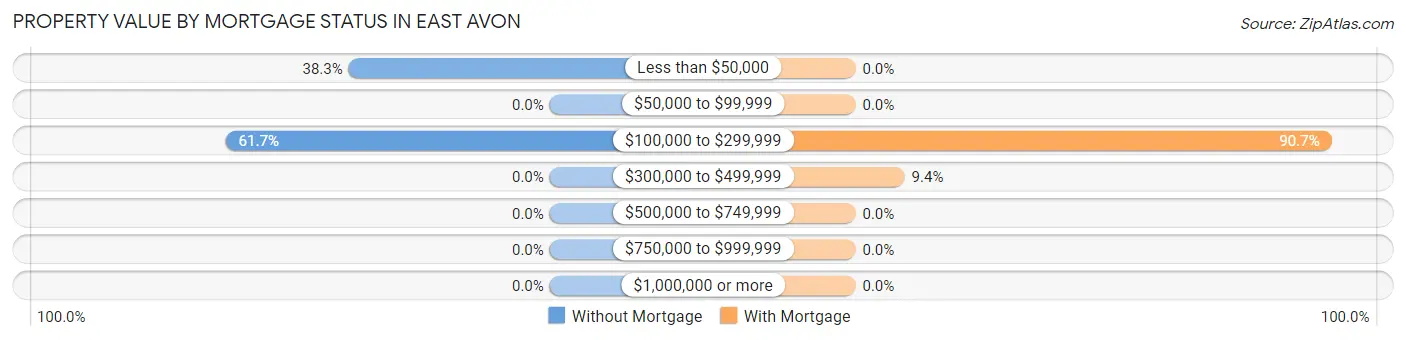
| Property Value | Without Mortgage | With Mortgage |
| Less than $50,000 | 18 (38.3%) | 0 (0.0%) |
| $50,000 to $99,999 | 0 (0.0%) | 0 (0.0%) |
| $100,000 to $299,999 | 29 (61.7%) | 97 (90.6%) |
| $300,000 to $499,999 | 0 (0.0%) | 10 (9.3%) |
| $500,000 to $749,999 | 0 (0.0%) | 0 (0.0%) |
| $750,000 to $999,999 | 0 (0.0%) | 0 (0.0%) |
| $1,000,000 or more | 0 (0.0%) | 0 (0.0%) |
| Total | 47 (100.0%) | 107 (100.0%) |
Household Income by Mortgage Status in East Avon
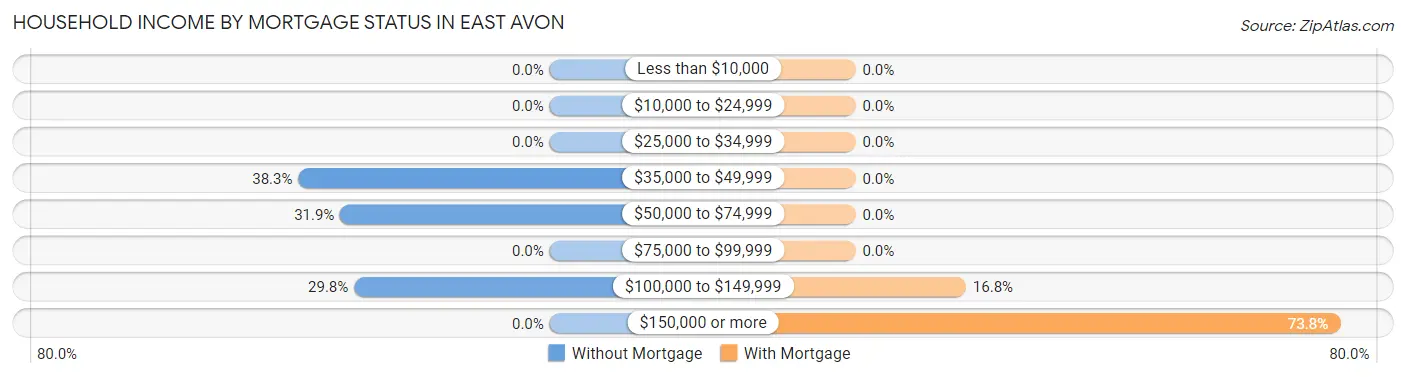
| Household Income | Without Mortgage | With Mortgage |
| Less than $10,000 | 0 (0.0%) | 0 (0.0%) |
| $10,000 to $24,999 | 0 (0.0%) | 0 (0.0%) |
| $25,000 to $34,999 | 0 (0.0%) | 0 (0.0%) |
| $35,000 to $49,999 | 18 (38.3%) | 0 (0.0%) |
| $50,000 to $74,999 | 15 (31.9%) | 0 (0.0%) |
| $75,000 to $99,999 | 0 (0.0%) | 0 (0.0%) |
| $100,000 to $149,999 | 14 (29.8%) | 18 (16.8%) |
| $150,000 or more | 0 (0.0%) | 79 (73.8%) |
| Total | 47 (100.0%) | 107 (100.0%) |
Property Value to Household Income Ratio in East Avon
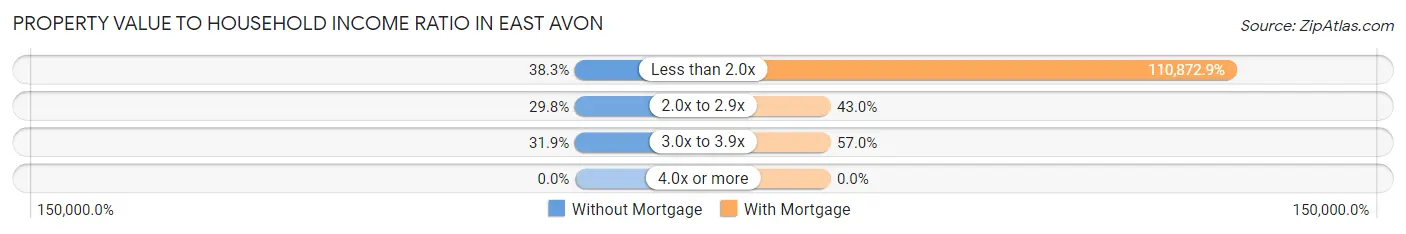
| Value-to-Income Ratio | Without Mortgage | With Mortgage |
| Less than 2.0x | 18 (38.3%) | 118,634 (110,872.9%) |
| 2.0x to 2.9x | 14 (29.8%) | 46 (43.0%) |
| 3.0x to 3.9x | 15 (31.9%) | 61 (57.0%) |
| 4.0x or more | 0 (0.0%) | 0 (0.0%) |
| Total | 47 (100.0%) | 107 (100.0%) |
Real Estate Taxes by Mortgage Status in East Avon
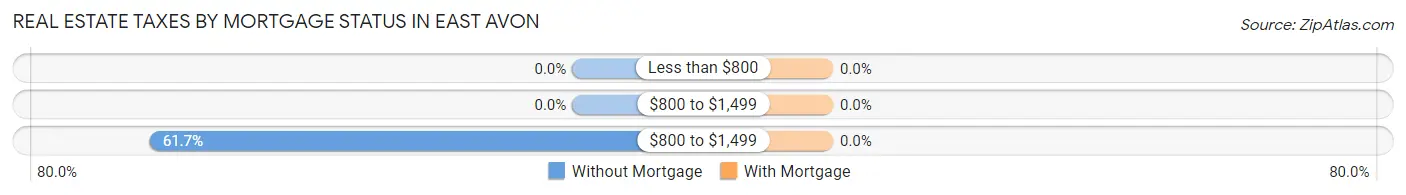
| Property Taxes | Without Mortgage | With Mortgage |
| Less than $800 | 0 (0.0%) | 0 (0.0%) |
| $800 to $1,499 | 0 (0.0%) | 0 (0.0%) |
| $800 to $1,499 | 29 (61.7%) | 0 (0.0%) |
| Total | 47 (100.0%) | 107 (100.0%) |
Health & Disability in East Avon
Health Insurance Coverage by Age in East Avon
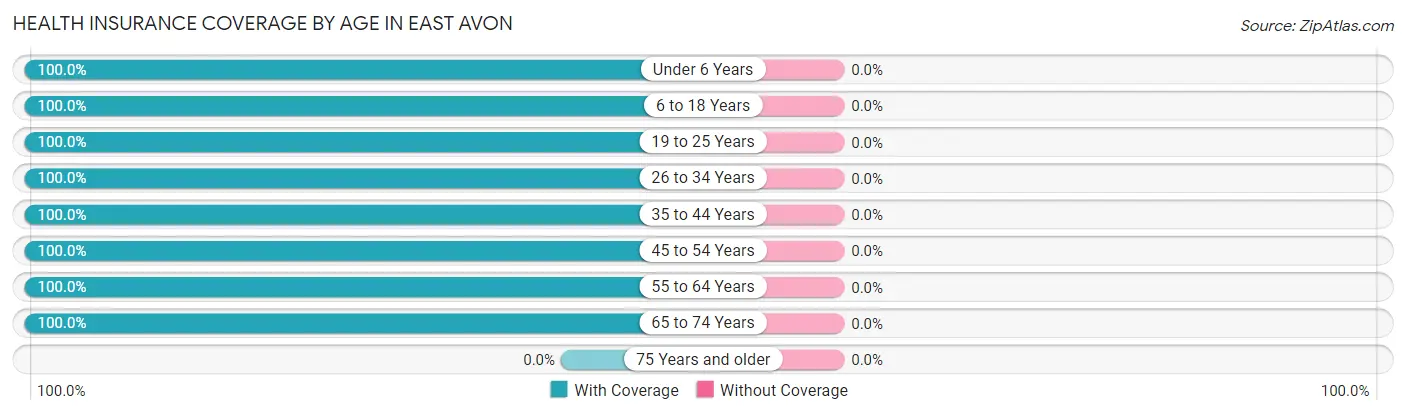
| Age Bracket | With Coverage | Without Coverage |
| Under 6 Years | 27 (100.0%) | 0 (0.0%) |
| 6 to 18 Years | 189 (100.0%) | 0 (0.0%) |
| 19 to 25 Years | 45 (100.0%) | 0 (0.0%) |
| 26 to 34 Years | 31 (100.0%) | 0 (0.0%) |
| 35 to 44 Years | 142 (100.0%) | 0 (0.0%) |
| 45 to 54 Years | 55 (100.0%) | 0 (0.0%) |
| 55 to 64 Years | 35 (100.0%) | 0 (0.0%) |
| 65 to 74 Years | 44 (100.0%) | 0 (0.0%) |
| 75 Years and older | 0 (0.0%) | 0 (0.0%) |
| Total | 568 (100.0%) | 0 (0.0%) |
Health Insurance Coverage by Citizenship Status in East Avon
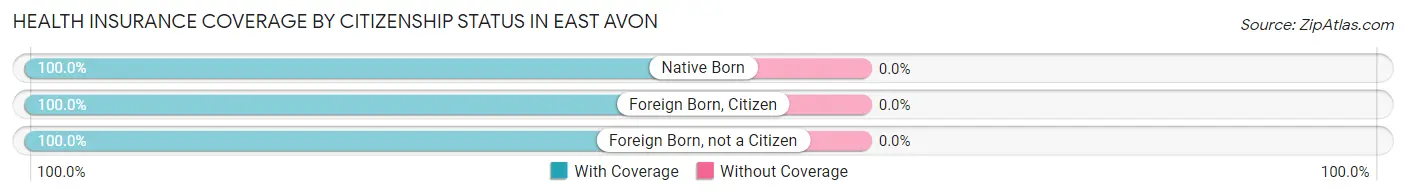
| Citizenship Status | With Coverage | Without Coverage |
| Native Born | 27 (100.0%) | 0 (0.0%) |
| Foreign Born, Citizen | 189 (100.0%) | 0 (0.0%) |
| Foreign Born, not a Citizen | 45 (100.0%) | 0 (0.0%) |
Health Insurance Coverage by Household Income in East Avon
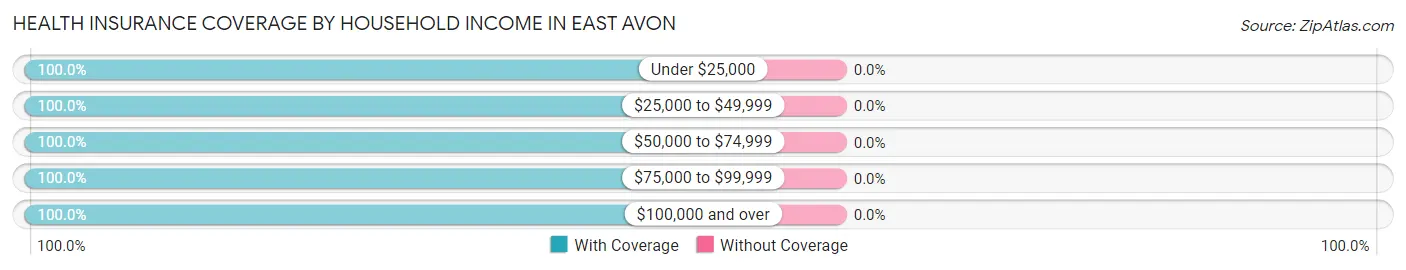
| Household Income | With Coverage | Without Coverage |
| Under $25,000 | 11 (100.0%) | 0 (0.0%) |
| $25,000 to $49,999 | 75 (100.0%) | 0 (0.0%) |
| $50,000 to $74,999 | 32 (100.0%) | 0 (0.0%) |
| $75,000 to $99,999 | 36 (100.0%) | 0 (0.0%) |
| $100,000 and over | 414 (100.0%) | 0 (0.0%) |
Public vs Private Health Insurance Coverage by Age in East Avon
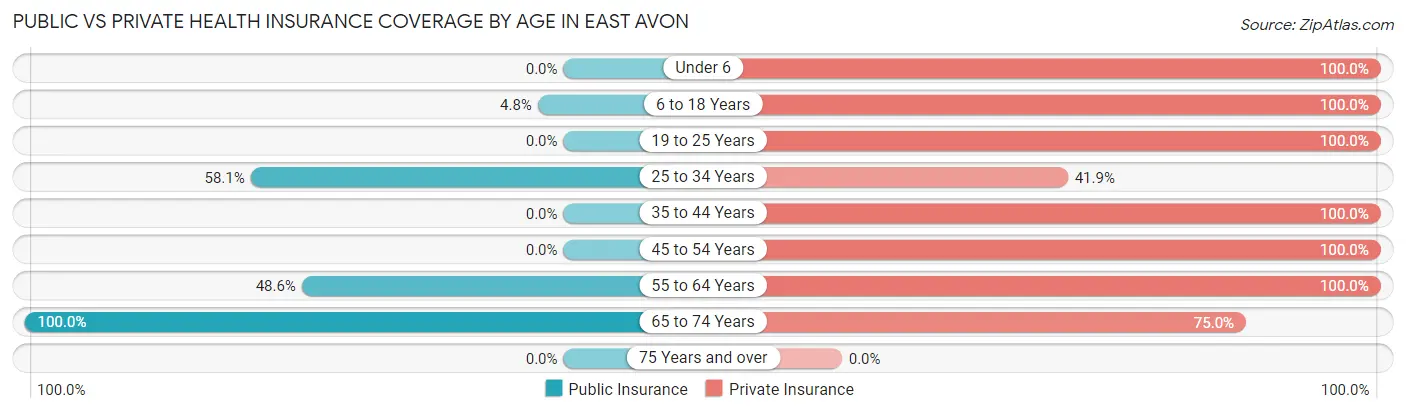
| Age Bracket | Public Insurance | Private Insurance |
| Under 6 | 0 (0.0%) | 27 (100.0%) |
| 6 to 18 Years | 9 (4.8%) | 189 (100.0%) |
| 19 to 25 Years | 0 (0.0%) | 45 (100.0%) |
| 25 to 34 Years | 18 (58.1%) | 13 (41.9%) |
| 35 to 44 Years | 0 (0.0%) | 142 (100.0%) |
| 45 to 54 Years | 0 (0.0%) | 55 (100.0%) |
| 55 to 64 Years | 17 (48.6%) | 35 (100.0%) |
| 65 to 74 Years | 44 (100.0%) | 33 (75.0%) |
| 75 Years and over | 0 (0.0%) | 0 (0.0%) |
| Total | 88 (15.5%) | 539 (94.9%) |
Disability Status by Sex by Age in East Avon
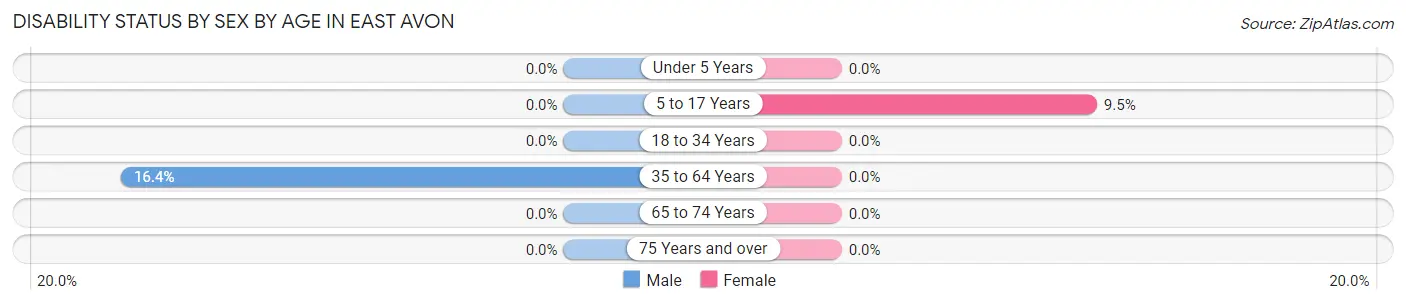
| Age Bracket | Male | Female |
| Under 5 Years | 0 (0.0%) | 0 (0.0%) |
| 5 to 17 Years | 0 (0.0%) | 9 (9.5%) |
| 18 to 34 Years | 0 (0.0%) | 0 (0.0%) |
| 35 to 64 Years | 22 (16.4%) | 0 (0.0%) |
| 65 to 74 Years | 0 (0.0%) | 0 (0.0%) |
| 75 Years and over | 0 (0.0%) | 0 (0.0%) |
Disability Class by Sex by Age in East Avon
Disability Class: Hearing Difficulty
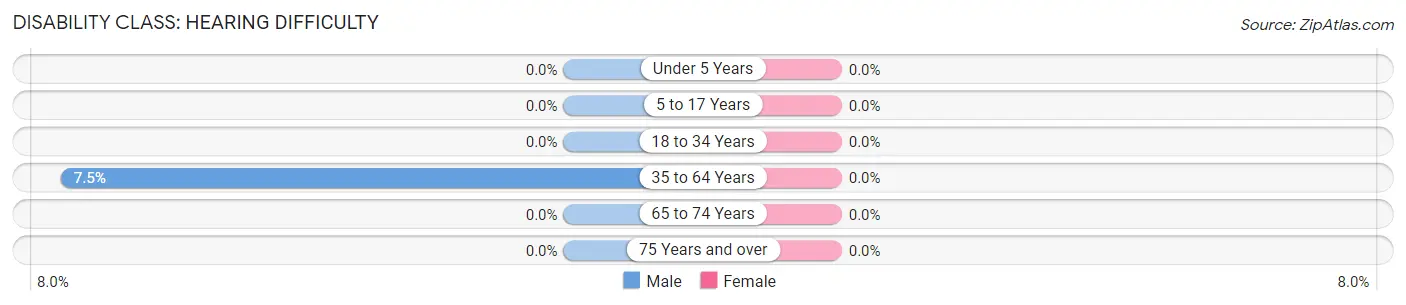
| Age Bracket | Male | Female |
| Under 5 Years | 0 (0.0%) | 0 (0.0%) |
| 5 to 17 Years | 0 (0.0%) | 0 (0.0%) |
| 18 to 34 Years | 0 (0.0%) | 0 (0.0%) |
| 35 to 64 Years | 10 (7.5%) | 0 (0.0%) |
| 65 to 74 Years | 0 (0.0%) | 0 (0.0%) |
| 75 Years and over | 0 (0.0%) | 0 (0.0%) |
Disability Class: Vision Difficulty
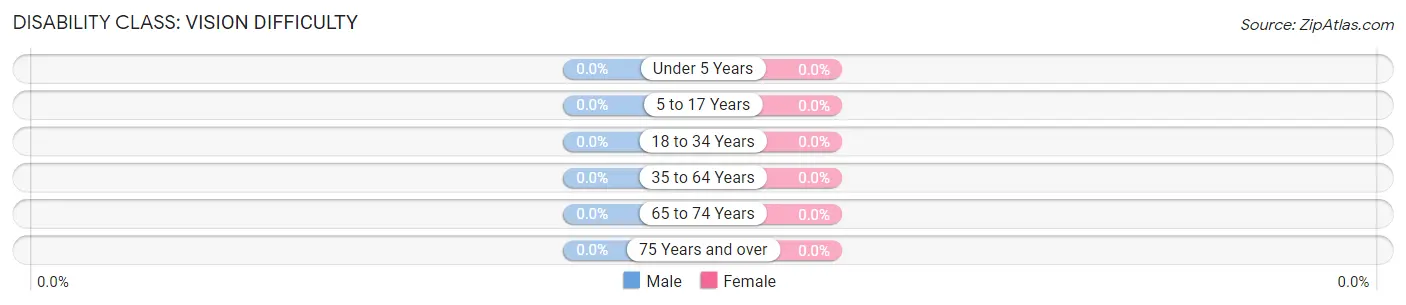
| Age Bracket | Male | Female |
| Under 5 Years | 0 (0.0%) | 0 (0.0%) |
| 5 to 17 Years | 0 (0.0%) | 0 (0.0%) |
| 18 to 34 Years | 0 (0.0%) | 0 (0.0%) |
| 35 to 64 Years | 0 (0.0%) | 0 (0.0%) |
| 65 to 74 Years | 0 (0.0%) | 0 (0.0%) |
| 75 Years and over | 0 (0.0%) | 0 (0.0%) |
Disability Class: Cognitive Difficulty
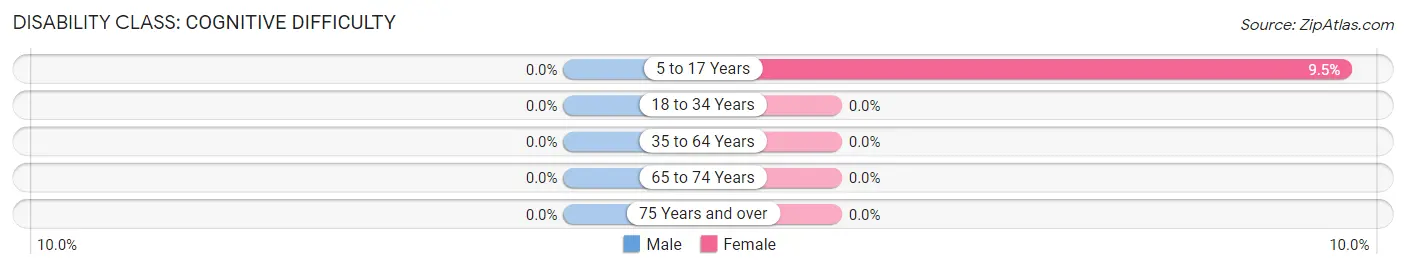
| Age Bracket | Male | Female |
| 5 to 17 Years | 0 (0.0%) | 9 (9.5%) |
| 18 to 34 Years | 0 (0.0%) | 0 (0.0%) |
| 35 to 64 Years | 0 (0.0%) | 0 (0.0%) |
| 65 to 74 Years | 0 (0.0%) | 0 (0.0%) |
| 75 Years and over | 0 (0.0%) | 0 (0.0%) |
Disability Class: Ambulatory Difficulty
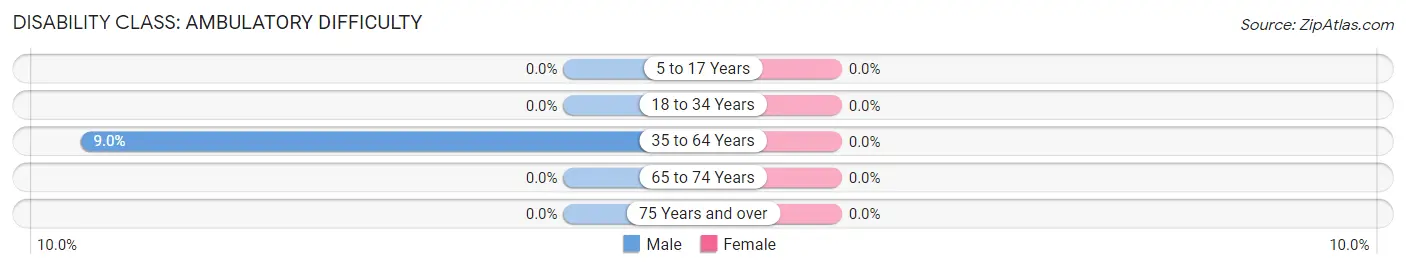
| Age Bracket | Male | Female |
| 5 to 17 Years | 0 (0.0%) | 0 (0.0%) |
| 18 to 34 Years | 0 (0.0%) | 0 (0.0%) |
| 35 to 64 Years | 12 (9.0%) | 0 (0.0%) |
| 65 to 74 Years | 0 (0.0%) | 0 (0.0%) |
| 75 Years and over | 0 (0.0%) | 0 (0.0%) |
Disability Class: Self-Care Difficulty
| Age Bracket | Male | Female |
| 5 to 17 Years | 0 (0.0%) | 0 (0.0%) |
| 18 to 34 Years | 0 (0.0%) | 0 (0.0%) |
| 35 to 64 Years | 0 (0.0%) | 0 (0.0%) |
| 65 to 74 Years | 0 (0.0%) | 0 (0.0%) |
| 75 Years and over | 0 (0.0%) | 0 (0.0%) |
Technology Access in East Avon
Computing Device Access in East Avon
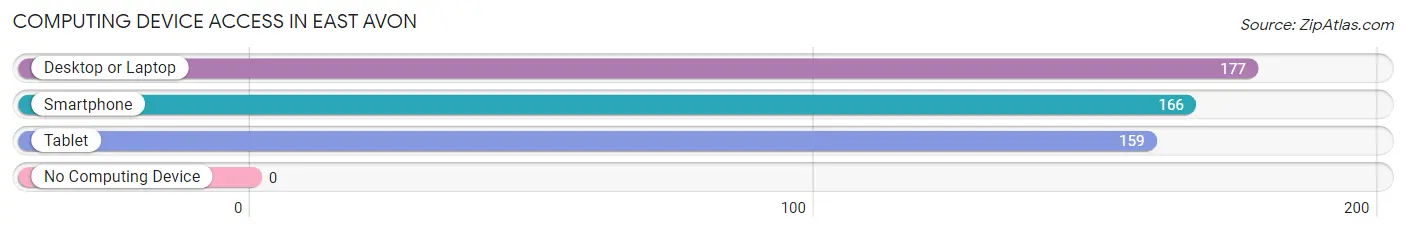
| Device Type | # Households | % Households |
| Desktop or Laptop | 177 | 100.0% |
| Smartphone | 166 | 93.8% |
| Tablet | 159 | 89.8% |
| No Computing Device | 0 | 0.0% |
| Total | 177 | 100.0% |
Internet Access in East Avon
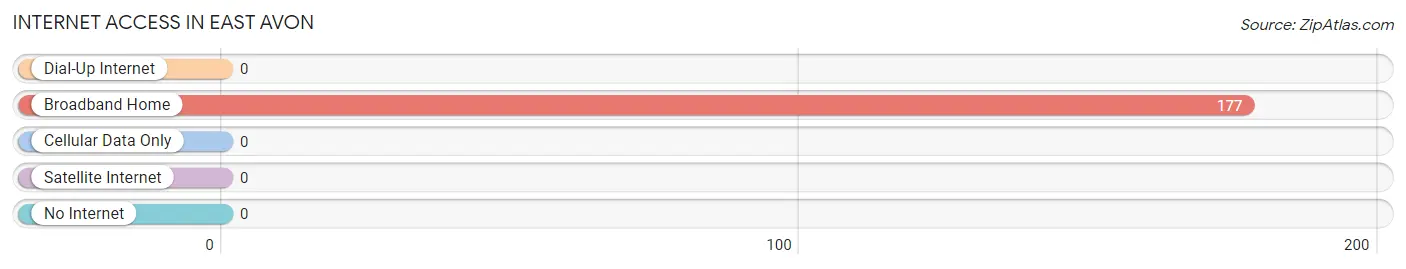
| Internet Type | # Households | % Households |
| Dial-Up Internet | 0 | 0.0% |
| Broadband Home | 177 | 100.0% |
| Cellular Data Only | 0 | 0.0% |
| Satellite Internet | 0 | 0.0% |
| No Internet | 0 | 0.0% |
| Total | 177 | 100.0% |
East Avon Summary
Avon, New York is a small town located in the Finger Lakes region of New York State. It is situated in the town of Avon, Livingston County, and is part of the Rochester Metropolitan Statistical Area. The town has a population of approximately 8,000 people and is located about 25 miles south of Rochester.
History
Avon was first settled in 1789 by a group of settlers from Connecticut. The town was originally known as “East Avon” and was part of the town of Caledonia. In 1808, the town was officially incorporated as the town of Avon.
The town was named after the Avon River in England. The town was originally an agricultural community, with many of the early settlers being farmers. The town was also home to several mills, including a grist mill, a saw mill, and a woolen mill.
In the late 19th century, the town began to experience a period of growth and development. The railroad arrived in 1853, and the town became a popular tourist destination. The town was also home to several factories, including a paper mill, a canning factory, and a brickyard.
Geography
Avon is located in the Finger Lakes region of New York State. The town is situated in the town of Avon, Livingston County, and is part of the Rochester Metropolitan Statistical Area. The town is located about 25 miles south of Rochester.
The town is situated on the east side of the Genesee River, and is bordered by the towns of Caledonia, Geneseo, and Lima. The town is also bordered by the villages of Avon and Geneseo.
The town has a total area of 8.2 square miles, of which 8.1 square miles is land and 0.1 square miles is water. The town is located in a hilly region, with elevations ranging from 600 to 1,000 feet above sea level.
Economy
Avon’s economy is largely based on agriculture and tourism. The town is home to several farms, which produce a variety of crops, including corn, soybeans, and hay. The town is also home to several wineries, which produce a variety of wines.
The town is also home to several manufacturing companies, including a paper mill, a canning factory, and a brickyard. The town is also home to several retail stores, restaurants, and other businesses.
Demographics
As of the 2010 census, Avon had a population of 8,093 people. The racial makeup of the town was 94.3% White, 1.7% African American, 0.3% Native American, 0.7% Asian, 0.1% Pacific Islander, 1.2% from other races, and 1.9% from two or more races. Hispanic or Latino of any race were 3.3% of the population.
The median income for a household in the town was $45,938, and the median income for a family was $54,917. The per capita income for the town was $21,945. About 6.3% of families and 8.7% of the population were below the poverty line, including 10.2% of those under age 18 and 6.2% of those age 65 or over.
Common Questions
What is Per Capita Income in East Avon?
Per Capita income in East Avon is $28,768.
What is the Median Family Income in East Avon?
Median Family Income in East Avon is $105,156.
What is the Median Household income in East Avon?
Median Household Income in East Avon is $105,078.
What is Income or Wage Gap in East Avon?
Income or Wage Gap in East Avon is 9.8%.
Women in East Avon earn 90.2 cents for every dollar earned by a man.
What is Inequality or Gini Index in East Avon?
Inequality or Gini Index in East Avon is 0.24.
What is the Total Population of East Avon?
Total Population of East Avon is 568.
What is the Total Male Population of East Avon?
Total Male Population of East Avon is 291.
What is the Total Female Population of East Avon?
Total Female Population of East Avon is 277.
What is the Ratio of Males per 100 Females in East Avon?
There are 105.05 Males per 100 Females in East Avon.
What is the Ratio of Females per 100 Males in East Avon?
There are 95.19 Females per 100 Males in East Avon.
What is the Median Population Age in East Avon?
Median Population Age in East Avon is 34.4 Years.
What is the Average Family Size in East Avon
Average Family Size in East Avon is 3.4 People.
What is the Average Household Size in East Avon
Average Household Size in East Avon is 3.2 People.
How Large is the Labor Force in East Avon?
There are 291 People in the Labor Forcein in East Avon.
What is the Percentage of People in the Labor Force in East Avon?
79.5% of People are in the Labor Force in East Avon.
What is the Unemployment Rate in East Avon?
Unemployment Rate in East Avon is 6.2%.