Herricks, NY Map & Demographics
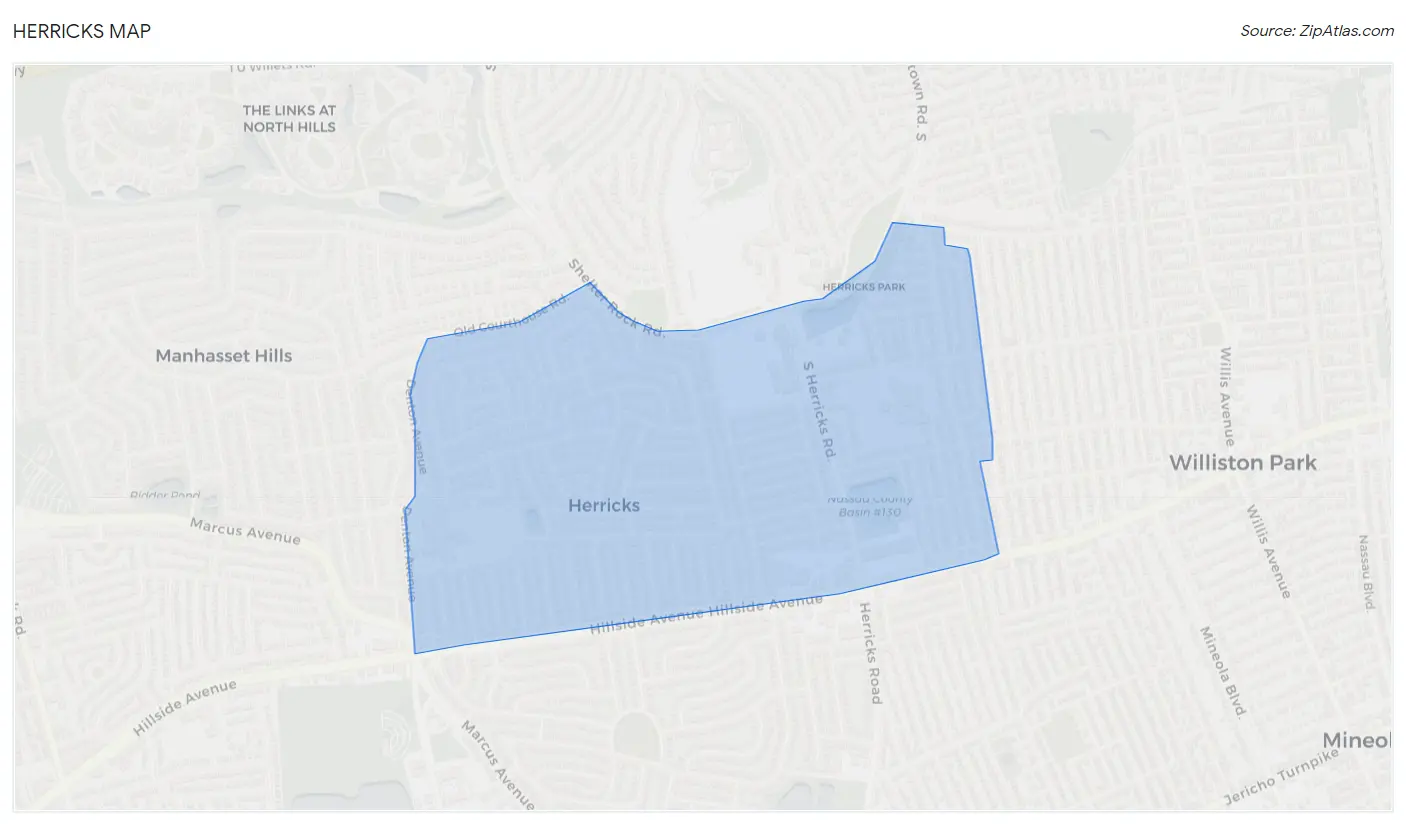
Herricks Map
Herricks Overview
$62,322
PER CAPITA INCOME
$167,292
AVG FAMILY INCOME
$156,625
AVG HOUSEHOLD INCOME
41.6%
WAGE / INCOME GAP [ % ]
58.4¢/ $1
WAGE / INCOME GAP [ $ ]
0.44
INEQUALITY / GINI INDEX
4,225
TOTAL POPULATION
2,010
MALE POPULATION
2,215
FEMALE POPULATION
90.74
MALES / 100 FEMALES
110.20
FEMALES / 100 MALES
47.7
MEDIAN AGE
3.5
AVG FAMILY SIZE
3.3
AVG HOUSEHOLD SIZE
1,960
LABOR FORCE [ PEOPLE ]
56.2%
PERCENT IN LABOR FORCE
8.1%
UNEMPLOYMENT RATE
Income in Herricks
Income Overview in Herricks
Per Capita Income in Herricks is $62,322, while median incomes of families and households are $167,292 and $156,625 respectively.
| Characteristic | Number | Measure |
| Per Capita Income | 4,225 | $62,322 |
| Median Family Income | 1,143 | $167,292 |
| Mean Family Income | 1,143 | $217,546 |
| Median Household Income | 1,285 | $156,625 |
| Mean Household Income | 1,285 | $206,237 |
| Income Deficit | 1,143 | $0 |
| Wage / Income Gap (%) | 4,225 | 41.57% |
| Wage / Income Gap ($) | 4,225 | 58.43¢ per $1 |
| Gini / Inequality Index | 4,225 | 0.44 |
Earnings by Sex in Herricks
Average Earnings in Herricks are $57,292, $79,851 for men and $46,653 for women, a difference of 41.6%.
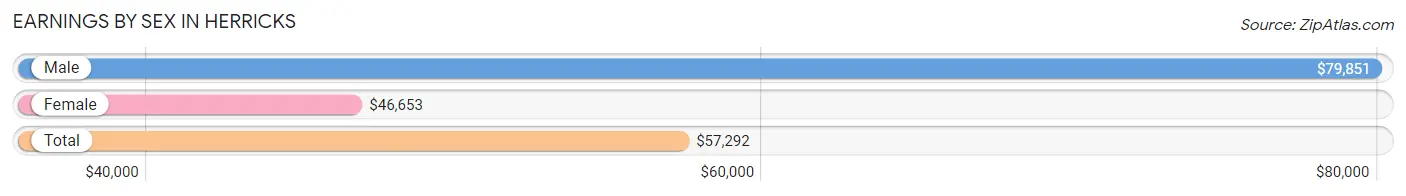
| Sex | Number | Average Earnings |
| Male | 1,055 (50.7%) | $79,851 |
| Female | 1,027 (49.3%) | $46,653 |
| Total | 2,082 (100.0%) | $57,292 |
Earnings by Sex by Income Bracket in Herricks
The most common earnings brackets in Herricks are $100,000+ for men (437 | 41.4%) and $100,000+ for women (267 | 26.0%).
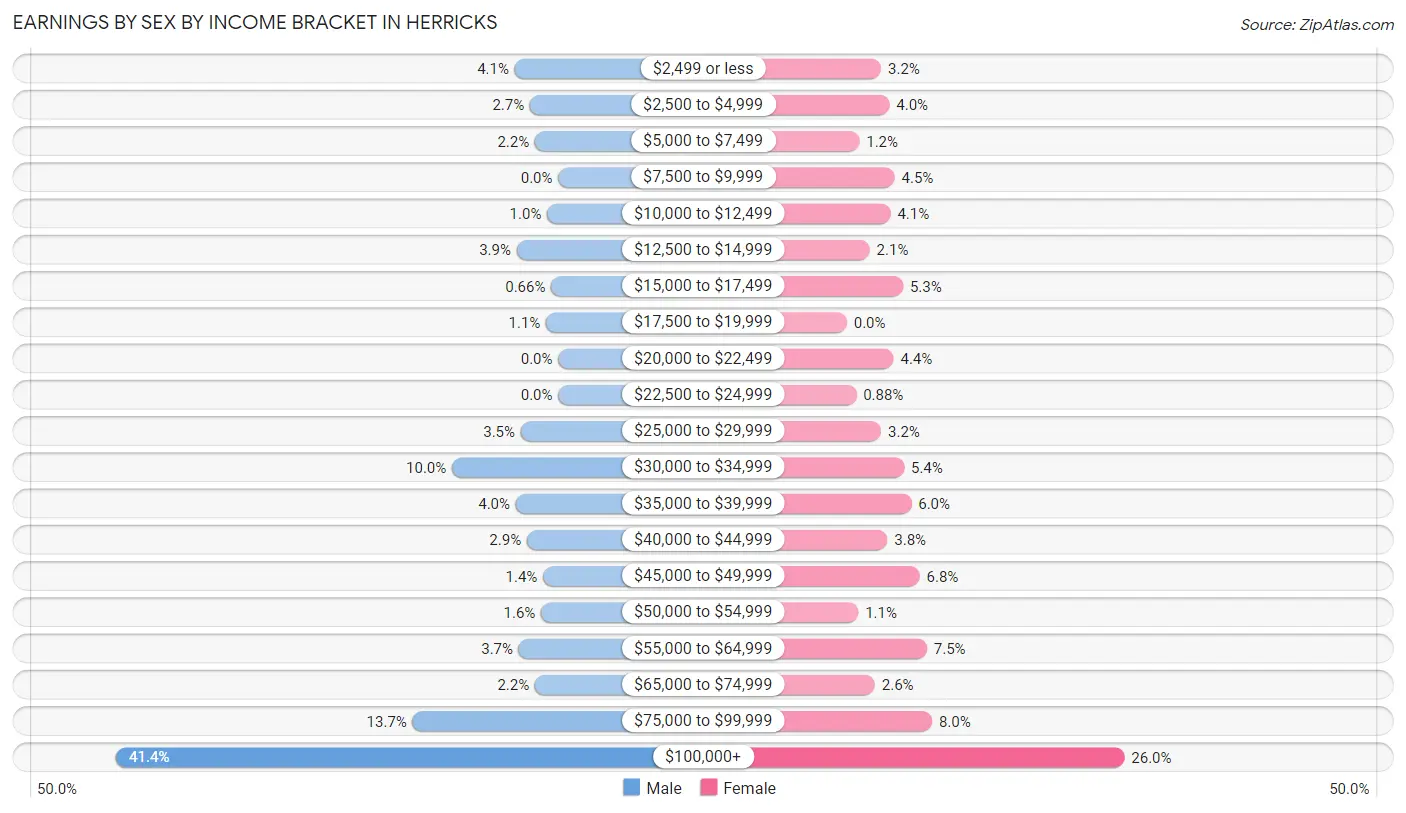
| Income | Male | Female |
| $2,499 or less | 43 (4.1%) | 33 (3.2%) |
| $2,500 to $4,999 | 28 (2.6%) | 41 (4.0%) |
| $5,000 to $7,499 | 23 (2.2%) | 12 (1.2%) |
| $7,500 to $9,999 | 0 (0.0%) | 46 (4.5%) |
| $10,000 to $12,499 | 11 (1.0%) | 42 (4.1%) |
| $12,500 to $14,999 | 41 (3.9%) | 22 (2.1%) |
| $15,000 to $17,499 | 7 (0.7%) | 54 (5.3%) |
| $17,500 to $19,999 | 12 (1.1%) | 0 (0.0%) |
| $20,000 to $22,499 | 0 (0.0%) | 45 (4.4%) |
| $22,500 to $24,999 | 0 (0.0%) | 9 (0.9%) |
| $25,000 to $29,999 | 37 (3.5%) | 33 (3.2%) |
| $30,000 to $34,999 | 105 (10.0%) | 55 (5.4%) |
| $35,000 to $39,999 | 42 (4.0%) | 62 (6.0%) |
| $40,000 to $44,999 | 31 (2.9%) | 39 (3.8%) |
| $45,000 to $49,999 | 15 (1.4%) | 70 (6.8%) |
| $50,000 to $54,999 | 17 (1.6%) | 11 (1.1%) |
| $55,000 to $64,999 | 39 (3.7%) | 77 (7.5%) |
| $65,000 to $74,999 | 23 (2.2%) | 27 (2.6%) |
| $75,000 to $99,999 | 144 (13.7%) | 82 (8.0%) |
| $100,000+ | 437 (41.4%) | 267 (26.0%) |
| Total | 1,055 (100.0%) | 1,027 (100.0%) |
Earnings by Sex by Educational Attainment in Herricks
Average earnings in Herricks are $94,688 for men and $49,327 for women, a difference of 47.9%. Men with an educational attainment of graduate degree enjoy the highest average annual earnings of $140,588, while those with college or associate's degree education earn the least with $55,865. Women with an educational attainment of graduate degree earn the most with the average annual earnings of $93,600, while those with high school diploma education have the smallest earnings of $21,563.
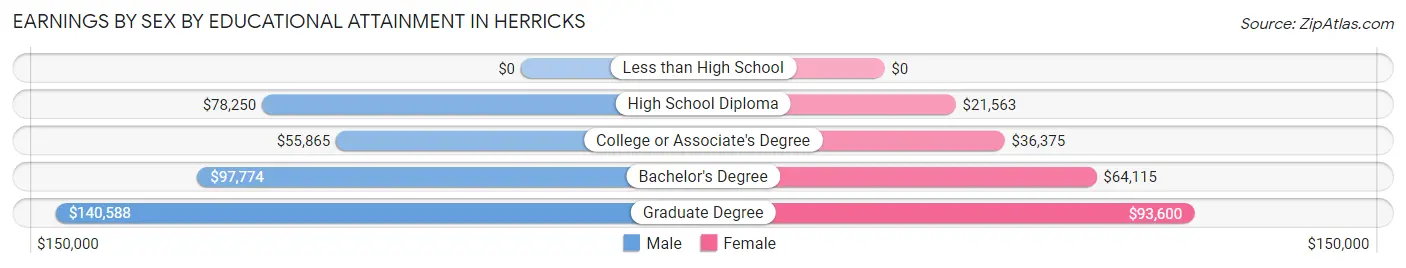
| Educational Attainment | Male Income | Female Income |
| Less than High School | - | - |
| High School Diploma | $78,250 | $21,563 |
| College or Associate's Degree | $55,865 | $36,375 |
| Bachelor's Degree | $97,774 | $64,115 |
| Graduate Degree | $140,588 | $93,600 |
| Total | $94,688 | $49,327 |
Family Income in Herricks
Family Income Brackets in Herricks
According to the Herricks family income data, there are 491 families falling into the $200,000+ income range, which is the most common income bracket and makes up 43.0% of all families.
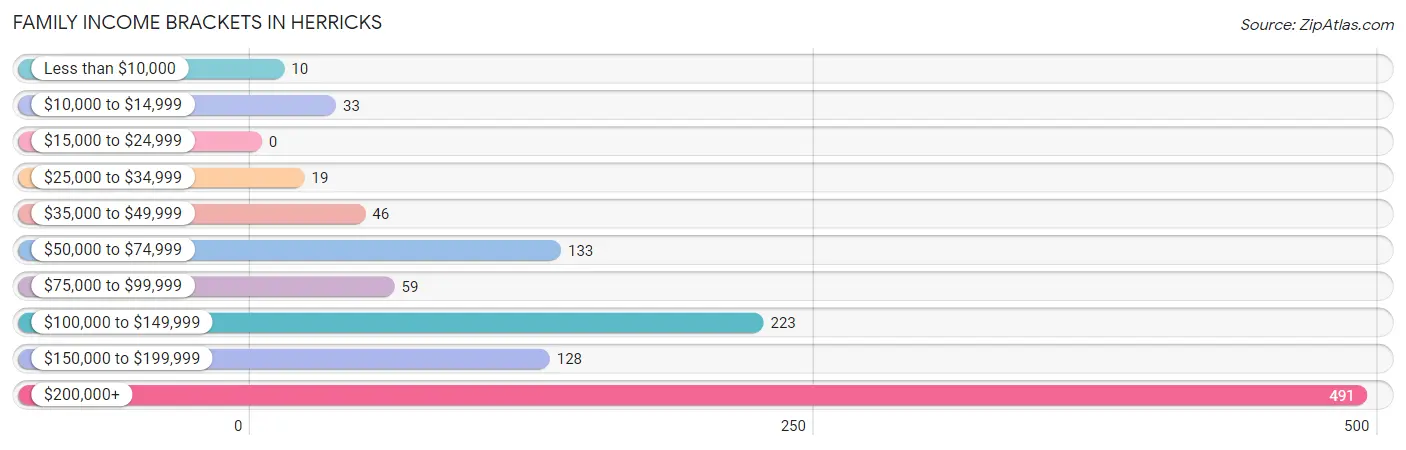
| Income Bracket | # Families | % Families |
| Less than $10,000 | 10 | 0.9% |
| $10,000 to $14,999 | 33 | 2.9% |
| $15,000 to $24,999 | 0 | 0.0% |
| $25,000 to $34,999 | 19 | 1.7% |
| $35,000 to $49,999 | 46 | 4.0% |
| $50,000 to $74,999 | 133 | 11.6% |
| $75,000 to $99,999 | 59 | 5.2% |
| $100,000 to $149,999 | 223 | 19.5% |
| $150,000 to $199,999 | 128 | 11.2% |
| $200,000+ | 491 | 43.0% |
Family Income by Famaliy Size in Herricks
5-person families (105 | 9.2%) account for the highest median family income in Herricks with $250,001 per family, while 4-person families (266 | 23.3%) have the highest median income of $62,273 per family member.
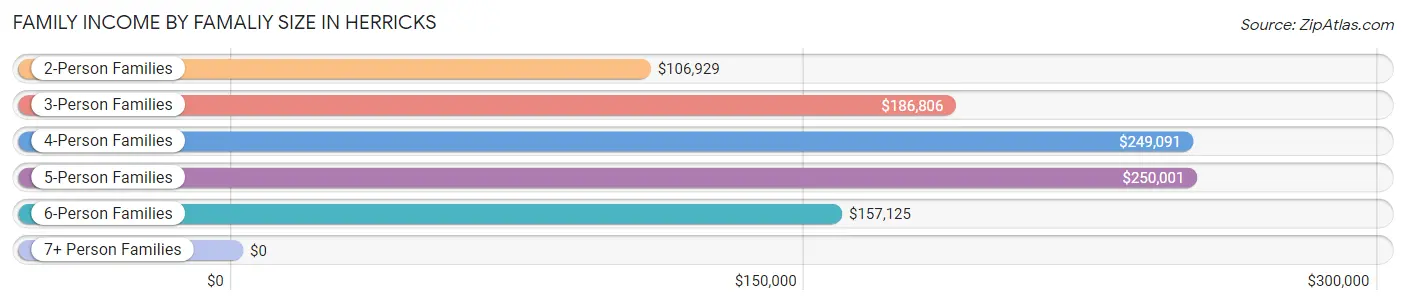
| Income Bracket | # Families | Median Income |
| 2-Person Families | 392 (34.3%) | $106,929 |
| 3-Person Families | 273 (23.9%) | $186,806 |
| 4-Person Families | 266 (23.3%) | $249,091 |
| 5-Person Families | 105 (9.2%) | $250,001 |
| 6-Person Families | 67 (5.9%) | $157,125 |
| 7+ Person Families | 40 (3.5%) | $0 |
| Total | 1,143 (100.0%) | $167,292 |
Family Income by Number of Earners in Herricks
The median family income in Herricks is $167,292, with families comprising 3+ earners (256) having the highest median family income of $250,001, while families with no earners (143) have the lowest median family income of $51,250, accounting for 22.4% and 12.5% of families, respectively.
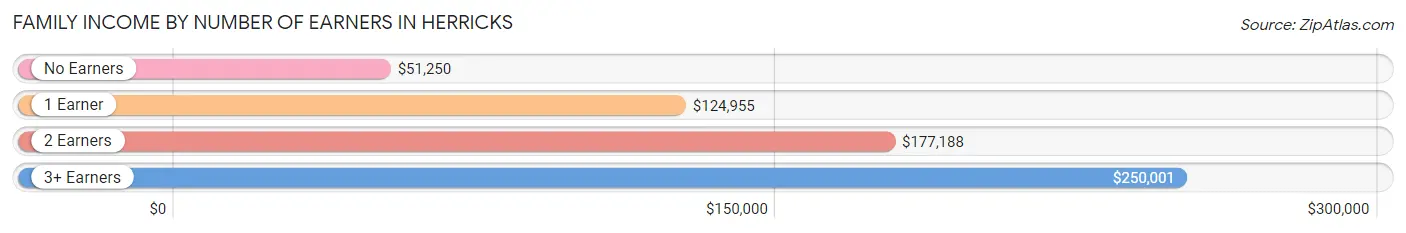
| Number of Earners | # Families | Median Income |
| No Earners | 143 (12.5%) | $51,250 |
| 1 Earner | 304 (26.6%) | $124,955 |
| 2 Earners | 440 (38.5%) | $177,188 |
| 3+ Earners | 256 (22.4%) | $250,001 |
| Total | 1,143 (100.0%) | $167,292 |
Household Income in Herricks
Household Income Brackets in Herricks
With 517 households falling in the category, the $200,000+ income range is the most frequent in Herricks, accounting for 40.2% of all households. In contrast, only 12 households (0.9%) fall into the $15,000 to $24,999 income bracket, making it the least populous group.
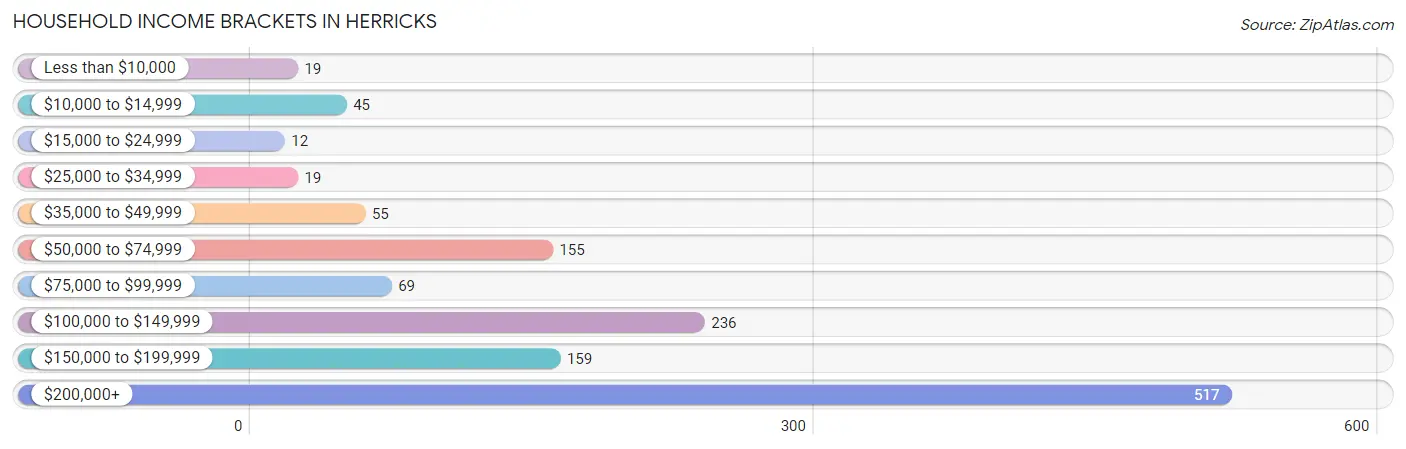
| Income Bracket | # Households | % Households |
| Less than $10,000 | 19 | 1.5% |
| $10,000 to $14,999 | 45 | 3.5% |
| $15,000 to $24,999 | 12 | 0.9% |
| $25,000 to $34,999 | 19 | 1.5% |
| $35,000 to $49,999 | 55 | 4.3% |
| $50,000 to $74,999 | 155 | 12.1% |
| $75,000 to $99,999 | 69 | 5.4% |
| $100,000 to $149,999 | 236 | 18.4% |
| $150,000 to $199,999 | 159 | 12.4% |
| $200,000+ | 517 | 40.2% |
Household Income by Householder Age in Herricks
The median household income in Herricks is $156,625, with the highest median household income of $204,250 found in the 25 to 44 years age bracket for the primary householder. A total of 161 households (12.5%) fall into this category.
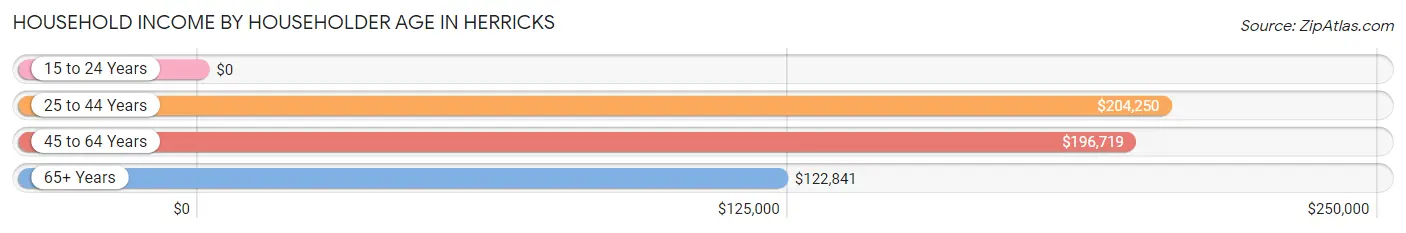
| Income Bracket | # Households | Median Income |
| 15 to 24 Years | 0 (0.0%) | $0 |
| 25 to 44 Years | 161 (12.5%) | $204,250 |
| 45 to 64 Years | 645 (50.2%) | $196,719 |
| 65+ Years | 479 (37.3%) | $122,841 |
| Total | 1,285 (100.0%) | $156,625 |
Poverty in Herricks
Income Below Poverty by Sex and Age in Herricks
With 7.4% poverty level for males and 5.8% for females among the residents of Herricks, 16 and 17 year old males and 12 to 14 year old females are the most vulnerable to poverty, with 40 males (48.8%) and 47 females (34.3%) in their respective age groups living below the poverty level.
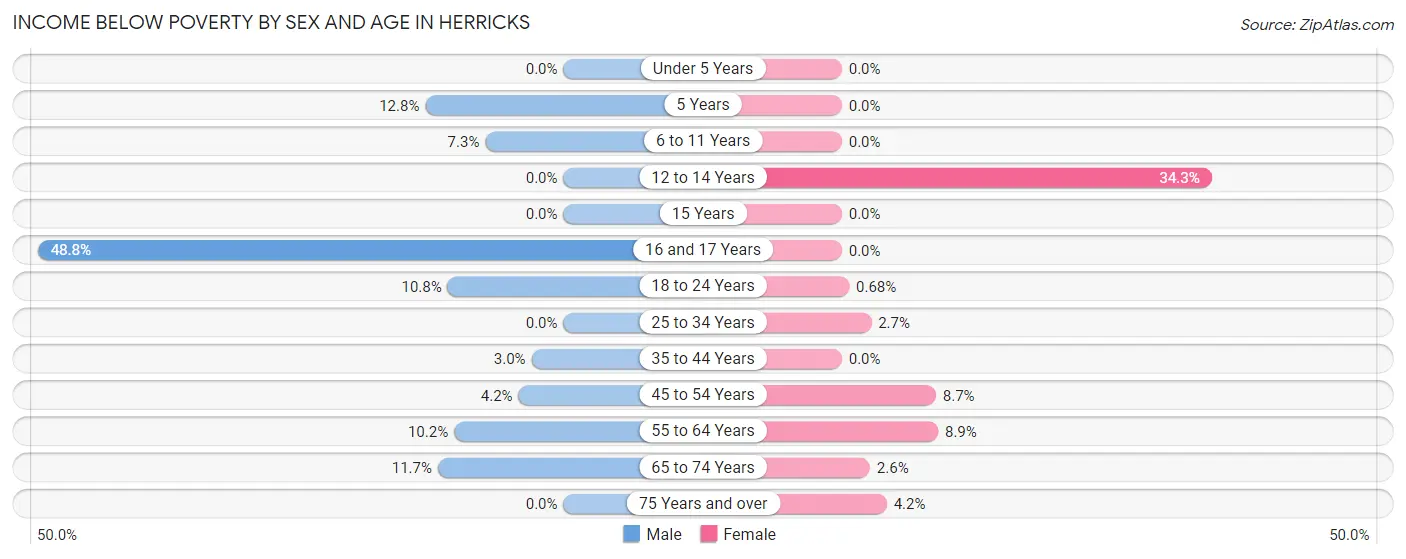
| Age Bracket | Male | Female |
| Under 5 Years | 0 (0.0%) | 0 (0.0%) |
| 5 Years | 5 (12.8%) | 0 (0.0%) |
| 6 to 11 Years | 5 (7.2%) | 0 (0.0%) |
| 12 to 14 Years | 0 (0.0%) | 47 (34.3%) |
| 15 Years | 0 (0.0%) | 0 (0.0%) |
| 16 and 17 Years | 40 (48.8%) | 0 (0.0%) |
| 18 to 24 Years | 23 (10.7%) | 1 (0.7%) |
| 25 to 34 Years | 0 (0.0%) | 6 (2.7%) |
| 35 to 44 Years | 6 (3.0%) | 0 (0.0%) |
| 45 to 54 Years | 14 (4.2%) | 24 (8.7%) |
| 55 to 64 Years | 27 (10.2%) | 31 (8.9%) |
| 65 to 74 Years | 29 (11.7%) | 9 (2.6%) |
| 75 Years and over | 0 (0.0%) | 10 (4.2%) |
| Total | 149 (7.4%) | 128 (5.8%) |
Income Above Poverty by Sex and Age in Herricks
According to the poverty statistics in Herricks, males aged under 5 years and females aged under 5 years are the age groups that are most secure financially, with 100.0% of males and 100.0% of females in these age groups living above the poverty line.
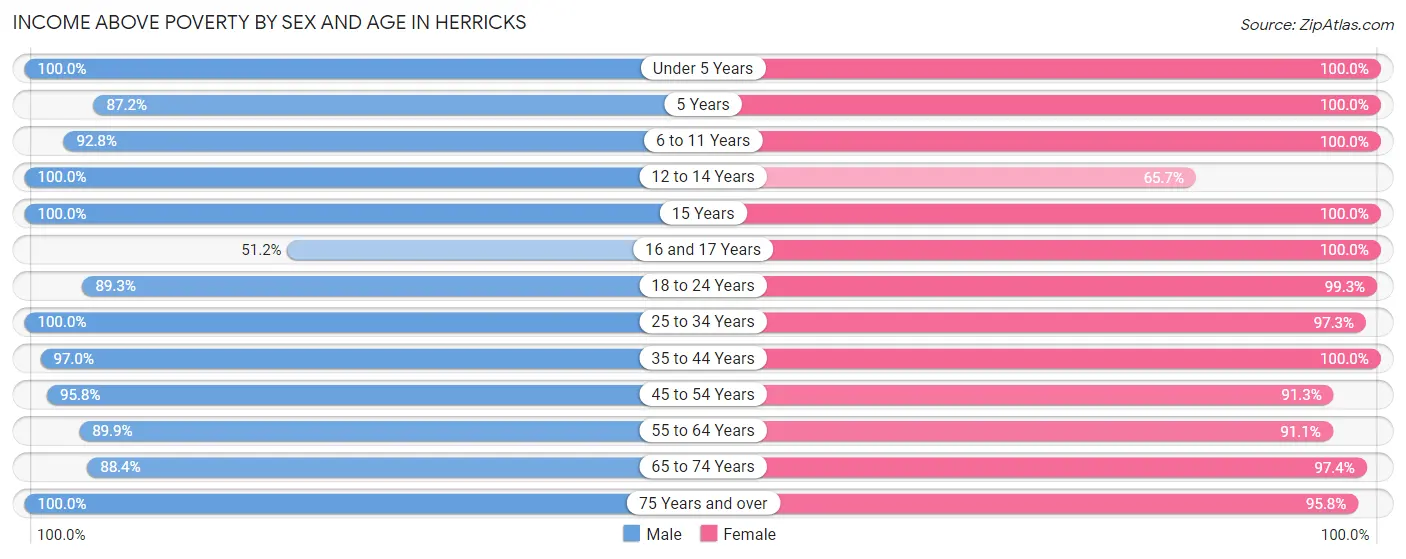
| Age Bracket | Male | Female |
| Under 5 Years | 74 (100.0%) | 121 (100.0%) |
| 5 Years | 34 (87.2%) | 37 (100.0%) |
| 6 to 11 Years | 64 (92.7%) | 119 (100.0%) |
| 12 to 14 Years | 94 (100.0%) | 90 (65.7%) |
| 15 Years | 28 (100.0%) | 15 (100.0%) |
| 16 and 17 Years | 42 (51.2%) | 30 (100.0%) |
| 18 to 24 Years | 191 (89.2%) | 145 (99.3%) |
| 25 to 34 Years | 178 (100.0%) | 214 (97.3%) |
| 35 to 44 Years | 197 (97.0%) | 178 (100.0%) |
| 45 to 54 Years | 322 (95.8%) | 251 (91.3%) |
| 55 to 64 Years | 239 (89.8%) | 316 (91.1%) |
| 65 to 74 Years | 220 (88.3%) | 336 (97.4%) |
| 75 Years and over | 178 (100.0%) | 230 (95.8%) |
| Total | 1,861 (92.6%) | 2,082 (94.2%) |
Income Below Poverty Among Married-Couple Families in Herricks
The poverty statistics for married-couple families in Herricks show that 4.4% or 40 of the total 902 families live below the poverty line. Families with 1 or 2 children have the highest poverty rate of 5.9%, comprising of 20 families. On the other hand, families with 3 or 4 children have the lowest poverty rate of 0.0%, which includes 0 families.
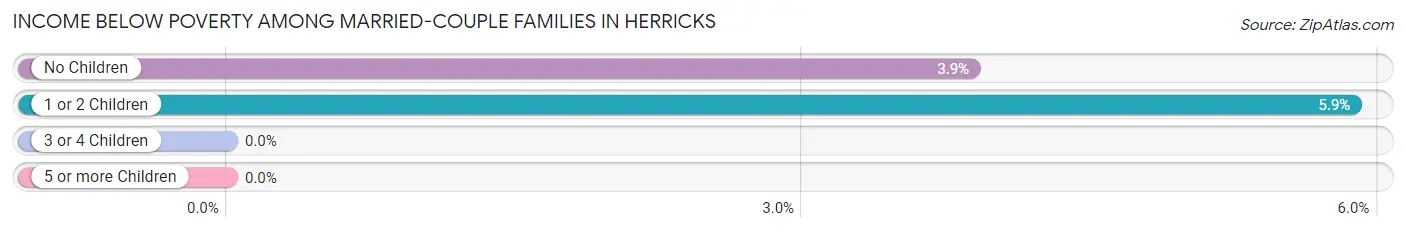
| Children | Above Poverty | Below Poverty |
| No Children | 495 (96.1%) | 20 (3.9%) |
| 1 or 2 Children | 321 (94.1%) | 20 (5.9%) |
| 3 or 4 Children | 46 (100.0%) | 0 (0.0%) |
| 5 or more Children | 0 (0.0%) | 0 (0.0%) |
| Total | 862 (95.6%) | 40 (4.4%) |
Income Below Poverty Among Single-Parent Households in Herricks
According to the poverty data in Herricks, 40.0% or 14 single-father households and 4.4% or 9 single-mother households are living below the poverty line. Among single-father households, those with no children have the highest poverty rate, with 14 households (40.0%) experiencing poverty. Likewise, among single-mother households, those with no children have the highest poverty rate, with 9 households (5.6%) falling below the poverty line.
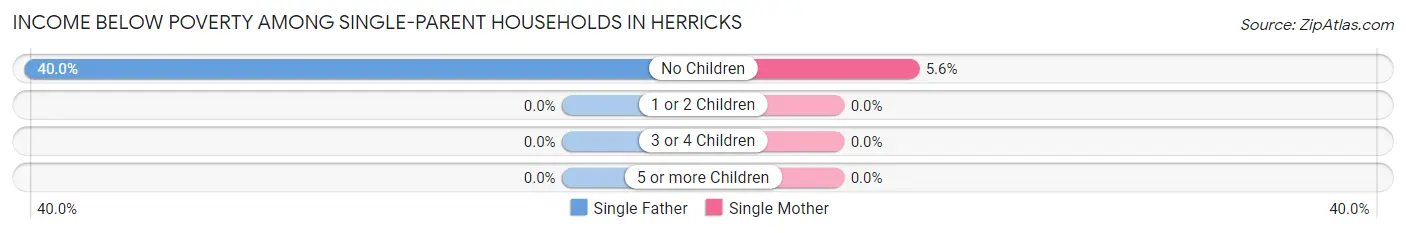
| Children | Single Father | Single Mother |
| No Children | 14 (40.0%) | 9 (5.6%) |
| 1 or 2 Children | 0 (0.0%) | 0 (0.0%) |
| 3 or 4 Children | 0 (0.0%) | 0 (0.0%) |
| 5 or more Children | 0 (0.0%) | 0 (0.0%) |
| Total | 14 (40.0%) | 9 (4.4%) |
Income Below Poverty Among Married-Couple vs Single-Parent Households in Herricks
The poverty data for Herricks shows that 40 of the married-couple family households (4.4%) and 23 of the single-parent households (9.5%) are living below the poverty level. Within the married-couple family households, those with 1 or 2 children have the highest poverty rate, with 20 households (5.9%) falling below the poverty line. Among the single-parent households, those with no children have the highest poverty rate, with 23 household (11.7%) living below poverty.
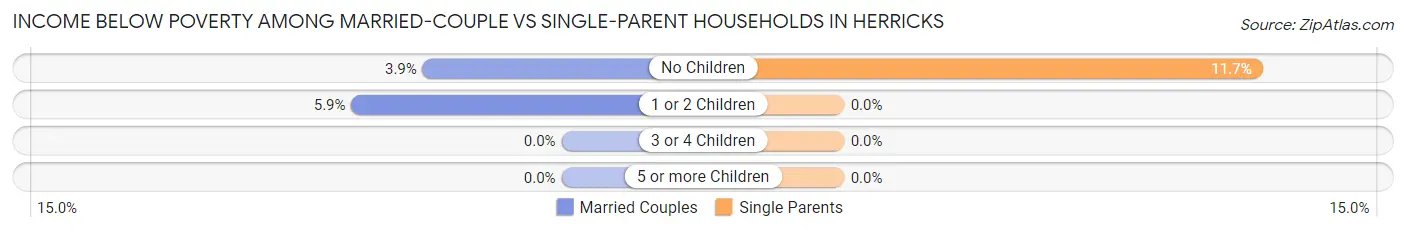
| Children | Married-Couple Families | Single-Parent Households |
| No Children | 20 (3.9%) | 23 (11.7%) |
| 1 or 2 Children | 20 (5.9%) | 0 (0.0%) |
| 3 or 4 Children | 0 (0.0%) | 0 (0.0%) |
| 5 or more Children | 0 (0.0%) | 0 (0.0%) |
| Total | 40 (4.4%) | 23 (9.5%) |
Race in Herricks
The most populous races in Herricks are White / Caucasian (1,888 | 44.7%), Asian (1,844 | 43.6%), and Two or more Races (238 | 5.6%).
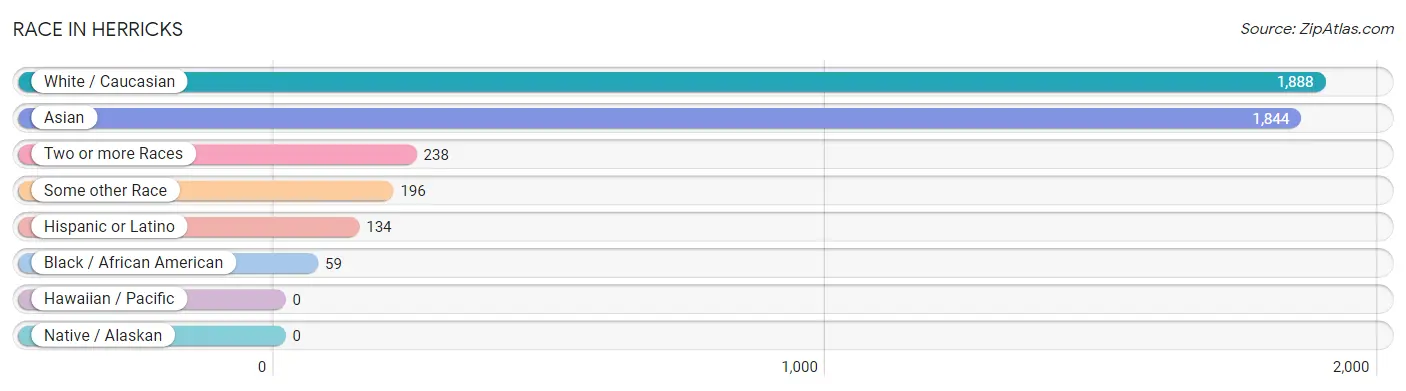
| Race | # Population | % Population |
| Asian | 1,844 | 43.6% |
| Black / African American | 59 | 1.4% |
| Hawaiian / Pacific | 0 | 0.0% |
| Hispanic or Latino | 134 | 3.2% |
| Native / Alaskan | 0 | 0.0% |
| White / Caucasian | 1,888 | 44.7% |
| Two or more Races | 238 | 5.6% |
| Some other Race | 196 | 4.6% |
| Total | 4,225 | 100.0% |
Ancestry in Herricks
The most populous ancestries reported in Herricks are Thai (915 | 21.7%), Italian (751 | 17.8%), Indian (Asian) (699 | 16.5%), Burmese (277 | 6.6%), and Irish (260 | 6.1%), together accounting for 68.7% of all Herricks residents.
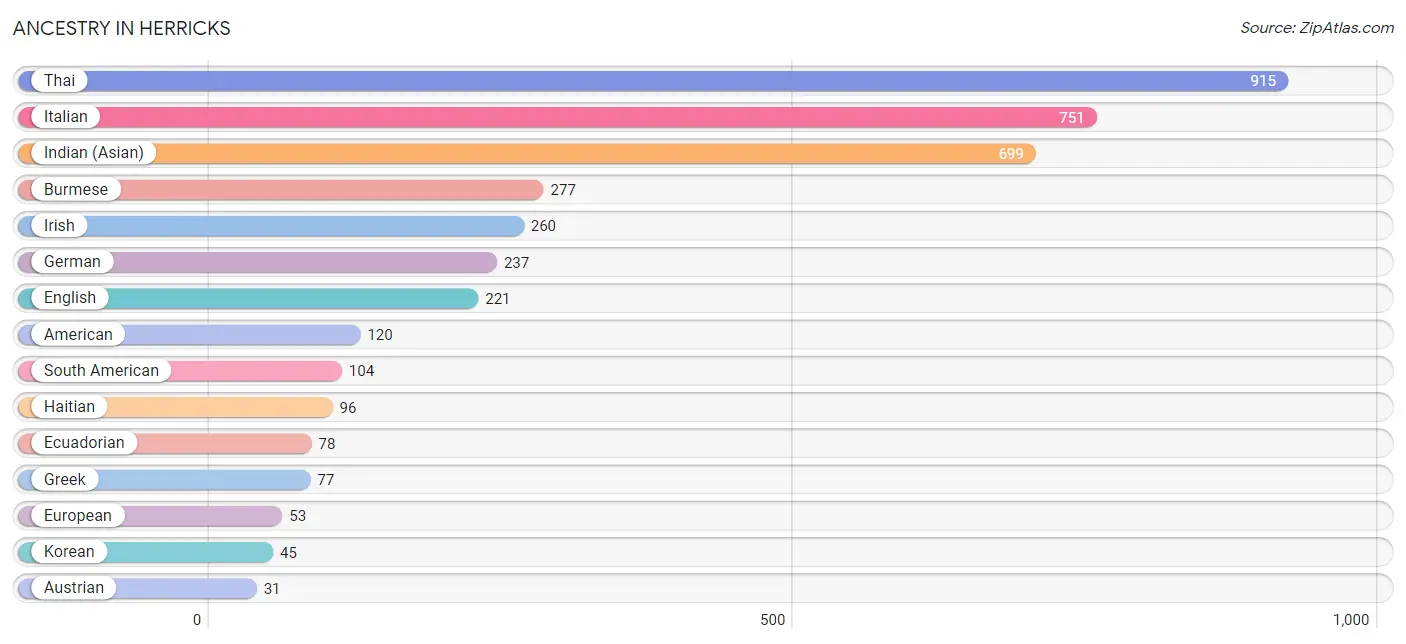
| Ancestry | # Population | % Population |
| American | 120 | 2.8% |
| Austrian | 31 | 0.7% |
| Burmese | 277 | 6.6% |
| Croatian | 26 | 0.6% |
| Dutch | 10 | 0.2% |
| Eastern European | 11 | 0.3% |
| Ecuadorian | 78 | 1.8% |
| English | 221 | 5.2% |
| European | 53 | 1.3% |
| French | 10 | 0.2% |
| German | 237 | 5.6% |
| Greek | 77 | 1.8% |
| Guyanese | 1 | 0.0% |
| Haitian | 96 | 2.3% |
| Indian (Asian) | 699 | 16.5% |
| Irish | 260 | 6.1% |
| Israeli | 24 | 0.6% |
| Italian | 751 | 17.8% |
| Korean | 45 | 1.1% |
| Peruvian | 26 | 0.6% |
| Polish | 30 | 0.7% |
| Portuguese | 6 | 0.1% |
| Puerto Rican | 30 | 0.7% |
| Russian | 13 | 0.3% |
| Scotch-Irish | 11 | 0.3% |
| Scottish | 9 | 0.2% |
| Serbian | 17 | 0.4% |
| South African | 16 | 0.4% |
| South American | 104 | 2.5% |
| Subsaharan African | 16 | 0.4% |
| Swedish | 18 | 0.4% |
| Thai | 915 | 21.7% |
| Ukrainian | 16 | 0.4% |
| Vietnamese | 25 | 0.6% | View All 34 Rows |
Immigrants in Herricks
The most numerous immigrant groups reported in Herricks came from Asia (1,213 | 28.7%), South Central Asia (642 | 15.2%), India (485 | 11.5%), Eastern Asia (455 | 10.8%), and China (305 | 7.2%), together accounting for 73.4% of all Herricks residents.
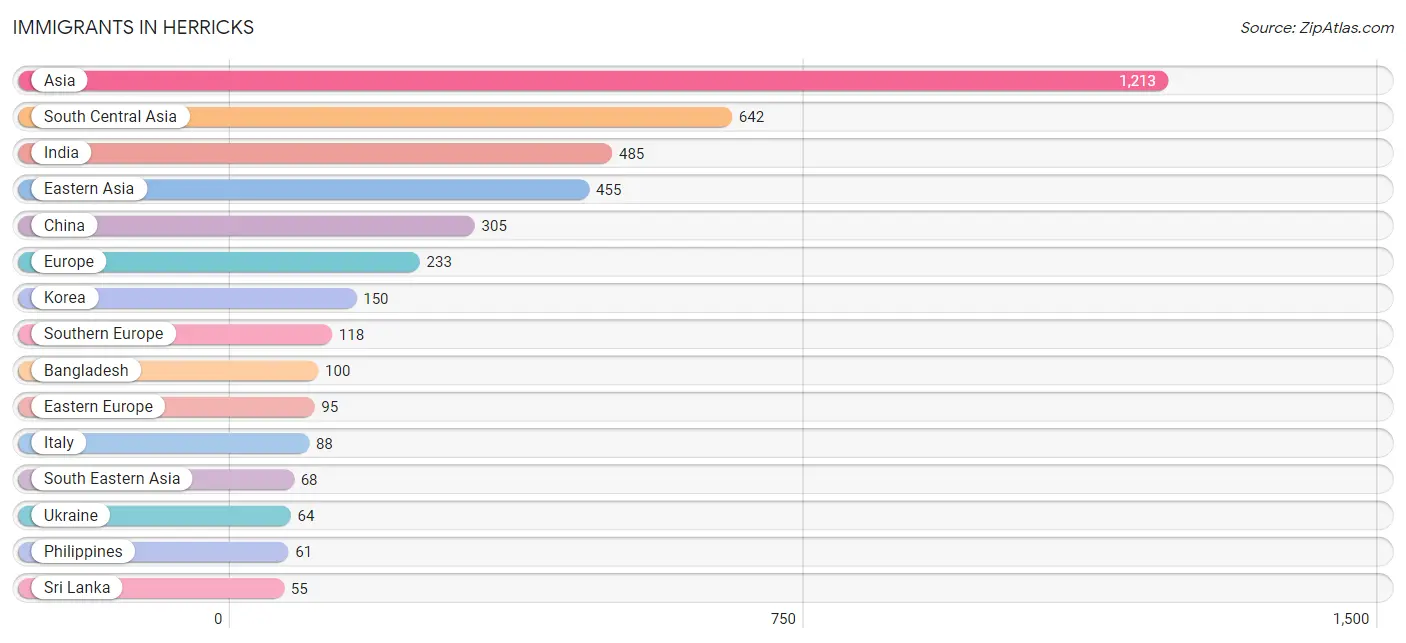
| Immigration Origin | # Population | % Population |
| Africa | 16 | 0.4% |
| Asia | 1,213 | 28.7% |
| Bangladesh | 100 | 2.4% |
| China | 305 | 7.2% |
| Croatia | 26 | 0.6% |
| Eastern Asia | 455 | 10.8% |
| Eastern Europe | 95 | 2.2% |
| England | 9 | 0.2% |
| Europe | 233 | 5.5% |
| Greece | 24 | 0.6% |
| Guyana | 16 | 0.4% |
| Hong Kong | 46 | 1.1% |
| India | 485 | 11.5% |
| Ireland | 11 | 0.3% |
| Israel | 24 | 0.6% |
| Italy | 88 | 2.1% |
| Korea | 150 | 3.5% |
| Latin America | 28 | 0.7% |
| Malaysia | 7 | 0.2% |
| Northern Europe | 20 | 0.5% |
| Pakistan | 2 | 0.1% |
| Philippines | 61 | 1.4% |
| Poland | 5 | 0.1% |
| Portugal | 6 | 0.1% |
| South Africa | 16 | 0.4% |
| South America | 28 | 0.7% |
| South Central Asia | 642 | 15.2% |
| South Eastern Asia | 68 | 1.6% |
| Southern Europe | 118 | 2.8% |
| Sri Lanka | 55 | 1.3% |
| Taiwan | 8 | 0.2% |
| Ukraine | 64 | 1.5% |
| Venezuela | 12 | 0.3% |
| Western Asia | 48 | 1.1% | View All 34 Rows |
Sex and Age in Herricks
Sex and Age in Herricks
The most populous age groups in Herricks are 50 to 54 Years (262 | 13.0%) for men and 65 to 69 Years (208 | 9.4%) for women.
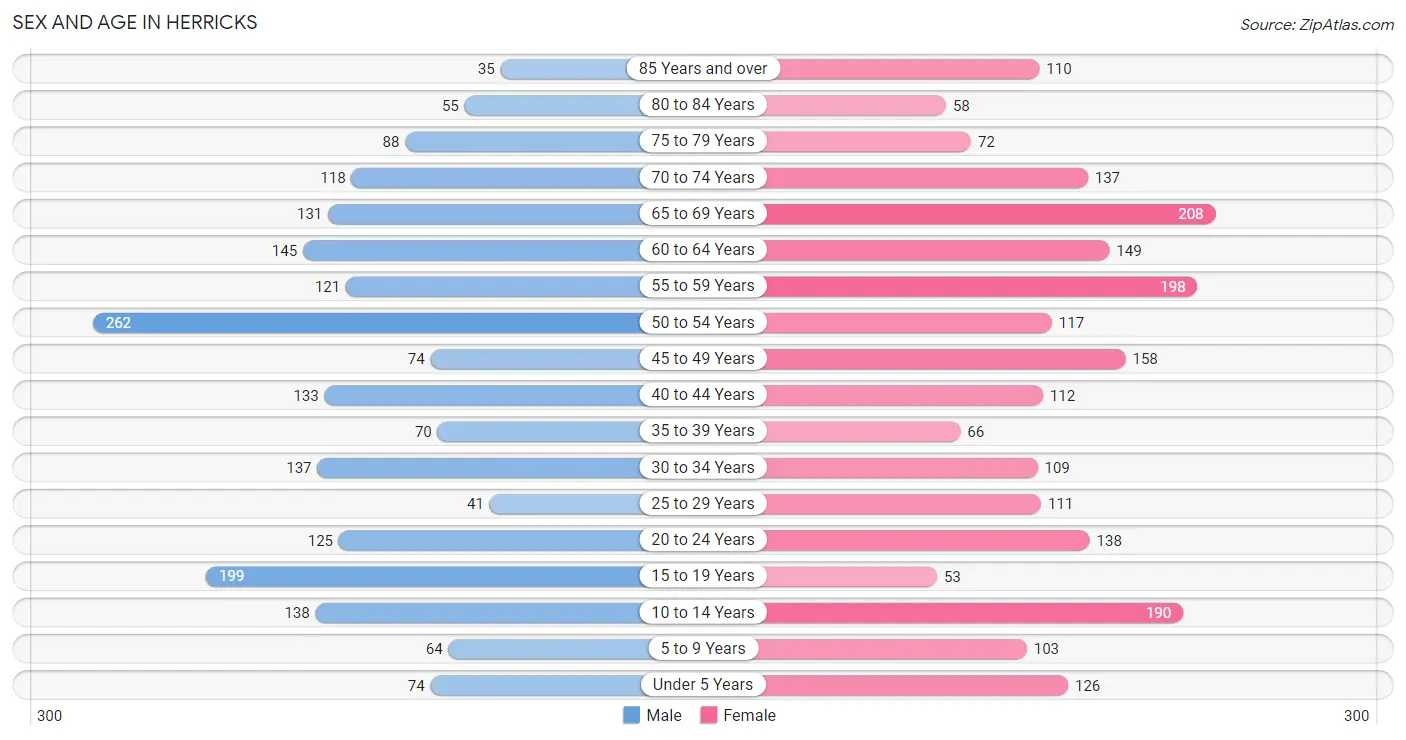
| Age Bracket | Male | Female |
| Under 5 Years | 74 (3.7%) | 126 (5.7%) |
| 5 to 9 Years | 64 (3.2%) | 103 (4.6%) |
| 10 to 14 Years | 138 (6.9%) | 190 (8.6%) |
| 15 to 19 Years | 199 (9.9%) | 53 (2.4%) |
| 20 to 24 Years | 125 (6.2%) | 138 (6.2%) |
| 25 to 29 Years | 41 (2.0%) | 111 (5.0%) |
| 30 to 34 Years | 137 (6.8%) | 109 (4.9%) |
| 35 to 39 Years | 70 (3.5%) | 66 (3.0%) |
| 40 to 44 Years | 133 (6.6%) | 112 (5.1%) |
| 45 to 49 Years | 74 (3.7%) | 158 (7.1%) |
| 50 to 54 Years | 262 (13.0%) | 117 (5.3%) |
| 55 to 59 Years | 121 (6.0%) | 198 (8.9%) |
| 60 to 64 Years | 145 (7.2%) | 149 (6.7%) |
| 65 to 69 Years | 131 (6.5%) | 208 (9.4%) |
| 70 to 74 Years | 118 (5.9%) | 137 (6.2%) |
| 75 to 79 Years | 88 (4.4%) | 72 (3.3%) |
| 80 to 84 Years | 55 (2.7%) | 58 (2.6%) |
| 85 Years and over | 35 (1.7%) | 110 (5.0%) |
| Total | 2,010 (100.0%) | 2,215 (100.0%) |
Families and Households in Herricks
Median Family Size in Herricks
The median family size in Herricks is 3.52 persons per family, with married-couple families (902 | 78.9%) accounting for the largest median family size of 3.86 persons per family. On the other hand, single male/father families (35 | 3.1%) represent the smallest median family size with 1.94 persons per family.
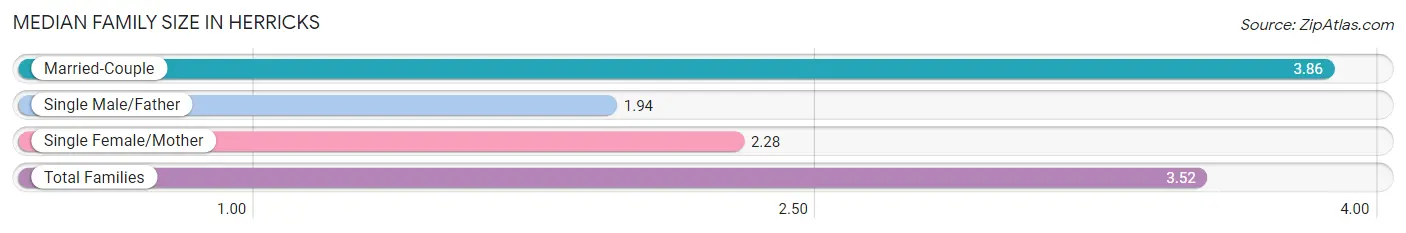
| Family Type | # Families | Family Size |
| Married-Couple | 902 (78.9%) | 3.86 |
| Single Male/Father | 35 (3.1%) | 1.94 |
| Single Female/Mother | 206 (18.0%) | 2.28 |
| Total Families | 1,143 (100.0%) | 3.52 |
Median Household Size in Herricks
The median household size in Herricks is 3.29 persons per household, with married-couple households (902 | 70.2%) accounting for the largest median household size of 3.89 persons per household. non-family households (142 | 11.1%) represent the smallest median household size with 1.08 persons per household.
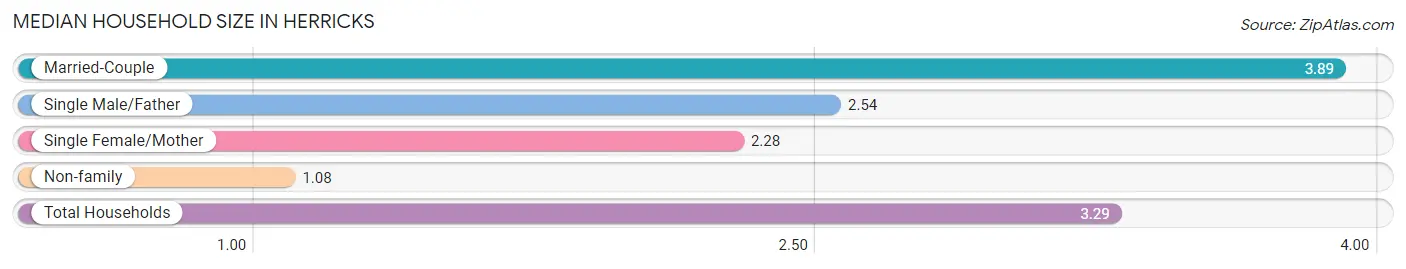
| Household Type | # Households | Household Size |
| Married-Couple | 902 (70.2%) | 3.89 |
| Single Male/Father | 35 (2.7%) | 2.54 |
| Single Female/Mother | 206 (16.0%) | 2.28 |
| Non-family | 142 (11.1%) | 1.08 |
| Total Households | 1,285 (100.0%) | 3.29 |
Household Size by Marriage Status in Herricks
Out of a total of 1,285 households in Herricks, 1,143 (88.9%) are family households, while 142 (11.1%) are nonfamily households. The most numerous type of family households are 2-person households, comprising 367, and the most common type of nonfamily households are 1-person households, comprising 130.
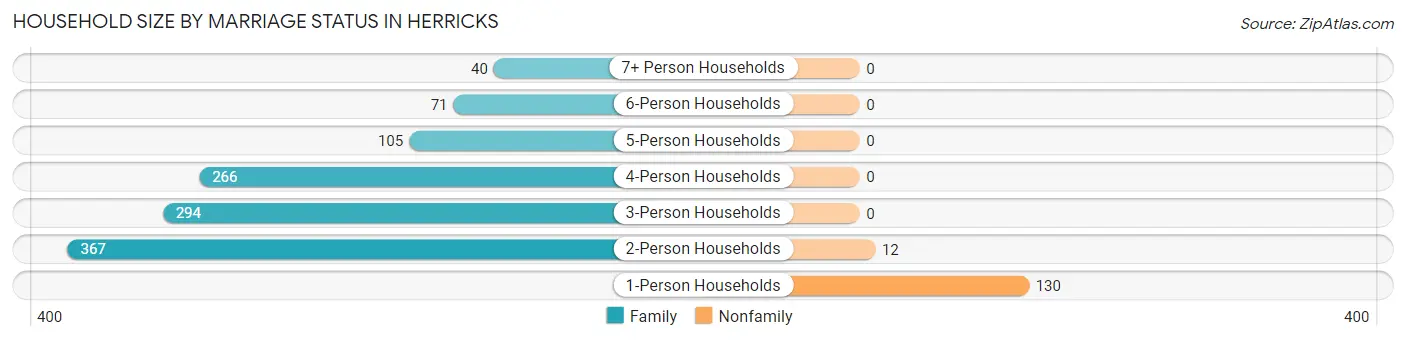
| Household Size | Family Households | Nonfamily Households |
| 1-Person Households | - | 130 (10.1%) |
| 2-Person Households | 367 (28.6%) | 12 (0.9%) |
| 3-Person Households | 294 (22.9%) | 0 (0.0%) |
| 4-Person Households | 266 (20.7%) | 0 (0.0%) |
| 5-Person Households | 105 (8.2%) | 0 (0.0%) |
| 6-Person Households | 71 (5.5%) | 0 (0.0%) |
| 7+ Person Households | 40 (3.1%) | 0 (0.0%) |
| Total | 1,143 (88.9%) | 142 (11.1%) |
Female Fertility in Herricks
Fertility by Age in Herricks
Average fertility rate in Herricks is 26.0 births per 1,000 women. Women in the age bracket of 35 to 50 years have the highest fertility rate with 30.0 births per 1,000 women. Women in the age bracket of 35 to 50 years acount for 55.0% of all women with births.
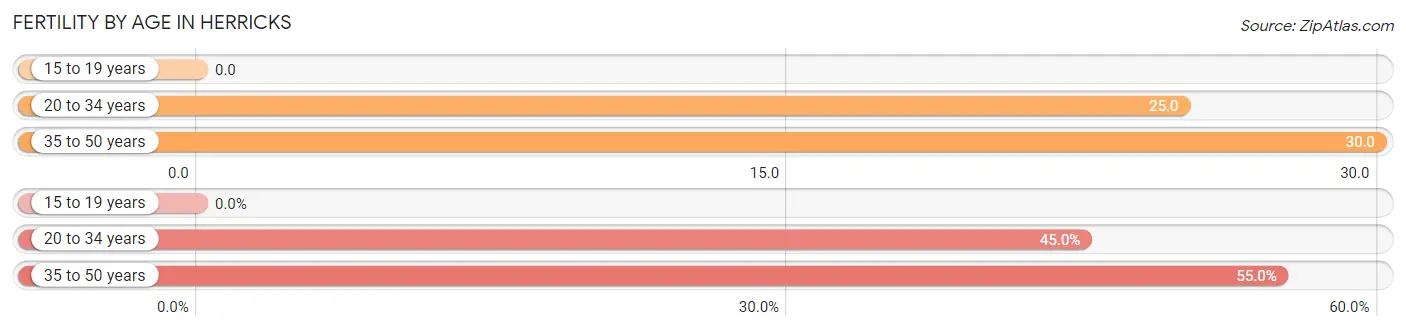
| Age Bracket | Women with Births | Births / 1,000 Women |
| 15 to 19 years | 0 (0.0%) | 0.0 |
| 20 to 34 years | 9 (45.0%) | 25.0 |
| 35 to 50 years | 11 (55.0%) | 30.0 |
| Total | 20 (100.0%) | 26.0 |
Fertility by Age by Marriage Status in Herricks
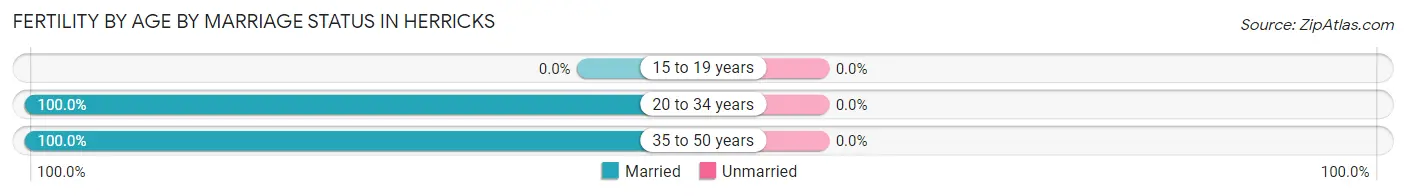
| Age Bracket | Married | Unmarried |
| 15 to 19 years | 0 (0.0%) | 0 (0.0%) |
| 20 to 34 years | 9 (100.0%) | 0 (0.0%) |
| 35 to 50 years | 11 (100.0%) | 0 (0.0%) |
| Total | 20 (100.0%) | 0 (0.0%) |
Fertility by Education in Herricks
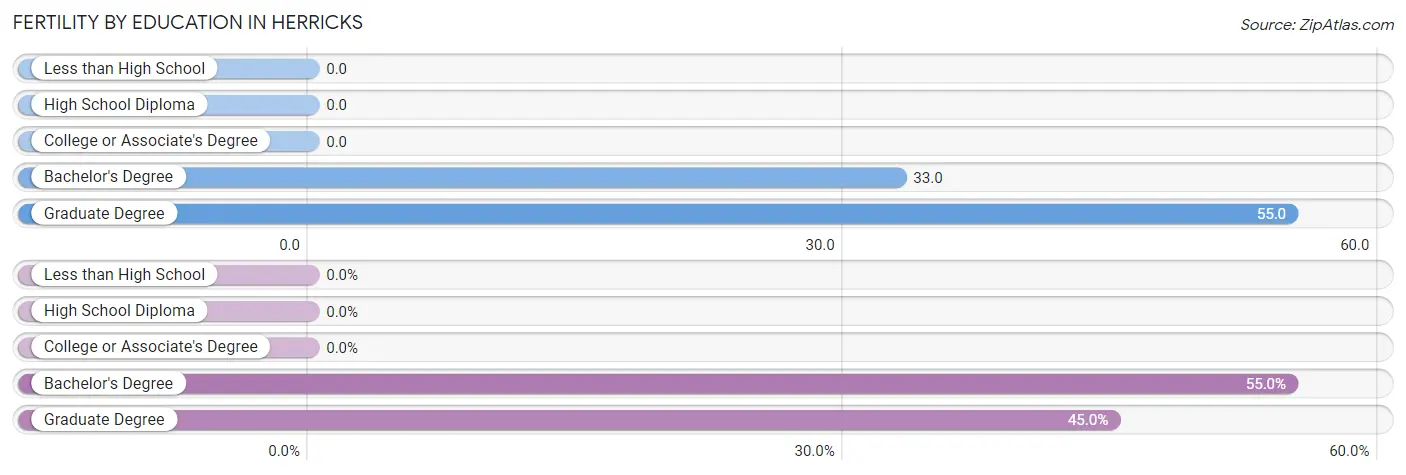
| Educational Attainment | Women with Births | Births / 1,000 Women |
| Less than High School | 0 (0.0%) | 0.0 |
| High School Diploma | 0 (0.0%) | 0.0 |
| College or Associate's Degree | 0 (0.0%) | 0.0 |
| Bachelor's Degree | 11 (55.0%) | 33.0 |
| Graduate Degree | 9 (45.0%) | 55.0 |
| Total | 20 (100.0%) | 26.0 |
Fertility by Education by Marriage Status in Herricks
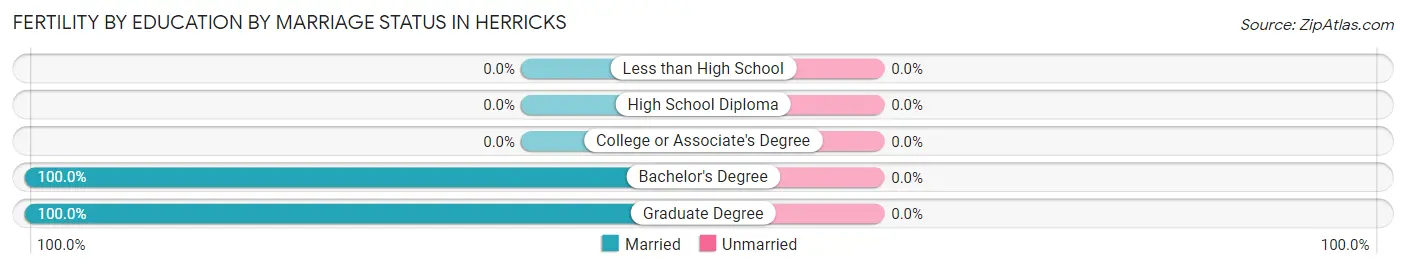
| Educational Attainment | Married | Unmarried |
| Less than High School | 0 (0.0%) | 0 (0.0%) |
| High School Diploma | 0 (0.0%) | 0 (0.0%) |
| College or Associate's Degree | 0 (0.0%) | 0 (0.0%) |
| Bachelor's Degree | 11 (100.0%) | 0 (0.0%) |
| Graduate Degree | 9 (100.0%) | 0 (0.0%) |
| Total | 20 (100.0%) | 0 (0.0%) |
Employment Characteristics in Herricks
Employment by Class of Employer in Herricks
Among the 1,792 employed individuals in Herricks, private company employees (1,016 | 56.7%), local government employees (233 | 13.0%), and self-employed (incorporated) (168 | 9.4%) make up the most common classes of employment.
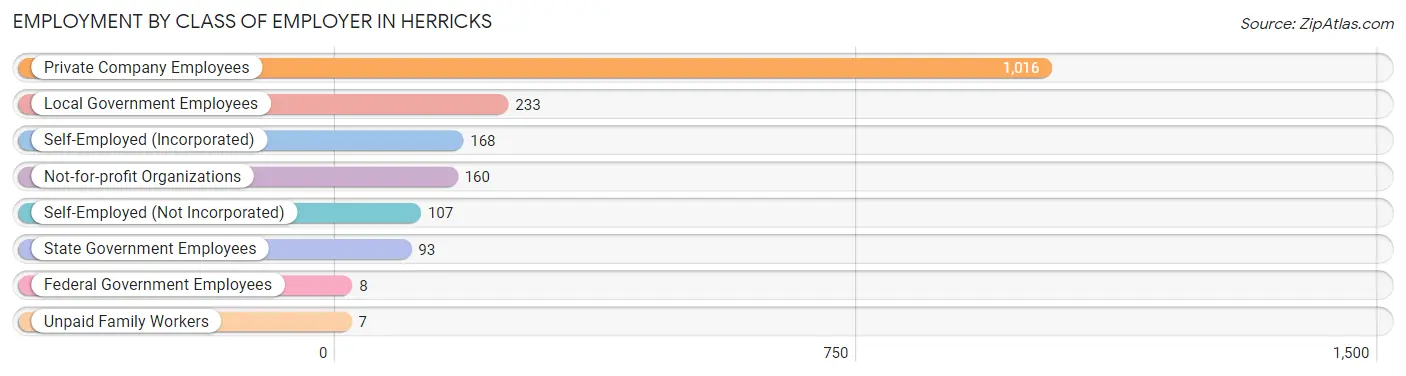
| Employer Class | # Employees | % Employees |
| Private Company Employees | 1,016 | 56.7% |
| Self-Employed (Incorporated) | 168 | 9.4% |
| Self-Employed (Not Incorporated) | 107 | 6.0% |
| Not-for-profit Organizations | 160 | 8.9% |
| Local Government Employees | 233 | 13.0% |
| State Government Employees | 93 | 5.2% |
| Federal Government Employees | 8 | 0.4% |
| Unpaid Family Workers | 7 | 0.4% |
| Total | 1,792 | 100.0% |
Employment Status by Age in Herricks
According to the labor force statistics for Herricks, out of the total population over 16 years of age (3,487), 56.2% or 1,960 individuals are in the labor force, with 8.1% or 159 of them unemployed. The age group with the highest labor force participation rate is 30 to 34 years, with 96.3% or 237 individuals in the labor force. Within the labor force, the 25 to 29 years age range has the highest percentage of unemployed individuals, with 43.8% or 63 of them being unemployed.
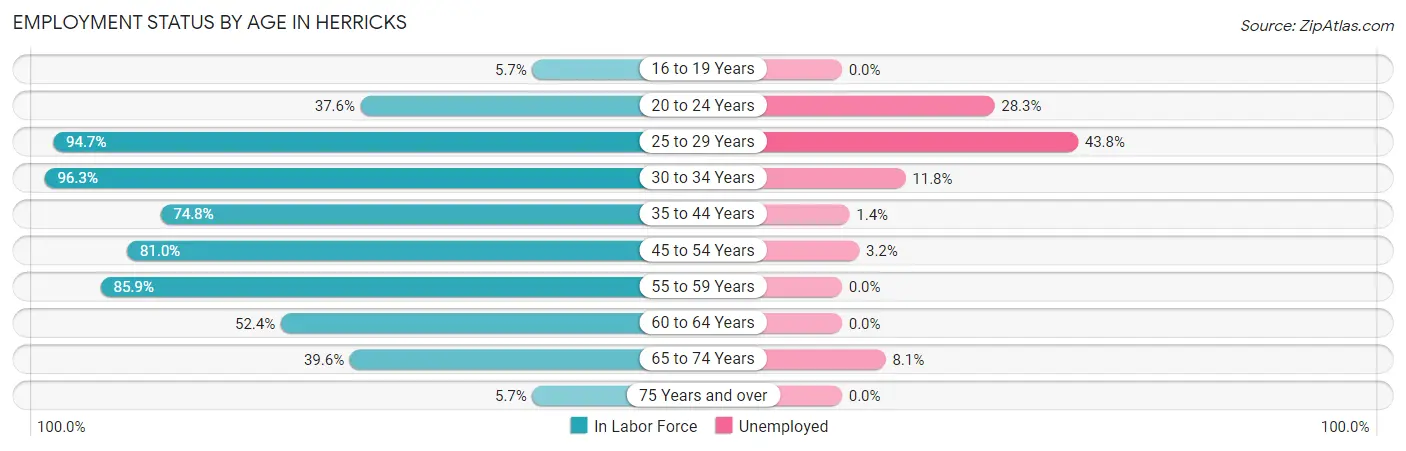
| Age Bracket | In Labor Force | Unemployed |
| 16 to 19 Years | 12 (5.7%) | 0 (0.0%) |
| 20 to 24 Years | 99 (37.6%) | 28 (28.3%) |
| 25 to 29 Years | 144 (94.7%) | 63 (43.8%) |
| 30 to 34 Years | 237 (96.3%) | 28 (11.8%) |
| 35 to 44 Years | 285 (74.8%) | 4 (1.4%) |
| 45 to 54 Years | 495 (81.0%) | 16 (3.2%) |
| 55 to 59 Years | 274 (85.9%) | 0 (0.0%) |
| 60 to 64 Years | 154 (52.4%) | 0 (0.0%) |
| 65 to 74 Years | 235 (39.6%) | 19 (8.1%) |
| 75 Years and over | 24 (5.7%) | 0 (0.0%) |
| Total | 1,960 (56.2%) | 159 (8.1%) |
Employment Status by Educational Attainment in Herricks
According to labor force statistics for Herricks, 79.3% of individuals (1,588) out of the total population between 25 and 64 years of age (2,003) are in the labor force, with 7.0% or 111 of them being unemployed. The group with the highest labor force participation rate are those with the educational attainment of bachelor's degree or higher, with 87.1% or 1,063 individuals in the labor force. Within the labor force, individuals with college / associate degree education have the highest percentage of unemployment, with 18.4% or 44 of them being unemployed.
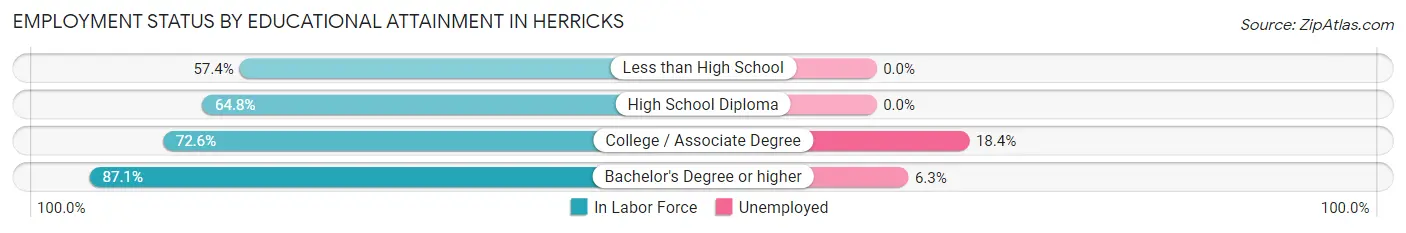
| Educational Attainment | In Labor Force | Unemployed |
| Less than High School | 58 (57.4%) | 0 (0.0%) |
| High School Diploma | 228 (64.8%) | 0 (0.0%) |
| College / Associate Degree | 239 (72.6%) | 61 (18.4%) |
| Bachelor's Degree or higher | 1,063 (87.1%) | 77 (6.3%) |
| Total | 1,588 (79.3%) | 140 (7.0%) |
Employment Occupations by Sex in Herricks
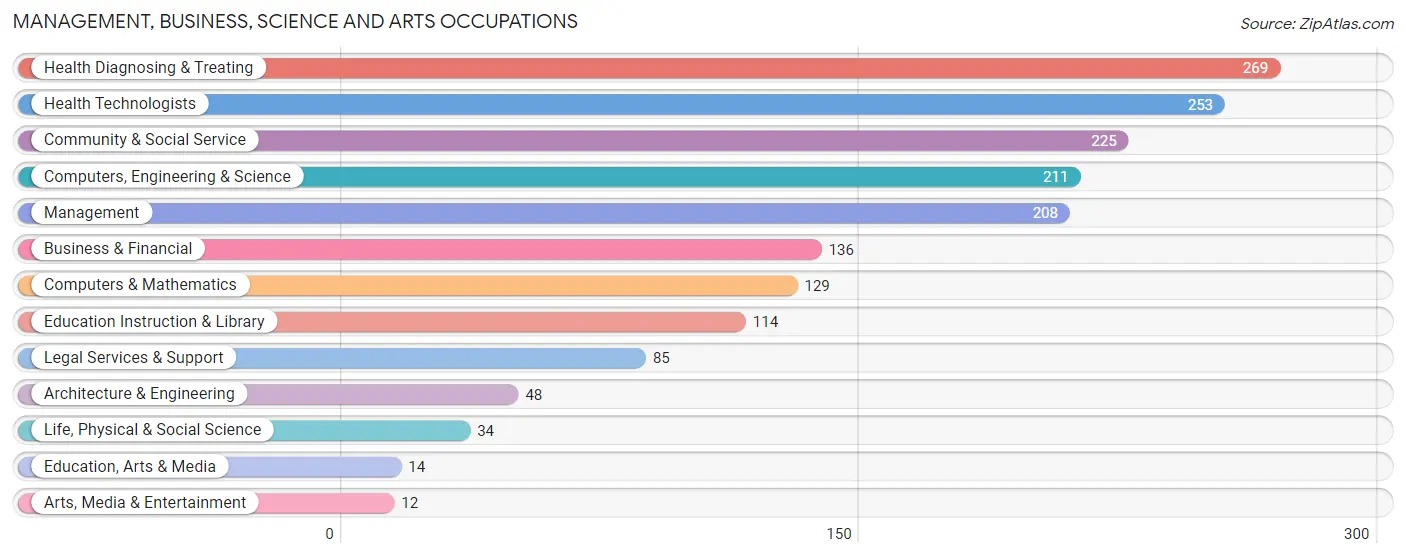
Management, Business, Science and Arts Occupations
The most common Management, Business, Science and Arts occupations in Herricks are Health Diagnosing & Treating (269 | 14.9%), Health Technologists (253 | 14.1%), Community & Social Service (225 | 12.5%), Computers, Engineering & Science (211 | 11.7%), and Management (208 | 11.6%).
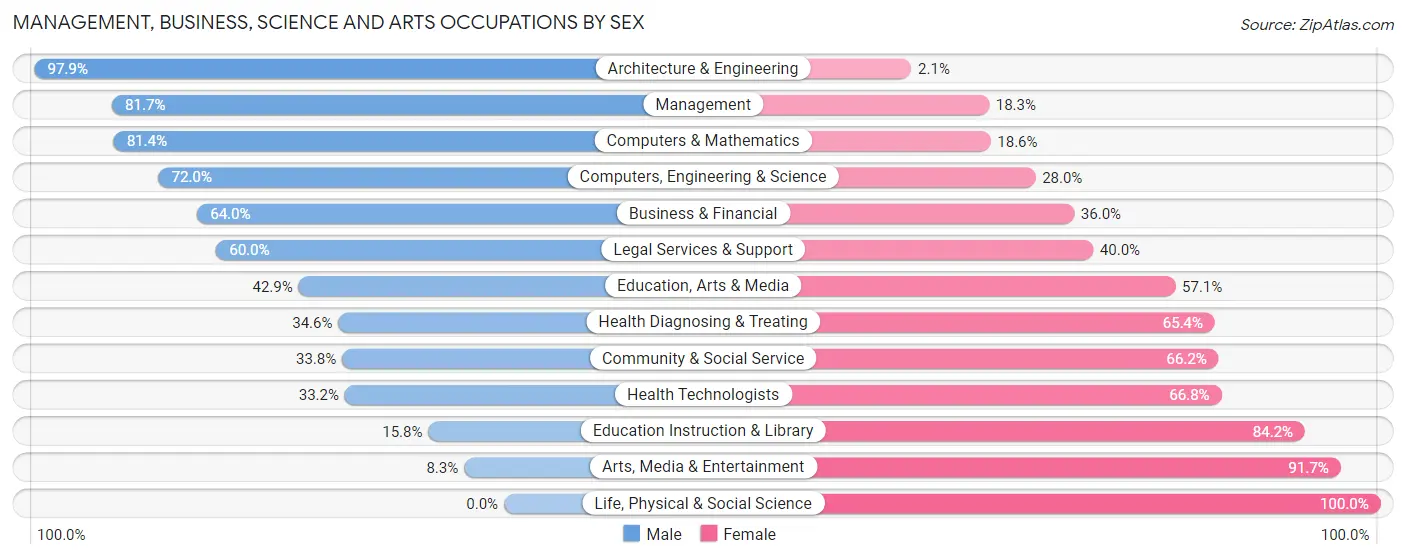
Management, Business, Science and Arts Occupations by Sex
Within the Management, Business, Science and Arts occupations in Herricks, the most male-oriented occupations are Architecture & Engineering (97.9%), Management (81.7%), and Computers & Mathematics (81.4%), while the most female-oriented occupations are Life, Physical & Social Science (100.0%), Arts, Media & Entertainment (91.7%), and Education Instruction & Library (84.2%).
| Occupation | Male | Female |
| Management | 170 (81.7%) | 38 (18.3%) |
| Business & Financial | 87 (64.0%) | 49 (36.0%) |
| Computers, Engineering & Science | 152 (72.0%) | 59 (28.0%) |
| Computers & Mathematics | 105 (81.4%) | 24 (18.6%) |
| Architecture & Engineering | 47 (97.9%) | 1 (2.1%) |
| Life, Physical & Social Science | 0 (0.0%) | 34 (100.0%) |
| Community & Social Service | 76 (33.8%) | 149 (66.2%) |
| Education, Arts & Media | 6 (42.9%) | 8 (57.1%) |
| Legal Services & Support | 51 (60.0%) | 34 (40.0%) |
| Education Instruction & Library | 18 (15.8%) | 96 (84.2%) |
| Arts, Media & Entertainment | 1 (8.3%) | 11 (91.7%) |
| Health Diagnosing & Treating | 93 (34.6%) | 176 (65.4%) |
| Health Technologists | 84 (33.2%) | 169 (66.8%) |
| Total (Category) | 578 (55.1%) | 471 (44.9%) |
| Total (Overall) | 940 (52.2%) | 861 (47.8%) |
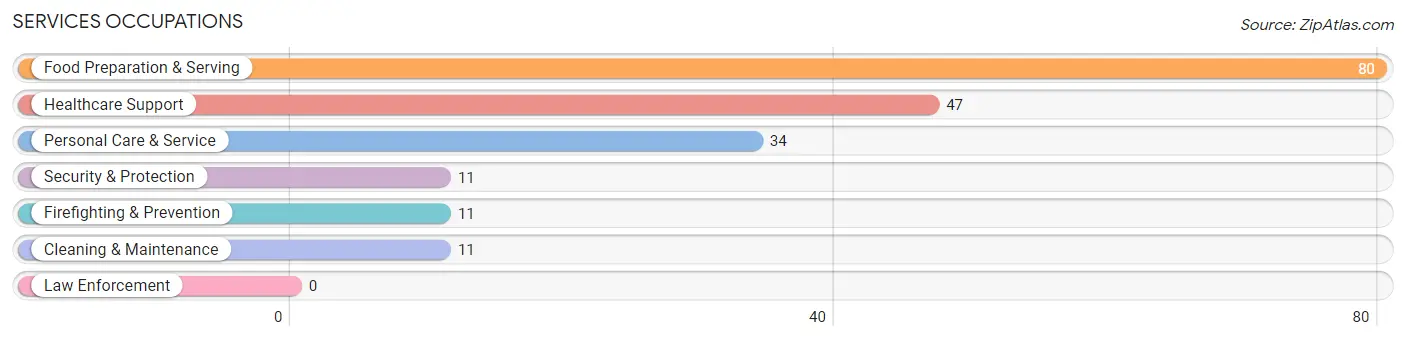
Services Occupations
The most common Services occupations in Herricks are Food Preparation & Serving (80 | 4.4%), Healthcare Support (47 | 2.6%), Personal Care & Service (34 | 1.9%), Security & Protection (11 | 0.6%), and Firefighting & Prevention (11 | 0.6%).
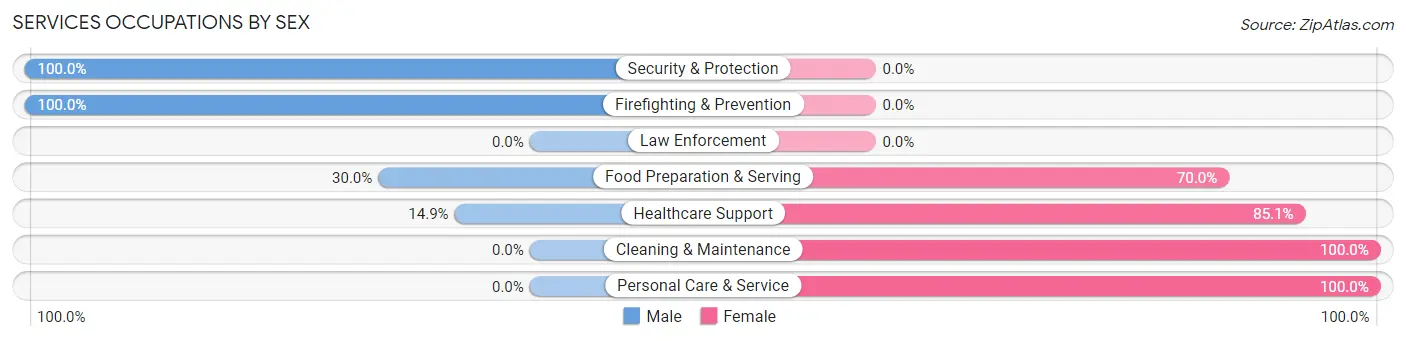
Services Occupations by Sex
Within the Services occupations in Herricks, the most male-oriented occupations are Security & Protection (100.0%), Firefighting & Prevention (100.0%), and Food Preparation & Serving (30.0%), while the most female-oriented occupations are Cleaning & Maintenance (100.0%), Personal Care & Service (100.0%), and Healthcare Support (85.1%).
| Occupation | Male | Female |
| Healthcare Support | 7 (14.9%) | 40 (85.1%) |
| Security & Protection | 11 (100.0%) | 0 (0.0%) |
| Firefighting & Prevention | 11 (100.0%) | 0 (0.0%) |
| Law Enforcement | 0 (0.0%) | 0 (0.0%) |
| Food Preparation & Serving | 24 (30.0%) | 56 (70.0%) |
| Cleaning & Maintenance | 0 (0.0%) | 11 (100.0%) |
| Personal Care & Service | 0 (0.0%) | 34 (100.0%) |
| Total (Category) | 42 (23.0%) | 141 (77.0%) |
| Total (Overall) | 940 (52.2%) | 861 (47.8%) |
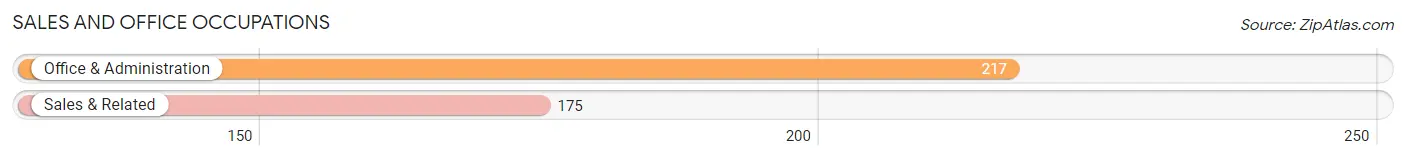
Sales and Office Occupations
The most common Sales and Office occupations in Herricks are Office & Administration (217 | 12.0%), and Sales & Related (175 | 9.7%).
Sales and Office Occupations by Sex
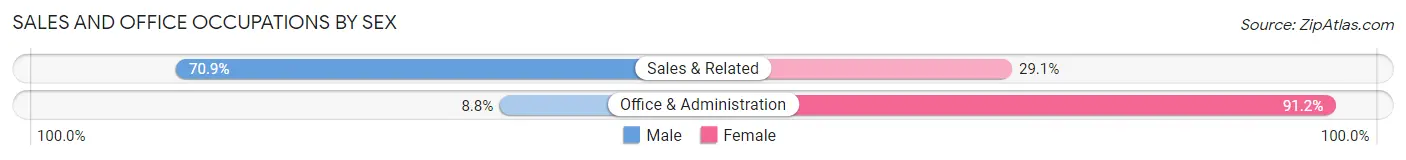
| Occupation | Male | Female |
| Sales & Related | 124 (70.9%) | 51 (29.1%) |
| Office & Administration | 19 (8.8%) | 198 (91.2%) |
| Total (Category) | 143 (36.5%) | 249 (63.5%) |
| Total (Overall) | 940 (52.2%) | 861 (47.8%) |
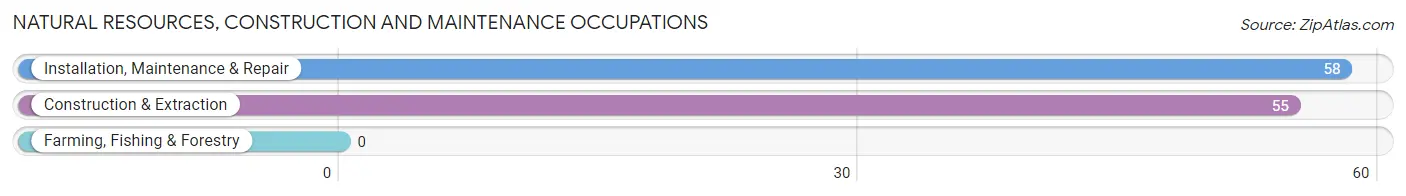
Natural Resources, Construction and Maintenance Occupations
The most common Natural Resources, Construction and Maintenance occupations in Herricks are Installation, Maintenance & Repair (58 | 3.2%), and Construction & Extraction (55 | 3.0%).
Natural Resources, Construction and Maintenance Occupations by Sex
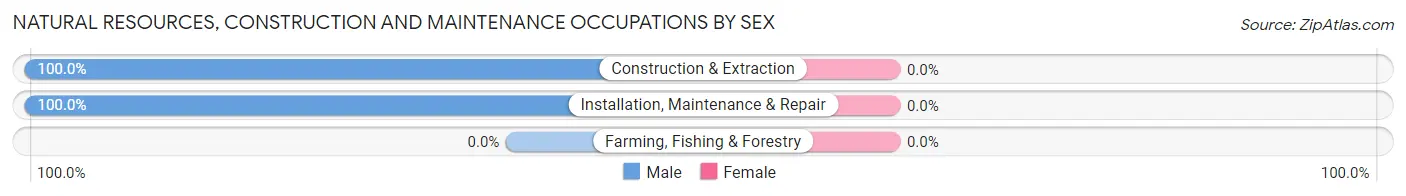
| Occupation | Male | Female |
| Farming, Fishing & Forestry | 0 (0.0%) | 0 (0.0%) |
| Construction & Extraction | 55 (100.0%) | 0 (0.0%) |
| Installation, Maintenance & Repair | 58 (100.0%) | 0 (0.0%) |
| Total (Category) | 113 (100.0%) | 0 (0.0%) |
| Total (Overall) | 940 (52.2%) | 861 (47.8%) |
Production, Transportation and Moving Occupations
The most common Production, Transportation and Moving occupations in Herricks are Production (48 | 2.7%), and Transportation (16 | 0.9%).
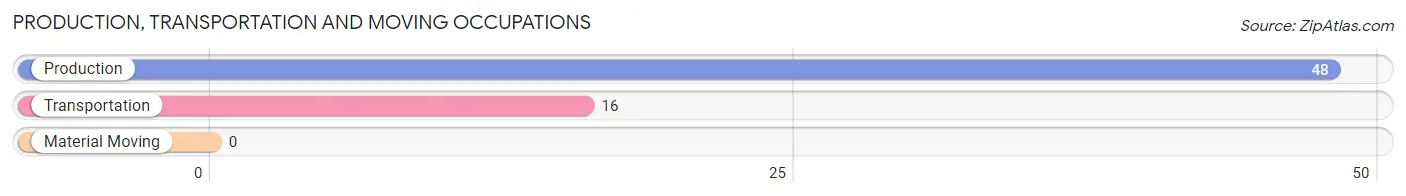
Production, Transportation and Moving Occupations by Sex
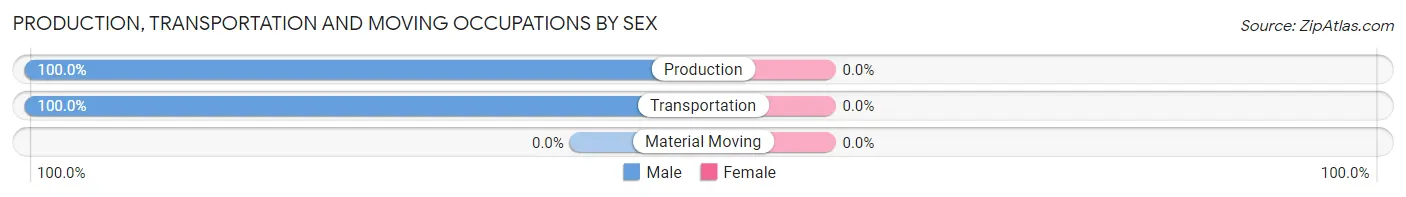
| Occupation | Male | Female |
| Production | 48 (100.0%) | 0 (0.0%) |
| Transportation | 16 (100.0%) | 0 (0.0%) |
| Material Moving | 0 (0.0%) | 0 (0.0%) |
| Total (Category) | 64 (100.0%) | 0 (0.0%) |
| Total (Overall) | 940 (52.2%) | 861 (47.8%) |
Employment Industries by Sex in Herricks
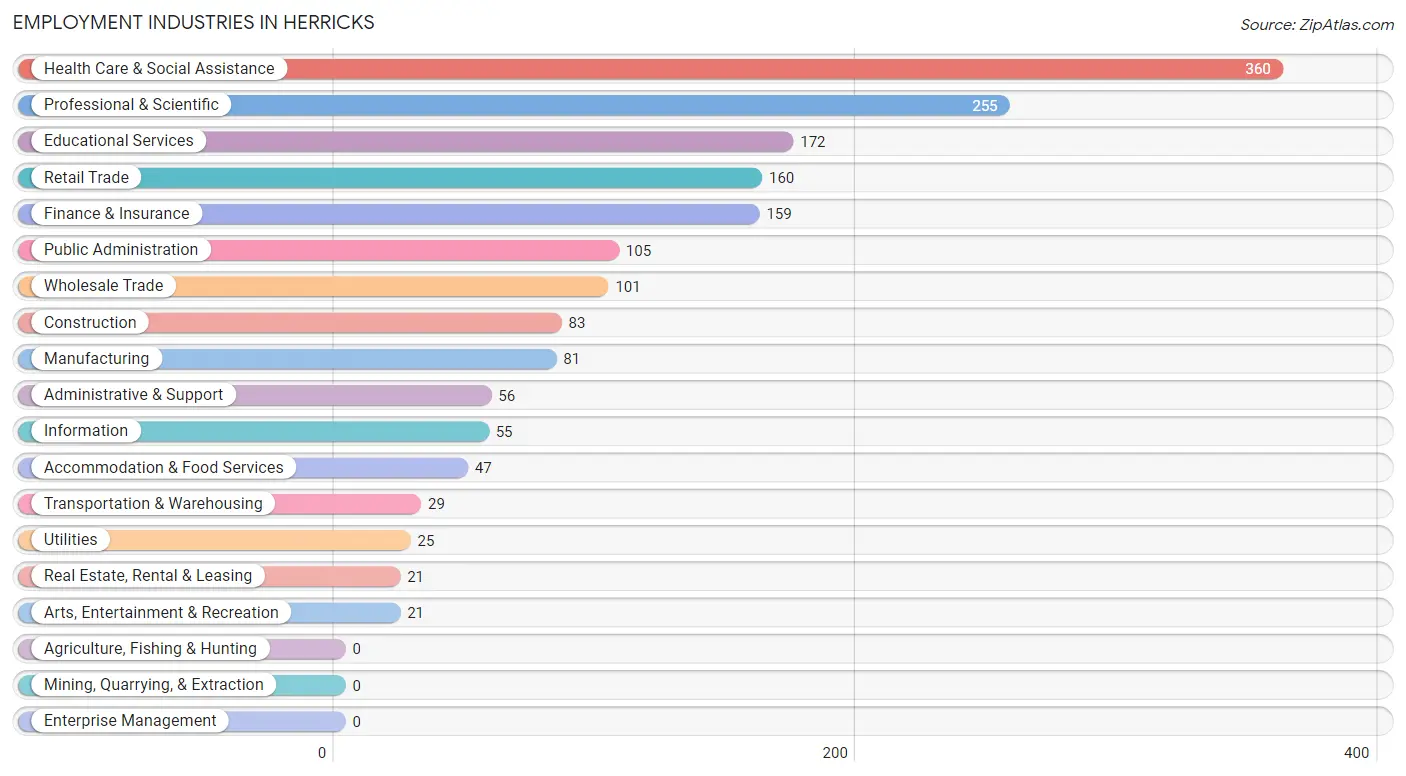
Employment Industries in Herricks
The major employment industries in Herricks include Health Care & Social Assistance (360 | 20.0%), Professional & Scientific (255 | 14.2%), Educational Services (172 | 9.6%), Retail Trade (160 | 8.9%), and Finance & Insurance (159 | 8.8%).
Employment Industries by Sex in Herricks
The Herricks industries that see more men than women are Construction (100.0%), Utilities (100.0%), and Real Estate, Rental & Leasing (100.0%), whereas the industries that tend to have a higher number of women are Educational Services (83.7%), Health Care & Social Assistance (75.0%), and Arts, Entertainment & Recreation (52.4%).
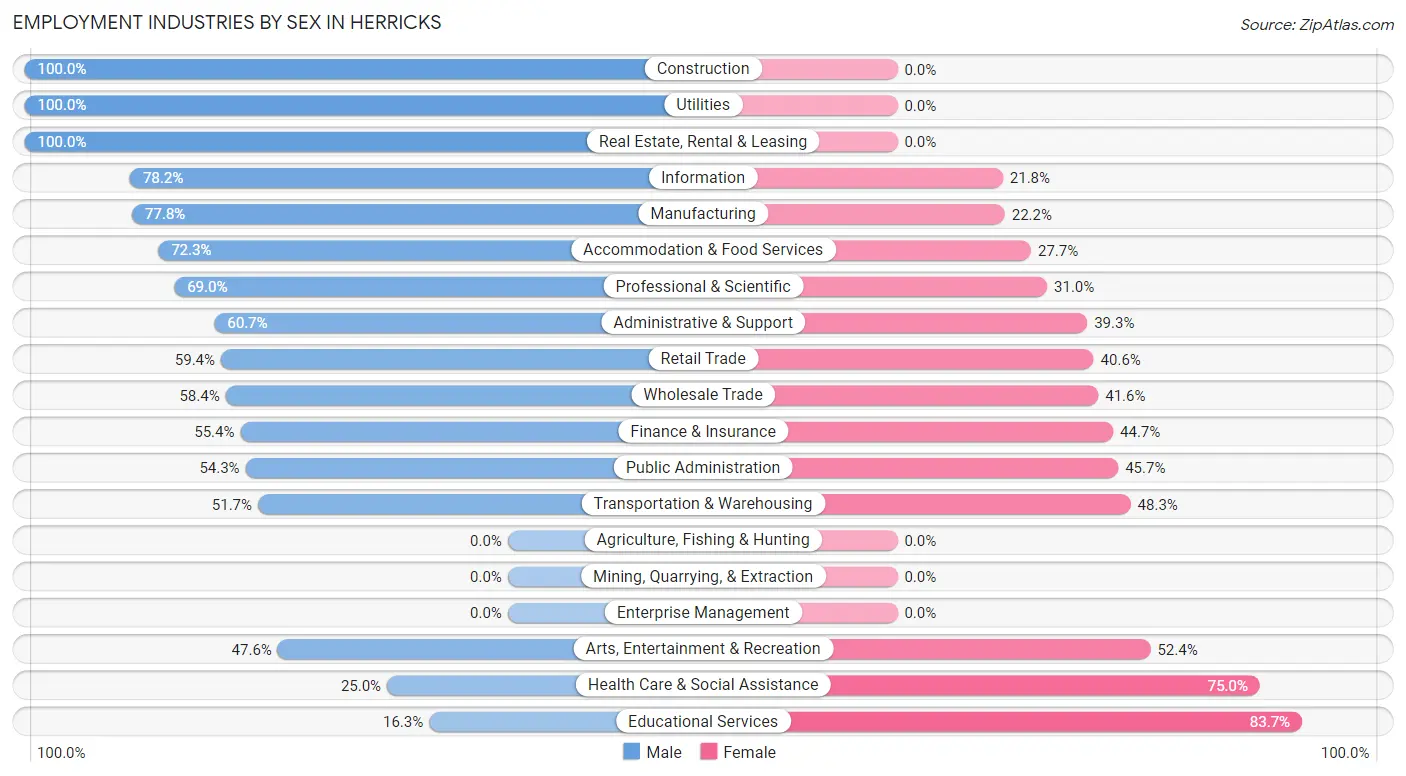
| Industry | Male | Female |
| Agriculture, Fishing & Hunting | 0 (0.0%) | 0 (0.0%) |
| Mining, Quarrying, & Extraction | 0 (0.0%) | 0 (0.0%) |
| Construction | 83 (100.0%) | 0 (0.0%) |
| Manufacturing | 63 (77.8%) | 18 (22.2%) |
| Wholesale Trade | 59 (58.4%) | 42 (41.6%) |
| Retail Trade | 95 (59.4%) | 65 (40.6%) |
| Transportation & Warehousing | 15 (51.7%) | 14 (48.3%) |
| Utilities | 25 (100.0%) | 0 (0.0%) |
| Information | 43 (78.2%) | 12 (21.8%) |
| Finance & Insurance | 88 (55.3%) | 71 (44.7%) |
| Real Estate, Rental & Leasing | 21 (100.0%) | 0 (0.0%) |
| Professional & Scientific | 176 (69.0%) | 79 (31.0%) |
| Enterprise Management | 0 (0.0%) | 0 (0.0%) |
| Administrative & Support | 34 (60.7%) | 22 (39.3%) |
| Educational Services | 28 (16.3%) | 144 (83.7%) |
| Health Care & Social Assistance | 90 (25.0%) | 270 (75.0%) |
| Arts, Entertainment & Recreation | 10 (47.6%) | 11 (52.4%) |
| Accommodation & Food Services | 34 (72.3%) | 13 (27.7%) |
| Public Administration | 57 (54.3%) | 48 (45.7%) |
| Total | 940 (52.2%) | 861 (47.8%) |
Education in Herricks
School Enrollment in Herricks
The most common levels of schooling among the 1,134 students in Herricks are high school (244 | 21.5%), middle school (238 | 21.0%), and college / undergraduate (231 | 20.4%).
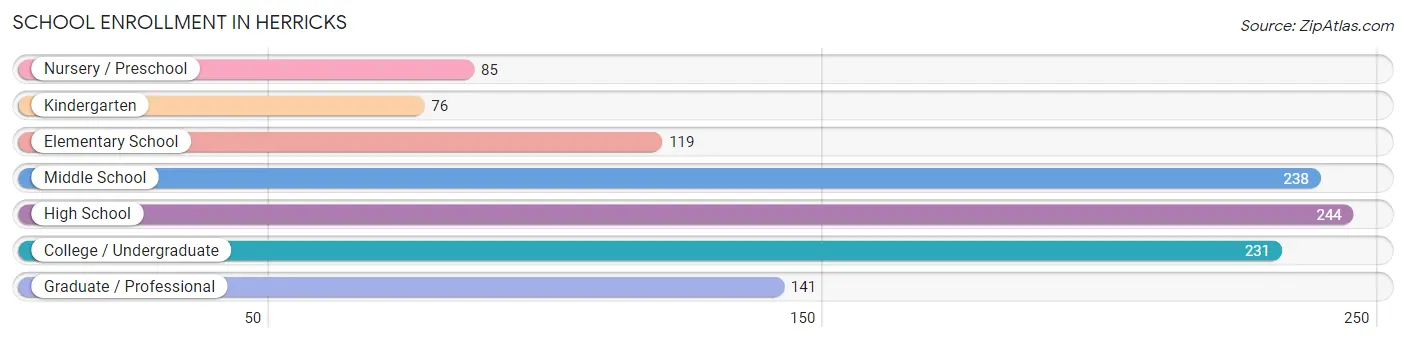
| School Level | # Students | % Students |
| Nursery / Preschool | 85 | 7.5% |
| Kindergarten | 76 | 6.7% |
| Elementary School | 119 | 10.5% |
| Middle School | 238 | 21.0% |
| High School | 244 | 21.5% |
| College / Undergraduate | 231 | 20.4% |
| Graduate / Professional | 141 | 12.4% |
| Total | 1,134 | 100.0% |
School Enrollment by Age by Funding Source in Herricks
Out of a total of 1,134 students who are enrolled in schools in Herricks, 372 (32.8%) attend a private institution, while the remaining 762 (67.2%) are enrolled in public schools. The age group of 18 to 19 year olds has the highest likelihood of being enrolled in private schools, with 77 (79.4% in the age bracket) enrolled. Conversely, the age group of 10 to 14 year olds has the lowest likelihood of being enrolled in a private school, with 316 (96.3% in the age bracket) attending a public institution.
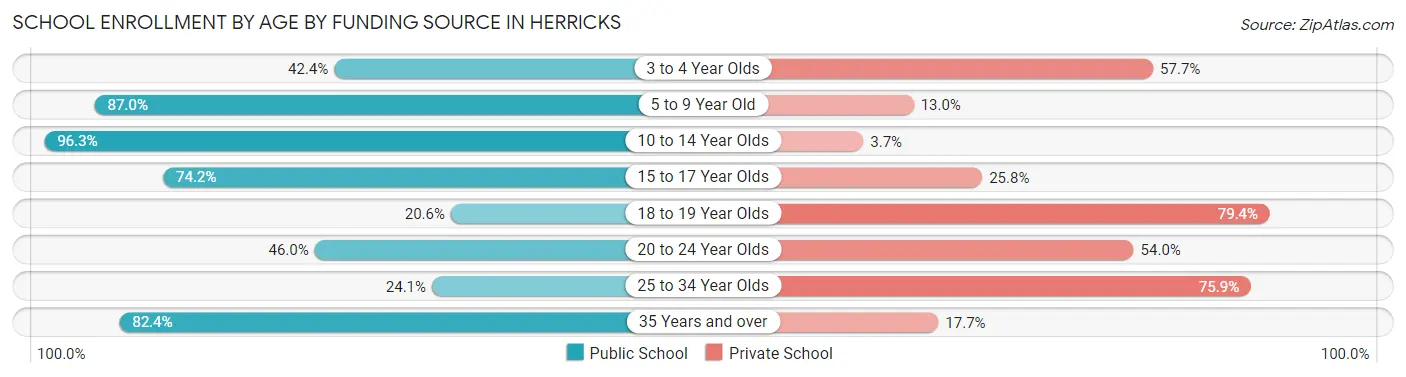
| Age Bracket | Public School | Private School |
| 3 to 4 Year Olds | 36 (42.3%) | 49 (57.7%) |
| 5 to 9 Year Old | 140 (87.0%) | 21 (13.0%) |
| 10 to 14 Year Olds | 316 (96.3%) | 12 (3.7%) |
| 15 to 17 Year Olds | 115 (74.2%) | 40 (25.8%) |
| 18 to 19 Year Olds | 20 (20.6%) | 77 (79.4%) |
| 20 to 24 Year Olds | 86 (46.0%) | 101 (54.0%) |
| 25 to 34 Year Olds | 21 (24.1%) | 66 (75.9%) |
| 35 Years and over | 28 (82.4%) | 6 (17.6%) |
| Total | 762 (67.2%) | 372 (32.8%) |
Educational Attainment by Field of Study in Herricks
Business (520 | 27.2%), science & technology (234 | 12.2%), social sciences (173 | 9.0%), computers & mathematics (171 | 8.9%), and bio, nature & agricultural (163 | 8.5%) are the most common fields of study among 1,911 individuals in Herricks who have obtained a bachelor's degree or higher.
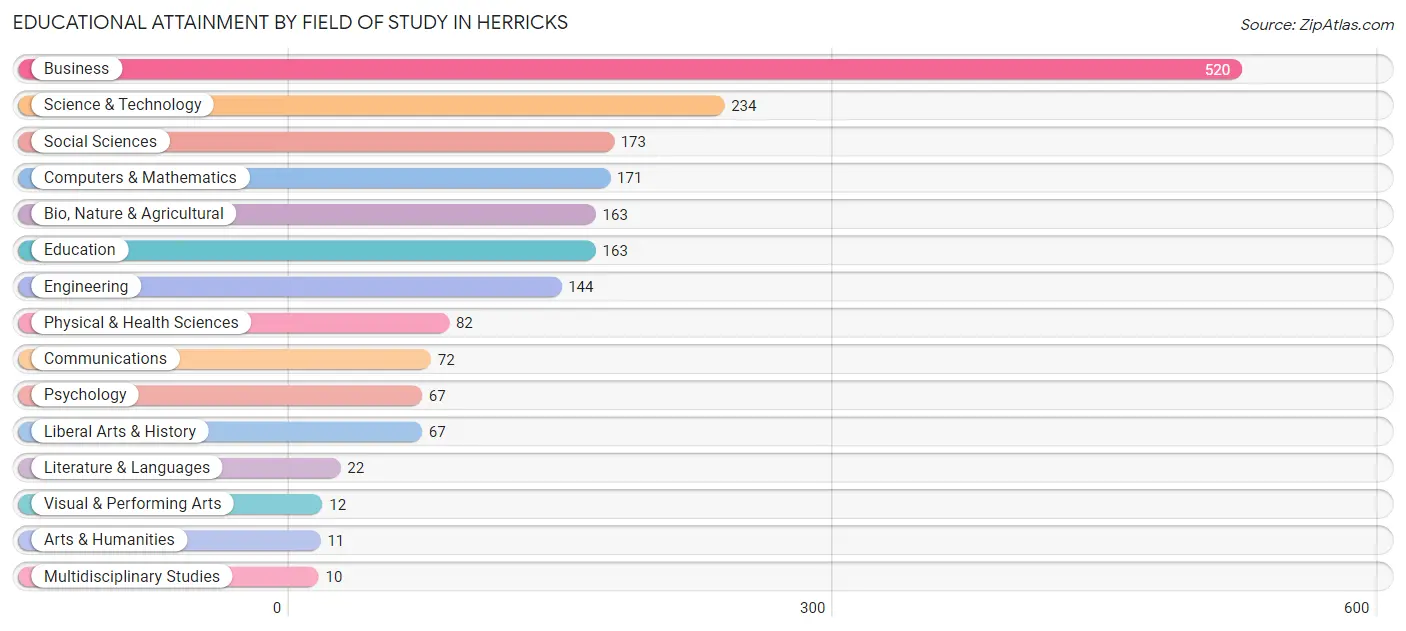
| Field of Study | # Graduates | % Graduates |
| Computers & Mathematics | 171 | 8.9% |
| Bio, Nature & Agricultural | 163 | 8.5% |
| Physical & Health Sciences | 82 | 4.3% |
| Psychology | 67 | 3.5% |
| Social Sciences | 173 | 9.0% |
| Engineering | 144 | 7.5% |
| Multidisciplinary Studies | 10 | 0.5% |
| Science & Technology | 234 | 12.2% |
| Business | 520 | 27.2% |
| Education | 163 | 8.5% |
| Literature & Languages | 22 | 1.1% |
| Liberal Arts & History | 67 | 3.5% |
| Visual & Performing Arts | 12 | 0.6% |
| Communications | 72 | 3.8% |
| Arts & Humanities | 11 | 0.6% |
| Total | 1,911 | 100.0% |
Transportation & Commute in Herricks
Vehicle Availability by Sex in Herricks
The most prevalent vehicle ownership categories in Herricks are males with 2 vehicles (480, accounting for 51.1%) and females with 2 vehicles (358, making up 56.3%).
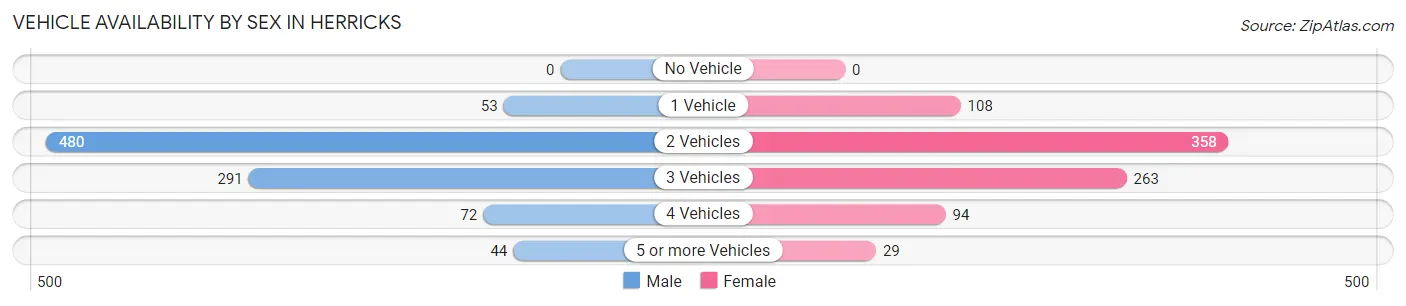
| Vehicles Available | Male | Female |
| No Vehicle | 0 (0.0%) | 0 (0.0%) |
| 1 Vehicle | 53 (5.6%) | 108 (12.7%) |
| 2 Vehicles | 480 (51.1%) | 358 (42.0%) |
| 3 Vehicles | 291 (31.0%) | 263 (30.9%) |
| 4 Vehicles | 72 (7.7%) | 94 (11.0%) |
| 5 or more Vehicles | 44 (4.7%) | 29 (3.4%) |
| Total | 940 (100.0%) | 852 (100.0%) |
Commute Time in Herricks
The most frequently occuring commute durations in Herricks are 30 to 34 minutes (260 commuters, 17.2%), 45 to 59 minutes (256 commuters, 16.9%), and 60 to 89 minutes (188 commuters, 12.4%).
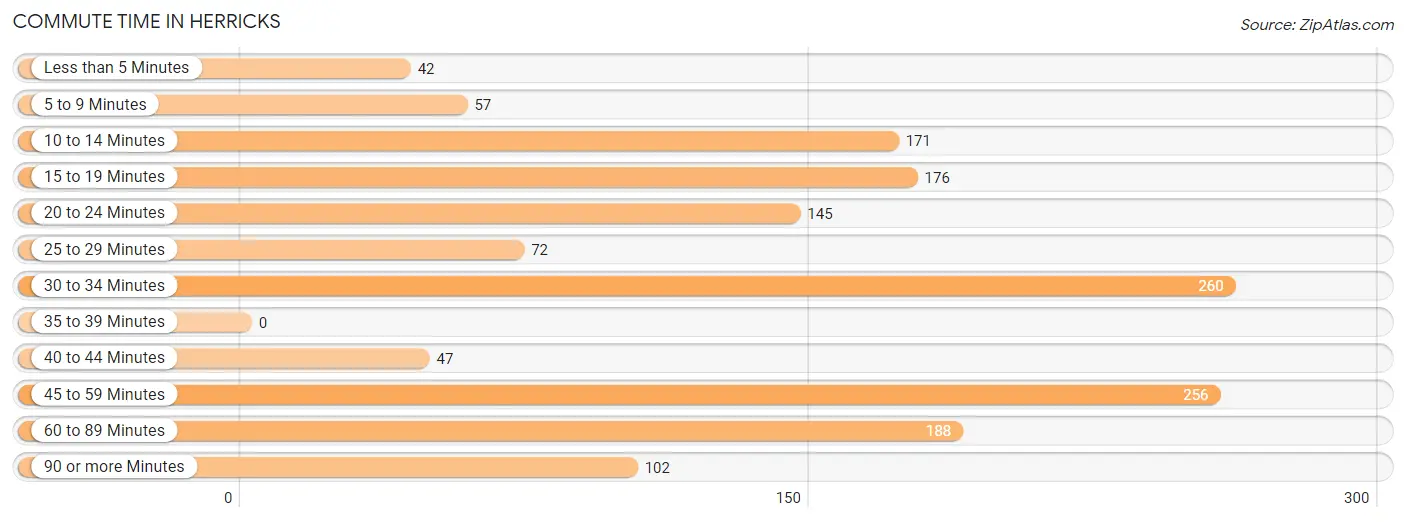
| Commute Time | # Commuters | % Commuters |
| Less than 5 Minutes | 42 | 2.8% |
| 5 to 9 Minutes | 57 | 3.8% |
| 10 to 14 Minutes | 171 | 11.3% |
| 15 to 19 Minutes | 176 | 11.6% |
| 20 to 24 Minutes | 145 | 9.6% |
| 25 to 29 Minutes | 72 | 4.8% |
| 30 to 34 Minutes | 260 | 17.2% |
| 35 to 39 Minutes | 0 | 0.0% |
| 40 to 44 Minutes | 47 | 3.1% |
| 45 to 59 Minutes | 256 | 16.9% |
| 60 to 89 Minutes | 188 | 12.4% |
| 90 or more Minutes | 102 | 6.7% |
Commute Time by Sex in Herricks
The most common commute times in Herricks are 30 to 34 minutes (159 commuters, 20.2%) for males and 10 to 14 minutes (149 commuters, 20.5%) for females.
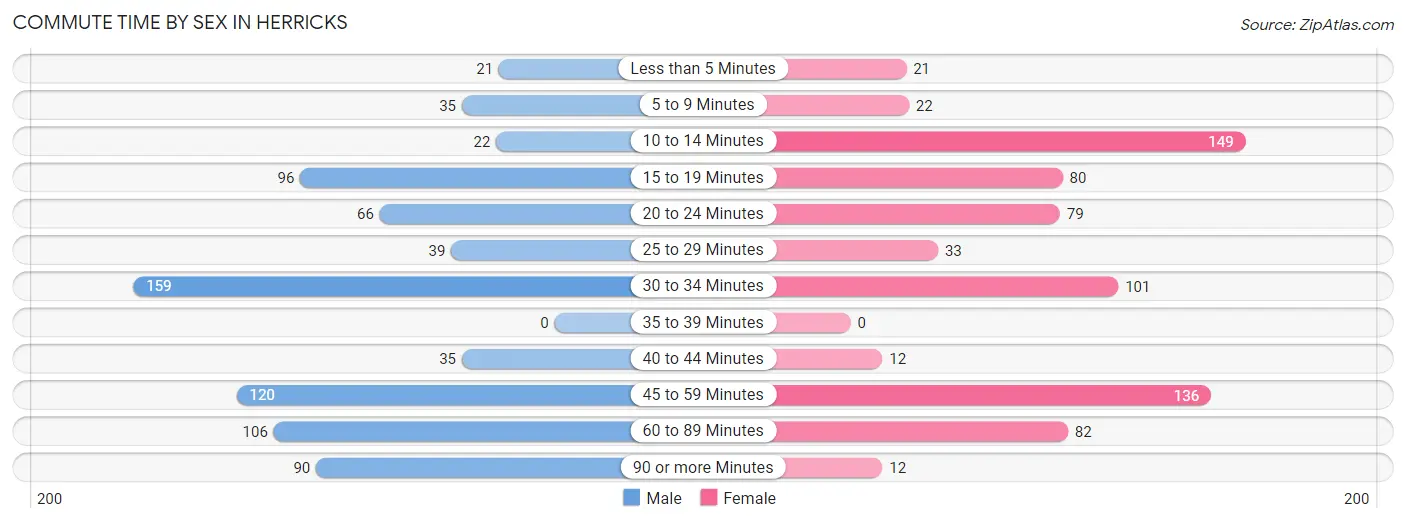
| Commute Time | Male | Female |
| Less than 5 Minutes | 21 (2.7%) | 21 (2.9%) |
| 5 to 9 Minutes | 35 (4.4%) | 22 (3.0%) |
| 10 to 14 Minutes | 22 (2.8%) | 149 (20.5%) |
| 15 to 19 Minutes | 96 (12.2%) | 80 (11.0%) |
| 20 to 24 Minutes | 66 (8.4%) | 79 (10.9%) |
| 25 to 29 Minutes | 39 (4.9%) | 33 (4.5%) |
| 30 to 34 Minutes | 159 (20.2%) | 101 (13.9%) |
| 35 to 39 Minutes | 0 (0.0%) | 0 (0.0%) |
| 40 to 44 Minutes | 35 (4.4%) | 12 (1.7%) |
| 45 to 59 Minutes | 120 (15.2%) | 136 (18.7%) |
| 60 to 89 Minutes | 106 (13.4%) | 82 (11.3%) |
| 90 or more Minutes | 90 (11.4%) | 12 (1.7%) |
Time of Departure to Work by Sex in Herricks
The most frequent times of departure to work in Herricks are 8:30 AM to 8:59 AM (120, 15.2%) for males and 8:00 AM to 8:29 AM (156, 21.5%) for females.
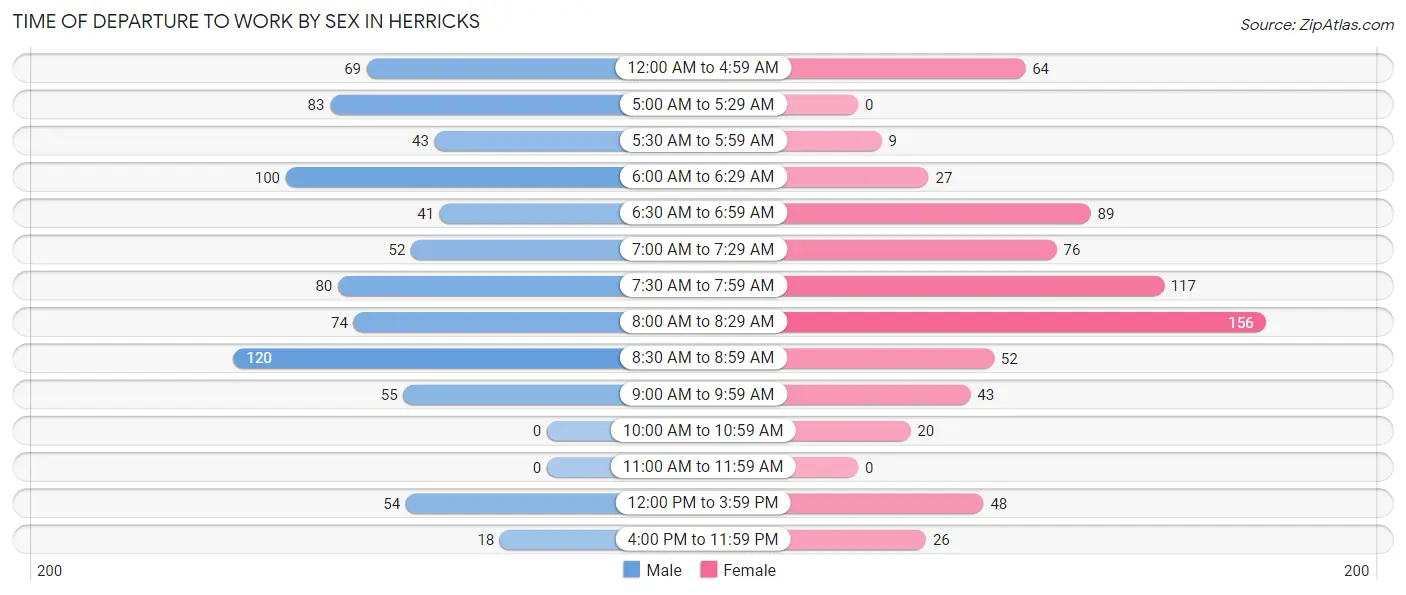
| Time of Departure | Male | Female |
| 12:00 AM to 4:59 AM | 69 (8.7%) | 64 (8.8%) |
| 5:00 AM to 5:29 AM | 83 (10.5%) | 0 (0.0%) |
| 5:30 AM to 5:59 AM | 43 (5.4%) | 9 (1.2%) |
| 6:00 AM to 6:29 AM | 100 (12.7%) | 27 (3.7%) |
| 6:30 AM to 6:59 AM | 41 (5.2%) | 89 (12.2%) |
| 7:00 AM to 7:29 AM | 52 (6.6%) | 76 (10.4%) |
| 7:30 AM to 7:59 AM | 80 (10.1%) | 117 (16.1%) |
| 8:00 AM to 8:29 AM | 74 (9.4%) | 156 (21.5%) |
| 8:30 AM to 8:59 AM | 120 (15.2%) | 52 (7.1%) |
| 9:00 AM to 9:59 AM | 55 (7.0%) | 43 (5.9%) |
| 10:00 AM to 10:59 AM | 0 (0.0%) | 20 (2.8%) |
| 11:00 AM to 11:59 AM | 0 (0.0%) | 0 (0.0%) |
| 12:00 PM to 3:59 PM | 54 (6.8%) | 48 (6.6%) |
| 4:00 PM to 11:59 PM | 18 (2.3%) | 26 (3.6%) |
| Total | 789 (100.0%) | 727 (100.0%) |
Housing Occupancy in Herricks
Occupancy by Ownership in Herricks
Of the total 1,285 dwellings in Herricks, owner-occupied units account for 1,224 (95.3%), while renter-occupied units make up 61 (4.8%).
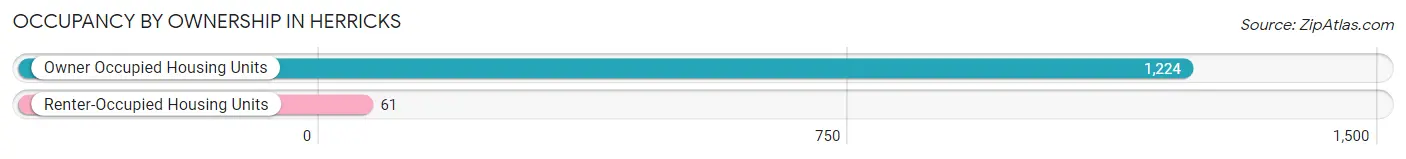
| Occupancy | # Housing Units | % Housing Units |
| Owner Occupied Housing Units | 1,224 | 95.3% |
| Renter-Occupied Housing Units | 61 | 4.8% |
| Total Occupied Housing Units | 1,285 | 100.0% |
Occupancy by Household Size in Herricks
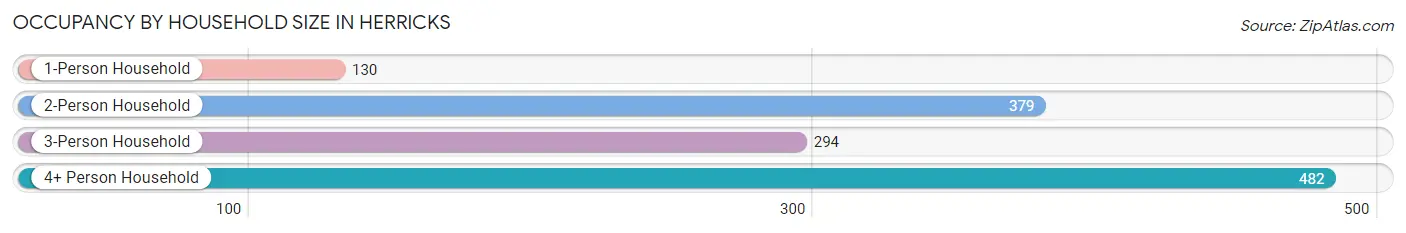
| Household Size | # Housing Units | % Housing Units |
| 1-Person Household | 130 | 10.1% |
| 2-Person Household | 379 | 29.5% |
| 3-Person Household | 294 | 22.9% |
| 4+ Person Household | 482 | 37.5% |
| Total Housing Units | 1,285 | 100.0% |
Occupancy by Ownership by Household Size in Herricks
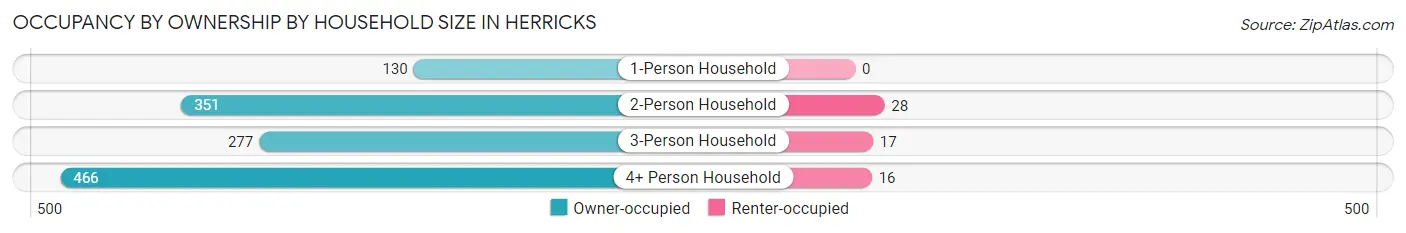
| Household Size | Owner-occupied | Renter-occupied |
| 1-Person Household | 130 (100.0%) | 0 (0.0%) |
| 2-Person Household | 351 (92.6%) | 28 (7.4%) |
| 3-Person Household | 277 (94.2%) | 17 (5.8%) |
| 4+ Person Household | 466 (96.7%) | 16 (3.3%) |
| Total Housing Units | 1,224 (95.3%) | 61 (4.8%) |
Occupancy by Educational Attainment in Herricks
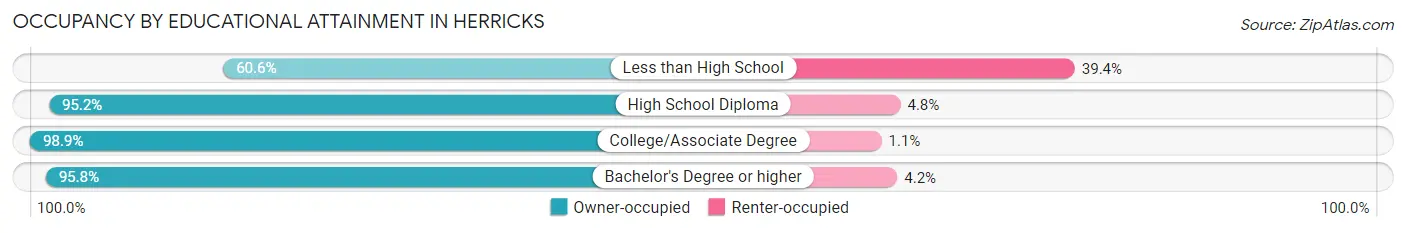
| Household Size | Owner-occupied | Renter-occupied |
| Less than High School | 20 (60.6%) | 13 (39.4%) |
| High School Diploma | 197 (95.2%) | 10 (4.8%) |
| College/Associate Degree | 185 (98.9%) | 2 (1.1%) |
| Bachelor's Degree or higher | 822 (95.8%) | 36 (4.2%) |
Occupancy by Age of Householder in Herricks
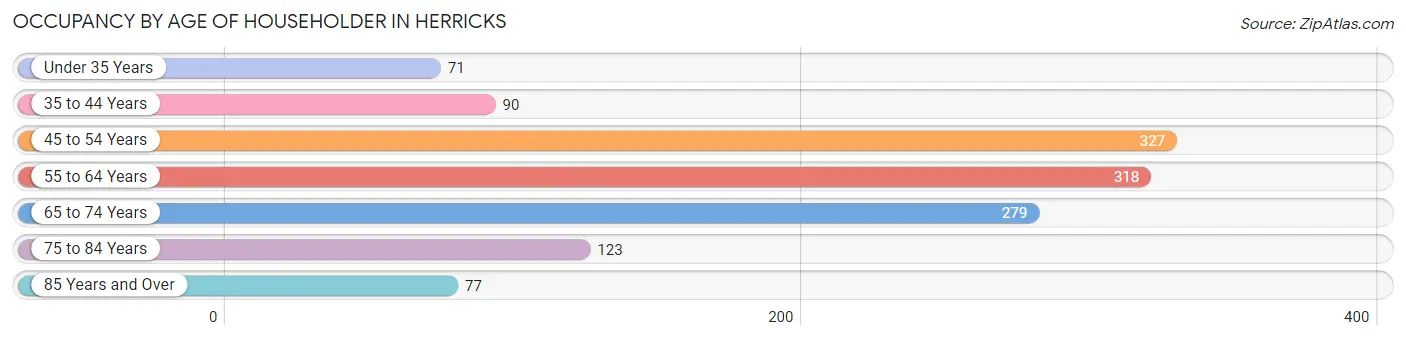
| Age Bracket | # Households | % Households |
| Under 35 Years | 71 | 5.5% |
| 35 to 44 Years | 90 | 7.0% |
| 45 to 54 Years | 327 | 25.5% |
| 55 to 64 Years | 318 | 24.7% |
| 65 to 74 Years | 279 | 21.7% |
| 75 to 84 Years | 123 | 9.6% |
| 85 Years and Over | 77 | 6.0% |
| Total | 1,285 | 100.0% |
Housing Finances in Herricks
Median Income by Occupancy in Herricks
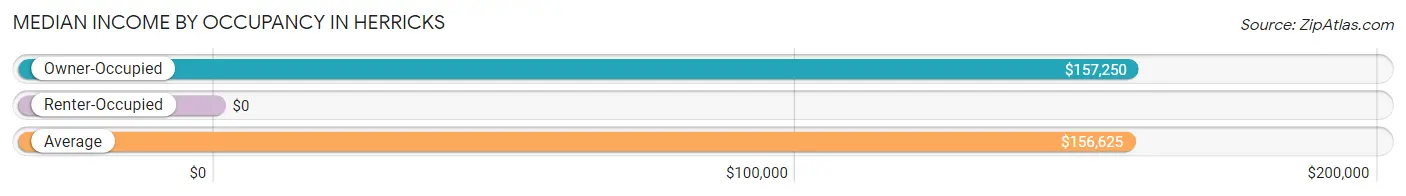
| Occupancy Type | # Households | Median Income |
| Owner-Occupied | 1,224 (95.3%) | $157,250 |
| Renter-Occupied | 61 (4.8%) | $0 |
| Average | 1,285 (100.0%) | $156,625 |
Occupancy by Householder Income Bracket in Herricks
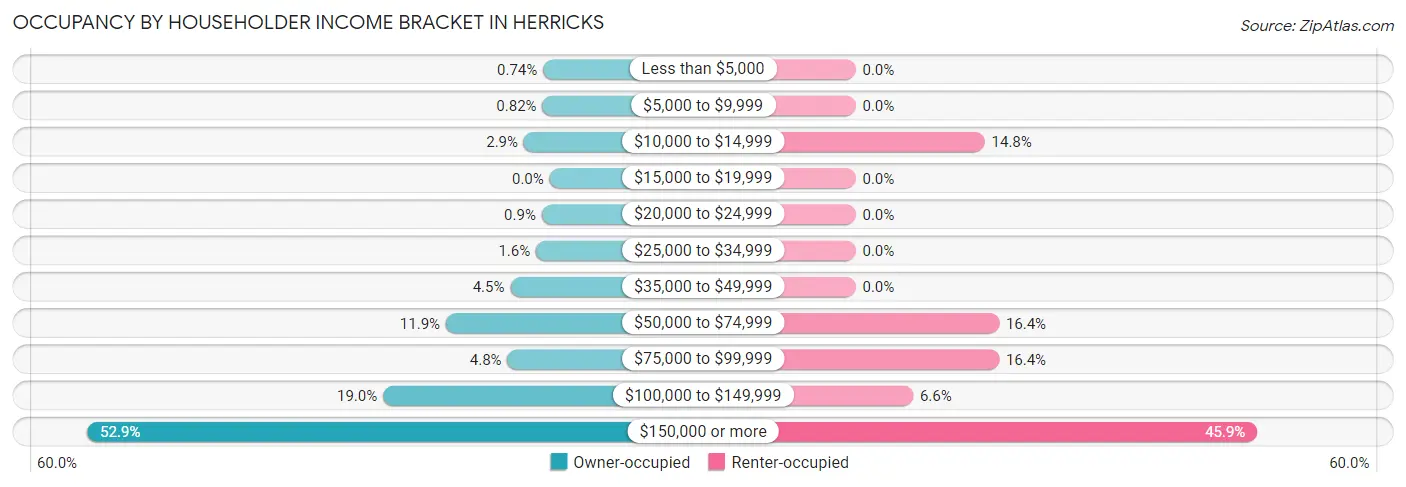
| Income Bracket | Owner-occupied | Renter-occupied |
| Less than $5,000 | 9 (0.7%) | 0 (0.0%) |
| $5,000 to $9,999 | 10 (0.8%) | 0 (0.0%) |
| $10,000 to $14,999 | 36 (2.9%) | 9 (14.7%) |
| $15,000 to $19,999 | 0 (0.0%) | 0 (0.0%) |
| $20,000 to $24,999 | 11 (0.9%) | 0 (0.0%) |
| $25,000 to $34,999 | 19 (1.5%) | 0 (0.0%) |
| $35,000 to $49,999 | 55 (4.5%) | 0 (0.0%) |
| $50,000 to $74,999 | 145 (11.8%) | 10 (16.4%) |
| $75,000 to $99,999 | 59 (4.8%) | 10 (16.4%) |
| $100,000 to $149,999 | 233 (19.0%) | 4 (6.6%) |
| $150,000 or more | 647 (52.9%) | 28 (45.9%) |
| Total | 1,224 (100.0%) | 61 (100.0%) |
Monthly Housing Cost Tiers in Herricks
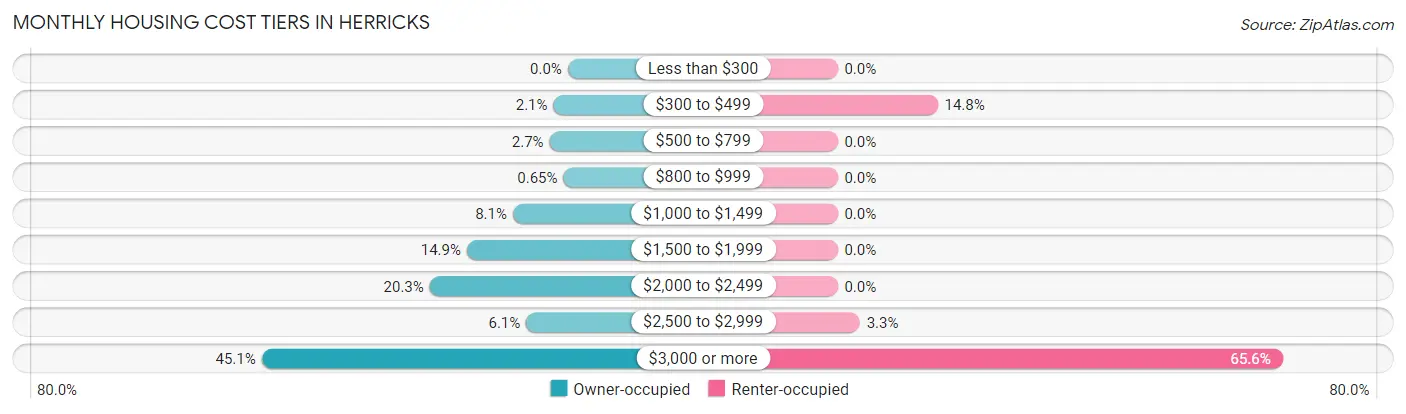
| Monthly Cost | Owner-occupied | Renter-occupied |
| Less than $300 | 0 (0.0%) | 0 (0.0%) |
| $300 to $499 | 26 (2.1%) | 9 (14.7%) |
| $500 to $799 | 33 (2.7%) | 0 (0.0%) |
| $800 to $999 | 8 (0.6%) | 0 (0.0%) |
| $1,000 to $1,499 | 99 (8.1%) | 0 (0.0%) |
| $1,500 to $1,999 | 182 (14.9%) | 0 (0.0%) |
| $2,000 to $2,499 | 249 (20.3%) | 0 (0.0%) |
| $2,500 to $2,999 | 75 (6.1%) | 2 (3.3%) |
| $3,000 or more | 552 (45.1%) | 40 (65.6%) |
| Total | 1,224 (100.0%) | 61 (100.0%) |
Physical Housing Characteristics in Herricks
Housing Structures in Herricks
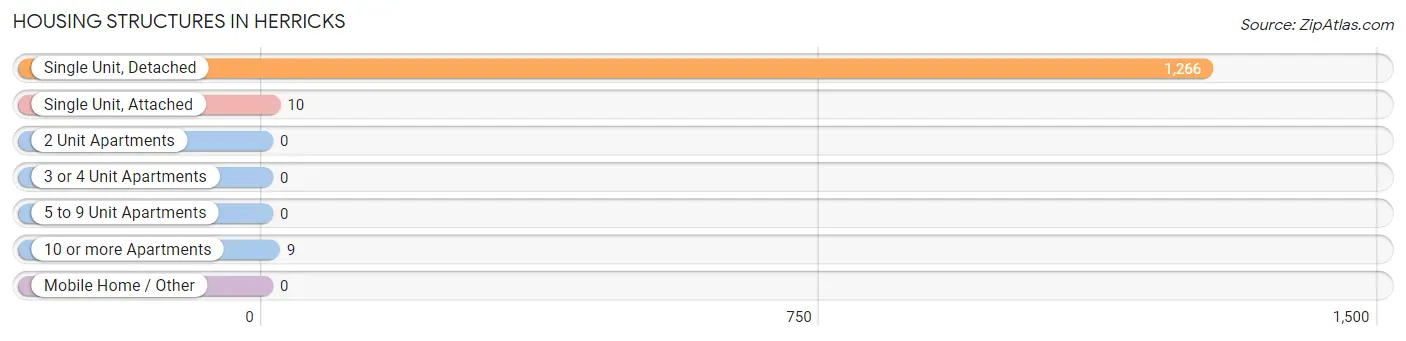
| Structure Type | # Housing Units | % Housing Units |
| Single Unit, Detached | 1,266 | 98.5% |
| Single Unit, Attached | 10 | 0.8% |
| 2 Unit Apartments | 0 | 0.0% |
| 3 or 4 Unit Apartments | 0 | 0.0% |
| 5 to 9 Unit Apartments | 0 | 0.0% |
| 10 or more Apartments | 9 | 0.7% |
| Mobile Home / Other | 0 | 0.0% |
| Total | 1,285 | 100.0% |
Housing Structures by Occupancy in Herricks
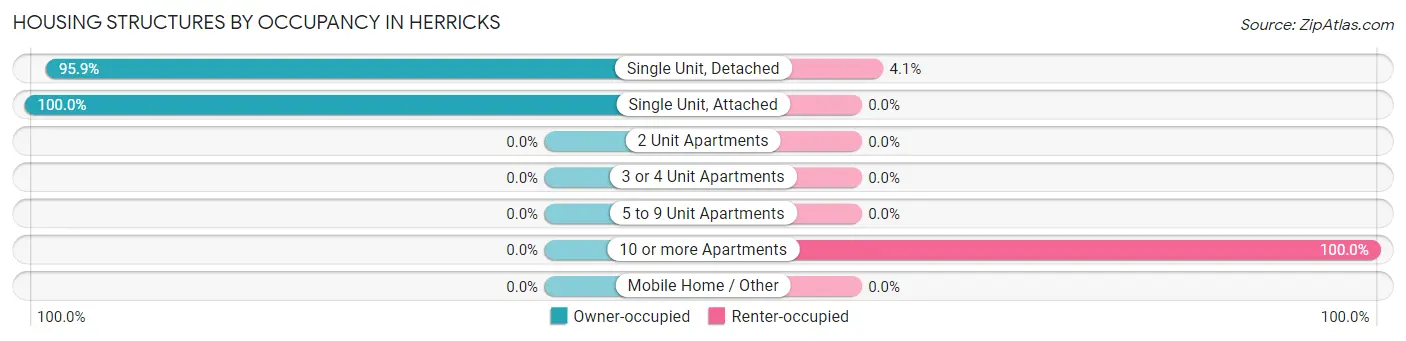
| Structure Type | Owner-occupied | Renter-occupied |
| Single Unit, Detached | 1,214 (95.9%) | 52 (4.1%) |
| Single Unit, Attached | 10 (100.0%) | 0 (0.0%) |
| 2 Unit Apartments | 0 (0.0%) | 0 (0.0%) |
| 3 or 4 Unit Apartments | 0 (0.0%) | 0 (0.0%) |
| 5 to 9 Unit Apartments | 0 (0.0%) | 0 (0.0%) |
| 10 or more Apartments | 0 (0.0%) | 9 (100.0%) |
| Mobile Home / Other | 0 (0.0%) | 0 (0.0%) |
| Total | 1,224 (95.3%) | 61 (4.8%) |
Housing Structures by Number of Rooms in Herricks
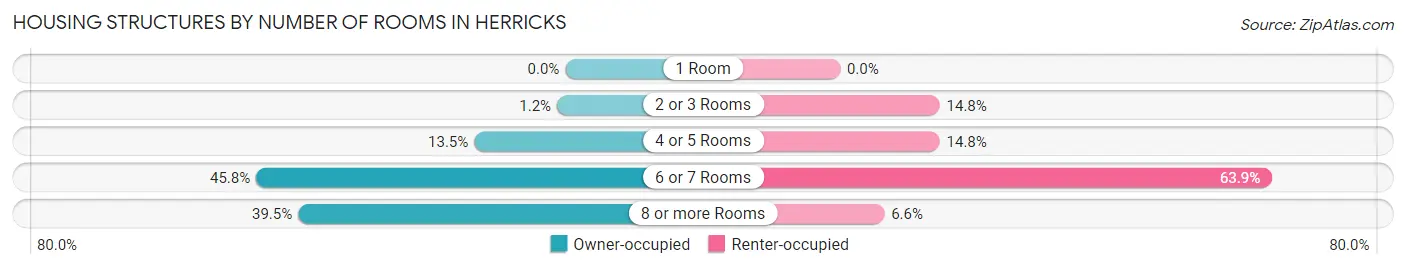
| Number of Rooms | Owner-occupied | Renter-occupied |
| 1 Room | 0 (0.0%) | 0 (0.0%) |
| 2 or 3 Rooms | 15 (1.2%) | 9 (14.7%) |
| 4 or 5 Rooms | 165 (13.5%) | 9 (14.7%) |
| 6 or 7 Rooms | 560 (45.8%) | 39 (63.9%) |
| 8 or more Rooms | 484 (39.5%) | 4 (6.6%) |
| Total | 1,224 (100.0%) | 61 (100.0%) |
Housing Structure by Heating Type in Herricks
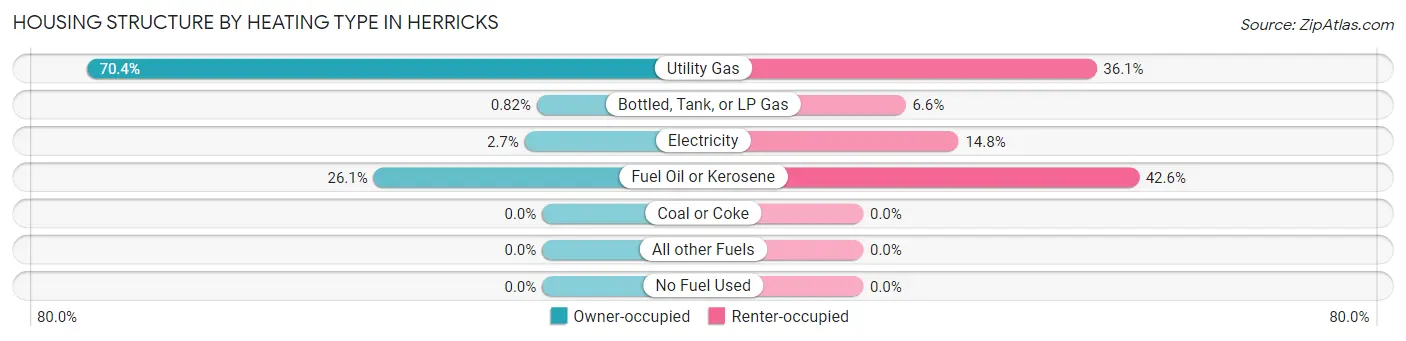
| Heating Type | Owner-occupied | Renter-occupied |
| Utility Gas | 862 (70.4%) | 22 (36.1%) |
| Bottled, Tank, or LP Gas | 10 (0.8%) | 4 (6.6%) |
| Electricity | 33 (2.7%) | 9 (14.7%) |
| Fuel Oil or Kerosene | 319 (26.1%) | 26 (42.6%) |
| Coal or Coke | 0 (0.0%) | 0 (0.0%) |
| All other Fuels | 0 (0.0%) | 0 (0.0%) |
| No Fuel Used | 0 (0.0%) | 0 (0.0%) |
| Total | 1,224 (100.0%) | 61 (100.0%) |
Household Vehicle Usage in Herricks
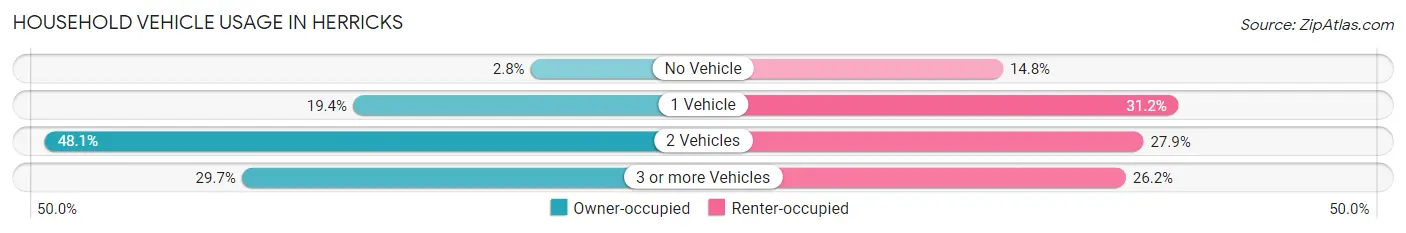
| Vehicles per Household | Owner-occupied | Renter-occupied |
| No Vehicle | 34 (2.8%) | 9 (14.7%) |
| 1 Vehicle | 237 (19.4%) | 19 (31.1%) |
| 2 Vehicles | 589 (48.1%) | 17 (27.9%) |
| 3 or more Vehicles | 364 (29.7%) | 16 (26.2%) |
| Total | 1,224 (100.0%) | 61 (100.0%) |
Real Estate & Mortgages in Herricks
Real Estate and Mortgage Overview in Herricks
| Characteristic | Without Mortgage | With Mortgage |
| Housing Units | 514 | 710 |
| Median Property Value | $758,900 | $852,100 |
| Median Household Income | $122,818 | $478 |
| Monthly Housing Costs | $1,501 | $552 |
| Real Estate Taxes | $10,001 | $0 |
Property Value by Mortgage Status in Herricks
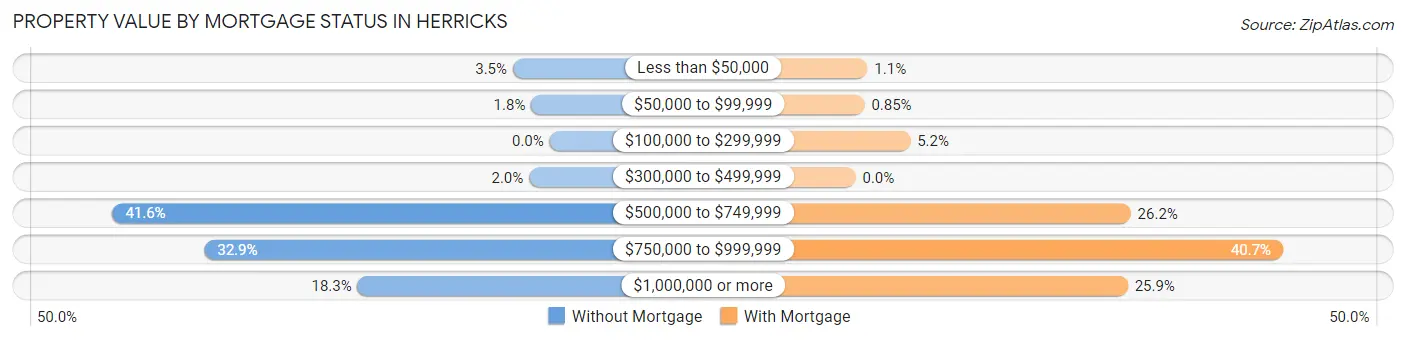
| Property Value | Without Mortgage | With Mortgage |
| Less than $50,000 | 18 (3.5%) | 8 (1.1%) |
| $50,000 to $99,999 | 9 (1.8%) | 6 (0.9%) |
| $100,000 to $299,999 | 0 (0.0%) | 37 (5.2%) |
| $300,000 to $499,999 | 10 (1.9%) | 0 (0.0%) |
| $500,000 to $749,999 | 214 (41.6%) | 186 (26.2%) |
| $750,000 to $999,999 | 169 (32.9%) | 289 (40.7%) |
| $1,000,000 or more | 94 (18.3%) | 184 (25.9%) |
| Total | 514 (100.0%) | 710 (100.0%) |
Household Income by Mortgage Status in Herricks
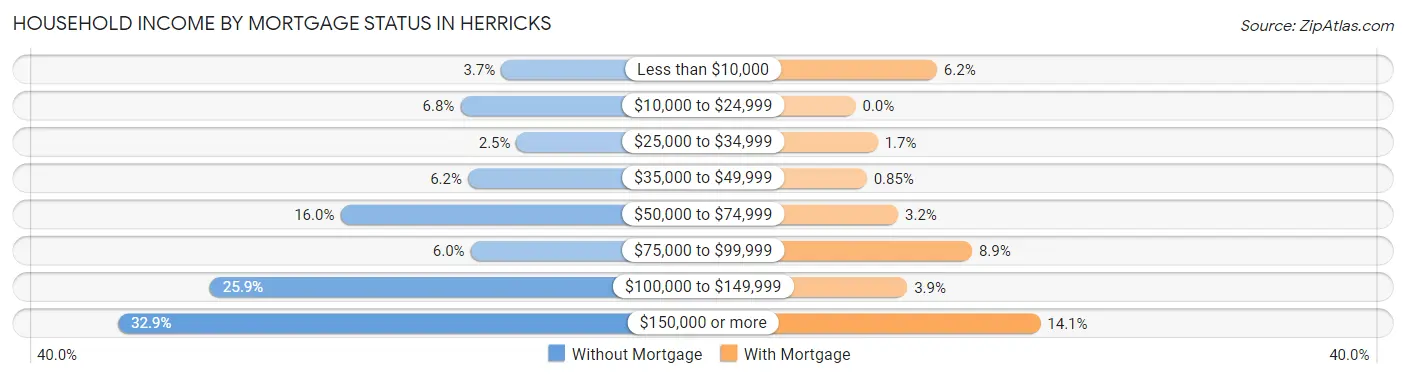
| Household Income | Without Mortgage | With Mortgage |
| Less than $10,000 | 19 (3.7%) | 44 (6.2%) |
| $10,000 to $24,999 | 35 (6.8%) | 0 (0.0%) |
| $25,000 to $34,999 | 13 (2.5%) | 12 (1.7%) |
| $35,000 to $49,999 | 32 (6.2%) | 6 (0.9%) |
| $50,000 to $74,999 | 82 (16.0%) | 23 (3.2%) |
| $75,000 to $99,999 | 31 (6.0%) | 63 (8.9%) |
| $100,000 to $149,999 | 133 (25.9%) | 28 (3.9%) |
| $150,000 or more | 169 (32.9%) | 100 (14.1%) |
| Total | 514 (100.0%) | 710 (100.0%) |
Property Value to Household Income Ratio in Herricks
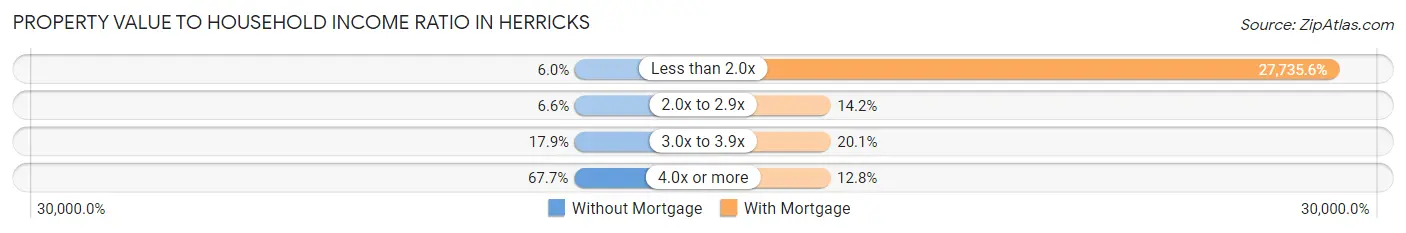
| Value-to-Income Ratio | Without Mortgage | With Mortgage |
| Less than 2.0x | 31 (6.0%) | 196,923 (27,735.6%) |
| 2.0x to 2.9x | 34 (6.6%) | 101 (14.2%) |
| 3.0x to 3.9x | 92 (17.9%) | 143 (20.1%) |
| 4.0x or more | 348 (67.7%) | 91 (12.8%) |
| Total | 514 (100.0%) | 710 (100.0%) |
Real Estate Taxes by Mortgage Status in Herricks
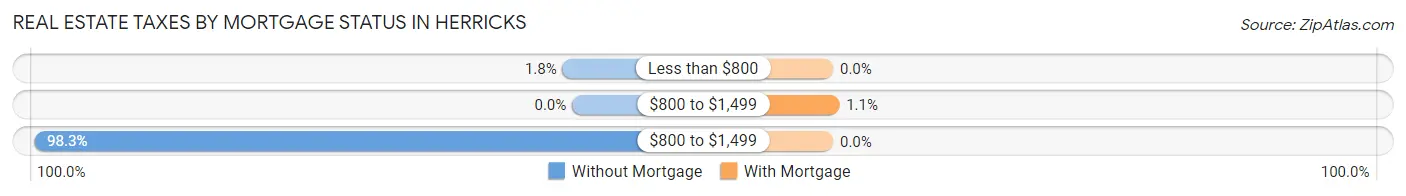
| Property Taxes | Without Mortgage | With Mortgage |
| Less than $800 | 9 (1.8%) | 0 (0.0%) |
| $800 to $1,499 | 0 (0.0%) | 8 (1.1%) |
| $800 to $1,499 | 505 (98.3%) | 0 (0.0%) |
| Total | 514 (100.0%) | 710 (100.0%) |
Health & Disability in Herricks
Health Insurance Coverage by Age in Herricks
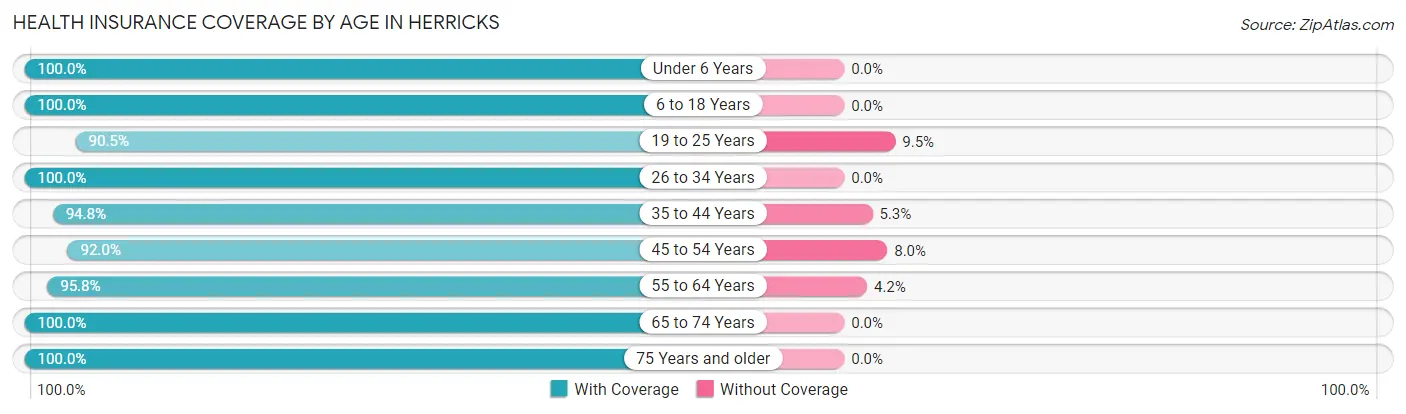
| Age Bracket | With Coverage | Without Coverage |
| Under 6 Years | 276 (100.0%) | 0 (0.0%) |
| 6 to 18 Years | 662 (100.0%) | 0 (0.0%) |
| 19 to 25 Years | 266 (90.5%) | 28 (9.5%) |
| 26 to 34 Years | 376 (100.0%) | 0 (0.0%) |
| 35 to 44 Years | 361 (94.8%) | 20 (5.2%) |
| 45 to 54 Years | 562 (92.0%) | 49 (8.0%) |
| 55 to 64 Years | 587 (95.8%) | 26 (4.2%) |
| 65 to 74 Years | 594 (100.0%) | 0 (0.0%) |
| 75 Years and older | 418 (100.0%) | 0 (0.0%) |
| Total | 4,102 (97.1%) | 123 (2.9%) |
Health Insurance Coverage by Citizenship Status in Herricks
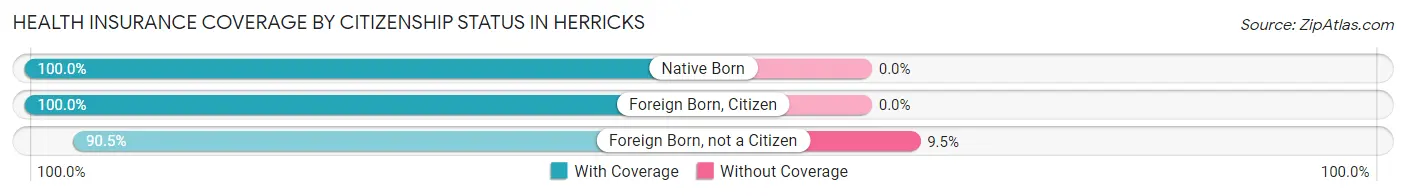
| Citizenship Status | With Coverage | Without Coverage |
| Native Born | 276 (100.0%) | 0 (0.0%) |
| Foreign Born, Citizen | 662 (100.0%) | 0 (0.0%) |
| Foreign Born, not a Citizen | 266 (90.5%) | 28 (9.5%) |
Health Insurance Coverage by Household Income in Herricks
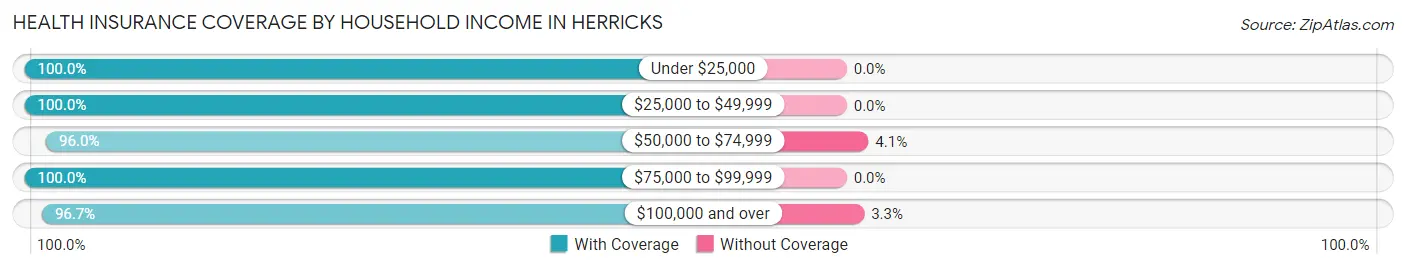
| Household Income | With Coverage | Without Coverage |
| Under $25,000 | 117 (100.0%) | 0 (0.0%) |
| $25,000 to $49,999 | 282 (100.0%) | 0 (0.0%) |
| $50,000 to $74,999 | 379 (96.0%) | 16 (4.1%) |
| $75,000 to $99,999 | 145 (100.0%) | 0 (0.0%) |
| $100,000 and over | 3,179 (96.7%) | 107 (3.3%) |
Public vs Private Health Insurance Coverage by Age in Herricks
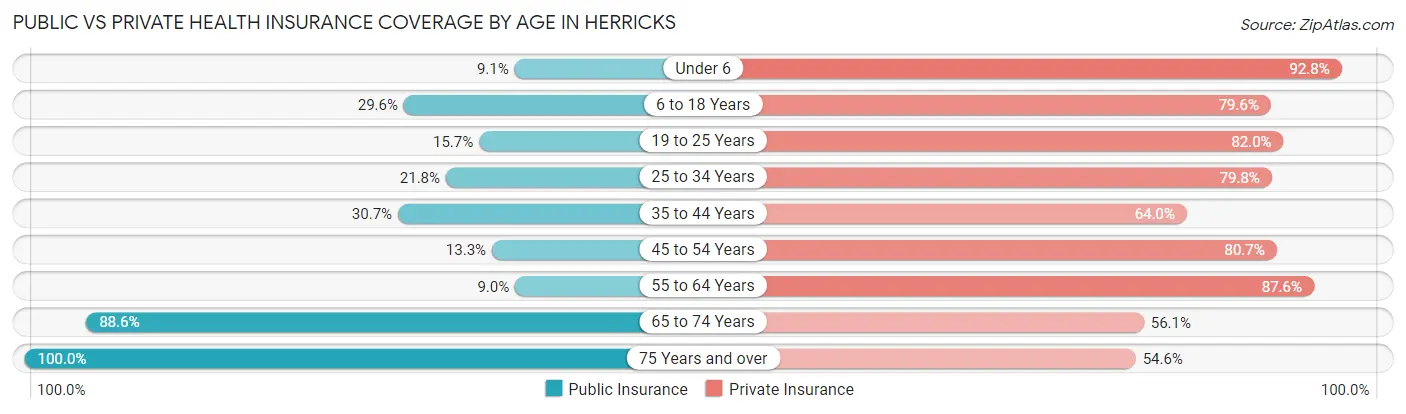
| Age Bracket | Public Insurance | Private Insurance |
| Under 6 | 25 (9.1%) | 256 (92.7%) |
| 6 to 18 Years | 196 (29.6%) | 527 (79.6%) |
| 19 to 25 Years | 46 (15.7%) | 241 (82.0%) |
| 25 to 34 Years | 82 (21.8%) | 300 (79.8%) |
| 35 to 44 Years | 117 (30.7%) | 244 (64.0%) |
| 45 to 54 Years | 81 (13.3%) | 493 (80.7%) |
| 55 to 64 Years | 55 (9.0%) | 537 (87.6%) |
| 65 to 74 Years | 526 (88.5%) | 333 (56.1%) |
| 75 Years and over | 418 (100.0%) | 228 (54.5%) |
| Total | 1,546 (36.6%) | 3,159 (74.8%) |
Disability Status by Sex by Age in Herricks
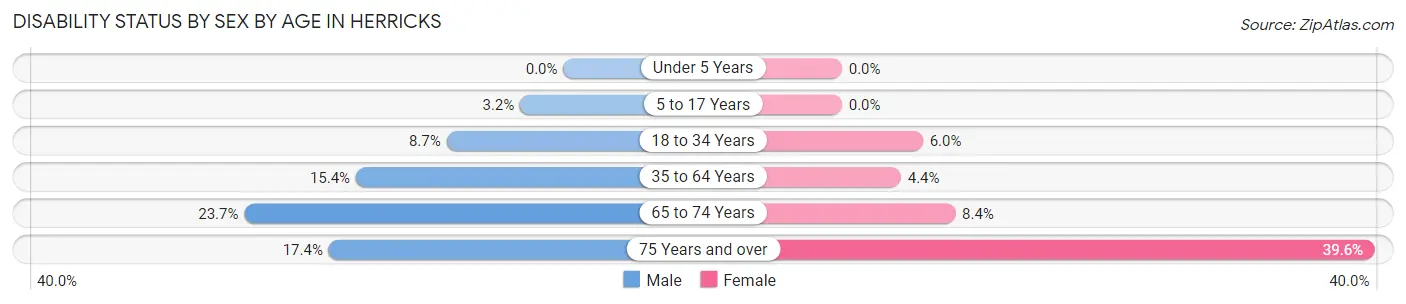
| Age Bracket | Male | Female |
| Under 5 Years | 0 (0.0%) | 0 (0.0%) |
| 5 to 17 Years | 10 (3.2%) | 0 (0.0%) |
| 18 to 34 Years | 34 (8.7%) | 22 (6.0%) |
| 35 to 64 Years | 124 (15.4%) | 35 (4.4%) |
| 65 to 74 Years | 59 (23.7%) | 29 (8.4%) |
| 75 Years and over | 31 (17.4%) | 95 (39.6%) |
Disability Class by Sex by Age in Herricks
Disability Class: Hearing Difficulty
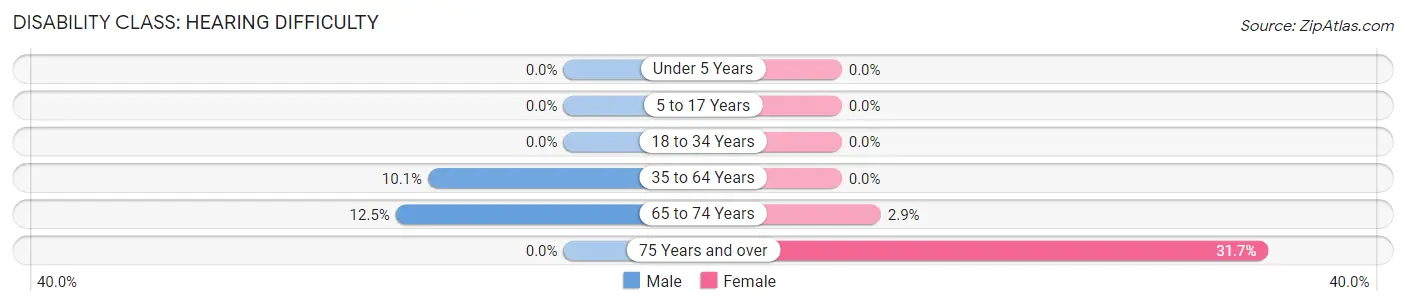
| Age Bracket | Male | Female |
| Under 5 Years | 0 (0.0%) | 0 (0.0%) |
| 5 to 17 Years | 0 (0.0%) | 0 (0.0%) |
| 18 to 34 Years | 0 (0.0%) | 0 (0.0%) |
| 35 to 64 Years | 81 (10.1%) | 0 (0.0%) |
| 65 to 74 Years | 31 (12.4%) | 10 (2.9%) |
| 75 Years and over | 0 (0.0%) | 76 (31.7%) |
Disability Class: Vision Difficulty
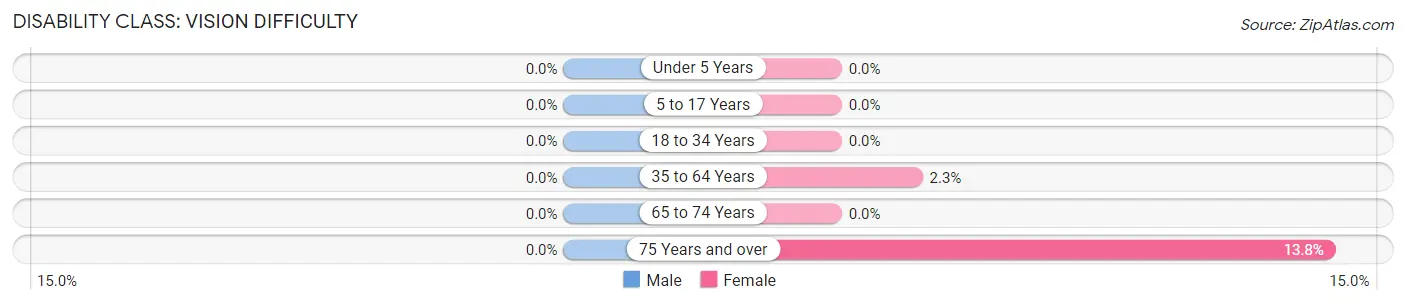
| Age Bracket | Male | Female |
| Under 5 Years | 0 (0.0%) | 0 (0.0%) |
| 5 to 17 Years | 0 (0.0%) | 0 (0.0%) |
| 18 to 34 Years | 0 (0.0%) | 0 (0.0%) |
| 35 to 64 Years | 0 (0.0%) | 18 (2.2%) |
| 65 to 74 Years | 0 (0.0%) | 0 (0.0%) |
| 75 Years and over | 0 (0.0%) | 33 (13.8%) |
Disability Class: Cognitive Difficulty
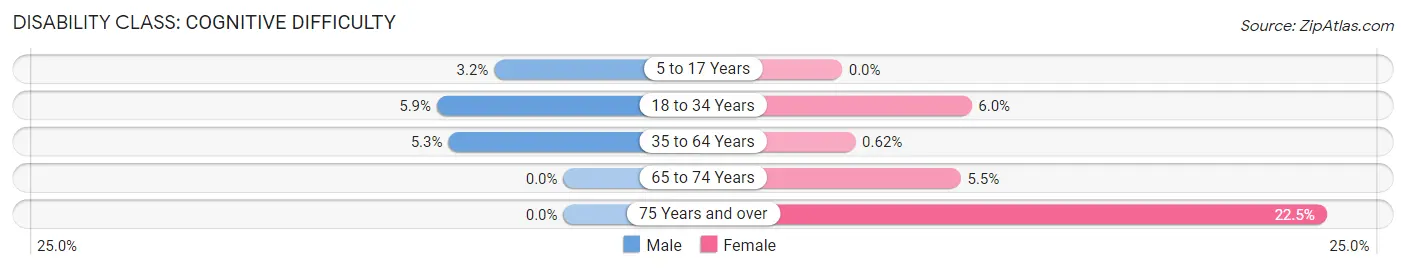
| Age Bracket | Male | Female |
| 5 to 17 Years | 10 (3.2%) | 0 (0.0%) |
| 18 to 34 Years | 23 (5.9%) | 22 (6.0%) |
| 35 to 64 Years | 43 (5.3%) | 5 (0.6%) |
| 65 to 74 Years | 0 (0.0%) | 19 (5.5%) |
| 75 Years and over | 0 (0.0%) | 54 (22.5%) |
Disability Class: Ambulatory Difficulty
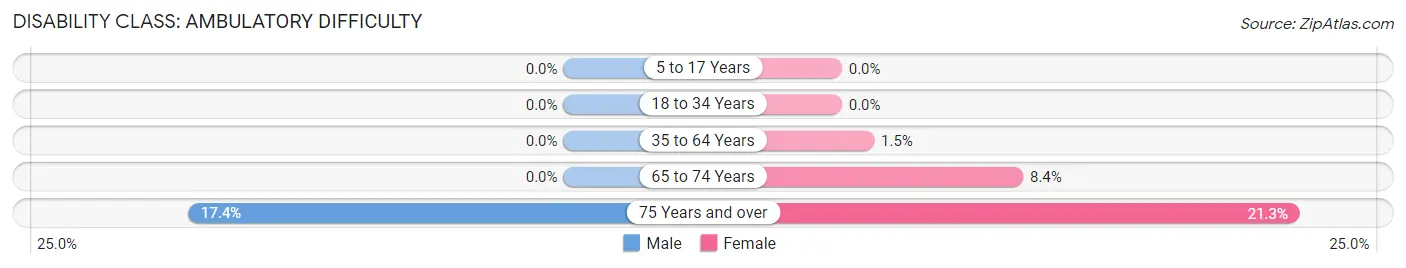
| Age Bracket | Male | Female |
| 5 to 17 Years | 0 (0.0%) | 0 (0.0%) |
| 18 to 34 Years | 0 (0.0%) | 0 (0.0%) |
| 35 to 64 Years | 0 (0.0%) | 12 (1.5%) |
| 65 to 74 Years | 0 (0.0%) | 29 (8.4%) |
| 75 Years and over | 31 (17.4%) | 51 (21.2%) |
Disability Class: Self-Care Difficulty
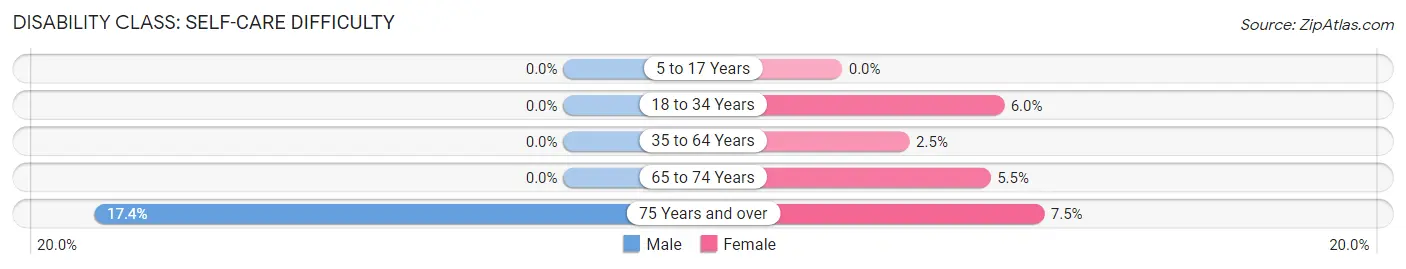
| Age Bracket | Male | Female |
| 5 to 17 Years | 0 (0.0%) | 0 (0.0%) |
| 18 to 34 Years | 0 (0.0%) | 22 (6.0%) |
| 35 to 64 Years | 0 (0.0%) | 20 (2.5%) |
| 65 to 74 Years | 0 (0.0%) | 19 (5.5%) |
| 75 Years and over | 31 (17.4%) | 18 (7.5%) |
Technology Access in Herricks
Computing Device Access in Herricks
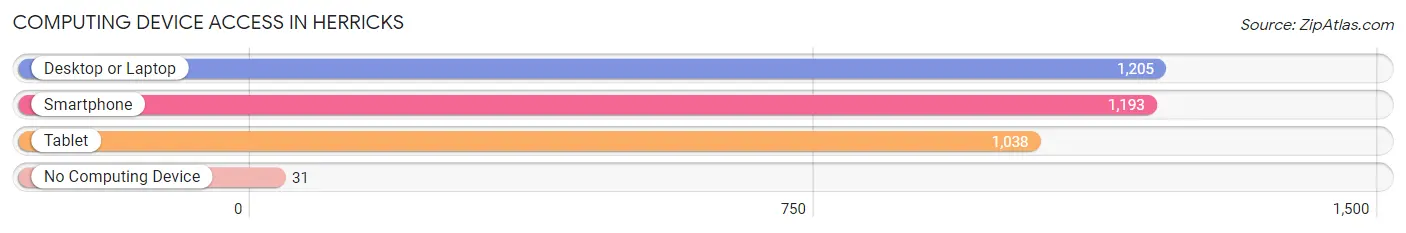
| Device Type | # Households | % Households |
| Desktop or Laptop | 1,205 | 93.8% |
| Smartphone | 1,193 | 92.8% |
| Tablet | 1,038 | 80.8% |
| No Computing Device | 31 | 2.4% |
| Total | 1,285 | 100.0% |
Internet Access in Herricks
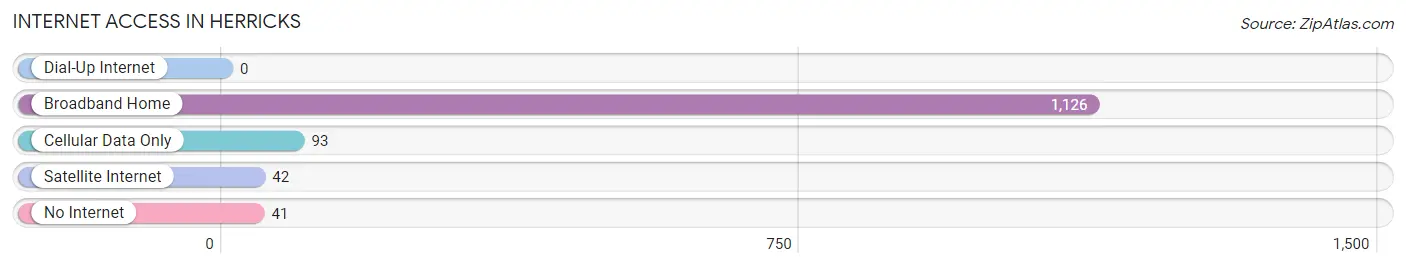
| Internet Type | # Households | % Households |
| Dial-Up Internet | 0 | 0.0% |
| Broadband Home | 1,126 | 87.6% |
| Cellular Data Only | 93 | 7.2% |
| Satellite Internet | 42 | 3.3% |
| No Internet | 41 | 3.2% |
| Total | 1,285 | 100.0% |
Herricks Summary
Herricks is a hamlet located in the Town of North Hempstead in Nassau County, New York. It is situated on the North Shore of Long Island, approximately 18 miles east of Manhattan. The hamlet is bordered by Roslyn Heights to the east, Williston Park to the south, and Albertson to the west. Herricks is home to a diverse population of approximately 8,000 people.
History
Herricks was originally inhabited by the Matinecock Native American tribe. The area was first settled by Europeans in the mid-17th century. The hamlet was named after the Herrick family, who were among the first settlers. The Herricks were Quakers who had emigrated from England in 1643. The family purchased land in the area in 1657 and established a farm.
In the late 19th century, Herricks began to develop as a residential community. The hamlet was incorporated in 1899 and was named after the Herrick family. The hamlet was primarily a farming community until the 1950s, when it began to experience rapid growth and development.
Geography
Herricks is located on the North Shore of Long Island, approximately 18 miles east of Manhattan. The hamlet is bordered by Roslyn Heights to the east, Williston Park to the south, and Albertson to the west. Herricks is situated on a hilly terrain, with elevations ranging from sea level to approximately 200 feet. The hamlet is home to several parks, including Herricks Park, which features a playground, basketball court, and baseball field.
Economy
Herricks is primarily a residential community, with a small commercial district located along Herricks Road. The hamlet is home to several small businesses, including restaurants, retail stores, and professional services. Herricks is also home to a number of corporate offices, including those of the North Shore-LIJ Health System and the New York Institute of Technology.
Demographics
As of the 2010 census, Herricks had a population of 8,000 people. The racial makeup of the hamlet was 79.3% White, 8.2% Asian, 6.2% African American, and 4.3% Hispanic or Latino. The median household income was $107,000, and the median home value was $637,000.
Herricks is home to a diverse population, with a variety of religious and cultural backgrounds. The hamlet is home to a large Jewish community, as well as a growing Asian population. Herricks is also home to a number of churches, including the Herricks United Methodist Church and the Herricks Community Church.
Common Questions
What is Per Capita Income in Herricks?
Per Capita income in Herricks is $62,322.
What is the Median Family Income in Herricks?
Median Family Income in Herricks is $167,292.
What is the Median Household income in Herricks?
Median Household Income in Herricks is $156,625.
What is Income or Wage Gap in Herricks?
Income or Wage Gap in Herricks is 41.6%.
Women in Herricks earn 58.4 cents for every dollar earned by a man.
What is Inequality or Gini Index in Herricks?
Inequality or Gini Index in Herricks is 0.44.
What is the Total Population of Herricks?
Total Population of Herricks is 4,225.
What is the Total Male Population of Herricks?
Total Male Population of Herricks is 2,010.
What is the Total Female Population of Herricks?
Total Female Population of Herricks is 2,215.
What is the Ratio of Males per 100 Females in Herricks?
There are 90.74 Males per 100 Females in Herricks.
What is the Ratio of Females per 100 Males in Herricks?
There are 110.20 Females per 100 Males in Herricks.
What is the Median Population Age in Herricks?
Median Population Age in Herricks is 47.7 Years.
What is the Average Family Size in Herricks
Average Family Size in Herricks is 3.5 People.
What is the Average Household Size in Herricks
Average Household Size in Herricks is 3.3 People.
How Large is the Labor Force in Herricks?
There are 1,960 People in the Labor Forcein in Herricks.
What is the Percentage of People in the Labor Force in Herricks?
56.2% of People are in the Labor Force in Herricks.
What is the Unemployment Rate in Herricks?
Unemployment Rate in Herricks is 8.1%.