Port Gibson, NY Map & Demographics
Port Gibson Map
Port Gibson Overview
$37,204
PER CAPITA INCOME
0.35
INEQUALITY / GINI INDEX
576
TOTAL POPULATION
324
MALE POPULATION
252
FEMALE POPULATION
128.57
MALES / 100 FEMALES
77.78
FEMALES / 100 MALES
69.3
MEDIAN AGE
2.5
AVG FAMILY SIZE
2.2
AVG HOUSEHOLD SIZE
262
LABOR FORCE [ PEOPLE ]
45.5%
PERCENT IN LABOR FORCE
5.0%
UNEMPLOYMENT RATE
Port Gibson Zip Codes
Income in Port Gibson
Income Overview in Port Gibson
| Characteristic | Number | Measure |
| Per Capita Income | 576 | $37,204 |
| Median Family Income | 207 | $0 |
| Mean Family Income | 207 | $72,143 |
| Median Household Income | 251 | $0 |
| Mean Household Income | 251 | $66,327 |
| Income Deficit | 207 | $0 |
| Wage / Income Gap (%) | 576 | 0.00% |
| Wage / Income Gap ($) | 576 | 100.00¢ per $1 |
| Gini / Inequality Index | 576 | 0.35 |
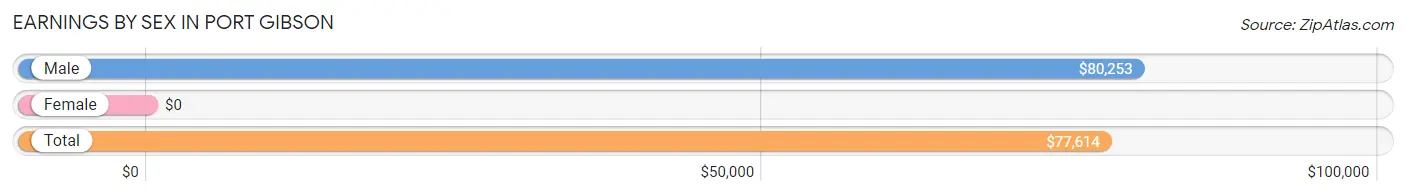
Earnings by Sex in Port Gibson
| Sex | Number | Average Earnings |
| Male | 160 (61.1%) | $80,253 |
| Female | 102 (38.9%) | $0 |
| Total | 262 (100.0%) | $77,614 |
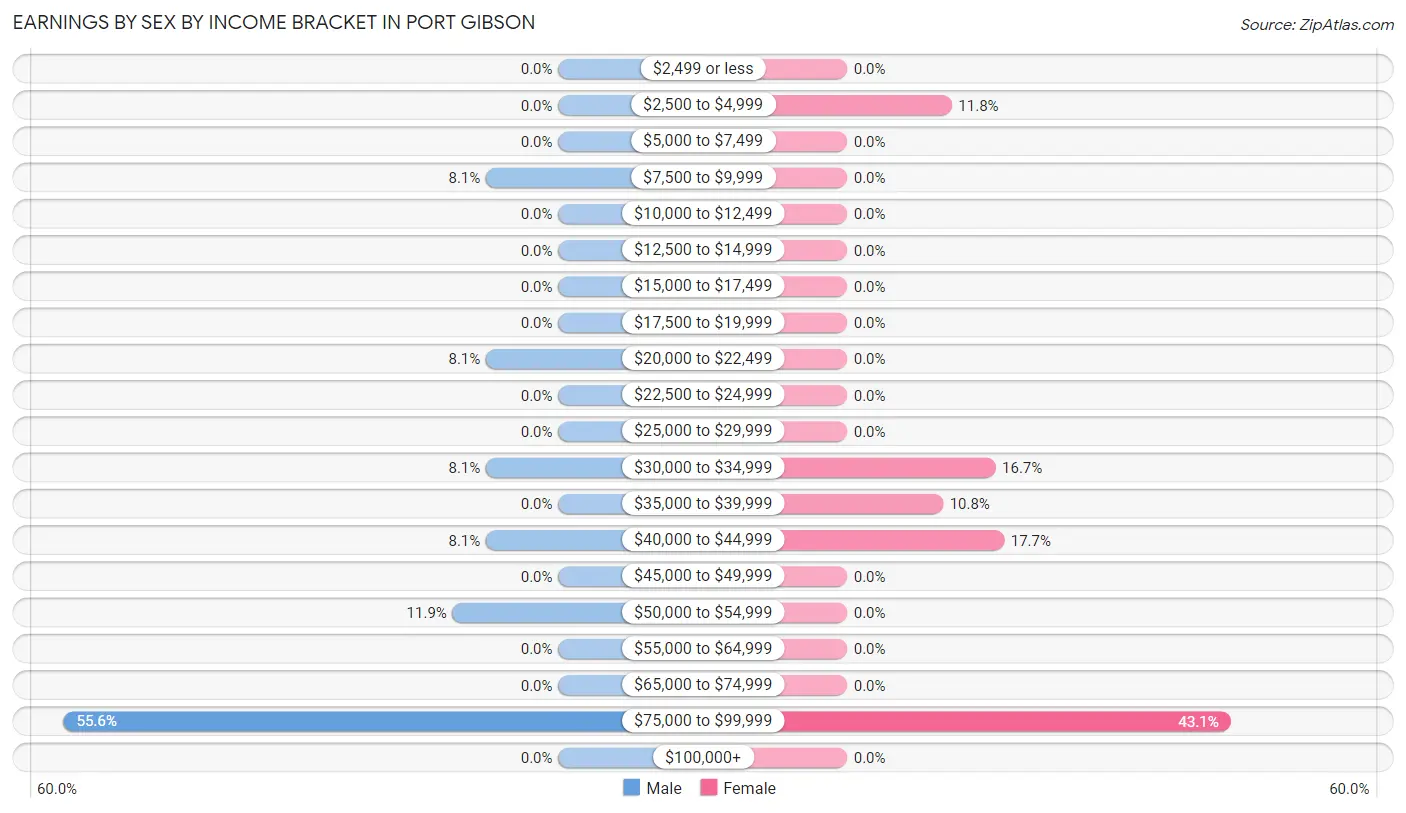
Earnings by Sex by Income Bracket in Port Gibson
The most common earnings brackets in Port Gibson are $75,000 to $99,999 for men (89 | 55.6%) and $75,000 to $99,999 for women (44 | 43.1%).
| Income | Male | Female |
| $2,499 or less | 0 (0.0%) | 0 (0.0%) |
| $2,500 to $4,999 | 0 (0.0%) | 12 (11.8%) |
| $5,000 to $7,499 | 0 (0.0%) | 0 (0.0%) |
| $7,500 to $9,999 | 13 (8.1%) | 0 (0.0%) |
| $10,000 to $12,499 | 0 (0.0%) | 0 (0.0%) |
| $12,500 to $14,999 | 0 (0.0%) | 0 (0.0%) |
| $15,000 to $17,499 | 0 (0.0%) | 0 (0.0%) |
| $17,500 to $19,999 | 0 (0.0%) | 0 (0.0%) |
| $20,000 to $22,499 | 13 (8.1%) | 0 (0.0%) |
| $22,500 to $24,999 | 0 (0.0%) | 0 (0.0%) |
| $25,000 to $29,999 | 0 (0.0%) | 0 (0.0%) |
| $30,000 to $34,999 | 13 (8.1%) | 17 (16.7%) |
| $35,000 to $39,999 | 0 (0.0%) | 11 (10.8%) |
| $40,000 to $44,999 | 13 (8.1%) | 18 (17.6%) |
| $45,000 to $49,999 | 0 (0.0%) | 0 (0.0%) |
| $50,000 to $54,999 | 19 (11.9%) | 0 (0.0%) |
| $55,000 to $64,999 | 0 (0.0%) | 0 (0.0%) |
| $65,000 to $74,999 | 0 (0.0%) | 0 (0.0%) |
| $75,000 to $99,999 | 89 (55.6%) | 44 (43.1%) |
| $100,000+ | 0 (0.0%) | 0 (0.0%) |
| Total | 160 (100.0%) | 102 (100.0%) |
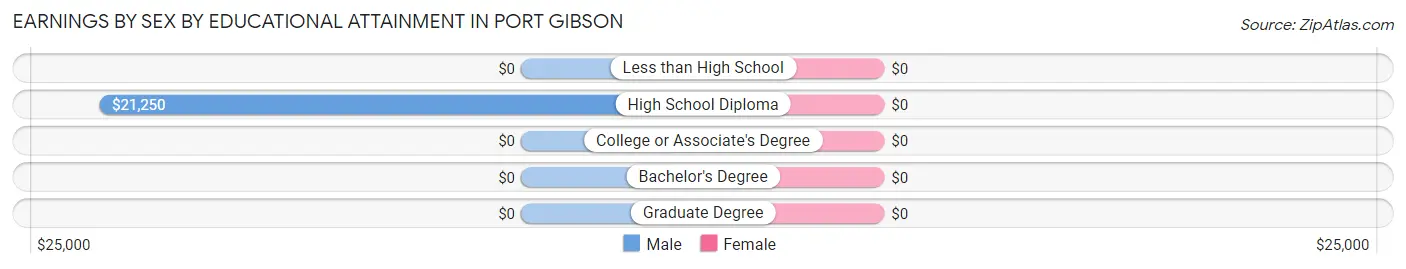
Earnings by Sex by Educational Attainment in Port Gibson
| Educational Attainment | Male Income | Female Income |
| Less than High School | - | - |
| High School Diploma | $21,250 | $0 |
| College or Associate's Degree | - | - |
| Bachelor's Degree | - | - |
| Graduate Degree | - | - |
| Total | $80,520 | $77,585 |
Family Income in Port Gibson
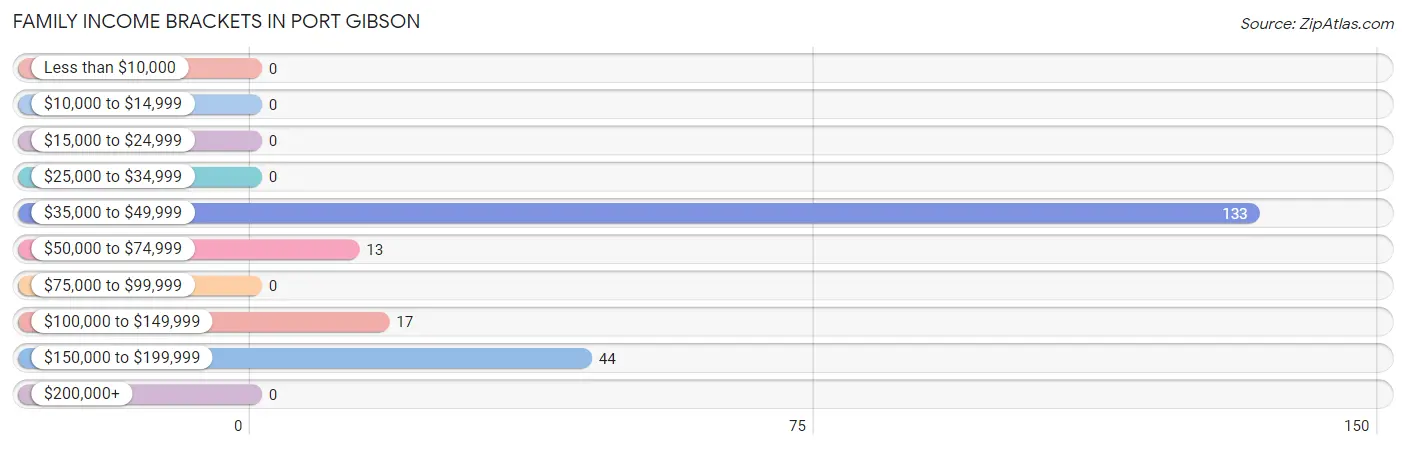
Family Income Brackets in Port Gibson
According to the Port Gibson family income data, there are 133 families falling into the $35,000 to $49,999 income range, which is the most common income bracket and makes up 64.2% of all families.
| Income Bracket | # Families | % Families |
| Less than $10,000 | 0 | 0.0% |
| $10,000 to $14,999 | 0 | 0.0% |
| $15,000 to $24,999 | 0 | 0.0% |
| $25,000 to $34,999 | 0 | 0.0% |
| $35,000 to $49,999 | 133 | 64.3% |
| $50,000 to $74,999 | 13 | 6.3% |
| $75,000 to $99,999 | 0 | 0.0% |
| $100,000 to $149,999 | 17 | 8.2% |
| $150,000 to $199,999 | 44 | 21.3% |
| $200,000+ | 0 | 0.0% |
Family Income by Famaliy Size in Port Gibson
| Income Bracket | # Families | Median Income |
| 2-Person Families | 182 (87.9%) | $0 |
| 3-Person Families | 13 (6.3%) | $0 |
| 4-Person Families | 12 (5.8%) | $0 |
| 5-Person Families | 0 (0.0%) | $0 |
| 6-Person Families | 0 (0.0%) | $0 |
| 7+ Person Families | 0 (0.0%) | $0 |
| Total | 207 (100.0%) | $0 |
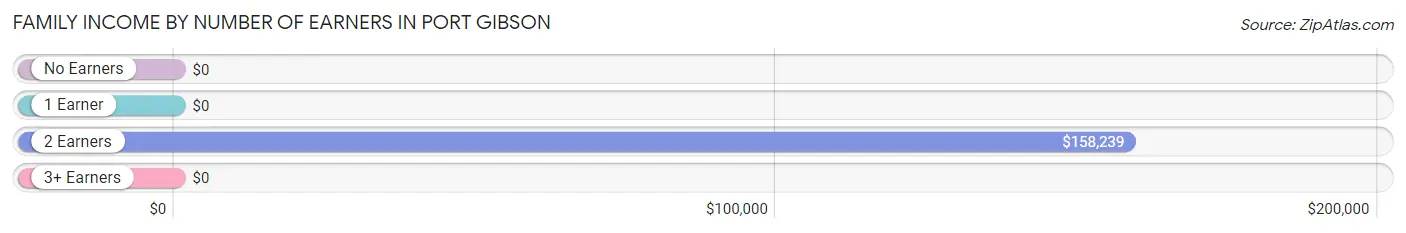
Family Income by Number of Earners in Port Gibson
| Number of Earners | # Families | Median Income |
| No Earners | 133 (64.2%) | $0 |
| 1 Earner | 0 (0.0%) | $0 |
| 2 Earners | 62 (29.9%) | $158,239 |
| 3+ Earners | 12 (5.8%) | $0 |
| Total | 207 (100.0%) | $0 |
Household Income in Port Gibson
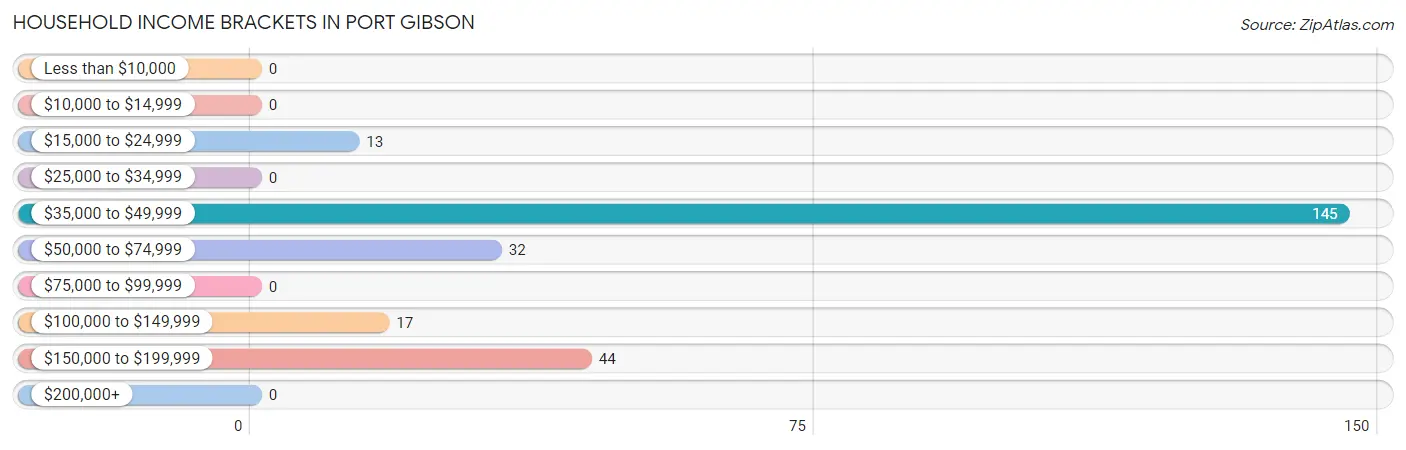
Household Income Brackets in Port Gibson
With 145 households falling in the category, the $35,000 to $49,999 income range is the most frequent in Port Gibson, accounting for 57.8% of all households.
| Income Bracket | # Households | % Households |
| Less than $10,000 | 0 | 0.0% |
| $10,000 to $14,999 | 0 | 0.0% |
| $15,000 to $24,999 | 13 | 5.2% |
| $25,000 to $34,999 | 0 | 0.0% |
| $35,000 to $49,999 | 145 | 57.8% |
| $50,000 to $74,999 | 32 | 12.7% |
| $75,000 to $99,999 | 0 | 0.0% |
| $100,000 to $149,999 | 17 | 6.8% |
| $150,000 to $199,999 | 44 | 17.5% |
| $200,000+ | 0 | 0.0% |
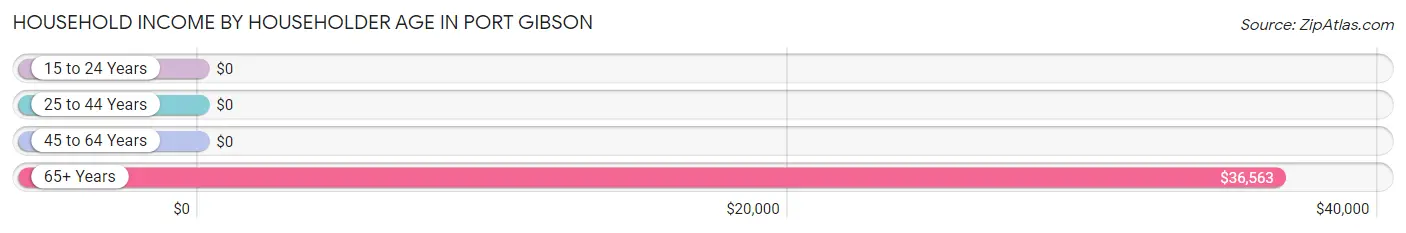
Household Income by Householder Age in Port Gibson
The median household income in Port Gibson is $0, with the highest median household income of $36,563 found in the 65+ years age bracket for the primary householder. A total of 170 households (67.7%) fall into this category. Meanwhile, the 15 to 24 years age bracket for the primary householder has the lowest median household income of $0, with 19 households (7.6%) in this group.
| Income Bracket | # Households | Median Income |
| 15 to 24 Years | 19 (7.6%) | $0 |
| 25 to 44 Years | 49 (19.5%) | $0 |
| 45 to 64 Years | 13 (5.2%) | $0 |
| 65+ Years | 170 (67.7%) | $36,563 |
| Total | 251 (100.0%) | $0 |
Poverty in Port Gibson
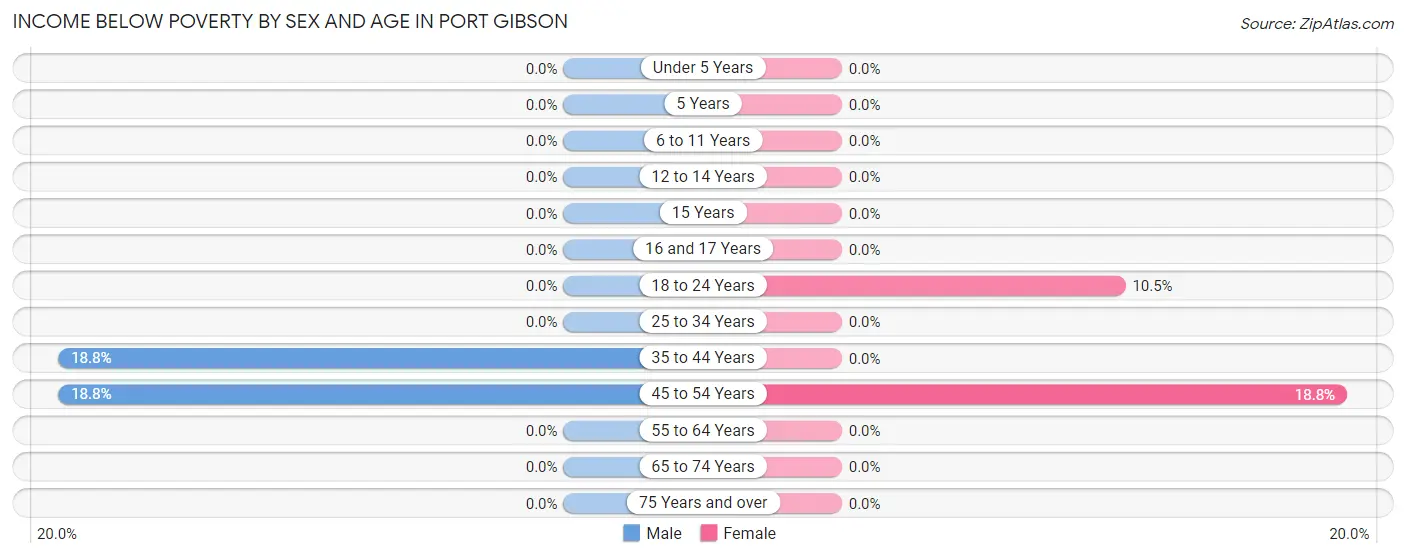
Income Below Poverty by Sex and Age in Port Gibson
With 1.8% poverty level for males and 2.0% for females among the residents of Port Gibson, 35 to 44 year old males and 45 to 54 year old females are the most vulnerable to poverty, with 3 males (18.8%) and 3 females (18.8%) in their respective age groups living below the poverty level.
| Age Bracket | Male | Female |
| Under 5 Years | 0 (0.0%) | 0 (0.0%) |
| 5 Years | 0 (0.0%) | 0 (0.0%) |
| 6 to 11 Years | 0 (0.0%) | 0 (0.0%) |
| 12 to 14 Years | 0 (0.0%) | 0 (0.0%) |
| 15 Years | 0 (0.0%) | 0 (0.0%) |
| 16 and 17 Years | 0 (0.0%) | 0 (0.0%) |
| 18 to 24 Years | 0 (0.0%) | 2 (10.5%) |
| 25 to 34 Years | 0 (0.0%) | 0 (0.0%) |
| 35 to 44 Years | 3 (18.8%) | 0 (0.0%) |
| 45 to 54 Years | 3 (18.8%) | 3 (18.8%) |
| 55 to 64 Years | 0 (0.0%) | 0 (0.0%) |
| 65 to 74 Years | 0 (0.0%) | 0 (0.0%) |
| 75 Years and over | 0 (0.0%) | 0 (0.0%) |
| Total | 6 (1.8%) | 5 (2.0%) |
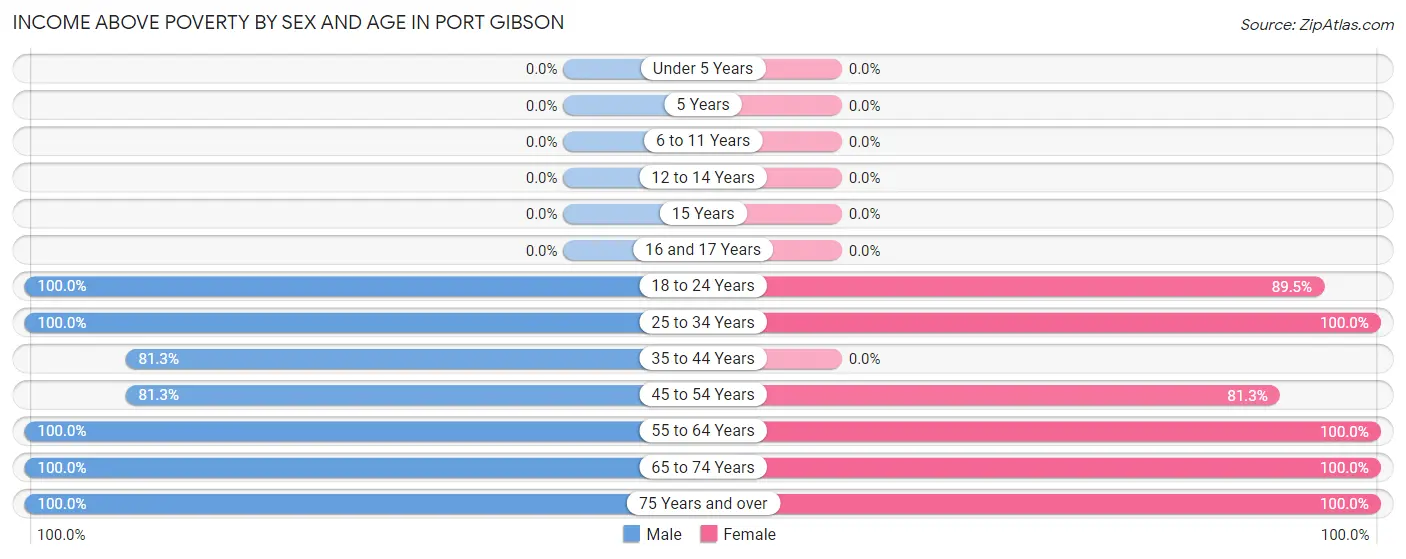
Income Above Poverty by Sex and Age in Port Gibson
According to the poverty statistics in Port Gibson, males aged 18 to 24 years and females aged 25 to 34 years are the age groups that are most secure financially, with 100.0% of males and 100.0% of females in these age groups living above the poverty line.
| Age Bracket | Male | Female |
| Under 5 Years | 0 (0.0%) | 0 (0.0%) |
| 5 Years | 0 (0.0%) | 0 (0.0%) |
| 6 to 11 Years | 0 (0.0%) | 0 (0.0%) |
| 12 to 14 Years | 0 (0.0%) | 0 (0.0%) |
| 15 Years | 0 (0.0%) | 0 (0.0%) |
| 16 and 17 Years | 0 (0.0%) | 0 (0.0%) |
| 18 to 24 Years | 19 (100.0%) | 17 (89.5%) |
| 25 to 34 Years | 102 (100.0%) | 49 (100.0%) |
| 35 to 44 Years | 13 (81.2%) | 0 (0.0%) |
| 45 to 54 Years | 13 (81.2%) | 13 (81.2%) |
| 55 to 64 Years | 13 (100.0%) | 20 (100.0%) |
| 65 to 74 Years | 22 (100.0%) | 12 (100.0%) |
| 75 Years and over | 136 (100.0%) | 136 (100.0%) |
| Total | 318 (98.2%) | 247 (98.0%) |
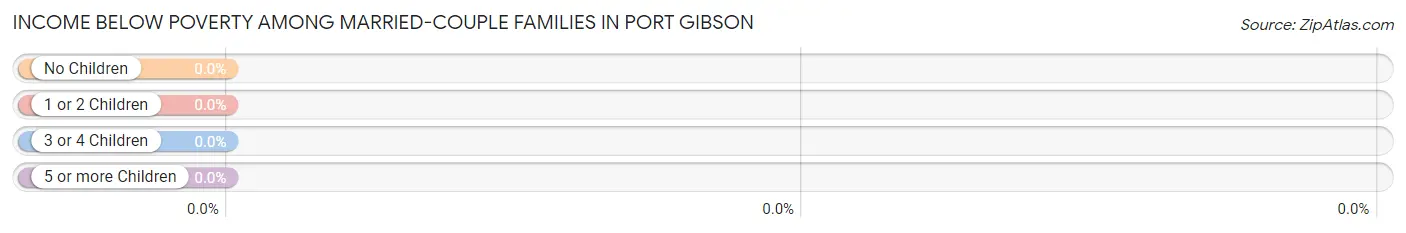
Income Below Poverty Among Married-Couple Families in Port Gibson
| Children | Above Poverty | Below Poverty |
| No Children | 195 (100.0%) | 0 (0.0%) |
| 1 or 2 Children | 0 (0.0%) | 0 (0.0%) |
| 3 or 4 Children | 0 (0.0%) | 0 (0.0%) |
| 5 or more Children | 0 (0.0%) | 0 (0.0%) |
| Total | 195 (100.0%) | 0 (0.0%) |
Income Below Poverty Among Single-Parent Households in Port Gibson
| Children | Single Father | Single Mother |
| No Children | 0 (0.0%) | 0 (0.0%) |
| 1 or 2 Children | 0 (0.0%) | 0 (0.0%) |
| 3 or 4 Children | 0 (0.0%) | 0 (0.0%) |
| 5 or more Children | 0 (0.0%) | 0 (0.0%) |
| Total | 0 (0.0%) | 0 (0.0%) |
Income Below Poverty Among Married-Couple vs Single-Parent Households in Port Gibson
| Children | Married-Couple Families | Single-Parent Households |
| No Children | 0 (0.0%) | 0 (0.0%) |
| 1 or 2 Children | 0 (0.0%) | 0 (0.0%) |
| 3 or 4 Children | 0 (0.0%) | 0 (0.0%) |
| 5 or more Children | 0 (0.0%) | 0 (0.0%) |
| Total | 0 (0.0%) | 0 (0.0%) |
Race in Port Gibson
The most populous races in Port Gibson are White / Caucasian (557 | 96.7%), Native / Alaskan (11 | 1.9%), and Two or more Races (5 | 0.9%).
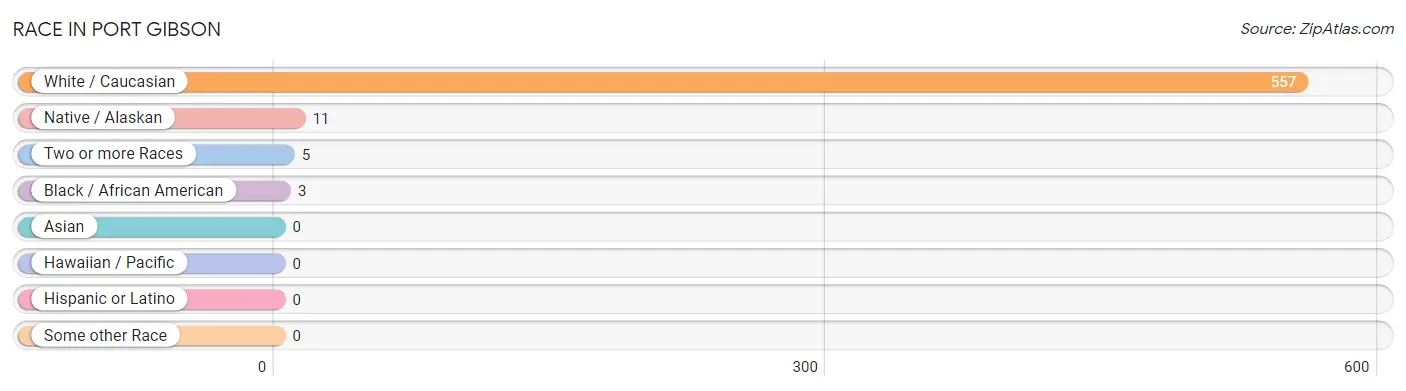
| Race | # Population | % Population |
| Asian | 0 | 0.0% |
| Black / African American | 3 | 0.5% |
| Hawaiian / Pacific | 0 | 0.0% |
| Hispanic or Latino | 0 | 0.0% |
| Native / Alaskan | 11 | 1.9% |
| White / Caucasian | 557 | 96.7% |
| Two or more Races | 5 | 0.9% |
| Some other Race | 0 | 0.0% |
| Total | 576 | 100.0% |
Ancestry in Port Gibson
The most populous ancestries reported in Port Gibson are English (154 | 26.7%), American (136 | 23.6%), Italian (133 | 23.1%), Irish (67 | 11.6%), and Polish (42 | 7.3%), together accounting for 92.4% of all Port Gibson residents.
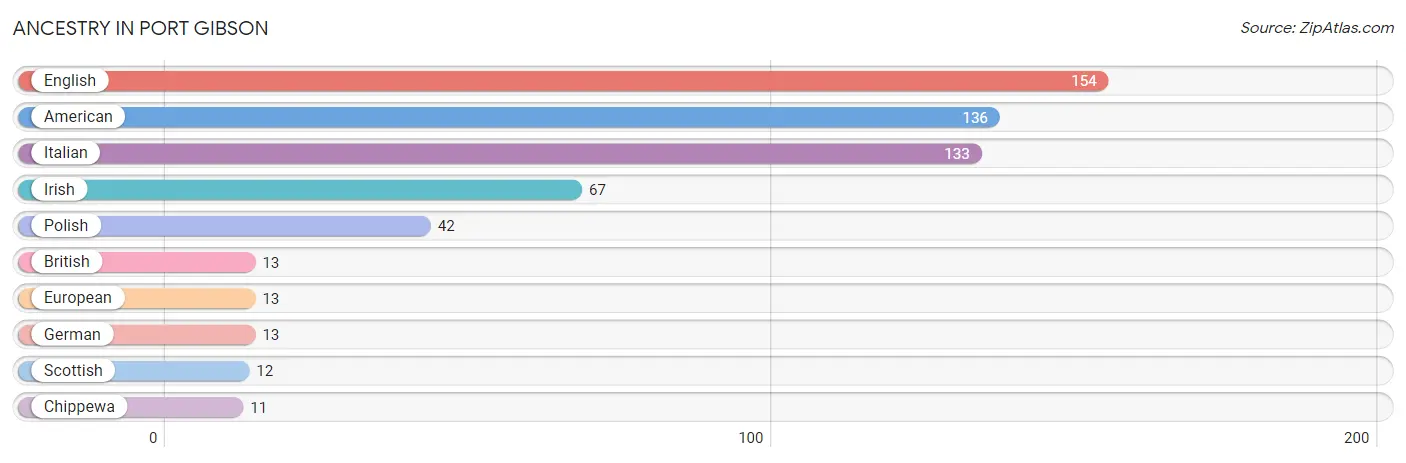
| Ancestry | # Population | % Population |
| American | 136 | 23.6% |
| British | 13 | 2.3% |
| Chippewa | 11 | 1.9% |
| English | 154 | 26.7% |
| European | 13 | 2.3% |
| German | 13 | 2.3% |
| Irish | 67 | 11.6% |
| Italian | 133 | 23.1% |
| Polish | 42 | 7.3% |
| Scottish | 12 | 2.1% | View All 10 Rows |
Immigrants in Port Gibson

| Immigration Origin | # Population | % Population | View All 0 Rows |
Sex and Age in Port Gibson
Sex and Age in Port Gibson
The most populous age groups in Port Gibson are 85 Years and over (124 | 38.3%) for men and 85 Years and over (136 | 54.0%) for women.
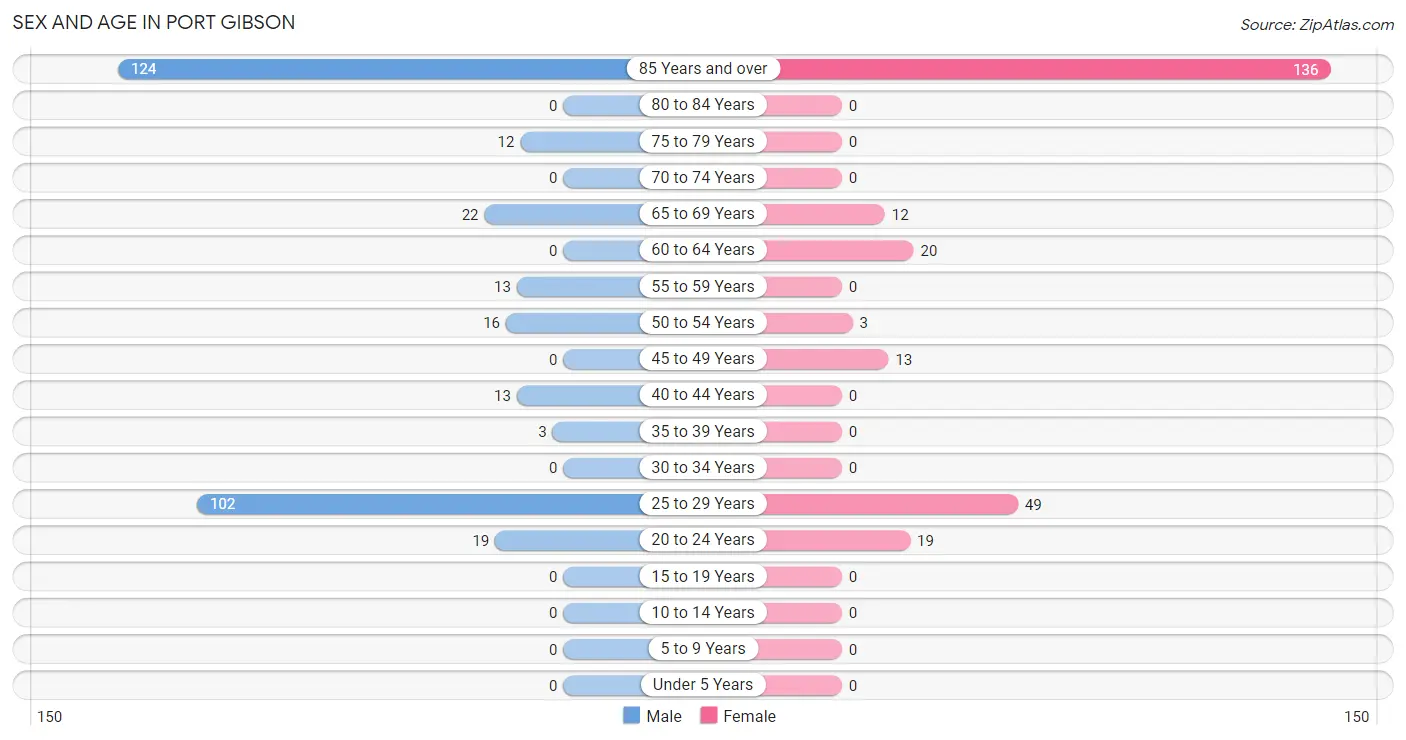
| Age Bracket | Male | Female |
| Under 5 Years | 0 (0.0%) | 0 (0.0%) |
| 5 to 9 Years | 0 (0.0%) | 0 (0.0%) |
| 10 to 14 Years | 0 (0.0%) | 0 (0.0%) |
| 15 to 19 Years | 0 (0.0%) | 0 (0.0%) |
| 20 to 24 Years | 19 (5.9%) | 19 (7.5%) |
| 25 to 29 Years | 102 (31.5%) | 49 (19.4%) |
| 30 to 34 Years | 0 (0.0%) | 0 (0.0%) |
| 35 to 39 Years | 3 (0.9%) | 0 (0.0%) |
| 40 to 44 Years | 13 (4.0%) | 0 (0.0%) |
| 45 to 49 Years | 0 (0.0%) | 13 (5.2%) |
| 50 to 54 Years | 16 (4.9%) | 3 (1.2%) |
| 55 to 59 Years | 13 (4.0%) | 0 (0.0%) |
| 60 to 64 Years | 0 (0.0%) | 20 (7.9%) |
| 65 to 69 Years | 22 (6.8%) | 12 (4.8%) |
| 70 to 74 Years | 0 (0.0%) | 0 (0.0%) |
| 75 to 79 Years | 12 (3.7%) | 0 (0.0%) |
| 80 to 84 Years | 0 (0.0%) | 0 (0.0%) |
| 85 Years and over | 124 (38.3%) | 136 (54.0%) |
| Total | 324 (100.0%) | 252 (100.0%) |
Families and Households in Port Gibson
Median Family Size in Port Gibson
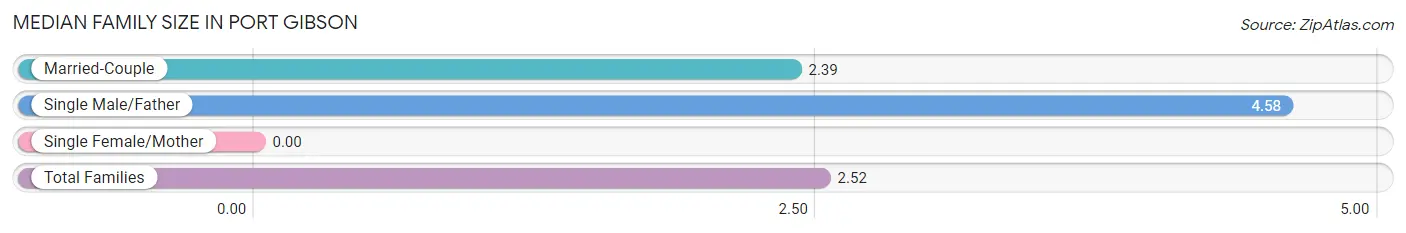
| Family Type | # Families | Family Size |
| Married-Couple | 195 (94.2%) | 2.39 |
| Single Male/Father | 12 (5.8%) | 4.58 |
| Single Female/Mother | 0 (0.0%) | - |
| Total Families | 207 (100.0%) | 2.52 |
Median Household Size in Port Gibson
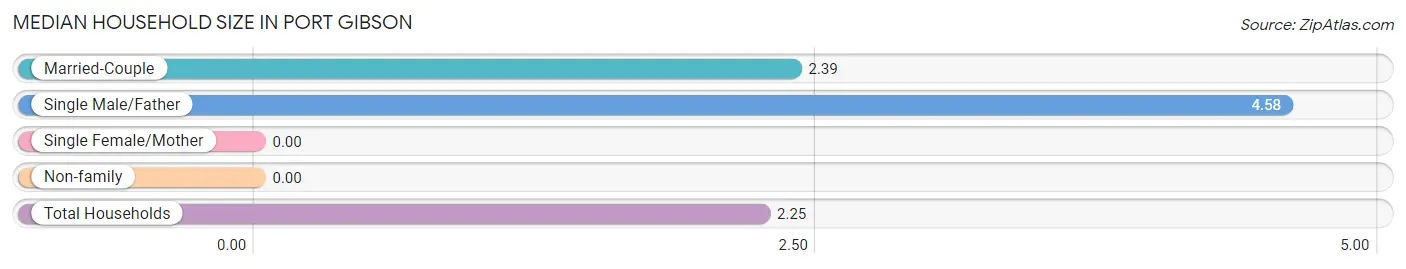
| Household Type | # Households | Household Size |
| Married-Couple | 195 (77.7%) | 2.39 |
| Single Male/Father | 12 (4.8%) | 4.58 |
| Single Female/Mother | 0 (0.0%) | - |
| Non-family | 44 (17.5%) | - |
| Total Households | 251 (100.0%) | 2.25 |
Household Size by Marriage Status in Port Gibson
Out of a total of 251 households in Port Gibson, 207 (82.5%) are family households, while 44 (17.5%) are nonfamily households. The most numerous type of family households are 2-person households, comprising 182, and the most common type of nonfamily households are 1-person households, comprising 44.
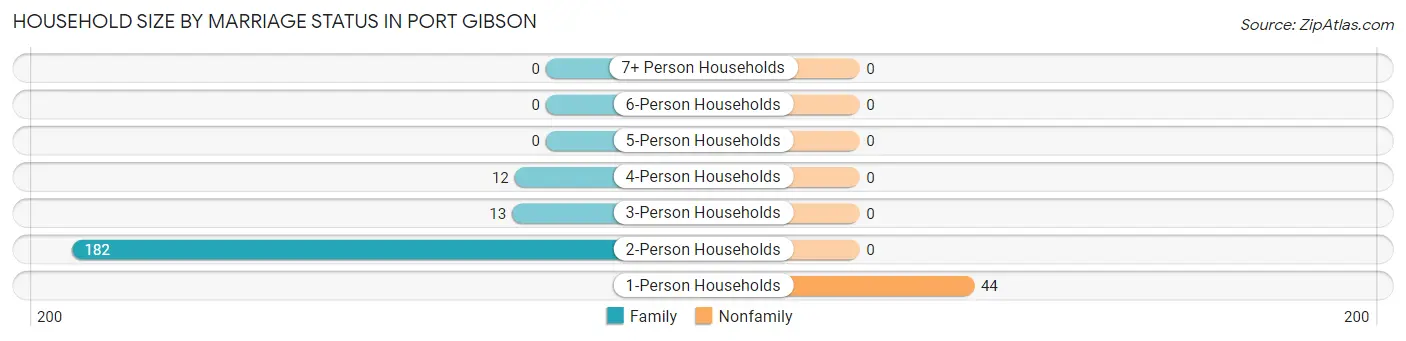
| Household Size | Family Households | Nonfamily Households |
| 1-Person Households | - | 44 (17.5%) |
| 2-Person Households | 182 (72.5%) | 0 (0.0%) |
| 3-Person Households | 13 (5.2%) | 0 (0.0%) |
| 4-Person Households | 12 (4.8%) | 0 (0.0%) |
| 5-Person Households | 0 (0.0%) | 0 (0.0%) |
| 6-Person Households | 0 (0.0%) | 0 (0.0%) |
| 7+ Person Households | 0 (0.0%) | 0 (0.0%) |
| Total | 207 (82.5%) | 44 (17.5%) |
Female Fertility in Port Gibson
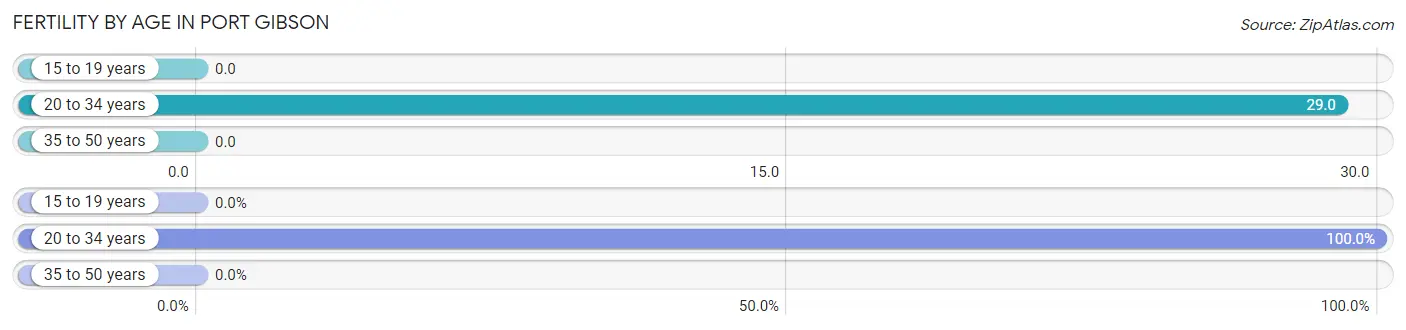
Fertility by Age in Port Gibson
Average fertility rate in Port Gibson is 24.0 births per 1,000 women. Women in the age bracket of 20 to 34 years have the highest fertility rate with 29.0 births per 1,000 women. Women in the age bracket of 20 to 34 years acount for 100.0% of all women with births.
| Age Bracket | Women with Births | Births / 1,000 Women |
| 15 to 19 years | 0 (0.0%) | 0.0 |
| 20 to 34 years | 2 (100.0%) | 29.0 |
| 35 to 50 years | 0 (0.0%) | 0.0 |
| Total | 2 (100.0%) | 24.0 |
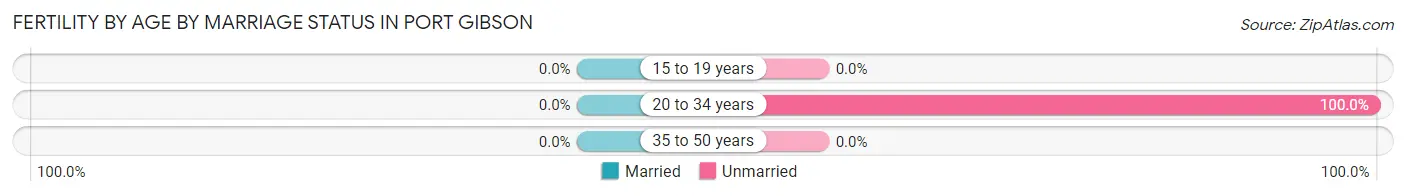
Fertility by Age by Marriage Status in Port Gibson
| Age Bracket | Married | Unmarried |
| 15 to 19 years | 0 (0.0%) | 0 (0.0%) |
| 20 to 34 years | 0 (0.0%) | 2 (100.0%) |
| 35 to 50 years | 0 (0.0%) | 0 (0.0%) |
| Total | 0 (0.0%) | 2 (100.0%) |
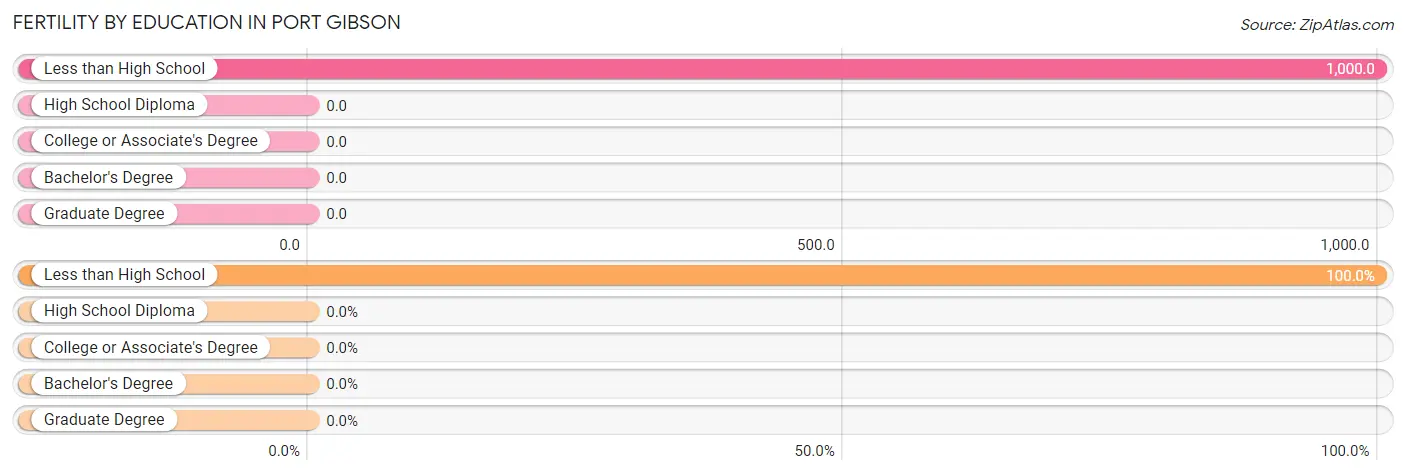
Fertility by Education in Port Gibson
| Educational Attainment | Women with Births | Births / 1,000 Women |
| Less than High School | 2 (100.0%) | 1,000.0 |
| High School Diploma | 0 (0.0%) | 0.0 |
| College or Associate's Degree | 0 (0.0%) | 0.0 |
| Bachelor's Degree | 0 (0.0%) | 0.0 |
| Graduate Degree | 0 (0.0%) | 0.0 |
| Total | 2 (100.0%) | 24.0 |
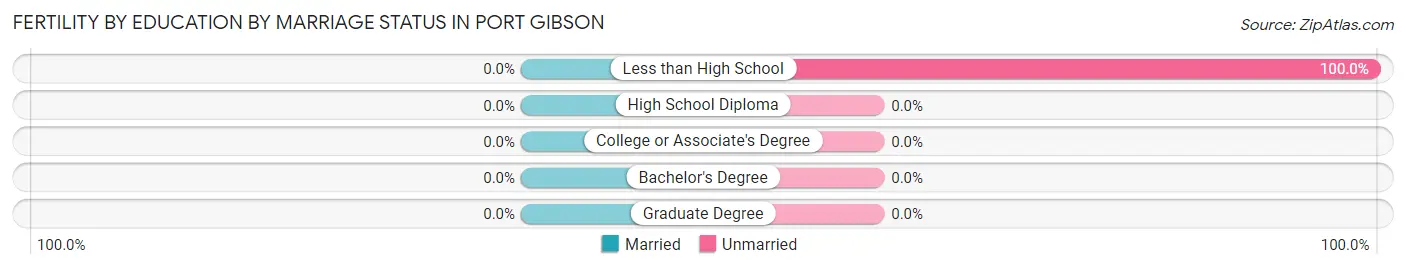
Fertility by Education by Marriage Status in Port Gibson
| Educational Attainment | Married | Unmarried |
| Less than High School | 0 (0.0%) | 2 (100.0%) |
| High School Diploma | 0 (0.0%) | 0 (0.0%) |
| College or Associate's Degree | 0 (0.0%) | 0 (0.0%) |
| Bachelor's Degree | 0 (0.0%) | 0 (0.0%) |
| Graduate Degree | 0 (0.0%) | 0 (0.0%) |
| Total | 0 (0.0%) | 2 (100.0%) |
Employment Characteristics in Port Gibson
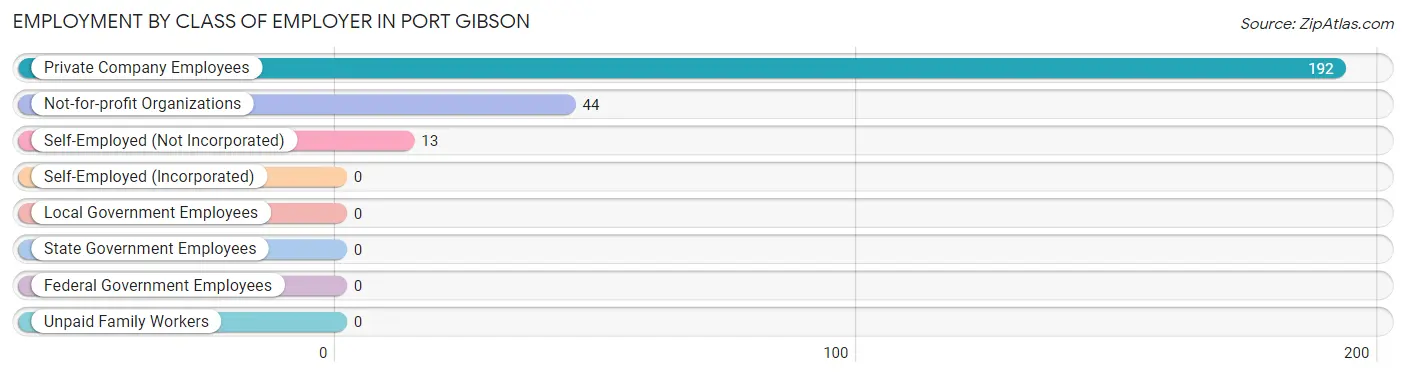
Employment by Class of Employer in Port Gibson
Among the 249 employed individuals in Port Gibson, private company employees (192 | 77.1%), not-for-profit organizations (44 | 17.7%), and self-employed (not incorporated) (13 | 5.2%) make up the most common classes of employment.
| Employer Class | # Employees | % Employees |
| Private Company Employees | 192 | 77.1% |
| Self-Employed (Incorporated) | 0 | 0.0% |
| Self-Employed (Not Incorporated) | 13 | 5.2% |
| Not-for-profit Organizations | 44 | 17.7% |
| Local Government Employees | 0 | 0.0% |
| State Government Employees | 0 | 0.0% |
| Federal Government Employees | 0 | 0.0% |
| Unpaid Family Workers | 0 | 0.0% |
| Total | 249 | 100.0% |
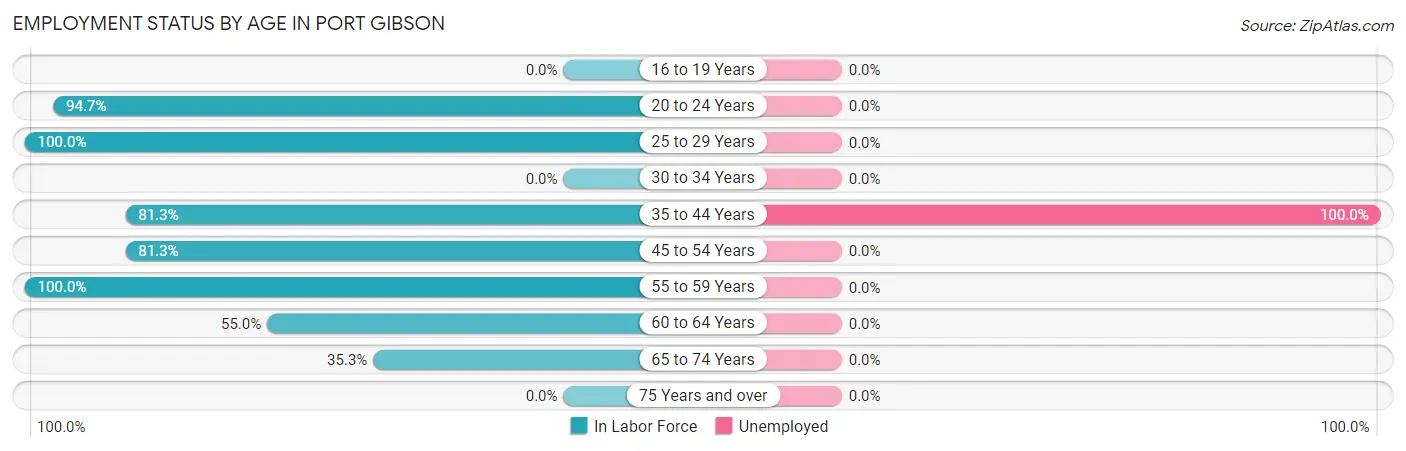
Employment Status by Age in Port Gibson
According to the labor force statistics for Port Gibson, out of the total population over 16 years of age (576), 45.5% or 262 individuals are in the labor force, with 5.0% or 13 of them unemployed. The age group with the highest labor force participation rate is 25 to 29 years, with 100.0% or 151 individuals in the labor force. Within the labor force, the 35 to 44 years age range has the highest percentage of unemployed individuals, with 100.0% or 13 of them being unemployed.
| Age Bracket | In Labor Force | Unemployed |
| 16 to 19 Years | 0 (0.0%) | 0 (0.0%) |
| 20 to 24 Years | 36 (94.7%) | 0 (0.0%) |
| 25 to 29 Years | 151 (100.0%) | 0 (0.0%) |
| 30 to 34 Years | 0 (0.0%) | 0 (0.0%) |
| 35 to 44 Years | 13 (81.3%) | 13 (100.0%) |
| 45 to 54 Years | 26 (81.3%) | 0 (0.0%) |
| 55 to 59 Years | 13 (100.0%) | 0 (0.0%) |
| 60 to 64 Years | 11 (55.0%) | 0 (0.0%) |
| 65 to 74 Years | 12 (35.3%) | 0 (0.0%) |
| 75 Years and over | 0 (0.0%) | 0 (0.0%) |
| Total | 262 (45.5%) | 13 (5.0%) |
Employment Status by Educational Attainment in Port Gibson
According to labor force statistics for Port Gibson, 92.2% of individuals (214) out of the total population between 25 and 64 years of age (232) are in the labor force, with 6.1% or 13 of them being unemployed. The group with the highest labor force participation rate are those with the educational attainment of bachelor's degree or higher, with 100.0% or 151 individuals in the labor force. Within the labor force, individuals with high school diploma education have the highest percentage of unemployment, with 20.6% or 13 of them being unemployed.
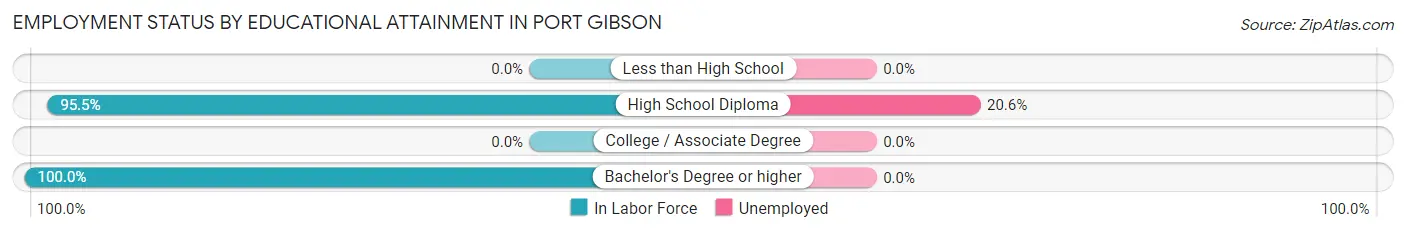
| Educational Attainment | In Labor Force | Unemployed |
| Less than High School | 0 (0.0%) | 0 (0.0%) |
| High School Diploma | 63 (95.5%) | 14 (20.6%) |
| College / Associate Degree | 0 (0.0%) | 0 (0.0%) |
| Bachelor's Degree or higher | 151 (100.0%) | 0 (0.0%) |
| Total | 214 (92.2%) | 14 (6.1%) |
Employment Occupations by Sex in Port Gibson
Management, Business, Science and Arts Occupations
The most common Management, Business, Science and Arts occupations in Port Gibson are Business & Financial (89 | 35.7%), Health Diagnosing & Treating (44 | 17.7%), Community & Social Service (16 | 6.4%), Arts, Media & Entertainment (11 | 4.4%), and Education Instruction & Library (5 | 2.0%).
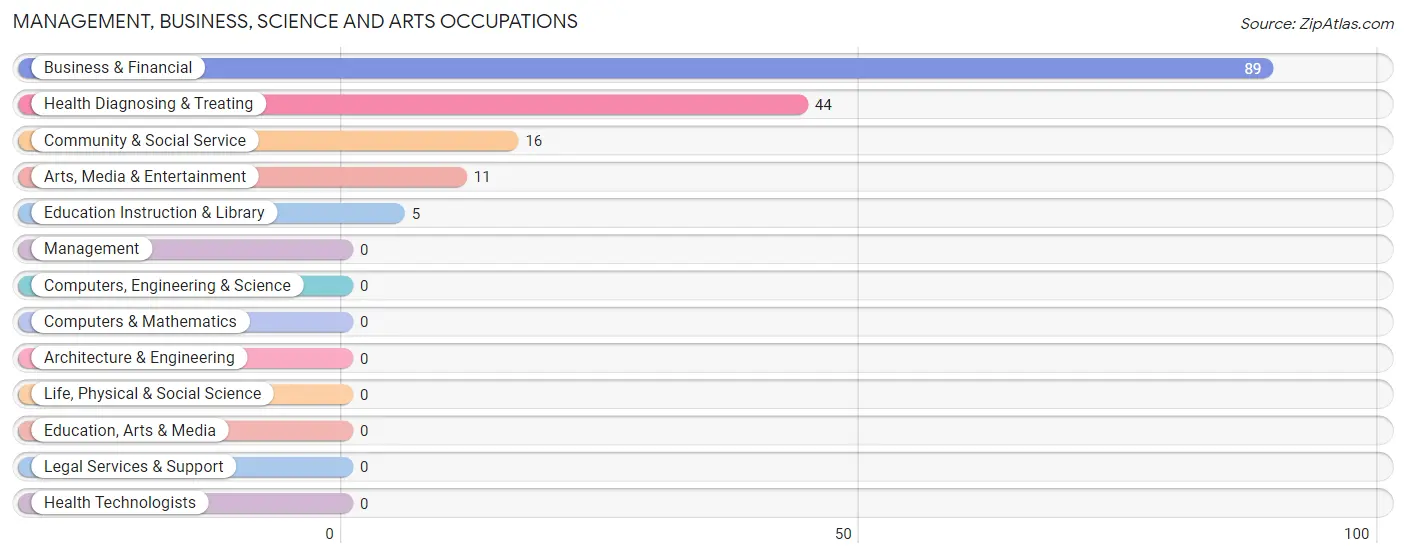
Management, Business, Science and Arts Occupations by Sex
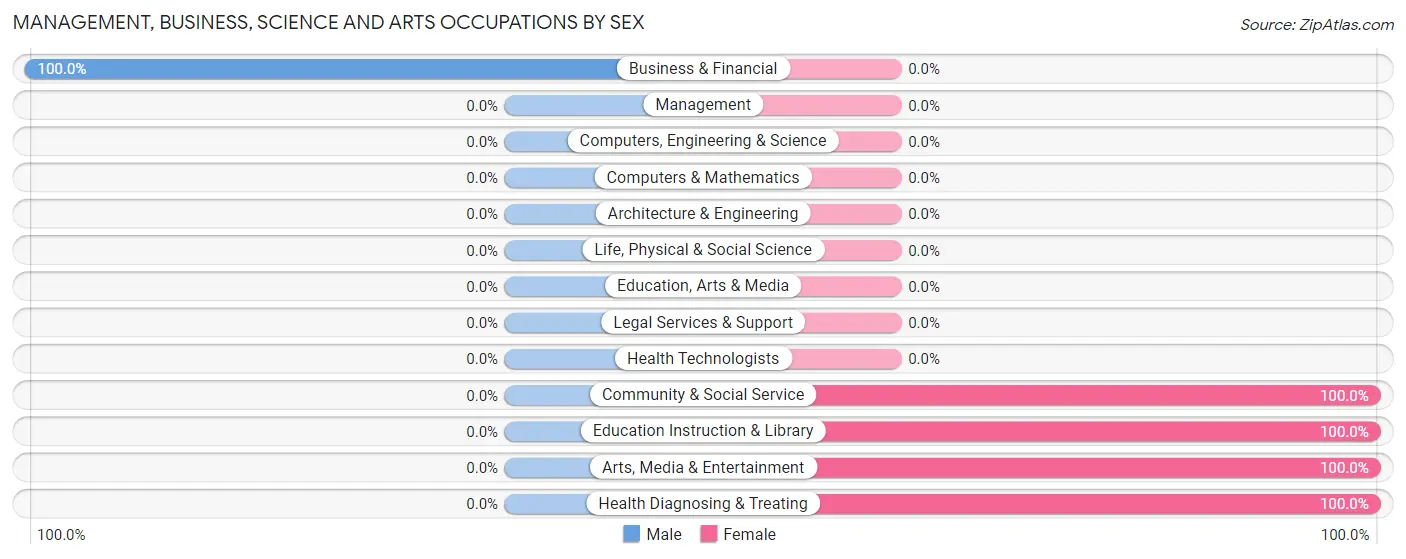
| Occupation | Male | Female |
| Management | 0 (0.0%) | 0 (0.0%) |
| Business & Financial | 89 (100.0%) | 0 (0.0%) |
| Computers, Engineering & Science | 0 (0.0%) | 0 (0.0%) |
| Computers & Mathematics | 0 (0.0%) | 0 (0.0%) |
| Architecture & Engineering | 0 (0.0%) | 0 (0.0%) |
| Life, Physical & Social Science | 0 (0.0%) | 0 (0.0%) |
| Community & Social Service | 0 (0.0%) | 16 (100.0%) |
| Education, Arts & Media | 0 (0.0%) | 0 (0.0%) |
| Legal Services & Support | 0 (0.0%) | 0 (0.0%) |
| Education Instruction & Library | 0 (0.0%) | 5 (100.0%) |
| Arts, Media & Entertainment | 0 (0.0%) | 11 (100.0%) |
| Health Diagnosing & Treating | 0 (0.0%) | 44 (100.0%) |
| Health Technologists | 0 (0.0%) | 0 (0.0%) |
| Total (Category) | 89 (59.7%) | 60 (40.3%) |
| Total (Overall) | 147 (59.0%) | 102 (41.0%) |
Services Occupations
The most common Services occupations in Port Gibson are , and Personal Care & Service (13 | 5.2%).
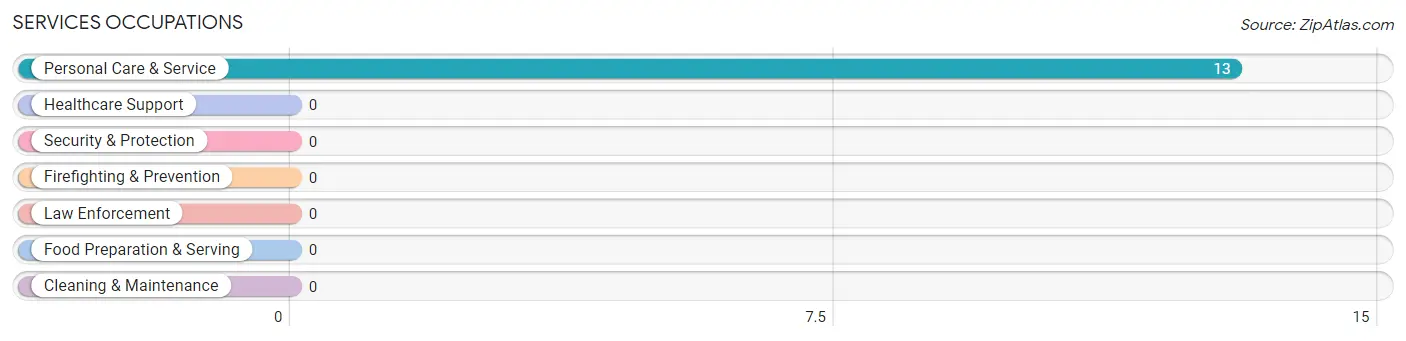
Services Occupations by Sex
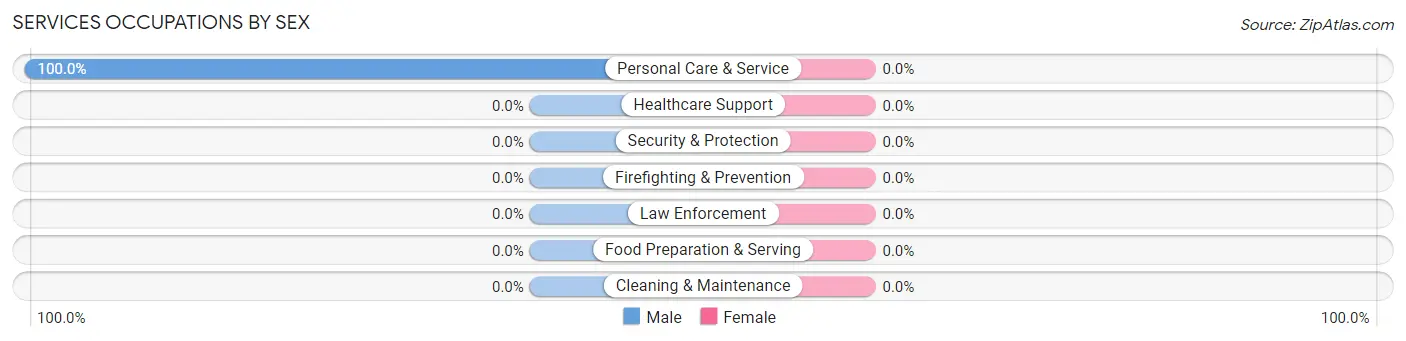
| Occupation | Male | Female |
| Healthcare Support | 0 (0.0%) | 0 (0.0%) |
| Security & Protection | 0 (0.0%) | 0 (0.0%) |
| Firefighting & Prevention | 0 (0.0%) | 0 (0.0%) |
| Law Enforcement | 0 (0.0%) | 0 (0.0%) |
| Food Preparation & Serving | 0 (0.0%) | 0 (0.0%) |
| Cleaning & Maintenance | 0 (0.0%) | 0 (0.0%) |
| Personal Care & Service | 13 (100.0%) | 0 (0.0%) |
| Total (Category) | 13 (100.0%) | 0 (0.0%) |
| Total (Overall) | 147 (59.0%) | 102 (41.0%) |
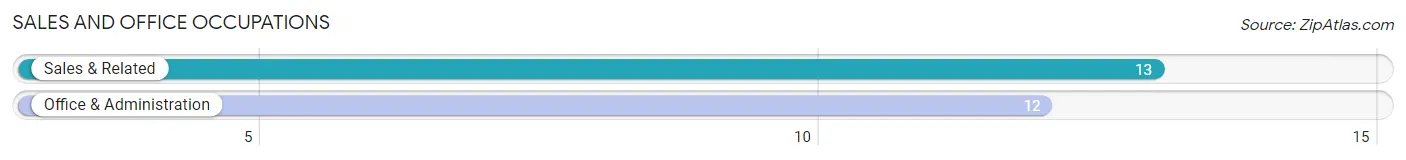
Sales and Office Occupations
The most common Sales and Office occupations in Port Gibson are Sales & Related (13 | 5.2%), and Office & Administration (12 | 4.8%).
Sales and Office Occupations by Sex
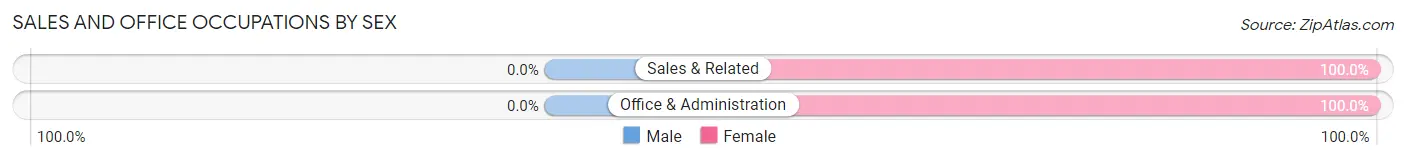
| Occupation | Male | Female |
| Sales & Related | 0 (0.0%) | 13 (100.0%) |
| Office & Administration | 0 (0.0%) | 12 (100.0%) |
| Total (Category) | 0 (0.0%) | 25 (100.0%) |
| Total (Overall) | 147 (59.0%) | 102 (41.0%) |
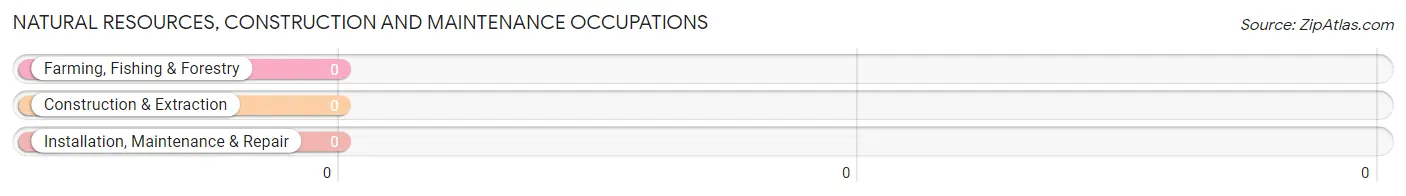
Natural Resources, Construction and Maintenance Occupations
Natural Resources, Construction and Maintenance Occupations by Sex
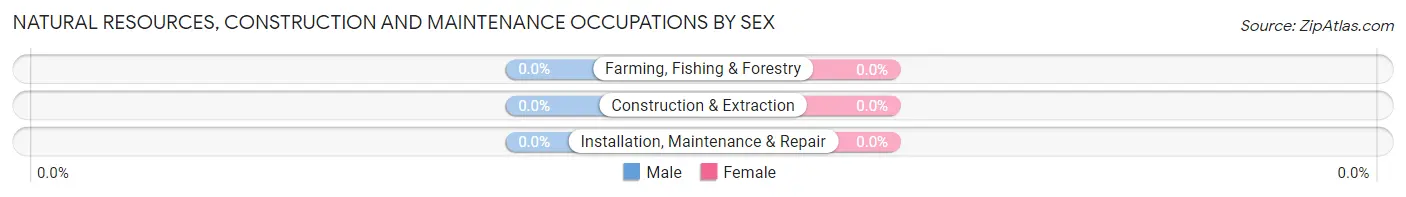
| Occupation | Male | Female |
| Farming, Fishing & Forestry | 0 (0.0%) | 0 (0.0%) |
| Construction & Extraction | 0 (0.0%) | 0 (0.0%) |
| Installation, Maintenance & Repair | 0 (0.0%) | 0 (0.0%) |
| Total (Category) | 0 (0.0%) | 0 (0.0%) |
| Total (Overall) | 147 (59.0%) | 102 (41.0%) |
Production, Transportation and Moving Occupations
The most common Production, Transportation and Moving occupations in Port Gibson are Transportation (32 | 12.9%), and Production (30 | 12.0%).
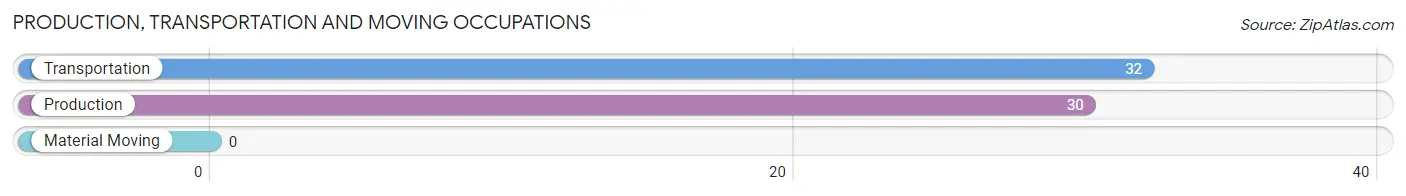
Production, Transportation and Moving Occupations by Sex
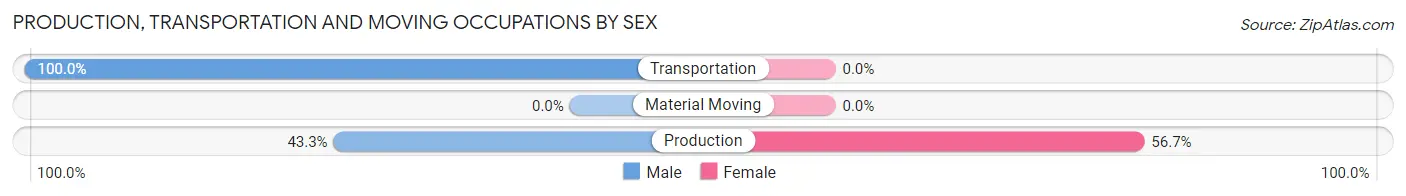
| Occupation | Male | Female |
| Production | 13 (43.3%) | 17 (56.7%) |
| Transportation | 32 (100.0%) | 0 (0.0%) |
| Material Moving | 0 (0.0%) | 0 (0.0%) |
| Total (Category) | 45 (72.6%) | 17 (27.4%) |
| Total (Overall) | 147 (59.0%) | 102 (41.0%) |
Employment Industries by Sex in Port Gibson
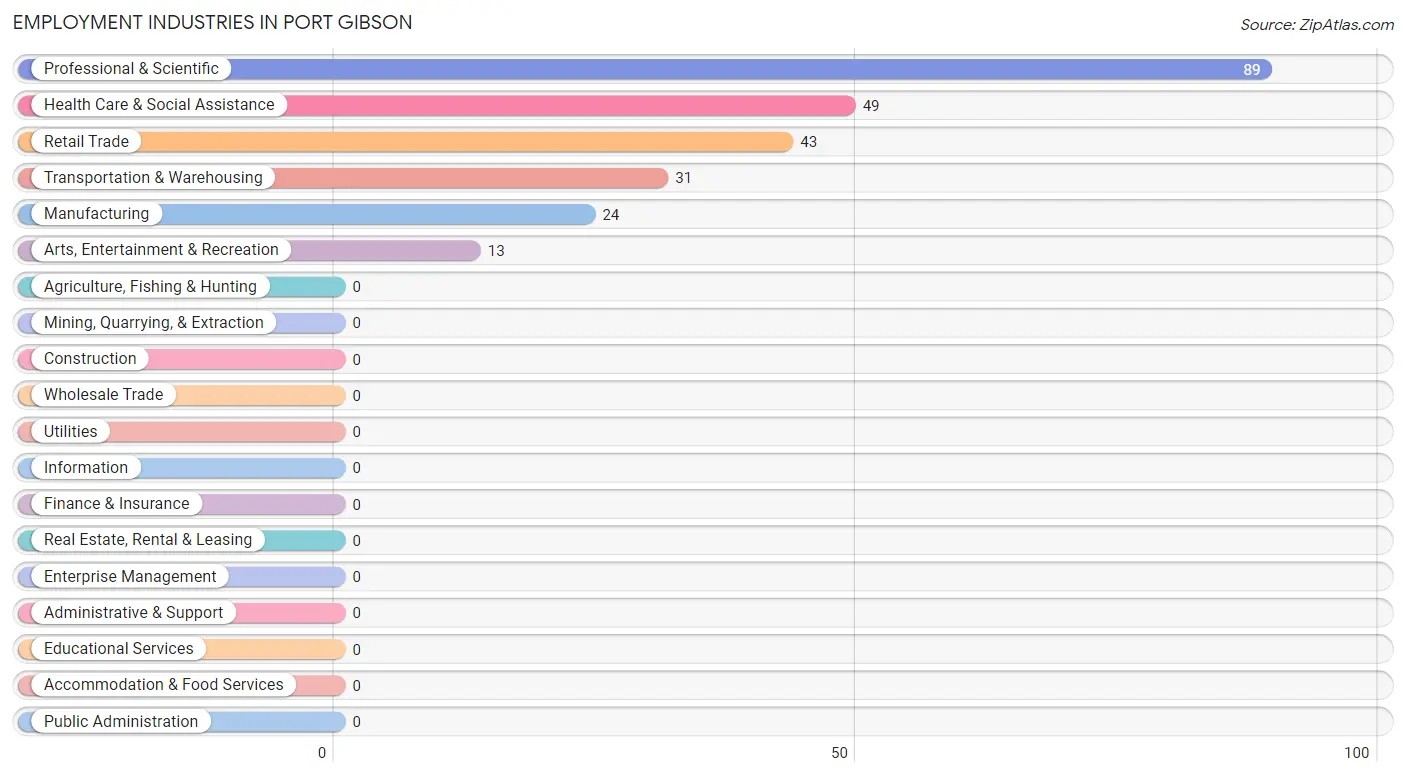
Employment Industries in Port Gibson
The major employment industries in Port Gibson include Professional & Scientific (89 | 35.7%), Health Care & Social Assistance (49 | 19.7%), Retail Trade (43 | 17.3%), Transportation & Warehousing (31 | 12.4%), and Manufacturing (24 | 9.6%).
Employment Industries by Sex in Port Gibson
The Port Gibson industries that see more men than women are Professional & Scientific (100.0%), Arts, Entertainment & Recreation (100.0%), and Transportation & Warehousing (61.3%), whereas the industries that tend to have a higher number of women are Health Care & Social Assistance (100.0%), Retail Trade (69.8%), and Manufacturing (45.8%).
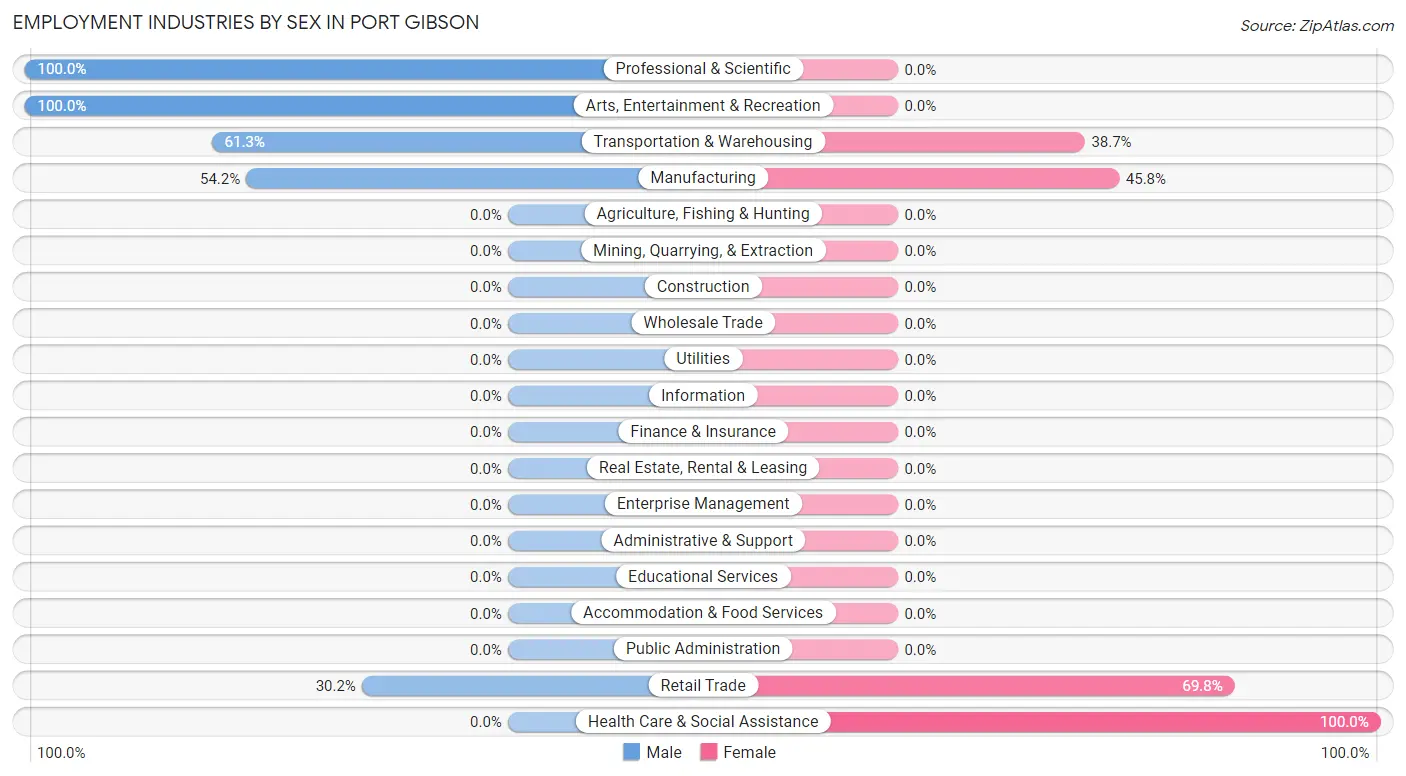
| Industry | Male | Female |
| Agriculture, Fishing & Hunting | 0 (0.0%) | 0 (0.0%) |
| Mining, Quarrying, & Extraction | 0 (0.0%) | 0 (0.0%) |
| Construction | 0 (0.0%) | 0 (0.0%) |
| Manufacturing | 13 (54.2%) | 11 (45.8%) |
| Wholesale Trade | 0 (0.0%) | 0 (0.0%) |
| Retail Trade | 13 (30.2%) | 30 (69.8%) |
| Transportation & Warehousing | 19 (61.3%) | 12 (38.7%) |
| Utilities | 0 (0.0%) | 0 (0.0%) |
| Information | 0 (0.0%) | 0 (0.0%) |
| Finance & Insurance | 0 (0.0%) | 0 (0.0%) |
| Real Estate, Rental & Leasing | 0 (0.0%) | 0 (0.0%) |
| Professional & Scientific | 89 (100.0%) | 0 (0.0%) |
| Enterprise Management | 0 (0.0%) | 0 (0.0%) |
| Administrative & Support | 0 (0.0%) | 0 (0.0%) |
| Educational Services | 0 (0.0%) | 0 (0.0%) |
| Health Care & Social Assistance | 0 (0.0%) | 49 (100.0%) |
| Arts, Entertainment & Recreation | 13 (100.0%) | 0 (0.0%) |
| Accommodation & Food Services | 0 (0.0%) | 0 (0.0%) |
| Public Administration | 0 (0.0%) | 0 (0.0%) |
| Total | 147 (59.0%) | 102 (41.0%) |
Education in Port Gibson
School Enrollment in Port Gibson
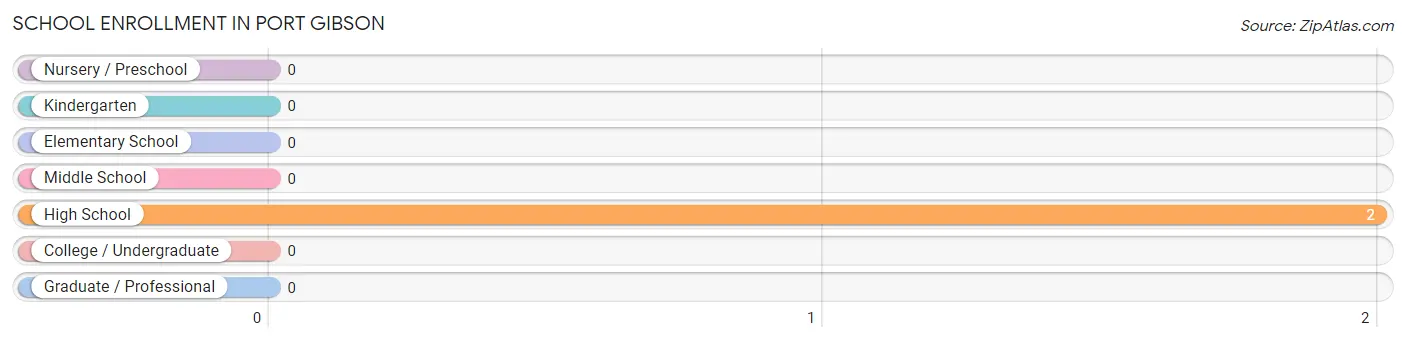
| School Level | # Students | % Students |
| Nursery / Preschool | 0 | 0.0% |
| Kindergarten | 0 | 0.0% |
| Elementary School | 0 | 0.0% |
| Middle School | 0 | 0.0% |
| High School | 2 | 100.0% |
| College / Undergraduate | 0 | 0.0% |
| Graduate / Professional | 0 | 0.0% |
| Total | 2 | 100.0% |
School Enrollment by Age by Funding Source in Port Gibson
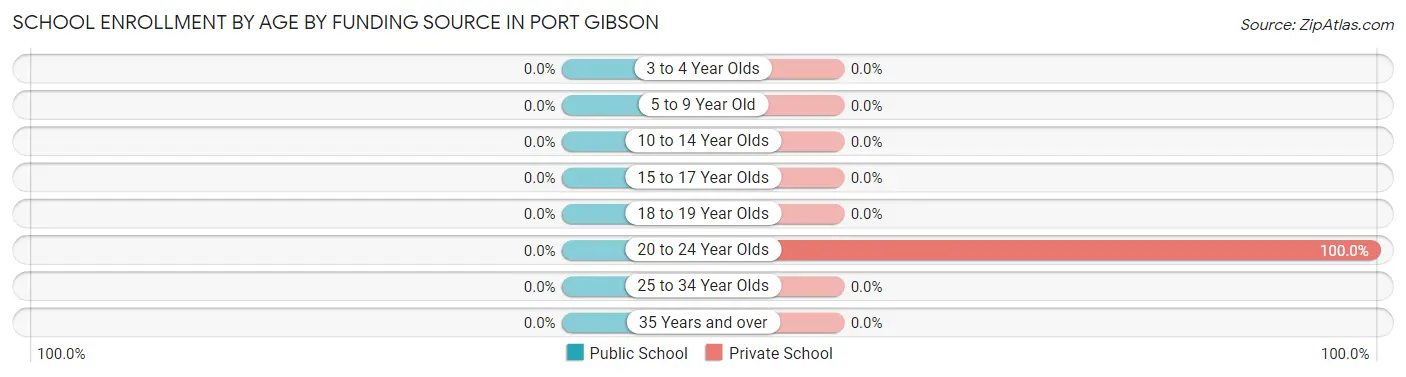
| Age Bracket | Public School | Private School |
| 3 to 4 Year Olds | 0 (0.0%) | 0 (0.0%) |
| 5 to 9 Year Old | 0 (0.0%) | 0 (0.0%) |
| 10 to 14 Year Olds | 0 (0.0%) | 0 (0.0%) |
| 15 to 17 Year Olds | 0 (0.0%) | 0 (0.0%) |
| 18 to 19 Year Olds | 0 (0.0%) | 0 (0.0%) |
| 20 to 24 Year Olds | 0 (0.0%) | 2 (100.0%) |
| 25 to 34 Year Olds | 0 (0.0%) | 0 (0.0%) |
| 35 Years and over | 0 (0.0%) | 0 (0.0%) |
| Total | 0 (0.0%) | 2 (100.0%) |
Educational Attainment by Field of Study in Port Gibson
Business (114 | 69.9%), science & technology (44 | 27.0%), and literature & languages (5 | 3.1%) are the most common fields of study among 163 individuals in Port Gibson who have obtained a bachelor's degree or higher.
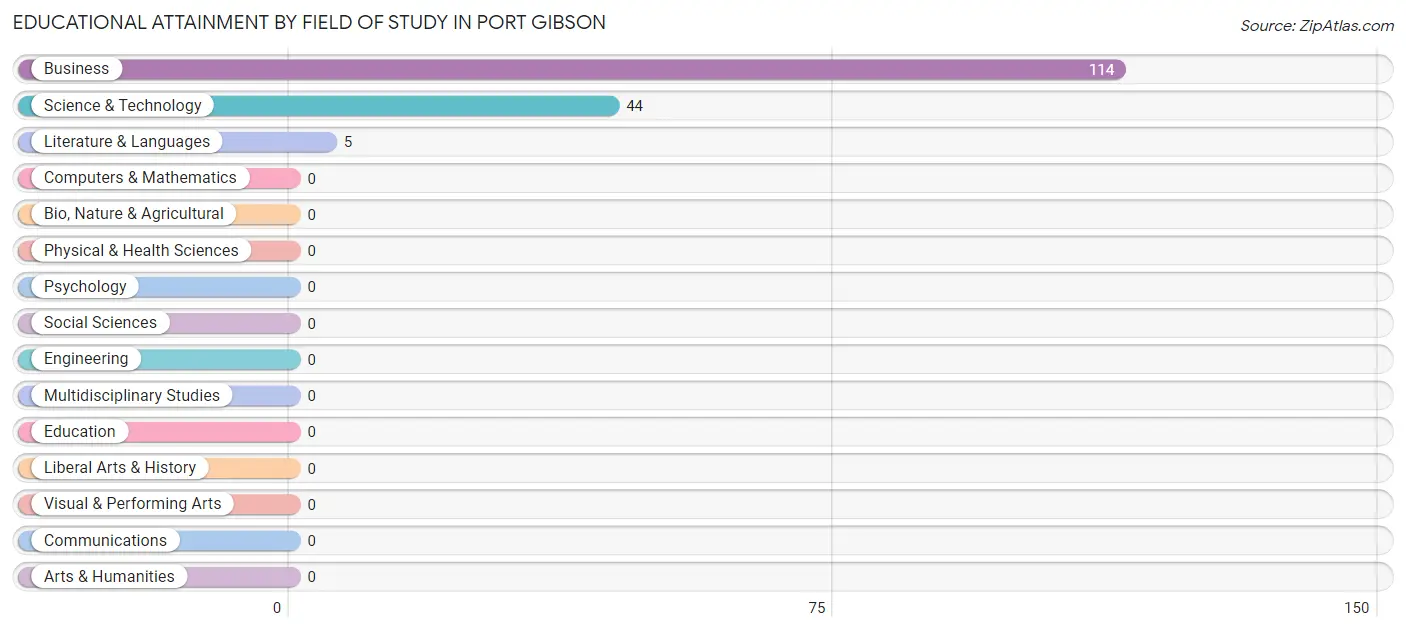
| Field of Study | # Graduates | % Graduates |
| Computers & Mathematics | 0 | 0.0% |
| Bio, Nature & Agricultural | 0 | 0.0% |
| Physical & Health Sciences | 0 | 0.0% |
| Psychology | 0 | 0.0% |
| Social Sciences | 0 | 0.0% |
| Engineering | 0 | 0.0% |
| Multidisciplinary Studies | 0 | 0.0% |
| Science & Technology | 44 | 27.0% |
| Business | 114 | 69.9% |
| Education | 0 | 0.0% |
| Literature & Languages | 5 | 3.1% |
| Liberal Arts & History | 0 | 0.0% |
| Visual & Performing Arts | 0 | 0.0% |
| Communications | 0 | 0.0% |
| Arts & Humanities | 0 | 0.0% |
| Total | 163 | 100.0% |
Transportation & Commute in Port Gibson
Vehicle Availability by Sex in Port Gibson
The most prevalent vehicle ownership categories in Port Gibson are males with 2 vehicles (102, accounting for 69.4%) and females with 2 vehicles (61, making up 100.0%).
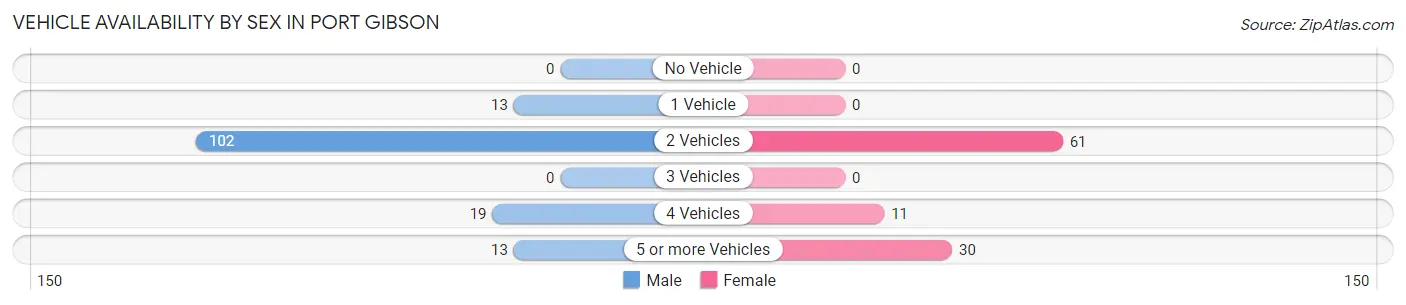
| Vehicles Available | Male | Female |
| No Vehicle | 0 (0.0%) | 0 (0.0%) |
| 1 Vehicle | 13 (8.8%) | 0 (0.0%) |
| 2 Vehicles | 102 (69.4%) | 61 (59.8%) |
| 3 Vehicles | 0 (0.0%) | 0 (0.0%) |
| 4 Vehicles | 19 (12.9%) | 11 (10.8%) |
| 5 or more Vehicles | 13 (8.8%) | 30 (29.4%) |
| Total | 147 (100.0%) | 102 (100.0%) |
Commute Time in Port Gibson
The most frequently occuring commute durations in Port Gibson are 35 to 39 minutes (89 commuters, 35.7%), 10 to 14 minutes (62 commuters, 24.9%), and 15 to 19 minutes (28 commuters, 11.2%).
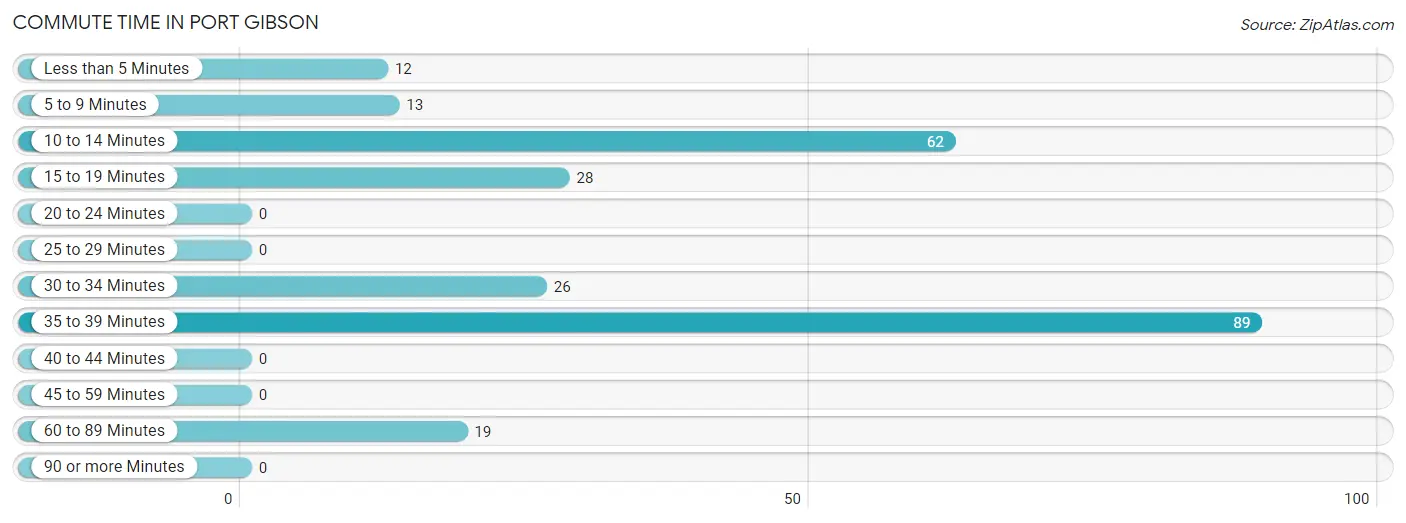
| Commute Time | # Commuters | % Commuters |
| Less than 5 Minutes | 12 | 4.8% |
| 5 to 9 Minutes | 13 | 5.2% |
| 10 to 14 Minutes | 62 | 24.9% |
| 15 to 19 Minutes | 28 | 11.2% |
| 20 to 24 Minutes | 0 | 0.0% |
| 25 to 29 Minutes | 0 | 0.0% |
| 30 to 34 Minutes | 26 | 10.4% |
| 35 to 39 Minutes | 89 | 35.7% |
| 40 to 44 Minutes | 0 | 0.0% |
| 45 to 59 Minutes | 0 | 0.0% |
| 60 to 89 Minutes | 19 | 7.6% |
| 90 or more Minutes | 0 | 0.0% |
Commute Time by Sex in Port Gibson
The most common commute times in Port Gibson are 35 to 39 minutes (89 commuters, 60.5%) for males and 10 to 14 minutes (49 commuters, 48.0%) for females.
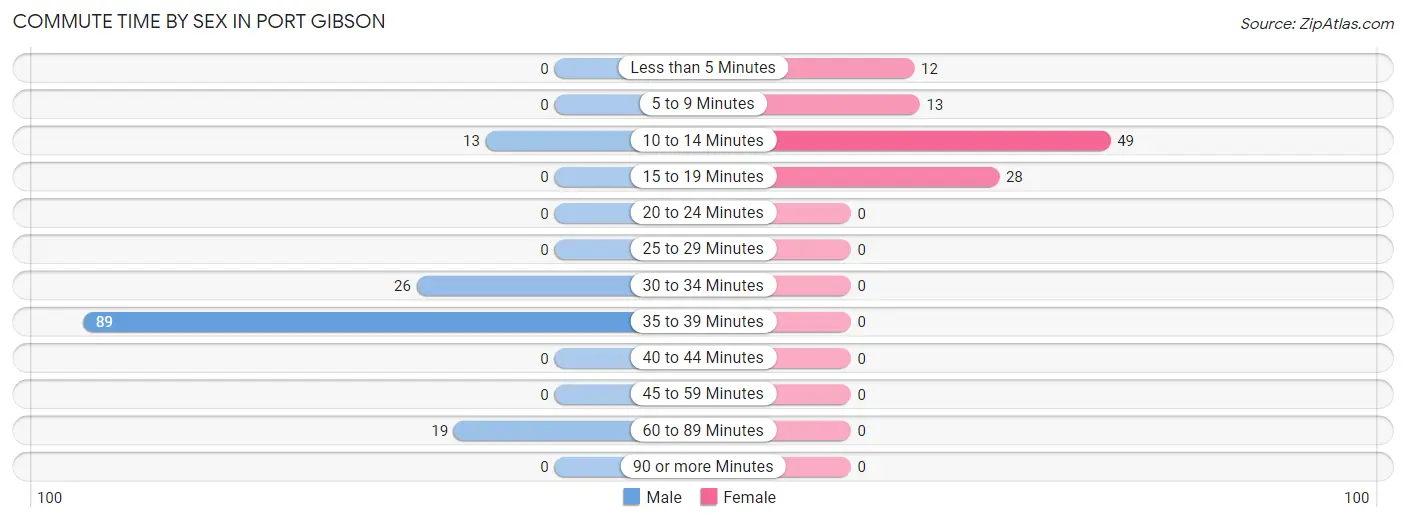
| Commute Time | Male | Female |
| Less than 5 Minutes | 0 (0.0%) | 12 (11.8%) |
| 5 to 9 Minutes | 0 (0.0%) | 13 (12.8%) |
| 10 to 14 Minutes | 13 (8.8%) | 49 (48.0%) |
| 15 to 19 Minutes | 0 (0.0%) | 28 (27.5%) |
| 20 to 24 Minutes | 0 (0.0%) | 0 (0.0%) |
| 25 to 29 Minutes | 0 (0.0%) | 0 (0.0%) |
| 30 to 34 Minutes | 26 (17.7%) | 0 (0.0%) |
| 35 to 39 Minutes | 89 (60.5%) | 0 (0.0%) |
| 40 to 44 Minutes | 0 (0.0%) | 0 (0.0%) |
| 45 to 59 Minutes | 0 (0.0%) | 0 (0.0%) |
| 60 to 89 Minutes | 19 (12.9%) | 0 (0.0%) |
| 90 or more Minutes | 0 (0.0%) | 0 (0.0%) |
Time of Departure to Work by Sex in Port Gibson
The most frequent times of departure to work in Port Gibson are 6:30 AM to 6:59 AM (102, 69.4%) for males and 6:30 AM to 6:59 AM (44, 43.1%) for females.
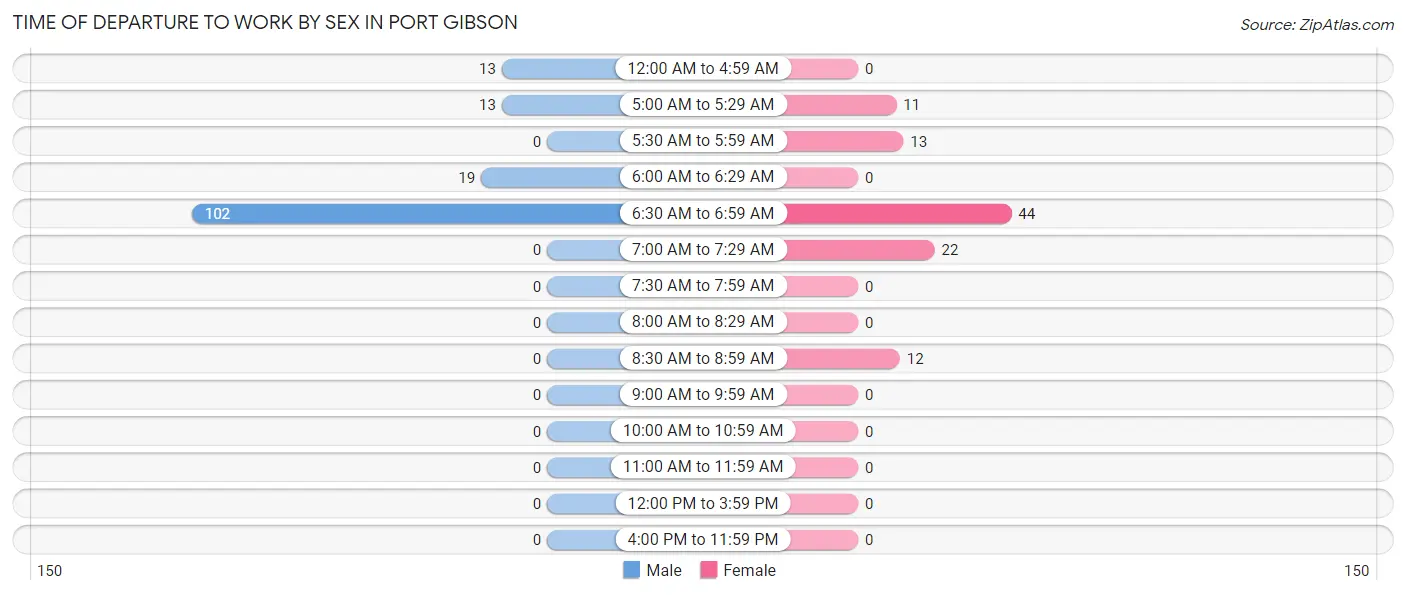
| Time of Departure | Male | Female |
| 12:00 AM to 4:59 AM | 13 (8.8%) | 0 (0.0%) |
| 5:00 AM to 5:29 AM | 13 (8.8%) | 11 (10.8%) |
| 5:30 AM to 5:59 AM | 0 (0.0%) | 13 (12.8%) |
| 6:00 AM to 6:29 AM | 19 (12.9%) | 0 (0.0%) |
| 6:30 AM to 6:59 AM | 102 (69.4%) | 44 (43.1%) |
| 7:00 AM to 7:29 AM | 0 (0.0%) | 22 (21.6%) |
| 7:30 AM to 7:59 AM | 0 (0.0%) | 0 (0.0%) |
| 8:00 AM to 8:29 AM | 0 (0.0%) | 0 (0.0%) |
| 8:30 AM to 8:59 AM | 0 (0.0%) | 12 (11.8%) |
| 9:00 AM to 9:59 AM | 0 (0.0%) | 0 (0.0%) |
| 10:00 AM to 10:59 AM | 0 (0.0%) | 0 (0.0%) |
| 11:00 AM to 11:59 AM | 0 (0.0%) | 0 (0.0%) |
| 12:00 PM to 3:59 PM | 0 (0.0%) | 0 (0.0%) |
| 4:00 PM to 11:59 PM | 0 (0.0%) | 0 (0.0%) |
| Total | 147 (100.0%) | 102 (100.0%) |
Housing Occupancy in Port Gibson
Occupancy by Ownership in Port Gibson
Of the total 251 dwellings in Port Gibson, owner-occupied units account for 239 (95.2%), while renter-occupied units make up 12 (4.8%).
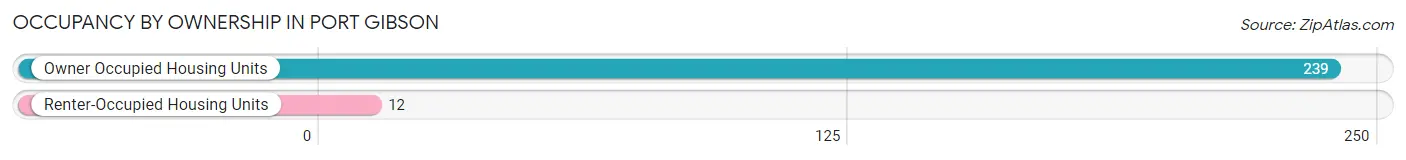
| Occupancy | # Housing Units | % Housing Units |
| Owner Occupied Housing Units | 239 | 95.2% |
| Renter-Occupied Housing Units | 12 | 4.8% |
| Total Occupied Housing Units | 251 | 100.0% |
Occupancy by Household Size in Port Gibson
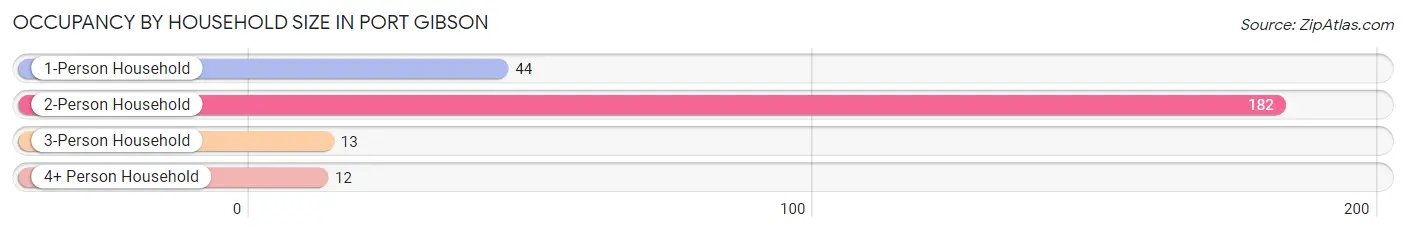
| Household Size | # Housing Units | % Housing Units |
| 1-Person Household | 44 | 17.5% |
| 2-Person Household | 182 | 72.5% |
| 3-Person Household | 13 | 5.2% |
| 4+ Person Household | 12 | 4.8% |
| Total Housing Units | 251 | 100.0% |
Occupancy by Ownership by Household Size in Port Gibson
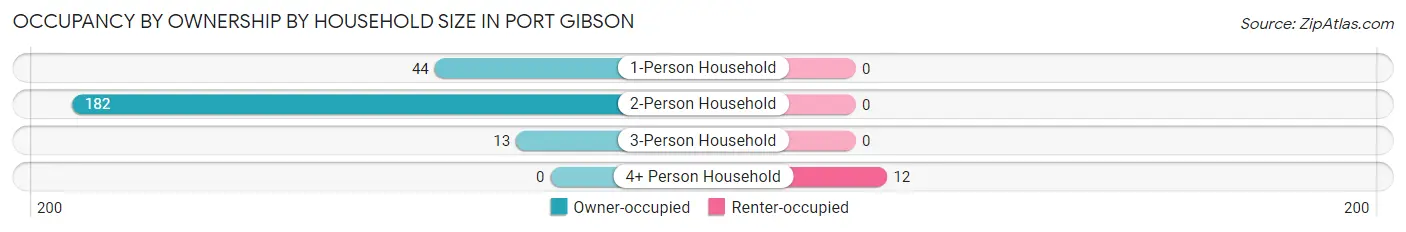
| Household Size | Owner-occupied | Renter-occupied |
| 1-Person Household | 44 (100.0%) | 0 (0.0%) |
| 2-Person Household | 182 (100.0%) | 0 (0.0%) |
| 3-Person Household | 13 (100.0%) | 0 (0.0%) |
| 4+ Person Household | 0 (0.0%) | 12 (100.0%) |
| Total Housing Units | 239 (95.2%) | 12 (4.8%) |
Occupancy by Educational Attainment in Port Gibson
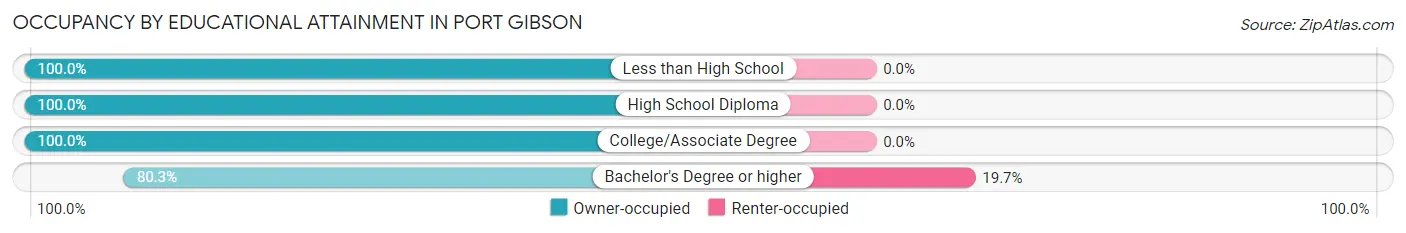
| Household Size | Owner-occupied | Renter-occupied |
| Less than High School | 124 (100.0%) | 0 (0.0%) |
| High School Diploma | 54 (100.0%) | 0 (0.0%) |
| College/Associate Degree | 12 (100.0%) | 0 (0.0%) |
| Bachelor's Degree or higher | 49 (80.3%) | 12 (19.7%) |
Occupancy by Age of Householder in Port Gibson
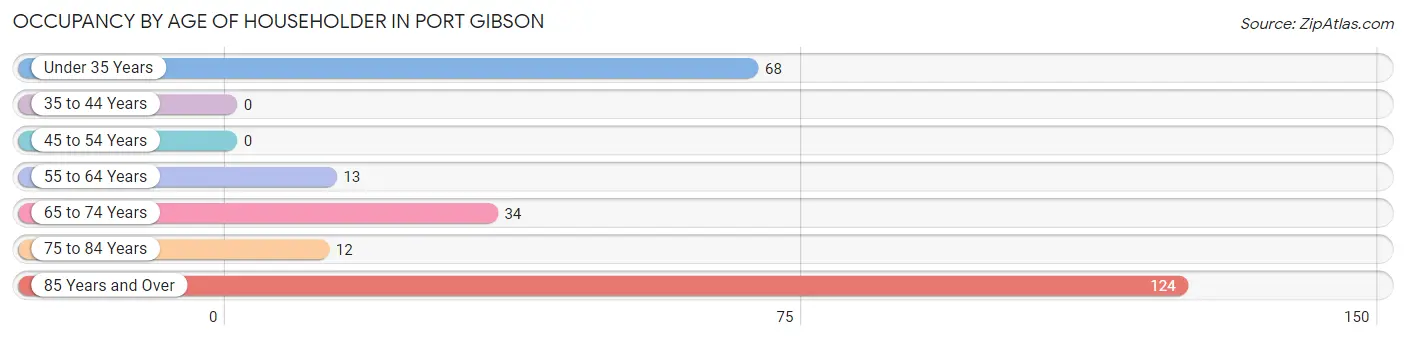
| Age Bracket | # Households | % Households |
| Under 35 Years | 68 | 27.1% |
| 35 to 44 Years | 0 | 0.0% |
| 45 to 54 Years | 0 | 0.0% |
| 55 to 64 Years | 13 | 5.2% |
| 65 to 74 Years | 34 | 13.6% |
| 75 to 84 Years | 12 | 4.8% |
| 85 Years and Over | 124 | 49.4% |
| Total | 251 | 100.0% |
Housing Finances in Port Gibson
Median Income by Occupancy in Port Gibson
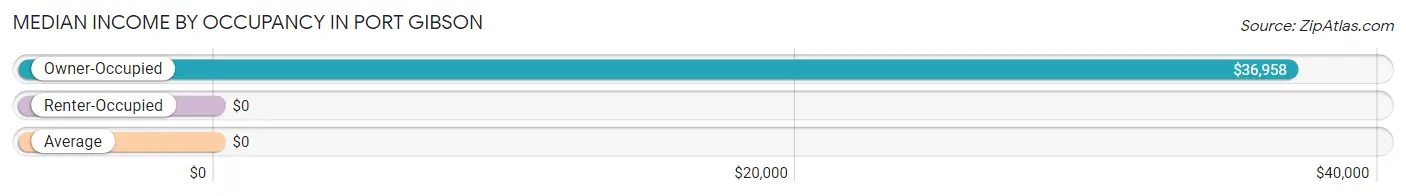
| Occupancy Type | # Households | Median Income |
| Owner-Occupied | 239 (95.2%) | $36,958 |
| Renter-Occupied | 12 (4.8%) | $0 |
| Average | 251 (100.0%) | $0 |
Occupancy by Householder Income Bracket in Port Gibson
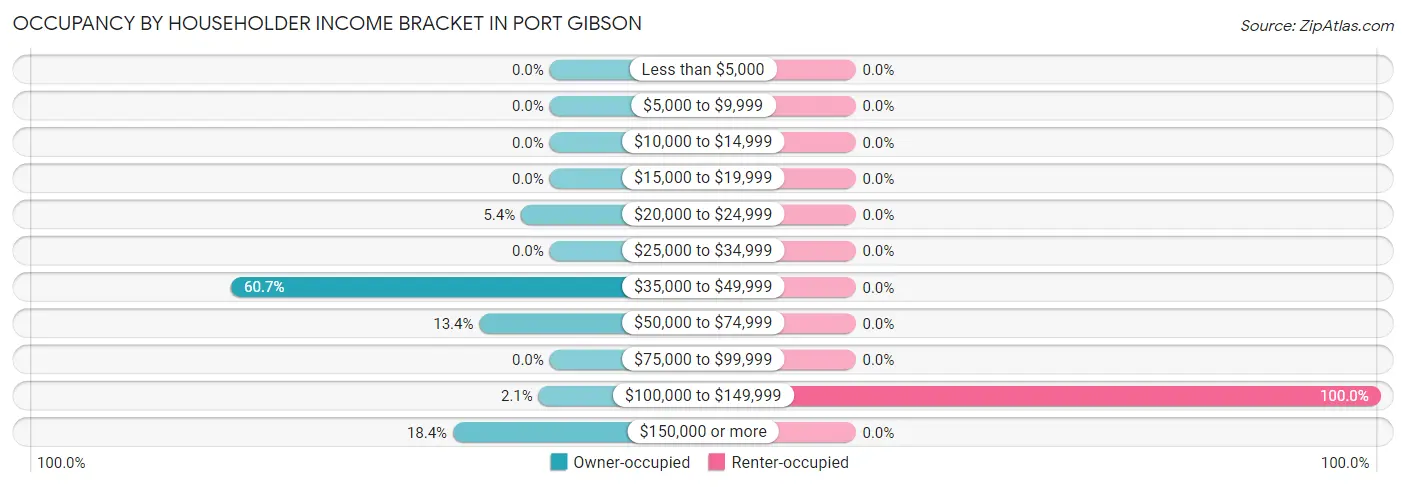
| Income Bracket | Owner-occupied | Renter-occupied |
| Less than $5,000 | 0 (0.0%) | 0 (0.0%) |
| $5,000 to $9,999 | 0 (0.0%) | 0 (0.0%) |
| $10,000 to $14,999 | 0 (0.0%) | 0 (0.0%) |
| $15,000 to $19,999 | 0 (0.0%) | 0 (0.0%) |
| $20,000 to $24,999 | 13 (5.4%) | 0 (0.0%) |
| $25,000 to $34,999 | 0 (0.0%) | 0 (0.0%) |
| $35,000 to $49,999 | 145 (60.7%) | 0 (0.0%) |
| $50,000 to $74,999 | 32 (13.4%) | 0 (0.0%) |
| $75,000 to $99,999 | 0 (0.0%) | 0 (0.0%) |
| $100,000 to $149,999 | 5 (2.1%) | 12 (100.0%) |
| $150,000 or more | 44 (18.4%) | 0 (0.0%) |
| Total | 239 (100.0%) | 12 (100.0%) |
Monthly Housing Cost Tiers in Port Gibson
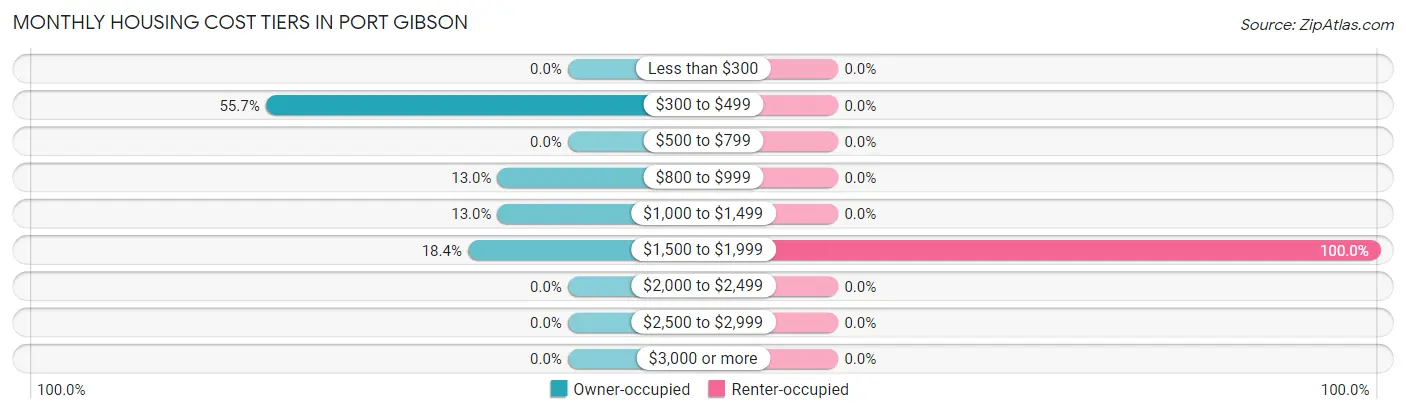
| Monthly Cost | Owner-occupied | Renter-occupied |
| Less than $300 | 0 (0.0%) | 0 (0.0%) |
| $300 to $499 | 133 (55.6%) | 0 (0.0%) |
| $500 to $799 | 0 (0.0%) | 0 (0.0%) |
| $800 to $999 | 31 (13.0%) | 0 (0.0%) |
| $1,000 to $1,499 | 31 (13.0%) | 0 (0.0%) |
| $1,500 to $1,999 | 44 (18.4%) | 12 (100.0%) |
| $2,000 to $2,499 | 0 (0.0%) | 0 (0.0%) |
| $2,500 to $2,999 | 0 (0.0%) | 0 (0.0%) |
| $3,000 or more | 0 (0.0%) | 0 (0.0%) |
| Total | 239 (100.0%) | 12 (100.0%) |
Physical Housing Characteristics in Port Gibson
Housing Structures in Port Gibson
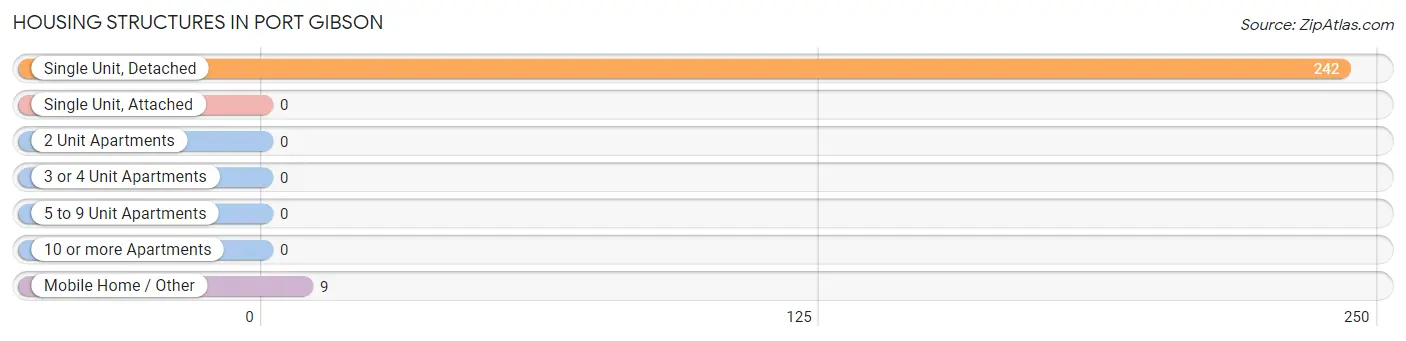
| Structure Type | # Housing Units | % Housing Units |
| Single Unit, Detached | 242 | 96.4% |
| Single Unit, Attached | 0 | 0.0% |
| 2 Unit Apartments | 0 | 0.0% |
| 3 or 4 Unit Apartments | 0 | 0.0% |
| 5 to 9 Unit Apartments | 0 | 0.0% |
| 10 or more Apartments | 0 | 0.0% |
| Mobile Home / Other | 9 | 3.6% |
| Total | 251 | 100.0% |
Housing Structures by Occupancy in Port Gibson
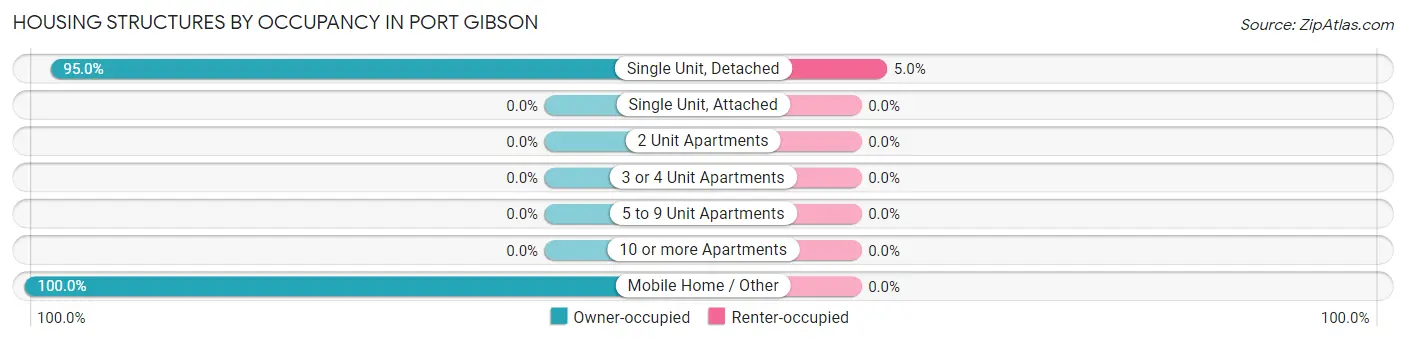
| Structure Type | Owner-occupied | Renter-occupied |
| Single Unit, Detached | 230 (95.0%) | 12 (5.0%) |
| Single Unit, Attached | 0 (0.0%) | 0 (0.0%) |
| 2 Unit Apartments | 0 (0.0%) | 0 (0.0%) |
| 3 or 4 Unit Apartments | 0 (0.0%) | 0 (0.0%) |
| 5 to 9 Unit Apartments | 0 (0.0%) | 0 (0.0%) |
| 10 or more Apartments | 0 (0.0%) | 0 (0.0%) |
| Mobile Home / Other | 9 (100.0%) | 0 (0.0%) |
| Total | 239 (95.2%) | 12 (4.8%) |
Housing Structures by Number of Rooms in Port Gibson
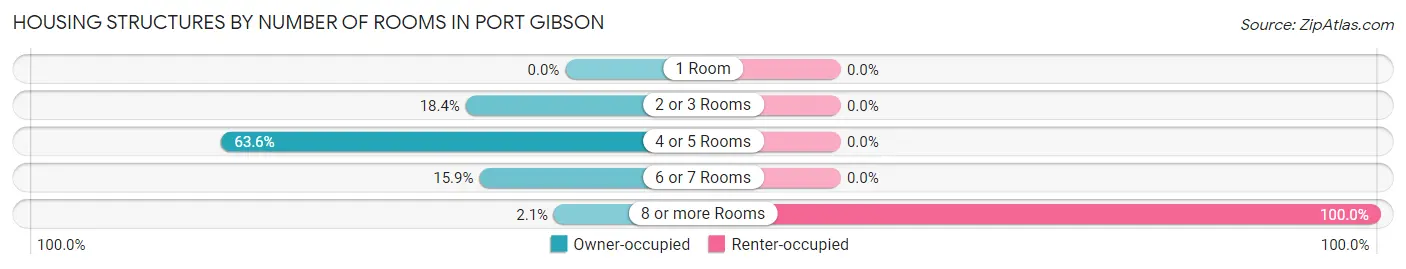
| Number of Rooms | Owner-occupied | Renter-occupied |
| 1 Room | 0 (0.0%) | 0 (0.0%) |
| 2 or 3 Rooms | 44 (18.4%) | 0 (0.0%) |
| 4 or 5 Rooms | 152 (63.6%) | 0 (0.0%) |
| 6 or 7 Rooms | 38 (15.9%) | 0 (0.0%) |
| 8 or more Rooms | 5 (2.1%) | 12 (100.0%) |
| Total | 239 (100.0%) | 12 (100.0%) |
Housing Structure by Heating Type in Port Gibson
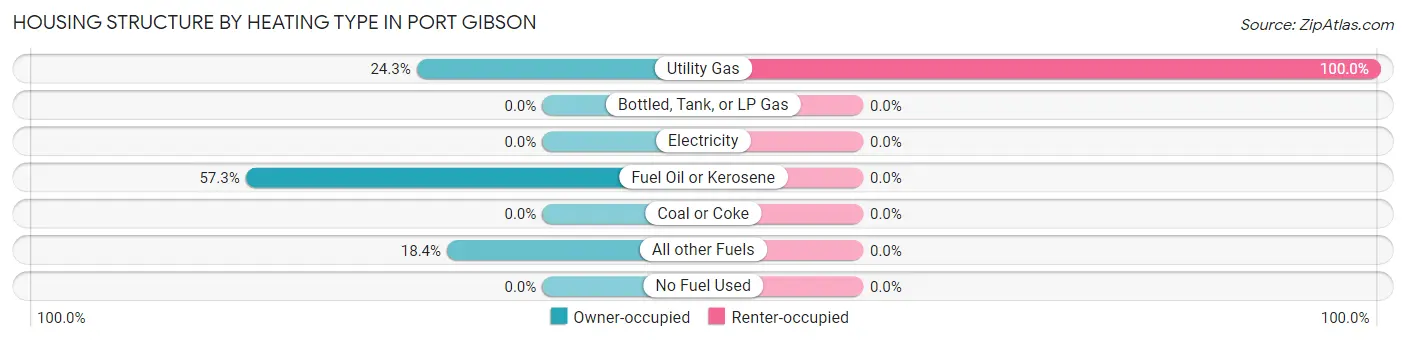
| Heating Type | Owner-occupied | Renter-occupied |
| Utility Gas | 58 (24.3%) | 12 (100.0%) |
| Bottled, Tank, or LP Gas | 0 (0.0%) | 0 (0.0%) |
| Electricity | 0 (0.0%) | 0 (0.0%) |
| Fuel Oil or Kerosene | 137 (57.3%) | 0 (0.0%) |
| Coal or Coke | 0 (0.0%) | 0 (0.0%) |
| All other Fuels | 44 (18.4%) | 0 (0.0%) |
| No Fuel Used | 0 (0.0%) | 0 (0.0%) |
| Total | 239 (100.0%) | 12 (100.0%) |
Household Vehicle Usage in Port Gibson
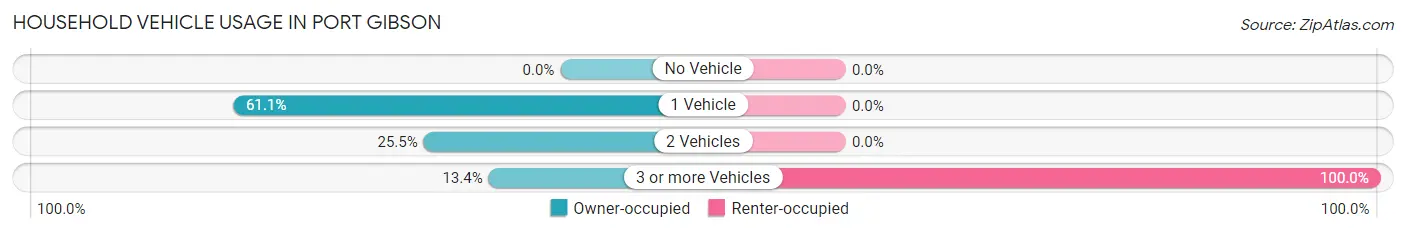
| Vehicles per Household | Owner-occupied | Renter-occupied |
| No Vehicle | 0 (0.0%) | 0 (0.0%) |
| 1 Vehicle | 146 (61.1%) | 0 (0.0%) |
| 2 Vehicles | 61 (25.5%) | 0 (0.0%) |
| 3 or more Vehicles | 32 (13.4%) | 12 (100.0%) |
| Total | 239 (100.0%) | 12 (100.0%) |
Real Estate & Mortgages in Port Gibson
Real Estate and Mortgage Overview in Port Gibson
| Characteristic | Without Mortgage | With Mortgage |
| Housing Units | 133 | 106 |
| Median Property Value | - | - |
| Median Household Income | - | - |
| Monthly Housing Costs | - | - |
| Real Estate Taxes | - | - |
Property Value by Mortgage Status in Port Gibson
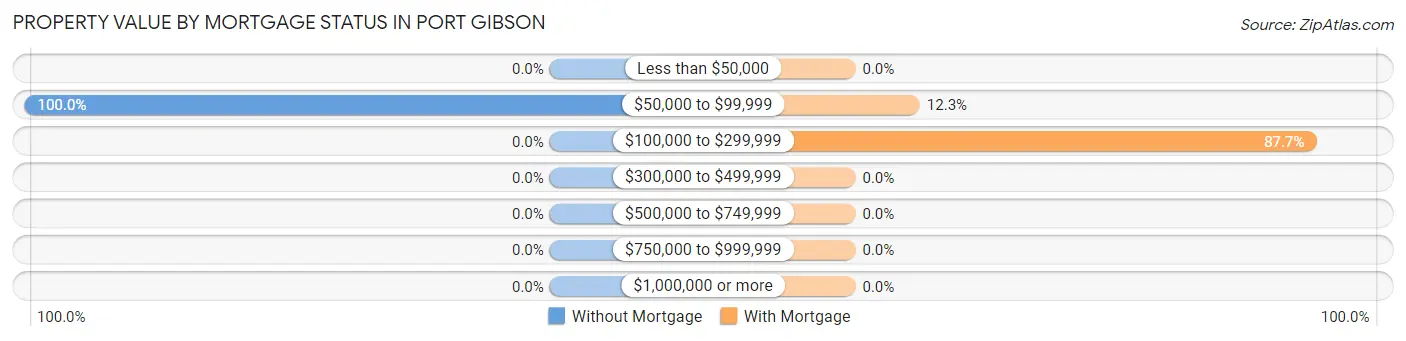
| Property Value | Without Mortgage | With Mortgage |
| Less than $50,000 | 0 (0.0%) | 0 (0.0%) |
| $50,000 to $99,999 | 133 (100.0%) | 13 (12.3%) |
| $100,000 to $299,999 | 0 (0.0%) | 93 (87.7%) |
| $300,000 to $499,999 | 0 (0.0%) | 0 (0.0%) |
| $500,000 to $749,999 | 0 (0.0%) | 0 (0.0%) |
| $750,000 to $999,999 | 0 (0.0%) | 0 (0.0%) |
| $1,000,000 or more | 0 (0.0%) | 0 (0.0%) |
| Total | 133 (100.0%) | 106 (100.0%) |
Household Income by Mortgage Status in Port Gibson
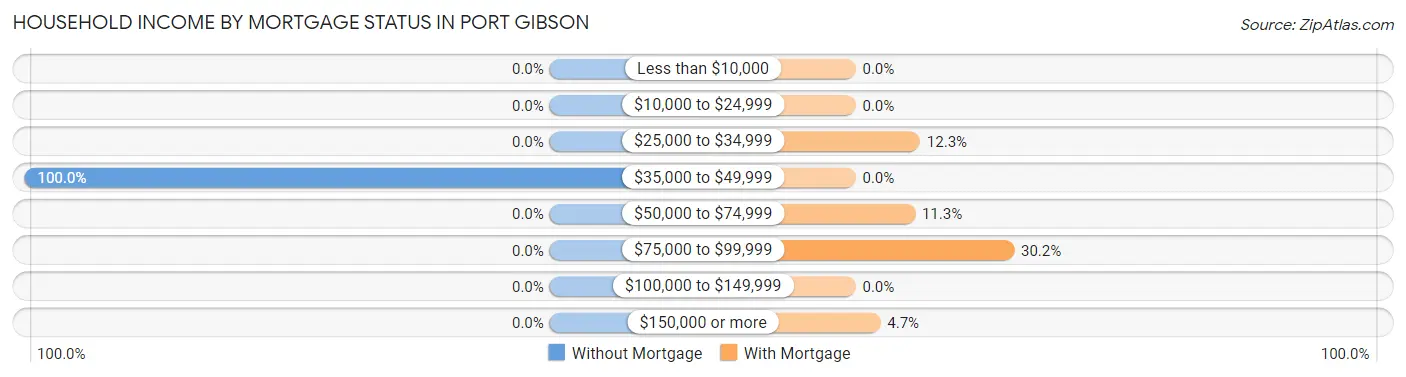
| Household Income | Without Mortgage | With Mortgage |
| Less than $10,000 | 0 (0.0%) | 0 (0.0%) |
| $10,000 to $24,999 | 0 (0.0%) | 0 (0.0%) |
| $25,000 to $34,999 | 0 (0.0%) | 13 (12.3%) |
| $35,000 to $49,999 | 133 (100.0%) | 0 (0.0%) |
| $50,000 to $74,999 | 0 (0.0%) | 12 (11.3%) |
| $75,000 to $99,999 | 0 (0.0%) | 32 (30.2%) |
| $100,000 to $149,999 | 0 (0.0%) | 0 (0.0%) |
| $150,000 or more | 0 (0.0%) | 5 (4.7%) |
| Total | 133 (100.0%) | 106 (100.0%) |
Property Value to Household Income Ratio in Port Gibson
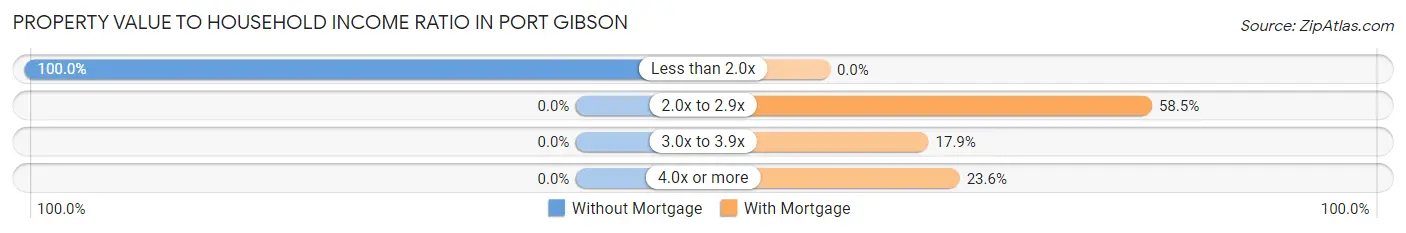
| Value-to-Income Ratio | Without Mortgage | With Mortgage |
| Less than 2.0x | 133 (100.0%) | 0 (0.0%) |
| 2.0x to 2.9x | 0 (0.0%) | 62 (58.5%) |
| 3.0x to 3.9x | 0 (0.0%) | 19 (17.9%) |
| 4.0x or more | 0 (0.0%) | 25 (23.6%) |
| Total | 133 (100.0%) | 106 (100.0%) |
Real Estate Taxes by Mortgage Status in Port Gibson
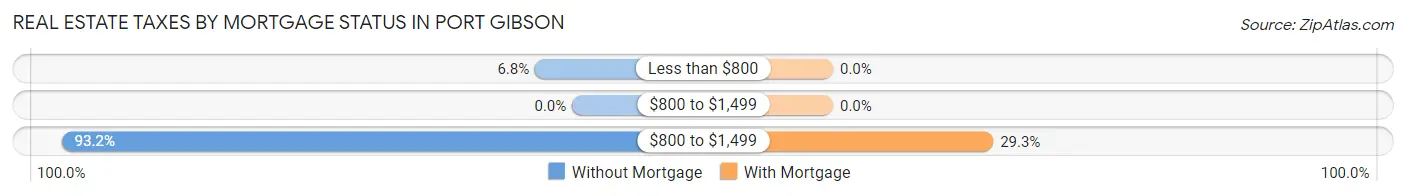
| Property Taxes | Without Mortgage | With Mortgage |
| Less than $800 | 9 (6.8%) | 0 (0.0%) |
| $800 to $1,499 | 0 (0.0%) | 0 (0.0%) |
| $800 to $1,499 | 124 (93.2%) | 31 (29.2%) |
| Total | 133 (100.0%) | 106 (100.0%) |
Health & Disability in Port Gibson
Health Insurance Coverage by Age in Port Gibson
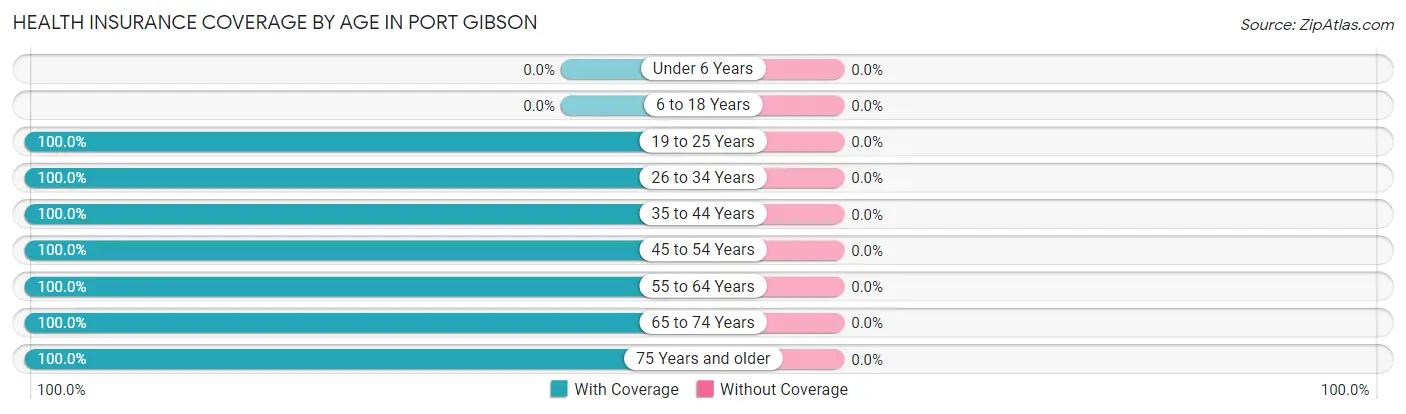
| Age Bracket | With Coverage | Without Coverage |
| Under 6 Years | 0 (0.0%) | 0 (0.0%) |
| 6 to 18 Years | 0 (0.0%) | 0 (0.0%) |
| 19 to 25 Years | 56 (100.0%) | 0 (0.0%) |
| 26 to 34 Years | 133 (100.0%) | 0 (0.0%) |
| 35 to 44 Years | 16 (100.0%) | 0 (0.0%) |
| 45 to 54 Years | 32 (100.0%) | 0 (0.0%) |
| 55 to 64 Years | 33 (100.0%) | 0 (0.0%) |
| 65 to 74 Years | 34 (100.0%) | 0 (0.0%) |
| 75 Years and older | 272 (100.0%) | 0 (0.0%) |
| Total | 576 (100.0%) | 0 (0.0%) |
Health Insurance Coverage by Citizenship Status in Port Gibson
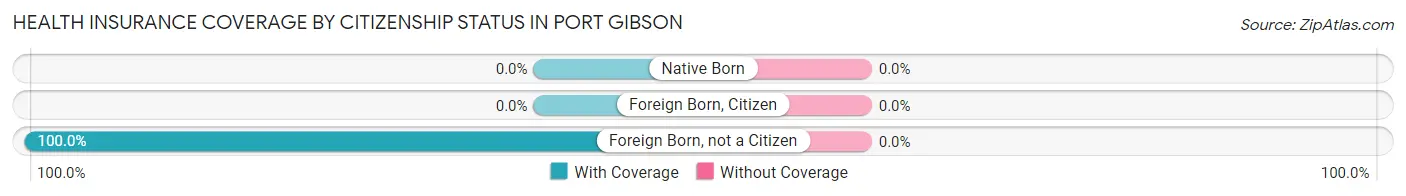
| Citizenship Status | With Coverage | Without Coverage |
| Native Born | 0 (0.0%) | 0 (0.0%) |
| Foreign Born, Citizen | 0 (0.0%) | 0 (0.0%) |
| Foreign Born, not a Citizen | 56 (100.0%) | 0 (0.0%) |
Health Insurance Coverage by Household Income in Port Gibson
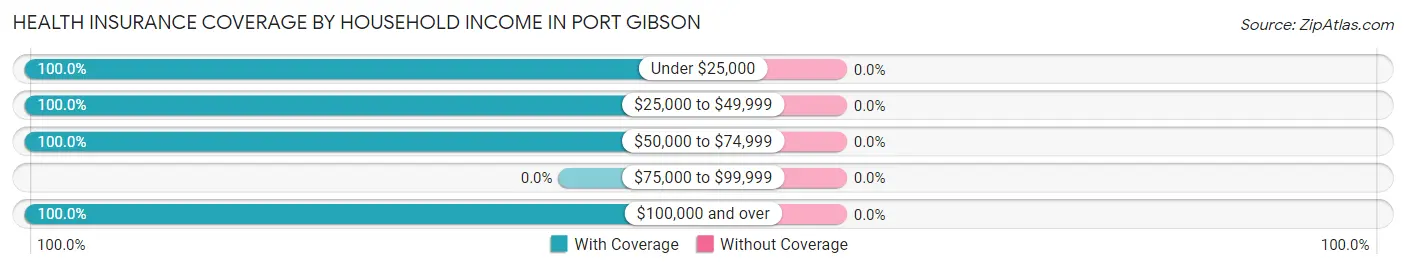
| Household Income | With Coverage | Without Coverage |
| Under $25,000 | 13 (100.0%) | 0 (0.0%) |
| $25,000 to $49,999 | 290 (100.0%) | 0 (0.0%) |
| $50,000 to $74,999 | 56 (100.0%) | 0 (0.0%) |
| $75,000 to $99,999 | 0 (0.0%) | 0 (0.0%) |
| $100,000 and over | 206 (100.0%) | 0 (0.0%) |
Public vs Private Health Insurance Coverage by Age in Port Gibson
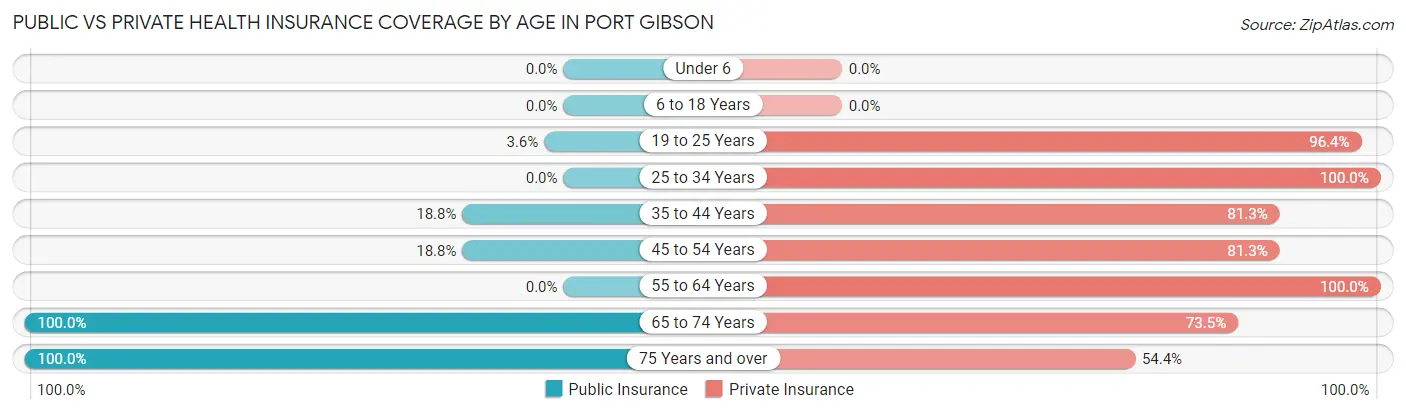
| Age Bracket | Public Insurance | Private Insurance |
| Under 6 | 0 (0.0%) | 0 (0.0%) |
| 6 to 18 Years | 0 (0.0%) | 0 (0.0%) |
| 19 to 25 Years | 2 (3.6%) | 54 (96.4%) |
| 25 to 34 Years | 0 (0.0%) | 133 (100.0%) |
| 35 to 44 Years | 3 (18.8%) | 13 (81.2%) |
| 45 to 54 Years | 6 (18.8%) | 26 (81.2%) |
| 55 to 64 Years | 0 (0.0%) | 33 (100.0%) |
| 65 to 74 Years | 34 (100.0%) | 25 (73.5%) |
| 75 Years and over | 272 (100.0%) | 148 (54.4%) |
| Total | 317 (55.0%) | 432 (75.0%) |
Disability Status by Sex by Age in Port Gibson
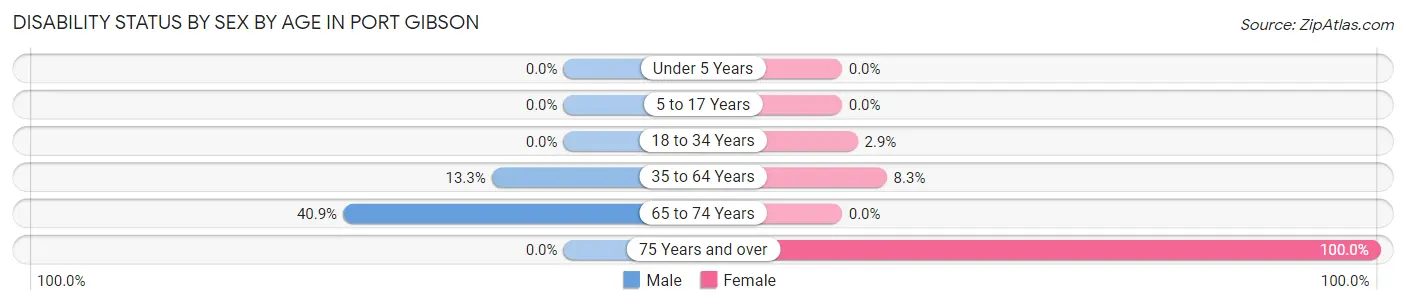
| Age Bracket | Male | Female |
| Under 5 Years | 0 (0.0%) | 0 (0.0%) |
| 5 to 17 Years | 0 (0.0%) | 0 (0.0%) |
| 18 to 34 Years | 0 (0.0%) | 2 (2.9%) |
| 35 to 64 Years | 6 (13.3%) | 3 (8.3%) |
| 65 to 74 Years | 9 (40.9%) | 0 (0.0%) |
| 75 Years and over | 0 (0.0%) | 136 (100.0%) |
Disability Class by Sex by Age in Port Gibson
Disability Class: Hearing Difficulty
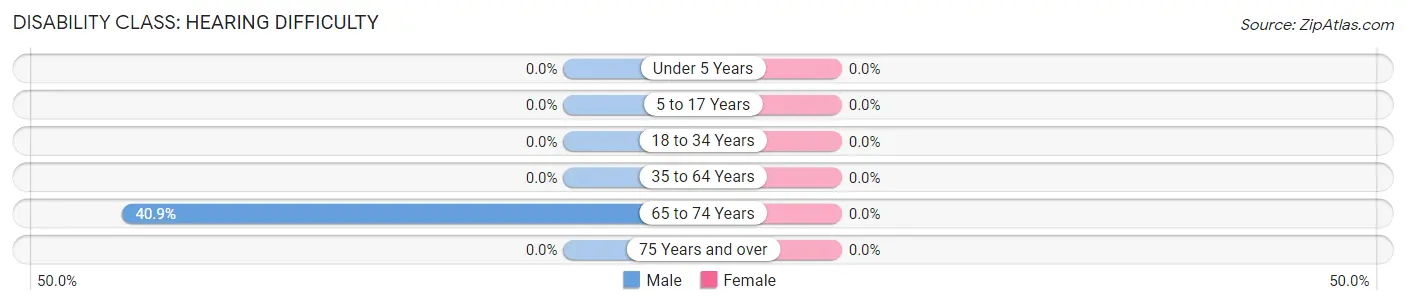
| Age Bracket | Male | Female |
| Under 5 Years | 0 (0.0%) | 0 (0.0%) |
| 5 to 17 Years | 0 (0.0%) | 0 (0.0%) |
| 18 to 34 Years | 0 (0.0%) | 0 (0.0%) |
| 35 to 64 Years | 0 (0.0%) | 0 (0.0%) |
| 65 to 74 Years | 9 (40.9%) | 0 (0.0%) |
| 75 Years and over | 0 (0.0%) | 0 (0.0%) |
Disability Class: Vision Difficulty
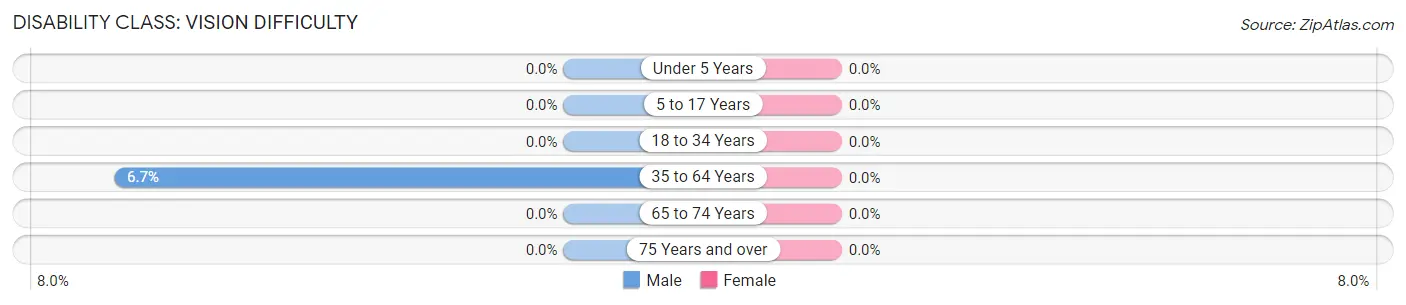
| Age Bracket | Male | Female |
| Under 5 Years | 0 (0.0%) | 0 (0.0%) |
| 5 to 17 Years | 0 (0.0%) | 0 (0.0%) |
| 18 to 34 Years | 0 (0.0%) | 0 (0.0%) |
| 35 to 64 Years | 3 (6.7%) | 0 (0.0%) |
| 65 to 74 Years | 0 (0.0%) | 0 (0.0%) |
| 75 Years and over | 0 (0.0%) | 0 (0.0%) |
Disability Class: Cognitive Difficulty
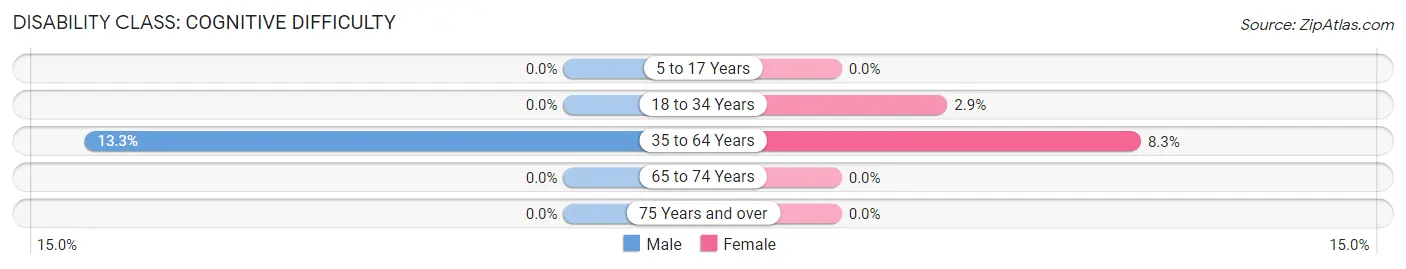
| Age Bracket | Male | Female |
| 5 to 17 Years | 0 (0.0%) | 0 (0.0%) |
| 18 to 34 Years | 0 (0.0%) | 2 (2.9%) |
| 35 to 64 Years | 6 (13.3%) | 3 (8.3%) |
| 65 to 74 Years | 0 (0.0%) | 0 (0.0%) |
| 75 Years and over | 0 (0.0%) | 0 (0.0%) |
Disability Class: Ambulatory Difficulty
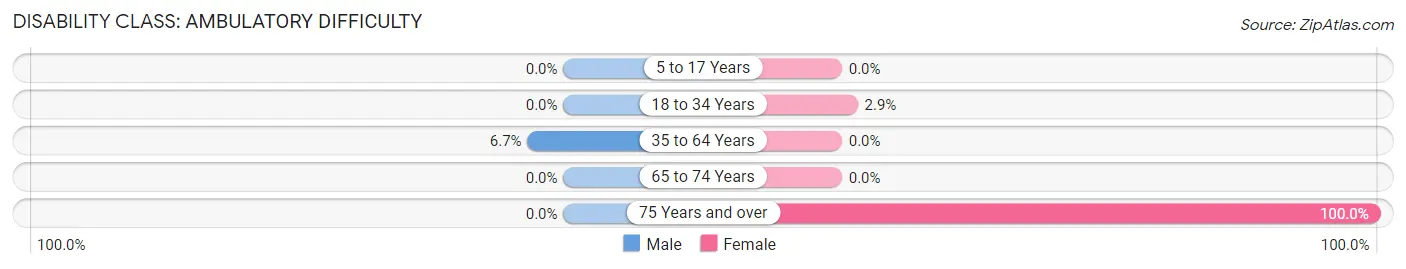
| Age Bracket | Male | Female |
| 5 to 17 Years | 0 (0.0%) | 0 (0.0%) |
| 18 to 34 Years | 0 (0.0%) | 2 (2.9%) |
| 35 to 64 Years | 3 (6.7%) | 0 (0.0%) |
| 65 to 74 Years | 0 (0.0%) | 0 (0.0%) |
| 75 Years and over | 0 (0.0%) | 136 (100.0%) |
Disability Class: Self-Care Difficulty
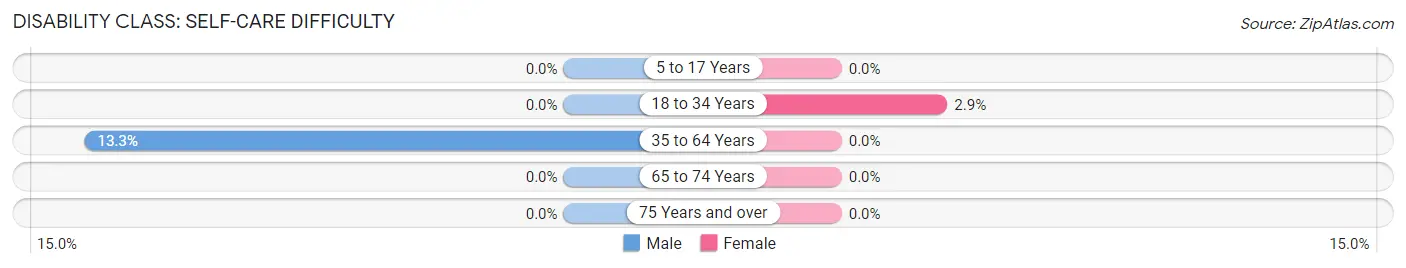
| Age Bracket | Male | Female |
| 5 to 17 Years | 0 (0.0%) | 0 (0.0%) |
| 18 to 34 Years | 0 (0.0%) | 2 (2.9%) |
| 35 to 64 Years | 6 (13.3%) | 0 (0.0%) |
| 65 to 74 Years | 0 (0.0%) | 0 (0.0%) |
| 75 Years and over | 0 (0.0%) | 0 (0.0%) |
Technology Access in Port Gibson
Computing Device Access in Port Gibson
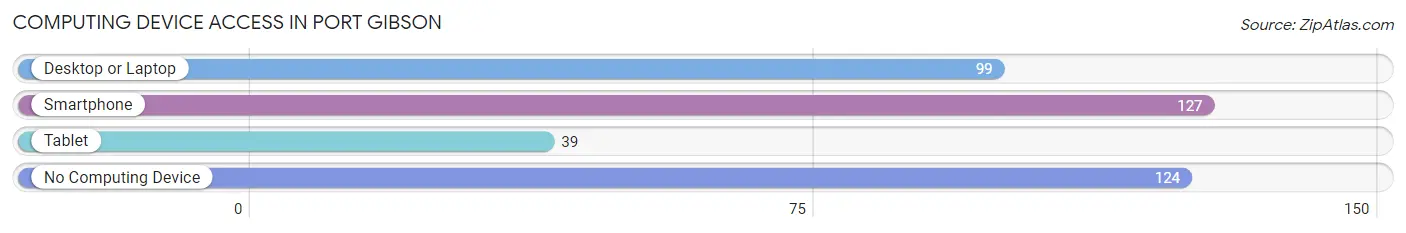
| Device Type | # Households | % Households |
| Desktop or Laptop | 99 | 39.4% |
| Smartphone | 127 | 50.6% |
| Tablet | 39 | 15.5% |
| No Computing Device | 124 | 49.4% |
| Total | 251 | 100.0% |
Internet Access in Port Gibson
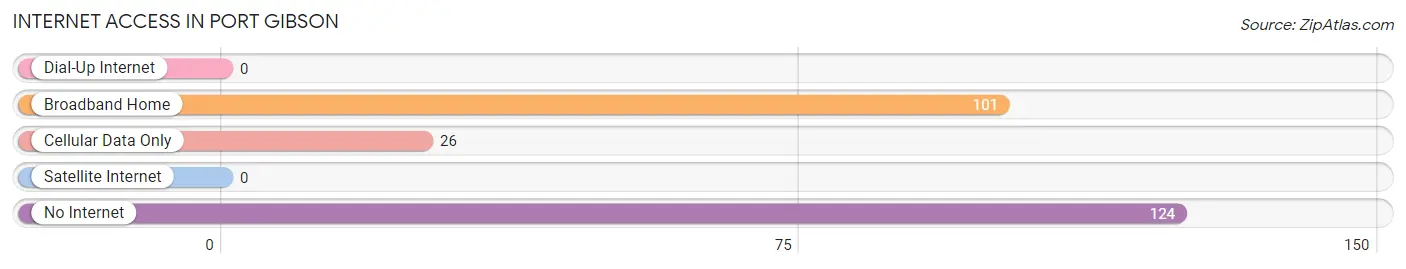
| Internet Type | # Households | % Households |
| Dial-Up Internet | 0 | 0.0% |
| Broadband Home | 101 | 40.2% |
| Cellular Data Only | 26 | 10.4% |
| Satellite Internet | 0 | 0.0% |
| No Internet | 124 | 49.4% |
| Total | 251 | 100.0% |
Port Gibson Summary
History
The town of Port Gibson is located in the Finger Lakes region of New York State. It is situated in the northwest corner of Ontario County, and is bordered by the towns of Gorham, Hopewell, and Seneca. The town was first settled in 1790 by a group of settlers from Connecticut, led by Captain John Gibson. The town was named after the port of Gibson in Connecticut, and was officially established in 1802.
The town of Port Gibson has a rich history of industry and agriculture. In the early 19th century, the town was home to several mills, including a sawmill, gristmill, and a woolen mill. The town was also home to several farms, and was known for its production of apples, potatoes, and other crops.
In the late 19th century, the town began to experience a period of growth and development. The railroad arrived in 1872, and the town was connected to the larger cities of Rochester and Syracuse. This allowed for the growth of industry and commerce in the area. The town also experienced a period of population growth, as many immigrants from Europe and other parts of the United States moved to the area.
Geography
Port Gibson is located in the Finger Lakes region of New York State. It is situated in the northwest corner of Ontario County, and is bordered by the towns of Gorham, Hopewell, and Seneca. The town is located on the western edge of the Finger Lakes, and is surrounded by rolling hills and valleys. The town is home to several small lakes, including Lake Ontario, which is the largest lake in the area.
The town of Port Gibson is located in a rural area, and is home to several small towns and villages. The largest of these is the village of Port Gibson, which is the county seat of Ontario County. The village is home to several businesses, including a grocery store, a bank, and a post office.
Economy
The economy of Port Gibson is largely based on agriculture and tourism. The town is home to several farms, which produce a variety of crops, including apples, potatoes, and other vegetables. The town is also home to several wineries, which produce a variety of wines.
The town is also home to several small businesses, including restaurants, shops, and other services. The town is also home to several small manufacturing companies, which produce a variety of products, including furniture, clothing, and other items.
Demographics
As of the 2010 census, the town of Port Gibson had a population of 1,845. The population is largely white (94.3%), with a small percentage of African Americans (2.2%) and Hispanics (2.5%). The median household income is $45,000, and the median age is 43.
The town of Port Gibson is served by the Port Gibson Central School District, which includes two elementary schools, a middle school, and a high school. The town is also home to several churches, including the First Presbyterian Church, the United Methodist Church, and the Church of the Nazarene.
Common Questions
What is Per Capita Income in Port Gibson?
Per Capita income in Port Gibson is $37,204.
What is Inequality or Gini Index in Port Gibson?
Inequality or Gini Index in Port Gibson is 0.35.
What is the Total Population of Port Gibson?
Total Population of Port Gibson is 576.
What is the Total Male Population of Port Gibson?
Total Male Population of Port Gibson is 324.
What is the Total Female Population of Port Gibson?
Total Female Population of Port Gibson is 252.
What is the Ratio of Males per 100 Females in Port Gibson?
There are 128.57 Males per 100 Females in Port Gibson.
What is the Ratio of Females per 100 Males in Port Gibson?
There are 77.78 Females per 100 Males in Port Gibson.
What is the Median Population Age in Port Gibson?
Median Population Age in Port Gibson is 69.3 Years.
What is the Average Family Size in Port Gibson
Average Family Size in Port Gibson is 2.5 People.
What is the Average Household Size in Port Gibson
Average Household Size in Port Gibson is 2.2 People.
How Large is the Labor Force in Port Gibson?
There are 262 People in the Labor Forcein in Port Gibson.
What is the Percentage of People in the Labor Force in Port Gibson?
45.5% of People are in the Labor Force in Port Gibson.
What is the Unemployment Rate in Port Gibson?
Unemployment Rate in Port Gibson is 5.0%.