Zip Codes with the Highest Percentage of Population Employed in Health Diagnosing & Treating in Long Island City, NY
RELATED REPORTS & OPTIONS
Health Diagnosing & Treating
Long Island City
Compare Zip Codes
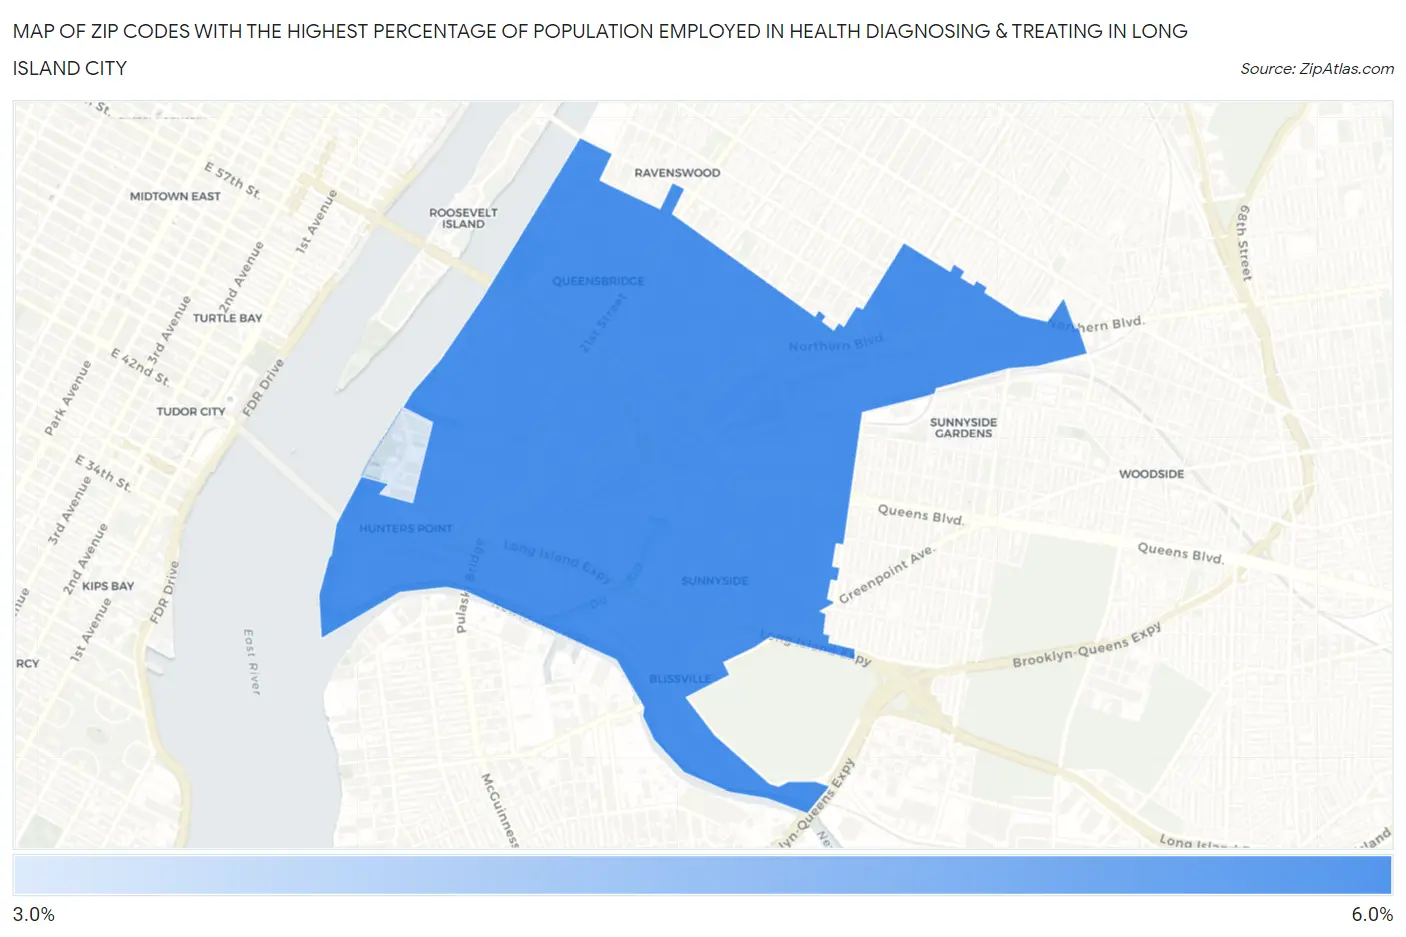
Map of Zip Codes with the Highest Percentage of Population Employed in Health Diagnosing & Treating in Long Island City
3.1%
5.7%
Zip Codes with the Highest Percentage of Population Employed in Health Diagnosing & Treating in Long Island City, NY
| Zip Code | % Employed | vs State | vs National | |
| 1. | 11101 | 5.7% | 6.6%(-0.911)#965 | 6.2%(-0.584)#15,128 |
| 2. | 11109 | 3.1% | 6.6%(-3.47)#1,386 | 6.2%(-3.14)#24,053 |
1
Common Questions
What are the Top Zip Codes with the Highest Percentage of Population Employed in Health Diagnosing & Treating in Long Island City, NY?
Top Zip Codes with the Highest Percentage of Population Employed in Health Diagnosing & Treating in Long Island City, NY are:
What zip code has the Highest Percentage of Population Employed in Health Diagnosing & Treating in Long Island City, NY?
11101 has the Highest Percentage of Population Employed in Health Diagnosing & Treating in Long Island City, NY with 5.7%.
What is the Percentage of Population Employed in Health Diagnosing & Treating in New York?
Percentage of Population Employed in Health Diagnosing & Treating in New York is 6.6%.
What is the Percentage of Population Employed in Health Diagnosing & Treating in the United States?
Percentage of Population Employed in Health Diagnosing & Treating in the United States is 6.2%.