Pamelia Center, NY Map & Demographics
Pamelia Center Map
Pamelia Center Overview
$24,241
PER CAPITA INCOME
$116,354
AVG FAMILY INCOME
$116,354
AVG HOUSEHOLD INCOME
47.6%
WAGE / INCOME GAP [ % ]
52.4¢/ $1
WAGE / INCOME GAP [ $ ]
0.28
INEQUALITY / GINI INDEX
770
TOTAL POPULATION
409
MALE POPULATION
361
FEMALE POPULATION
113.30
MALES / 100 FEMALES
88.26
FEMALES / 100 MALES
21.5
MEDIAN AGE
3.7
AVG FAMILY SIZE
4.4
AVG HOUSEHOLD SIZE
282
LABOR FORCE [ PEOPLE ]
50.4%
PERCENT IN LABOR FORCE
12.2%
UNEMPLOYMENT RATE
Income in Pamelia Center
Income Overview in Pamelia Center
Per Capita Income in Pamelia Center is $24,241, while median incomes of families and households are $116,354 and $116,354 respectively.
| Characteristic | Number | Measure |
| Per Capita Income | 770 | $24,241 |
| Median Family Income | 175 | $116,354 |
| Mean Family Income | 175 | $104,953 |
| Median Household Income | 175 | $116,354 |
| Mean Household Income | 175 | $104,953 |
| Income Deficit | 175 | $0 |
| Wage / Income Gap (%) | 770 | 47.63% |
| Wage / Income Gap ($) | 770 | 52.37¢ per $1 |
| Gini / Inequality Index | 770 | 0.28 |
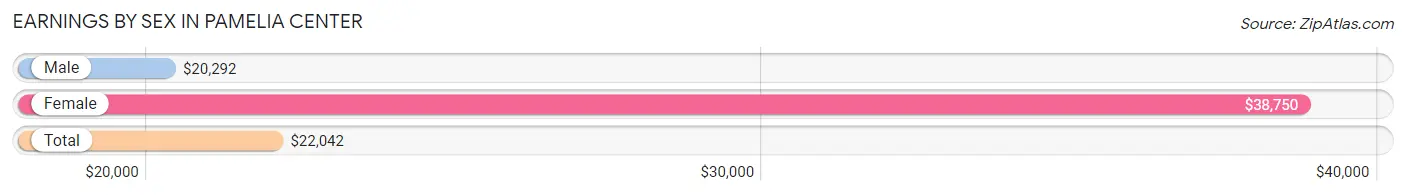
Earnings by Sex in Pamelia Center
Average Earnings in Pamelia Center are $22,042, $20,292 for men and $38,750 for women, a difference of 47.6%.
| Sex | Number | Average Earnings |
| Male | 223 (54.8%) | $20,292 |
| Female | 184 (45.2%) | $38,750 |
| Total | 407 (100.0%) | $22,042 |
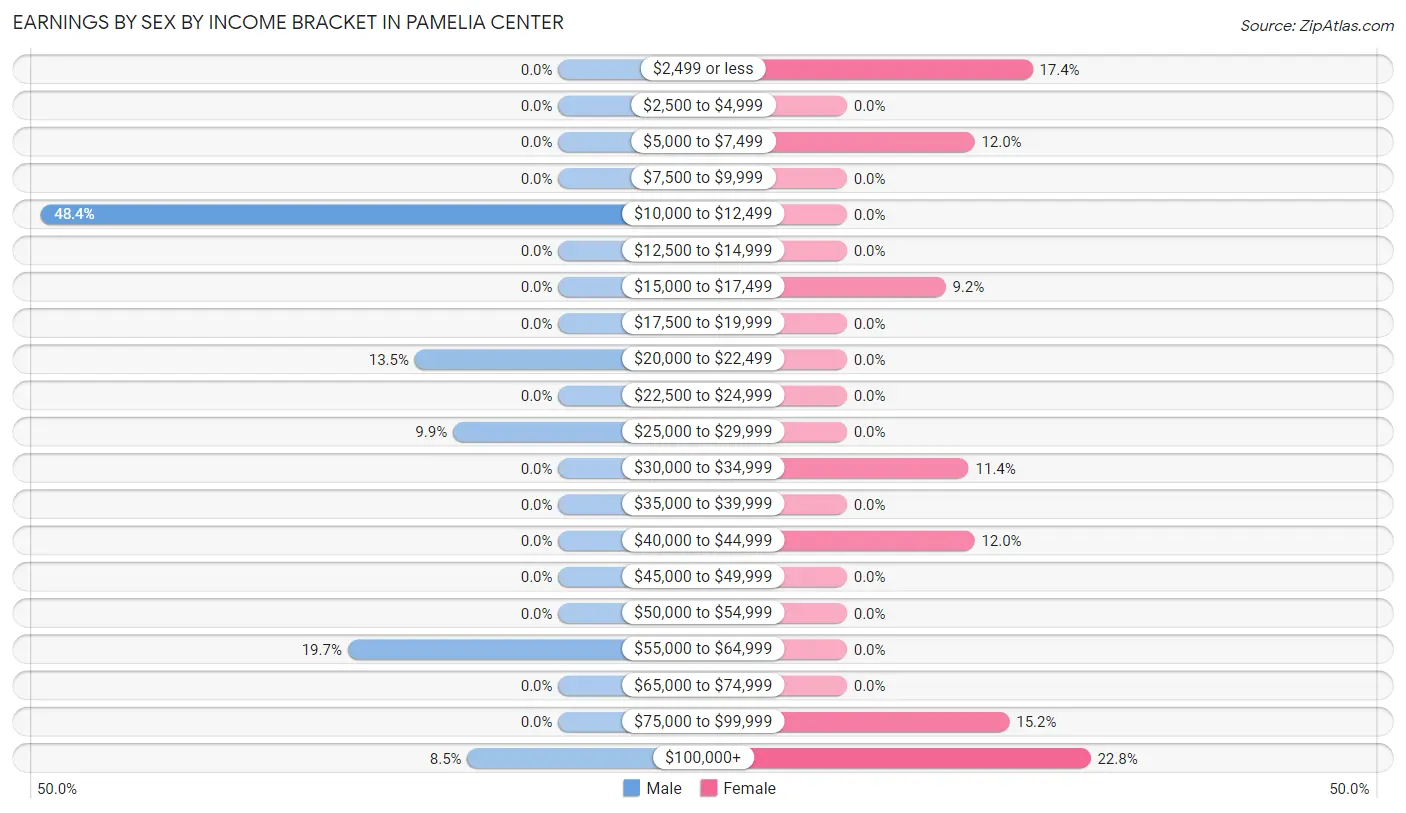
Earnings by Sex by Income Bracket in Pamelia Center
The most common earnings brackets in Pamelia Center are $10,000 to $12,499 for men (108 | 48.4%) and $100,000+ for women (42 | 22.8%).
| Income | Male | Female |
| $2,499 or less | 0 (0.0%) | 32 (17.4%) |
| $2,500 to $4,999 | 0 (0.0%) | 0 (0.0%) |
| $5,000 to $7,499 | 0 (0.0%) | 22 (12.0%) |
| $7,500 to $9,999 | 0 (0.0%) | 0 (0.0%) |
| $10,000 to $12,499 | 108 (48.4%) | 0 (0.0%) |
| $12,500 to $14,999 | 0 (0.0%) | 0 (0.0%) |
| $15,000 to $17,499 | 0 (0.0%) | 17 (9.2%) |
| $17,500 to $19,999 | 0 (0.0%) | 0 (0.0%) |
| $20,000 to $22,499 | 30 (13.5%) | 0 (0.0%) |
| $22,500 to $24,999 | 0 (0.0%) | 0 (0.0%) |
| $25,000 to $29,999 | 22 (9.9%) | 0 (0.0%) |
| $30,000 to $34,999 | 0 (0.0%) | 21 (11.4%) |
| $35,000 to $39,999 | 0 (0.0%) | 0 (0.0%) |
| $40,000 to $44,999 | 0 (0.0%) | 22 (12.0%) |
| $45,000 to $49,999 | 0 (0.0%) | 0 (0.0%) |
| $50,000 to $54,999 | 0 (0.0%) | 0 (0.0%) |
| $55,000 to $64,999 | 44 (19.7%) | 0 (0.0%) |
| $65,000 to $74,999 | 0 (0.0%) | 0 (0.0%) |
| $75,000 to $99,999 | 0 (0.0%) | 28 (15.2%) |
| $100,000+ | 19 (8.5%) | 42 (22.8%) |
| Total | 223 (100.0%) | 184 (100.0%) |
Earnings by Sex by Educational Attainment in Pamelia Center
| Educational Attainment | Male Income | Female Income |
| Less than High School | - | - |
| High School Diploma | - | - |
| College or Associate's Degree | - | - |
| Bachelor's Degree | - | - |
| Graduate Degree | - | - |
| Total | $58,665 | $0 |
Family Income in Pamelia Center
Family Income Brackets in Pamelia Center
According to the Pamelia Center family income data, there are 65 families falling into the $100,000 to $149,999 income range, which is the most common income bracket and makes up 37.1% of all families.
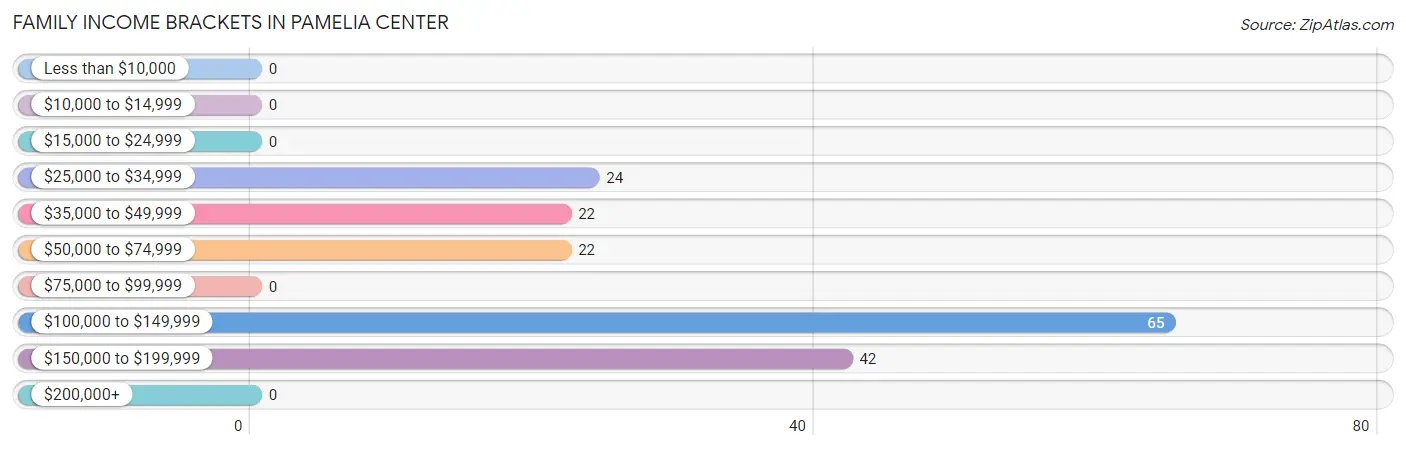
| Income Bracket | # Families | % Families |
| Less than $10,000 | 0 | 0.0% |
| $10,000 to $14,999 | 0 | 0.0% |
| $15,000 to $24,999 | 0 | 0.0% |
| $25,000 to $34,999 | 24 | 13.7% |
| $35,000 to $49,999 | 22 | 12.6% |
| $50,000 to $74,999 | 22 | 12.6% |
| $75,000 to $99,999 | 0 | 0.0% |
| $100,000 to $149,999 | 65 | 37.1% |
| $150,000 to $199,999 | 42 | 24.0% |
| $200,000+ | 0 | 0.0% |
Family Income by Famaliy Size in Pamelia Center
2-person families (87 | 49.7%) account for the highest median family income in Pamelia Center with $44,716 per family, while 2-person families (87 | 49.7%) have the highest median income of $22,358 per family member.
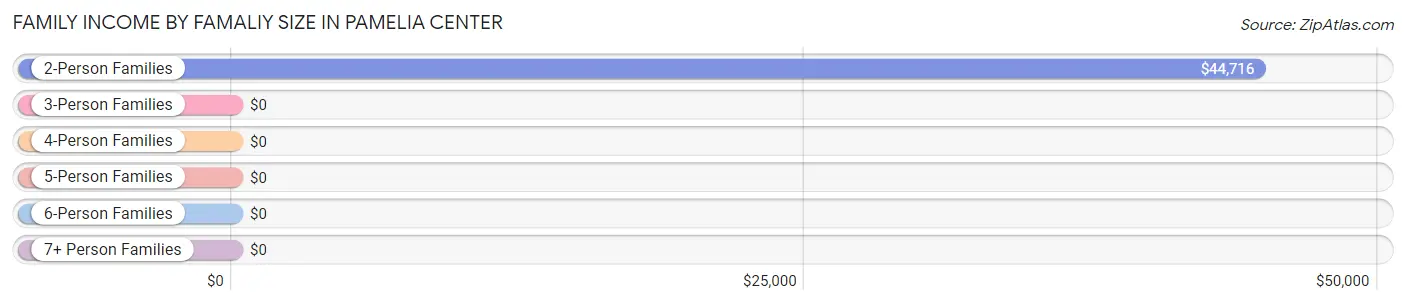
| Income Bracket | # Families | Median Income |
| 2-Person Families | 87 (49.7%) | $44,716 |
| 3-Person Families | 10 (5.7%) | $0 |
| 4-Person Families | 42 (24.0%) | $0 |
| 5-Person Families | 0 (0.0%) | $0 |
| 6-Person Families | 36 (20.6%) | $0 |
| 7+ Person Families | 0 (0.0%) | $0 |
| Total | 175 (100.0%) | $116,354 |
Family Income by Number of Earners in Pamelia Center
| Number of Earners | # Families | Median Income |
| No Earners | 10 (5.7%) | $0 |
| 1 Earner | 46 (26.3%) | $0 |
| 2 Earners | 41 (23.4%) | $0 |
| 3+ Earners | 78 (44.6%) | $0 |
| Total | 175 (100.0%) | $116,354 |
Household Income in Pamelia Center
Household Income Brackets in Pamelia Center
With 65 households falling in the category, the $100,000 to $149,999 income range is the most frequent in Pamelia Center, accounting for 37.1% of all households.
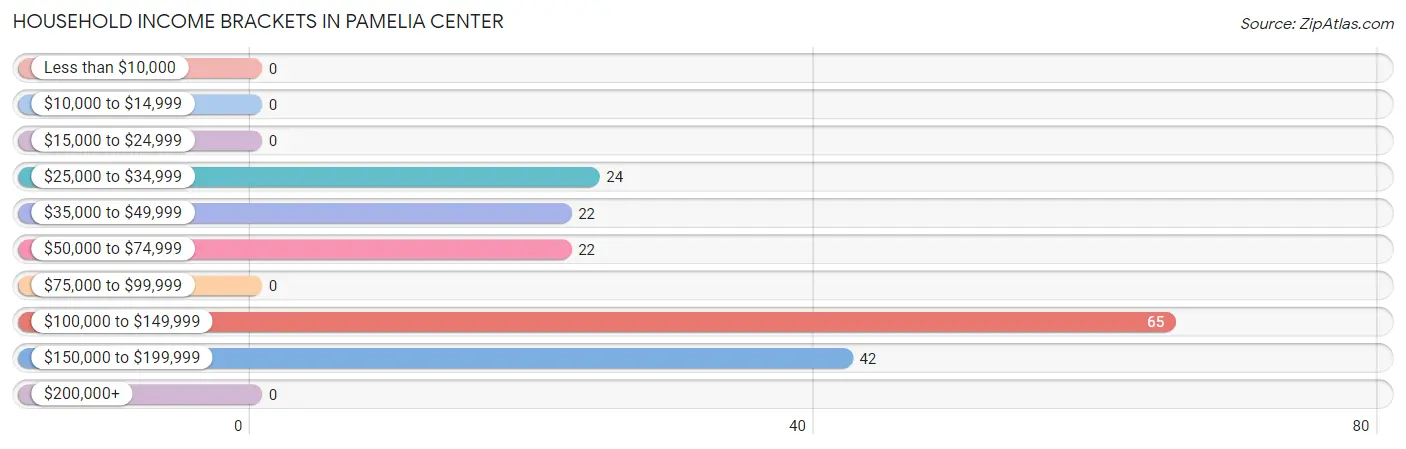
| Income Bracket | # Households | % Households |
| Less than $10,000 | 0 | 0.0% |
| $10,000 to $14,999 | 0 | 0.0% |
| $15,000 to $24,999 | 0 | 0.0% |
| $25,000 to $34,999 | 24 | 13.7% |
| $35,000 to $49,999 | 22 | 12.6% |
| $50,000 to $74,999 | 22 | 12.6% |
| $75,000 to $99,999 | 0 | 0.0% |
| $100,000 to $149,999 | 65 | 37.1% |
| $150,000 to $199,999 | 42 | 24.0% |
| $200,000+ | 0 | 0.0% |
Household Income by Householder Age in Pamelia Center
The median household income in Pamelia Center is $116,354, with the highest median household income of $117,292 found in the 45 to 64 years age bracket for the primary householder. A total of 110 households (62.9%) fall into this category.
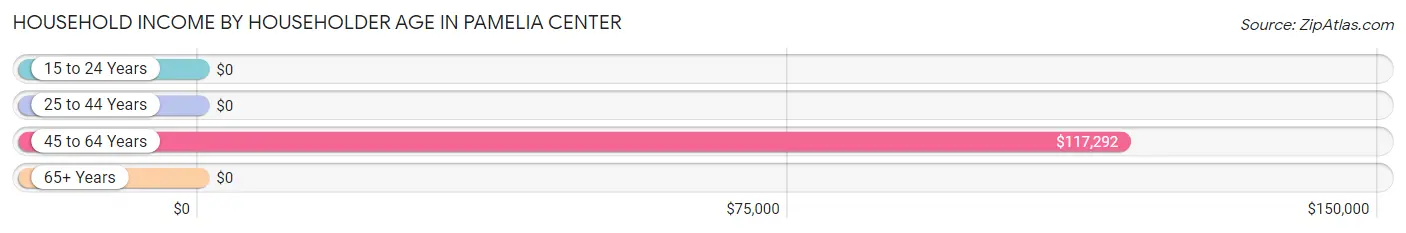
| Income Bracket | # Households | Median Income |
| 15 to 24 Years | 0 (0.0%) | $0 |
| 25 to 44 Years | 65 (37.1%) | $0 |
| 45 to 64 Years | 110 (62.9%) | $117,292 |
| 65+ Years | 0 (0.0%) | $0 |
| Total | 175 (100.0%) | $116,354 |
Poverty in Pamelia Center
Income Below Poverty by Sex and Age in Pamelia Center
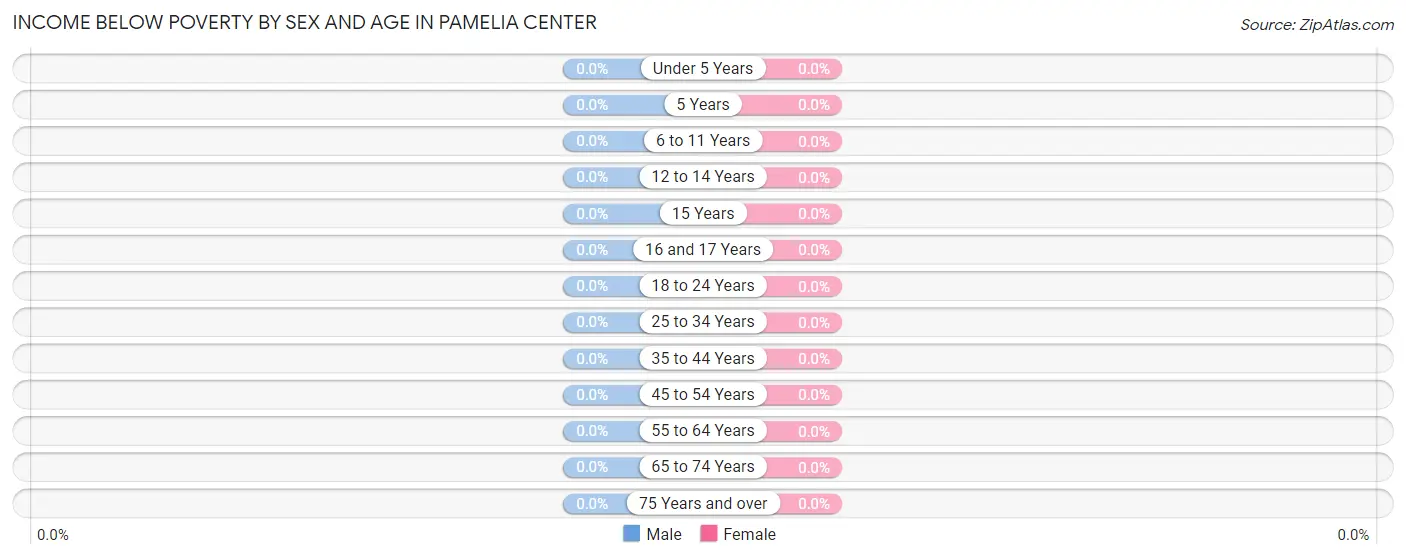
| Age Bracket | Male | Female |
| Under 5 Years | 0 (0.0%) | 0 (0.0%) |
| 5 Years | 0 (0.0%) | 0 (0.0%) |
| 6 to 11 Years | 0 (0.0%) | 0 (0.0%) |
| 12 to 14 Years | 0 (0.0%) | 0 (0.0%) |
| 15 Years | 0 (0.0%) | 0 (0.0%) |
| 16 and 17 Years | 0 (0.0%) | 0 (0.0%) |
| 18 to 24 Years | 0 (0.0%) | 0 (0.0%) |
| 25 to 34 Years | 0 (0.0%) | 0 (0.0%) |
| 35 to 44 Years | 0 (0.0%) | 0 (0.0%) |
| 45 to 54 Years | 0 (0.0%) | 0 (0.0%) |
| 55 to 64 Years | 0 (0.0%) | 0 (0.0%) |
| 65 to 74 Years | 0 (0.0%) | 0 (0.0%) |
| 75 Years and over | 0 (0.0%) | 0 (0.0%) |
| Total | 0 (0.0%) | 0 (0.0%) |
Income Above Poverty by Sex and Age in Pamelia Center
According to the poverty statistics in Pamelia Center, males aged 6 to 11 years and females aged 12 to 14 years are the age groups that are most secure financially, with 100.0% of males and 100.0% of females in these age groups living above the poverty line.
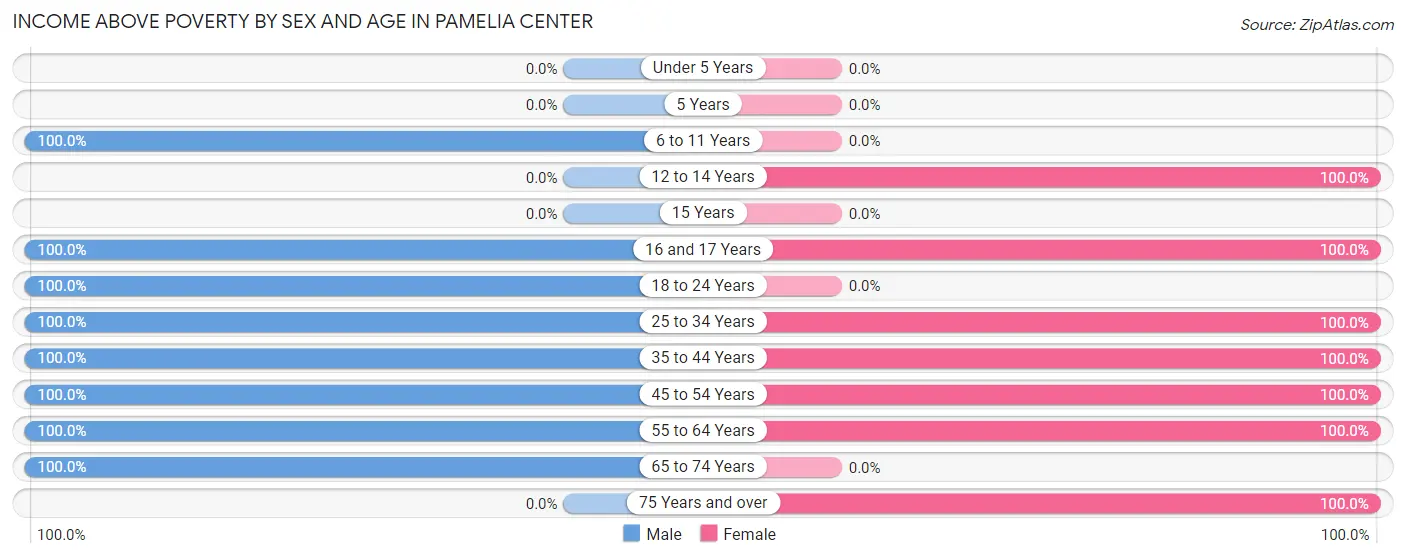
| Age Bracket | Male | Female |
| Under 5 Years | 0 (0.0%) | 0 (0.0%) |
| 5 Years | 0 (0.0%) | 0 (0.0%) |
| 6 to 11 Years | 53 (100.0%) | 0 (0.0%) |
| 12 to 14 Years | 0 (0.0%) | 32 (100.0%) |
| 15 Years | 0 (0.0%) | 0 (0.0%) |
| 16 and 17 Years | 59 (100.0%) | 32 (100.0%) |
| 18 to 24 Years | 138 (100.0%) | 0 (0.0%) |
| 25 to 34 Years | 19 (100.0%) | 17 (100.0%) |
| 35 to 44 Years | 24 (100.0%) | 43 (100.0%) |
| 45 to 54 Years | 22 (100.0%) | 42 (100.0%) |
| 55 to 64 Years | 80 (100.0%) | 60 (100.0%) |
| 65 to 74 Years | 14 (100.0%) | 0 (0.0%) |
| 75 Years and over | 0 (0.0%) | 10 (100.0%) |
| Total | 409 (100.0%) | 236 (100.0%) |
Income Below Poverty Among Married-Couple Families in Pamelia Center
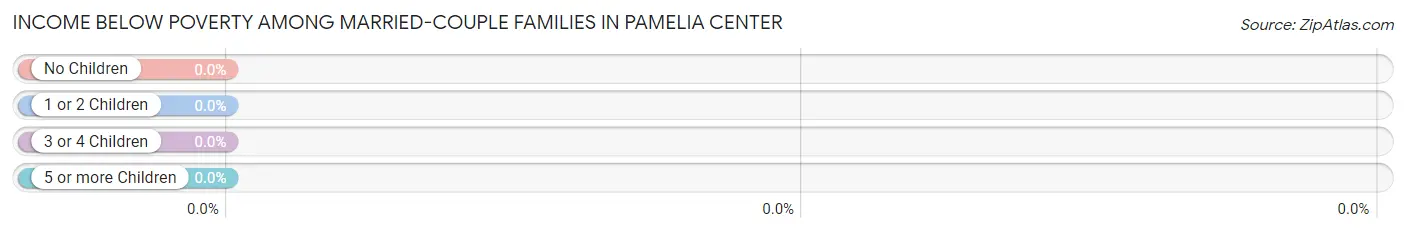
| Children | Above Poverty | Below Poverty |
| No Children | 75 (100.0%) | 0 (0.0%) |
| 1 or 2 Children | 42 (100.0%) | 0 (0.0%) |
| 3 or 4 Children | 36 (100.0%) | 0 (0.0%) |
| 5 or more Children | 0 (0.0%) | 0 (0.0%) |
| Total | 153 (100.0%) | 0 (0.0%) |
Income Below Poverty Among Single-Parent Households in Pamelia Center
| Children | Single Father | Single Mother |
| No Children | 0 (0.0%) | 0 (0.0%) |
| 1 or 2 Children | 0 (0.0%) | 0 (0.0%) |
| 3 or 4 Children | 0 (0.0%) | 0 (0.0%) |
| 5 or more Children | 0 (0.0%) | 0 (0.0%) |
| Total | 0 (0.0%) | 0 (0.0%) |
Income Below Poverty Among Married-Couple vs Single-Parent Households in Pamelia Center
| Children | Married-Couple Families | Single-Parent Households |
| No Children | 0 (0.0%) | 0 (0.0%) |
| 1 or 2 Children | 0 (0.0%) | 0 (0.0%) |
| 3 or 4 Children | 0 (0.0%) | 0 (0.0%) |
| 5 or more Children | 0 (0.0%) | 0 (0.0%) |
| Total | 0 (0.0%) | 0 (0.0%) |
Race in Pamelia Center
The most populous races in Pamelia Center are White / Caucasian (714 | 92.7%), Black / African American (36 | 4.7%), and Asian (20 | 2.6%).
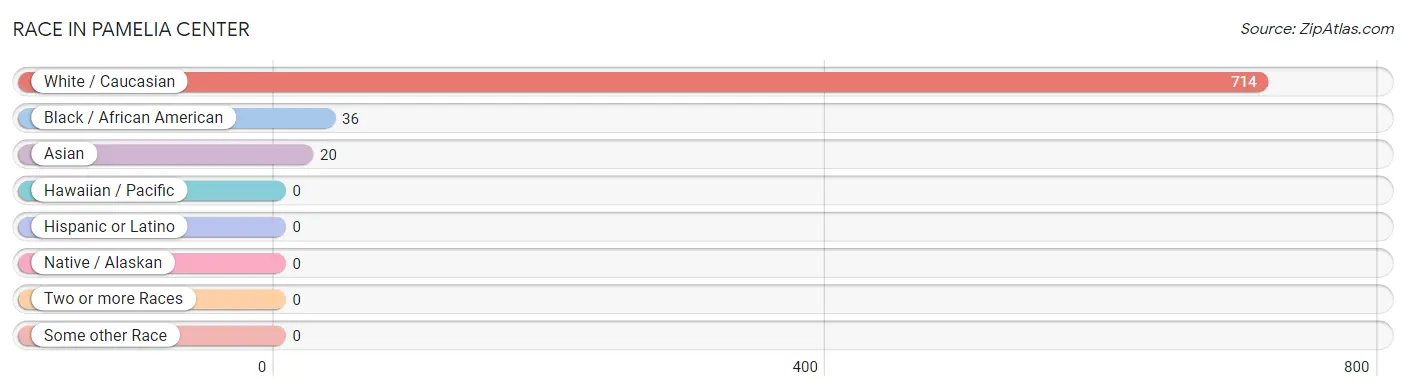
| Race | # Population | % Population |
| Asian | 20 | 2.6% |
| Black / African American | 36 | 4.7% |
| Hawaiian / Pacific | 0 | 0.0% |
| Hispanic or Latino | 0 | 0.0% |
| Native / Alaskan | 0 | 0.0% |
| White / Caucasian | 714 | 92.7% |
| Two or more Races | 0 | 0.0% |
| Some other Race | 0 | 0.0% |
| Total | 770 | 100.0% |
Ancestry in Pamelia Center
The most populous ancestries reported in Pamelia Center are American (36 | 4.7%), Belizean (36 | 4.7%), Canadian (24 | 3.1%), European (24 | 3.1%), and English (22 | 2.9%), together accounting for 18.5% of all Pamelia Center residents.
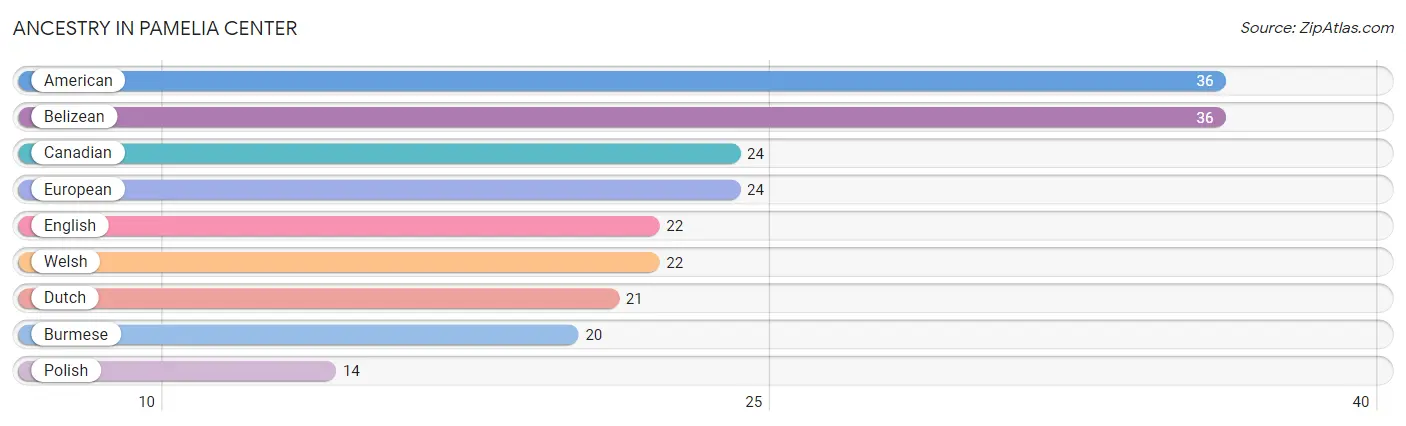
| Ancestry | # Population | % Population |
| American | 36 | 4.7% |
| Belizean | 36 | 4.7% |
| Burmese | 20 | 2.6% |
| Canadian | 24 | 3.1% |
| Dutch | 21 | 2.7% |
| English | 22 | 2.9% |
| European | 24 | 3.1% |
| Polish | 14 | 1.8% |
| Welsh | 22 | 2.9% | View All 9 Rows |
Immigrants in Pamelia Center
The most numerous immigrant groups reported in Pamelia Center came from Belize (36 | 4.7%), Central America (36 | 4.7%), Latin America (36 | 4.7%), Europe (22 | 2.9%), and Northern Europe (22 | 2.9%), together accounting for 19.8% of all Pamelia Center residents.
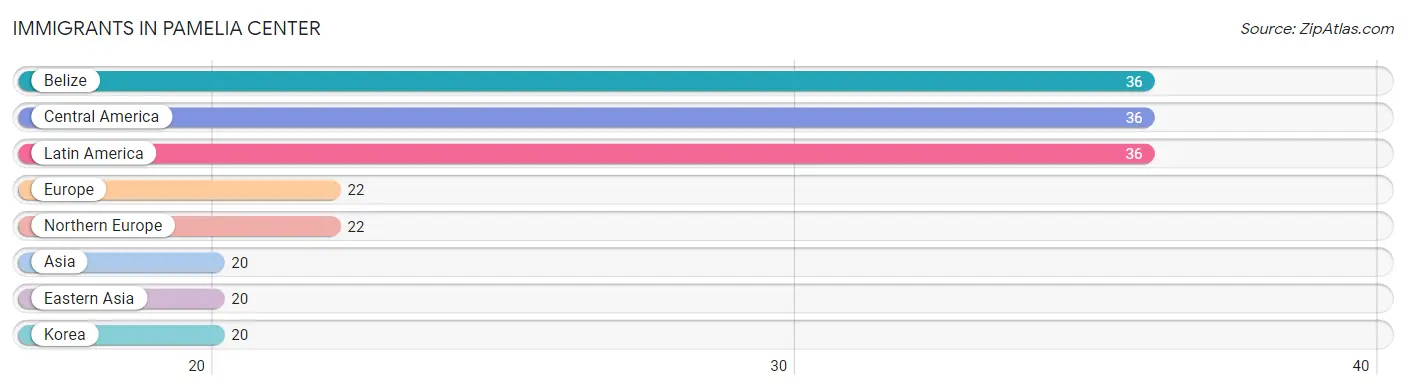
| Immigration Origin | # Population | % Population |
| Asia | 20 | 2.6% |
| Belize | 36 | 4.7% |
| Central America | 36 | 4.7% |
| Eastern Asia | 20 | 2.6% |
| Europe | 22 | 2.9% |
| Korea | 20 | 2.6% |
| Latin America | 36 | 4.7% |
| Northern Europe | 22 | 2.9% | View All 8 Rows |
Sex and Age in Pamelia Center
Sex and Age in Pamelia Center
The most populous age groups in Pamelia Center are 20 to 24 Years (108 | 26.4%) for men and 5 to 9 Years (64 | 17.7%) for women.
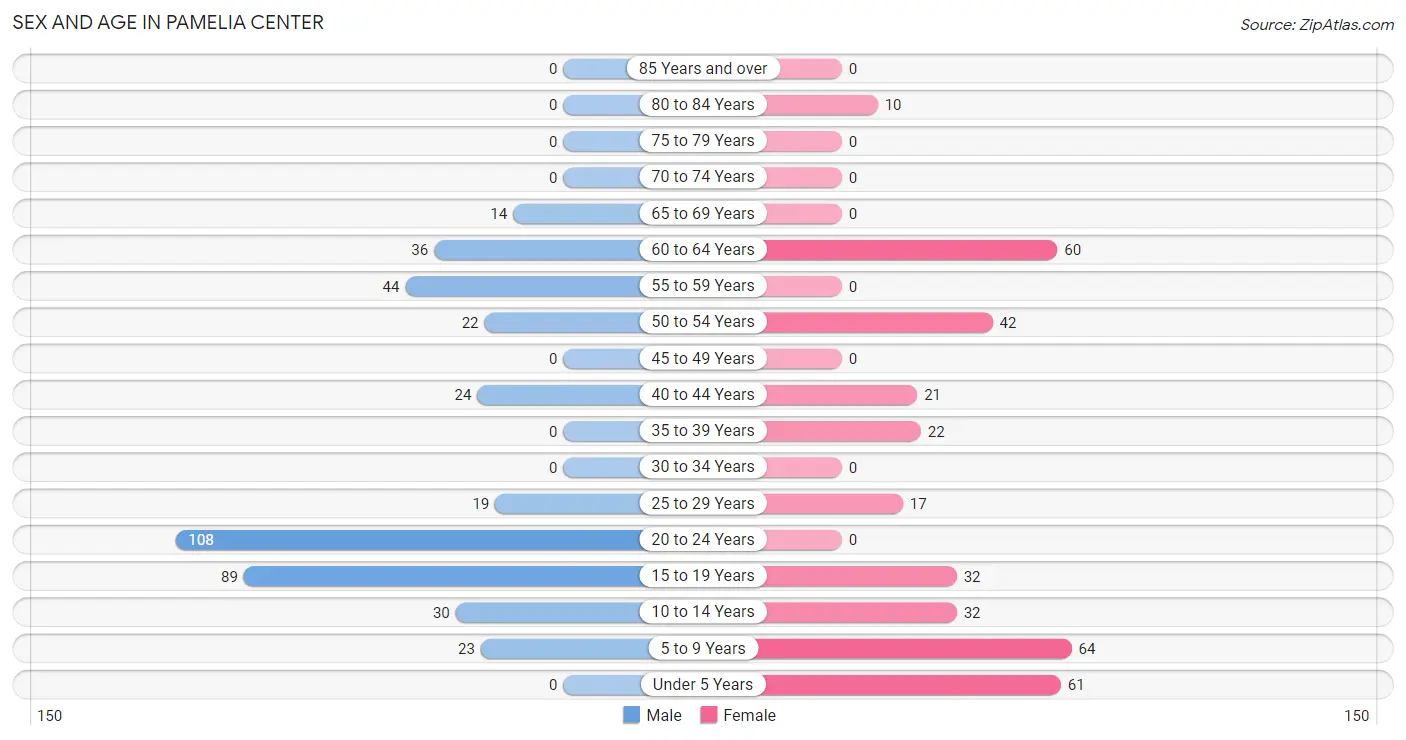
| Age Bracket | Male | Female |
| Under 5 Years | 0 (0.0%) | 61 (16.9%) |
| 5 to 9 Years | 23 (5.6%) | 64 (17.7%) |
| 10 to 14 Years | 30 (7.3%) | 32 (8.9%) |
| 15 to 19 Years | 89 (21.8%) | 32 (8.9%) |
| 20 to 24 Years | 108 (26.4%) | 0 (0.0%) |
| 25 to 29 Years | 19 (4.6%) | 17 (4.7%) |
| 30 to 34 Years | 0 (0.0%) | 0 (0.0%) |
| 35 to 39 Years | 0 (0.0%) | 22 (6.1%) |
| 40 to 44 Years | 24 (5.9%) | 21 (5.8%) |
| 45 to 49 Years | 0 (0.0%) | 0 (0.0%) |
| 50 to 54 Years | 22 (5.4%) | 42 (11.6%) |
| 55 to 59 Years | 44 (10.8%) | 0 (0.0%) |
| 60 to 64 Years | 36 (8.8%) | 60 (16.6%) |
| 65 to 69 Years | 14 (3.4%) | 0 (0.0%) |
| 70 to 74 Years | 0 (0.0%) | 0 (0.0%) |
| 75 to 79 Years | 0 (0.0%) | 0 (0.0%) |
| 80 to 84 Years | 0 (0.0%) | 10 (2.8%) |
| 85 Years and over | 0 (0.0%) | 0 (0.0%) |
| Total | 409 (100.0%) | 361 (100.0%) |
Families and Households in Pamelia Center
Median Family Size in Pamelia Center
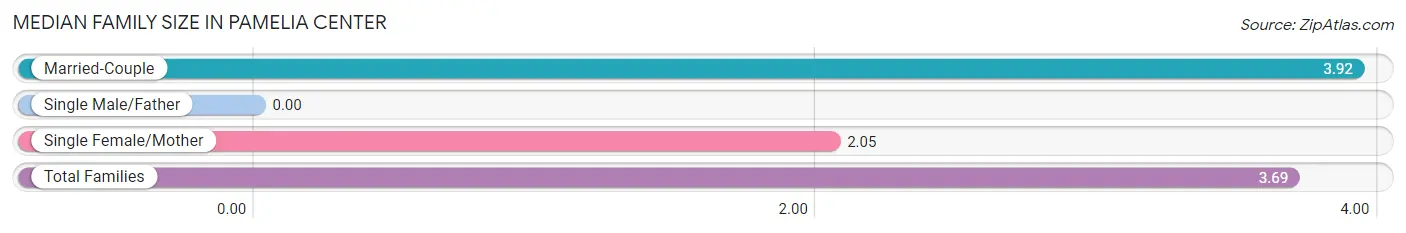
| Family Type | # Families | Family Size |
| Married-Couple | 153 (87.4%) | 3.92 |
| Single Male/Father | 0 (0.0%) | - |
| Single Female/Mother | 22 (12.6%) | 2.05 |
| Total Families | 175 (100.0%) | 3.69 |
Median Household Size in Pamelia Center
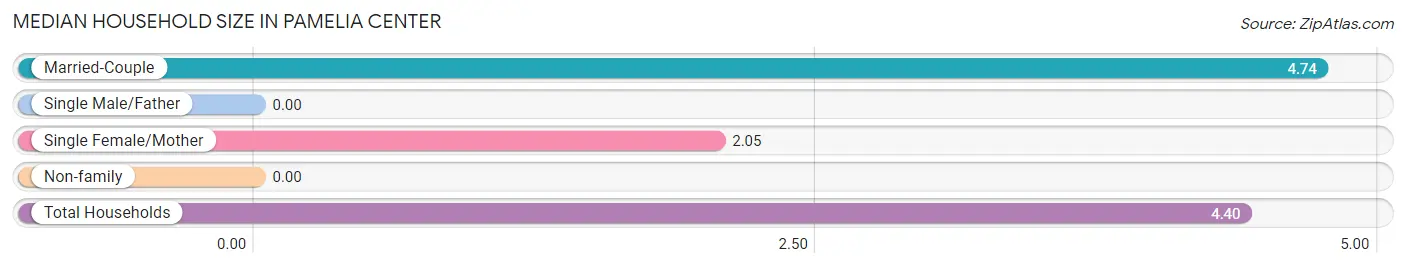
| Household Type | # Households | Household Size |
| Married-Couple | 153 (87.4%) | 4.74 |
| Single Male/Father | 0 (0.0%) | - |
| Single Female/Mother | 22 (12.6%) | 2.05 |
| Non-family | 0 (0.0%) | - |
| Total Households | 175 (100.0%) | 4.40 |
Household Size by Marriage Status in Pamelia Center
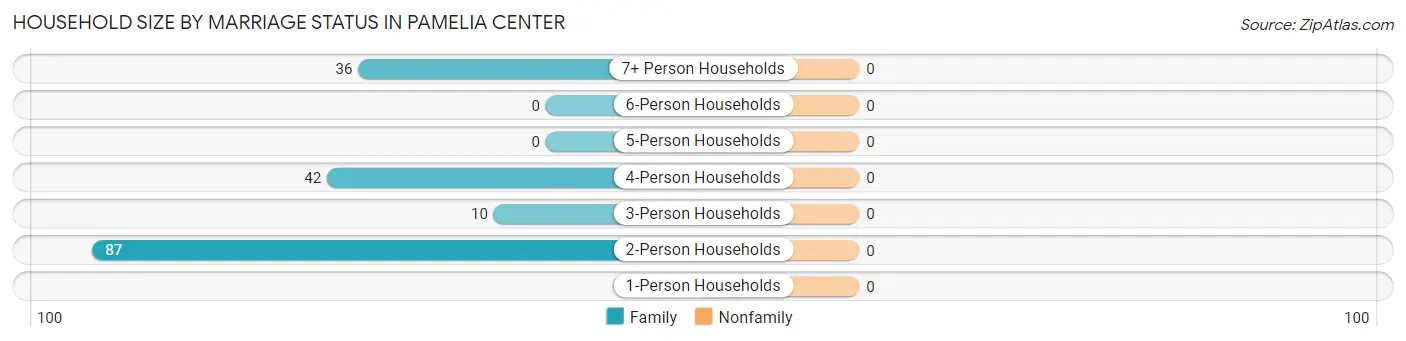
| Household Size | Family Households | Nonfamily Households |
| 1-Person Households | - | 0 (0.0%) |
| 2-Person Households | 87 (49.7%) | 0 (0.0%) |
| 3-Person Households | 10 (5.7%) | 0 (0.0%) |
| 4-Person Households | 42 (24.0%) | 0 (0.0%) |
| 5-Person Households | 0 (0.0%) | 0 (0.0%) |
| 6-Person Households | 0 (0.0%) | 0 (0.0%) |
| 7+ Person Households | 36 (20.6%) | 0 (0.0%) |
| Total | 175 (100.0%) | 0 (0.0%) |
Female Fertility in Pamelia Center
Fertility by Age in Pamelia Center
| Age Bracket | Women with Births | Births / 1,000 Women |
| 15 to 19 years | 0 (0.0%) | 0.0 |
| 20 to 34 years | 0 (0.0%) | 0.0 |
| 35 to 50 years | 0 (0.0%) | 0.0 |
| Total | 0 (0.0%) | 0.0 |
Fertility by Age by Marriage Status in Pamelia Center
| Age Bracket | Married | Unmarried |
| 15 to 19 years | 0 (0.0%) | 0 (0.0%) |
| 20 to 34 years | 0 (0.0%) | 0 (0.0%) |
| 35 to 50 years | 0 (0.0%) | 0 (0.0%) |
| Total | 0 (0.0%) | 0 (0.0%) |
Fertility by Education in Pamelia Center
| Educational Attainment | Women with Births | Births / 1,000 Women |
| Less than High School | 0 (0.0%) | 0.0 |
| High School Diploma | 0 (0.0%) | 0.0 |
| College or Associate's Degree | 0 (0.0%) | 0.0 |
| Bachelor's Degree | 0 (0.0%) | 0.0 |
| Graduate Degree | 0 (0.0%) | 0.0 |
| Total | 0 (0.0%) | 0.0 |
Fertility by Education by Marriage Status in Pamelia Center
| Educational Attainment | Married | Unmarried |
| Less than High School | 0 (0.0%) | 0 (0.0%) |
| High School Diploma | 0 (0.0%) | 0 (0.0%) |
| College or Associate's Degree | 0 (0.0%) | 0 (0.0%) |
| Bachelor's Degree | 0 (0.0%) | 0 (0.0%) |
| Graduate Degree | 0 (0.0%) | 0 (0.0%) |
| Total | 0 (0.0%) | 0 (0.0%) |
Employment Characteristics in Pamelia Center
Employment by Class of Employer in Pamelia Center
Among the 250 employed individuals in Pamelia Center, private company employees (160 | 64.0%), not-for-profit organizations (49 | 19.6%), and local government employees (22 | 8.8%) make up the most common classes of employment.
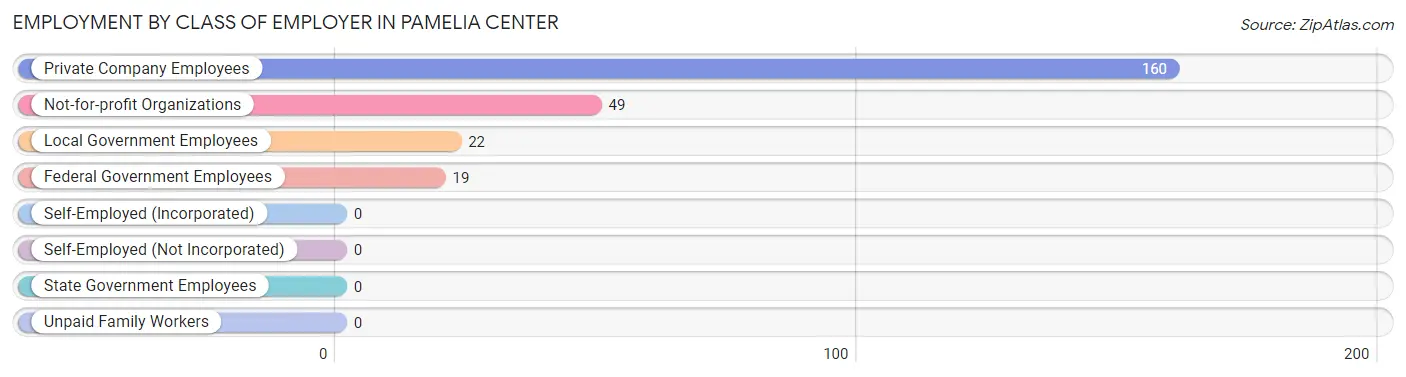
| Employer Class | # Employees | % Employees |
| Private Company Employees | 160 | 64.0% |
| Self-Employed (Incorporated) | 0 | 0.0% |
| Self-Employed (Not Incorporated) | 0 | 0.0% |
| Not-for-profit Organizations | 49 | 19.6% |
| Local Government Employees | 22 | 8.8% |
| State Government Employees | 0 | 0.0% |
| Federal Government Employees | 19 | 7.6% |
| Unpaid Family Workers | 0 | 0.0% |
| Total | 250 | 100.0% |
Employment Status by Age in Pamelia Center
According to the labor force statistics for Pamelia Center, out of the total population over 16 years of age (560), 50.4% or 282 individuals are in the labor force, with 12.2% or 34 of them unemployed. The age group with the highest labor force participation rate is 45 to 54 years, with 100.0% or 64 individuals in the labor force. Within the labor force, the 16 to 19 years age range has the highest percentage of unemployed individuals, with 51.6% or 32 of them being unemployed.
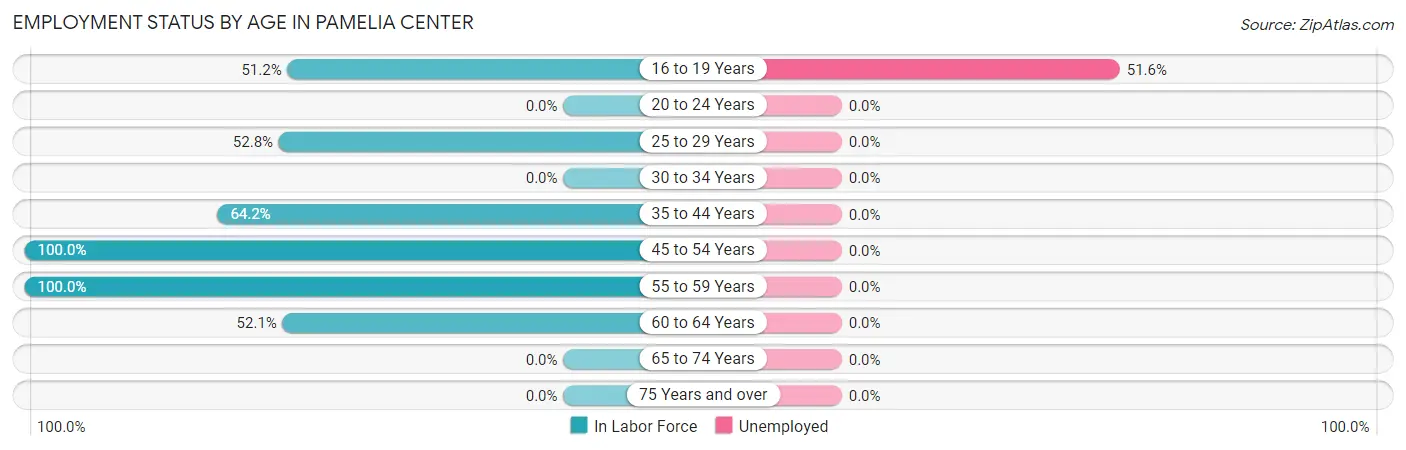
| Age Bracket | In Labor Force | Unemployed |
| 16 to 19 Years | 62 (51.2%) | 32 (51.6%) |
| 20 to 24 Years | 0 (0.0%) | 0 (0.0%) |
| 25 to 29 Years | 19 (52.8%) | 0 (0.0%) |
| 30 to 34 Years | 0 (0.0%) | 0 (0.0%) |
| 35 to 44 Years | 43 (64.2%) | 0 (0.0%) |
| 45 to 54 Years | 64 (100.0%) | 0 (0.0%) |
| 55 to 59 Years | 44 (100.0%) | 0 (0.0%) |
| 60 to 64 Years | 50 (52.1%) | 0 (0.0%) |
| 65 to 74 Years | 0 (0.0%) | 0 (0.0%) |
| 75 Years and over | 0 (0.0%) | 0 (0.0%) |
| Total | 282 (50.4%) | 34 (12.2%) |
Employment Status by Educational Attainment in Pamelia Center
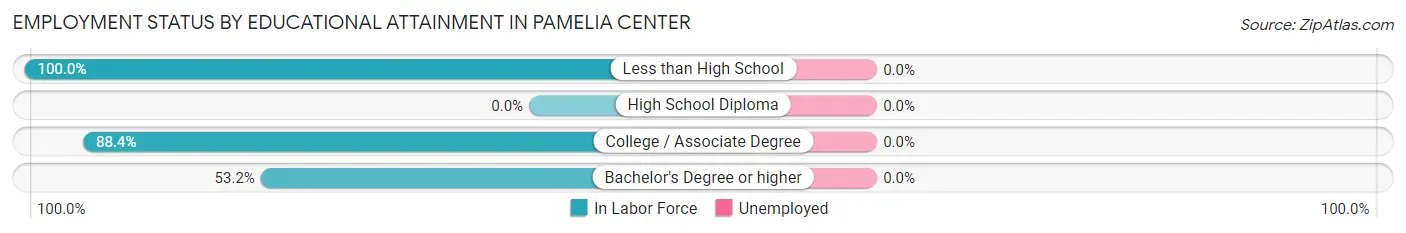
| Educational Attainment | In Labor Force | Unemployed |
| Less than High School | 50 (100.0%) | 0 (0.0%) |
| High School Diploma | 0 (0.0%) | 0 (0.0%) |
| College / Associate Degree | 129 (88.4%) | 0 (0.0%) |
| Bachelor's Degree or higher | 41 (53.2%) | 0 (0.0%) |
| Total | 220 (71.7%) | 0 (0.0%) |
Employment Occupations by Sex in Pamelia Center
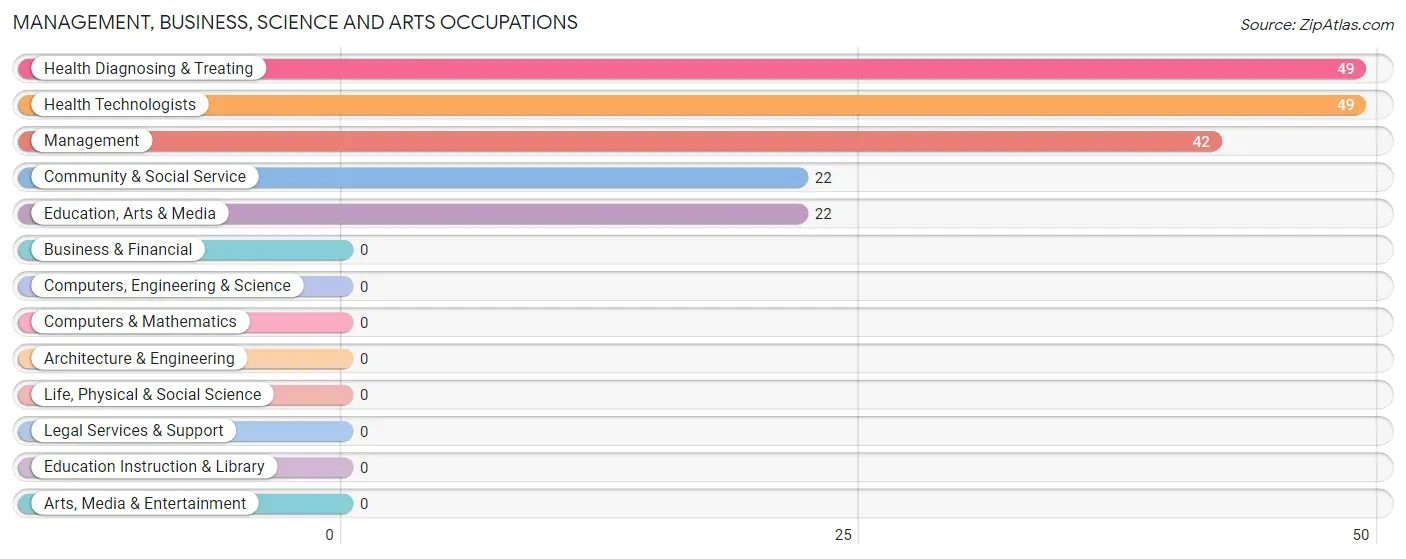
Management, Business, Science and Arts Occupations
The most common Management, Business, Science and Arts occupations in Pamelia Center are Health Diagnosing & Treating (49 | 21.2%), Health Technologists (49 | 21.2%), Management (42 | 18.2%), Community & Social Service (22 | 9.5%), and Education, Arts & Media (22 | 9.5%).
Management, Business, Science and Arts Occupations by Sex
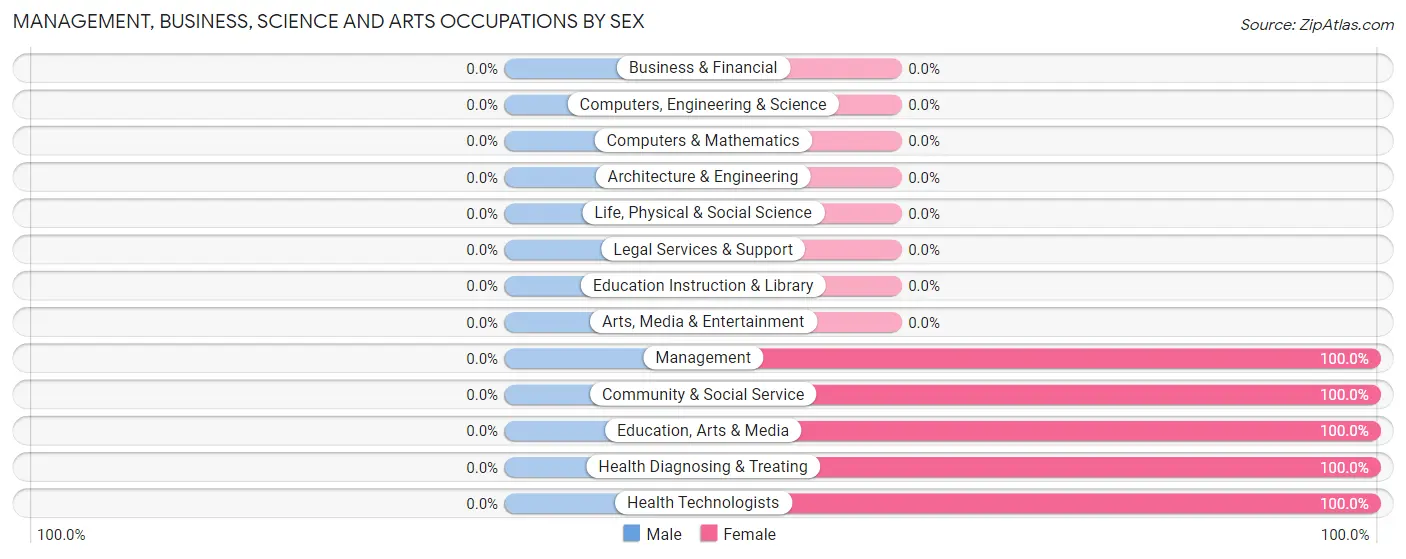
| Occupation | Male | Female |
| Management | 0 (0.0%) | 42 (100.0%) |
| Business & Financial | 0 (0.0%) | 0 (0.0%) |
| Computers, Engineering & Science | 0 (0.0%) | 0 (0.0%) |
| Computers & Mathematics | 0 (0.0%) | 0 (0.0%) |
| Architecture & Engineering | 0 (0.0%) | 0 (0.0%) |
| Life, Physical & Social Science | 0 (0.0%) | 0 (0.0%) |
| Community & Social Service | 0 (0.0%) | 22 (100.0%) |
| Education, Arts & Media | 0 (0.0%) | 22 (100.0%) |
| Legal Services & Support | 0 (0.0%) | 0 (0.0%) |
| Education Instruction & Library | 0 (0.0%) | 0 (0.0%) |
| Arts, Media & Entertainment | 0 (0.0%) | 0 (0.0%) |
| Health Diagnosing & Treating | 0 (0.0%) | 49 (100.0%) |
| Health Technologists | 0 (0.0%) | 49 (100.0%) |
| Total (Category) | 0 (0.0%) | 113 (100.0%) |
| Total (Overall) | 96 (41.6%) | 135 (58.4%) |
Services Occupations
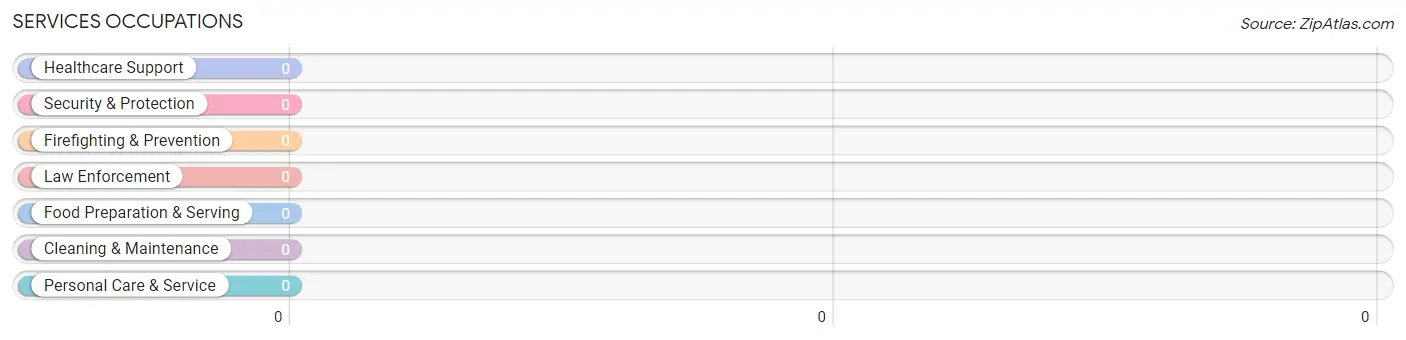
Services Occupations by Sex
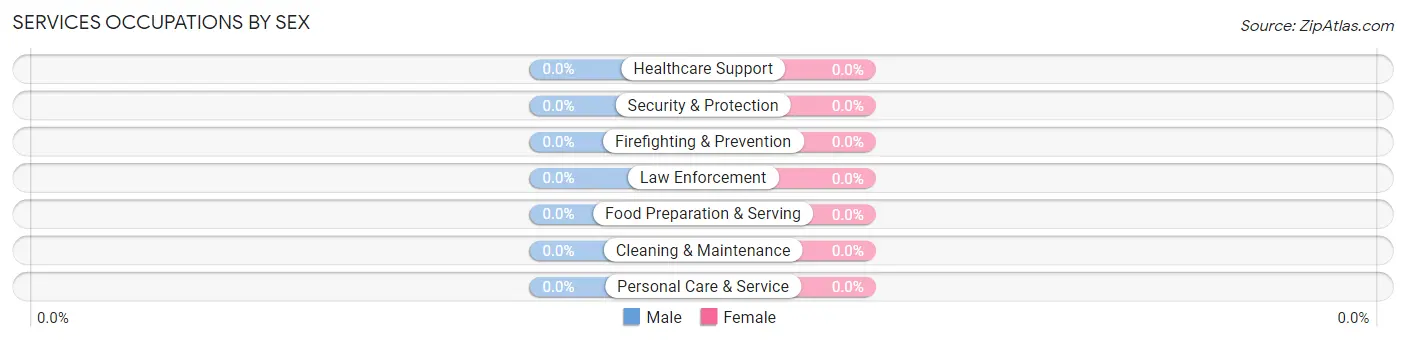
| Occupation | Male | Female |
| Healthcare Support | 0 (0.0%) | 0 (0.0%) |
| Security & Protection | 0 (0.0%) | 0 (0.0%) |
| Firefighting & Prevention | 0 (0.0%) | 0 (0.0%) |
| Law Enforcement | 0 (0.0%) | 0 (0.0%) |
| Food Preparation & Serving | 0 (0.0%) | 0 (0.0%) |
| Cleaning & Maintenance | 0 (0.0%) | 0 (0.0%) |
| Personal Care & Service | 0 (0.0%) | 0 (0.0%) |
| Total (Category) | 0 (0.0%) | 0 (0.0%) |
| Total (Overall) | 96 (41.6%) | 135 (58.4%) |
Sales and Office Occupations
The most common Sales and Office occupations in Pamelia Center are Sales & Related (74 | 32.0%), and Office & Administration (44 | 19.1%).
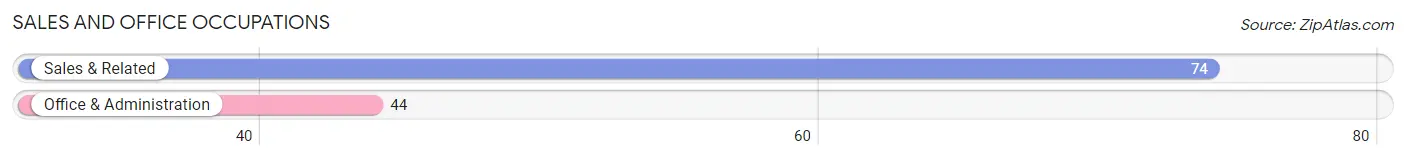
Sales and Office Occupations by Sex
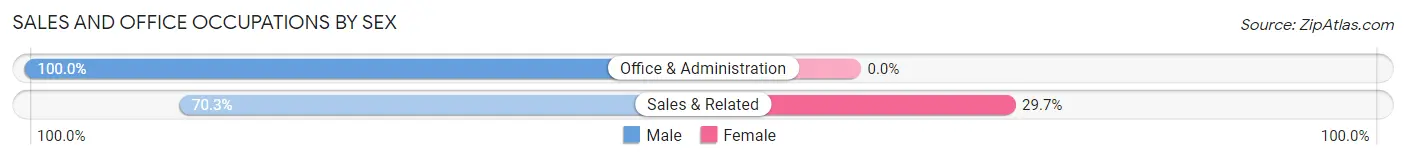
| Occupation | Male | Female |
| Sales & Related | 52 (70.3%) | 22 (29.7%) |
| Office & Administration | 44 (100.0%) | 0 (0.0%) |
| Total (Category) | 96 (81.4%) | 22 (18.6%) |
| Total (Overall) | 96 (41.6%) | 135 (58.4%) |
Natural Resources, Construction and Maintenance Occupations
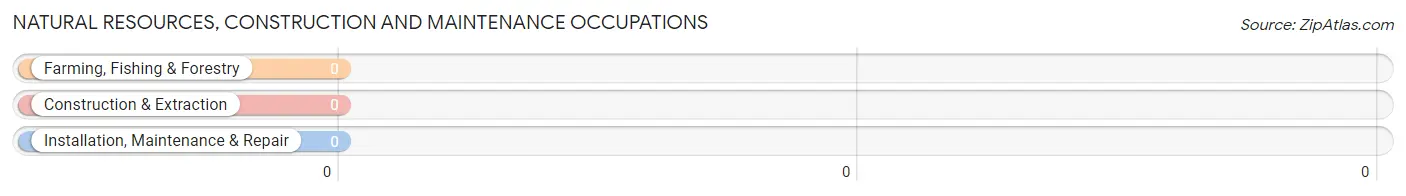
Natural Resources, Construction and Maintenance Occupations by Sex
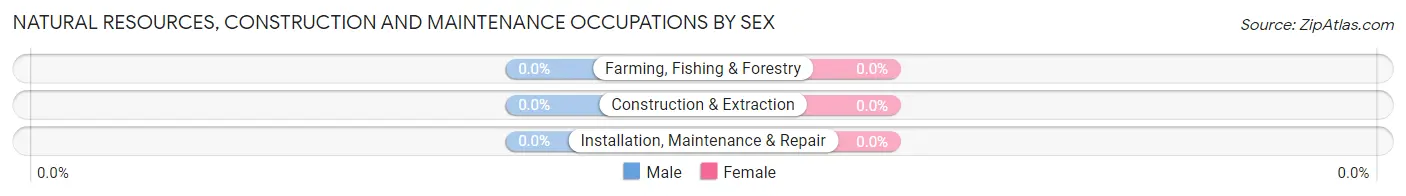
| Occupation | Male | Female |
| Farming, Fishing & Forestry | 0 (0.0%) | 0 (0.0%) |
| Construction & Extraction | 0 (0.0%) | 0 (0.0%) |
| Installation, Maintenance & Repair | 0 (0.0%) | 0 (0.0%) |
| Total (Category) | 0 (0.0%) | 0 (0.0%) |
| Total (Overall) | 96 (41.6%) | 135 (58.4%) |
Production, Transportation and Moving Occupations
Production, Transportation and Moving Occupations by Sex
| Occupation | Male | Female |
| Production | 0 (0.0%) | 0 (0.0%) |
| Transportation | 0 (0.0%) | 0 (0.0%) |
| Material Moving | 0 (0.0%) | 0 (0.0%) |
| Total (Category) | 0 (0.0%) | 0 (0.0%) |
| Total (Overall) | 96 (41.6%) | 135 (58.4%) |
Employment Industries by Sex in Pamelia Center
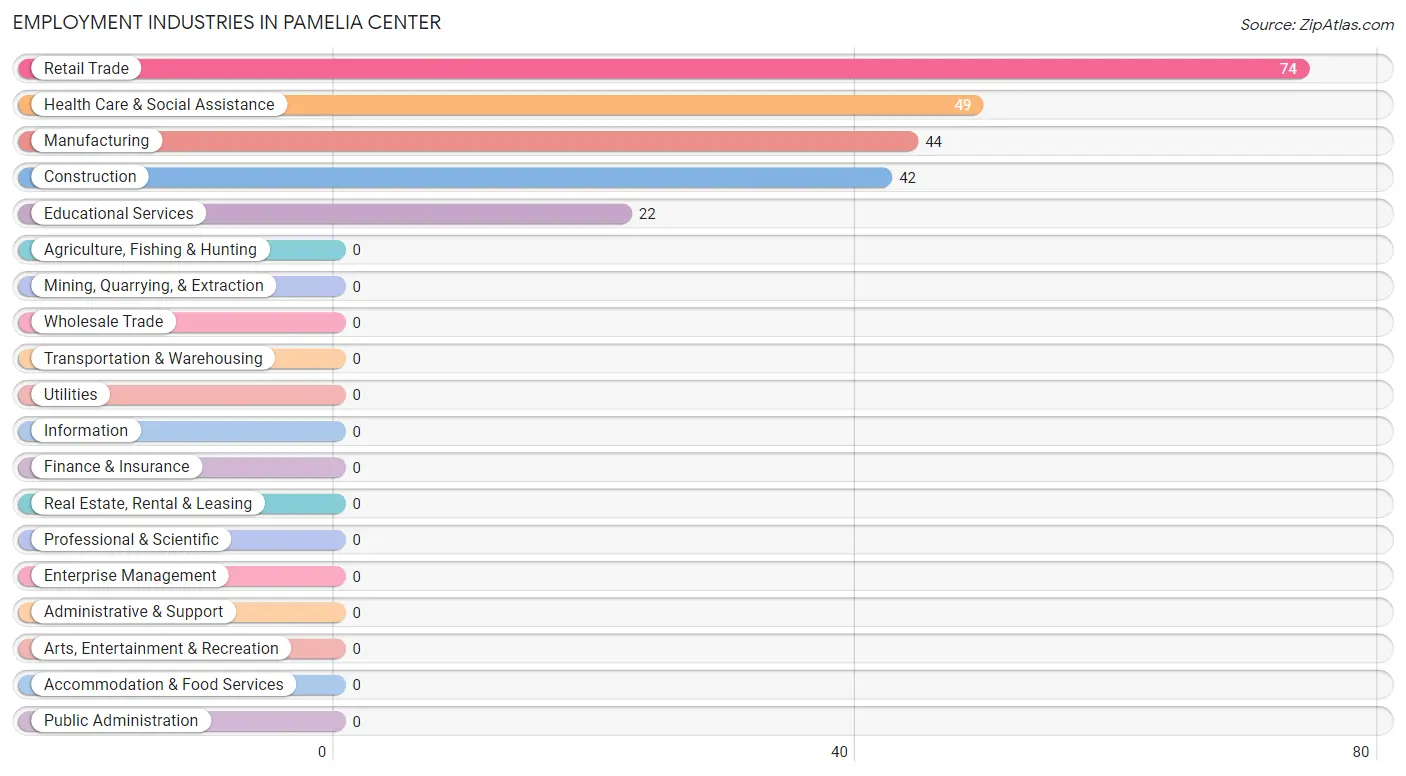
Employment Industries in Pamelia Center
The major employment industries in Pamelia Center include Retail Trade (74 | 32.0%), Health Care & Social Assistance (49 | 21.2%), Manufacturing (44 | 19.1%), Construction (42 | 18.2%), and Educational Services (22 | 9.5%).
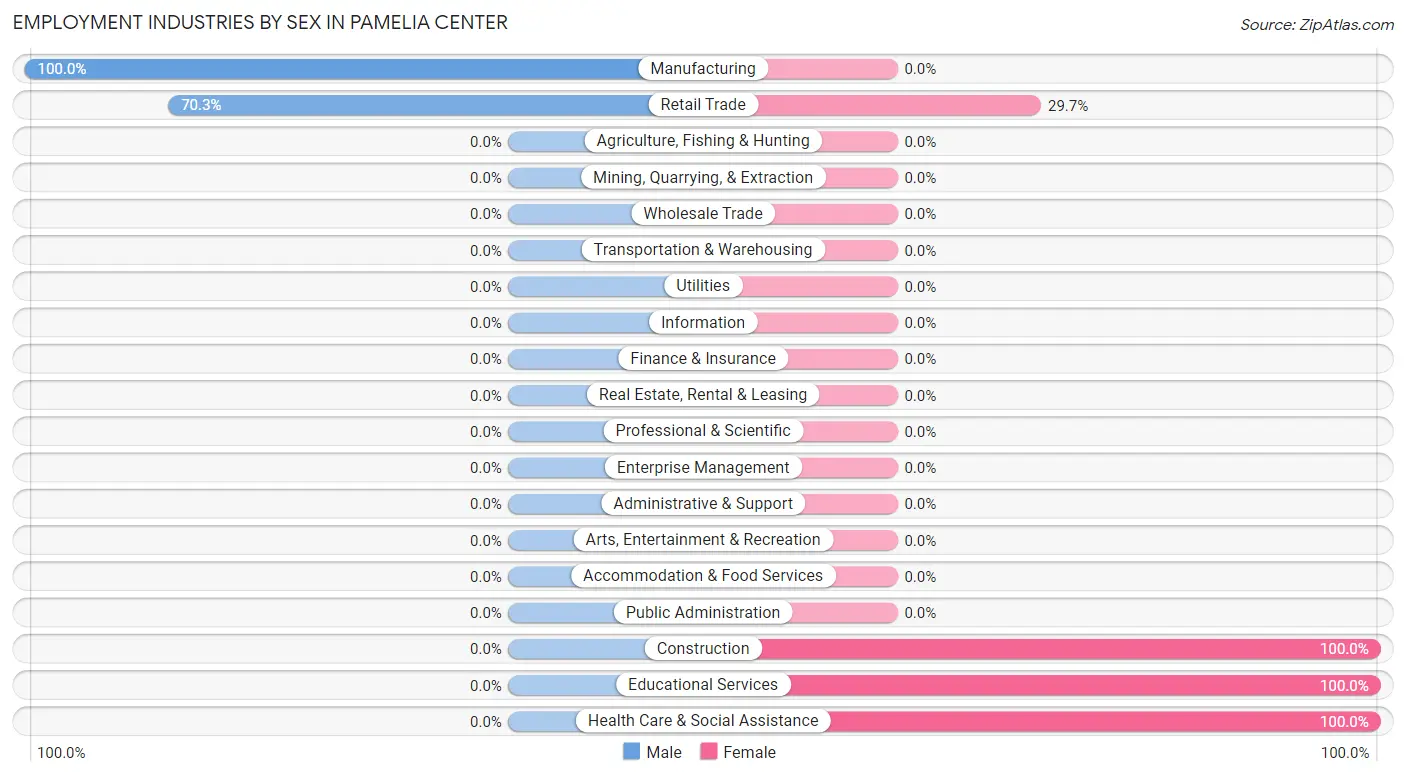
Employment Industries by Sex in Pamelia Center
The Pamelia Center industries that see more men than women are Manufacturing (100.0%), and Retail Trade (70.3%), whereas the industries that tend to have a higher number of women are Construction (100.0%), Educational Services (100.0%), and Health Care & Social Assistance (100.0%).
| Industry | Male | Female |
| Agriculture, Fishing & Hunting | 0 (0.0%) | 0 (0.0%) |
| Mining, Quarrying, & Extraction | 0 (0.0%) | 0 (0.0%) |
| Construction | 0 (0.0%) | 42 (100.0%) |
| Manufacturing | 44 (100.0%) | 0 (0.0%) |
| Wholesale Trade | 0 (0.0%) | 0 (0.0%) |
| Retail Trade | 52 (70.3%) | 22 (29.7%) |
| Transportation & Warehousing | 0 (0.0%) | 0 (0.0%) |
| Utilities | 0 (0.0%) | 0 (0.0%) |
| Information | 0 (0.0%) | 0 (0.0%) |
| Finance & Insurance | 0 (0.0%) | 0 (0.0%) |
| Real Estate, Rental & Leasing | 0 (0.0%) | 0 (0.0%) |
| Professional & Scientific | 0 (0.0%) | 0 (0.0%) |
| Enterprise Management | 0 (0.0%) | 0 (0.0%) |
| Administrative & Support | 0 (0.0%) | 0 (0.0%) |
| Educational Services | 0 (0.0%) | 22 (100.0%) |
| Health Care & Social Assistance | 0 (0.0%) | 49 (100.0%) |
| Arts, Entertainment & Recreation | 0 (0.0%) | 0 (0.0%) |
| Accommodation & Food Services | 0 (0.0%) | 0 (0.0%) |
| Public Administration | 0 (0.0%) | 0 (0.0%) |
| Total | 96 (41.6%) | 135 (58.4%) |
Education in Pamelia Center
School Enrollment in Pamelia Center
The most common levels of schooling among the 365 students in Pamelia Center are college / undergraduate (125 | 34.3%), high school (91 | 24.9%), and middle school (62 | 17.0%).
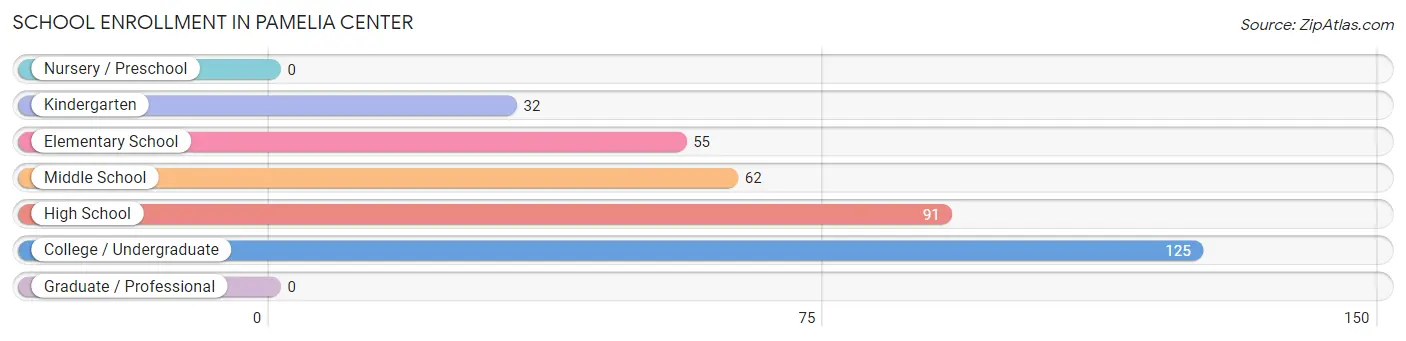
| School Level | # Students | % Students |
| Nursery / Preschool | 0 | 0.0% |
| Kindergarten | 32 | 8.8% |
| Elementary School | 55 | 15.1% |
| Middle School | 62 | 17.0% |
| High School | 91 | 24.9% |
| College / Undergraduate | 125 | 34.3% |
| Graduate / Professional | 0 | 0.0% |
| Total | 365 | 100.0% |
School Enrollment by Age by Funding Source in Pamelia Center
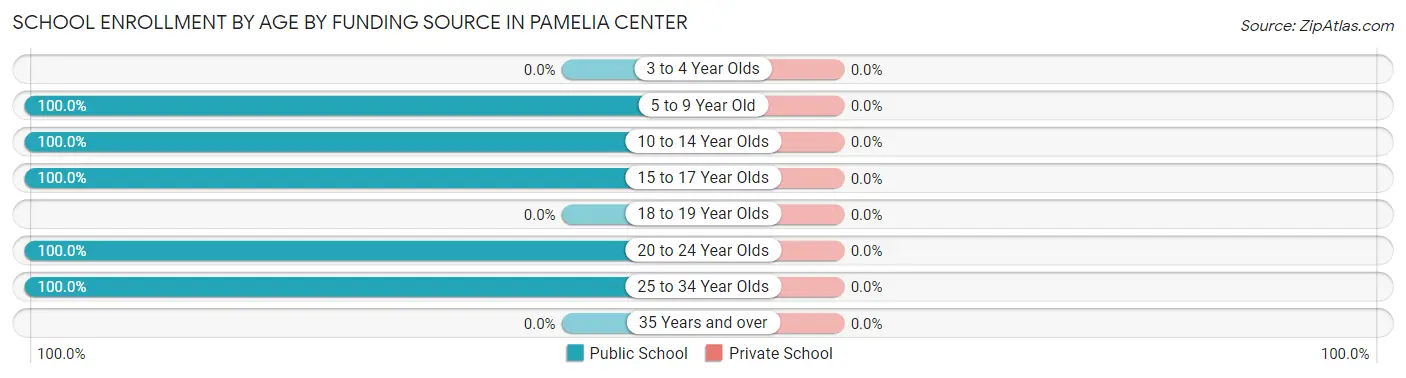
| Age Bracket | Public School | Private School |
| 3 to 4 Year Olds | 0 (0.0%) | 0 (0.0%) |
| 5 to 9 Year Old | 87 (100.0%) | 0 (0.0%) |
| 10 to 14 Year Olds | 62 (100.0%) | 0 (0.0%) |
| 15 to 17 Year Olds | 91 (100.0%) | 0 (0.0%) |
| 18 to 19 Year Olds | 0 (0.0%) | 0 (0.0%) |
| 20 to 24 Year Olds | 108 (100.0%) | 0 (0.0%) |
| 25 to 34 Year Olds | 17 (100.0%) | 0 (0.0%) |
| 35 Years and over | 0 (0.0%) | 0 (0.0%) |
| Total | 365 (100.0%) | 0 (0.0%) |
Educational Attainment by Field of Study in Pamelia Center
Physical & health sciences (55 | 71.4%), and psychology (22 | 28.6%) are the most common fields of study among 77 individuals in Pamelia Center who have obtained a bachelor's degree or higher.
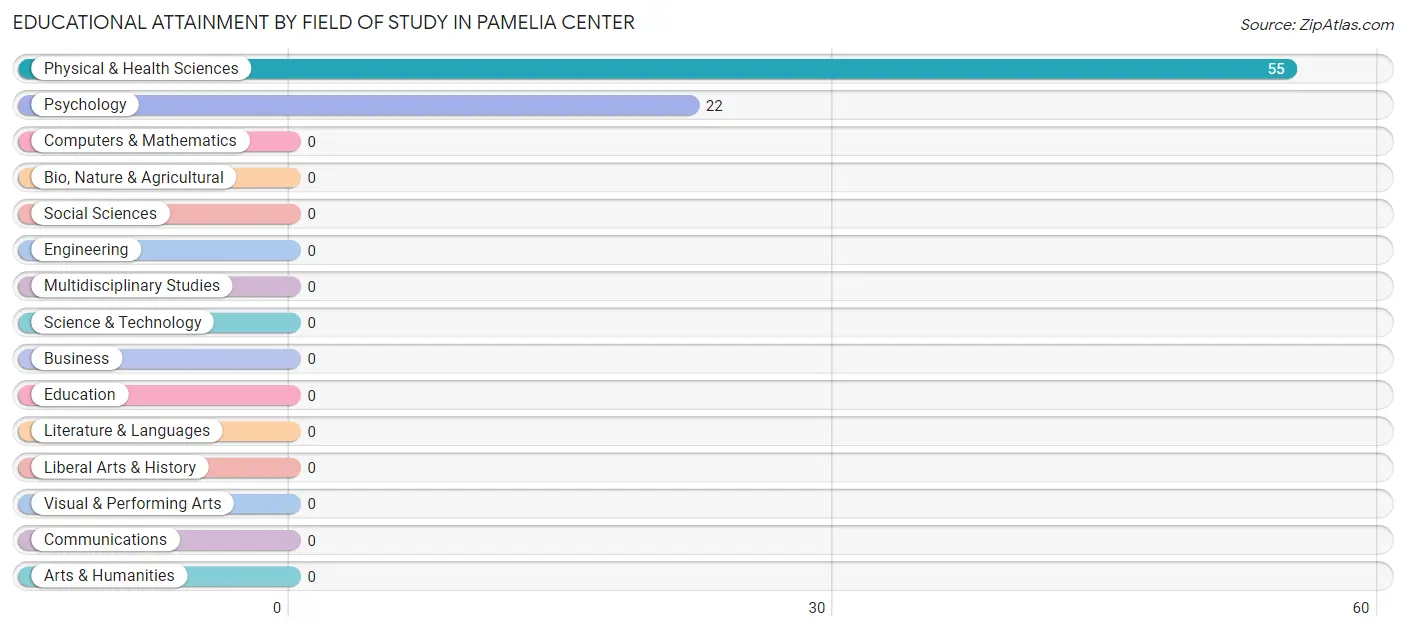
| Field of Study | # Graduates | % Graduates |
| Computers & Mathematics | 0 | 0.0% |
| Bio, Nature & Agricultural | 0 | 0.0% |
| Physical & Health Sciences | 55 | 71.4% |
| Psychology | 22 | 28.6% |
| Social Sciences | 0 | 0.0% |
| Engineering | 0 | 0.0% |
| Multidisciplinary Studies | 0 | 0.0% |
| Science & Technology | 0 | 0.0% |
| Business | 0 | 0.0% |
| Education | 0 | 0.0% |
| Literature & Languages | 0 | 0.0% |
| Liberal Arts & History | 0 | 0.0% |
| Visual & Performing Arts | 0 | 0.0% |
| Communications | 0 | 0.0% |
| Arts & Humanities | 0 | 0.0% |
| Total | 77 | 100.0% |
Transportation & Commute in Pamelia Center
Vehicle Availability by Sex in Pamelia Center
The most prevalent vehicle ownership categories in Pamelia Center are males with 3 vehicles (66, accounting for 57.4%) and females with 3 vehicles (64, making up 48.9%).
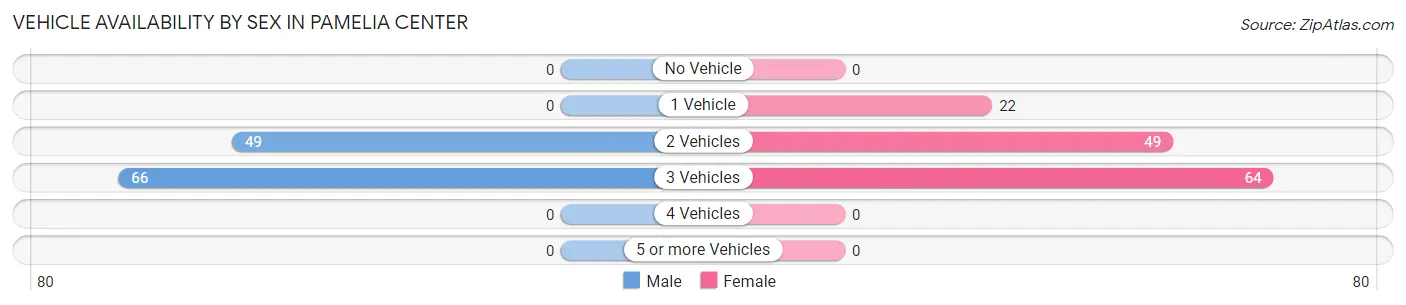
| Vehicles Available | Male | Female |
| No Vehicle | 0 (0.0%) | 0 (0.0%) |
| 1 Vehicle | 0 (0.0%) | 22 (16.3%) |
| 2 Vehicles | 49 (42.6%) | 49 (36.3%) |
| 3 Vehicles | 66 (57.4%) | 64 (47.4%) |
| 4 Vehicles | 0 (0.0%) | 0 (0.0%) |
| 5 or more Vehicles | 0 (0.0%) | 0 (0.0%) |
| Total | 115 (100.0%) | 135 (100.0%) |
Commute Time in Pamelia Center
The most frequently occuring commute durations in Pamelia Center are 20 to 24 minutes (80 commuters, 32.0%), 5 to 9 minutes (66 commuters, 26.4%), and less than 5 minutes (42 commuters, 16.8%).
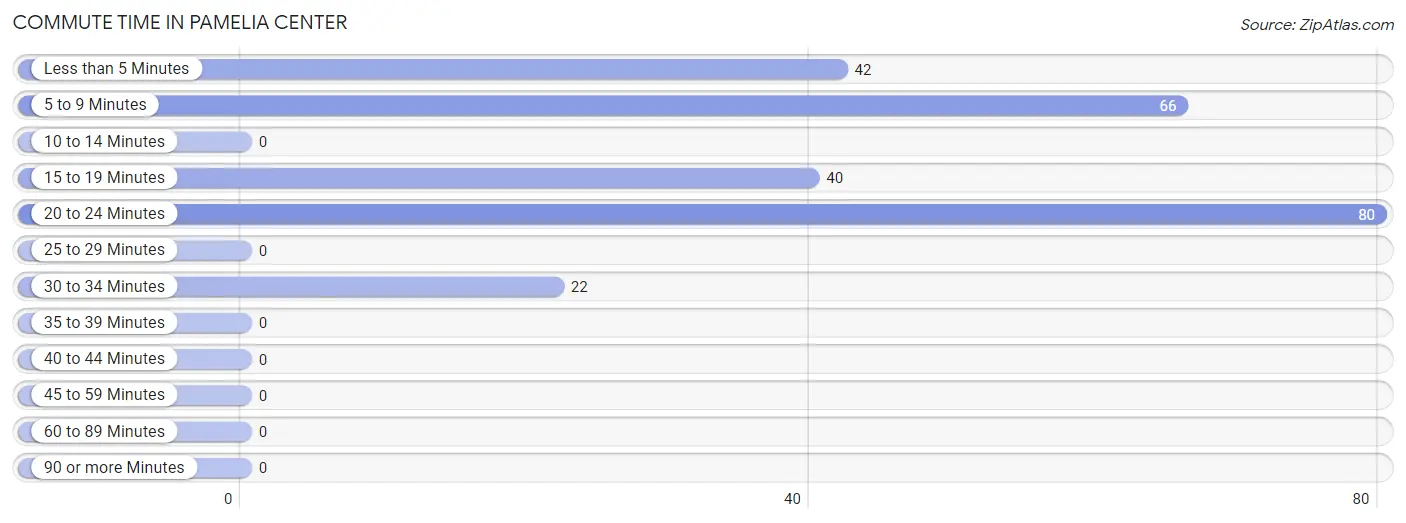
| Commute Time | # Commuters | % Commuters |
| Less than 5 Minutes | 42 | 16.8% |
| 5 to 9 Minutes | 66 | 26.4% |
| 10 to 14 Minutes | 0 | 0.0% |
| 15 to 19 Minutes | 40 | 16.0% |
| 20 to 24 Minutes | 80 | 32.0% |
| 25 to 29 Minutes | 0 | 0.0% |
| 30 to 34 Minutes | 22 | 8.8% |
| 35 to 39 Minutes | 0 | 0.0% |
| 40 to 44 Minutes | 0 | 0.0% |
| 45 to 59 Minutes | 0 | 0.0% |
| 60 to 89 Minutes | 0 | 0.0% |
| 90 or more Minutes | 0 | 0.0% |
Commute Time by Sex in Pamelia Center
The most common commute times in Pamelia Center are 20 to 24 minutes (52 commuters, 45.2%) for males and less than 5 minutes (42 commuters, 31.1%) for females.
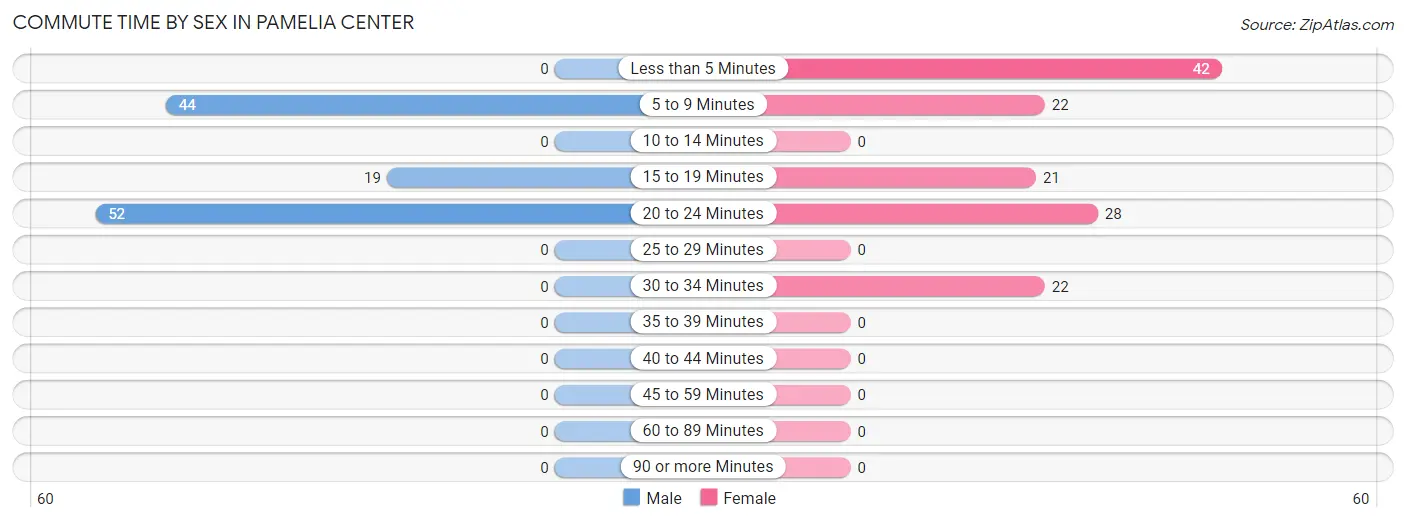
| Commute Time | Male | Female |
| Less than 5 Minutes | 0 (0.0%) | 42 (31.1%) |
| 5 to 9 Minutes | 44 (38.3%) | 22 (16.3%) |
| 10 to 14 Minutes | 0 (0.0%) | 0 (0.0%) |
| 15 to 19 Minutes | 19 (16.5%) | 21 (15.6%) |
| 20 to 24 Minutes | 52 (45.2%) | 28 (20.7%) |
| 25 to 29 Minutes | 0 (0.0%) | 0 (0.0%) |
| 30 to 34 Minutes | 0 (0.0%) | 22 (16.3%) |
| 35 to 39 Minutes | 0 (0.0%) | 0 (0.0%) |
| 40 to 44 Minutes | 0 (0.0%) | 0 (0.0%) |
| 45 to 59 Minutes | 0 (0.0%) | 0 (0.0%) |
| 60 to 89 Minutes | 0 (0.0%) | 0 (0.0%) |
| 90 or more Minutes | 0 (0.0%) | 0 (0.0%) |
Time of Departure to Work by Sex in Pamelia Center
The most frequent times of departure to work in Pamelia Center are 8:00 AM to 8:29 AM (44, 38.3%) for males and 7:30 AM to 7:59 AM (50, 37.0%) for females.
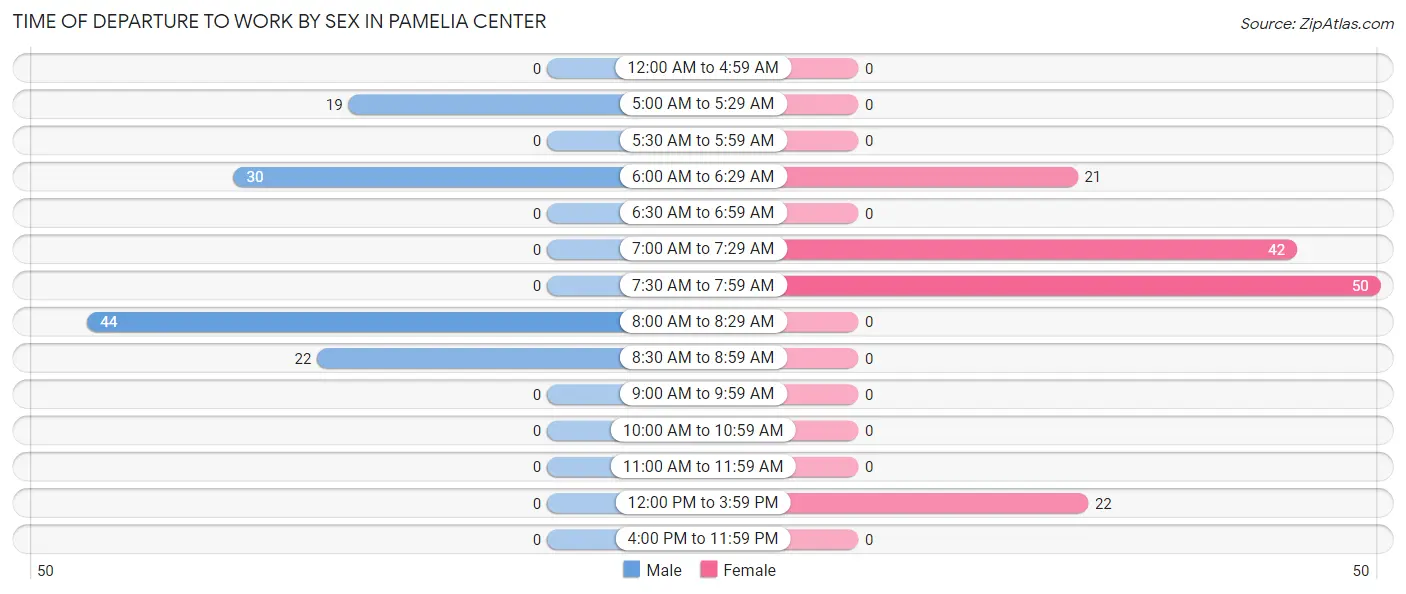
| Time of Departure | Male | Female |
| 12:00 AM to 4:59 AM | 0 (0.0%) | 0 (0.0%) |
| 5:00 AM to 5:29 AM | 19 (16.5%) | 0 (0.0%) |
| 5:30 AM to 5:59 AM | 0 (0.0%) | 0 (0.0%) |
| 6:00 AM to 6:29 AM | 30 (26.1%) | 21 (15.6%) |
| 6:30 AM to 6:59 AM | 0 (0.0%) | 0 (0.0%) |
| 7:00 AM to 7:29 AM | 0 (0.0%) | 42 (31.1%) |
| 7:30 AM to 7:59 AM | 0 (0.0%) | 50 (37.0%) |
| 8:00 AM to 8:29 AM | 44 (38.3%) | 0 (0.0%) |
| 8:30 AM to 8:59 AM | 22 (19.1%) | 0 (0.0%) |
| 9:00 AM to 9:59 AM | 0 (0.0%) | 0 (0.0%) |
| 10:00 AM to 10:59 AM | 0 (0.0%) | 0 (0.0%) |
| 11:00 AM to 11:59 AM | 0 (0.0%) | 0 (0.0%) |
| 12:00 PM to 3:59 PM | 0 (0.0%) | 22 (16.3%) |
| 4:00 PM to 11:59 PM | 0 (0.0%) | 0 (0.0%) |
| Total | 115 (100.0%) | 135 (100.0%) |
Housing Occupancy in Pamelia Center
Occupancy by Ownership in Pamelia Center
Of the total 175 dwellings in Pamelia Center, owner-occupied units account for 175 (100.0%), while renter-occupied units make up 0 (0.0%).
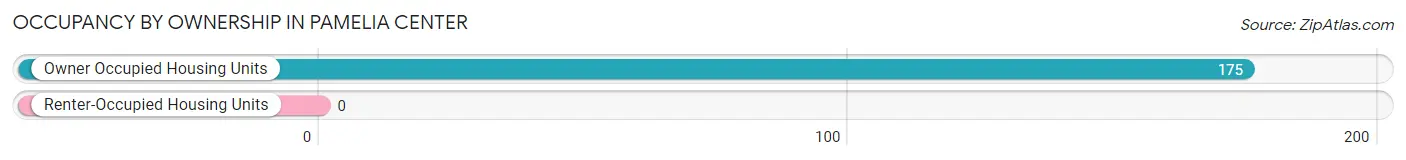
| Occupancy | # Housing Units | % Housing Units |
| Owner Occupied Housing Units | 175 | 100.0% |
| Renter-Occupied Housing Units | 0 | 0.0% |
| Total Occupied Housing Units | 175 | 100.0% |
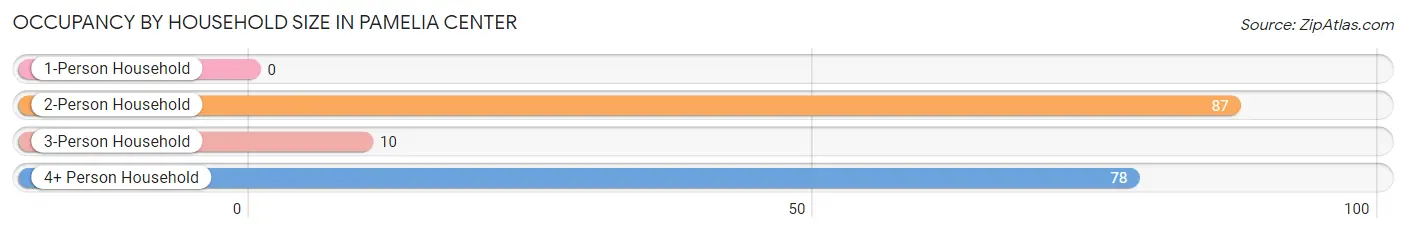
Occupancy by Household Size in Pamelia Center
| Household Size | # Housing Units | % Housing Units |
| 1-Person Household | 0 | 0.0% |
| 2-Person Household | 87 | 49.7% |
| 3-Person Household | 10 | 5.7% |
| 4+ Person Household | 78 | 44.6% |
| Total Housing Units | 175 | 100.0% |
Occupancy by Ownership by Household Size in Pamelia Center
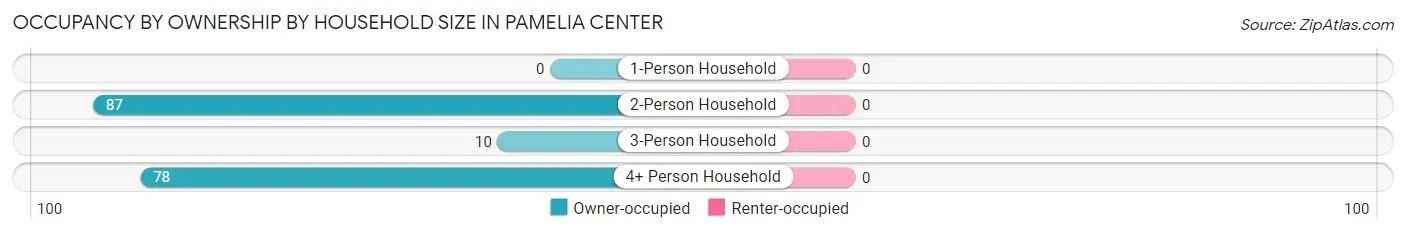
| Household Size | Owner-occupied | Renter-occupied |
| 1-Person Household | 0 (0.0%) | 0 (0.0%) |
| 2-Person Household | 87 (100.0%) | 0 (0.0%) |
| 3-Person Household | 10 (100.0%) | 0 (0.0%) |
| 4+ Person Household | 78 (100.0%) | 0 (0.0%) |
| Total Housing Units | 175 (100.0%) | 0 (0.0%) |
Occupancy by Educational Attainment in Pamelia Center
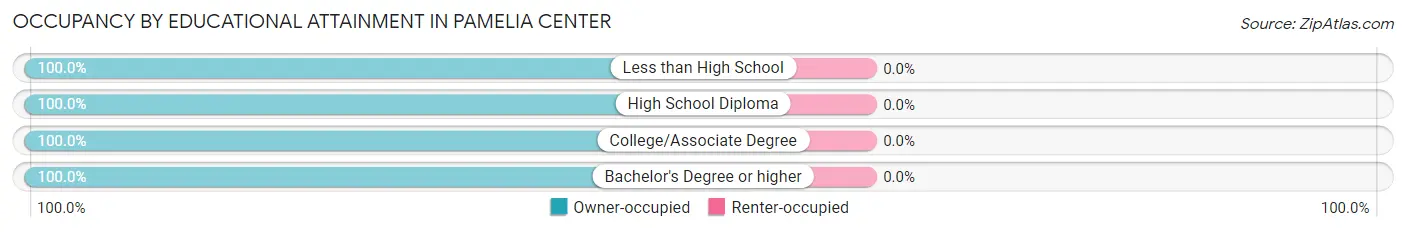
| Household Size | Owner-occupied | Renter-occupied |
| Less than High School | 22 (100.0%) | 0 (0.0%) |
| High School Diploma | 34 (100.0%) | 0 (0.0%) |
| College/Associate Degree | 64 (100.0%) | 0 (0.0%) |
| Bachelor's Degree or higher | 55 (100.0%) | 0 (0.0%) |
Occupancy by Age of Householder in Pamelia Center
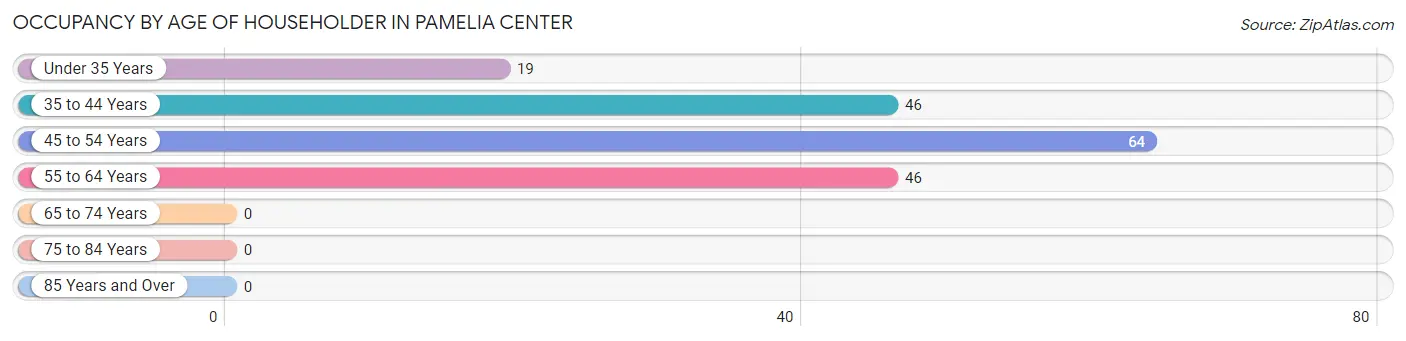
| Age Bracket | # Households | % Households |
| Under 35 Years | 19 | 10.9% |
| 35 to 44 Years | 46 | 26.3% |
| 45 to 54 Years | 64 | 36.6% |
| 55 to 64 Years | 46 | 26.3% |
| 65 to 74 Years | 0 | 0.0% |
| 75 to 84 Years | 0 | 0.0% |
| 85 Years and Over | 0 | 0.0% |
| Total | 175 | 100.0% |
Housing Finances in Pamelia Center
Median Income by Occupancy in Pamelia Center
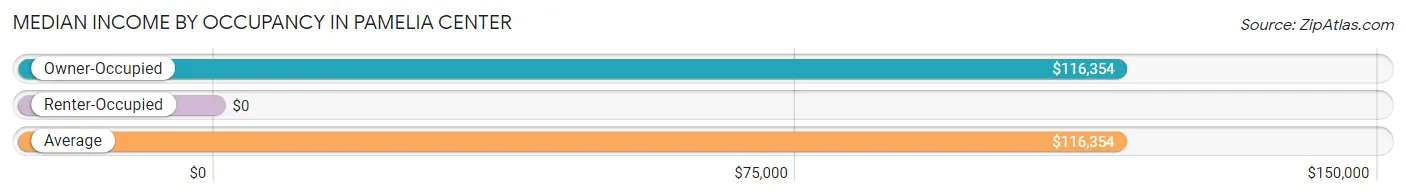
| Occupancy Type | # Households | Median Income |
| Owner-Occupied | 175 (100.0%) | $116,354 |
| Renter-Occupied | 0 (0.0%) | $0 |
| Average | 175 (100.0%) | $116,354 |
Occupancy by Householder Income Bracket in Pamelia Center
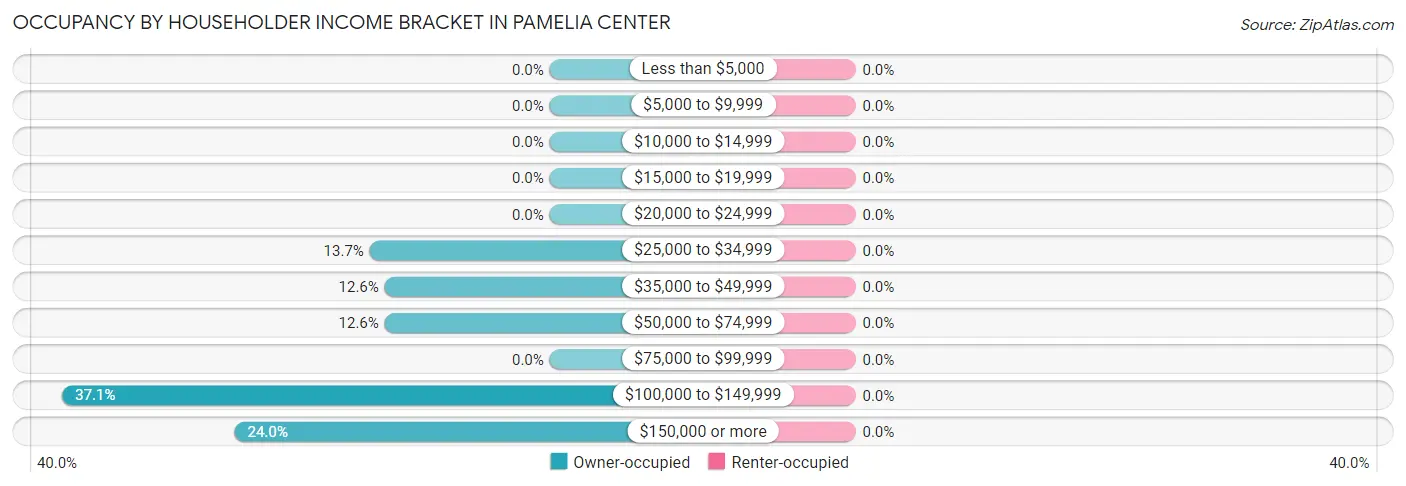
| Income Bracket | Owner-occupied | Renter-occupied |
| Less than $5,000 | 0 (0.0%) | 0 (0.0%) |
| $5,000 to $9,999 | 0 (0.0%) | 0 (0.0%) |
| $10,000 to $14,999 | 0 (0.0%) | 0 (0.0%) |
| $15,000 to $19,999 | 0 (0.0%) | 0 (0.0%) |
| $20,000 to $24,999 | 0 (0.0%) | 0 (0.0%) |
| $25,000 to $34,999 | 24 (13.7%) | 0 (0.0%) |
| $35,000 to $49,999 | 22 (12.6%) | 0 (0.0%) |
| $50,000 to $74,999 | 22 (12.6%) | 0 (0.0%) |
| $75,000 to $99,999 | 0 (0.0%) | 0 (0.0%) |
| $100,000 to $149,999 | 65 (37.1%) | 0 (0.0%) |
| $150,000 or more | 42 (24.0%) | 0 (0.0%) |
| Total | 175 (100.0%) | 0 (0.0%) |
Monthly Housing Cost Tiers in Pamelia Center
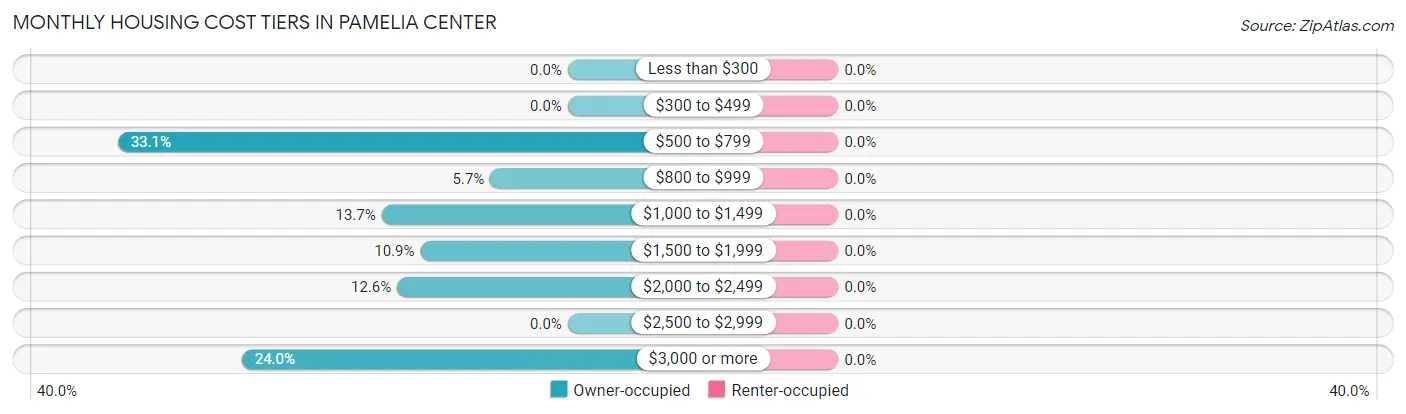
| Monthly Cost | Owner-occupied | Renter-occupied |
| Less than $300 | 0 (0.0%) | 0 (0.0%) |
| $300 to $499 | 0 (0.0%) | 0 (0.0%) |
| $500 to $799 | 58 (33.1%) | 0 (0.0%) |
| $800 to $999 | 10 (5.7%) | 0 (0.0%) |
| $1,000 to $1,499 | 24 (13.7%) | 0 (0.0%) |
| $1,500 to $1,999 | 19 (10.9%) | 0 (0.0%) |
| $2,000 to $2,499 | 22 (12.6%) | 0 (0.0%) |
| $2,500 to $2,999 | 0 (0.0%) | 0 (0.0%) |
| $3,000 or more | 42 (24.0%) | 0 (0.0%) |
| Total | 175 (100.0%) | 0 (0.0%) |
Physical Housing Characteristics in Pamelia Center
Housing Structures in Pamelia Center
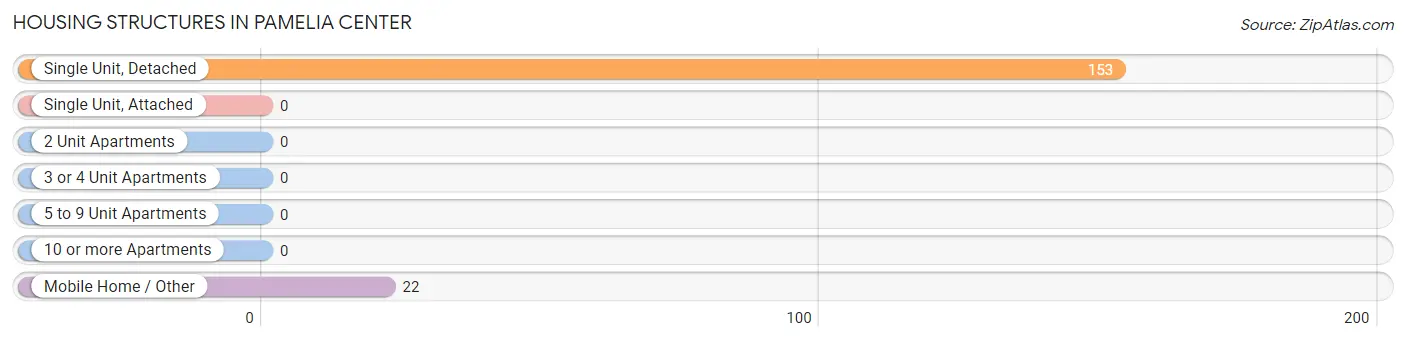
| Structure Type | # Housing Units | % Housing Units |
| Single Unit, Detached | 153 | 87.4% |
| Single Unit, Attached | 0 | 0.0% |
| 2 Unit Apartments | 0 | 0.0% |
| 3 or 4 Unit Apartments | 0 | 0.0% |
| 5 to 9 Unit Apartments | 0 | 0.0% |
| 10 or more Apartments | 0 | 0.0% |
| Mobile Home / Other | 22 | 12.6% |
| Total | 175 | 100.0% |
Housing Structures by Occupancy in Pamelia Center
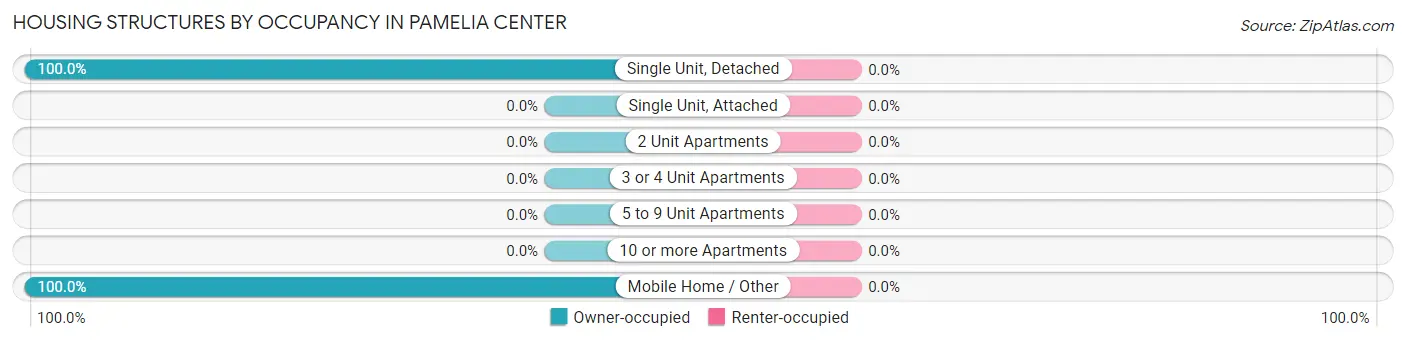
| Structure Type | Owner-occupied | Renter-occupied |
| Single Unit, Detached | 153 (100.0%) | 0 (0.0%) |
| Single Unit, Attached | 0 (0.0%) | 0 (0.0%) |
| 2 Unit Apartments | 0 (0.0%) | 0 (0.0%) |
| 3 or 4 Unit Apartments | 0 (0.0%) | 0 (0.0%) |
| 5 to 9 Unit Apartments | 0 (0.0%) | 0 (0.0%) |
| 10 or more Apartments | 0 (0.0%) | 0 (0.0%) |
| Mobile Home / Other | 22 (100.0%) | 0 (0.0%) |
| Total | 175 (100.0%) | 0 (0.0%) |
Housing Structures by Number of Rooms in Pamelia Center
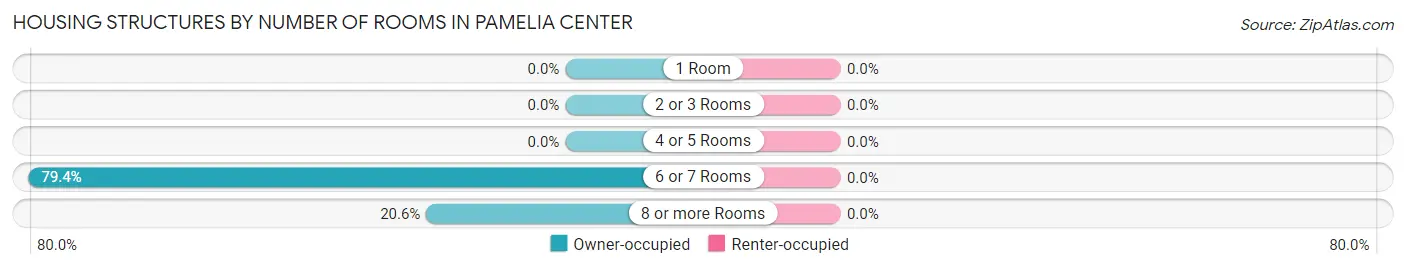
| Number of Rooms | Owner-occupied | Renter-occupied |
| 1 Room | 0 (0.0%) | 0 (0.0%) |
| 2 or 3 Rooms | 0 (0.0%) | 0 (0.0%) |
| 4 or 5 Rooms | 0 (0.0%) | 0 (0.0%) |
| 6 or 7 Rooms | 139 (79.4%) | 0 (0.0%) |
| 8 or more Rooms | 36 (20.6%) | 0 (0.0%) |
| Total | 175 (100.0%) | 0 (0.0%) |
Housing Structure by Heating Type in Pamelia Center
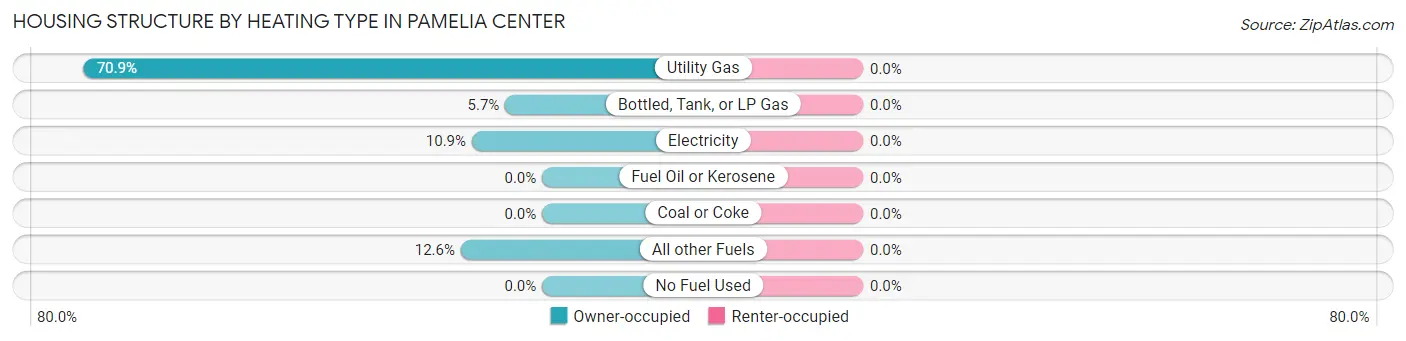
| Heating Type | Owner-occupied | Renter-occupied |
| Utility Gas | 124 (70.9%) | 0 (0.0%) |
| Bottled, Tank, or LP Gas | 10 (5.7%) | 0 (0.0%) |
| Electricity | 19 (10.9%) | 0 (0.0%) |
| Fuel Oil or Kerosene | 0 (0.0%) | 0 (0.0%) |
| Coal or Coke | 0 (0.0%) | 0 (0.0%) |
| All other Fuels | 22 (12.6%) | 0 (0.0%) |
| No Fuel Used | 0 (0.0%) | 0 (0.0%) |
| Total | 175 (100.0%) | 0 (0.0%) |
Household Vehicle Usage in Pamelia Center
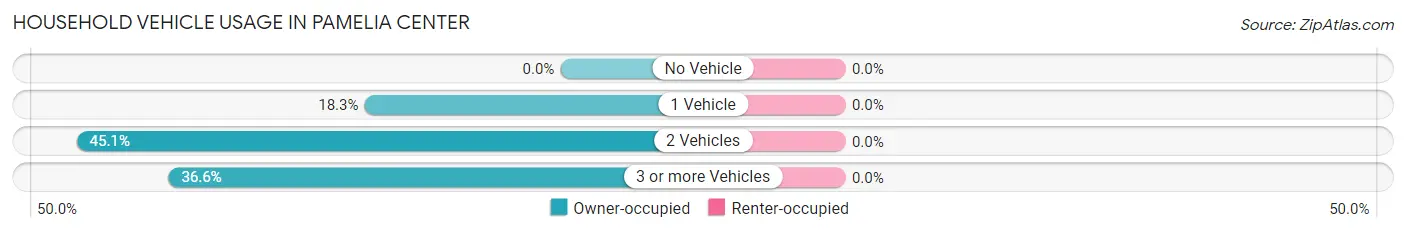
| Vehicles per Household | Owner-occupied | Renter-occupied |
| No Vehicle | 0 (0.0%) | 0 (0.0%) |
| 1 Vehicle | 32 (18.3%) | 0 (0.0%) |
| 2 Vehicles | 79 (45.1%) | 0 (0.0%) |
| 3 or more Vehicles | 64 (36.6%) | 0 (0.0%) |
| Total | 175 (100.0%) | 0 (0.0%) |
Real Estate & Mortgages in Pamelia Center
Real Estate and Mortgage Overview in Pamelia Center
| Characteristic | Without Mortgage | With Mortgage |
| Housing Units | 92 | 83 |
| Median Property Value | $130,800 | $335,200 |
| Median Household Income | - | - |
| Monthly Housing Costs | $745 | $42 |
| Real Estate Taxes | $517 | $0 |
Property Value by Mortgage Status in Pamelia Center
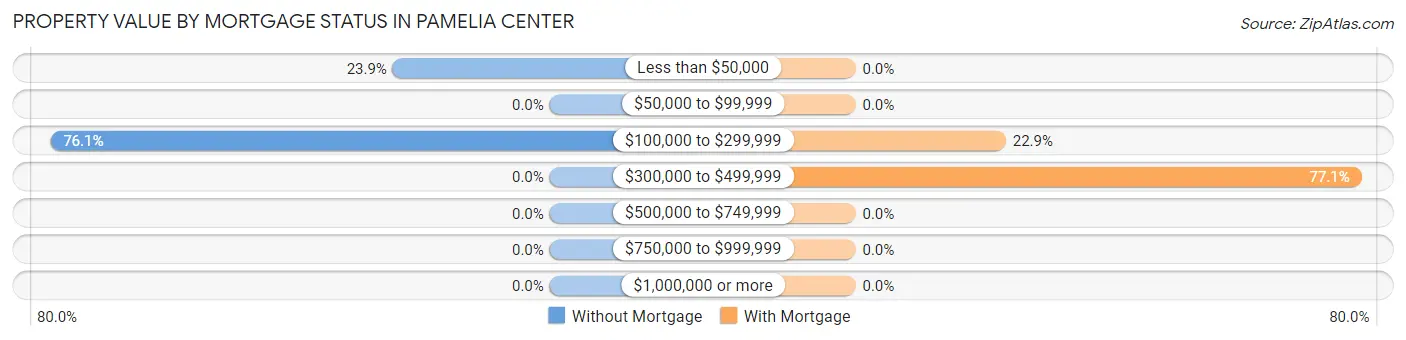
| Property Value | Without Mortgage | With Mortgage |
| Less than $50,000 | 22 (23.9%) | 0 (0.0%) |
| $50,000 to $99,999 | 0 (0.0%) | 0 (0.0%) |
| $100,000 to $299,999 | 70 (76.1%) | 19 (22.9%) |
| $300,000 to $499,999 | 0 (0.0%) | 64 (77.1%) |
| $500,000 to $749,999 | 0 (0.0%) | 0 (0.0%) |
| $750,000 to $999,999 | 0 (0.0%) | 0 (0.0%) |
| $1,000,000 or more | 0 (0.0%) | 0 (0.0%) |
| Total | 92 (100.0%) | 83 (100.0%) |
Household Income by Mortgage Status in Pamelia Center
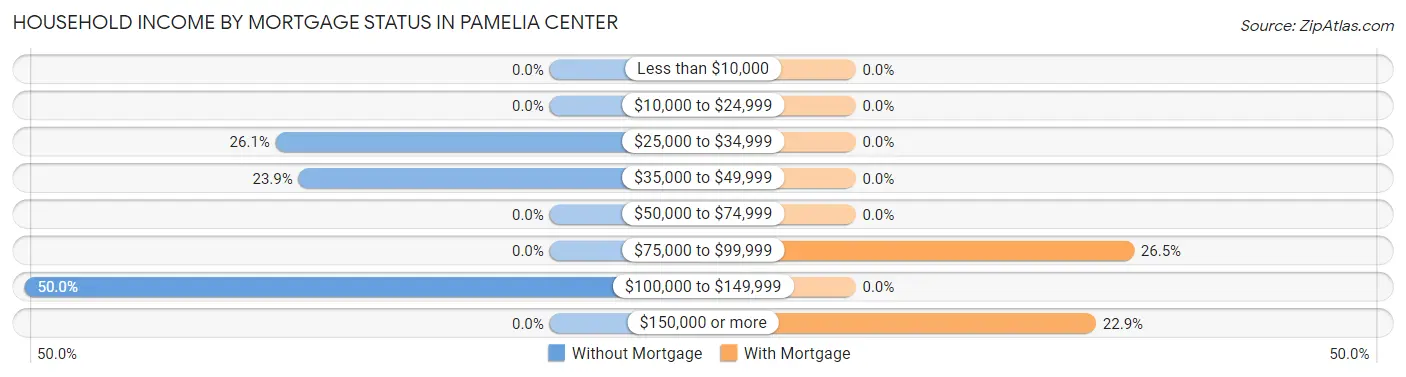
| Household Income | Without Mortgage | With Mortgage |
| Less than $10,000 | 0 (0.0%) | 0 (0.0%) |
| $10,000 to $24,999 | 0 (0.0%) | 0 (0.0%) |
| $25,000 to $34,999 | 24 (26.1%) | 0 (0.0%) |
| $35,000 to $49,999 | 22 (23.9%) | 0 (0.0%) |
| $50,000 to $74,999 | 0 (0.0%) | 0 (0.0%) |
| $75,000 to $99,999 | 0 (0.0%) | 22 (26.5%) |
| $100,000 to $149,999 | 46 (50.0%) | 0 (0.0%) |
| $150,000 or more | 0 (0.0%) | 19 (22.9%) |
| Total | 92 (100.0%) | 83 (100.0%) |
Property Value to Household Income Ratio in Pamelia Center
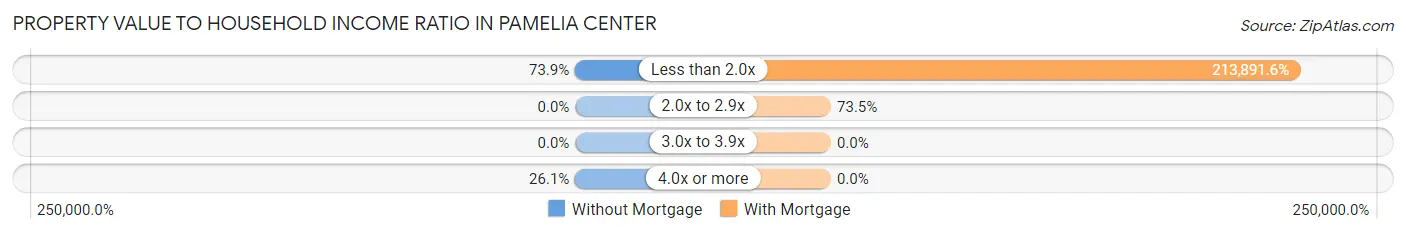
| Value-to-Income Ratio | Without Mortgage | With Mortgage |
| Less than 2.0x | 68 (73.9%) | 177,530 (213,891.6%) |
| 2.0x to 2.9x | 0 (0.0%) | 61 (73.5%) |
| 3.0x to 3.9x | 0 (0.0%) | 0 (0.0%) |
| 4.0x or more | 24 (26.1%) | 0 (0.0%) |
| Total | 92 (100.0%) | 83 (100.0%) |
Real Estate Taxes by Mortgage Status in Pamelia Center
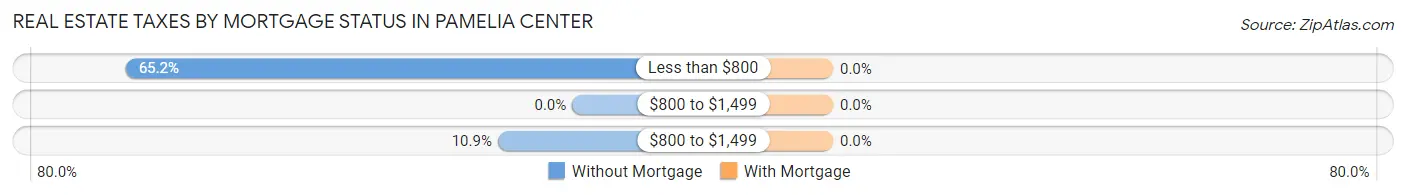
| Property Taxes | Without Mortgage | With Mortgage |
| Less than $800 | 60 (65.2%) | 0 (0.0%) |
| $800 to $1,499 | 0 (0.0%) | 0 (0.0%) |
| $800 to $1,499 | 10 (10.9%) | 0 (0.0%) |
| Total | 92 (100.0%) | 83 (100.0%) |
Health & Disability in Pamelia Center
Health Insurance Coverage by Age in Pamelia Center
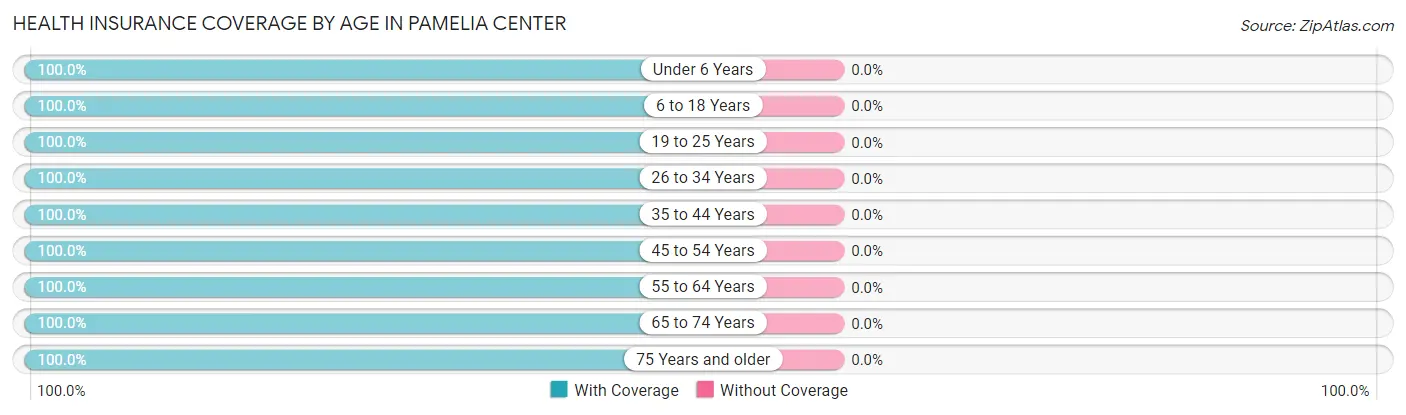
| Age Bracket | With Coverage | Without Coverage |
| Under 6 Years | 61 (100.0%) | 0 (0.0%) |
| 6 to 18 Years | 240 (100.0%) | 0 (0.0%) |
| 19 to 25 Years | 138 (100.0%) | 0 (0.0%) |
| 26 to 34 Years | 17 (100.0%) | 0 (0.0%) |
| 35 to 44 Years | 67 (100.0%) | 0 (0.0%) |
| 45 to 54 Years | 64 (100.0%) | 0 (0.0%) |
| 55 to 64 Years | 140 (100.0%) | 0 (0.0%) |
| 65 to 74 Years | 14 (100.0%) | 0 (0.0%) |
| 75 Years and older | 10 (100.0%) | 0 (0.0%) |
| Total | 751 (100.0%) | 0 (0.0%) |
Health Insurance Coverage by Citizenship Status in Pamelia Center
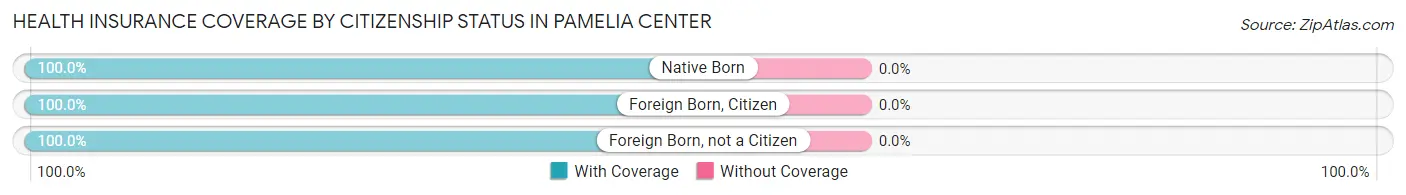
| Citizenship Status | With Coverage | Without Coverage |
| Native Born | 61 (100.0%) | 0 (0.0%) |
| Foreign Born, Citizen | 240 (100.0%) | 0 (0.0%) |
| Foreign Born, not a Citizen | 138 (100.0%) | 0 (0.0%) |
Health Insurance Coverage by Household Income in Pamelia Center
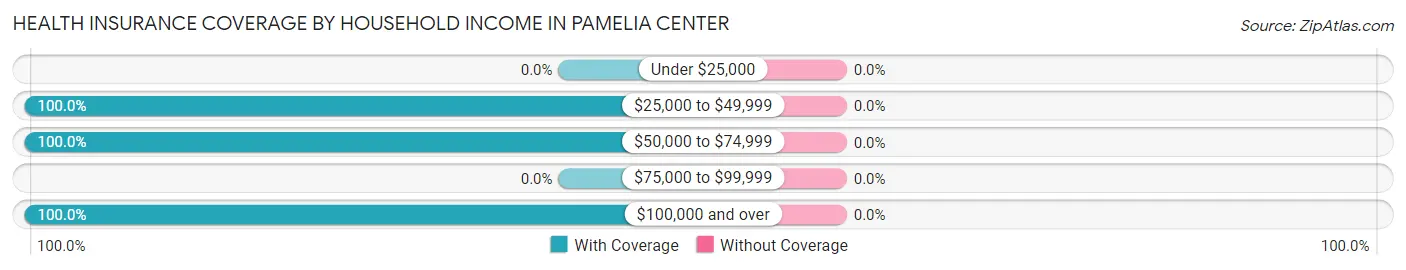
| Household Income | With Coverage | Without Coverage |
| Under $25,000 | 0 (0.0%) | 0 (0.0%) |
| $25,000 to $49,999 | 90 (100.0%) | 0 (0.0%) |
| $50,000 to $74,999 | 44 (100.0%) | 0 (0.0%) |
| $75,000 to $99,999 | 0 (0.0%) | 0 (0.0%) |
| $100,000 and over | 617 (100.0%) | 0 (0.0%) |
Public vs Private Health Insurance Coverage by Age in Pamelia Center
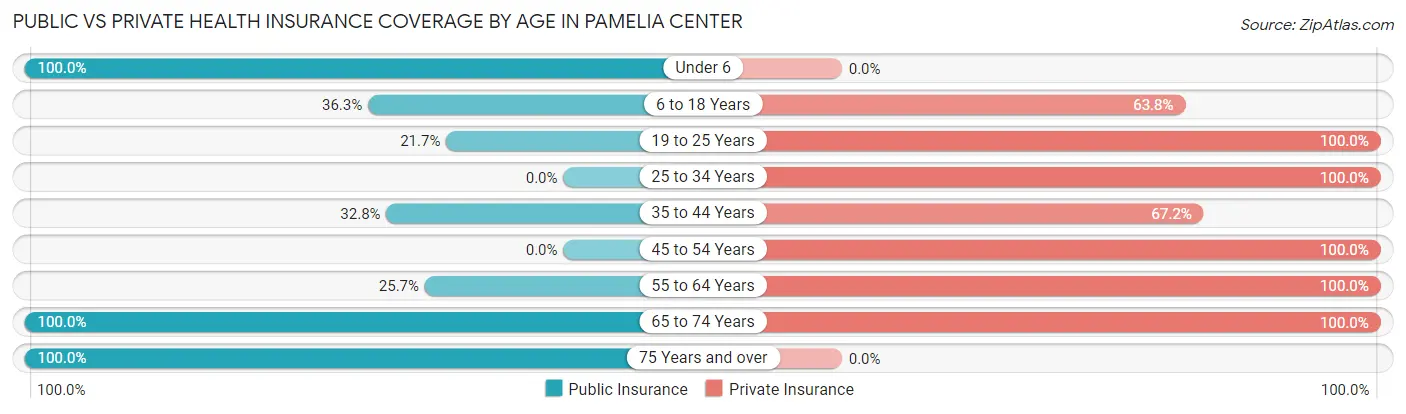
| Age Bracket | Public Insurance | Private Insurance |
| Under 6 | 61 (100.0%) | 0 (0.0%) |
| 6 to 18 Years | 87 (36.2%) | 153 (63.7%) |
| 19 to 25 Years | 30 (21.7%) | 138 (100.0%) |
| 25 to 34 Years | 0 (0.0%) | 17 (100.0%) |
| 35 to 44 Years | 22 (32.8%) | 45 (67.2%) |
| 45 to 54 Years | 0 (0.0%) | 64 (100.0%) |
| 55 to 64 Years | 36 (25.7%) | 140 (100.0%) |
| 65 to 74 Years | 14 (100.0%) | 14 (100.0%) |
| 75 Years and over | 10 (100.0%) | 0 (0.0%) |
| Total | 260 (34.6%) | 571 (76.0%) |
Disability Status by Sex by Age in Pamelia Center
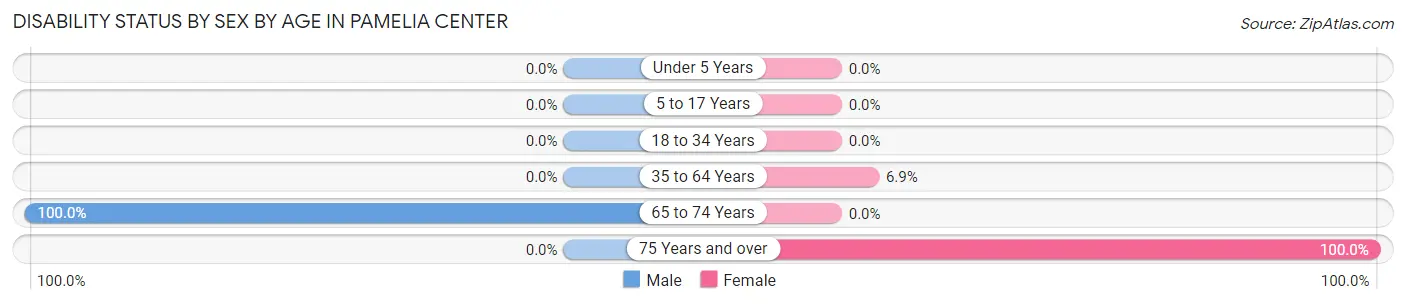
| Age Bracket | Male | Female |
| Under 5 Years | 0 (0.0%) | 0 (0.0%) |
| 5 to 17 Years | 0 (0.0%) | 0 (0.0%) |
| 18 to 34 Years | 0 (0.0%) | 0 (0.0%) |
| 35 to 64 Years | 0 (0.0%) | 10 (6.9%) |
| 65 to 74 Years | 14 (100.0%) | 0 (0.0%) |
| 75 Years and over | 0 (0.0%) | 10 (100.0%) |
Disability Class by Sex by Age in Pamelia Center
Disability Class: Hearing Difficulty
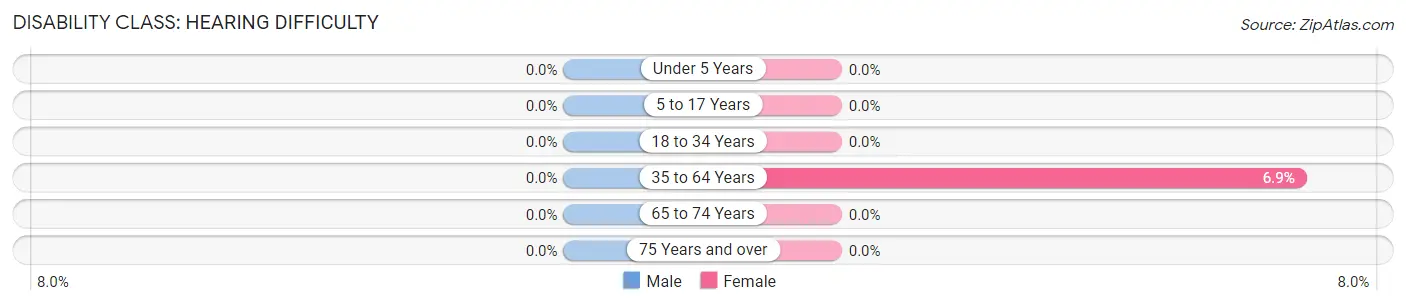
| Age Bracket | Male | Female |
| Under 5 Years | 0 (0.0%) | 0 (0.0%) |
| 5 to 17 Years | 0 (0.0%) | 0 (0.0%) |
| 18 to 34 Years | 0 (0.0%) | 0 (0.0%) |
| 35 to 64 Years | 0 (0.0%) | 10 (6.9%) |
| 65 to 74 Years | 0 (0.0%) | 0 (0.0%) |
| 75 Years and over | 0 (0.0%) | 0 (0.0%) |
Disability Class: Vision Difficulty
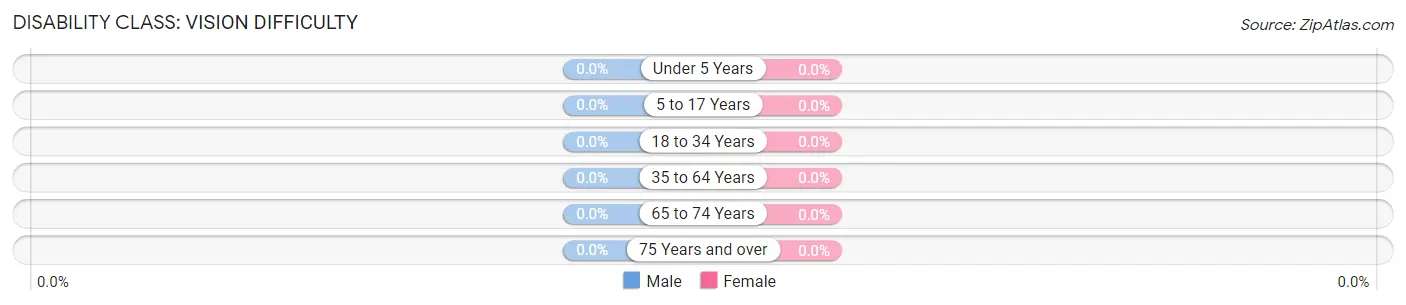
| Age Bracket | Male | Female |
| Under 5 Years | 0 (0.0%) | 0 (0.0%) |
| 5 to 17 Years | 0 (0.0%) | 0 (0.0%) |
| 18 to 34 Years | 0 (0.0%) | 0 (0.0%) |
| 35 to 64 Years | 0 (0.0%) | 0 (0.0%) |
| 65 to 74 Years | 0 (0.0%) | 0 (0.0%) |
| 75 Years and over | 0 (0.0%) | 0 (0.0%) |
Disability Class: Cognitive Difficulty
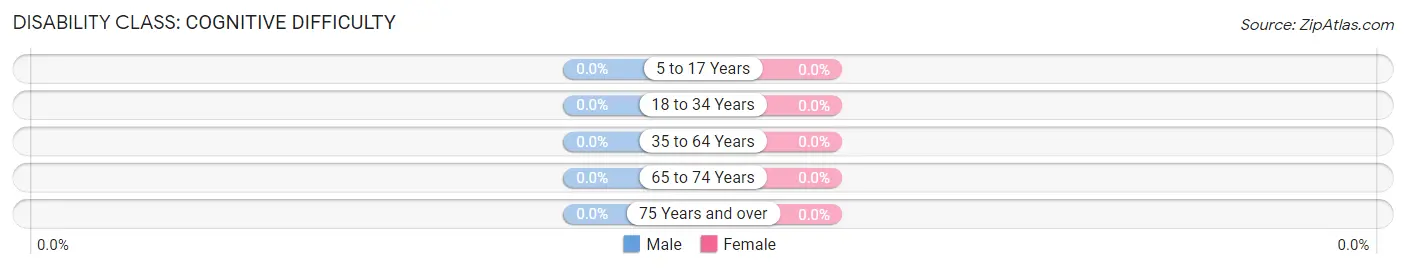
| Age Bracket | Male | Female |
| 5 to 17 Years | 0 (0.0%) | 0 (0.0%) |
| 18 to 34 Years | 0 (0.0%) | 0 (0.0%) |
| 35 to 64 Years | 0 (0.0%) | 0 (0.0%) |
| 65 to 74 Years | 0 (0.0%) | 0 (0.0%) |
| 75 Years and over | 0 (0.0%) | 0 (0.0%) |
Disability Class: Ambulatory Difficulty
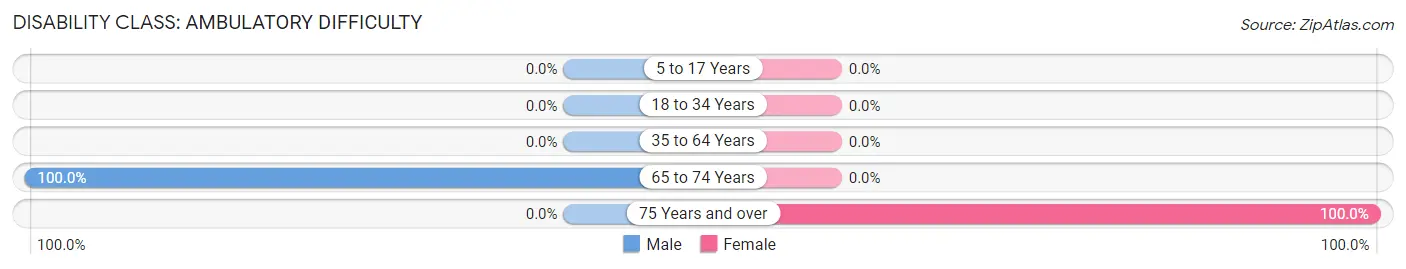
| Age Bracket | Male | Female |
| 5 to 17 Years | 0 (0.0%) | 0 (0.0%) |
| 18 to 34 Years | 0 (0.0%) | 0 (0.0%) |
| 35 to 64 Years | 0 (0.0%) | 0 (0.0%) |
| 65 to 74 Years | 14 (100.0%) | 0 (0.0%) |
| 75 Years and over | 0 (0.0%) | 10 (100.0%) |
Disability Class: Self-Care Difficulty
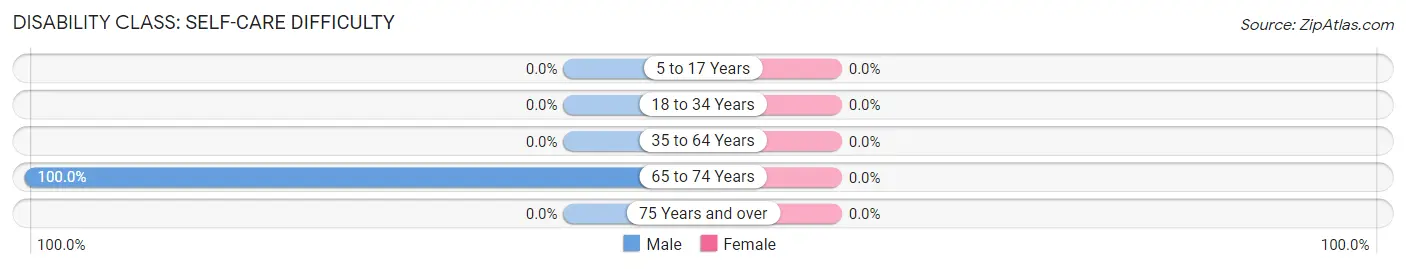
| Age Bracket | Male | Female |
| 5 to 17 Years | 0 (0.0%) | 0 (0.0%) |
| 18 to 34 Years | 0 (0.0%) | 0 (0.0%) |
| 35 to 64 Years | 0 (0.0%) | 0 (0.0%) |
| 65 to 74 Years | 14 (100.0%) | 0 (0.0%) |
| 75 Years and over | 0 (0.0%) | 0 (0.0%) |
Technology Access in Pamelia Center
Computing Device Access in Pamelia Center
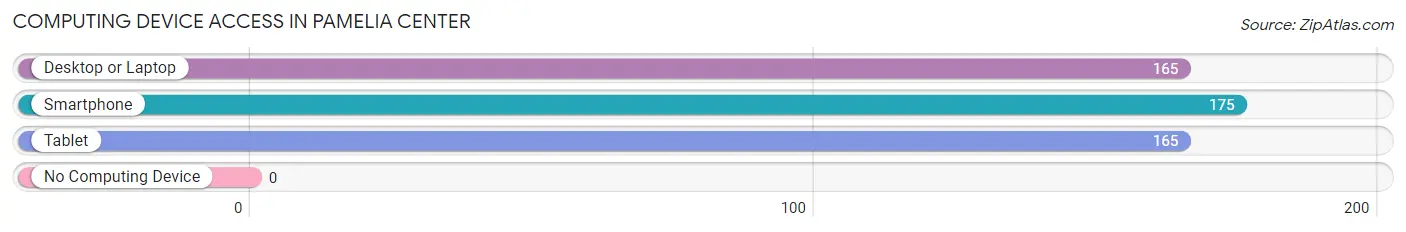
| Device Type | # Households | % Households |
| Desktop or Laptop | 165 | 94.3% |
| Smartphone | 175 | 100.0% |
| Tablet | 165 | 94.3% |
| No Computing Device | 0 | 0.0% |
| Total | 175 | 100.0% |
Internet Access in Pamelia Center
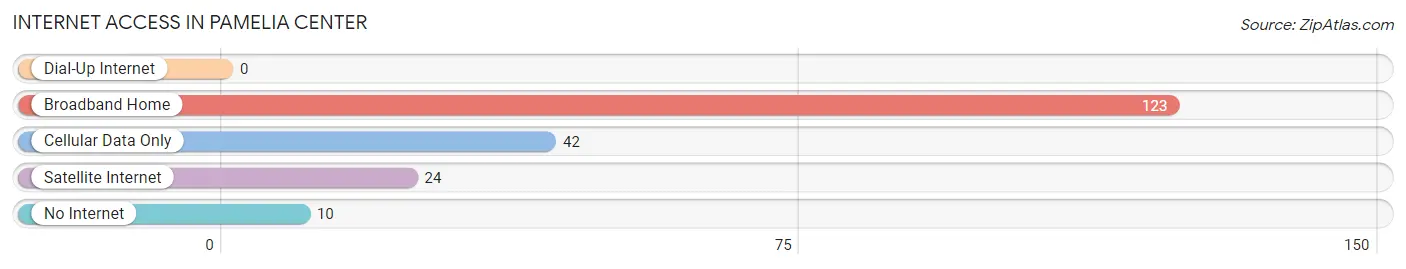
| Internet Type | # Households | % Households |
| Dial-Up Internet | 0 | 0.0% |
| Broadband Home | 123 | 70.3% |
| Cellular Data Only | 42 | 24.0% |
| Satellite Internet | 24 | 13.7% |
| No Internet | 10 | 5.7% |
| Total | 175 | 100.0% |
Pamelia Center Summary
Pamelia Center is a hamlet located in the town of Pamelia in Jefferson County, New York. It is situated on the eastern shore of Lake Ontario, approximately 20 miles north of Watertown. The hamlet is home to a population of approximately 1,000 people and is a popular destination for tourists and outdoor enthusiasts.
History
The area that is now Pamelia Center was first settled in the early 1800s by a group of settlers from Connecticut. The settlers were attracted to the area due to its abundance of natural resources, including timber and fish. The hamlet was originally known as “Pamelia” after the daughter of one of the settlers.
In 1820, the hamlet was officially incorporated as the Town of Pamelia. The town was named after the daughter of one of the settlers, Pamelia Smith. The town was primarily an agricultural community, with the main crops being wheat, corn, and potatoes.
In the late 1800s, the hamlet began to grow and develop. The first post office was established in 1876 and the first school was built in 1877. The hamlet also had a general store, a blacksmith shop, and a grist mill.
In the early 1900s, the hamlet began to experience a period of growth and prosperity. The population increased from approximately 500 in 1900 to over 1,000 by the mid-1900s. The hamlet also saw the construction of several new businesses, including a hotel, a bank, and a movie theater.
Geography
Pamelia Center is located in the town of Pamelia in Jefferson County, New York. It is situated on the eastern shore of Lake Ontario, approximately 20 miles north of Watertown. The hamlet is located in a rural area and is surrounded by rolling hills and farmland.
The hamlet is located at an elevation of approximately 600 feet above sea level. The climate in the area is generally mild, with temperatures ranging from the low 30s in the winter to the mid-80s in the summer.
Economy
The economy of Pamelia Center is primarily based on agriculture and tourism. The hamlet is home to several farms, which produce a variety of crops, including wheat, corn, and potatoes. The hamlet is also a popular destination for tourists and outdoor enthusiasts, who come to enjoy the area’s natural beauty and recreational activities.
The hamlet is home to several businesses, including a hotel, a bank, and a movie theater. The hamlet also has a post office, a general store, and a blacksmith shop.
Demographics
As of the 2010 census, the population of Pamelia Center was 1,000. The population is primarily white (97.2%), with a small percentage of African Americans (1.2%) and Native Americans (0.6%). The median household income in the hamlet is $45,000, and the median age is 43.
The hamlet is served by the Pamelia Central School District, which includes a primary school, a middle school, and a high school. The hamlet is also home to several churches, including the Pamelia United Methodist Church and the Pamelia Baptist Church.
Conclusion
Pamelia Center is a small hamlet located in the town of Pamelia in Jefferson County, New York. It is situated on the eastern shore of Lake Ontario, approximately 20 miles north of Watertown. The hamlet is home to a population of approximately 1,000 people and is a popular destination for tourists and outdoor enthusiasts. The economy of the hamlet is primarily based on agriculture and tourism, and the population is primarily white. The hamlet is served by the Pamelia Central School District and is home to several churches.
Common Questions
What is Per Capita Income in Pamelia Center?
Per Capita income in Pamelia Center is $24,241.
What is the Median Family Income in Pamelia Center?
Median Family Income in Pamelia Center is $116,354.
What is the Median Household income in Pamelia Center?
Median Household Income in Pamelia Center is $116,354.
What is Income or Wage Gap in Pamelia Center?
Income or Wage Gap in Pamelia Center is 47.6%.
Women in Pamelia Center earn 52.4 cents for every dollar earned by a man.
What is Inequality or Gini Index in Pamelia Center?
Inequality or Gini Index in Pamelia Center is 0.28.
What is the Total Population of Pamelia Center?
Total Population of Pamelia Center is 770.
What is the Total Male Population of Pamelia Center?
Total Male Population of Pamelia Center is 409.
What is the Total Female Population of Pamelia Center?
Total Female Population of Pamelia Center is 361.
What is the Ratio of Males per 100 Females in Pamelia Center?
There are 113.30 Males per 100 Females in Pamelia Center.
What is the Ratio of Females per 100 Males in Pamelia Center?
There are 88.26 Females per 100 Males in Pamelia Center.
What is the Median Population Age in Pamelia Center?
Median Population Age in Pamelia Center is 21.5 Years.
What is the Average Family Size in Pamelia Center
Average Family Size in Pamelia Center is 3.7 People.
What is the Average Household Size in Pamelia Center
Average Household Size in Pamelia Center is 4.4 People.
How Large is the Labor Force in Pamelia Center?
There are 282 People in the Labor Forcein in Pamelia Center.
What is the Percentage of People in the Labor Force in Pamelia Center?
50.4% of People are in the Labor Force in Pamelia Center.
What is the Unemployment Rate in Pamelia Center?
Unemployment Rate in Pamelia Center is 12.2%.