Star Lake, NY Map & Demographics
Star Lake Map
Star Lake Overview
$32,157
PER CAPITA INCOME
$64,375
AVG FAMILY INCOME
$53,125
AVG HOUSEHOLD INCOME
3.5%
WAGE / INCOME GAP [ % ]
96.5¢/ $1
WAGE / INCOME GAP [ $ ]
0.43
INEQUALITY / GINI INDEX
649
TOTAL POPULATION
395
MALE POPULATION
254
FEMALE POPULATION
155.51
MALES / 100 FEMALES
64.30
FEMALES / 100 MALES
52.8
MEDIAN AGE
3.1
AVG FAMILY SIZE
2.2
AVG HOUSEHOLD SIZE
242
LABOR FORCE [ PEOPLE ]
47.6%
PERCENT IN LABOR FORCE
2.9%
UNEMPLOYMENT RATE
Star Lake Zip Codes
Star Lake Area Codes
Income in Star Lake
Income Overview in Star Lake
Per Capita Income in Star Lake is $32,157, while median incomes of families and households are $64,375 and $53,125 respectively.
| Characteristic | Number | Measure |
| Per Capita Income | 649 | $32,157 |
| Median Family Income | 154 | $64,375 |
| Mean Family Income | 154 | $83,346 |
| Median Household Income | 277 | $53,125 |
| Mean Household Income | 277 | $68,632 |
| Income Deficit | 154 | $0 |
| Wage / Income Gap (%) | 649 | 3.54% |
| Wage / Income Gap ($) | 649 | 96.46¢ per $1 |
| Gini / Inequality Index | 649 | 0.43 |
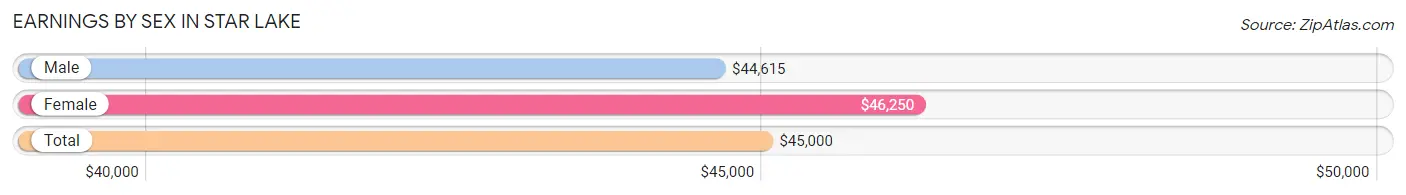
Earnings by Sex in Star Lake
Average Earnings in Star Lake are $45,000, $44,615 for men and $46,250 for women, a difference of 3.5%.
| Sex | Number | Average Earnings |
| Male | 162 (62.8%) | $44,615 |
| Female | 96 (37.2%) | $46,250 |
| Total | 258 (100.0%) | $45,000 |
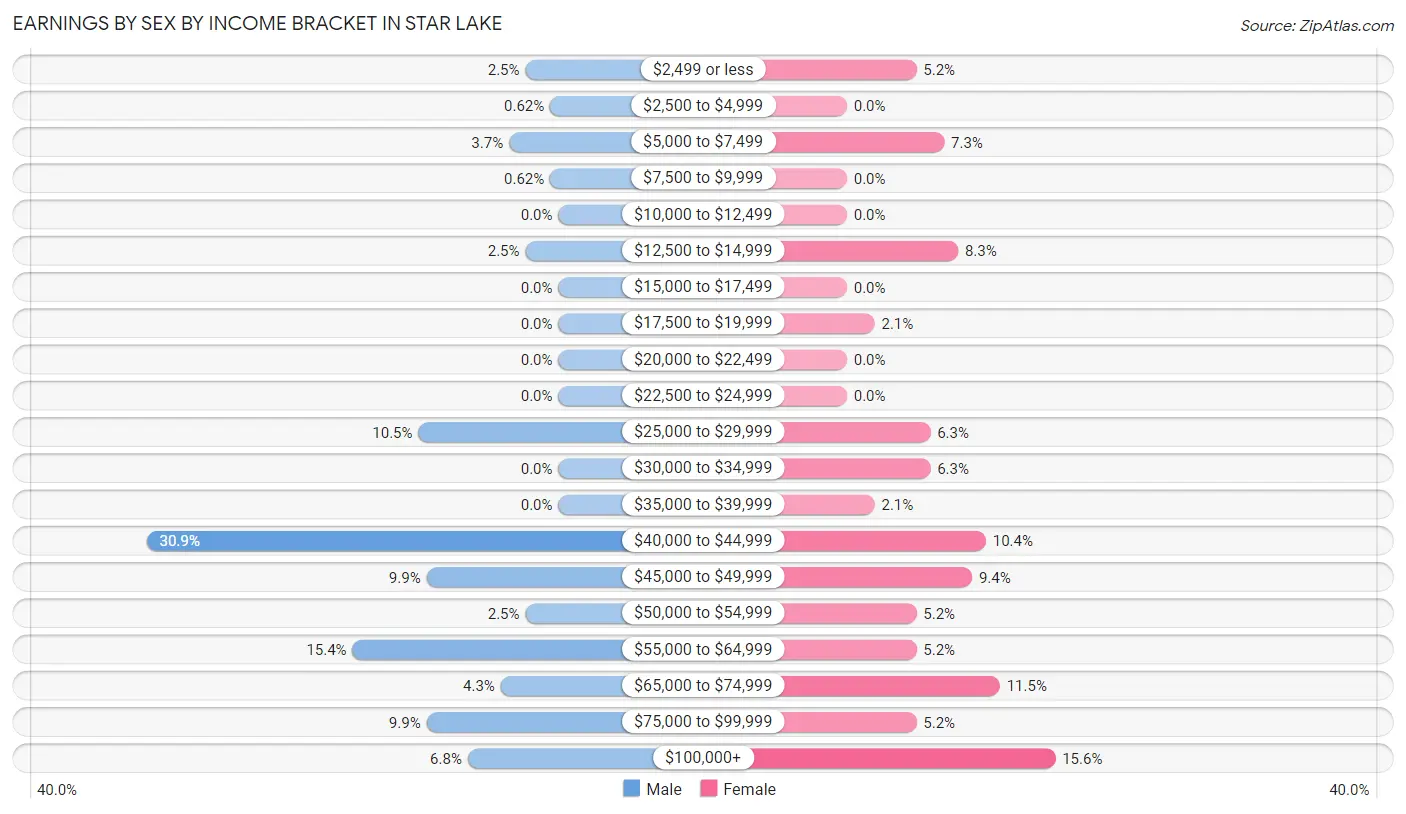
Earnings by Sex by Income Bracket in Star Lake
The most common earnings brackets in Star Lake are $40,000 to $44,999 for men (50 | 30.9%) and $100,000+ for women (15 | 15.6%).
| Income | Male | Female |
| $2,499 or less | 4 (2.5%) | 5 (5.2%) |
| $2,500 to $4,999 | 1 (0.6%) | 0 (0.0%) |
| $5,000 to $7,499 | 6 (3.7%) | 7 (7.3%) |
| $7,500 to $9,999 | 1 (0.6%) | 0 (0.0%) |
| $10,000 to $12,499 | 0 (0.0%) | 0 (0.0%) |
| $12,500 to $14,999 | 4 (2.5%) | 8 (8.3%) |
| $15,000 to $17,499 | 0 (0.0%) | 0 (0.0%) |
| $17,500 to $19,999 | 0 (0.0%) | 2 (2.1%) |
| $20,000 to $22,499 | 0 (0.0%) | 0 (0.0%) |
| $22,500 to $24,999 | 0 (0.0%) | 0 (0.0%) |
| $25,000 to $29,999 | 17 (10.5%) | 6 (6.2%) |
| $30,000 to $34,999 | 0 (0.0%) | 6 (6.2%) |
| $35,000 to $39,999 | 0 (0.0%) | 2 (2.1%) |
| $40,000 to $44,999 | 50 (30.9%) | 10 (10.4%) |
| $45,000 to $49,999 | 16 (9.9%) | 9 (9.4%) |
| $50,000 to $54,999 | 4 (2.5%) | 5 (5.2%) |
| $55,000 to $64,999 | 25 (15.4%) | 5 (5.2%) |
| $65,000 to $74,999 | 7 (4.3%) | 11 (11.5%) |
| $75,000 to $99,999 | 16 (9.9%) | 5 (5.2%) |
| $100,000+ | 11 (6.8%) | 15 (15.6%) |
| Total | 162 (100.0%) | 96 (100.0%) |
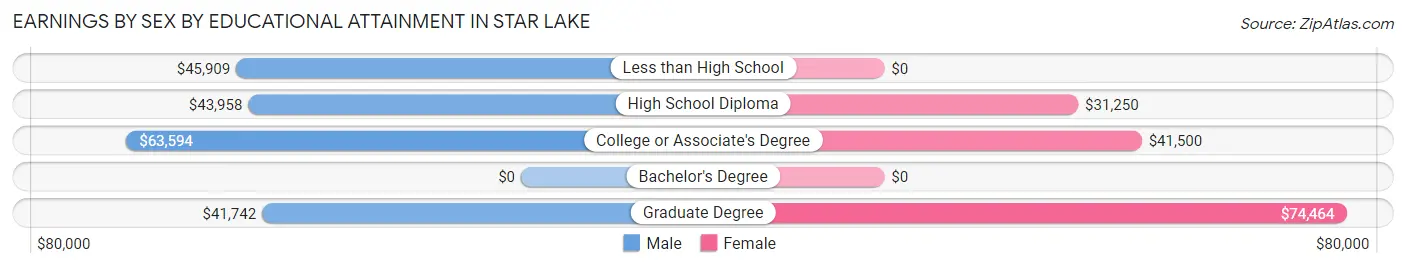
Earnings by Sex by Educational Attainment in Star Lake
Average earnings in Star Lake are $44,712 for men and $48,750 for women, a difference of 8.3%. Men with an educational attainment of college or associate's degree enjoy the highest average annual earnings of $63,594, while those with graduate degree education earn the least with $41,742. Women with an educational attainment of graduate degree earn the most with the average annual earnings of $74,464, while those with high school diploma education have the smallest earnings of $31,250.
| Educational Attainment | Male Income | Female Income |
| Less than High School | $45,909 | $0 |
| High School Diploma | $43,958 | $31,250 |
| College or Associate's Degree | $63,594 | $41,500 |
| Bachelor's Degree | - | - |
| Graduate Degree | $41,742 | $74,464 |
| Total | $44,712 | $48,750 |
Family Income in Star Lake
Family Income Brackets in Star Lake
According to the Star Lake family income data, there are 33 families falling into the $100,000 to $149,999 income range, which is the most common income bracket and makes up 21.4% of all families.
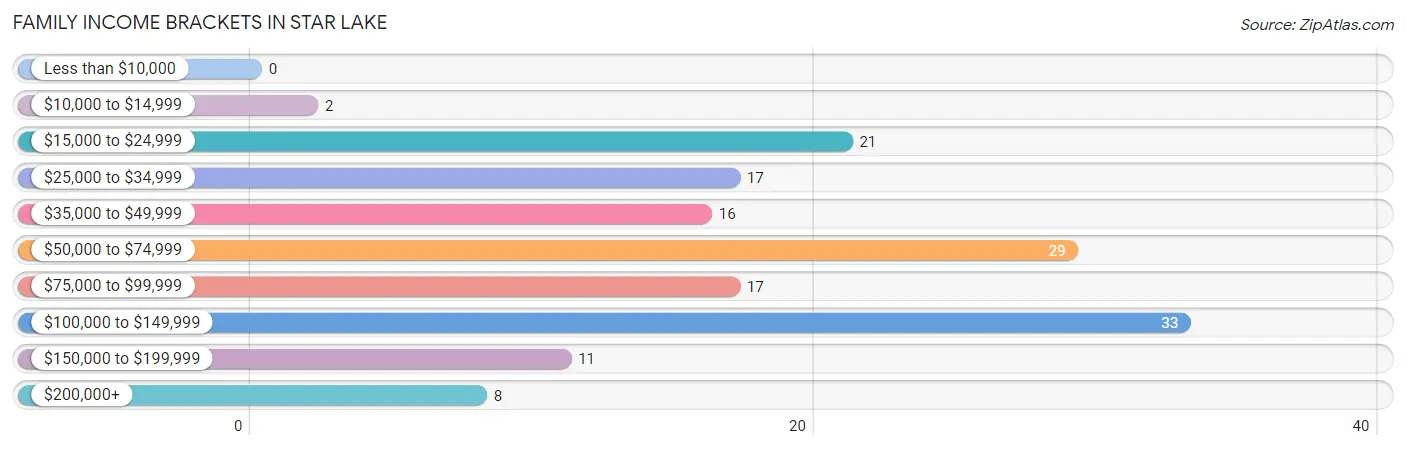
| Income Bracket | # Families | % Families |
| Less than $10,000 | 0 | 0.0% |
| $10,000 to $14,999 | 2 | 1.3% |
| $15,000 to $24,999 | 21 | 13.6% |
| $25,000 to $34,999 | 17 | 11.0% |
| $35,000 to $49,999 | 16 | 10.4% |
| $50,000 to $74,999 | 29 | 18.8% |
| $75,000 to $99,999 | 17 | 11.0% |
| $100,000 to $149,999 | 33 | 21.4% |
| $150,000 to $199,999 | 11 | 7.1% |
| $200,000+ | 8 | 5.2% |
Family Income by Famaliy Size in Star Lake
2-person families (97 | 63.0%) account for the highest median family income in Star Lake with $65,938 per family, while 2-person families (97 | 63.0%) have the highest median income of $32,969 per family member.
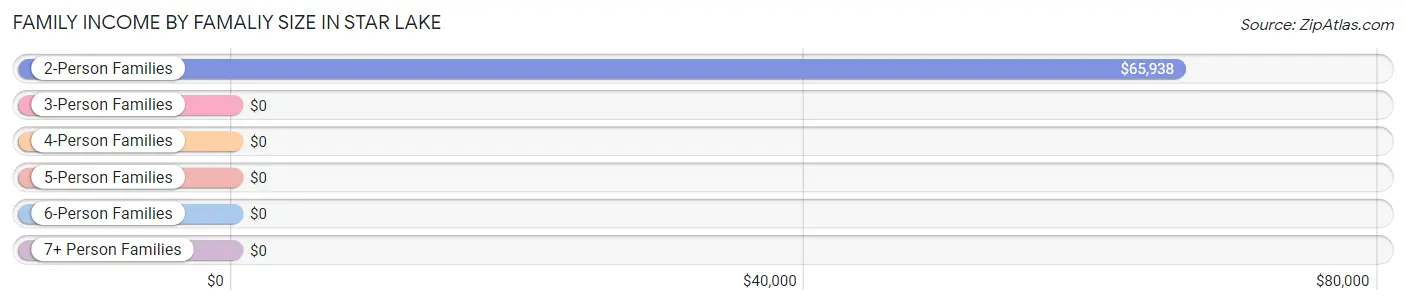
| Income Bracket | # Families | Median Income |
| 2-Person Families | 97 (63.0%) | $65,938 |
| 3-Person Families | 30 (19.5%) | $0 |
| 4-Person Families | 13 (8.4%) | $0 |
| 5-Person Families | 6 (3.9%) | $0 |
| 6-Person Families | 8 (5.2%) | $0 |
| 7+ Person Families | 0 (0.0%) | $0 |
| Total | 154 (100.0%) | $64,375 |
Family Income by Number of Earners in Star Lake
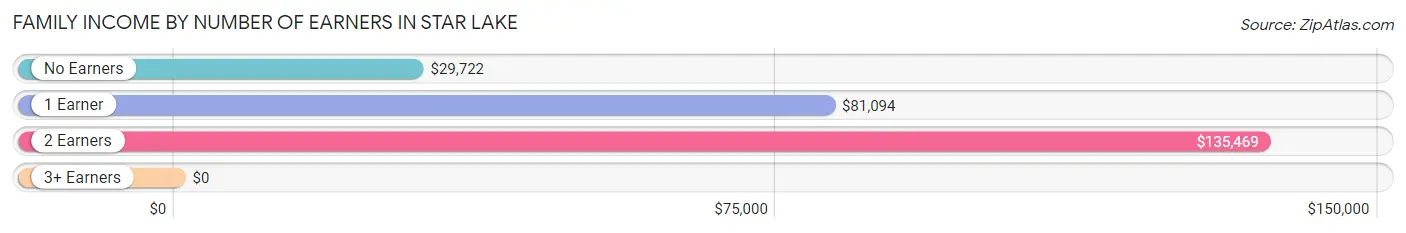
| Number of Earners | # Families | Median Income |
| No Earners | 60 (39.0%) | $29,722 |
| 1 Earner | 55 (35.7%) | $81,094 |
| 2 Earners | 33 (21.4%) | $135,469 |
| 3+ Earners | 6 (3.9%) | $0 |
| Total | 154 (100.0%) | $64,375 |
Household Income in Star Lake
Household Income Brackets in Star Lake
With 56 households falling in the category, the $50,000 to $74,999 income range is the most frequent in Star Lake, accounting for 20.2% of all households. In contrast, only 10 households (3.6%) fall into the $10,000 to $14,999 income bracket, making it the least populous group.
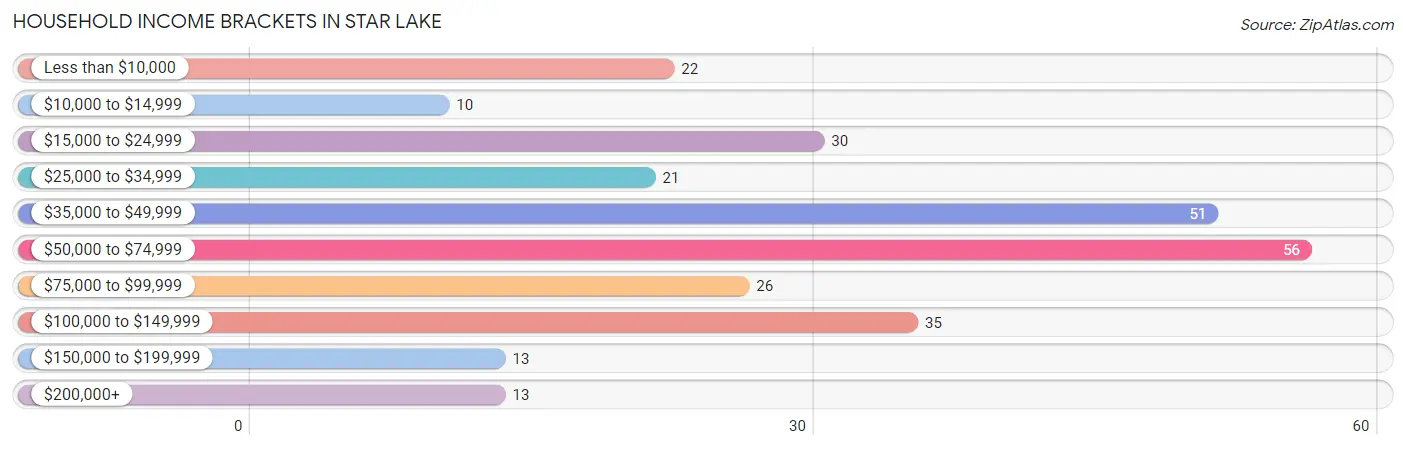
| Income Bracket | # Households | % Households |
| Less than $10,000 | 22 | 7.9% |
| $10,000 to $14,999 | 10 | 3.6% |
| $15,000 to $24,999 | 30 | 10.8% |
| $25,000 to $34,999 | 21 | 7.6% |
| $35,000 to $49,999 | 51 | 18.4% |
| $50,000 to $74,999 | 56 | 20.2% |
| $75,000 to $99,999 | 26 | 9.4% |
| $100,000 to $149,999 | 35 | 12.6% |
| $150,000 to $199,999 | 13 | 4.7% |
| $200,000+ | 13 | 4.7% |
Household Income by Householder Age in Star Lake
The median household income in Star Lake is $53,125, with the highest median household income of $81,250 found in the 25 to 44 years age bracket for the primary householder. A total of 52 households (18.8%) fall into this category. Meanwhile, the 15 to 24 years age bracket for the primary householder has the lowest median household income of $0, with 4 households (1.4%) in this group.
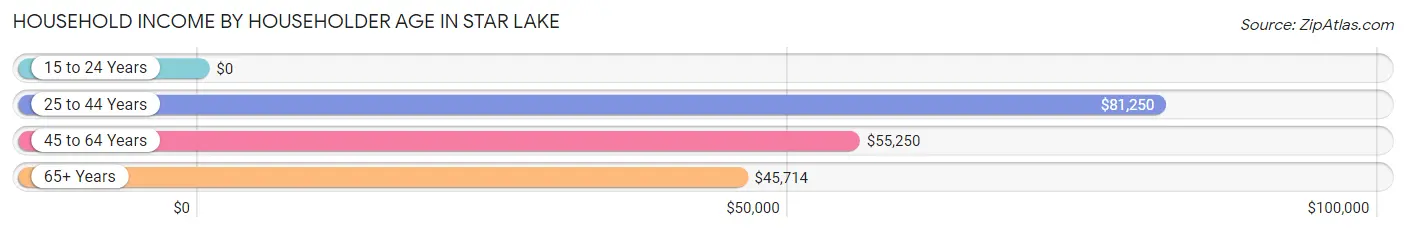
| Income Bracket | # Households | Median Income |
| 15 to 24 Years | 4 (1.4%) | $0 |
| 25 to 44 Years | 52 (18.8%) | $81,250 |
| 45 to 64 Years | 117 (42.2%) | $55,250 |
| 65+ Years | 104 (37.6%) | $45,714 |
| Total | 277 (100.0%) | $53,125 |
Poverty in Star Lake
Income Below Poverty by Sex and Age in Star Lake
With 29.7% poverty level for males and 12.6% for females among the residents of Star Lake, 16 and 17 year old males and 35 to 44 year old females are the most vulnerable to poverty, with 4 males (100.0%) and 6 females (66.7%) in their respective age groups living below the poverty level.
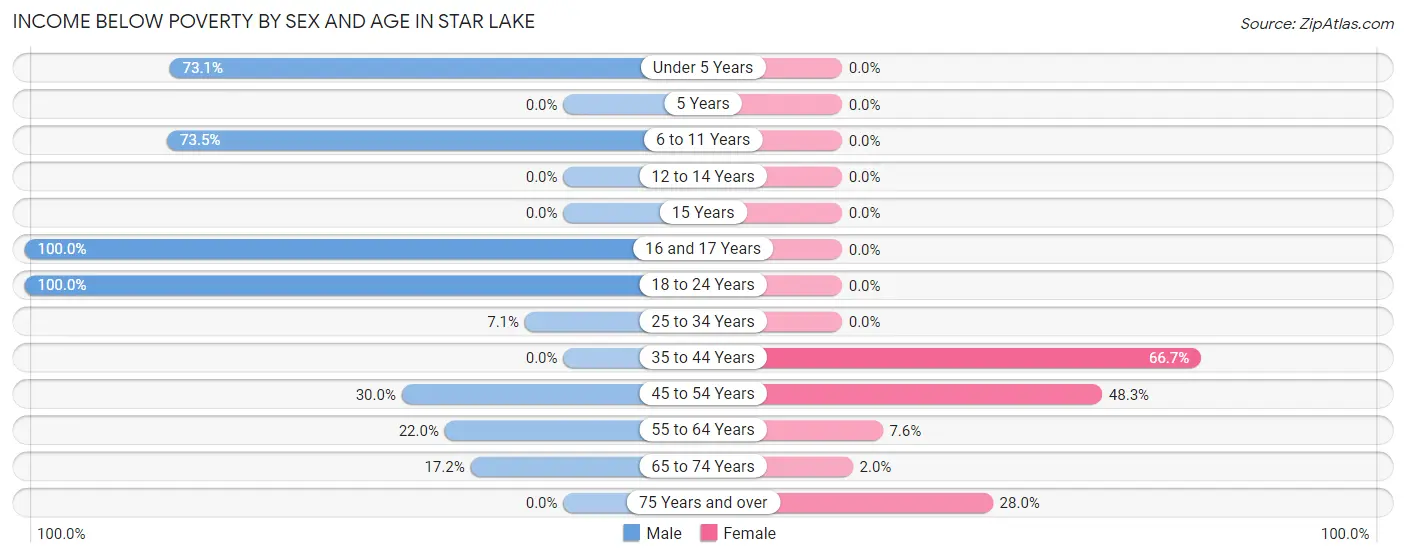
| Age Bracket | Male | Female |
| Under 5 Years | 38 (73.1%) | 0 (0.0%) |
| 5 Years | 0 (0.0%) | 0 (0.0%) |
| 6 to 11 Years | 25 (73.5%) | 0 (0.0%) |
| 12 to 14 Years | 0 (0.0%) | 0 (0.0%) |
| 15 Years | 0 (0.0%) | 0 (0.0%) |
| 16 and 17 Years | 4 (100.0%) | 0 (0.0%) |
| 18 to 24 Years | 1 (100.0%) | 0 (0.0%) |
| 25 to 34 Years | 2 (7.1%) | 0 (0.0%) |
| 35 to 44 Years | 0 (0.0%) | 6 (66.7%) |
| 45 to 54 Years | 12 (30.0%) | 14 (48.3%) |
| 55 to 64 Years | 24 (22.0%) | 4 (7.5%) |
| 65 to 74 Years | 10 (17.2%) | 1 (2.0%) |
| 75 Years and over | 0 (0.0%) | 7 (28.0%) |
| Total | 116 (29.7%) | 32 (12.6%) |
Income Above Poverty by Sex and Age in Star Lake
According to the poverty statistics in Star Lake, males aged 12 to 14 years and females aged under 5 years are the age groups that are most secure financially, with 100.0% of males and 100.0% of females in these age groups living above the poverty line.
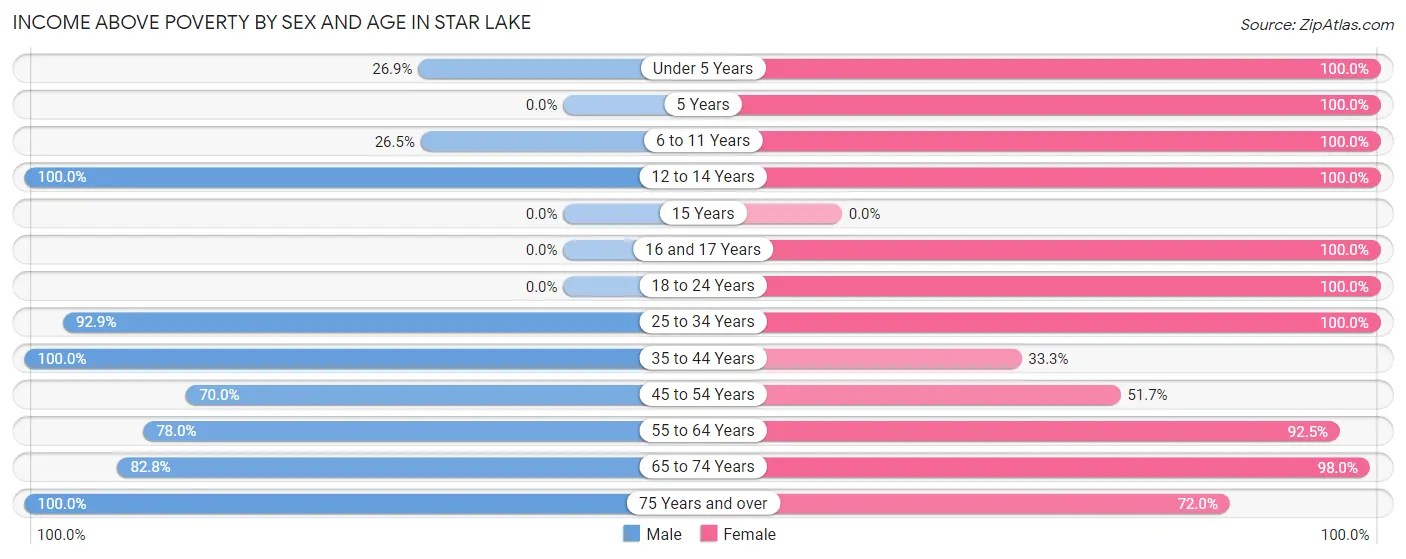
| Age Bracket | Male | Female |
| Under 5 Years | 14 (26.9%) | 8 (100.0%) |
| 5 Years | 0 (0.0%) | 15 (100.0%) |
| 6 to 11 Years | 9 (26.5%) | 19 (100.0%) |
| 12 to 14 Years | 6 (100.0%) | 3 (100.0%) |
| 15 Years | 0 (0.0%) | 0 (0.0%) |
| 16 and 17 Years | 0 (0.0%) | 3 (100.0%) |
| 18 to 24 Years | 0 (0.0%) | 9 (100.0%) |
| 25 to 34 Years | 26 (92.9%) | 31 (100.0%) |
| 35 to 44 Years | 34 (100.0%) | 3 (33.3%) |
| 45 to 54 Years | 28 (70.0%) | 15 (51.7%) |
| 55 to 64 Years | 85 (78.0%) | 49 (92.4%) |
| 65 to 74 Years | 48 (82.8%) | 49 (98.0%) |
| 75 Years and over | 25 (100.0%) | 18 (72.0%) |
| Total | 275 (70.3%) | 222 (87.4%) |
Income Below Poverty Among Married-Couple Families in Star Lake
The poverty statistics for married-couple families in Star Lake show that 15.0% or 20 of the total 133 families live below the poverty line. Families with 1 or 2 children have the highest poverty rate of 55.2%, comprising of 16 families. On the other hand, families with 3 or 4 children have the lowest poverty rate of 0.0%, which includes 0 families.
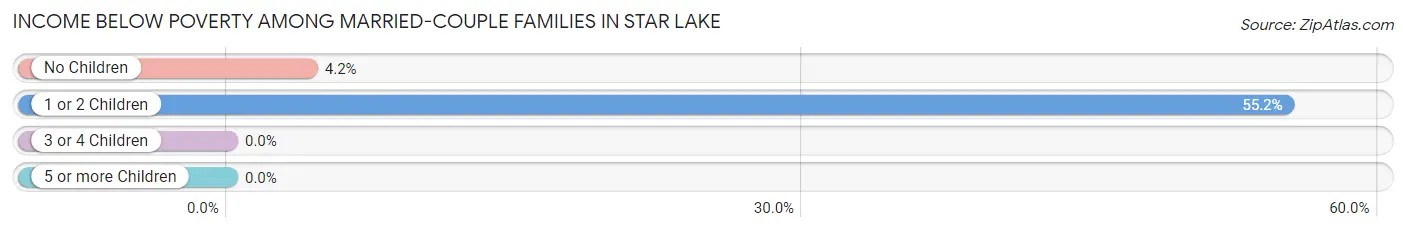
| Children | Above Poverty | Below Poverty |
| No Children | 92 (95.8%) | 4 (4.2%) |
| 1 or 2 Children | 13 (44.8%) | 16 (55.2%) |
| 3 or 4 Children | 8 (100.0%) | 0 (0.0%) |
| 5 or more Children | 0 (0.0%) | 0 (0.0%) |
| Total | 113 (85.0%) | 20 (15.0%) |
Income Below Poverty Among Single-Parent Households in Star Lake
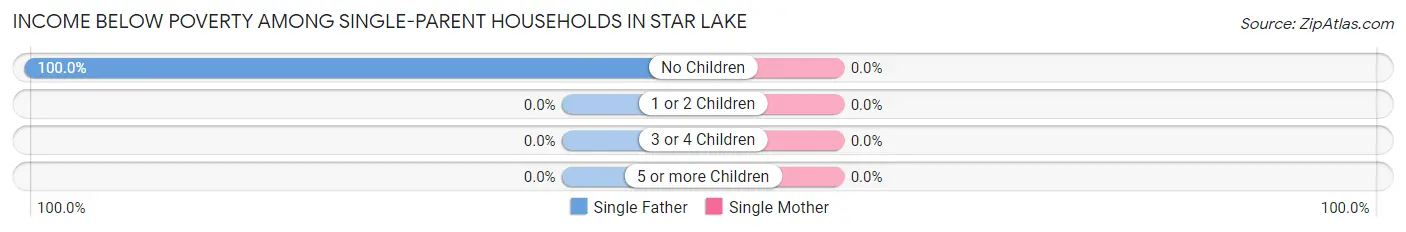
| Children | Single Father | Single Mother |
| No Children | 1 (100.0%) | 0 (0.0%) |
| 1 or 2 Children | 0 (0.0%) | 0 (0.0%) |
| 3 or 4 Children | 0 (0.0%) | 0 (0.0%) |
| 5 or more Children | 0 (0.0%) | 0 (0.0%) |
| Total | 1 (25.0%) | 0 (0.0%) |
Income Below Poverty Among Married-Couple vs Single-Parent Households in Star Lake
The poverty data for Star Lake shows that 20 of the married-couple family households (15.0%) and 1 of the single-parent households (4.8%) are living below the poverty level. Within the married-couple family households, those with 1 or 2 children have the highest poverty rate, with 16 households (55.2%) falling below the poverty line. Among the single-parent households, those with no children have the highest poverty rate, with 1 household (8.3%) living below poverty.
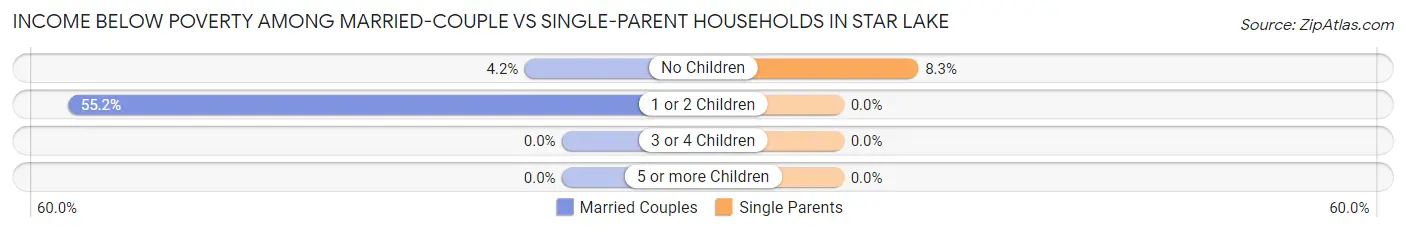
| Children | Married-Couple Families | Single-Parent Households |
| No Children | 4 (4.2%) | 1 (8.3%) |
| 1 or 2 Children | 16 (55.2%) | 0 (0.0%) |
| 3 or 4 Children | 0 (0.0%) | 0 (0.0%) |
| 5 or more Children | 0 (0.0%) | 0 (0.0%) |
| Total | 20 (15.0%) | 1 (4.8%) |
Race in Star Lake
The most populous races in Star Lake are White / Caucasian (533 | 82.1%), Two or more Races (78 | 12.0%), and Hispanic or Latino (40 | 6.2%).
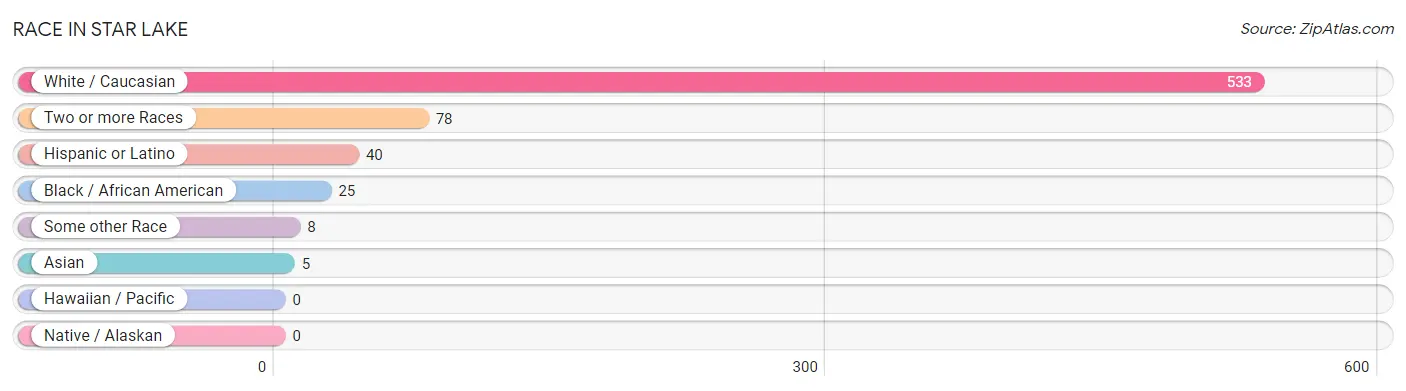
| Race | # Population | % Population |
| Asian | 5 | 0.8% |
| Black / African American | 25 | 3.8% |
| Hawaiian / Pacific | 0 | 0.0% |
| Hispanic or Latino | 40 | 6.2% |
| Native / Alaskan | 0 | 0.0% |
| White / Caucasian | 533 | 82.1% |
| Two or more Races | 78 | 12.0% |
| Some other Race | 8 | 1.2% |
| Total | 649 | 100.0% |
Ancestry in Star Lake
The most populous ancestries reported in Star Lake are Irish (80 | 12.3%), French (70 | 10.8%), English (66 | 10.2%), French Canadian (46 | 7.1%), and German (41 | 6.3%), together accounting for 46.7% of all Star Lake residents.
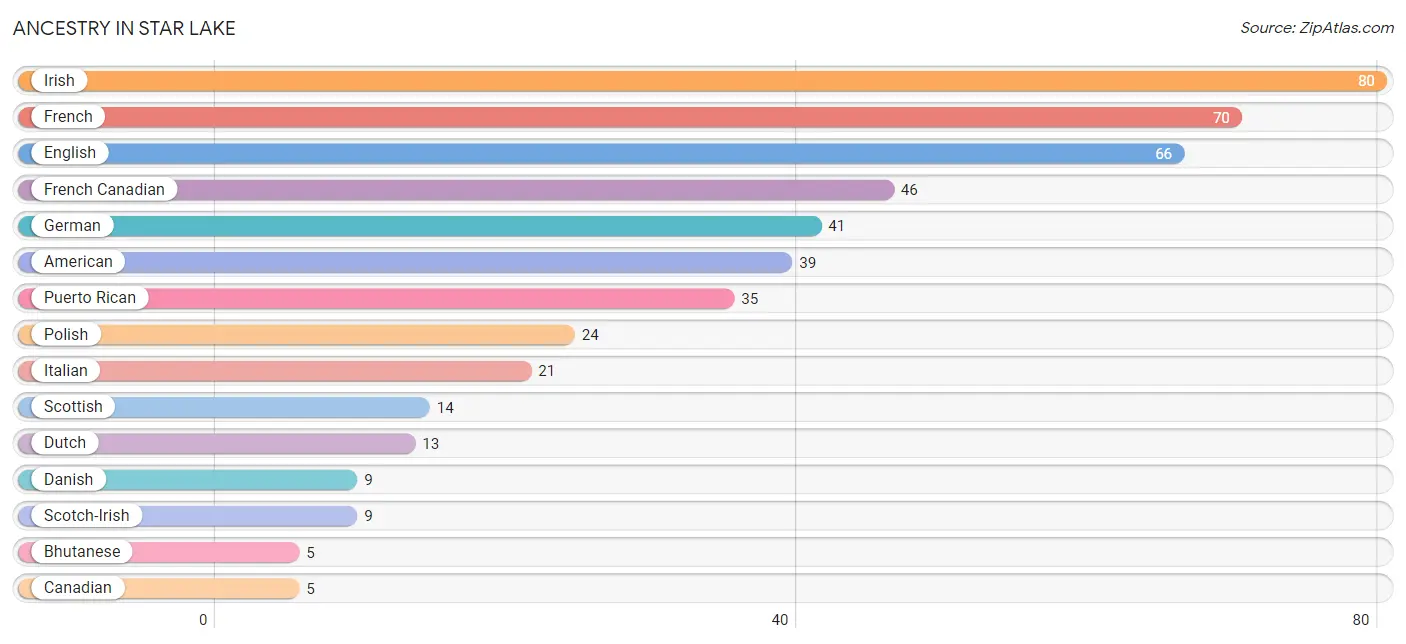
| Ancestry | # Population | % Population |
| American | 39 | 6.0% |
| Australian | 3 | 0.5% |
| Austrian | 4 | 0.6% |
| Belgian | 2 | 0.3% |
| Bhutanese | 5 | 0.8% |
| Canadian | 5 | 0.8% |
| Danish | 9 | 1.4% |
| Dutch | 13 | 2.0% |
| Eastern European | 2 | 0.3% |
| English | 66 | 10.2% |
| French | 70 | 10.8% |
| French Canadian | 46 | 7.1% |
| German | 41 | 6.3% |
| Hungarian | 4 | 0.6% |
| Irish | 80 | 12.3% |
| Italian | 21 | 3.2% |
| Lithuanian | 2 | 0.3% |
| Mexican | 3 | 0.5% |
| Norwegian | 3 | 0.5% |
| Polish | 24 | 3.7% |
| Puerto Rican | 35 | 5.4% |
| Scotch-Irish | 9 | 1.4% |
| Scottish | 14 | 2.2% |
| Ukrainian | 2 | 0.3% | View All 24 Rows |
Immigrants in Star Lake
The most numerous immigrant groups reported in Star Lake came from Europe (6 | 0.9%), Asia (5 | 0.8%), Canada (5 | 0.8%), Eastern Asia (5 | 0.8%), and Japan (5 | 0.8%), together accounting for 4.0% of all Star Lake residents.
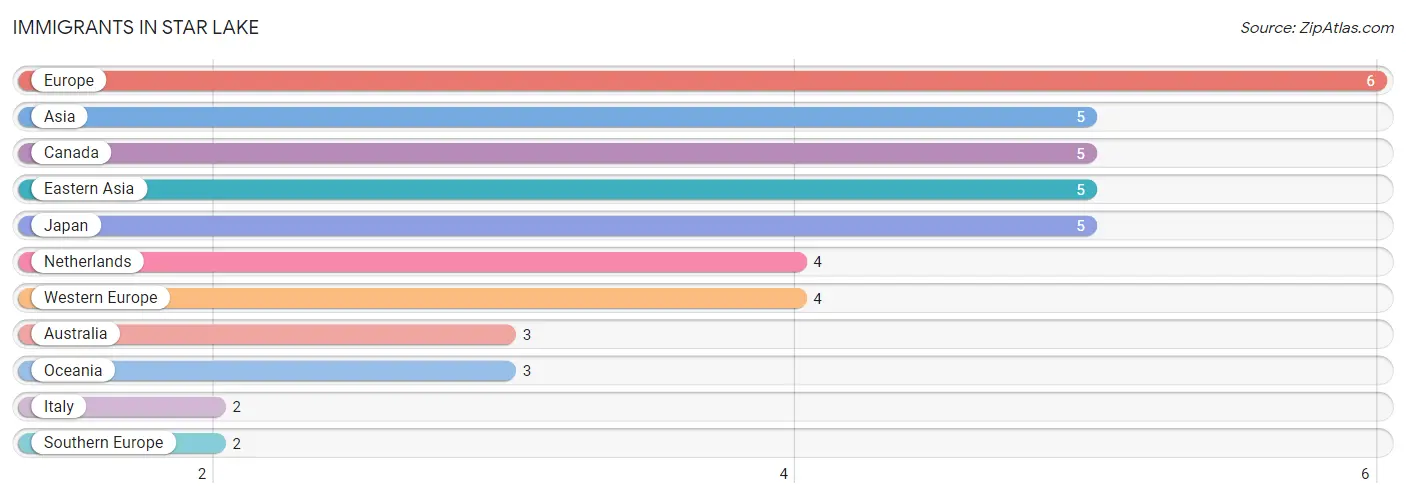
| Immigration Origin | # Population | % Population |
| Asia | 5 | 0.8% |
| Australia | 3 | 0.5% |
| Canada | 5 | 0.8% |
| Eastern Asia | 5 | 0.8% |
| Europe | 6 | 0.9% |
| Italy | 2 | 0.3% |
| Japan | 5 | 0.8% |
| Netherlands | 4 | 0.6% |
| Oceania | 3 | 0.5% |
| Southern Europe | 2 | 0.3% |
| Western Europe | 4 | 0.6% | View All 11 Rows |
Sex and Age in Star Lake
Sex and Age in Star Lake
The most populous age groups in Star Lake are 55 to 59 Years (67 | 17.0%) for men and 5 to 9 Years (34 | 13.4%) for women.

| Age Bracket | Male | Female |
| Under 5 Years | 56 (14.2%) | 8 (3.2%) |
| 5 to 9 Years | 25 (6.3%) | 34 (13.4%) |
| 10 to 14 Years | 15 (3.8%) | 3 (1.2%) |
| 15 to 19 Years | 4 (1.0%) | 3 (1.2%) |
| 20 to 24 Years | 1 (0.3%) | 9 (3.5%) |
| 25 to 29 Years | 14 (3.5%) | 0 (0.0%) |
| 30 to 34 Years | 14 (3.5%) | 31 (12.2%) |
| 35 to 39 Years | 23 (5.8%) | 3 (1.2%) |
| 40 to 44 Years | 11 (2.8%) | 6 (2.4%) |
| 45 to 49 Years | 32 (8.1%) | 13 (5.1%) |
| 50 to 54 Years | 8 (2.0%) | 16 (6.3%) |
| 55 to 59 Years | 67 (17.0%) | 27 (10.6%) |
| 60 to 64 Years | 42 (10.6%) | 26 (10.2%) |
| 65 to 69 Years | 27 (6.8%) | 27 (10.6%) |
| 70 to 74 Years | 31 (7.9%) | 23 (9.1%) |
| 75 to 79 Years | 20 (5.1%) | 13 (5.1%) |
| 80 to 84 Years | 3 (0.8%) | 12 (4.7%) |
| 85 Years and over | 2 (0.5%) | 0 (0.0%) |
| Total | 395 (100.0%) | 254 (100.0%) |
Families and Households in Star Lake
Median Family Size in Star Lake
The median family size in Star Lake is 3.06 persons per family, with single male/father families (4 | 2.6%) accounting for the largest median family size of 3.5 persons per family. On the other hand, single female/mother families (17 | 11.0%) represent the smallest median family size with 2.94 persons per family.
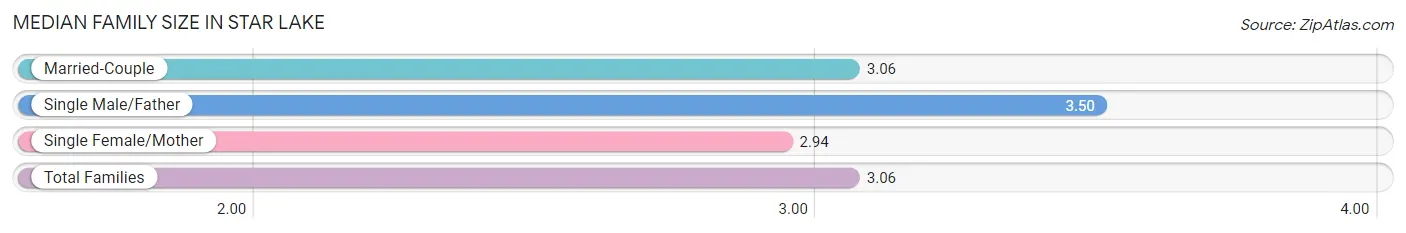
| Family Type | # Families | Family Size |
| Married-Couple | 133 (86.4%) | 3.06 |
| Single Male/Father | 4 (2.6%) | 3.50 |
| Single Female/Mother | 17 (11.0%) | 2.94 |
| Total Families | 154 (100.0%) | 3.06 |
Median Household Size in Star Lake
The median household size in Star Lake is 2.22 persons per household, with single male/father households (4 | 1.4%) accounting for the largest median household size of 4.25 persons per household. non-family households (123 | 44.4%) represent the smallest median household size with 1.08 persons per household.
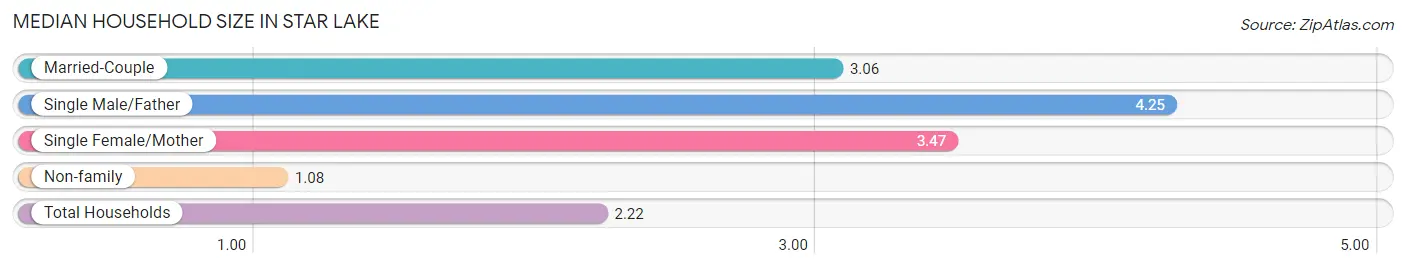
| Household Type | # Households | Household Size |
| Married-Couple | 133 (48.0%) | 3.06 |
| Single Male/Father | 4 (1.4%) | 4.25 |
| Single Female/Mother | 17 (6.1%) | 3.47 |
| Non-family | 123 (44.4%) | 1.08 |
| Total Households | 277 (100.0%) | 2.22 |
Household Size by Marriage Status in Star Lake
Out of a total of 277 households in Star Lake, 154 (55.6%) are family households, while 123 (44.4%) are nonfamily households. The most numerous type of family households are 2-person households, comprising 97, and the most common type of nonfamily households are 1-person households, comprising 116.
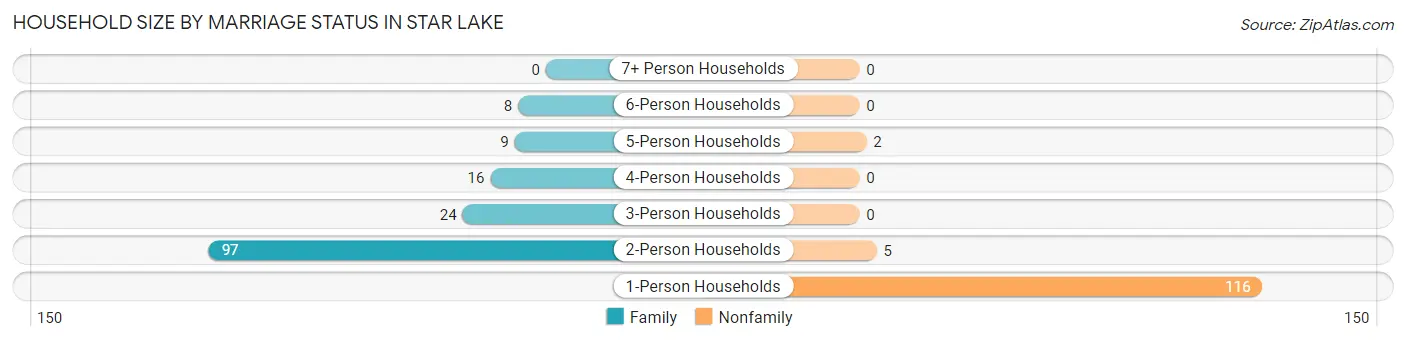
| Household Size | Family Households | Nonfamily Households |
| 1-Person Households | - | 116 (41.9%) |
| 2-Person Households | 97 (35.0%) | 5 (1.8%) |
| 3-Person Households | 24 (8.7%) | 0 (0.0%) |
| 4-Person Households | 16 (5.8%) | 0 (0.0%) |
| 5-Person Households | 9 (3.3%) | 2 (0.7%) |
| 6-Person Households | 8 (2.9%) | 0 (0.0%) |
| 7+ Person Households | 0 (0.0%) | 0 (0.0%) |
| Total | 154 (55.6%) | 123 (44.4%) |
Female Fertility in Star Lake
Fertility by Age in Star Lake
Average fertility rate in Star Lake is 80.0 births per 1,000 women. Women in the age bracket of 35 to 50 years have the highest fertility rate with 188.0 births per 1,000 women. Women in the age bracket of 35 to 50 years acount for 100.0% of all women with births.
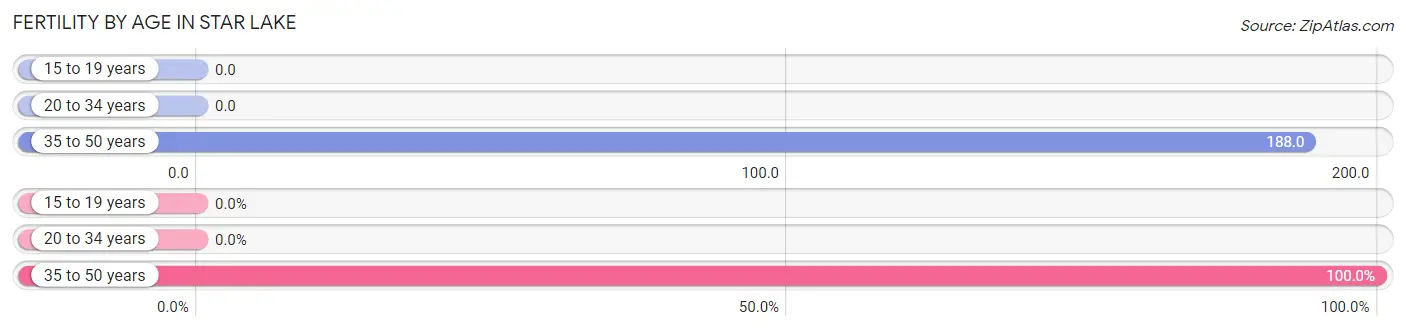
| Age Bracket | Women with Births | Births / 1,000 Women |
| 15 to 19 years | 0 (0.0%) | 0.0 |
| 20 to 34 years | 0 (0.0%) | 0.0 |
| 35 to 50 years | 6 (100.0%) | 188.0 |
| Total | 6 (100.0%) | 80.0 |
Fertility by Age by Marriage Status in Star Lake
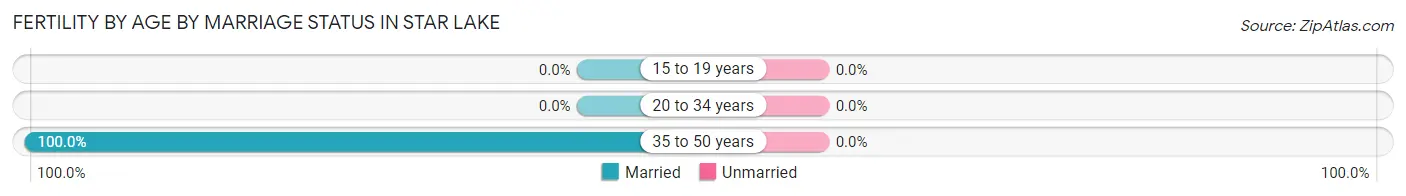
| Age Bracket | Married | Unmarried |
| 15 to 19 years | 0 (0.0%) | 0 (0.0%) |
| 20 to 34 years | 0 (0.0%) | 0 (0.0%) |
| 35 to 50 years | 6 (100.0%) | 0 (0.0%) |
| Total | 6 (100.0%) | 0 (0.0%) |
Fertility by Education in Star Lake
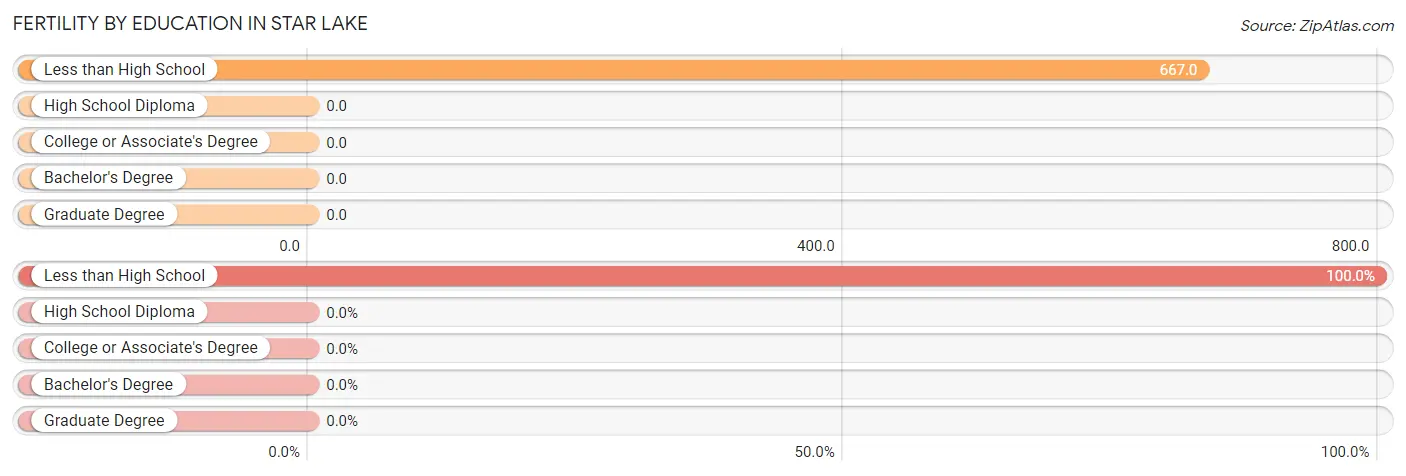
| Educational Attainment | Women with Births | Births / 1,000 Women |
| Less than High School | 6 (100.0%) | 667.0 |
| High School Diploma | 0 (0.0%) | 0.0 |
| College or Associate's Degree | 0 (0.0%) | 0.0 |
| Bachelor's Degree | 0 (0.0%) | 0.0 |
| Graduate Degree | 0 (0.0%) | 0.0 |
| Total | 6 (100.0%) | 80.0 |
Fertility by Education by Marriage Status in Star Lake
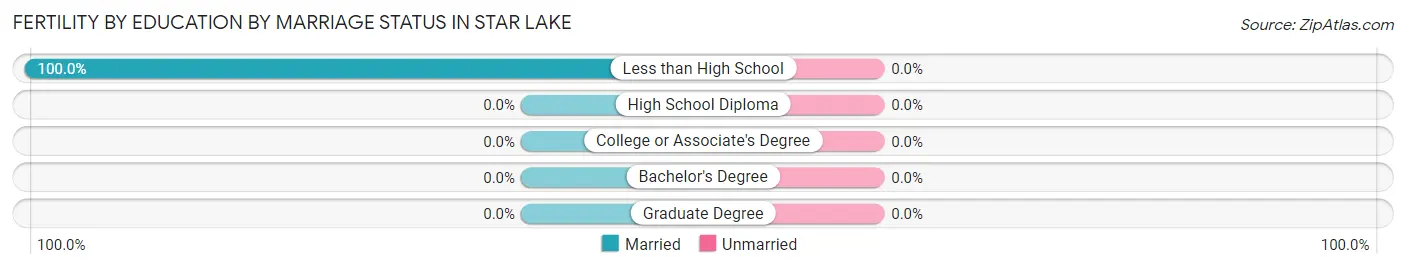
| Educational Attainment | Married | Unmarried |
| Less than High School | 6 (100.0%) | 0 (0.0%) |
| High School Diploma | 0 (0.0%) | 0 (0.0%) |
| College or Associate's Degree | 0 (0.0%) | 0 (0.0%) |
| Bachelor's Degree | 0 (0.0%) | 0 (0.0%) |
| Graduate Degree | 0 (0.0%) | 0 (0.0%) |
| Total | 6 (100.0%) | 0 (0.0%) |
Employment Characteristics in Star Lake
Employment by Class of Employer in Star Lake
Among the 233 employed individuals in Star Lake, not-for-profit organizations (76 | 32.6%), private company employees (68 | 29.2%), and state government employees (41 | 17.6%) make up the most common classes of employment.
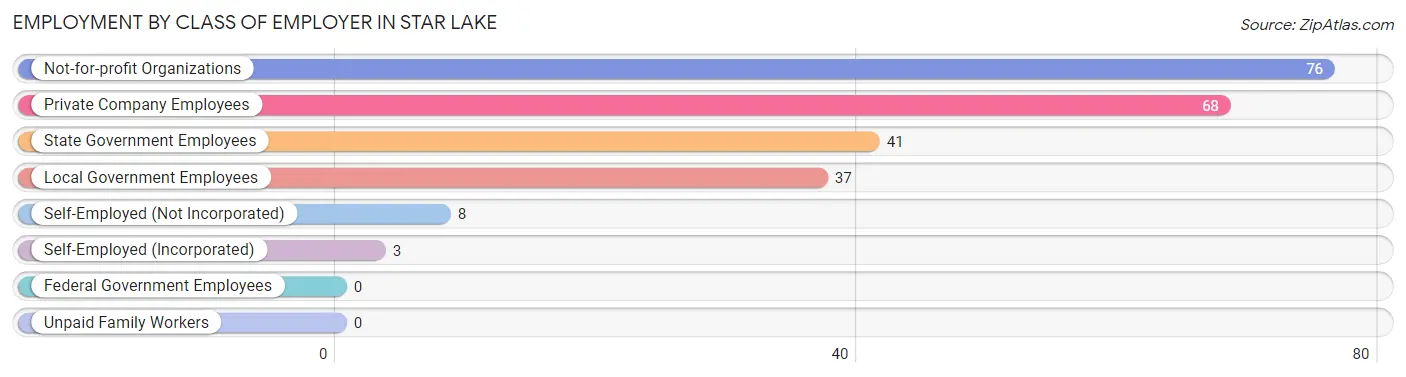
| Employer Class | # Employees | % Employees |
| Private Company Employees | 68 | 29.2% |
| Self-Employed (Incorporated) | 3 | 1.3% |
| Self-Employed (Not Incorporated) | 8 | 3.4% |
| Not-for-profit Organizations | 76 | 32.6% |
| Local Government Employees | 37 | 15.9% |
| State Government Employees | 41 | 17.6% |
| Federal Government Employees | 0 | 0.0% |
| Unpaid Family Workers | 0 | 0.0% |
| Total | 233 | 100.0% |
Employment Status by Age in Star Lake
According to the labor force statistics for Star Lake, out of the total population over 16 years of age (508), 47.6% or 242 individuals are in the labor force, with 2.9% or 7 of them unemployed. The age group with the highest labor force participation rate is 20 to 24 years, with 100.0% or 10 individuals in the labor force. Within the labor force, the 45 to 54 years age range has the highest percentage of unemployed individuals, with 14.3% or 4 of them being unemployed.
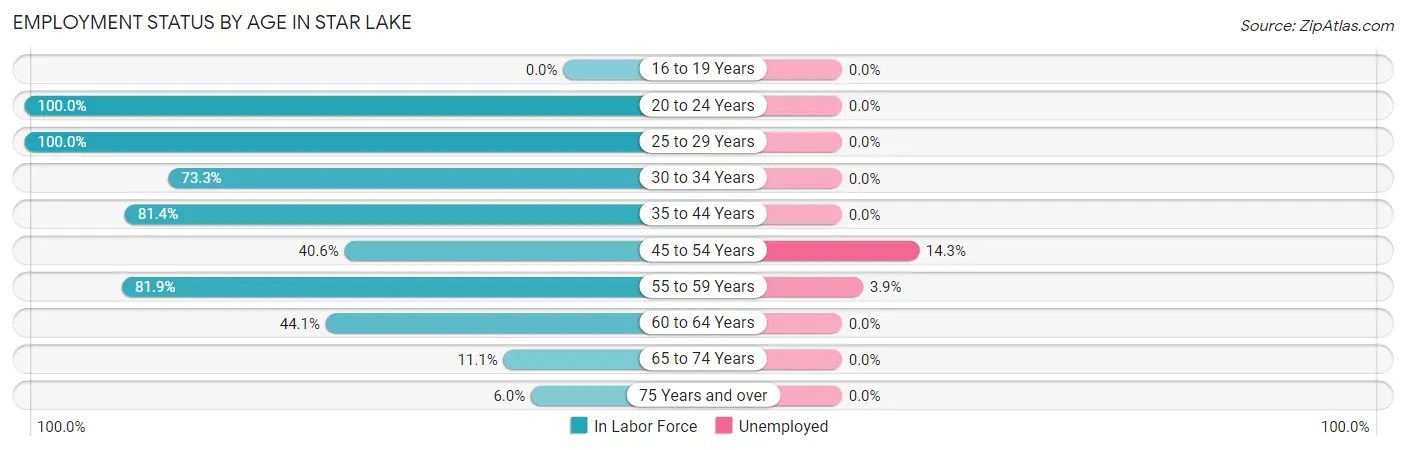
| Age Bracket | In Labor Force | Unemployed |
| 16 to 19 Years | 0 (0.0%) | 0 (0.0%) |
| 20 to 24 Years | 10 (100.0%) | 0 (0.0%) |
| 25 to 29 Years | 14 (100.0%) | 0 (0.0%) |
| 30 to 34 Years | 33 (73.3%) | 0 (0.0%) |
| 35 to 44 Years | 35 (81.4%) | 0 (0.0%) |
| 45 to 54 Years | 28 (40.6%) | 4 (14.3%) |
| 55 to 59 Years | 77 (81.9%) | 3 (3.9%) |
| 60 to 64 Years | 30 (44.1%) | 0 (0.0%) |
| 65 to 74 Years | 12 (11.1%) | 0 (0.0%) |
| 75 Years and over | 3 (6.0%) | 0 (0.0%) |
| Total | 242 (47.6%) | 7 (2.9%) |
Employment Status by Educational Attainment in Star Lake
According to labor force statistics for Star Lake, 65.2% of individuals (217) out of the total population between 25 and 64 years of age (333) are in the labor force, with 3.2% or 7 of them being unemployed. The group with the highest labor force participation rate are those with the educational attainment of bachelor's degree or higher, with 90.3% or 84 individuals in the labor force. Within the labor force, individuals with high school diploma education have the highest percentage of unemployment, with 13.5% or 7 of them being unemployed.
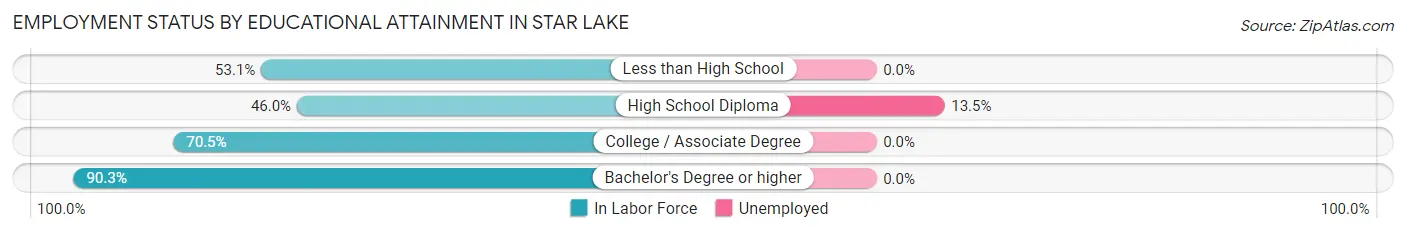
| Educational Attainment | In Labor Force | Unemployed |
| Less than High School | 26 (53.1%) | 0 (0.0%) |
| High School Diploma | 52 (46.0%) | 15 (13.5%) |
| College / Associate Degree | 55 (70.5%) | 0 (0.0%) |
| Bachelor's Degree or higher | 84 (90.3%) | 0 (0.0%) |
| Total | 217 (65.2%) | 11 (3.2%) |
Employment Occupations by Sex in Star Lake
Management, Business, Science and Arts Occupations
The most common Management, Business, Science and Arts occupations in Star Lake are Community & Social Service (54 | 23.0%), Education Instruction & Library (54 | 23.0%), Health Diagnosing & Treating (39 | 16.6%), Health Technologists (38 | 16.2%), and Business & Financial (10 | 4.3%).
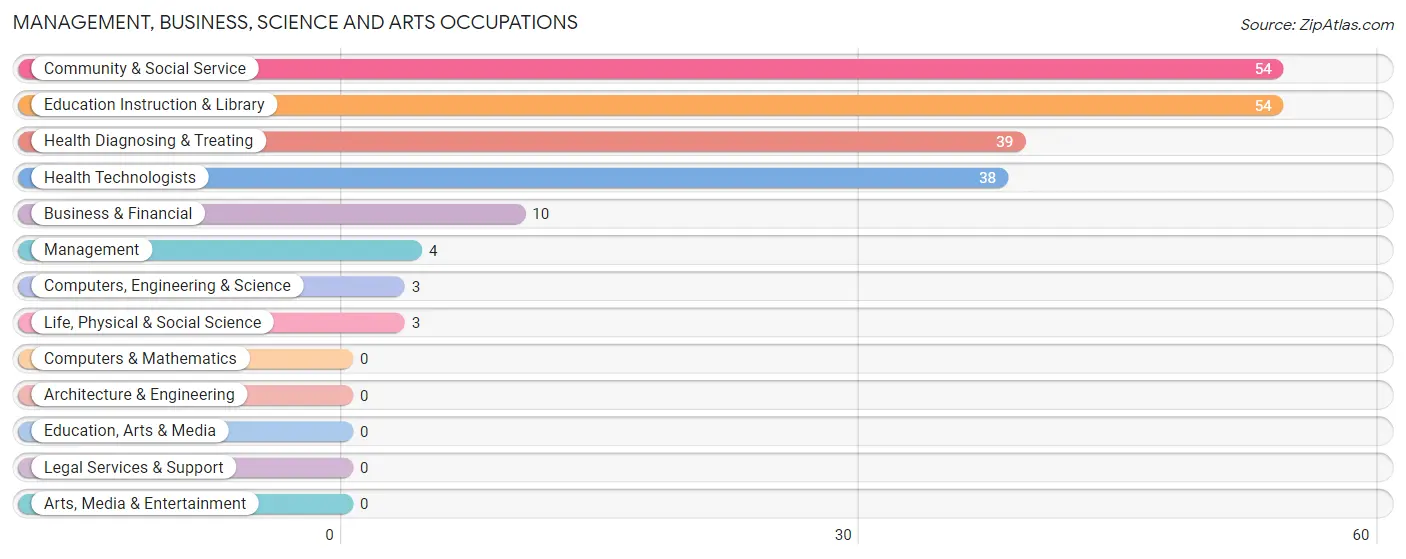
Management, Business, Science and Arts Occupations by Sex
Within the Management, Business, Science and Arts occupations in Star Lake, the most male-oriented occupations are Computers, Engineering & Science (100.0%), Life, Physical & Social Science (100.0%), and Business & Financial (80.0%), while the most female-oriented occupations are Health Diagnosing & Treating (66.7%), Health Technologists (65.8%), and Management (25.0%).
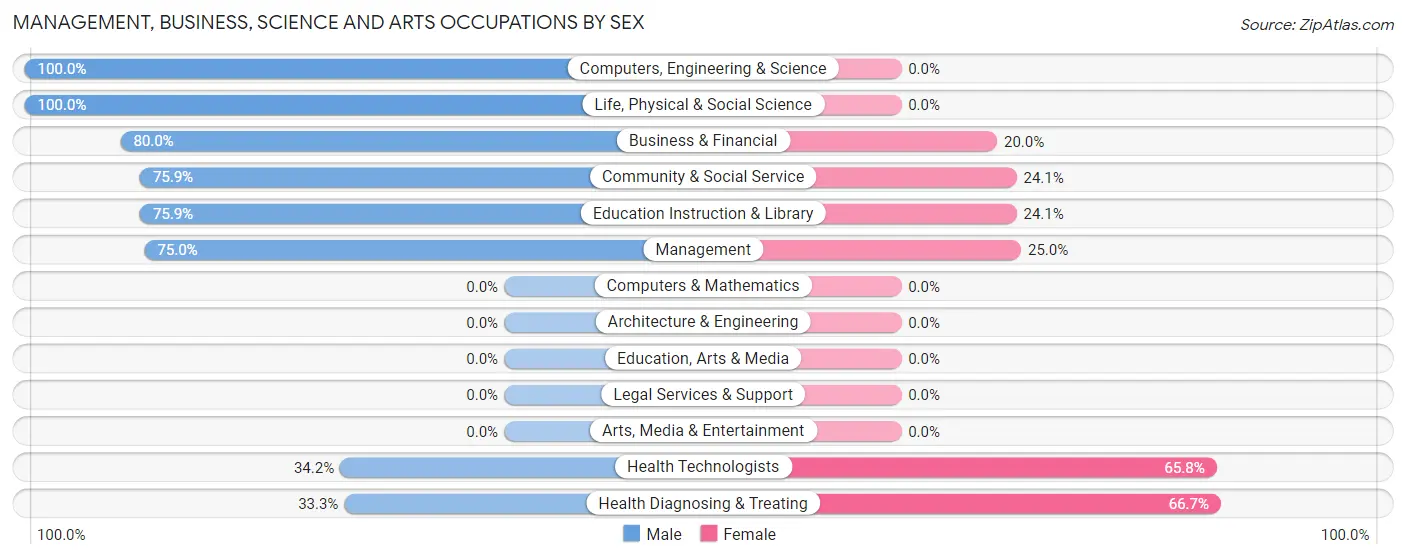
| Occupation | Male | Female |
| Management | 3 (75.0%) | 1 (25.0%) |
| Business & Financial | 8 (80.0%) | 2 (20.0%) |
| Computers, Engineering & Science | 3 (100.0%) | 0 (0.0%) |
| Computers & Mathematics | 0 (0.0%) | 0 (0.0%) |
| Architecture & Engineering | 0 (0.0%) | 0 (0.0%) |
| Life, Physical & Social Science | 3 (100.0%) | 0 (0.0%) |
| Community & Social Service | 41 (75.9%) | 13 (24.1%) |
| Education, Arts & Media | 0 (0.0%) | 0 (0.0%) |
| Legal Services & Support | 0 (0.0%) | 0 (0.0%) |
| Education Instruction & Library | 41 (75.9%) | 13 (24.1%) |
| Arts, Media & Entertainment | 0 (0.0%) | 0 (0.0%) |
| Health Diagnosing & Treating | 13 (33.3%) | 26 (66.7%) |
| Health Technologists | 13 (34.2%) | 25 (65.8%) |
| Total (Category) | 68 (61.8%) | 42 (38.2%) |
| Total (Overall) | 145 (61.7%) | 90 (38.3%) |
Services Occupations
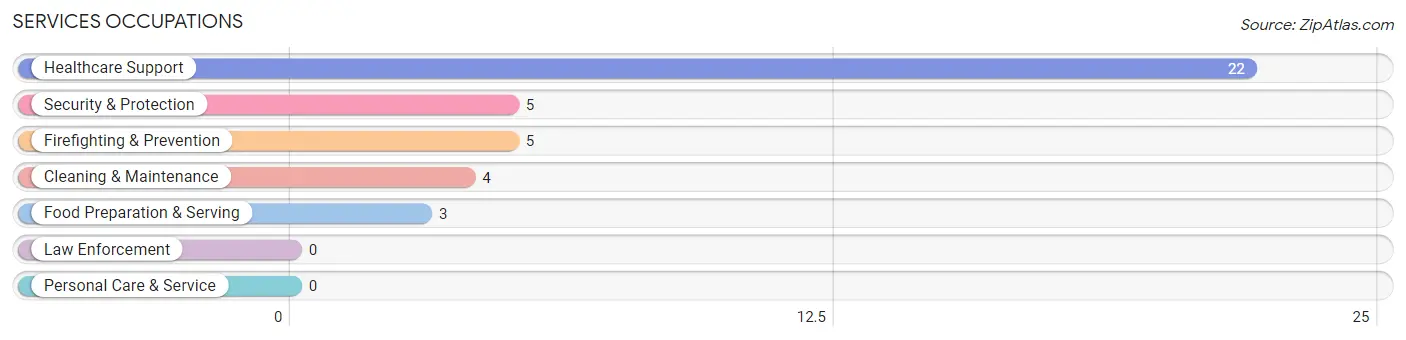
The most common Services occupations in Star Lake are Healthcare Support (22 | 9.4%), Security & Protection (5 | 2.1%), Firefighting & Prevention (5 | 2.1%), Cleaning & Maintenance (4 | 1.7%), and Food Preparation & Serving (3 | 1.3%).
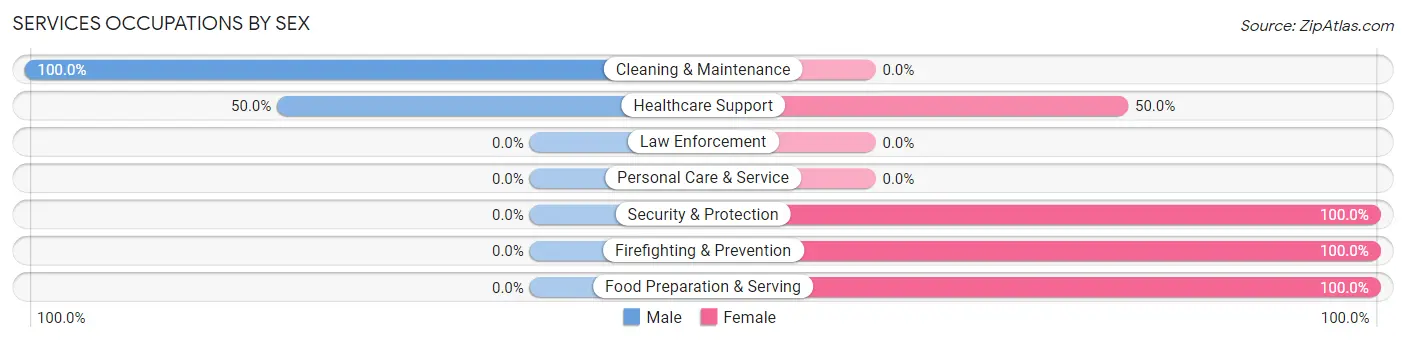
Services Occupations by Sex
Within the Services occupations in Star Lake, the most male-oriented occupations are Cleaning & Maintenance (100.0%), and Healthcare Support (50.0%), while the most female-oriented occupations are Security & Protection (100.0%), Firefighting & Prevention (100.0%), and Food Preparation & Serving (100.0%).
| Occupation | Male | Female |
| Healthcare Support | 11 (50.0%) | 11 (50.0%) |
| Security & Protection | 0 (0.0%) | 5 (100.0%) |
| Firefighting & Prevention | 0 (0.0%) | 5 (100.0%) |
| Law Enforcement | 0 (0.0%) | 0 (0.0%) |
| Food Preparation & Serving | 0 (0.0%) | 3 (100.0%) |
| Cleaning & Maintenance | 4 (100.0%) | 0 (0.0%) |
| Personal Care & Service | 0 (0.0%) | 0 (0.0%) |
| Total (Category) | 15 (44.1%) | 19 (55.9%) |
| Total (Overall) | 145 (61.7%) | 90 (38.3%) |
Sales and Office Occupations
The most common Sales and Office occupations in Star Lake are Office & Administration (25 | 10.6%), and Sales & Related (4 | 1.7%).
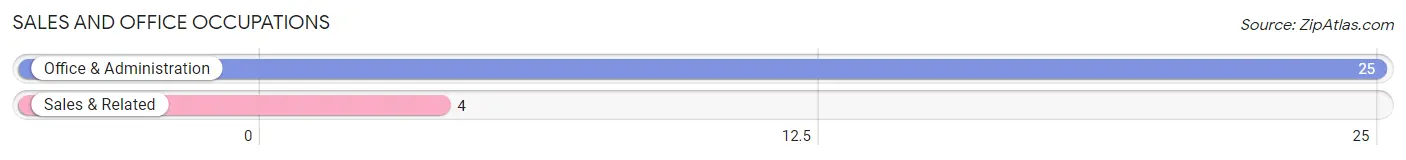
Sales and Office Occupations by Sex
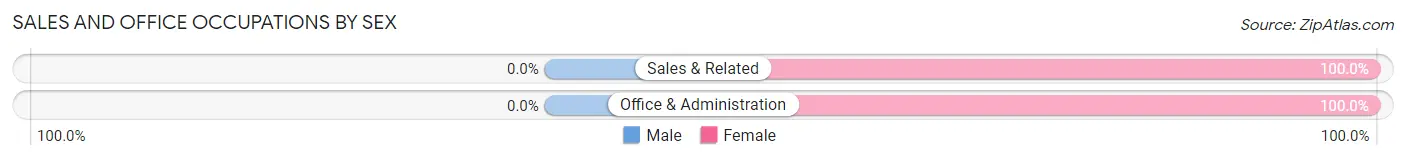
| Occupation | Male | Female |
| Sales & Related | 0 (0.0%) | 4 (100.0%) |
| Office & Administration | 0 (0.0%) | 25 (100.0%) |
| Total (Category) | 0 (0.0%) | 29 (100.0%) |
| Total (Overall) | 145 (61.7%) | 90 (38.3%) |
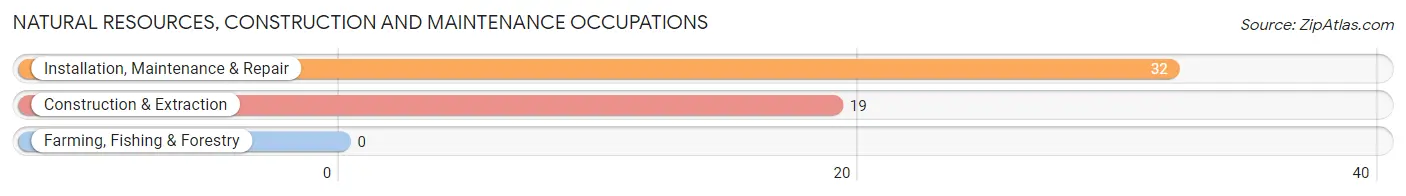
Natural Resources, Construction and Maintenance Occupations
The most common Natural Resources, Construction and Maintenance occupations in Star Lake are Installation, Maintenance & Repair (32 | 13.6%), and Construction & Extraction (19 | 8.1%).
Natural Resources, Construction and Maintenance Occupations by Sex
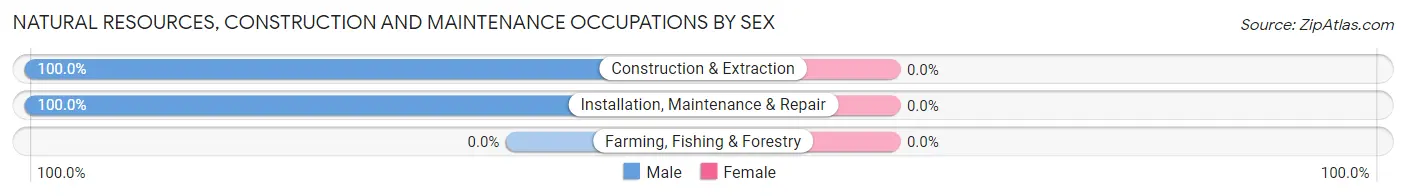
| Occupation | Male | Female |
| Farming, Fishing & Forestry | 0 (0.0%) | 0 (0.0%) |
| Construction & Extraction | 19 (100.0%) | 0 (0.0%) |
| Installation, Maintenance & Repair | 32 (100.0%) | 0 (0.0%) |
| Total (Category) | 51 (100.0%) | 0 (0.0%) |
| Total (Overall) | 145 (61.7%) | 90 (38.3%) |
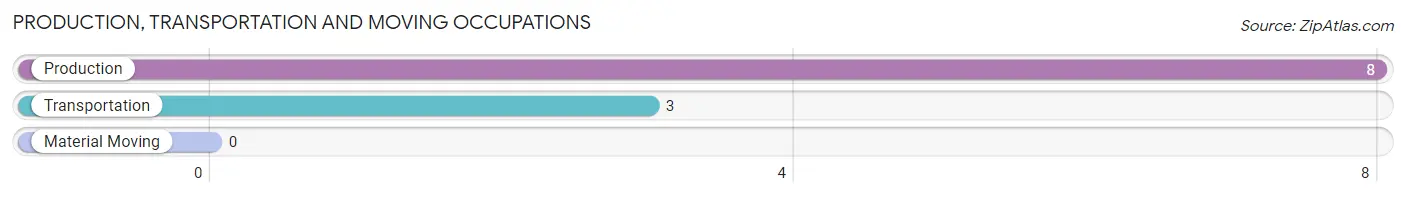
Production, Transportation and Moving Occupations
The most common Production, Transportation and Moving occupations in Star Lake are Production (8 | 3.4%), and Transportation (3 | 1.3%).
Production, Transportation and Moving Occupations by Sex
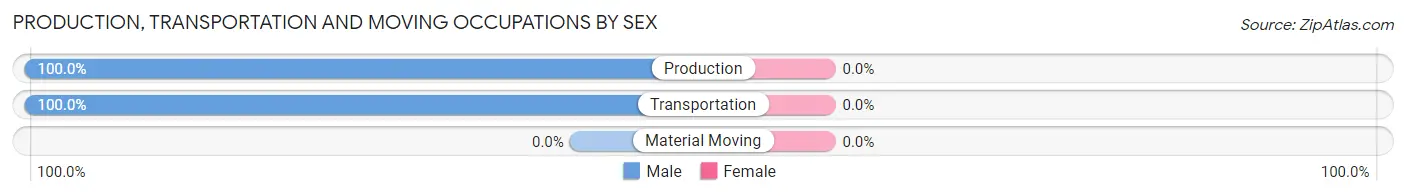
| Occupation | Male | Female |
| Production | 8 (100.0%) | 0 (0.0%) |
| Transportation | 3 (100.0%) | 0 (0.0%) |
| Material Moving | 0 (0.0%) | 0 (0.0%) |
| Total (Category) | 11 (100.0%) | 0 (0.0%) |
| Total (Overall) | 145 (61.7%) | 90 (38.3%) |
Employment Industries by Sex in Star Lake
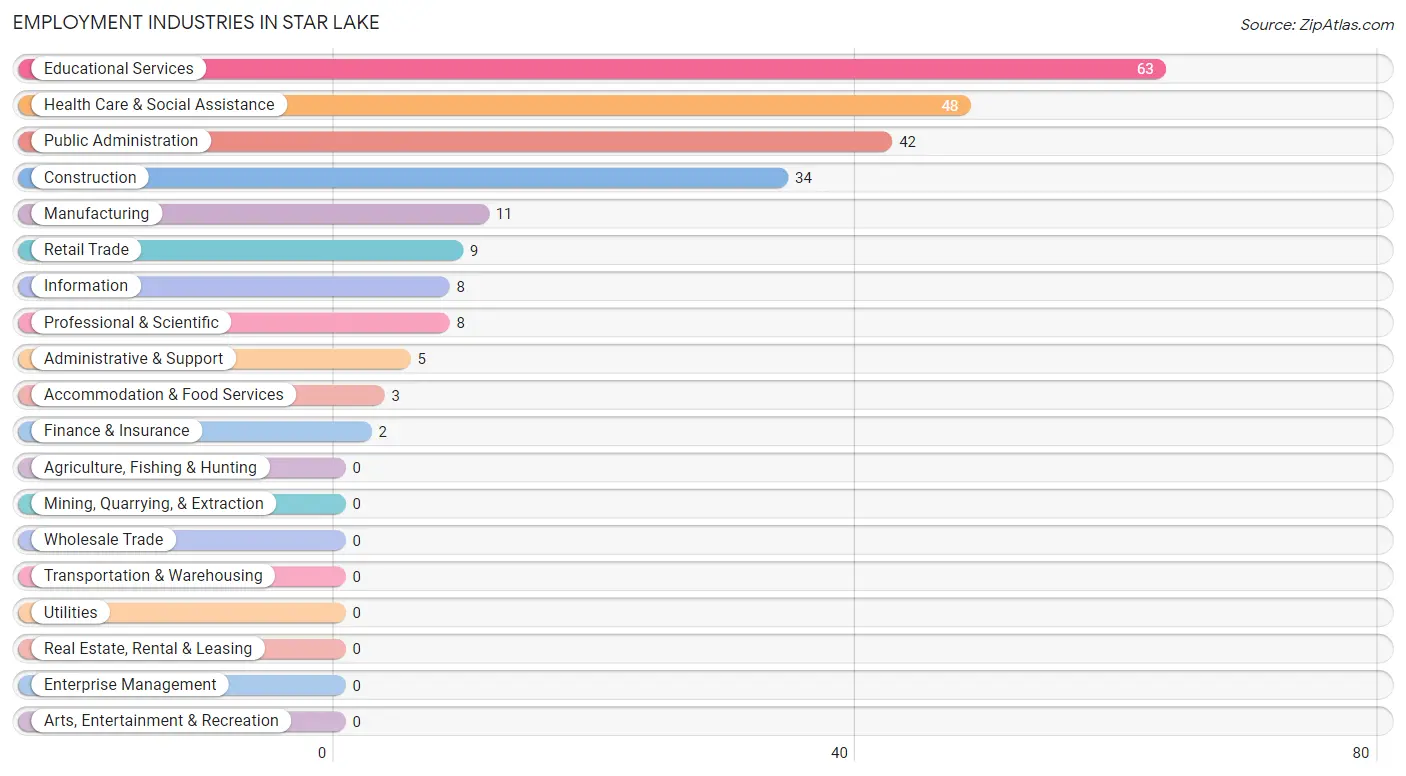
Employment Industries in Star Lake
The major employment industries in Star Lake include Educational Services (63 | 26.8%), Health Care & Social Assistance (48 | 20.4%), Public Administration (42 | 17.9%), Construction (34 | 14.5%), and Manufacturing (11 | 4.7%).
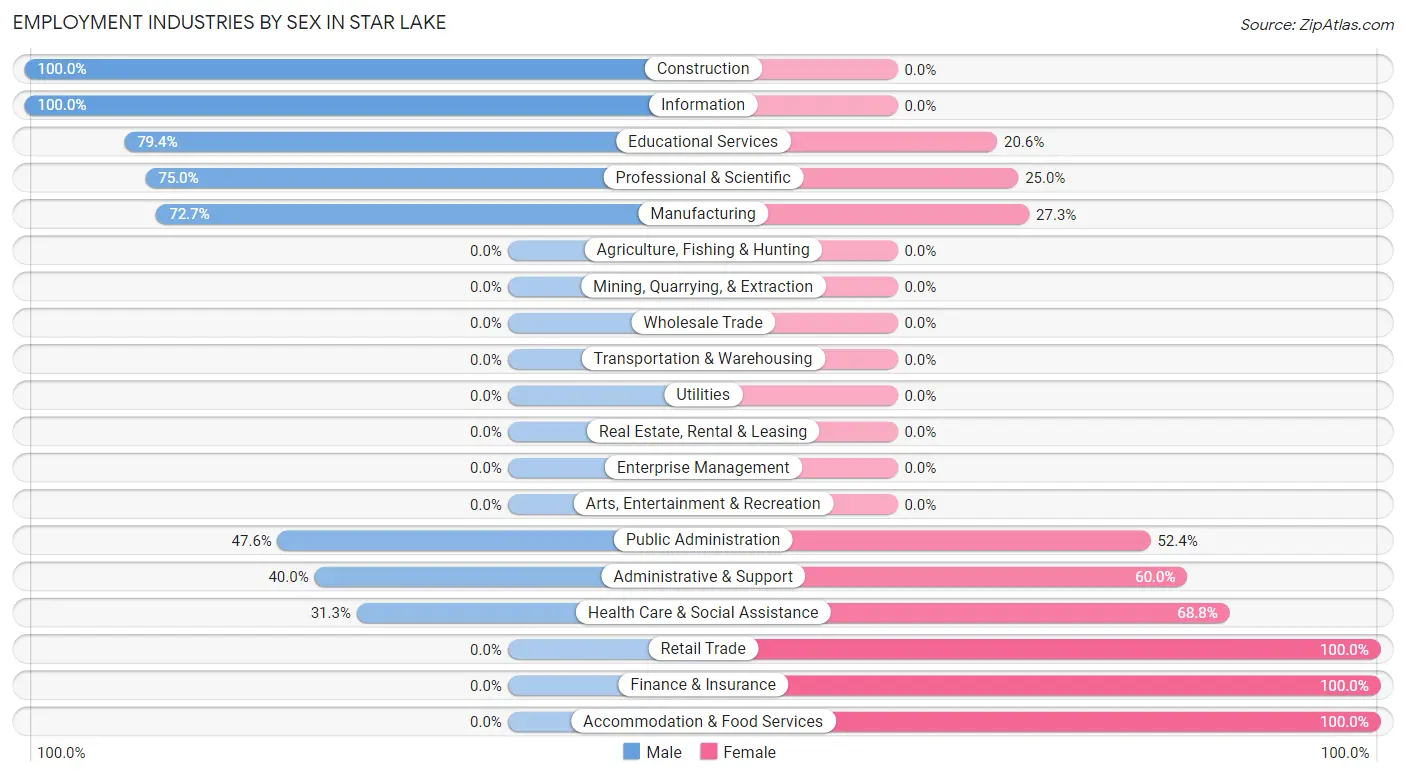
Employment Industries by Sex in Star Lake
The Star Lake industries that see more men than women are Construction (100.0%), Information (100.0%), and Educational Services (79.4%), whereas the industries that tend to have a higher number of women are Retail Trade (100.0%), Finance & Insurance (100.0%), and Accommodation & Food Services (100.0%).
| Industry | Male | Female |
| Agriculture, Fishing & Hunting | 0 (0.0%) | 0 (0.0%) |
| Mining, Quarrying, & Extraction | 0 (0.0%) | 0 (0.0%) |
| Construction | 34 (100.0%) | 0 (0.0%) |
| Manufacturing | 8 (72.7%) | 3 (27.3%) |
| Wholesale Trade | 0 (0.0%) | 0 (0.0%) |
| Retail Trade | 0 (0.0%) | 9 (100.0%) |
| Transportation & Warehousing | 0 (0.0%) | 0 (0.0%) |
| Utilities | 0 (0.0%) | 0 (0.0%) |
| Information | 8 (100.0%) | 0 (0.0%) |
| Finance & Insurance | 0 (0.0%) | 2 (100.0%) |
| Real Estate, Rental & Leasing | 0 (0.0%) | 0 (0.0%) |
| Professional & Scientific | 6 (75.0%) | 2 (25.0%) |
| Enterprise Management | 0 (0.0%) | 0 (0.0%) |
| Administrative & Support | 2 (40.0%) | 3 (60.0%) |
| Educational Services | 50 (79.4%) | 13 (20.6%) |
| Health Care & Social Assistance | 15 (31.2%) | 33 (68.8%) |
| Arts, Entertainment & Recreation | 0 (0.0%) | 0 (0.0%) |
| Accommodation & Food Services | 0 (0.0%) | 3 (100.0%) |
| Public Administration | 20 (47.6%) | 22 (52.4%) |
| Total | 145 (61.7%) | 90 (38.3%) |
Education in Star Lake
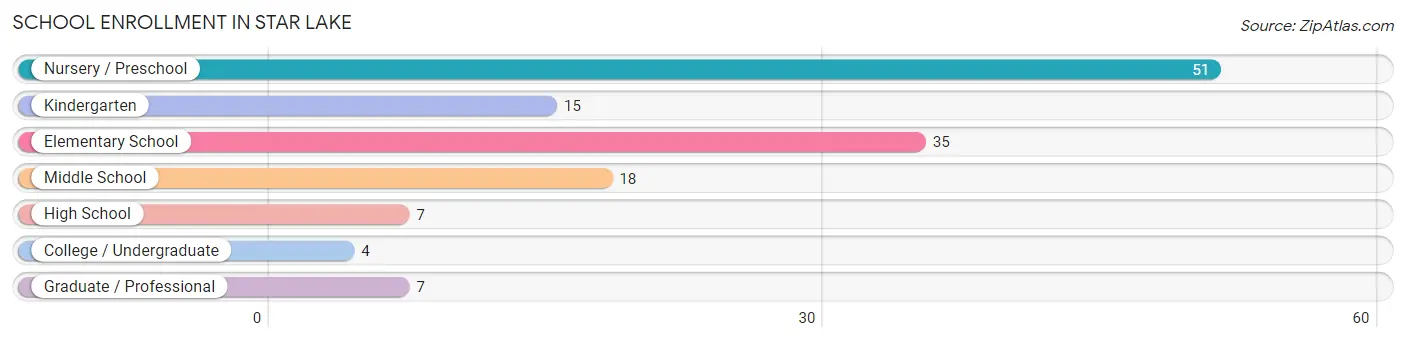
School Enrollment in Star Lake
The most common levels of schooling among the 137 students in Star Lake are nursery / preschool (51 | 37.2%), elementary school (35 | 25.6%), and middle school (18 | 13.1%).
| School Level | # Students | % Students |
| Nursery / Preschool | 51 | 37.2% |
| Kindergarten | 15 | 11.0% |
| Elementary School | 35 | 25.6% |
| Middle School | 18 | 13.1% |
| High School | 7 | 5.1% |
| College / Undergraduate | 4 | 2.9% |
| Graduate / Professional | 7 | 5.1% |
| Total | 137 | 100.0% |
School Enrollment by Age by Funding Source in Star Lake
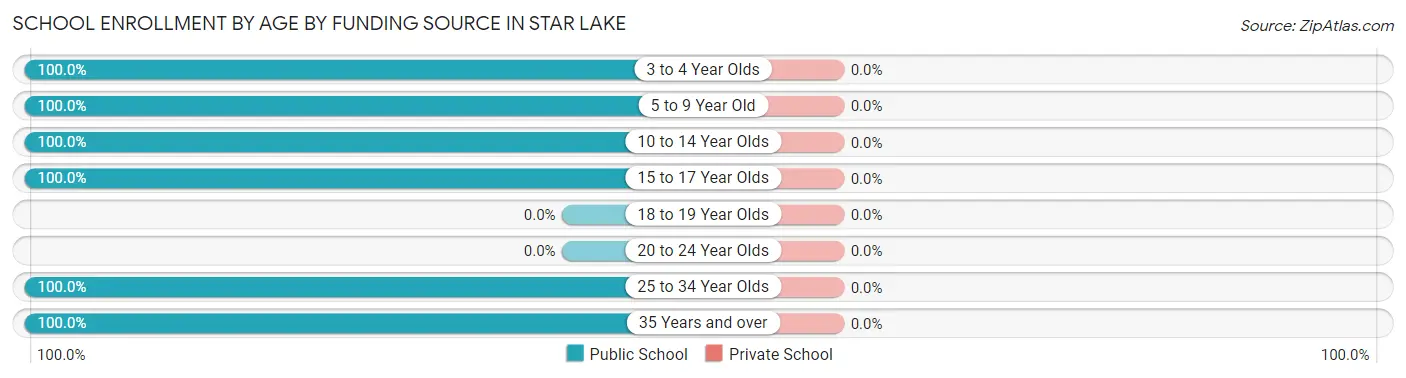
| Age Bracket | Public School | Private School |
| 3 to 4 Year Olds | 51 (100.0%) | 0 (0.0%) |
| 5 to 9 Year Old | 50 (100.0%) | 0 (0.0%) |
| 10 to 14 Year Olds | 18 (100.0%) | 0 (0.0%) |
| 15 to 17 Year Olds | 7 (100.0%) | 0 (0.0%) |
| 18 to 19 Year Olds | 0 (0.0%) | 0 (0.0%) |
| 20 to 24 Year Olds | 0 (0.0%) | 0 (0.0%) |
| 25 to 34 Year Olds | 7 (100.0%) | 0 (0.0%) |
| 35 Years and over | 4 (100.0%) | 0 (0.0%) |
| Total | 137 (100.0%) | 0 (0.0%) |
Educational Attainment by Field of Study in Star Lake
Liberal arts & history (33 | 25.0%), education (29 | 22.0%), science & technology (25 | 18.9%), physical & health sciences (12 | 9.1%), and literature & languages (9 | 6.8%) are the most common fields of study among 132 individuals in Star Lake who have obtained a bachelor's degree or higher.
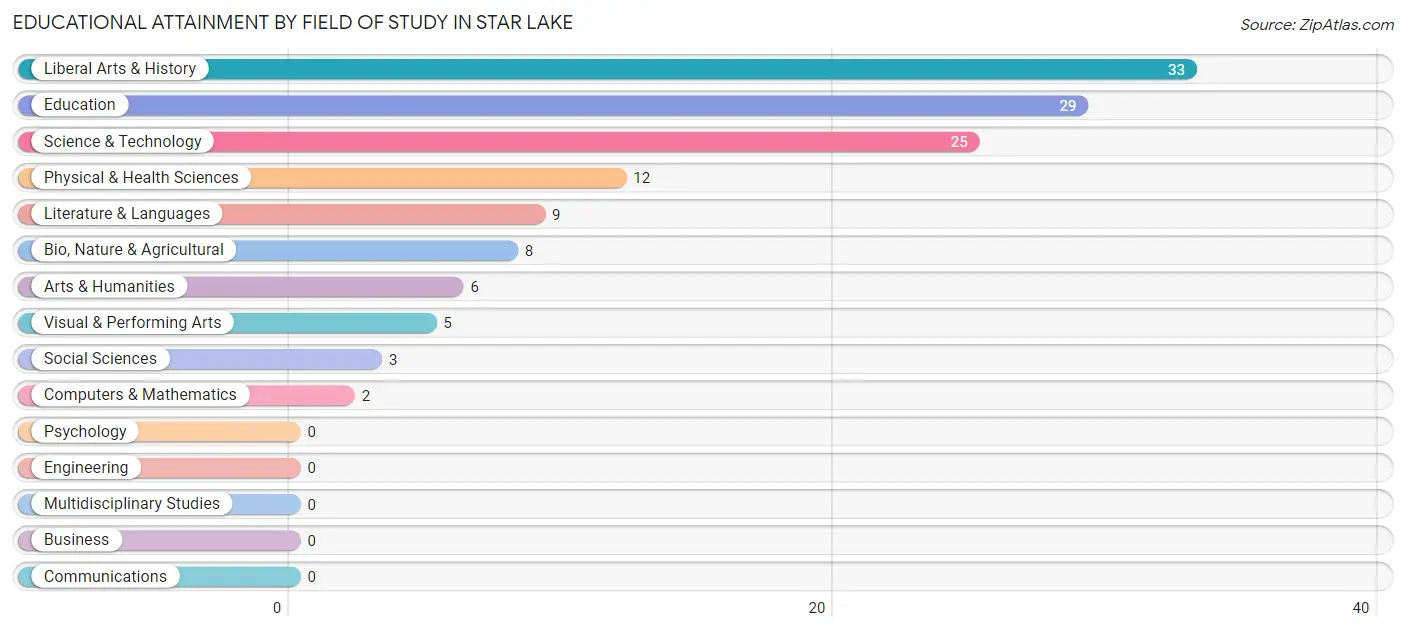
| Field of Study | # Graduates | % Graduates |
| Computers & Mathematics | 2 | 1.5% |
| Bio, Nature & Agricultural | 8 | 6.1% |
| Physical & Health Sciences | 12 | 9.1% |
| Psychology | 0 | 0.0% |
| Social Sciences | 3 | 2.3% |
| Engineering | 0 | 0.0% |
| Multidisciplinary Studies | 0 | 0.0% |
| Science & Technology | 25 | 18.9% |
| Business | 0 | 0.0% |
| Education | 29 | 22.0% |
| Literature & Languages | 9 | 6.8% |
| Liberal Arts & History | 33 | 25.0% |
| Visual & Performing Arts | 5 | 3.8% |
| Communications | 0 | 0.0% |
| Arts & Humanities | 6 | 4.5% |
| Total | 132 | 100.0% |
Transportation & Commute in Star Lake
Vehicle Availability by Sex in Star Lake
The most prevalent vehicle ownership categories in Star Lake are males with 2 vehicles (37, accounting for 33.6%) and females with 2 vehicles (38, making up 41.1%).
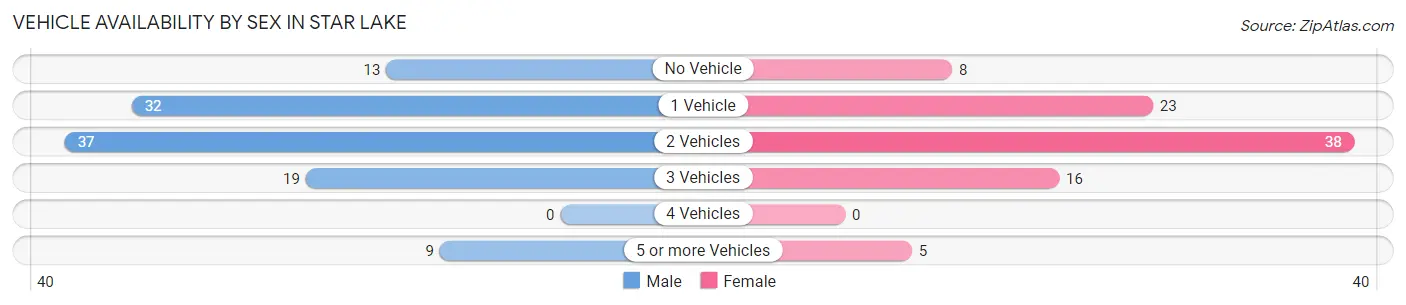
| Vehicles Available | Male | Female |
| No Vehicle | 13 (11.8%) | 8 (8.9%) |
| 1 Vehicle | 32 (29.1%) | 23 (25.6%) |
| 2 Vehicles | 37 (33.6%) | 38 (42.2%) |
| 3 Vehicles | 19 (17.3%) | 16 (17.8%) |
| 4 Vehicles | 0 (0.0%) | 0 (0.0%) |
| 5 or more Vehicles | 9 (8.2%) | 5 (5.6%) |
| Total | 110 (100.0%) | 90 (100.0%) |
Commute Time in Star Lake
The most frequently occuring commute durations in Star Lake are 45 to 59 minutes (36 commuters, 20.1%), 15 to 19 minutes (32 commuters, 17.9%), and 5 to 9 minutes (25 commuters, 14.0%).
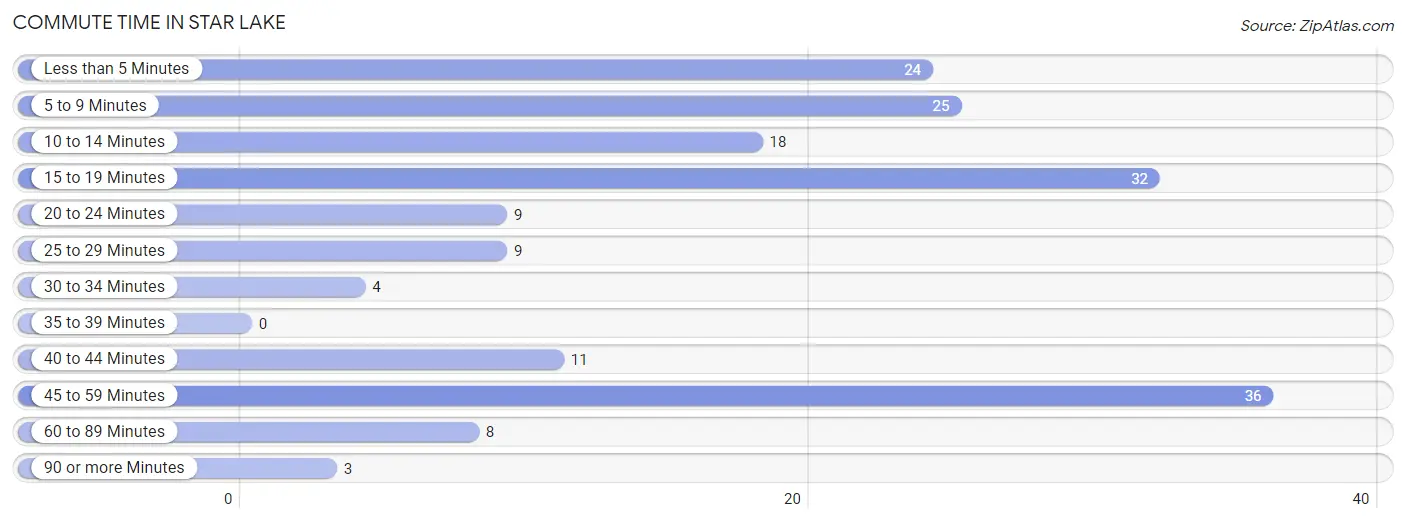
| Commute Time | # Commuters | % Commuters |
| Less than 5 Minutes | 24 | 13.4% |
| 5 to 9 Minutes | 25 | 14.0% |
| 10 to 14 Minutes | 18 | 10.1% |
| 15 to 19 Minutes | 32 | 17.9% |
| 20 to 24 Minutes | 9 | 5.0% |
| 25 to 29 Minutes | 9 | 5.0% |
| 30 to 34 Minutes | 4 | 2.2% |
| 35 to 39 Minutes | 0 | 0.0% |
| 40 to 44 Minutes | 11 | 6.1% |
| 45 to 59 Minutes | 36 | 20.1% |
| 60 to 89 Minutes | 8 | 4.5% |
| 90 or more Minutes | 3 | 1.7% |
Commute Time by Sex in Star Lake
The most common commute times in Star Lake are 15 to 19 minutes (27 commuters, 25.2%) for males and 45 to 59 minutes (31 commuters, 43.1%) for females.
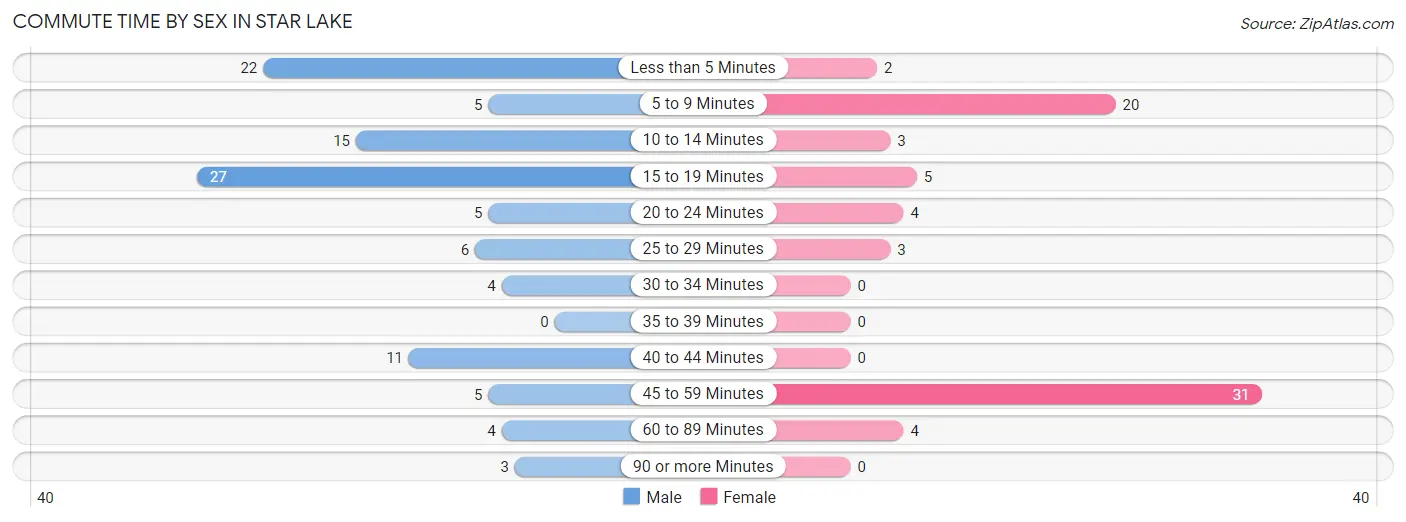
| Commute Time | Male | Female |
| Less than 5 Minutes | 22 (20.6%) | 2 (2.8%) |
| 5 to 9 Minutes | 5 (4.7%) | 20 (27.8%) |
| 10 to 14 Minutes | 15 (14.0%) | 3 (4.2%) |
| 15 to 19 Minutes | 27 (25.2%) | 5 (6.9%) |
| 20 to 24 Minutes | 5 (4.7%) | 4 (5.6%) |
| 25 to 29 Minutes | 6 (5.6%) | 3 (4.2%) |
| 30 to 34 Minutes | 4 (3.7%) | 0 (0.0%) |
| 35 to 39 Minutes | 0 (0.0%) | 0 (0.0%) |
| 40 to 44 Minutes | 11 (10.3%) | 0 (0.0%) |
| 45 to 59 Minutes | 5 (4.7%) | 31 (43.1%) |
| 60 to 89 Minutes | 4 (3.7%) | 4 (5.6%) |
| 90 or more Minutes | 3 (2.8%) | 0 (0.0%) |
Time of Departure to Work by Sex in Star Lake
The most frequent times of departure to work in Star Lake are 6:30 AM to 6:59 AM (34, 31.8%) for males and 6:30 AM to 6:59 AM (16, 22.2%) for females.
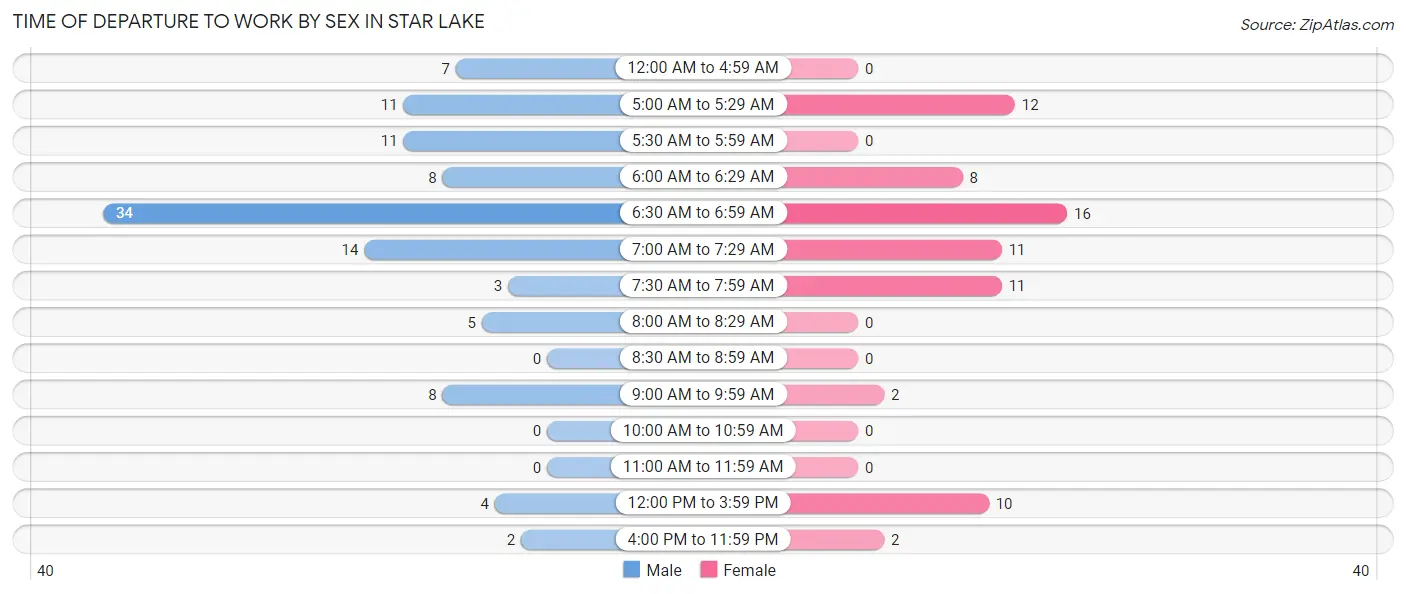
| Time of Departure | Male | Female |
| 12:00 AM to 4:59 AM | 7 (6.5%) | 0 (0.0%) |
| 5:00 AM to 5:29 AM | 11 (10.3%) | 12 (16.7%) |
| 5:30 AM to 5:59 AM | 11 (10.3%) | 0 (0.0%) |
| 6:00 AM to 6:29 AM | 8 (7.5%) | 8 (11.1%) |
| 6:30 AM to 6:59 AM | 34 (31.8%) | 16 (22.2%) |
| 7:00 AM to 7:29 AM | 14 (13.1%) | 11 (15.3%) |
| 7:30 AM to 7:59 AM | 3 (2.8%) | 11 (15.3%) |
| 8:00 AM to 8:29 AM | 5 (4.7%) | 0 (0.0%) |
| 8:30 AM to 8:59 AM | 0 (0.0%) | 0 (0.0%) |
| 9:00 AM to 9:59 AM | 8 (7.5%) | 2 (2.8%) |
| 10:00 AM to 10:59 AM | 0 (0.0%) | 0 (0.0%) |
| 11:00 AM to 11:59 AM | 0 (0.0%) | 0 (0.0%) |
| 12:00 PM to 3:59 PM | 4 (3.7%) | 10 (13.9%) |
| 4:00 PM to 11:59 PM | 2 (1.9%) | 2 (2.8%) |
| Total | 107 (100.0%) | 72 (100.0%) |
Housing Occupancy in Star Lake
Occupancy by Ownership in Star Lake
Of the total 277 dwellings in Star Lake, owner-occupied units account for 215 (77.6%), while renter-occupied units make up 62 (22.4%).
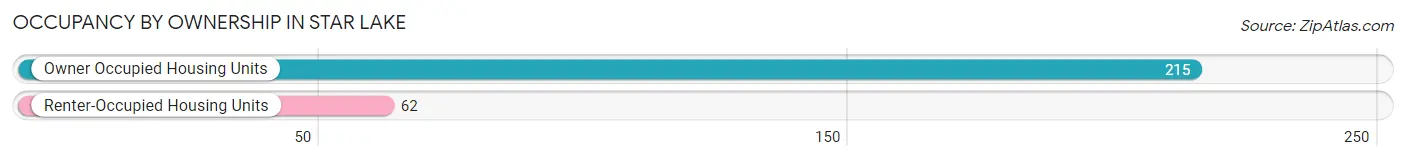
| Occupancy | # Housing Units | % Housing Units |
| Owner Occupied Housing Units | 215 | 77.6% |
| Renter-Occupied Housing Units | 62 | 22.4% |
| Total Occupied Housing Units | 277 | 100.0% |
Occupancy by Household Size in Star Lake
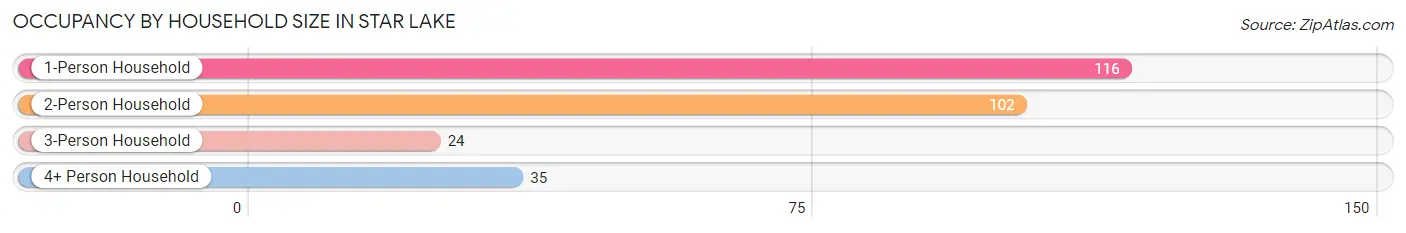
| Household Size | # Housing Units | % Housing Units |
| 1-Person Household | 116 | 41.9% |
| 2-Person Household | 102 | 36.8% |
| 3-Person Household | 24 | 8.7% |
| 4+ Person Household | 35 | 12.6% |
| Total Housing Units | 277 | 100.0% |
Occupancy by Ownership by Household Size in Star Lake
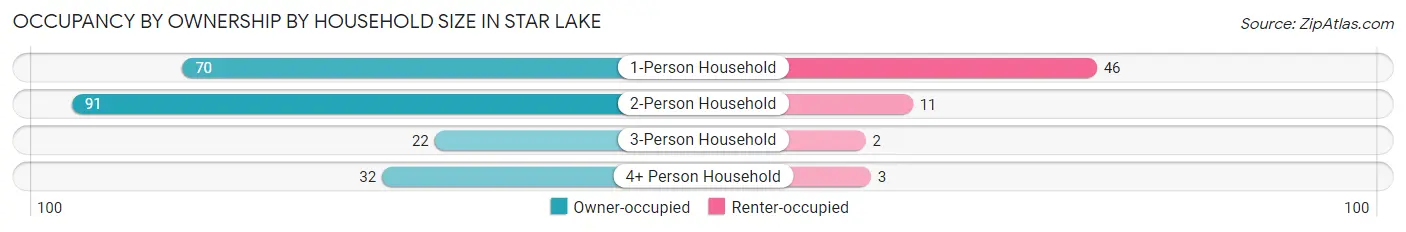
| Household Size | Owner-occupied | Renter-occupied |
| 1-Person Household | 70 (60.3%) | 46 (39.7%) |
| 2-Person Household | 91 (89.2%) | 11 (10.8%) |
| 3-Person Household | 22 (91.7%) | 2 (8.3%) |
| 4+ Person Household | 32 (91.4%) | 3 (8.6%) |
| Total Housing Units | 215 (77.6%) | 62 (22.4%) |
Occupancy by Educational Attainment in Star Lake
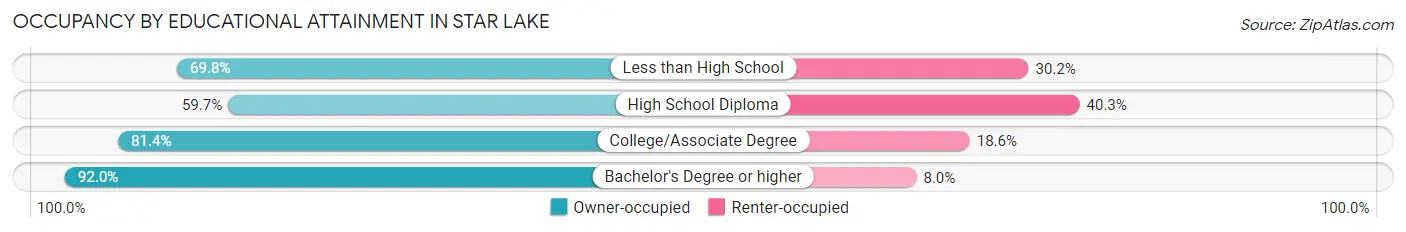
| Household Size | Owner-occupied | Renter-occupied |
| Less than High School | 30 (69.8%) | 13 (30.2%) |
| High School Diploma | 37 (59.7%) | 25 (40.3%) |
| College/Associate Degree | 79 (81.4%) | 18 (18.6%) |
| Bachelor's Degree or higher | 69 (92.0%) | 6 (8.0%) |
Occupancy by Age of Householder in Star Lake
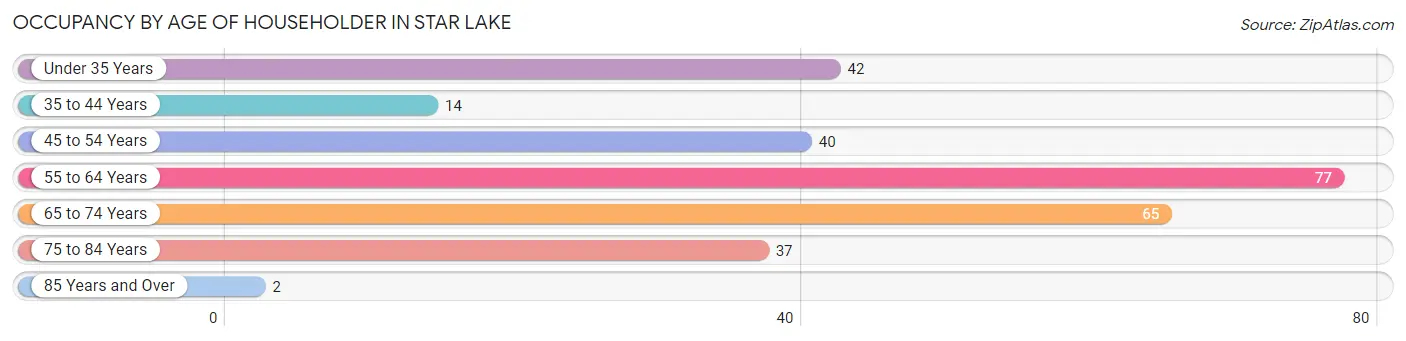
| Age Bracket | # Households | % Households |
| Under 35 Years | 42 | 15.2% |
| 35 to 44 Years | 14 | 5.1% |
| 45 to 54 Years | 40 | 14.4% |
| 55 to 64 Years | 77 | 27.8% |
| 65 to 74 Years | 65 | 23.5% |
| 75 to 84 Years | 37 | 13.4% |
| 85 Years and Over | 2 | 0.7% |
| Total | 277 | 100.0% |
Housing Finances in Star Lake
Median Income by Occupancy in Star Lake
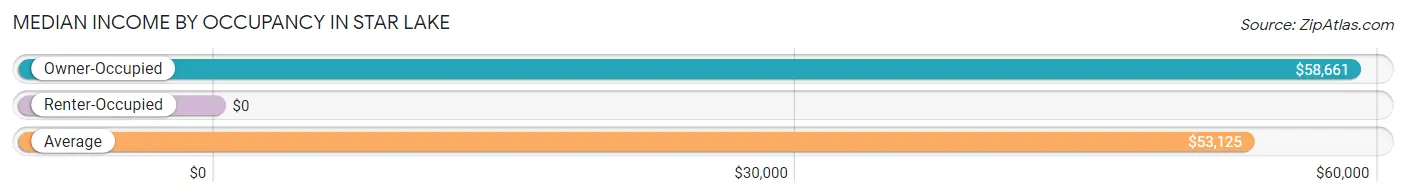
| Occupancy Type | # Households | Median Income |
| Owner-Occupied | 215 (77.6%) | $58,661 |
| Renter-Occupied | 62 (22.4%) | $0 |
| Average | 277 (100.0%) | $53,125 |
Occupancy by Householder Income Bracket in Star Lake
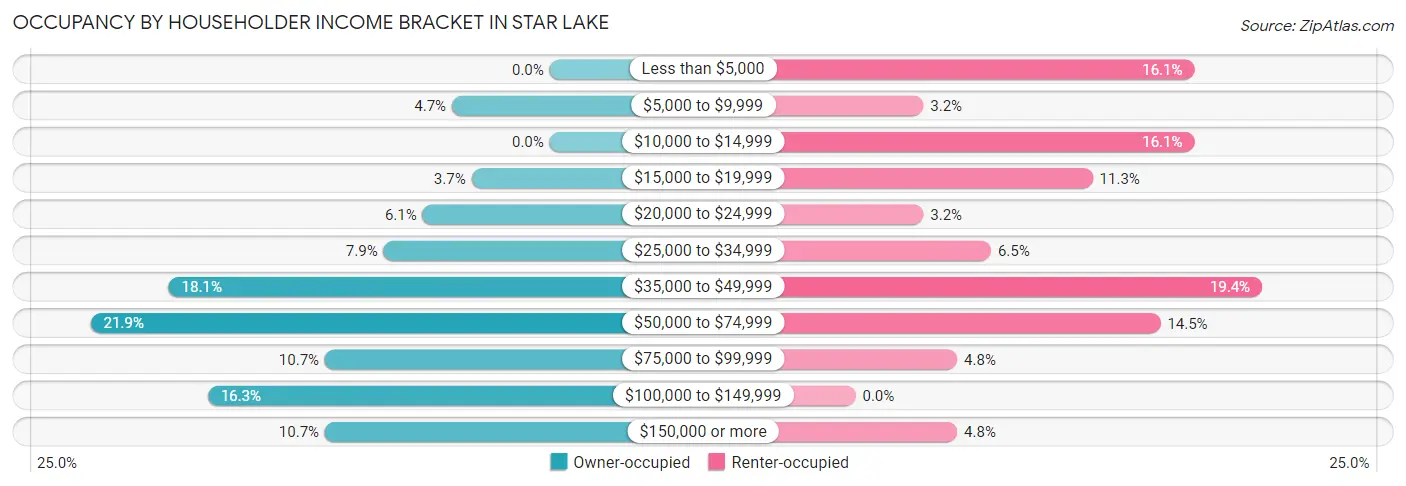
| Income Bracket | Owner-occupied | Renter-occupied |
| Less than $5,000 | 0 (0.0%) | 10 (16.1%) |
| $5,000 to $9,999 | 10 (4.6%) | 2 (3.2%) |
| $10,000 to $14,999 | 0 (0.0%) | 10 (16.1%) |
| $15,000 to $19,999 | 8 (3.7%) | 7 (11.3%) |
| $20,000 to $24,999 | 13 (6.0%) | 2 (3.2%) |
| $25,000 to $34,999 | 17 (7.9%) | 4 (6.5%) |
| $35,000 to $49,999 | 39 (18.1%) | 12 (19.4%) |
| $50,000 to $74,999 | 47 (21.9%) | 9 (14.5%) |
| $75,000 to $99,999 | 23 (10.7%) | 3 (4.8%) |
| $100,000 to $149,999 | 35 (16.3%) | 0 (0.0%) |
| $150,000 or more | 23 (10.7%) | 3 (4.8%) |
| Total | 215 (100.0%) | 62 (100.0%) |
Monthly Housing Cost Tiers in Star Lake
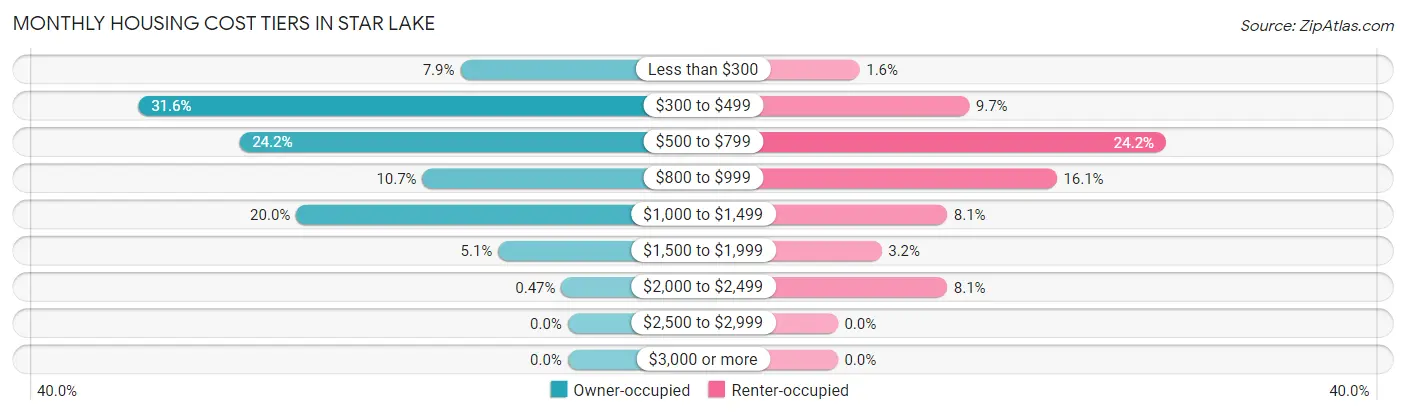
| Monthly Cost | Owner-occupied | Renter-occupied |
| Less than $300 | 17 (7.9%) | 1 (1.6%) |
| $300 to $499 | 68 (31.6%) | 6 (9.7%) |
| $500 to $799 | 52 (24.2%) | 15 (24.2%) |
| $800 to $999 | 23 (10.7%) | 10 (16.1%) |
| $1,000 to $1,499 | 43 (20.0%) | 5 (8.1%) |
| $1,500 to $1,999 | 11 (5.1%) | 2 (3.2%) |
| $2,000 to $2,499 | 1 (0.5%) | 5 (8.1%) |
| $2,500 to $2,999 | 0 (0.0%) | 0 (0.0%) |
| $3,000 or more | 0 (0.0%) | 0 (0.0%) |
| Total | 215 (100.0%) | 62 (100.0%) |
Physical Housing Characteristics in Star Lake
Housing Structures in Star Lake
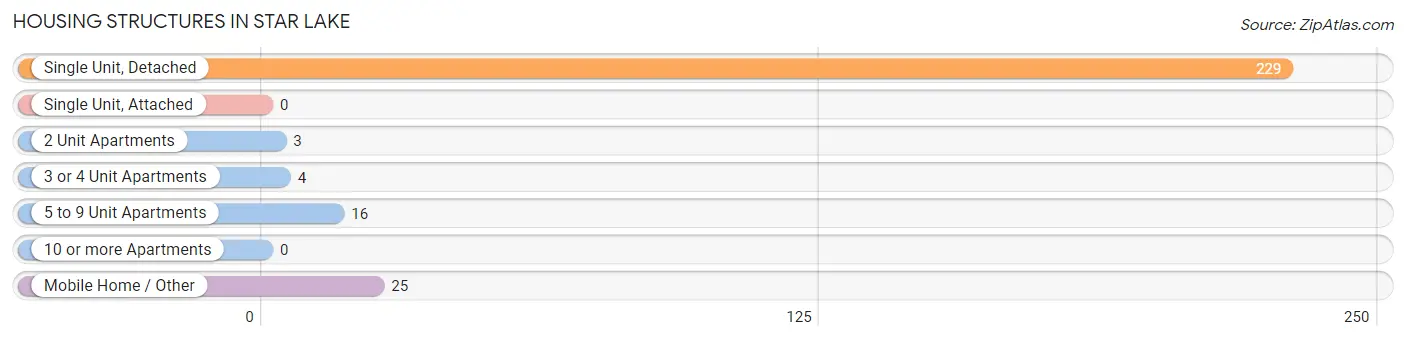
| Structure Type | # Housing Units | % Housing Units |
| Single Unit, Detached | 229 | 82.7% |
| Single Unit, Attached | 0 | 0.0% |
| 2 Unit Apartments | 3 | 1.1% |
| 3 or 4 Unit Apartments | 4 | 1.4% |
| 5 to 9 Unit Apartments | 16 | 5.8% |
| 10 or more Apartments | 0 | 0.0% |
| Mobile Home / Other | 25 | 9.0% |
| Total | 277 | 100.0% |
Housing Structures by Occupancy in Star Lake
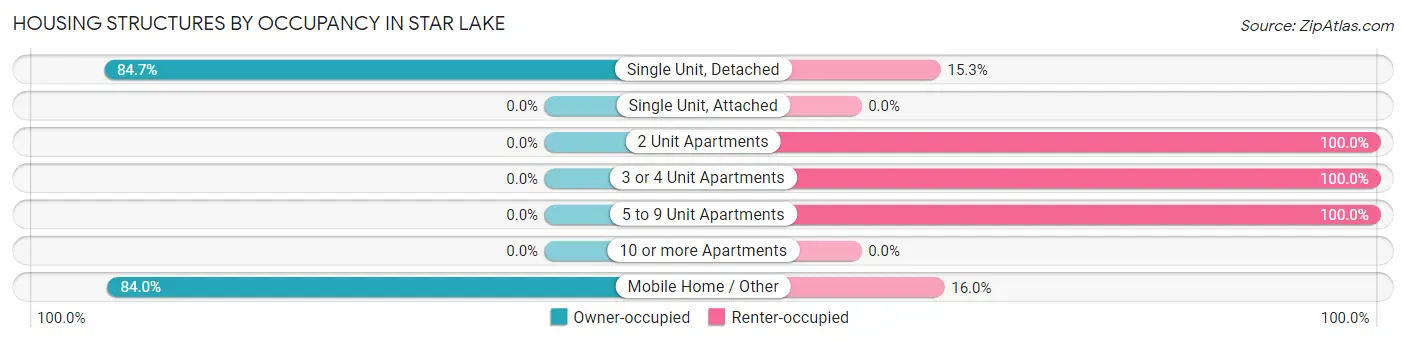
| Structure Type | Owner-occupied | Renter-occupied |
| Single Unit, Detached | 194 (84.7%) | 35 (15.3%) |
| Single Unit, Attached | 0 (0.0%) | 0 (0.0%) |
| 2 Unit Apartments | 0 (0.0%) | 3 (100.0%) |
| 3 or 4 Unit Apartments | 0 (0.0%) | 4 (100.0%) |
| 5 to 9 Unit Apartments | 0 (0.0%) | 16 (100.0%) |
| 10 or more Apartments | 0 (0.0%) | 0 (0.0%) |
| Mobile Home / Other | 21 (84.0%) | 4 (16.0%) |
| Total | 215 (77.6%) | 62 (22.4%) |
Housing Structures by Number of Rooms in Star Lake
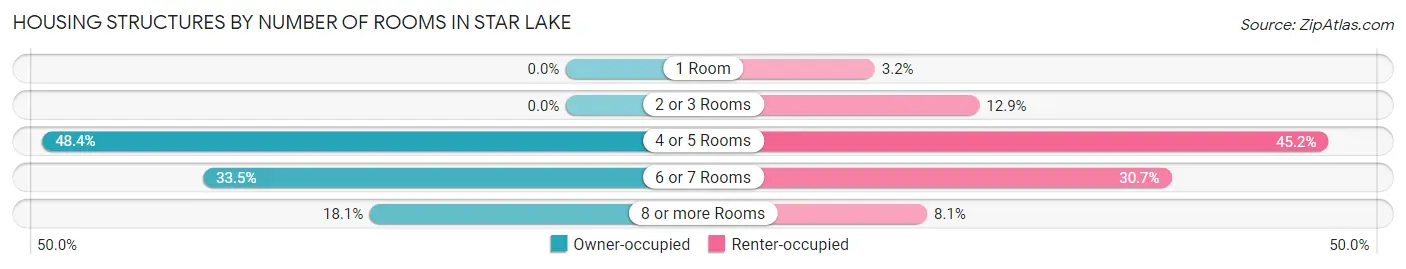
| Number of Rooms | Owner-occupied | Renter-occupied |
| 1 Room | 0 (0.0%) | 2 (3.2%) |
| 2 or 3 Rooms | 0 (0.0%) | 8 (12.9%) |
| 4 or 5 Rooms | 104 (48.4%) | 28 (45.2%) |
| 6 or 7 Rooms | 72 (33.5%) | 19 (30.6%) |
| 8 or more Rooms | 39 (18.1%) | 5 (8.1%) |
| Total | 215 (100.0%) | 62 (100.0%) |
Housing Structure by Heating Type in Star Lake
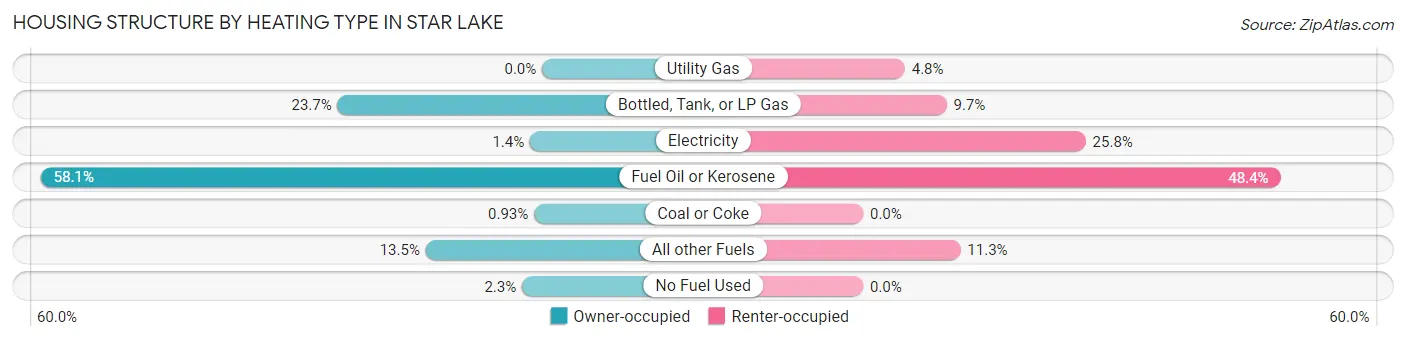
| Heating Type | Owner-occupied | Renter-occupied |
| Utility Gas | 0 (0.0%) | 3 (4.8%) |
| Bottled, Tank, or LP Gas | 51 (23.7%) | 6 (9.7%) |
| Electricity | 3 (1.4%) | 16 (25.8%) |
| Fuel Oil or Kerosene | 125 (58.1%) | 30 (48.4%) |
| Coal or Coke | 2 (0.9%) | 0 (0.0%) |
| All other Fuels | 29 (13.5%) | 7 (11.3%) |
| No Fuel Used | 5 (2.3%) | 0 (0.0%) |
| Total | 215 (100.0%) | 62 (100.0%) |
Household Vehicle Usage in Star Lake
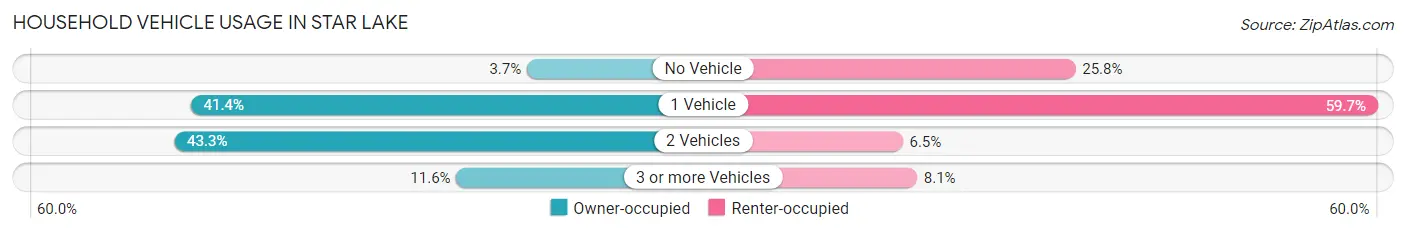
| Vehicles per Household | Owner-occupied | Renter-occupied |
| No Vehicle | 8 (3.7%) | 16 (25.8%) |
| 1 Vehicle | 89 (41.4%) | 37 (59.7%) |
| 2 Vehicles | 93 (43.3%) | 4 (6.5%) |
| 3 or more Vehicles | 25 (11.6%) | 5 (8.1%) |
| Total | 215 (100.0%) | 62 (100.0%) |
Real Estate & Mortgages in Star Lake
Real Estate and Mortgage Overview in Star Lake
| Characteristic | Without Mortgage | With Mortgage |
| Housing Units | 150 | 65 |
| Median Property Value | $81,000 | $71,900 |
| Median Household Income | $49,286 | $7 |
| Monthly Housing Costs | $473 | $0 |
| Real Estate Taxes | $1,706 | $0 |
Property Value by Mortgage Status in Star Lake
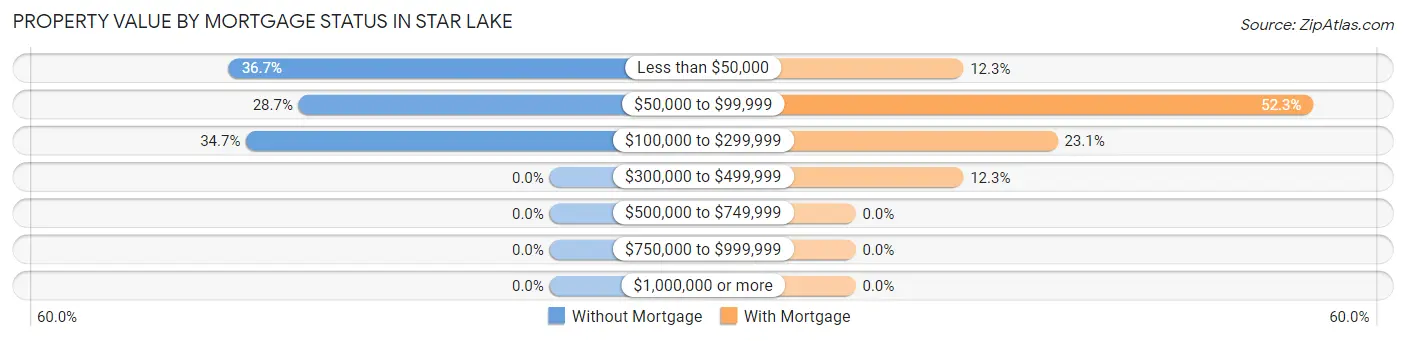
| Property Value | Without Mortgage | With Mortgage |
| Less than $50,000 | 55 (36.7%) | 8 (12.3%) |
| $50,000 to $99,999 | 43 (28.7%) | 34 (52.3%) |
| $100,000 to $299,999 | 52 (34.7%) | 15 (23.1%) |
| $300,000 to $499,999 | 0 (0.0%) | 8 (12.3%) |
| $500,000 to $749,999 | 0 (0.0%) | 0 (0.0%) |
| $750,000 to $999,999 | 0 (0.0%) | 0 (0.0%) |
| $1,000,000 or more | 0 (0.0%) | 0 (0.0%) |
| Total | 150 (100.0%) | 65 (100.0%) |
Household Income by Mortgage Status in Star Lake
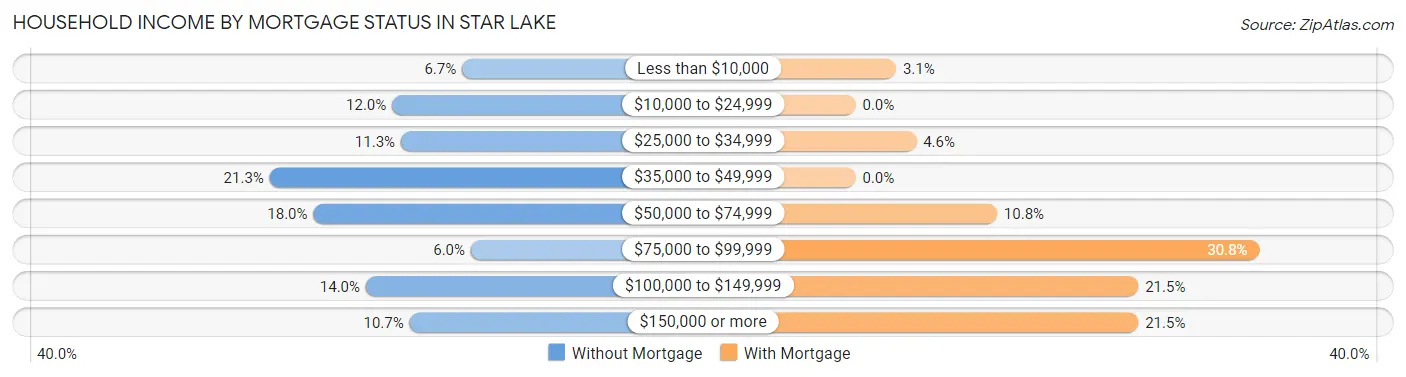
| Household Income | Without Mortgage | With Mortgage |
| Less than $10,000 | 10 (6.7%) | 2 (3.1%) |
| $10,000 to $24,999 | 18 (12.0%) | 0 (0.0%) |
| $25,000 to $34,999 | 17 (11.3%) | 3 (4.6%) |
| $35,000 to $49,999 | 32 (21.3%) | 0 (0.0%) |
| $50,000 to $74,999 | 27 (18.0%) | 7 (10.8%) |
| $75,000 to $99,999 | 9 (6.0%) | 20 (30.8%) |
| $100,000 to $149,999 | 21 (14.0%) | 14 (21.5%) |
| $150,000 or more | 16 (10.7%) | 14 (21.5%) |
| Total | 150 (100.0%) | 65 (100.0%) |
Property Value to Household Income Ratio in Star Lake
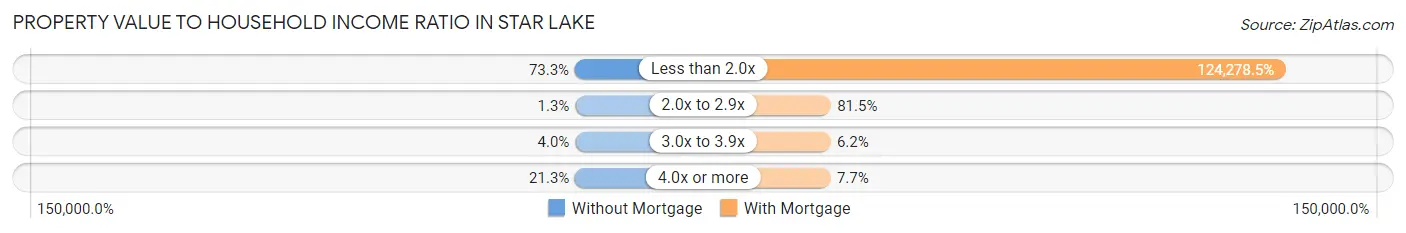
| Value-to-Income Ratio | Without Mortgage | With Mortgage |
| Less than 2.0x | 110 (73.3%) | 80,781 (124,278.5%) |
| 2.0x to 2.9x | 2 (1.3%) | 53 (81.5%) |
| 3.0x to 3.9x | 6 (4.0%) | 4 (6.1%) |
| 4.0x or more | 32 (21.3%) | 5 (7.7%) |
| Total | 150 (100.0%) | 65 (100.0%) |
Real Estate Taxes by Mortgage Status in Star Lake
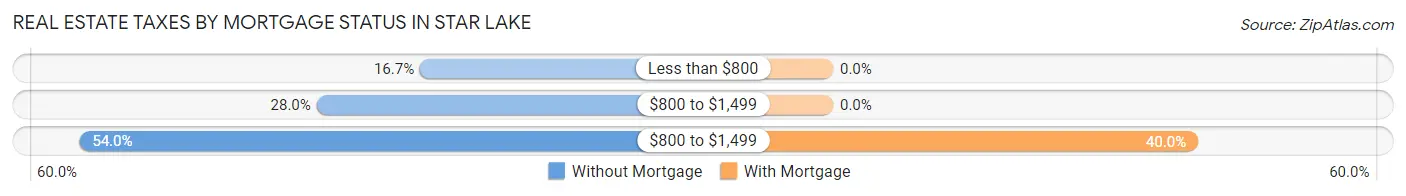
| Property Taxes | Without Mortgage | With Mortgage |
| Less than $800 | 25 (16.7%) | 0 (0.0%) |
| $800 to $1,499 | 42 (28.0%) | 0 (0.0%) |
| $800 to $1,499 | 81 (54.0%) | 26 (40.0%) |
| Total | 150 (100.0%) | 65 (100.0%) |
Health & Disability in Star Lake
Health Insurance Coverage by Age in Star Lake
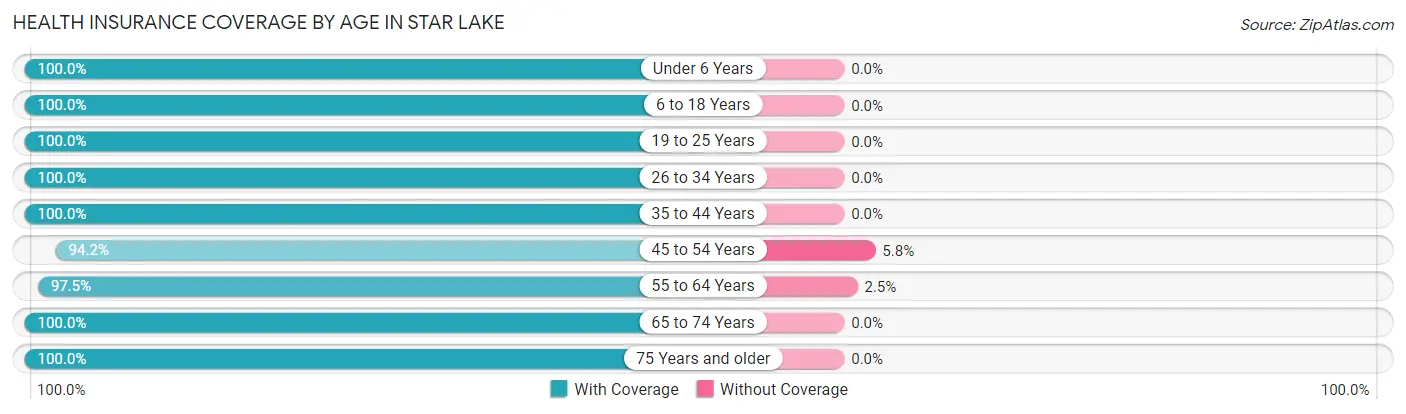
| Age Bracket | With Coverage | Without Coverage |
| Under 6 Years | 79 (100.0%) | 0 (0.0%) |
| 6 to 18 Years | 69 (100.0%) | 0 (0.0%) |
| 19 to 25 Years | 10 (100.0%) | 0 (0.0%) |
| 26 to 34 Years | 59 (100.0%) | 0 (0.0%) |
| 35 to 44 Years | 43 (100.0%) | 0 (0.0%) |
| 45 to 54 Years | 65 (94.2%) | 4 (5.8%) |
| 55 to 64 Years | 158 (97.5%) | 4 (2.5%) |
| 65 to 74 Years | 108 (100.0%) | 0 (0.0%) |
| 75 Years and older | 50 (100.0%) | 0 (0.0%) |
| Total | 641 (98.8%) | 8 (1.2%) |
Health Insurance Coverage by Citizenship Status in Star Lake
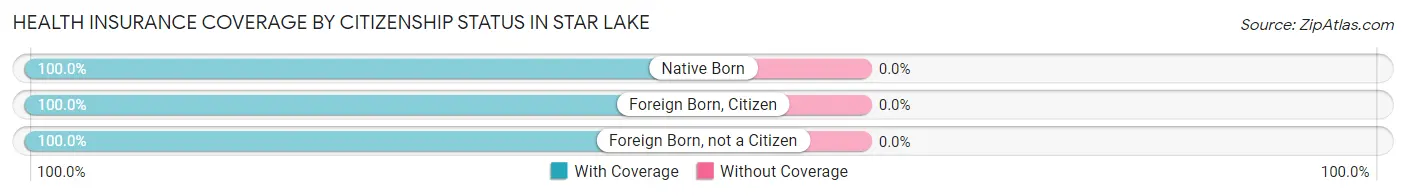
| Citizenship Status | With Coverage | Without Coverage |
| Native Born | 79 (100.0%) | 0 (0.0%) |
| Foreign Born, Citizen | 69 (100.0%) | 0 (0.0%) |
| Foreign Born, not a Citizen | 10 (100.0%) | 0 (0.0%) |
Health Insurance Coverage by Household Income in Star Lake
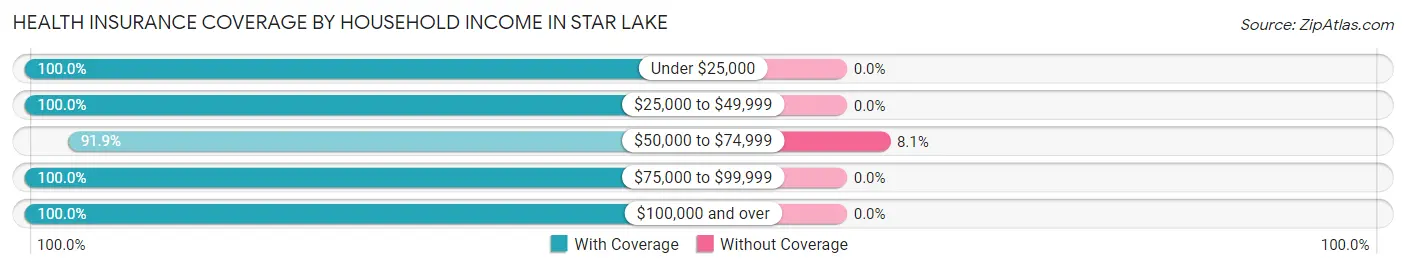
| Household Income | With Coverage | Without Coverage |
| Under $25,000 | 160 (100.0%) | 0 (0.0%) |
| $25,000 to $49,999 | 121 (100.0%) | 0 (0.0%) |
| $50,000 to $74,999 | 91 (91.9%) | 8 (8.1%) |
| $75,000 to $99,999 | 94 (100.0%) | 0 (0.0%) |
| $100,000 and over | 142 (100.0%) | 0 (0.0%) |
Public vs Private Health Insurance Coverage by Age in Star Lake
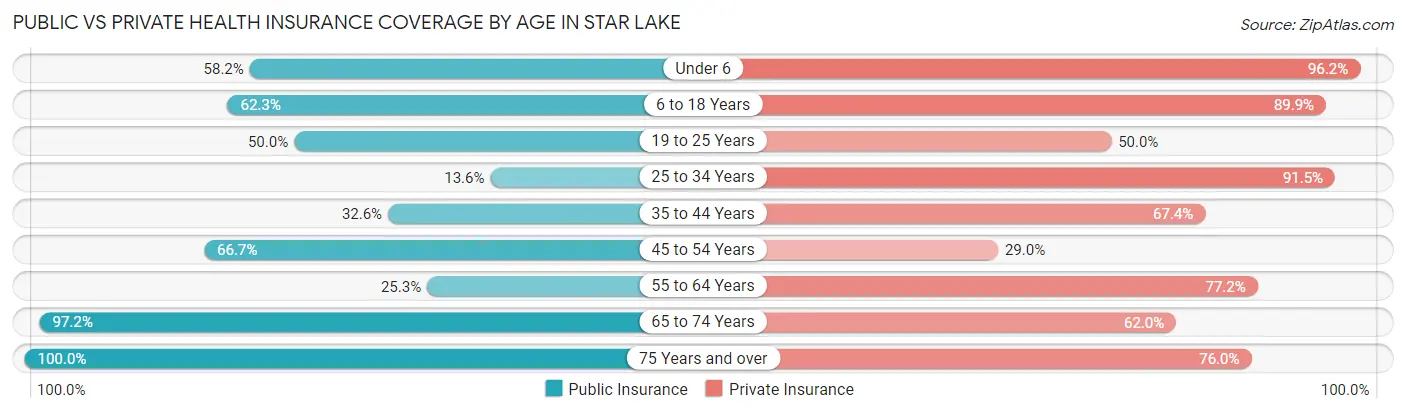
| Age Bracket | Public Insurance | Private Insurance |
| Under 6 | 46 (58.2%) | 76 (96.2%) |
| 6 to 18 Years | 43 (62.3%) | 62 (89.9%) |
| 19 to 25 Years | 5 (50.0%) | 5 (50.0%) |
| 25 to 34 Years | 8 (13.6%) | 54 (91.5%) |
| 35 to 44 Years | 14 (32.6%) | 29 (67.4%) |
| 45 to 54 Years | 46 (66.7%) | 20 (29.0%) |
| 55 to 64 Years | 41 (25.3%) | 125 (77.2%) |
| 65 to 74 Years | 105 (97.2%) | 67 (62.0%) |
| 75 Years and over | 50 (100.0%) | 38 (76.0%) |
| Total | 358 (55.2%) | 476 (73.3%) |
Disability Status by Sex by Age in Star Lake
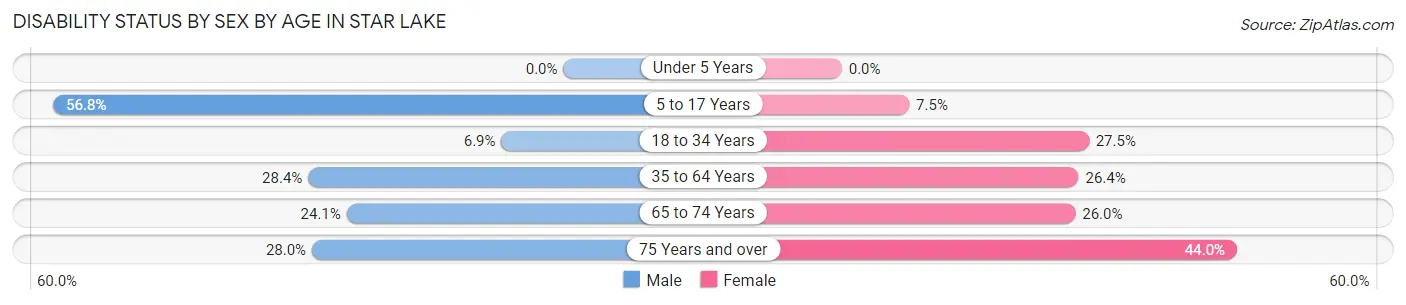
| Age Bracket | Male | Female |
| Under 5 Years | 0 (0.0%) | 0 (0.0%) |
| 5 to 17 Years | 25 (56.8%) | 3 (7.5%) |
| 18 to 34 Years | 2 (6.9%) | 11 (27.5%) |
| 35 to 64 Years | 52 (28.4%) | 24 (26.4%) |
| 65 to 74 Years | 14 (24.1%) | 13 (26.0%) |
| 75 Years and over | 7 (28.0%) | 11 (44.0%) |
Disability Class by Sex by Age in Star Lake
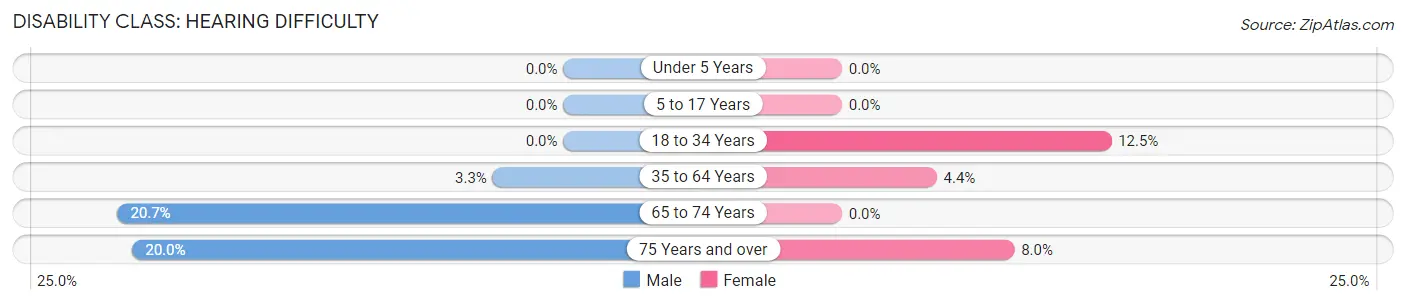
Disability Class: Hearing Difficulty
| Age Bracket | Male | Female |
| Under 5 Years | 0 (0.0%) | 0 (0.0%) |
| 5 to 17 Years | 0 (0.0%) | 0 (0.0%) |
| 18 to 34 Years | 0 (0.0%) | 5 (12.5%) |
| 35 to 64 Years | 6 (3.3%) | 4 (4.4%) |
| 65 to 74 Years | 12 (20.7%) | 0 (0.0%) |
| 75 Years and over | 5 (20.0%) | 2 (8.0%) |
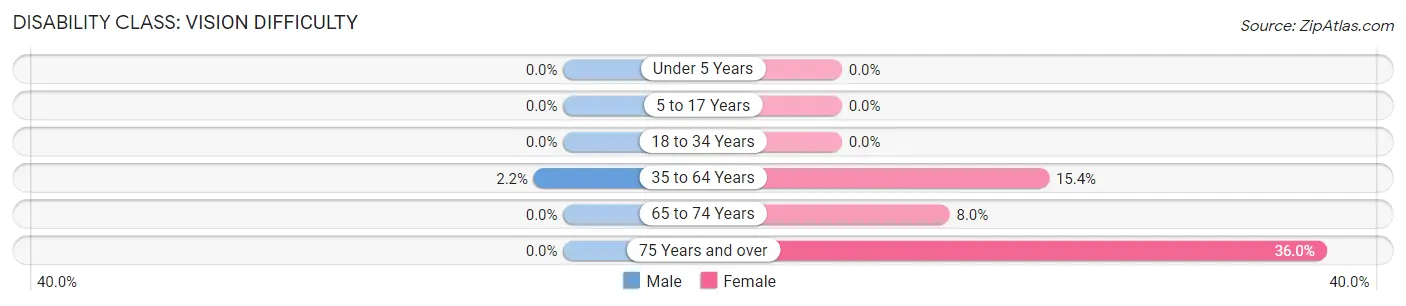
Disability Class: Vision Difficulty
| Age Bracket | Male | Female |
| Under 5 Years | 0 (0.0%) | 0 (0.0%) |
| 5 to 17 Years | 0 (0.0%) | 0 (0.0%) |
| 18 to 34 Years | 0 (0.0%) | 0 (0.0%) |
| 35 to 64 Years | 4 (2.2%) | 14 (15.4%) |
| 65 to 74 Years | 0 (0.0%) | 4 (8.0%) |
| 75 Years and over | 0 (0.0%) | 9 (36.0%) |
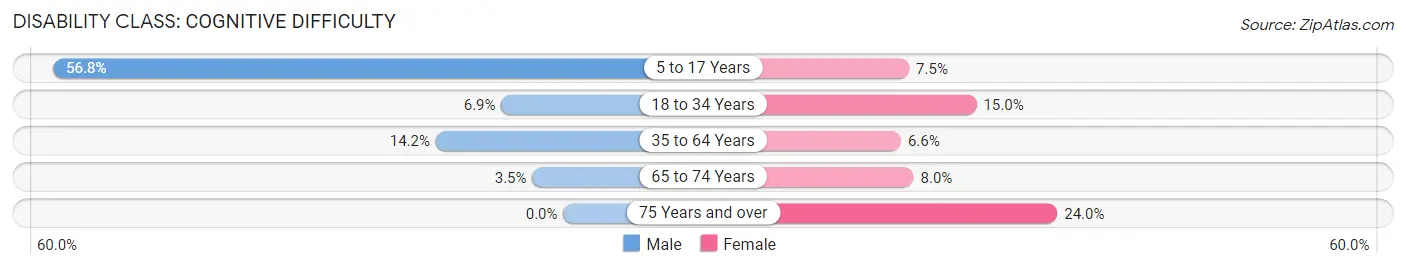
Disability Class: Cognitive Difficulty
| Age Bracket | Male | Female |
| 5 to 17 Years | 25 (56.8%) | 3 (7.5%) |
| 18 to 34 Years | 2 (6.9%) | 6 (15.0%) |
| 35 to 64 Years | 26 (14.2%) | 6 (6.6%) |
| 65 to 74 Years | 2 (3.5%) | 4 (8.0%) |
| 75 Years and over | 0 (0.0%) | 6 (24.0%) |
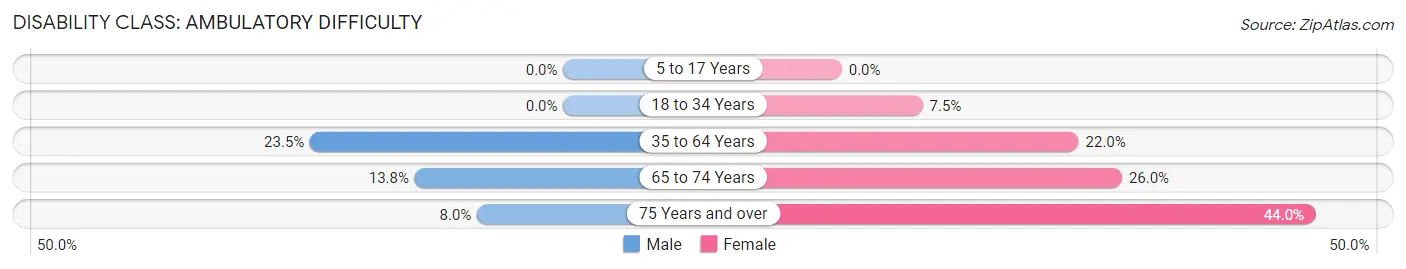
Disability Class: Ambulatory Difficulty
| Age Bracket | Male | Female |
| 5 to 17 Years | 0 (0.0%) | 0 (0.0%) |
| 18 to 34 Years | 0 (0.0%) | 3 (7.5%) |
| 35 to 64 Years | 43 (23.5%) | 20 (22.0%) |
| 65 to 74 Years | 8 (13.8%) | 13 (26.0%) |
| 75 Years and over | 2 (8.0%) | 11 (44.0%) |
Disability Class: Self-Care Difficulty
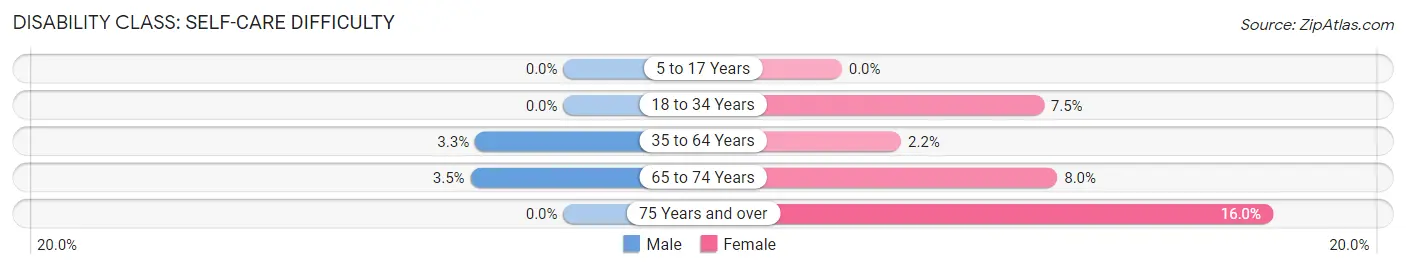
| Age Bracket | Male | Female |
| 5 to 17 Years | 0 (0.0%) | 0 (0.0%) |
| 18 to 34 Years | 0 (0.0%) | 3 (7.5%) |
| 35 to 64 Years | 6 (3.3%) | 2 (2.2%) |
| 65 to 74 Years | 2 (3.5%) | 4 (8.0%) |
| 75 Years and over | 0 (0.0%) | 4 (16.0%) |
Technology Access in Star Lake
Computing Device Access in Star Lake
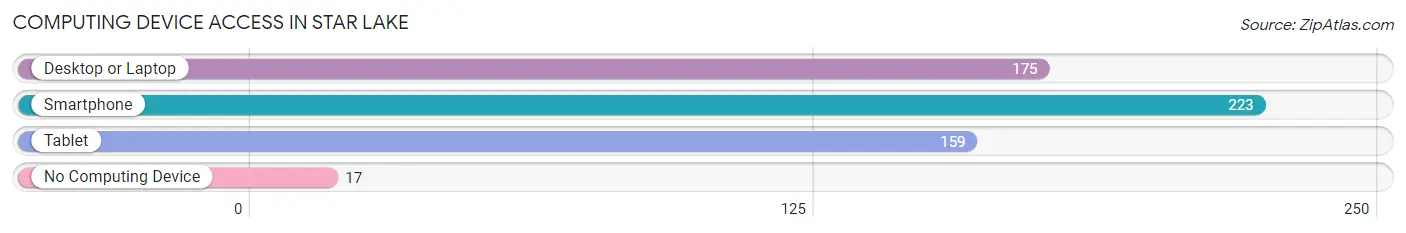
| Device Type | # Households | % Households |
| Desktop or Laptop | 175 | 63.2% |
| Smartphone | 223 | 80.5% |
| Tablet | 159 | 57.4% |
| No Computing Device | 17 | 6.1% |
| Total | 277 | 100.0% |
Internet Access in Star Lake
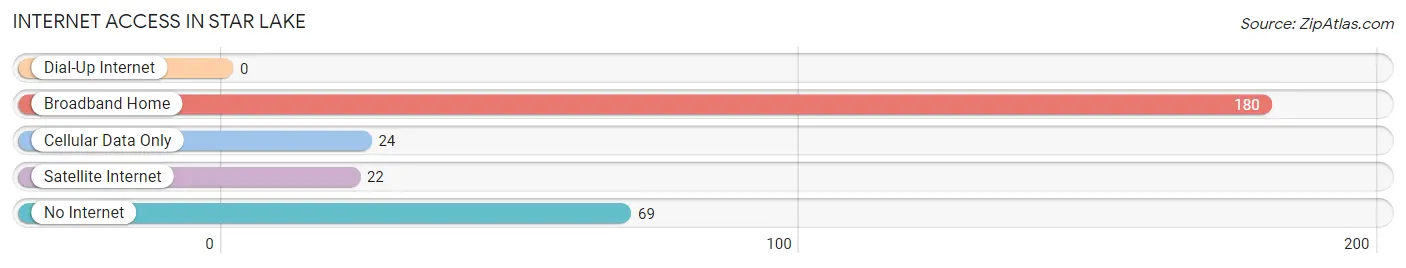
| Internet Type | # Households | % Households |
| Dial-Up Internet | 0 | 0.0% |
| Broadband Home | 180 | 65.0% |
| Cellular Data Only | 24 | 8.7% |
| Satellite Internet | 22 | 7.9% |
| No Internet | 69 | 24.9% |
| Total | 277 | 100.0% |
Star Lake Summary
Silver Lake is a hamlet located in the town of Tuxedo in Orange County, New York. It is situated in the foothills of the Ramapo Mountains, approximately 40 miles northwest of New York City. The hamlet is home to a population of approximately 1,000 people and is a popular destination for outdoor recreation.
History
The area that is now Silver Lake was originally inhabited by the Munsee Native Americans. The first European settlers arrived in the area in the late 1700s and began to clear the land for farming. The hamlet was originally known as “Silver Lake” due to the abundance of silver ore in the area. The ore was mined and used to make jewelry and other items.
In the mid-1800s, the hamlet began to develop as a resort destination. The Silver Lake Hotel was built in 1854 and was a popular destination for wealthy New Yorkers. The hotel was destroyed by fire in 1887, but the area continued to attract visitors.
In the early 1900s, the hamlet began to develop as a residential community. The Silver Lake Country Club was established in 1910 and is still in operation today. The hamlet also became a popular destination for outdoor recreation, such as fishing, hunting, and hiking.
Geography
Silver Lake is located in the foothills of the Ramapo Mountains in Orange County, New York. The hamlet is situated on the shores of Silver Lake, a small lake that is approximately one mile long and one-half mile wide. The lake is fed by several small streams and is a popular destination for fishing and swimming.
The hamlet is surrounded by forests and is home to a variety of wildlife, including deer, foxes, and turkeys. The area is also home to several species of birds, including bald eagles, ospreys, and great blue herons.
Economy
The economy of Silver Lake is largely based on tourism and outdoor recreation. The hamlet is home to several resorts and hotels, as well as a variety of restaurants and shops. The Silver Lake Country Club is a popular destination for golfers and is one of the oldest golf courses in the state.
The hamlet is also home to several small businesses, including a hardware store, a grocery store, and a gas station. The hamlet is also home to a variety of art galleries and antique shops.
Demographics
As of the 2010 census, the population of Silver Lake was 1,000. The median age of the population was 44.7 years, and the median household income was $63,750. The majority of the population (90.2%) was white, and the remainder was made up of African Americans (3.2%), Asians (2.2%), and other races (4.4%).
The hamlet is home to a variety of religious denominations, including Roman Catholic (44.2%), Protestant (25.2%), and other faiths (30.6%). The majority of the population (90.2%) was born in the United States, and the remainder was born in other countries (9.8%).
Conclusion
Silver Lake is a hamlet located in the town of Tuxedo in Orange County, New York. It is situated in the foothills of the Ramapo Mountains, approximately 40 miles northwest of New York City. The hamlet is home to a population of approximately 1,000 people and is a popular destination for outdoor recreation. The economy of Silver Lake is largely based on tourism and outdoor recreation, and the hamlet is home to several resorts and hotels, as well as a variety of restaurants and shops. The majority of the population is white, and the median household income is $63,750. Silver Lake is a popular destination for outdoor recreation and is home to a variety of religious denominations.
Common Questions
What is Per Capita Income in Star Lake?
Per Capita income in Star Lake is $32,157.
What is the Median Family Income in Star Lake?
Median Family Income in Star Lake is $64,375.
What is the Median Household income in Star Lake?
Median Household Income in Star Lake is $53,125.
What is Income or Wage Gap in Star Lake?
Income or Wage Gap in Star Lake is 3.5%.
Women in Star Lake earn 96.5 cents for every dollar earned by a man.
What is Inequality or Gini Index in Star Lake?
Inequality or Gini Index in Star Lake is 0.43.
What is the Total Population of Star Lake?
Total Population of Star Lake is 649.
What is the Total Male Population of Star Lake?
Total Male Population of Star Lake is 395.
What is the Total Female Population of Star Lake?
Total Female Population of Star Lake is 254.
What is the Ratio of Males per 100 Females in Star Lake?
There are 155.51 Males per 100 Females in Star Lake.
What is the Ratio of Females per 100 Males in Star Lake?
There are 64.30 Females per 100 Males in Star Lake.
What is the Median Population Age in Star Lake?
Median Population Age in Star Lake is 52.8 Years.
What is the Average Family Size in Star Lake
Average Family Size in Star Lake is 3.1 People.
What is the Average Household Size in Star Lake
Average Household Size in Star Lake is 2.2 People.
How Large is the Labor Force in Star Lake?
There are 242 People in the Labor Forcein in Star Lake.
What is the Percentage of People in the Labor Force in Star Lake?
47.6% of People are in the Labor Force in Star Lake.
What is the Unemployment Rate in Star Lake?
Unemployment Rate in Star Lake is 2.9%.