Cherry Creek, NY Map & Demographics
Cherry Creek Map
Cherry Creek Overview
$36,648
PER CAPITA INCOME
$71,250
AVG FAMILY INCOME
$65,588
AVG HOUSEHOLD INCOME
30.9%
WAGE / INCOME GAP [ % ]
69.1¢/ $1
WAGE / INCOME GAP [ $ ]
0.38
INEQUALITY / GINI INDEX
309
TOTAL POPULATION
139
MALE POPULATION
170
FEMALE POPULATION
81.76
MALES / 100 FEMALES
122.30
FEMALES / 100 MALES
35.4
MEDIAN AGE
2.7
AVG FAMILY SIZE
2.3
AVG HOUSEHOLD SIZE
163
LABOR FORCE [ PEOPLE ]
65.5%
PERCENT IN LABOR FORCE
11.7%
UNEMPLOYMENT RATE
Cherry Creek Zip Codes
Cherry Creek Area Codes
Income in Cherry Creek
Income Overview in Cherry Creek
Per Capita Income in Cherry Creek is $36,648, while median incomes of families and households are $71,250 and $65,588 respectively.
| Characteristic | Number | Measure |
| Per Capita Income | 309 | $36,648 |
| Median Family Income | 97 | $71,250 |
| Mean Family Income | 97 | $100,244 |
| Median Household Income | 132 | $65,588 |
| Mean Household Income | 132 | $84,236 |
| Income Deficit | 97 | $0 |
| Wage / Income Gap (%) | 309 | 30.93% |
| Wage / Income Gap ($) | 309 | 69.07¢ per $1 |
| Gini / Inequality Index | 309 | 0.38 |
Earnings by Sex in Cherry Creek
Average Earnings in Cherry Creek are $44,750, $56,923 for men and $39,318 for women, a difference of 30.9%.
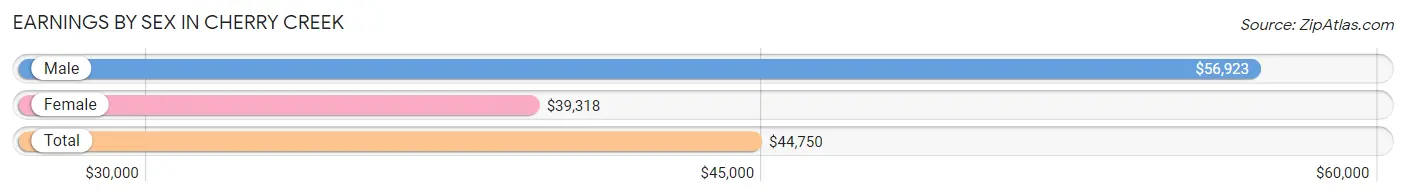
| Sex | Number | Average Earnings |
| Male | 78 (45.9%) | $56,923 |
| Female | 92 (54.1%) | $39,318 |
| Total | 170 (100.0%) | $44,750 |
Earnings by Sex by Income Bracket in Cherry Creek
The most common earnings brackets in Cherry Creek are $55,000 to $64,999 for men (18 | 23.1%) and $55,000 to $64,999 for women (18 | 19.6%).
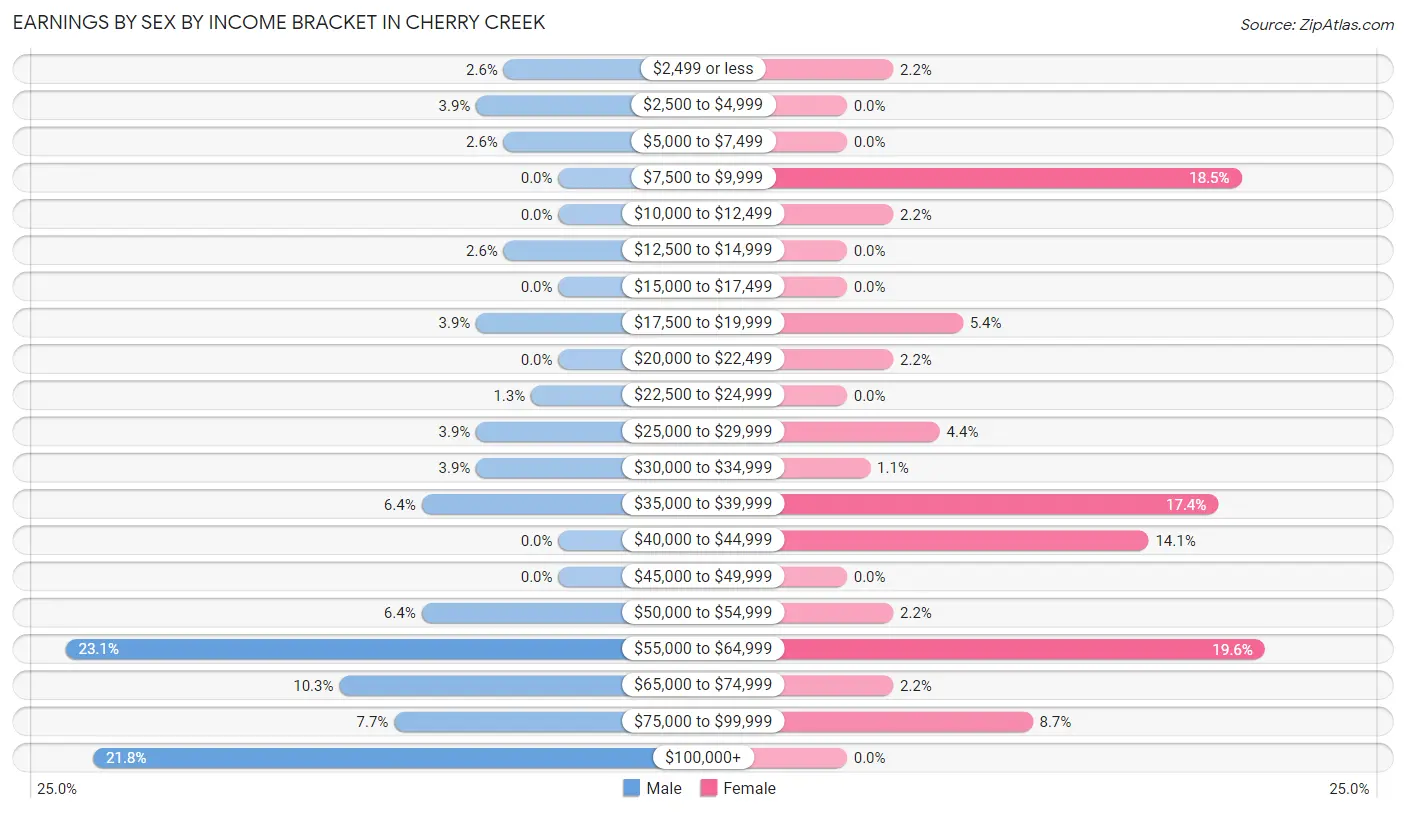
| Income | Male | Female |
| $2,499 or less | 2 (2.6%) | 2 (2.2%) |
| $2,500 to $4,999 | 3 (3.8%) | 0 (0.0%) |
| $5,000 to $7,499 | 2 (2.6%) | 0 (0.0%) |
| $7,500 to $9,999 | 0 (0.0%) | 17 (18.5%) |
| $10,000 to $12,499 | 0 (0.0%) | 2 (2.2%) |
| $12,500 to $14,999 | 2 (2.6%) | 0 (0.0%) |
| $15,000 to $17,499 | 0 (0.0%) | 0 (0.0%) |
| $17,500 to $19,999 | 3 (3.8%) | 5 (5.4%) |
| $20,000 to $22,499 | 0 (0.0%) | 2 (2.2%) |
| $22,500 to $24,999 | 1 (1.3%) | 0 (0.0%) |
| $25,000 to $29,999 | 3 (3.8%) | 4 (4.3%) |
| $30,000 to $34,999 | 3 (3.8%) | 1 (1.1%) |
| $35,000 to $39,999 | 5 (6.4%) | 16 (17.4%) |
| $40,000 to $44,999 | 0 (0.0%) | 13 (14.1%) |
| $45,000 to $49,999 | 0 (0.0%) | 0 (0.0%) |
| $50,000 to $54,999 | 5 (6.4%) | 2 (2.2%) |
| $55,000 to $64,999 | 18 (23.1%) | 18 (19.6%) |
| $65,000 to $74,999 | 8 (10.3%) | 2 (2.2%) |
| $75,000 to $99,999 | 6 (7.7%) | 8 (8.7%) |
| $100,000+ | 17 (21.8%) | 0 (0.0%) |
| Total | 78 (100.0%) | 92 (100.0%) |
Earnings by Sex by Educational Attainment in Cherry Creek
Average earnings in Cherry Creek are $56,923 for men and $43,625 for women, a difference of 23.4%. Men with an educational attainment of college or associate's degree enjoy the highest average annual earnings of $85,313, while those with high school diploma education earn the least with $35,750. Women with an educational attainment of bachelor's degree earn the most with the average annual earnings of $64,375, while those with college or associate's degree education have the smallest earnings of $38,750.
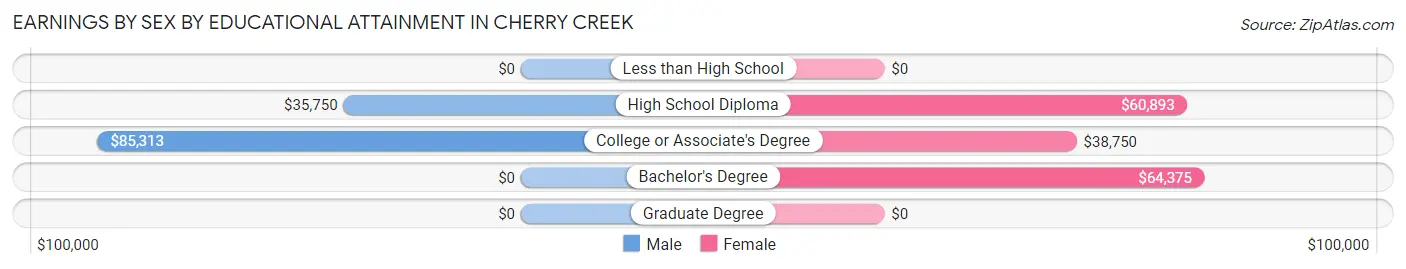
| Educational Attainment | Male Income | Female Income |
| Less than High School | - | - |
| High School Diploma | $35,750 | $60,893 |
| College or Associate's Degree | $85,313 | $38,750 |
| Bachelor's Degree | - | - |
| Graduate Degree | - | - |
| Total | $56,923 | $43,625 |
Family Income in Cherry Creek
Family Income Brackets in Cherry Creek
According to the Cherry Creek family income data, there are 42 families falling into the $50,000 to $74,999 income range, which is the most common income bracket and makes up 43.3% of all families.
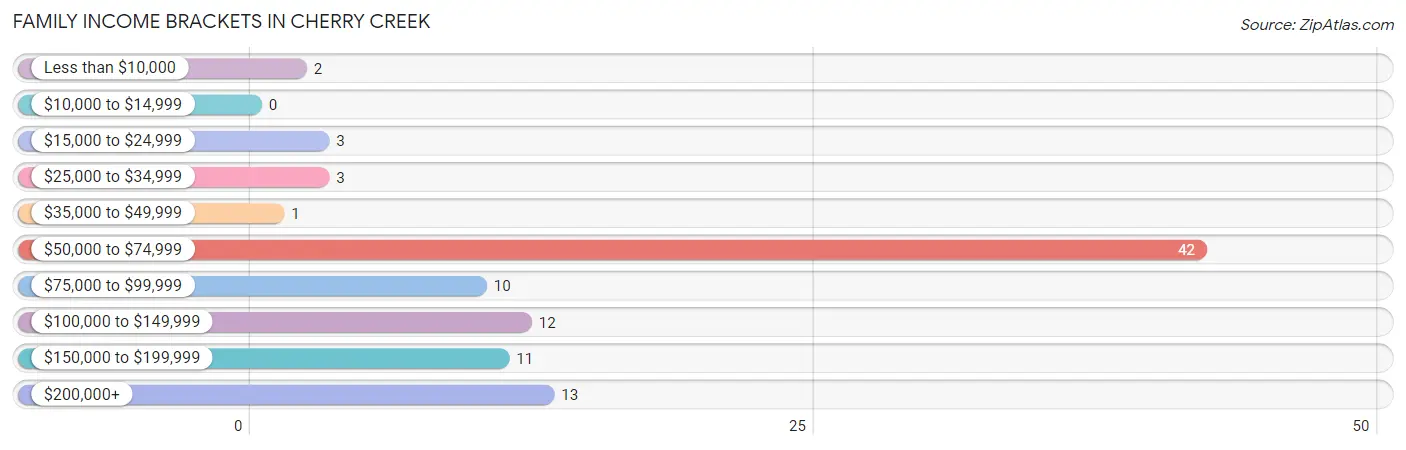
| Income Bracket | # Families | % Families |
| Less than $10,000 | 2 | 2.1% |
| $10,000 to $14,999 | 0 | 0.0% |
| $15,000 to $24,999 | 3 | 3.1% |
| $25,000 to $34,999 | 3 | 3.1% |
| $35,000 to $49,999 | 1 | 1.0% |
| $50,000 to $74,999 | 42 | 43.3% |
| $75,000 to $99,999 | 10 | 10.3% |
| $100,000 to $149,999 | 12 | 12.4% |
| $150,000 to $199,999 | 11 | 11.3% |
| $200,000+ | 13 | 13.4% |
Family Income by Famaliy Size in Cherry Creek
5-person families (9 | 9.3%) account for the highest median family income in Cherry Creek with $94,583 per family, while 2-person families (58 | 59.8%) have the highest median income of $40,834 per family member.
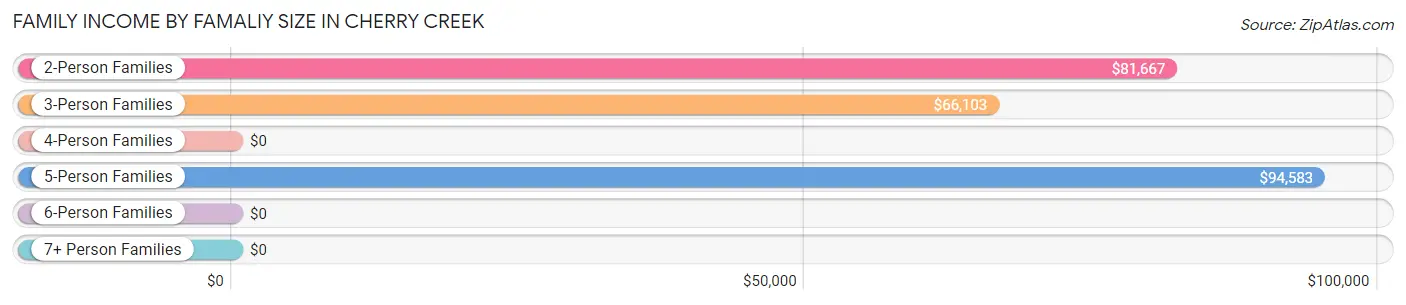
| Income Bracket | # Families | Median Income |
| 2-Person Families | 58 (59.8%) | $81,667 |
| 3-Person Families | 27 (27.8%) | $66,103 |
| 4-Person Families | 0 (0.0%) | $0 |
| 5-Person Families | 9 (9.3%) | $94,583 |
| 6-Person Families | 0 (0.0%) | $0 |
| 7+ Person Families | 3 (3.1%) | $0 |
| Total | 97 (100.0%) | $71,250 |
Family Income by Number of Earners in Cherry Creek
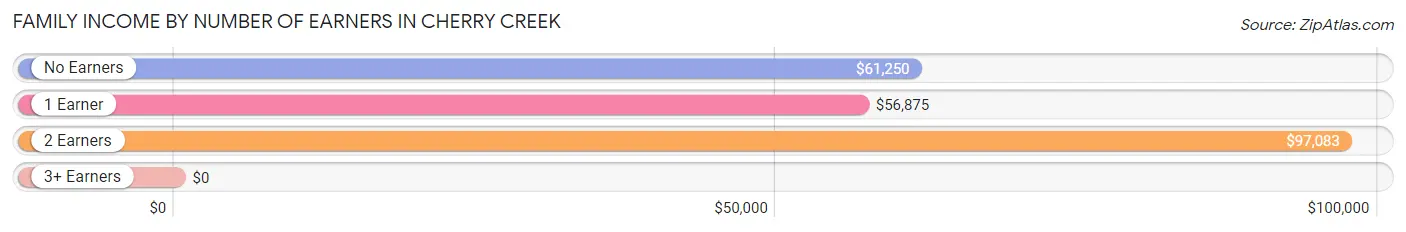
| Number of Earners | # Families | Median Income |
| No Earners | 14 (14.4%) | $61,250 |
| 1 Earner | 21 (21.6%) | $56,875 |
| 2 Earners | 59 (60.8%) | $97,083 |
| 3+ Earners | 3 (3.1%) | $0 |
| Total | 97 (100.0%) | $71,250 |
Household Income in Cherry Creek
Household Income Brackets in Cherry Creek
With 44 households falling in the category, the $50,000 to $74,999 income range is the most frequent in Cherry Creek, accounting for 33.3% of all households. In contrast, only 2 households (1.5%) fall into the $10,000 to $14,999 income bracket, making it the least populous group.
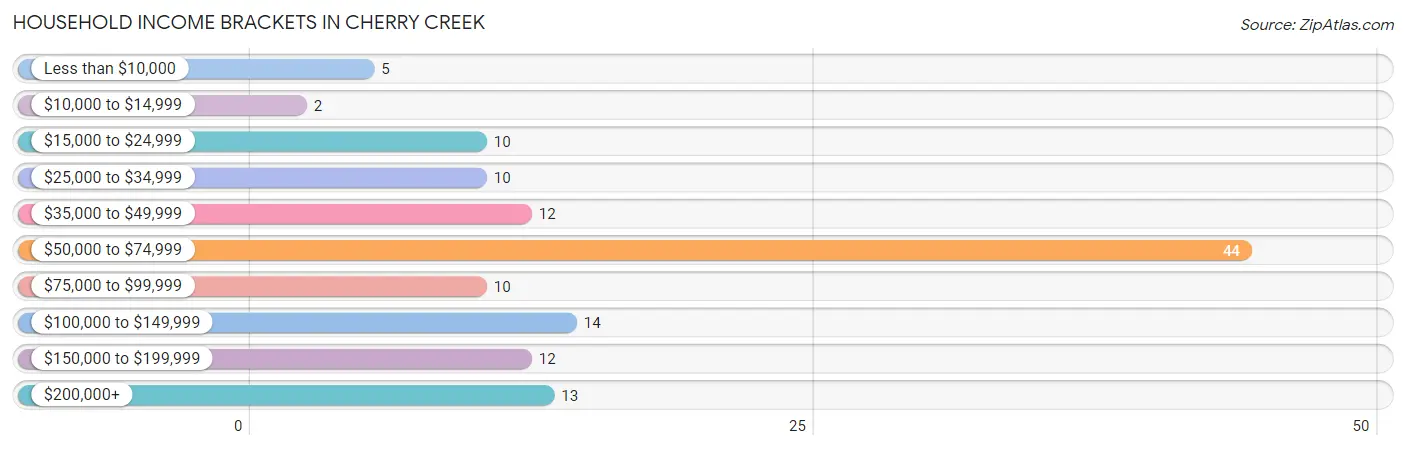
| Income Bracket | # Households | % Households |
| Less than $10,000 | 5 | 3.8% |
| $10,000 to $14,999 | 2 | 1.5% |
| $15,000 to $24,999 | 10 | 7.6% |
| $25,000 to $34,999 | 10 | 7.6% |
| $35,000 to $49,999 | 12 | 9.1% |
| $50,000 to $74,999 | 44 | 33.3% |
| $75,000 to $99,999 | 10 | 7.6% |
| $100,000 to $149,999 | 14 | 10.6% |
| $150,000 to $199,999 | 12 | 9.1% |
| $200,000+ | 13 | 9.8% |
Household Income by Householder Age in Cherry Creek
The median household income in Cherry Creek is $65,588, with the highest median household income of $106,875 found in the 25 to 44 years age bracket for the primary householder. A total of 41 households (31.1%) fall into this category. Meanwhile, the 15 to 24 years age bracket for the primary householder has the lowest median household income of $0, with 19 households (14.4%) in this group.
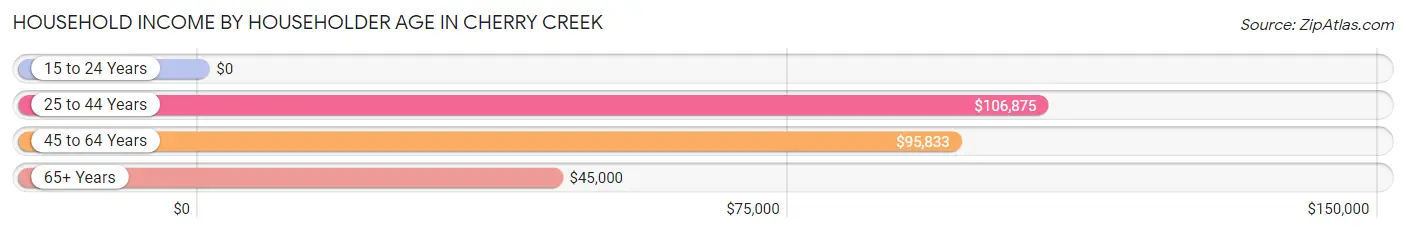
| Income Bracket | # Households | Median Income |
| 15 to 24 Years | 19 (14.4%) | $0 |
| 25 to 44 Years | 41 (31.1%) | $106,875 |
| 45 to 64 Years | 26 (19.7%) | $95,833 |
| 65+ Years | 46 (34.8%) | $45,000 |
| Total | 132 (100.0%) | $65,588 |
Poverty in Cherry Creek
Income Below Poverty by Sex and Age in Cherry Creek
With 2.2% poverty level for males and 5.9% for females among the residents of Cherry Creek, 75 year old and over males and 55 to 64 year old females are the most vulnerable to poverty, with 3 males (27.3%) and 5 females (29.4%) in their respective age groups living below the poverty level.
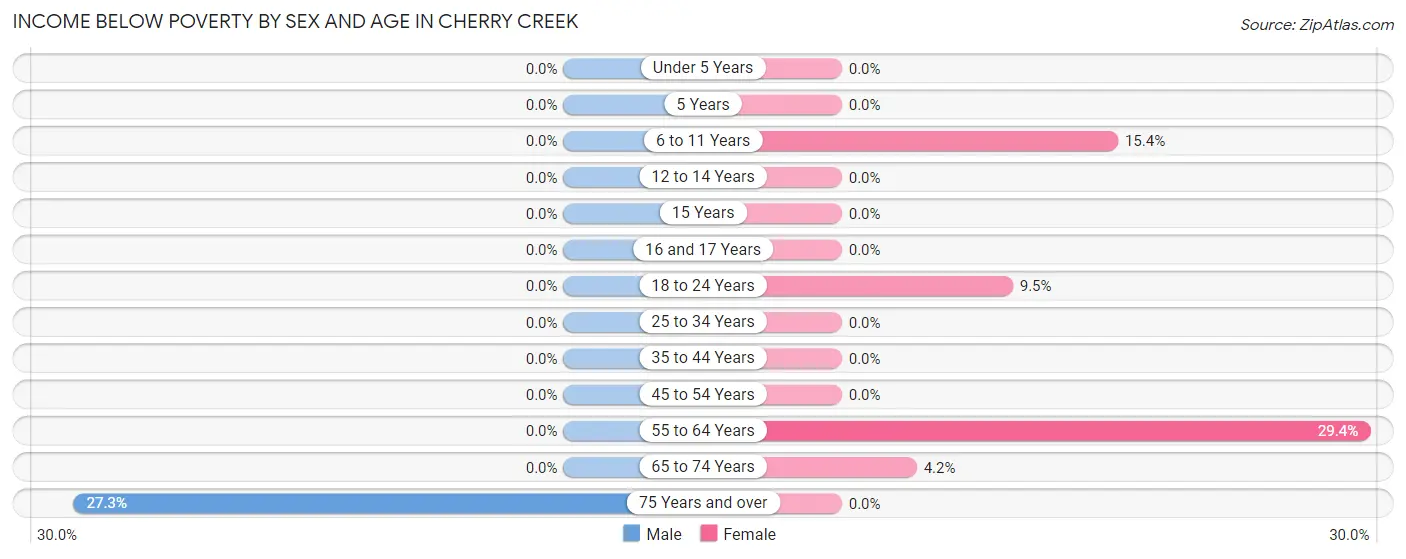
| Age Bracket | Male | Female |
| Under 5 Years | 0 (0.0%) | 0 (0.0%) |
| 5 Years | 0 (0.0%) | 0 (0.0%) |
| 6 to 11 Years | 0 (0.0%) | 2 (15.4%) |
| 12 to 14 Years | 0 (0.0%) | 0 (0.0%) |
| 15 Years | 0 (0.0%) | 0 (0.0%) |
| 16 and 17 Years | 0 (0.0%) | 0 (0.0%) |
| 18 to 24 Years | 0 (0.0%) | 2 (9.5%) |
| 25 to 34 Years | 0 (0.0%) | 0 (0.0%) |
| 35 to 44 Years | 0 (0.0%) | 0 (0.0%) |
| 45 to 54 Years | 0 (0.0%) | 0 (0.0%) |
| 55 to 64 Years | 0 (0.0%) | 5 (29.4%) |
| 65 to 74 Years | 0 (0.0%) | 1 (4.2%) |
| 75 Years and over | 3 (27.3%) | 0 (0.0%) |
| Total | 3 (2.2%) | 10 (5.9%) |
Income Above Poverty by Sex and Age in Cherry Creek
According to the poverty statistics in Cherry Creek, males aged under 5 years and females aged under 5 years are the age groups that are most secure financially, with 100.0% of males and 100.0% of females in these age groups living above the poverty line.
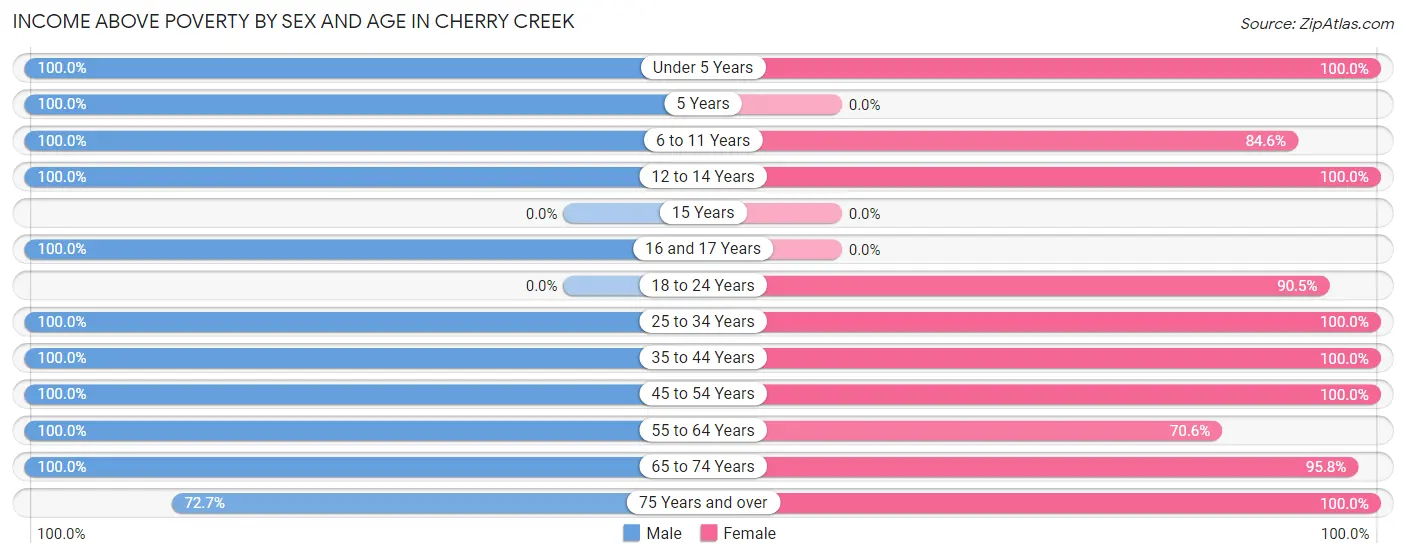
| Age Bracket | Male | Female |
| Under 5 Years | 9 (100.0%) | 22 (100.0%) |
| 5 Years | 3 (100.0%) | 0 (0.0%) |
| 6 to 11 Years | 3 (100.0%) | 11 (84.6%) |
| 12 to 14 Years | 8 (100.0%) | 2 (100.0%) |
| 15 Years | 0 (0.0%) | 0 (0.0%) |
| 16 and 17 Years | 5 (100.0%) | 0 (0.0%) |
| 18 to 24 Years | 0 (0.0%) | 19 (90.5%) |
| 25 to 34 Years | 38 (100.0%) | 26 (100.0%) |
| 35 to 44 Years | 17 (100.0%) | 10 (100.0%) |
| 45 to 54 Years | 7 (100.0%) | 22 (100.0%) |
| 55 to 64 Years | 22 (100.0%) | 12 (70.6%) |
| 65 to 74 Years | 16 (100.0%) | 23 (95.8%) |
| 75 Years and over | 8 (72.7%) | 13 (100.0%) |
| Total | 136 (97.8%) | 160 (94.1%) |
Income Below Poverty Among Married-Couple Families in Cherry Creek
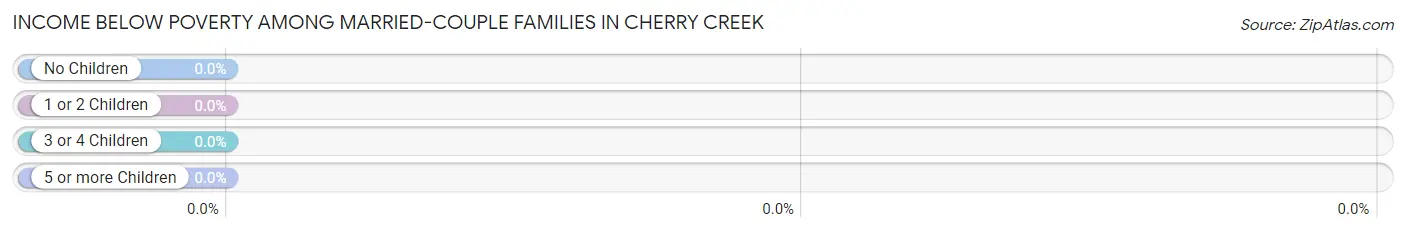
| Children | Above Poverty | Below Poverty |
| No Children | 45 (100.0%) | 0 (0.0%) |
| 1 or 2 Children | 27 (100.0%) | 0 (0.0%) |
| 3 or 4 Children | 6 (100.0%) | 0 (0.0%) |
| 5 or more Children | 0 (0.0%) | 0 (0.0%) |
| Total | 78 (100.0%) | 0 (0.0%) |
Income Below Poverty Among Single-Parent Households in Cherry Creek
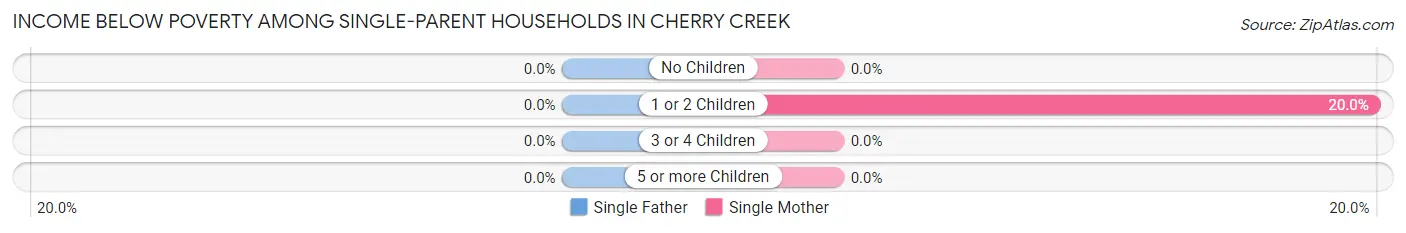
| Children | Single Father | Single Mother |
| No Children | 0 (0.0%) | 0 (0.0%) |
| 1 or 2 Children | 0 (0.0%) | 2 (20.0%) |
| 3 or 4 Children | 0 (0.0%) | 0 (0.0%) |
| 5 or more Children | 0 (0.0%) | 0 (0.0%) |
| Total | 0 (0.0%) | 2 (14.3%) |
Income Below Poverty Among Married-Couple vs Single-Parent Households in Cherry Creek
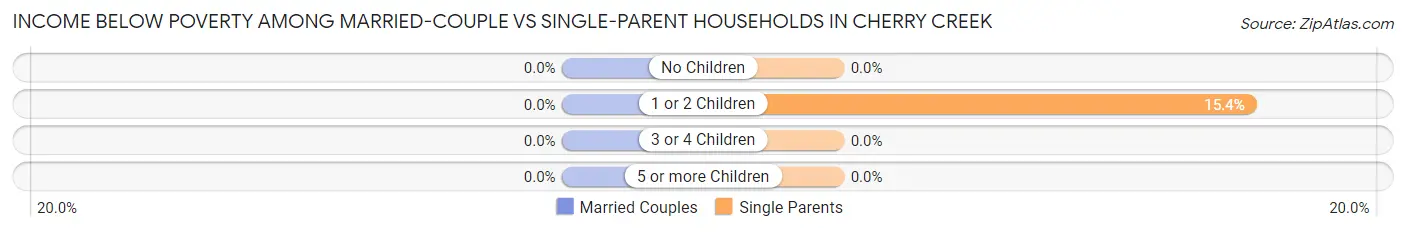
| Children | Married-Couple Families | Single-Parent Households |
| No Children | 0 (0.0%) | 0 (0.0%) |
| 1 or 2 Children | 0 (0.0%) | 2 (15.4%) |
| 3 or 4 Children | 0 (0.0%) | 0 (0.0%) |
| 5 or more Children | 0 (0.0%) | 0 (0.0%) |
| Total | 0 (0.0%) | 2 (10.5%) |
Race in Cherry Creek
The most populous races in Cherry Creek are White / Caucasian (300 | 97.1%), Hispanic or Latino (14 | 4.5%), and Two or more Races (9 | 2.9%).
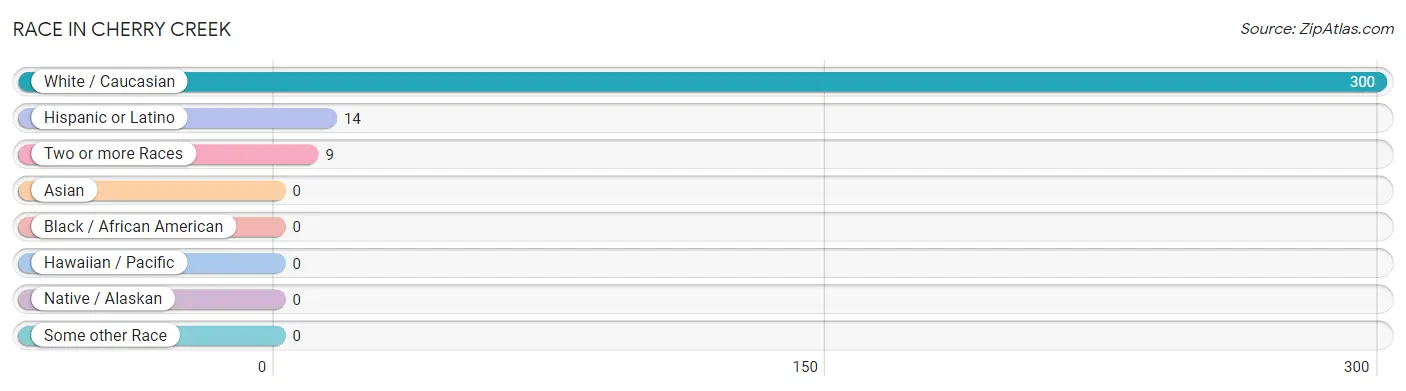
| Race | # Population | % Population |
| Asian | 0 | 0.0% |
| Black / African American | 0 | 0.0% |
| Hawaiian / Pacific | 0 | 0.0% |
| Hispanic or Latino | 14 | 4.5% |
| Native / Alaskan | 0 | 0.0% |
| White / Caucasian | 300 | 97.1% |
| Two or more Races | 9 | 2.9% |
| Some other Race | 0 | 0.0% |
| Total | 309 | 100.0% |
Ancestry in Cherry Creek
The most populous ancestries reported in Cherry Creek are German (54 | 17.5%), Irish (50 | 16.2%), Italian (44 | 14.2%), English (40 | 12.9%), and Polish (32 | 10.4%), together accounting for 71.2% of all Cherry Creek residents.
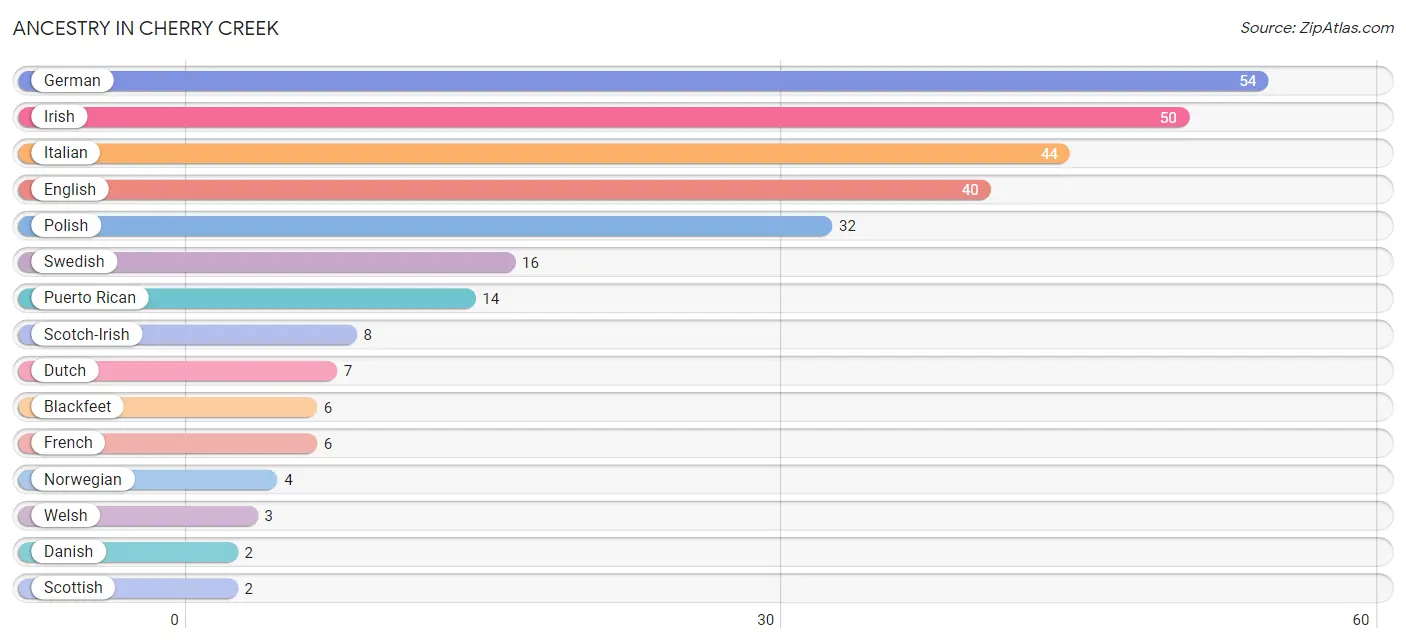
| Ancestry | # Population | % Population |
| Blackfeet | 6 | 1.9% |
| Danish | 2 | 0.6% |
| Dutch | 7 | 2.3% |
| English | 40 | 12.9% |
| French | 6 | 1.9% |
| German | 54 | 17.5% |
| Irish | 50 | 16.2% |
| Italian | 44 | 14.2% |
| Norwegian | 4 | 1.3% |
| Polish | 32 | 10.4% |
| Puerto Rican | 14 | 4.5% |
| Scotch-Irish | 8 | 2.6% |
| Scottish | 2 | 0.6% |
| Swedish | 16 | 5.2% |
| Welsh | 3 | 1.0% | View All 15 Rows |
Immigrants in Cherry Creek

| Immigration Origin | # Population | % Population | View All 0 Rows |
Sex and Age in Cherry Creek
Sex and Age in Cherry Creek
The most populous age groups in Cherry Creek are 25 to 29 Years (28 | 20.1%) for men and Under 5 Years (22 | 12.9%) for women.
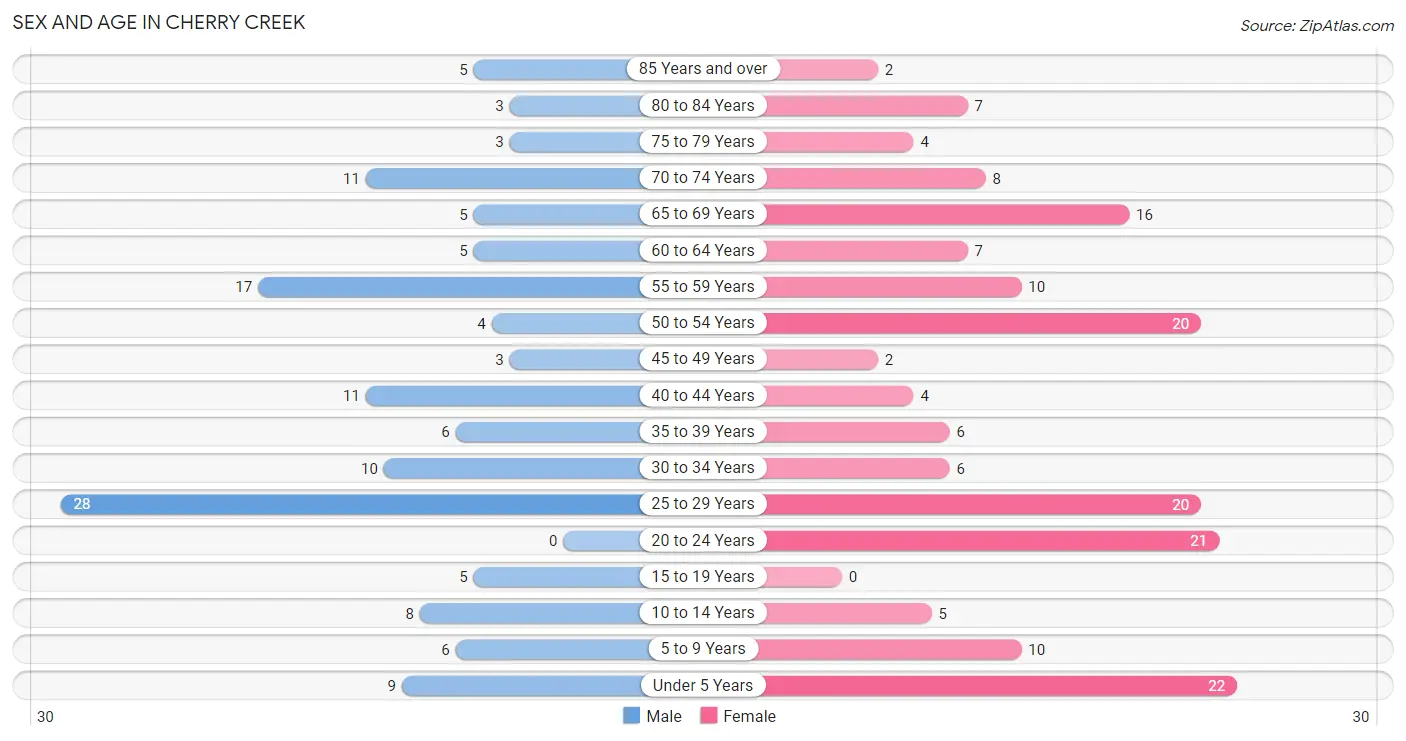
| Age Bracket | Male | Female |
| Under 5 Years | 9 (6.5%) | 22 (12.9%) |
| 5 to 9 Years | 6 (4.3%) | 10 (5.9%) |
| 10 to 14 Years | 8 (5.8%) | 5 (2.9%) |
| 15 to 19 Years | 5 (3.6%) | 0 (0.0%) |
| 20 to 24 Years | 0 (0.0%) | 21 (12.3%) |
| 25 to 29 Years | 28 (20.1%) | 20 (11.8%) |
| 30 to 34 Years | 10 (7.2%) | 6 (3.5%) |
| 35 to 39 Years | 6 (4.3%) | 6 (3.5%) |
| 40 to 44 Years | 11 (7.9%) | 4 (2.4%) |
| 45 to 49 Years | 3 (2.2%) | 2 (1.2%) |
| 50 to 54 Years | 4 (2.9%) | 20 (11.8%) |
| 55 to 59 Years | 17 (12.2%) | 10 (5.9%) |
| 60 to 64 Years | 5 (3.6%) | 7 (4.1%) |
| 65 to 69 Years | 5 (3.6%) | 16 (9.4%) |
| 70 to 74 Years | 11 (7.9%) | 8 (4.7%) |
| 75 to 79 Years | 3 (2.2%) | 4 (2.4%) |
| 80 to 84 Years | 3 (2.2%) | 7 (4.1%) |
| 85 Years and over | 5 (3.6%) | 2 (1.2%) |
| Total | 139 (100.0%) | 170 (100.0%) |
Families and Households in Cherry Creek
Median Family Size in Cherry Creek
The median family size in Cherry Creek is 2.73 persons per family, with married-couple families (78 | 80.4%) accounting for the largest median family size of 2.82 persons per family. On the other hand, single male/father families (5 | 5.1%) represent the smallest median family size with 2.20 persons per family.
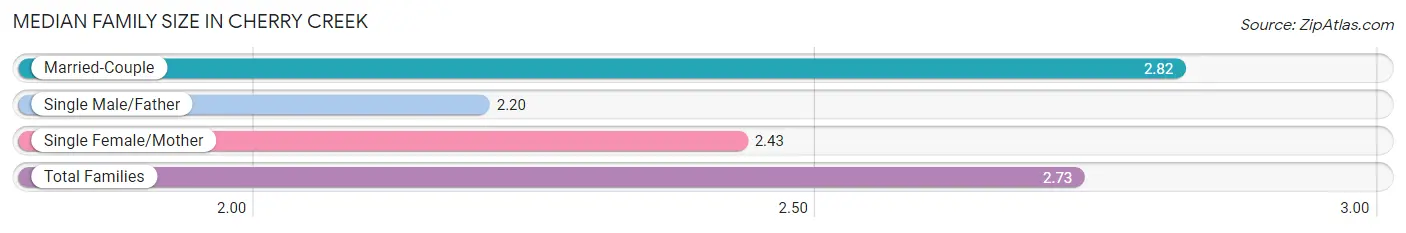
| Family Type | # Families | Family Size |
| Married-Couple | 78 (80.4%) | 2.82 |
| Single Male/Father | 5 (5.1%) | 2.20 |
| Single Female/Mother | 14 (14.4%) | 2.43 |
| Total Families | 97 (100.0%) | 2.73 |
Median Household Size in Cherry Creek
The median household size in Cherry Creek is 2.34 persons per household, with single male/father households (5 | 3.8%) accounting for the largest median household size of 3.2 persons per household. non-family households (35 | 26.5%) represent the smallest median household size with 1.11 persons per household.
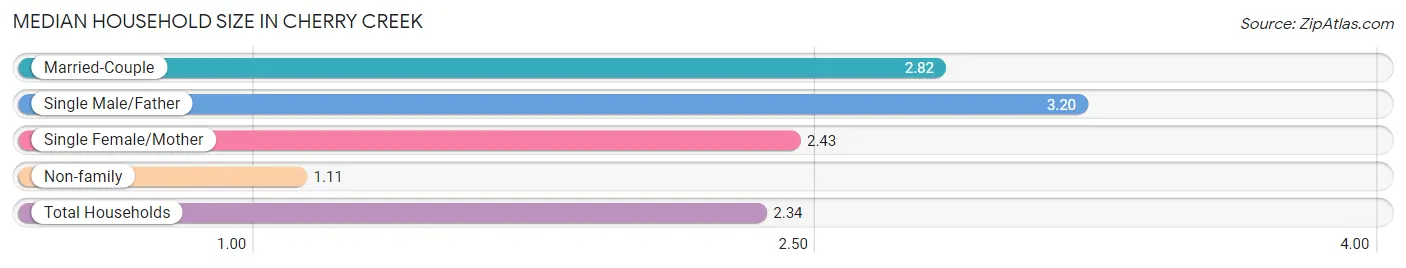
| Household Type | # Households | Household Size |
| Married-Couple | 78 (59.1%) | 2.82 |
| Single Male/Father | 5 (3.8%) | 3.20 |
| Single Female/Mother | 14 (10.6%) | 2.43 |
| Non-family | 35 (26.5%) | 1.11 |
| Total Households | 132 (100.0%) | 2.34 |
Household Size by Marriage Status in Cherry Creek
Out of a total of 132 households in Cherry Creek, 97 (73.5%) are family households, while 35 (26.5%) are nonfamily households. The most numerous type of family households are 2-person households, comprising 54, and the most common type of nonfamily households are 1-person households, comprising 31.
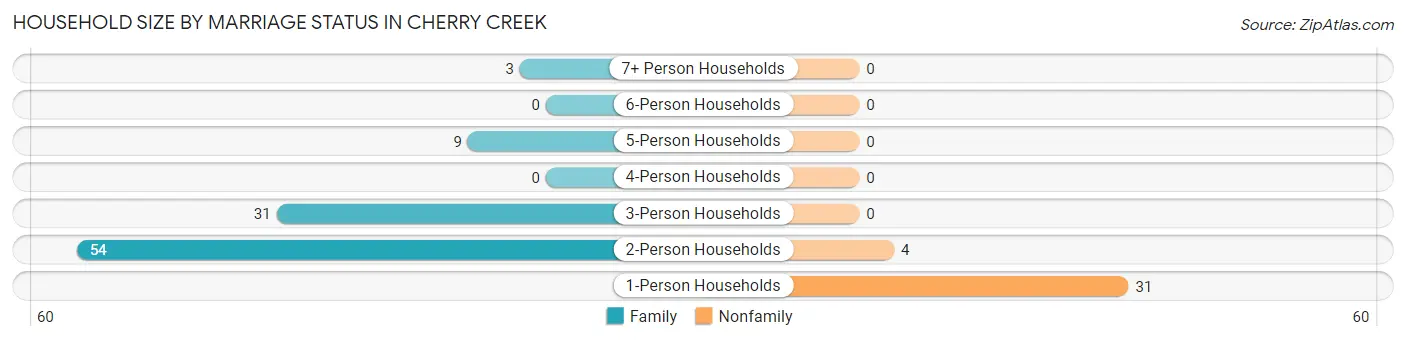
| Household Size | Family Households | Nonfamily Households |
| 1-Person Households | - | 31 (23.5%) |
| 2-Person Households | 54 (40.9%) | 4 (3.0%) |
| 3-Person Households | 31 (23.5%) | 0 (0.0%) |
| 4-Person Households | 0 (0.0%) | 0 (0.0%) |
| 5-Person Households | 9 (6.8%) | 0 (0.0%) |
| 6-Person Households | 0 (0.0%) | 0 (0.0%) |
| 7+ Person Households | 3 (2.3%) | 0 (0.0%) |
| Total | 97 (73.5%) | 35 (26.5%) |
Female Fertility in Cherry Creek
Fertility by Age in Cherry Creek
Average fertility rate in Cherry Creek is 424.0 births per 1,000 women. Women in the age bracket of 20 to 34 years have the highest fertility rate with 532.0 births per 1,000 women. Women in the age bracket of 20 to 34 years acount for 100.0% of all women with births.
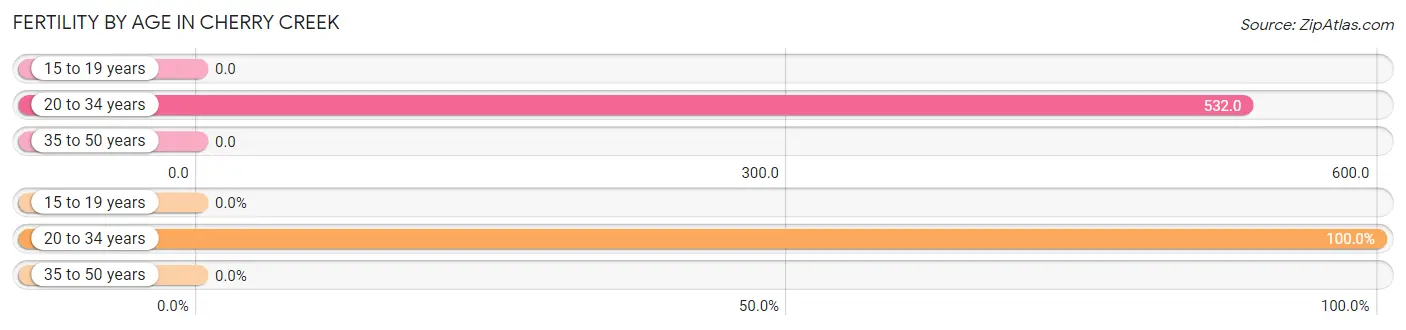
| Age Bracket | Women with Births | Births / 1,000 Women |
| 15 to 19 years | 0 (0.0%) | 0.0 |
| 20 to 34 years | 25 (100.0%) | 532.0 |
| 35 to 50 years | 0 (0.0%) | 0.0 |
| Total | 25 (100.0%) | 424.0 |
Fertility by Age by Marriage Status in Cherry Creek
88.0% of women with births (25) in Cherry Creek are married. The highest percentage of unmarried women with births falls into 20 to 34 years age bracket with 12.0% of them unmarried at the time of birth, while the lowest percentage of unmarried women with births belong to 20 to 34 years age bracket with 12.0% of them unmarried.
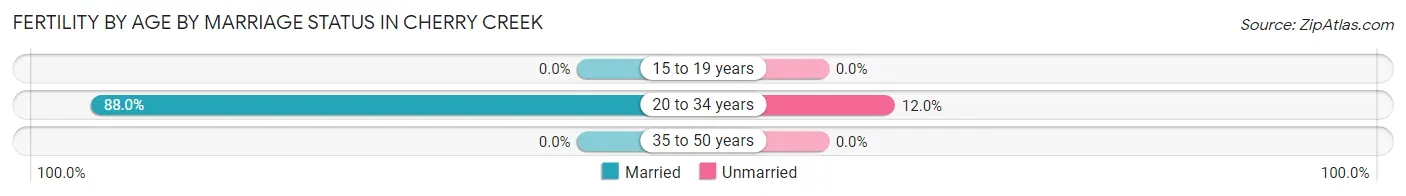
| Age Bracket | Married | Unmarried |
| 15 to 19 years | 0 (0.0%) | 0 (0.0%) |
| 20 to 34 years | 22 (88.0%) | 3 (12.0%) |
| 35 to 50 years | 0 (0.0%) | 0 (0.0%) |
| Total | 22 (88.0%) | 3 (12.0%) |
Fertility by Education in Cherry Creek
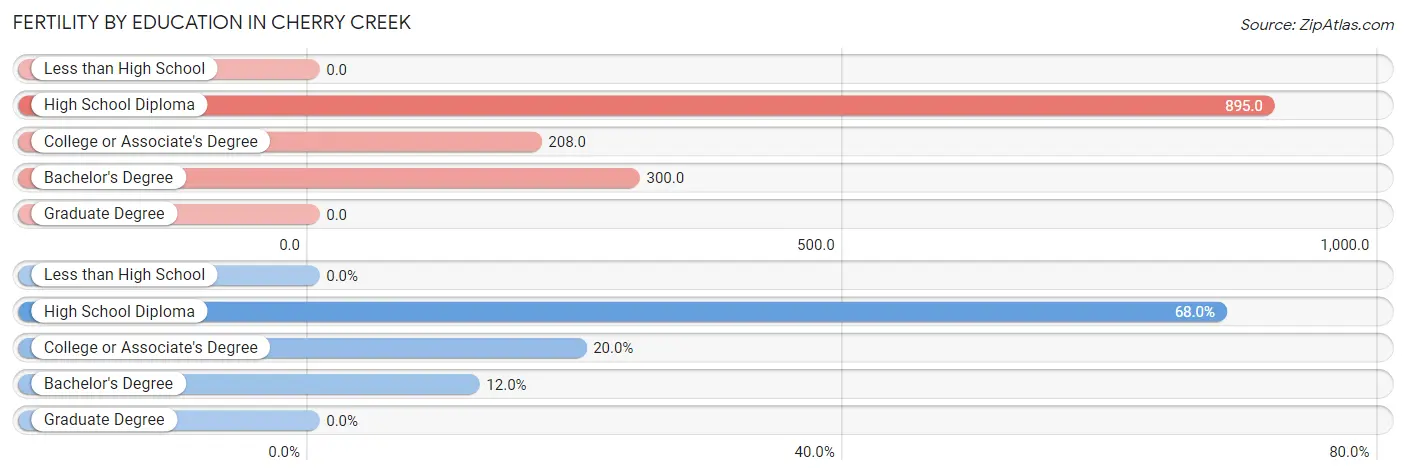
| Educational Attainment | Women with Births | Births / 1,000 Women |
| Less than High School | 0 (0.0%) | 0.0 |
| High School Diploma | 17 (68.0%) | 895.0 |
| College or Associate's Degree | 5 (20.0%) | 208.0 |
| Bachelor's Degree | 3 (12.0%) | 300.0 |
| Graduate Degree | 0 (0.0%) | 0.0 |
| Total | 25 (100.0%) | 424.0 |
Fertility by Education by Marriage Status in Cherry Creek
12.0% of women with births in Cherry Creek are unmarried. Women with the educational attainment of high school diploma are most likely to be married with 100.0% of them married at childbirth, while women with the educational attainment of college or associate's degree are least likely to be married with 60.0% of them unmarried at childbirth.
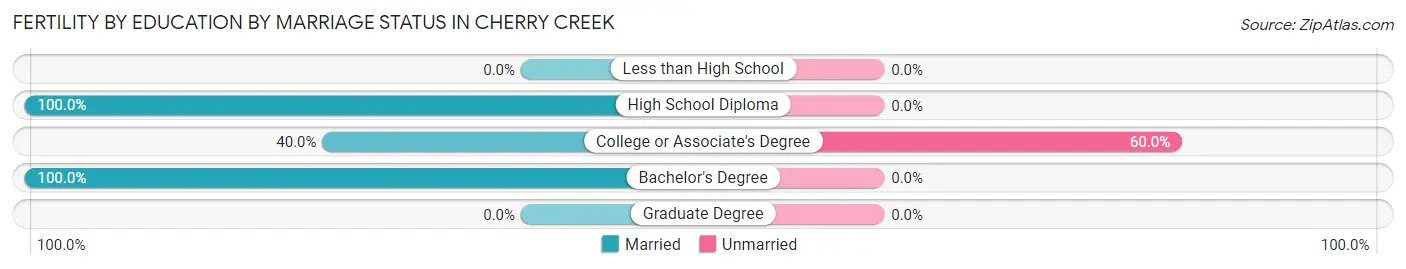
| Educational Attainment | Married | Unmarried |
| Less than High School | 0 (0.0%) | 0 (0.0%) |
| High School Diploma | 17 (100.0%) | 0 (0.0%) |
| College or Associate's Degree | 2 (40.0%) | 3 (60.0%) |
| Bachelor's Degree | 3 (100.0%) | 0 (0.0%) |
| Graduate Degree | 0 (0.0%) | 0 (0.0%) |
| Total | 22 (88.0%) | 3 (12.0%) |
Employment Characteristics in Cherry Creek
Employment by Class of Employer in Cherry Creek
Among the 144 employed individuals in Cherry Creek, private company employees (81 | 56.2%), not-for-profit organizations (23 | 16.0%), and state government employees (18 | 12.5%) make up the most common classes of employment.
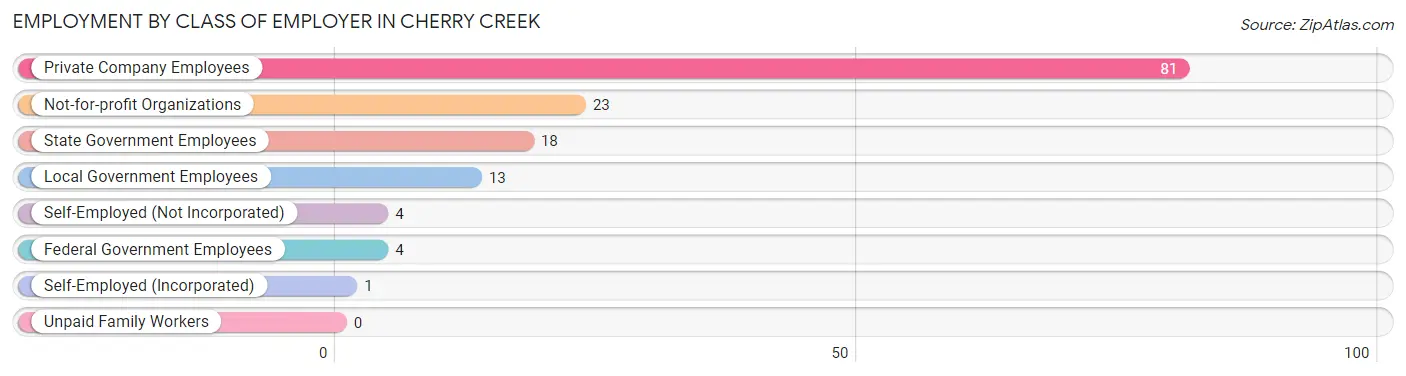
| Employer Class | # Employees | % Employees |
| Private Company Employees | 81 | 56.2% |
| Self-Employed (Incorporated) | 1 | 0.7% |
| Self-Employed (Not Incorporated) | 4 | 2.8% |
| Not-for-profit Organizations | 23 | 16.0% |
| Local Government Employees | 13 | 9.0% |
| State Government Employees | 18 | 12.5% |
| Federal Government Employees | 4 | 2.8% |
| Unpaid Family Workers | 0 | 0.0% |
| Total | 144 | 100.0% |
Employment Status by Age in Cherry Creek
According to the labor force statistics for Cherry Creek, out of the total population over 16 years of age (249), 65.5% or 163 individuals are in the labor force, with 11.7% or 19 of them unemployed. The age group with the highest labor force participation rate is 20 to 24 years, with 100.0% or 21 individuals in the labor force. Within the labor force, the 20 to 24 years age range has the highest percentage of unemployed individuals, with 90.5% or 19 of them being unemployed.
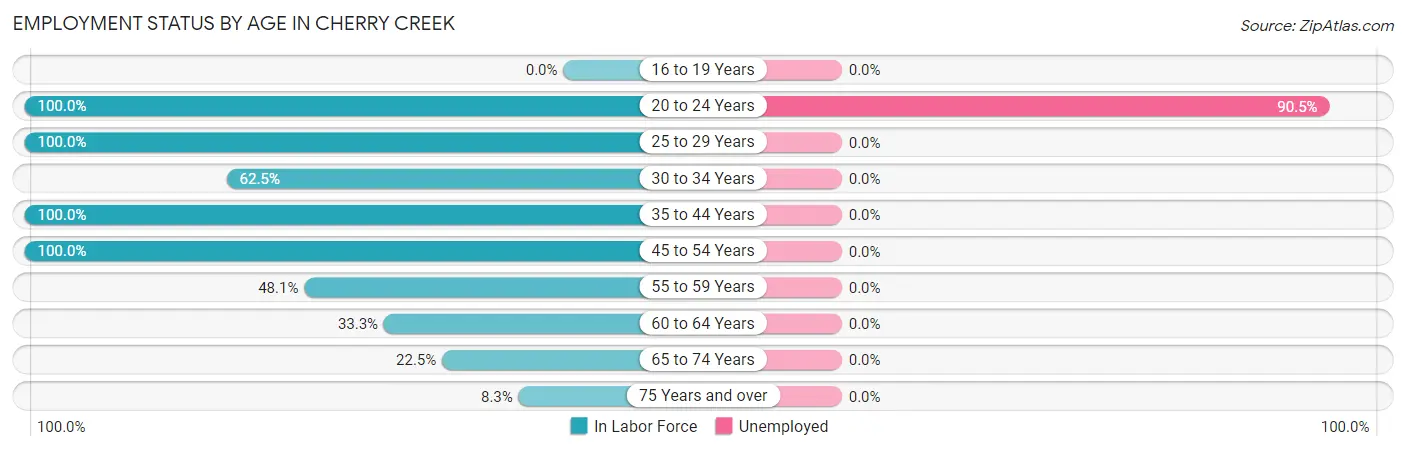
| Age Bracket | In Labor Force | Unemployed |
| 16 to 19 Years | 0 (0.0%) | 0 (0.0%) |
| 20 to 24 Years | 21 (100.0%) | 19 (90.5%) |
| 25 to 29 Years | 48 (100.0%) | 0 (0.0%) |
| 30 to 34 Years | 10 (62.5%) | 0 (0.0%) |
| 35 to 44 Years | 27 (100.0%) | 0 (0.0%) |
| 45 to 54 Years | 29 (100.0%) | 0 (0.0%) |
| 55 to 59 Years | 13 (48.1%) | 0 (0.0%) |
| 60 to 64 Years | 4 (33.3%) | 0 (0.0%) |
| 65 to 74 Years | 9 (22.5%) | 0 (0.0%) |
| 75 Years and over | 2 (8.3%) | 0 (0.0%) |
| Total | 163 (65.5%) | 19 (11.7%) |
Employment Status by Educational Attainment in Cherry Creek
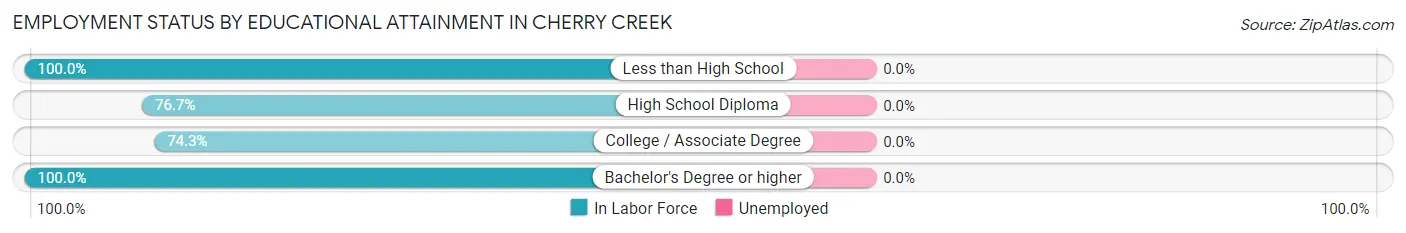
| Educational Attainment | In Labor Force | Unemployed |
| Less than High School | 6 (100.0%) | 0 (0.0%) |
| High School Diploma | 33 (76.7%) | 0 (0.0%) |
| College / Associate Degree | 52 (74.3%) | 0 (0.0%) |
| Bachelor's Degree or higher | 40 (100.0%) | 0 (0.0%) |
| Total | 131 (82.4%) | 0 (0.0%) |
Employment Occupations by Sex in Cherry Creek
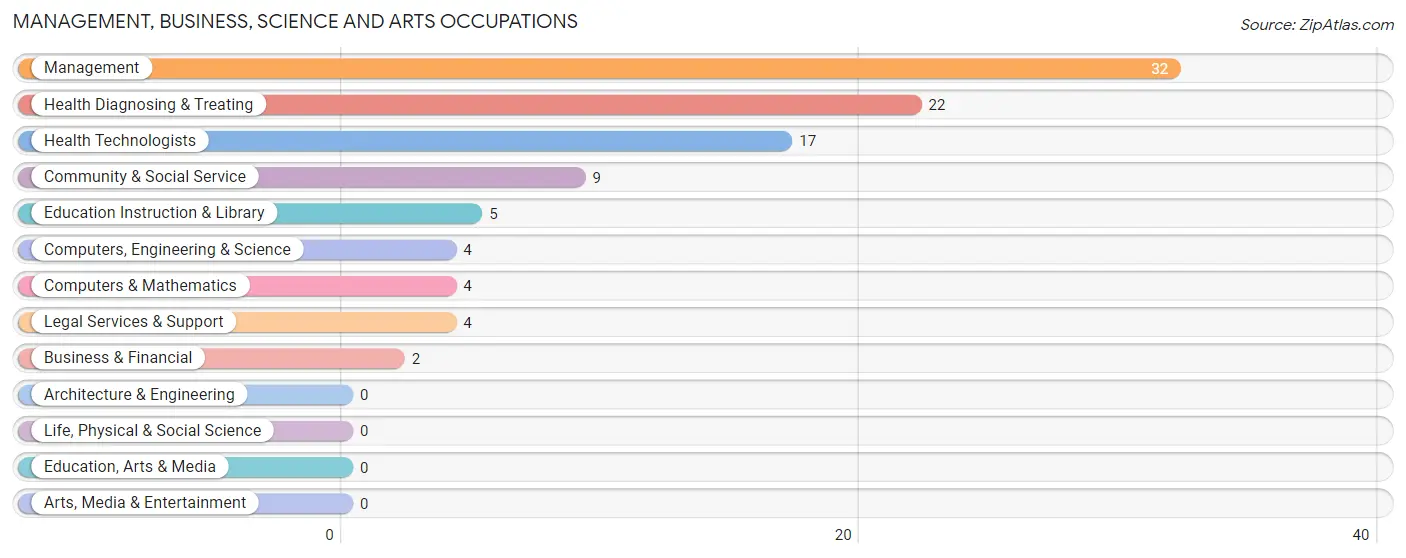
Management, Business, Science and Arts Occupations
The most common Management, Business, Science and Arts occupations in Cherry Creek are Management (32 | 22.2%), Health Diagnosing & Treating (22 | 15.3%), Health Technologists (17 | 11.8%), Community & Social Service (9 | 6.2%), and Education Instruction & Library (5 | 3.5%).
Management, Business, Science and Arts Occupations by Sex
Within the Management, Business, Science and Arts occupations in Cherry Creek, the most male-oriented occupations are Legal Services & Support (100.0%), Management (93.8%), and Community & Social Service (55.6%), while the most female-oriented occupations are Business & Financial (100.0%), Computers, Engineering & Science (100.0%), and Computers & Mathematics (100.0%).
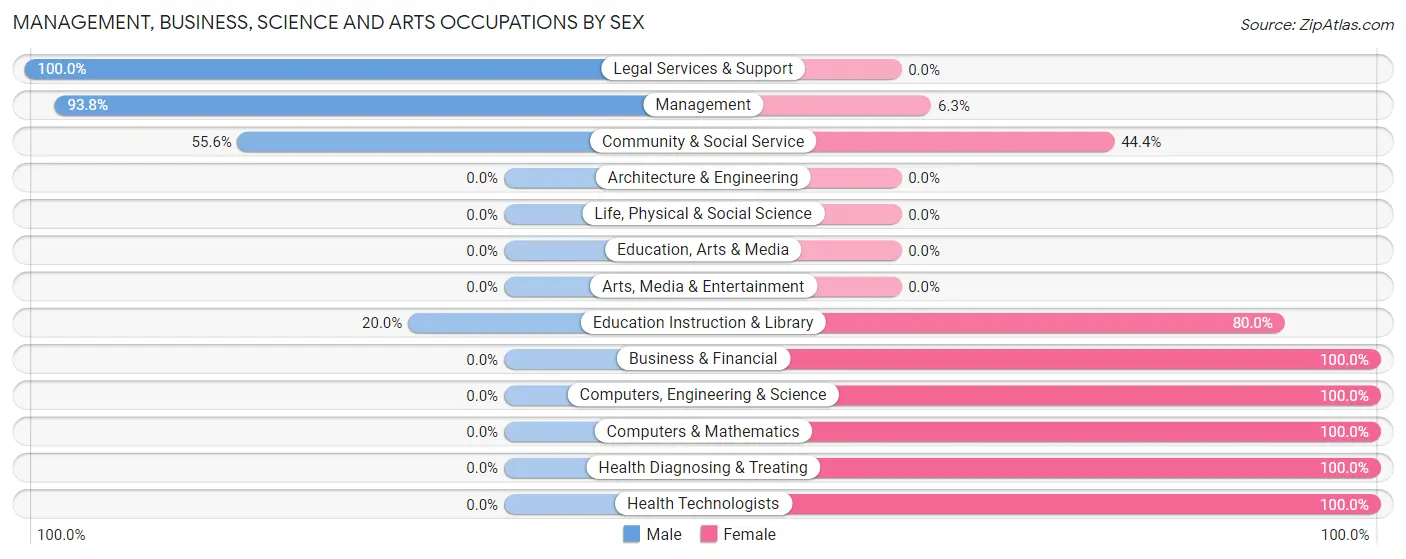
| Occupation | Male | Female |
| Management | 30 (93.8%) | 2 (6.2%) |
| Business & Financial | 0 (0.0%) | 2 (100.0%) |
| Computers, Engineering & Science | 0 (0.0%) | 4 (100.0%) |
| Computers & Mathematics | 0 (0.0%) | 4 (100.0%) |
| Architecture & Engineering | 0 (0.0%) | 0 (0.0%) |
| Life, Physical & Social Science | 0 (0.0%) | 0 (0.0%) |
| Community & Social Service | 5 (55.6%) | 4 (44.4%) |
| Education, Arts & Media | 0 (0.0%) | 0 (0.0%) |
| Legal Services & Support | 4 (100.0%) | 0 (0.0%) |
| Education Instruction & Library | 1 (20.0%) | 4 (80.0%) |
| Arts, Media & Entertainment | 0 (0.0%) | 0 (0.0%) |
| Health Diagnosing & Treating | 0 (0.0%) | 22 (100.0%) |
| Health Technologists | 0 (0.0%) | 17 (100.0%) |
| Total (Category) | 35 (50.7%) | 34 (49.3%) |
| Total (Overall) | 76 (52.8%) | 68 (47.2%) |
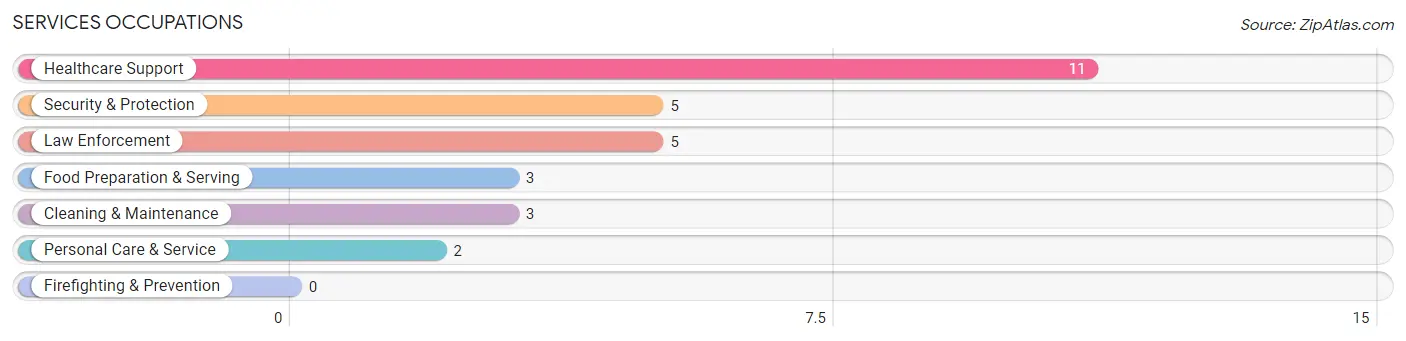
Services Occupations
The most common Services occupations in Cherry Creek are Healthcare Support (11 | 7.6%), Security & Protection (5 | 3.5%), Law Enforcement (5 | 3.5%), Food Preparation & Serving (3 | 2.1%), and Cleaning & Maintenance (3 | 2.1%).
Services Occupations by Sex
Within the Services occupations in Cherry Creek, the most male-oriented occupations are Cleaning & Maintenance (100.0%), Food Preparation & Serving (66.7%), and Security & Protection (60.0%), while the most female-oriented occupations are Personal Care & Service (100.0%), Healthcare Support (72.7%), and Security & Protection (40.0%).
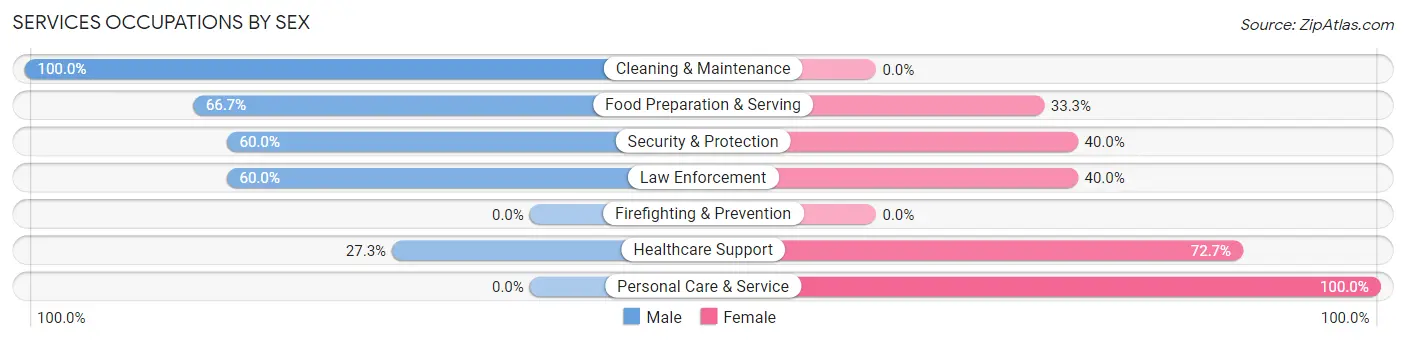
| Occupation | Male | Female |
| Healthcare Support | 3 (27.3%) | 8 (72.7%) |
| Security & Protection | 3 (60.0%) | 2 (40.0%) |
| Firefighting & Prevention | 0 (0.0%) | 0 (0.0%) |
| Law Enforcement | 3 (60.0%) | 2 (40.0%) |
| Food Preparation & Serving | 2 (66.7%) | 1 (33.3%) |
| Cleaning & Maintenance | 3 (100.0%) | 0 (0.0%) |
| Personal Care & Service | 0 (0.0%) | 2 (100.0%) |
| Total (Category) | 11 (45.8%) | 13 (54.2%) |
| Total (Overall) | 76 (52.8%) | 68 (47.2%) |
Sales and Office Occupations
The most common Sales and Office occupations in Cherry Creek are , and Office & Administration (19 | 13.2%).
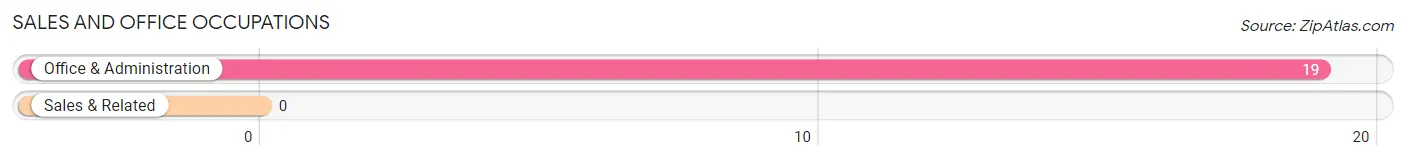
Sales and Office Occupations by Sex
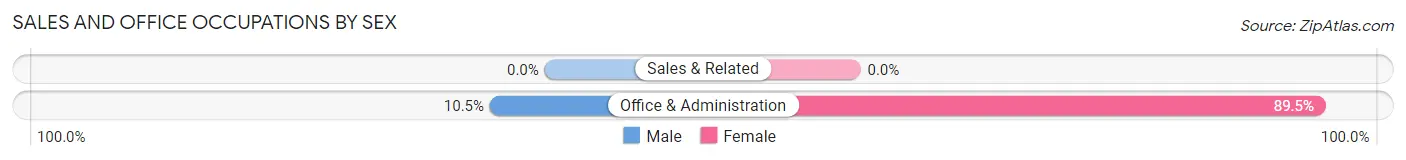
| Occupation | Male | Female |
| Sales & Related | 0 (0.0%) | 0 (0.0%) |
| Office & Administration | 2 (10.5%) | 17 (89.5%) |
| Total (Category) | 2 (10.5%) | 17 (89.5%) |
| Total (Overall) | 76 (52.8%) | 68 (47.2%) |
Natural Resources, Construction and Maintenance Occupations
The most common Natural Resources, Construction and Maintenance occupations in Cherry Creek are Construction & Extraction (8 | 5.6%), and Installation, Maintenance & Repair (1 | 0.7%).
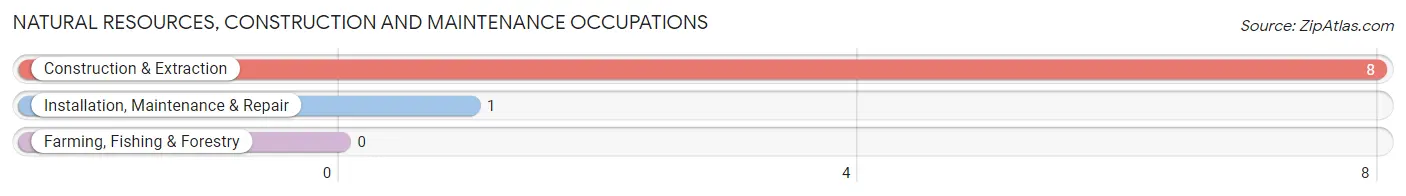
Natural Resources, Construction and Maintenance Occupations by Sex
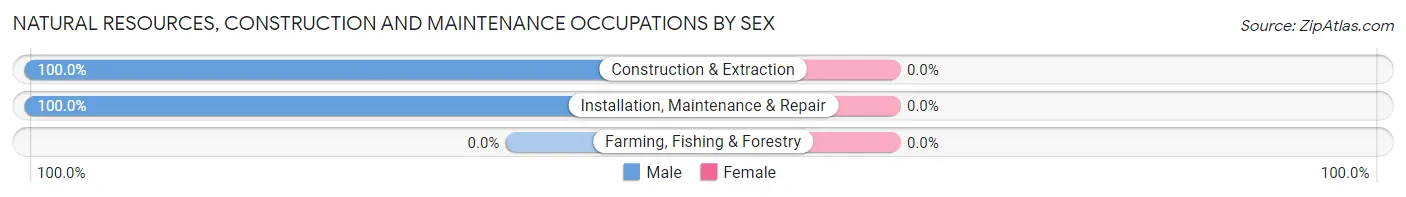
| Occupation | Male | Female |
| Farming, Fishing & Forestry | 0 (0.0%) | 0 (0.0%) |
| Construction & Extraction | 8 (100.0%) | 0 (0.0%) |
| Installation, Maintenance & Repair | 1 (100.0%) | 0 (0.0%) |
| Total (Category) | 9 (100.0%) | 0 (0.0%) |
| Total (Overall) | 76 (52.8%) | 68 (47.2%) |
Production, Transportation and Moving Occupations
The most common Production, Transportation and Moving occupations in Cherry Creek are Transportation (11 | 7.6%), Production (10 | 6.9%), and Material Moving (2 | 1.4%).
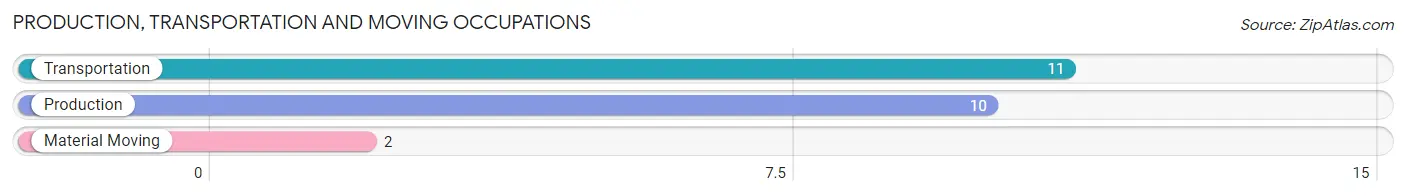
Production, Transportation and Moving Occupations by Sex
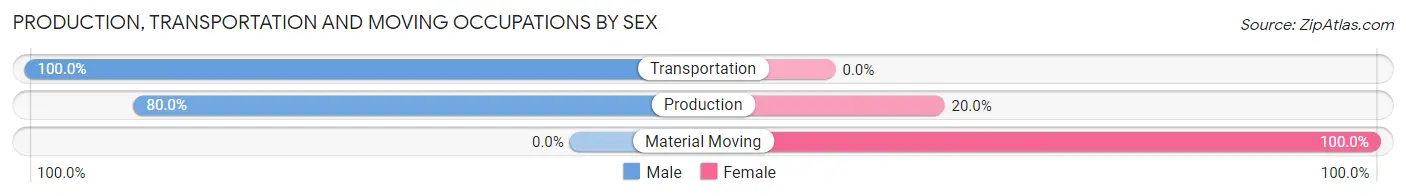
| Occupation | Male | Female |
| Production | 8 (80.0%) | 2 (20.0%) |
| Transportation | 11 (100.0%) | 0 (0.0%) |
| Material Moving | 0 (0.0%) | 2 (100.0%) |
| Total (Category) | 19 (82.6%) | 4 (17.4%) |
| Total (Overall) | 76 (52.8%) | 68 (47.2%) |
Employment Industries by Sex in Cherry Creek
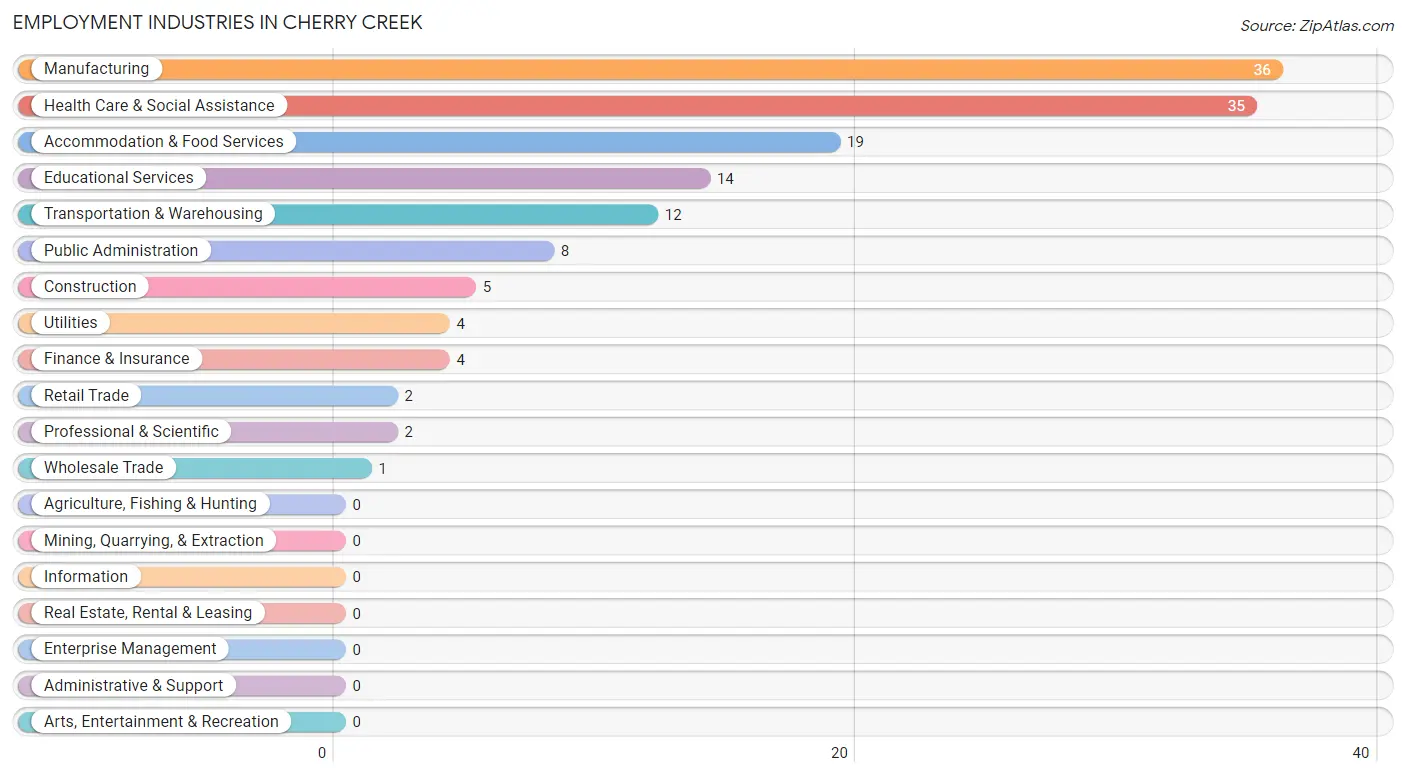
Employment Industries in Cherry Creek
The major employment industries in Cherry Creek include Manufacturing (36 | 25.0%), Health Care & Social Assistance (35 | 24.3%), Accommodation & Food Services (19 | 13.2%), Educational Services (14 | 9.7%), and Transportation & Warehousing (12 | 8.3%).
Employment Industries by Sex in Cherry Creek
The Cherry Creek industries that see more men than women are Construction (100.0%), Wholesale Trade (100.0%), and Utilities (100.0%), whereas the industries that tend to have a higher number of women are Retail Trade (100.0%), Professional & Scientific (100.0%), and Accommodation & Food Services (89.5%).
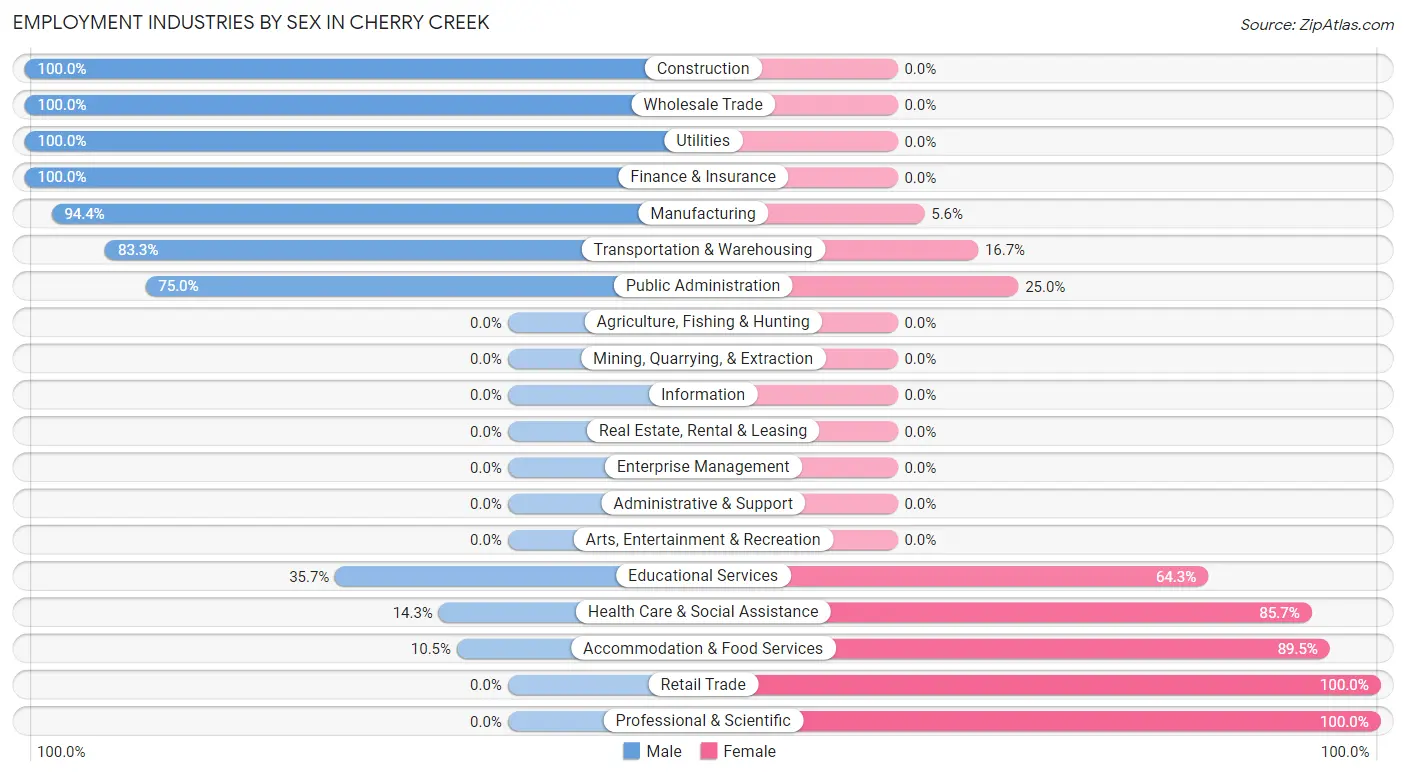
| Industry | Male | Female |
| Agriculture, Fishing & Hunting | 0 (0.0%) | 0 (0.0%) |
| Mining, Quarrying, & Extraction | 0 (0.0%) | 0 (0.0%) |
| Construction | 5 (100.0%) | 0 (0.0%) |
| Manufacturing | 34 (94.4%) | 2 (5.6%) |
| Wholesale Trade | 1 (100.0%) | 0 (0.0%) |
| Retail Trade | 0 (0.0%) | 2 (100.0%) |
| Transportation & Warehousing | 10 (83.3%) | 2 (16.7%) |
| Utilities | 4 (100.0%) | 0 (0.0%) |
| Information | 0 (0.0%) | 0 (0.0%) |
| Finance & Insurance | 4 (100.0%) | 0 (0.0%) |
| Real Estate, Rental & Leasing | 0 (0.0%) | 0 (0.0%) |
| Professional & Scientific | 0 (0.0%) | 2 (100.0%) |
| Enterprise Management | 0 (0.0%) | 0 (0.0%) |
| Administrative & Support | 0 (0.0%) | 0 (0.0%) |
| Educational Services | 5 (35.7%) | 9 (64.3%) |
| Health Care & Social Assistance | 5 (14.3%) | 30 (85.7%) |
| Arts, Entertainment & Recreation | 0 (0.0%) | 0 (0.0%) |
| Accommodation & Food Services | 2 (10.5%) | 17 (89.5%) |
| Public Administration | 6 (75.0%) | 2 (25.0%) |
| Total | 76 (52.8%) | 68 (47.2%) |
Education in Cherry Creek
School Enrollment in Cherry Creek
The most common levels of schooling among the 36 students in Cherry Creek are middle school (13 | 36.1%), elementary school (10 | 27.8%), and high school (5 | 13.9%).
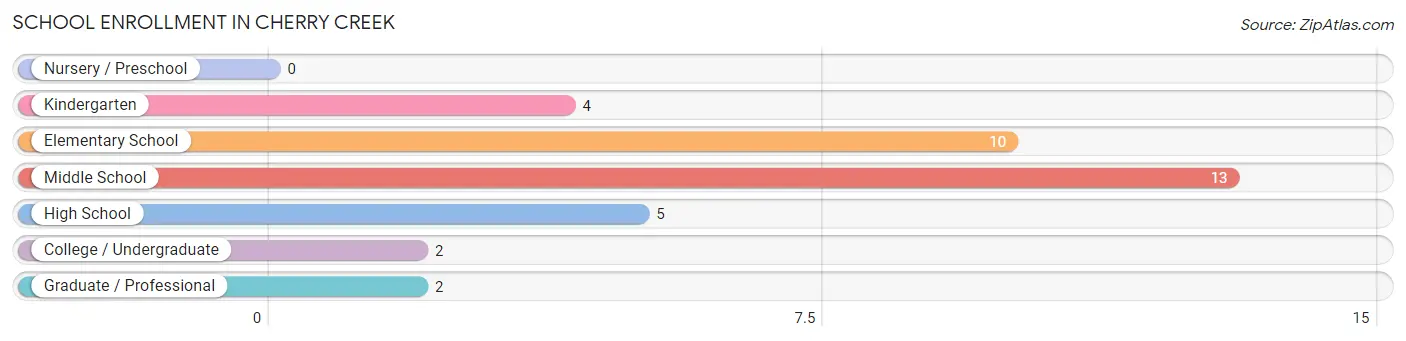
| School Level | # Students | % Students |
| Nursery / Preschool | 0 | 0.0% |
| Kindergarten | 4 | 11.1% |
| Elementary School | 10 | 27.8% |
| Middle School | 13 | 36.1% |
| High School | 5 | 13.9% |
| College / Undergraduate | 2 | 5.6% |
| Graduate / Professional | 2 | 5.6% |
| Total | 36 | 100.0% |
School Enrollment by Age by Funding Source in Cherry Creek
Out of a total of 36 students who are enrolled in schools in Cherry Creek, 5 (13.9%) attend a private institution, while the remaining 31 (86.1%) are enrolled in public schools. The age group of 20 to 24 year olds has the highest likelihood of being enrolled in private schools, with 2 (100.0% in the age bracket) enrolled. Conversely, the age group of 10 to 14 year olds has the lowest likelihood of being enrolled in a private school, with 13 (100.0% in the age bracket) attending a public institution.
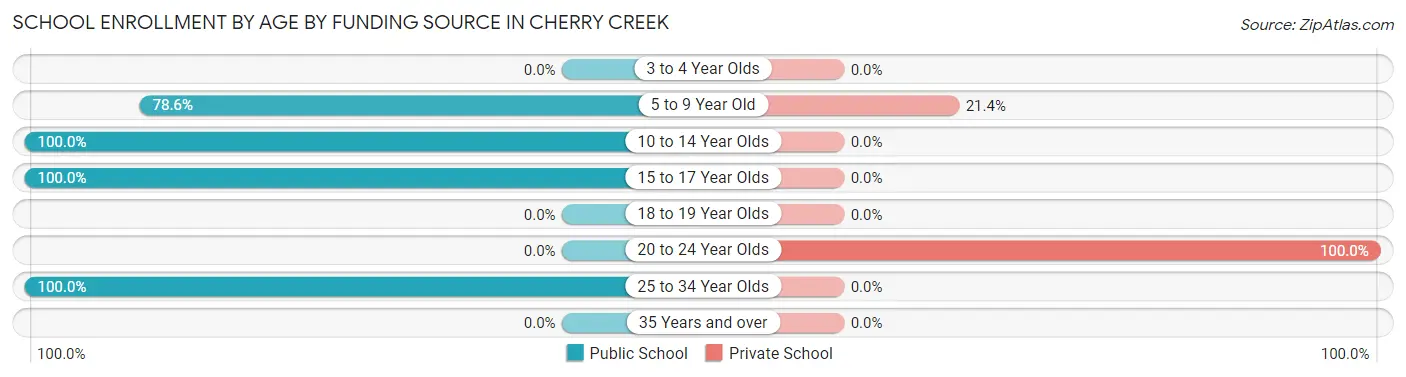
| Age Bracket | Public School | Private School |
| 3 to 4 Year Olds | 0 (0.0%) | 0 (0.0%) |
| 5 to 9 Year Old | 11 (78.6%) | 3 (21.4%) |
| 10 to 14 Year Olds | 13 (100.0%) | 0 (0.0%) |
| 15 to 17 Year Olds | 5 (100.0%) | 0 (0.0%) |
| 18 to 19 Year Olds | 0 (0.0%) | 0 (0.0%) |
| 20 to 24 Year Olds | 0 (0.0%) | 2 (100.0%) |
| 25 to 34 Year Olds | 2 (100.0%) | 0 (0.0%) |
| 35 Years and over | 0 (0.0%) | 0 (0.0%) |
| Total | 31 (86.1%) | 5 (13.9%) |
Educational Attainment by Field of Study in Cherry Creek
Business (24 | 48.0%), science & technology (11 | 22.0%), computers & mathematics (4 | 8.0%), physical & health sciences (4 | 8.0%), and psychology (3 | 6.0%) are the most common fields of study among 50 individuals in Cherry Creek who have obtained a bachelor's degree or higher.
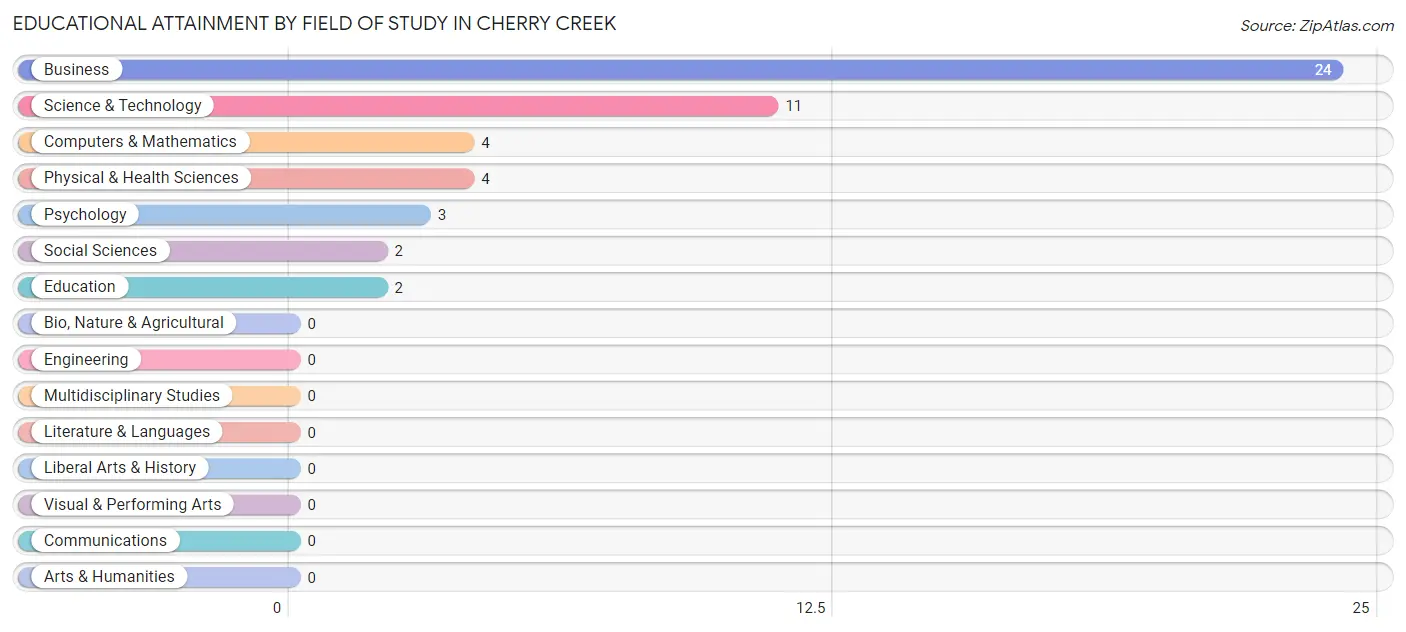
| Field of Study | # Graduates | % Graduates |
| Computers & Mathematics | 4 | 8.0% |
| Bio, Nature & Agricultural | 0 | 0.0% |
| Physical & Health Sciences | 4 | 8.0% |
| Psychology | 3 | 6.0% |
| Social Sciences | 2 | 4.0% |
| Engineering | 0 | 0.0% |
| Multidisciplinary Studies | 0 | 0.0% |
| Science & Technology | 11 | 22.0% |
| Business | 24 | 48.0% |
| Education | 2 | 4.0% |
| Literature & Languages | 0 | 0.0% |
| Liberal Arts & History | 0 | 0.0% |
| Visual & Performing Arts | 0 | 0.0% |
| Communications | 0 | 0.0% |
| Arts & Humanities | 0 | 0.0% |
| Total | 50 | 100.0% |
Transportation & Commute in Cherry Creek
Vehicle Availability by Sex in Cherry Creek
The most prevalent vehicle ownership categories in Cherry Creek are males with 2 vehicles (34, accounting for 44.7%) and females with 2 vehicles (23, making up 50.0%).
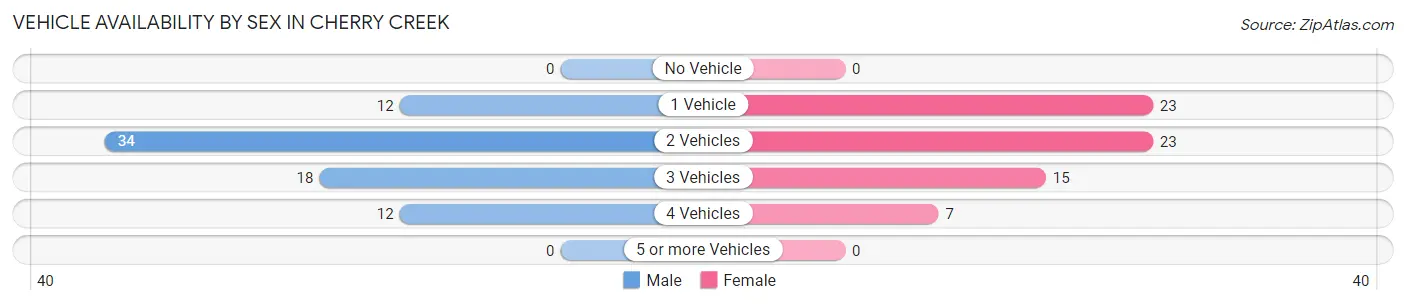
| Vehicles Available | Male | Female |
| No Vehicle | 0 (0.0%) | 0 (0.0%) |
| 1 Vehicle | 12 (15.8%) | 23 (33.8%) |
| 2 Vehicles | 34 (44.7%) | 23 (33.8%) |
| 3 Vehicles | 18 (23.7%) | 15 (22.1%) |
| 4 Vehicles | 12 (15.8%) | 7 (10.3%) |
| 5 or more Vehicles | 0 (0.0%) | 0 (0.0%) |
| Total | 76 (100.0%) | 68 (100.0%) |
Commute Time in Cherry Creek
The most frequently occuring commute durations in Cherry Creek are 30 to 34 minutes (44 commuters, 31.0%), 5 to 9 minutes (23 commuters, 16.2%), and 45 to 59 minutes (17 commuters, 12.0%).
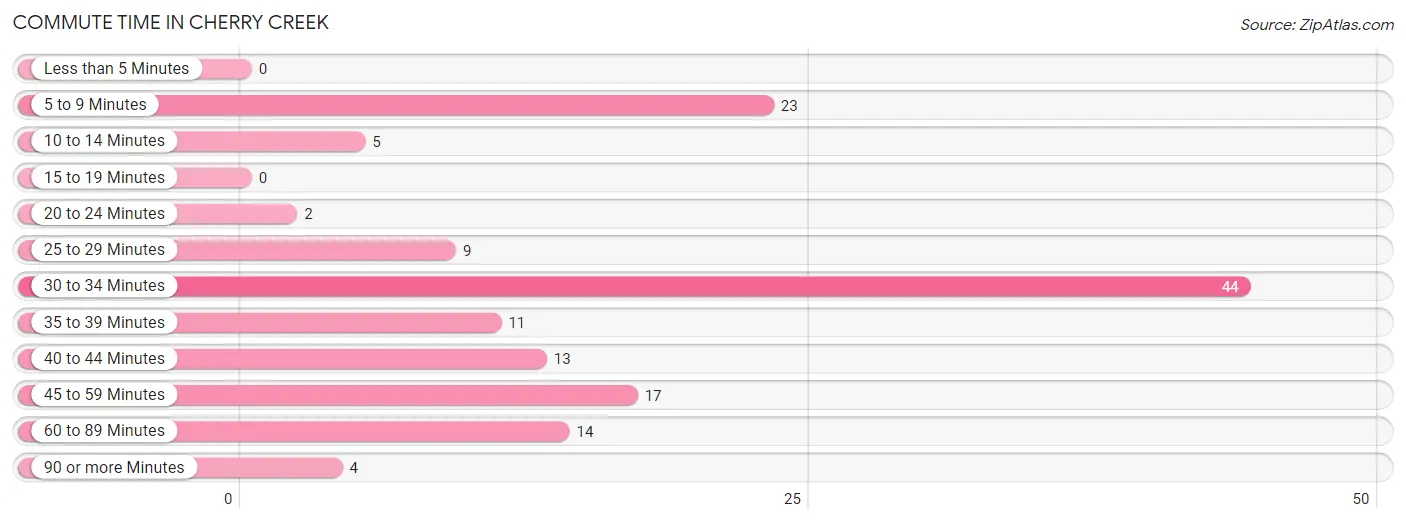
| Commute Time | # Commuters | % Commuters |
| Less than 5 Minutes | 0 | 0.0% |
| 5 to 9 Minutes | 23 | 16.2% |
| 10 to 14 Minutes | 5 | 3.5% |
| 15 to 19 Minutes | 0 | 0.0% |
| 20 to 24 Minutes | 2 | 1.4% |
| 25 to 29 Minutes | 9 | 6.3% |
| 30 to 34 Minutes | 44 | 31.0% |
| 35 to 39 Minutes | 11 | 7.7% |
| 40 to 44 Minutes | 13 | 9.1% |
| 45 to 59 Minutes | 17 | 12.0% |
| 60 to 89 Minutes | 14 | 9.9% |
| 90 or more Minutes | 4 | 2.8% |
Commute Time by Sex in Cherry Creek
The most common commute times in Cherry Creek are 30 to 34 minutes (21 commuters, 27.6%) for males and 30 to 34 minutes (23 commuters, 34.8%) for females.
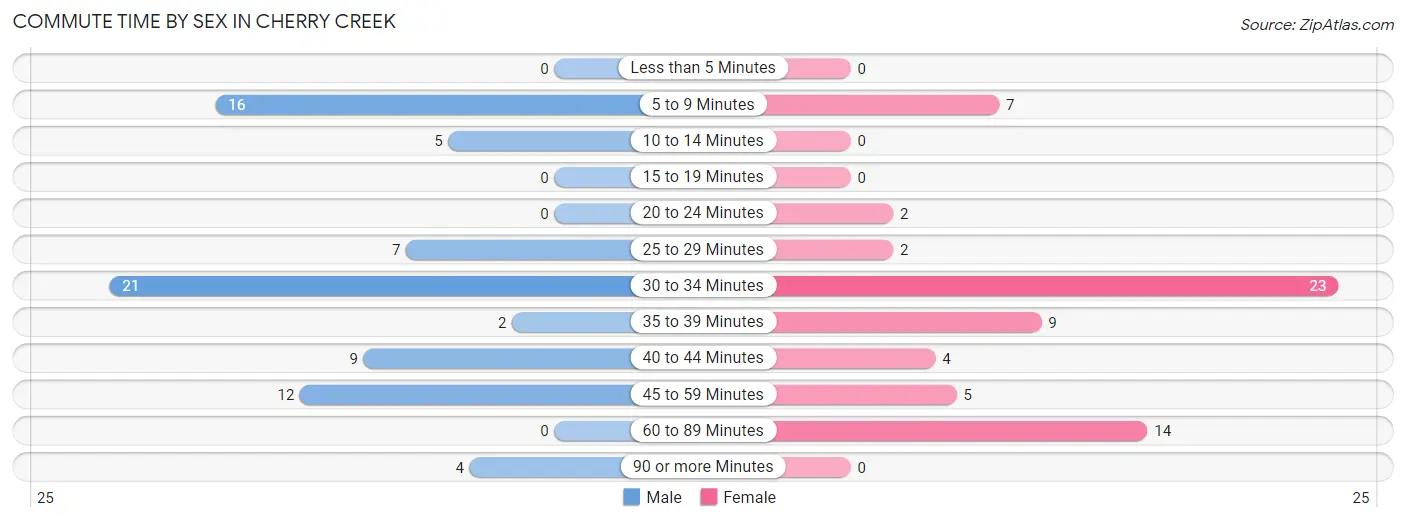
| Commute Time | Male | Female |
| Less than 5 Minutes | 0 (0.0%) | 0 (0.0%) |
| 5 to 9 Minutes | 16 (21.0%) | 7 (10.6%) |
| 10 to 14 Minutes | 5 (6.6%) | 0 (0.0%) |
| 15 to 19 Minutes | 0 (0.0%) | 0 (0.0%) |
| 20 to 24 Minutes | 0 (0.0%) | 2 (3.0%) |
| 25 to 29 Minutes | 7 (9.2%) | 2 (3.0%) |
| 30 to 34 Minutes | 21 (27.6%) | 23 (34.8%) |
| 35 to 39 Minutes | 2 (2.6%) | 9 (13.6%) |
| 40 to 44 Minutes | 9 (11.8%) | 4 (6.1%) |
| 45 to 59 Minutes | 12 (15.8%) | 5 (7.6%) |
| 60 to 89 Minutes | 0 (0.0%) | 14 (21.2%) |
| 90 or more Minutes | 4 (5.3%) | 0 (0.0%) |
Time of Departure to Work by Sex in Cherry Creek
The most frequent times of departure to work in Cherry Creek are 12:00 AM to 4:59 AM (17, 22.4%) for males and 5:30 AM to 5:59 AM (14, 21.2%) for females.
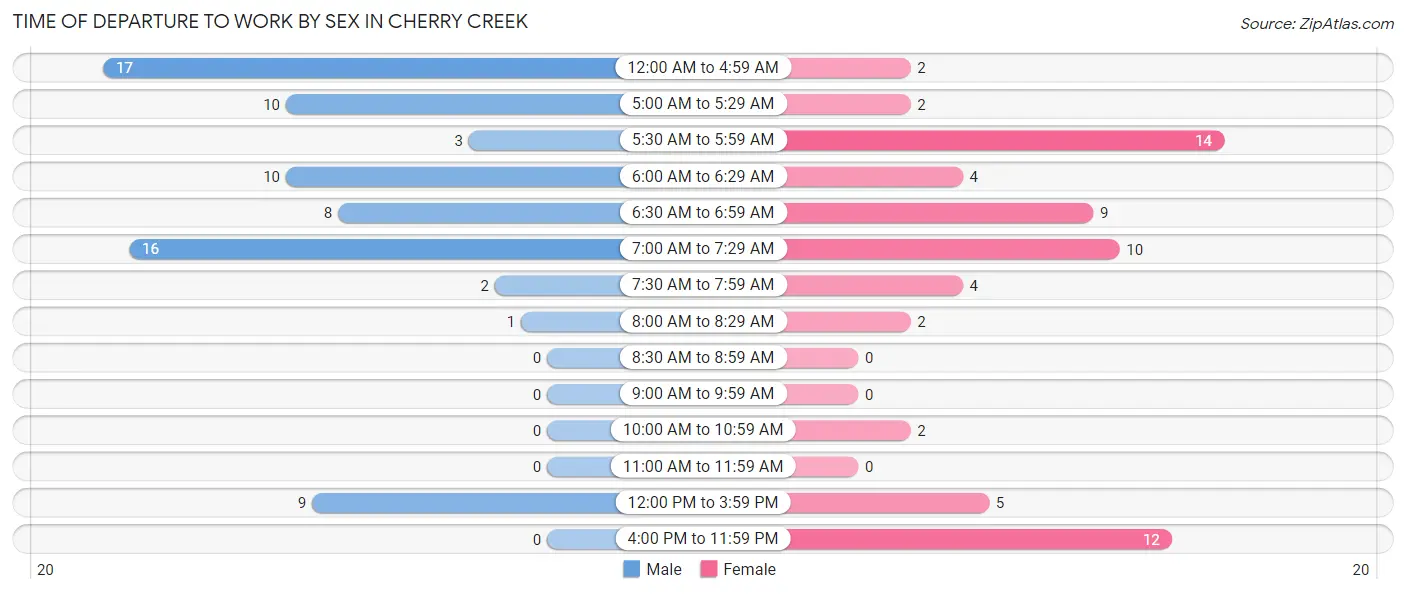
| Time of Departure | Male | Female |
| 12:00 AM to 4:59 AM | 17 (22.4%) | 2 (3.0%) |
| 5:00 AM to 5:29 AM | 10 (13.2%) | 2 (3.0%) |
| 5:30 AM to 5:59 AM | 3 (4.0%) | 14 (21.2%) |
| 6:00 AM to 6:29 AM | 10 (13.2%) | 4 (6.1%) |
| 6:30 AM to 6:59 AM | 8 (10.5%) | 9 (13.6%) |
| 7:00 AM to 7:29 AM | 16 (21.0%) | 10 (15.1%) |
| 7:30 AM to 7:59 AM | 2 (2.6%) | 4 (6.1%) |
| 8:00 AM to 8:29 AM | 1 (1.3%) | 2 (3.0%) |
| 8:30 AM to 8:59 AM | 0 (0.0%) | 0 (0.0%) |
| 9:00 AM to 9:59 AM | 0 (0.0%) | 0 (0.0%) |
| 10:00 AM to 10:59 AM | 0 (0.0%) | 2 (3.0%) |
| 11:00 AM to 11:59 AM | 0 (0.0%) | 0 (0.0%) |
| 12:00 PM to 3:59 PM | 9 (11.8%) | 5 (7.6%) |
| 4:00 PM to 11:59 PM | 0 (0.0%) | 12 (18.2%) |
| Total | 76 (100.0%) | 66 (100.0%) |
Housing Occupancy in Cherry Creek
Occupancy by Ownership in Cherry Creek
Of the total 132 dwellings in Cherry Creek, owner-occupied units account for 108 (81.8%), while renter-occupied units make up 24 (18.2%).
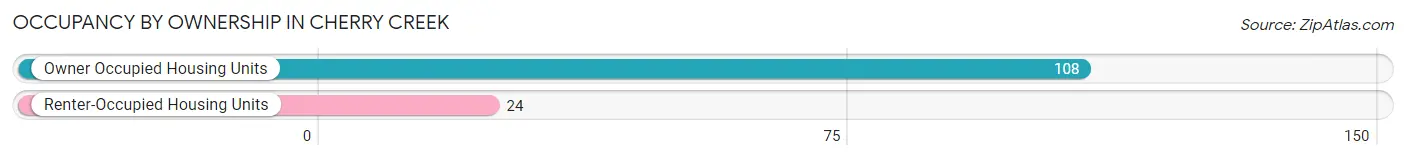
| Occupancy | # Housing Units | % Housing Units |
| Owner Occupied Housing Units | 108 | 81.8% |
| Renter-Occupied Housing Units | 24 | 18.2% |
| Total Occupied Housing Units | 132 | 100.0% |
Occupancy by Household Size in Cherry Creek
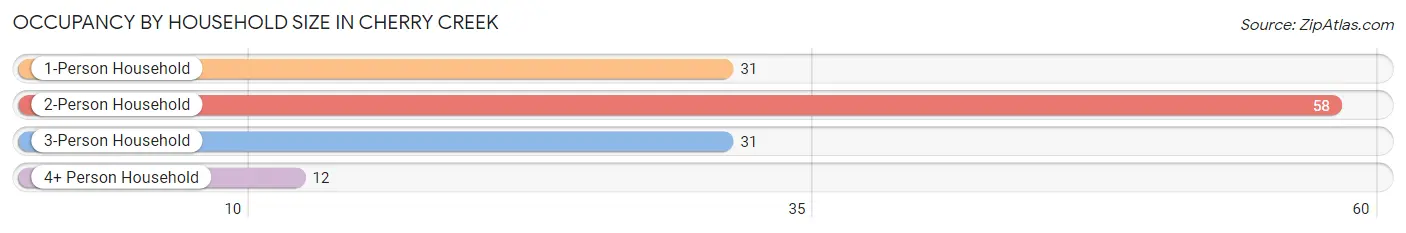
| Household Size | # Housing Units | % Housing Units |
| 1-Person Household | 31 | 23.5% |
| 2-Person Household | 58 | 43.9% |
| 3-Person Household | 31 | 23.5% |
| 4+ Person Household | 12 | 9.1% |
| Total Housing Units | 132 | 100.0% |
Occupancy by Ownership by Household Size in Cherry Creek
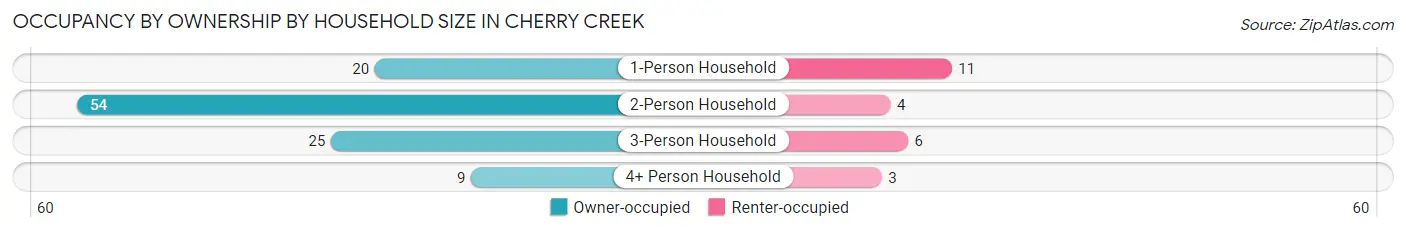
| Household Size | Owner-occupied | Renter-occupied |
| 1-Person Household | 20 (64.5%) | 11 (35.5%) |
| 2-Person Household | 54 (93.1%) | 4 (6.9%) |
| 3-Person Household | 25 (80.6%) | 6 (19.4%) |
| 4+ Person Household | 9 (75.0%) | 3 (25.0%) |
| Total Housing Units | 108 (81.8%) | 24 (18.2%) |
Occupancy by Educational Attainment in Cherry Creek
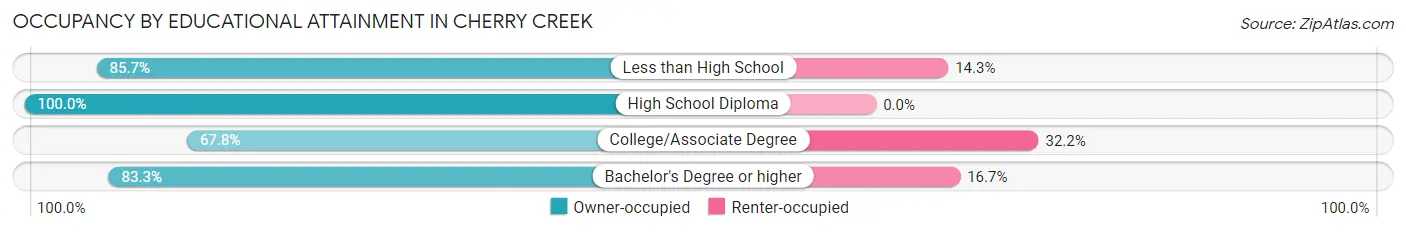
| Household Size | Owner-occupied | Renter-occupied |
| Less than High School | 6 (85.7%) | 1 (14.3%) |
| High School Diploma | 42 (100.0%) | 0 (0.0%) |
| College/Associate Degree | 40 (67.8%) | 19 (32.2%) |
| Bachelor's Degree or higher | 20 (83.3%) | 4 (16.7%) |
Occupancy by Age of Householder in Cherry Creek
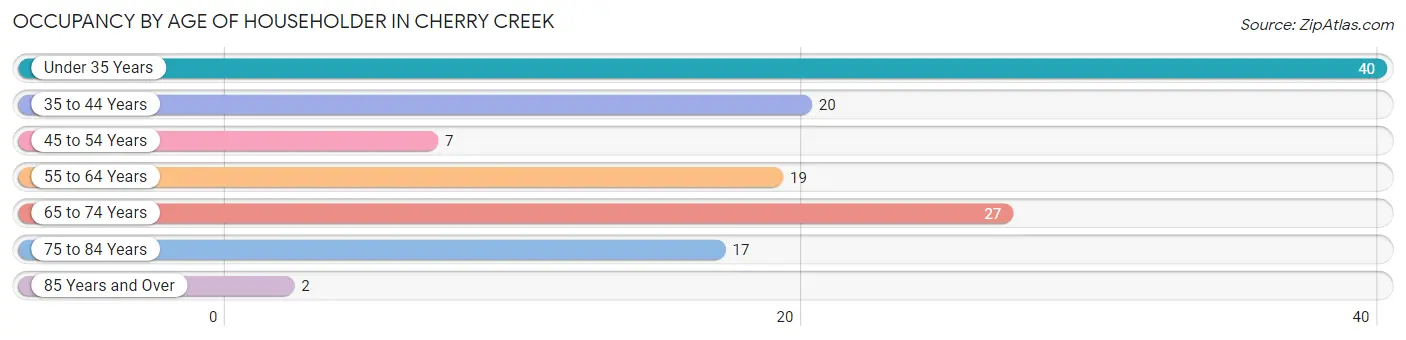
| Age Bracket | # Households | % Households |
| Under 35 Years | 40 | 30.3% |
| 35 to 44 Years | 20 | 15.1% |
| 45 to 54 Years | 7 | 5.3% |
| 55 to 64 Years | 19 | 14.4% |
| 65 to 74 Years | 27 | 20.4% |
| 75 to 84 Years | 17 | 12.9% |
| 85 Years and Over | 2 | 1.5% |
| Total | 132 | 100.0% |
Housing Finances in Cherry Creek
Median Income by Occupancy in Cherry Creek
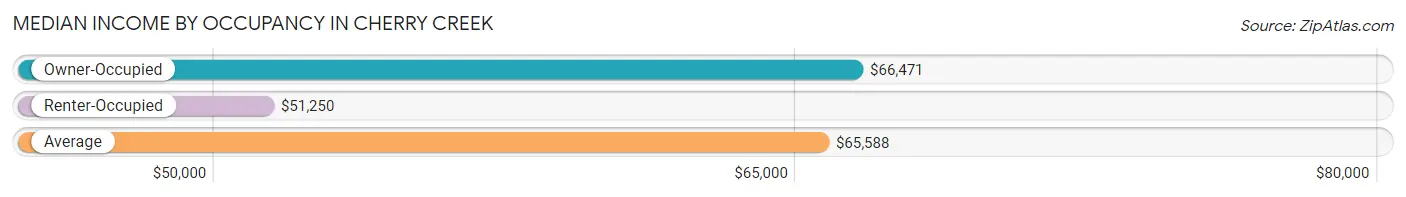
| Occupancy Type | # Households | Median Income |
| Owner-Occupied | 108 (81.8%) | $66,471 |
| Renter-Occupied | 24 (18.2%) | $51,250 |
| Average | 132 (100.0%) | $65,588 |
Occupancy by Householder Income Bracket in Cherry Creek
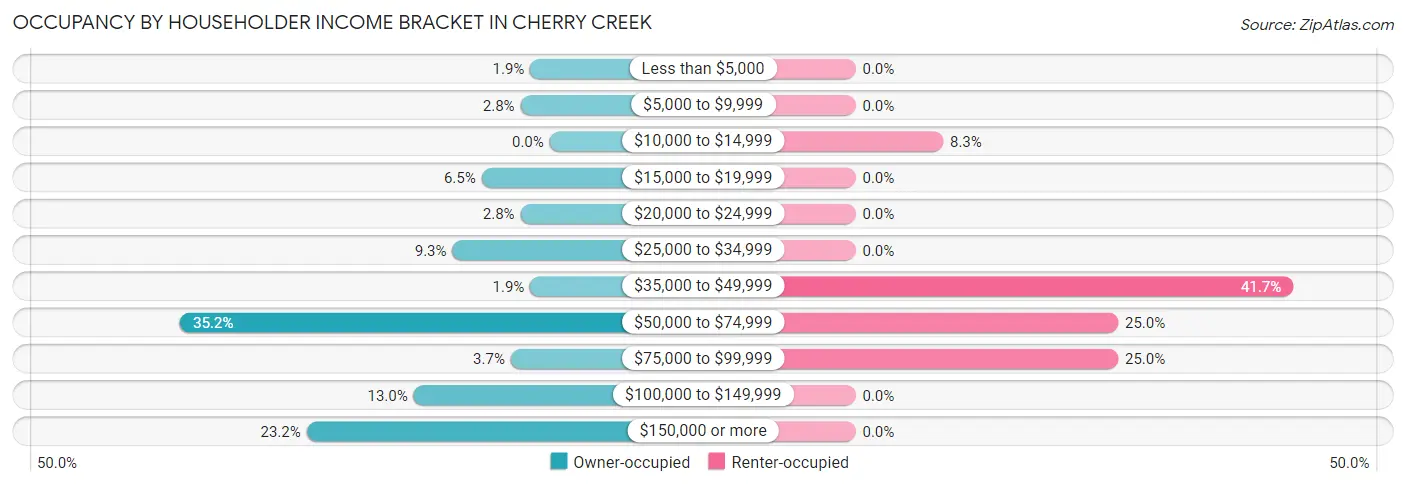
| Income Bracket | Owner-occupied | Renter-occupied |
| Less than $5,000 | 2 (1.8%) | 0 (0.0%) |
| $5,000 to $9,999 | 3 (2.8%) | 0 (0.0%) |
| $10,000 to $14,999 | 0 (0.0%) | 2 (8.3%) |
| $15,000 to $19,999 | 7 (6.5%) | 0 (0.0%) |
| $20,000 to $24,999 | 3 (2.8%) | 0 (0.0%) |
| $25,000 to $34,999 | 10 (9.3%) | 0 (0.0%) |
| $35,000 to $49,999 | 2 (1.8%) | 10 (41.7%) |
| $50,000 to $74,999 | 38 (35.2%) | 6 (25.0%) |
| $75,000 to $99,999 | 4 (3.7%) | 6 (25.0%) |
| $100,000 to $149,999 | 14 (13.0%) | 0 (0.0%) |
| $150,000 or more | 25 (23.2%) | 0 (0.0%) |
| Total | 108 (100.0%) | 24 (100.0%) |
Monthly Housing Cost Tiers in Cherry Creek
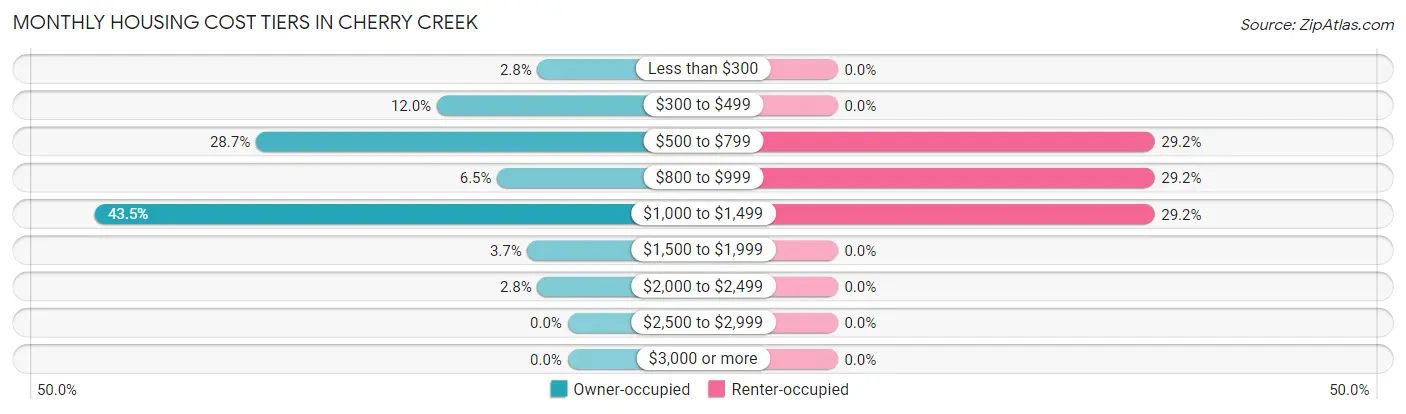
| Monthly Cost | Owner-occupied | Renter-occupied |
| Less than $300 | 3 (2.8%) | 0 (0.0%) |
| $300 to $499 | 13 (12.0%) | 0 (0.0%) |
| $500 to $799 | 31 (28.7%) | 7 (29.2%) |
| $800 to $999 | 7 (6.5%) | 7 (29.2%) |
| $1,000 to $1,499 | 47 (43.5%) | 7 (29.2%) |
| $1,500 to $1,999 | 4 (3.7%) | 0 (0.0%) |
| $2,000 to $2,499 | 3 (2.8%) | 0 (0.0%) |
| $2,500 to $2,999 | 0 (0.0%) | 0 (0.0%) |
| $3,000 or more | 0 (0.0%) | 0 (0.0%) |
| Total | 108 (100.0%) | 24 (100.0%) |
Physical Housing Characteristics in Cherry Creek
Housing Structures in Cherry Creek
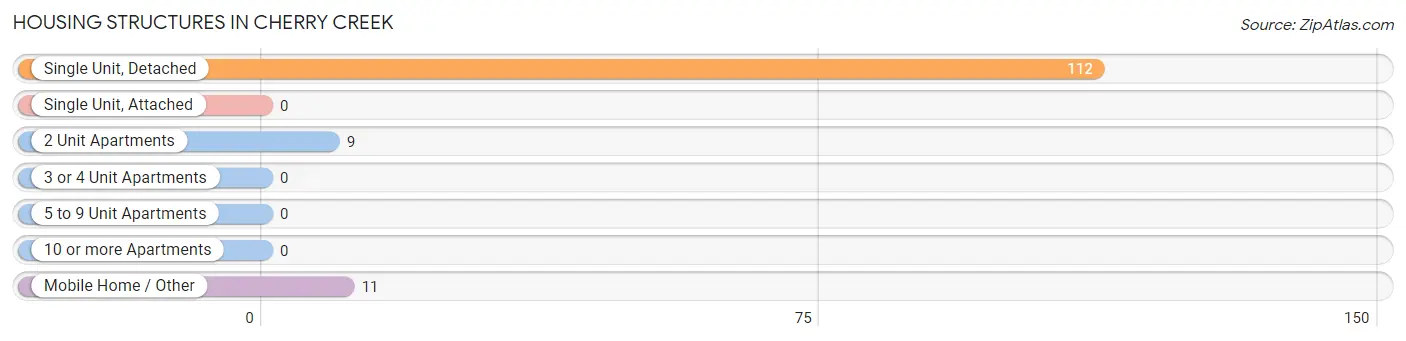
| Structure Type | # Housing Units | % Housing Units |
| Single Unit, Detached | 112 | 84.9% |
| Single Unit, Attached | 0 | 0.0% |
| 2 Unit Apartments | 9 | 6.8% |
| 3 or 4 Unit Apartments | 0 | 0.0% |
| 5 to 9 Unit Apartments | 0 | 0.0% |
| 10 or more Apartments | 0 | 0.0% |
| Mobile Home / Other | 11 | 8.3% |
| Total | 132 | 100.0% |
Housing Structures by Occupancy in Cherry Creek
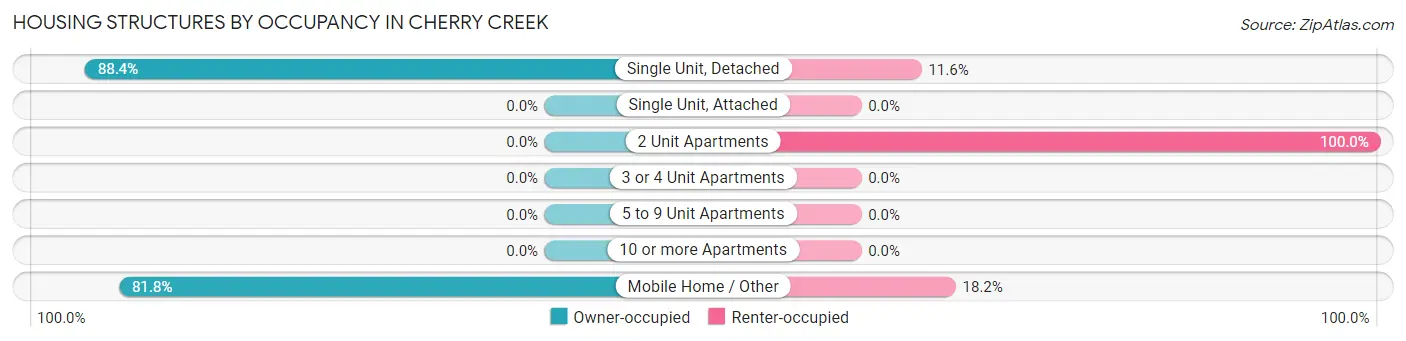
| Structure Type | Owner-occupied | Renter-occupied |
| Single Unit, Detached | 99 (88.4%) | 13 (11.6%) |
| Single Unit, Attached | 0 (0.0%) | 0 (0.0%) |
| 2 Unit Apartments | 0 (0.0%) | 9 (100.0%) |
| 3 or 4 Unit Apartments | 0 (0.0%) | 0 (0.0%) |
| 5 to 9 Unit Apartments | 0 (0.0%) | 0 (0.0%) |
| 10 or more Apartments | 0 (0.0%) | 0 (0.0%) |
| Mobile Home / Other | 9 (81.8%) | 2 (18.2%) |
| Total | 108 (81.8%) | 24 (18.2%) |
Housing Structures by Number of Rooms in Cherry Creek
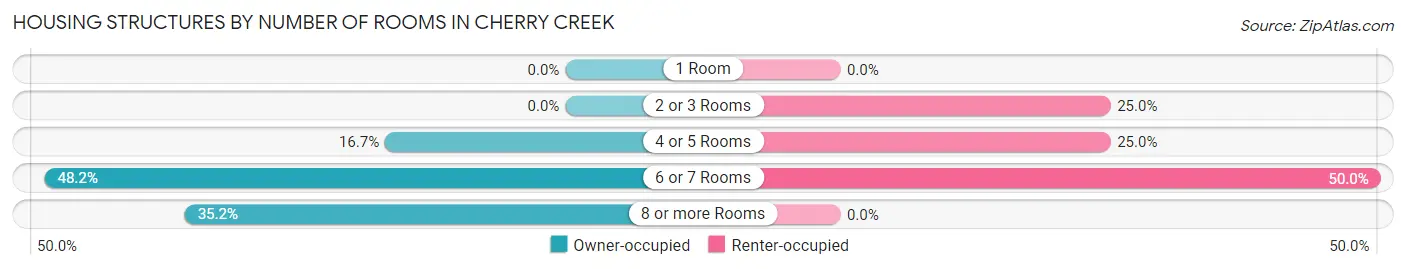
| Number of Rooms | Owner-occupied | Renter-occupied |
| 1 Room | 0 (0.0%) | 0 (0.0%) |
| 2 or 3 Rooms | 0 (0.0%) | 6 (25.0%) |
| 4 or 5 Rooms | 18 (16.7%) | 6 (25.0%) |
| 6 or 7 Rooms | 52 (48.1%) | 12 (50.0%) |
| 8 or more Rooms | 38 (35.2%) | 0 (0.0%) |
| Total | 108 (100.0%) | 24 (100.0%) |
Housing Structure by Heating Type in Cherry Creek
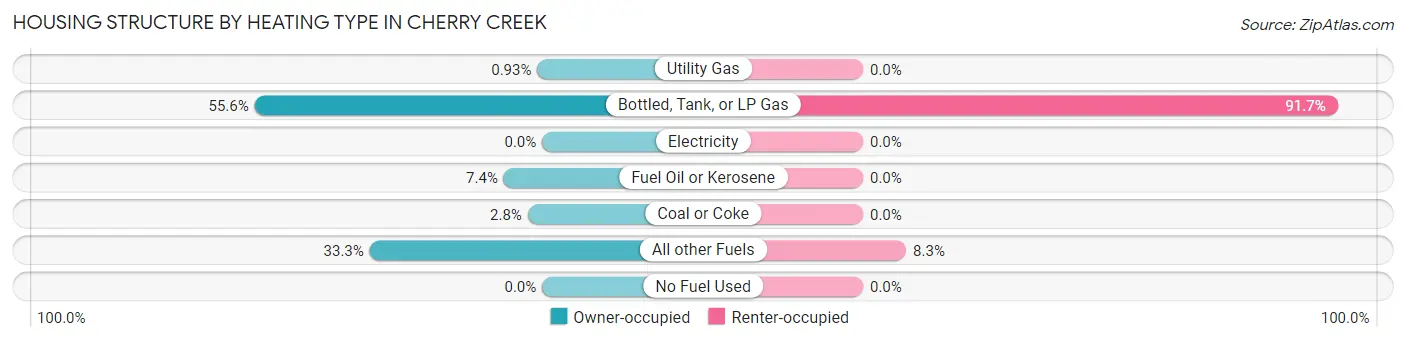
| Heating Type | Owner-occupied | Renter-occupied |
| Utility Gas | 1 (0.9%) | 0 (0.0%) |
| Bottled, Tank, or LP Gas | 60 (55.6%) | 22 (91.7%) |
| Electricity | 0 (0.0%) | 0 (0.0%) |
| Fuel Oil or Kerosene | 8 (7.4%) | 0 (0.0%) |
| Coal or Coke | 3 (2.8%) | 0 (0.0%) |
| All other Fuels | 36 (33.3%) | 2 (8.3%) |
| No Fuel Used | 0 (0.0%) | 0 (0.0%) |
| Total | 108 (100.0%) | 24 (100.0%) |
Household Vehicle Usage in Cherry Creek
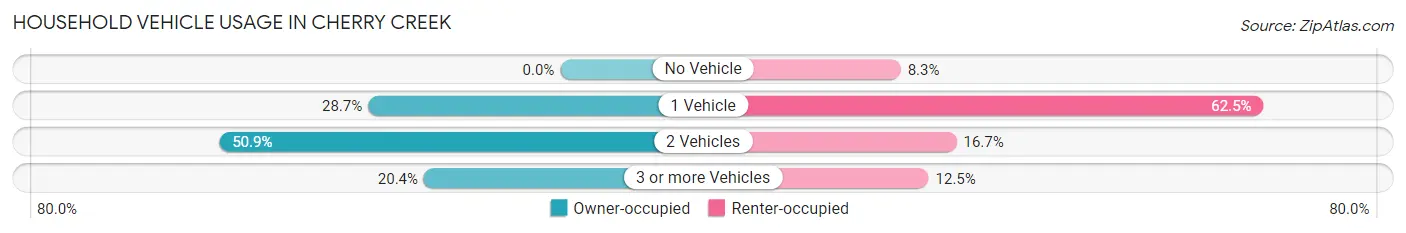
| Vehicles per Household | Owner-occupied | Renter-occupied |
| No Vehicle | 0 (0.0%) | 2 (8.3%) |
| 1 Vehicle | 31 (28.7%) | 15 (62.5%) |
| 2 Vehicles | 55 (50.9%) | 4 (16.7%) |
| 3 or more Vehicles | 22 (20.4%) | 3 (12.5%) |
| Total | 108 (100.0%) | 24 (100.0%) |
Real Estate & Mortgages in Cherry Creek
Real Estate and Mortgage Overview in Cherry Creek
| Characteristic | Without Mortgage | With Mortgage |
| Housing Units | 50 | 58 |
| Median Property Value | $65,000 | $70,000 |
| Median Household Income | $53,750 | $25 |
| Monthly Housing Costs | $600 | $0 |
| Real Estate Taxes | $2,100 | $0 |
Property Value by Mortgage Status in Cherry Creek
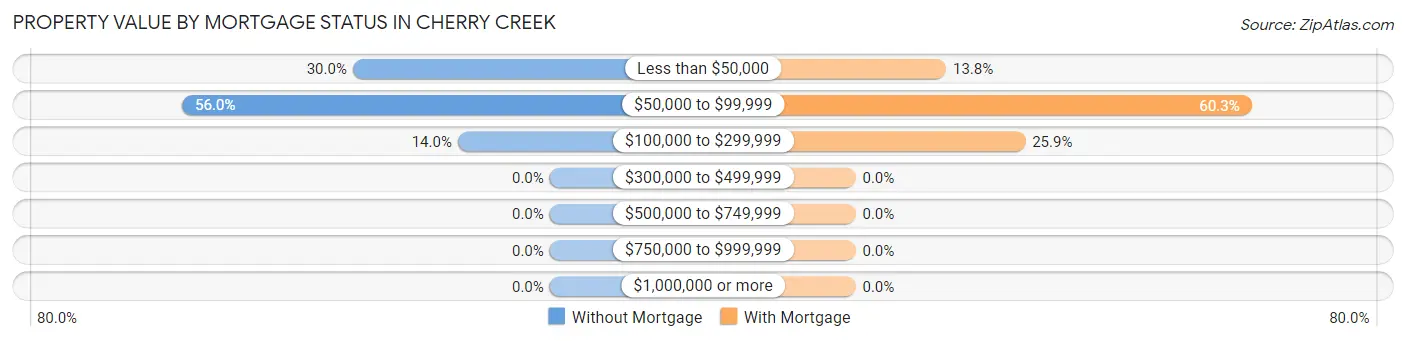
| Property Value | Without Mortgage | With Mortgage |
| Less than $50,000 | 15 (30.0%) | 8 (13.8%) |
| $50,000 to $99,999 | 28 (56.0%) | 35 (60.3%) |
| $100,000 to $299,999 | 7 (14.0%) | 15 (25.9%) |
| $300,000 to $499,999 | 0 (0.0%) | 0 (0.0%) |
| $500,000 to $749,999 | 0 (0.0%) | 0 (0.0%) |
| $750,000 to $999,999 | 0 (0.0%) | 0 (0.0%) |
| $1,000,000 or more | 0 (0.0%) | 0 (0.0%) |
| Total | 50 (100.0%) | 58 (100.0%) |
Household Income by Mortgage Status in Cherry Creek
| Household Income | Without Mortgage | With Mortgage |
| Less than $10,000 | 5 (10.0%) | 0 (0.0%) |
| $10,000 to $24,999 | 10 (20.0%) | 0 (0.0%) |
| $25,000 to $34,999 | 7 (14.0%) | 0 (0.0%) |
| $35,000 to $49,999 | 2 (4.0%) | 3 (5.2%) |
| $50,000 to $74,999 | 17 (34.0%) | 0 (0.0%) |
| $75,000 to $99,999 | 4 (8.0%) | 21 (36.2%) |
| $100,000 to $149,999 | 5 (10.0%) | 0 (0.0%) |
| $150,000 or more | 0 (0.0%) | 9 (15.5%) |
| Total | 50 (100.0%) | 58 (100.0%) |
Property Value to Household Income Ratio in Cherry Creek
| Value-to-Income Ratio | Without Mortgage | With Mortgage |
| Less than 2.0x | 32 (64.0%) | 107,083 (184,625.9%) |
| 2.0x to 2.9x | 6 (12.0%) | 58 (100.0%) |
| 3.0x to 3.9x | 4 (8.0%) | 0 (0.0%) |
| 4.0x or more | 8 (16.0%) | 0 (0.0%) |
| Total | 50 (100.0%) | 58 (100.0%) |
Real Estate Taxes by Mortgage Status in Cherry Creek
| Property Taxes | Without Mortgage | With Mortgage |
| Less than $800 | 13 (26.0%) | 0 (0.0%) |
| $800 to $1,499 | 8 (16.0%) | 0 (0.0%) |
| $800 to $1,499 | 26 (52.0%) | 9 (15.5%) |
| Total | 50 (100.0%) | 58 (100.0%) |
Health & Disability in Cherry Creek
Health Insurance Coverage by Age in Cherry Creek
| Age Bracket | With Coverage | Without Coverage |
| Under 6 Years | 34 (100.0%) | 0 (0.0%) |
| 6 to 18 Years | 31 (100.0%) | 0 (0.0%) |
| 19 to 25 Years | 27 (100.0%) | 0 (0.0%) |
| 26 to 34 Years | 58 (100.0%) | 0 (0.0%) |
| 35 to 44 Years | 27 (100.0%) | 0 (0.0%) |
| 45 to 54 Years | 29 (100.0%) | 0 (0.0%) |
| 55 to 64 Years | 36 (92.3%) | 3 (7.7%) |
| 65 to 74 Years | 40 (100.0%) | 0 (0.0%) |
| 75 Years and older | 24 (100.0%) | 0 (0.0%) |
| Total | 306 (99.0%) | 3 (1.0%) |
Health Insurance Coverage by Citizenship Status in Cherry Creek
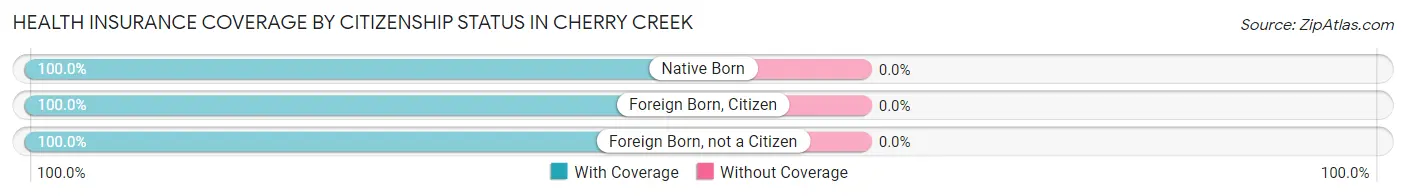
| Citizenship Status | With Coverage | Without Coverage |
| Native Born | 34 (100.0%) | 0 (0.0%) |
| Foreign Born, Citizen | 31 (100.0%) | 0 (0.0%) |
| Foreign Born, not a Citizen | 27 (100.0%) | 0 (0.0%) |
Health Insurance Coverage by Household Income in Cherry Creek
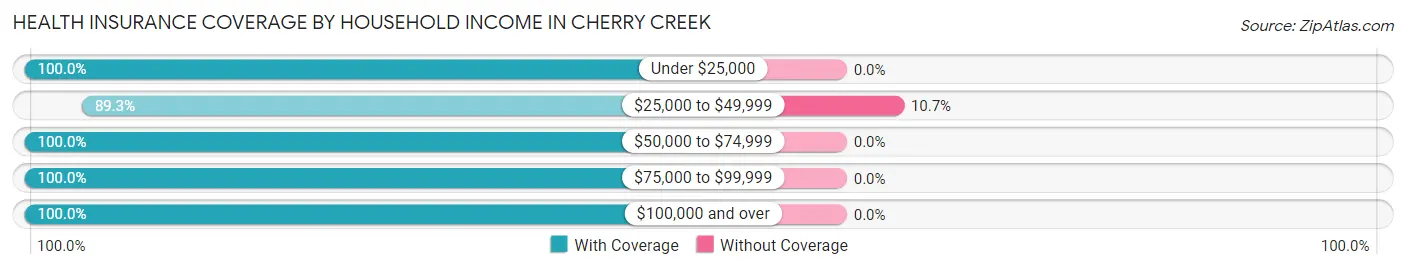
| Household Income | With Coverage | Without Coverage |
| Under $25,000 | 24 (100.0%) | 0 (0.0%) |
| $25,000 to $49,999 | 25 (89.3%) | 3 (10.7%) |
| $50,000 to $74,999 | 102 (100.0%) | 0 (0.0%) |
| $75,000 to $99,999 | 42 (100.0%) | 0 (0.0%) |
| $100,000 and over | 113 (100.0%) | 0 (0.0%) |
Public vs Private Health Insurance Coverage by Age in Cherry Creek
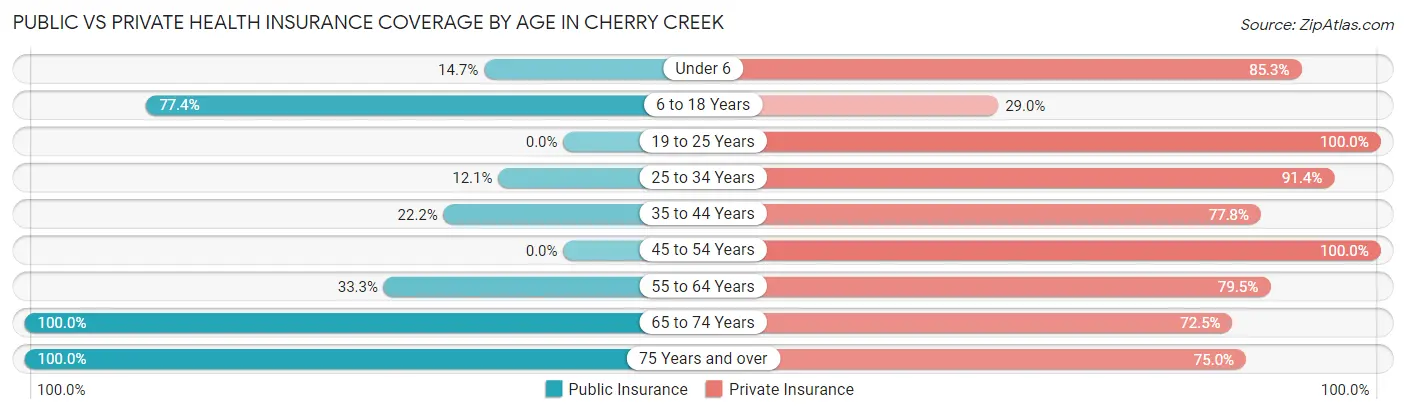
| Age Bracket | Public Insurance | Private Insurance |
| Under 6 | 5 (14.7%) | 29 (85.3%) |
| 6 to 18 Years | 24 (77.4%) | 9 (29.0%) |
| 19 to 25 Years | 0 (0.0%) | 27 (100.0%) |
| 25 to 34 Years | 7 (12.1%) | 53 (91.4%) |
| 35 to 44 Years | 6 (22.2%) | 21 (77.8%) |
| 45 to 54 Years | 0 (0.0%) | 29 (100.0%) |
| 55 to 64 Years | 13 (33.3%) | 31 (79.5%) |
| 65 to 74 Years | 40 (100.0%) | 29 (72.5%) |
| 75 Years and over | 24 (100.0%) | 18 (75.0%) |
| Total | 119 (38.5%) | 246 (79.6%) |
Disability Status by Sex by Age in Cherry Creek
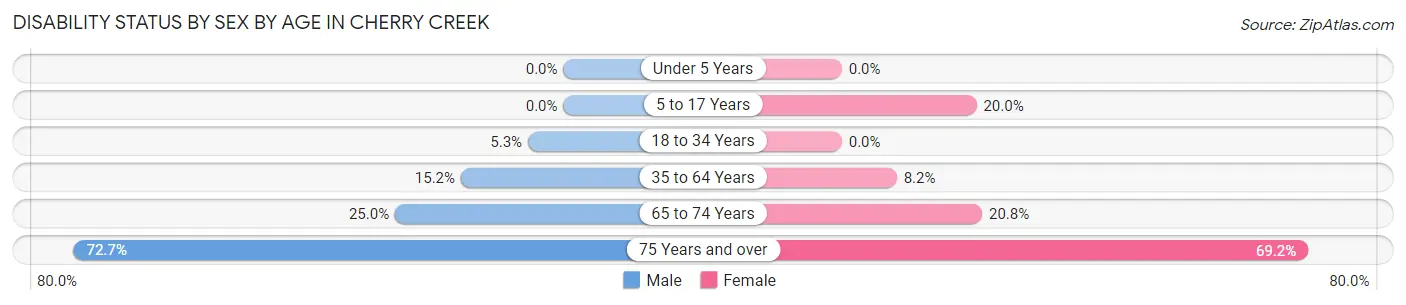
| Age Bracket | Male | Female |
| Under 5 Years | 0 (0.0%) | 0 (0.0%) |
| 5 to 17 Years | 0 (0.0%) | 3 (20.0%) |
| 18 to 34 Years | 2 (5.3%) | 0 (0.0%) |
| 35 to 64 Years | 7 (15.2%) | 4 (8.2%) |
| 65 to 74 Years | 4 (25.0%) | 5 (20.8%) |
| 75 Years and over | 8 (72.7%) | 9 (69.2%) |
Disability Class by Sex by Age in Cherry Creek
Disability Class: Hearing Difficulty
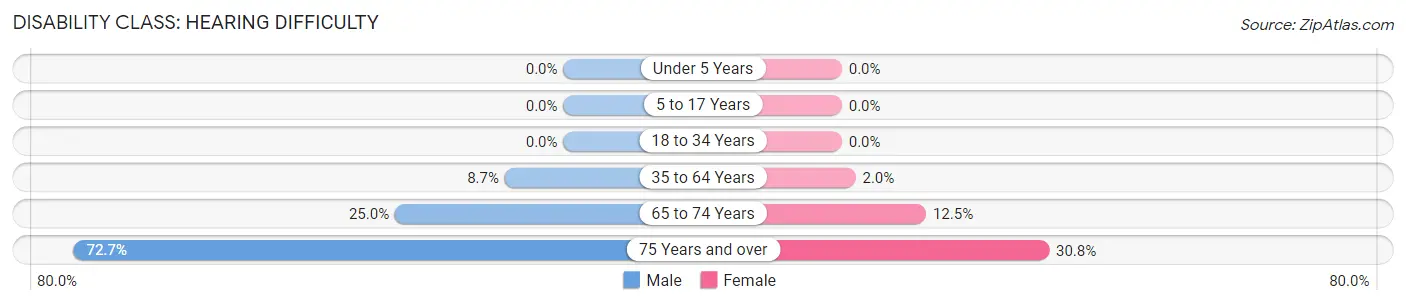
| Age Bracket | Male | Female |
| Under 5 Years | 0 (0.0%) | 0 (0.0%) |
| 5 to 17 Years | 0 (0.0%) | 0 (0.0%) |
| 18 to 34 Years | 0 (0.0%) | 0 (0.0%) |
| 35 to 64 Years | 4 (8.7%) | 1 (2.0%) |
| 65 to 74 Years | 4 (25.0%) | 3 (12.5%) |
| 75 Years and over | 8 (72.7%) | 4 (30.8%) |
Disability Class: Vision Difficulty
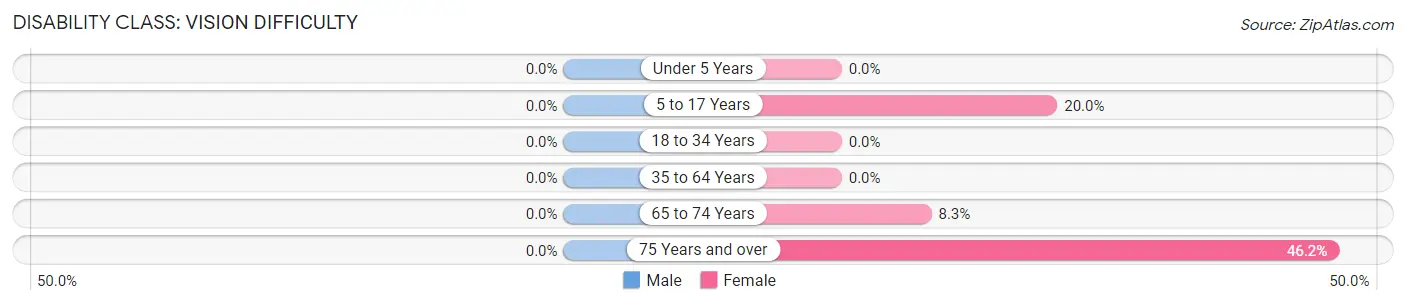
| Age Bracket | Male | Female |
| Under 5 Years | 0 (0.0%) | 0 (0.0%) |
| 5 to 17 Years | 0 (0.0%) | 3 (20.0%) |
| 18 to 34 Years | 0 (0.0%) | 0 (0.0%) |
| 35 to 64 Years | 0 (0.0%) | 0 (0.0%) |
| 65 to 74 Years | 0 (0.0%) | 2 (8.3%) |
| 75 Years and over | 0 (0.0%) | 6 (46.2%) |
Disability Class: Cognitive Difficulty
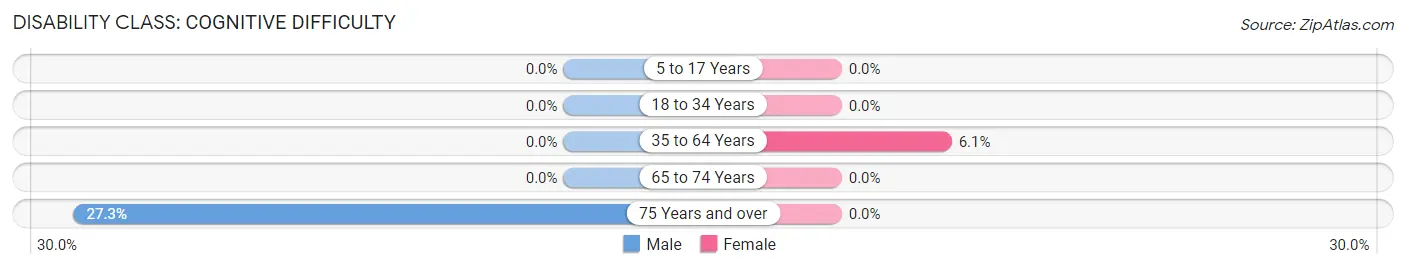
| Age Bracket | Male | Female |
| 5 to 17 Years | 0 (0.0%) | 0 (0.0%) |
| 18 to 34 Years | 0 (0.0%) | 0 (0.0%) |
| 35 to 64 Years | 0 (0.0%) | 3 (6.1%) |
| 65 to 74 Years | 0 (0.0%) | 0 (0.0%) |
| 75 Years and over | 3 (27.3%) | 0 (0.0%) |
Disability Class: Ambulatory Difficulty
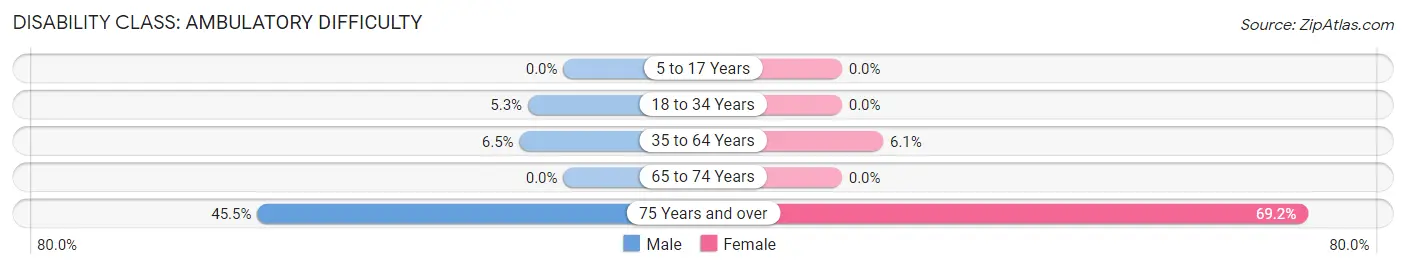
| Age Bracket | Male | Female |
| 5 to 17 Years | 0 (0.0%) | 0 (0.0%) |
| 18 to 34 Years | 2 (5.3%) | 0 (0.0%) |
| 35 to 64 Years | 3 (6.5%) | 3 (6.1%) |
| 65 to 74 Years | 0 (0.0%) | 0 (0.0%) |
| 75 Years and over | 5 (45.5%) | 9 (69.2%) |
Disability Class: Self-Care Difficulty
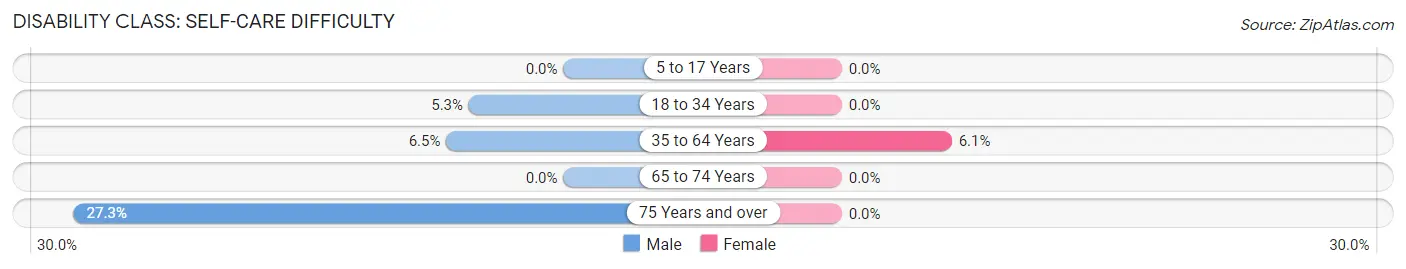
| Age Bracket | Male | Female |
| 5 to 17 Years | 0 (0.0%) | 0 (0.0%) |
| 18 to 34 Years | 2 (5.3%) | 0 (0.0%) |
| 35 to 64 Years | 3 (6.5%) | 3 (6.1%) |
| 65 to 74 Years | 0 (0.0%) | 0 (0.0%) |
| 75 Years and over | 3 (27.3%) | 0 (0.0%) |
Technology Access in Cherry Creek
Computing Device Access in Cherry Creek
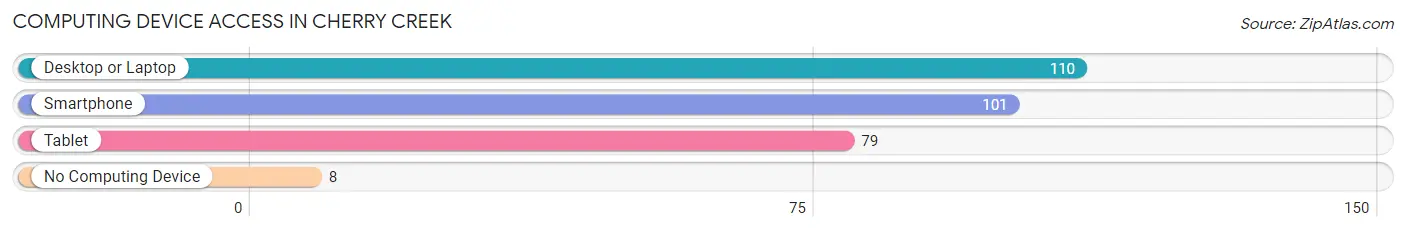
| Device Type | # Households | % Households |
| Desktop or Laptop | 110 | 83.3% |
| Smartphone | 101 | 76.5% |
| Tablet | 79 | 59.9% |
| No Computing Device | 8 | 6.1% |
| Total | 132 | 100.0% |
Internet Access in Cherry Creek
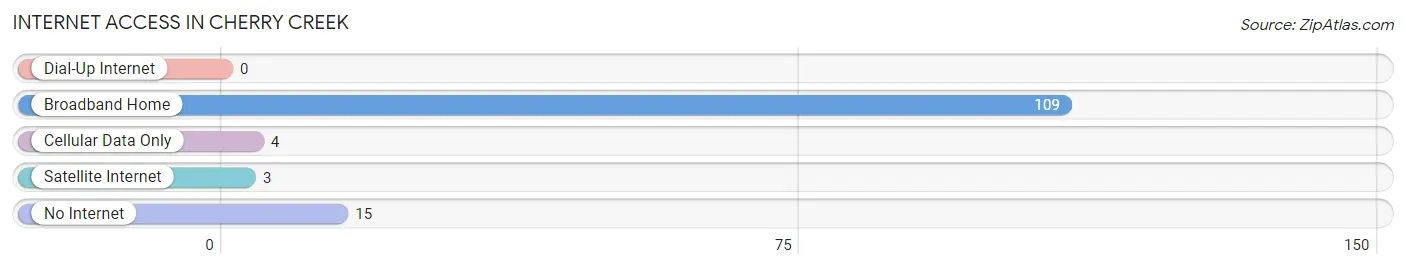
| Internet Type | # Households | % Households |
| Dial-Up Internet | 0 | 0.0% |
| Broadband Home | 109 | 82.6% |
| Cellular Data Only | 4 | 3.0% |
| Satellite Internet | 3 | 2.3% |
| No Internet | 15 | 11.4% |
| Total | 132 | 100.0% |
Cherry Creek Summary
Cherry Creek is a small town located in Chautauqua County, New York. It is situated in the southwestern corner of the county, near the Pennsylvania border. The town is home to a population of approximately 1,000 people, and is part of the Jamestown-Dunkirk-Fredonia metropolitan area.
History
The area that is now Cherry Creek was first settled in 1811 by a group of settlers from Connecticut. The town was originally known as “Cherry Valley”, and was later changed to “Cherry Creek” in 1820. The town was officially incorporated in 1821.
The town was originally a farming community, and the main crops grown were wheat, corn, and potatoes. The town also had a number of sawmills and gristmills, which provided lumber and grain for the local population.
In the late 19th century, the town began to experience a period of growth and development. The railroad arrived in 1881, and the town was connected to the larger cities of Buffalo and Jamestown. This allowed for the transportation of goods and people, and helped to spur economic growth.
The town also experienced a period of industrialization in the early 20th century. The first factory was opened in 1906, and by the 1920s, the town had several factories producing furniture, clothing, and other goods.
Geography
Cherry Creek is located in the southwestern corner of Chautauqua County, near the Pennsylvania border. The town is situated on the banks of the Conewango Creek, and is surrounded by rolling hills and forests. The town is located approximately 25 miles south of Buffalo, and 50 miles east of Erie, Pennsylvania.
The town has a total area of 8.2 square miles, all of which is land. The town is home to several small lakes, including Lake Erie, Lake Chautauqua, and Lake Erie.
Economy
The economy of Cherry Creek is largely based on agriculture and manufacturing. The town is home to several farms, which produce a variety of crops, including corn, wheat, and potatoes. The town also has several factories, which produce furniture, clothing, and other goods.
The town is also home to several small businesses, including restaurants, retail stores, and service providers. The town is also home to a number of tourist attractions, including the Cherry Creek State Park, which offers camping, fishing, and other outdoor activities.
Demographics
As of the 2010 census, the population of Cherry Creek was 1,000 people. The racial makeup of the town was 97.2% White, 0.7% African American, 0.2% Native American, 0.2% Asian, 0.2% from other races, and 1.7% from two or more races. Hispanic or Latino of any race were 0.7% of the population.
The median income for a household in the town was $41,250, and the median income for a family was $48,750. The per capita income for the town was $19,945. About 8.2% of families and 10.2% of the population were below the poverty line, including 14.3% of those under age 18 and 6.3% of those age 65 or over.
Common Questions
What is Per Capita Income in Cherry Creek?
Per Capita income in Cherry Creek is $36,648.
What is the Median Family Income in Cherry Creek?
Median Family Income in Cherry Creek is $71,250.
What is the Median Household income in Cherry Creek?
Median Household Income in Cherry Creek is $65,588.
What is Income or Wage Gap in Cherry Creek?
Income or Wage Gap in Cherry Creek is 30.9%.
Women in Cherry Creek earn 69.1 cents for every dollar earned by a man.
What is Inequality or Gini Index in Cherry Creek?
Inequality or Gini Index in Cherry Creek is 0.38.
What is the Total Population of Cherry Creek?
Total Population of Cherry Creek is 309.
What is the Total Male Population of Cherry Creek?
Total Male Population of Cherry Creek is 139.
What is the Total Female Population of Cherry Creek?
Total Female Population of Cherry Creek is 170.
What is the Ratio of Males per 100 Females in Cherry Creek?
There are 81.76 Males per 100 Females in Cherry Creek.
What is the Ratio of Females per 100 Males in Cherry Creek?
There are 122.30 Females per 100 Males in Cherry Creek.
What is the Median Population Age in Cherry Creek?
Median Population Age in Cherry Creek is 35.4 Years.
What is the Average Family Size in Cherry Creek
Average Family Size in Cherry Creek is 2.7 People.
What is the Average Household Size in Cherry Creek
Average Household Size in Cherry Creek is 2.3 People.
How Large is the Labor Force in Cherry Creek?
There are 163 People in the Labor Forcein in Cherry Creek.
What is the Percentage of People in the Labor Force in Cherry Creek?
65.5% of People are in the Labor Force in Cherry Creek.
What is the Unemployment Rate in Cherry Creek?
Unemployment Rate in Cherry Creek is 11.7%.