Depauville, NY Map & Demographics
Depauville Map
Depauville Overview
$29,046
PER CAPITA INCOME
$86,071
AVG FAMILY INCOME
0.29
INEQUALITY / GINI INDEX
388
TOTAL POPULATION
230
MALE POPULATION
158
FEMALE POPULATION
145.57
MALES / 100 FEMALES
68.70
FEMALES / 100 MALES
48.7
MEDIAN AGE
2.9
AVG FAMILY SIZE
2.3
AVG HOUSEHOLD SIZE
217
LABOR FORCE [ PEOPLE ]
70.2%
PERCENT IN LABOR FORCE
30.4%
UNEMPLOYMENT RATE
Depauville Zip Codes
Depauville Area Codes
Income in Depauville
Income Overview in Depauville
| Characteristic | Number | Measure |
| Per Capita Income | 388 | $29,046 |
| Median Family Income | 108 | $86,071 |
| Mean Family Income | 108 | $74,171 |
| Median Household Income | 169 | $0 |
| Mean Household Income | 169 | $64,738 |
| Income Deficit | 108 | $0 |
| Wage / Income Gap (%) | 388 | 0.00% |
| Wage / Income Gap ($) | 388 | 100.00¢ per $1 |
| Gini / Inequality Index | 388 | 0.29 |
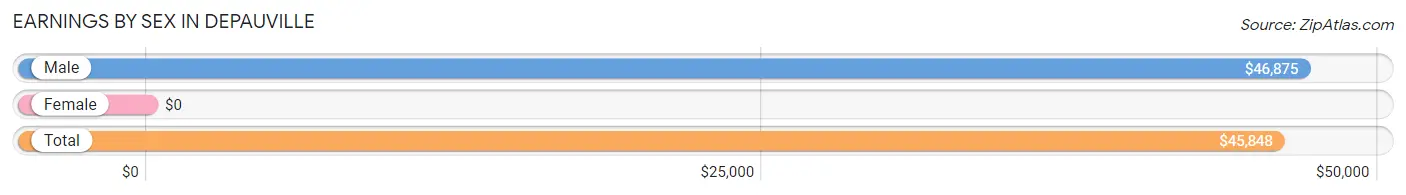
Earnings by Sex in Depauville
| Sex | Number | Average Earnings |
| Male | 126 (70.4%) | $46,875 |
| Female | 53 (29.6%) | $0 |
| Total | 179 (100.0%) | $45,848 |
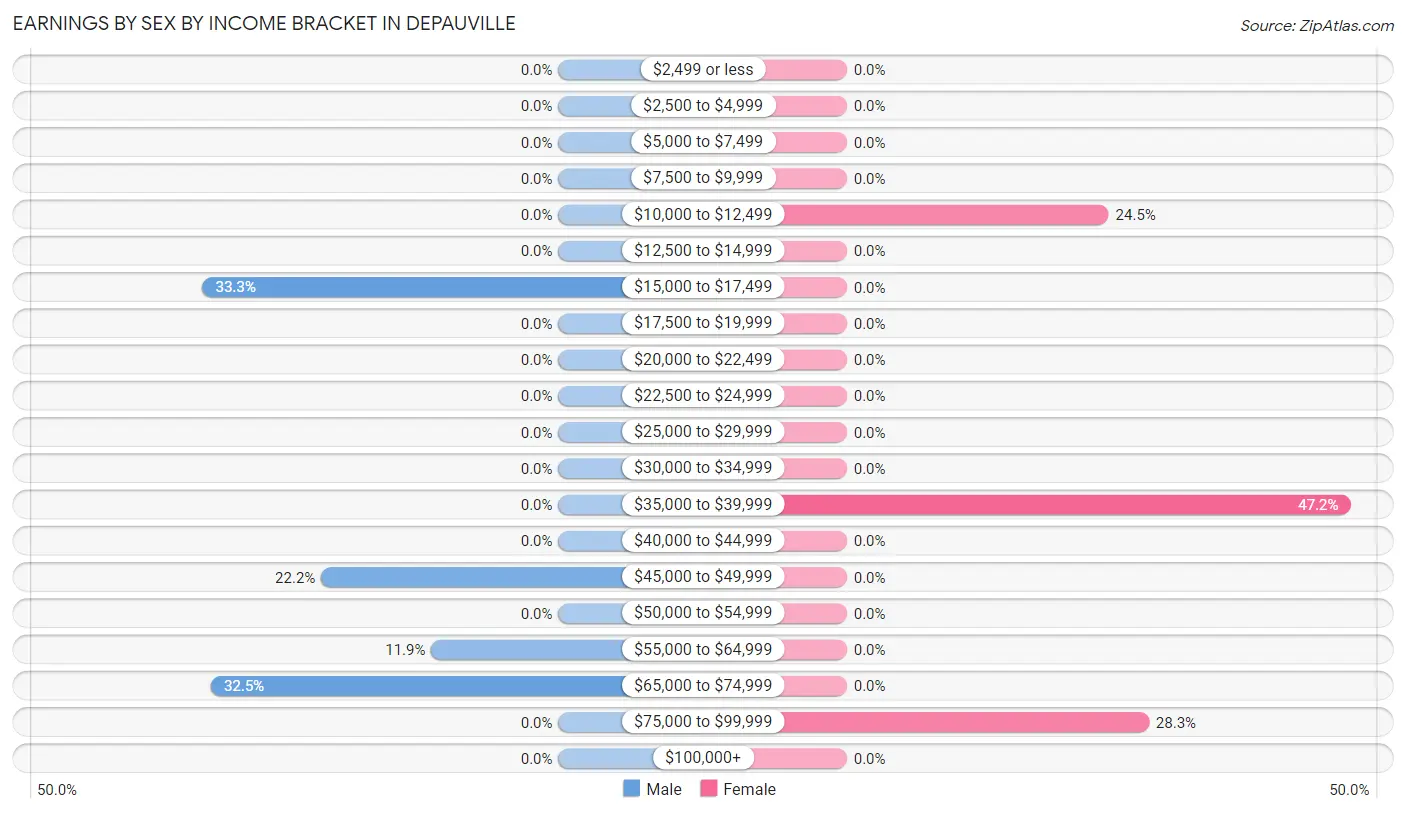
Earnings by Sex by Income Bracket in Depauville
The most common earnings brackets in Depauville are $15,000 to $17,499 for men (42 | 33.3%) and $35,000 to $39,999 for women (25 | 47.2%).
| Income | Male | Female |
| $2,499 or less | 0 (0.0%) | 0 (0.0%) |
| $2,500 to $4,999 | 0 (0.0%) | 0 (0.0%) |
| $5,000 to $7,499 | 0 (0.0%) | 0 (0.0%) |
| $7,500 to $9,999 | 0 (0.0%) | 0 (0.0%) |
| $10,000 to $12,499 | 0 (0.0%) | 13 (24.5%) |
| $12,500 to $14,999 | 0 (0.0%) | 0 (0.0%) |
| $15,000 to $17,499 | 42 (33.3%) | 0 (0.0%) |
| $17,500 to $19,999 | 0 (0.0%) | 0 (0.0%) |
| $20,000 to $22,499 | 0 (0.0%) | 0 (0.0%) |
| $22,500 to $24,999 | 0 (0.0%) | 0 (0.0%) |
| $25,000 to $29,999 | 0 (0.0%) | 0 (0.0%) |
| $30,000 to $34,999 | 0 (0.0%) | 0 (0.0%) |
| $35,000 to $39,999 | 0 (0.0%) | 25 (47.2%) |
| $40,000 to $44,999 | 0 (0.0%) | 0 (0.0%) |
| $45,000 to $49,999 | 28 (22.2%) | 0 (0.0%) |
| $50,000 to $54,999 | 0 (0.0%) | 0 (0.0%) |
| $55,000 to $64,999 | 15 (11.9%) | 0 (0.0%) |
| $65,000 to $74,999 | 41 (32.5%) | 0 (0.0%) |
| $75,000 to $99,999 | 0 (0.0%) | 15 (28.3%) |
| $100,000+ | 0 (0.0%) | 0 (0.0%) |
| Total | 126 (100.0%) | 53 (100.0%) |
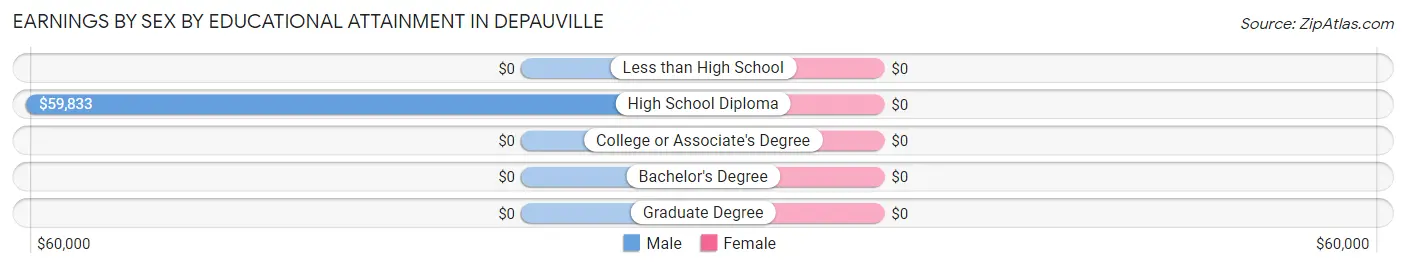
Earnings by Sex by Educational Attainment in Depauville
| Educational Attainment | Male Income | Female Income |
| Less than High School | - | - |
| High School Diploma | $59,833 | $0 |
| College or Associate's Degree | - | - |
| Bachelor's Degree | - | - |
| Graduate Degree | - | - |
| Total | $59,833 | $0 |
Family Income in Depauville
Family Income Brackets in Depauville
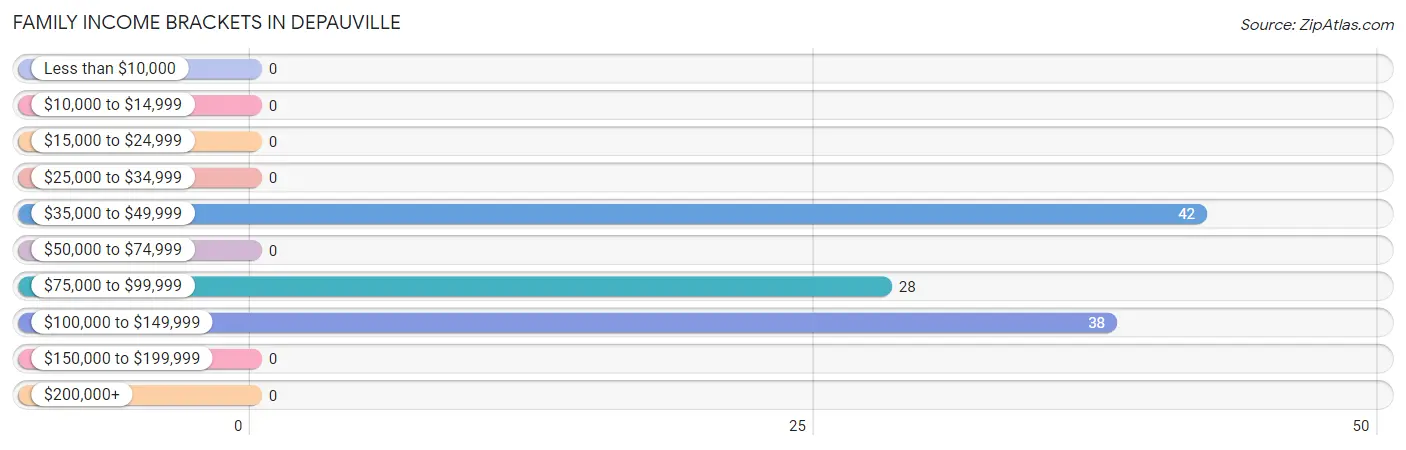
According to the Depauville family income data, there are 42 families falling into the $35,000 to $49,999 income range, which is the most common income bracket and makes up 38.9% of all families.
| Income Bracket | # Families | % Families |
| Less than $10,000 | 0 | 0.0% |
| $10,000 to $14,999 | 0 | 0.0% |
| $15,000 to $24,999 | 0 | 0.0% |
| $25,000 to $34,999 | 0 | 0.0% |
| $35,000 to $49,999 | 42 | 38.9% |
| $50,000 to $74,999 | 0 | 0.0% |
| $75,000 to $99,999 | 28 | 25.9% |
| $100,000 to $149,999 | 38 | 35.2% |
| $150,000 to $199,999 | 0 | 0.0% |
| $200,000+ | 0 | 0.0% |
Family Income by Famaliy Size in Depauville
| Income Bracket | # Families | Median Income |
| 2-Person Families | 80 (74.1%) | $0 |
| 3-Person Families | 0 (0.0%) | $0 |
| 4-Person Families | 0 (0.0%) | $0 |
| 5-Person Families | 28 (25.9%) | $0 |
| 6-Person Families | 0 (0.0%) | $0 |
| 7+ Person Families | 0 (0.0%) | $0 |
| Total | 108 (100.0%) | $86,071 |
Family Income by Number of Earners in Depauville
| Number of Earners | # Families | Median Income |
| No Earners | 0 (0.0%) | $0 |
| 1 Earner | 80 (74.1%) | $0 |
| 2 Earners | 28 (25.9%) | $0 |
| 3+ Earners | 0 (0.0%) | $0 |
| Total | 108 (100.0%) | $86,071 |
Household Income in Depauville
Household Income Brackets in Depauville
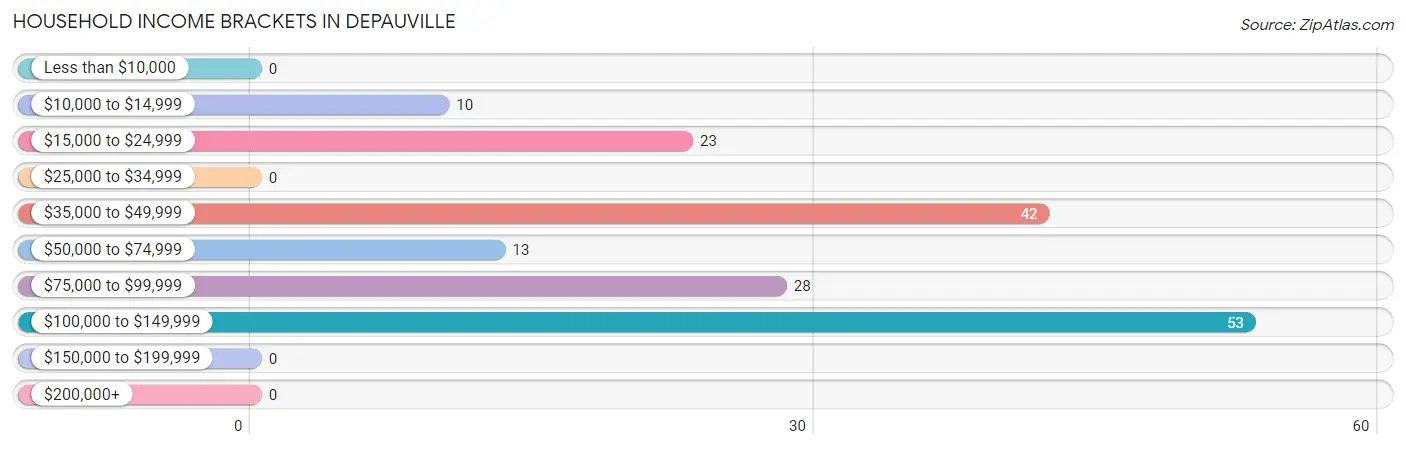
With 53 households falling in the category, the $100,000 to $149,999 income range is the most frequent in Depauville, accounting for 31.4% of all households.
| Income Bracket | # Households | % Households |
| Less than $10,000 | 0 | 0.0% |
| $10,000 to $14,999 | 10 | 5.9% |
| $15,000 to $24,999 | 23 | 13.6% |
| $25,000 to $34,999 | 0 | 0.0% |
| $35,000 to $49,999 | 42 | 24.9% |
| $50,000 to $74,999 | 13 | 7.7% |
| $75,000 to $99,999 | 28 | 16.6% |
| $100,000 to $149,999 | 53 | 31.4% |
| $150,000 to $199,999 | 0 | 0.0% |
| $200,000+ | 0 | 0.0% |
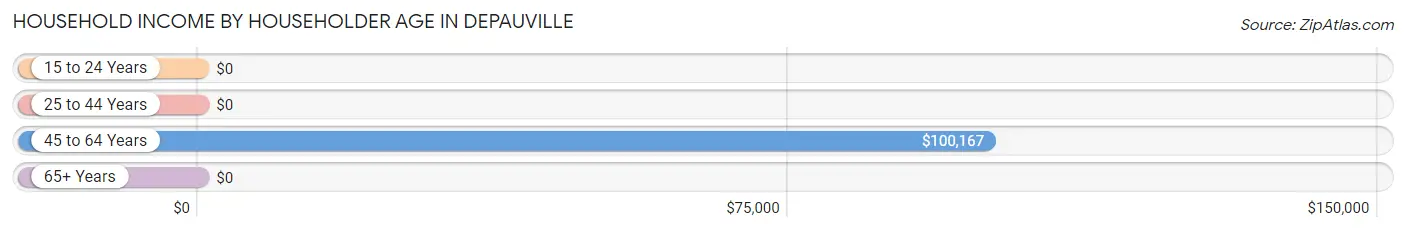
Household Income by Householder Age in Depauville
The median household income in Depauville is $0, with the highest median household income of $100,167 found in the 45 to 64 years age bracket for the primary householder. A total of 104 households (61.5%) fall into this category.
| Income Bracket | # Households | Median Income |
| 15 to 24 Years | 0 (0.0%) | $0 |
| 25 to 44 Years | 28 (16.6%) | $0 |
| 45 to 64 Years | 104 (61.5%) | $100,167 |
| 65+ Years | 37 (21.9%) | $0 |
| Total | 169 (100.0%) | $0 |
Poverty in Depauville
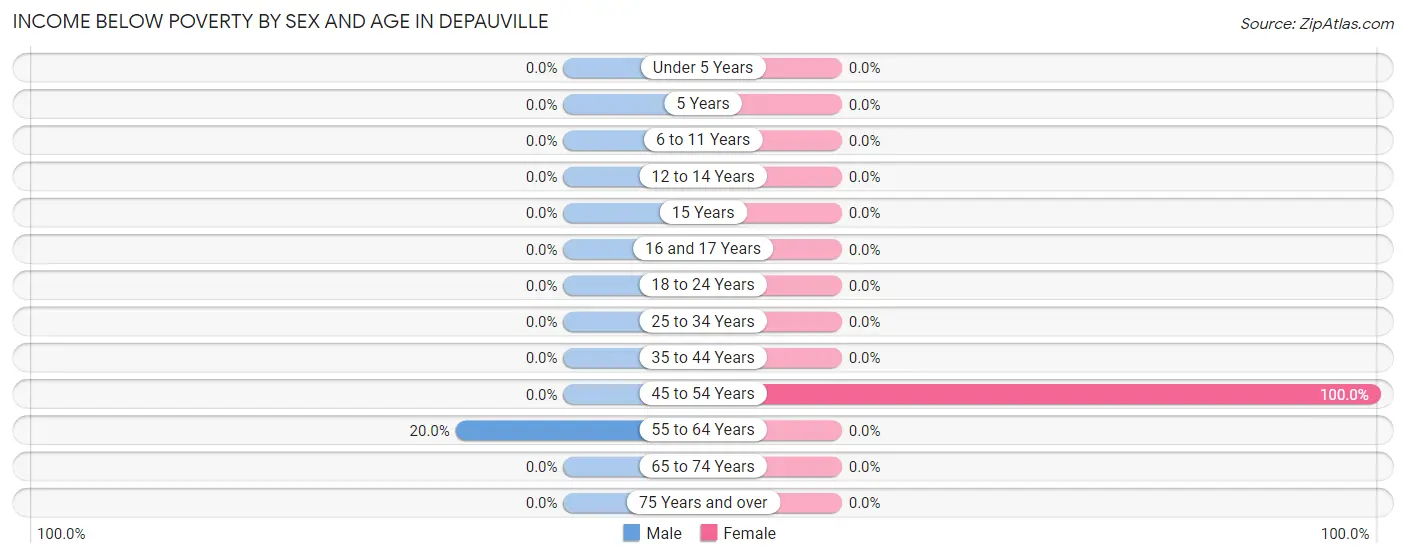
Income Below Poverty by Sex and Age in Depauville
With 6.1% poverty level for males and 8.2% for females among the residents of Depauville, 55 to 64 year old males and 45 to 54 year old females are the most vulnerable to poverty, with 14 males (20.0%) and 13 females (100.0%) in their respective age groups living below the poverty level.
| Age Bracket | Male | Female |
| Under 5 Years | 0 (0.0%) | 0 (0.0%) |
| 5 Years | 0 (0.0%) | 0 (0.0%) |
| 6 to 11 Years | 0 (0.0%) | 0 (0.0%) |
| 12 to 14 Years | 0 (0.0%) | 0 (0.0%) |
| 15 Years | 0 (0.0%) | 0 (0.0%) |
| 16 and 17 Years | 0 (0.0%) | 0 (0.0%) |
| 18 to 24 Years | 0 (0.0%) | 0 (0.0%) |
| 25 to 34 Years | 0 (0.0%) | 0 (0.0%) |
| 35 to 44 Years | 0 (0.0%) | 0 (0.0%) |
| 45 to 54 Years | 0 (0.0%) | 13 (100.0%) |
| 55 to 64 Years | 14 (20.0%) | 0 (0.0%) |
| 65 to 74 Years | 0 (0.0%) | 0 (0.0%) |
| 75 Years and over | 0 (0.0%) | 0 (0.0%) |
| Total | 14 (6.1%) | 13 (8.2%) |
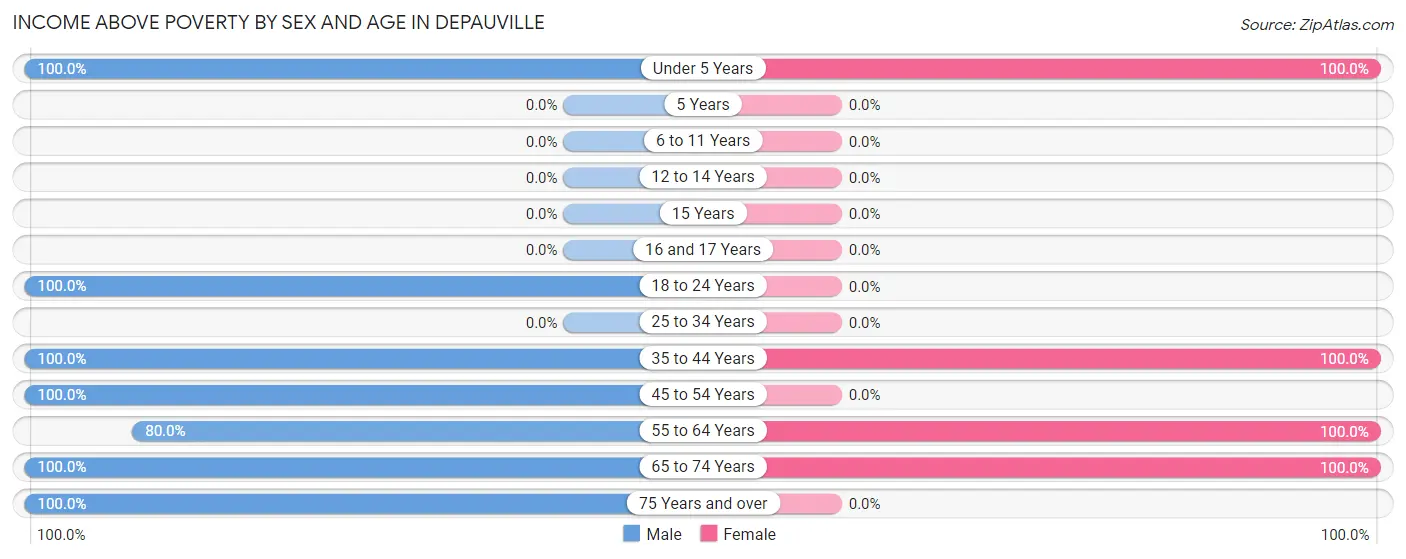
Income Above Poverty by Sex and Age in Depauville
According to the poverty statistics in Depauville, males aged under 5 years and females aged under 5 years are the age groups that are most secure financially, with 100.0% of males and 100.0% of females in these age groups living above the poverty line.
| Age Bracket | Male | Female |
| Under 5 Years | 25 (100.0%) | 54 (100.0%) |
| 5 Years | 0 (0.0%) | 0 (0.0%) |
| 6 to 11 Years | 0 (0.0%) | 0 (0.0%) |
| 12 to 14 Years | 0 (0.0%) | 0 (0.0%) |
| 15 Years | 0 (0.0%) | 0 (0.0%) |
| 16 and 17 Years | 0 (0.0%) | 0 (0.0%) |
| 18 to 24 Years | 42 (100.0%) | 0 (0.0%) |
| 25 to 34 Years | 0 (0.0%) | 0 (0.0%) |
| 35 to 44 Years | 28 (100.0%) | 25 (100.0%) |
| 45 to 54 Years | 28 (100.0%) | 0 (0.0%) |
| 55 to 64 Years | 56 (80.0%) | 53 (100.0%) |
| 65 to 74 Years | 23 (100.0%) | 13 (100.0%) |
| 75 Years and over | 14 (100.0%) | 0 (0.0%) |
| Total | 216 (93.9%) | 145 (91.8%) |
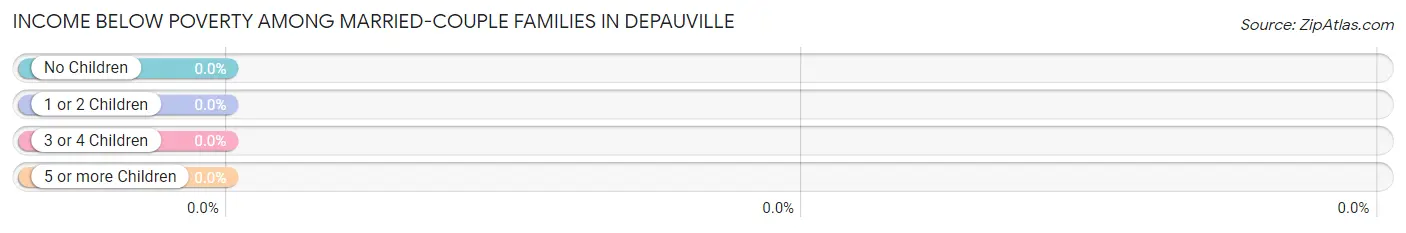
Income Below Poverty Among Married-Couple Families in Depauville
| Children | Above Poverty | Below Poverty |
| No Children | 52 (100.0%) | 0 (0.0%) |
| 1 or 2 Children | 0 (0.0%) | 0 (0.0%) |
| 3 or 4 Children | 28 (100.0%) | 0 (0.0%) |
| 5 or more Children | 0 (0.0%) | 0 (0.0%) |
| Total | 80 (100.0%) | 0 (0.0%) |
Income Below Poverty Among Single-Parent Households in Depauville
| Children | Single Father | Single Mother |
| No Children | 0 (0.0%) | 0 (0.0%) |
| 1 or 2 Children | 0 (0.0%) | 0 (0.0%) |
| 3 or 4 Children | 0 (0.0%) | 0 (0.0%) |
| 5 or more Children | 0 (0.0%) | 0 (0.0%) |
| Total | 0 (0.0%) | 0 (0.0%) |
Income Below Poverty Among Married-Couple vs Single-Parent Households in Depauville
| Children | Married-Couple Families | Single-Parent Households |
| No Children | 0 (0.0%) | 0 (0.0%) |
| 1 or 2 Children | 0 (0.0%) | 0 (0.0%) |
| 3 or 4 Children | 0 (0.0%) | 0 (0.0%) |
| 5 or more Children | 0 (0.0%) | 0 (0.0%) |
| Total | 0 (0.0%) | 0 (0.0%) |
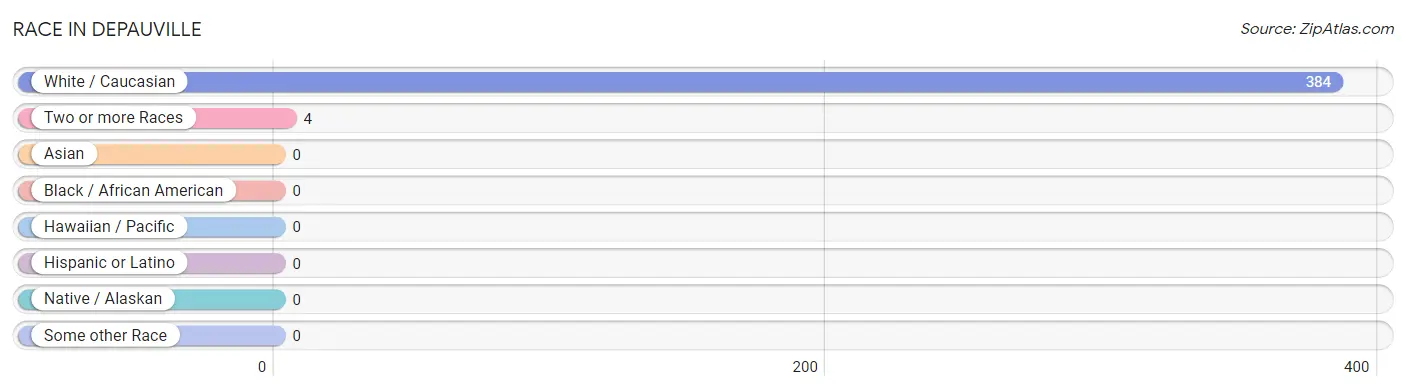
Race in Depauville
The most populous races in Depauville are White / Caucasian (384 | 99.0%), and Two or more Races (4 | 1.0%).
| Race | # Population | % Population |
| Asian | 0 | 0.0% |
| Black / African American | 0 | 0.0% |
| Hawaiian / Pacific | 0 | 0.0% |
| Hispanic or Latino | 0 | 0.0% |
| Native / Alaskan | 0 | 0.0% |
| White / Caucasian | 384 | 99.0% |
| Two or more Races | 4 | 1.0% |
| Some other Race | 0 | 0.0% |
| Total | 388 | 100.0% |
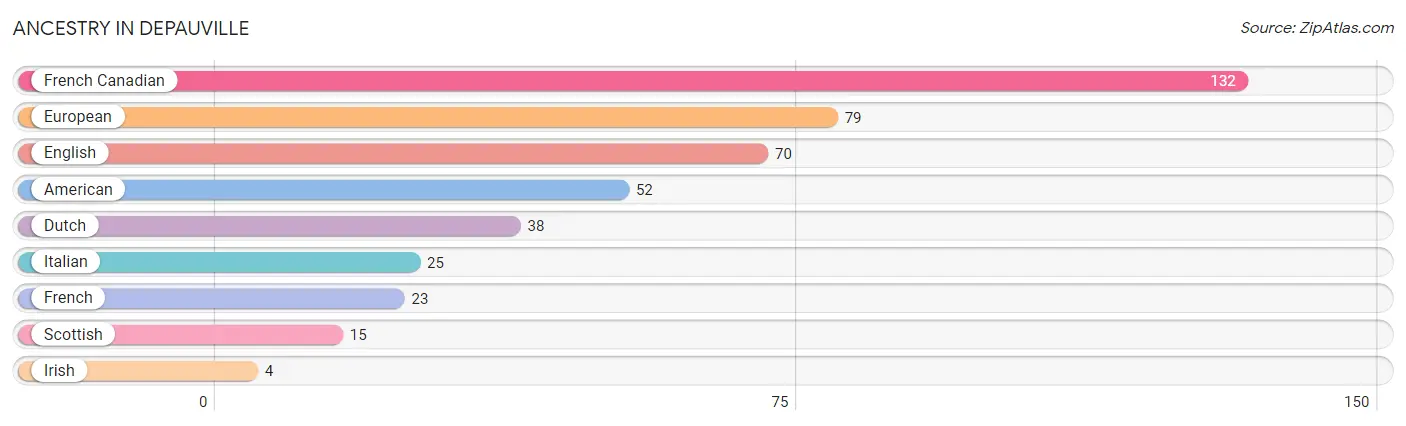
Ancestry in Depauville
The most populous ancestries reported in Depauville are French Canadian (132 | 34.0%), European (79 | 20.4%), English (70 | 18.0%), American (52 | 13.4%), and Dutch (38 | 9.8%), together accounting for 95.6% of all Depauville residents.
| Ancestry | # Population | % Population |
| American | 52 | 13.4% |
| Dutch | 38 | 9.8% |
| English | 70 | 18.0% |
| European | 79 | 20.4% |
| French | 23 | 5.9% |
| French Canadian | 132 | 34.0% |
| Irish | 4 | 1.0% |
| Italian | 25 | 6.4% |
| Scottish | 15 | 3.9% | View All 9 Rows |
Immigrants in Depauville

| Immigration Origin | # Population | % Population | View All 0 Rows |
Sex and Age in Depauville
Sex and Age in Depauville
The most populous age groups in Depauville are 60 to 64 Years (55 | 23.9%) for men and Under 5 Years (54 | 34.2%) for women.
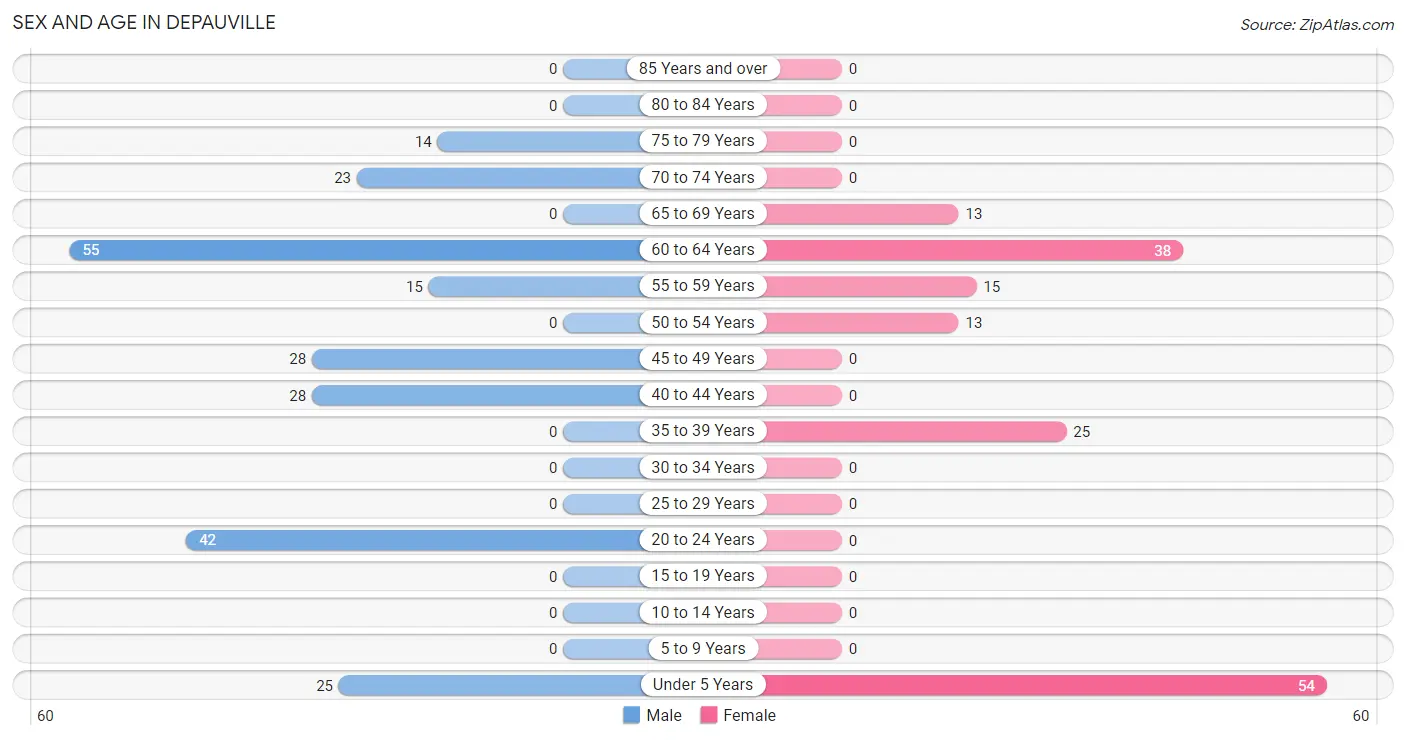
| Age Bracket | Male | Female |
| Under 5 Years | 25 (10.9%) | 54 (34.2%) |
| 5 to 9 Years | 0 (0.0%) | 0 (0.0%) |
| 10 to 14 Years | 0 (0.0%) | 0 (0.0%) |
| 15 to 19 Years | 0 (0.0%) | 0 (0.0%) |
| 20 to 24 Years | 42 (18.3%) | 0 (0.0%) |
| 25 to 29 Years | 0 (0.0%) | 0 (0.0%) |
| 30 to 34 Years | 0 (0.0%) | 0 (0.0%) |
| 35 to 39 Years | 0 (0.0%) | 25 (15.8%) |
| 40 to 44 Years | 28 (12.2%) | 0 (0.0%) |
| 45 to 49 Years | 28 (12.2%) | 0 (0.0%) |
| 50 to 54 Years | 0 (0.0%) | 13 (8.2%) |
| 55 to 59 Years | 15 (6.5%) | 15 (9.5%) |
| 60 to 64 Years | 55 (23.9%) | 38 (24.0%) |
| 65 to 69 Years | 0 (0.0%) | 13 (8.2%) |
| 70 to 74 Years | 23 (10.0%) | 0 (0.0%) |
| 75 to 79 Years | 14 (6.1%) | 0 (0.0%) |
| 80 to 84 Years | 0 (0.0%) | 0 (0.0%) |
| 85 Years and over | 0 (0.0%) | 0 (0.0%) |
| Total | 230 (100.0%) | 158 (100.0%) |
Families and Households in Depauville
Median Family Size in Depauville
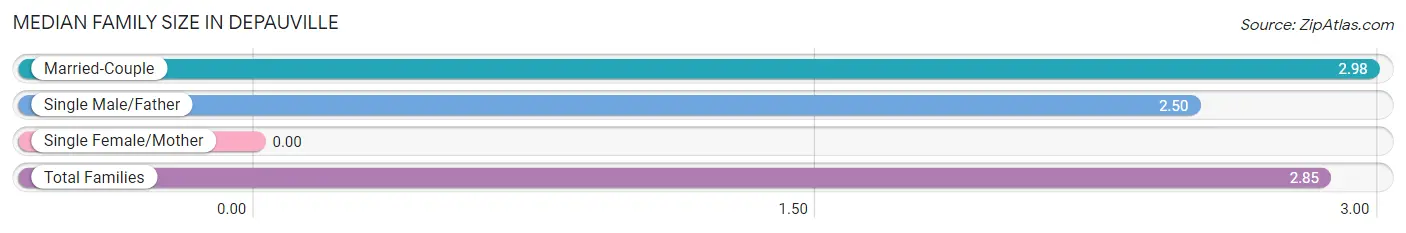
| Family Type | # Families | Family Size |
| Married-Couple | 80 (74.1%) | 2.98 |
| Single Male/Father | 28 (25.9%) | 2.50 |
| Single Female/Mother | 0 (0.0%) | - |
| Total Families | 108 (100.0%) | 2.85 |
Median Household Size in Depauville
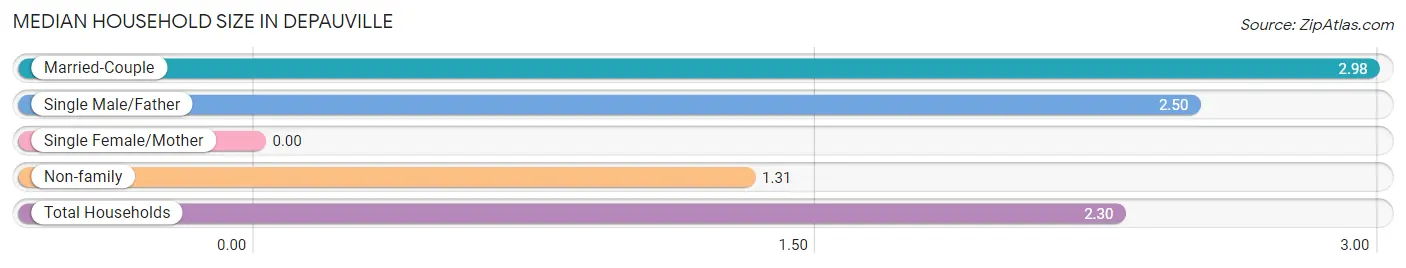
| Household Type | # Households | Household Size |
| Married-Couple | 80 (47.3%) | 2.98 |
| Single Male/Father | 28 (16.6%) | 2.50 |
| Single Female/Mother | 0 (0.0%) | - |
| Non-family | 61 (36.1%) | 1.31 |
| Total Households | 169 (100.0%) | 2.30 |
Household Size by Marriage Status in Depauville
Out of a total of 169 households in Depauville, 108 (63.9%) are family households, while 61 (36.1%) are nonfamily households. The most numerous type of family households are 2-person households, comprising 80, and the most common type of nonfamily households are 1-person households, comprising 33.
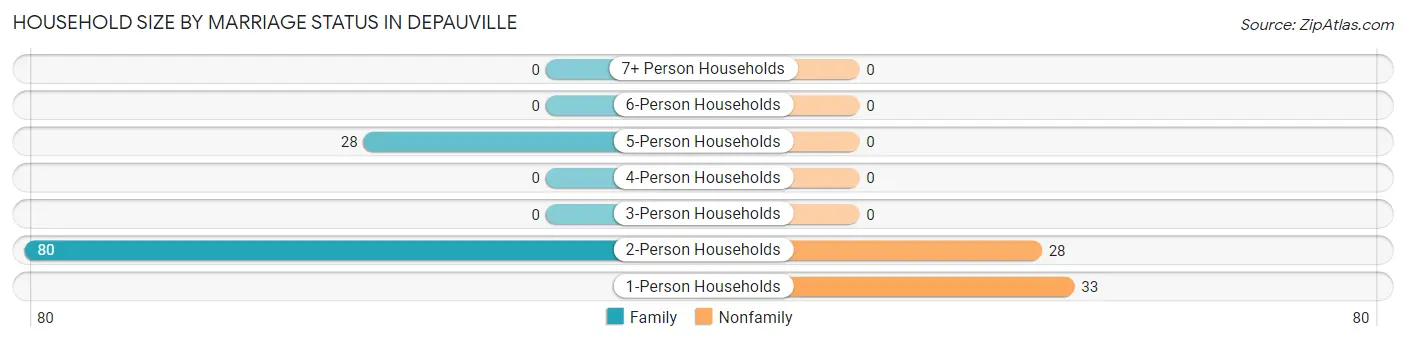
| Household Size | Family Households | Nonfamily Households |
| 1-Person Households | - | 33 (19.5%) |
| 2-Person Households | 80 (47.3%) | 28 (16.6%) |
| 3-Person Households | 0 (0.0%) | 0 (0.0%) |
| 4-Person Households | 0 (0.0%) | 0 (0.0%) |
| 5-Person Households | 28 (16.6%) | 0 (0.0%) |
| 6-Person Households | 0 (0.0%) | 0 (0.0%) |
| 7+ Person Households | 0 (0.0%) | 0 (0.0%) |
| Total | 108 (63.9%) | 61 (36.1%) |
Female Fertility in Depauville
Fertility by Age in Depauville
Average fertility rate in Depauville is 1,000.0 births per 1,000 women. Women in the age bracket of 35 to 50 years have the highest fertility rate with 1,000.0 births per 1,000 women. Women in the age bracket of 35 to 50 years acount for 100.0% of all women with births.
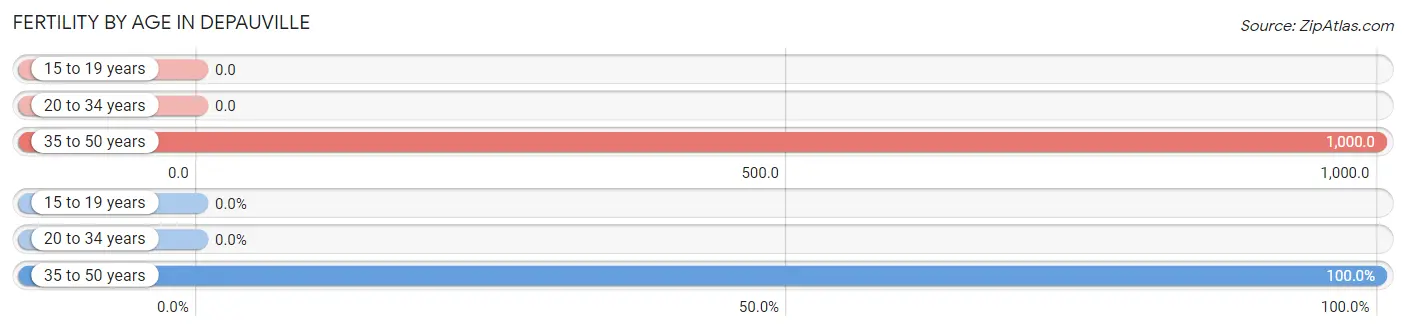
| Age Bracket | Women with Births | Births / 1,000 Women |
| 15 to 19 years | 0 (0.0%) | 0.0 |
| 20 to 34 years | 0 (0.0%) | 0.0 |
| 35 to 50 years | 25 (100.0%) | 1,000.0 |
| Total | 25 (100.0%) | 1,000.0 |
Fertility by Age by Marriage Status in Depauville
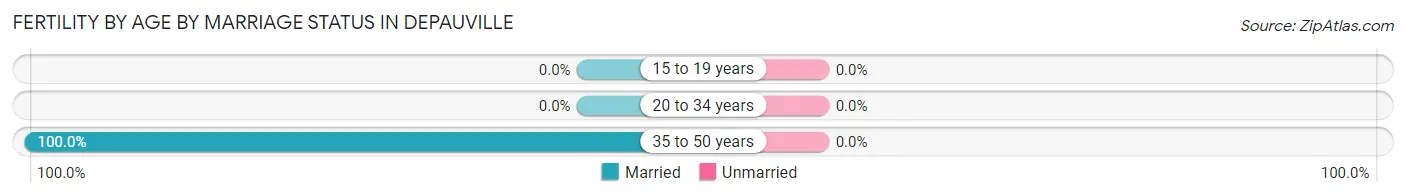
| Age Bracket | Married | Unmarried |
| 15 to 19 years | 0 (0.0%) | 0 (0.0%) |
| 20 to 34 years | 0 (0.0%) | 0 (0.0%) |
| 35 to 50 years | 25 (100.0%) | 0 (0.0%) |
| Total | 25 (100.0%) | 0 (0.0%) |
Fertility by Education in Depauville
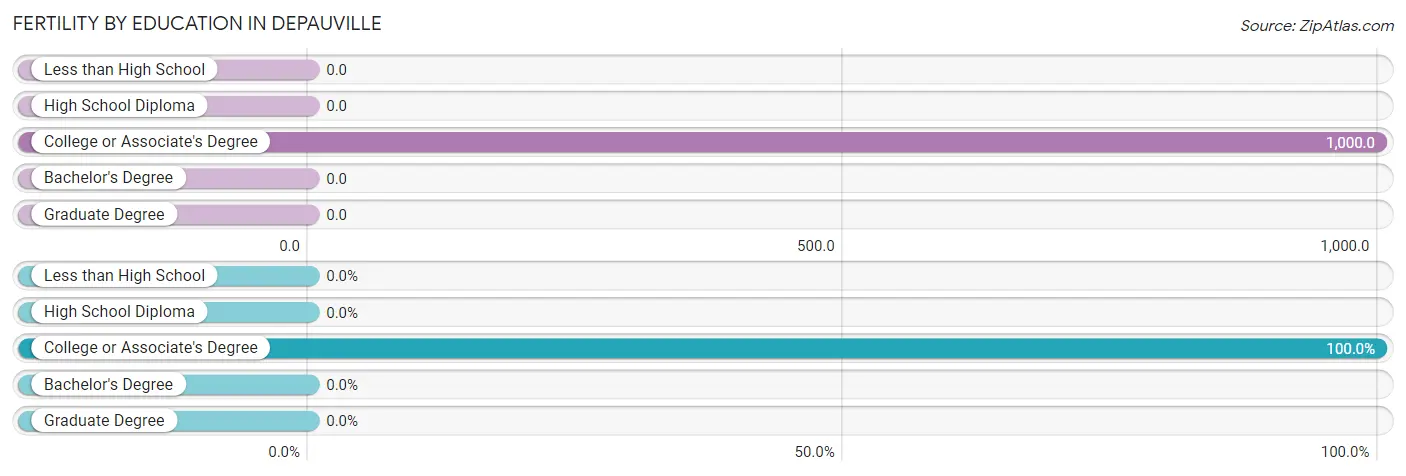
| Educational Attainment | Women with Births | Births / 1,000 Women |
| Less than High School | 0 (0.0%) | 0.0 |
| High School Diploma | 0 (0.0%) | 0.0 |
| College or Associate's Degree | 25 (100.0%) | 1,000.0 |
| Bachelor's Degree | 0 (0.0%) | 0.0 |
| Graduate Degree | 0 (0.0%) | 0.0 |
| Total | 25 (100.0%) | 1,000.0 |
Fertility by Education by Marriage Status in Depauville
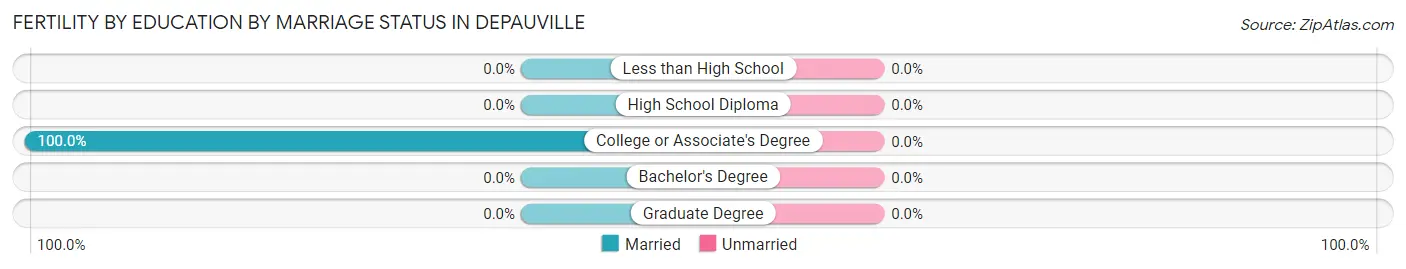
| Educational Attainment | Married | Unmarried |
| Less than High School | 0 (0.0%) | 0 (0.0%) |
| High School Diploma | 0 (0.0%) | 0 (0.0%) |
| College or Associate's Degree | 25 (100.0%) | 0 (0.0%) |
| Bachelor's Degree | 0 (0.0%) | 0 (0.0%) |
| Graduate Degree | 0 (0.0%) | 0 (0.0%) |
| Total | 25 (100.0%) | 0 (0.0%) |
Employment Characteristics in Depauville
Employment by Class of Employer in Depauville
Among the 151 employed individuals in Depauville, not-for-profit organizations (81 | 53.6%), and private company employees (70 | 46.4%) make up the most common classes of employment.
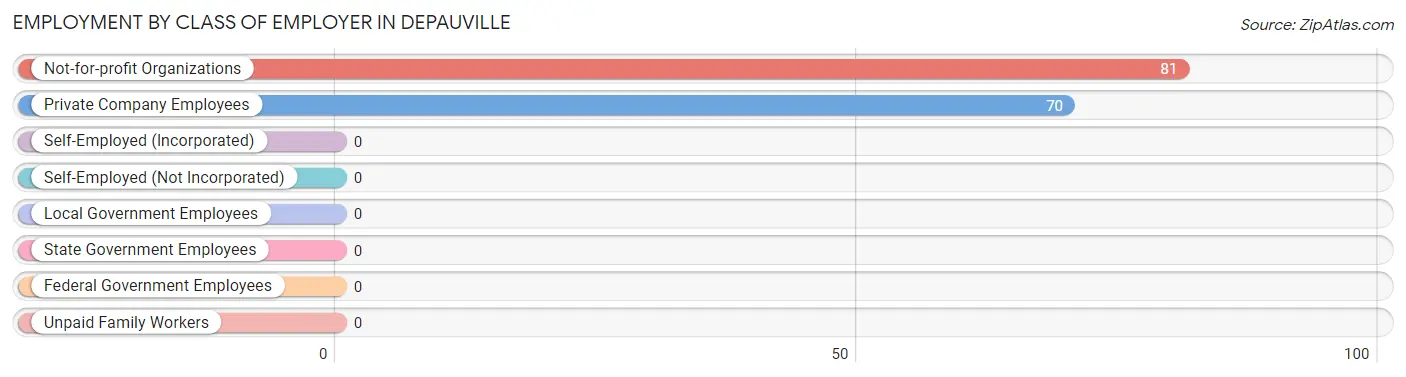
| Employer Class | # Employees | % Employees |
| Private Company Employees | 70 | 46.4% |
| Self-Employed (Incorporated) | 0 | 0.0% |
| Self-Employed (Not Incorporated) | 0 | 0.0% |
| Not-for-profit Organizations | 81 | 53.6% |
| Local Government Employees | 0 | 0.0% |
| State Government Employees | 0 | 0.0% |
| Federal Government Employees | 0 | 0.0% |
| Unpaid Family Workers | 0 | 0.0% |
| Total | 151 | 100.0% |
Employment Status by Age in Depauville
According to the labor force statistics for Depauville, out of the total population over 16 years of age (309), 70.2% or 217 individuals are in the labor force, with 30.4% or 66 of them unemployed. The age group with the highest labor force participation rate is 20 to 24 years, with 100.0% or 42 individuals in the labor force. Within the labor force, the 45 to 54 years age range has the highest percentage of unemployed individuals, with 100.0% or 28 of them being unemployed.
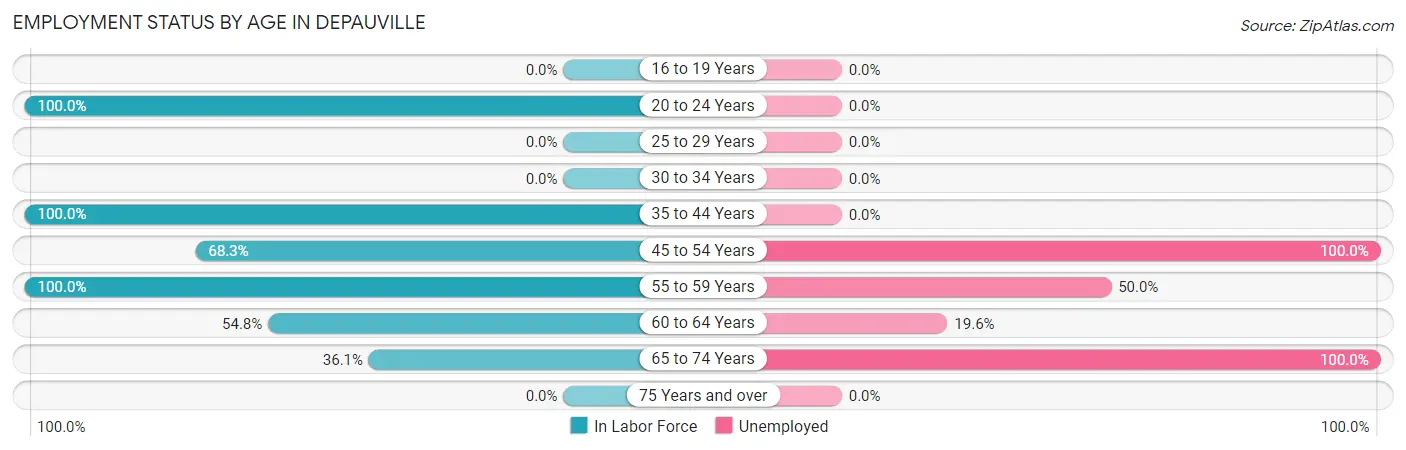
| Age Bracket | In Labor Force | Unemployed |
| 16 to 19 Years | 0 (0.0%) | 0 (0.0%) |
| 20 to 24 Years | 42 (100.0%) | 0 (0.0%) |
| 25 to 29 Years | 0 (0.0%) | 0 (0.0%) |
| 30 to 34 Years | 0 (0.0%) | 0 (0.0%) |
| 35 to 44 Years | 53 (100.0%) | 0 (0.0%) |
| 45 to 54 Years | 28 (68.3%) | 28 (100.0%) |
| 55 to 59 Years | 30 (100.0%) | 15 (50.0%) |
| 60 to 64 Years | 51 (54.8%) | 10 (19.6%) |
| 65 to 74 Years | 13 (36.1%) | 13 (100.0%) |
| 75 Years and over | 0 (0.0%) | 0 (0.0%) |
| Total | 217 (70.2%) | 66 (30.4%) |
Employment Status by Educational Attainment in Depauville
According to labor force statistics for Depauville, 74.7% of individuals (162) out of the total population between 25 and 64 years of age (217) are in the labor force, with 32.7% or 53 of them being unemployed. The group with the highest labor force participation rate are those with the educational attainment of high school diploma, with 100.0% or 122 individuals in the labor force. Within the labor force, individuals with high school diploma education have the highest percentage of unemployment, with 43.4% or 53 of them being unemployed.
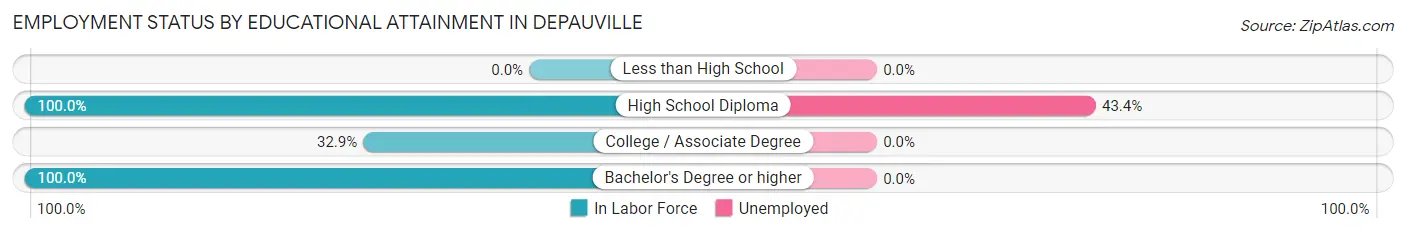
| Educational Attainment | In Labor Force | Unemployed |
| Less than High School | 0 (0.0%) | 0 (0.0%) |
| High School Diploma | 122 (100.0%) | 53 (43.4%) |
| College / Associate Degree | 25 (32.9%) | 0 (0.0%) |
| Bachelor's Degree or higher | 15 (100.0%) | 0 (0.0%) |
| Total | 162 (74.7%) | 71 (32.7%) |
Employment Occupations by Sex in Depauville
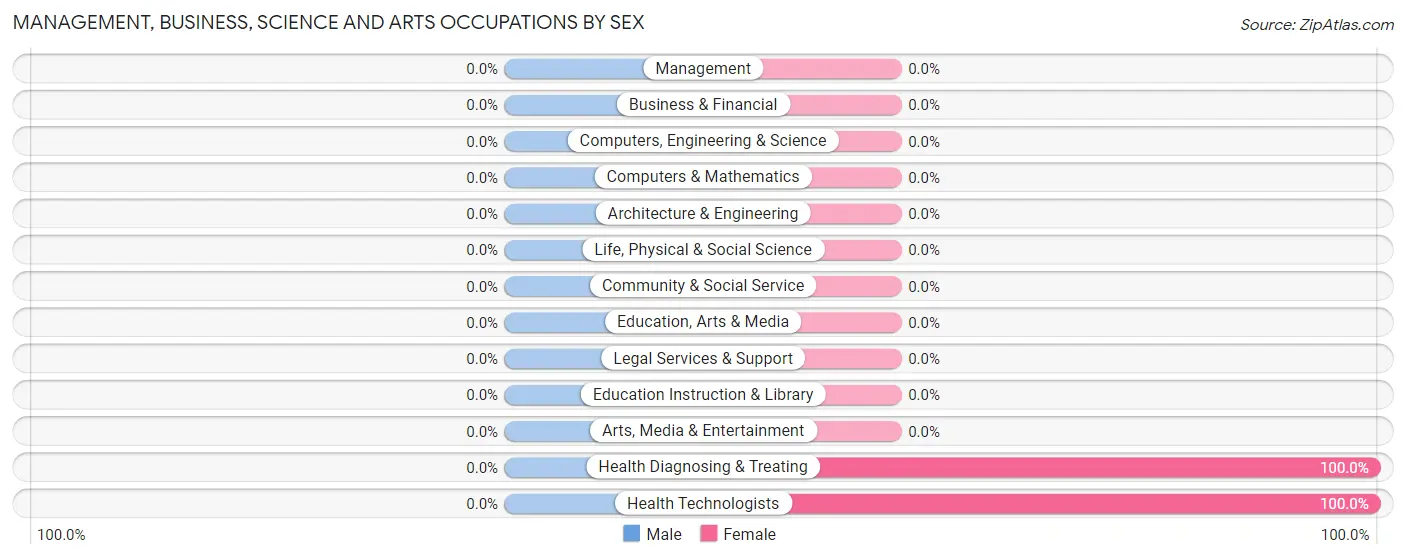
Management, Business, Science and Arts Occupations
The most common Management, Business, Science and Arts occupations in Depauville are Health Diagnosing & Treating (40 | 26.5%), and Health Technologists (15 | 9.9%).
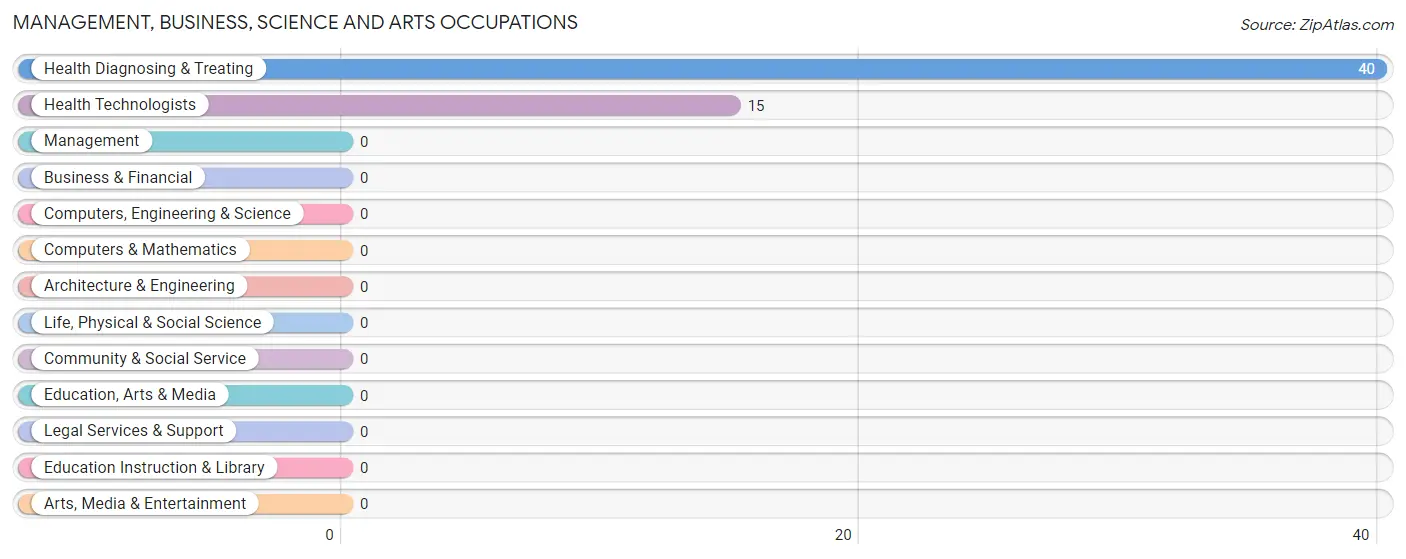
Management, Business, Science and Arts Occupations by Sex
| Occupation | Male | Female |
| Management | 0 (0.0%) | 0 (0.0%) |
| Business & Financial | 0 (0.0%) | 0 (0.0%) |
| Computers, Engineering & Science | 0 (0.0%) | 0 (0.0%) |
| Computers & Mathematics | 0 (0.0%) | 0 (0.0%) |
| Architecture & Engineering | 0 (0.0%) | 0 (0.0%) |
| Life, Physical & Social Science | 0 (0.0%) | 0 (0.0%) |
| Community & Social Service | 0 (0.0%) | 0 (0.0%) |
| Education, Arts & Media | 0 (0.0%) | 0 (0.0%) |
| Legal Services & Support | 0 (0.0%) | 0 (0.0%) |
| Education Instruction & Library | 0 (0.0%) | 0 (0.0%) |
| Arts, Media & Entertainment | 0 (0.0%) | 0 (0.0%) |
| Health Diagnosing & Treating | 0 (0.0%) | 40 (100.0%) |
| Health Technologists | 0 (0.0%) | 15 (100.0%) |
| Total (Category) | 0 (0.0%) | 40 (100.0%) |
| Total (Overall) | 111 (73.5%) | 40 (26.5%) |
Services Occupations
Services Occupations by Sex
| Occupation | Male | Female |
| Healthcare Support | 0 (0.0%) | 0 (0.0%) |
| Security & Protection | 0 (0.0%) | 0 (0.0%) |
| Firefighting & Prevention | 0 (0.0%) | 0 (0.0%) |
| Law Enforcement | 0 (0.0%) | 0 (0.0%) |
| Food Preparation & Serving | 0 (0.0%) | 0 (0.0%) |
| Cleaning & Maintenance | 0 (0.0%) | 0 (0.0%) |
| Personal Care & Service | 0 (0.0%) | 0 (0.0%) |
| Total (Category) | 0 (0.0%) | 0 (0.0%) |
| Total (Overall) | 111 (73.5%) | 40 (26.5%) |
Sales and Office Occupations
The most common Sales and Office occupations in Depauville are , and Sales & Related (28 | 18.5%).
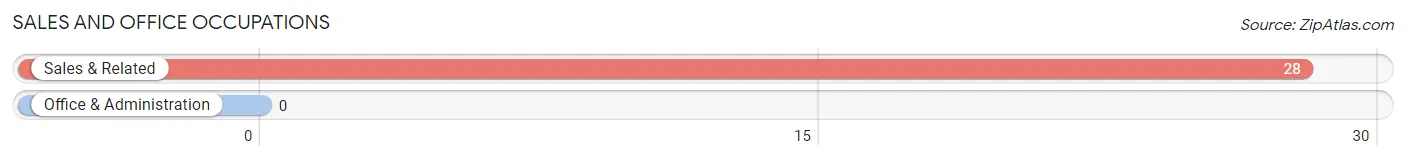
Sales and Office Occupations by Sex

| Occupation | Male | Female |
| Sales & Related | 28 (100.0%) | 0 (0.0%) |
| Office & Administration | 0 (0.0%) | 0 (0.0%) |
| Total (Category) | 28 (100.0%) | 0 (0.0%) |
| Total (Overall) | 111 (73.5%) | 40 (26.5%) |
Natural Resources, Construction and Maintenance Occupations

Natural Resources, Construction and Maintenance Occupations by Sex
| Occupation | Male | Female |
| Farming, Fishing & Forestry | 0 (0.0%) | 0 (0.0%) |
| Construction & Extraction | 0 (0.0%) | 0 (0.0%) |
| Installation, Maintenance & Repair | 0 (0.0%) | 0 (0.0%) |
| Total (Category) | 0 (0.0%) | 0 (0.0%) |
| Total (Overall) | 111 (73.5%) | 40 (26.5%) |
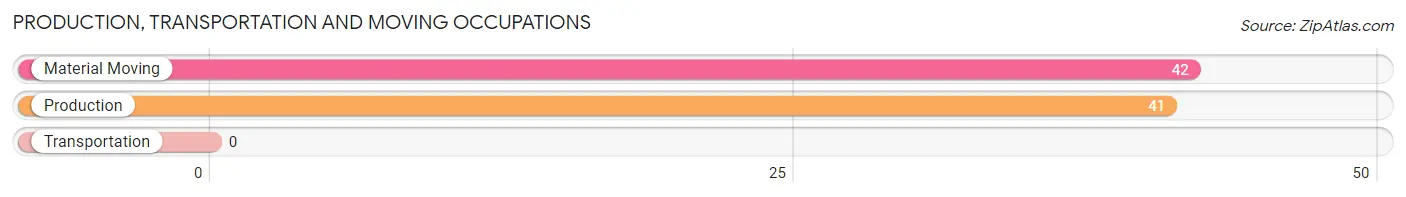
Production, Transportation and Moving Occupations
The most common Production, Transportation and Moving occupations in Depauville are Material Moving (42 | 27.8%), and Production (41 | 27.2%).
Production, Transportation and Moving Occupations by Sex
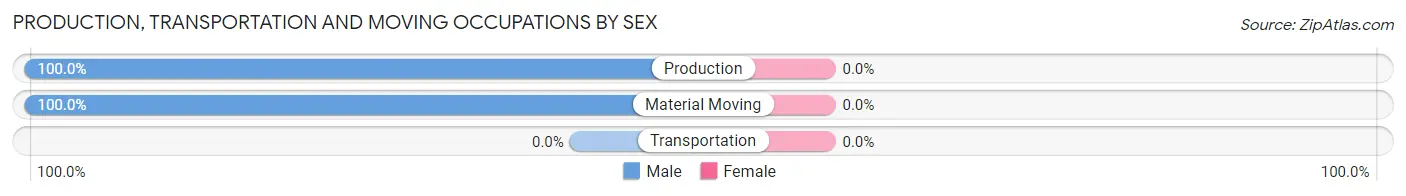
| Occupation | Male | Female |
| Production | 41 (100.0%) | 0 (0.0%) |
| Transportation | 0 (0.0%) | 0 (0.0%) |
| Material Moving | 42 (100.0%) | 0 (0.0%) |
| Total (Category) | 83 (100.0%) | 0 (0.0%) |
| Total (Overall) | 111 (73.5%) | 40 (26.5%) |
Employment Industries by Sex in Depauville
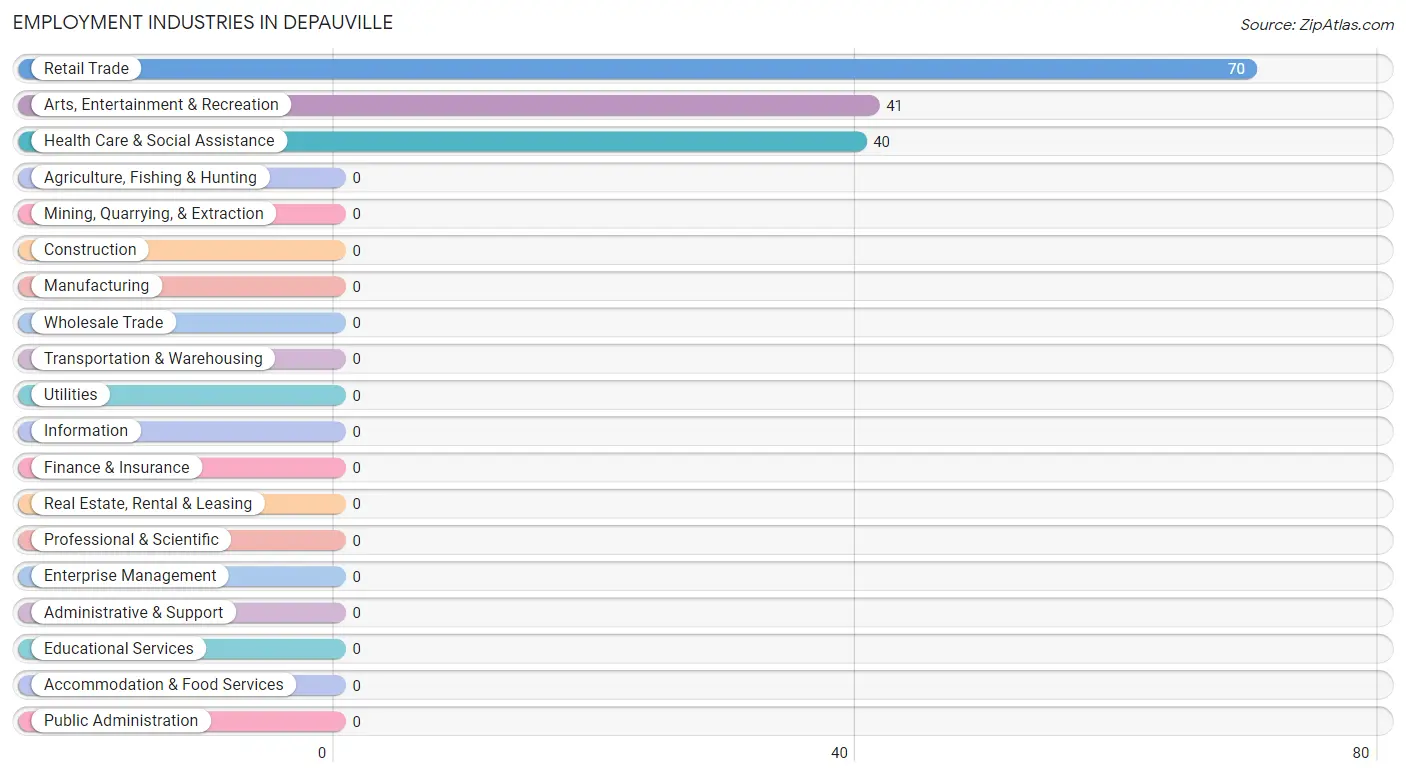
Employment Industries in Depauville
The major employment industries in Depauville include Retail Trade (70 | 46.4%), Arts, Entertainment & Recreation (41 | 27.2%), and Health Care & Social Assistance (40 | 26.5%).
Employment Industries by Sex in Depauville
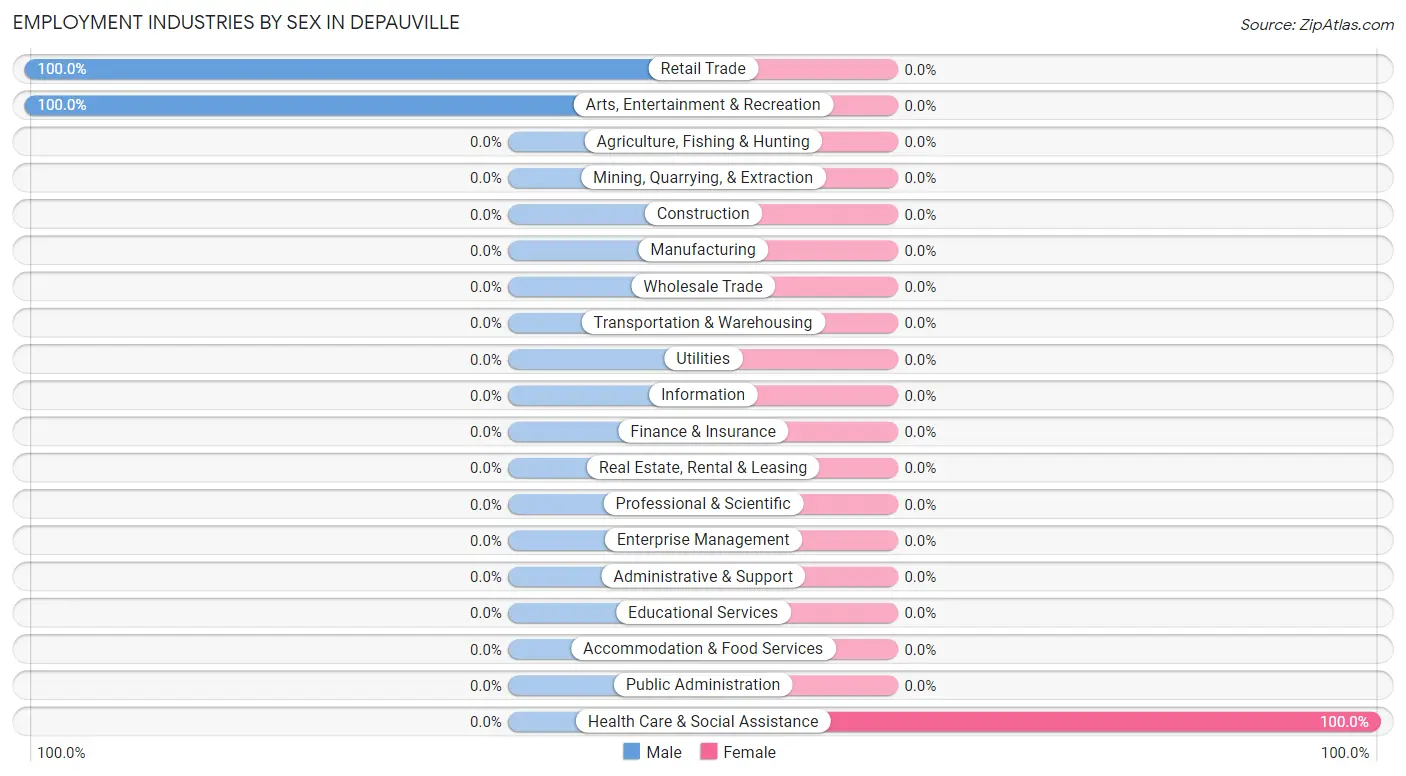
| Industry | Male | Female |
| Agriculture, Fishing & Hunting | 0 (0.0%) | 0 (0.0%) |
| Mining, Quarrying, & Extraction | 0 (0.0%) | 0 (0.0%) |
| Construction | 0 (0.0%) | 0 (0.0%) |
| Manufacturing | 0 (0.0%) | 0 (0.0%) |
| Wholesale Trade | 0 (0.0%) | 0 (0.0%) |
| Retail Trade | 70 (100.0%) | 0 (0.0%) |
| Transportation & Warehousing | 0 (0.0%) | 0 (0.0%) |
| Utilities | 0 (0.0%) | 0 (0.0%) |
| Information | 0 (0.0%) | 0 (0.0%) |
| Finance & Insurance | 0 (0.0%) | 0 (0.0%) |
| Real Estate, Rental & Leasing | 0 (0.0%) | 0 (0.0%) |
| Professional & Scientific | 0 (0.0%) | 0 (0.0%) |
| Enterprise Management | 0 (0.0%) | 0 (0.0%) |
| Administrative & Support | 0 (0.0%) | 0 (0.0%) |
| Educational Services | 0 (0.0%) | 0 (0.0%) |
| Health Care & Social Assistance | 0 (0.0%) | 40 (100.0%) |
| Arts, Entertainment & Recreation | 41 (100.0%) | 0 (0.0%) |
| Accommodation & Food Services | 0 (0.0%) | 0 (0.0%) |
| Public Administration | 0 (0.0%) | 0 (0.0%) |
| Total | 111 (73.5%) | 40 (26.5%) |
Education in Depauville
School Enrollment in Depauville
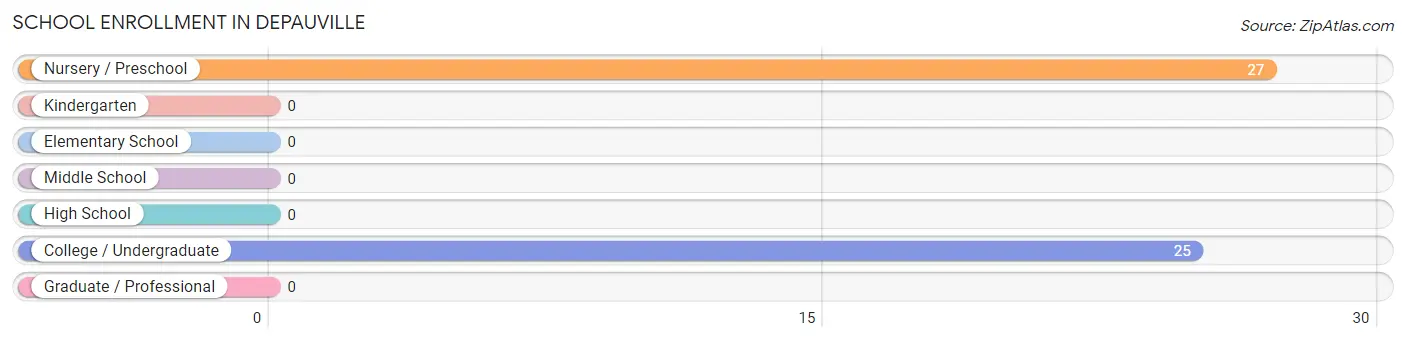
The most common levels of schooling among the 52 students in Depauville are nursery / preschool (27 | 51.9%), and college / undergraduate (25 | 48.1%).
| School Level | # Students | % Students |
| Nursery / Preschool | 27 | 51.9% |
| Kindergarten | 0 | 0.0% |
| Elementary School | 0 | 0.0% |
| Middle School | 0 | 0.0% |
| High School | 0 | 0.0% |
| College / Undergraduate | 25 | 48.1% |
| Graduate / Professional | 0 | 0.0% |
| Total | 52 | 100.0% |
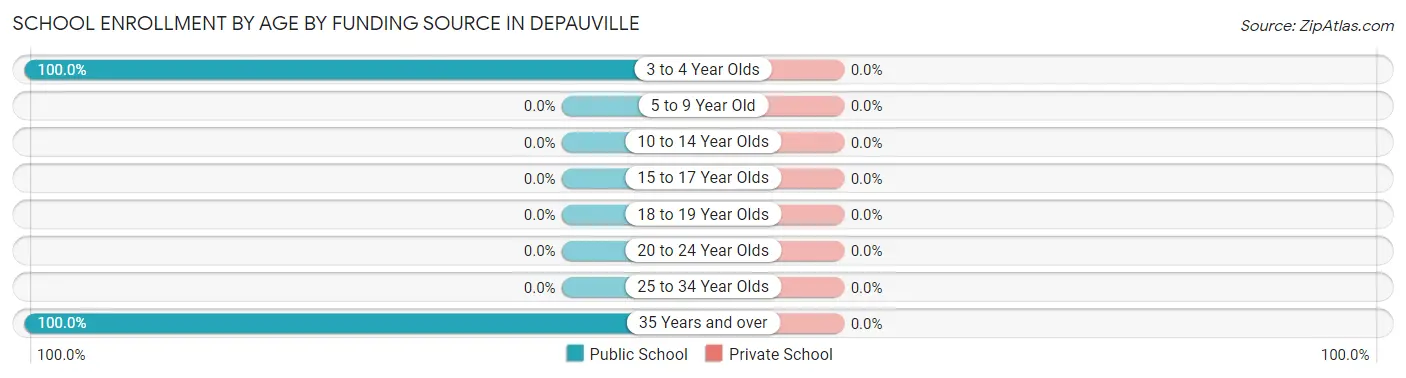
School Enrollment by Age by Funding Source in Depauville
| Age Bracket | Public School | Private School |
| 3 to 4 Year Olds | 27 (100.0%) | 0 (0.0%) |
| 5 to 9 Year Old | 0 (0.0%) | 0 (0.0%) |
| 10 to 14 Year Olds | 0 (0.0%) | 0 (0.0%) |
| 15 to 17 Year Olds | 0 (0.0%) | 0 (0.0%) |
| 18 to 19 Year Olds | 0 (0.0%) | 0 (0.0%) |
| 20 to 24 Year Olds | 0 (0.0%) | 0 (0.0%) |
| 25 to 34 Year Olds | 0 (0.0%) | 0 (0.0%) |
| 35 Years and over | 25 (100.0%) | 0 (0.0%) |
| Total | 52 (100.0%) | 0 (0.0%) |
Educational Attainment by Field of Study in Depauville
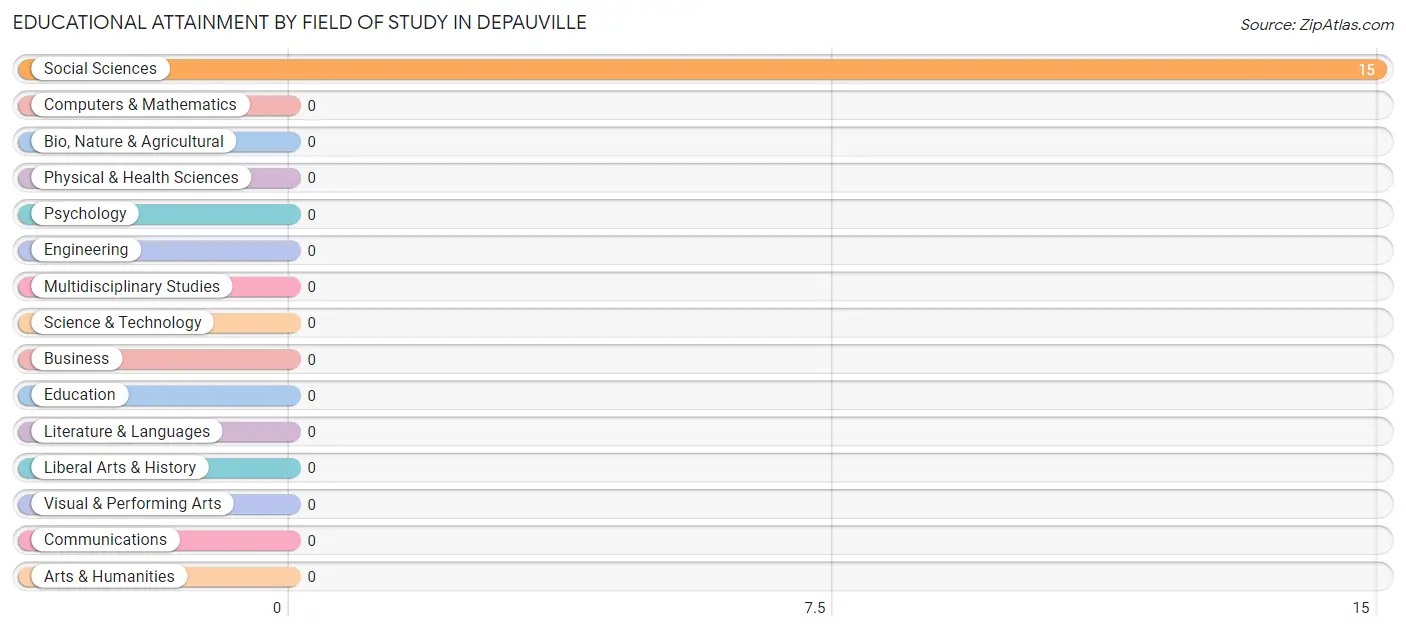
, and social sciences (15 | 100.0%) are the most common fields of study among 15 individuals in Depauville who have obtained a bachelor's degree or higher.
| Field of Study | # Graduates | % Graduates |
| Computers & Mathematics | 0 | 0.0% |
| Bio, Nature & Agricultural | 0 | 0.0% |
| Physical & Health Sciences | 0 | 0.0% |
| Psychology | 0 | 0.0% |
| Social Sciences | 15 | 100.0% |
| Engineering | 0 | 0.0% |
| Multidisciplinary Studies | 0 | 0.0% |
| Science & Technology | 0 | 0.0% |
| Business | 0 | 0.0% |
| Education | 0 | 0.0% |
| Literature & Languages | 0 | 0.0% |
| Liberal Arts & History | 0 | 0.0% |
| Visual & Performing Arts | 0 | 0.0% |
| Communications | 0 | 0.0% |
| Arts & Humanities | 0 | 0.0% |
| Total | 15 | 100.0% |
Transportation & Commute in Depauville
Vehicle Availability by Sex in Depauville
The most prevalent vehicle ownership categories in Depauville are males with 2 vehicles (111, accounting for 100.0%) and females with 2 vehicles (40, making up 277.5%).
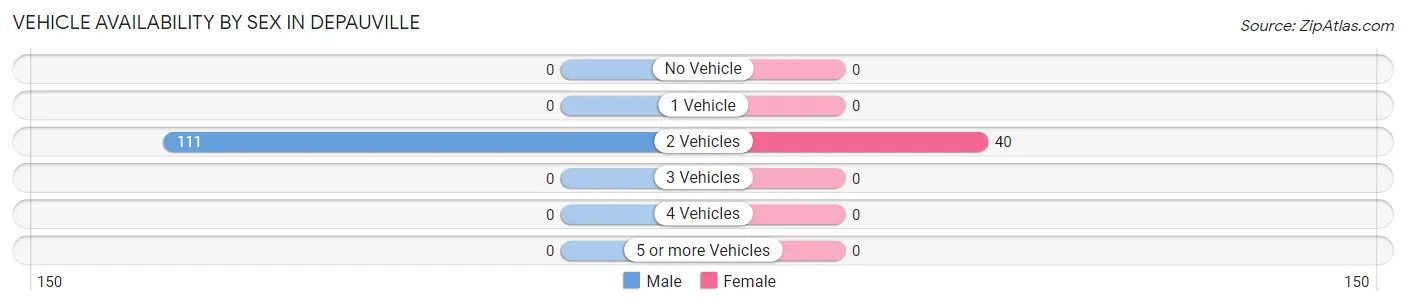
| Vehicles Available | Male | Female |
| No Vehicle | 0 (0.0%) | 0 (0.0%) |
| 1 Vehicle | 0 (0.0%) | 0 (0.0%) |
| 2 Vehicles | 111 (100.0%) | 40 (100.0%) |
| 3 Vehicles | 0 (0.0%) | 0 (0.0%) |
| 4 Vehicles | 0 (0.0%) | 0 (0.0%) |
| 5 or more Vehicles | 0 (0.0%) | 0 (0.0%) |
| Total | 111 (100.0%) | 40 (100.0%) |
Commute Time in Depauville
The most frequently occuring commute durations in Depauville are 10 to 14 minutes (67 commuters, 44.4%), 40 to 44 minutes (41 commuters, 27.2%), and 30 to 34 minutes (28 commuters, 18.5%).
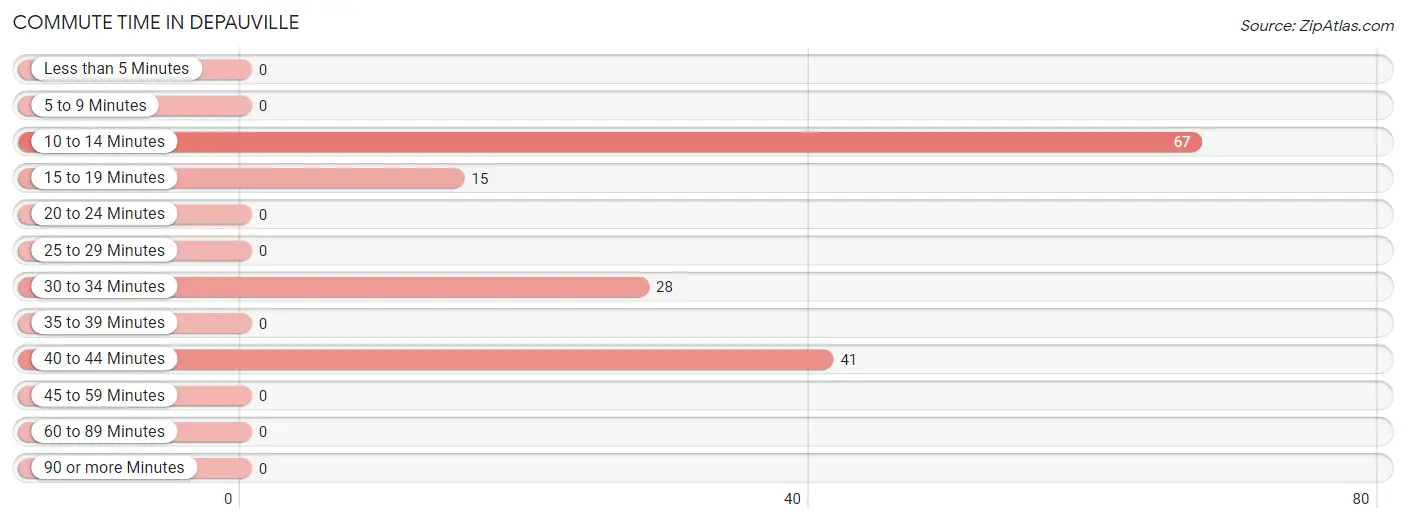
| Commute Time | # Commuters | % Commuters |
| Less than 5 Minutes | 0 | 0.0% |
| 5 to 9 Minutes | 0 | 0.0% |
| 10 to 14 Minutes | 67 | 44.4% |
| 15 to 19 Minutes | 15 | 9.9% |
| 20 to 24 Minutes | 0 | 0.0% |
| 25 to 29 Minutes | 0 | 0.0% |
| 30 to 34 Minutes | 28 | 18.5% |
| 35 to 39 Minutes | 0 | 0.0% |
| 40 to 44 Minutes | 41 | 27.2% |
| 45 to 59 Minutes | 0 | 0.0% |
| 60 to 89 Minutes | 0 | 0.0% |
| 90 or more Minutes | 0 | 0.0% |
Commute Time by Sex in Depauville
The most common commute times in Depauville are 10 to 14 minutes (42 commuters, 37.8%) for males and 10 to 14 minutes (25 commuters, 62.5%) for females.
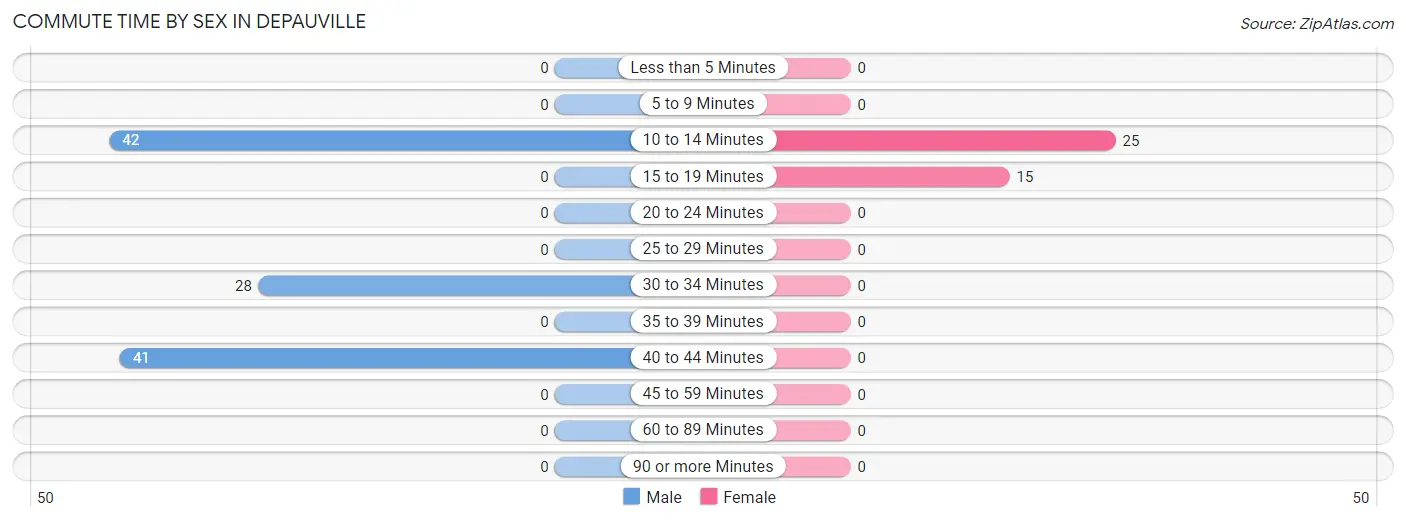
| Commute Time | Male | Female |
| Less than 5 Minutes | 0 (0.0%) | 0 (0.0%) |
| 5 to 9 Minutes | 0 (0.0%) | 0 (0.0%) |
| 10 to 14 Minutes | 42 (37.8%) | 25 (62.5%) |
| 15 to 19 Minutes | 0 (0.0%) | 15 (37.5%) |
| 20 to 24 Minutes | 0 (0.0%) | 0 (0.0%) |
| 25 to 29 Minutes | 0 (0.0%) | 0 (0.0%) |
| 30 to 34 Minutes | 28 (25.2%) | 0 (0.0%) |
| 35 to 39 Minutes | 0 (0.0%) | 0 (0.0%) |
| 40 to 44 Minutes | 41 (36.9%) | 0 (0.0%) |
| 45 to 59 Minutes | 0 (0.0%) | 0 (0.0%) |
| 60 to 89 Minutes | 0 (0.0%) | 0 (0.0%) |
| 90 or more Minutes | 0 (0.0%) | 0 (0.0%) |
Time of Departure to Work by Sex in Depauville
The most frequent times of departure to work in Depauville are 6:00 AM to 6:29 AM (69, 62.2%) for males and 6:00 AM to 6:29 AM (25, 62.5%) for females.
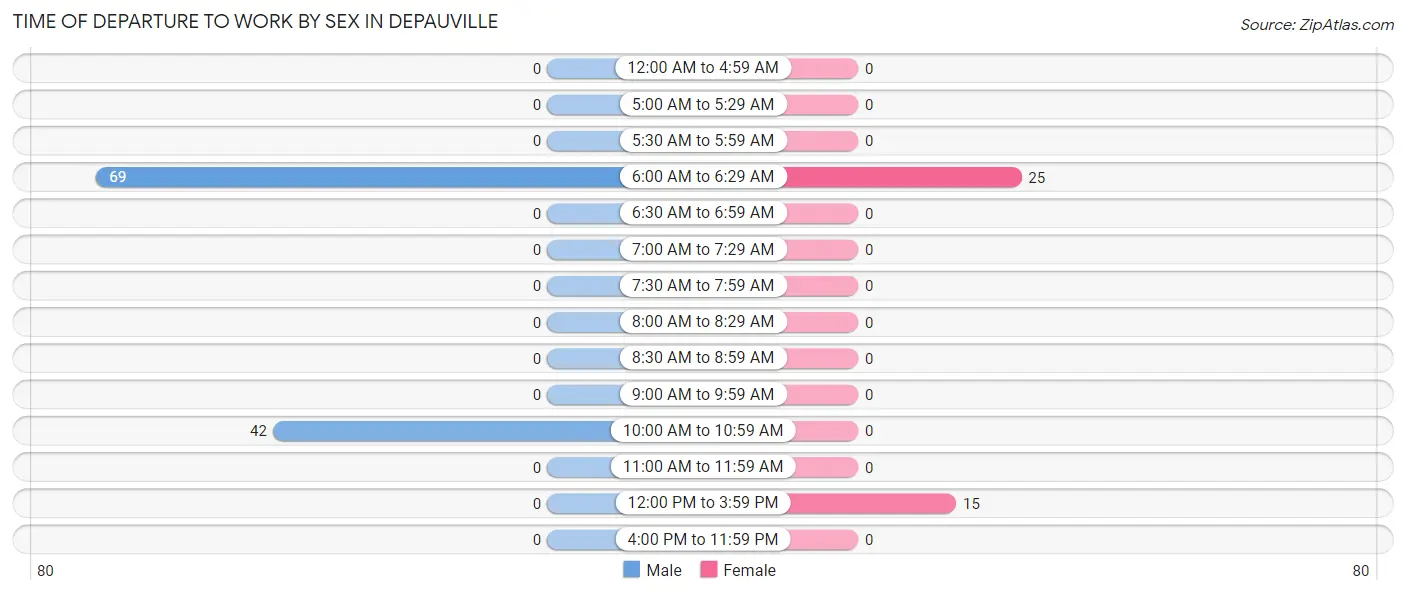
| Time of Departure | Male | Female |
| 12:00 AM to 4:59 AM | 0 (0.0%) | 0 (0.0%) |
| 5:00 AM to 5:29 AM | 0 (0.0%) | 0 (0.0%) |
| 5:30 AM to 5:59 AM | 0 (0.0%) | 0 (0.0%) |
| 6:00 AM to 6:29 AM | 69 (62.2%) | 25 (62.5%) |
| 6:30 AM to 6:59 AM | 0 (0.0%) | 0 (0.0%) |
| 7:00 AM to 7:29 AM | 0 (0.0%) | 0 (0.0%) |
| 7:30 AM to 7:59 AM | 0 (0.0%) | 0 (0.0%) |
| 8:00 AM to 8:29 AM | 0 (0.0%) | 0 (0.0%) |
| 8:30 AM to 8:59 AM | 0 (0.0%) | 0 (0.0%) |
| 9:00 AM to 9:59 AM | 0 (0.0%) | 0 (0.0%) |
| 10:00 AM to 10:59 AM | 42 (37.8%) | 0 (0.0%) |
| 11:00 AM to 11:59 AM | 0 (0.0%) | 0 (0.0%) |
| 12:00 PM to 3:59 PM | 0 (0.0%) | 15 (37.5%) |
| 4:00 PM to 11:59 PM | 0 (0.0%) | 0 (0.0%) |
| Total | 111 (100.0%) | 40 (100.0%) |
Housing Occupancy in Depauville
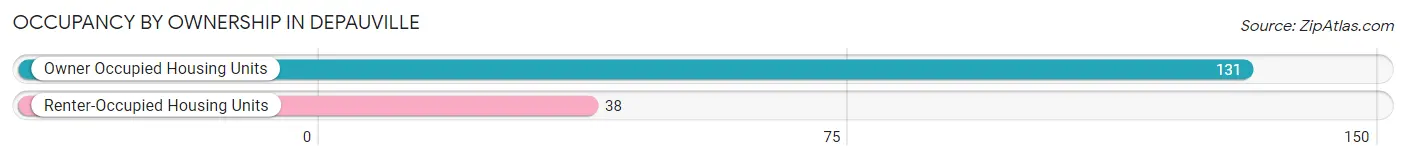
Occupancy by Ownership in Depauville
Of the total 169 dwellings in Depauville, owner-occupied units account for 131 (77.5%), while renter-occupied units make up 38 (22.5%).
| Occupancy | # Housing Units | % Housing Units |
| Owner Occupied Housing Units | 131 | 77.5% |
| Renter-Occupied Housing Units | 38 | 22.5% |
| Total Occupied Housing Units | 169 | 100.0% |
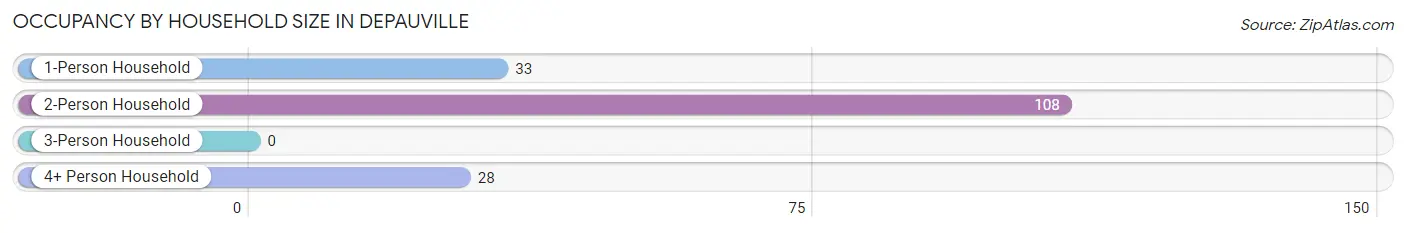
Occupancy by Household Size in Depauville
| Household Size | # Housing Units | % Housing Units |
| 1-Person Household | 33 | 19.5% |
| 2-Person Household | 108 | 63.9% |
| 3-Person Household | 0 | 0.0% |
| 4+ Person Household | 28 | 16.6% |
| Total Housing Units | 169 | 100.0% |
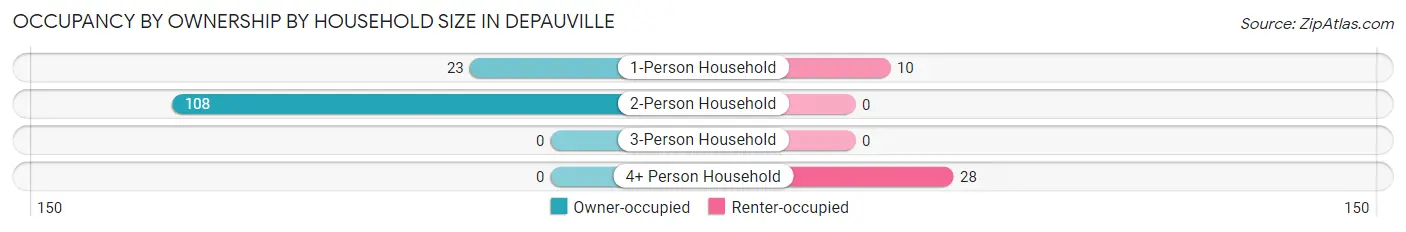
Occupancy by Ownership by Household Size in Depauville
| Household Size | Owner-occupied | Renter-occupied |
| 1-Person Household | 23 (69.7%) | 10 (30.3%) |
| 2-Person Household | 108 (100.0%) | 0 (0.0%) |
| 3-Person Household | 0 (0.0%) | 0 (0.0%) |
| 4+ Person Household | 0 (0.0%) | 28 (100.0%) |
| Total Housing Units | 131 (77.5%) | 38 (22.5%) |
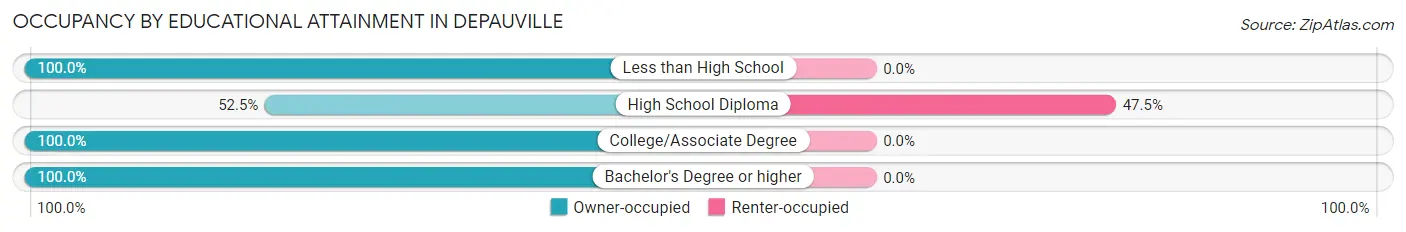
Occupancy by Educational Attainment in Depauville
| Household Size | Owner-occupied | Renter-occupied |
| Less than High School | 23 (100.0%) | 0 (0.0%) |
| High School Diploma | 42 (52.5%) | 38 (47.5%) |
| College/Associate Degree | 51 (100.0%) | 0 (0.0%) |
| Bachelor's Degree or higher | 15 (100.0%) | 0 (0.0%) |
Occupancy by Age of Householder in Depauville
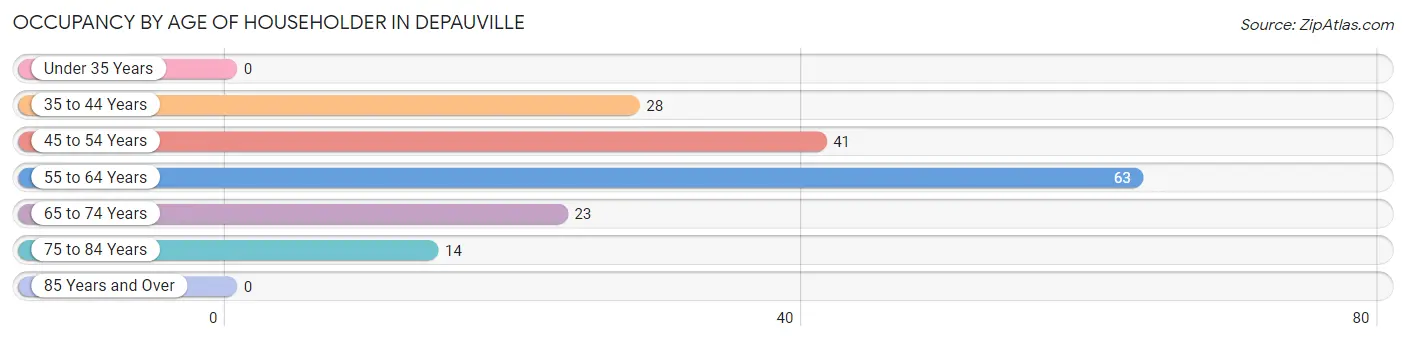
| Age Bracket | # Households | % Households |
| Under 35 Years | 0 | 0.0% |
| 35 to 44 Years | 28 | 16.6% |
| 45 to 54 Years | 41 | 24.3% |
| 55 to 64 Years | 63 | 37.3% |
| 65 to 74 Years | 23 | 13.6% |
| 75 to 84 Years | 14 | 8.3% |
| 85 Years and Over | 0 | 0.0% |
| Total | 169 | 100.0% |
Housing Finances in Depauville
Median Income by Occupancy in Depauville
| Occupancy Type | # Households | Median Income |
| Owner-Occupied | 131 (77.5%) | $0 |
| Renter-Occupied | 38 (22.5%) | $0 |
| Average | 169 (100.0%) | $0 |
Occupancy by Householder Income Bracket in Depauville
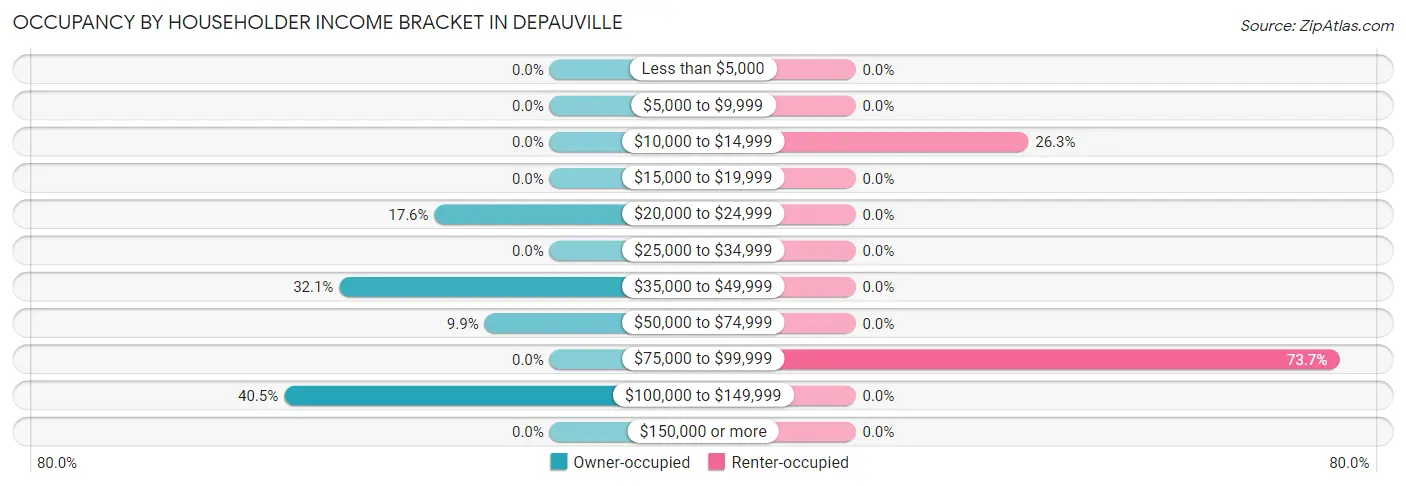
| Income Bracket | Owner-occupied | Renter-occupied |
| Less than $5,000 | 0 (0.0%) | 0 (0.0%) |
| $5,000 to $9,999 | 0 (0.0%) | 0 (0.0%) |
| $10,000 to $14,999 | 0 (0.0%) | 10 (26.3%) |
| $15,000 to $19,999 | 0 (0.0%) | 0 (0.0%) |
| $20,000 to $24,999 | 23 (17.6%) | 0 (0.0%) |
| $25,000 to $34,999 | 0 (0.0%) | 0 (0.0%) |
| $35,000 to $49,999 | 42 (32.1%) | 0 (0.0%) |
| $50,000 to $74,999 | 13 (9.9%) | 0 (0.0%) |
| $75,000 to $99,999 | 0 (0.0%) | 28 (73.7%) |
| $100,000 to $149,999 | 53 (40.5%) | 0 (0.0%) |
| $150,000 or more | 0 (0.0%) | 0 (0.0%) |
| Total | 131 (100.0%) | 38 (100.0%) |
Monthly Housing Cost Tiers in Depauville
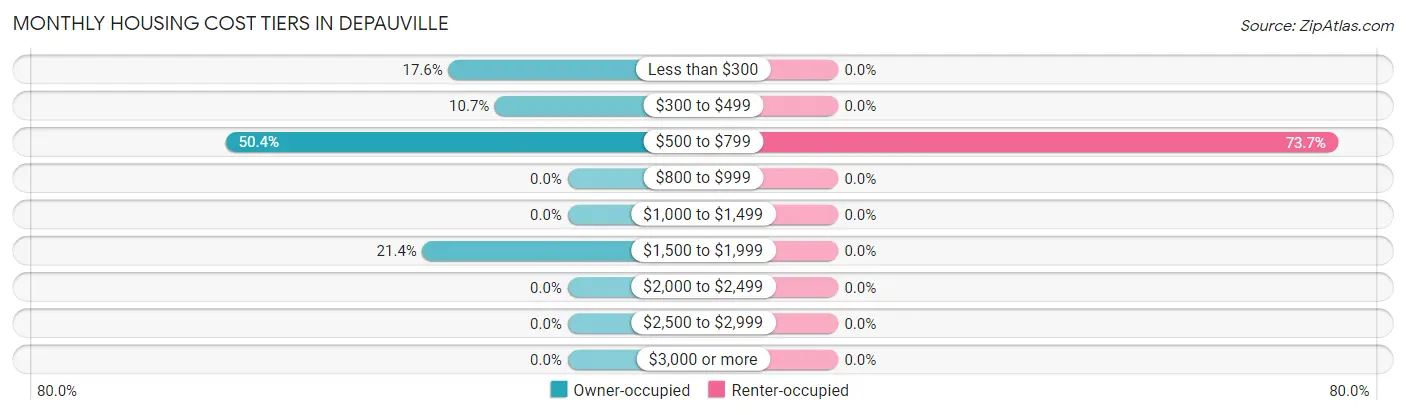
| Monthly Cost | Owner-occupied | Renter-occupied |
| Less than $300 | 23 (17.6%) | 0 (0.0%) |
| $300 to $499 | 14 (10.7%) | 0 (0.0%) |
| $500 to $799 | 66 (50.4%) | 28 (73.7%) |
| $800 to $999 | 0 (0.0%) | 0 (0.0%) |
| $1,000 to $1,499 | 0 (0.0%) | 0 (0.0%) |
| $1,500 to $1,999 | 28 (21.4%) | 0 (0.0%) |
| $2,000 to $2,499 | 0 (0.0%) | 0 (0.0%) |
| $2,500 to $2,999 | 0 (0.0%) | 0 (0.0%) |
| $3,000 or more | 0 (0.0%) | 0 (0.0%) |
| Total | 131 (100.0%) | 38 (100.0%) |
Physical Housing Characteristics in Depauville
Housing Structures in Depauville
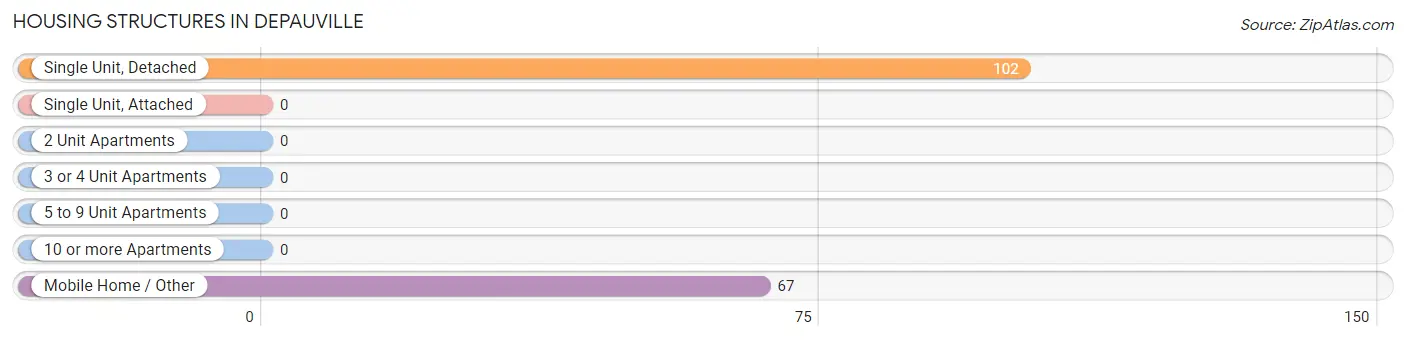
| Structure Type | # Housing Units | % Housing Units |
| Single Unit, Detached | 102 | 60.4% |
| Single Unit, Attached | 0 | 0.0% |
| 2 Unit Apartments | 0 | 0.0% |
| 3 or 4 Unit Apartments | 0 | 0.0% |
| 5 to 9 Unit Apartments | 0 | 0.0% |
| 10 or more Apartments | 0 | 0.0% |
| Mobile Home / Other | 67 | 39.6% |
| Total | 169 | 100.0% |
Housing Structures by Occupancy in Depauville
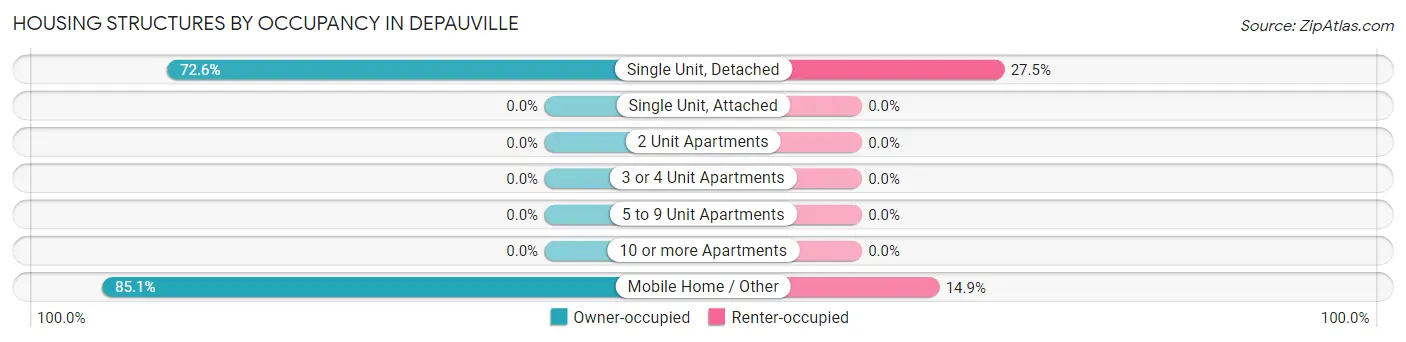
| Structure Type | Owner-occupied | Renter-occupied |
| Single Unit, Detached | 74 (72.6%) | 28 (27.5%) |
| Single Unit, Attached | 0 (0.0%) | 0 (0.0%) |
| 2 Unit Apartments | 0 (0.0%) | 0 (0.0%) |
| 3 or 4 Unit Apartments | 0 (0.0%) | 0 (0.0%) |
| 5 to 9 Unit Apartments | 0 (0.0%) | 0 (0.0%) |
| 10 or more Apartments | 0 (0.0%) | 0 (0.0%) |
| Mobile Home / Other | 57 (85.1%) | 10 (14.9%) |
| Total | 131 (77.5%) | 38 (22.5%) |
Housing Structures by Number of Rooms in Depauville
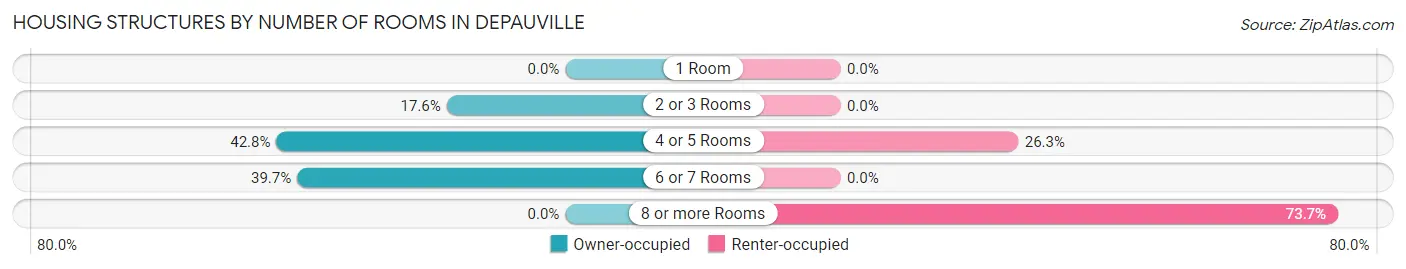
| Number of Rooms | Owner-occupied | Renter-occupied |
| 1 Room | 0 (0.0%) | 0 (0.0%) |
| 2 or 3 Rooms | 23 (17.6%) | 0 (0.0%) |
| 4 or 5 Rooms | 56 (42.7%) | 10 (26.3%) |
| 6 or 7 Rooms | 52 (39.7%) | 0 (0.0%) |
| 8 or more Rooms | 0 (0.0%) | 28 (73.7%) |
| Total | 131 (100.0%) | 38 (100.0%) |
Housing Structure by Heating Type in Depauville
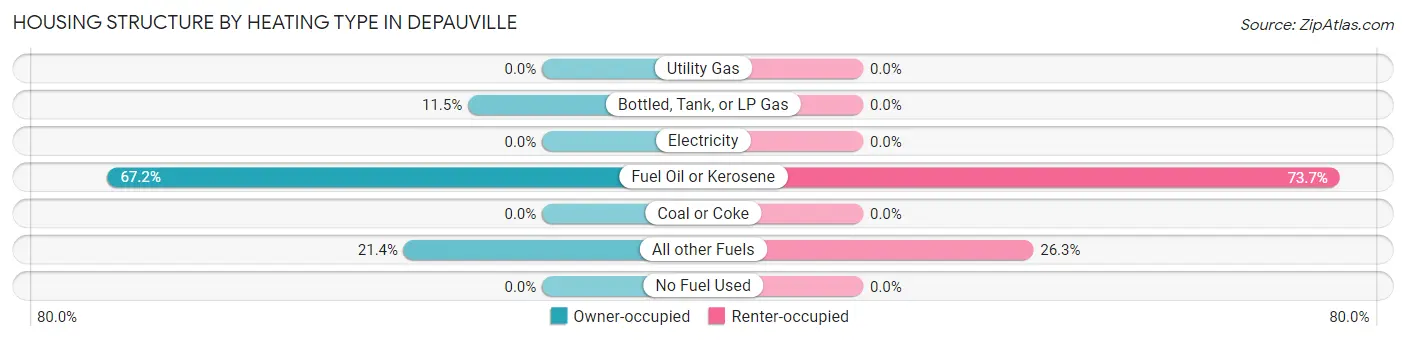
| Heating Type | Owner-occupied | Renter-occupied |
| Utility Gas | 0 (0.0%) | 0 (0.0%) |
| Bottled, Tank, or LP Gas | 15 (11.5%) | 0 (0.0%) |
| Electricity | 0 (0.0%) | 0 (0.0%) |
| Fuel Oil or Kerosene | 88 (67.2%) | 28 (73.7%) |
| Coal or Coke | 0 (0.0%) | 0 (0.0%) |
| All other Fuels | 28 (21.4%) | 10 (26.3%) |
| No Fuel Used | 0 (0.0%) | 0 (0.0%) |
| Total | 131 (100.0%) | 38 (100.0%) |
Household Vehicle Usage in Depauville
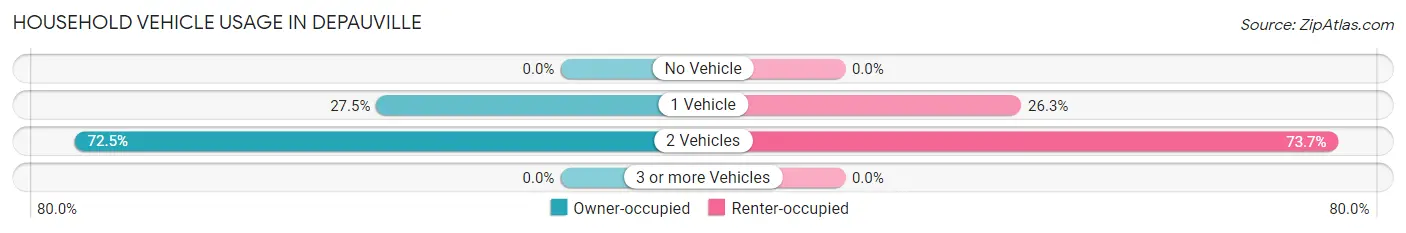
| Vehicles per Household | Owner-occupied | Renter-occupied |
| No Vehicle | 0 (0.0%) | 0 (0.0%) |
| 1 Vehicle | 36 (27.5%) | 10 (26.3%) |
| 2 Vehicles | 95 (72.5%) | 28 (73.7%) |
| 3 or more Vehicles | 0 (0.0%) | 0 (0.0%) |
| Total | 131 (100.0%) | 38 (100.0%) |
Real Estate & Mortgages in Depauville
Real Estate and Mortgage Overview in Depauville
| Characteristic | Without Mortgage | With Mortgage |
| Housing Units | 103 | 28 |
| Median Property Value | $83,800 | $0 |
| Median Household Income | - | - |
| Monthly Housing Costs | $522 | $0 |
| Real Estate Taxes | $1,691 | $0 |
Property Value by Mortgage Status in Depauville
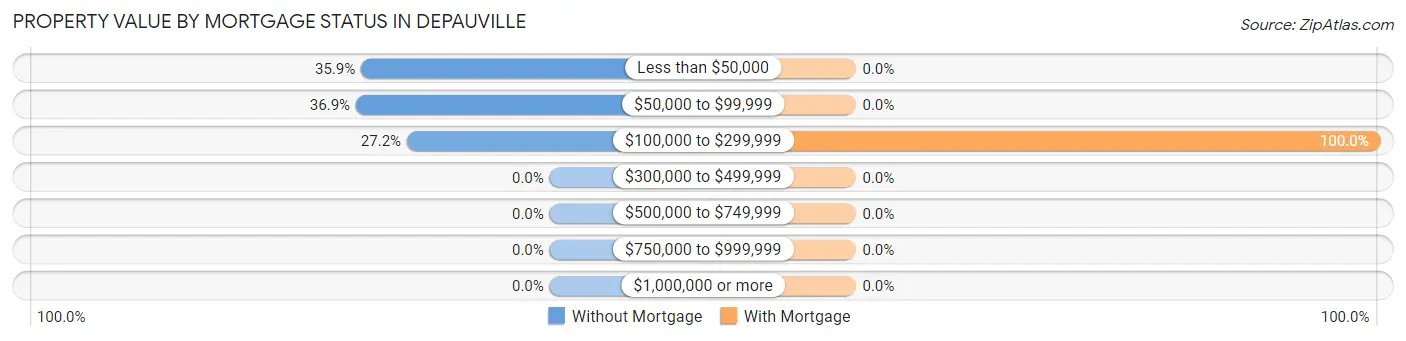
| Property Value | Without Mortgage | With Mortgage |
| Less than $50,000 | 37 (35.9%) | 0 (0.0%) |
| $50,000 to $99,999 | 38 (36.9%) | 0 (0.0%) |
| $100,000 to $299,999 | 28 (27.2%) | 28 (100.0%) |
| $300,000 to $499,999 | 0 (0.0%) | 0 (0.0%) |
| $500,000 to $749,999 | 0 (0.0%) | 0 (0.0%) |
| $750,000 to $999,999 | 0 (0.0%) | 0 (0.0%) |
| $1,000,000 or more | 0 (0.0%) | 0 (0.0%) |
| Total | 103 (100.0%) | 28 (100.0%) |
Household Income by Mortgage Status in Depauville
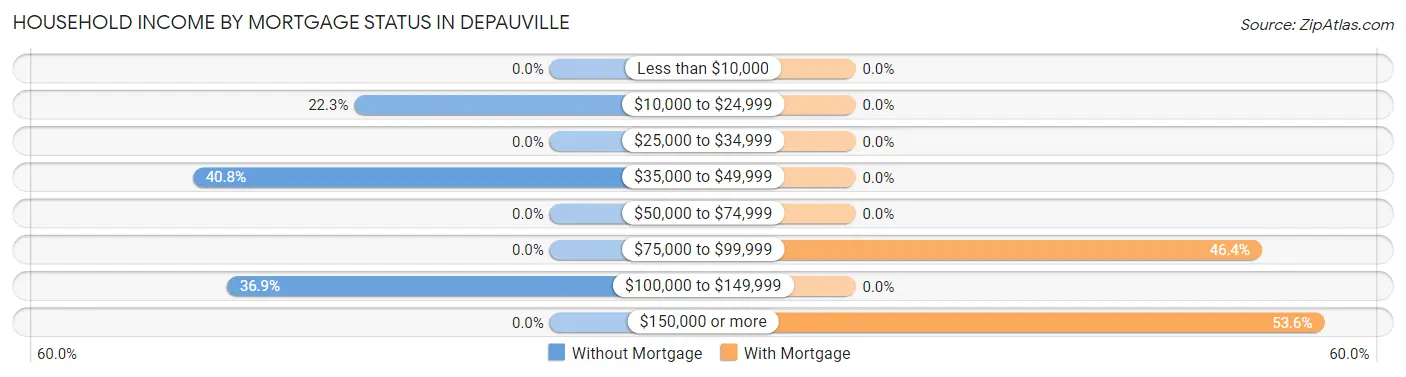
| Household Income | Without Mortgage | With Mortgage |
| Less than $10,000 | 0 (0.0%) | 0 (0.0%) |
| $10,000 to $24,999 | 23 (22.3%) | 0 (0.0%) |
| $25,000 to $34,999 | 0 (0.0%) | 0 (0.0%) |
| $35,000 to $49,999 | 42 (40.8%) | 0 (0.0%) |
| $50,000 to $74,999 | 0 (0.0%) | 0 (0.0%) |
| $75,000 to $99,999 | 0 (0.0%) | 13 (46.4%) |
| $100,000 to $149,999 | 38 (36.9%) | 0 (0.0%) |
| $150,000 or more | 0 (0.0%) | 15 (53.6%) |
| Total | 103 (100.0%) | 28 (100.0%) |
Property Value to Household Income Ratio in Depauville
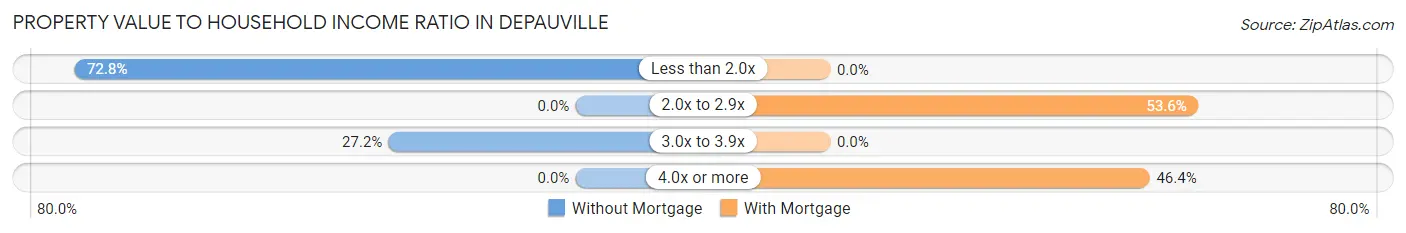
| Value-to-Income Ratio | Without Mortgage | With Mortgage |
| Less than 2.0x | 75 (72.8%) | 0 (0.0%) |
| 2.0x to 2.9x | 0 (0.0%) | 15 (53.6%) |
| 3.0x to 3.9x | 28 (27.2%) | 0 (0.0%) |
| 4.0x or more | 0 (0.0%) | 13 (46.4%) |
| Total | 103 (100.0%) | 28 (100.0%) |
Real Estate Taxes by Mortgage Status in Depauville
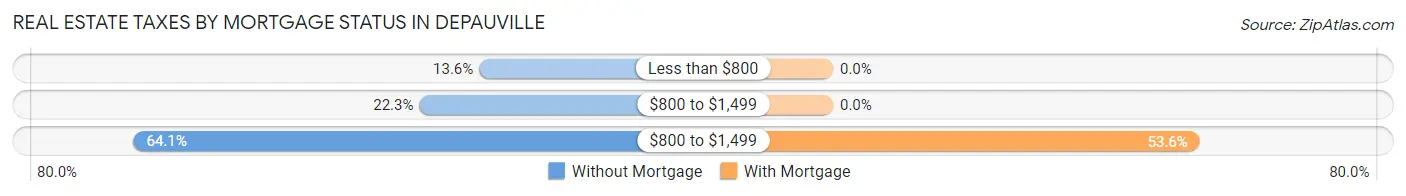
| Property Taxes | Without Mortgage | With Mortgage |
| Less than $800 | 14 (13.6%) | 0 (0.0%) |
| $800 to $1,499 | 23 (22.3%) | 0 (0.0%) |
| $800 to $1,499 | 66 (64.1%) | 15 (53.6%) |
| Total | 103 (100.0%) | 28 (100.0%) |
Health & Disability in Depauville
Health Insurance Coverage by Age in Depauville
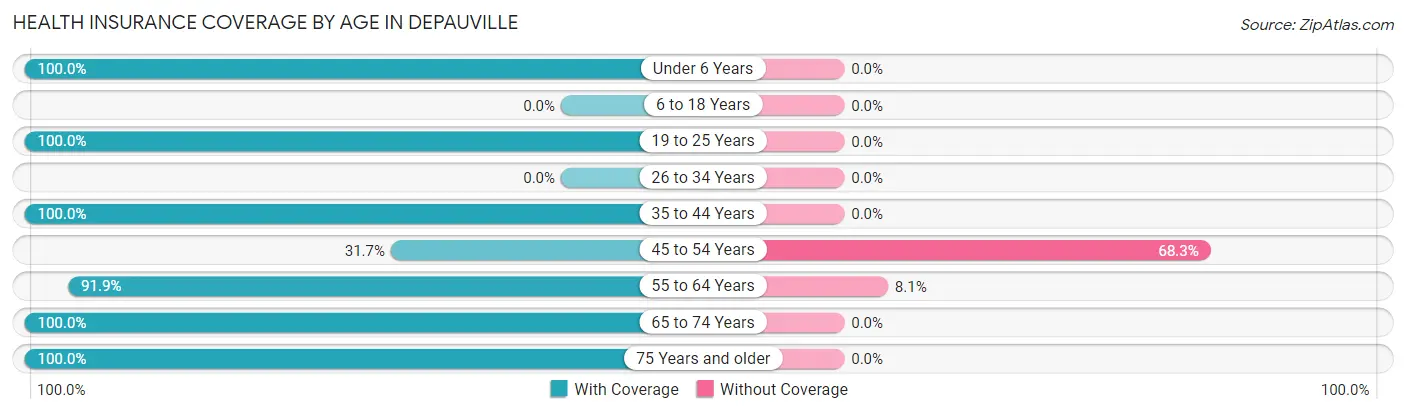
| Age Bracket | With Coverage | Without Coverage |
| Under 6 Years | 79 (100.0%) | 0 (0.0%) |
| 6 to 18 Years | 0 (0.0%) | 0 (0.0%) |
| 19 to 25 Years | 42 (100.0%) | 0 (0.0%) |
| 26 to 34 Years | 0 (0.0%) | 0 (0.0%) |
| 35 to 44 Years | 53 (100.0%) | 0 (0.0%) |
| 45 to 54 Years | 13 (31.7%) | 28 (68.3%) |
| 55 to 64 Years | 113 (91.9%) | 10 (8.1%) |
| 65 to 74 Years | 36 (100.0%) | 0 (0.0%) |
| 75 Years and older | 14 (100.0%) | 0 (0.0%) |
| Total | 350 (90.2%) | 38 (9.8%) |
Health Insurance Coverage by Citizenship Status in Depauville
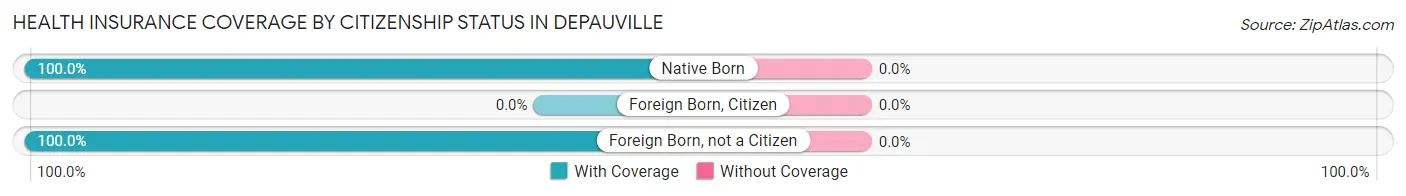
| Citizenship Status | With Coverage | Without Coverage |
| Native Born | 79 (100.0%) | 0 (0.0%) |
| Foreign Born, Citizen | 0 (0.0%) | 0 (0.0%) |
| Foreign Born, not a Citizen | 42 (100.0%) | 0 (0.0%) |
Health Insurance Coverage by Household Income in Depauville
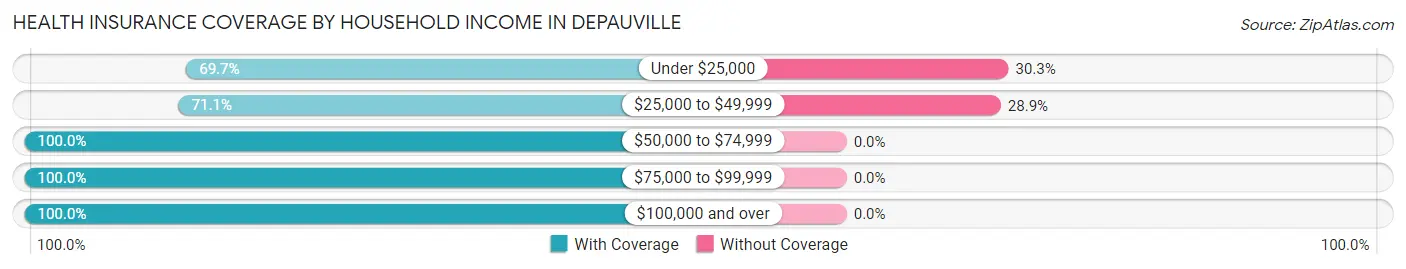
| Household Income | With Coverage | Without Coverage |
| Under $25,000 | 23 (69.7%) | 10 (30.3%) |
| $25,000 to $49,999 | 69 (71.1%) | 28 (28.9%) |
| $50,000 to $74,999 | 28 (100.0%) | 0 (0.0%) |
| $75,000 to $99,999 | 132 (100.0%) | 0 (0.0%) |
| $100,000 and over | 98 (100.0%) | 0 (0.0%) |
Public vs Private Health Insurance Coverage by Age in Depauville
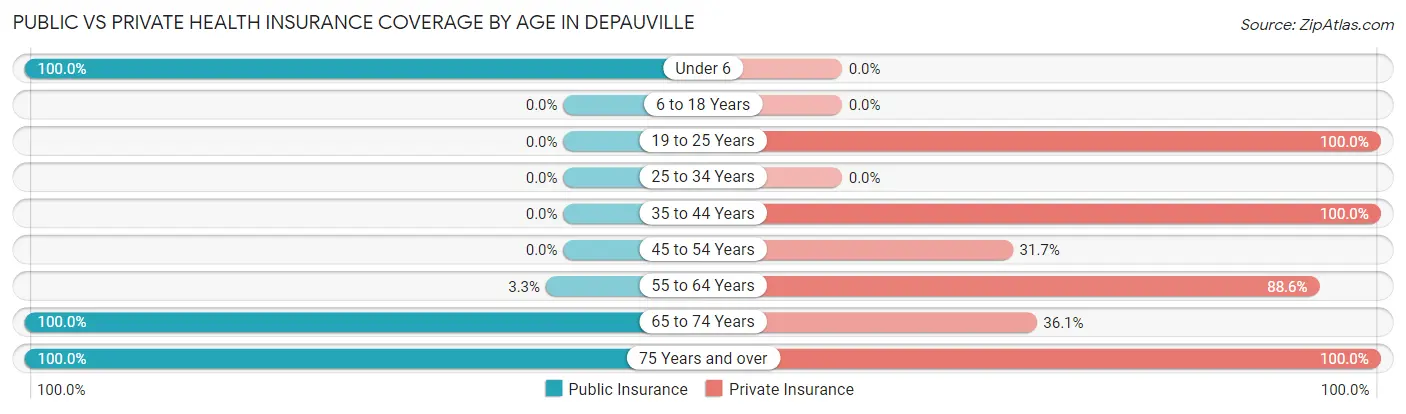
| Age Bracket | Public Insurance | Private Insurance |
| Under 6 | 79 (100.0%) | 0 (0.0%) |
| 6 to 18 Years | 0 (0.0%) | 0 (0.0%) |
| 19 to 25 Years | 0 (0.0%) | 42 (100.0%) |
| 25 to 34 Years | 0 (0.0%) | 0 (0.0%) |
| 35 to 44 Years | 0 (0.0%) | 53 (100.0%) |
| 45 to 54 Years | 0 (0.0%) | 13 (31.7%) |
| 55 to 64 Years | 4 (3.3%) | 109 (88.6%) |
| 65 to 74 Years | 36 (100.0%) | 13 (36.1%) |
| 75 Years and over | 14 (100.0%) | 14 (100.0%) |
| Total | 133 (34.3%) | 244 (62.9%) |
Disability Status by Sex by Age in Depauville
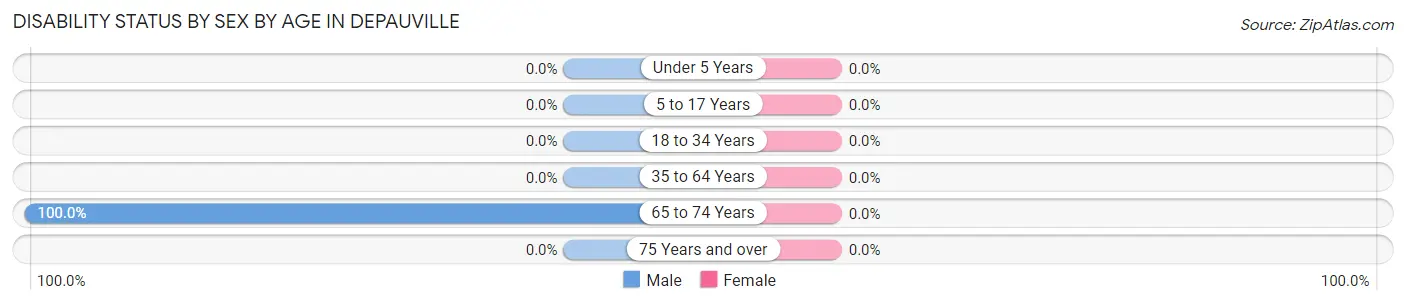
| Age Bracket | Male | Female |
| Under 5 Years | 0 (0.0%) | 0 (0.0%) |
| 5 to 17 Years | 0 (0.0%) | 0 (0.0%) |
| 18 to 34 Years | 0 (0.0%) | 0 (0.0%) |
| 35 to 64 Years | 0 (0.0%) | 0 (0.0%) |
| 65 to 74 Years | 23 (100.0%) | 0 (0.0%) |
| 75 Years and over | 0 (0.0%) | 0 (0.0%) |
Disability Class by Sex by Age in Depauville
Disability Class: Hearing Difficulty
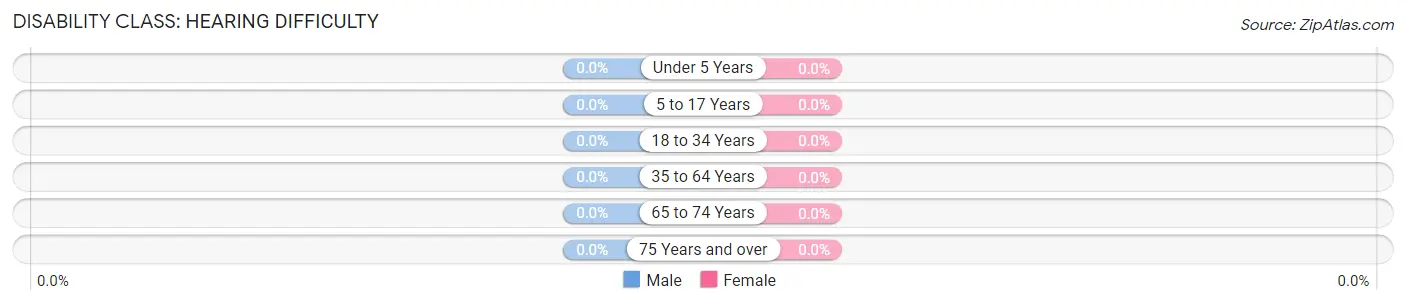
| Age Bracket | Male | Female |
| Under 5 Years | 0 (0.0%) | 0 (0.0%) |
| 5 to 17 Years | 0 (0.0%) | 0 (0.0%) |
| 18 to 34 Years | 0 (0.0%) | 0 (0.0%) |
| 35 to 64 Years | 0 (0.0%) | 0 (0.0%) |
| 65 to 74 Years | 0 (0.0%) | 0 (0.0%) |
| 75 Years and over | 0 (0.0%) | 0 (0.0%) |
Disability Class: Vision Difficulty
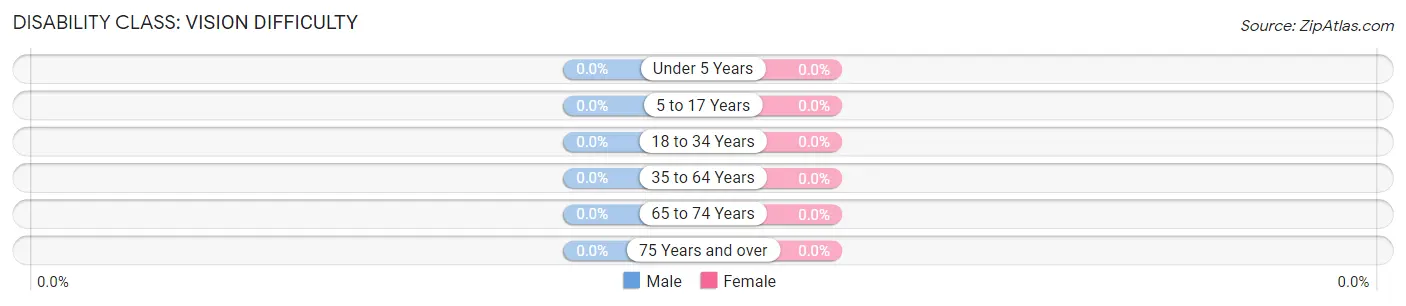
| Age Bracket | Male | Female |
| Under 5 Years | 0 (0.0%) | 0 (0.0%) |
| 5 to 17 Years | 0 (0.0%) | 0 (0.0%) |
| 18 to 34 Years | 0 (0.0%) | 0 (0.0%) |
| 35 to 64 Years | 0 (0.0%) | 0 (0.0%) |
| 65 to 74 Years | 0 (0.0%) | 0 (0.0%) |
| 75 Years and over | 0 (0.0%) | 0 (0.0%) |
Disability Class: Cognitive Difficulty
| Age Bracket | Male | Female |
| 5 to 17 Years | 0 (0.0%) | 0 (0.0%) |
| 18 to 34 Years | 0 (0.0%) | 0 (0.0%) |
| 35 to 64 Years | 0 (0.0%) | 0 (0.0%) |
| 65 to 74 Years | 0 (0.0%) | 0 (0.0%) |
| 75 Years and over | 0 (0.0%) | 0 (0.0%) |
Disability Class: Ambulatory Difficulty
| Age Bracket | Male | Female |
| 5 to 17 Years | 0 (0.0%) | 0 (0.0%) |
| 18 to 34 Years | 0 (0.0%) | 0 (0.0%) |
| 35 to 64 Years | 0 (0.0%) | 0 (0.0%) |
| 65 to 74 Years | 23 (100.0%) | 0 (0.0%) |
| 75 Years and over | 0 (0.0%) | 0 (0.0%) |
Disability Class: Self-Care Difficulty
| Age Bracket | Male | Female |
| 5 to 17 Years | 0 (0.0%) | 0 (0.0%) |
| 18 to 34 Years | 0 (0.0%) | 0 (0.0%) |
| 35 to 64 Years | 0 (0.0%) | 0 (0.0%) |
| 65 to 74 Years | 0 (0.0%) | 0 (0.0%) |
| 75 Years and over | 0 (0.0%) | 0 (0.0%) |
Technology Access in Depauville
Computing Device Access in Depauville
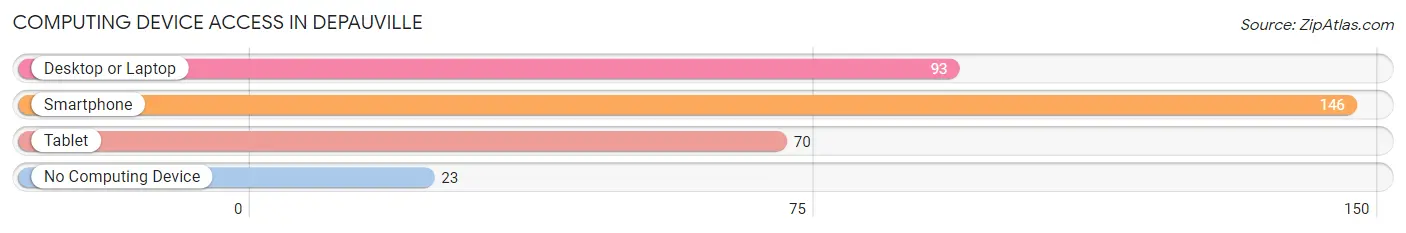
| Device Type | # Households | % Households |
| Desktop or Laptop | 93 | 55.0% |
| Smartphone | 146 | 86.4% |
| Tablet | 70 | 41.4% |
| No Computing Device | 23 | 13.6% |
| Total | 169 | 100.0% |
Internet Access in Depauville
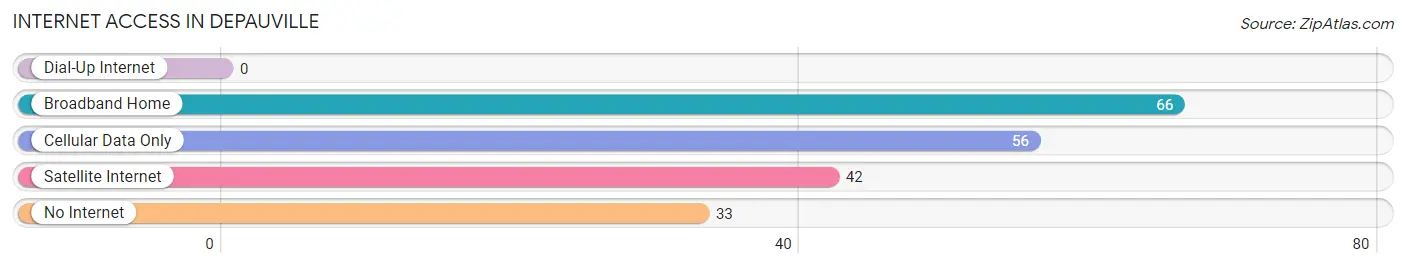
| Internet Type | # Households | % Households |
| Dial-Up Internet | 0 | 0.0% |
| Broadband Home | 66 | 39.1% |
| Cellular Data Only | 56 | 33.1% |
| Satellite Internet | 42 | 24.8% |
| No Internet | 33 | 19.5% |
| Total | 169 | 100.0% |
Depauville Summary
Depauville, NY is a small hamlet located in the town of Clayton, Jefferson County, New York. It is situated on the eastern shore of Lake Ontario, approximately 20 miles north of Watertown. The hamlet is home to a population of approximately 500 people, and is a popular destination for tourists and outdoor enthusiasts.
History
Depauville was first settled in 1802 by a group of French-Canadian immigrants led by Jean-Baptiste Depau. The hamlet was named after him, and the area was originally known as Depau’s Mills. The hamlet was officially incorporated in 1845, and the first post office was established in 1848.
In the late 19th century, Depauville was a thriving community with a variety of businesses, including a sawmill, gristmill, and a tannery. The hamlet was also home to a number of churches, including the First Presbyterian Church, which was established in 1845.
Geography
Depauville is located in the town of Clayton, Jefferson County, New York. It is situated on the eastern shore of Lake Ontario, approximately 20 miles north of Watertown. The hamlet is bordered by the Black River to the east, and the St. Lawrence River to the west.
The terrain of Depauville is mostly flat, with some rolling hills. The hamlet is located in a temperate climate, with warm summers and cold winters. The average annual temperature is around 50 degrees Fahrenheit.
Economy
The economy of Depauville is largely based on tourism and outdoor recreation. The hamlet is home to a number of popular attractions, including the Depauville Marina, which offers boat rentals and fishing charters. The hamlet is also home to a number of restaurants, shops, and other businesses.
The hamlet is also home to a number of small businesses, including a sawmill, gristmill, and a tannery. These businesses provide employment opportunities for the local population.
Demographics
As of the 2010 census, the population of Depauville was 498. The racial makeup of the hamlet was 97.2% White, 0.6% African American, 0.2% Native American, 0.2% Asian, 0.2% from other races, and 1.8% from two or more races. Hispanic or Latino of any race were 0.8% of the population.
The median household income in Depauville was $41,250, and the median family income was $45,833. The per capita income for the hamlet was $20,945. About 8.3% of families and 10.2% of the population were below the poverty line, including 14.3% of those under age 18 and 5.3% of those age 65 or over.
Conclusion
Depauville, NY is a small hamlet located in the town of Clayton, Jefferson County, New York. It is situated on the eastern shore of Lake Ontario, approximately 20 miles north of Watertown. The hamlet is home to a population of approximately 500 people, and is a popular destination for tourists and outdoor enthusiasts. The economy of Depauville is largely based on tourism and outdoor recreation, and the hamlet is home to a number of small businesses. The racial makeup of the hamlet is predominantly White, with a small percentage of African American, Native American, and Asian residents. The median household income in Depauville is $41,250, and the per capita income is $20,945.
Common Questions
What is Per Capita Income in Depauville?
Per Capita income in Depauville is $29,046.
What is the Median Family Income in Depauville?
Median Family Income in Depauville is $86,071.
What is Inequality or Gini Index in Depauville?
Inequality or Gini Index in Depauville is 0.29.
What is the Total Population of Depauville?
Total Population of Depauville is 388.
What is the Total Male Population of Depauville?
Total Male Population of Depauville is 230.
What is the Total Female Population of Depauville?
Total Female Population of Depauville is 158.
What is the Ratio of Males per 100 Females in Depauville?
There are 145.57 Males per 100 Females in Depauville.
What is the Ratio of Females per 100 Males in Depauville?
There are 68.70 Females per 100 Males in Depauville.
What is the Median Population Age in Depauville?
Median Population Age in Depauville is 48.7 Years.
What is the Average Family Size in Depauville
Average Family Size in Depauville is 2.9 People.
What is the Average Household Size in Depauville
Average Household Size in Depauville is 2.3 People.
How Large is the Labor Force in Depauville?
There are 217 People in the Labor Forcein in Depauville.
What is the Percentage of People in the Labor Force in Depauville?
70.2% of People are in the Labor Force in Depauville.
What is the Unemployment Rate in Depauville?
Unemployment Rate in Depauville is 30.4%.