Elma Center, NY Map & Demographics
Elma Center Map
Elma Center Overview
$73,497
PER CAPITA INCOME
$114,019
AVG FAMILY INCOME
$102,159
AVG HOUSEHOLD INCOME
30.9%
WAGE / INCOME GAP [ % ]
69.1¢/ $1
WAGE / INCOME GAP [ $ ]
0.58
INEQUALITY / GINI INDEX
3,434
TOTAL POPULATION
1,925
MALE POPULATION
1,509
FEMALE POPULATION
127.57
MALES / 100 FEMALES
78.39
FEMALES / 100 MALES
40.4
MEDIAN AGE
3.3
AVG FAMILY SIZE
2.7
AVG HOUSEHOLD SIZE
1,450
LABOR FORCE [ PEOPLE ]
56.7%
PERCENT IN LABOR FORCE
5.6%
UNEMPLOYMENT RATE
Income in Elma Center
Income Overview in Elma Center
Per Capita Income in Elma Center is $73,497, while median incomes of families and households are $114,019 and $102,159 respectively.
| Characteristic | Number | Measure |
| Per Capita Income | 3,434 | $73,497 |
| Median Family Income | 899 | $114,019 |
| Mean Family Income | 899 | $235,866 |
| Median Household Income | 1,268 | $102,159 |
| Mean Household Income | 1,268 | $184,132 |
| Income Deficit | 899 | $0 |
| Wage / Income Gap (%) | 3,434 | 30.85% |
| Wage / Income Gap ($) | 3,434 | 69.15¢ per $1 |
| Gini / Inequality Index | 3,434 | 0.58 |
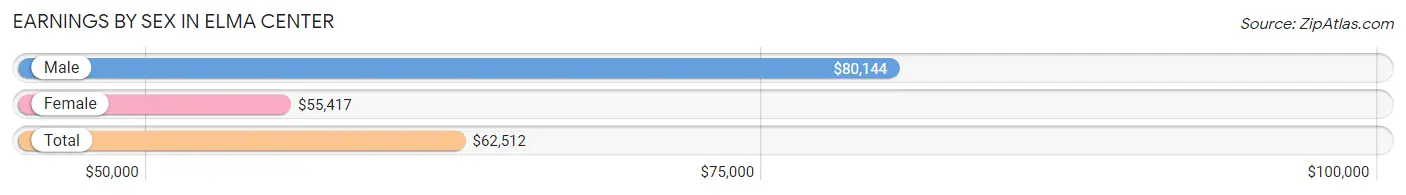
Earnings by Sex in Elma Center
Average Earnings in Elma Center are $62,512, $80,144 for men and $55,417 for women, a difference of 30.8%.
| Sex | Number | Average Earnings |
| Male | 849 (55.9%) | $80,144 |
| Female | 670 (44.1%) | $55,417 |
| Total | 1,519 (100.0%) | $62,512 |
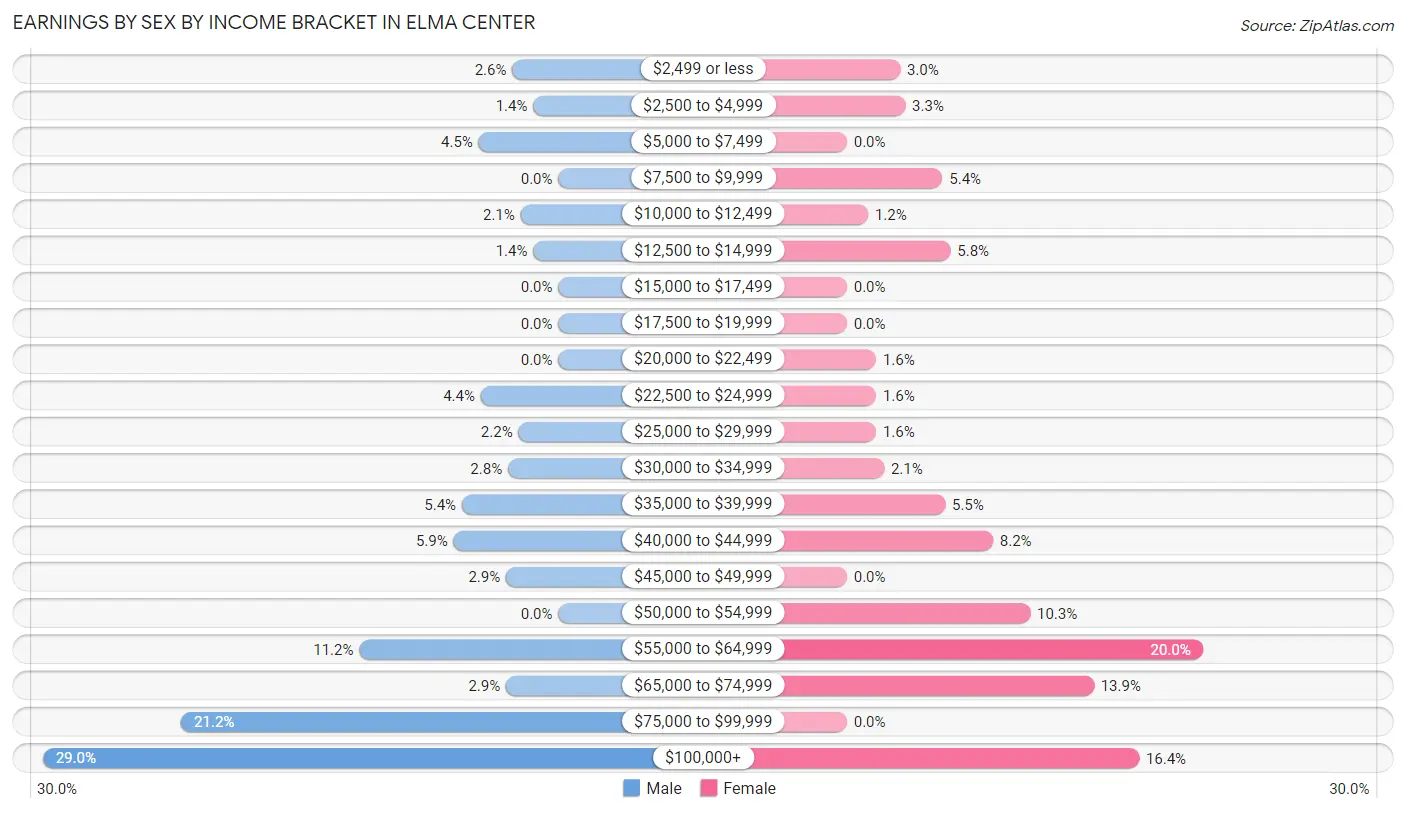
Earnings by Sex by Income Bracket in Elma Center
The most common earnings brackets in Elma Center are $100,000+ for men (246 | 29.0%) and $55,000 to $64,999 for women (134 | 20.0%).
| Income | Male | Female |
| $2,499 or less | 22 (2.6%) | 20 (3.0%) |
| $2,500 to $4,999 | 12 (1.4%) | 22 (3.3%) |
| $5,000 to $7,499 | 38 (4.5%) | 0 (0.0%) |
| $7,500 to $9,999 | 0 (0.0%) | 36 (5.4%) |
| $10,000 to $12,499 | 18 (2.1%) | 8 (1.2%) |
| $12,500 to $14,999 | 12 (1.4%) | 39 (5.8%) |
| $15,000 to $17,499 | 0 (0.0%) | 0 (0.0%) |
| $17,500 to $19,999 | 0 (0.0%) | 0 (0.0%) |
| $20,000 to $22,499 | 0 (0.0%) | 11 (1.6%) |
| $22,500 to $24,999 | 37 (4.4%) | 11 (1.6%) |
| $25,000 to $29,999 | 19 (2.2%) | 11 (1.6%) |
| $30,000 to $34,999 | 24 (2.8%) | 14 (2.1%) |
| $35,000 to $39,999 | 46 (5.4%) | 37 (5.5%) |
| $40,000 to $44,999 | 50 (5.9%) | 55 (8.2%) |
| $45,000 to $49,999 | 25 (2.9%) | 0 (0.0%) |
| $50,000 to $54,999 | 0 (0.0%) | 69 (10.3%) |
| $55,000 to $64,999 | 95 (11.2%) | 134 (20.0%) |
| $65,000 to $74,999 | 25 (2.9%) | 93 (13.9%) |
| $75,000 to $99,999 | 180 (21.2%) | 0 (0.0%) |
| $100,000+ | 246 (29.0%) | 110 (16.4%) |
| Total | 849 (100.0%) | 670 (100.0%) |
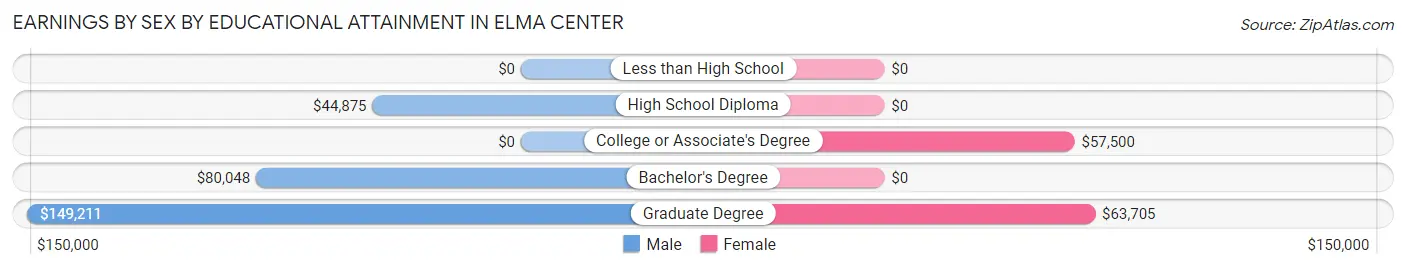
Earnings by Sex by Educational Attainment in Elma Center
Average earnings in Elma Center are $81,875 for men and $57,500 for women, a difference of 29.8%. Men with an educational attainment of graduate degree enjoy the highest average annual earnings of $149,211, while those with high school diploma education earn the least with $44,875. Women with an educational attainment of graduate degree earn the most with the average annual earnings of $63,705, while those with college or associate's degree education have the smallest earnings of $57,500.
| Educational Attainment | Male Income | Female Income |
| Less than High School | - | - |
| High School Diploma | $44,875 | $0 |
| College or Associate's Degree | - | - |
| Bachelor's Degree | $80,048 | $0 |
| Graduate Degree | $149,211 | $63,705 |
| Total | $81,875 | $57,500 |
Family Income in Elma Center
Family Income Brackets in Elma Center
According to the Elma Center family income data, there are 271 families falling into the $100,000 to $149,999 income range, which is the most common income bracket and makes up 30.1% of all families.
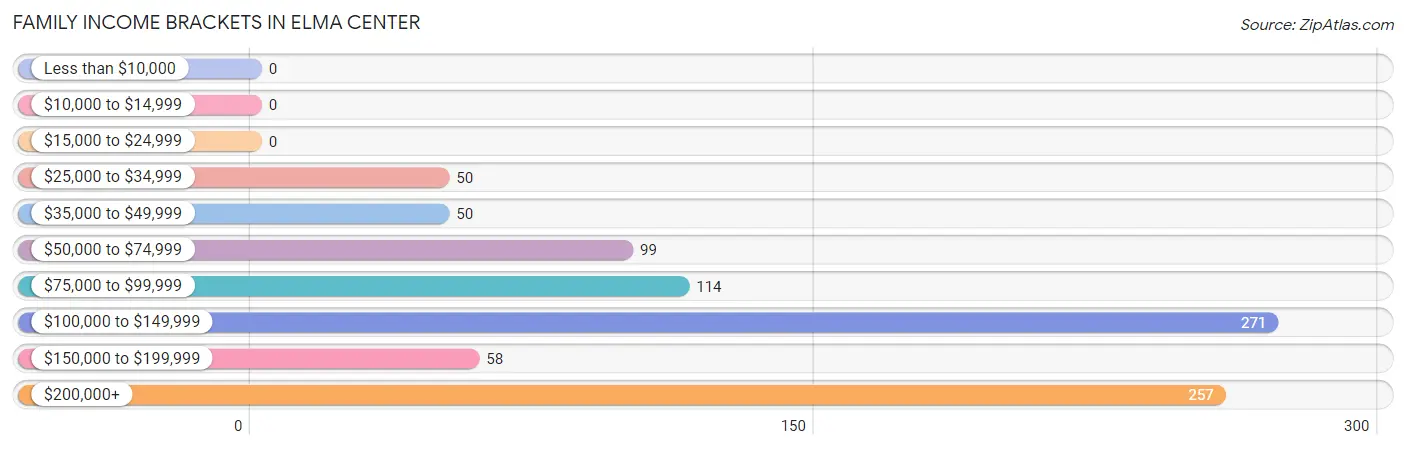
| Income Bracket | # Families | % Families |
| Less than $10,000 | 0 | 0.0% |
| $10,000 to $14,999 | 0 | 0.0% |
| $15,000 to $24,999 | 0 | 0.0% |
| $25,000 to $34,999 | 50 | 5.6% |
| $35,000 to $49,999 | 50 | 5.6% |
| $50,000 to $74,999 | 99 | 11.0% |
| $75,000 to $99,999 | 114 | 12.7% |
| $100,000 to $149,999 | 271 | 30.1% |
| $150,000 to $199,999 | 58 | 6.5% |
| $200,000+ | 257 | 28.6% |
Family Income by Famaliy Size in Elma Center
3-person families (179 | 19.9%) account for the highest median family income in Elma Center with $148,417 per family, while 2-person families (397 | 44.2%) have the highest median income of $52,098 per family member.
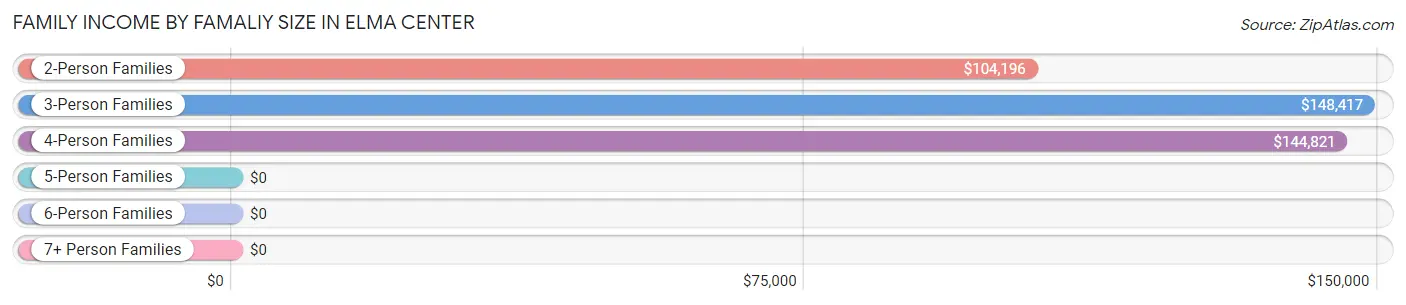
| Income Bracket | # Families | Median Income |
| 2-Person Families | 397 (44.2%) | $104,196 |
| 3-Person Families | 179 (19.9%) | $148,417 |
| 4-Person Families | 198 (22.0%) | $144,821 |
| 5-Person Families | 31 (3.5%) | $0 |
| 6-Person Families | 94 (10.5%) | $0 |
| 7+ Person Families | 0 (0.0%) | $0 |
| Total | 899 (100.0%) | $114,019 |
Family Income by Number of Earners in Elma Center
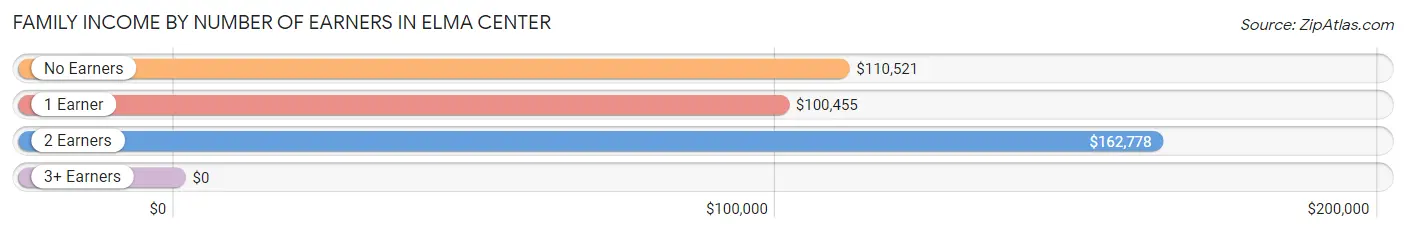
| Number of Earners | # Families | Median Income |
| No Earners | 129 (14.3%) | $110,521 |
| 1 Earner | 260 (28.9%) | $100,455 |
| 2 Earners | 492 (54.7%) | $162,778 |
| 3+ Earners | 18 (2.0%) | $0 |
| Total | 899 (100.0%) | $114,019 |
Household Income in Elma Center
Household Income Brackets in Elma Center
With 314 households falling in the category, the $100,000 to $149,999 income range is the most frequent in Elma Center, accounting for 24.8% of all households. In contrast, only 15 households (1.2%) fall into the $10,000 to $14,999 income bracket, making it the least populous group.
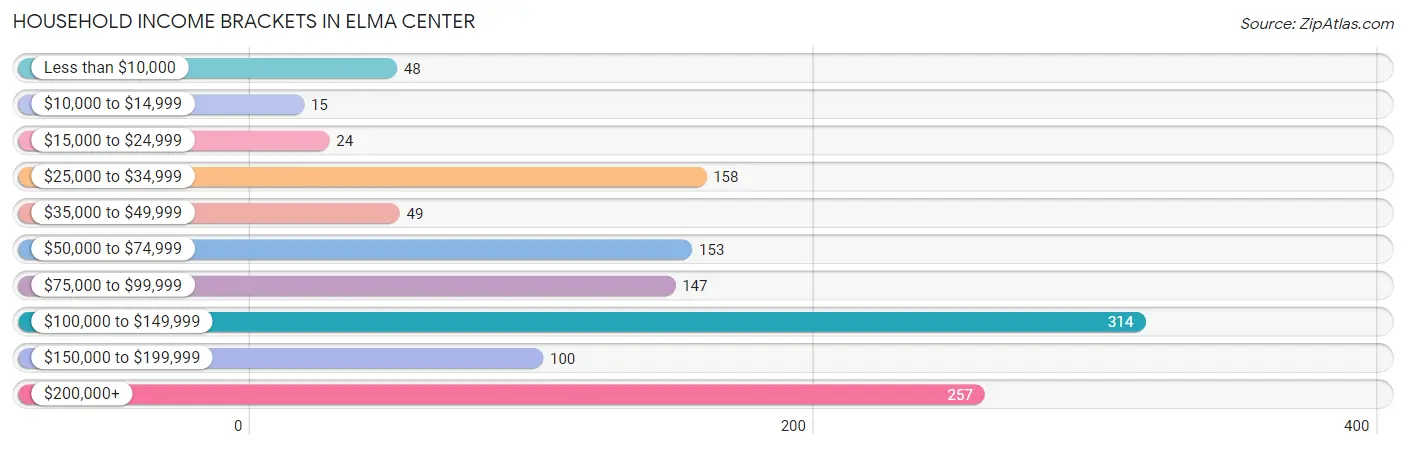
| Income Bracket | # Households | % Households |
| Less than $10,000 | 48 | 3.8% |
| $10,000 to $14,999 | 15 | 1.2% |
| $15,000 to $24,999 | 24 | 1.9% |
| $25,000 to $34,999 | 158 | 12.5% |
| $35,000 to $49,999 | 49 | 3.9% |
| $50,000 to $74,999 | 153 | 12.1% |
| $75,000 to $99,999 | 147 | 11.6% |
| $100,000 to $149,999 | 314 | 24.8% |
| $150,000 to $199,999 | 100 | 7.9% |
| $200,000+ | 257 | 20.3% |
Household Income by Householder Age in Elma Center
The median household income in Elma Center is $102,159, with the highest median household income of $148,293 found in the 25 to 44 years age bracket for the primary householder. A total of 409 households (32.3%) fall into this category.
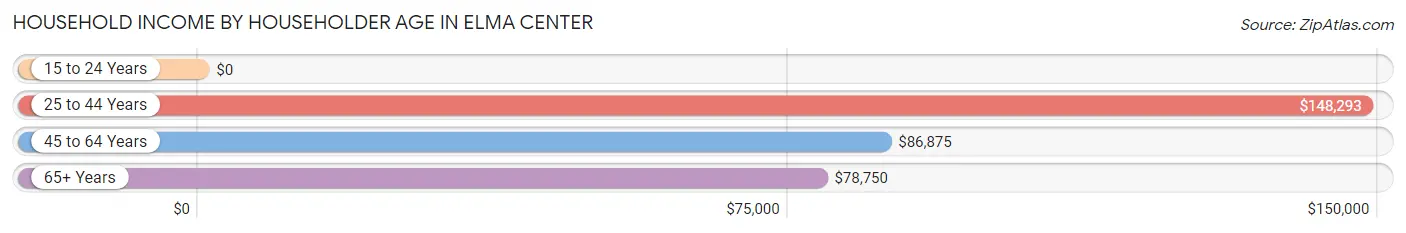
| Income Bracket | # Households | Median Income |
| 15 to 24 Years | 0 (0.0%) | $0 |
| 25 to 44 Years | 409 (32.3%) | $148,293 |
| 45 to 64 Years | 271 (21.4%) | $86,875 |
| 65+ Years | 588 (46.4%) | $78,750 |
| Total | 1,268 (100.0%) | $102,159 |
Poverty in Elma Center
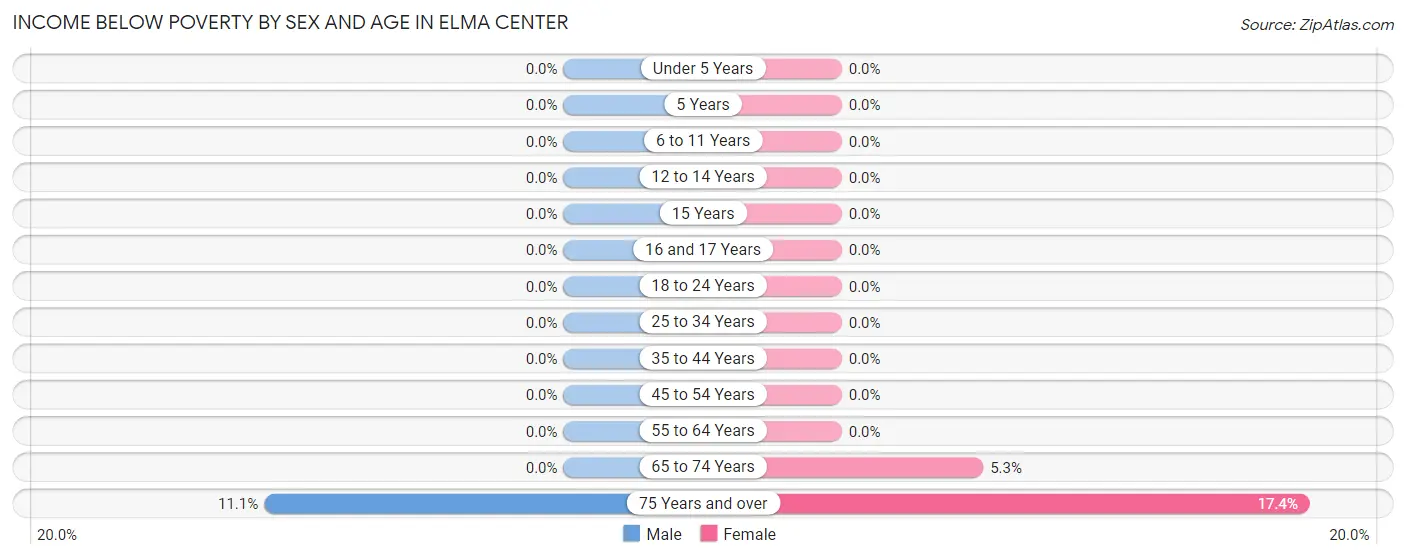
Income Below Poverty by Sex and Age in Elma Center
With 1.0% poverty level for males and 3.4% for females among the residents of Elma Center, 75 year old and over males and 75 year old and over females are the most vulnerable to poverty, with 20 males (11.1%) and 33 females (17.4%) in their respective age groups living below the poverty level.
| Age Bracket | Male | Female |
| Under 5 Years | 0 (0.0%) | 0 (0.0%) |
| 5 Years | 0 (0.0%) | 0 (0.0%) |
| 6 to 11 Years | 0 (0.0%) | 0 (0.0%) |
| 12 to 14 Years | 0 (0.0%) | 0 (0.0%) |
| 15 Years | 0 (0.0%) | 0 (0.0%) |
| 16 and 17 Years | 0 (0.0%) | 0 (0.0%) |
| 18 to 24 Years | 0 (0.0%) | 0 (0.0%) |
| 25 to 34 Years | 0 (0.0%) | 0 (0.0%) |
| 35 to 44 Years | 0 (0.0%) | 0 (0.0%) |
| 45 to 54 Years | 0 (0.0%) | 0 (0.0%) |
| 55 to 64 Years | 0 (0.0%) | 0 (0.0%) |
| 65 to 74 Years | 0 (0.0%) | 18 (5.2%) |
| 75 Years and over | 20 (11.1%) | 33 (17.4%) |
| Total | 20 (1.0%) | 51 (3.4%) |
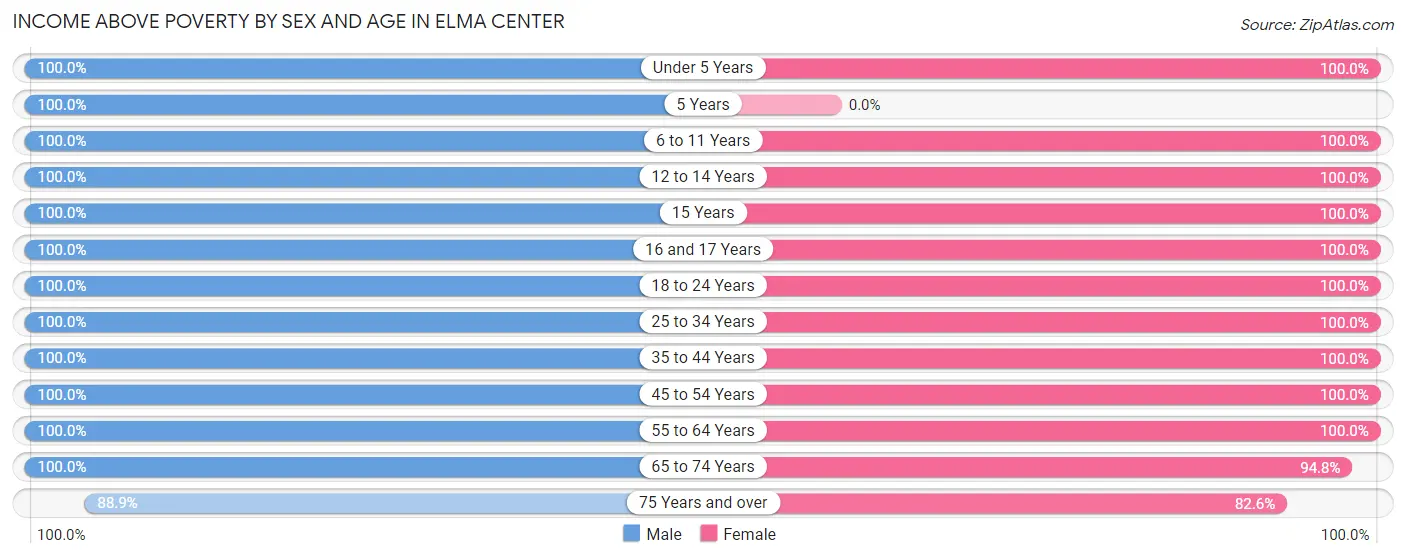
Income Above Poverty by Sex and Age in Elma Center
According to the poverty statistics in Elma Center, males aged under 5 years and females aged under 5 years are the age groups that are most secure financially, with 100.0% of males and 100.0% of females in these age groups living above the poverty line.
| Age Bracket | Male | Female |
| Under 5 Years | 245 (100.0%) | 172 (100.0%) |
| 5 Years | 33 (100.0%) | 0 (0.0%) |
| 6 to 11 Years | 315 (100.0%) | 15 (100.0%) |
| 12 to 14 Years | 42 (100.0%) | 23 (100.0%) |
| 15 Years | 23 (100.0%) | 8 (100.0%) |
| 16 and 17 Years | 59 (100.0%) | 23 (100.0%) |
| 18 to 24 Years | 76 (100.0%) | 45 (100.0%) |
| 25 to 34 Years | 195 (100.0%) | 169 (100.0%) |
| 35 to 44 Years | 221 (100.0%) | 276 (100.0%) |
| 45 to 54 Years | 155 (100.0%) | 86 (100.0%) |
| 55 to 64 Years | 141 (100.0%) | 159 (100.0%) |
| 65 to 74 Years | 240 (100.0%) | 325 (94.8%) |
| 75 Years and over | 160 (88.9%) | 157 (82.6%) |
| Total | 1,905 (99.0%) | 1,458 (96.6%) |
Income Below Poverty Among Married-Couple Families in Elma Center
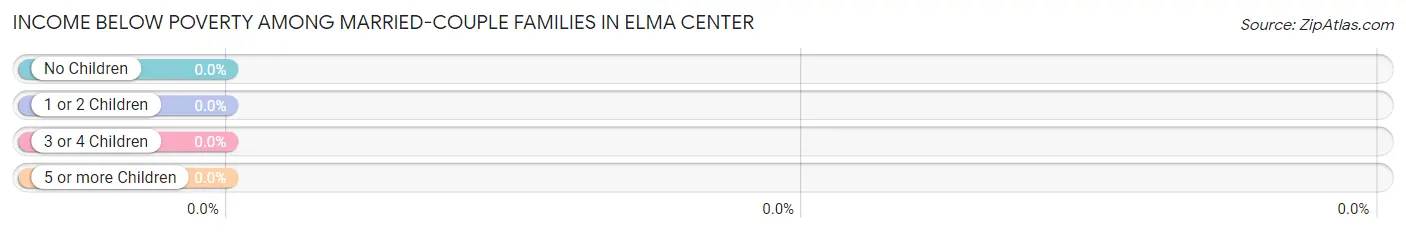
| Children | Above Poverty | Below Poverty |
| No Children | 443 (100.0%) | 0 (0.0%) |
| 1 or 2 Children | 220 (100.0%) | 0 (0.0%) |
| 3 or 4 Children | 125 (100.0%) | 0 (0.0%) |
| 5 or more Children | 0 (0.0%) | 0 (0.0%) |
| Total | 788 (100.0%) | 0 (0.0%) |
Income Below Poverty Among Single-Parent Households in Elma Center
| Children | Single Father | Single Mother |
| No Children | 0 (0.0%) | 0 (0.0%) |
| 1 or 2 Children | 0 (0.0%) | 0 (0.0%) |
| 3 or 4 Children | 0 (0.0%) | 0 (0.0%) |
| 5 or more Children | 0 (0.0%) | 0 (0.0%) |
| Total | 0 (0.0%) | 0 (0.0%) |
Income Below Poverty Among Married-Couple vs Single-Parent Households in Elma Center
| Children | Married-Couple Families | Single-Parent Households |
| No Children | 0 (0.0%) | 0 (0.0%) |
| 1 or 2 Children | 0 (0.0%) | 0 (0.0%) |
| 3 or 4 Children | 0 (0.0%) | 0 (0.0%) |
| 5 or more Children | 0 (0.0%) | 0 (0.0%) |
| Total | 0 (0.0%) | 0 (0.0%) |
Race in Elma Center
The most populous races in Elma Center are White / Caucasian (3,429 | 99.9%), and Black / African American (5 | 0.2%).
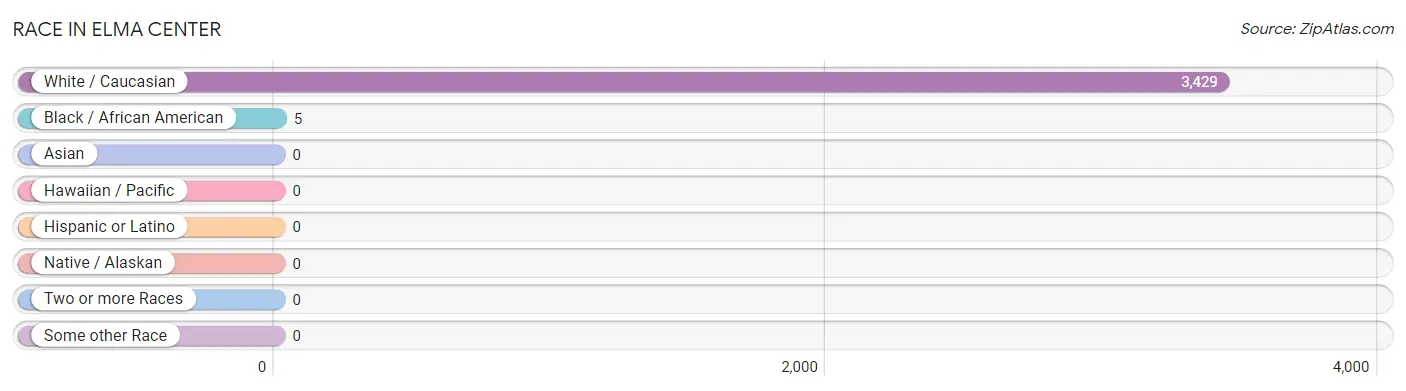
| Race | # Population | % Population |
| Asian | 0 | 0.0% |
| Black / African American | 5 | 0.2% |
| Hawaiian / Pacific | 0 | 0.0% |
| Hispanic or Latino | 0 | 0.0% |
| Native / Alaskan | 0 | 0.0% |
| White / Caucasian | 3,429 | 99.9% |
| Two or more Races | 0 | 0.0% |
| Some other Race | 0 | 0.0% |
| Total | 3,434 | 100.0% |
Ancestry in Elma Center
The most populous ancestries reported in Elma Center are German (1,503 | 43.8%), Polish (1,171 | 34.1%), Italian (1,031 | 30.0%), Irish (558 | 16.3%), and English (370 | 10.8%), together accounting for 134.9% of all Elma Center residents.
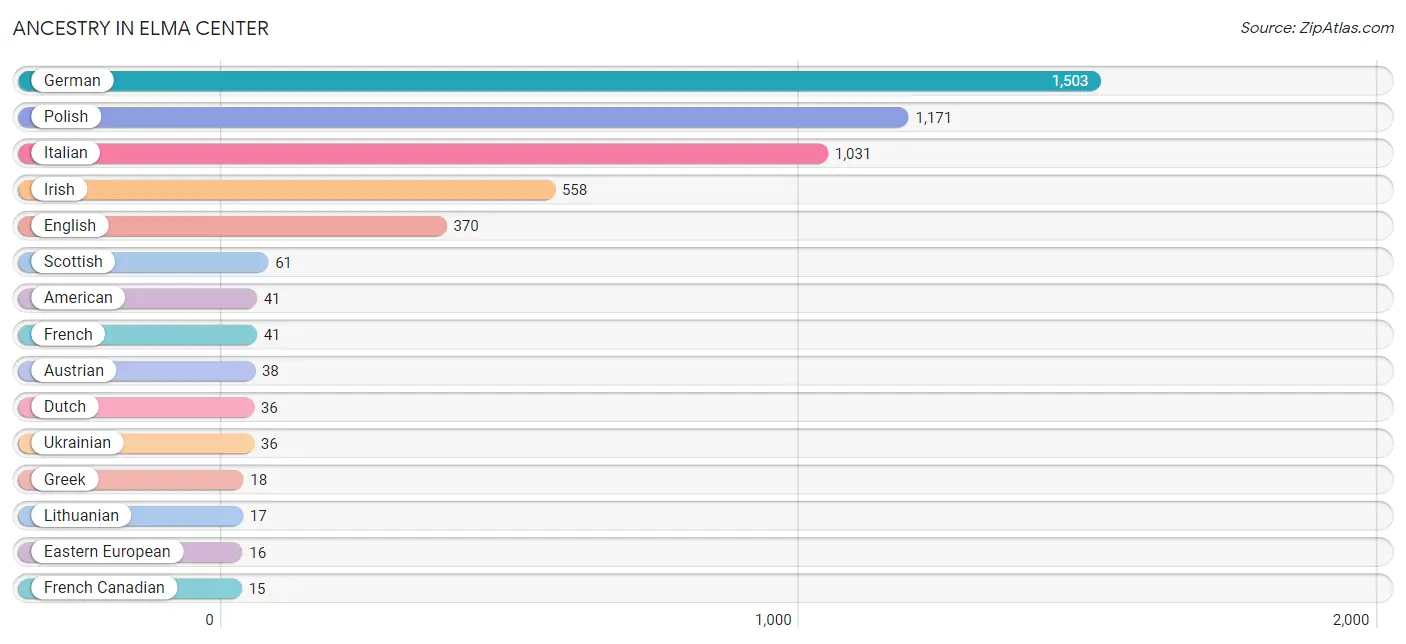
| Ancestry | # Population | % Population |
| American | 41 | 1.2% |
| Armenian | 9 | 0.3% |
| Austrian | 38 | 1.1% |
| Dutch | 36 | 1.1% |
| Eastern European | 16 | 0.5% |
| English | 370 | 10.8% |
| French | 41 | 1.2% |
| French Canadian | 15 | 0.4% |
| German | 1,503 | 43.8% |
| Greek | 18 | 0.5% |
| Irish | 558 | 16.3% |
| Italian | 1,031 | 30.0% |
| Lithuanian | 17 | 0.5% |
| Polish | 1,171 | 34.1% |
| Russian | 12 | 0.4% |
| Scottish | 61 | 1.8% |
| Ukrainian | 36 | 1.1% |
| Yugoslavian | 14 | 0.4% | View All 18 Rows |
Immigrants in Elma Center
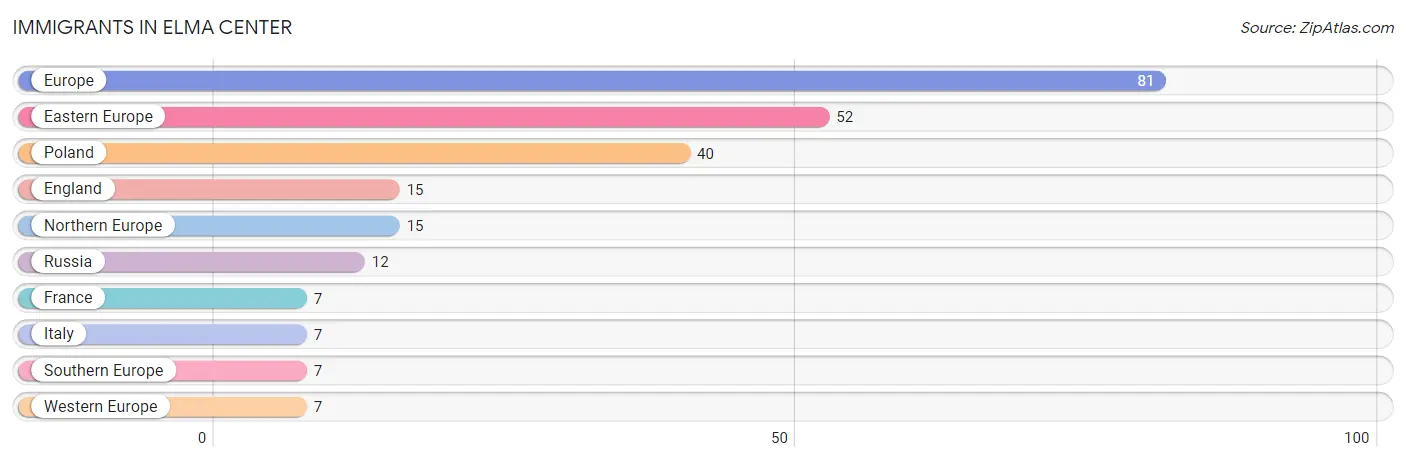
The most numerous immigrant groups reported in Elma Center came from Europe (81 | 2.4%), Eastern Europe (52 | 1.5%), Poland (40 | 1.2%), England (15 | 0.4%), and Northern Europe (15 | 0.4%), together accounting for 5.9% of all Elma Center residents.
| Immigration Origin | # Population | % Population |
| Eastern Europe | 52 | 1.5% |
| England | 15 | 0.4% |
| Europe | 81 | 2.4% |
| France | 7 | 0.2% |
| Italy | 7 | 0.2% |
| Northern Europe | 15 | 0.4% |
| Poland | 40 | 1.2% |
| Russia | 12 | 0.4% |
| Southern Europe | 7 | 0.2% |
| Western Europe | 7 | 0.2% | View All 10 Rows |
Sex and Age in Elma Center
Sex and Age in Elma Center
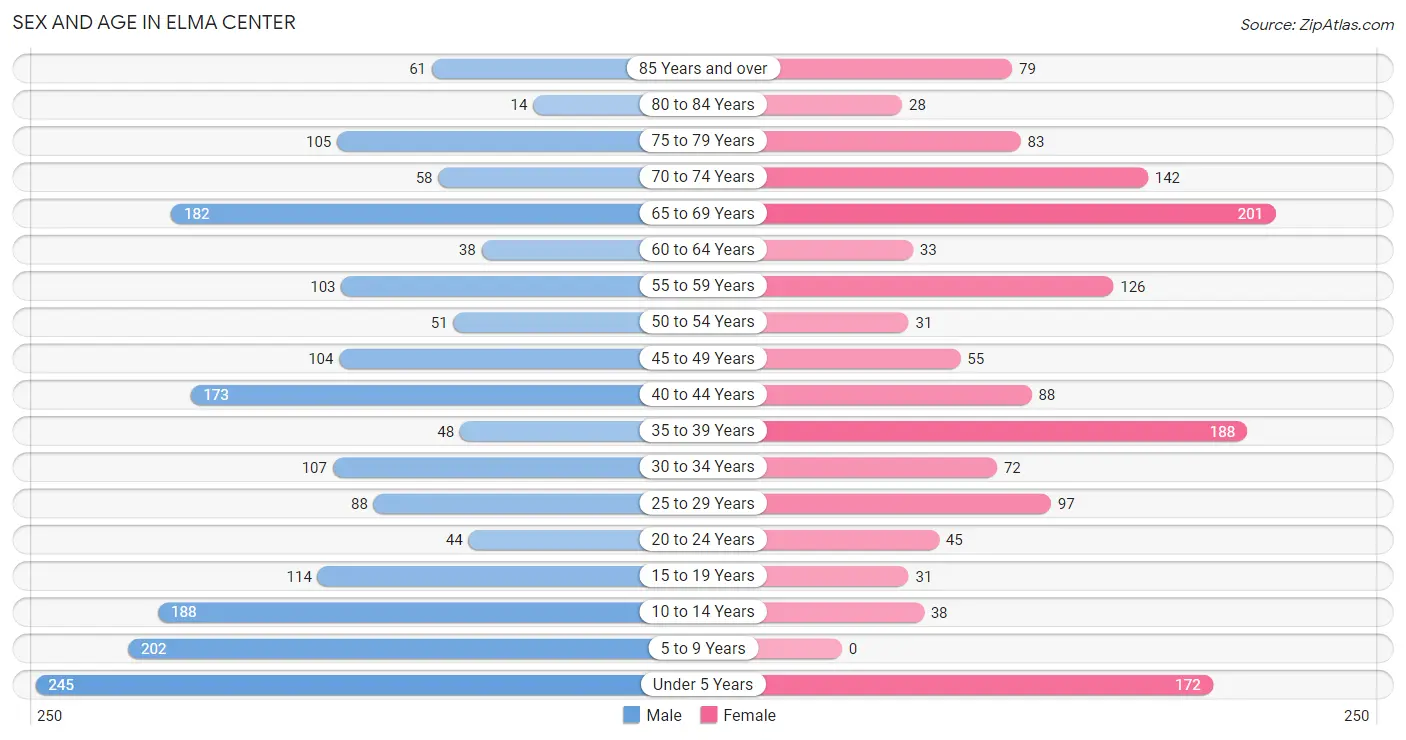
The most populous age groups in Elma Center are Under 5 Years (245 | 12.7%) for men and 65 to 69 Years (201 | 13.3%) for women.
| Age Bracket | Male | Female |
| Under 5 Years | 245 (12.7%) | 172 (11.4%) |
| 5 to 9 Years | 202 (10.5%) | 0 (0.0%) |
| 10 to 14 Years | 188 (9.8%) | 38 (2.5%) |
| 15 to 19 Years | 114 (5.9%) | 31 (2.1%) |
| 20 to 24 Years | 44 (2.3%) | 45 (3.0%) |
| 25 to 29 Years | 88 (4.6%) | 97 (6.4%) |
| 30 to 34 Years | 107 (5.6%) | 72 (4.8%) |
| 35 to 39 Years | 48 (2.5%) | 188 (12.5%) |
| 40 to 44 Years | 173 (9.0%) | 88 (5.8%) |
| 45 to 49 Years | 104 (5.4%) | 55 (3.6%) |
| 50 to 54 Years | 51 (2.6%) | 31 (2.1%) |
| 55 to 59 Years | 103 (5.3%) | 126 (8.4%) |
| 60 to 64 Years | 38 (2.0%) | 33 (2.2%) |
| 65 to 69 Years | 182 (9.5%) | 201 (13.3%) |
| 70 to 74 Years | 58 (3.0%) | 142 (9.4%) |
| 75 to 79 Years | 105 (5.4%) | 83 (5.5%) |
| 80 to 84 Years | 14 (0.7%) | 28 (1.9%) |
| 85 Years and over | 61 (3.2%) | 79 (5.2%) |
| Total | 1,925 (100.0%) | 1,509 (100.0%) |
Families and Households in Elma Center
Median Family Size in Elma Center
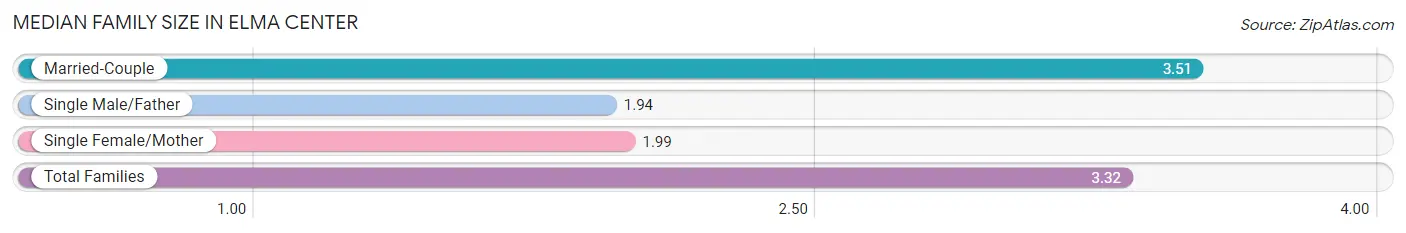
The median family size in Elma Center is 3.32 persons per family, with married-couple families (788 | 87.6%) accounting for the largest median family size of 3.51 persons per family. On the other hand, single male/father families (32 | 3.6%) represent the smallest median family size with 1.94 persons per family.
| Family Type | # Families | Family Size |
| Married-Couple | 788 (87.6%) | 3.51 |
| Single Male/Father | 32 (3.6%) | 1.94 |
| Single Female/Mother | 79 (8.8%) | 1.99 |
| Total Families | 899 (100.0%) | 3.32 |
Median Household Size in Elma Center
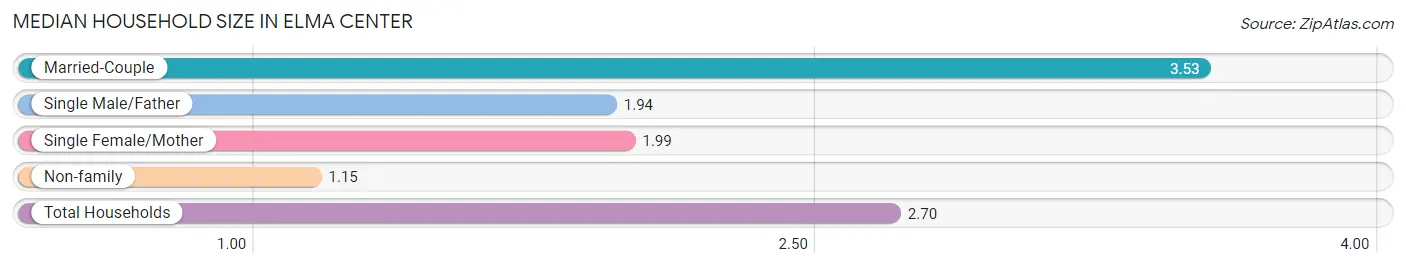
The median household size in Elma Center is 2.70 persons per household, with married-couple households (788 | 62.2%) accounting for the largest median household size of 3.53 persons per household. non-family households (369 | 29.1%) represent the smallest median household size with 1.15 persons per household.
| Household Type | # Households | Household Size |
| Married-Couple | 788 (62.2%) | 3.53 |
| Single Male/Father | 32 (2.5%) | 1.94 |
| Single Female/Mother | 79 (6.2%) | 1.99 |
| Non-family | 369 (29.1%) | 1.15 |
| Total Households | 1,268 (100.0%) | 2.70 |
Household Size by Marriage Status in Elma Center
Out of a total of 1,268 households in Elma Center, 899 (70.9%) are family households, while 369 (29.1%) are nonfamily households. The most numerous type of family households are 2-person households, comprising 397, and the most common type of nonfamily households are 1-person households, comprising 310.
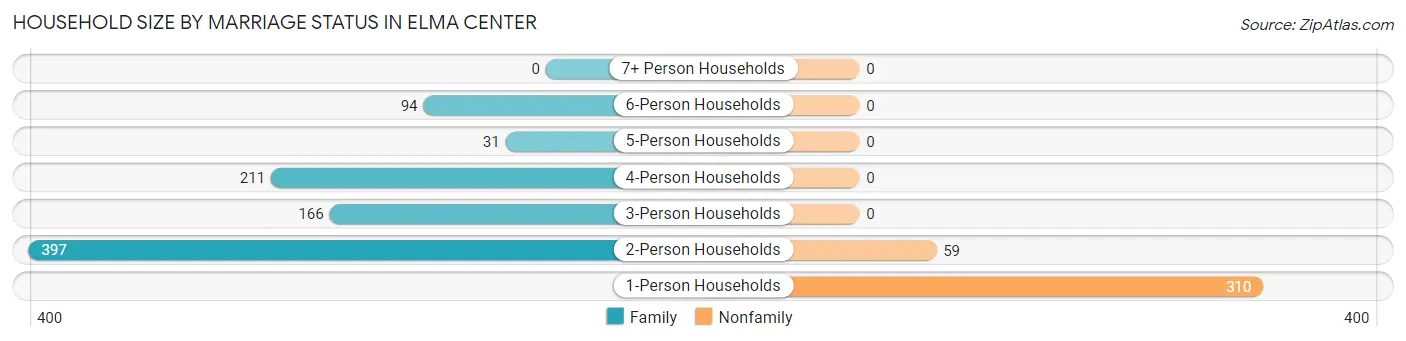
| Household Size | Family Households | Nonfamily Households |
| 1-Person Households | - | 310 (24.4%) |
| 2-Person Households | 397 (31.3%) | 59 (4.6%) |
| 3-Person Households | 166 (13.1%) | 0 (0.0%) |
| 4-Person Households | 211 (16.6%) | 0 (0.0%) |
| 5-Person Households | 31 (2.4%) | 0 (0.0%) |
| 6-Person Households | 94 (7.4%) | 0 (0.0%) |
| 7+ Person Households | 0 (0.0%) | 0 (0.0%) |
| Total | 899 (70.9%) | 369 (29.1%) |
Female Fertility in Elma Center
Fertility by Age in Elma Center
Average fertility rate in Elma Center is 77.0 births per 1,000 women. Women in the age bracket of 20 to 34 years have the highest fertility rate with 210.0 births per 1,000 women. Women in the age bracket of 20 to 34 years acount for 100.0% of all women with births.
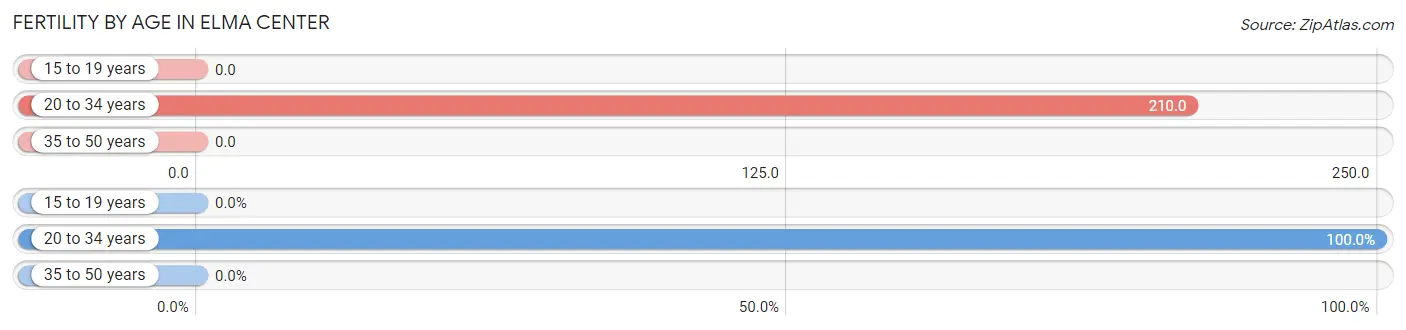
| Age Bracket | Women with Births | Births / 1,000 Women |
| 15 to 19 years | 0 (0.0%) | 0.0 |
| 20 to 34 years | 45 (100.0%) | 210.0 |
| 35 to 50 years | 0 (0.0%) | 0.0 |
| Total | 45 (100.0%) | 77.0 |
Fertility by Age by Marriage Status in Elma Center
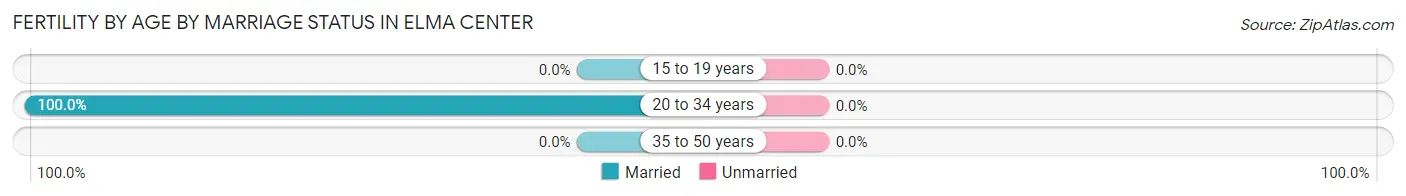
| Age Bracket | Married | Unmarried |
| 15 to 19 years | 0 (0.0%) | 0 (0.0%) |
| 20 to 34 years | 45 (100.0%) | 0 (0.0%) |
| 35 to 50 years | 0 (0.0%) | 0 (0.0%) |
| Total | 45 (100.0%) | 0 (0.0%) |
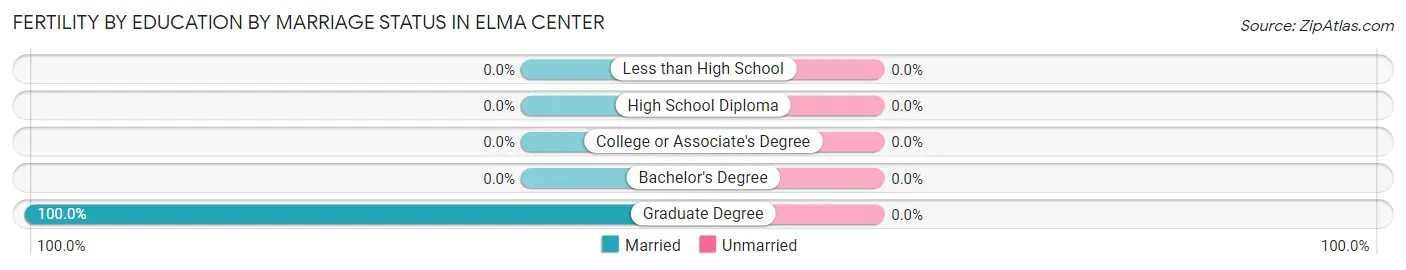
Fertility by Education in Elma Center
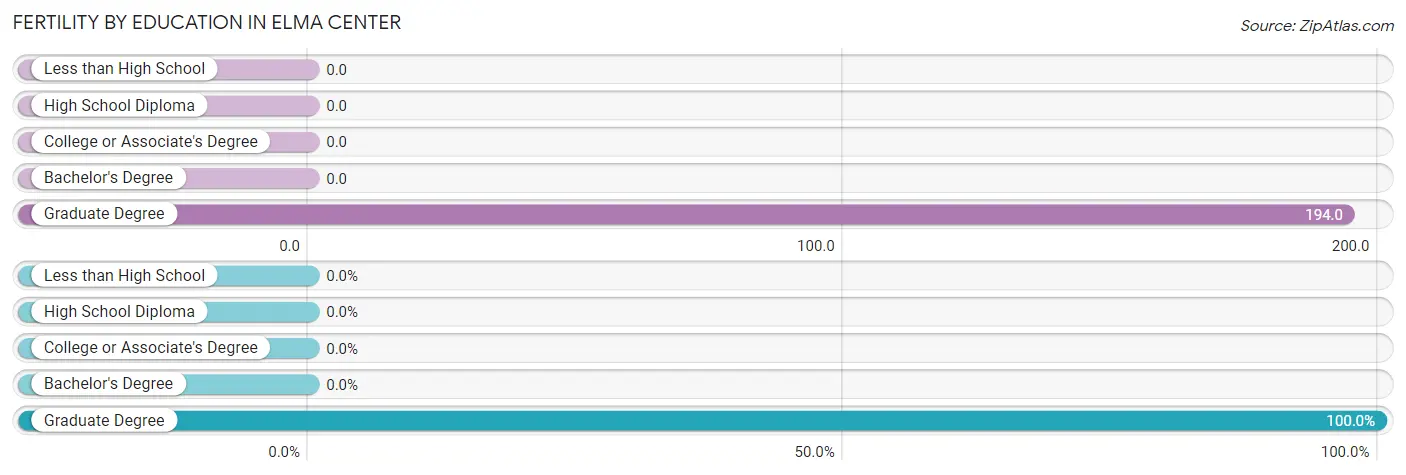
| Educational Attainment | Women with Births | Births / 1,000 Women |
| Less than High School | 0 (0.0%) | 0.0 |
| High School Diploma | 0 (0.0%) | 0.0 |
| College or Associate's Degree | 0 (0.0%) | 0.0 |
| Bachelor's Degree | 0 (0.0%) | 0.0 |
| Graduate Degree | 45 (100.0%) | 194.0 |
| Total | 45 (100.0%) | 77.0 |
Fertility by Education by Marriage Status in Elma Center
| Educational Attainment | Married | Unmarried |
| Less than High School | 0 (0.0%) | 0 (0.0%) |
| High School Diploma | 0 (0.0%) | 0 (0.0%) |
| College or Associate's Degree | 0 (0.0%) | 0 (0.0%) |
| Bachelor's Degree | 0 (0.0%) | 0 (0.0%) |
| Graduate Degree | 45 (100.0%) | 0 (0.0%) |
| Total | 45 (100.0%) | 0 (0.0%) |
Employment Characteristics in Elma Center
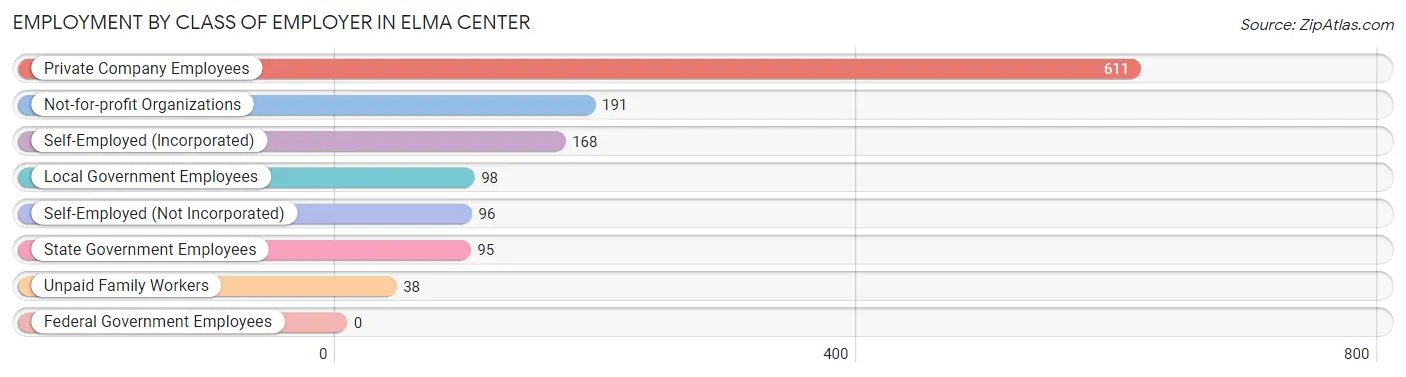
Employment by Class of Employer in Elma Center
Among the 1,297 employed individuals in Elma Center, private company employees (611 | 47.1%), not-for-profit organizations (191 | 14.7%), and self-employed (incorporated) (168 | 13.0%) make up the most common classes of employment.
| Employer Class | # Employees | % Employees |
| Private Company Employees | 611 | 47.1% |
| Self-Employed (Incorporated) | 168 | 13.0% |
| Self-Employed (Not Incorporated) | 96 | 7.4% |
| Not-for-profit Organizations | 191 | 14.7% |
| Local Government Employees | 98 | 7.6% |
| State Government Employees | 95 | 7.3% |
| Federal Government Employees | 0 | 0.0% |
| Unpaid Family Workers | 38 | 2.9% |
| Total | 1,297 | 100.0% |
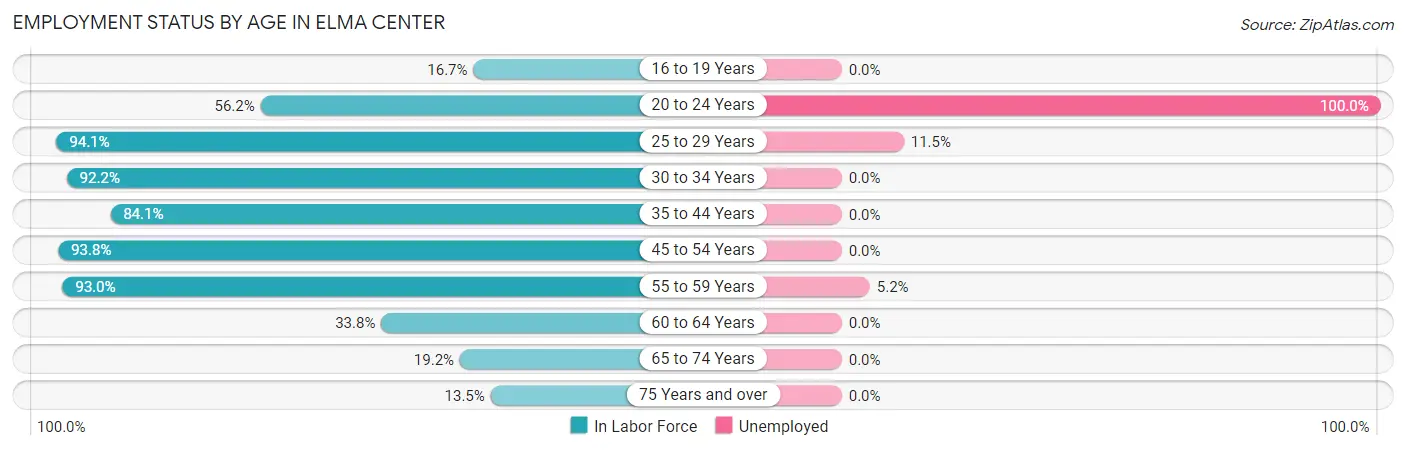
Employment Status by Age in Elma Center
According to the labor force statistics for Elma Center, out of the total population over 16 years of age (2,558), 56.7% or 1,450 individuals are in the labor force, with 5.6% or 81 of them unemployed. The age group with the highest labor force participation rate is 25 to 29 years, with 94.1% or 174 individuals in the labor force. Within the labor force, the 20 to 24 years age range has the highest percentage of unemployed individuals, with 100.0% or 50 of them being unemployed.
| Age Bracket | In Labor Force | Unemployed |
| 16 to 19 Years | 19 (16.7%) | 0 (0.0%) |
| 20 to 24 Years | 50 (56.2%) | 50 (100.0%) |
| 25 to 29 Years | 174 (94.1%) | 20 (11.5%) |
| 30 to 34 Years | 165 (92.2%) | 0 (0.0%) |
| 35 to 44 Years | 418 (84.1%) | 0 (0.0%) |
| 45 to 54 Years | 226 (93.8%) | 0 (0.0%) |
| 55 to 59 Years | 213 (93.0%) | 11 (5.2%) |
| 60 to 64 Years | 24 (33.8%) | 0 (0.0%) |
| 65 to 74 Years | 112 (19.2%) | 0 (0.0%) |
| 75 Years and over | 50 (13.5%) | 0 (0.0%) |
| Total | 1,450 (56.7%) | 81 (5.6%) |
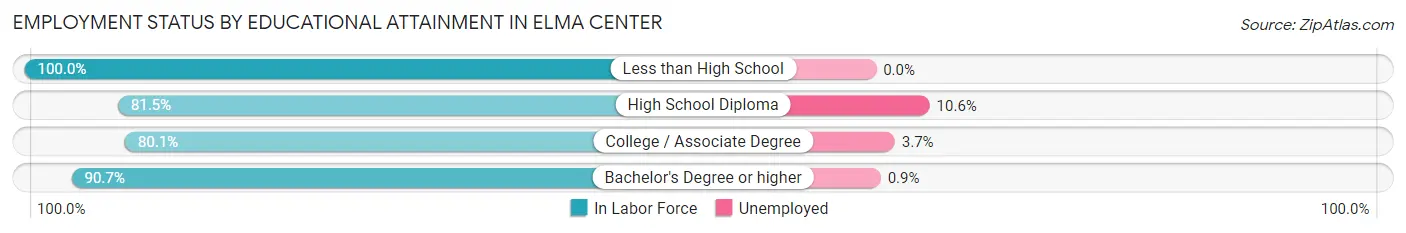
Employment Status by Educational Attainment in Elma Center
According to labor force statistics for Elma Center, 87.0% of individuals (1,220) out of the total population between 25 and 64 years of age (1,402) are in the labor force, with 2.5% or 30 of them being unemployed. The group with the highest labor force participation rate are those with the educational attainment of less than high school, with 100.0% or 16 individuals in the labor force. Within the labor force, individuals with high school diploma education have the highest percentage of unemployment, with 10.6% or 13 of them being unemployed.
| Educational Attainment | In Labor Force | Unemployed |
| Less than High School | 16 (100.0%) | 0 (0.0%) |
| High School Diploma | 123 (81.5%) | 16 (10.6%) |
| College / Associate Degree | 294 (80.1%) | 14 (3.7%) |
| Bachelor's Degree or higher | 787 (90.7%) | 8 (0.9%) |
| Total | 1,220 (87.0%) | 35 (2.5%) |
Employment Occupations by Sex in Elma Center
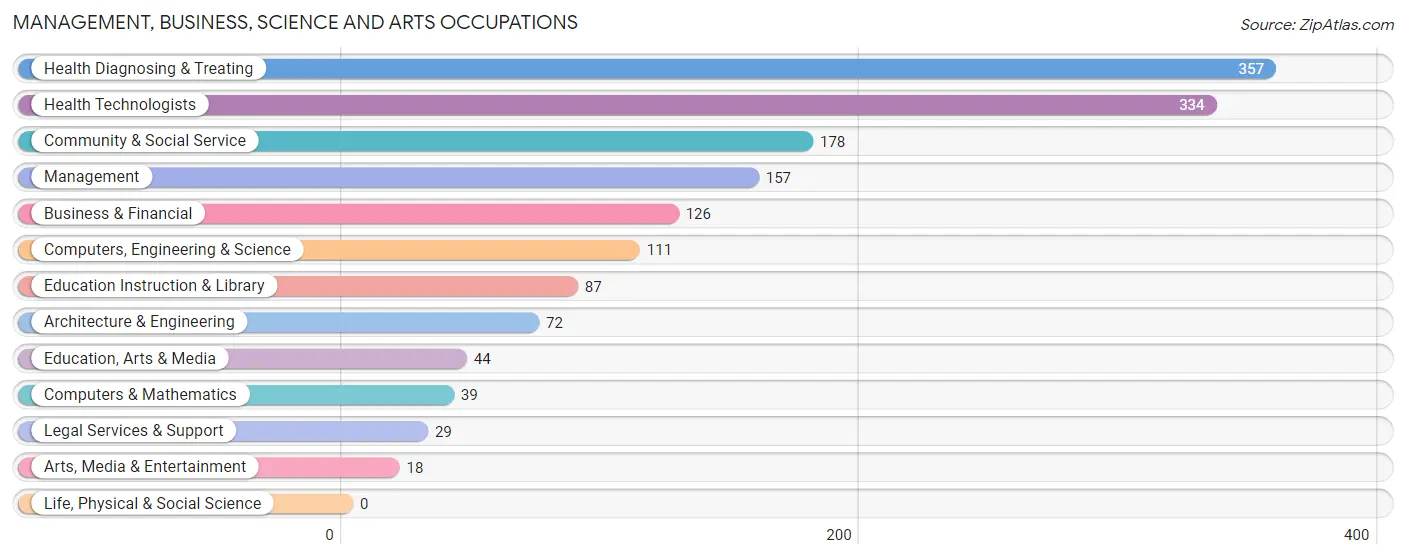
Management, Business, Science and Arts Occupations
The most common Management, Business, Science and Arts occupations in Elma Center are Health Diagnosing & Treating (357 | 26.1%), Health Technologists (334 | 24.4%), Community & Social Service (178 | 13.0%), Management (157 | 11.5%), and Business & Financial (126 | 9.2%).
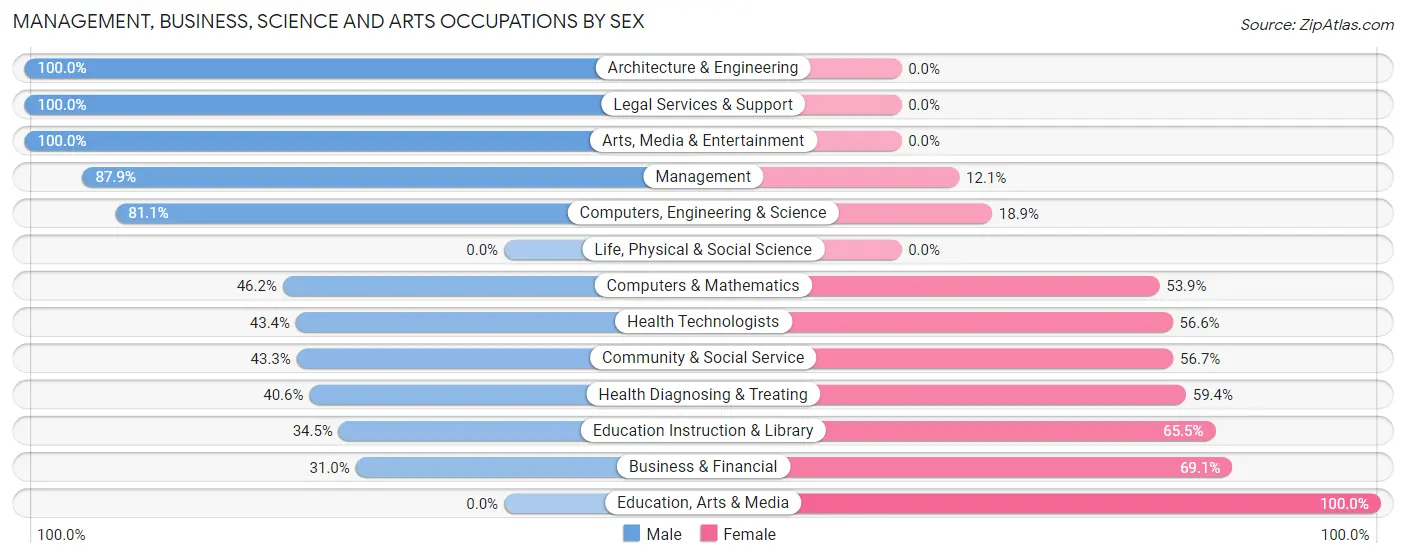
Management, Business, Science and Arts Occupations by Sex
Within the Management, Business, Science and Arts occupations in Elma Center, the most male-oriented occupations are Architecture & Engineering (100.0%), Legal Services & Support (100.0%), and Arts, Media & Entertainment (100.0%), while the most female-oriented occupations are Education, Arts & Media (100.0%), Business & Financial (69.1%), and Education Instruction & Library (65.5%).
| Occupation | Male | Female |
| Management | 138 (87.9%) | 19 (12.1%) |
| Business & Financial | 39 (30.9%) | 87 (69.1%) |
| Computers, Engineering & Science | 90 (81.1%) | 21 (18.9%) |
| Computers & Mathematics | 18 (46.2%) | 21 (53.8%) |
| Architecture & Engineering | 72 (100.0%) | 0 (0.0%) |
| Life, Physical & Social Science | 0 (0.0%) | 0 (0.0%) |
| Community & Social Service | 77 (43.3%) | 101 (56.7%) |
| Education, Arts & Media | 0 (0.0%) | 44 (100.0%) |
| Legal Services & Support | 29 (100.0%) | 0 (0.0%) |
| Education Instruction & Library | 30 (34.5%) | 57 (65.5%) |
| Arts, Media & Entertainment | 18 (100.0%) | 0 (0.0%) |
| Health Diagnosing & Treating | 145 (40.6%) | 212 (59.4%) |
| Health Technologists | 145 (43.4%) | 189 (56.6%) |
| Total (Category) | 489 (52.6%) | 440 (47.4%) |
| Total (Overall) | 791 (57.7%) | 579 (42.3%) |
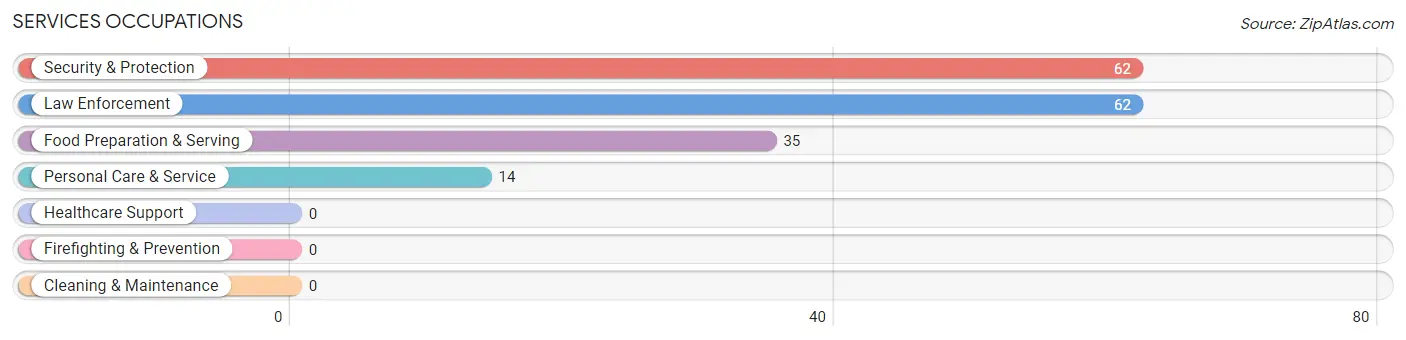
Services Occupations
The most common Services occupations in Elma Center are Security & Protection (62 | 4.5%), Law Enforcement (62 | 4.5%), Food Preparation & Serving (35 | 2.5%), and Personal Care & Service (14 | 1.0%).
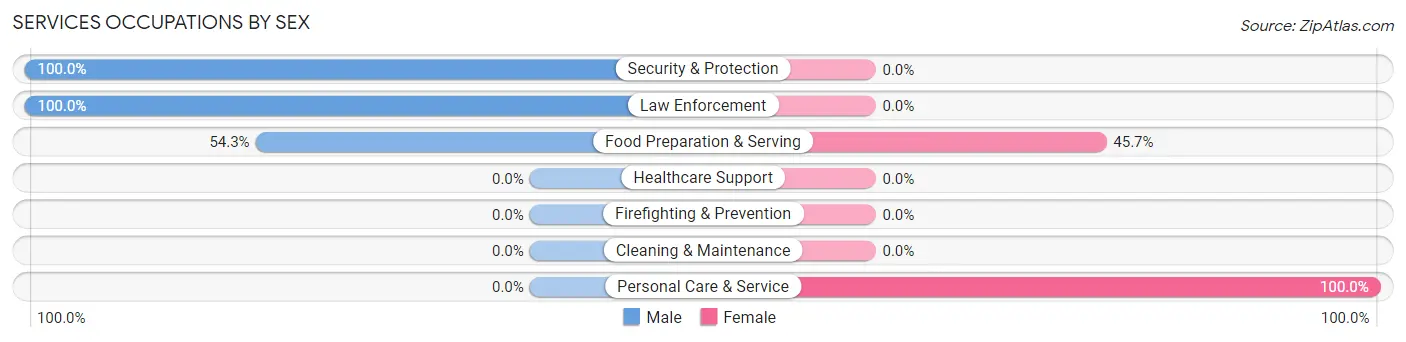
Services Occupations by Sex
Within the Services occupations in Elma Center, the most male-oriented occupations are Security & Protection (100.0%), Law Enforcement (100.0%), and Food Preparation & Serving (54.3%), while the most female-oriented occupations are Personal Care & Service (100.0%), and Food Preparation & Serving (45.7%).
| Occupation | Male | Female |
| Healthcare Support | 0 (0.0%) | 0 (0.0%) |
| Security & Protection | 62 (100.0%) | 0 (0.0%) |
| Firefighting & Prevention | 0 (0.0%) | 0 (0.0%) |
| Law Enforcement | 62 (100.0%) | 0 (0.0%) |
| Food Preparation & Serving | 19 (54.3%) | 16 (45.7%) |
| Cleaning & Maintenance | 0 (0.0%) | 0 (0.0%) |
| Personal Care & Service | 0 (0.0%) | 14 (100.0%) |
| Total (Category) | 81 (73.0%) | 30 (27.0%) |
| Total (Overall) | 791 (57.7%) | 579 (42.3%) |
Sales and Office Occupations
The most common Sales and Office occupations in Elma Center are Sales & Related (131 | 9.6%), and Office & Administration (26 | 1.9%).
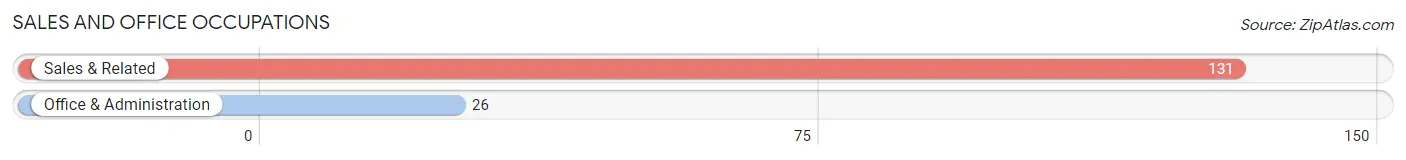
Sales and Office Occupations by Sex
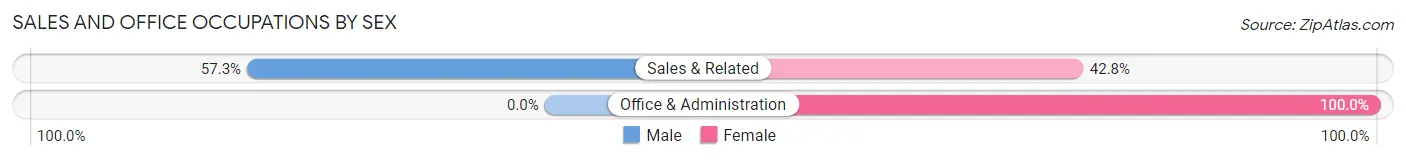
| Occupation | Male | Female |
| Sales & Related | 75 (57.3%) | 56 (42.7%) |
| Office & Administration | 0 (0.0%) | 26 (100.0%) |
| Total (Category) | 75 (47.8%) | 82 (52.2%) |
| Total (Overall) | 791 (57.7%) | 579 (42.3%) |
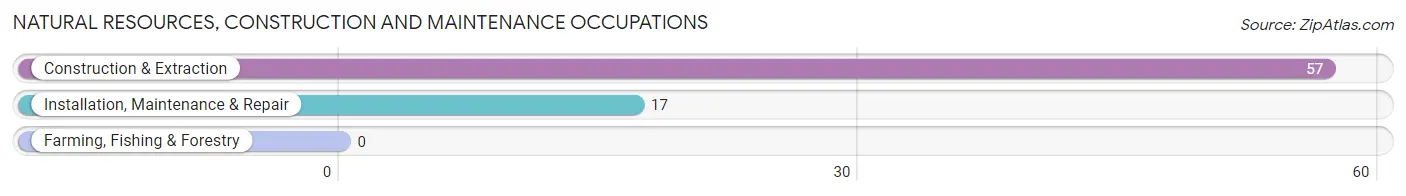
Natural Resources, Construction and Maintenance Occupations
The most common Natural Resources, Construction and Maintenance occupations in Elma Center are Construction & Extraction (57 | 4.2%), and Installation, Maintenance & Repair (17 | 1.2%).
Natural Resources, Construction and Maintenance Occupations by Sex
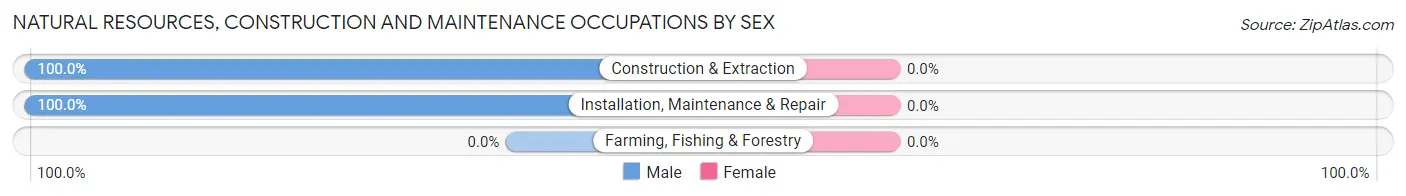
| Occupation | Male | Female |
| Farming, Fishing & Forestry | 0 (0.0%) | 0 (0.0%) |
| Construction & Extraction | 57 (100.0%) | 0 (0.0%) |
| Installation, Maintenance & Repair | 17 (100.0%) | 0 (0.0%) |
| Total (Category) | 74 (100.0%) | 0 (0.0%) |
| Total (Overall) | 791 (57.7%) | 579 (42.3%) |
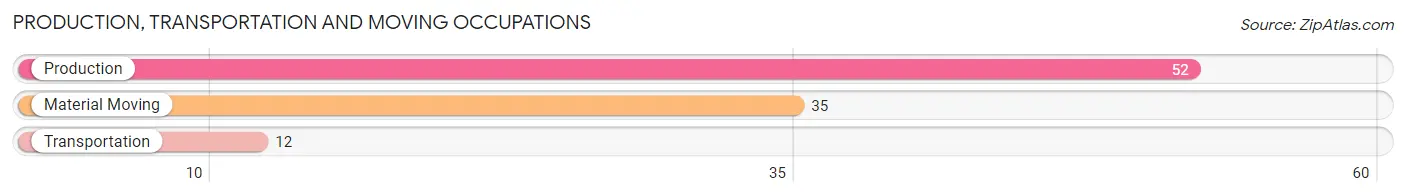
Production, Transportation and Moving Occupations
The most common Production, Transportation and Moving occupations in Elma Center are Production (52 | 3.8%), Material Moving (35 | 2.5%), and Transportation (12 | 0.9%).
Production, Transportation and Moving Occupations by Sex
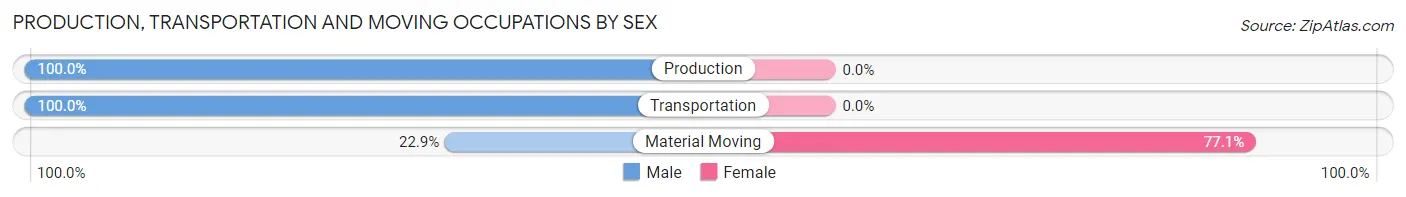
| Occupation | Male | Female |
| Production | 52 (100.0%) | 0 (0.0%) |
| Transportation | 12 (100.0%) | 0 (0.0%) |
| Material Moving | 8 (22.9%) | 27 (77.1%) |
| Total (Category) | 72 (72.7%) | 27 (27.3%) |
| Total (Overall) | 791 (57.7%) | 579 (42.3%) |
Employment Industries by Sex in Elma Center
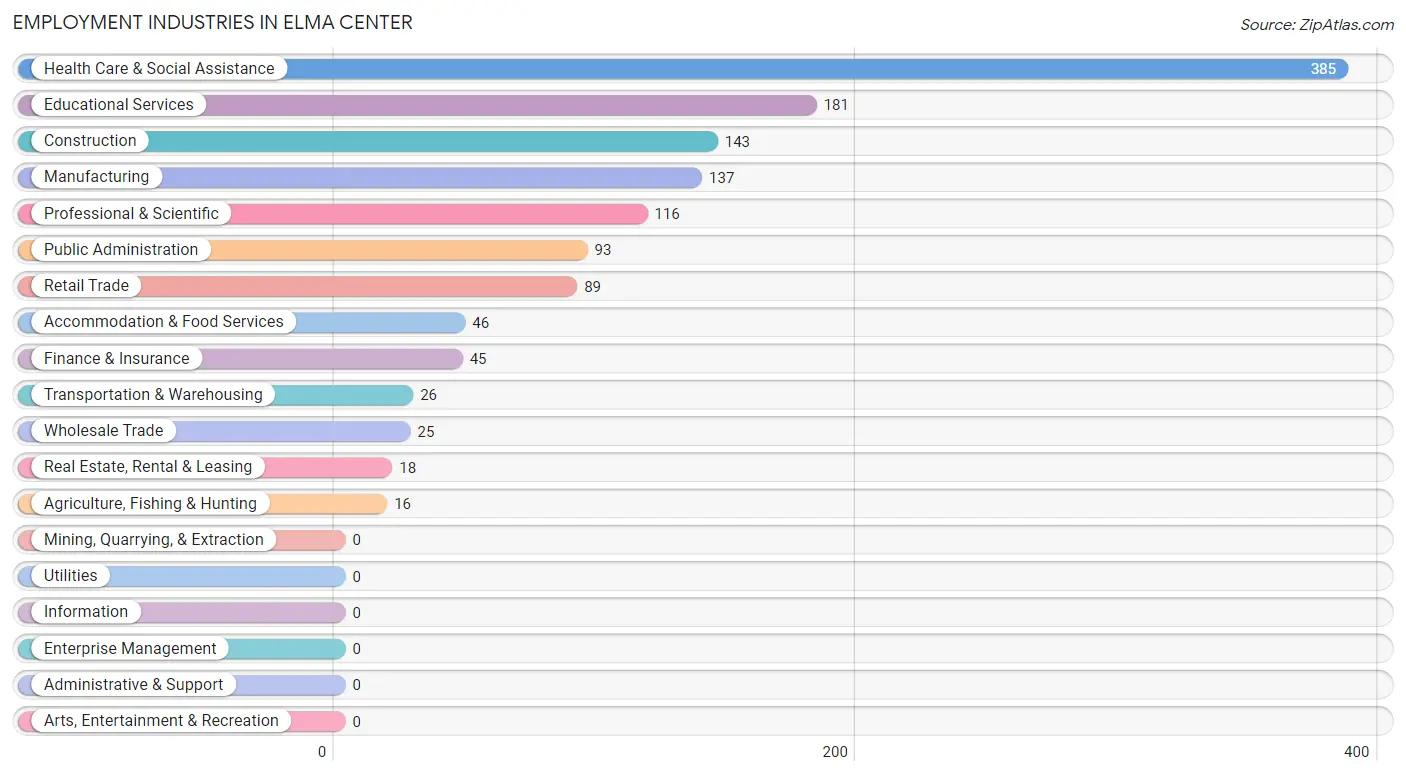
Employment Industries in Elma Center
The major employment industries in Elma Center include Health Care & Social Assistance (385 | 28.1%), Educational Services (181 | 13.2%), Construction (143 | 10.4%), Manufacturing (137 | 10.0%), and Professional & Scientific (116 | 8.5%).
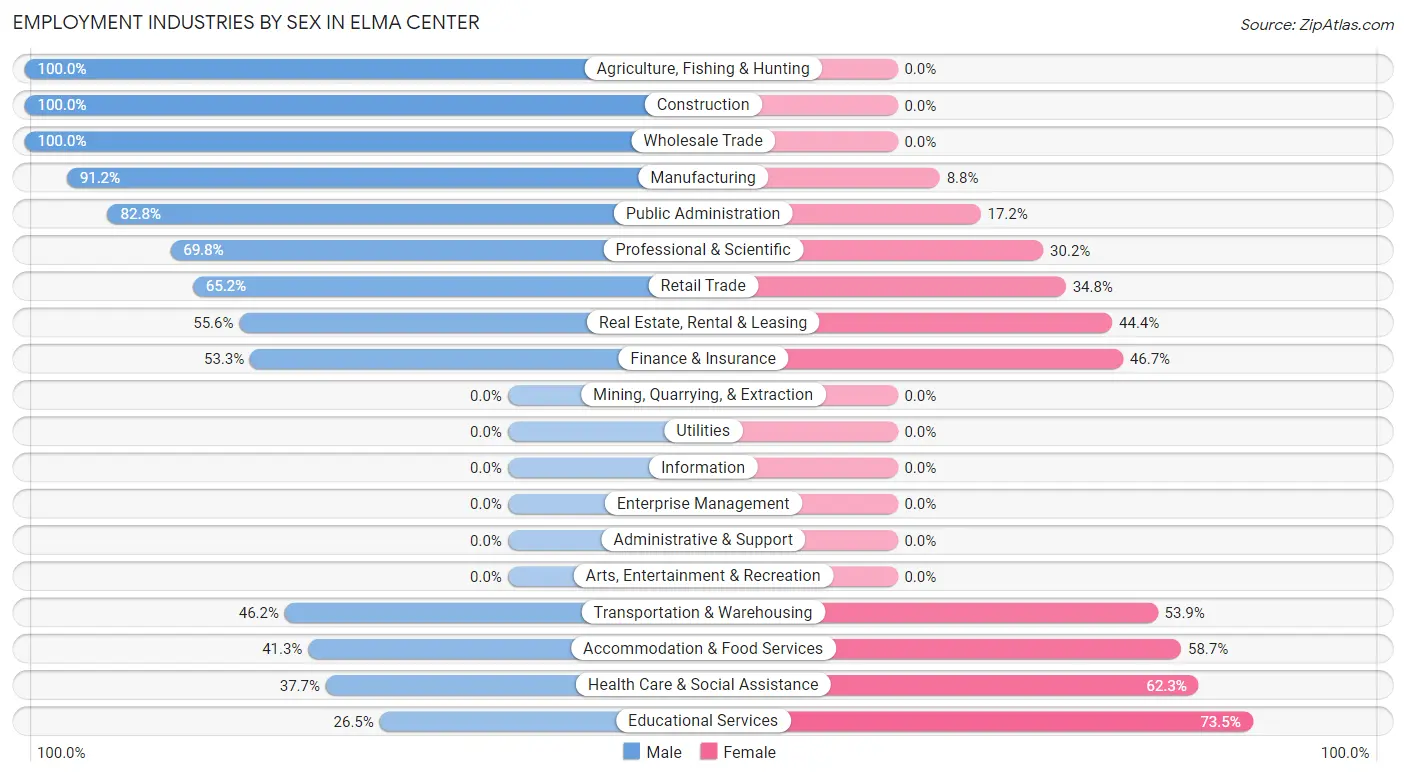
Employment Industries by Sex in Elma Center
The Elma Center industries that see more men than women are Agriculture, Fishing & Hunting (100.0%), Construction (100.0%), and Wholesale Trade (100.0%), whereas the industries that tend to have a higher number of women are Educational Services (73.5%), Health Care & Social Assistance (62.3%), and Accommodation & Food Services (58.7%).
| Industry | Male | Female |
| Agriculture, Fishing & Hunting | 16 (100.0%) | 0 (0.0%) |
| Mining, Quarrying, & Extraction | 0 (0.0%) | 0 (0.0%) |
| Construction | 143 (100.0%) | 0 (0.0%) |
| Manufacturing | 125 (91.2%) | 12 (8.8%) |
| Wholesale Trade | 25 (100.0%) | 0 (0.0%) |
| Retail Trade | 58 (65.2%) | 31 (34.8%) |
| Transportation & Warehousing | 12 (46.2%) | 14 (53.8%) |
| Utilities | 0 (0.0%) | 0 (0.0%) |
| Information | 0 (0.0%) | 0 (0.0%) |
| Finance & Insurance | 24 (53.3%) | 21 (46.7%) |
| Real Estate, Rental & Leasing | 10 (55.6%) | 8 (44.4%) |
| Professional & Scientific | 81 (69.8%) | 35 (30.2%) |
| Enterprise Management | 0 (0.0%) | 0 (0.0%) |
| Administrative & Support | 0 (0.0%) | 0 (0.0%) |
| Educational Services | 48 (26.5%) | 133 (73.5%) |
| Health Care & Social Assistance | 145 (37.7%) | 240 (62.3%) |
| Arts, Entertainment & Recreation | 0 (0.0%) | 0 (0.0%) |
| Accommodation & Food Services | 19 (41.3%) | 27 (58.7%) |
| Public Administration | 77 (82.8%) | 16 (17.2%) |
| Total | 791 (57.7%) | 579 (42.3%) |
Education in Elma Center
School Enrollment in Elma Center
The most common levels of schooling among the 890 students in Elma Center are elementary school (300 | 33.7%), nursery / preschool (224 | 25.2%), and high school (158 | 17.7%).
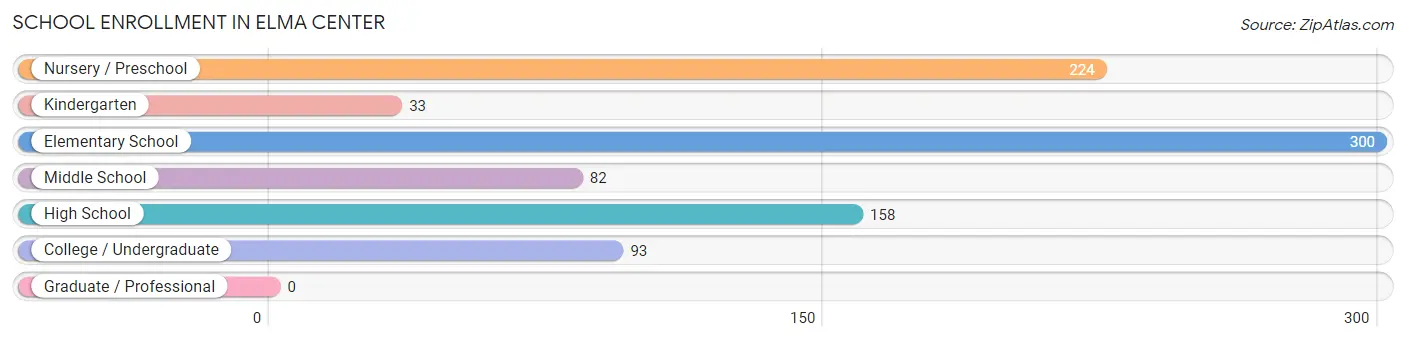
| School Level | # Students | % Students |
| Nursery / Preschool | 224 | 25.2% |
| Kindergarten | 33 | 3.7% |
| Elementary School | 300 | 33.7% |
| Middle School | 82 | 9.2% |
| High School | 158 | 17.7% |
| College / Undergraduate | 93 | 10.4% |
| Graduate / Professional | 0 | 0.0% |
| Total | 890 | 100.0% |
School Enrollment by Age by Funding Source in Elma Center
Out of a total of 890 students who are enrolled in schools in Elma Center, 230 (25.8%) attend a private institution, while the remaining 660 (74.2%) are enrolled in public schools. The age group of 18 to 19 year olds has the highest likelihood of being enrolled in private schools, with 32 (100.0% in the age bracket) enrolled. Conversely, the age group of 5 to 9 year old has the lowest likelihood of being enrolled in a private school, with 202 (100.0% in the age bracket) attending a public institution.
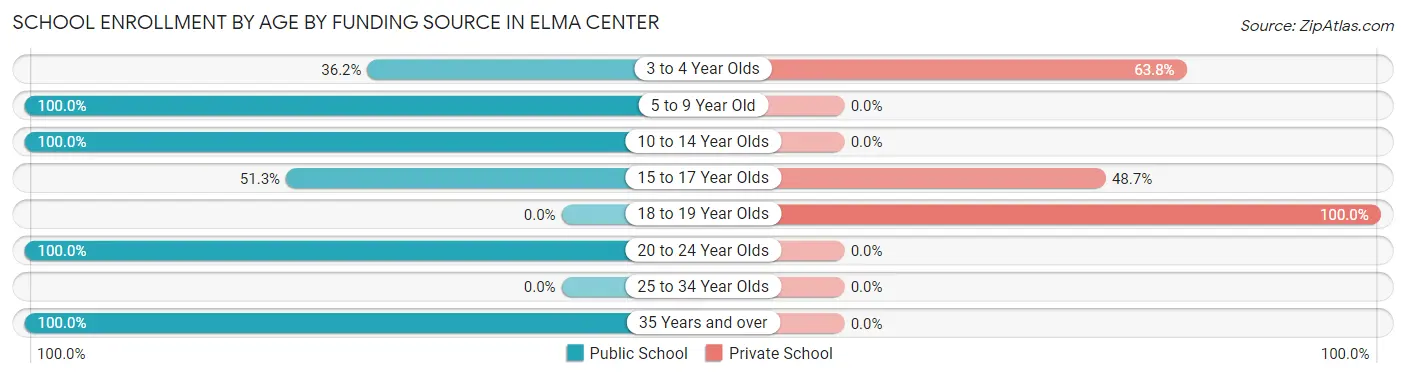
| Age Bracket | Public School | Private School |
| 3 to 4 Year Olds | 81 (36.2%) | 143 (63.8%) |
| 5 to 9 Year Old | 202 (100.0%) | 0 (0.0%) |
| 10 to 14 Year Olds | 226 (100.0%) | 0 (0.0%) |
| 15 to 17 Year Olds | 58 (51.3%) | 55 (48.7%) |
| 18 to 19 Year Olds | 0 (0.0%) | 32 (100.0%) |
| 20 to 24 Year Olds | 77 (100.0%) | 0 (0.0%) |
| 25 to 34 Year Olds | 0 (0.0%) | 0 (0.0%) |
| 35 Years and over | 16 (100.0%) | 0 (0.0%) |
| Total | 660 (74.2%) | 230 (25.8%) |
Educational Attainment by Field of Study in Elma Center
Science & technology (251 | 20.2%), business (221 | 17.8%), education (221 | 17.8%), bio, nature & agricultural (161 | 13.0%), and social sciences (78 | 6.3%) are the most common fields of study among 1,240 individuals in Elma Center who have obtained a bachelor's degree or higher.
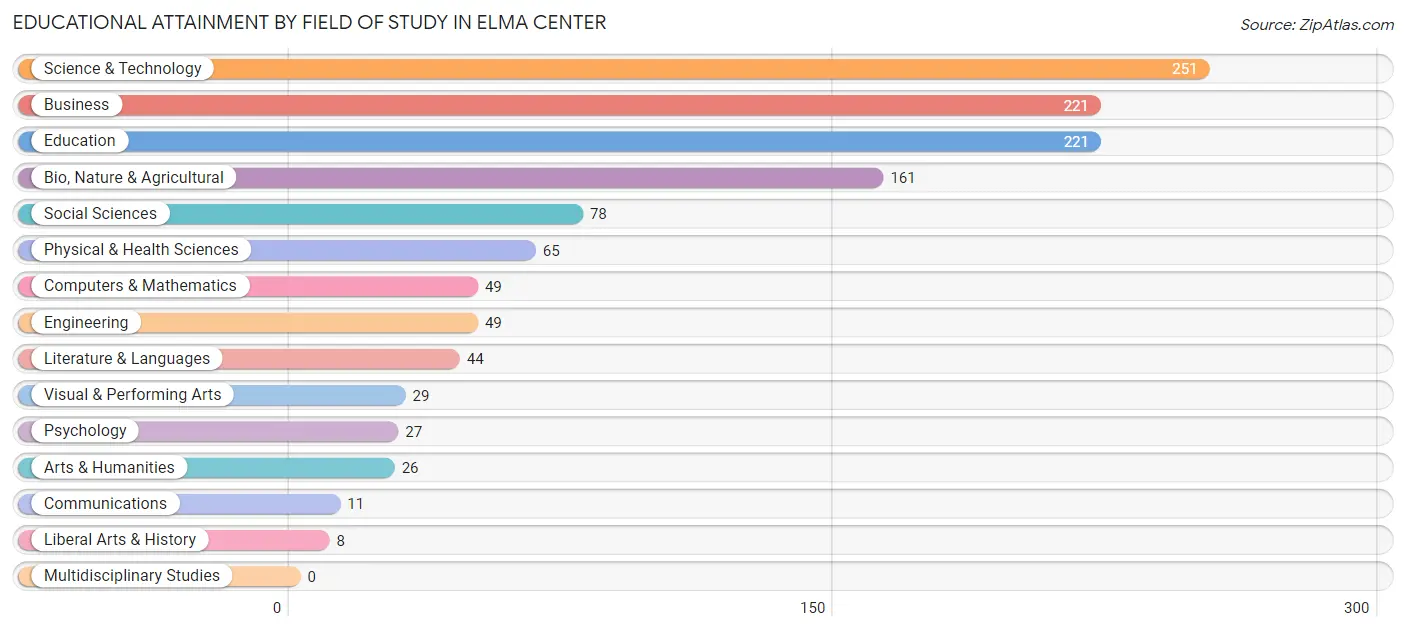
| Field of Study | # Graduates | % Graduates |
| Computers & Mathematics | 49 | 4.0% |
| Bio, Nature & Agricultural | 161 | 13.0% |
| Physical & Health Sciences | 65 | 5.2% |
| Psychology | 27 | 2.2% |
| Social Sciences | 78 | 6.3% |
| Engineering | 49 | 4.0% |
| Multidisciplinary Studies | 0 | 0.0% |
| Science & Technology | 251 | 20.2% |
| Business | 221 | 17.8% |
| Education | 221 | 17.8% |
| Literature & Languages | 44 | 3.5% |
| Liberal Arts & History | 8 | 0.6% |
| Visual & Performing Arts | 29 | 2.3% |
| Communications | 11 | 0.9% |
| Arts & Humanities | 26 | 2.1% |
| Total | 1,240 | 100.0% |
Transportation & Commute in Elma Center
Vehicle Availability by Sex in Elma Center
The most prevalent vehicle ownership categories in Elma Center are males with 2 vehicles (470, accounting for 59.4%) and females with 2 vehicles (267, making up 93.1%).
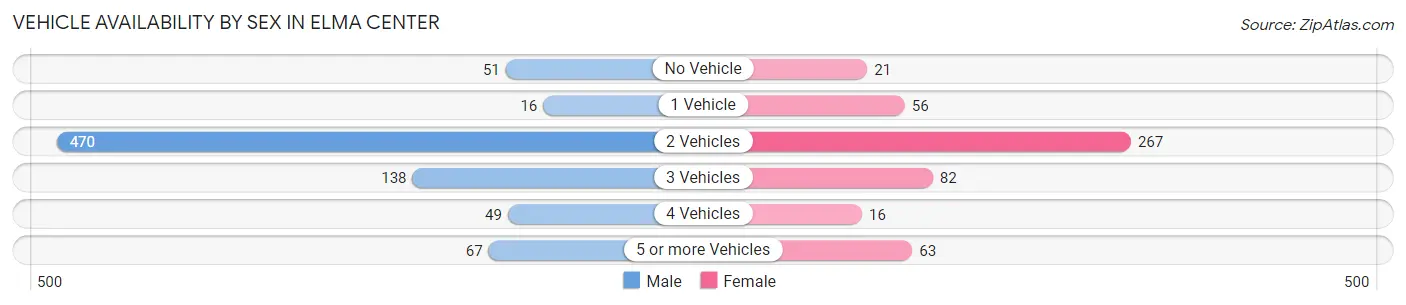
| Vehicles Available | Male | Female |
| No Vehicle | 51 (6.5%) | 21 (4.2%) |
| 1 Vehicle | 16 (2.0%) | 56 (11.1%) |
| 2 Vehicles | 470 (59.4%) | 267 (52.9%) |
| 3 Vehicles | 138 (17.4%) | 82 (16.2%) |
| 4 Vehicles | 49 (6.2%) | 16 (3.2%) |
| 5 or more Vehicles | 67 (8.5%) | 63 (12.5%) |
| Total | 791 (100.0%) | 505 (100.0%) |
Commute Time in Elma Center
The most frequently occuring commute durations in Elma Center are 30 to 34 minutes (338 commuters, 29.5%), 20 to 24 minutes (185 commuters, 16.2%), and 10 to 14 minutes (174 commuters, 15.2%).
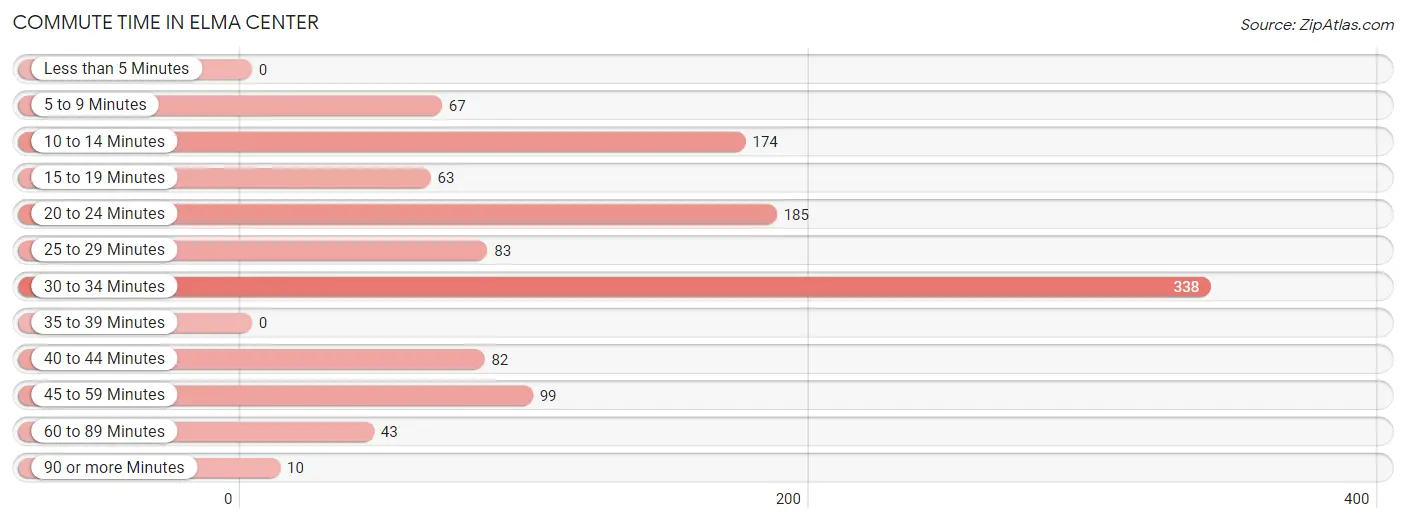
| Commute Time | # Commuters | % Commuters |
| Less than 5 Minutes | 0 | 0.0% |
| 5 to 9 Minutes | 67 | 5.9% |
| 10 to 14 Minutes | 174 | 15.2% |
| 15 to 19 Minutes | 63 | 5.5% |
| 20 to 24 Minutes | 185 | 16.2% |
| 25 to 29 Minutes | 83 | 7.3% |
| 30 to 34 Minutes | 338 | 29.5% |
| 35 to 39 Minutes | 0 | 0.0% |
| 40 to 44 Minutes | 82 | 7.2% |
| 45 to 59 Minutes | 99 | 8.6% |
| 60 to 89 Minutes | 43 | 3.8% |
| 90 or more Minutes | 10 | 0.9% |
Commute Time by Sex in Elma Center
The most common commute times in Elma Center are 30 to 34 minutes (181 commuters, 25.3%) for males and 30 to 34 minutes (157 commuters, 36.6%) for females.
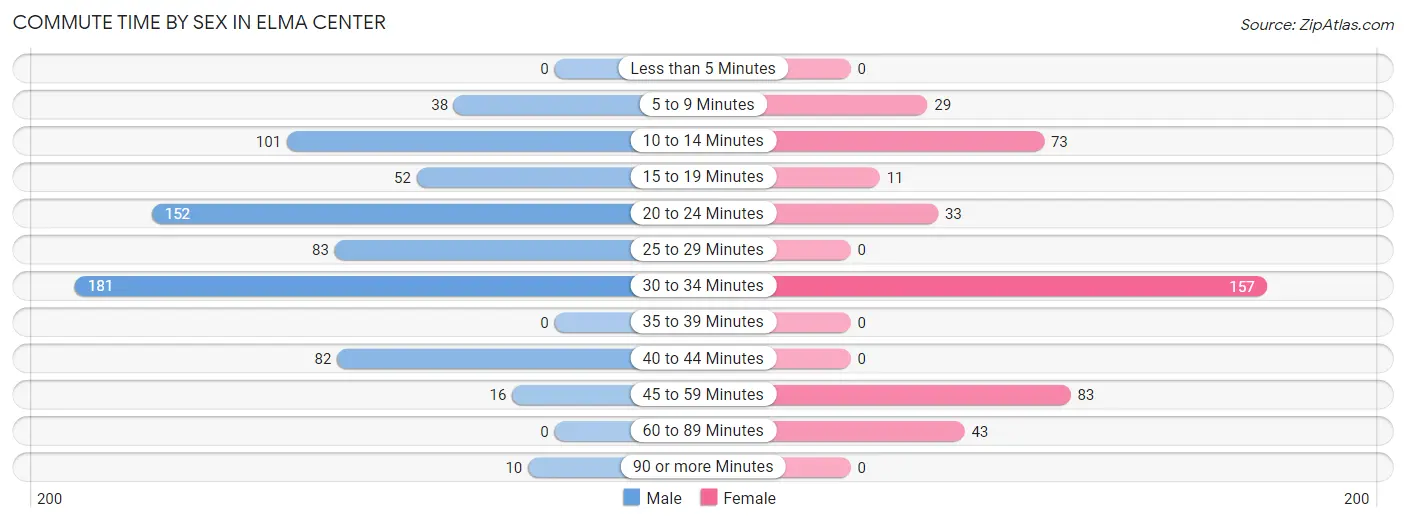
| Commute Time | Male | Female |
| Less than 5 Minutes | 0 (0.0%) | 0 (0.0%) |
| 5 to 9 Minutes | 38 (5.3%) | 29 (6.8%) |
| 10 to 14 Minutes | 101 (14.1%) | 73 (17.0%) |
| 15 to 19 Minutes | 52 (7.3%) | 11 (2.6%) |
| 20 to 24 Minutes | 152 (21.3%) | 33 (7.7%) |
| 25 to 29 Minutes | 83 (11.6%) | 0 (0.0%) |
| 30 to 34 Minutes | 181 (25.3%) | 157 (36.6%) |
| 35 to 39 Minutes | 0 (0.0%) | 0 (0.0%) |
| 40 to 44 Minutes | 82 (11.5%) | 0 (0.0%) |
| 45 to 59 Minutes | 16 (2.2%) | 83 (19.4%) |
| 60 to 89 Minutes | 0 (0.0%) | 43 (10.0%) |
| 90 or more Minutes | 10 (1.4%) | 0 (0.0%) |
Time of Departure to Work by Sex in Elma Center
The most frequent times of departure to work in Elma Center are 7:00 AM to 7:29 AM (180, 25.2%) for males and 7:00 AM to 7:29 AM (156, 36.4%) for females.
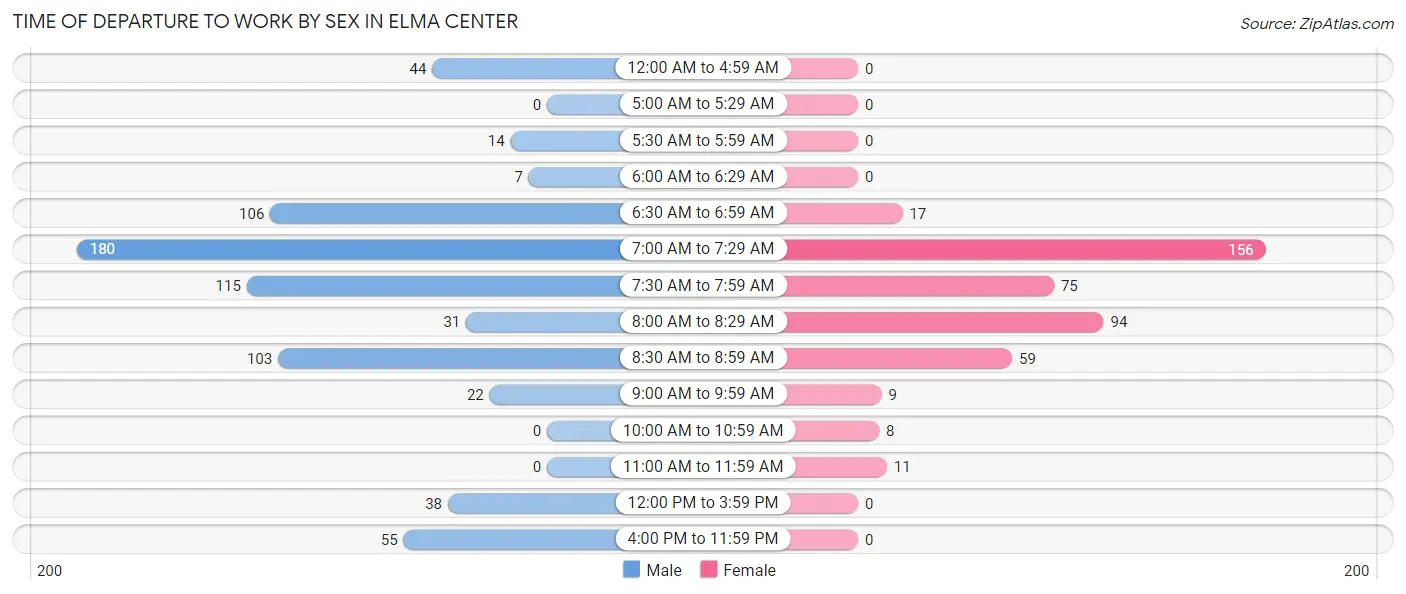
| Time of Departure | Male | Female |
| 12:00 AM to 4:59 AM | 44 (6.1%) | 0 (0.0%) |
| 5:00 AM to 5:29 AM | 0 (0.0%) | 0 (0.0%) |
| 5:30 AM to 5:59 AM | 14 (2.0%) | 0 (0.0%) |
| 6:00 AM to 6:29 AM | 7 (1.0%) | 0 (0.0%) |
| 6:30 AM to 6:59 AM | 106 (14.8%) | 17 (4.0%) |
| 7:00 AM to 7:29 AM | 180 (25.2%) | 156 (36.4%) |
| 7:30 AM to 7:59 AM | 115 (16.1%) | 75 (17.5%) |
| 8:00 AM to 8:29 AM | 31 (4.3%) | 94 (21.9%) |
| 8:30 AM to 8:59 AM | 103 (14.4%) | 59 (13.8%) |
| 9:00 AM to 9:59 AM | 22 (3.1%) | 9 (2.1%) |
| 10:00 AM to 10:59 AM | 0 (0.0%) | 8 (1.9%) |
| 11:00 AM to 11:59 AM | 0 (0.0%) | 11 (2.6%) |
| 12:00 PM to 3:59 PM | 38 (5.3%) | 0 (0.0%) |
| 4:00 PM to 11:59 PM | 55 (7.7%) | 0 (0.0%) |
| Total | 715 (100.0%) | 429 (100.0%) |
Housing Occupancy in Elma Center
Occupancy by Ownership in Elma Center
Of the total 1,268 dwellings in Elma Center, owner-occupied units account for 1,102 (86.9%), while renter-occupied units make up 166 (13.1%).
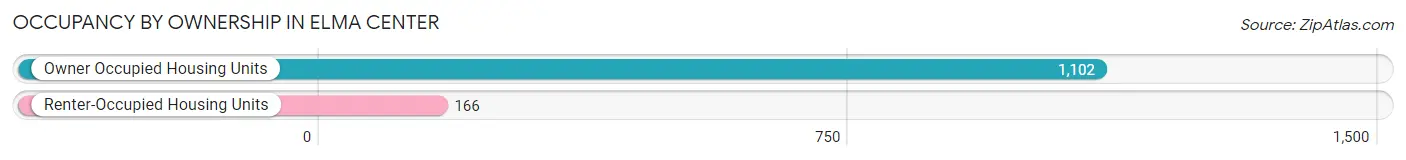
| Occupancy | # Housing Units | % Housing Units |
| Owner Occupied Housing Units | 1,102 | 86.9% |
| Renter-Occupied Housing Units | 166 | 13.1% |
| Total Occupied Housing Units | 1,268 | 100.0% |
Occupancy by Household Size in Elma Center
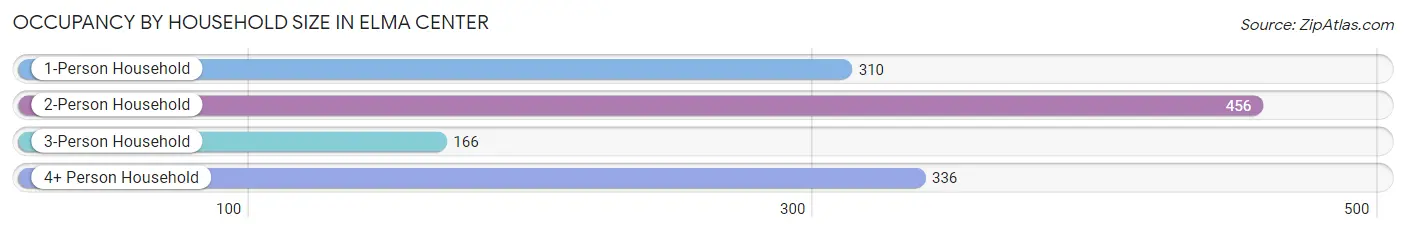
| Household Size | # Housing Units | % Housing Units |
| 1-Person Household | 310 | 24.4% |
| 2-Person Household | 456 | 36.0% |
| 3-Person Household | 166 | 13.1% |
| 4+ Person Household | 336 | 26.5% |
| Total Housing Units | 1,268 | 100.0% |
Occupancy by Ownership by Household Size in Elma Center
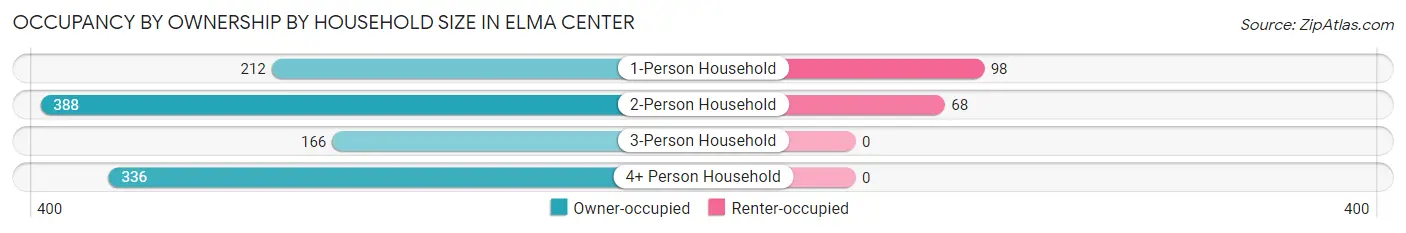
| Household Size | Owner-occupied | Renter-occupied |
| 1-Person Household | 212 (68.4%) | 98 (31.6%) |
| 2-Person Household | 388 (85.1%) | 68 (14.9%) |
| 3-Person Household | 166 (100.0%) | 0 (0.0%) |
| 4+ Person Household | 336 (100.0%) | 0 (0.0%) |
| Total Housing Units | 1,102 (86.9%) | 166 (13.1%) |
Occupancy by Educational Attainment in Elma Center
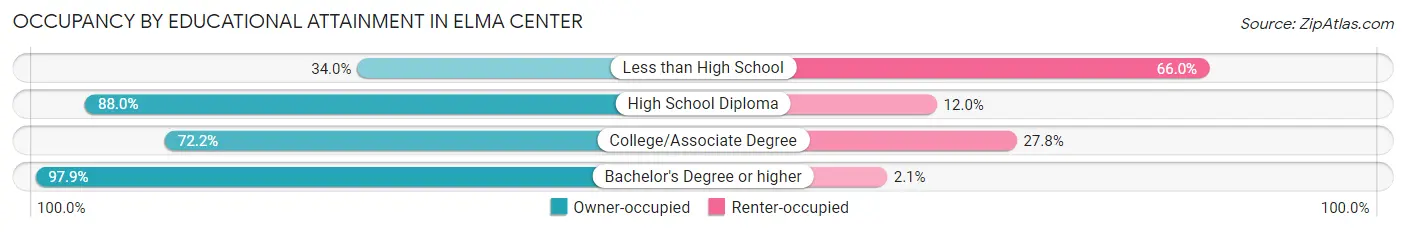
| Household Size | Owner-occupied | Renter-occupied |
| Less than High School | 16 (34.0%) | 31 (66.0%) |
| High School Diploma | 323 (88.0%) | 44 (12.0%) |
| College/Associate Degree | 205 (72.2%) | 79 (27.8%) |
| Bachelor's Degree or higher | 558 (97.9%) | 12 (2.1%) |
Occupancy by Age of Householder in Elma Center
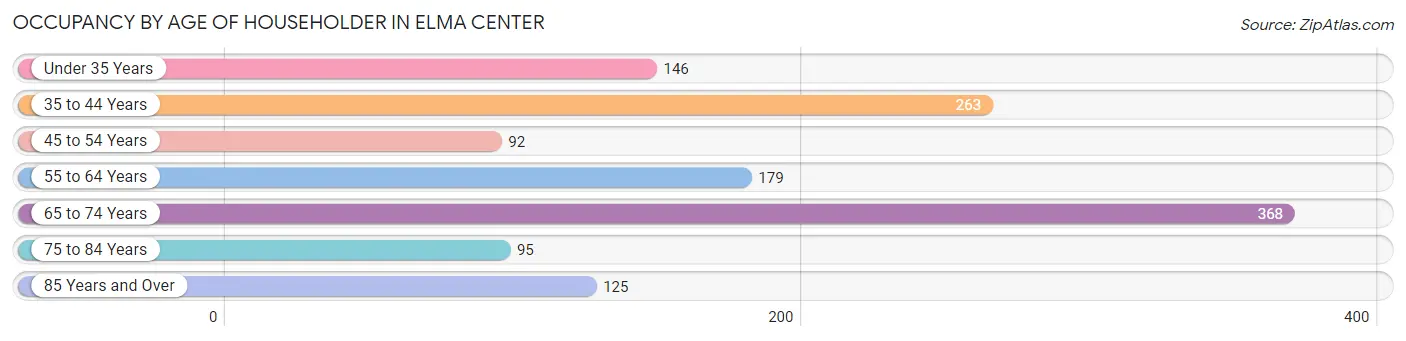
| Age Bracket | # Households | % Households |
| Under 35 Years | 146 | 11.5% |
| 35 to 44 Years | 263 | 20.7% |
| 45 to 54 Years | 92 | 7.3% |
| 55 to 64 Years | 179 | 14.1% |
| 65 to 74 Years | 368 | 29.0% |
| 75 to 84 Years | 95 | 7.5% |
| 85 Years and Over | 125 | 9.9% |
| Total | 1,268 | 100.0% |
Housing Finances in Elma Center
Median Income by Occupancy in Elma Center
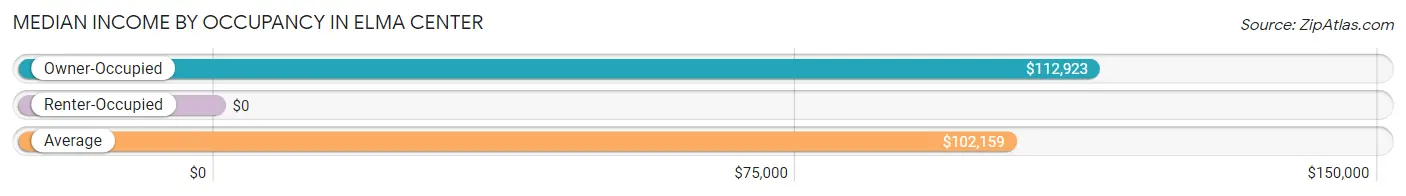
| Occupancy Type | # Households | Median Income |
| Owner-Occupied | 1,102 (86.9%) | $112,923 |
| Renter-Occupied | 166 (13.1%) | $0 |
| Average | 1,268 (100.0%) | $102,159 |
Occupancy by Householder Income Bracket in Elma Center
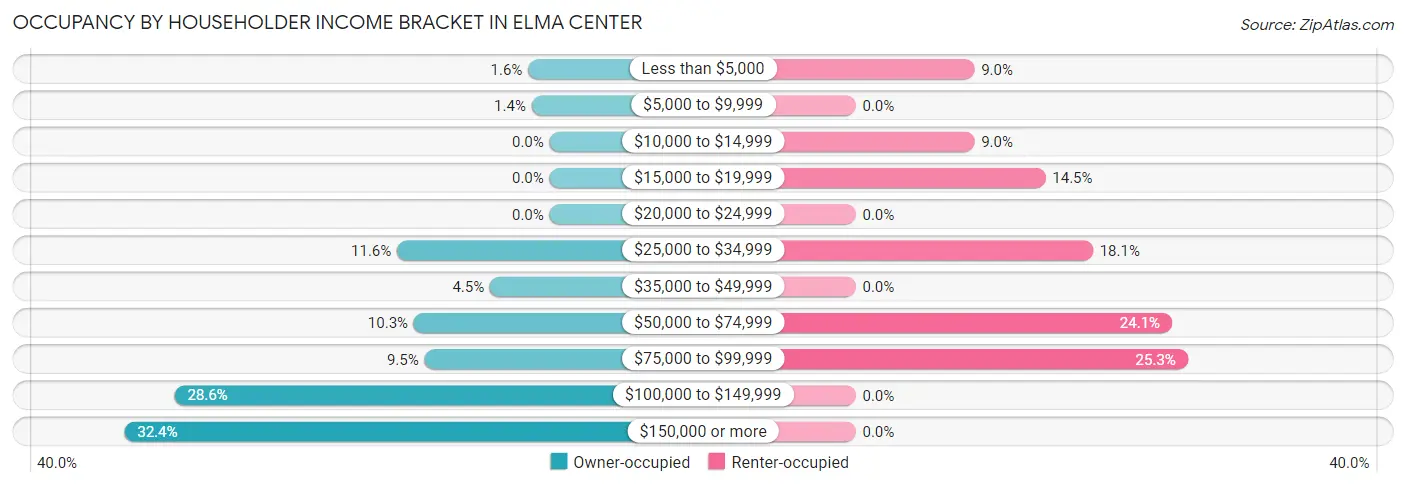
| Income Bracket | Owner-occupied | Renter-occupied |
| Less than $5,000 | 18 (1.6%) | 15 (9.0%) |
| $5,000 to $9,999 | 15 (1.4%) | 0 (0.0%) |
| $10,000 to $14,999 | 0 (0.0%) | 15 (9.0%) |
| $15,000 to $19,999 | 0 (0.0%) | 24 (14.5%) |
| $20,000 to $24,999 | 0 (0.0%) | 0 (0.0%) |
| $25,000 to $34,999 | 128 (11.6%) | 30 (18.1%) |
| $35,000 to $49,999 | 50 (4.5%) | 0 (0.0%) |
| $50,000 to $74,999 | 114 (10.3%) | 40 (24.1%) |
| $75,000 to $99,999 | 105 (9.5%) | 42 (25.3%) |
| $100,000 to $149,999 | 315 (28.6%) | 0 (0.0%) |
| $150,000 or more | 357 (32.4%) | 0 (0.0%) |
| Total | 1,102 (100.0%) | 166 (100.0%) |
Monthly Housing Cost Tiers in Elma Center
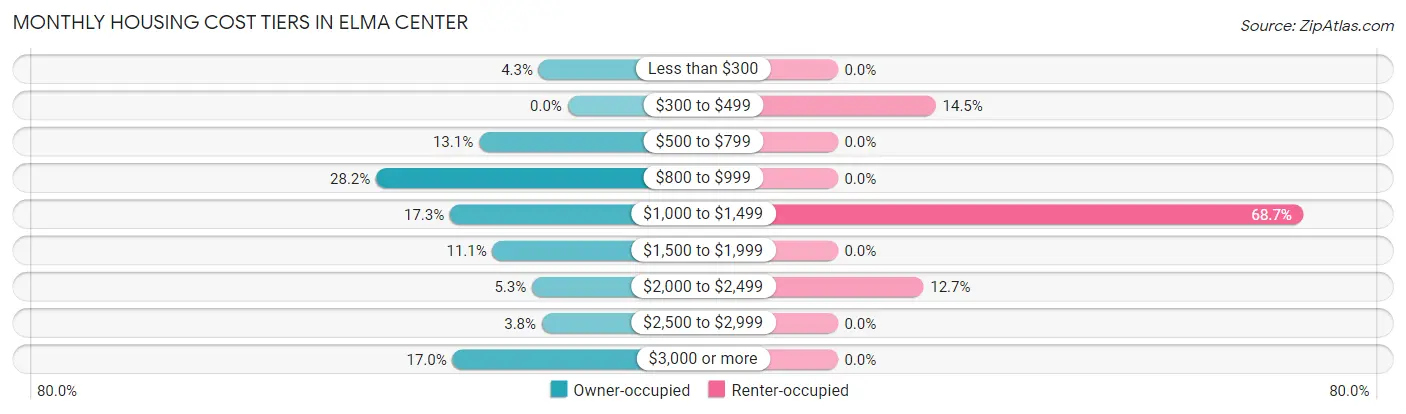
| Monthly Cost | Owner-occupied | Renter-occupied |
| Less than $300 | 47 (4.3%) | 0 (0.0%) |
| $300 to $499 | 0 (0.0%) | 24 (14.5%) |
| $500 to $799 | 144 (13.1%) | 0 (0.0%) |
| $800 to $999 | 311 (28.2%) | 0 (0.0%) |
| $1,000 to $1,499 | 191 (17.3%) | 114 (68.7%) |
| $1,500 to $1,999 | 122 (11.1%) | 0 (0.0%) |
| $2,000 to $2,499 | 58 (5.3%) | 21 (12.7%) |
| $2,500 to $2,999 | 42 (3.8%) | 0 (0.0%) |
| $3,000 or more | 187 (17.0%) | 0 (0.0%) |
| Total | 1,102 (100.0%) | 166 (100.0%) |
Physical Housing Characteristics in Elma Center
Housing Structures in Elma Center
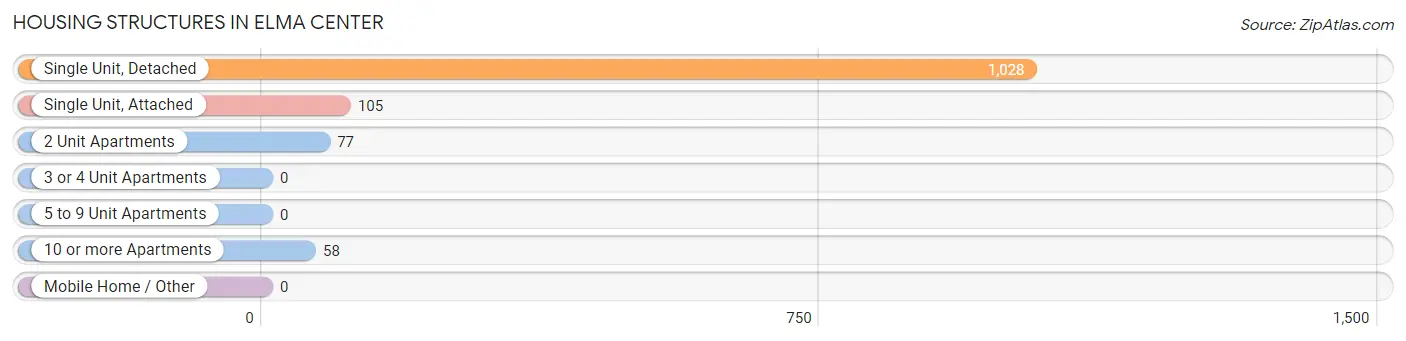
| Structure Type | # Housing Units | % Housing Units |
| Single Unit, Detached | 1,028 | 81.1% |
| Single Unit, Attached | 105 | 8.3% |
| 2 Unit Apartments | 77 | 6.1% |
| 3 or 4 Unit Apartments | 0 | 0.0% |
| 5 to 9 Unit Apartments | 0 | 0.0% |
| 10 or more Apartments | 58 | 4.6% |
| Mobile Home / Other | 0 | 0.0% |
| Total | 1,268 | 100.0% |
Housing Structures by Occupancy in Elma Center
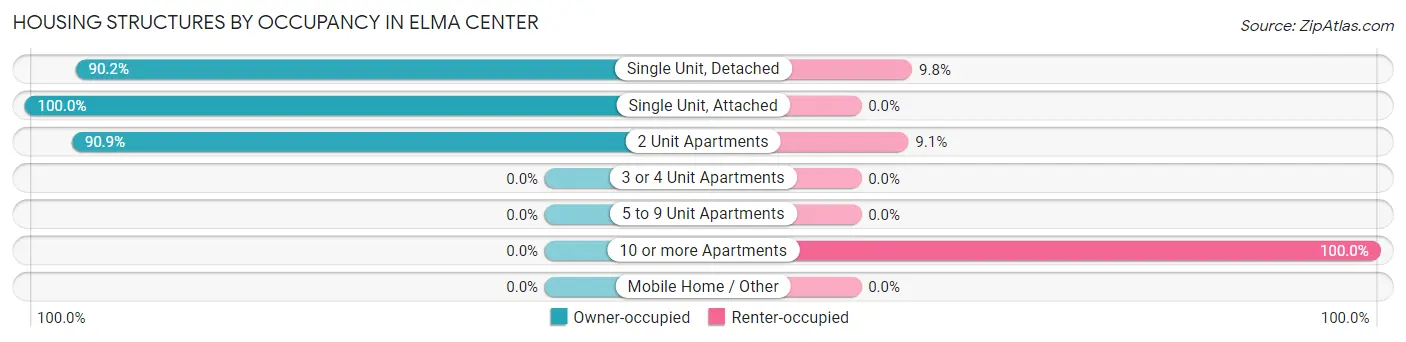
| Structure Type | Owner-occupied | Renter-occupied |
| Single Unit, Detached | 927 (90.2%) | 101 (9.8%) |
| Single Unit, Attached | 105 (100.0%) | 0 (0.0%) |
| 2 Unit Apartments | 70 (90.9%) | 7 (9.1%) |
| 3 or 4 Unit Apartments | 0 (0.0%) | 0 (0.0%) |
| 5 to 9 Unit Apartments | 0 (0.0%) | 0 (0.0%) |
| 10 or more Apartments | 0 (0.0%) | 58 (100.0%) |
| Mobile Home / Other | 0 (0.0%) | 0 (0.0%) |
| Total | 1,102 (86.9%) | 166 (13.1%) |
Housing Structures by Number of Rooms in Elma Center
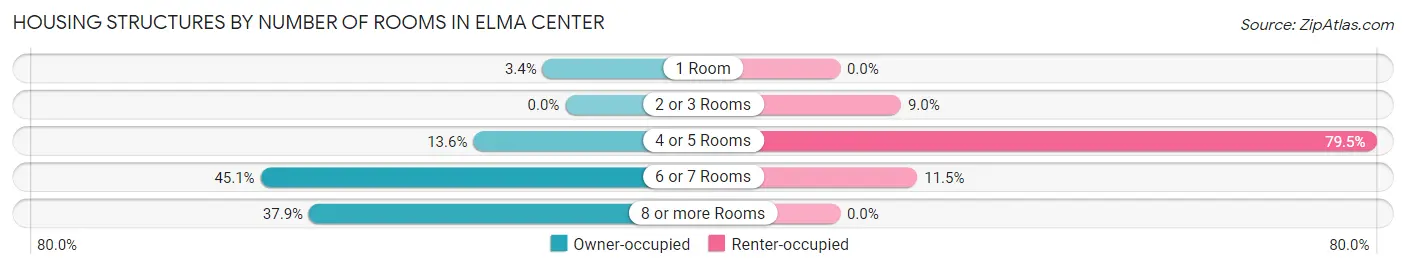
| Number of Rooms | Owner-occupied | Renter-occupied |
| 1 Room | 37 (3.4%) | 0 (0.0%) |
| 2 or 3 Rooms | 0 (0.0%) | 15 (9.0%) |
| 4 or 5 Rooms | 150 (13.6%) | 132 (79.5%) |
| 6 or 7 Rooms | 497 (45.1%) | 19 (11.5%) |
| 8 or more Rooms | 418 (37.9%) | 0 (0.0%) |
| Total | 1,102 (100.0%) | 166 (100.0%) |
Housing Structure by Heating Type in Elma Center
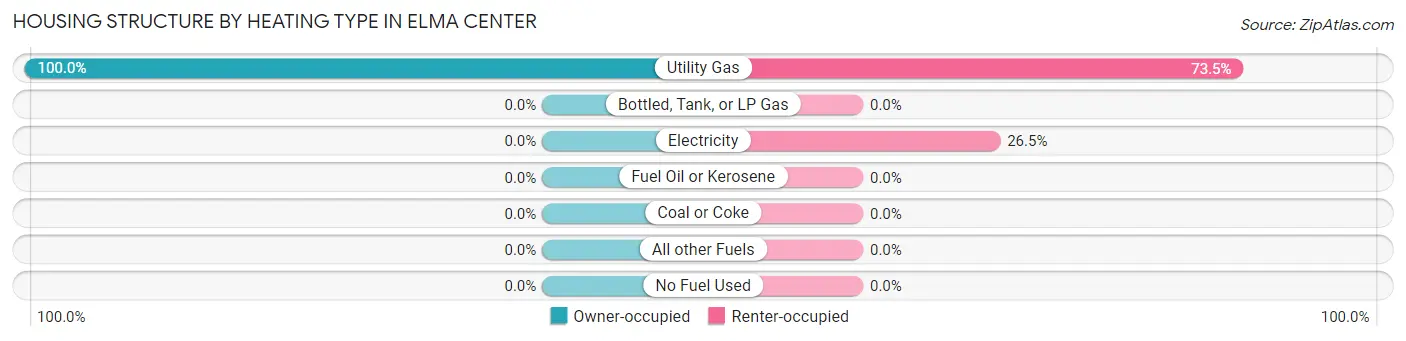
| Heating Type | Owner-occupied | Renter-occupied |
| Utility Gas | 1,102 (100.0%) | 122 (73.5%) |
| Bottled, Tank, or LP Gas | 0 (0.0%) | 0 (0.0%) |
| Electricity | 0 (0.0%) | 44 (26.5%) |
| Fuel Oil or Kerosene | 0 (0.0%) | 0 (0.0%) |
| Coal or Coke | 0 (0.0%) | 0 (0.0%) |
| All other Fuels | 0 (0.0%) | 0 (0.0%) |
| No Fuel Used | 0 (0.0%) | 0 (0.0%) |
| Total | 1,102 (100.0%) | 166 (100.0%) |
Household Vehicle Usage in Elma Center
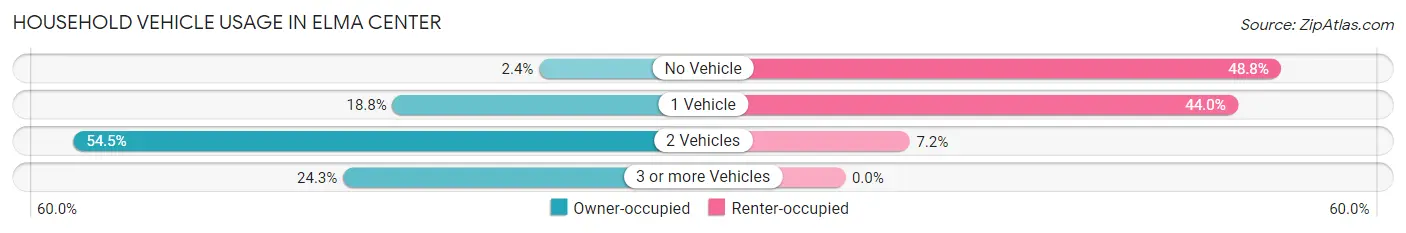
| Vehicles per Household | Owner-occupied | Renter-occupied |
| No Vehicle | 26 (2.4%) | 81 (48.8%) |
| 1 Vehicle | 207 (18.8%) | 73 (44.0%) |
| 2 Vehicles | 601 (54.5%) | 12 (7.2%) |
| 3 or more Vehicles | 268 (24.3%) | 0 (0.0%) |
| Total | 1,102 (100.0%) | 166 (100.0%) |
Real Estate & Mortgages in Elma Center
Real Estate and Mortgage Overview in Elma Center
| Characteristic | Without Mortgage | With Mortgage |
| Housing Units | 486 | 616 |
| Median Property Value | $408,300 | $415,000 |
| Median Household Income | $109,167 | $214 |
| Monthly Housing Costs | $875 | $187 |
| Real Estate Taxes | $6,259 | $8 |
Property Value by Mortgage Status in Elma Center
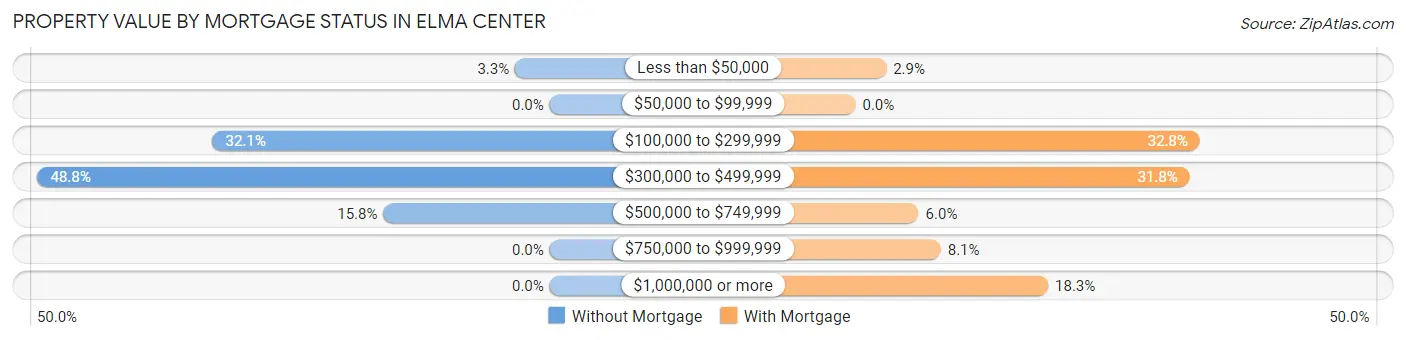
| Property Value | Without Mortgage | With Mortgage |
| Less than $50,000 | 16 (3.3%) | 18 (2.9%) |
| $50,000 to $99,999 | 0 (0.0%) | 0 (0.0%) |
| $100,000 to $299,999 | 156 (32.1%) | 202 (32.8%) |
| $300,000 to $499,999 | 237 (48.8%) | 196 (31.8%) |
| $500,000 to $749,999 | 77 (15.8%) | 37 (6.0%) |
| $750,000 to $999,999 | 0 (0.0%) | 50 (8.1%) |
| $1,000,000 or more | 0 (0.0%) | 113 (18.3%) |
| Total | 486 (100.0%) | 616 (100.0%) |
Household Income by Mortgage Status in Elma Center
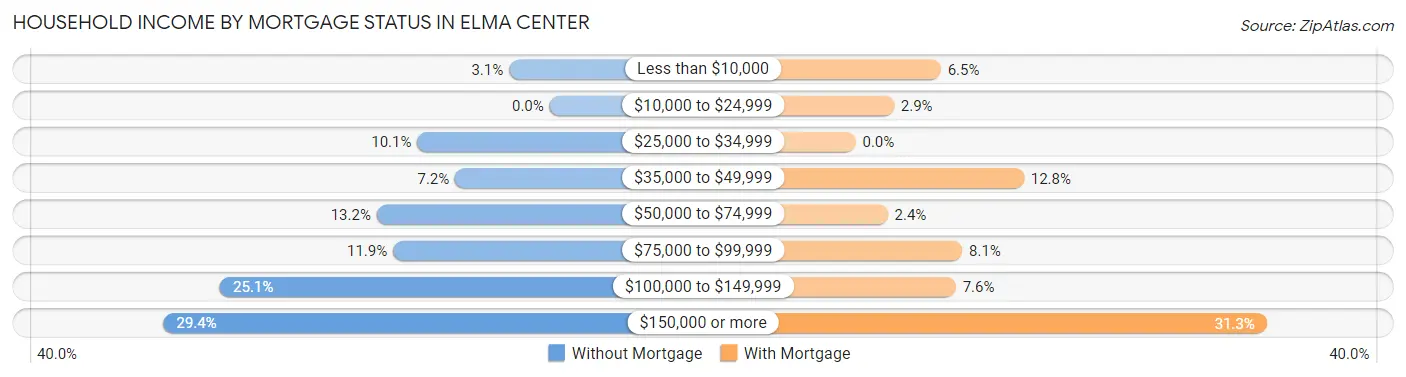
| Household Income | Without Mortgage | With Mortgage |
| Less than $10,000 | 15 (3.1%) | 40 (6.5%) |
| $10,000 to $24,999 | 0 (0.0%) | 18 (2.9%) |
| $25,000 to $34,999 | 49 (10.1%) | 0 (0.0%) |
| $35,000 to $49,999 | 35 (7.2%) | 79 (12.8%) |
| $50,000 to $74,999 | 64 (13.2%) | 15 (2.4%) |
| $75,000 to $99,999 | 58 (11.9%) | 50 (8.1%) |
| $100,000 to $149,999 | 122 (25.1%) | 47 (7.6%) |
| $150,000 or more | 143 (29.4%) | 193 (31.3%) |
| Total | 486 (100.0%) | 616 (100.0%) |
Property Value to Household Income Ratio in Elma Center
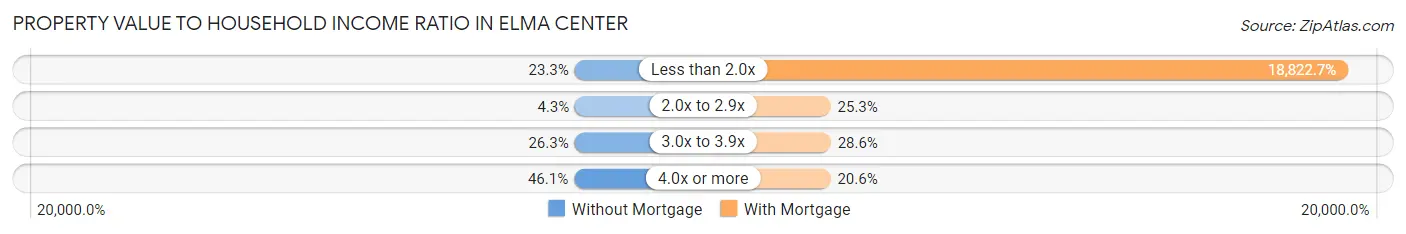
| Value-to-Income Ratio | Without Mortgage | With Mortgage |
| Less than 2.0x | 113 (23.3%) | 115,948 (18,822.7%) |
| 2.0x to 2.9x | 21 (4.3%) | 156 (25.3%) |
| 3.0x to 3.9x | 128 (26.3%) | 176 (28.6%) |
| 4.0x or more | 224 (46.1%) | 127 (20.6%) |
| Total | 486 (100.0%) | 616 (100.0%) |
Real Estate Taxes by Mortgage Status in Elma Center
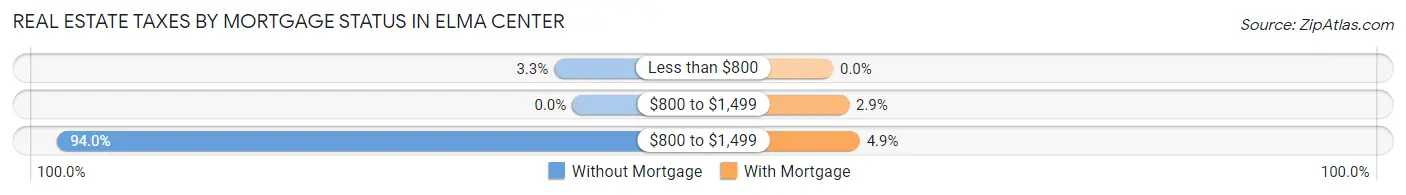
| Property Taxes | Without Mortgage | With Mortgage |
| Less than $800 | 16 (3.3%) | 0 (0.0%) |
| $800 to $1,499 | 0 (0.0%) | 18 (2.9%) |
| $800 to $1,499 | 457 (94.0%) | 30 (4.9%) |
| Total | 486 (100.0%) | 616 (100.0%) |
Health & Disability in Elma Center
Health Insurance Coverage by Age in Elma Center
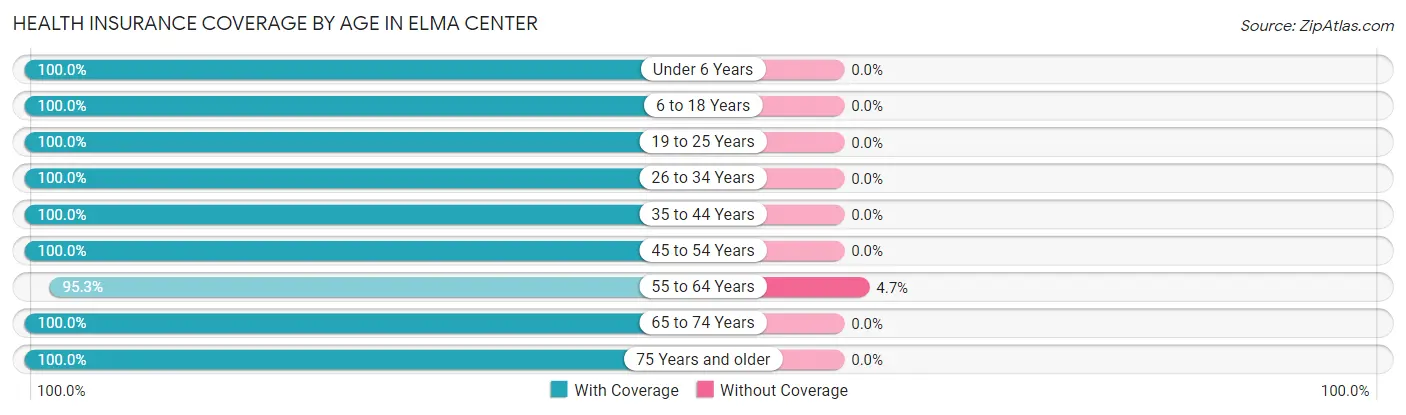
| Age Bracket | With Coverage | Without Coverage |
| Under 6 Years | 450 (100.0%) | 0 (0.0%) |
| 6 to 18 Years | 540 (100.0%) | 0 (0.0%) |
| 19 to 25 Years | 89 (100.0%) | 0 (0.0%) |
| 26 to 34 Years | 364 (100.0%) | 0 (0.0%) |
| 35 to 44 Years | 497 (100.0%) | 0 (0.0%) |
| 45 to 54 Years | 241 (100.0%) | 0 (0.0%) |
| 55 to 64 Years | 286 (95.3%) | 14 (4.7%) |
| 65 to 74 Years | 583 (100.0%) | 0 (0.0%) |
| 75 Years and older | 370 (100.0%) | 0 (0.0%) |
| Total | 3,420 (99.6%) | 14 (0.4%) |
Health Insurance Coverage by Citizenship Status in Elma Center
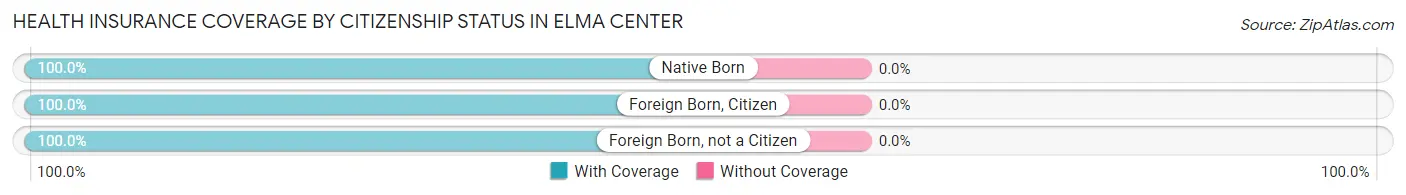
| Citizenship Status | With Coverage | Without Coverage |
| Native Born | 450 (100.0%) | 0 (0.0%) |
| Foreign Born, Citizen | 540 (100.0%) | 0 (0.0%) |
| Foreign Born, not a Citizen | 89 (100.0%) | 0 (0.0%) |
Health Insurance Coverage by Household Income in Elma Center
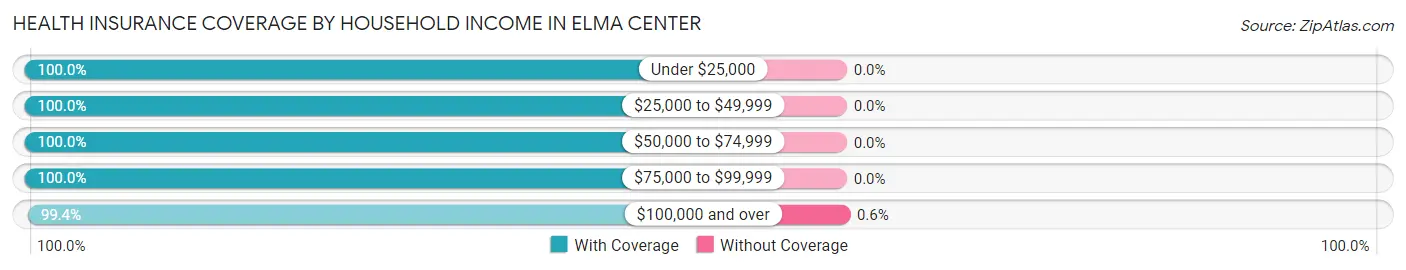
| Household Income | With Coverage | Without Coverage |
| Under $25,000 | 87 (100.0%) | 0 (0.0%) |
| $25,000 to $49,999 | 401 (100.0%) | 0 (0.0%) |
| $50,000 to $74,999 | 323 (100.0%) | 0 (0.0%) |
| $75,000 to $99,999 | 287 (100.0%) | 0 (0.0%) |
| $100,000 and over | 2,313 (99.4%) | 14 (0.6%) |
Public vs Private Health Insurance Coverage by Age in Elma Center
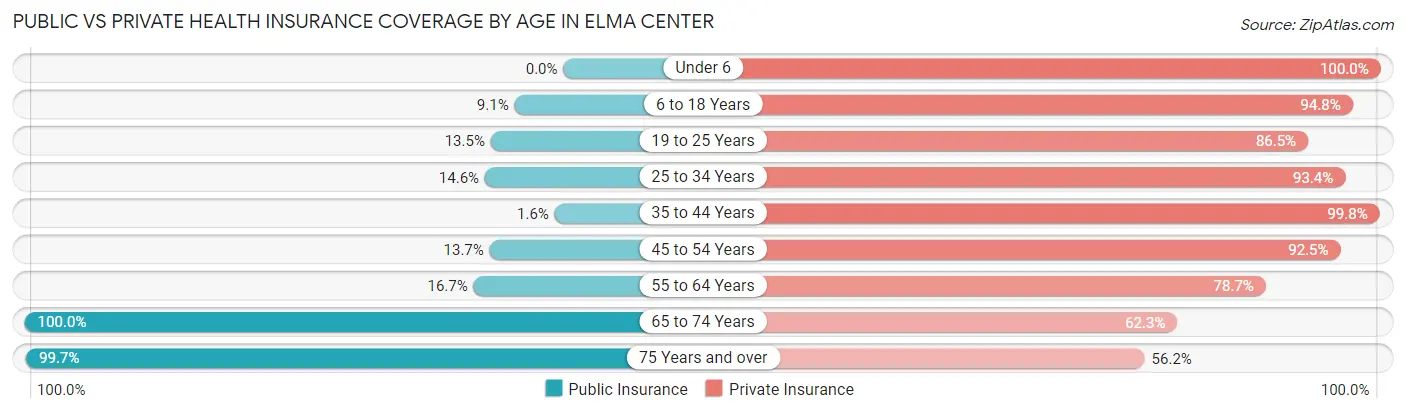
| Age Bracket | Public Insurance | Private Insurance |
| Under 6 | 0 (0.0%) | 450 (100.0%) |
| 6 to 18 Years | 49 (9.1%) | 512 (94.8%) |
| 19 to 25 Years | 12 (13.5%) | 77 (86.5%) |
| 25 to 34 Years | 53 (14.6%) | 340 (93.4%) |
| 35 to 44 Years | 8 (1.6%) | 496 (99.8%) |
| 45 to 54 Years | 33 (13.7%) | 223 (92.5%) |
| 55 to 64 Years | 50 (16.7%) | 236 (78.7%) |
| 65 to 74 Years | 583 (100.0%) | 363 (62.3%) |
| 75 Years and over | 369 (99.7%) | 208 (56.2%) |
| Total | 1,157 (33.7%) | 2,905 (84.6%) |
Disability Status by Sex by Age in Elma Center
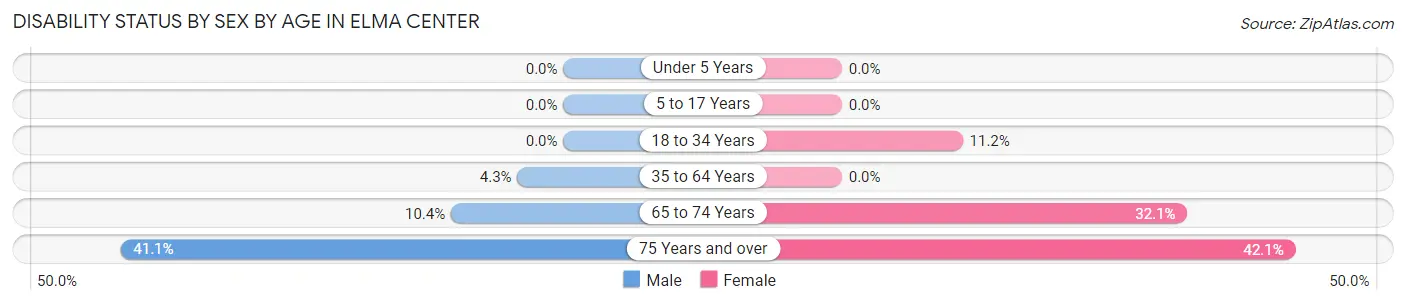
| Age Bracket | Male | Female |
| Under 5 Years | 0 (0.0%) | 0 (0.0%) |
| 5 to 17 Years | 0 (0.0%) | 0 (0.0%) |
| 18 to 34 Years | 0 (0.0%) | 24 (11.2%) |
| 35 to 64 Years | 22 (4.3%) | 0 (0.0%) |
| 65 to 74 Years | 25 (10.4%) | 110 (32.1%) |
| 75 Years and over | 74 (41.1%) | 80 (42.1%) |
Disability Class by Sex by Age in Elma Center
Disability Class: Hearing Difficulty
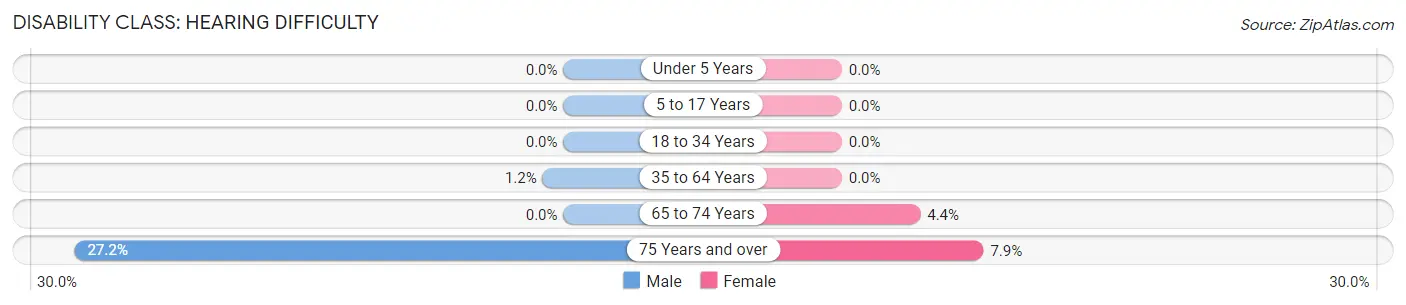
| Age Bracket | Male | Female |
| Under 5 Years | 0 (0.0%) | 0 (0.0%) |
| 5 to 17 Years | 0 (0.0%) | 0 (0.0%) |
| 18 to 34 Years | 0 (0.0%) | 0 (0.0%) |
| 35 to 64 Years | 6 (1.2%) | 0 (0.0%) |
| 65 to 74 Years | 0 (0.0%) | 15 (4.4%) |
| 75 Years and over | 49 (27.2%) | 15 (7.9%) |
Disability Class: Vision Difficulty
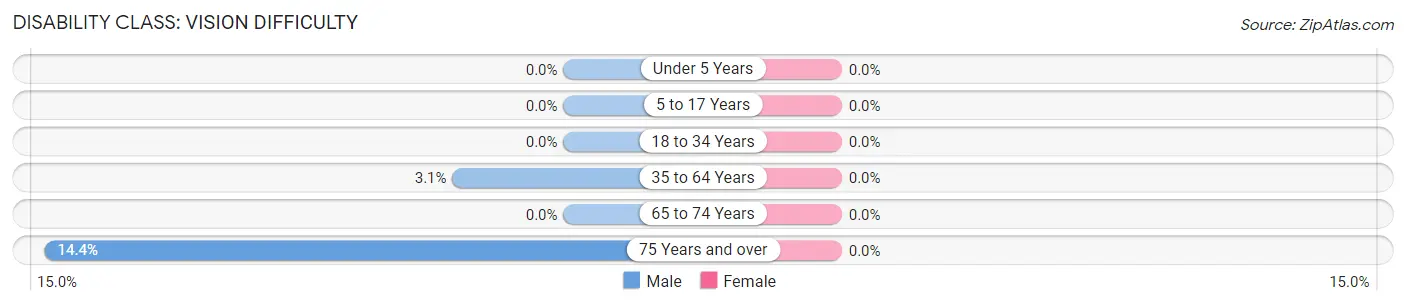
| Age Bracket | Male | Female |
| Under 5 Years | 0 (0.0%) | 0 (0.0%) |
| 5 to 17 Years | 0 (0.0%) | 0 (0.0%) |
| 18 to 34 Years | 0 (0.0%) | 0 (0.0%) |
| 35 to 64 Years | 16 (3.1%) | 0 (0.0%) |
| 65 to 74 Years | 0 (0.0%) | 0 (0.0%) |
| 75 Years and over | 26 (14.4%) | 0 (0.0%) |
Disability Class: Cognitive Difficulty
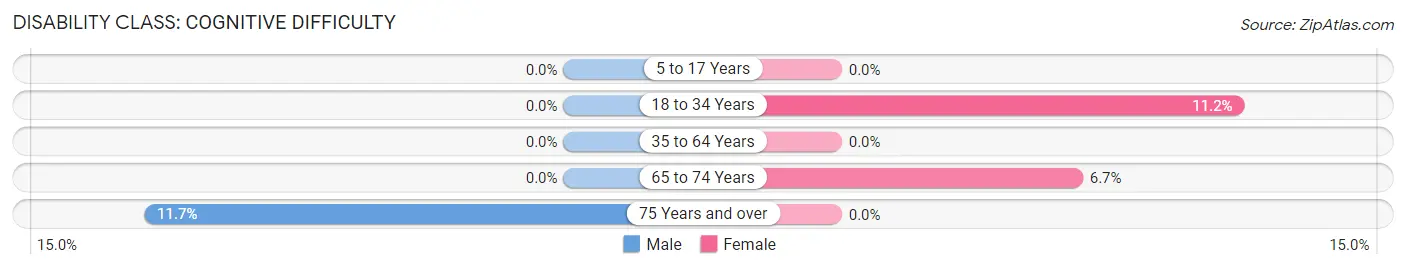
| Age Bracket | Male | Female |
| 5 to 17 Years | 0 (0.0%) | 0 (0.0%) |
| 18 to 34 Years | 0 (0.0%) | 24 (11.2%) |
| 35 to 64 Years | 0 (0.0%) | 0 (0.0%) |
| 65 to 74 Years | 0 (0.0%) | 23 (6.7%) |
| 75 Years and over | 21 (11.7%) | 0 (0.0%) |
Disability Class: Ambulatory Difficulty
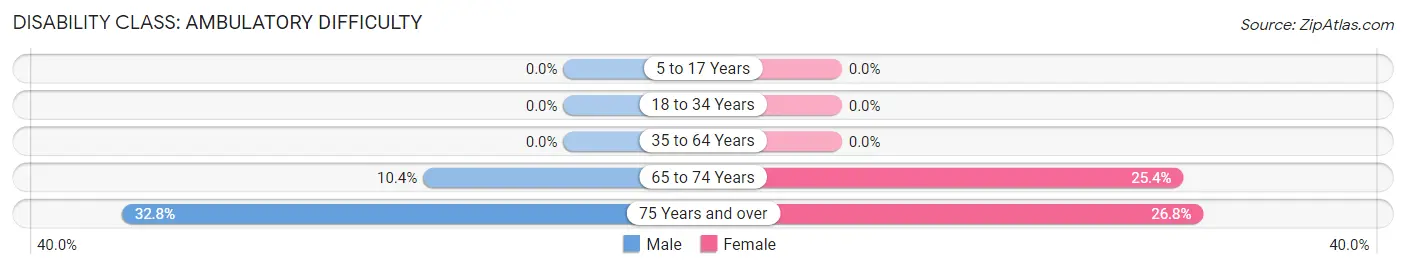
| Age Bracket | Male | Female |
| 5 to 17 Years | 0 (0.0%) | 0 (0.0%) |
| 18 to 34 Years | 0 (0.0%) | 0 (0.0%) |
| 35 to 64 Years | 0 (0.0%) | 0 (0.0%) |
| 65 to 74 Years | 25 (10.4%) | 87 (25.4%) |
| 75 Years and over | 59 (32.8%) | 51 (26.8%) |
Disability Class: Self-Care Difficulty
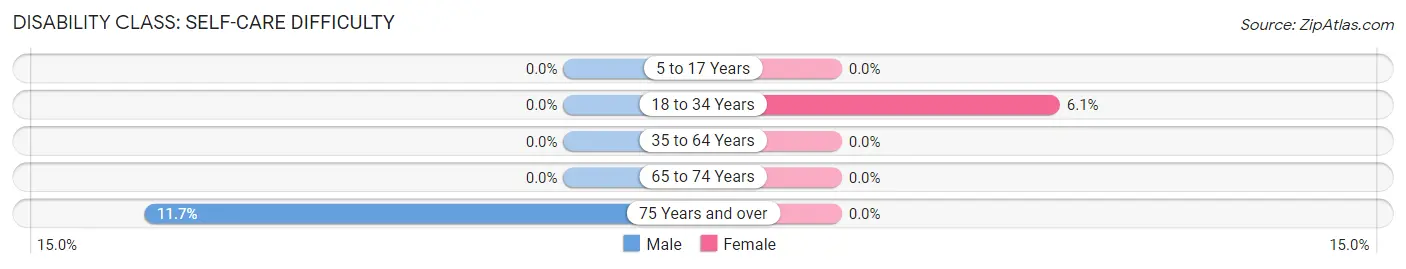
| Age Bracket | Male | Female |
| 5 to 17 Years | 0 (0.0%) | 0 (0.0%) |
| 18 to 34 Years | 0 (0.0%) | 13 (6.1%) |
| 35 to 64 Years | 0 (0.0%) | 0 (0.0%) |
| 65 to 74 Years | 0 (0.0%) | 0 (0.0%) |
| 75 Years and over | 21 (11.7%) | 0 (0.0%) |
Technology Access in Elma Center
Computing Device Access in Elma Center
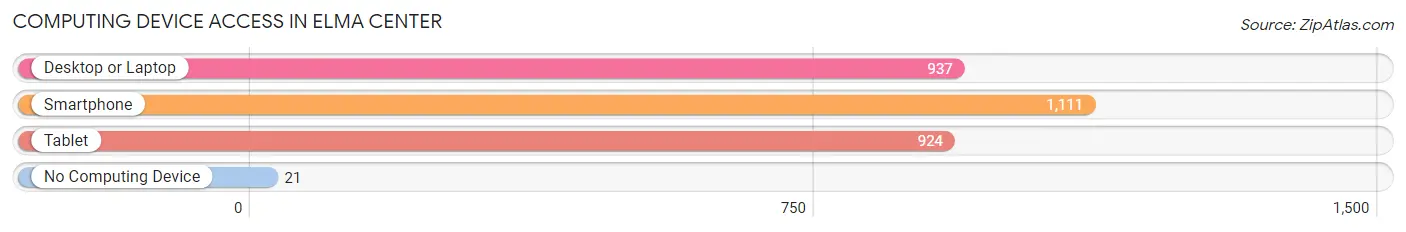
| Device Type | # Households | % Households |
| Desktop or Laptop | 937 | 73.9% |
| Smartphone | 1,111 | 87.6% |
| Tablet | 924 | 72.9% |
| No Computing Device | 21 | 1.7% |
| Total | 1,268 | 100.0% |
Internet Access in Elma Center
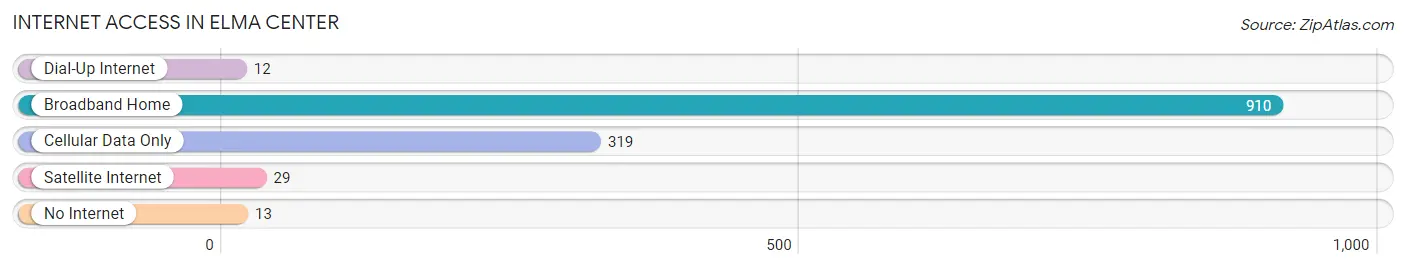
| Internet Type | # Households | % Households |
| Dial-Up Internet | 12 | 0.9% |
| Broadband Home | 910 | 71.8% |
| Cellular Data Only | 319 | 25.2% |
| Satellite Internet | 29 | 2.3% |
| No Internet | 13 | 1.0% |
| Total | 1,268 | 100.0% |
Elma Center Summary
Elma Center is a hamlet located in the town of Elma, New York, in Erie County. It is situated in the south-central part of the town, about 8 miles east of the city of Buffalo. The hamlet is home to a population of approximately 1,000 people, and is a popular destination for those looking to escape the hustle and bustle of the city.
Geography
Elma Center is located in the south-central part of the town of Elma, New York, in Erie County. It is situated about 8 miles east of the city of Buffalo. The hamlet is bordered by the towns of Aurora to the north, Marilla to the east, and Wales to the south. The hamlet is located on the banks of the Buffalo Creek, which flows through the town and empties into Lake Erie. The terrain of the area is mostly flat, with some rolling hills in the northern part of the hamlet.
History
Elma Center was first settled in the early 1800s by a group of German immigrants. The hamlet was originally known as “Germantown”, and was later renamed Elma Center in 1845. The hamlet was an important stop on the Buffalo and Erie Railroad, which ran through the town and connected Buffalo to the east. The railroad was a major factor in the growth of the hamlet, as it allowed for the transportation of goods and people.
In the late 1800s, Elma Center was a thriving agricultural community, with many farms and orchards in the area. The hamlet was also home to several businesses, including a sawmill, a gristmill, and a blacksmith shop. The hamlet was also home to a number of churches, including the Elma Center Methodist Episcopal Church, which was founded in 1845.
Economy
Elma Center is a primarily residential community, with a few small businesses located in the hamlet. The primary industries in the area are agriculture and tourism. The hamlet is home to several farms and orchards, which produce a variety of fruits and vegetables. The hamlet is also a popular destination for those looking to escape the hustle and bustle of the city, as it offers a peaceful and tranquil atmosphere.
Demographics
As of the 2010 census, Elma Center had a population of 1,000 people. The racial makeup of the hamlet was 97.2% White, 0.7% African American, 0.3% Native American, 0.3% Asian, and 1.5% from other races. The median household income in the hamlet was $50,000, and the median age was 43.
Elma Center is a small, close-knit community, with a strong sense of community and pride. The hamlet is home to a variety of organizations and clubs, including the Elma Center Historical Society, the Elma Center Lions Club, and the Elma Center Garden Club. The hamlet is also home to a number of churches, including the Elma Center Methodist Episcopal Church, which was founded in 1845.
Common Questions
What is Per Capita Income in Elma Center?
Per Capita income in Elma Center is $73,497.
What is the Median Family Income in Elma Center?
Median Family Income in Elma Center is $114,019.
What is the Median Household income in Elma Center?
Median Household Income in Elma Center is $102,159.
What is Income or Wage Gap in Elma Center?
Income or Wage Gap in Elma Center is 30.9%.
Women in Elma Center earn 69.1 cents for every dollar earned by a man.
What is Inequality or Gini Index in Elma Center?
Inequality or Gini Index in Elma Center is 0.58.
What is the Total Population of Elma Center?
Total Population of Elma Center is 3,434.
What is the Total Male Population of Elma Center?
Total Male Population of Elma Center is 1,925.
What is the Total Female Population of Elma Center?
Total Female Population of Elma Center is 1,509.
What is the Ratio of Males per 100 Females in Elma Center?
There are 127.57 Males per 100 Females in Elma Center.
What is the Ratio of Females per 100 Males in Elma Center?
There are 78.39 Females per 100 Males in Elma Center.
What is the Median Population Age in Elma Center?
Median Population Age in Elma Center is 40.4 Years.
What is the Average Family Size in Elma Center
Average Family Size in Elma Center is 3.3 People.
What is the Average Household Size in Elma Center
Average Household Size in Elma Center is 2.7 People.
How Large is the Labor Force in Elma Center?
There are 1,450 People in the Labor Forcein in Elma Center.
What is the Percentage of People in the Labor Force in Elma Center?
56.7% of People are in the Labor Force in Elma Center.
What is the Unemployment Rate in Elma Center?
Unemployment Rate in Elma Center is 5.6%.