Niverville, NY Map & Demographics
Niverville Map
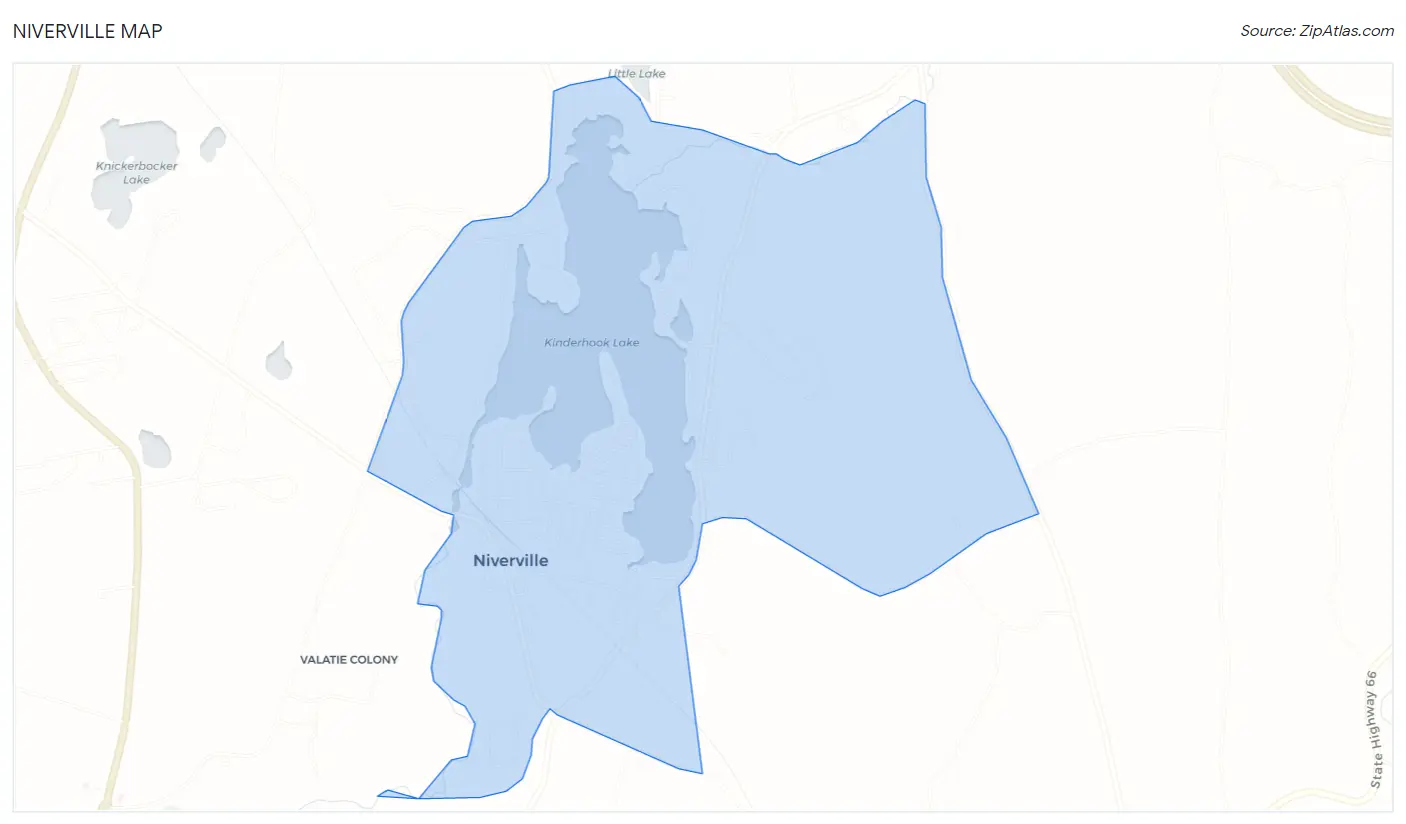
Niverville Overview
$66,130
PER CAPITA INCOME
$125,541
AVG FAMILY INCOME
$96,607
AVG HOUSEHOLD INCOME
0.55
INEQUALITY / GINI INDEX
1,463
TOTAL POPULATION
685
MALE POPULATION
778
FEMALE POPULATION
88.05
MALES / 100 FEMALES
113.58
FEMALES / 100 MALES
33.7
MEDIAN AGE
2.9
AVG FAMILY SIZE
2.9
AVG HOUSEHOLD SIZE
777
LABOR FORCE [ PEOPLE ]
72.1%
PERCENT IN LABOR FORCE
13.1%
UNEMPLOYMENT RATE
Niverville Zip Codes
Niverville Area Codes
Income in Niverville
Income Overview in Niverville
Per Capita Income in Niverville is $66,130, while median incomes of families and households are $125,541 and $96,607 respectively.
| Characteristic | Number | Measure |
| Per Capita Income | 1,463 | $66,130 |
| Median Family Income | 414 | $125,541 |
| Mean Family Income | 414 | $211,758 |
| Median Household Income | 512 | $96,607 |
| Mean Household Income | 512 | $184,025 |
| Income Deficit | 414 | $0 |
| Wage / Income Gap (%) | 1,463 | 0.00% |
| Wage / Income Gap ($) | 1,463 | 100.00¢ per $1 |
| Gini / Inequality Index | 1,463 | 0.55 |
Earnings by Sex in Niverville
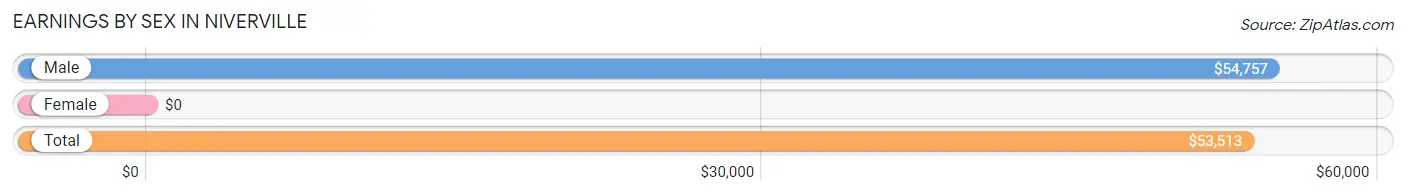
| Sex | Number | Average Earnings |
| Male | 372 (45.0%) | $54,757 |
| Female | 454 (55.0%) | $0 |
| Total | 826 (100.0%) | $53,513 |
Earnings by Sex by Income Bracket in Niverville
The most common earnings brackets in Niverville are $50,000 to $54,999 for men (72 | 19.4%) and $100,000+ for women (92 | 20.3%).
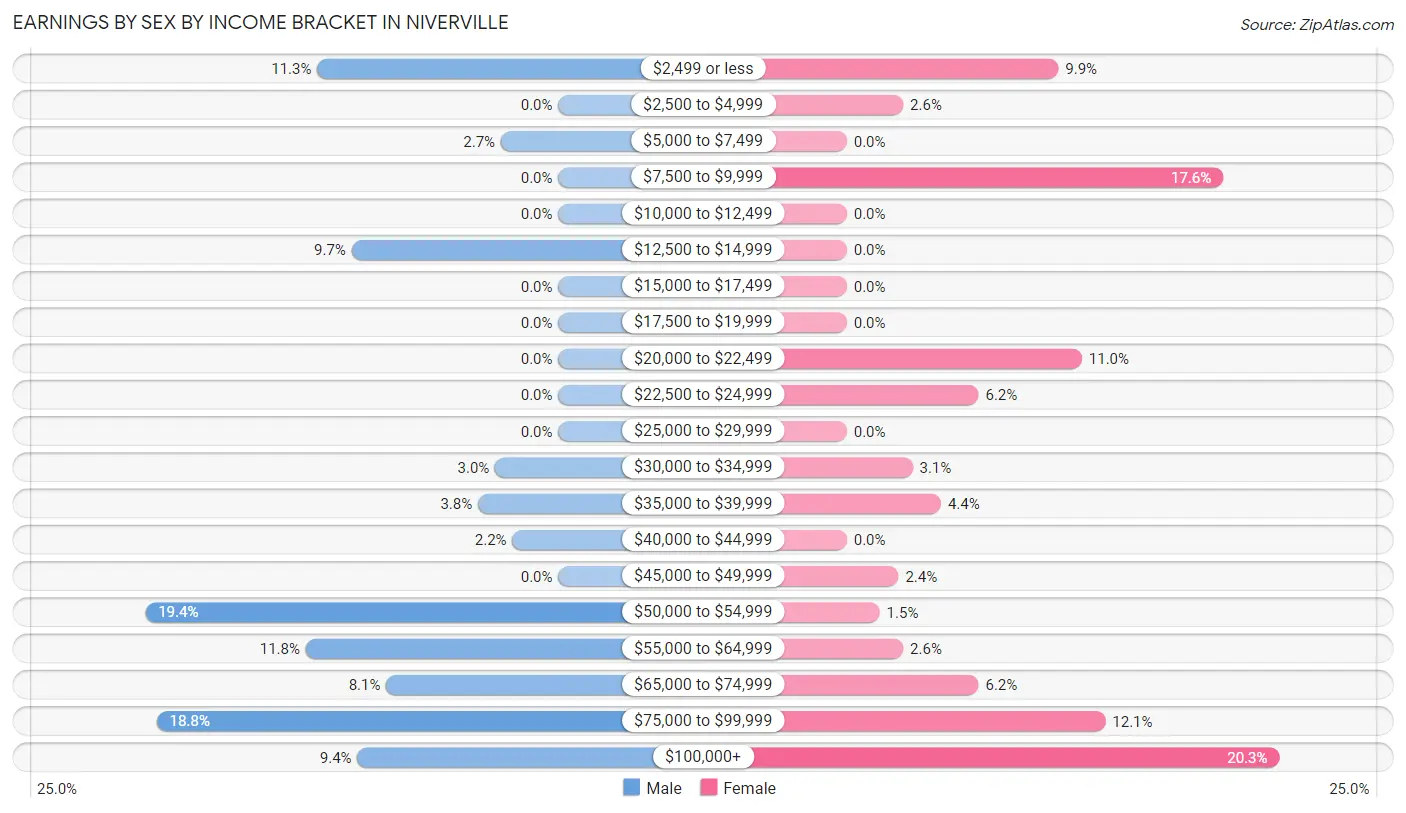
| Income | Male | Female |
| $2,499 or less | 42 (11.3%) | 45 (9.9%) |
| $2,500 to $4,999 | 0 (0.0%) | 12 (2.6%) |
| $5,000 to $7,499 | 10 (2.7%) | 0 (0.0%) |
| $7,500 to $9,999 | 0 (0.0%) | 80 (17.6%) |
| $10,000 to $12,499 | 0 (0.0%) | 0 (0.0%) |
| $12,500 to $14,999 | 36 (9.7%) | 0 (0.0%) |
| $15,000 to $17,499 | 0 (0.0%) | 0 (0.0%) |
| $17,500 to $19,999 | 0 (0.0%) | 0 (0.0%) |
| $20,000 to $22,499 | 0 (0.0%) | 50 (11.0%) |
| $22,500 to $24,999 | 0 (0.0%) | 28 (6.2%) |
| $25,000 to $29,999 | 0 (0.0%) | 0 (0.0%) |
| $30,000 to $34,999 | 11 (3.0%) | 14 (3.1%) |
| $35,000 to $39,999 | 14 (3.8%) | 20 (4.4%) |
| $40,000 to $44,999 | 8 (2.1%) | 0 (0.0%) |
| $45,000 to $49,999 | 0 (0.0%) | 11 (2.4%) |
| $50,000 to $54,999 | 72 (19.4%) | 7 (1.5%) |
| $55,000 to $64,999 | 44 (11.8%) | 12 (2.6%) |
| $65,000 to $74,999 | 30 (8.1%) | 28 (6.2%) |
| $75,000 to $99,999 | 70 (18.8%) | 55 (12.1%) |
| $100,000+ | 35 (9.4%) | 92 (20.3%) |
| Total | 372 (100.0%) | 454 (100.0%) |
Earnings by Sex by Educational Attainment in Niverville
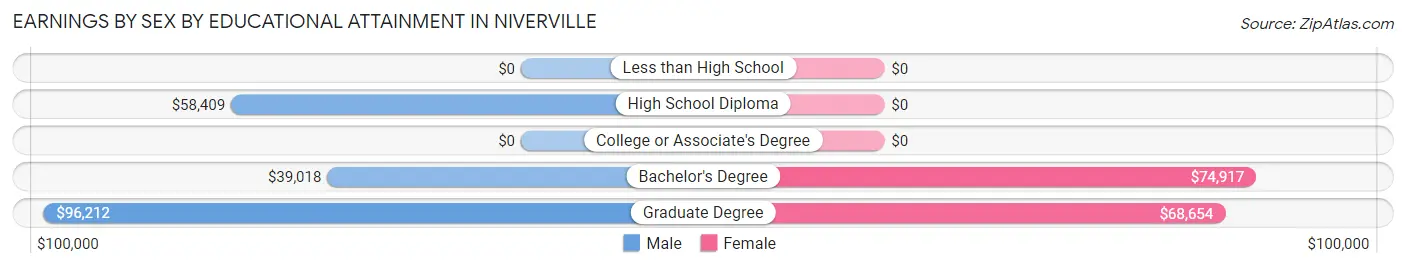
| Educational Attainment | Male Income | Female Income |
| Less than High School | - | - |
| High School Diploma | $58,409 | $0 |
| College or Associate's Degree | - | - |
| Bachelor's Degree | $39,018 | $74,917 |
| Graduate Degree | $96,212 | $68,654 |
| Total | $59,318 | $0 |
Family Income in Niverville
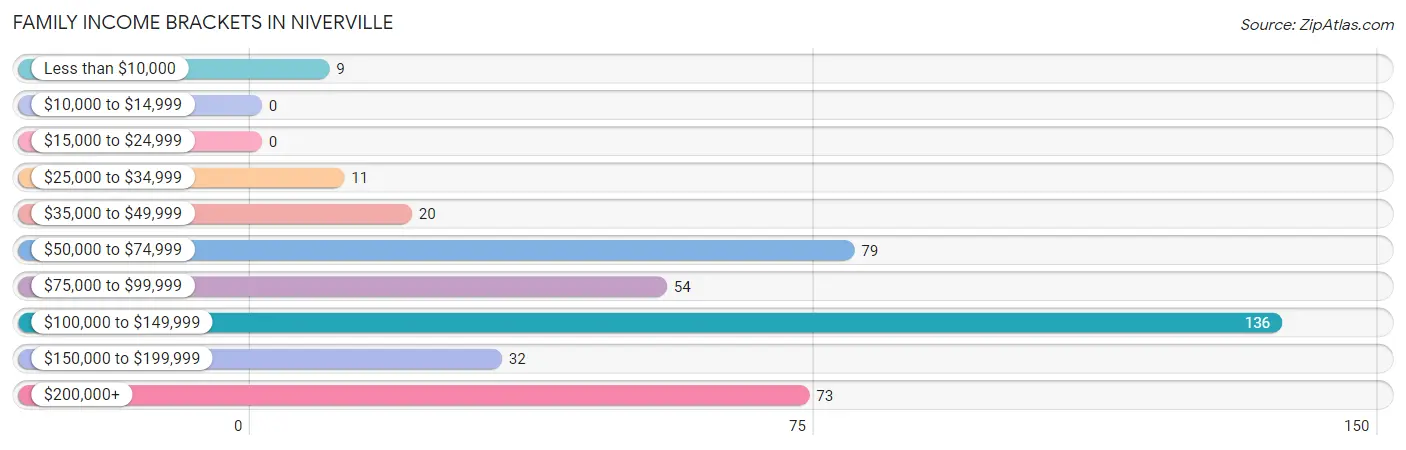
Family Income Brackets in Niverville
According to the Niverville family income data, there are 136 families falling into the $100,000 to $149,999 income range, which is the most common income bracket and makes up 32.9% of all families.
| Income Bracket | # Families | % Families |
| Less than $10,000 | 9 | 2.2% |
| $10,000 to $14,999 | 0 | 0.0% |
| $15,000 to $24,999 | 0 | 0.0% |
| $25,000 to $34,999 | 11 | 2.7% |
| $35,000 to $49,999 | 20 | 4.8% |
| $50,000 to $74,999 | 79 | 19.1% |
| $75,000 to $99,999 | 54 | 13.0% |
| $100,000 to $149,999 | 136 | 32.9% |
| $150,000 to $199,999 | 32 | 7.7% |
| $200,000+ | 73 | 17.6% |
Family Income by Famaliy Size in Niverville
2-person families (169 | 40.8%) account for the highest median family income in Niverville with $195,820 per family, while 2-person families (169 | 40.8%) have the highest median income of $97,910 per family member.
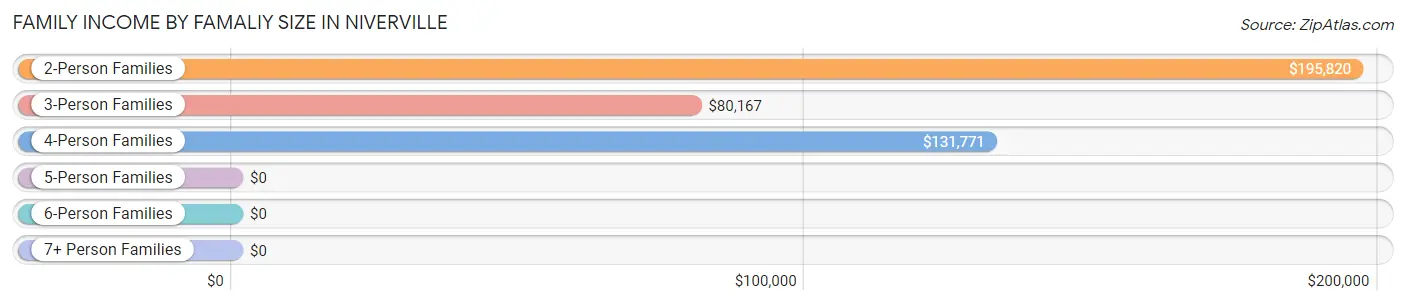
| Income Bracket | # Families | Median Income |
| 2-Person Families | 169 (40.8%) | $195,820 |
| 3-Person Families | 162 (39.1%) | $80,167 |
| 4-Person Families | 63 (15.2%) | $131,771 |
| 5-Person Families | 20 (4.8%) | $0 |
| 6-Person Families | 0 (0.0%) | $0 |
| 7+ Person Families | 0 (0.0%) | $0 |
| Total | 414 (100.0%) | $125,541 |
Family Income by Number of Earners in Niverville
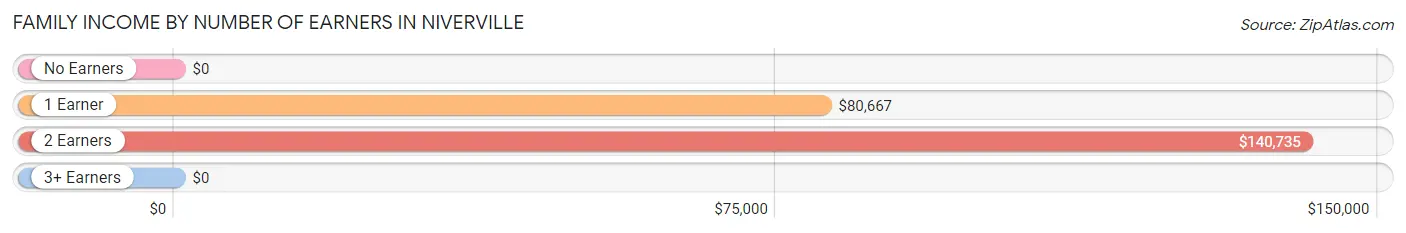
| Number of Earners | # Families | Median Income |
| No Earners | 26 (6.3%) | $0 |
| 1 Earner | 196 (47.3%) | $80,667 |
| 2 Earners | 144 (34.8%) | $140,735 |
| 3+ Earners | 48 (11.6%) | $0 |
| Total | 414 (100.0%) | $125,541 |
Household Income in Niverville
Household Income Brackets in Niverville
With 146 households falling in the category, the $100,000 to $149,999 income range is the most frequent in Niverville, accounting for 28.5% of all households.
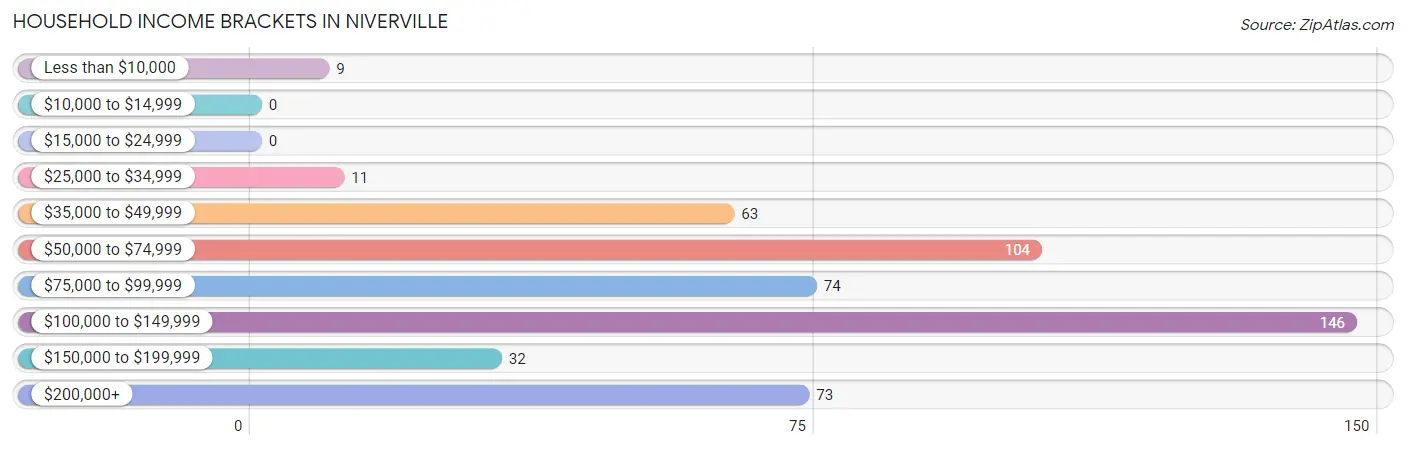
| Income Bracket | # Households | % Households |
| Less than $10,000 | 9 | 1.8% |
| $10,000 to $14,999 | 0 | 0.0% |
| $15,000 to $24,999 | 0 | 0.0% |
| $25,000 to $34,999 | 11 | 2.1% |
| $35,000 to $49,999 | 63 | 12.3% |
| $50,000 to $74,999 | 104 | 20.3% |
| $75,000 to $99,999 | 74 | 14.5% |
| $100,000 to $149,999 | 146 | 28.5% |
| $150,000 to $199,999 | 32 | 6.3% |
| $200,000+ | 73 | 14.3% |
Household Income by Householder Age in Niverville
The median household income in Niverville is $96,607, with the highest median household income of $195,820 found in the 45 to 64 years age bracket for the primary householder. A total of 99 households (19.3%) fall into this category.
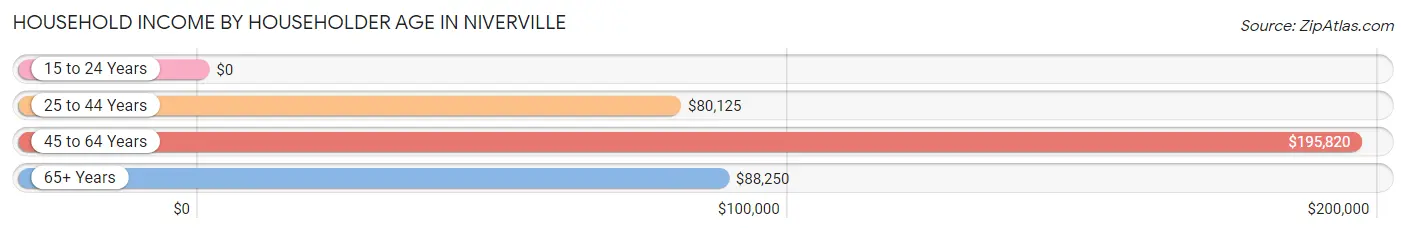
| Income Bracket | # Households | Median Income |
| 15 to 24 Years | 0 (0.0%) | $0 |
| 25 to 44 Years | 223 (43.5%) | $80,125 |
| 45 to 64 Years | 99 (19.3%) | $195,820 |
| 65+ Years | 190 (37.1%) | $88,250 |
| Total | 512 (100.0%) | $96,607 |
Poverty in Niverville
Income Below Poverty by Sex and Age in Niverville
With 9.0% poverty level for males and 11.4% for females among the residents of Niverville, 65 to 74 year old males and 25 to 34 year old females are the most vulnerable to poverty, with 55 males (49.1%) and 80 females (46.2%) in their respective age groups living below the poverty level.
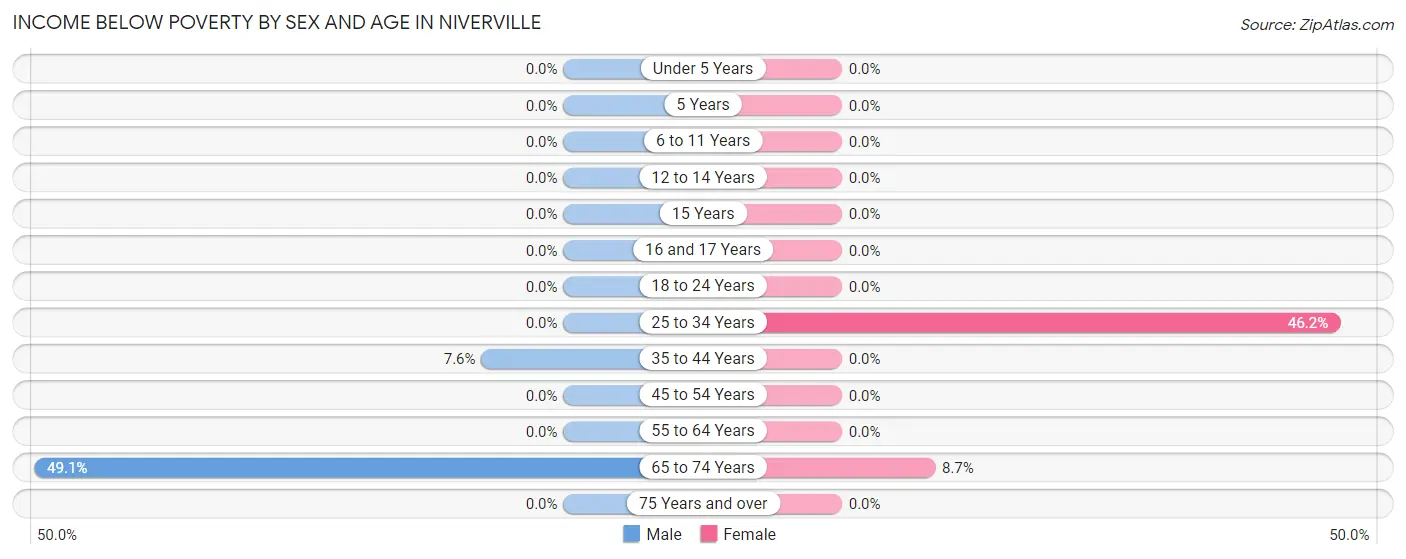
| Age Bracket | Male | Female |
| Under 5 Years | 0 (0.0%) | 0 (0.0%) |
| 5 Years | 0 (0.0%) | 0 (0.0%) |
| 6 to 11 Years | 0 (0.0%) | 0 (0.0%) |
| 12 to 14 Years | 0 (0.0%) | 0 (0.0%) |
| 15 Years | 0 (0.0%) | 0 (0.0%) |
| 16 and 17 Years | 0 (0.0%) | 0 (0.0%) |
| 18 to 24 Years | 0 (0.0%) | 0 (0.0%) |
| 25 to 34 Years | 0 (0.0%) | 80 (46.2%) |
| 35 to 44 Years | 7 (7.6%) | 0 (0.0%) |
| 45 to 54 Years | 0 (0.0%) | 0 (0.0%) |
| 55 to 64 Years | 0 (0.0%) | 0 (0.0%) |
| 65 to 74 Years | 55 (49.1%) | 9 (8.6%) |
| 75 Years and over | 0 (0.0%) | 0 (0.0%) |
| Total | 62 (9.0%) | 89 (11.4%) |
Income Above Poverty by Sex and Age in Niverville
According to the poverty statistics in Niverville, males aged under 5 years and females aged under 5 years are the age groups that are most secure financially, with 100.0% of males and 100.0% of females in these age groups living above the poverty line.
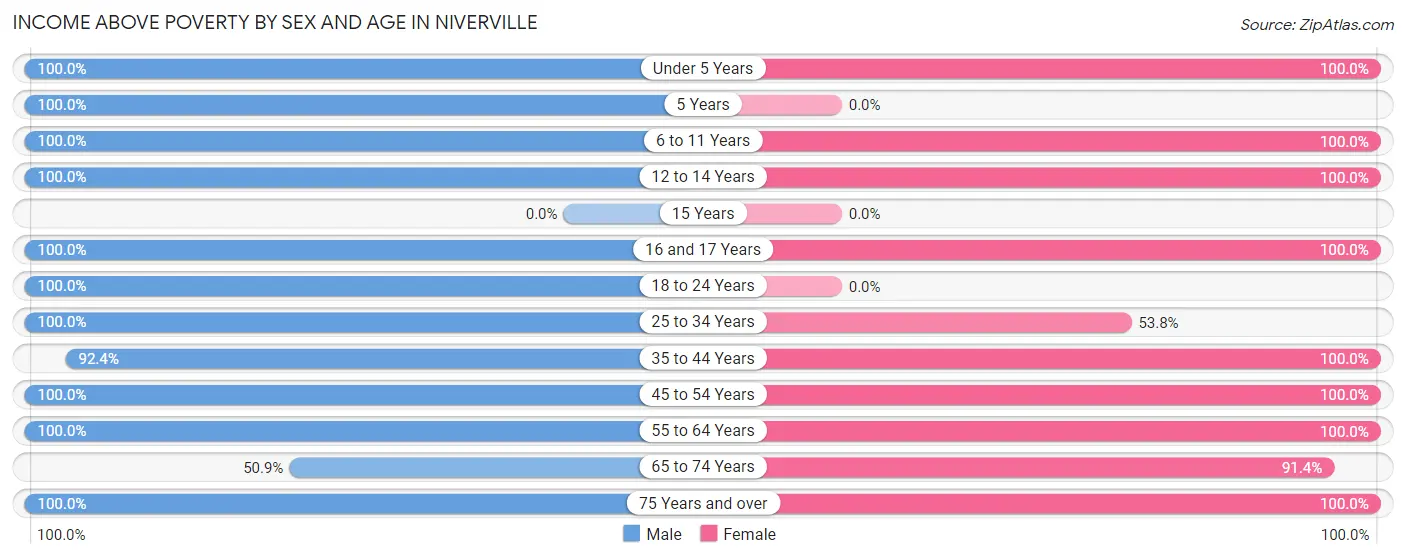
| Age Bracket | Male | Female |
| Under 5 Years | 62 (100.0%) | 19 (100.0%) |
| 5 Years | 11 (100.0%) | 0 (0.0%) |
| 6 to 11 Years | 84 (100.0%) | 118 (100.0%) |
| 12 to 14 Years | 31 (100.0%) | 61 (100.0%) |
| 15 Years | 0 (0.0%) | 0 (0.0%) |
| 16 and 17 Years | 21 (100.0%) | 12 (100.0%) |
| 18 to 24 Years | 57 (100.0%) | 0 (0.0%) |
| 25 to 34 Years | 88 (100.0%) | 93 (53.8%) |
| 35 to 44 Years | 85 (92.4%) | 119 (100.0%) |
| 45 to 54 Years | 8 (100.0%) | 56 (100.0%) |
| 55 to 64 Years | 109 (100.0%) | 92 (100.0%) |
| 65 to 74 Years | 57 (50.9%) | 95 (91.3%) |
| 75 Years and over | 10 (100.0%) | 24 (100.0%) |
| Total | 623 (90.9%) | 689 (88.6%) |
Income Below Poverty Among Married-Couple Families in Niverville
The poverty statistics for married-couple families in Niverville show that 3.6% or 9 of the total 253 families live below the poverty line. Families with no children have the highest poverty rate of 5.3%, comprising of 9 families. On the other hand, families with 1 or 2 children have the lowest poverty rate of 0.0%, which includes 0 families.
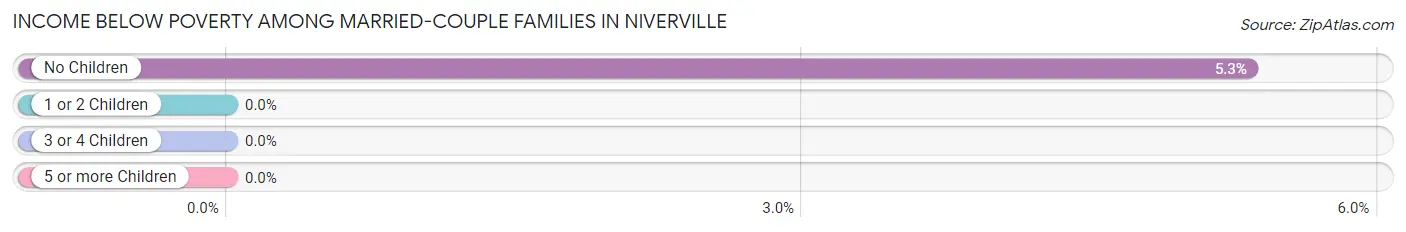
| Children | Above Poverty | Below Poverty |
| No Children | 160 (94.7%) | 9 (5.3%) |
| 1 or 2 Children | 84 (100.0%) | 0 (0.0%) |
| 3 or 4 Children | 0 (0.0%) | 0 (0.0%) |
| 5 or more Children | 0 (0.0%) | 0 (0.0%) |
| Total | 244 (96.4%) | 9 (3.6%) |
Income Below Poverty Among Single-Parent Households in Niverville
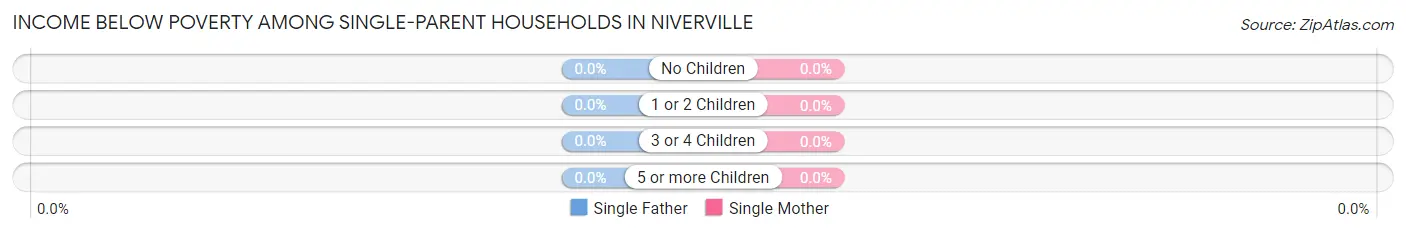
| Children | Single Father | Single Mother |
| No Children | 0 (0.0%) | 0 (0.0%) |
| 1 or 2 Children | 0 (0.0%) | 0 (0.0%) |
| 3 or 4 Children | 0 (0.0%) | 0 (0.0%) |
| 5 or more Children | 0 (0.0%) | 0 (0.0%) |
| Total | 0 (0.0%) | 0 (0.0%) |
Income Below Poverty Among Married-Couple vs Single-Parent Households in Niverville
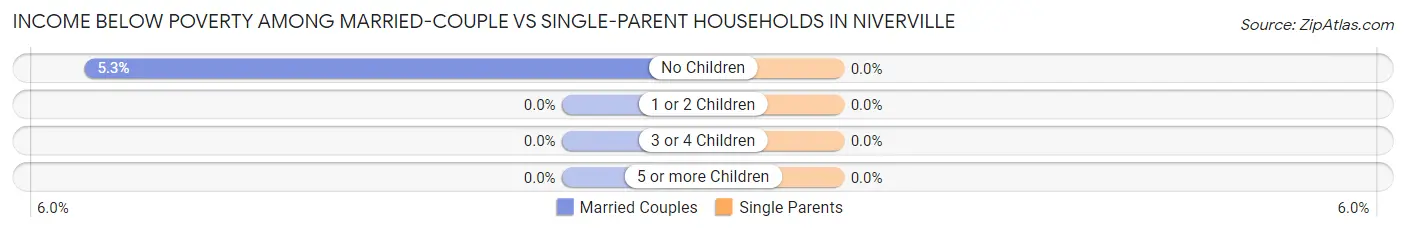
| Children | Married-Couple Families | Single-Parent Households |
| No Children | 9 (5.3%) | 0 (0.0%) |
| 1 or 2 Children | 0 (0.0%) | 0 (0.0%) |
| 3 or 4 Children | 0 (0.0%) | 0 (0.0%) |
| 5 or more Children | 0 (0.0%) | 0 (0.0%) |
| Total | 9 (3.6%) | 0 (0.0%) |
Race in Niverville
The most populous races in Niverville are White / Caucasian (1,403 | 95.9%), and Two or more Races (60 | 4.1%).
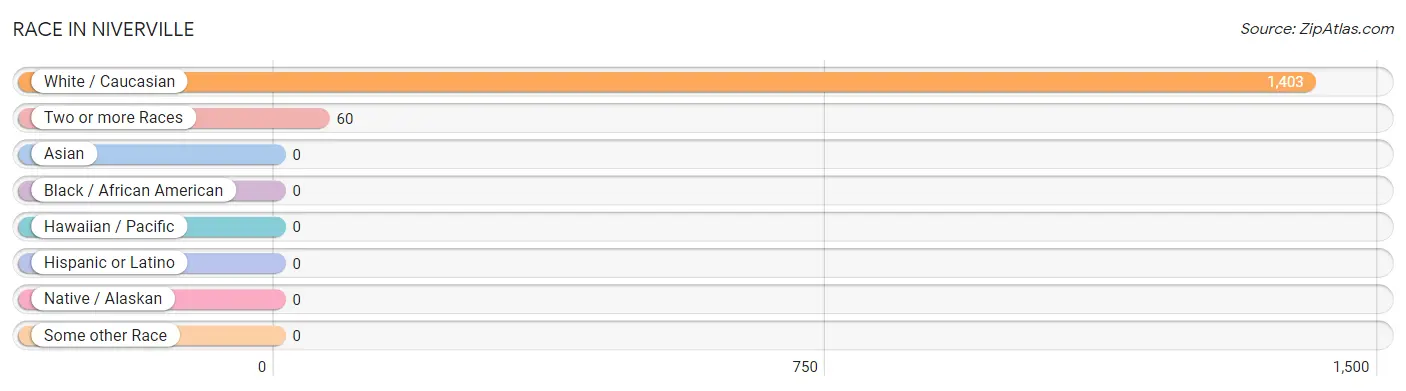
| Race | # Population | % Population |
| Asian | 0 | 0.0% |
| Black / African American | 0 | 0.0% |
| Hawaiian / Pacific | 0 | 0.0% |
| Hispanic or Latino | 0 | 0.0% |
| Native / Alaskan | 0 | 0.0% |
| White / Caucasian | 1,403 | 95.9% |
| Two or more Races | 60 | 4.1% |
| Some other Race | 0 | 0.0% |
| Total | 1,463 | 100.0% |
Ancestry in Niverville
The most populous ancestries reported in Niverville are American (202 | 13.8%), Polish (178 | 12.2%), Russian (163 | 11.1%), English (161 | 11.0%), and Irish (155 | 10.6%), together accounting for 58.7% of all Niverville residents.
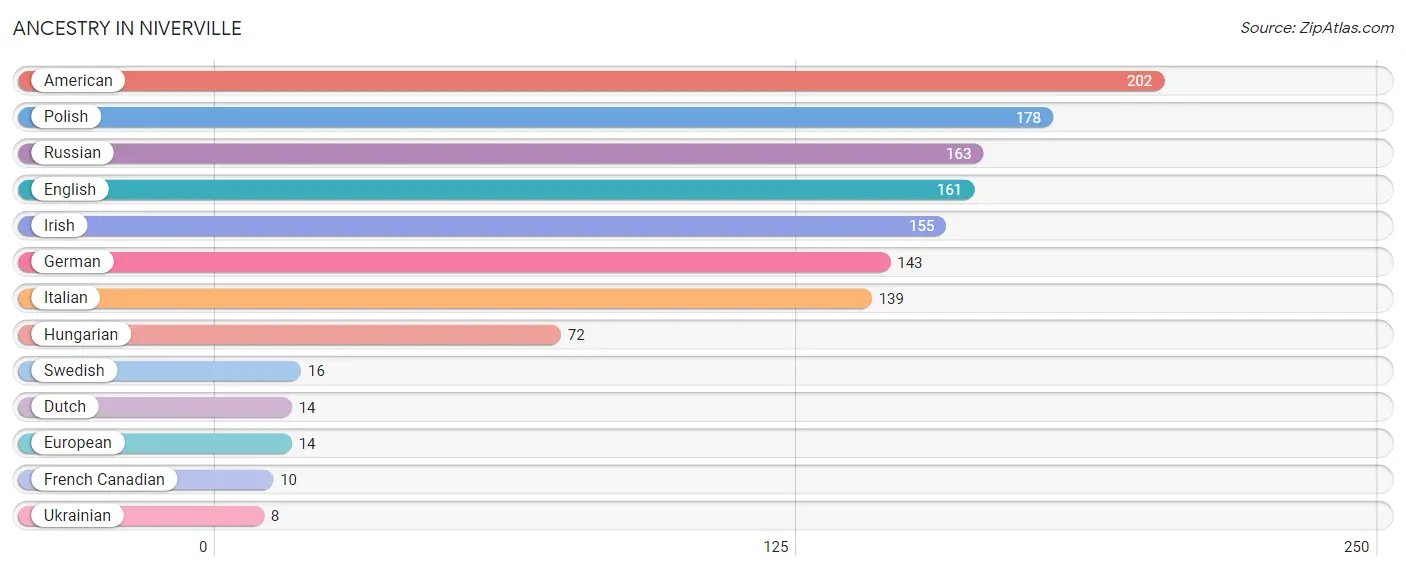
| Ancestry | # Population | % Population |
| American | 202 | 13.8% |
| Dutch | 14 | 1.0% |
| English | 161 | 11.0% |
| European | 14 | 1.0% |
| French Canadian | 10 | 0.7% |
| German | 143 | 9.8% |
| Hungarian | 72 | 4.9% |
| Irish | 155 | 10.6% |
| Italian | 139 | 9.5% |
| Polish | 178 | 12.2% |
| Russian | 163 | 11.1% |
| Swedish | 16 | 1.1% |
| Ukrainian | 8 | 0.5% | View All 13 Rows |
Immigrants in Niverville

| Immigration Origin | # Population | % Population | View All 0 Rows |
Sex and Age in Niverville
Sex and Age in Niverville
The most populous age groups in Niverville are 60 to 64 Years (109 | 15.9%) for men and 10 to 14 Years (163 | 20.9%) for women.
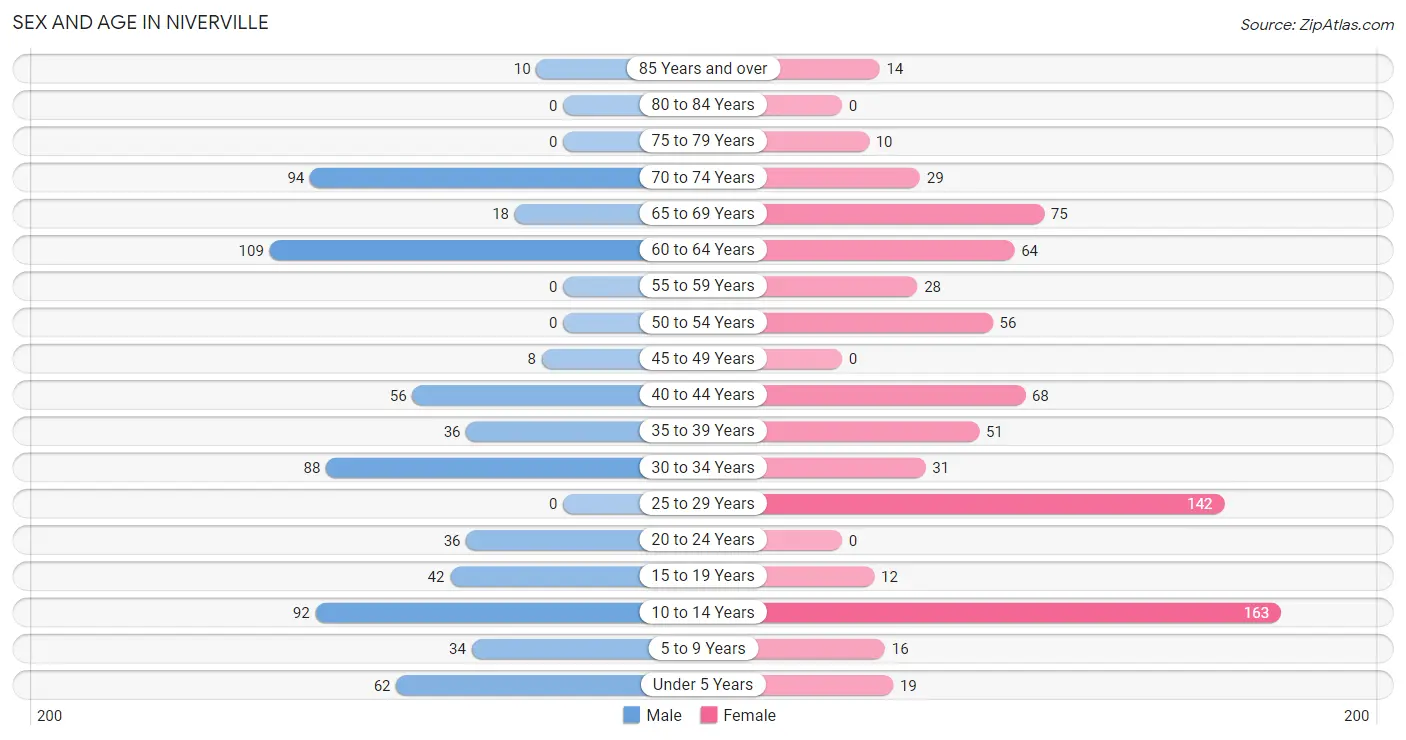
| Age Bracket | Male | Female |
| Under 5 Years | 62 (9.0%) | 19 (2.4%) |
| 5 to 9 Years | 34 (5.0%) | 16 (2.1%) |
| 10 to 14 Years | 92 (13.4%) | 163 (20.9%) |
| 15 to 19 Years | 42 (6.1%) | 12 (1.5%) |
| 20 to 24 Years | 36 (5.3%) | 0 (0.0%) |
| 25 to 29 Years | 0 (0.0%) | 142 (18.2%) |
| 30 to 34 Years | 88 (12.9%) | 31 (4.0%) |
| 35 to 39 Years | 36 (5.3%) | 51 (6.6%) |
| 40 to 44 Years | 56 (8.2%) | 68 (8.7%) |
| 45 to 49 Years | 8 (1.2%) | 0 (0.0%) |
| 50 to 54 Years | 0 (0.0%) | 56 (7.2%) |
| 55 to 59 Years | 0 (0.0%) | 28 (3.6%) |
| 60 to 64 Years | 109 (15.9%) | 64 (8.2%) |
| 65 to 69 Years | 18 (2.6%) | 75 (9.6%) |
| 70 to 74 Years | 94 (13.7%) | 29 (3.7%) |
| 75 to 79 Years | 0 (0.0%) | 10 (1.3%) |
| 80 to 84 Years | 0 (0.0%) | 0 (0.0%) |
| 85 Years and over | 10 (1.5%) | 14 (1.8%) |
| Total | 685 (100.0%) | 778 (100.0%) |
Families and Households in Niverville
Median Family Size in Niverville
The median family size in Niverville is 2.93 persons per family, with married-couple families (253 | 61.1%) accounting for the largest median family size of 3.09 persons per family. On the other hand, single female/mother families (89 | 21.5%) represent the smallest median family size with 2.52 persons per family.
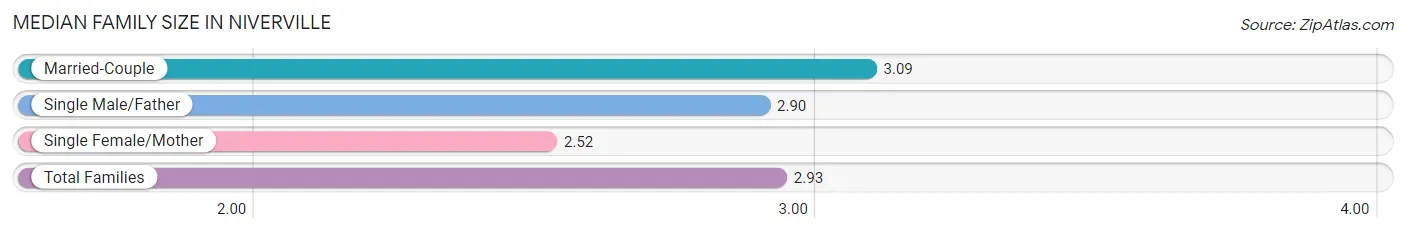
| Family Type | # Families | Family Size |
| Married-Couple | 253 (61.1%) | 3.09 |
| Single Male/Father | 72 (17.4%) | 2.90 |
| Single Female/Mother | 89 (21.5%) | 2.52 |
| Total Families | 414 (100.0%) | 2.93 |
Median Household Size in Niverville
The median household size in Niverville is 2.86 persons per household, with single male/father households (72 | 14.1%) accounting for the largest median household size of 4.01 persons per household. non-family households (98 | 19.1%) represent the smallest median household size with 1.64 persons per household.
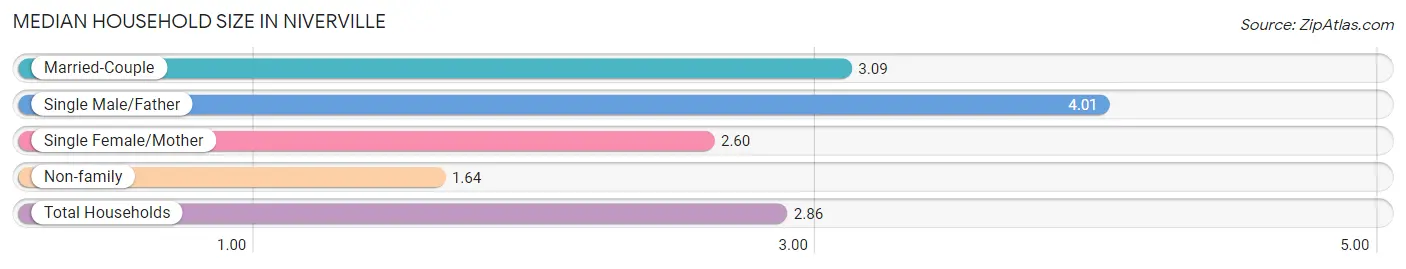
| Household Type | # Households | Household Size |
| Married-Couple | 253 (49.4%) | 3.09 |
| Single Male/Father | 72 (14.1%) | 4.01 |
| Single Female/Mother | 89 (17.4%) | 2.60 |
| Non-family | 98 (19.1%) | 1.64 |
| Total Households | 512 (100.0%) | 2.86 |
Household Size by Marriage Status in Niverville
Out of a total of 512 households in Niverville, 414 (80.9%) are family households, while 98 (19.1%) are nonfamily households. The most numerous type of family households are 2-person households, comprising 169, and the most common type of nonfamily households are 1-person households, comprising 50.
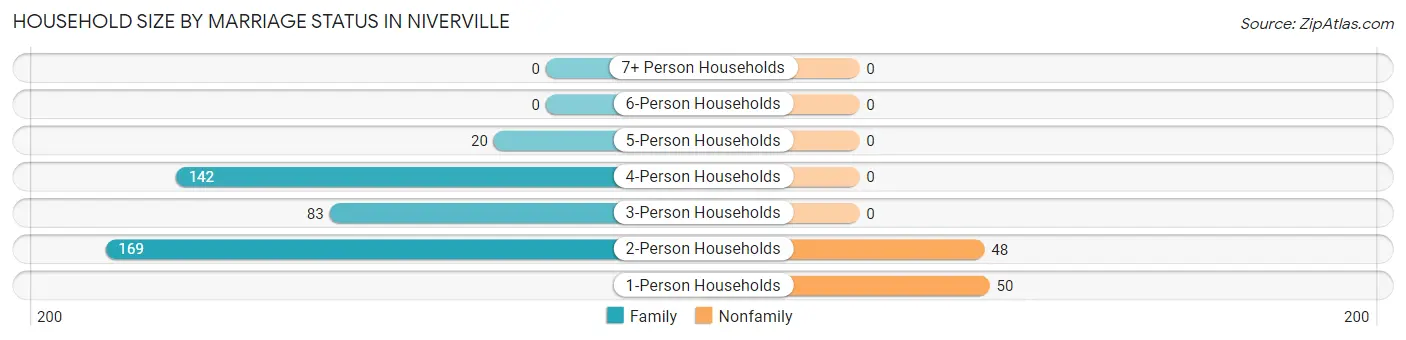
| Household Size | Family Households | Nonfamily Households |
| 1-Person Households | - | 50 (9.8%) |
| 2-Person Households | 169 (33.0%) | 48 (9.4%) |
| 3-Person Households | 83 (16.2%) | 0 (0.0%) |
| 4-Person Households | 142 (27.7%) | 0 (0.0%) |
| 5-Person Households | 20 (3.9%) | 0 (0.0%) |
| 6-Person Households | 0 (0.0%) | 0 (0.0%) |
| 7+ Person Households | 0 (0.0%) | 0 (0.0%) |
| Total | 414 (80.9%) | 98 (19.1%) |
Female Fertility in Niverville
Fertility by Age in Niverville
Average fertility rate in Niverville is 48.0 births per 1,000 women. Women in the age bracket of 20 to 34 years have the highest fertility rate with 87.0 births per 1,000 women. Women in the age bracket of 20 to 34 years acount for 100.0% of all women with births.
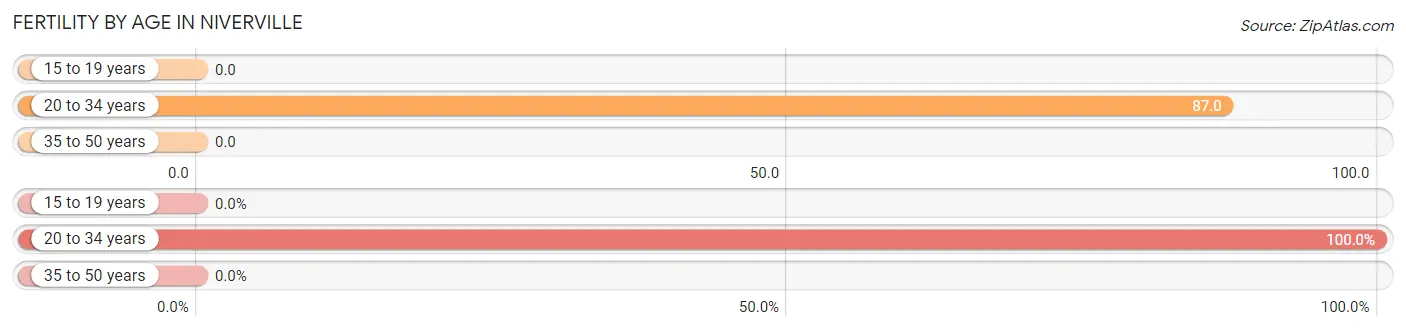
| Age Bracket | Women with Births | Births / 1,000 Women |
| 15 to 19 years | 0 (0.0%) | 0.0 |
| 20 to 34 years | 15 (100.0%) | 87.0 |
| 35 to 50 years | 0 (0.0%) | 0.0 |
| Total | 15 (100.0%) | 48.0 |
Fertility by Age by Marriage Status in Niverville
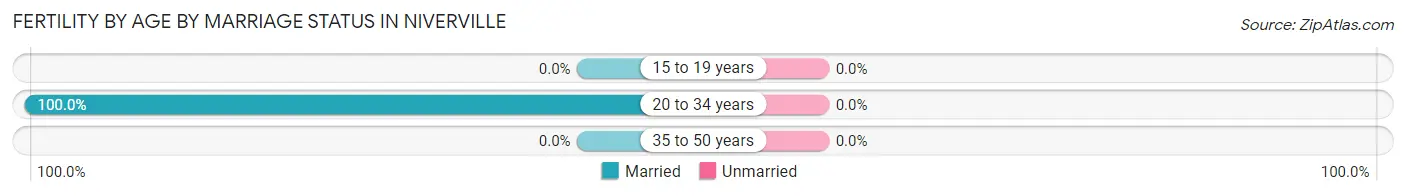
| Age Bracket | Married | Unmarried |
| 15 to 19 years | 0 (0.0%) | 0 (0.0%) |
| 20 to 34 years | 15 (100.0%) | 0 (0.0%) |
| 35 to 50 years | 0 (0.0%) | 0 (0.0%) |
| Total | 15 (100.0%) | 0 (0.0%) |
Fertility by Education in Niverville
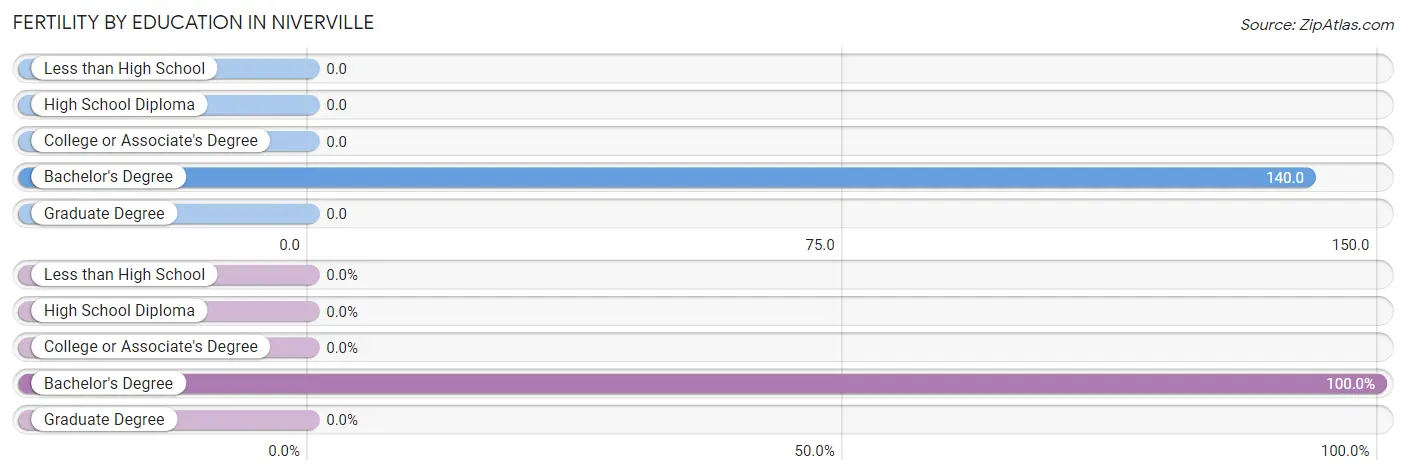
| Educational Attainment | Women with Births | Births / 1,000 Women |
| Less than High School | 0 (0.0%) | 0.0 |
| High School Diploma | 0 (0.0%) | 0.0 |
| College or Associate's Degree | 0 (0.0%) | 0.0 |
| Bachelor's Degree | 15 (100.0%) | 140.0 |
| Graduate Degree | 0 (0.0%) | 0.0 |
| Total | 15 (100.0%) | 48.0 |
Fertility by Education by Marriage Status in Niverville
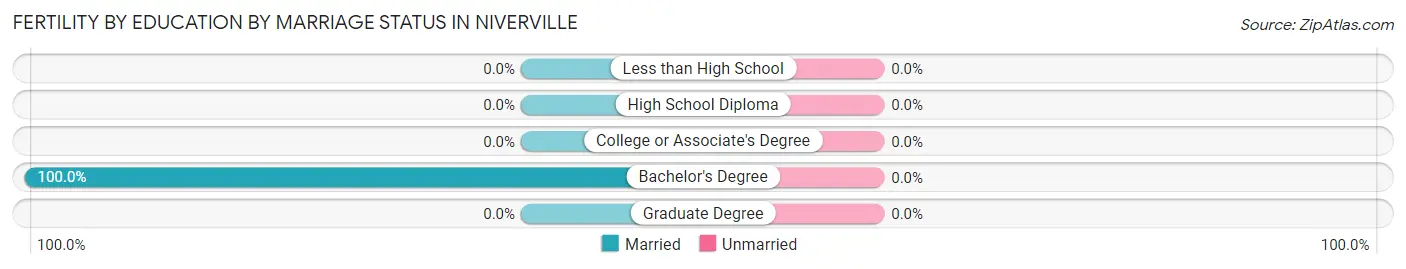
| Educational Attainment | Married | Unmarried |
| Less than High School | 0 (0.0%) | 0 (0.0%) |
| High School Diploma | 0 (0.0%) | 0 (0.0%) |
| College or Associate's Degree | 0 (0.0%) | 0 (0.0%) |
| Bachelor's Degree | 15 (100.0%) | 0 (0.0%) |
| Graduate Degree | 0 (0.0%) | 0 (0.0%) |
| Total | 15 (100.0%) | 0 (0.0%) |
Employment Characteristics in Niverville
Employment by Class of Employer in Niverville
Among the 643 employed individuals in Niverville, private company employees (405 | 63.0%), self-employed (not incorporated) (118 | 18.3%), and local government employees (94 | 14.6%) make up the most common classes of employment.
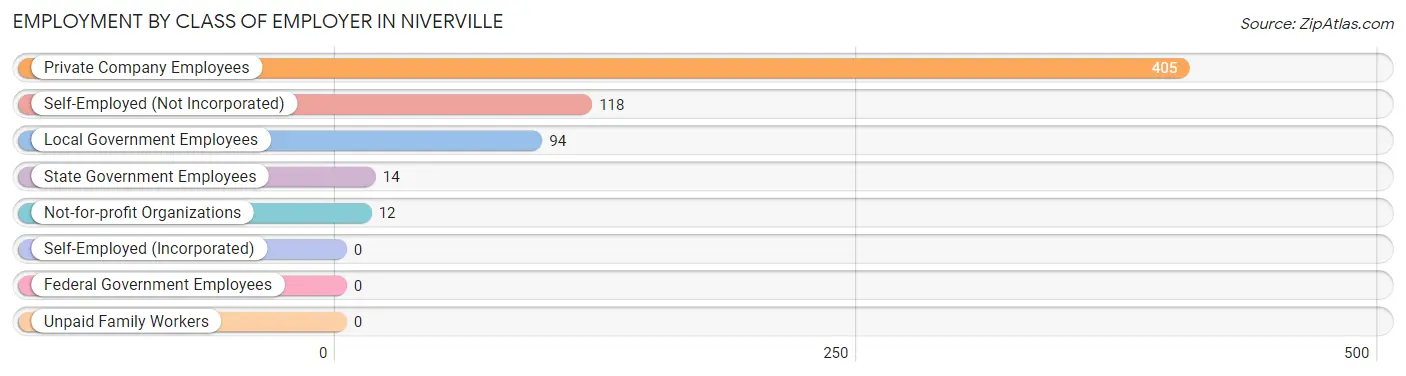
| Employer Class | # Employees | % Employees |
| Private Company Employees | 405 | 63.0% |
| Self-Employed (Incorporated) | 0 | 0.0% |
| Self-Employed (Not Incorporated) | 118 | 18.3% |
| Not-for-profit Organizations | 12 | 1.9% |
| Local Government Employees | 94 | 14.6% |
| State Government Employees | 14 | 2.2% |
| Federal Government Employees | 0 | 0.0% |
| Unpaid Family Workers | 0 | 0.0% |
| Total | 643 | 100.0% |
Employment Status by Age in Niverville
According to the labor force statistics for Niverville, out of the total population over 16 years of age (1,077), 72.1% or 777 individuals are in the labor force, with 13.1% or 102 of them unemployed. The age group with the highest labor force participation rate is 20 to 24 years, with 100.0% or 36 individuals in the labor force. Within the labor force, the 45 to 54 years age range has the highest percentage of unemployed individuals, with 78.1% or 50 of them being unemployed.
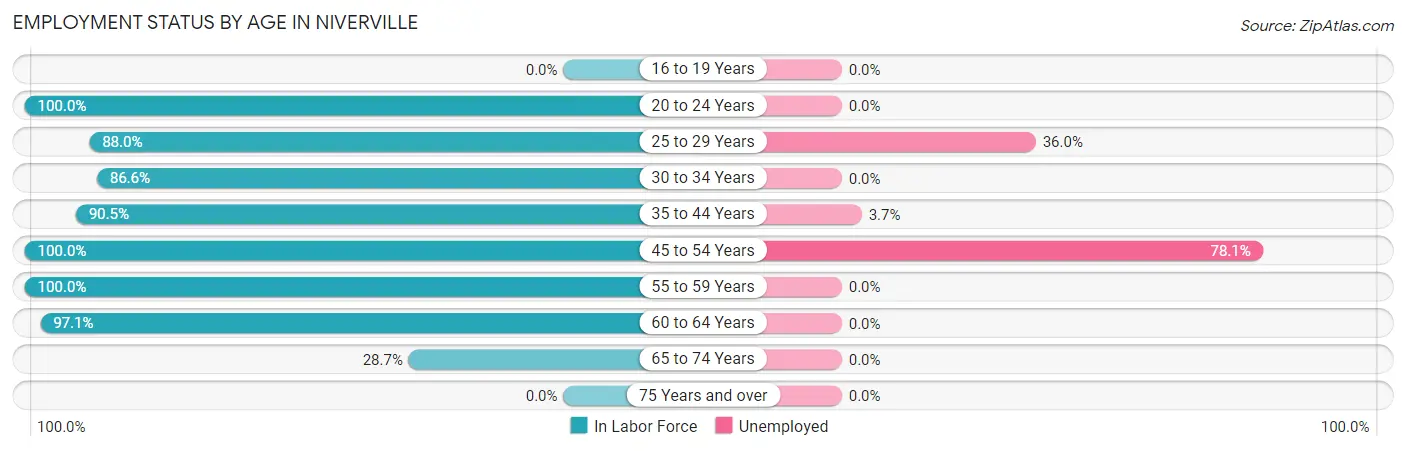
| Age Bracket | In Labor Force | Unemployed |
| 16 to 19 Years | 0 (0.0%) | 0 (0.0%) |
| 20 to 24 Years | 36 (100.0%) | 0 (0.0%) |
| 25 to 29 Years | 125 (88.0%) | 45 (36.0%) |
| 30 to 34 Years | 103 (86.6%) | 0 (0.0%) |
| 35 to 44 Years | 191 (90.5%) | 7 (3.7%) |
| 45 to 54 Years | 64 (100.0%) | 50 (78.1%) |
| 55 to 59 Years | 28 (100.0%) | 0 (0.0%) |
| 60 to 64 Years | 168 (97.1%) | 0 (0.0%) |
| 65 to 74 Years | 62 (28.7%) | 0 (0.0%) |
| 75 Years and over | 0 (0.0%) | 0 (0.0%) |
| Total | 777 (72.1%) | 102 (13.1%) |
Employment Status by Educational Attainment in Niverville
According to labor force statistics for Niverville, 92.1% of individuals (679) out of the total population between 25 and 64 years of age (737) are in the labor force, with 15.0% or 102 of them being unemployed. The group with the highest labor force participation rate are those with the educational attainment of less than high school, with 100.0% or 12 individuals in the labor force. Within the labor force, individuals with college / associate degree education have the highest percentage of unemployment, with 29.1% or 57 of them being unemployed.
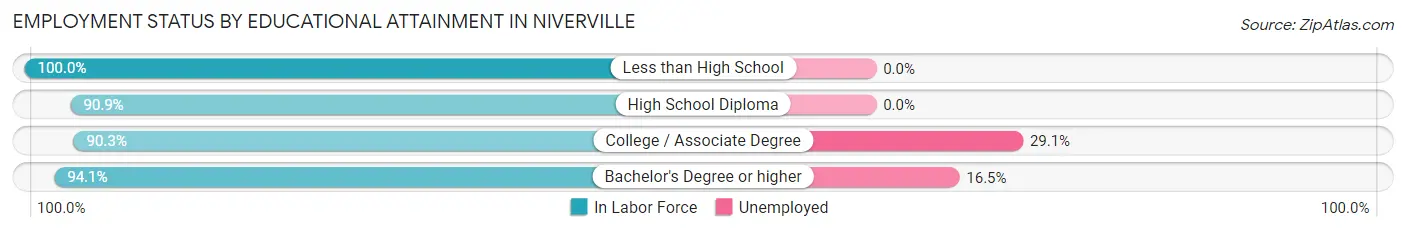
| Educational Attainment | In Labor Force | Unemployed |
| Less than High School | 12 (100.0%) | 0 (0.0%) |
| High School Diploma | 199 (90.9%) | 0 (0.0%) |
| College / Associate Degree | 196 (90.3%) | 63 (29.1%) |
| Bachelor's Degree or higher | 272 (94.1%) | 48 (16.5%) |
| Total | 679 (92.1%) | 111 (15.0%) |
Employment Occupations by Sex in Niverville
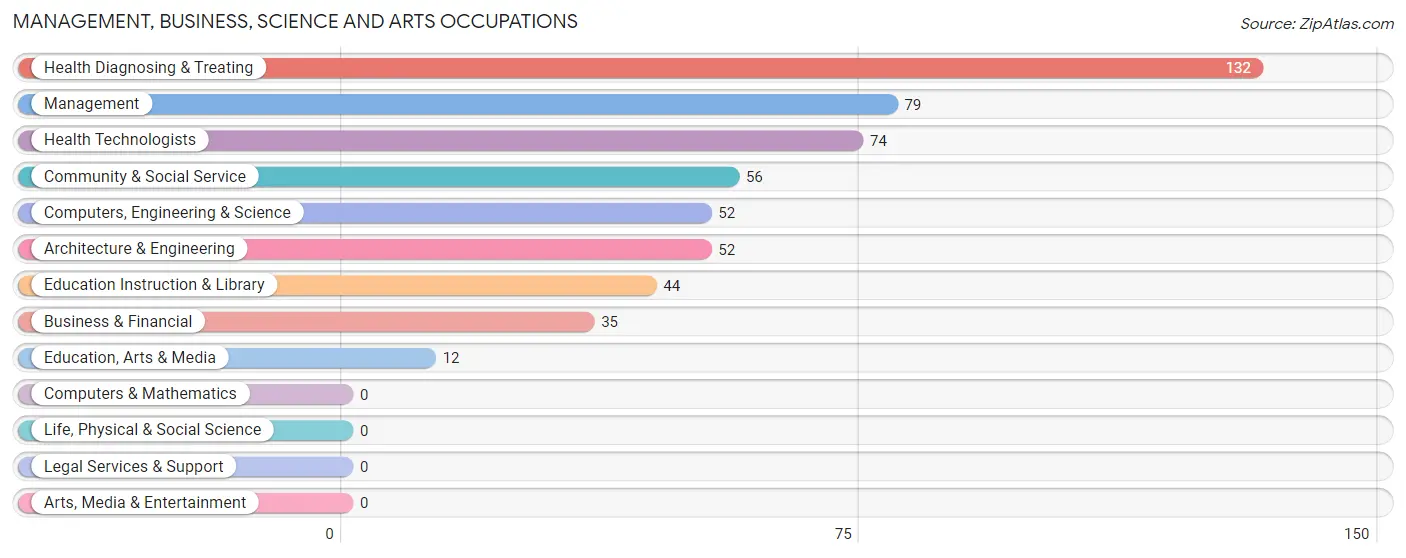
Management, Business, Science and Arts Occupations
The most common Management, Business, Science and Arts occupations in Niverville are Health Diagnosing & Treating (132 | 19.6%), Management (79 | 11.7%), Health Technologists (74 | 11.0%), Community & Social Service (56 | 8.3%), and Computers, Engineering & Science (52 | 7.7%).
Management, Business, Science and Arts Occupations by Sex
Within the Management, Business, Science and Arts occupations in Niverville, the most male-oriented occupations are Management (100.0%), Computers, Engineering & Science (90.4%), and Architecture & Engineering (90.4%), while the most female-oriented occupations are Business & Financial (100.0%), Education, Arts & Media (100.0%), and Health Diagnosing & Treating (100.0%).
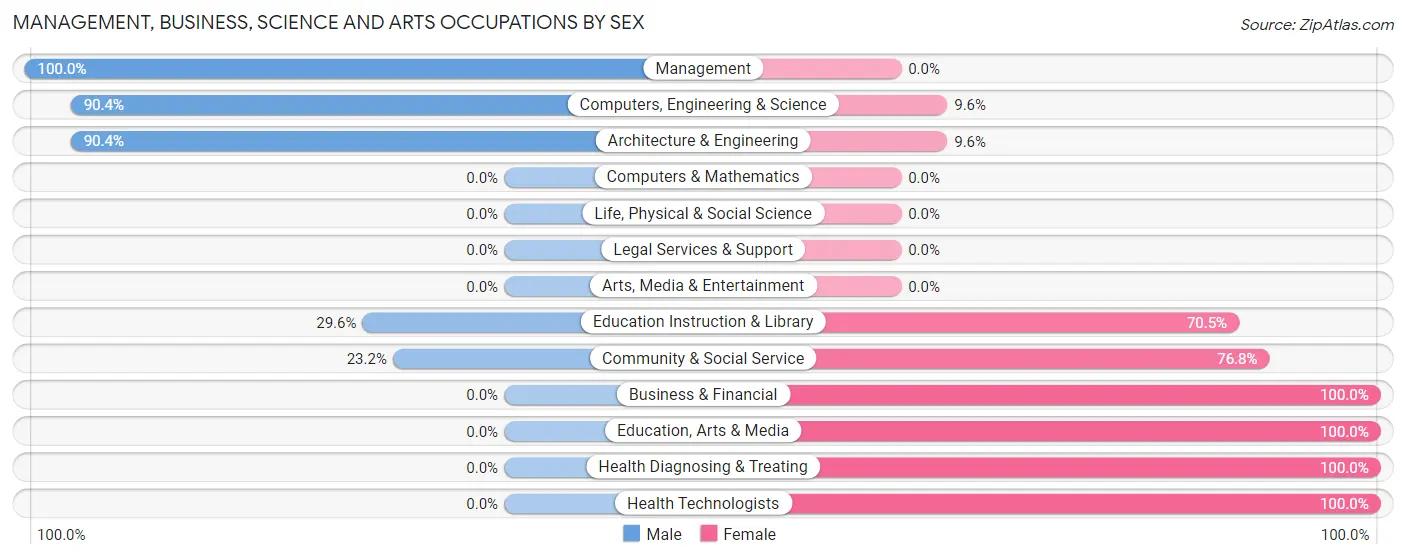
| Occupation | Male | Female |
| Management | 79 (100.0%) | 0 (0.0%) |
| Business & Financial | 0 (0.0%) | 35 (100.0%) |
| Computers, Engineering & Science | 47 (90.4%) | 5 (9.6%) |
| Computers & Mathematics | 0 (0.0%) | 0 (0.0%) |
| Architecture & Engineering | 47 (90.4%) | 5 (9.6%) |
| Life, Physical & Social Science | 0 (0.0%) | 0 (0.0%) |
| Community & Social Service | 13 (23.2%) | 43 (76.8%) |
| Education, Arts & Media | 0 (0.0%) | 12 (100.0%) |
| Legal Services & Support | 0 (0.0%) | 0 (0.0%) |
| Education Instruction & Library | 13 (29.5%) | 31 (70.5%) |
| Arts, Media & Entertainment | 0 (0.0%) | 0 (0.0%) |
| Health Diagnosing & Treating | 0 (0.0%) | 132 (100.0%) |
| Health Technologists | 0 (0.0%) | 74 (100.0%) |
| Total (Category) | 139 (39.3%) | 215 (60.7%) |
| Total (Overall) | 330 (48.9%) | 345 (51.1%) |
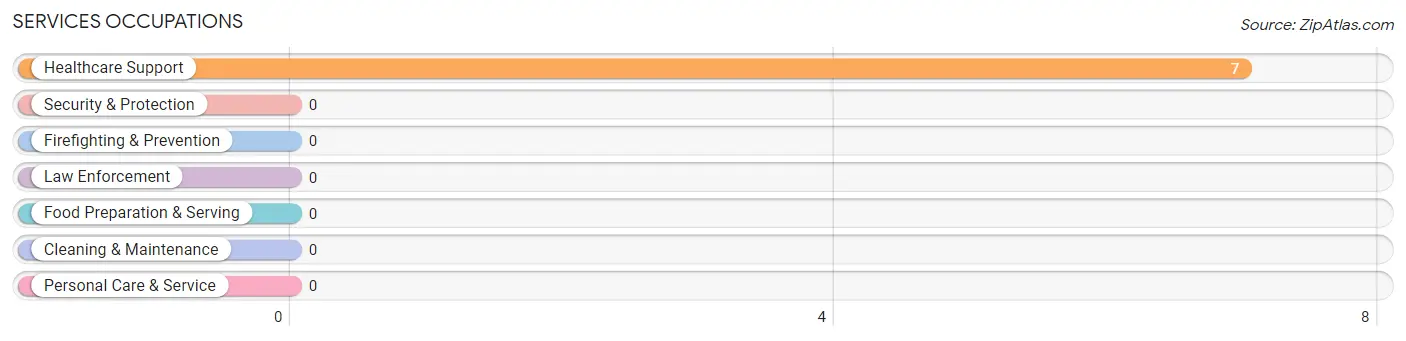
Services Occupations
The most common Services occupations in Niverville are , and Healthcare Support (7 | 1.0%).
Services Occupations by Sex
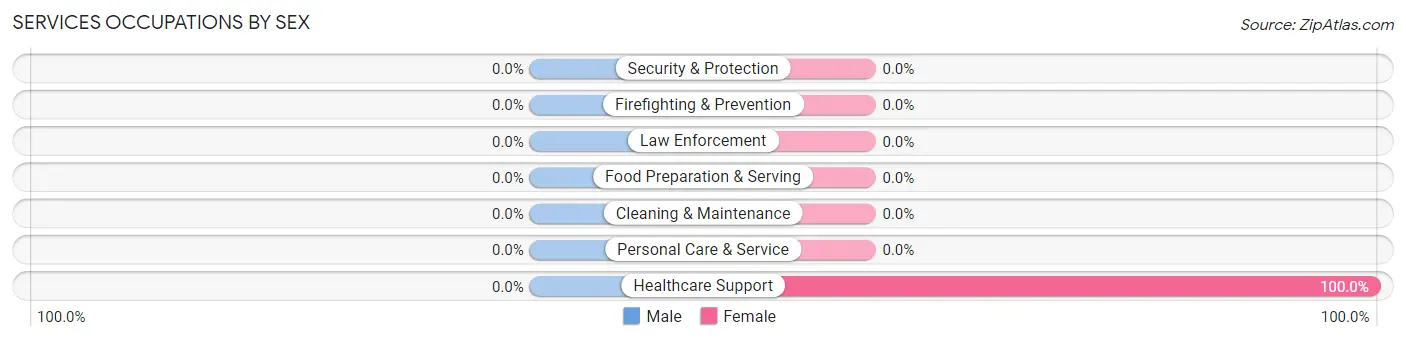
| Occupation | Male | Female |
| Healthcare Support | 0 (0.0%) | 7 (100.0%) |
| Security & Protection | 0 (0.0%) | 0 (0.0%) |
| Firefighting & Prevention | 0 (0.0%) | 0 (0.0%) |
| Law Enforcement | 0 (0.0%) | 0 (0.0%) |
| Food Preparation & Serving | 0 (0.0%) | 0 (0.0%) |
| Cleaning & Maintenance | 0 (0.0%) | 0 (0.0%) |
| Personal Care & Service | 0 (0.0%) | 0 (0.0%) |
| Total (Category) | 0 (0.0%) | 7 (100.0%) |
| Total (Overall) | 330 (48.9%) | 345 (51.1%) |
Sales and Office Occupations
The most common Sales and Office occupations in Niverville are Sales & Related (60 | 8.9%), and Office & Administration (36 | 5.3%).
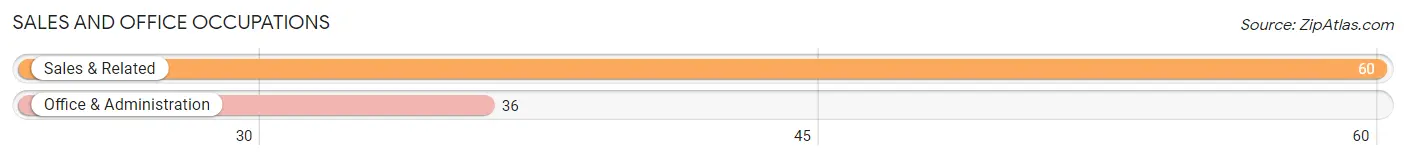
Sales and Office Occupations by Sex
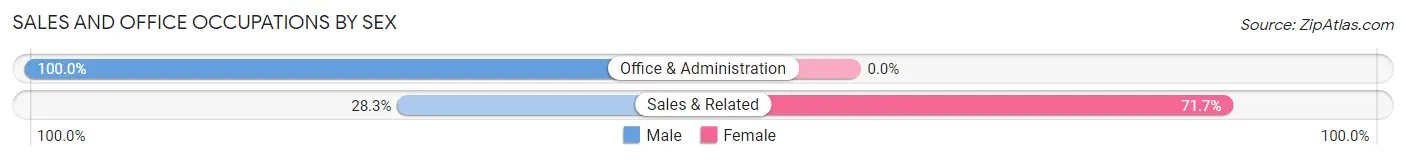
| Occupation | Male | Female |
| Sales & Related | 17 (28.3%) | 43 (71.7%) |
| Office & Administration | 36 (100.0%) | 0 (0.0%) |
| Total (Category) | 53 (55.2%) | 43 (44.8%) |
| Total (Overall) | 330 (48.9%) | 345 (51.1%) |
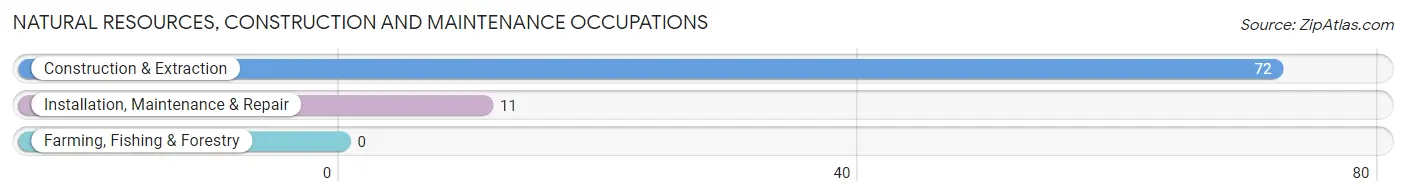
Natural Resources, Construction and Maintenance Occupations
The most common Natural Resources, Construction and Maintenance occupations in Niverville are Construction & Extraction (72 | 10.7%), and Installation, Maintenance & Repair (11 | 1.6%).
Natural Resources, Construction and Maintenance Occupations by Sex
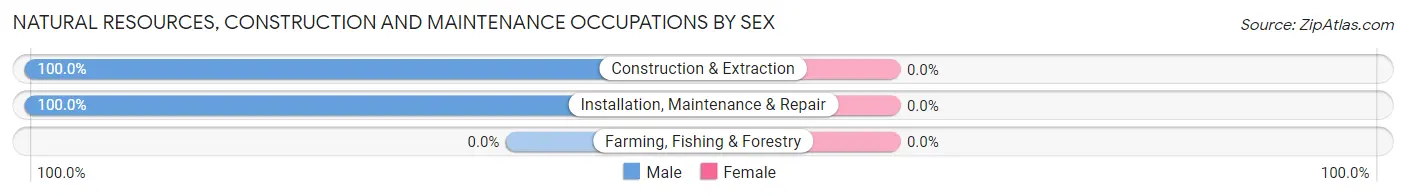
| Occupation | Male | Female |
| Farming, Fishing & Forestry | 0 (0.0%) | 0 (0.0%) |
| Construction & Extraction | 72 (100.0%) | 0 (0.0%) |
| Installation, Maintenance & Repair | 11 (100.0%) | 0 (0.0%) |
| Total (Category) | 83 (100.0%) | 0 (0.0%) |
| Total (Overall) | 330 (48.9%) | 345 (51.1%) |
Production, Transportation and Moving Occupations
The most common Production, Transportation and Moving occupations in Niverville are Production (105 | 15.6%), and Transportation (30 | 4.4%).
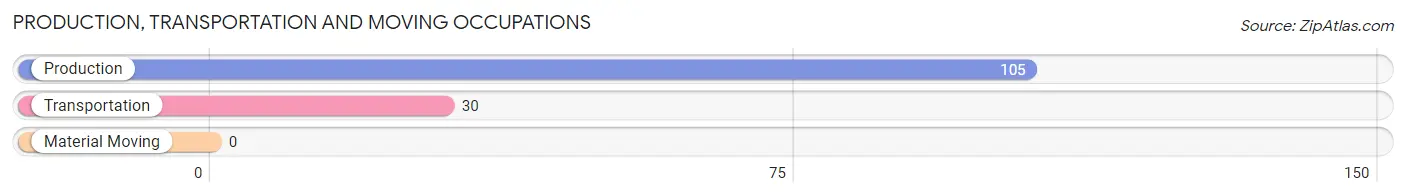
Production, Transportation and Moving Occupations by Sex
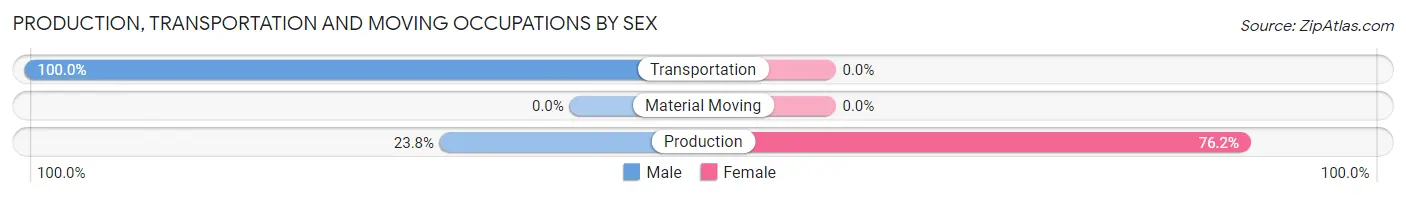
| Occupation | Male | Female |
| Production | 25 (23.8%) | 80 (76.2%) |
| Transportation | 30 (100.0%) | 0 (0.0%) |
| Material Moving | 0 (0.0%) | 0 (0.0%) |
| Total (Category) | 55 (40.7%) | 80 (59.3%) |
| Total (Overall) | 330 (48.9%) | 345 (51.1%) |
Employment Industries by Sex in Niverville
Employment Industries in Niverville
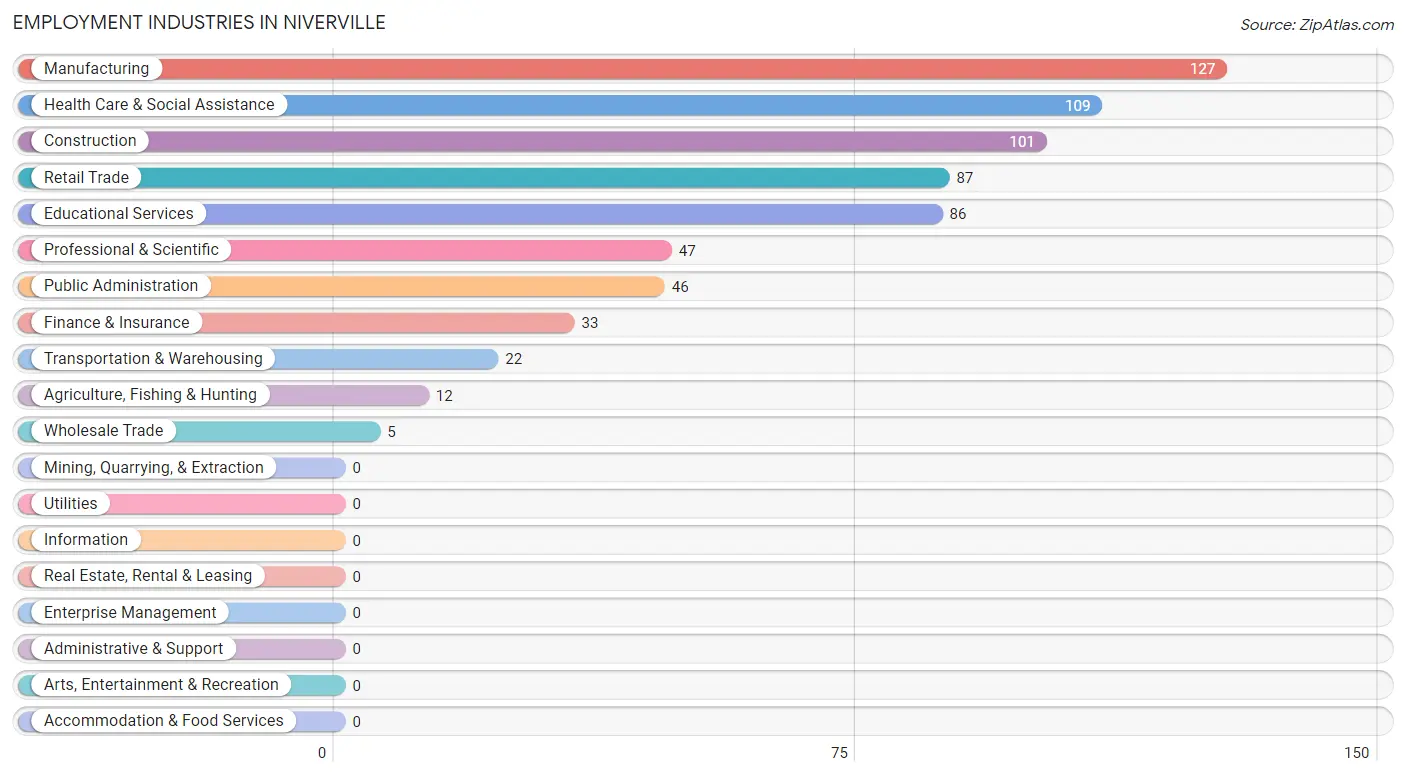
The major employment industries in Niverville include Manufacturing (127 | 18.8%), Health Care & Social Assistance (109 | 16.2%), Construction (101 | 15.0%), Retail Trade (87 | 12.9%), and Educational Services (86 | 12.7%).
Employment Industries by Sex in Niverville
The Niverville industries that see more men than women are Agriculture, Fishing & Hunting (100.0%), Construction (100.0%), and Wholesale Trade (100.0%), whereas the industries that tend to have a higher number of women are Health Care & Social Assistance (100.0%), Educational Services (84.9%), and Manufacturing (66.9%).
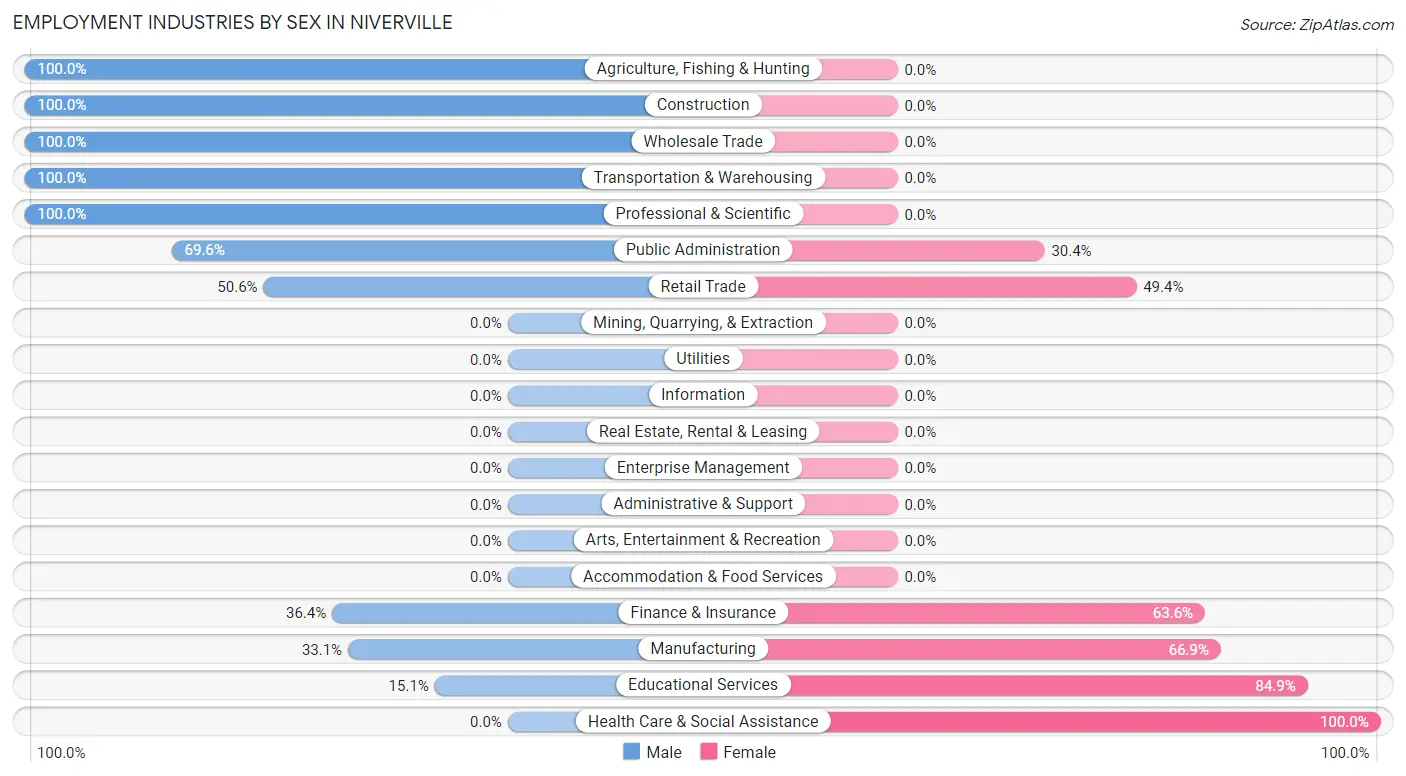
| Industry | Male | Female |
| Agriculture, Fishing & Hunting | 12 (100.0%) | 0 (0.0%) |
| Mining, Quarrying, & Extraction | 0 (0.0%) | 0 (0.0%) |
| Construction | 101 (100.0%) | 0 (0.0%) |
| Manufacturing | 42 (33.1%) | 85 (66.9%) |
| Wholesale Trade | 5 (100.0%) | 0 (0.0%) |
| Retail Trade | 44 (50.6%) | 43 (49.4%) |
| Transportation & Warehousing | 22 (100.0%) | 0 (0.0%) |
| Utilities | 0 (0.0%) | 0 (0.0%) |
| Information | 0 (0.0%) | 0 (0.0%) |
| Finance & Insurance | 12 (36.4%) | 21 (63.6%) |
| Real Estate, Rental & Leasing | 0 (0.0%) | 0 (0.0%) |
| Professional & Scientific | 47 (100.0%) | 0 (0.0%) |
| Enterprise Management | 0 (0.0%) | 0 (0.0%) |
| Administrative & Support | 0 (0.0%) | 0 (0.0%) |
| Educational Services | 13 (15.1%) | 73 (84.9%) |
| Health Care & Social Assistance | 0 (0.0%) | 109 (100.0%) |
| Arts, Entertainment & Recreation | 0 (0.0%) | 0 (0.0%) |
| Accommodation & Food Services | 0 (0.0%) | 0 (0.0%) |
| Public Administration | 32 (69.6%) | 14 (30.4%) |
| Total | 330 (48.9%) | 345 (51.1%) |
Education in Niverville
School Enrollment in Niverville
The most common levels of schooling among the 303 students in Niverville are middle school (193 | 63.7%), high school (60 | 19.8%), and kindergarten (28 | 9.2%).
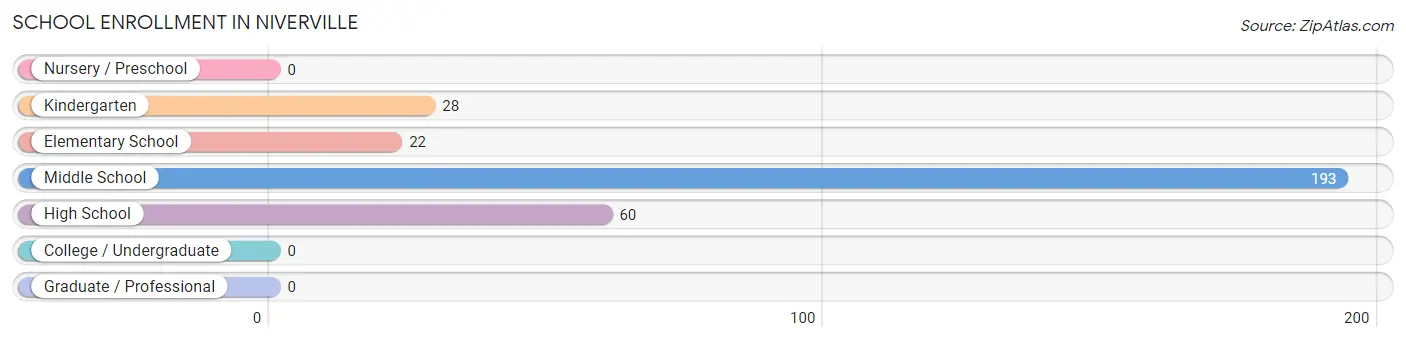
| School Level | # Students | % Students |
| Nursery / Preschool | 0 | 0.0% |
| Kindergarten | 28 | 9.2% |
| Elementary School | 22 | 7.3% |
| Middle School | 193 | 63.7% |
| High School | 60 | 19.8% |
| College / Undergraduate | 0 | 0.0% |
| Graduate / Professional | 0 | 0.0% |
| Total | 303 | 100.0% |
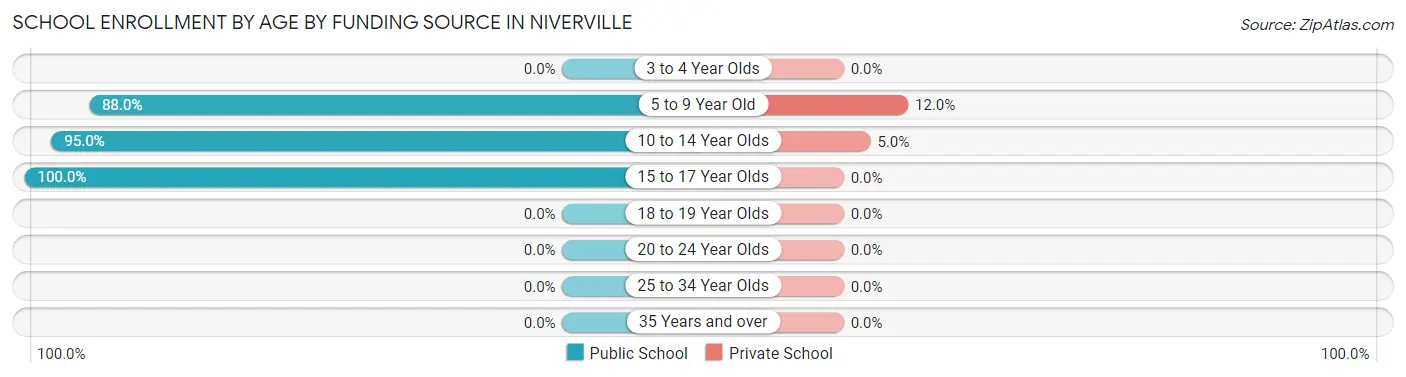
School Enrollment by Age by Funding Source in Niverville
Out of a total of 303 students who are enrolled in schools in Niverville, 17 (5.6%) attend a private institution, while the remaining 286 (94.4%) are enrolled in public schools. The age group of 5 to 9 year old has the highest likelihood of being enrolled in private schools, with 6 (12.0% in the age bracket) enrolled. Conversely, the age group of 15 to 17 year olds has the lowest likelihood of being enrolled in a private school, with 33 (100.0% in the age bracket) attending a public institution.
| Age Bracket | Public School | Private School |
| 3 to 4 Year Olds | 0 (0.0%) | 0 (0.0%) |
| 5 to 9 Year Old | 44 (88.0%) | 6 (12.0%) |
| 10 to 14 Year Olds | 209 (95.0%) | 11 (5.0%) |
| 15 to 17 Year Olds | 33 (100.0%) | 0 (0.0%) |
| 18 to 19 Year Olds | 0 (0.0%) | 0 (0.0%) |
| 20 to 24 Year Olds | 0 (0.0%) | 0 (0.0%) |
| 25 to 34 Year Olds | 0 (0.0%) | 0 (0.0%) |
| 35 Years and over | 0 (0.0%) | 0 (0.0%) |
| Total | 286 (94.4%) | 17 (5.6%) |
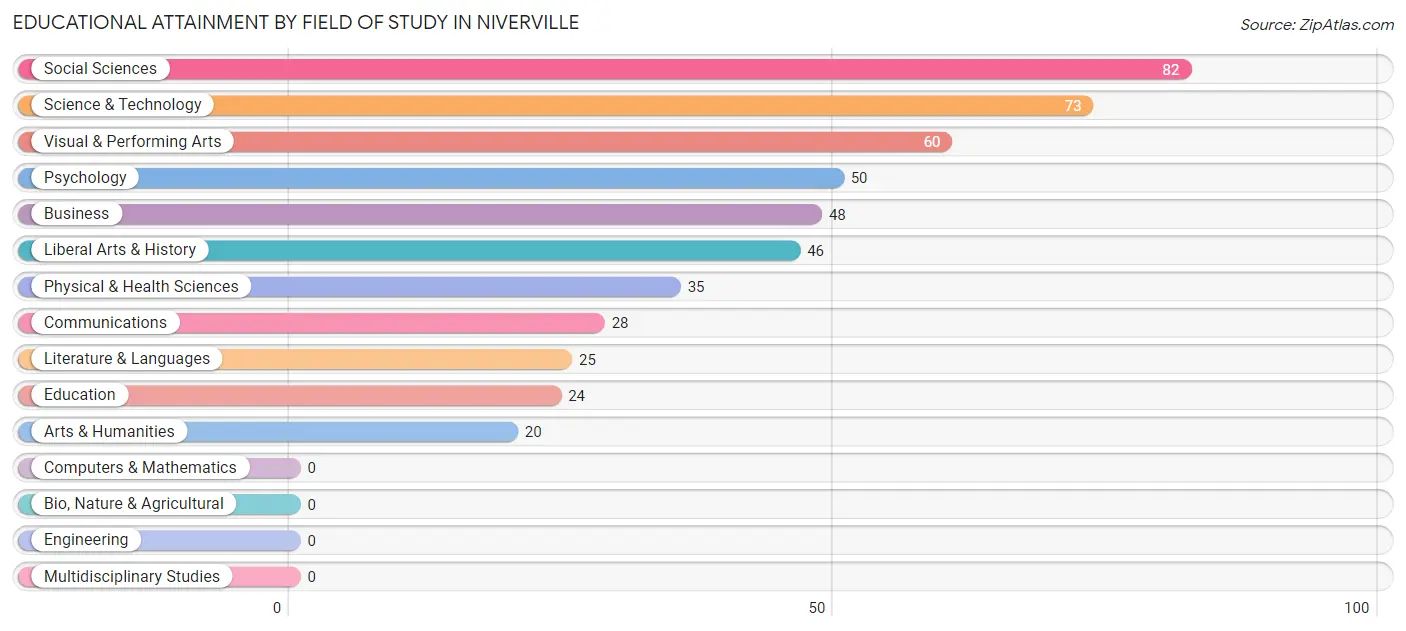
Educational Attainment by Field of Study in Niverville
Social sciences (82 | 16.7%), science & technology (73 | 14.9%), visual & performing arts (60 | 12.2%), psychology (50 | 10.2%), and business (48 | 9.8%) are the most common fields of study among 491 individuals in Niverville who have obtained a bachelor's degree or higher.
| Field of Study | # Graduates | % Graduates |
| Computers & Mathematics | 0 | 0.0% |
| Bio, Nature & Agricultural | 0 | 0.0% |
| Physical & Health Sciences | 35 | 7.1% |
| Psychology | 50 | 10.2% |
| Social Sciences | 82 | 16.7% |
| Engineering | 0 | 0.0% |
| Multidisciplinary Studies | 0 | 0.0% |
| Science & Technology | 73 | 14.9% |
| Business | 48 | 9.8% |
| Education | 24 | 4.9% |
| Literature & Languages | 25 | 5.1% |
| Liberal Arts & History | 46 | 9.4% |
| Visual & Performing Arts | 60 | 12.2% |
| Communications | 28 | 5.7% |
| Arts & Humanities | 20 | 4.1% |
| Total | 491 | 100.0% |
Transportation & Commute in Niverville
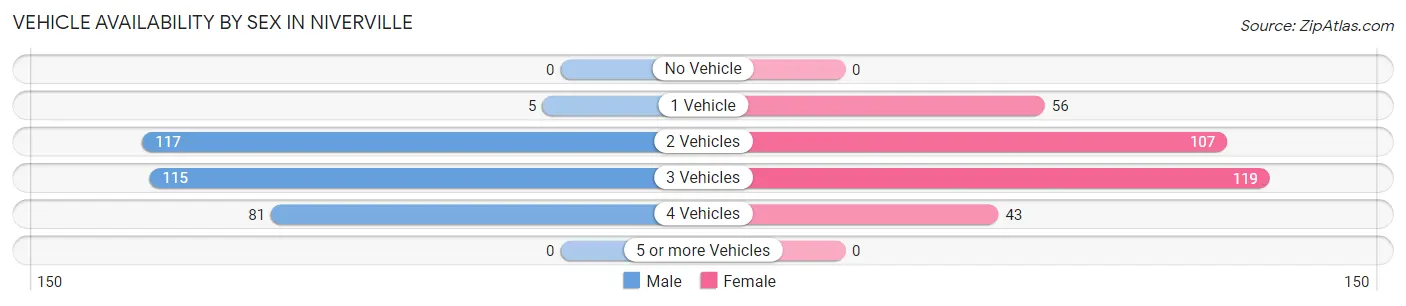
Vehicle Availability by Sex in Niverville
The most prevalent vehicle ownership categories in Niverville are males with 2 vehicles (117, accounting for 36.8%) and females with 2 vehicles (107, making up 36.0%).
| Vehicles Available | Male | Female |
| No Vehicle | 0 (0.0%) | 0 (0.0%) |
| 1 Vehicle | 5 (1.6%) | 56 (17.2%) |
| 2 Vehicles | 117 (36.8%) | 107 (32.9%) |
| 3 Vehicles | 115 (36.2%) | 119 (36.6%) |
| 4 Vehicles | 81 (25.5%) | 43 (13.2%) |
| 5 or more Vehicles | 0 (0.0%) | 0 (0.0%) |
| Total | 318 (100.0%) | 325 (100.0%) |
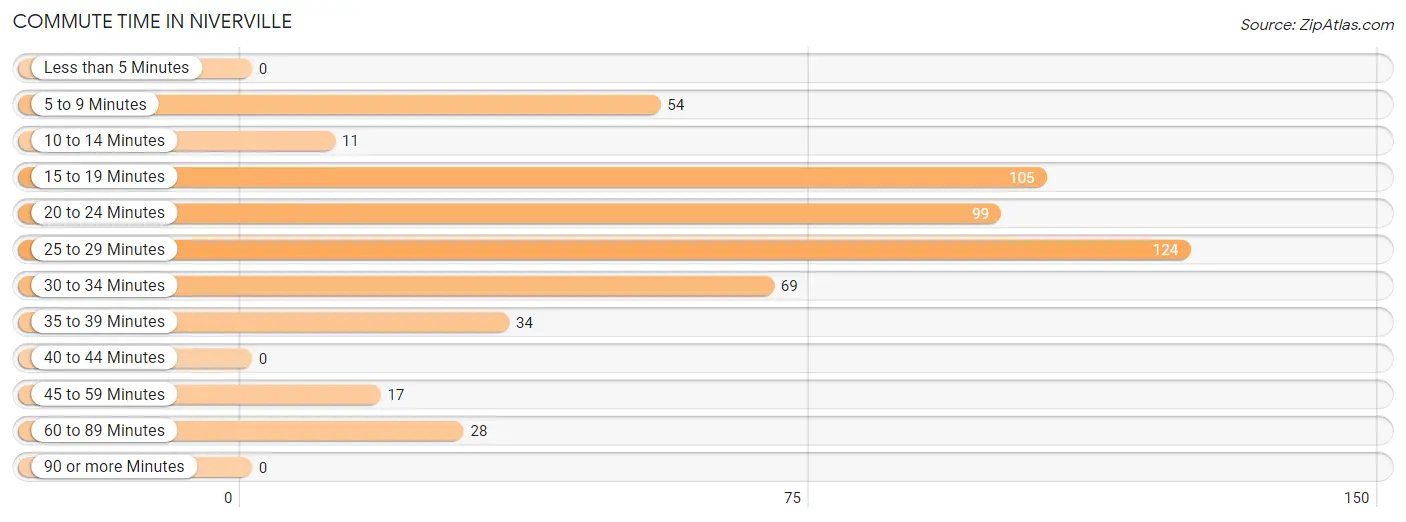
Commute Time in Niverville
The most frequently occuring commute durations in Niverville are 25 to 29 minutes (124 commuters, 22.9%), 15 to 19 minutes (105 commuters, 19.4%), and 20 to 24 minutes (99 commuters, 18.3%).
| Commute Time | # Commuters | % Commuters |
| Less than 5 Minutes | 0 | 0.0% |
| 5 to 9 Minutes | 54 | 10.0% |
| 10 to 14 Minutes | 11 | 2.0% |
| 15 to 19 Minutes | 105 | 19.4% |
| 20 to 24 Minutes | 99 | 18.3% |
| 25 to 29 Minutes | 124 | 22.9% |
| 30 to 34 Minutes | 69 | 12.8% |
| 35 to 39 Minutes | 34 | 6.3% |
| 40 to 44 Minutes | 0 | 0.0% |
| 45 to 59 Minutes | 17 | 3.1% |
| 60 to 89 Minutes | 28 | 5.2% |
| 90 or more Minutes | 0 | 0.0% |
Commute Time by Sex in Niverville
The most common commute times in Niverville are 15 to 19 minutes (77 commuters, 25.2%) for males and 25 to 29 minutes (70 commuters, 29.8%) for females.
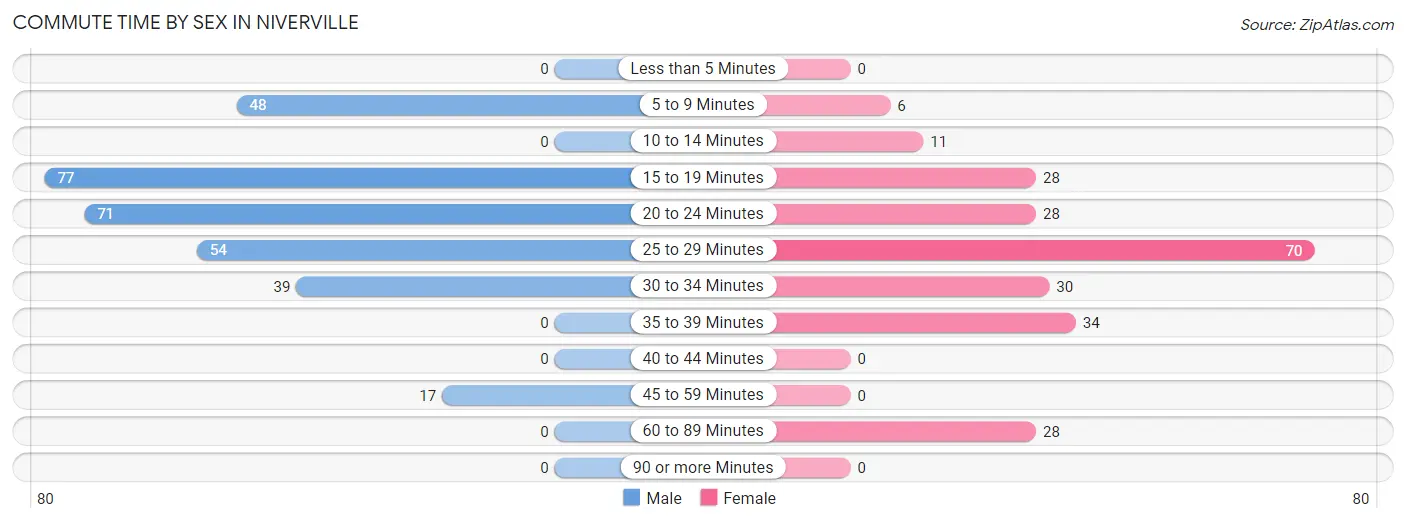
| Commute Time | Male | Female |
| Less than 5 Minutes | 0 (0.0%) | 0 (0.0%) |
| 5 to 9 Minutes | 48 (15.7%) | 6 (2.5%) |
| 10 to 14 Minutes | 0 (0.0%) | 11 (4.7%) |
| 15 to 19 Minutes | 77 (25.2%) | 28 (11.9%) |
| 20 to 24 Minutes | 71 (23.2%) | 28 (11.9%) |
| 25 to 29 Minutes | 54 (17.6%) | 70 (29.8%) |
| 30 to 34 Minutes | 39 (12.8%) | 30 (12.8%) |
| 35 to 39 Minutes | 0 (0.0%) | 34 (14.5%) |
| 40 to 44 Minutes | 0 (0.0%) | 0 (0.0%) |
| 45 to 59 Minutes | 17 (5.6%) | 0 (0.0%) |
| 60 to 89 Minutes | 0 (0.0%) | 28 (11.9%) |
| 90 or more Minutes | 0 (0.0%) | 0 (0.0%) |
Time of Departure to Work by Sex in Niverville
The most frequent times of departure to work in Niverville are 6:30 AM to 6:59 AM (129, 42.2%) for males and 9:00 AM to 9:59 AM (54, 23.0%) for females.
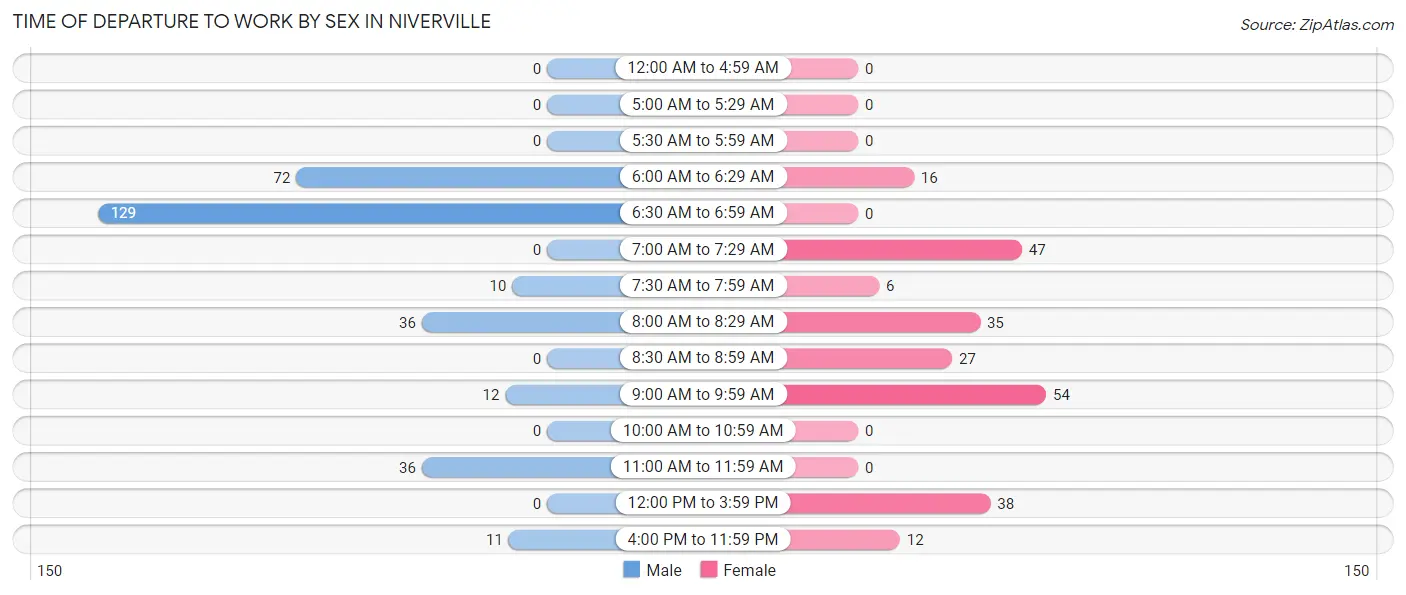
| Time of Departure | Male | Female |
| 12:00 AM to 4:59 AM | 0 (0.0%) | 0 (0.0%) |
| 5:00 AM to 5:29 AM | 0 (0.0%) | 0 (0.0%) |
| 5:30 AM to 5:59 AM | 0 (0.0%) | 0 (0.0%) |
| 6:00 AM to 6:29 AM | 72 (23.5%) | 16 (6.8%) |
| 6:30 AM to 6:59 AM | 129 (42.2%) | 0 (0.0%) |
| 7:00 AM to 7:29 AM | 0 (0.0%) | 47 (20.0%) |
| 7:30 AM to 7:59 AM | 10 (3.3%) | 6 (2.5%) |
| 8:00 AM to 8:29 AM | 36 (11.8%) | 35 (14.9%) |
| 8:30 AM to 8:59 AM | 0 (0.0%) | 27 (11.5%) |
| 9:00 AM to 9:59 AM | 12 (3.9%) | 54 (23.0%) |
| 10:00 AM to 10:59 AM | 0 (0.0%) | 0 (0.0%) |
| 11:00 AM to 11:59 AM | 36 (11.8%) | 0 (0.0%) |
| 12:00 PM to 3:59 PM | 0 (0.0%) | 38 (16.2%) |
| 4:00 PM to 11:59 PM | 11 (3.6%) | 12 (5.1%) |
| Total | 306 (100.0%) | 235 (100.0%) |
Housing Occupancy in Niverville
Occupancy by Ownership in Niverville
Of the total 512 dwellings in Niverville, owner-occupied units account for 459 (89.6%), while renter-occupied units make up 53 (10.3%).
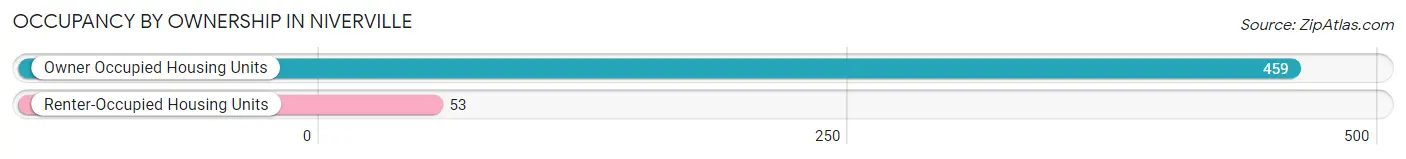
| Occupancy | # Housing Units | % Housing Units |
| Owner Occupied Housing Units | 459 | 89.6% |
| Renter-Occupied Housing Units | 53 | 10.3% |
| Total Occupied Housing Units | 512 | 100.0% |
Occupancy by Household Size in Niverville
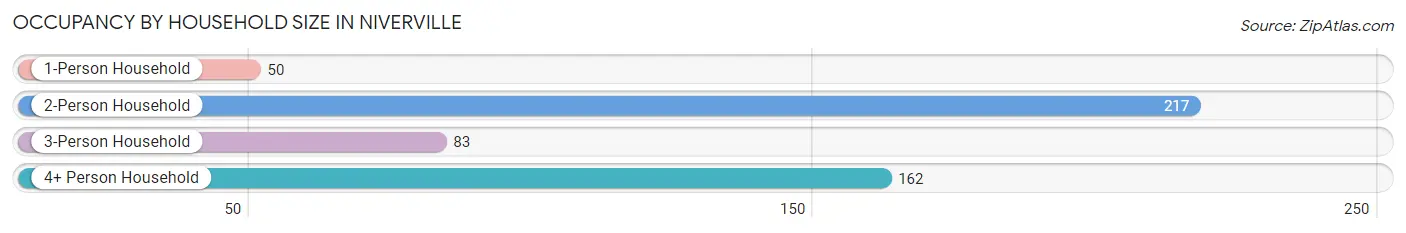
| Household Size | # Housing Units | % Housing Units |
| 1-Person Household | 50 | 9.8% |
| 2-Person Household | 217 | 42.4% |
| 3-Person Household | 83 | 16.2% |
| 4+ Person Household | 162 | 31.6% |
| Total Housing Units | 512 | 100.0% |
Occupancy by Ownership by Household Size in Niverville
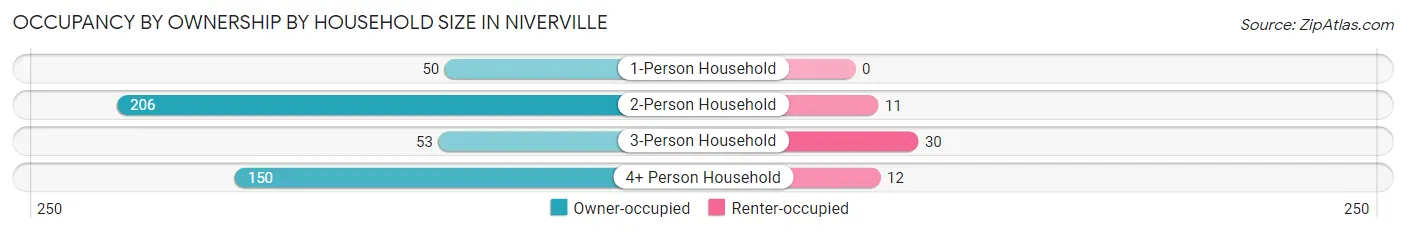
| Household Size | Owner-occupied | Renter-occupied |
| 1-Person Household | 50 (100.0%) | 0 (0.0%) |
| 2-Person Household | 206 (94.9%) | 11 (5.1%) |
| 3-Person Household | 53 (63.9%) | 30 (36.1%) |
| 4+ Person Household | 150 (92.6%) | 12 (7.4%) |
| Total Housing Units | 459 (89.6%) | 53 (10.3%) |
Occupancy by Educational Attainment in Niverville
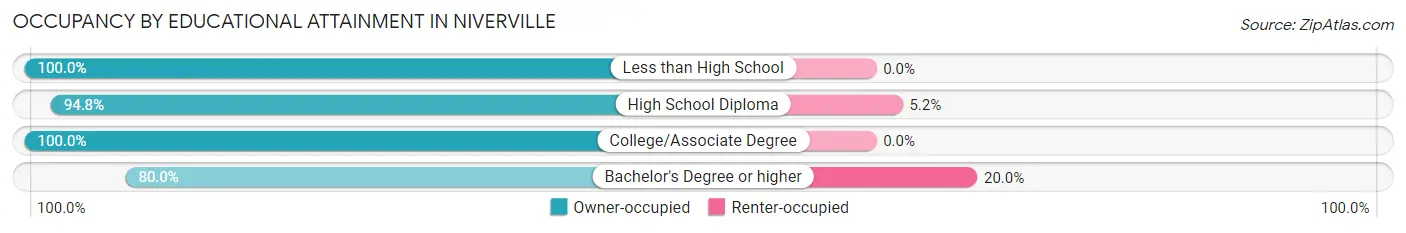
| Household Size | Owner-occupied | Renter-occupied |
| Less than High School | 26 (100.0%) | 0 (0.0%) |
| High School Diploma | 200 (94.8%) | 11 (5.2%) |
| College/Associate Degree | 65 (100.0%) | 0 (0.0%) |
| Bachelor's Degree or higher | 168 (80.0%) | 42 (20.0%) |
Occupancy by Age of Householder in Niverville
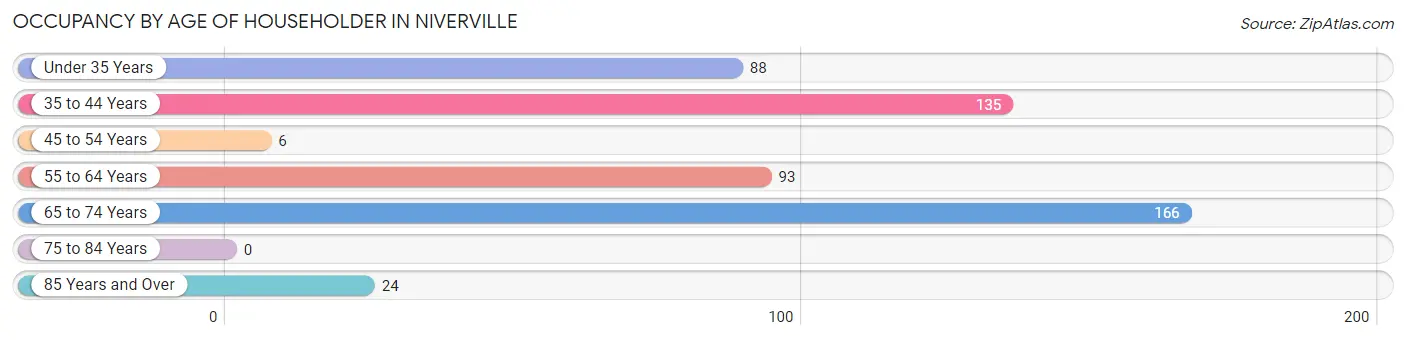
| Age Bracket | # Households | % Households |
| Under 35 Years | 88 | 17.2% |
| 35 to 44 Years | 135 | 26.4% |
| 45 to 54 Years | 6 | 1.2% |
| 55 to 64 Years | 93 | 18.2% |
| 65 to 74 Years | 166 | 32.4% |
| 75 to 84 Years | 0 | 0.0% |
| 85 Years and Over | 24 | 4.7% |
| Total | 512 | 100.0% |
Housing Finances in Niverville
Median Income by Occupancy in Niverville
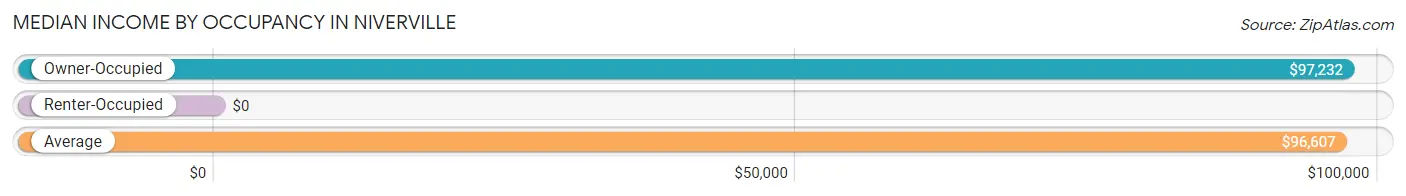
| Occupancy Type | # Households | Median Income |
| Owner-Occupied | 459 (89.6%) | $97,232 |
| Renter-Occupied | 53 (10.3%) | $0 |
| Average | 512 (100.0%) | $96,607 |
Occupancy by Householder Income Bracket in Niverville
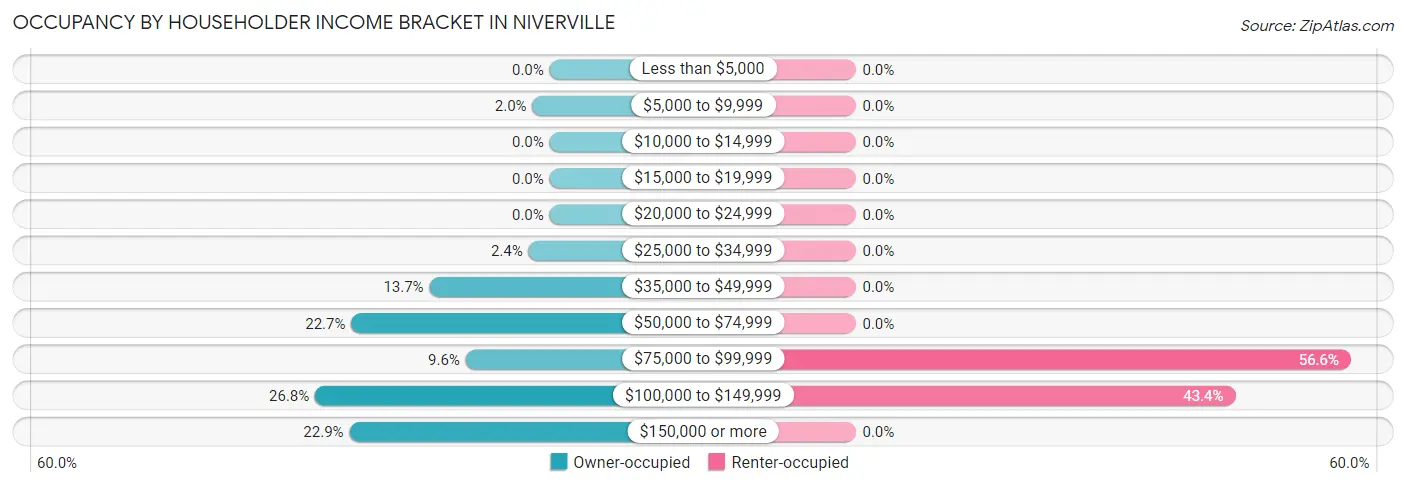
| Income Bracket | Owner-occupied | Renter-occupied |
| Less than $5,000 | 0 (0.0%) | 0 (0.0%) |
| $5,000 to $9,999 | 9 (2.0%) | 0 (0.0%) |
| $10,000 to $14,999 | 0 (0.0%) | 0 (0.0%) |
| $15,000 to $19,999 | 0 (0.0%) | 0 (0.0%) |
| $20,000 to $24,999 | 0 (0.0%) | 0 (0.0%) |
| $25,000 to $34,999 | 11 (2.4%) | 0 (0.0%) |
| $35,000 to $49,999 | 63 (13.7%) | 0 (0.0%) |
| $50,000 to $74,999 | 104 (22.7%) | 0 (0.0%) |
| $75,000 to $99,999 | 44 (9.6%) | 30 (56.6%) |
| $100,000 to $149,999 | 123 (26.8%) | 23 (43.4%) |
| $150,000 or more | 105 (22.9%) | 0 (0.0%) |
| Total | 459 (100.0%) | 53 (100.0%) |
Monthly Housing Cost Tiers in Niverville
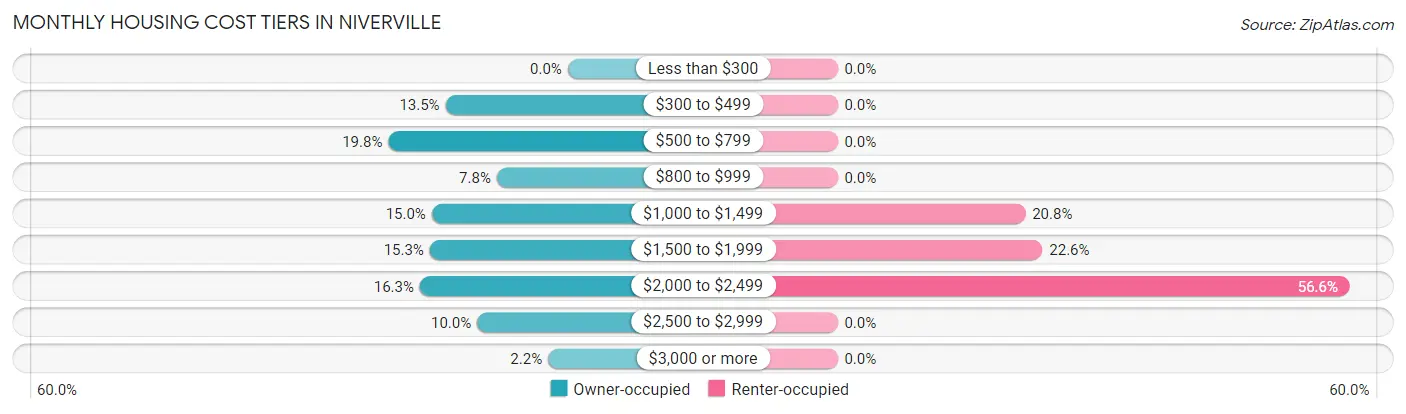
| Monthly Cost | Owner-occupied | Renter-occupied |
| Less than $300 | 0 (0.0%) | 0 (0.0%) |
| $300 to $499 | 62 (13.5%) | 0 (0.0%) |
| $500 to $799 | 91 (19.8%) | 0 (0.0%) |
| $800 to $999 | 36 (7.8%) | 0 (0.0%) |
| $1,000 to $1,499 | 69 (15.0%) | 11 (20.7%) |
| $1,500 to $1,999 | 70 (15.2%) | 12 (22.6%) |
| $2,000 to $2,499 | 75 (16.3%) | 30 (56.6%) |
| $2,500 to $2,999 | 46 (10.0%) | 0 (0.0%) |
| $3,000 or more | 10 (2.2%) | 0 (0.0%) |
| Total | 459 (100.0%) | 53 (100.0%) |
Physical Housing Characteristics in Niverville
Housing Structures in Niverville
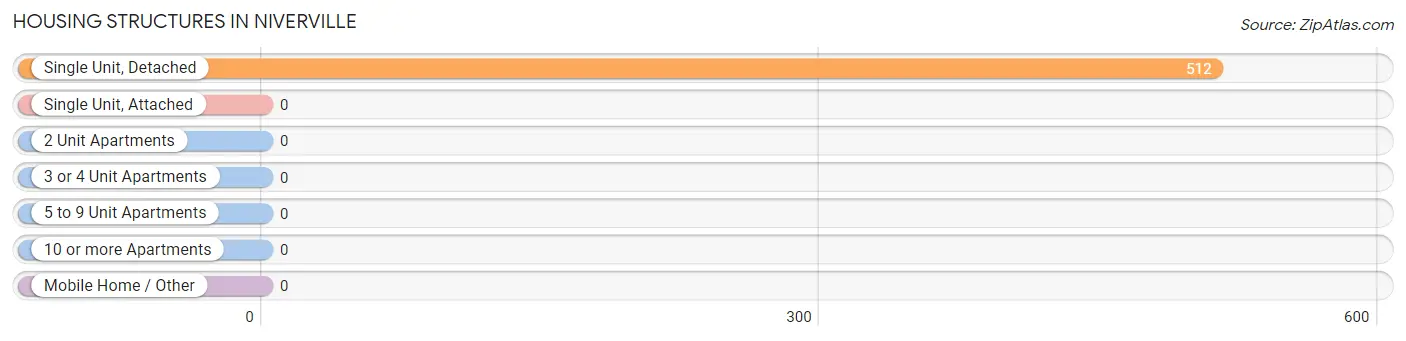
| Structure Type | # Housing Units | % Housing Units |
| Single Unit, Detached | 512 | 100.0% |
| Single Unit, Attached | 0 | 0.0% |
| 2 Unit Apartments | 0 | 0.0% |
| 3 or 4 Unit Apartments | 0 | 0.0% |
| 5 to 9 Unit Apartments | 0 | 0.0% |
| 10 or more Apartments | 0 | 0.0% |
| Mobile Home / Other | 0 | 0.0% |
| Total | 512 | 100.0% |
Housing Structures by Occupancy in Niverville
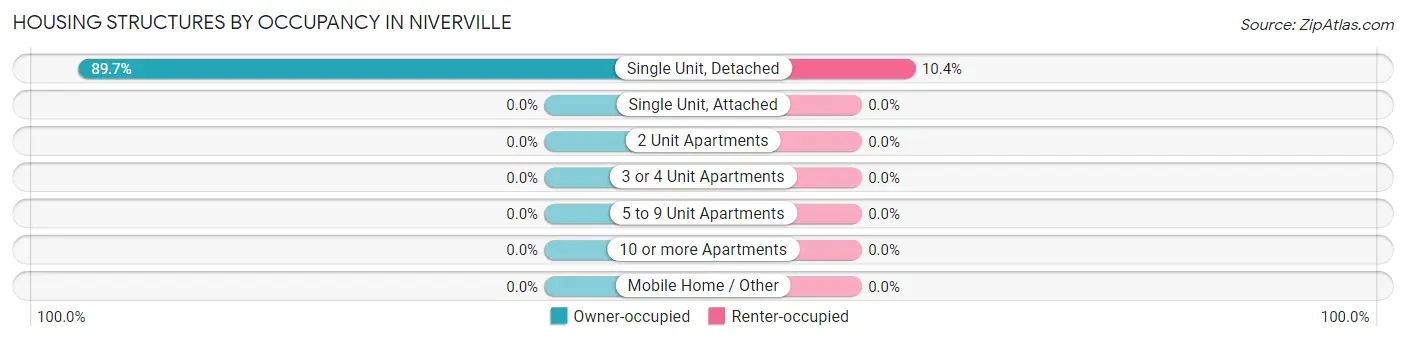
| Structure Type | Owner-occupied | Renter-occupied |
| Single Unit, Detached | 459 (89.6%) | 53 (10.3%) |
| Single Unit, Attached | 0 (0.0%) | 0 (0.0%) |
| 2 Unit Apartments | 0 (0.0%) | 0 (0.0%) |
| 3 or 4 Unit Apartments | 0 (0.0%) | 0 (0.0%) |
| 5 to 9 Unit Apartments | 0 (0.0%) | 0 (0.0%) |
| 10 or more Apartments | 0 (0.0%) | 0 (0.0%) |
| Mobile Home / Other | 0 (0.0%) | 0 (0.0%) |
| Total | 459 (89.6%) | 53 (10.3%) |
Housing Structures by Number of Rooms in Niverville
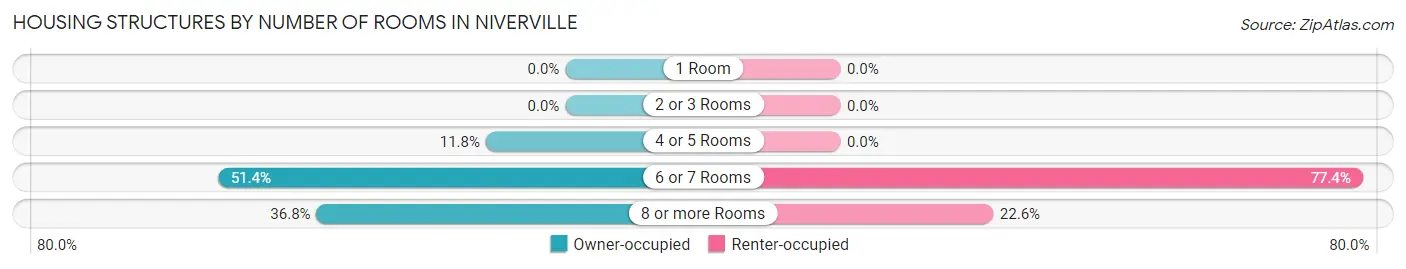
| Number of Rooms | Owner-occupied | Renter-occupied |
| 1 Room | 0 (0.0%) | 0 (0.0%) |
| 2 or 3 Rooms | 0 (0.0%) | 0 (0.0%) |
| 4 or 5 Rooms | 54 (11.8%) | 0 (0.0%) |
| 6 or 7 Rooms | 236 (51.4%) | 41 (77.4%) |
| 8 or more Rooms | 169 (36.8%) | 12 (22.6%) |
| Total | 459 (100.0%) | 53 (100.0%) |
Housing Structure by Heating Type in Niverville
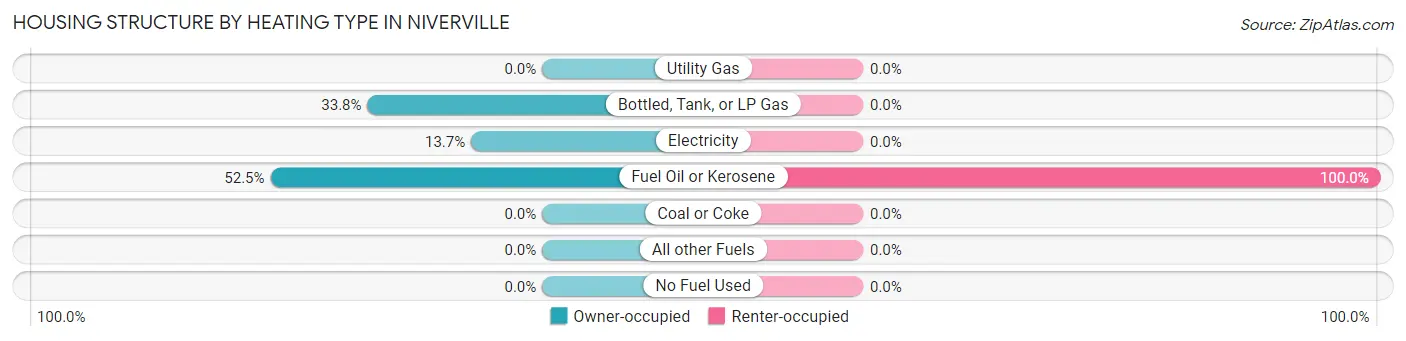
| Heating Type | Owner-occupied | Renter-occupied |
| Utility Gas | 0 (0.0%) | 0 (0.0%) |
| Bottled, Tank, or LP Gas | 155 (33.8%) | 0 (0.0%) |
| Electricity | 63 (13.7%) | 0 (0.0%) |
| Fuel Oil or Kerosene | 241 (52.5%) | 53 (100.0%) |
| Coal or Coke | 0 (0.0%) | 0 (0.0%) |
| All other Fuels | 0 (0.0%) | 0 (0.0%) |
| No Fuel Used | 0 (0.0%) | 0 (0.0%) |
| Total | 459 (100.0%) | 53 (100.0%) |
Household Vehicle Usage in Niverville
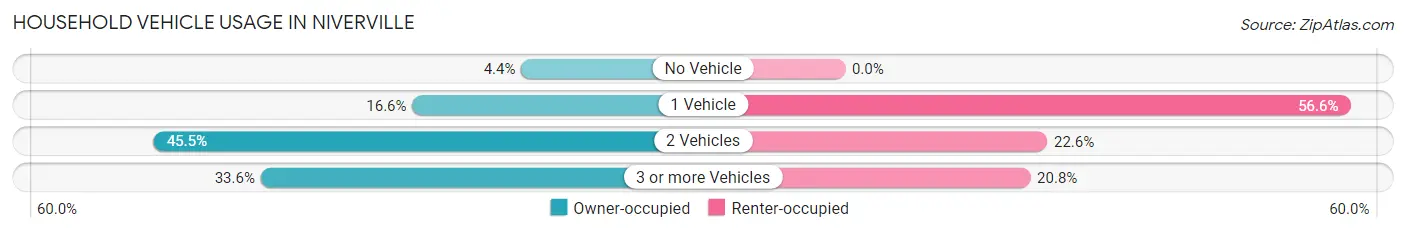
| Vehicles per Household | Owner-occupied | Renter-occupied |
| No Vehicle | 20 (4.4%) | 0 (0.0%) |
| 1 Vehicle | 76 (16.6%) | 30 (56.6%) |
| 2 Vehicles | 209 (45.5%) | 12 (22.6%) |
| 3 or more Vehicles | 154 (33.6%) | 11 (20.7%) |
| Total | 459 (100.0%) | 53 (100.0%) |
Real Estate & Mortgages in Niverville
Real Estate and Mortgage Overview in Niverville
| Characteristic | Without Mortgage | With Mortgage |
| Housing Units | 187 | 272 |
| Median Property Value | $308,900 | $273,000 |
| Median Household Income | $60,955 | $98 |
| Monthly Housing Costs | $637 | $10 |
| Real Estate Taxes | $2,970 | $0 |
Property Value by Mortgage Status in Niverville
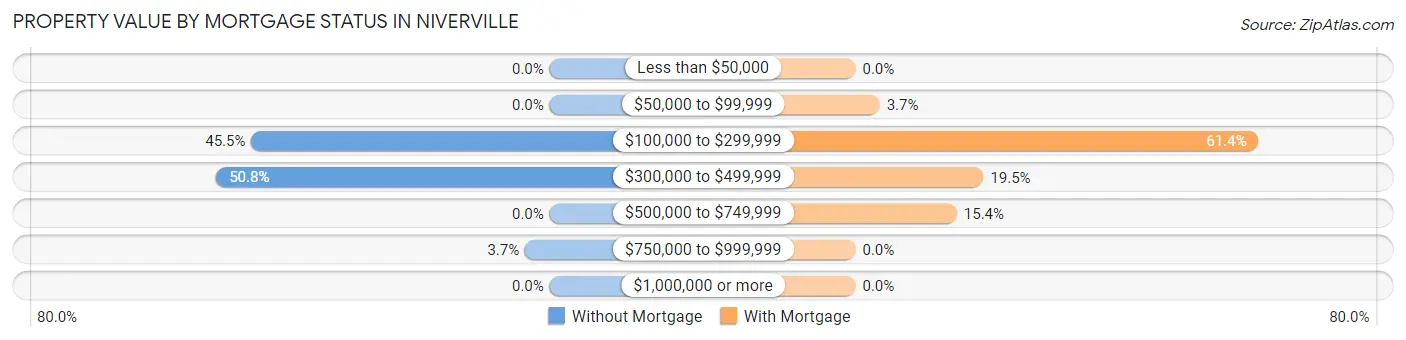
| Property Value | Without Mortgage | With Mortgage |
| Less than $50,000 | 0 (0.0%) | 0 (0.0%) |
| $50,000 to $99,999 | 0 (0.0%) | 10 (3.7%) |
| $100,000 to $299,999 | 85 (45.5%) | 167 (61.4%) |
| $300,000 to $499,999 | 95 (50.8%) | 53 (19.5%) |
| $500,000 to $749,999 | 0 (0.0%) | 42 (15.4%) |
| $750,000 to $999,999 | 7 (3.7%) | 0 (0.0%) |
| $1,000,000 or more | 0 (0.0%) | 0 (0.0%) |
| Total | 187 (100.0%) | 272 (100.0%) |
Household Income by Mortgage Status in Niverville
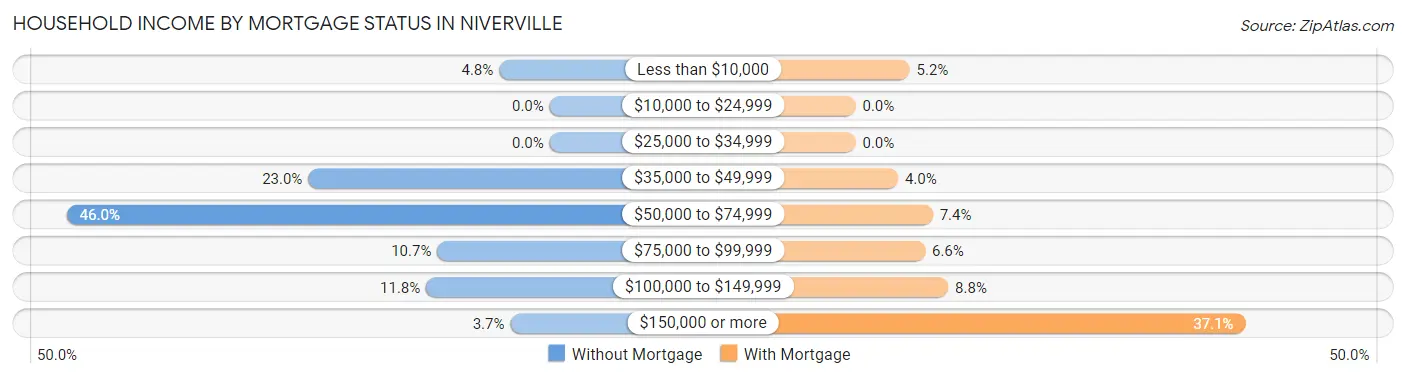
| Household Income | Without Mortgage | With Mortgage |
| Less than $10,000 | 9 (4.8%) | 14 (5.1%) |
| $10,000 to $24,999 | 0 (0.0%) | 0 (0.0%) |
| $25,000 to $34,999 | 0 (0.0%) | 0 (0.0%) |
| $35,000 to $49,999 | 43 (23.0%) | 11 (4.0%) |
| $50,000 to $74,999 | 86 (46.0%) | 20 (7.3%) |
| $75,000 to $99,999 | 20 (10.7%) | 18 (6.6%) |
| $100,000 to $149,999 | 22 (11.8%) | 24 (8.8%) |
| $150,000 or more | 7 (3.7%) | 101 (37.1%) |
| Total | 187 (100.0%) | 272 (100.0%) |
Property Value to Household Income Ratio in Niverville
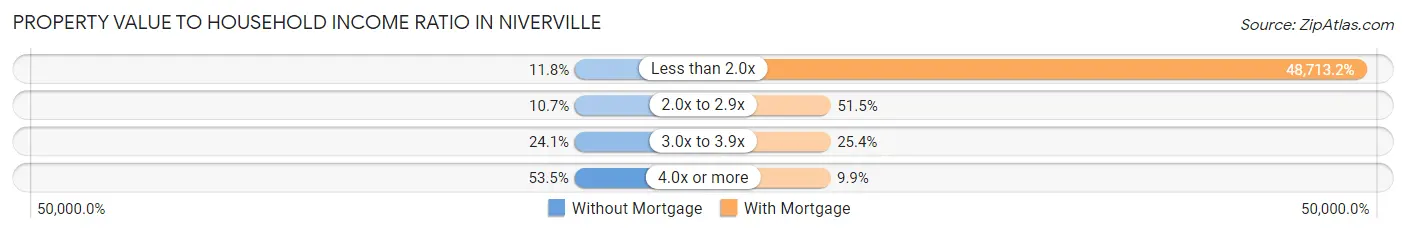
| Value-to-Income Ratio | Without Mortgage | With Mortgage |
| Less than 2.0x | 22 (11.8%) | 132,500 (48,713.2%) |
| 2.0x to 2.9x | 20 (10.7%) | 140 (51.5%) |
| 3.0x to 3.9x | 45 (24.1%) | 69 (25.4%) |
| 4.0x or more | 100 (53.5%) | 27 (9.9%) |
| Total | 187 (100.0%) | 272 (100.0%) |
Real Estate Taxes by Mortgage Status in Niverville
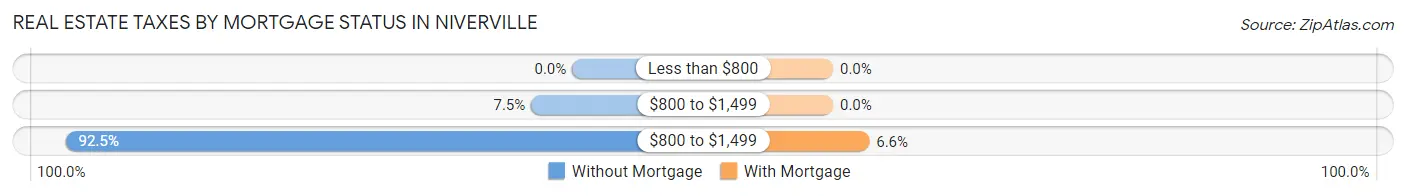
| Property Taxes | Without Mortgage | With Mortgage |
| Less than $800 | 0 (0.0%) | 0 (0.0%) |
| $800 to $1,499 | 14 (7.5%) | 0 (0.0%) |
| $800 to $1,499 | 173 (92.5%) | 18 (6.6%) |
| Total | 187 (100.0%) | 272 (100.0%) |
Health & Disability in Niverville
Health Insurance Coverage by Age in Niverville
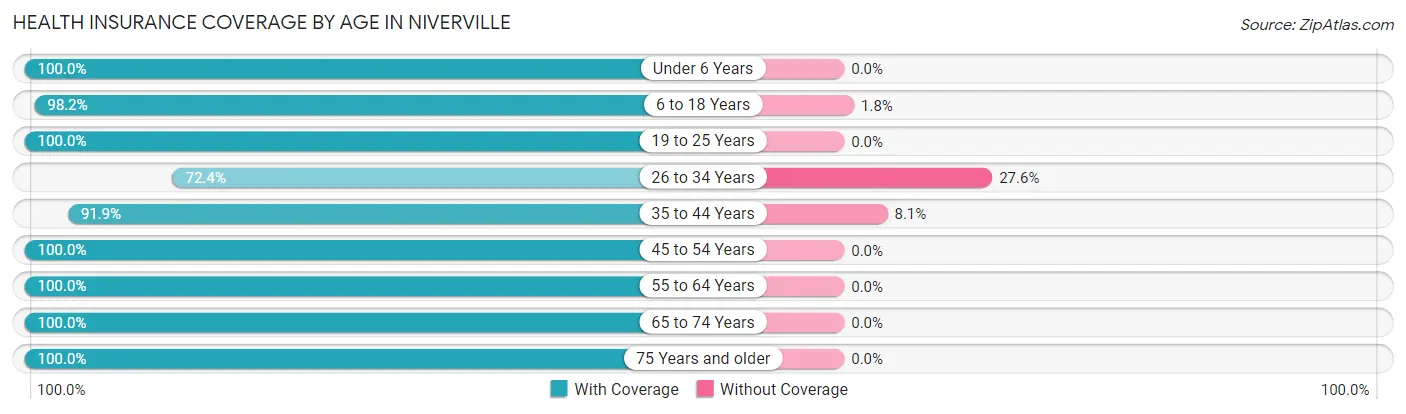
| Age Bracket | With Coverage | Without Coverage |
| Under 6 Years | 92 (100.0%) | 0 (0.0%) |
| 6 to 18 Years | 321 (98.2%) | 6 (1.8%) |
| 19 to 25 Years | 57 (100.0%) | 0 (0.0%) |
| 26 to 34 Years | 189 (72.4%) | 72 (27.6%) |
| 35 to 44 Years | 194 (91.9%) | 17 (8.1%) |
| 45 to 54 Years | 64 (100.0%) | 0 (0.0%) |
| 55 to 64 Years | 201 (100.0%) | 0 (0.0%) |
| 65 to 74 Years | 216 (100.0%) | 0 (0.0%) |
| 75 Years and older | 34 (100.0%) | 0 (0.0%) |
| Total | 1,368 (93.5%) | 95 (6.5%) |
Health Insurance Coverage by Citizenship Status in Niverville
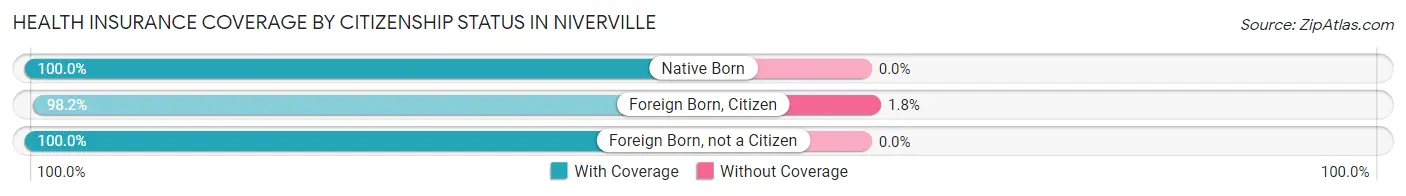
| Citizenship Status | With Coverage | Without Coverage |
| Native Born | 92 (100.0%) | 0 (0.0%) |
| Foreign Born, Citizen | 321 (98.2%) | 6 (1.8%) |
| Foreign Born, not a Citizen | 57 (100.0%) | 0 (0.0%) |
Health Insurance Coverage by Household Income in Niverville
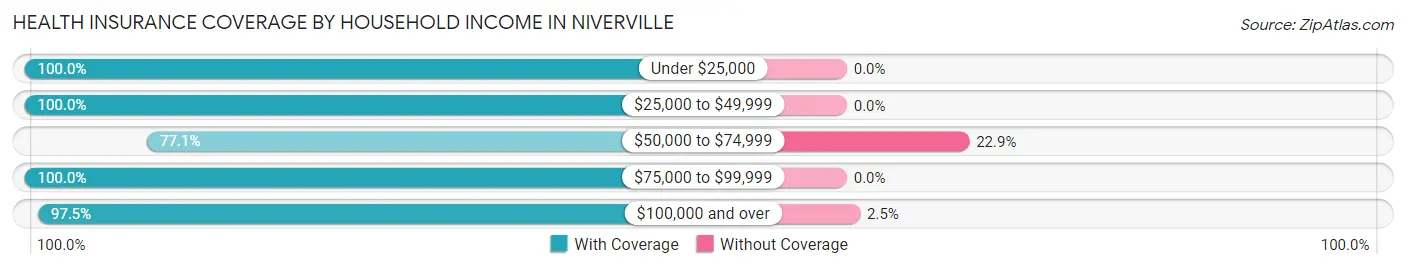
| Household Income | With Coverage | Without Coverage |
| Under $25,000 | 18 (100.0%) | 0 (0.0%) |
| $25,000 to $49,999 | 249 (100.0%) | 0 (0.0%) |
| $50,000 to $74,999 | 262 (77.1%) | 78 (22.9%) |
| $75,000 to $99,999 | 173 (100.0%) | 0 (0.0%) |
| $100,000 and over | 666 (97.5%) | 17 (2.5%) |
Public vs Private Health Insurance Coverage by Age in Niverville
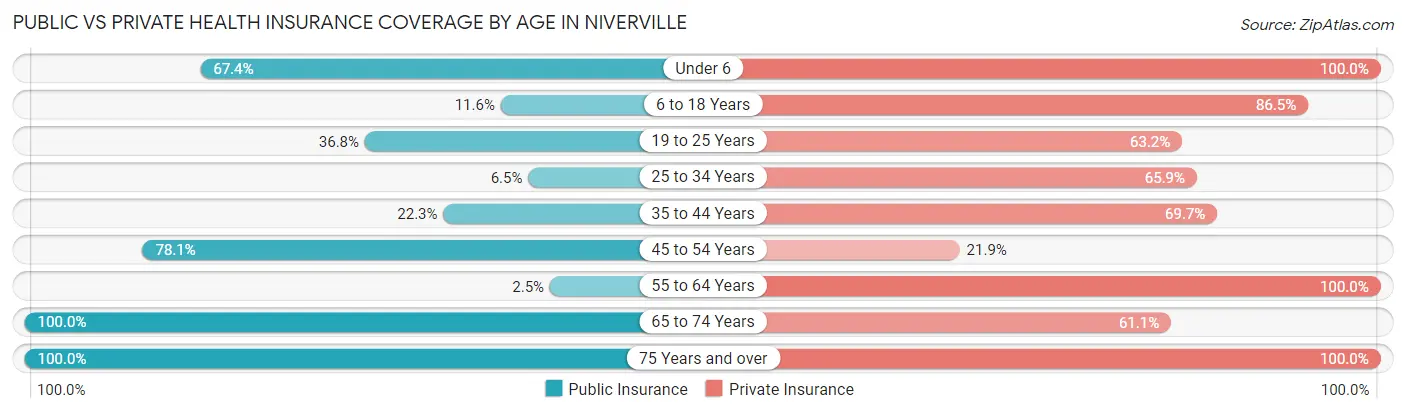
| Age Bracket | Public Insurance | Private Insurance |
| Under 6 | 62 (67.4%) | 92 (100.0%) |
| 6 to 18 Years | 38 (11.6%) | 283 (86.5%) |
| 19 to 25 Years | 21 (36.8%) | 36 (63.2%) |
| 25 to 34 Years | 17 (6.5%) | 172 (65.9%) |
| 35 to 44 Years | 47 (22.3%) | 147 (69.7%) |
| 45 to 54 Years | 50 (78.1%) | 14 (21.9%) |
| 55 to 64 Years | 5 (2.5%) | 201 (100.0%) |
| 65 to 74 Years | 216 (100.0%) | 132 (61.1%) |
| 75 Years and over | 34 (100.0%) | 34 (100.0%) |
| Total | 490 (33.5%) | 1,111 (75.9%) |
Disability Status by Sex by Age in Niverville
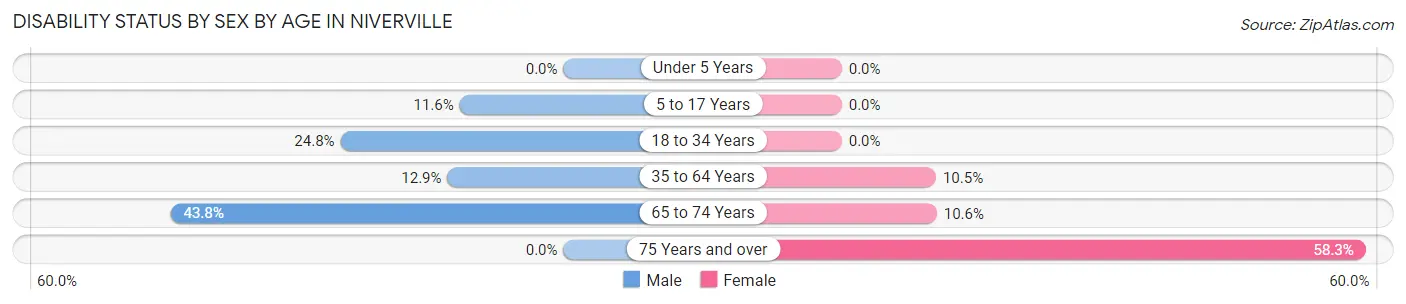
| Age Bracket | Male | Female |
| Under 5 Years | 0 (0.0%) | 0 (0.0%) |
| 5 to 17 Years | 17 (11.6%) | 0 (0.0%) |
| 18 to 34 Years | 36 (24.8%) | 0 (0.0%) |
| 35 to 64 Years | 27 (12.9%) | 28 (10.5%) |
| 65 to 74 Years | 49 (43.8%) | 11 (10.6%) |
| 75 Years and over | 0 (0.0%) | 14 (58.3%) |
Disability Class by Sex by Age in Niverville
Disability Class: Hearing Difficulty
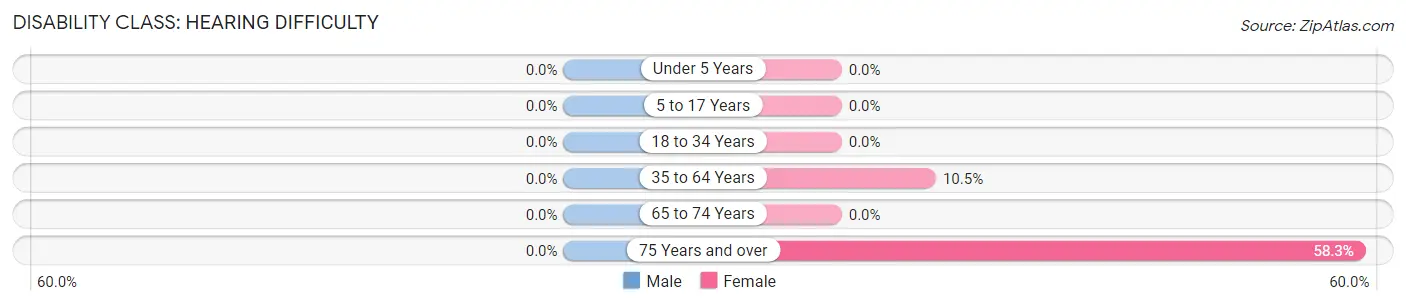
| Age Bracket | Male | Female |
| Under 5 Years | 0 (0.0%) | 0 (0.0%) |
| 5 to 17 Years | 0 (0.0%) | 0 (0.0%) |
| 18 to 34 Years | 0 (0.0%) | 0 (0.0%) |
| 35 to 64 Years | 0 (0.0%) | 28 (10.5%) |
| 65 to 74 Years | 0 (0.0%) | 0 (0.0%) |
| 75 Years and over | 0 (0.0%) | 14 (58.3%) |
Disability Class: Vision Difficulty
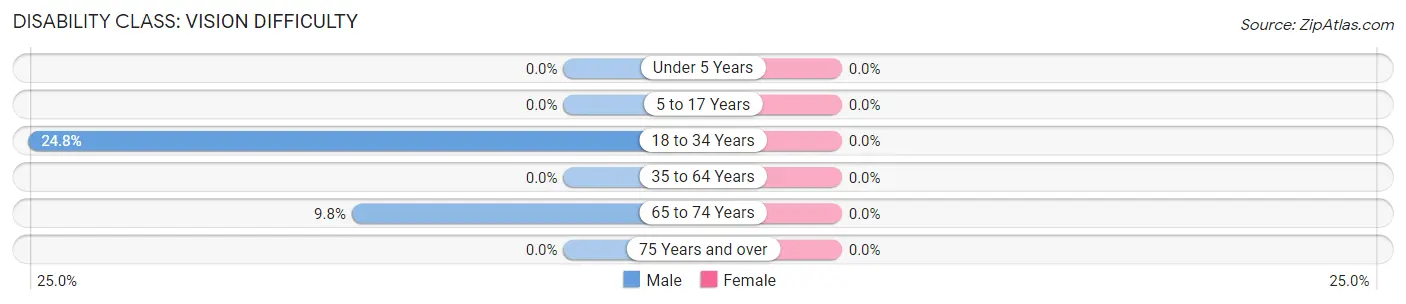
| Age Bracket | Male | Female |
| Under 5 Years | 0 (0.0%) | 0 (0.0%) |
| 5 to 17 Years | 0 (0.0%) | 0 (0.0%) |
| 18 to 34 Years | 36 (24.8%) | 0 (0.0%) |
| 35 to 64 Years | 0 (0.0%) | 0 (0.0%) |
| 65 to 74 Years | 11 (9.8%) | 0 (0.0%) |
| 75 Years and over | 0 (0.0%) | 0 (0.0%) |
Disability Class: Cognitive Difficulty
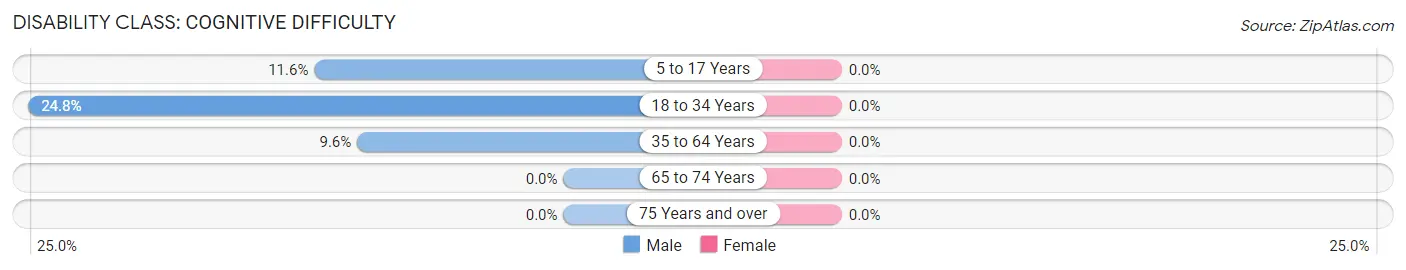
| Age Bracket | Male | Female |
| 5 to 17 Years | 17 (11.6%) | 0 (0.0%) |
| 18 to 34 Years | 36 (24.8%) | 0 (0.0%) |
| 35 to 64 Years | 20 (9.6%) | 0 (0.0%) |
| 65 to 74 Years | 0 (0.0%) | 0 (0.0%) |
| 75 Years and over | 0 (0.0%) | 0 (0.0%) |
Disability Class: Ambulatory Difficulty
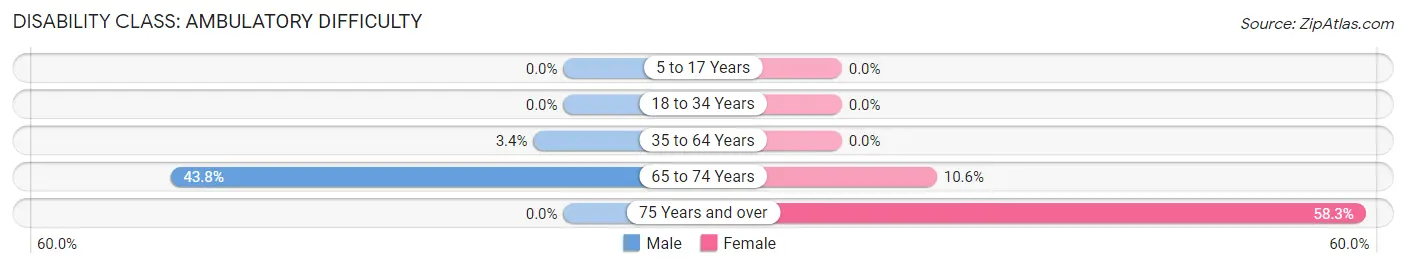
| Age Bracket | Male | Female |
| 5 to 17 Years | 0 (0.0%) | 0 (0.0%) |
| 18 to 34 Years | 0 (0.0%) | 0 (0.0%) |
| 35 to 64 Years | 7 (3.4%) | 0 (0.0%) |
| 65 to 74 Years | 49 (43.8%) | 11 (10.6%) |
| 75 Years and over | 0 (0.0%) | 14 (58.3%) |
Disability Class: Self-Care Difficulty
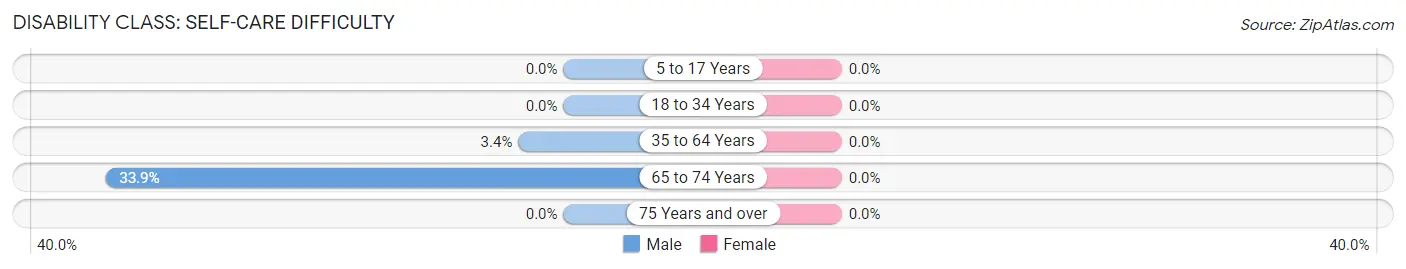
| Age Bracket | Male | Female |
| 5 to 17 Years | 0 (0.0%) | 0 (0.0%) |
| 18 to 34 Years | 0 (0.0%) | 0 (0.0%) |
| 35 to 64 Years | 7 (3.4%) | 0 (0.0%) |
| 65 to 74 Years | 38 (33.9%) | 0 (0.0%) |
| 75 Years and over | 0 (0.0%) | 0 (0.0%) |
Technology Access in Niverville
Computing Device Access in Niverville
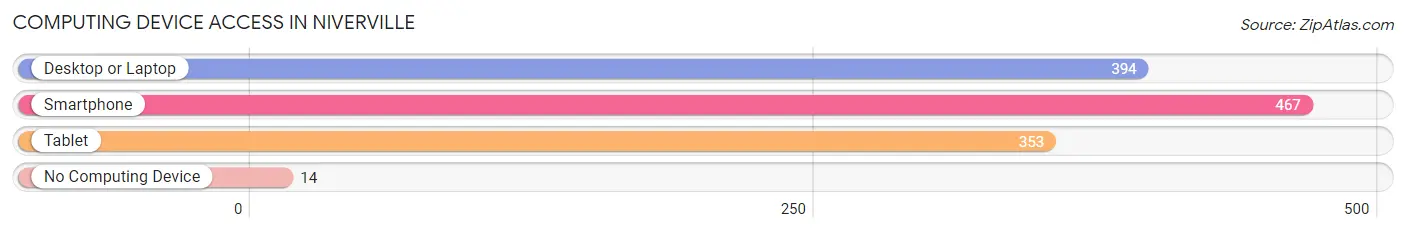
| Device Type | # Households | % Households |
| Desktop or Laptop | 394 | 76.9% |
| Smartphone | 467 | 91.2% |
| Tablet | 353 | 69.0% |
| No Computing Device | 14 | 2.7% |
| Total | 512 | 100.0% |
Internet Access in Niverville
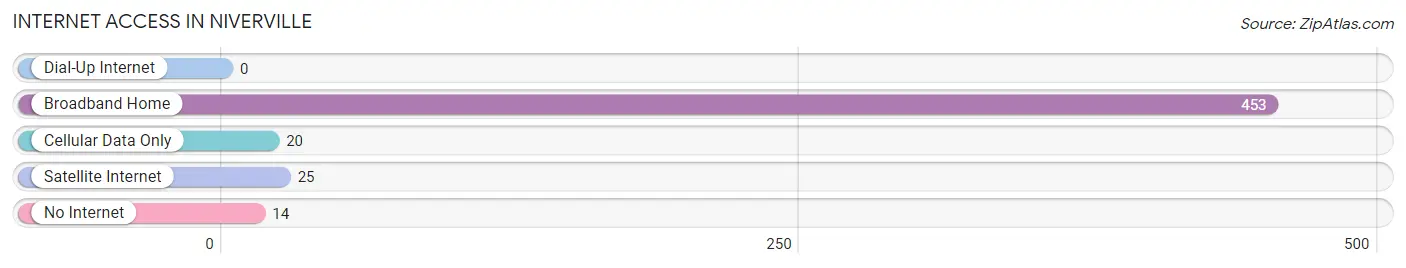
| Internet Type | # Households | % Households |
| Dial-Up Internet | 0 | 0.0% |
| Broadband Home | 453 | 88.5% |
| Cellular Data Only | 20 | 3.9% |
| Satellite Internet | 25 | 4.9% |
| No Internet | 14 | 2.7% |
| Total | 512 | 100.0% |
Niverville Summary
Niverville is a small town located in Columbia County, New York, United States. It is situated in the Hudson Valley region of the state, about 25 miles south of Albany. The town was founded in 1788 and has a population of approximately 1,500 people.
History
Niverville was founded in 1788 by John Niver, a Revolutionary War veteran. He purchased the land from the local Native American tribes and named the town after himself. The town was originally part of the town of Kinderhook, but was later incorporated as its own town in 1819.
In the early 19th century, Niverville was a thriving agricultural community. The town was known for its dairy farms, orchards, and vegetable gardens. The town also had a number of mills, including a grist mill, a saw mill, and a paper mill.
In the late 19th century, the town began to decline as the agricultural industry shifted away from the area. The town’s population decreased and many of the businesses closed.
In the early 20th century, the town began to experience a resurgence. The town was home to a number of factories, including a glove factory, a furniture factory, and a brickyard. The town also had a number of stores, including a general store, a hardware store, and a drug store.
Geography
Niverville is located in the Hudson Valley region of New York. The town is situated on the east bank of the Hudson River, about 25 miles south of Albany. The town is bordered by the towns of Kinderhook to the north, Chatham to the east, and Ghent to the south.
The town has a total area of 4.2 square miles, all of which is land. The terrain is mostly flat, with some rolling hills. The town is located in a temperate climate, with warm summers and cold winters.
Economy
Niverville’s economy is largely based on agriculture and tourism. The town is home to a number of farms, including dairy farms, orchards, and vegetable gardens. The town also has a number of stores, including a general store, a hardware store, and a drug store.
The town is also home to a number of small businesses, including a furniture factory, a glove factory, and a brickyard. The town also has a number of restaurants, including a diner and a pizzeria.
The town is also home to a number of tourist attractions, including the Niverville Historical Society Museum, the Niverville Nature Center, and the Niverville Art Gallery.
Demographics
As of the 2010 census, the town had a population of 1,500 people. The racial makeup of the town was 97.3% White, 0.7% African American, 0.3% Native American, 0.3% Asian, and 1.3% from other races.
The median household income in the town was $50,000, and the median family income was $60,000. The per capita income in the town was $25,000. About 8.3% of the population was below the poverty line.
Common Questions
What is Per Capita Income in Niverville?
Per Capita income in Niverville is $66,130.
What is the Median Family Income in Niverville?
Median Family Income in Niverville is $125,541.
What is the Median Household income in Niverville?
Median Household Income in Niverville is $96,607.
What is Inequality or Gini Index in Niverville?
Inequality or Gini Index in Niverville is 0.55.
What is the Total Population of Niverville?
Total Population of Niverville is 1,463.
What is the Total Male Population of Niverville?
Total Male Population of Niverville is 685.
What is the Total Female Population of Niverville?
Total Female Population of Niverville is 778.
What is the Ratio of Males per 100 Females in Niverville?
There are 88.05 Males per 100 Females in Niverville.
What is the Ratio of Females per 100 Males in Niverville?
There are 113.58 Females per 100 Males in Niverville.
What is the Median Population Age in Niverville?
Median Population Age in Niverville is 33.7 Years.
What is the Average Family Size in Niverville
Average Family Size in Niverville is 2.9 People.
What is the Average Household Size in Niverville
Average Household Size in Niverville is 2.9 People.
How Large is the Labor Force in Niverville?
There are 777 People in the Labor Forcein in Niverville.
What is the Percentage of People in the Labor Force in Niverville?
72.1% of People are in the Labor Force in Niverville.
What is the Unemployment Rate in Niverville?
Unemployment Rate in Niverville is 13.1%.