Gorham, NY Map & Demographics
Gorham Map
Gorham Overview
$39,312
PER CAPITA INCOME
$105,804
AVG FAMILY INCOME
$86,250
AVG HOUSEHOLD INCOME
81.2%
WAGE / INCOME GAP [ % ]
18.8¢/ $1
WAGE / INCOME GAP [ $ ]
0.19
INEQUALITY / GINI INDEX
474
TOTAL POPULATION
258
MALE POPULATION
216
FEMALE POPULATION
119.44
MALES / 100 FEMALES
83.72
FEMALES / 100 MALES
45.8
MEDIAN AGE
2.6
AVG FAMILY SIZE
2.2
AVG HOUSEHOLD SIZE
304
LABOR FORCE [ PEOPLE ]
73.6%
PERCENT IN LABOR FORCE
Income in Gorham
Income Overview in Gorham
Per Capita Income in Gorham is $39,312, while median incomes of families and households are $105,804 and $86,250 respectively.
| Characteristic | Number | Measure |
| Per Capita Income | 474 | $39,312 |
| Median Family Income | 135 | $105,804 |
| Mean Family Income | 135 | $98,081 |
| Median Household Income | 218 | $86,250 |
| Mean Household Income | 218 | $85,264 |
| Income Deficit | 135 | $0 |
| Wage / Income Gap (%) | 474 | 81.20% |
| Wage / Income Gap ($) | 474 | 18.80¢ per $1 |
| Gini / Inequality Index | 474 | 0.19 |
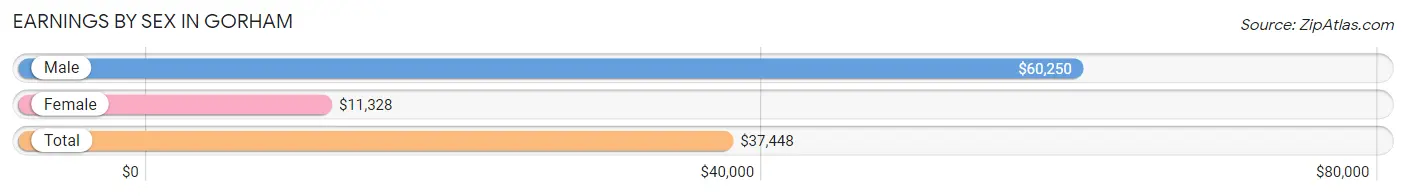
Earnings by Sex in Gorham
Average Earnings in Gorham are $37,448, $60,250 for men and $11,328 for women, a difference of 81.2%.
| Sex | Number | Average Earnings |
| Male | 162 (52.1%) | $60,250 |
| Female | 149 (47.9%) | $11,328 |
| Total | 311 (100.0%) | $37,448 |
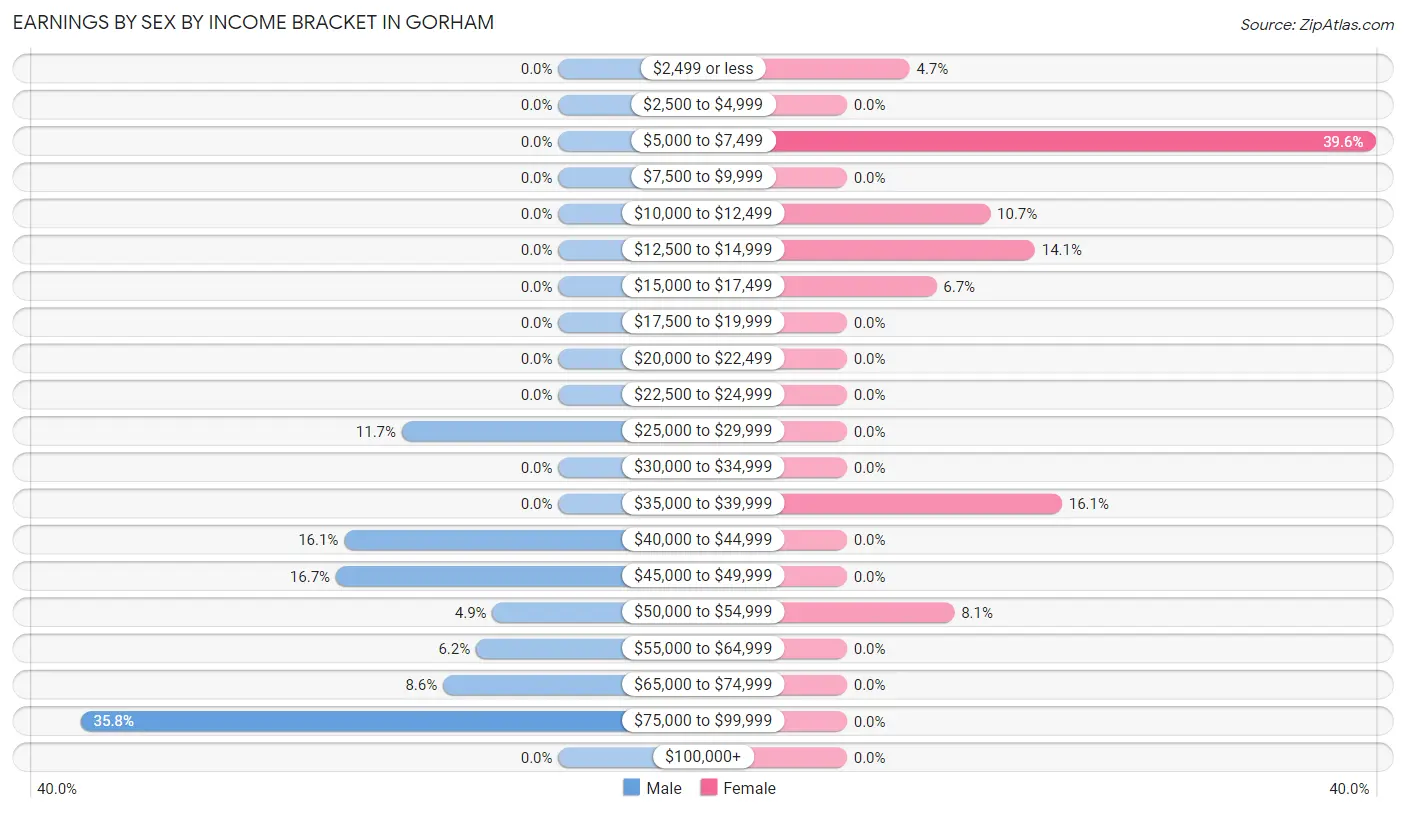
Earnings by Sex by Income Bracket in Gorham
The most common earnings brackets in Gorham are $75,000 to $99,999 for men (58 | 35.8%) and $5,000 to $7,499 for women (59 | 39.6%).
| Income | Male | Female |
| $2,499 or less | 0 (0.0%) | 7 (4.7%) |
| $2,500 to $4,999 | 0 (0.0%) | 0 (0.0%) |
| $5,000 to $7,499 | 0 (0.0%) | 59 (39.6%) |
| $7,500 to $9,999 | 0 (0.0%) | 0 (0.0%) |
| $10,000 to $12,499 | 0 (0.0%) | 16 (10.7%) |
| $12,500 to $14,999 | 0 (0.0%) | 21 (14.1%) |
| $15,000 to $17,499 | 0 (0.0%) | 10 (6.7%) |
| $17,500 to $19,999 | 0 (0.0%) | 0 (0.0%) |
| $20,000 to $22,499 | 0 (0.0%) | 0 (0.0%) |
| $22,500 to $24,999 | 0 (0.0%) | 0 (0.0%) |
| $25,000 to $29,999 | 19 (11.7%) | 0 (0.0%) |
| $30,000 to $34,999 | 0 (0.0%) | 0 (0.0%) |
| $35,000 to $39,999 | 0 (0.0%) | 24 (16.1%) |
| $40,000 to $44,999 | 26 (16.1%) | 0 (0.0%) |
| $45,000 to $49,999 | 27 (16.7%) | 0 (0.0%) |
| $50,000 to $54,999 | 8 (4.9%) | 12 (8.1%) |
| $55,000 to $64,999 | 10 (6.2%) | 0 (0.0%) |
| $65,000 to $74,999 | 14 (8.6%) | 0 (0.0%) |
| $75,000 to $99,999 | 58 (35.8%) | 0 (0.0%) |
| $100,000+ | 0 (0.0%) | 0 (0.0%) |
| Total | 162 (100.0%) | 149 (100.0%) |
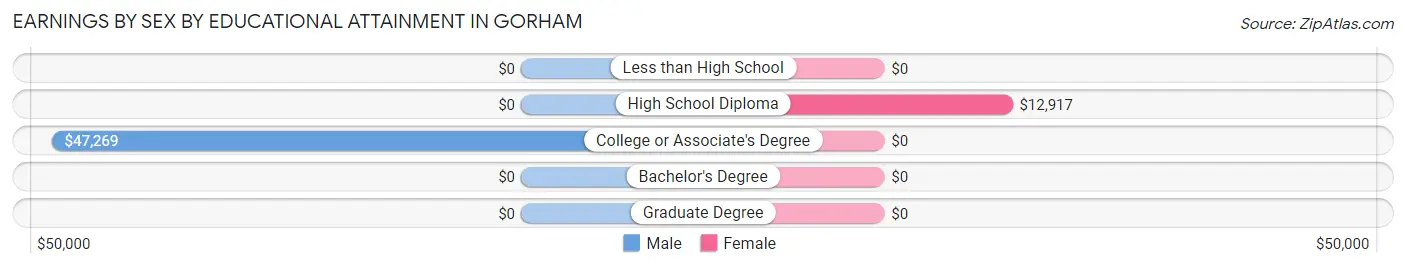
Earnings by Sex by Educational Attainment in Gorham
Average earnings in Gorham are $60,250 for men and $11,328 for women, a difference of 81.2%. Men with an educational attainment of college or associate's degree enjoy the highest average annual earnings of $47,269, while those with college or associate's degree education earn the least with $47,269. Women with an educational attainment of high school diploma earn the most with the average annual earnings of $12,917, while those with high school diploma education have the smallest earnings of $12,917.
| Educational Attainment | Male Income | Female Income |
| Less than High School | - | - |
| High School Diploma | - | - |
| College or Associate's Degree | $47,269 | $0 |
| Bachelor's Degree | - | - |
| Graduate Degree | - | - |
| Total | $60,250 | $11,328 |
Family Income in Gorham
Family Income Brackets in Gorham
According to the Gorham family income data, there are 60 families falling into the $100,000 to $149,999 income range, which is the most common income bracket and makes up 44.4% of all families.
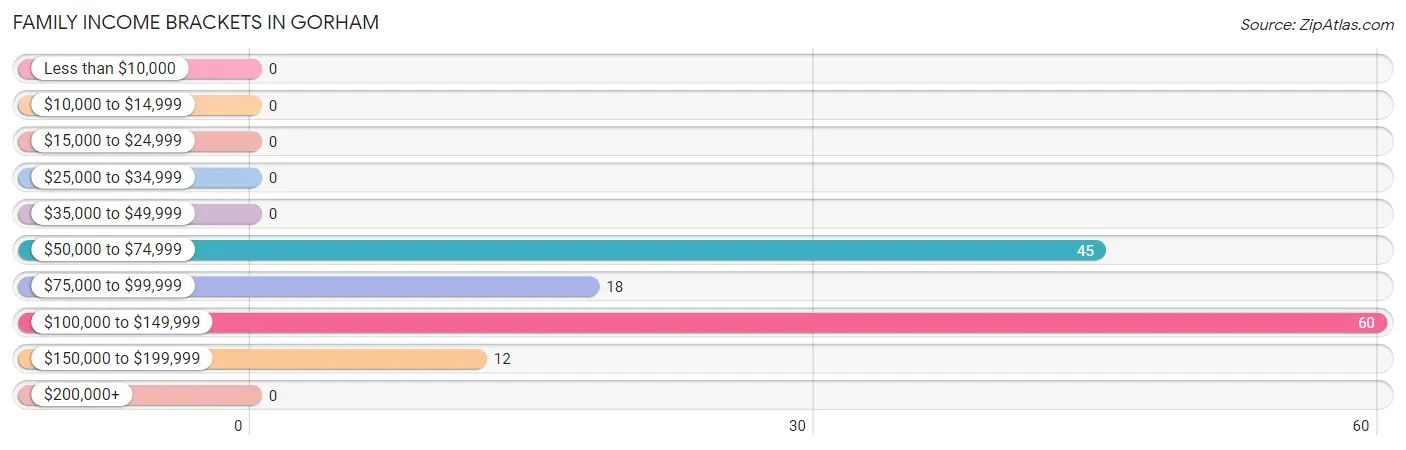
| Income Bracket | # Families | % Families |
| Less than $10,000 | 0 | 0.0% |
| $10,000 to $14,999 | 0 | 0.0% |
| $15,000 to $24,999 | 0 | 0.0% |
| $25,000 to $34,999 | 0 | 0.0% |
| $35,000 to $49,999 | 0 | 0.0% |
| $50,000 to $74,999 | 45 | 33.3% |
| $75,000 to $99,999 | 18 | 13.3% |
| $100,000 to $149,999 | 60 | 44.4% |
| $150,000 to $199,999 | 12 | 8.9% |
| $200,000+ | 0 | 0.0% |
Family Income by Famaliy Size in Gorham
2-person families (88 | 65.2%) account for the highest median family income in Gorham with $112,609 per family, while 2-person families (88 | 65.2%) have the highest median income of $56,304 per family member.
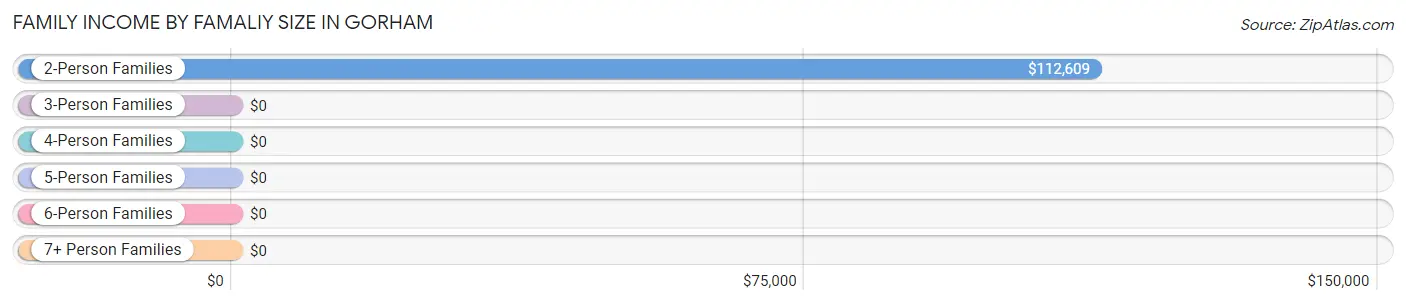
| Income Bracket | # Families | Median Income |
| 2-Person Families | 88 (65.2%) | $112,609 |
| 3-Person Families | 21 (15.6%) | $0 |
| 4-Person Families | 26 (19.3%) | $0 |
| 5-Person Families | 0 (0.0%) | $0 |
| 6-Person Families | 0 (0.0%) | $0 |
| 7+ Person Families | 0 (0.0%) | $0 |
| Total | 135 (100.0%) | $105,804 |
Family Income by Number of Earners in Gorham
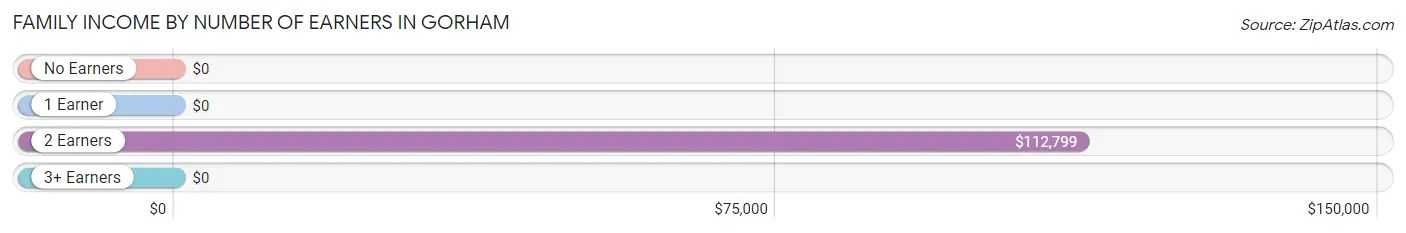
| Number of Earners | # Families | Median Income |
| No Earners | 21 (15.6%) | $0 |
| 1 Earner | 0 (0.0%) | $0 |
| 2 Earners | 105 (77.8%) | $112,799 |
| 3+ Earners | 9 (6.7%) | $0 |
| Total | 135 (100.0%) | $105,804 |
Household Income in Gorham
Household Income Brackets in Gorham
With 95 households falling in the category, the $50,000 to $74,999 income range is the most frequent in Gorham, accounting for 43.6% of all households.
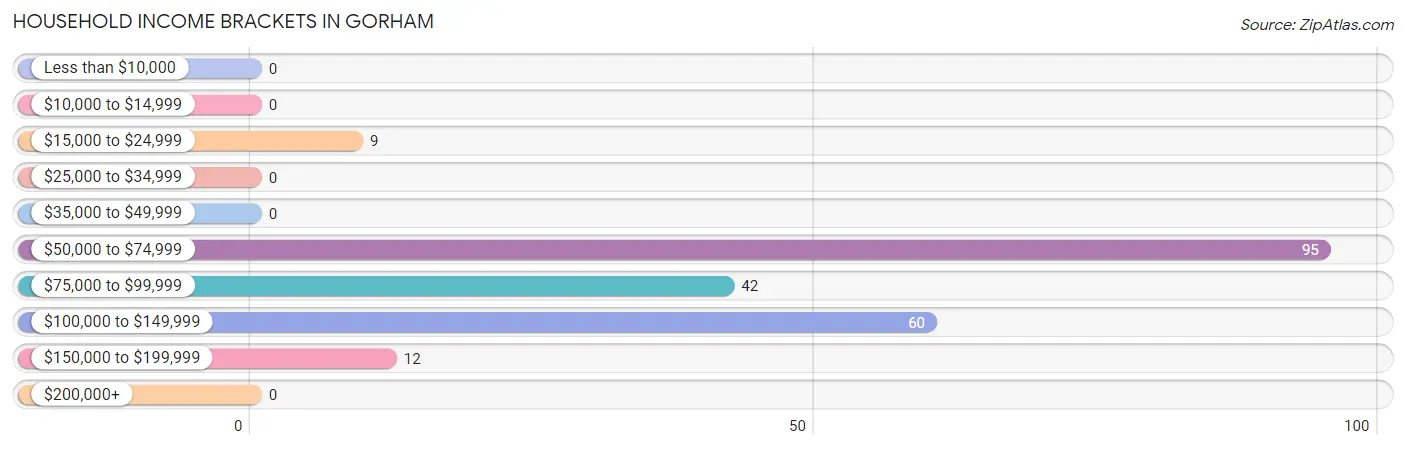
| Income Bracket | # Households | % Households |
| Less than $10,000 | 0 | 0.0% |
| $10,000 to $14,999 | 0 | 0.0% |
| $15,000 to $24,999 | 9 | 4.1% |
| $25,000 to $34,999 | 0 | 0.0% |
| $35,000 to $49,999 | 0 | 0.0% |
| $50,000 to $74,999 | 95 | 43.6% |
| $75,000 to $99,999 | 42 | 19.3% |
| $100,000 to $149,999 | 60 | 27.5% |
| $150,000 to $199,999 | 12 | 5.5% |
| $200,000+ | 0 | 0.0% |
Household Income by Householder Age in Gorham
The median household income in Gorham is $86,250, with the highest median household income of $93,359 found in the 65+ years age bracket for the primary householder. A total of 134 households (61.5%) fall into this category.
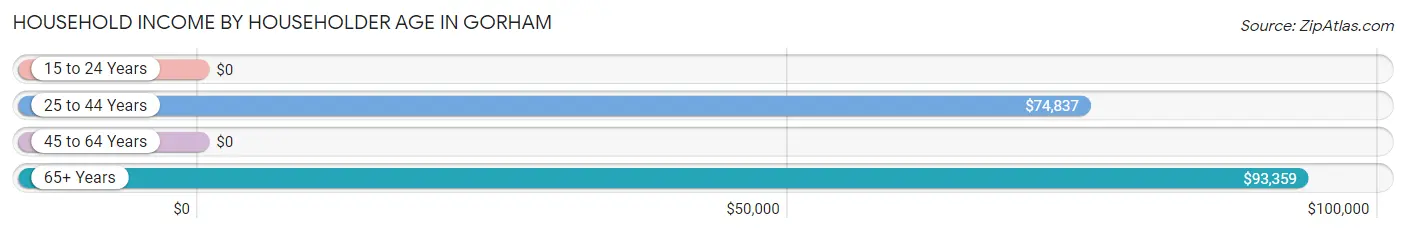
| Income Bracket | # Households | Median Income |
| 15 to 24 Years | 0 (0.0%) | $0 |
| 25 to 44 Years | 75 (34.4%) | $74,837 |
| 45 to 64 Years | 9 (4.1%) | $0 |
| 65+ Years | 134 (61.5%) | $93,359 |
| Total | 218 (100.0%) | $86,250 |
Poverty in Gorham
Income Below Poverty by Sex and Age in Gorham
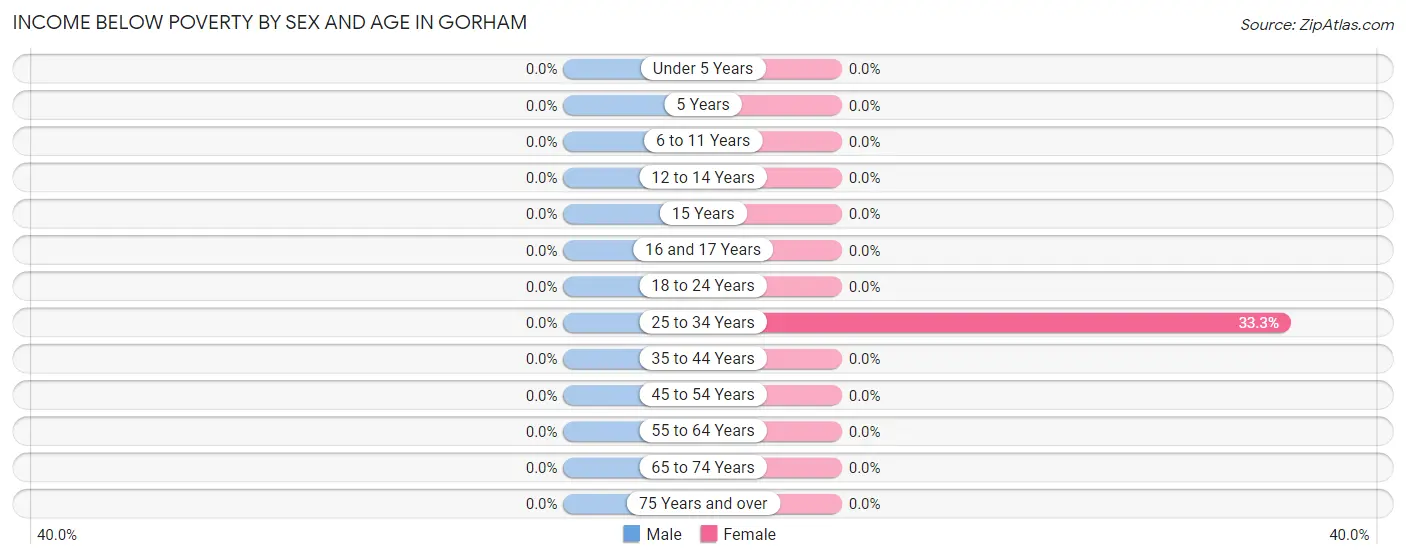
| Age Bracket | Male | Female |
| Under 5 Years | 0 (0.0%) | 0 (0.0%) |
| 5 Years | 0 (0.0%) | 0 (0.0%) |
| 6 to 11 Years | 0 (0.0%) | 0 (0.0%) |
| 12 to 14 Years | 0 (0.0%) | 0 (0.0%) |
| 15 Years | 0 (0.0%) | 0 (0.0%) |
| 16 and 17 Years | 0 (0.0%) | 0 (0.0%) |
| 18 to 24 Years | 0 (0.0%) | 0 (0.0%) |
| 25 to 34 Years | 0 (0.0%) | 16 (33.3%) |
| 35 to 44 Years | 0 (0.0%) | 0 (0.0%) |
| 45 to 54 Years | 0 (0.0%) | 0 (0.0%) |
| 55 to 64 Years | 0 (0.0%) | 0 (0.0%) |
| 65 to 74 Years | 0 (0.0%) | 0 (0.0%) |
| 75 Years and over | 0 (0.0%) | 0 (0.0%) |
| Total | 0 (0.0%) | 16 (7.4%) |
Income Above Poverty by Sex and Age in Gorham
According to the poverty statistics in Gorham, males aged under 5 years and females aged 6 to 11 years are the age groups that are most secure financially, with 100.0% of males and 100.0% of females in these age groups living above the poverty line.
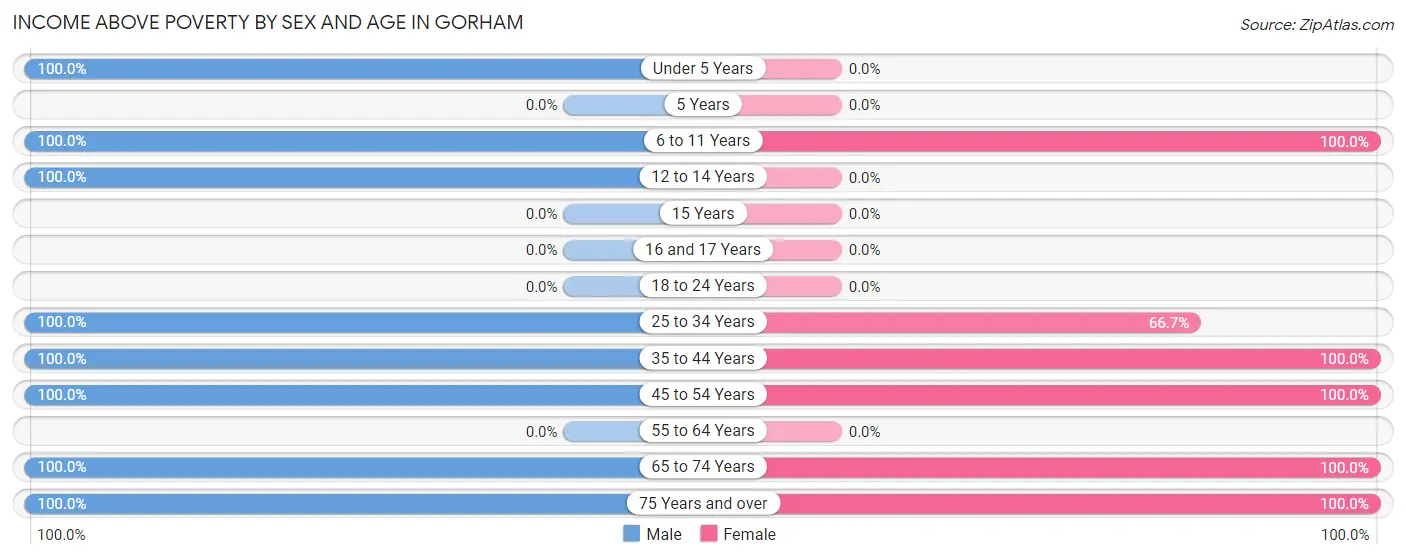
| Age Bracket | Male | Female |
| Under 5 Years | 10 (100.0%) | 0 (0.0%) |
| 5 Years | 0 (0.0%) | 0 (0.0%) |
| 6 to 11 Years | 12 (100.0%) | 11 (100.0%) |
| 12 to 14 Years | 28 (100.0%) | 0 (0.0%) |
| 15 Years | 0 (0.0%) | 0 (0.0%) |
| 16 and 17 Years | 0 (0.0%) | 0 (0.0%) |
| 18 to 24 Years | 0 (0.0%) | 0 (0.0%) |
| 25 to 34 Years | 55 (100.0%) | 32 (66.7%) |
| 35 to 44 Years | 26 (100.0%) | 26 (100.0%) |
| 45 to 54 Years | 35 (100.0%) | 9 (100.0%) |
| 55 to 64 Years | 0 (0.0%) | 0 (0.0%) |
| 65 to 74 Years | 83 (100.0%) | 86 (100.0%) |
| 75 Years and over | 8 (100.0%) | 36 (100.0%) |
| Total | 257 (100.0%) | 200 (92.6%) |
Income Below Poverty Among Married-Couple Families in Gorham
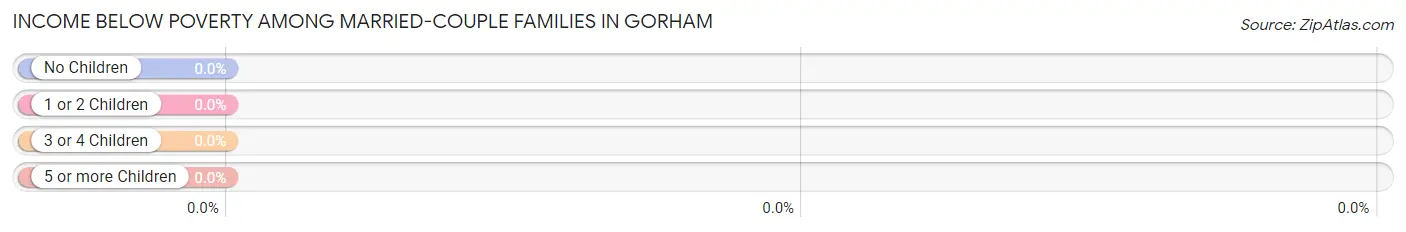
| Children | Above Poverty | Below Poverty |
| No Children | 86 (100.0%) | 0 (0.0%) |
| 1 or 2 Children | 38 (100.0%) | 0 (0.0%) |
| 3 or 4 Children | 0 (0.0%) | 0 (0.0%) |
| 5 or more Children | 0 (0.0%) | 0 (0.0%) |
| Total | 124 (100.0%) | 0 (0.0%) |
Income Below Poverty Among Single-Parent Households in Gorham
| Children | Single Father | Single Mother |
| No Children | 0 (0.0%) | 0 (0.0%) |
| 1 or 2 Children | 0 (0.0%) | 0 (0.0%) |
| 3 or 4 Children | 0 (0.0%) | 0 (0.0%) |
| 5 or more Children | 0 (0.0%) | 0 (0.0%) |
| Total | 0 (0.0%) | 0 (0.0%) |
Income Below Poverty Among Married-Couple vs Single-Parent Households in Gorham
| Children | Married-Couple Families | Single-Parent Households |
| No Children | 0 (0.0%) | 0 (0.0%) |
| 1 or 2 Children | 0 (0.0%) | 0 (0.0%) |
| 3 or 4 Children | 0 (0.0%) | 0 (0.0%) |
| 5 or more Children | 0 (0.0%) | 0 (0.0%) |
| Total | 0 (0.0%) | 0 (0.0%) |
Race in Gorham
The most populous races in Gorham are White / Caucasian (457 | 96.4%), Two or more Races (17 | 3.6%), and Hispanic or Latino (1 | 0.2%).
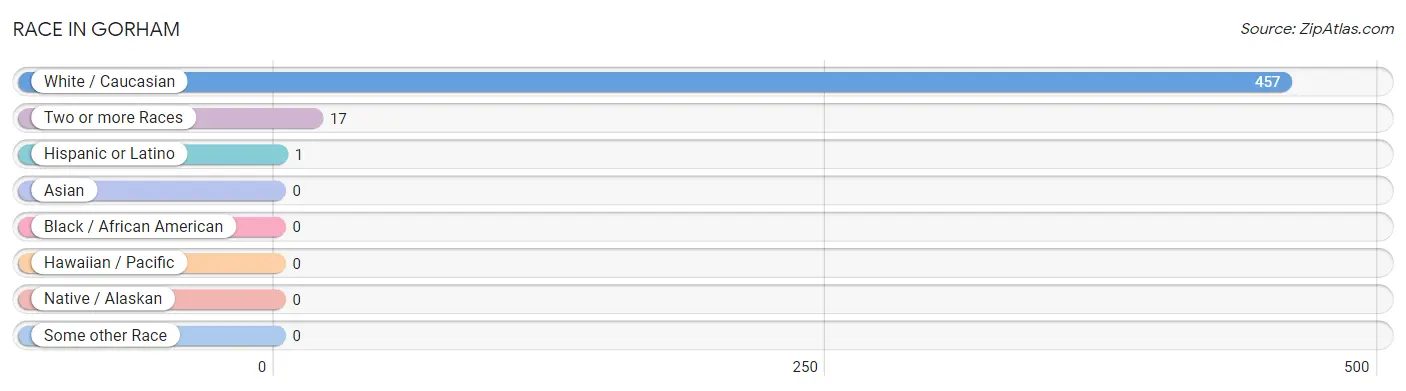
| Race | # Population | % Population |
| Asian | 0 | 0.0% |
| Black / African American | 0 | 0.0% |
| Hawaiian / Pacific | 0 | 0.0% |
| Hispanic or Latino | 1 | 0.2% |
| Native / Alaskan | 0 | 0.0% |
| White / Caucasian | 457 | 96.4% |
| Two or more Races | 17 | 3.6% |
| Some other Race | 0 | 0.0% |
| Total | 474 | 100.0% |
Ancestry in Gorham
The most populous ancestries reported in Gorham are English (140 | 29.5%), German (96 | 20.3%), Irish (60 | 12.7%), American (53 | 11.2%), and Italian (52 | 11.0%), together accounting for 84.6% of all Gorham residents.
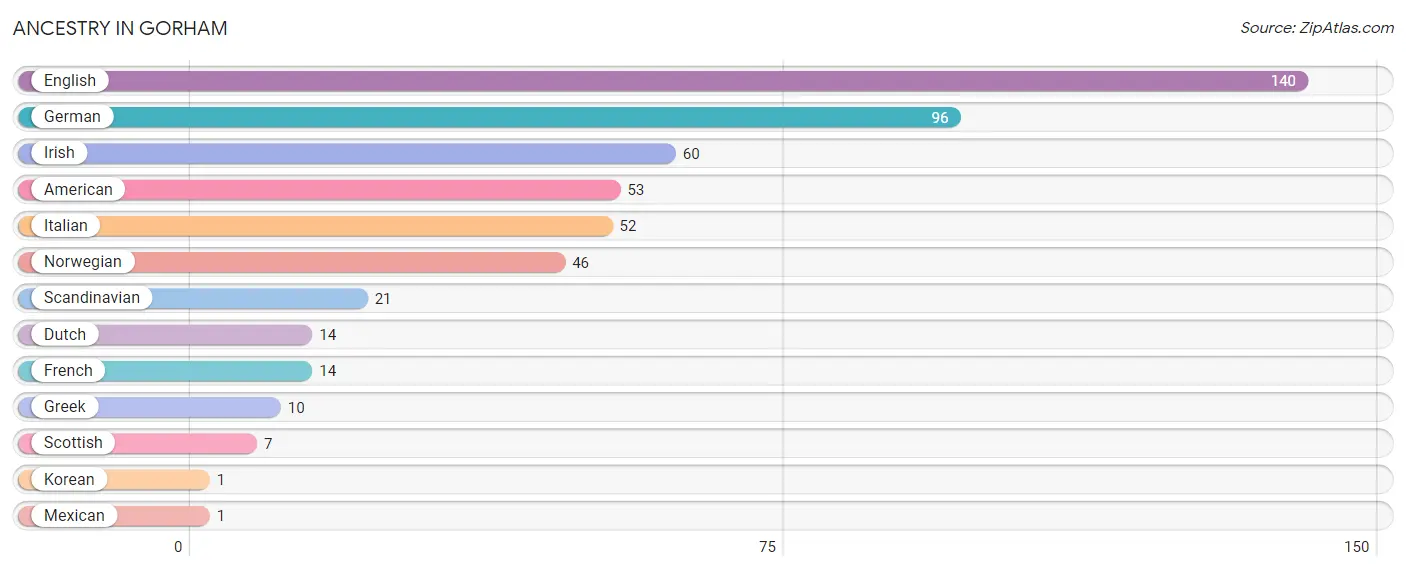
| Ancestry | # Population | % Population |
| American | 53 | 11.2% |
| Dutch | 14 | 2.9% |
| English | 140 | 29.5% |
| French | 14 | 2.9% |
| German | 96 | 20.3% |
| Greek | 10 | 2.1% |
| Irish | 60 | 12.7% |
| Italian | 52 | 11.0% |
| Korean | 1 | 0.2% |
| Mexican | 1 | 0.2% |
| Norwegian | 46 | 9.7% |
| Scandinavian | 21 | 4.4% |
| Scottish | 7 | 1.5% | View All 13 Rows |
Immigrants in Gorham

| Immigration Origin | # Population | % Population | View All 0 Rows |
Sex and Age in Gorham
Sex and Age in Gorham
The most populous age groups in Gorham are 70 to 74 Years (46 | 17.8%) for men and 70 to 74 Years (66 | 30.6%) for women.
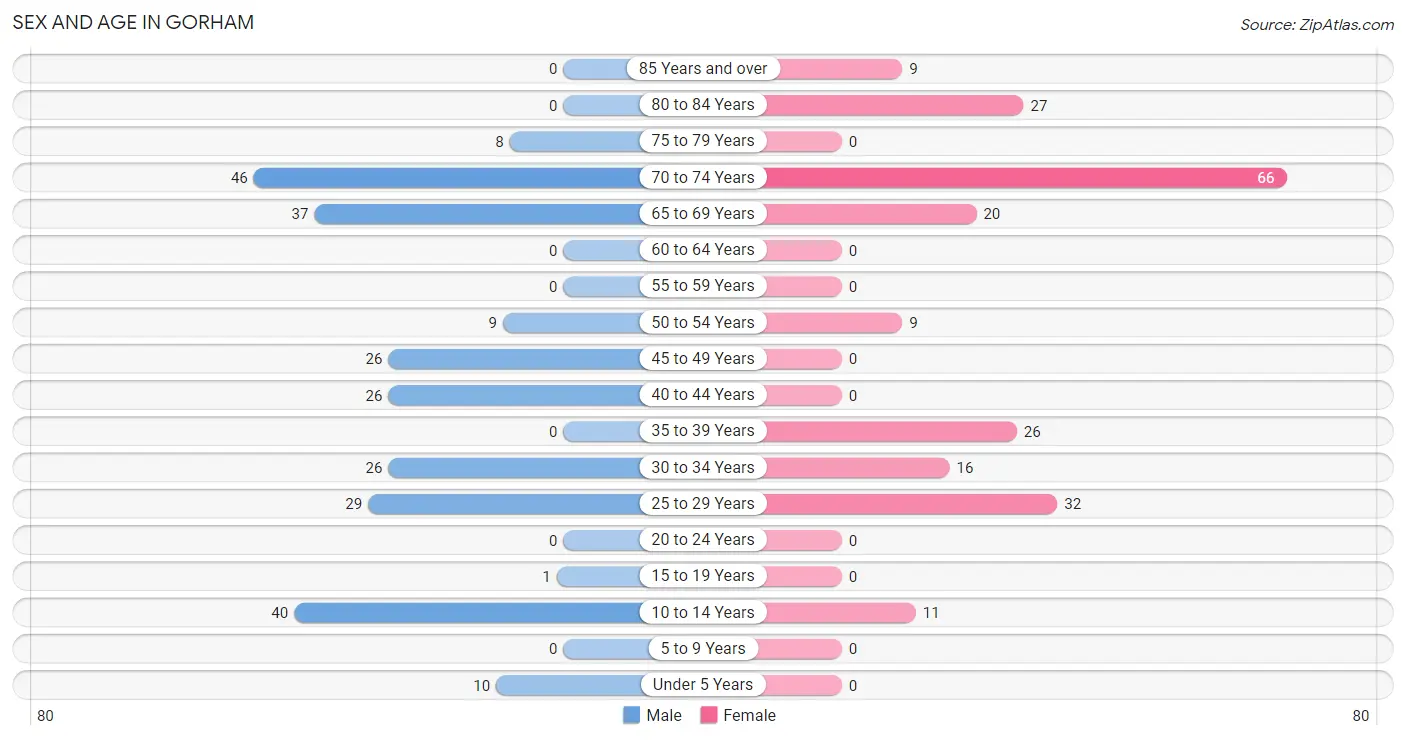
| Age Bracket | Male | Female |
| Under 5 Years | 10 (3.9%) | 0 (0.0%) |
| 5 to 9 Years | 0 (0.0%) | 0 (0.0%) |
| 10 to 14 Years | 40 (15.5%) | 11 (5.1%) |
| 15 to 19 Years | 1 (0.4%) | 0 (0.0%) |
| 20 to 24 Years | 0 (0.0%) | 0 (0.0%) |
| 25 to 29 Years | 29 (11.2%) | 32 (14.8%) |
| 30 to 34 Years | 26 (10.1%) | 16 (7.4%) |
| 35 to 39 Years | 0 (0.0%) | 26 (12.0%) |
| 40 to 44 Years | 26 (10.1%) | 0 (0.0%) |
| 45 to 49 Years | 26 (10.1%) | 0 (0.0%) |
| 50 to 54 Years | 9 (3.5%) | 9 (4.2%) |
| 55 to 59 Years | 0 (0.0%) | 0 (0.0%) |
| 60 to 64 Years | 0 (0.0%) | 0 (0.0%) |
| 65 to 69 Years | 37 (14.3%) | 20 (9.3%) |
| 70 to 74 Years | 46 (17.8%) | 66 (30.6%) |
| 75 to 79 Years | 8 (3.1%) | 0 (0.0%) |
| 80 to 84 Years | 0 (0.0%) | 27 (12.5%) |
| 85 Years and over | 0 (0.0%) | 9 (4.2%) |
| Total | 258 (100.0%) | 216 (100.0%) |
Families and Households in Gorham
Median Family Size in Gorham
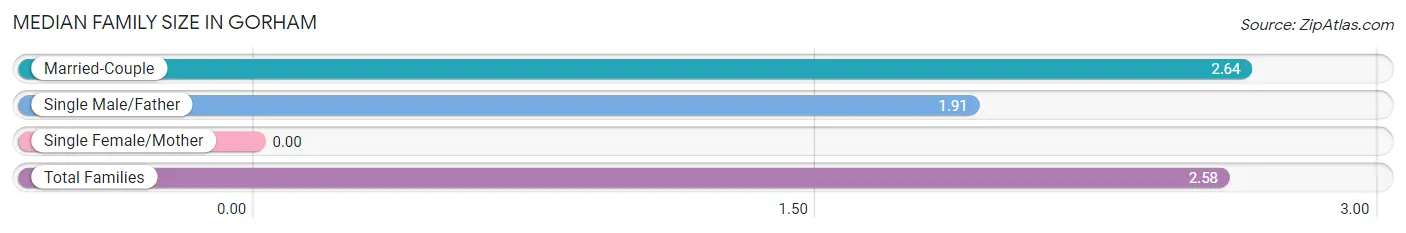
| Family Type | # Families | Family Size |
| Married-Couple | 124 (91.8%) | 2.64 |
| Single Male/Father | 11 (8.2%) | 1.91 |
| Single Female/Mother | 0 (0.0%) | - |
| Total Families | 135 (100.0%) | 2.58 |
Median Household Size in Gorham
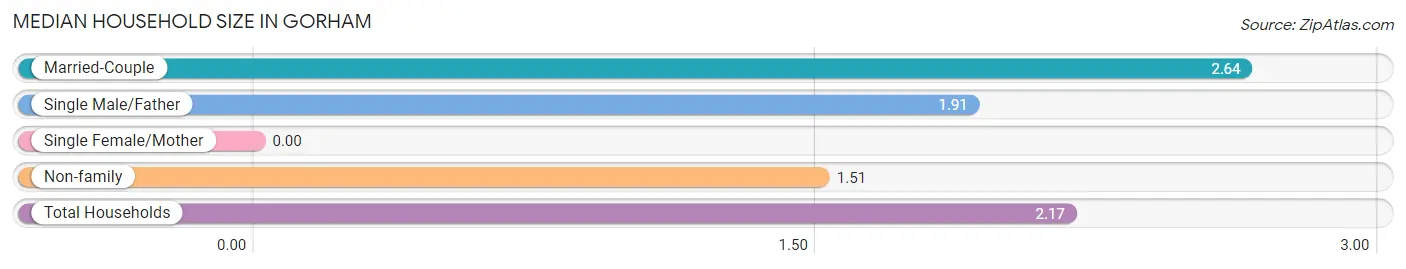
| Household Type | # Households | Household Size |
| Married-Couple | 124 (56.9%) | 2.64 |
| Single Male/Father | 11 (5.1%) | 1.91 |
| Single Female/Mother | 0 (0.0%) | - |
| Non-family | 83 (38.1%) | 1.51 |
| Total Households | 218 (100.0%) | 2.17 |
Household Size by Marriage Status in Gorham
Out of a total of 218 households in Gorham, 135 (61.9%) are family households, while 83 (38.1%) are nonfamily households. The most numerous type of family households are 2-person households, comprising 88, and the most common type of nonfamily households are 1-person households, comprising 43.
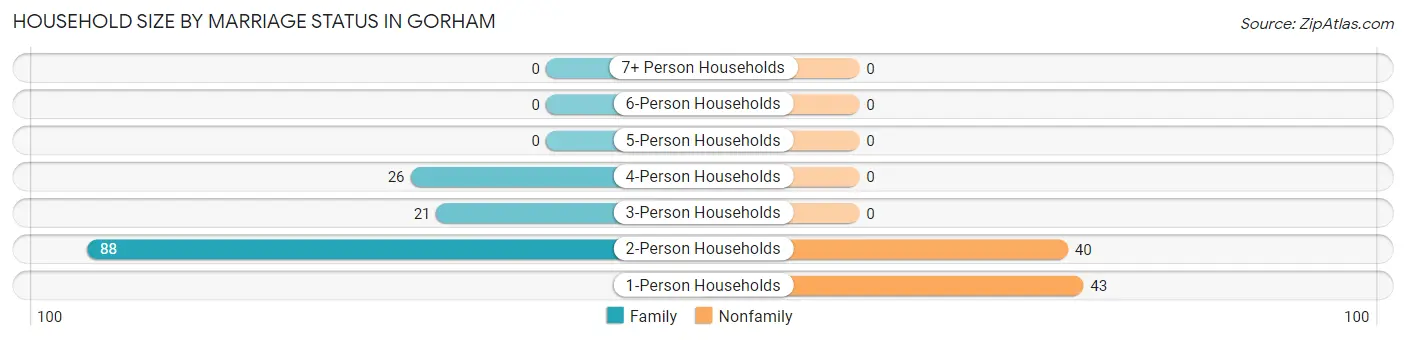
| Household Size | Family Households | Nonfamily Households |
| 1-Person Households | - | 43 (19.7%) |
| 2-Person Households | 88 (40.4%) | 40 (18.3%) |
| 3-Person Households | 21 (9.6%) | 0 (0.0%) |
| 4-Person Households | 26 (11.9%) | 0 (0.0%) |
| 5-Person Households | 0 (0.0%) | 0 (0.0%) |
| 6-Person Households | 0 (0.0%) | 0 (0.0%) |
| 7+ Person Households | 0 (0.0%) | 0 (0.0%) |
| Total | 135 (61.9%) | 83 (38.1%) |
Female Fertility in Gorham
Fertility by Age in Gorham
| Age Bracket | Women with Births | Births / 1,000 Women |
| 15 to 19 years | 0 (0.0%) | 0.0 |
| 20 to 34 years | 0 (0.0%) | 0.0 |
| 35 to 50 years | 0 (0.0%) | 0.0 |
| Total | 0 (0.0%) | 0.0 |
Fertility by Age by Marriage Status in Gorham
| Age Bracket | Married | Unmarried |
| 15 to 19 years | 0 (0.0%) | 0 (0.0%) |
| 20 to 34 years | 0 (0.0%) | 0 (0.0%) |
| 35 to 50 years | 0 (0.0%) | 0 (0.0%) |
| Total | 0 (0.0%) | 0 (0.0%) |
Fertility by Education in Gorham
| Educational Attainment | Women with Births | Births / 1,000 Women |
| Less than High School | 0 (0.0%) | 0.0 |
| High School Diploma | 0 (0.0%) | 0.0 |
| College or Associate's Degree | 0 (0.0%) | 0.0 |
| Bachelor's Degree | 0 (0.0%) | 0.0 |
| Graduate Degree | 0 (0.0%) | 0.0 |
| Total | 0 (0.0%) | 0.0 |
Fertility by Education by Marriage Status in Gorham
| Educational Attainment | Married | Unmarried |
| Less than High School | 0 (0.0%) | 0 (0.0%) |
| High School Diploma | 0 (0.0%) | 0 (0.0%) |
| College or Associate's Degree | 0 (0.0%) | 0 (0.0%) |
| Bachelor's Degree | 0 (0.0%) | 0 (0.0%) |
| Graduate Degree | 0 (0.0%) | 0 (0.0%) |
| Total | 0 (0.0%) | 0 (0.0%) |
Employment Characteristics in Gorham
Employment by Class of Employer in Gorham
Among the 304 employed individuals in Gorham, self-employed (not incorporated) (124 | 40.8%), private company employees (107 | 35.2%), and local government employees (38 | 12.5%) make up the most common classes of employment.
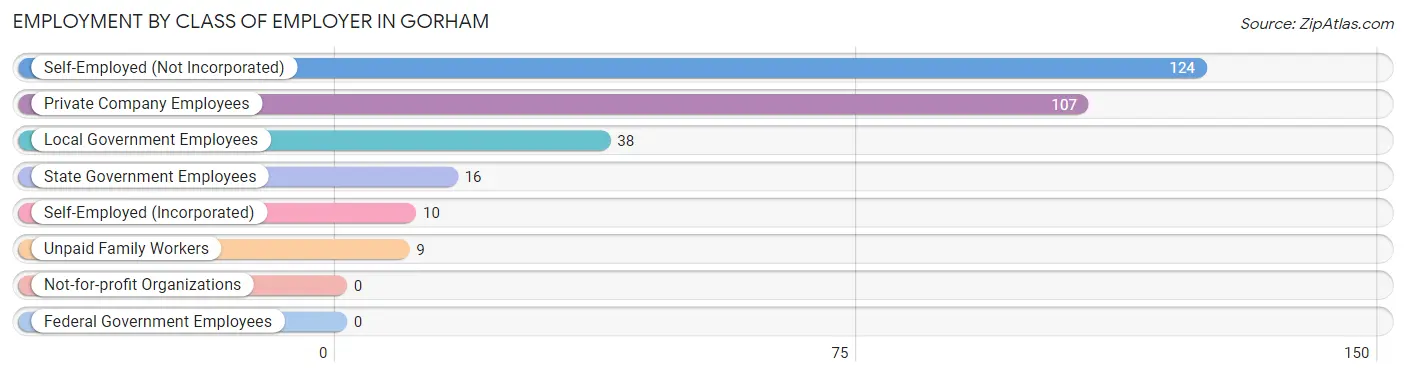
| Employer Class | # Employees | % Employees |
| Private Company Employees | 107 | 35.2% |
| Self-Employed (Incorporated) | 10 | 3.3% |
| Self-Employed (Not Incorporated) | 124 | 40.8% |
| Not-for-profit Organizations | 0 | 0.0% |
| Local Government Employees | 38 | 12.5% |
| State Government Employees | 16 | 5.3% |
| Federal Government Employees | 0 | 0.0% |
| Unpaid Family Workers | 9 | 3.0% |
| Total | 304 | 100.0% |
Employment Status by Age in Gorham
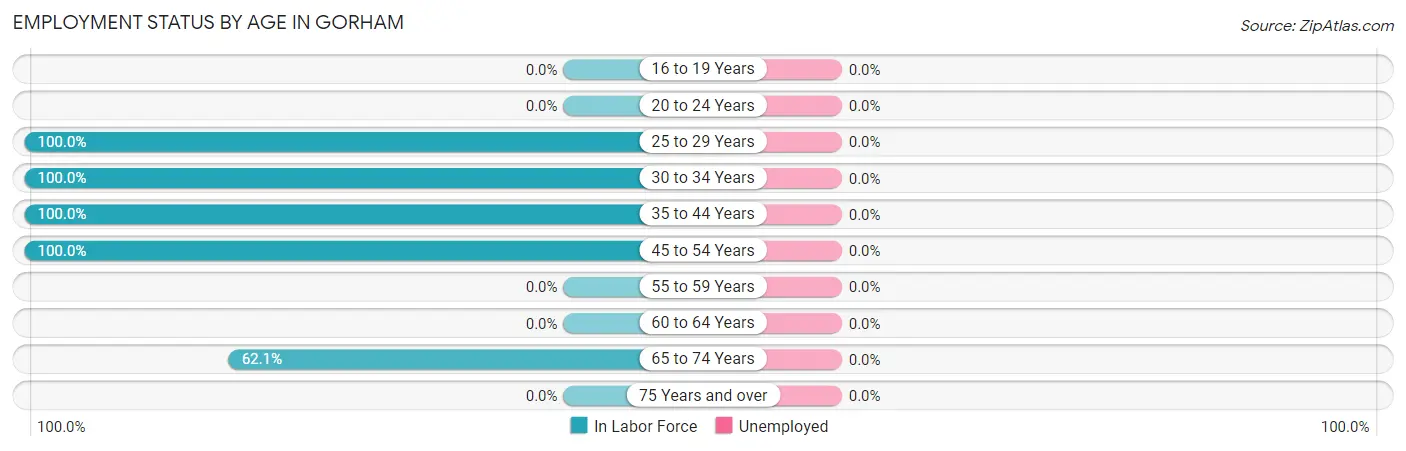
| Age Bracket | In Labor Force | Unemployed |
| 16 to 19 Years | 0 (0.0%) | 0 (0.0%) |
| 20 to 24 Years | 0 (0.0%) | 0 (0.0%) |
| 25 to 29 Years | 61 (100.0%) | 0 (0.0%) |
| 30 to 34 Years | 42 (100.0%) | 0 (0.0%) |
| 35 to 44 Years | 52 (100.0%) | 0 (0.0%) |
| 45 to 54 Years | 44 (100.0%) | 0 (0.0%) |
| 55 to 59 Years | 0 (0.0%) | 0 (0.0%) |
| 60 to 64 Years | 0 (0.0%) | 0 (0.0%) |
| 65 to 74 Years | 105 (62.1%) | 0 (0.0%) |
| 75 Years and over | 0 (0.0%) | 0 (0.0%) |
| Total | 304 (73.6%) | 0 (0.0%) |
Employment Status by Educational Attainment in Gorham
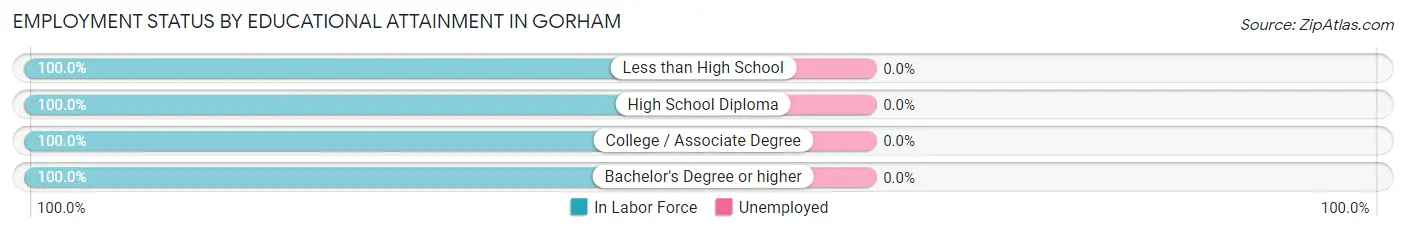
| Educational Attainment | In Labor Force | Unemployed |
| Less than High School | 9 (100.0%) | 0 (0.0%) |
| High School Diploma | 61 (100.0%) | 0 (0.0%) |
| College / Associate Degree | 91 (100.0%) | 0 (0.0%) |
| Bachelor's Degree or higher | 38 (100.0%) | 0 (0.0%) |
| Total | 199 (100.0%) | 0 (0.0%) |
Employment Occupations by Sex in Gorham
Management, Business, Science and Arts Occupations
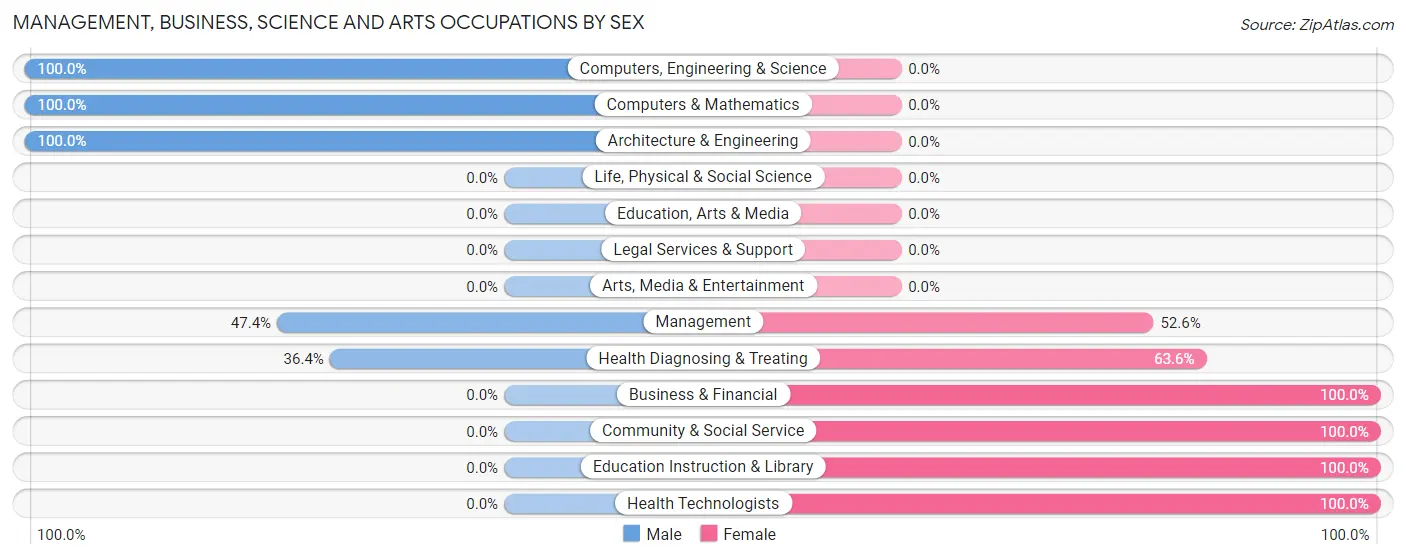
The most common Management, Business, Science and Arts occupations in Gorham are Health Diagnosing & Treating (44 | 14.5%), Computers, Engineering & Science (20 | 6.6%), Management (19 | 6.2%), Business & Financial (14 | 4.6%), and Computers & Mathematics (12 | 4.0%).
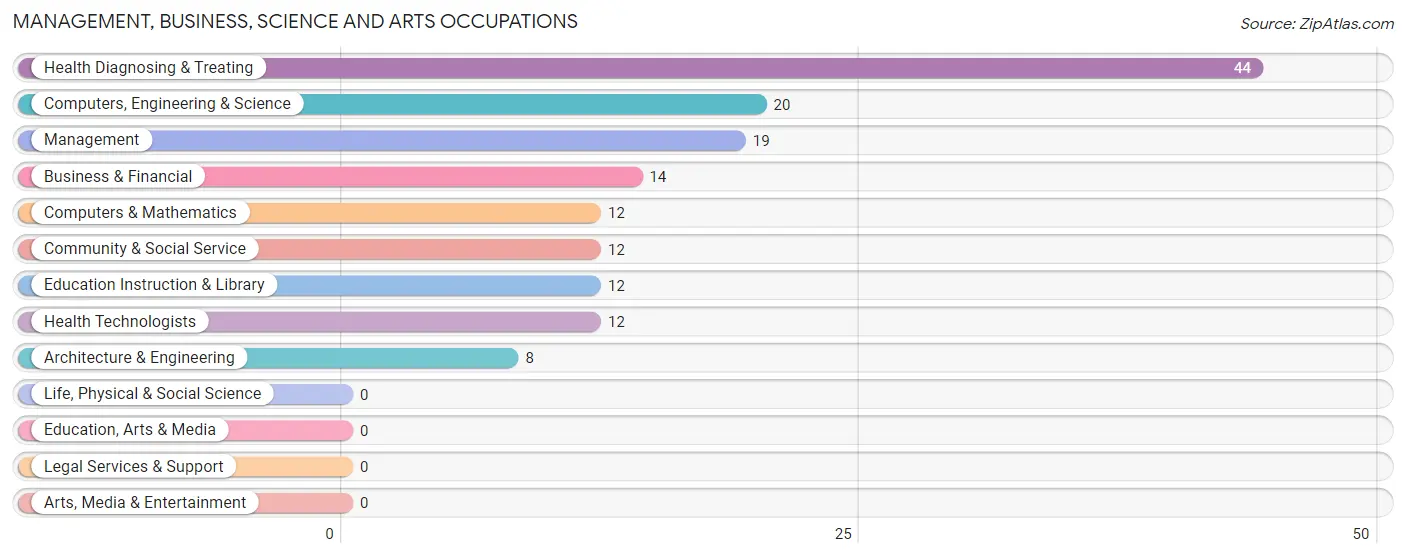
Management, Business, Science and Arts Occupations by Sex
Within the Management, Business, Science and Arts occupations in Gorham, the most male-oriented occupations are Computers, Engineering & Science (100.0%), Computers & Mathematics (100.0%), and Architecture & Engineering (100.0%), while the most female-oriented occupations are Business & Financial (100.0%), Community & Social Service (100.0%), and Education Instruction & Library (100.0%).
| Occupation | Male | Female |
| Management | 9 (47.4%) | 10 (52.6%) |
| Business & Financial | 0 (0.0%) | 14 (100.0%) |
| Computers, Engineering & Science | 20 (100.0%) | 0 (0.0%) |
| Computers & Mathematics | 12 (100.0%) | 0 (0.0%) |
| Architecture & Engineering | 8 (100.0%) | 0 (0.0%) |
| Life, Physical & Social Science | 0 (0.0%) | 0 (0.0%) |
| Community & Social Service | 0 (0.0%) | 12 (100.0%) |
| Education, Arts & Media | 0 (0.0%) | 0 (0.0%) |
| Legal Services & Support | 0 (0.0%) | 0 (0.0%) |
| Education Instruction & Library | 0 (0.0%) | 12 (100.0%) |
| Arts, Media & Entertainment | 0 (0.0%) | 0 (0.0%) |
| Health Diagnosing & Treating | 16 (36.4%) | 28 (63.6%) |
| Health Technologists | 0 (0.0%) | 12 (100.0%) |
| Total (Category) | 45 (41.3%) | 64 (58.7%) |
| Total (Overall) | 162 (53.3%) | 142 (46.7%) |
Services Occupations
Services Occupations by Sex
| Occupation | Male | Female |
| Healthcare Support | 0 (0.0%) | 0 (0.0%) |
| Security & Protection | 0 (0.0%) | 0 (0.0%) |
| Firefighting & Prevention | 0 (0.0%) | 0 (0.0%) |
| Law Enforcement | 0 (0.0%) | 0 (0.0%) |
| Food Preparation & Serving | 0 (0.0%) | 0 (0.0%) |
| Cleaning & Maintenance | 0 (0.0%) | 0 (0.0%) |
| Personal Care & Service | 0 (0.0%) | 0 (0.0%) |
| Total (Category) | 0 (0.0%) | 0 (0.0%) |
| Total (Overall) | 162 (53.3%) | 142 (46.7%) |
Sales and Office Occupations
The most common Sales and Office occupations in Gorham are Sales & Related (34 | 11.2%), and Office & Administration (26 | 8.6%).
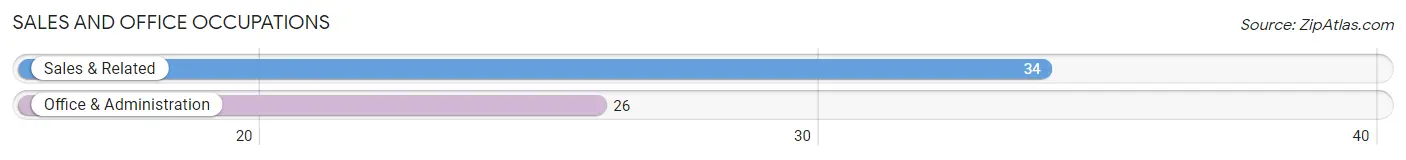
Sales and Office Occupations by Sex
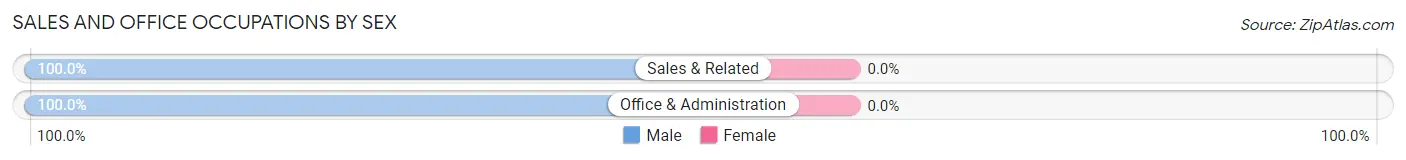
| Occupation | Male | Female |
| Sales & Related | 34 (100.0%) | 0 (0.0%) |
| Office & Administration | 26 (100.0%) | 0 (0.0%) |
| Total (Category) | 60 (100.0%) | 0 (0.0%) |
| Total (Overall) | 162 (53.3%) | 142 (46.7%) |
Natural Resources, Construction and Maintenance Occupations
The most common Natural Resources, Construction and Maintenance occupations in Gorham are , and Construction & Extraction (11 | 3.6%).
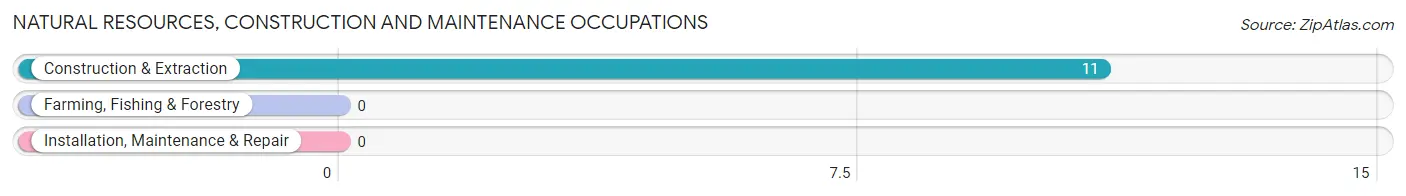
Natural Resources, Construction and Maintenance Occupations by Sex
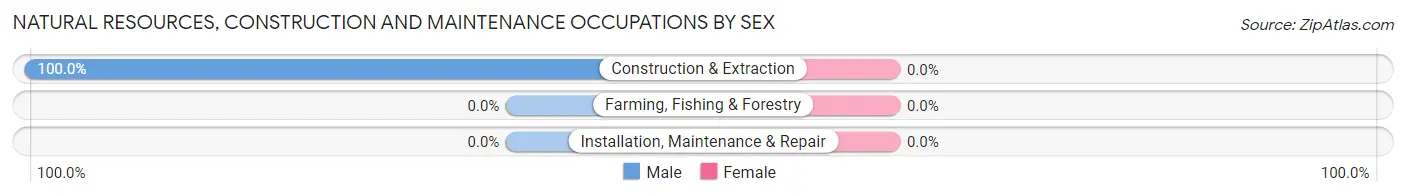
| Occupation | Male | Female |
| Farming, Fishing & Forestry | 0 (0.0%) | 0 (0.0%) |
| Construction & Extraction | 11 (100.0%) | 0 (0.0%) |
| Installation, Maintenance & Repair | 0 (0.0%) | 0 (0.0%) |
| Total (Category) | 11 (100.0%) | 0 (0.0%) |
| Total (Overall) | 162 (53.3%) | 142 (46.7%) |
Production, Transportation and Moving Occupations
The most common Production, Transportation and Moving occupations in Gorham are Transportation (59 | 19.4%), Production (46 | 15.1%), and Material Moving (19 | 6.2%).
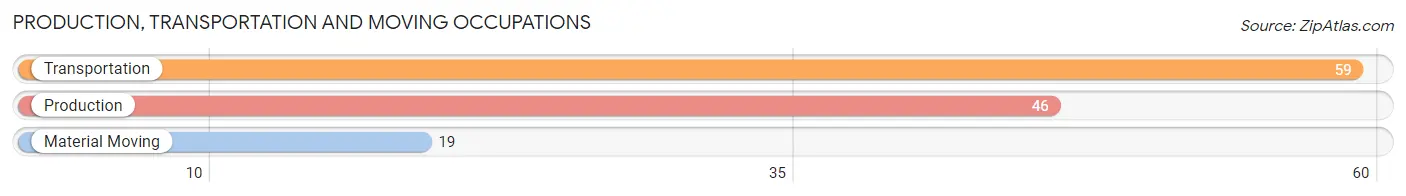
Production, Transportation and Moving Occupations by Sex
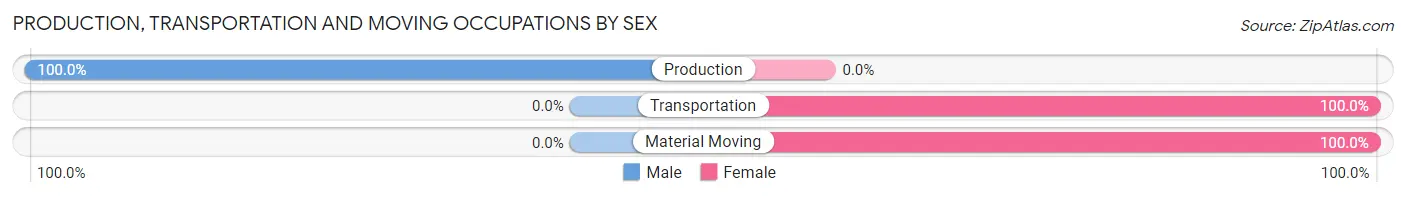
| Occupation | Male | Female |
| Production | 46 (100.0%) | 0 (0.0%) |
| Transportation | 0 (0.0%) | 59 (100.0%) |
| Material Moving | 0 (0.0%) | 19 (100.0%) |
| Total (Category) | 46 (37.1%) | 78 (62.9%) |
| Total (Overall) | 162 (53.3%) | 142 (46.7%) |
Employment Industries by Sex in Gorham
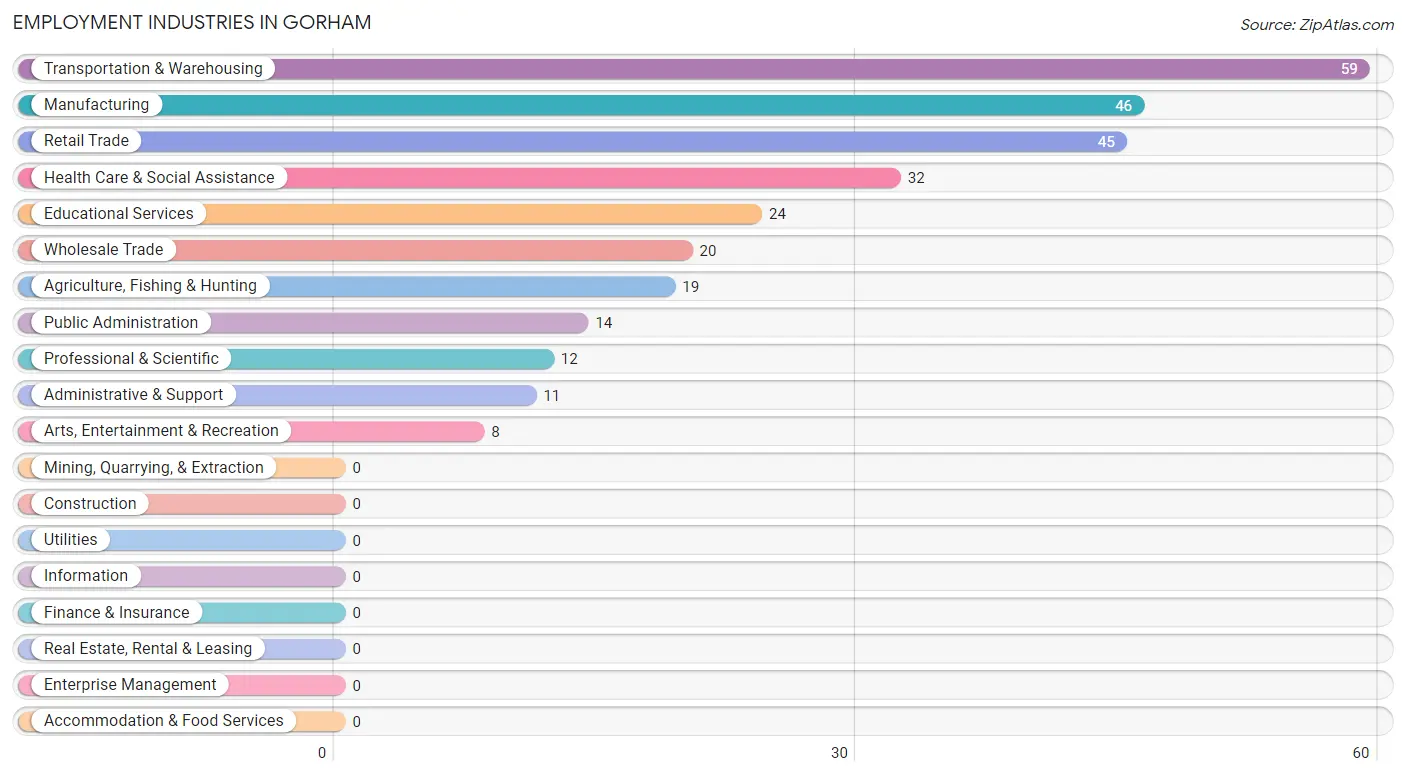
Employment Industries in Gorham
The major employment industries in Gorham include Transportation & Warehousing (59 | 19.4%), Manufacturing (46 | 15.1%), Retail Trade (45 | 14.8%), Health Care & Social Assistance (32 | 10.5%), and Educational Services (24 | 7.9%).
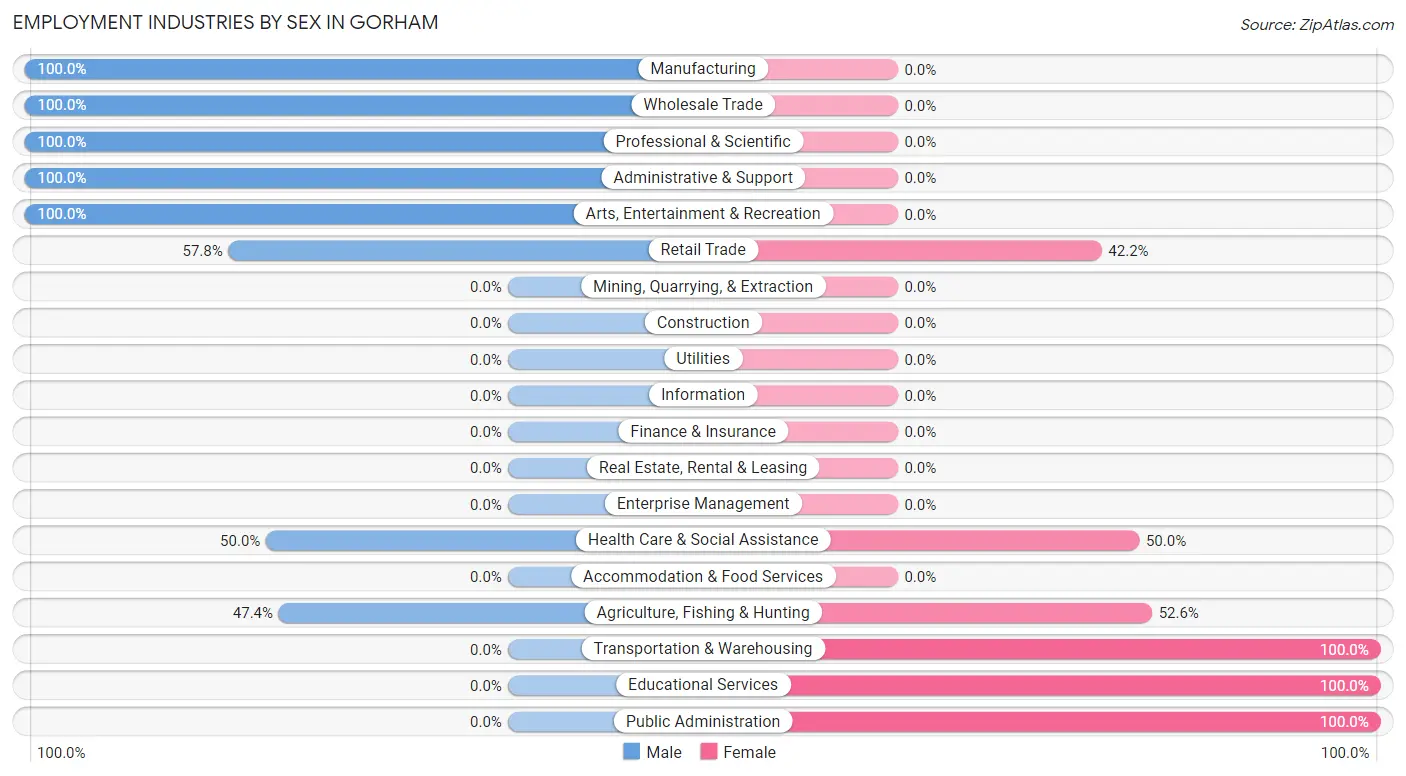
Employment Industries by Sex in Gorham
The Gorham industries that see more men than women are Manufacturing (100.0%), Wholesale Trade (100.0%), and Professional & Scientific (100.0%), whereas the industries that tend to have a higher number of women are Transportation & Warehousing (100.0%), Educational Services (100.0%), and Public Administration (100.0%).
| Industry | Male | Female |
| Agriculture, Fishing & Hunting | 9 (47.4%) | 10 (52.6%) |
| Mining, Quarrying, & Extraction | 0 (0.0%) | 0 (0.0%) |
| Construction | 0 (0.0%) | 0 (0.0%) |
| Manufacturing | 46 (100.0%) | 0 (0.0%) |
| Wholesale Trade | 20 (100.0%) | 0 (0.0%) |
| Retail Trade | 26 (57.8%) | 19 (42.2%) |
| Transportation & Warehousing | 0 (0.0%) | 59 (100.0%) |
| Utilities | 0 (0.0%) | 0 (0.0%) |
| Information | 0 (0.0%) | 0 (0.0%) |
| Finance & Insurance | 0 (0.0%) | 0 (0.0%) |
| Real Estate, Rental & Leasing | 0 (0.0%) | 0 (0.0%) |
| Professional & Scientific | 12 (100.0%) | 0 (0.0%) |
| Enterprise Management | 0 (0.0%) | 0 (0.0%) |
| Administrative & Support | 11 (100.0%) | 0 (0.0%) |
| Educational Services | 0 (0.0%) | 24 (100.0%) |
| Health Care & Social Assistance | 16 (50.0%) | 16 (50.0%) |
| Arts, Entertainment & Recreation | 8 (100.0%) | 0 (0.0%) |
| Accommodation & Food Services | 0 (0.0%) | 0 (0.0%) |
| Public Administration | 0 (0.0%) | 14 (100.0%) |
| Total | 162 (53.3%) | 142 (46.7%) |
Education in Gorham
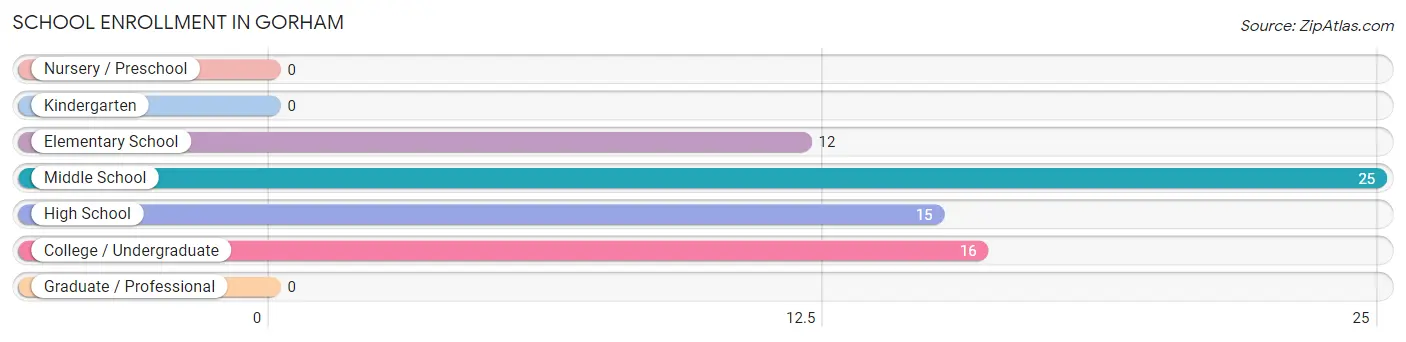
School Enrollment in Gorham
The most common levels of schooling among the 68 students in Gorham are middle school (25 | 36.8%), college / undergraduate (16 | 23.5%), and high school (15 | 22.1%).
| School Level | # Students | % Students |
| Nursery / Preschool | 0 | 0.0% |
| Kindergarten | 0 | 0.0% |
| Elementary School | 12 | 17.6% |
| Middle School | 25 | 36.8% |
| High School | 15 | 22.1% |
| College / Undergraduate | 16 | 23.5% |
| Graduate / Professional | 0 | 0.0% |
| Total | 68 | 100.0% |
School Enrollment by Age by Funding Source in Gorham
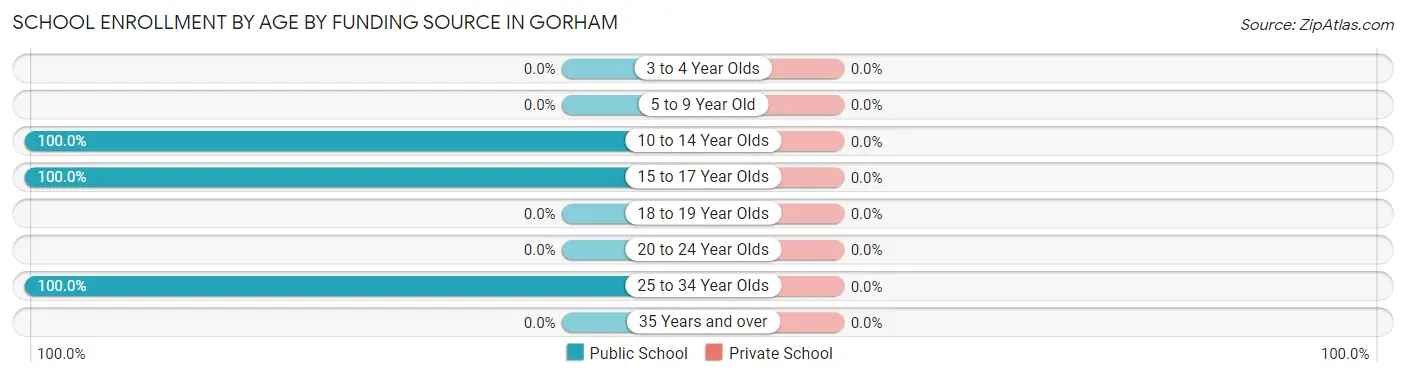
| Age Bracket | Public School | Private School |
| 3 to 4 Year Olds | 0 (0.0%) | 0 (0.0%) |
| 5 to 9 Year Old | 0 (0.0%) | 0 (0.0%) |
| 10 to 14 Year Olds | 51 (100.0%) | 0 (0.0%) |
| 15 to 17 Year Olds | 1 (100.0%) | 0 (0.0%) |
| 18 to 19 Year Olds | 0 (0.0%) | 0 (0.0%) |
| 20 to 24 Year Olds | 0 (0.0%) | 0 (0.0%) |
| 25 to 34 Year Olds | 16 (100.0%) | 0 (0.0%) |
| 35 Years and over | 0 (0.0%) | 0 (0.0%) |
| Total | 68 (100.0%) | 0 (0.0%) |
Educational Attainment by Field of Study in Gorham
Arts & humanities (27 | 37.5%), communications (14 | 19.4%), engineering (12 | 16.7%), education (12 | 16.7%), and literature & languages (7 | 9.7%) are the most common fields of study among 72 individuals in Gorham who have obtained a bachelor's degree or higher.
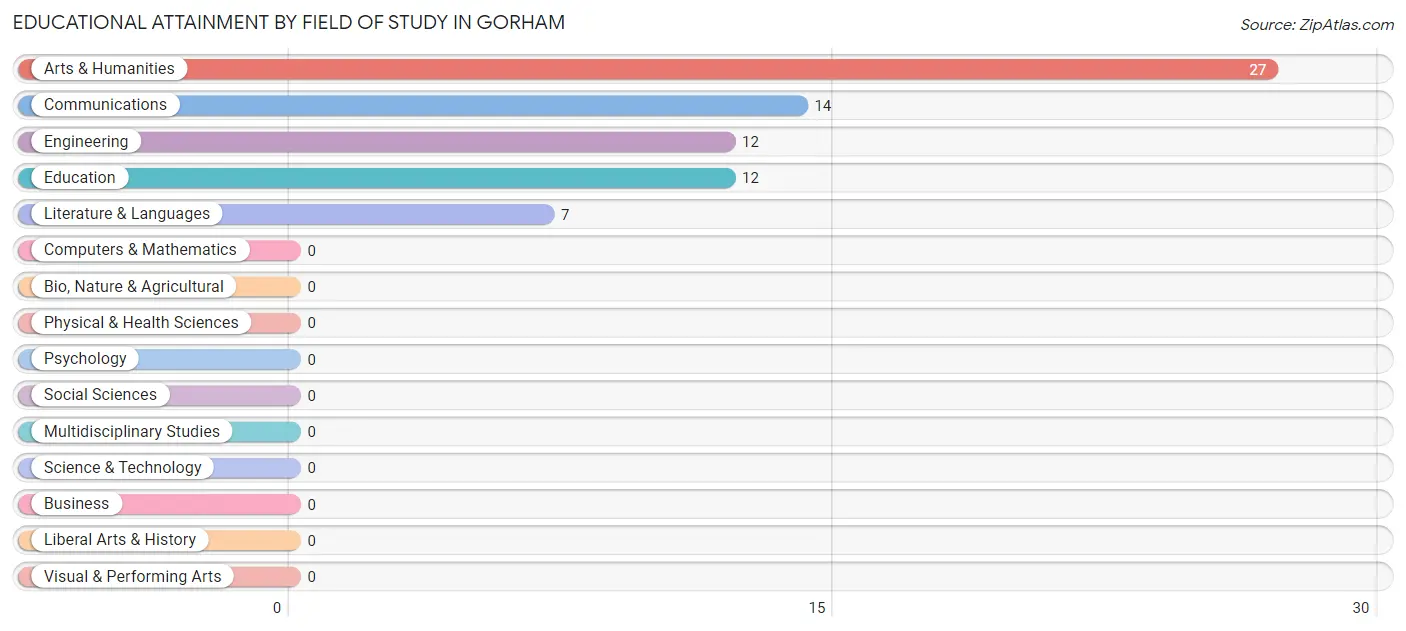
| Field of Study | # Graduates | % Graduates |
| Computers & Mathematics | 0 | 0.0% |
| Bio, Nature & Agricultural | 0 | 0.0% |
| Physical & Health Sciences | 0 | 0.0% |
| Psychology | 0 | 0.0% |
| Social Sciences | 0 | 0.0% |
| Engineering | 12 | 16.7% |
| Multidisciplinary Studies | 0 | 0.0% |
| Science & Technology | 0 | 0.0% |
| Business | 0 | 0.0% |
| Education | 12 | 16.7% |
| Literature & Languages | 7 | 9.7% |
| Liberal Arts & History | 0 | 0.0% |
| Visual & Performing Arts | 0 | 0.0% |
| Communications | 14 | 19.4% |
| Arts & Humanities | 27 | 37.5% |
| Total | 72 | 100.0% |
Transportation & Commute in Gorham
Vehicle Availability by Sex in Gorham
The most prevalent vehicle ownership categories in Gorham are males with 3 vehicles (70, accounting for 43.2%) and females with 3 vehicles (85, making up 49.3%).
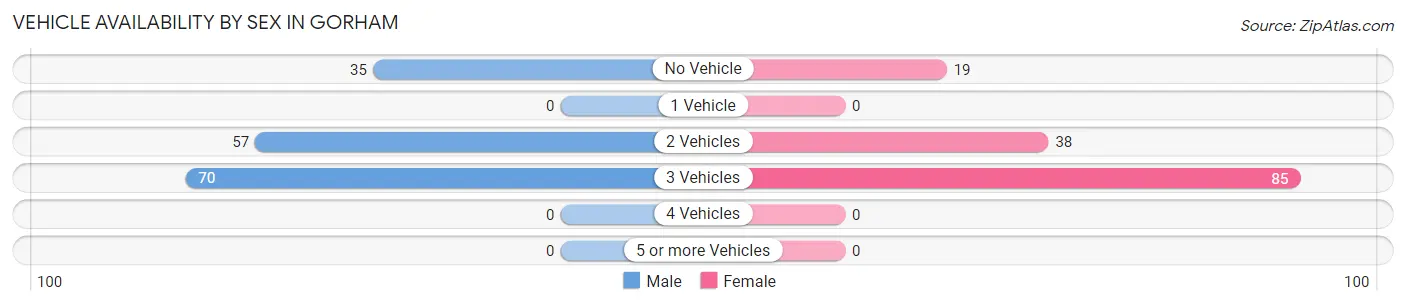
| Vehicles Available | Male | Female |
| No Vehicle | 35 (21.6%) | 19 (13.4%) |
| 1 Vehicle | 0 (0.0%) | 0 (0.0%) |
| 2 Vehicles | 57 (35.2%) | 38 (26.8%) |
| 3 Vehicles | 70 (43.2%) | 85 (59.9%) |
| 4 Vehicles | 0 (0.0%) | 0 (0.0%) |
| 5 or more Vehicles | 0 (0.0%) | 0 (0.0%) |
| Total | 162 (100.0%) | 142 (100.0%) |
Commute Time in Gorham
The most frequently occuring commute durations in Gorham are 5 to 9 minutes (85 commuters, 29.7%), 10 to 14 minutes (71 commuters, 24.8%), and 20 to 24 minutes (68 commuters, 23.8%).
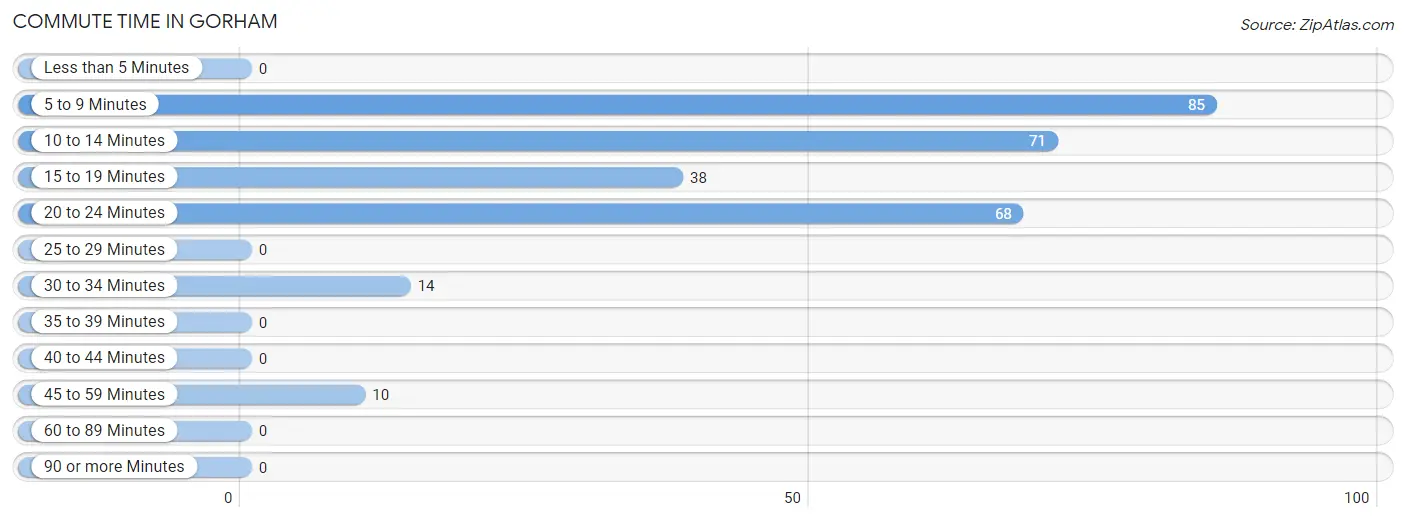
| Commute Time | # Commuters | % Commuters |
| Less than 5 Minutes | 0 | 0.0% |
| 5 to 9 Minutes | 85 | 29.7% |
| 10 to 14 Minutes | 71 | 24.8% |
| 15 to 19 Minutes | 38 | 13.3% |
| 20 to 24 Minutes | 68 | 23.8% |
| 25 to 29 Minutes | 0 | 0.0% |
| 30 to 34 Minutes | 14 | 4.9% |
| 35 to 39 Minutes | 0 | 0.0% |
| 40 to 44 Minutes | 0 | 0.0% |
| 45 to 59 Minutes | 10 | 3.5% |
| 60 to 89 Minutes | 0 | 0.0% |
| 90 or more Minutes | 0 | 0.0% |
Commute Time by Sex in Gorham
The most common commute times in Gorham are 20 to 24 minutes (54 commuters, 35.3%) for males and 5 to 9 minutes (69 commuters, 51.9%) for females.
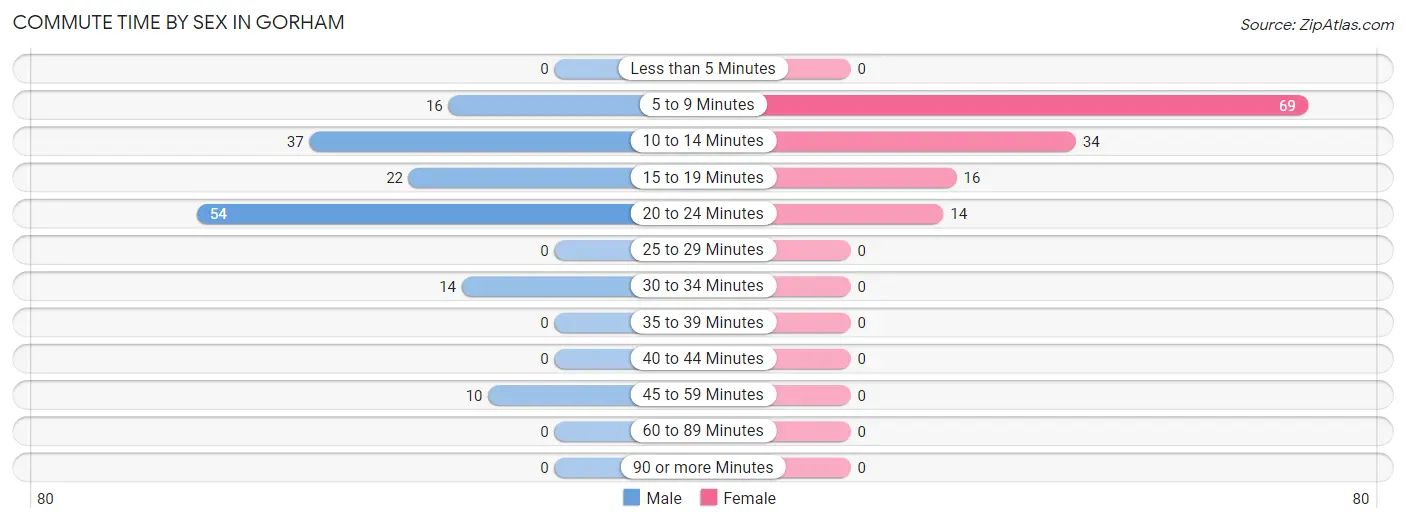
| Commute Time | Male | Female |
| Less than 5 Minutes | 0 (0.0%) | 0 (0.0%) |
| 5 to 9 Minutes | 16 (10.5%) | 69 (51.9%) |
| 10 to 14 Minutes | 37 (24.2%) | 34 (25.6%) |
| 15 to 19 Minutes | 22 (14.4%) | 16 (12.0%) |
| 20 to 24 Minutes | 54 (35.3%) | 14 (10.5%) |
| 25 to 29 Minutes | 0 (0.0%) | 0 (0.0%) |
| 30 to 34 Minutes | 14 (9.1%) | 0 (0.0%) |
| 35 to 39 Minutes | 0 (0.0%) | 0 (0.0%) |
| 40 to 44 Minutes | 0 (0.0%) | 0 (0.0%) |
| 45 to 59 Minutes | 10 (6.5%) | 0 (0.0%) |
| 60 to 89 Minutes | 0 (0.0%) | 0 (0.0%) |
| 90 or more Minutes | 0 (0.0%) | 0 (0.0%) |
Time of Departure to Work by Sex in Gorham
The most frequent times of departure to work in Gorham are 7:00 AM to 7:29 AM (46, 30.1%) for males and 7:00 AM to 7:29 AM (71, 53.4%) for females.
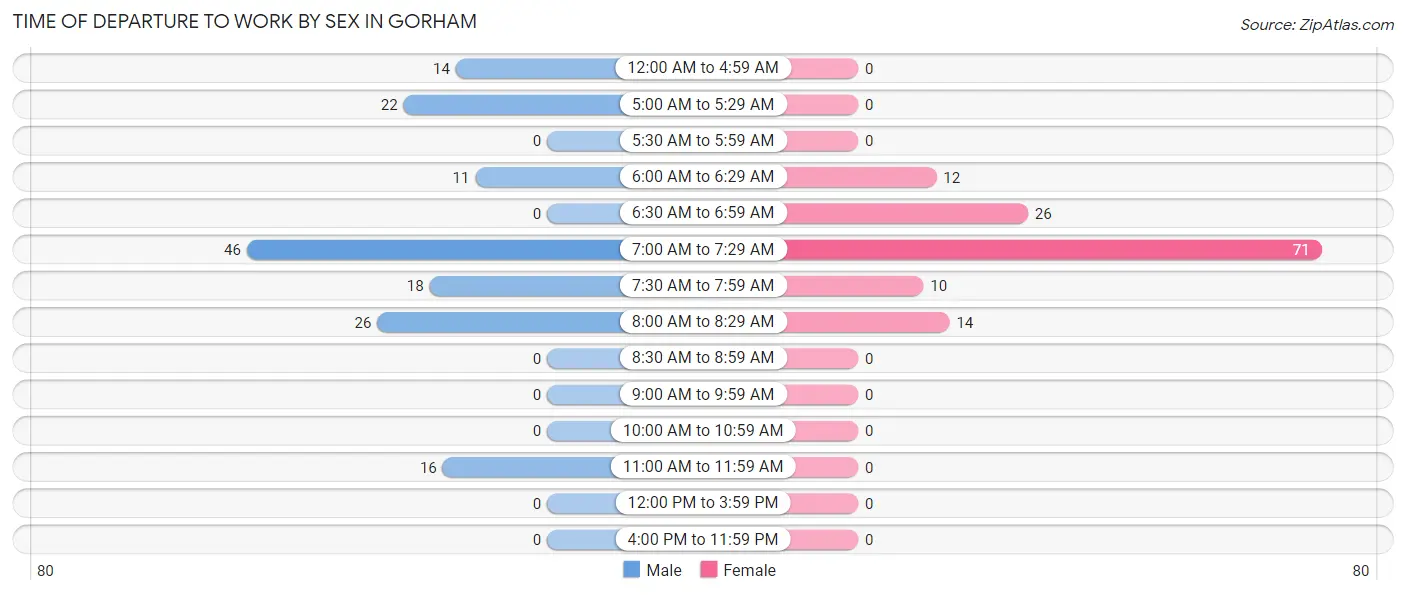
| Time of Departure | Male | Female |
| 12:00 AM to 4:59 AM | 14 (9.1%) | 0 (0.0%) |
| 5:00 AM to 5:29 AM | 22 (14.4%) | 0 (0.0%) |
| 5:30 AM to 5:59 AM | 0 (0.0%) | 0 (0.0%) |
| 6:00 AM to 6:29 AM | 11 (7.2%) | 12 (9.0%) |
| 6:30 AM to 6:59 AM | 0 (0.0%) | 26 (19.6%) |
| 7:00 AM to 7:29 AM | 46 (30.1%) | 71 (53.4%) |
| 7:30 AM to 7:59 AM | 18 (11.8%) | 10 (7.5%) |
| 8:00 AM to 8:29 AM | 26 (17.0%) | 14 (10.5%) |
| 8:30 AM to 8:59 AM | 0 (0.0%) | 0 (0.0%) |
| 9:00 AM to 9:59 AM | 0 (0.0%) | 0 (0.0%) |
| 10:00 AM to 10:59 AM | 0 (0.0%) | 0 (0.0%) |
| 11:00 AM to 11:59 AM | 16 (10.5%) | 0 (0.0%) |
| 12:00 PM to 3:59 PM | 0 (0.0%) | 0 (0.0%) |
| 4:00 PM to 11:59 PM | 0 (0.0%) | 0 (0.0%) |
| Total | 153 (100.0%) | 133 (100.0%) |
Housing Occupancy in Gorham
Occupancy by Ownership in Gorham
Of the total 218 dwellings in Gorham, owner-occupied units account for 202 (92.7%), while renter-occupied units make up 16 (7.3%).
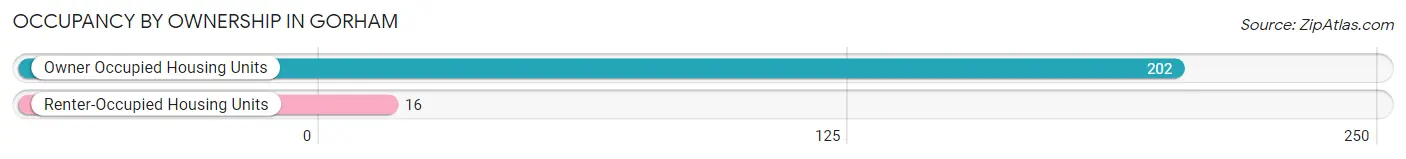
| Occupancy | # Housing Units | % Housing Units |
| Owner Occupied Housing Units | 202 | 92.7% |
| Renter-Occupied Housing Units | 16 | 7.3% |
| Total Occupied Housing Units | 218 | 100.0% |
Occupancy by Household Size in Gorham
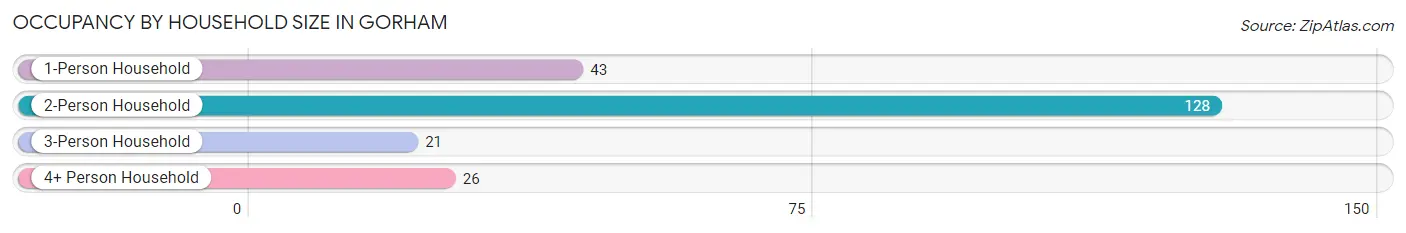
| Household Size | # Housing Units | % Housing Units |
| 1-Person Household | 43 | 19.7% |
| 2-Person Household | 128 | 58.7% |
| 3-Person Household | 21 | 9.6% |
| 4+ Person Household | 26 | 11.9% |
| Total Housing Units | 218 | 100.0% |
Occupancy by Ownership by Household Size in Gorham
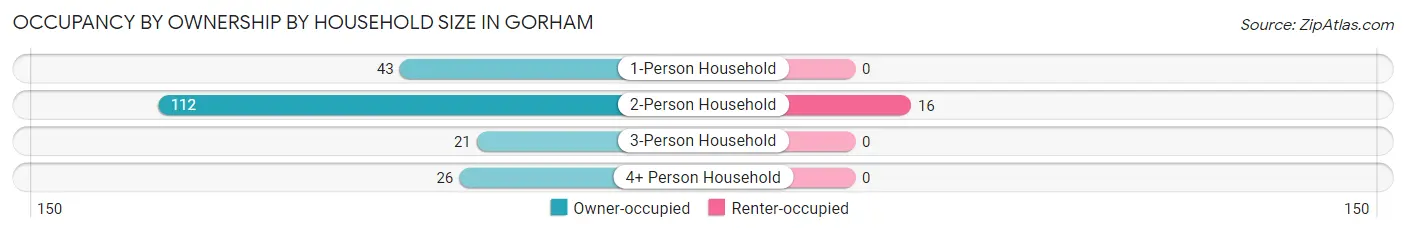
| Household Size | Owner-occupied | Renter-occupied |
| 1-Person Household | 43 (100.0%) | 0 (0.0%) |
| 2-Person Household | 112 (87.5%) | 16 (12.5%) |
| 3-Person Household | 21 (100.0%) | 0 (0.0%) |
| 4+ Person Household | 26 (100.0%) | 0 (0.0%) |
| Total Housing Units | 202 (92.7%) | 16 (7.3%) |
Occupancy by Educational Attainment in Gorham
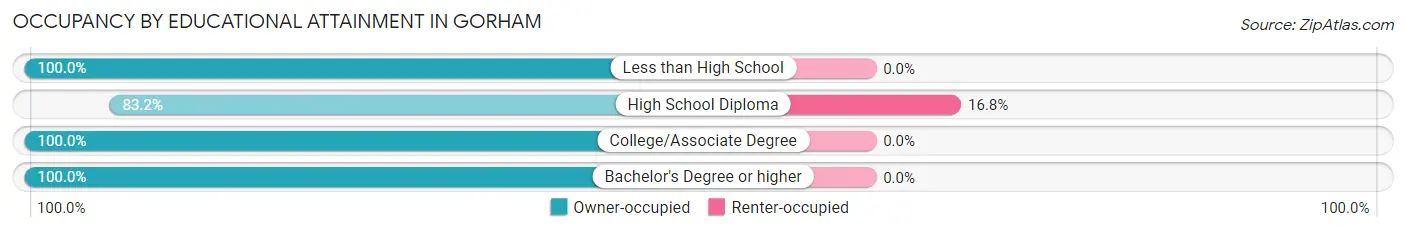
| Household Size | Owner-occupied | Renter-occupied |
| Less than High School | 22 (100.0%) | 0 (0.0%) |
| High School Diploma | 79 (83.2%) | 16 (16.8%) |
| College/Associate Degree | 55 (100.0%) | 0 (0.0%) |
| Bachelor's Degree or higher | 46 (100.0%) | 0 (0.0%) |
Occupancy by Age of Householder in Gorham
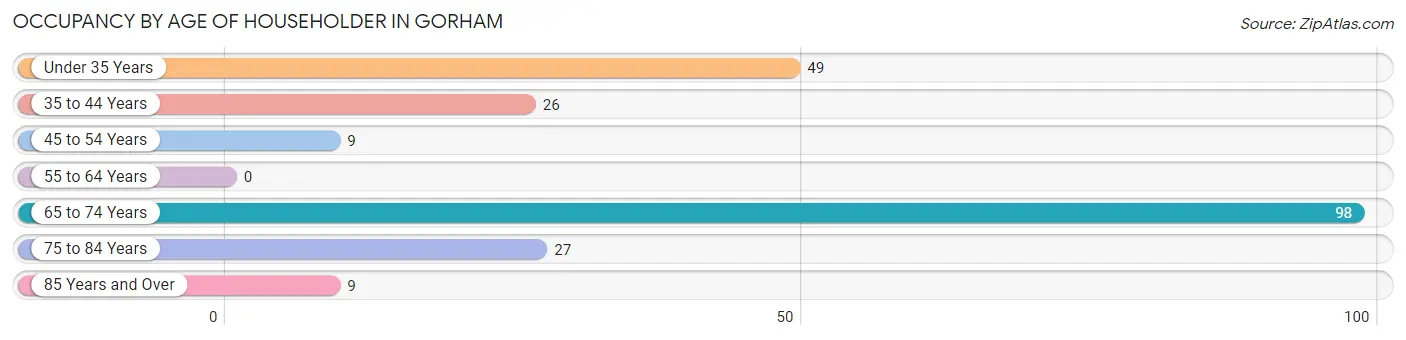
| Age Bracket | # Households | % Households |
| Under 35 Years | 49 | 22.5% |
| 35 to 44 Years | 26 | 11.9% |
| 45 to 54 Years | 9 | 4.1% |
| 55 to 64 Years | 0 | 0.0% |
| 65 to 74 Years | 98 | 45.0% |
| 75 to 84 Years | 27 | 12.4% |
| 85 Years and Over | 9 | 4.1% |
| Total | 218 | 100.0% |
Housing Finances in Gorham
Median Income by Occupancy in Gorham
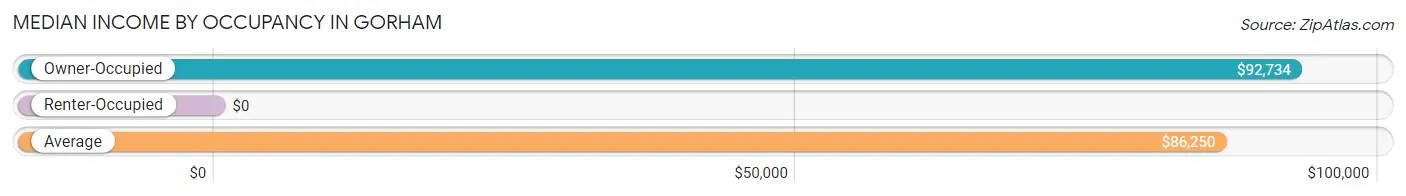
| Occupancy Type | # Households | Median Income |
| Owner-Occupied | 202 (92.7%) | $92,734 |
| Renter-Occupied | 16 (7.3%) | $0 |
| Average | 218 (100.0%) | $86,250 |
Occupancy by Householder Income Bracket in Gorham
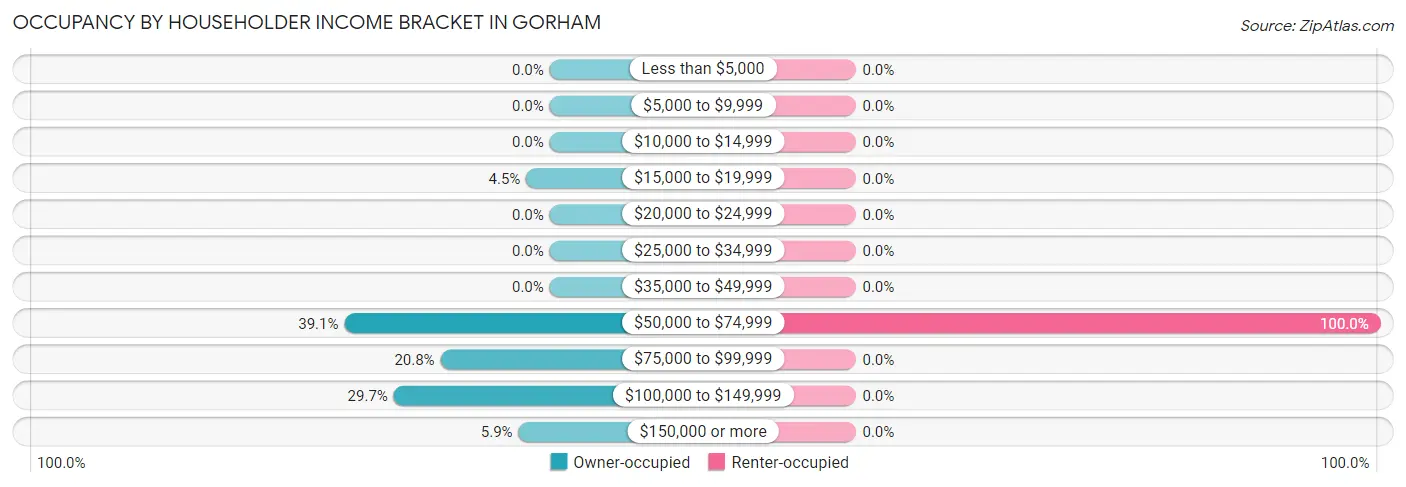
| Income Bracket | Owner-occupied | Renter-occupied |
| Less than $5,000 | 0 (0.0%) | 0 (0.0%) |
| $5,000 to $9,999 | 0 (0.0%) | 0 (0.0%) |
| $10,000 to $14,999 | 0 (0.0%) | 0 (0.0%) |
| $15,000 to $19,999 | 9 (4.5%) | 0 (0.0%) |
| $20,000 to $24,999 | 0 (0.0%) | 0 (0.0%) |
| $25,000 to $34,999 | 0 (0.0%) | 0 (0.0%) |
| $35,000 to $49,999 | 0 (0.0%) | 0 (0.0%) |
| $50,000 to $74,999 | 79 (39.1%) | 16 (100.0%) |
| $75,000 to $99,999 | 42 (20.8%) | 0 (0.0%) |
| $100,000 to $149,999 | 60 (29.7%) | 0 (0.0%) |
| $150,000 or more | 12 (5.9%) | 0 (0.0%) |
| Total | 202 (100.0%) | 16 (100.0%) |
Monthly Housing Cost Tiers in Gorham
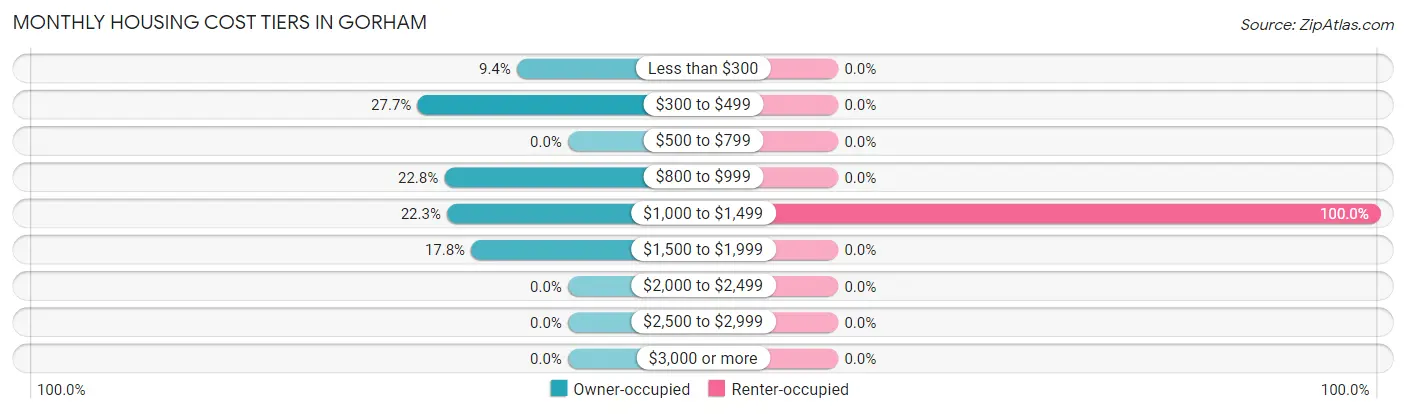
| Monthly Cost | Owner-occupied | Renter-occupied |
| Less than $300 | 19 (9.4%) | 0 (0.0%) |
| $300 to $499 | 56 (27.7%) | 0 (0.0%) |
| $500 to $799 | 0 (0.0%) | 0 (0.0%) |
| $800 to $999 | 46 (22.8%) | 0 (0.0%) |
| $1,000 to $1,499 | 45 (22.3%) | 16 (100.0%) |
| $1,500 to $1,999 | 36 (17.8%) | 0 (0.0%) |
| $2,000 to $2,499 | 0 (0.0%) | 0 (0.0%) |
| $2,500 to $2,999 | 0 (0.0%) | 0 (0.0%) |
| $3,000 or more | 0 (0.0%) | 0 (0.0%) |
| Total | 202 (100.0%) | 16 (100.0%) |
Physical Housing Characteristics in Gorham
Housing Structures in Gorham
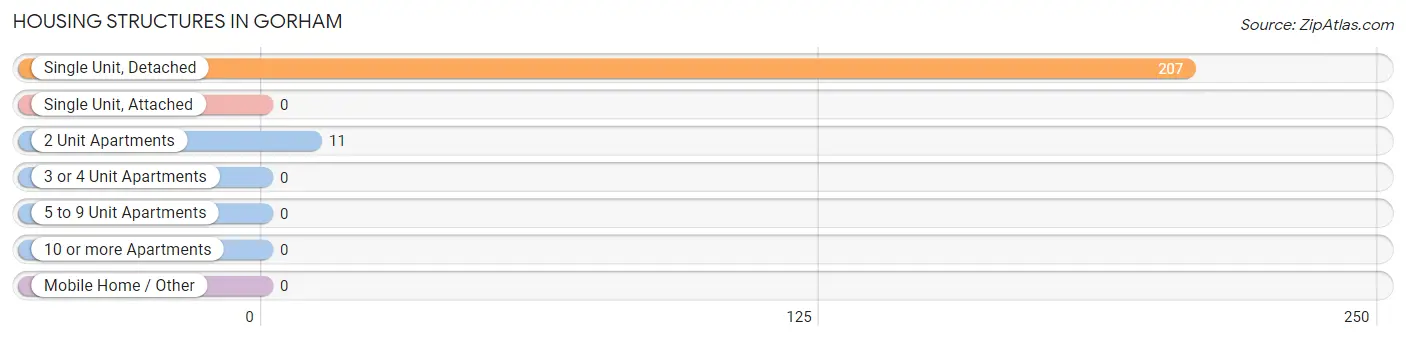
| Structure Type | # Housing Units | % Housing Units |
| Single Unit, Detached | 207 | 95.0% |
| Single Unit, Attached | 0 | 0.0% |
| 2 Unit Apartments | 11 | 5.1% |
| 3 or 4 Unit Apartments | 0 | 0.0% |
| 5 to 9 Unit Apartments | 0 | 0.0% |
| 10 or more Apartments | 0 | 0.0% |
| Mobile Home / Other | 0 | 0.0% |
| Total | 218 | 100.0% |
Housing Structures by Occupancy in Gorham
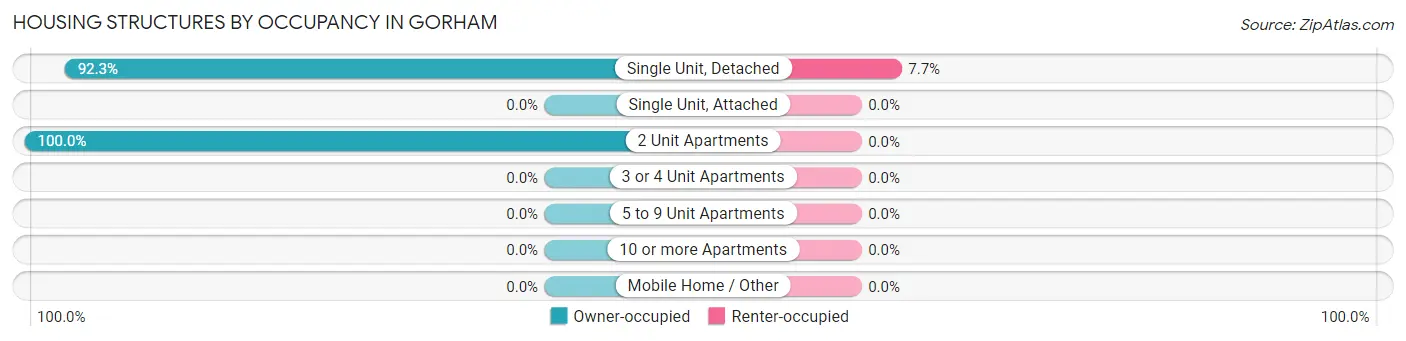
| Structure Type | Owner-occupied | Renter-occupied |
| Single Unit, Detached | 191 (92.3%) | 16 (7.7%) |
| Single Unit, Attached | 0 (0.0%) | 0 (0.0%) |
| 2 Unit Apartments | 11 (100.0%) | 0 (0.0%) |
| 3 or 4 Unit Apartments | 0 (0.0%) | 0 (0.0%) |
| 5 to 9 Unit Apartments | 0 (0.0%) | 0 (0.0%) |
| 10 or more Apartments | 0 (0.0%) | 0 (0.0%) |
| Mobile Home / Other | 0 (0.0%) | 0 (0.0%) |
| Total | 202 (92.7%) | 16 (7.3%) |
Housing Structures by Number of Rooms in Gorham
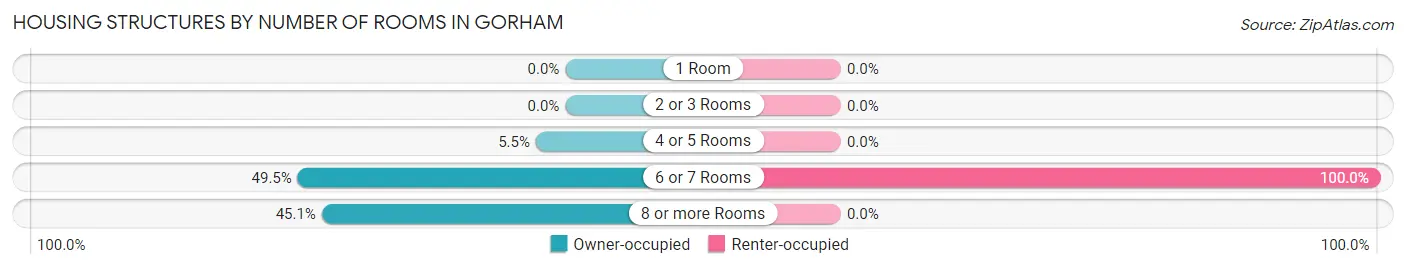
| Number of Rooms | Owner-occupied | Renter-occupied |
| 1 Room | 0 (0.0%) | 0 (0.0%) |
| 2 or 3 Rooms | 0 (0.0%) | 0 (0.0%) |
| 4 or 5 Rooms | 11 (5.4%) | 0 (0.0%) |
| 6 or 7 Rooms | 100 (49.5%) | 16 (100.0%) |
| 8 or more Rooms | 91 (45.1%) | 0 (0.0%) |
| Total | 202 (100.0%) | 16 (100.0%) |
Housing Structure by Heating Type in Gorham
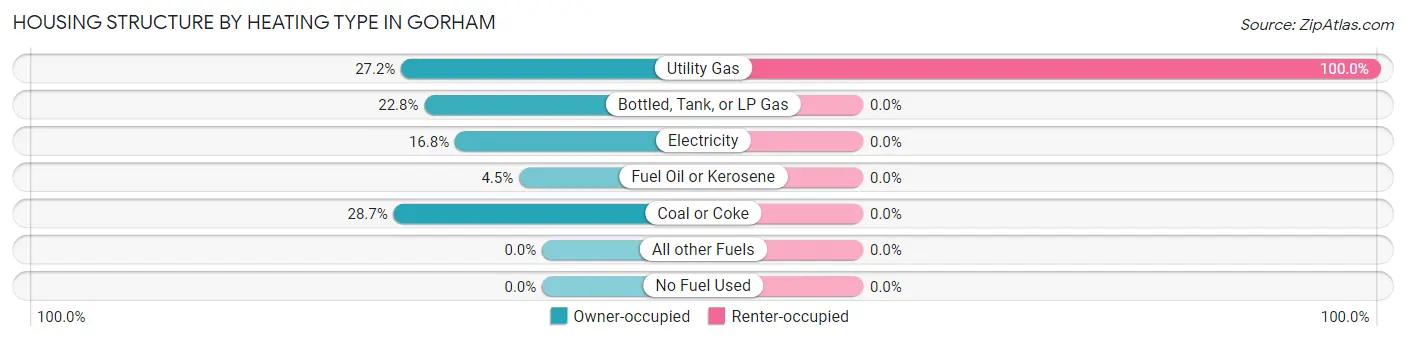
| Heating Type | Owner-occupied | Renter-occupied |
| Utility Gas | 55 (27.2%) | 16 (100.0%) |
| Bottled, Tank, or LP Gas | 46 (22.8%) | 0 (0.0%) |
| Electricity | 34 (16.8%) | 0 (0.0%) |
| Fuel Oil or Kerosene | 9 (4.5%) | 0 (0.0%) |
| Coal or Coke | 58 (28.7%) | 0 (0.0%) |
| All other Fuels | 0 (0.0%) | 0 (0.0%) |
| No Fuel Used | 0 (0.0%) | 0 (0.0%) |
| Total | 202 (100.0%) | 16 (100.0%) |
Household Vehicle Usage in Gorham
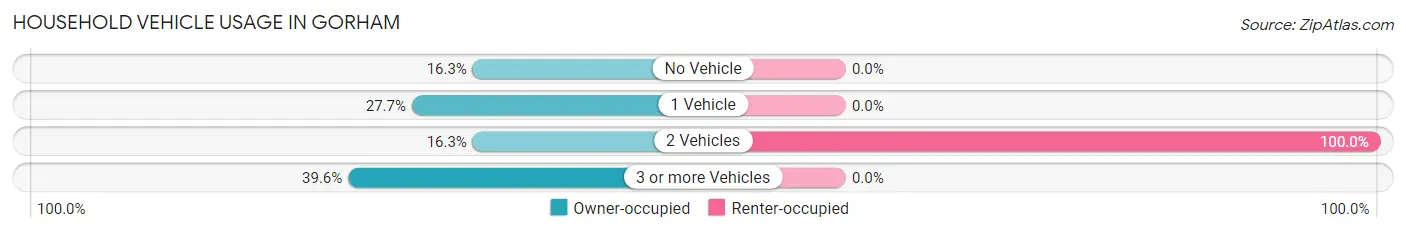
| Vehicles per Household | Owner-occupied | Renter-occupied |
| No Vehicle | 33 (16.3%) | 0 (0.0%) |
| 1 Vehicle | 56 (27.7%) | 0 (0.0%) |
| 2 Vehicles | 33 (16.3%) | 16 (100.0%) |
| 3 or more Vehicles | 80 (39.6%) | 0 (0.0%) |
| Total | 202 (100.0%) | 16 (100.0%) |
Real Estate & Mortgages in Gorham
Real Estate and Mortgage Overview in Gorham
| Characteristic | Without Mortgage | With Mortgage |
| Housing Units | 130 | 72 |
| Median Property Value | $214,800 | $178,600 |
| Median Household Income | $73,625 | $12 |
| Monthly Housing Costs | $477 | $0 |
| Real Estate Taxes | $2,685 | $0 |
Property Value by Mortgage Status in Gorham
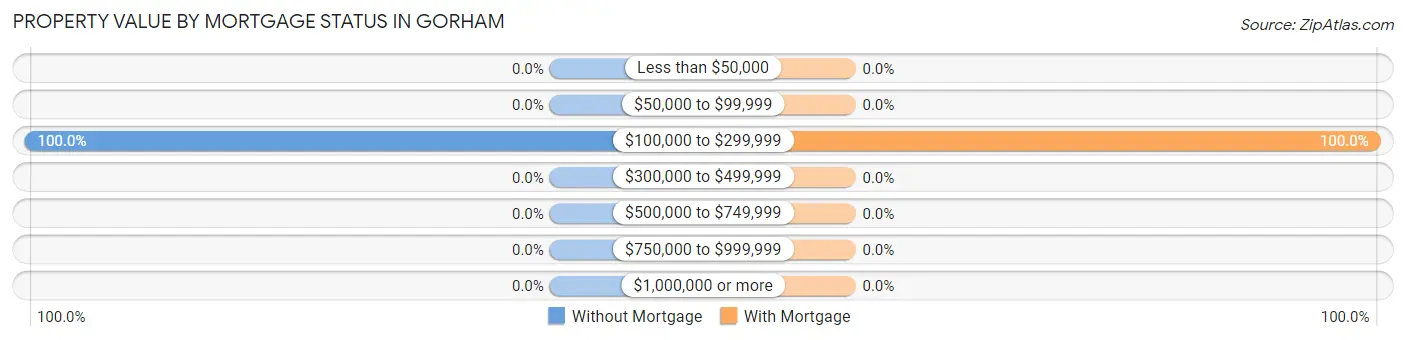
| Property Value | Without Mortgage | With Mortgage |
| Less than $50,000 | 0 (0.0%) | 0 (0.0%) |
| $50,000 to $99,999 | 0 (0.0%) | 0 (0.0%) |
| $100,000 to $299,999 | 130 (100.0%) | 72 (100.0%) |
| $300,000 to $499,999 | 0 (0.0%) | 0 (0.0%) |
| $500,000 to $749,999 | 0 (0.0%) | 0 (0.0%) |
| $750,000 to $999,999 | 0 (0.0%) | 0 (0.0%) |
| $1,000,000 or more | 0 (0.0%) | 0 (0.0%) |
| Total | 130 (100.0%) | 72 (100.0%) |
Household Income by Mortgage Status in Gorham
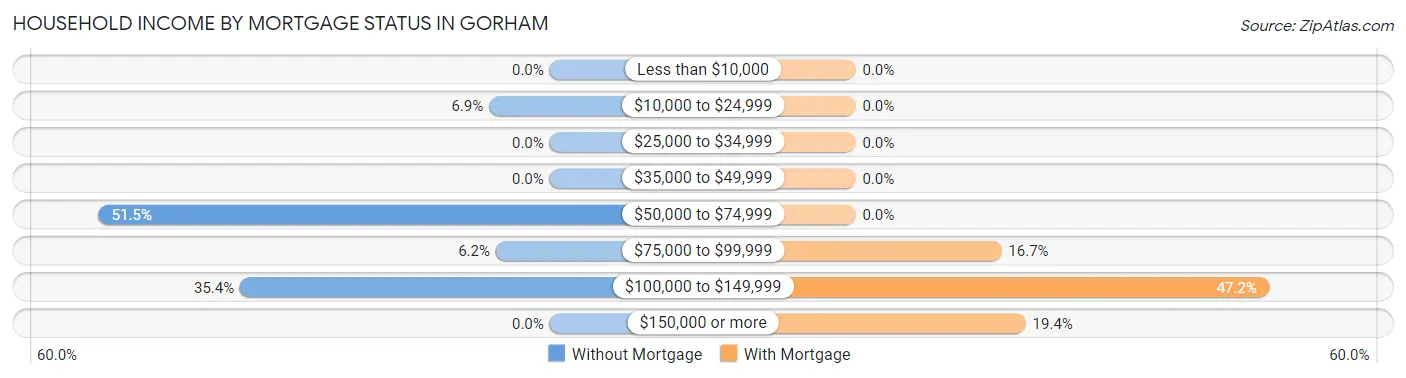
| Household Income | Without Mortgage | With Mortgage |
| Less than $10,000 | 0 (0.0%) | 0 (0.0%) |
| $10,000 to $24,999 | 9 (6.9%) | 0 (0.0%) |
| $25,000 to $34,999 | 0 (0.0%) | 0 (0.0%) |
| $35,000 to $49,999 | 0 (0.0%) | 0 (0.0%) |
| $50,000 to $74,999 | 67 (51.5%) | 0 (0.0%) |
| $75,000 to $99,999 | 8 (6.1%) | 12 (16.7%) |
| $100,000 to $149,999 | 46 (35.4%) | 34 (47.2%) |
| $150,000 or more | 0 (0.0%) | 14 (19.4%) |
| Total | 130 (100.0%) | 72 (100.0%) |
Property Value to Household Income Ratio in Gorham
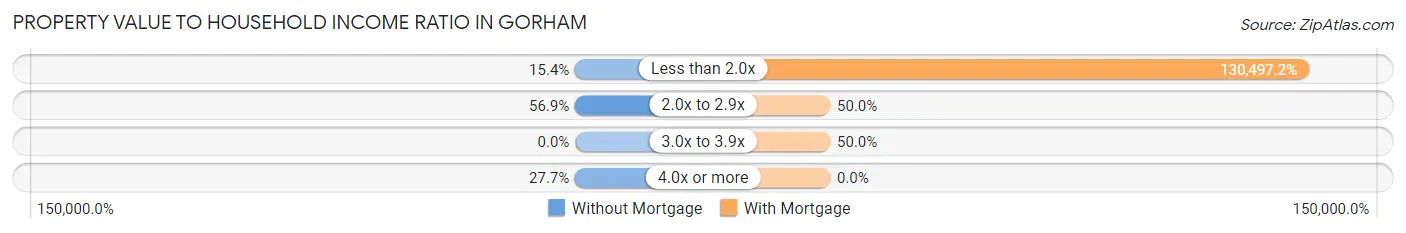
| Value-to-Income Ratio | Without Mortgage | With Mortgage |
| Less than 2.0x | 20 (15.4%) | 93,958 (130,497.2%) |
| 2.0x to 2.9x | 74 (56.9%) | 36 (50.0%) |
| 3.0x to 3.9x | 0 (0.0%) | 36 (50.0%) |
| 4.0x or more | 36 (27.7%) | 0 (0.0%) |
| Total | 130 (100.0%) | 72 (100.0%) |
Real Estate Taxes by Mortgage Status in Gorham
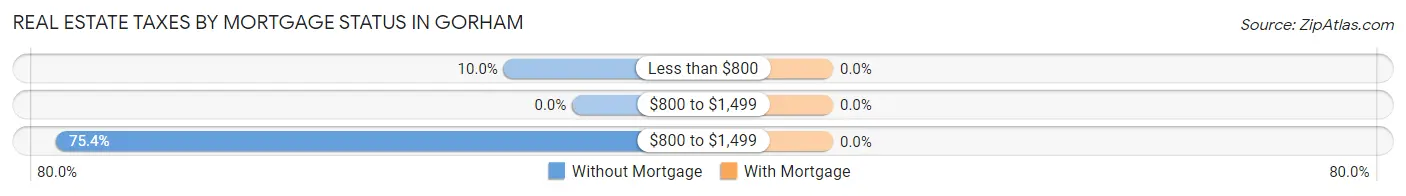
| Property Taxes | Without Mortgage | With Mortgage |
| Less than $800 | 13 (10.0%) | 0 (0.0%) |
| $800 to $1,499 | 0 (0.0%) | 0 (0.0%) |
| $800 to $1,499 | 98 (75.4%) | 0 (0.0%) |
| Total | 130 (100.0%) | 72 (100.0%) |
Health & Disability in Gorham
Health Insurance Coverage by Age in Gorham
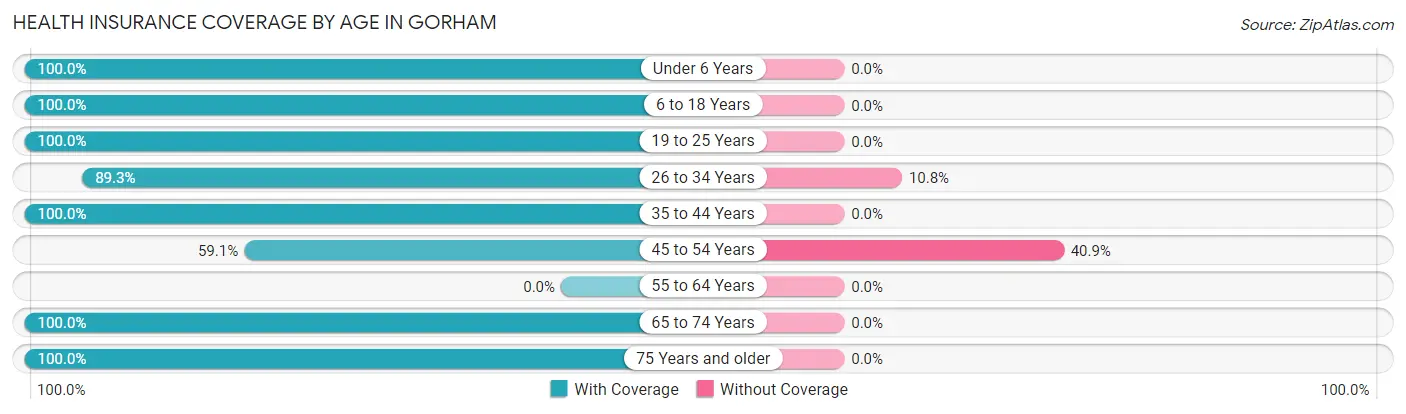
| Age Bracket | With Coverage | Without Coverage |
| Under 6 Years | 10 (100.0%) | 0 (0.0%) |
| 6 to 18 Years | 51 (100.0%) | 0 (0.0%) |
| 19 to 25 Years | 10 (100.0%) | 0 (0.0%) |
| 26 to 34 Years | 83 (89.2%) | 10 (10.7%) |
| 35 to 44 Years | 52 (100.0%) | 0 (0.0%) |
| 45 to 54 Years | 26 (59.1%) | 18 (40.9%) |
| 55 to 64 Years | 0 (0.0%) | 0 (0.0%) |
| 65 to 74 Years | 169 (100.0%) | 0 (0.0%) |
| 75 Years and older | 44 (100.0%) | 0 (0.0%) |
| Total | 445 (94.1%) | 28 (5.9%) |
Health Insurance Coverage by Citizenship Status in Gorham
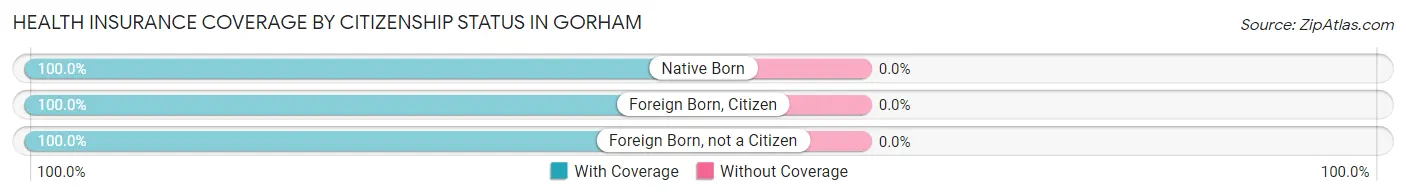
| Citizenship Status | With Coverage | Without Coverage |
| Native Born | 10 (100.0%) | 0 (0.0%) |
| Foreign Born, Citizen | 51 (100.0%) | 0 (0.0%) |
| Foreign Born, not a Citizen | 10 (100.0%) | 0 (0.0%) |
Health Insurance Coverage by Household Income in Gorham
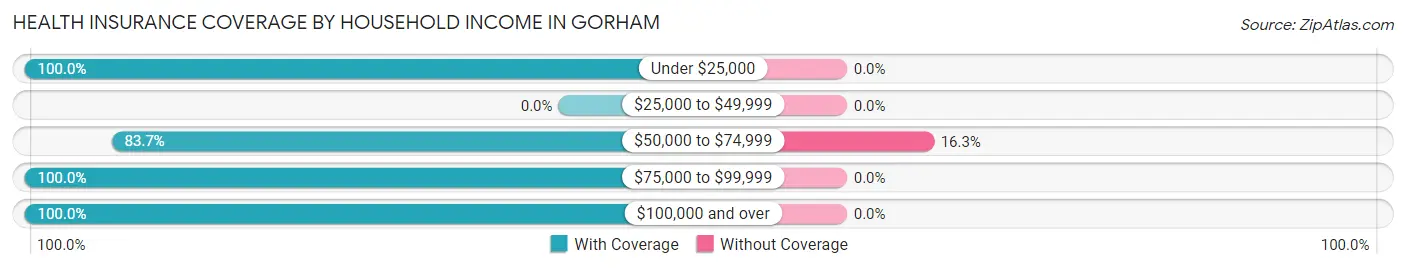
| Household Income | With Coverage | Without Coverage |
| Under $25,000 | 9 (100.0%) | 0 (0.0%) |
| $25,000 to $49,999 | 0 (0.0%) | 0 (0.0%) |
| $50,000 to $74,999 | 144 (83.7%) | 28 (16.3%) |
| $75,000 to $99,999 | 84 (100.0%) | 0 (0.0%) |
| $100,000 and over | 208 (100.0%) | 0 (0.0%) |
Public vs Private Health Insurance Coverage by Age in Gorham
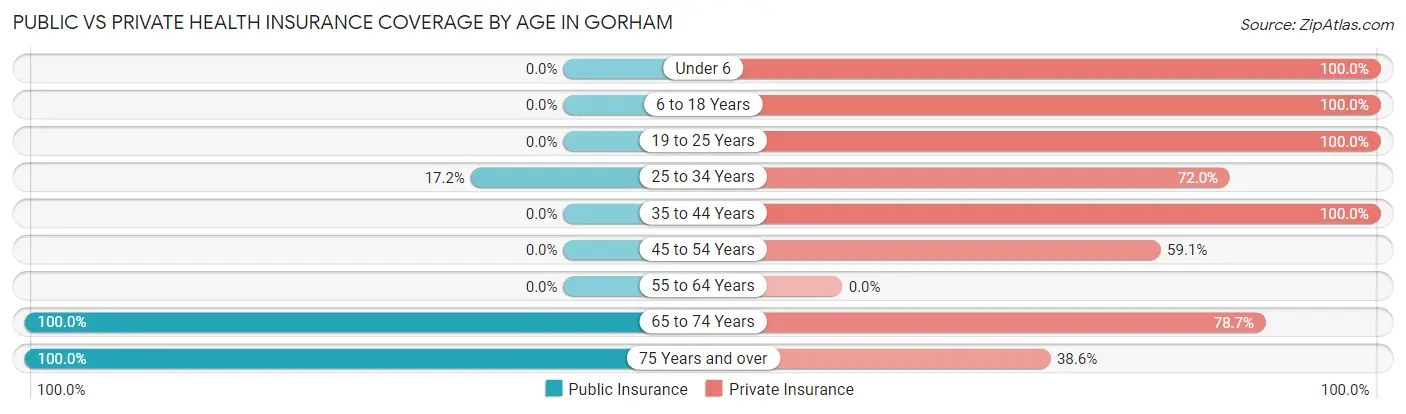
| Age Bracket | Public Insurance | Private Insurance |
| Under 6 | 0 (0.0%) | 10 (100.0%) |
| 6 to 18 Years | 0 (0.0%) | 51 (100.0%) |
| 19 to 25 Years | 0 (0.0%) | 10 (100.0%) |
| 25 to 34 Years | 16 (17.2%) | 67 (72.0%) |
| 35 to 44 Years | 0 (0.0%) | 52 (100.0%) |
| 45 to 54 Years | 0 (0.0%) | 26 (59.1%) |
| 55 to 64 Years | 0 (0.0%) | 0 (0.0%) |
| 65 to 74 Years | 169 (100.0%) | 133 (78.7%) |
| 75 Years and over | 44 (100.0%) | 17 (38.6%) |
| Total | 229 (48.4%) | 366 (77.4%) |
Disability Status by Sex by Age in Gorham
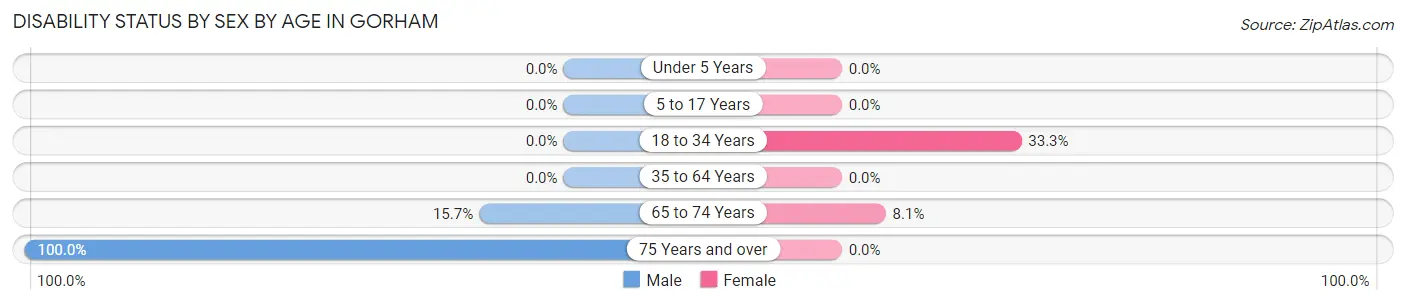
| Age Bracket | Male | Female |
| Under 5 Years | 0 (0.0%) | 0 (0.0%) |
| 5 to 17 Years | 0 (0.0%) | 0 (0.0%) |
| 18 to 34 Years | 0 (0.0%) | 16 (33.3%) |
| 35 to 64 Years | 0 (0.0%) | 0 (0.0%) |
| 65 to 74 Years | 13 (15.7%) | 7 (8.1%) |
| 75 Years and over | 8 (100.0%) | 0 (0.0%) |
Disability Class by Sex by Age in Gorham
Disability Class: Hearing Difficulty
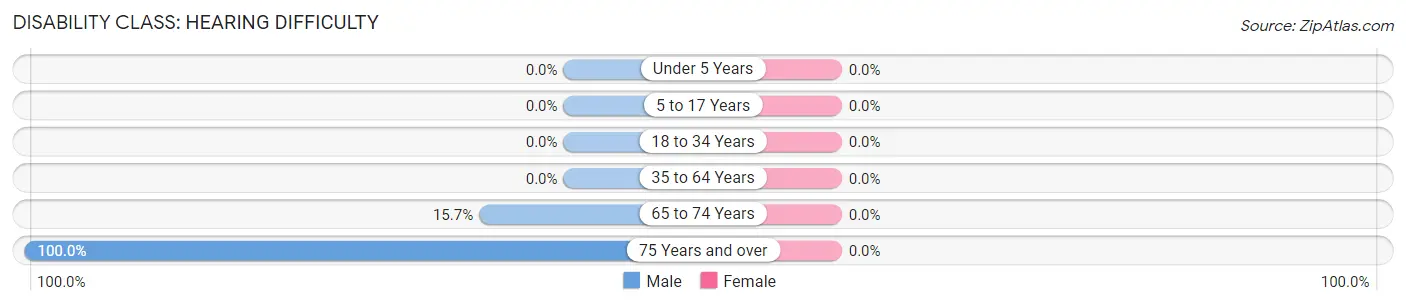
| Age Bracket | Male | Female |
| Under 5 Years | 0 (0.0%) | 0 (0.0%) |
| 5 to 17 Years | 0 (0.0%) | 0 (0.0%) |
| 18 to 34 Years | 0 (0.0%) | 0 (0.0%) |
| 35 to 64 Years | 0 (0.0%) | 0 (0.0%) |
| 65 to 74 Years | 13 (15.7%) | 0 (0.0%) |
| 75 Years and over | 8 (100.0%) | 0 (0.0%) |
Disability Class: Vision Difficulty
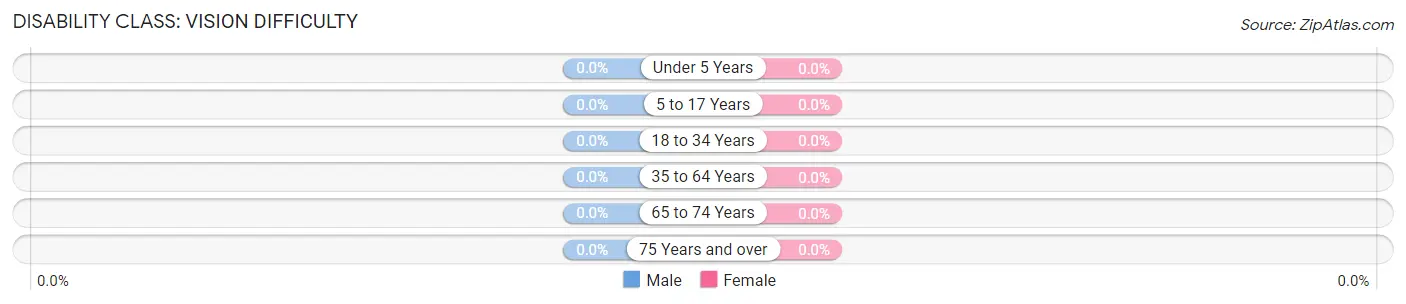
| Age Bracket | Male | Female |
| Under 5 Years | 0 (0.0%) | 0 (0.0%) |
| 5 to 17 Years | 0 (0.0%) | 0 (0.0%) |
| 18 to 34 Years | 0 (0.0%) | 0 (0.0%) |
| 35 to 64 Years | 0 (0.0%) | 0 (0.0%) |
| 65 to 74 Years | 0 (0.0%) | 0 (0.0%) |
| 75 Years and over | 0 (0.0%) | 0 (0.0%) |
Disability Class: Cognitive Difficulty
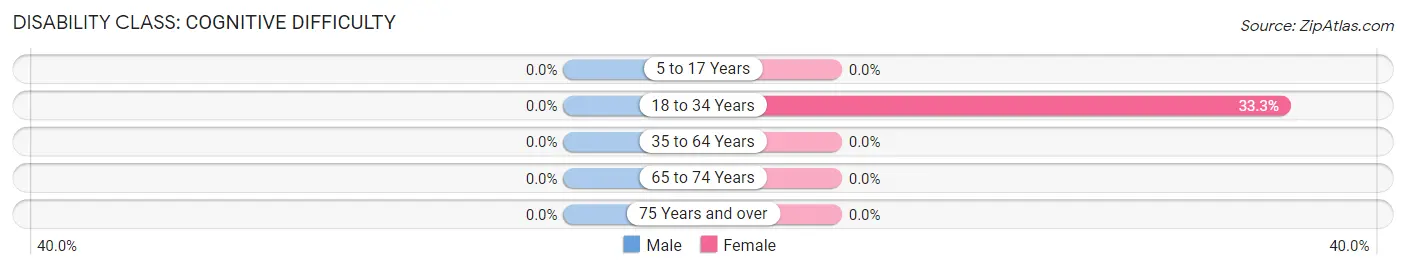
| Age Bracket | Male | Female |
| 5 to 17 Years | 0 (0.0%) | 0 (0.0%) |
| 18 to 34 Years | 0 (0.0%) | 16 (33.3%) |
| 35 to 64 Years | 0 (0.0%) | 0 (0.0%) |
| 65 to 74 Years | 0 (0.0%) | 0 (0.0%) |
| 75 Years and over | 0 (0.0%) | 0 (0.0%) |
Disability Class: Ambulatory Difficulty
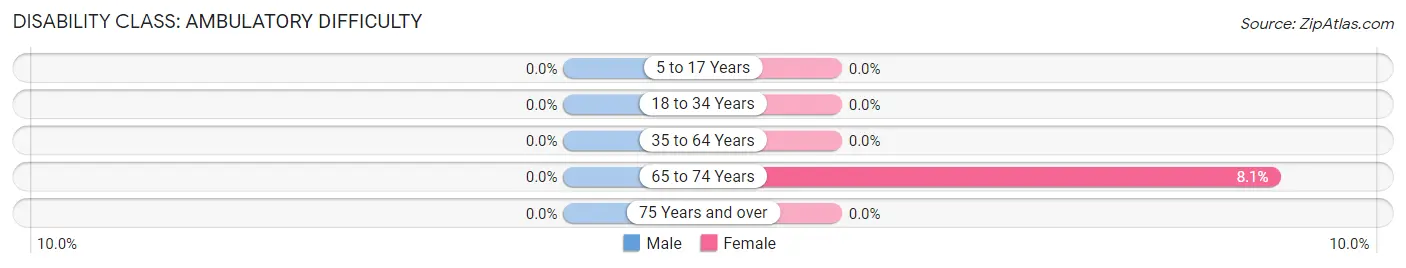
| Age Bracket | Male | Female |
| 5 to 17 Years | 0 (0.0%) | 0 (0.0%) |
| 18 to 34 Years | 0 (0.0%) | 0 (0.0%) |
| 35 to 64 Years | 0 (0.0%) | 0 (0.0%) |
| 65 to 74 Years | 0 (0.0%) | 7 (8.1%) |
| 75 Years and over | 0 (0.0%) | 0 (0.0%) |
Disability Class: Self-Care Difficulty
| Age Bracket | Male | Female |
| 5 to 17 Years | 0 (0.0%) | 0 (0.0%) |
| 18 to 34 Years | 0 (0.0%) | 0 (0.0%) |
| 35 to 64 Years | 0 (0.0%) | 0 (0.0%) |
| 65 to 74 Years | 0 (0.0%) | 0 (0.0%) |
| 75 Years and over | 0 (0.0%) | 0 (0.0%) |
Technology Access in Gorham
Computing Device Access in Gorham
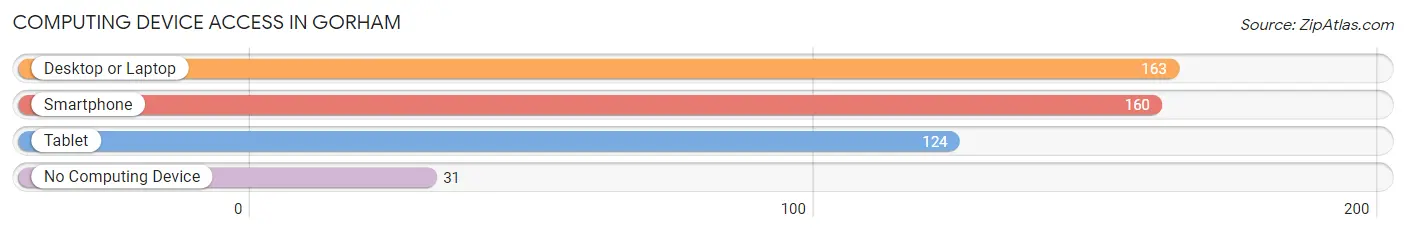
| Device Type | # Households | % Households |
| Desktop or Laptop | 163 | 74.8% |
| Smartphone | 160 | 73.4% |
| Tablet | 124 | 56.9% |
| No Computing Device | 31 | 14.2% |
| Total | 218 | 100.0% |
Internet Access in Gorham
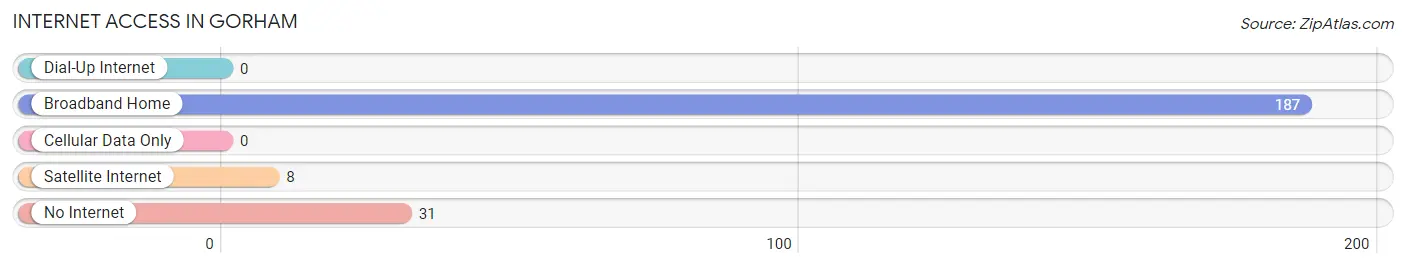
| Internet Type | # Households | % Households |
| Dial-Up Internet | 0 | 0.0% |
| Broadband Home | 187 | 85.8% |
| Cellular Data Only | 0 | 0.0% |
| Satellite Internet | 8 | 3.7% |
| No Internet | 31 | 14.2% |
| Total | 218 | 100.0% |
Gorham Summary
Gorham is a town located in Ontario County, New York, United States. The population was 2,845 at the 2010 census. The town is named after Gorham, Maine.
Geography
Gorham is located in the Finger Lakes region of New York. It is bordered by the towns of Canandaigua to the north, Hopewell to the east, Manchester to the south, and Phelps to the west. The town is located on the northern edge of Canandaigua Lake, the fourth largest of the Finger Lakes.
The town of Gorham is located in the western part of Ontario County, and is approximately 25 miles southeast of Rochester. The town is situated on a plateau, with elevations ranging from 600 to 800 feet above sea level. The highest point in the town is located at the intersection of County Road 8 and County Road 10, at an elevation of 810 feet.
The town of Gorham is home to several small lakes, including Mud Lake, Mud Creek Lake, and Mud Creek Pond. The town also contains several small streams, including Mud Creek, which flows through the town from north to south.
History
The area that is now the town of Gorham was first settled in 1789 by a group of settlers from Gorham, Maine. The town was officially established in 1812, and was named after the original settlers' hometown.
Gorham was an agricultural community for much of its history, with the main crops being wheat, corn, and potatoes. The town also had several small industries, including a sawmill, a gristmill, and a tannery.
In the late 19th century, the town began to develop as a resort community, with several hotels and inns being built along the shores of Canandaigua Lake. The town also became a popular destination for boating and fishing.
Economy
The economy of Gorham is largely based on tourism and agriculture. The town is home to several wineries, including the Finger Lakes Wine Country, which produces a variety of wines from local grapes. The town is also home to several small businesses, including restaurants, shops, and bed and breakfasts.
The town is also home to several farms, which produce a variety of crops, including corn, wheat, and potatoes. The town is also home to several dairy farms, which produce milk, cheese, and other dairy products.
Demographics
As of the 2010 census, the town of Gorham had a population of 2,845. The racial makeup of the town was 97.3% White, 0.7% African American, 0.3% Native American, 0.3% Asian, 0.1% Pacific Islander, 0.2% from other races, and 1.2% from two or more races. Hispanic or Latino of any race were 1.2% of the population.
The median household income in the town was $50,938, and the median family income was $60,938. The per capita income for the town was $25,938. About 8.3% of families and 10.2% of the population were below the poverty line, including 14.2% of those under age 18 and 5.2% of those age 65 or over.
Common Questions
What is Per Capita Income in Gorham?
Per Capita income in Gorham is $39,312.
What is the Median Family Income in Gorham?
Median Family Income in Gorham is $105,804.
What is the Median Household income in Gorham?
Median Household Income in Gorham is $86,250.
What is Income or Wage Gap in Gorham?
Income or Wage Gap in Gorham is 81.2%.
Women in Gorham earn 18.8 cents for every dollar earned by a man.
What is Inequality or Gini Index in Gorham?
Inequality or Gini Index in Gorham is 0.19.
What is the Total Population of Gorham?
Total Population of Gorham is 474.
What is the Total Male Population of Gorham?
Total Male Population of Gorham is 258.
What is the Total Female Population of Gorham?
Total Female Population of Gorham is 216.
What is the Ratio of Males per 100 Females in Gorham?
There are 119.44 Males per 100 Females in Gorham.
What is the Ratio of Females per 100 Males in Gorham?
There are 83.72 Females per 100 Males in Gorham.
What is the Median Population Age in Gorham?
Median Population Age in Gorham is 45.8 Years.
What is the Average Family Size in Gorham
Average Family Size in Gorham is 2.6 People.
What is the Average Household Size in Gorham
Average Household Size in Gorham is 2.2 People.
How Large is the Labor Force in Gorham?
There are 304 People in the Labor Forcein in Gorham.
What is the Percentage of People in the Labor Force in Gorham?
73.6% of People are in the Labor Force in Gorham.