Riverside, NY Map & Demographics
Riverside Map
Riverside Overview
$29,636
PER CAPITA INCOME
$126,806
AVG FAMILY INCOME
$56,429
AVG HOUSEHOLD INCOME
28.9%
WAGE / INCOME GAP [ % ]
71.1¢/ $1
WAGE / INCOME GAP [ $ ]
0.49
INEQUALITY / GINI INDEX
2,945
TOTAL POPULATION
2,006
MALE POPULATION
939
FEMALE POPULATION
213.63
MALES / 100 FEMALES
46.81
FEMALES / 100 MALES
36.3
MEDIAN AGE
3.4
AVG FAMILY SIZE
2.4
AVG HOUSEHOLD SIZE
1,024
LABOR FORCE [ PEOPLE ]
36.2%
PERCENT IN LABOR FORCE
16.5%
UNEMPLOYMENT RATE
Income in Riverside
Income Overview in Riverside
Per Capita Income in Riverside is $29,636, while median incomes of families and households are $126,806 and $56,429 respectively.
| Characteristic | Number | Measure |
| Per Capita Income | 2,945 | $29,636 |
| Median Family Income | 317 | $126,806 |
| Mean Family Income | 317 | $156,730 |
| Median Household Income | 666 | $56,429 |
| Mean Household Income | 666 | $107,290 |
| Income Deficit | 317 | $0 |
| Wage / Income Gap (%) | 2,945 | 28.89% |
| Wage / Income Gap ($) | 2,945 | 71.11¢ per $1 |
| Gini / Inequality Index | 2,945 | 0.49 |
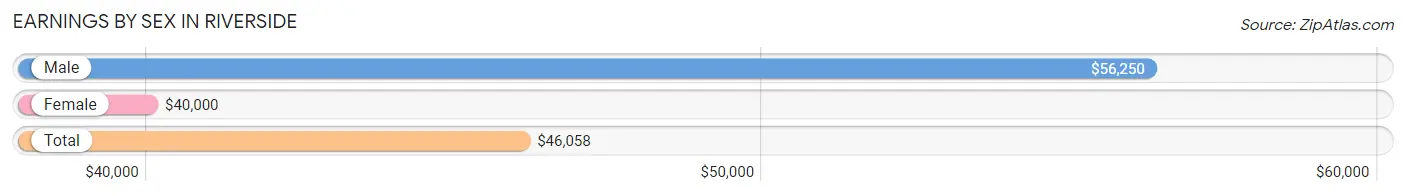
Earnings by Sex in Riverside
Average Earnings in Riverside are $46,058, $56,250 for men and $40,000 for women, a difference of 28.9%.
| Sex | Number | Average Earnings |
| Male | 1,031 (67.1%) | $56,250 |
| Female | 505 (32.9%) | $40,000 |
| Total | 1,536 (100.0%) | $46,058 |
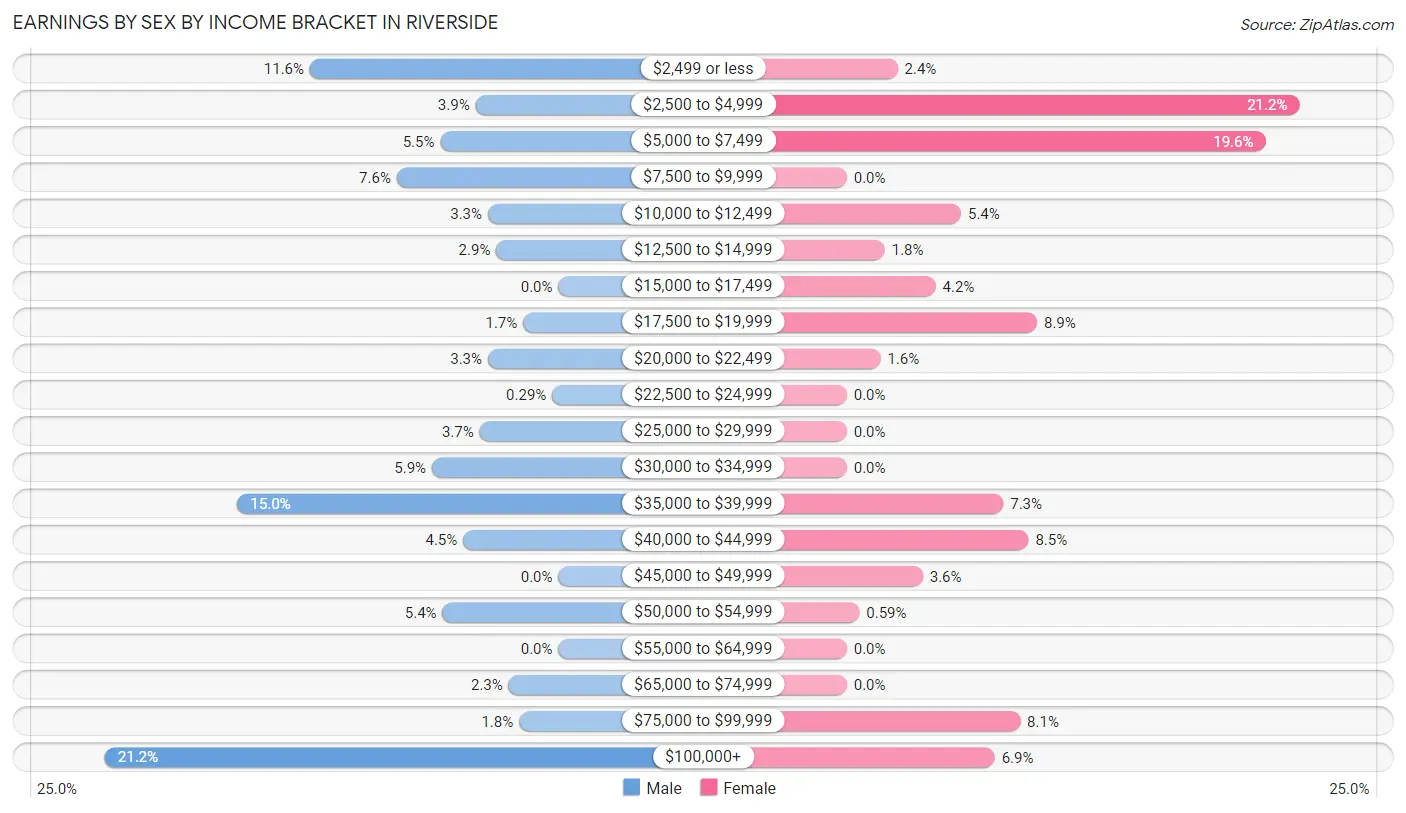
Earnings by Sex by Income Bracket in Riverside
The most common earnings brackets in Riverside are $100,000+ for men (219 | 21.2%) and $2,500 to $4,999 for women (107 | 21.2%).
| Income | Male | Female |
| $2,499 or less | 120 (11.6%) | 12 (2.4%) |
| $2,500 to $4,999 | 40 (3.9%) | 107 (21.2%) |
| $5,000 to $7,499 | 57 (5.5%) | 99 (19.6%) |
| $7,500 to $9,999 | 78 (7.6%) | 0 (0.0%) |
| $10,000 to $12,499 | 34 (3.3%) | 27 (5.3%) |
| $12,500 to $14,999 | 30 (2.9%) | 9 (1.8%) |
| $15,000 to $17,499 | 0 (0.0%) | 21 (4.2%) |
| $17,500 to $19,999 | 17 (1.7%) | 45 (8.9%) |
| $20,000 to $22,499 | 34 (3.3%) | 8 (1.6%) |
| $22,500 to $24,999 | 3 (0.3%) | 0 (0.0%) |
| $25,000 to $29,999 | 38 (3.7%) | 0 (0.0%) |
| $30,000 to $34,999 | 61 (5.9%) | 0 (0.0%) |
| $35,000 to $39,999 | 155 (15.0%) | 37 (7.3%) |
| $40,000 to $44,999 | 46 (4.5%) | 43 (8.5%) |
| $45,000 to $49,999 | 0 (0.0%) | 18 (3.6%) |
| $50,000 to $54,999 | 56 (5.4%) | 3 (0.6%) |
| $55,000 to $64,999 | 0 (0.0%) | 0 (0.0%) |
| $65,000 to $74,999 | 24 (2.3%) | 0 (0.0%) |
| $75,000 to $99,999 | 19 (1.8%) | 41 (8.1%) |
| $100,000+ | 219 (21.2%) | 35 (6.9%) |
| Total | 1,031 (100.0%) | 505 (100.0%) |
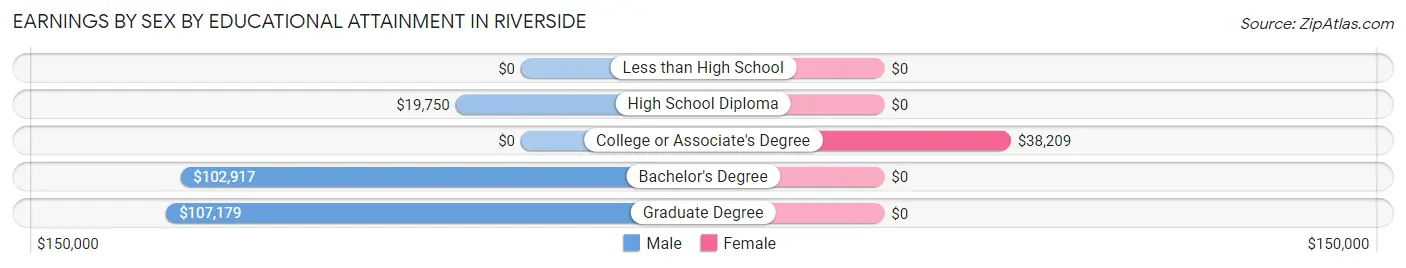
Earnings by Sex by Educational Attainment in Riverside
| Educational Attainment | Male Income | Female Income |
| Less than High School | - | - |
| High School Diploma | $19,750 | $0 |
| College or Associate's Degree | - | - |
| Bachelor's Degree | $102,917 | $0 |
| Graduate Degree | $107,179 | $0 |
| Total | $38,038 | $0 |
Family Income in Riverside
Family Income Brackets in Riverside
According to the Riverside family income data, there are 91 families falling into the $150,000 to $199,999 income range, which is the most common income bracket and makes up 28.7% of all families.
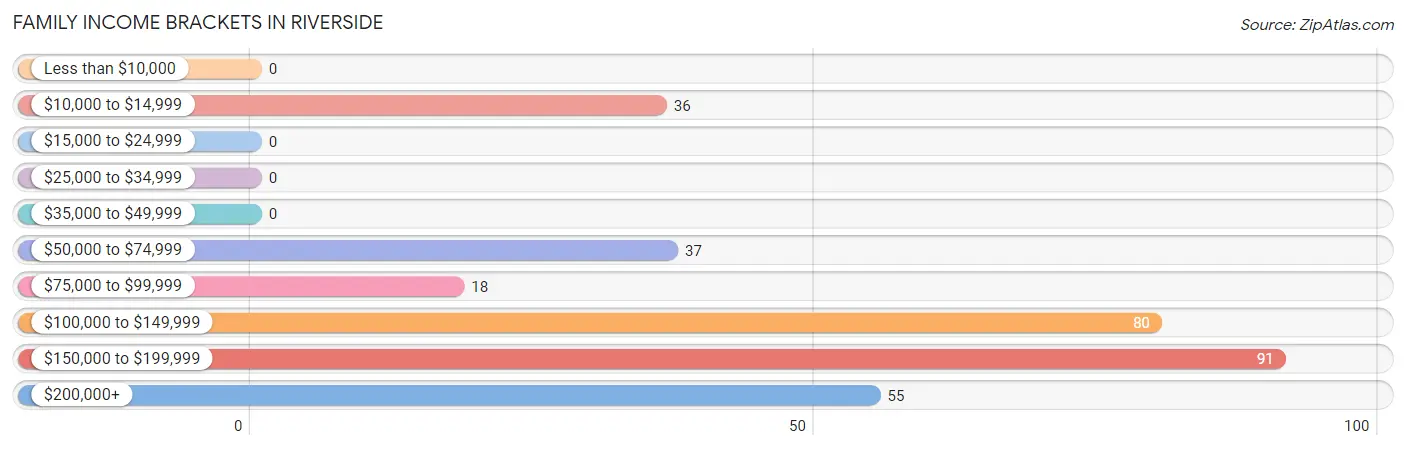
| Income Bracket | # Families | % Families |
| Less than $10,000 | 0 | 0.0% |
| $10,000 to $14,999 | 36 | 11.4% |
| $15,000 to $24,999 | 0 | 0.0% |
| $25,000 to $34,999 | 0 | 0.0% |
| $35,000 to $49,999 | 0 | 0.0% |
| $50,000 to $74,999 | 37 | 11.7% |
| $75,000 to $99,999 | 18 | 5.7% |
| $100,000 to $149,999 | 80 | 25.2% |
| $150,000 to $199,999 | 91 | 28.7% |
| $200,000+ | 55 | 17.4% |
Family Income by Famaliy Size in Riverside
3-person families (175 | 55.2%) account for the highest median family income in Riverside with $193,787 per family, while 3-person families (175 | 55.2%) have the highest median income of $64,596 per family member.
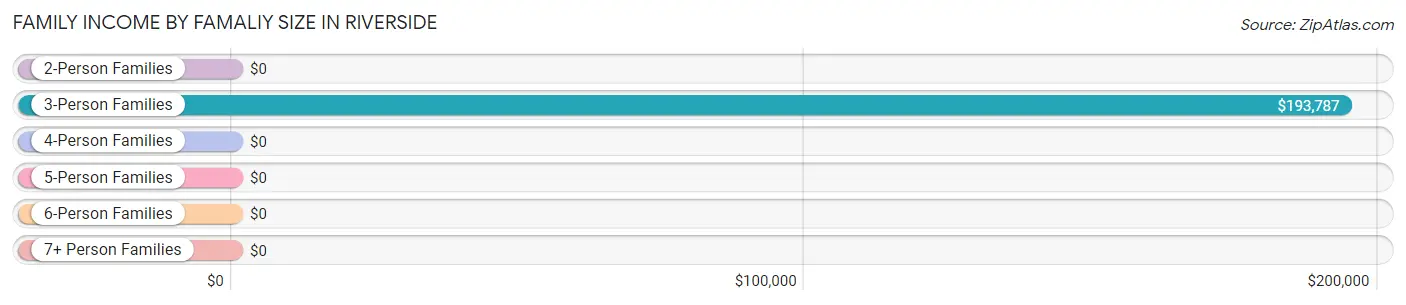
| Income Bracket | # Families | Median Income |
| 2-Person Families | 97 (30.6%) | $0 |
| 3-Person Families | 175 (55.2%) | $193,787 |
| 4-Person Families | 0 (0.0%) | $0 |
| 5-Person Families | 0 (0.0%) | $0 |
| 6-Person Families | 45 (14.2%) | $0 |
| 7+ Person Families | 0 (0.0%) | $0 |
| Total | 317 (100.0%) | $126,806 |
Family Income by Number of Earners in Riverside
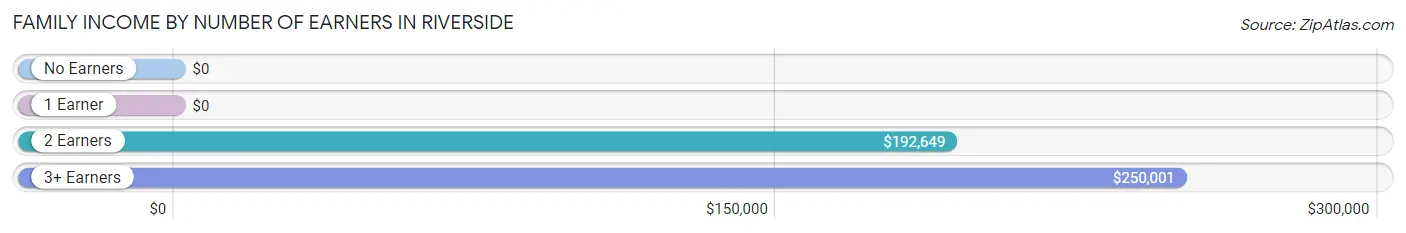
| Number of Earners | # Families | Median Income |
| No Earners | 36 (11.4%) | $0 |
| 1 Earner | 55 (17.3%) | $0 |
| 2 Earners | 126 (39.8%) | $192,649 |
| 3+ Earners | 100 (31.6%) | $250,001 |
| Total | 317 (100.0%) | $126,806 |
Household Income in Riverside
Household Income Brackets in Riverside
With 146 households falling in the category, the $35,000 to $49,999 income range is the most frequent in Riverside, accounting for 21.9% of all households. In contrast, only 16 households (2.4%) fall into the less than $10,000 income bracket, making it the least populous group.
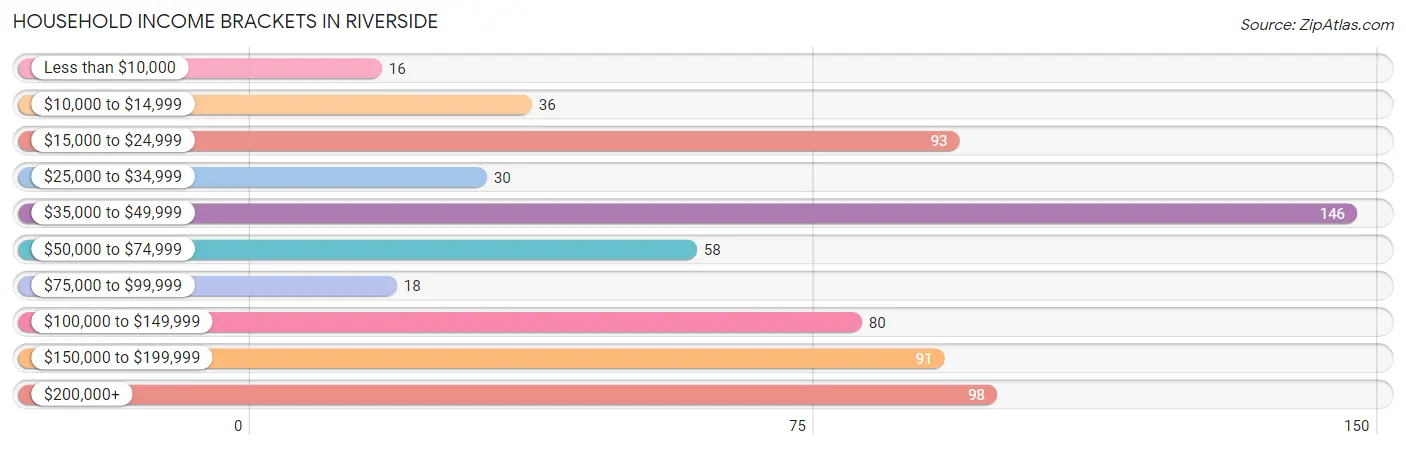
| Income Bracket | # Households | % Households |
| Less than $10,000 | 16 | 2.4% |
| $10,000 to $14,999 | 36 | 5.4% |
| $15,000 to $24,999 | 93 | 14.0% |
| $25,000 to $34,999 | 30 | 4.5% |
| $35,000 to $49,999 | 146 | 21.9% |
| $50,000 to $74,999 | 58 | 8.7% |
| $75,000 to $99,999 | 18 | 2.7% |
| $100,000 to $149,999 | 80 | 12.0% |
| $150,000 to $199,999 | 91 | 13.7% |
| $200,000+ | 98 | 14.7% |
Household Income by Householder Age in Riverside
The median household income in Riverside is $56,429, with the highest median household income of $74,223 found in the 45 to 64 years age bracket for the primary householder. A total of 441 households (66.2%) fall into this category.
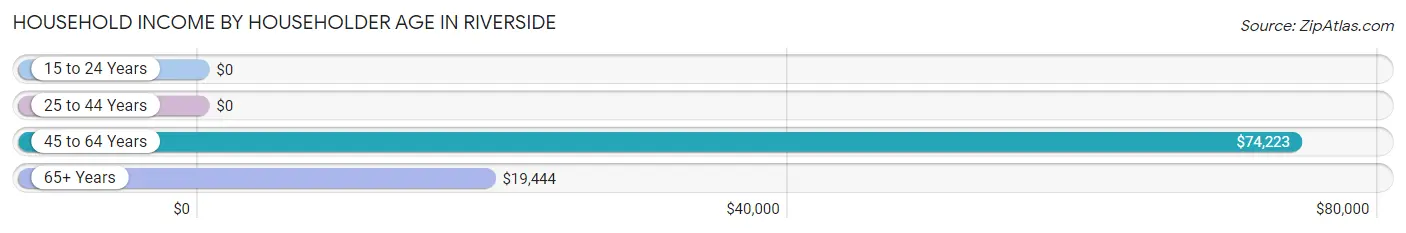
| Income Bracket | # Households | Median Income |
| 15 to 24 Years | 0 (0.0%) | $0 |
| 25 to 44 Years | 43 (6.5%) | $0 |
| 45 to 64 Years | 441 (66.2%) | $74,223 |
| 65+ Years | 182 (27.3%) | $19,444 |
| Total | 666 (100.0%) | $56,429 |
Poverty in Riverside
Income Below Poverty by Sex and Age in Riverside
With 9.0% poverty level for males and 4.6% for females among the residents of Riverside, 35 to 44 year old males and 45 to 54 year old females are the most vulnerable to poverty, with 8 males (100.0%) and 37 females (22.2%) in their respective age groups living below the poverty level.
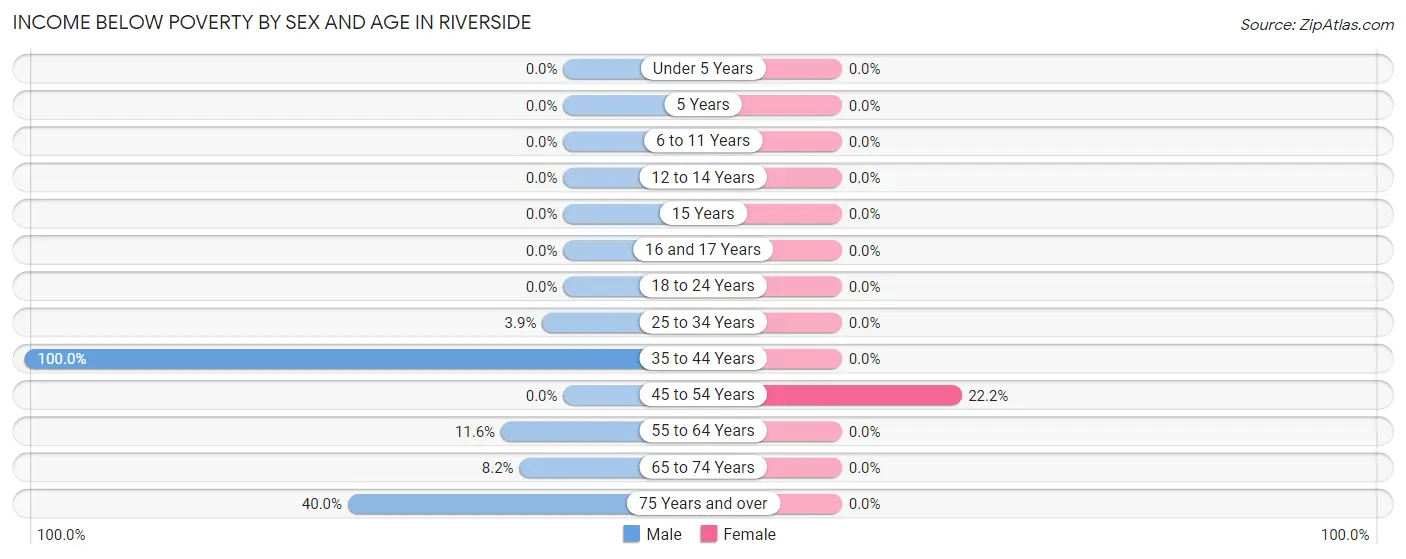
| Age Bracket | Male | Female |
| Under 5 Years | 0 (0.0%) | 0 (0.0%) |
| 5 Years | 0 (0.0%) | 0 (0.0%) |
| 6 to 11 Years | 0 (0.0%) | 0 (0.0%) |
| 12 to 14 Years | 0 (0.0%) | 0 (0.0%) |
| 15 Years | 0 (0.0%) | 0 (0.0%) |
| 16 and 17 Years | 0 (0.0%) | 0 (0.0%) |
| 18 to 24 Years | 0 (0.0%) | 0 (0.0%) |
| 25 to 34 Years | 8 (3.9%) | 0 (0.0%) |
| 35 to 44 Years | 8 (100.0%) | 0 (0.0%) |
| 45 to 54 Years | 0 (0.0%) | 37 (22.2%) |
| 55 to 64 Years | 36 (11.6%) | 0 (0.0%) |
| 65 to 74 Years | 11 (8.2%) | 0 (0.0%) |
| 75 Years and over | 8 (40.0%) | 0 (0.0%) |
| Total | 71 (9.0%) | 37 (4.6%) |
Income Above Poverty by Sex and Age in Riverside
According to the poverty statistics in Riverside, males aged 16 and 17 years and females aged 12 to 14 years are the age groups that are most secure financially, with 100.0% of males and 100.0% of females in these age groups living above the poverty line.
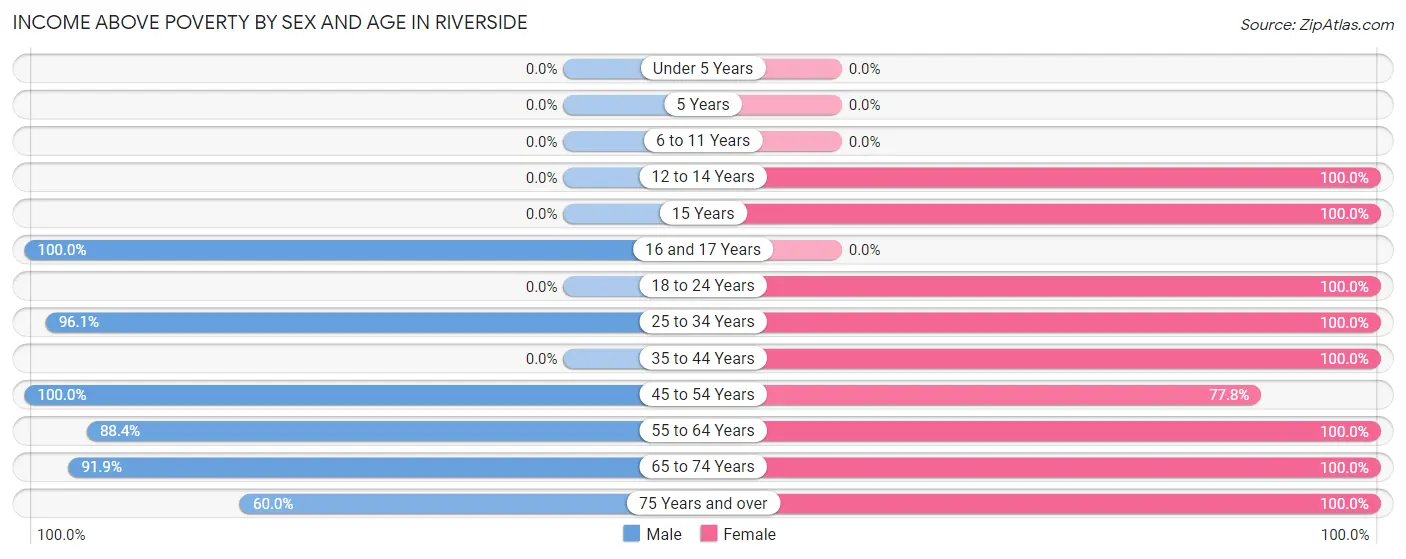
| Age Bracket | Male | Female |
| Under 5 Years | 0 (0.0%) | 0 (0.0%) |
| 5 Years | 0 (0.0%) | 0 (0.0%) |
| 6 to 11 Years | 0 (0.0%) | 0 (0.0%) |
| 12 to 14 Years | 0 (0.0%) | 66 (100.0%) |
| 15 Years | 0 (0.0%) | 49 (100.0%) |
| 16 and 17 Years | 47 (100.0%) | 0 (0.0%) |
| 18 to 24 Years | 0 (0.0%) | 153 (100.0%) |
| 25 to 34 Years | 196 (96.1%) | 118 (100.0%) |
| 35 to 44 Years | 0 (0.0%) | 39 (100.0%) |
| 45 to 54 Years | 67 (100.0%) | 130 (77.8%) |
| 55 to 64 Years | 275 (88.4%) | 131 (100.0%) |
| 65 to 74 Years | 124 (91.8%) | 72 (100.0%) |
| 75 Years and over | 12 (60.0%) | 12 (100.0%) |
| Total | 721 (91.0%) | 770 (95.4%) |
Income Below Poverty Among Married-Couple Families in Riverside
The poverty statistics for married-couple families in Riverside show that 12.9% or 36 of the total 280 families live below the poverty line. Families with no children have the highest poverty rate of 16.6%, comprising of 36 families. On the other hand, families with 1 or 2 children have the lowest poverty rate of 0.0%, which includes 0 families.
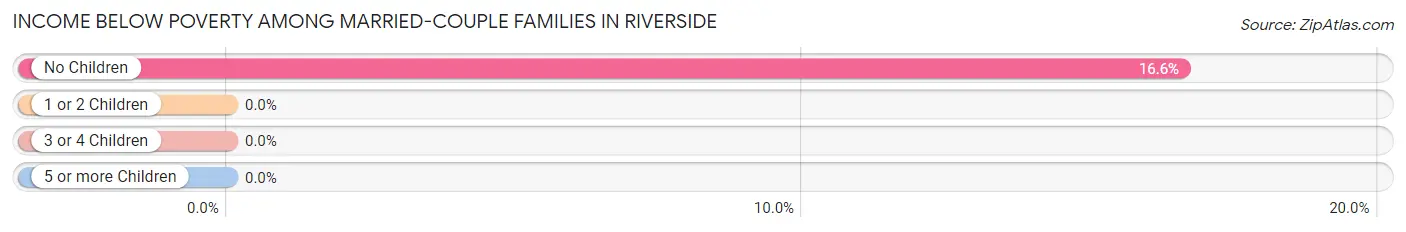
| Children | Above Poverty | Below Poverty |
| No Children | 181 (83.4%) | 36 (16.6%) |
| 1 or 2 Children | 18 (100.0%) | 0 (0.0%) |
| 3 or 4 Children | 45 (100.0%) | 0 (0.0%) |
| 5 or more Children | 0 (0.0%) | 0 (0.0%) |
| Total | 244 (87.1%) | 36 (12.9%) |
Income Below Poverty Among Single-Parent Households in Riverside
| Children | Single Father | Single Mother |
| No Children | 0 (0.0%) | 0 (0.0%) |
| 1 or 2 Children | 0 (0.0%) | 0 (0.0%) |
| 3 or 4 Children | 0 (0.0%) | 0 (0.0%) |
| 5 or more Children | 0 (0.0%) | 0 (0.0%) |
| Total | 0 (0.0%) | 0 (0.0%) |
Income Below Poverty Among Married-Couple vs Single-Parent Households in Riverside
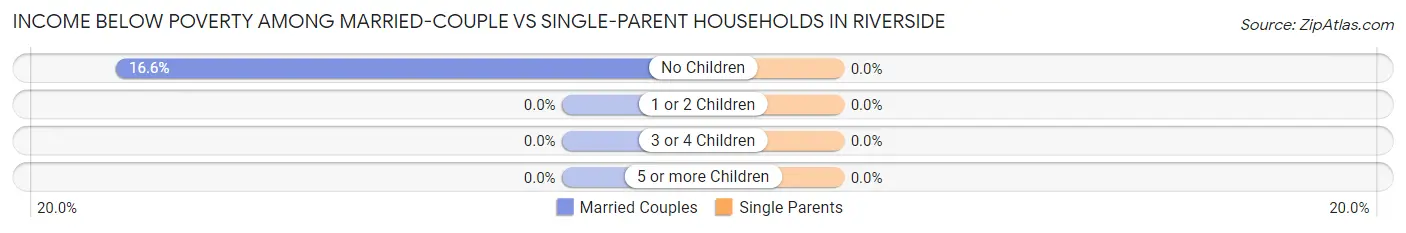
| Children | Married-Couple Families | Single-Parent Households |
| No Children | 36 (16.6%) | 0 (0.0%) |
| 1 or 2 Children | 0 (0.0%) | 0 (0.0%) |
| 3 or 4 Children | 0 (0.0%) | 0 (0.0%) |
| 5 or more Children | 0 (0.0%) | 0 (0.0%) |
| Total | 36 (12.9%) | 0 (0.0%) |
Race in Riverside
The most populous races in Riverside are White / Caucasian (1,752 | 59.5%), Black / African American (751 | 25.5%), and Hispanic or Latino (273 | 9.3%).
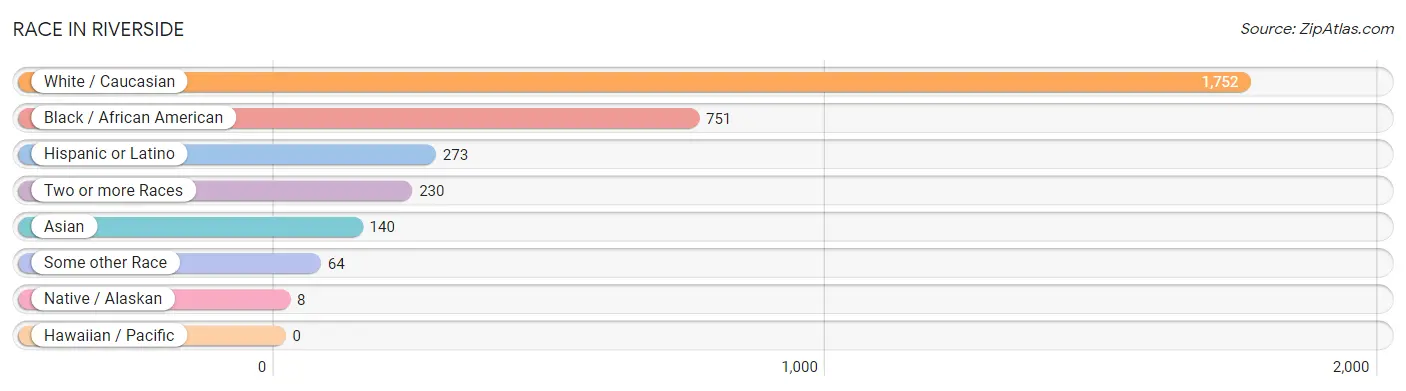
| Race | # Population | % Population |
| Asian | 140 | 4.8% |
| Black / African American | 751 | 25.5% |
| Hawaiian / Pacific | 0 | 0.0% |
| Hispanic or Latino | 273 | 9.3% |
| Native / Alaskan | 8 | 0.3% |
| White / Caucasian | 1,752 | 59.5% |
| Two or more Races | 230 | 7.8% |
| Some other Race | 64 | 2.2% |
| Total | 2,945 | 100.0% |
Ancestry in Riverside
The most populous ancestries reported in Riverside are Irish (769 | 26.1%), Italian (203 | 6.9%), English (170 | 5.8%), Dutch (161 | 5.5%), and Polish (146 | 5.0%), together accounting for 49.2% of all Riverside residents.
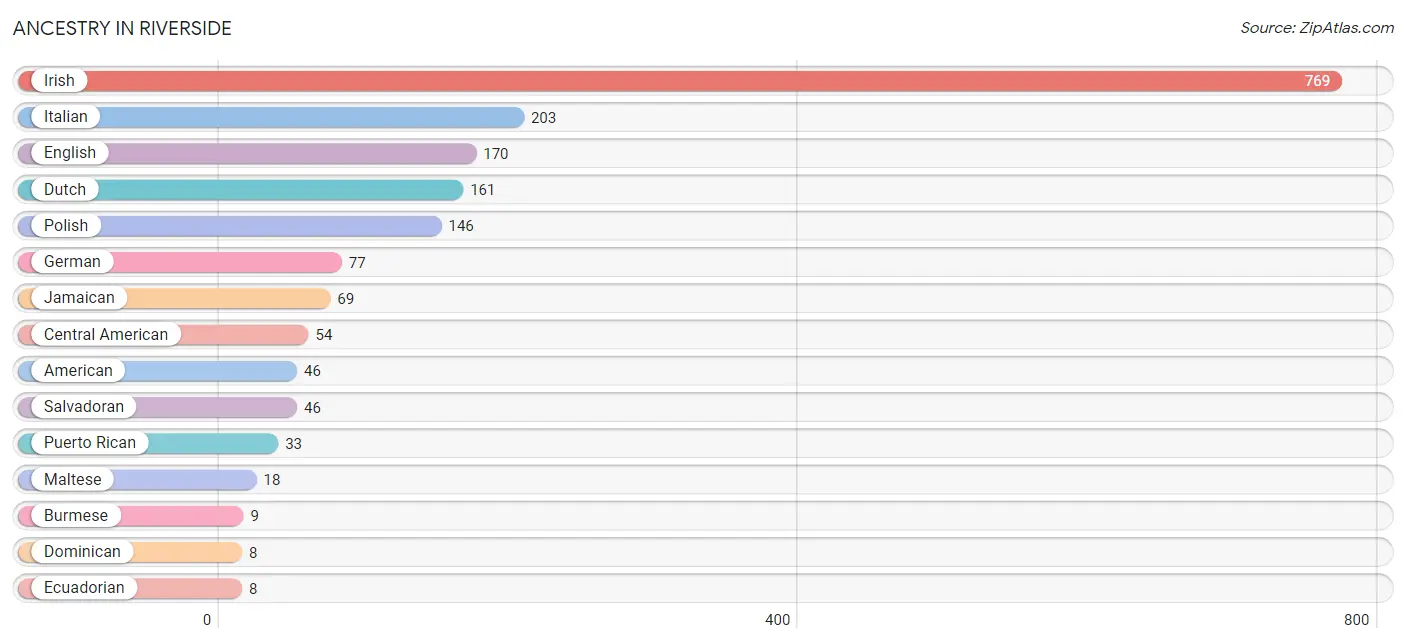
| Ancestry | # Population | % Population |
| American | 46 | 1.6% |
| Burmese | 9 | 0.3% |
| Central American | 54 | 1.8% |
| Dominican | 8 | 0.3% |
| Dutch | 161 | 5.5% |
| Ecuadorian | 8 | 0.3% |
| English | 170 | 5.8% |
| German | 77 | 2.6% |
| Honduran | 8 | 0.3% |
| Irish | 769 | 26.1% |
| Italian | 203 | 6.9% |
| Jamaican | 69 | 2.3% |
| Maltese | 18 | 0.6% |
| Mexican | 6 | 0.2% |
| Polish | 146 | 5.0% |
| Puerto Rican | 33 | 1.1% |
| Salvadoran | 46 | 1.6% |
| South American | 8 | 0.3% | View All 18 Rows |
Immigrants in Riverside
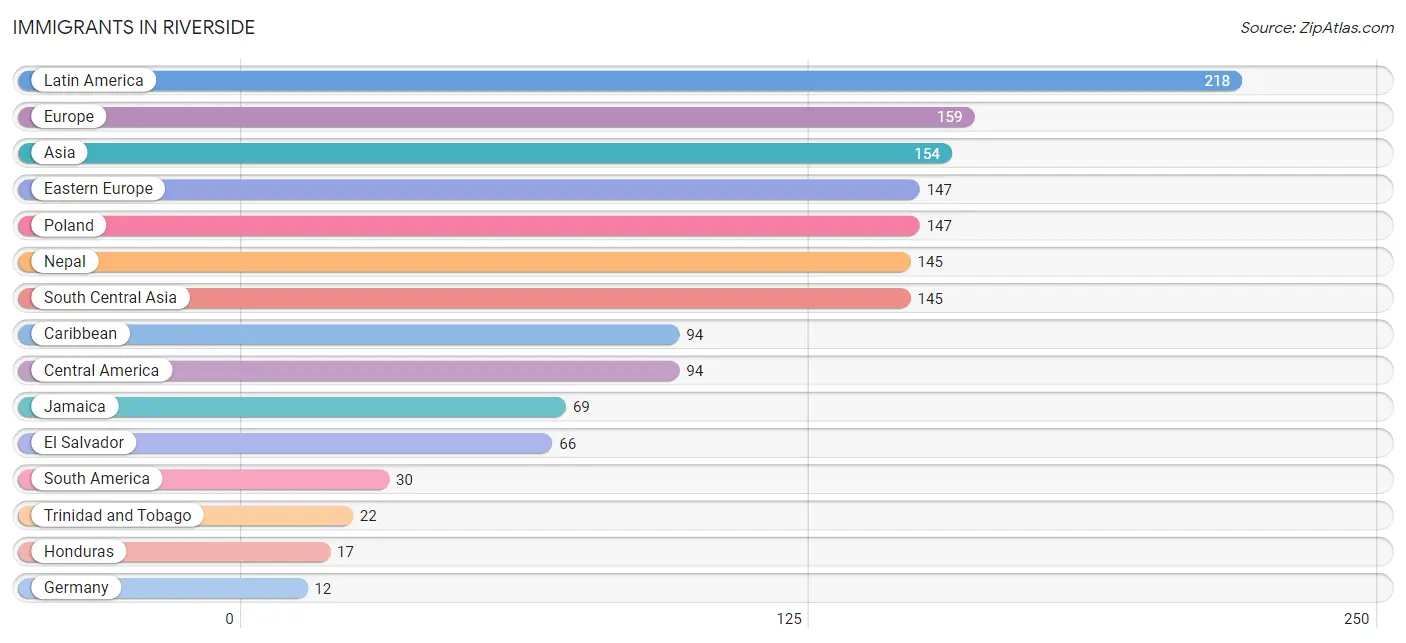
The most numerous immigrant groups reported in Riverside came from Latin America (218 | 7.4%), Europe (159 | 5.4%), Asia (154 | 5.2%), Eastern Europe (147 | 5.0%), and Poland (147 | 5.0%), together accounting for 28.0% of all Riverside residents.
| Immigration Origin | # Population | % Population |
| Asia | 154 | 5.2% |
| Caribbean | 94 | 3.2% |
| Central America | 94 | 3.2% |
| Dominican Republic | 3 | 0.1% |
| Eastern Asia | 9 | 0.3% |
| Eastern Europe | 147 | 5.0% |
| Ecuador | 8 | 0.3% |
| El Salvador | 66 | 2.2% |
| Europe | 159 | 5.4% |
| Germany | 12 | 0.4% |
| Honduras | 17 | 0.6% |
| Jamaica | 69 | 2.3% |
| Korea | 9 | 0.3% |
| Latin America | 218 | 7.4% |
| Mexico | 11 | 0.4% |
| Nepal | 145 | 4.9% |
| Poland | 147 | 5.0% |
| South America | 30 | 1.0% |
| South Central Asia | 145 | 4.9% |
| Trinidad and Tobago | 22 | 0.7% |
| Western Europe | 12 | 0.4% | View All 21 Rows |
Sex and Age in Riverside
Sex and Age in Riverside
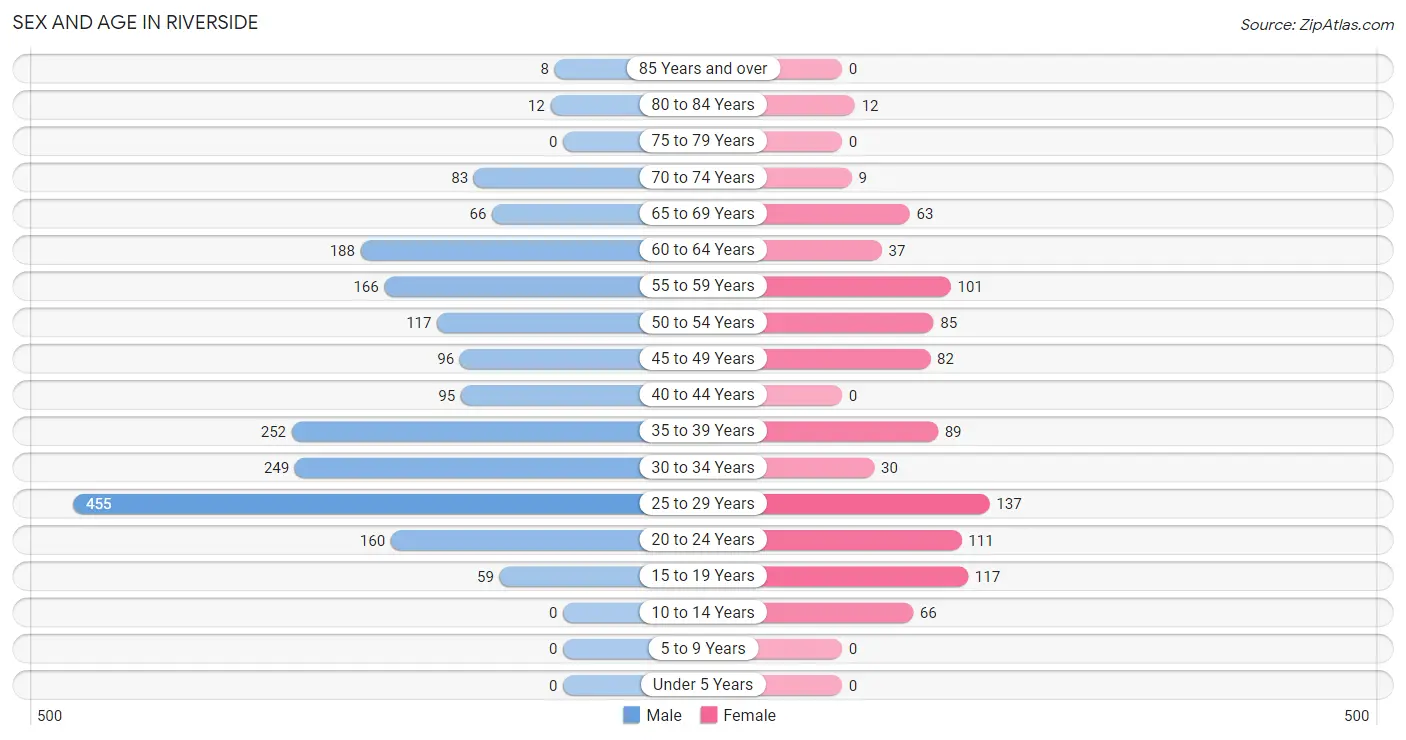
The most populous age groups in Riverside are 25 to 29 Years (455 | 22.7%) for men and 25 to 29 Years (137 | 14.6%) for women.
| Age Bracket | Male | Female |
| Under 5 Years | 0 (0.0%) | 0 (0.0%) |
| 5 to 9 Years | 0 (0.0%) | 0 (0.0%) |
| 10 to 14 Years | 0 (0.0%) | 66 (7.0%) |
| 15 to 19 Years | 59 (2.9%) | 117 (12.5%) |
| 20 to 24 Years | 160 (8.0%) | 111 (11.8%) |
| 25 to 29 Years | 455 (22.7%) | 137 (14.6%) |
| 30 to 34 Years | 249 (12.4%) | 30 (3.2%) |
| 35 to 39 Years | 252 (12.6%) | 89 (9.5%) |
| 40 to 44 Years | 95 (4.7%) | 0 (0.0%) |
| 45 to 49 Years | 96 (4.8%) | 82 (8.7%) |
| 50 to 54 Years | 117 (5.8%) | 85 (9.0%) |
| 55 to 59 Years | 166 (8.3%) | 101 (10.8%) |
| 60 to 64 Years | 188 (9.4%) | 37 (3.9%) |
| 65 to 69 Years | 66 (3.3%) | 63 (6.7%) |
| 70 to 74 Years | 83 (4.1%) | 9 (1.0%) |
| 75 to 79 Years | 0 (0.0%) | 0 (0.0%) |
| 80 to 84 Years | 12 (0.6%) | 12 (1.3%) |
| 85 Years and over | 8 (0.4%) | 0 (0.0%) |
| Total | 2,006 (100.0%) | 939 (100.0%) |
Families and Households in Riverside
Median Family Size in Riverside
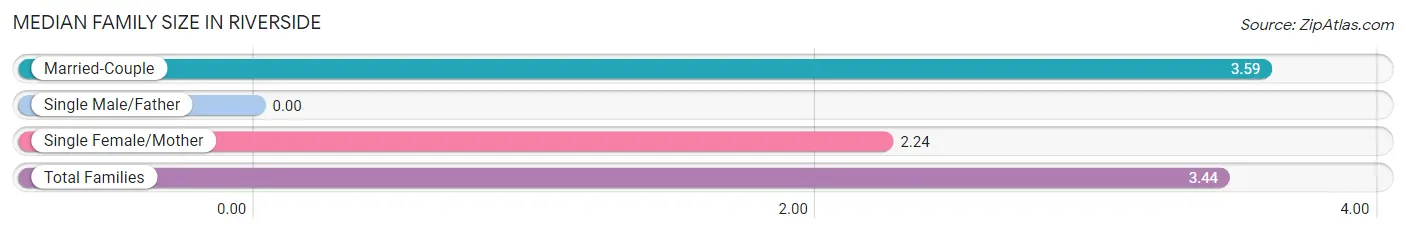
| Family Type | # Families | Family Size |
| Married-Couple | 280 (88.3%) | 3.59 |
| Single Male/Father | 0 (0.0%) | - |
| Single Female/Mother | 37 (11.7%) | 2.24 |
| Total Families | 317 (100.0%) | 3.44 |
Median Household Size in Riverside
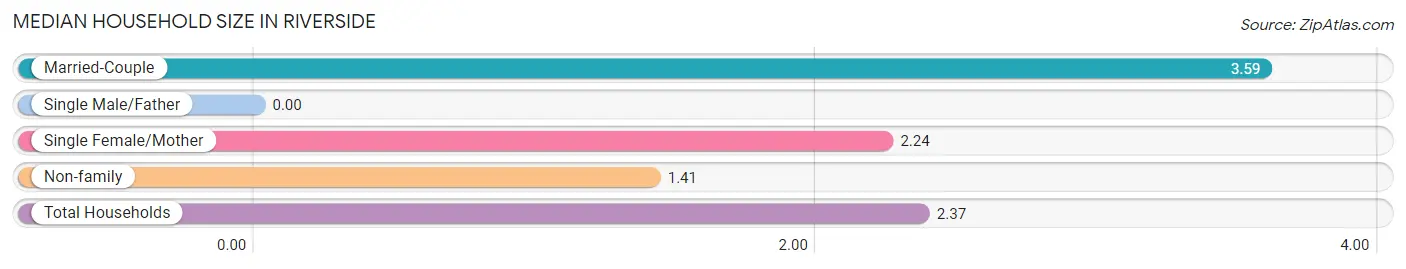
| Household Type | # Households | Household Size |
| Married-Couple | 280 (42.0%) | 3.59 |
| Single Male/Father | 0 (0.0%) | - |
| Single Female/Mother | 37 (5.6%) | 2.24 |
| Non-family | 349 (52.4%) | 1.41 |
| Total Households | 666 (100.0%) | 2.37 |
Household Size by Marriage Status in Riverside
Out of a total of 666 households in Riverside, 317 (47.6%) are family households, while 349 (52.4%) are nonfamily households. The most numerous type of family households are 3-person households, comprising 175, and the most common type of nonfamily households are 1-person households, comprising 306.
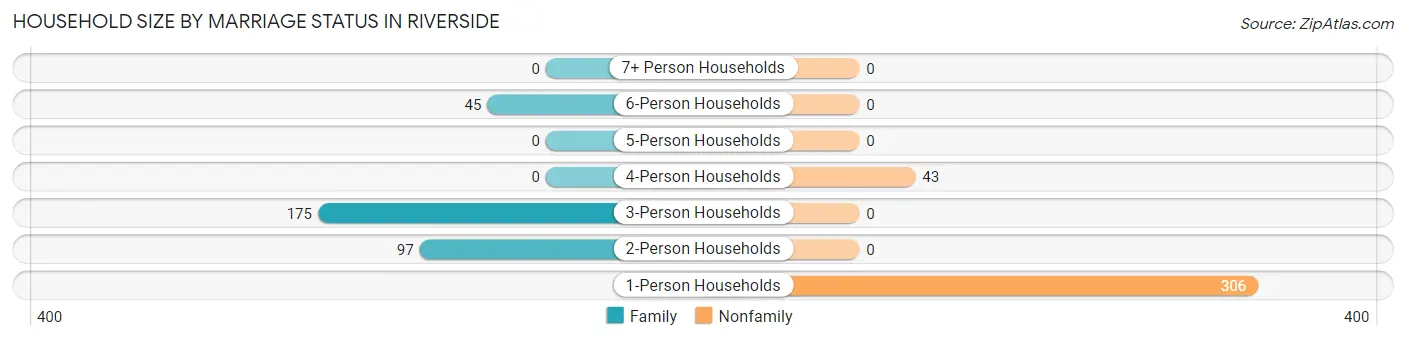
| Household Size | Family Households | Nonfamily Households |
| 1-Person Households | - | 306 (46.0%) |
| 2-Person Households | 97 (14.6%) | 0 (0.0%) |
| 3-Person Households | 175 (26.3%) | 0 (0.0%) |
| 4-Person Households | 0 (0.0%) | 43 (6.5%) |
| 5-Person Households | 0 (0.0%) | 0 (0.0%) |
| 6-Person Households | 45 (6.8%) | 0 (0.0%) |
| 7+ Person Households | 0 (0.0%) | 0 (0.0%) |
| Total | 317 (47.6%) | 349 (52.4%) |
Female Fertility in Riverside
Fertility by Age in Riverside
| Age Bracket | Women with Births | Births / 1,000 Women |
| 15 to 19 years | 0 (0.0%) | 0.0 |
| 20 to 34 years | 0 (0.0%) | 0.0 |
| 35 to 50 years | 0 (0.0%) | 0.0 |
| Total | 0 (0.0%) | 0.0 |
Fertility by Age by Marriage Status in Riverside
| Age Bracket | Married | Unmarried |
| 15 to 19 years | 0 (0.0%) | 0 (0.0%) |
| 20 to 34 years | 0 (0.0%) | 0 (0.0%) |
| 35 to 50 years | 0 (0.0%) | 0 (0.0%) |
| Total | 0 (0.0%) | 0 (0.0%) |
Fertility by Education in Riverside
| Educational Attainment | Women with Births | Births / 1,000 Women |
| Less than High School | 0 (0.0%) | 0.0 |
| High School Diploma | 0 (0.0%) | 0.0 |
| College or Associate's Degree | 0 (0.0%) | 0.0 |
| Bachelor's Degree | 0 (0.0%) | 0.0 |
| Graduate Degree | 0 (0.0%) | 0.0 |
| Total | 0 (0.0%) | 0.0 |
Fertility by Education by Marriage Status in Riverside

| Educational Attainment | Married | Unmarried |
| Less than High School | 0 (0.0%) | 0 (0.0%) |
| High School Diploma | 0 (0.0%) | 0 (0.0%) |
| College or Associate's Degree | 0 (0.0%) | 0 (0.0%) |
| Bachelor's Degree | 0 (0.0%) | 0 (0.0%) |
| Graduate Degree | 0 (0.0%) | 0 (0.0%) |
| Total | 0 (0.0%) | 0 (0.0%) |
Employment Characteristics in Riverside
Employment by Class of Employer in Riverside
Among the 855 employed individuals in Riverside, private company employees (458 | 53.6%), local government employees (175 | 20.5%), and state government employees (170 | 19.9%) make up the most common classes of employment.
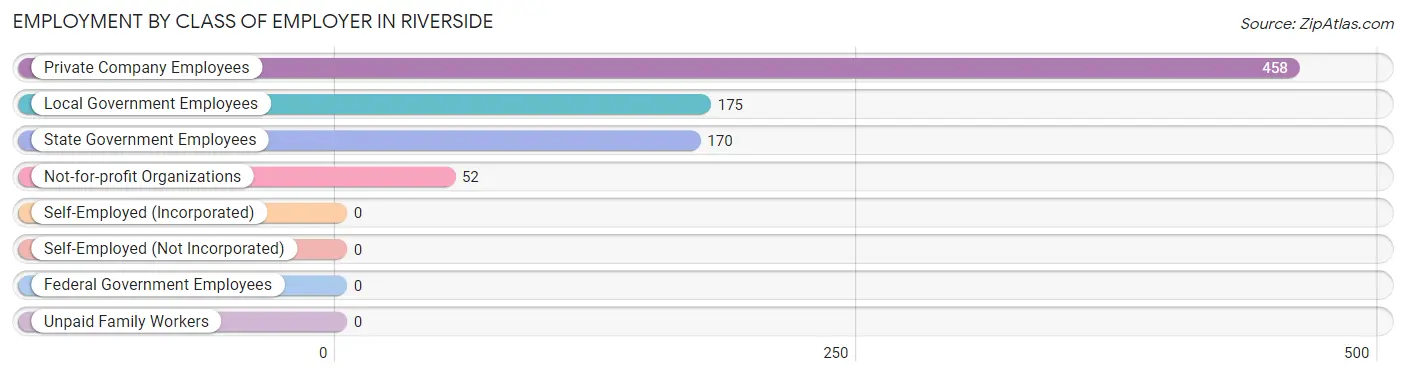
| Employer Class | # Employees | % Employees |
| Private Company Employees | 458 | 53.6% |
| Self-Employed (Incorporated) | 0 | 0.0% |
| Self-Employed (Not Incorporated) | 0 | 0.0% |
| Not-for-profit Organizations | 52 | 6.1% |
| Local Government Employees | 175 | 20.5% |
| State Government Employees | 170 | 19.9% |
| Federal Government Employees | 0 | 0.0% |
| Unpaid Family Workers | 0 | 0.0% |
| Total | 855 | 100.0% |
Employment Status by Age in Riverside
According to the labor force statistics for Riverside, out of the total population over 16 years of age (2,830), 36.2% or 1,024 individuals are in the labor force, with 16.5% or 169 of them unemployed. The age group with the highest labor force participation rate is 55 to 59 years, with 93.3% or 249 individuals in the labor force. Within the labor force, the 20 to 24 years age range has the highest percentage of unemployed individuals, with 100.0% or 94 of them being unemployed.
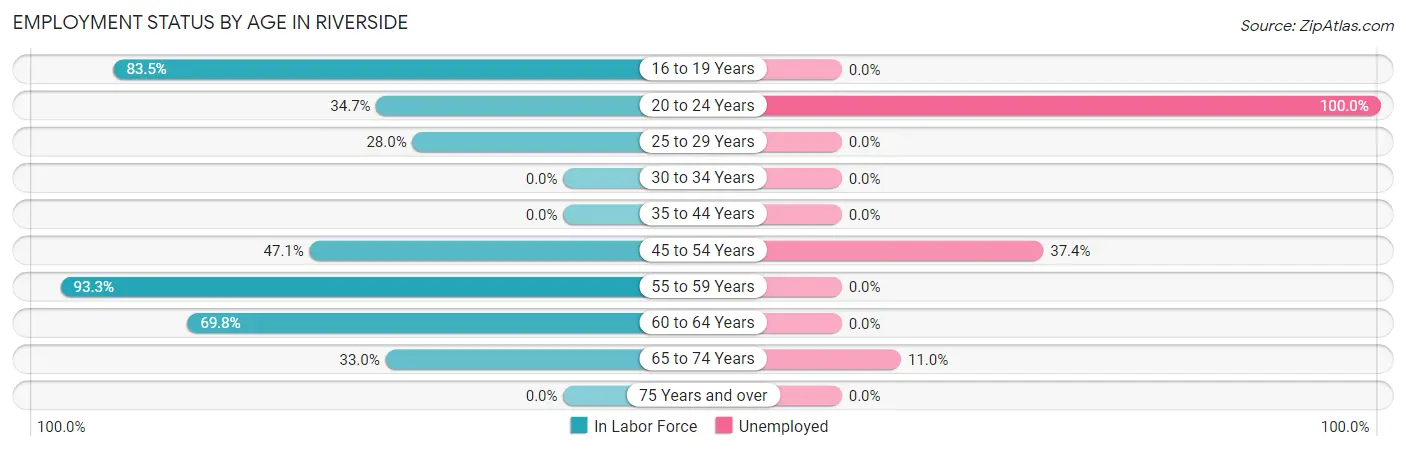
| Age Bracket | In Labor Force | Unemployed |
| 16 to 19 Years | 106 (83.5%) | 0 (0.0%) |
| 20 to 24 Years | 94 (34.7%) | 94 (100.0%) |
| 25 to 29 Years | 166 (28.0%) | 0 (0.0%) |
| 30 to 34 Years | 0 (0.0%) | 0 (0.0%) |
| 35 to 44 Years | 0 (0.0%) | 0 (0.0%) |
| 45 to 54 Years | 179 (47.1%) | 67 (37.4%) |
| 55 to 59 Years | 249 (93.3%) | 0 (0.0%) |
| 60 to 64 Years | 157 (69.8%) | 0 (0.0%) |
| 65 to 74 Years | 73 (33.0%) | 8 (11.0%) |
| 75 Years and over | 0 (0.0%) | 0 (0.0%) |
| Total | 1,024 (36.2%) | 169 (16.5%) |
Employment Status by Educational Attainment in Riverside
According to labor force statistics for Riverside, 34.5% of individuals (752) out of the total population between 25 and 64 years of age (2,179) are in the labor force, with 8.9% or 67 of them being unemployed. The group with the highest labor force participation rate are those with the educational attainment of bachelor's degree or higher, with 68.3% or 377 individuals in the labor force. Within the labor force, individuals with college / associate degree education have the highest percentage of unemployment, with 30.9% or 67 of them being unemployed.
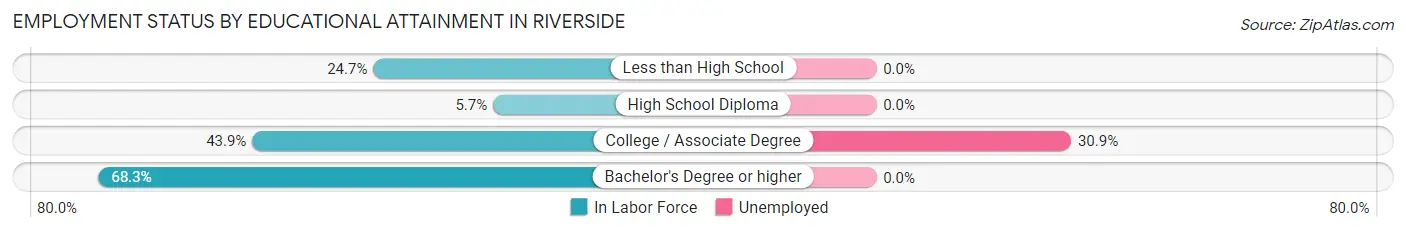
| Educational Attainment | In Labor Force | Unemployed |
| Less than High School | 120 (24.7%) | 0 (0.0%) |
| High School Diploma | 37 (5.7%) | 0 (0.0%) |
| College / Associate Degree | 217 (43.9%) | 153 (30.9%) |
| Bachelor's Degree or higher | 377 (68.3%) | 0 (0.0%) |
| Total | 752 (34.5%) | 194 (8.9%) |
Employment Occupations by Sex in Riverside
Management, Business, Science and Arts Occupations
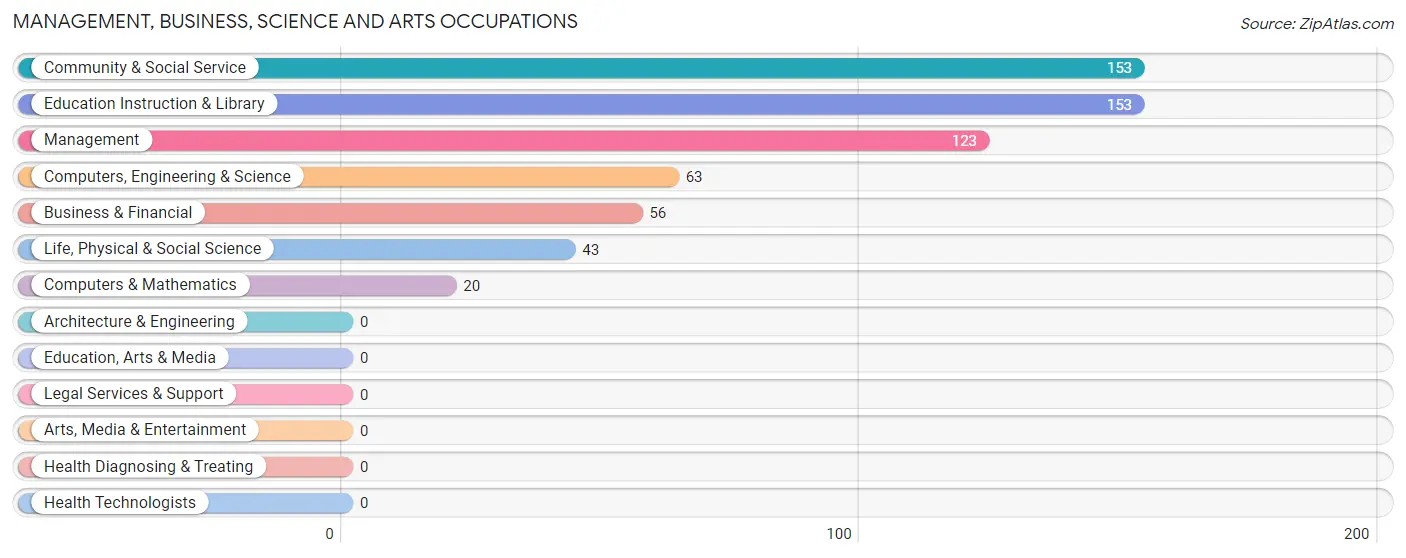
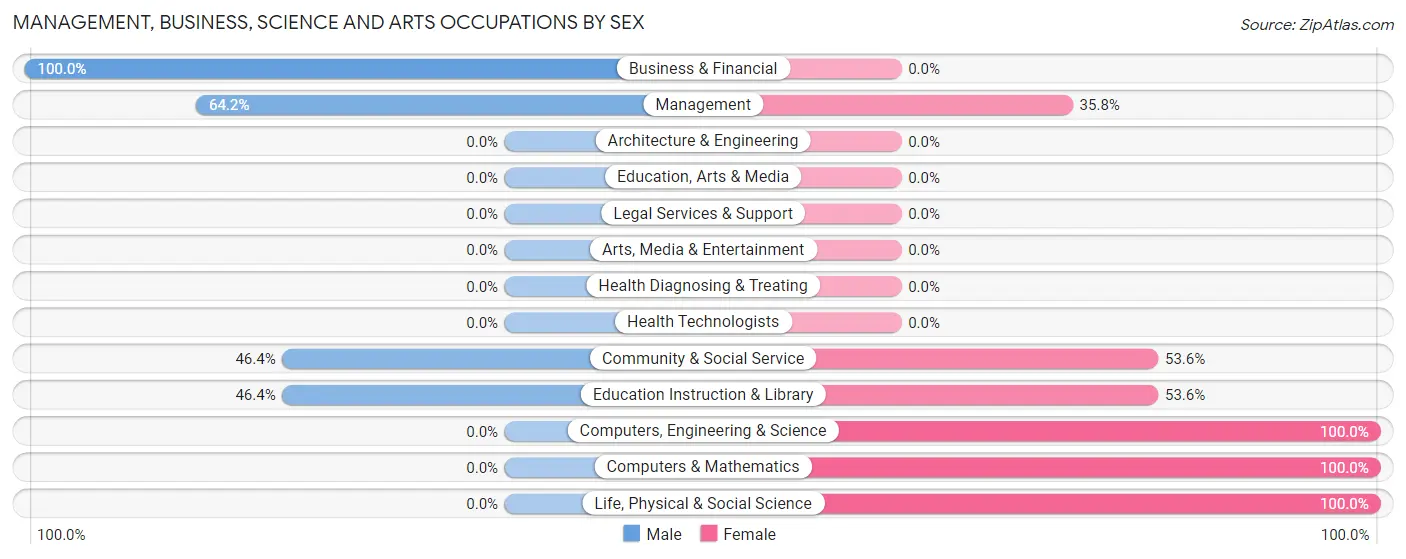
The most common Management, Business, Science and Arts occupations in Riverside are Community & Social Service (153 | 17.9%), Education Instruction & Library (153 | 17.9%), Management (123 | 14.4%), Computers, Engineering & Science (63 | 7.4%), and Business & Financial (56 | 6.6%).
Management, Business, Science and Arts Occupations by Sex
Within the Management, Business, Science and Arts occupations in Riverside, the most male-oriented occupations are Business & Financial (100.0%), Management (64.2%), and Community & Social Service (46.4%), while the most female-oriented occupations are Computers, Engineering & Science (100.0%), Computers & Mathematics (100.0%), and Life, Physical & Social Science (100.0%).
| Occupation | Male | Female |
| Management | 79 (64.2%) | 44 (35.8%) |
| Business & Financial | 56 (100.0%) | 0 (0.0%) |
| Computers, Engineering & Science | 0 (0.0%) | 63 (100.0%) |
| Computers & Mathematics | 0 (0.0%) | 20 (100.0%) |
| Architecture & Engineering | 0 (0.0%) | 0 (0.0%) |
| Life, Physical & Social Science | 0 (0.0%) | 43 (100.0%) |
| Community & Social Service | 71 (46.4%) | 82 (53.6%) |
| Education, Arts & Media | 0 (0.0%) | 0 (0.0%) |
| Legal Services & Support | 0 (0.0%) | 0 (0.0%) |
| Education Instruction & Library | 71 (46.4%) | 82 (53.6%) |
| Arts, Media & Entertainment | 0 (0.0%) | 0 (0.0%) |
| Health Diagnosing & Treating | 0 (0.0%) | 0 (0.0%) |
| Health Technologists | 0 (0.0%) | 0 (0.0%) |
| Total (Category) | 206 (52.1%) | 189 (47.8%) |
| Total (Overall) | 520 (60.8%) | 335 (39.2%) |
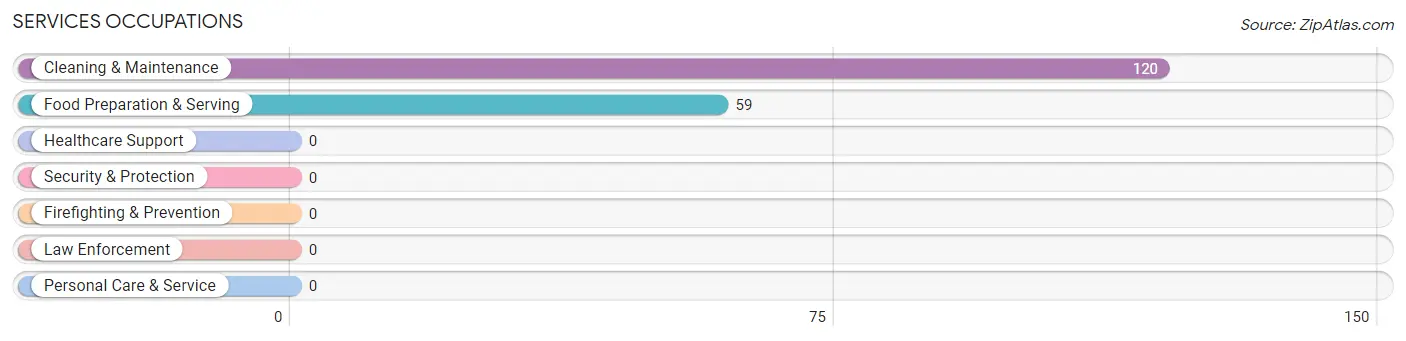
Services Occupations
The most common Services occupations in Riverside are Cleaning & Maintenance (120 | 14.0%), and Food Preparation & Serving (59 | 6.9%).
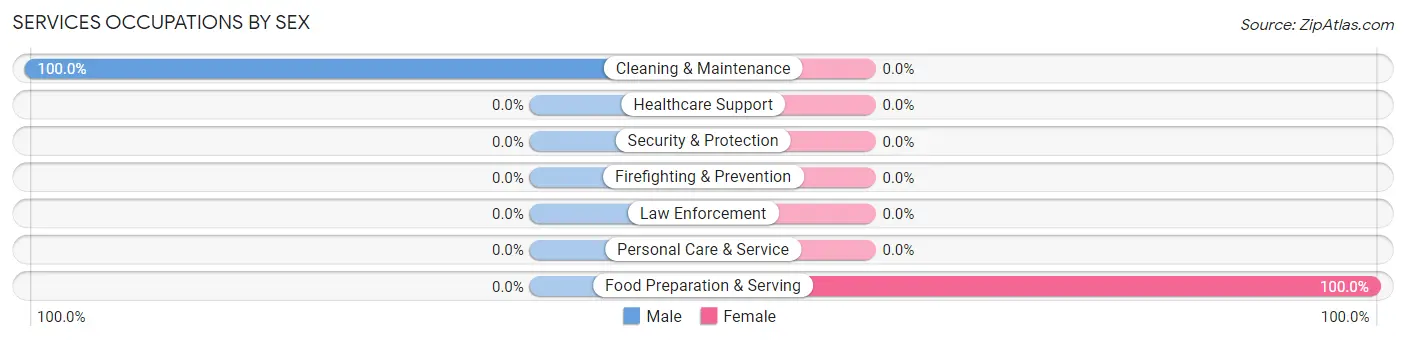
Services Occupations by Sex
| Occupation | Male | Female |
| Healthcare Support | 0 (0.0%) | 0 (0.0%) |
| Security & Protection | 0 (0.0%) | 0 (0.0%) |
| Firefighting & Prevention | 0 (0.0%) | 0 (0.0%) |
| Law Enforcement | 0 (0.0%) | 0 (0.0%) |
| Food Preparation & Serving | 0 (0.0%) | 59 (100.0%) |
| Cleaning & Maintenance | 120 (100.0%) | 0 (0.0%) |
| Personal Care & Service | 0 (0.0%) | 0 (0.0%) |
| Total (Category) | 120 (67.0%) | 59 (33.0%) |
| Total (Overall) | 520 (60.8%) | 335 (39.2%) |
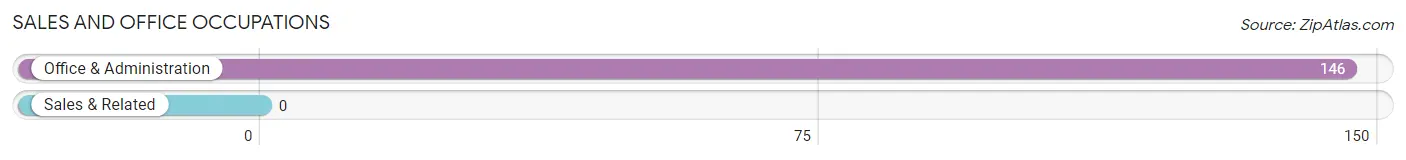
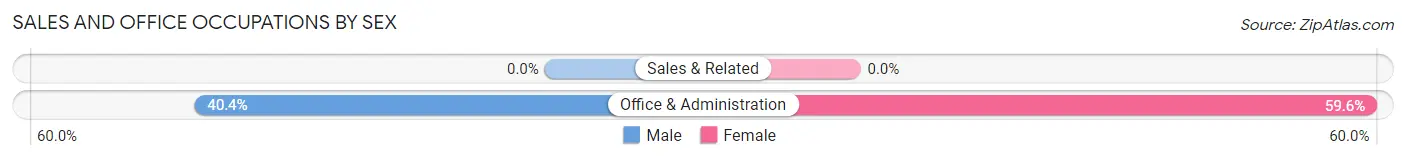
Sales and Office Occupations
The most common Sales and Office occupations in Riverside are , and Office & Administration (146 | 17.1%).
Sales and Office Occupations by Sex
| Occupation | Male | Female |
| Sales & Related | 0 (0.0%) | 0 (0.0%) |
| Office & Administration | 59 (40.4%) | 87 (59.6%) |
| Total (Category) | 59 (40.4%) | 87 (59.6%) |
| Total (Overall) | 520 (60.8%) | 335 (39.2%) |
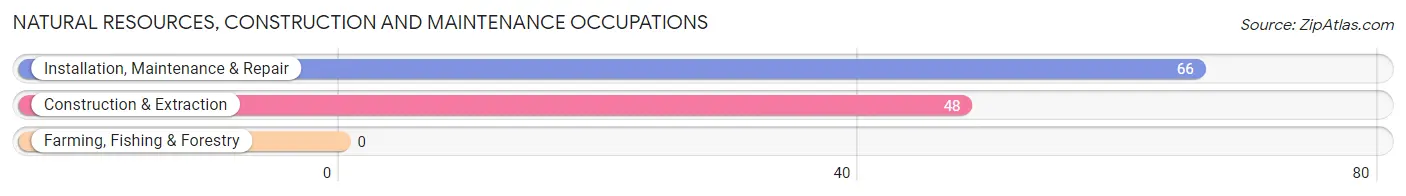
Natural Resources, Construction and Maintenance Occupations
The most common Natural Resources, Construction and Maintenance occupations in Riverside are Installation, Maintenance & Repair (66 | 7.7%), and Construction & Extraction (48 | 5.6%).
Natural Resources, Construction and Maintenance Occupations by Sex
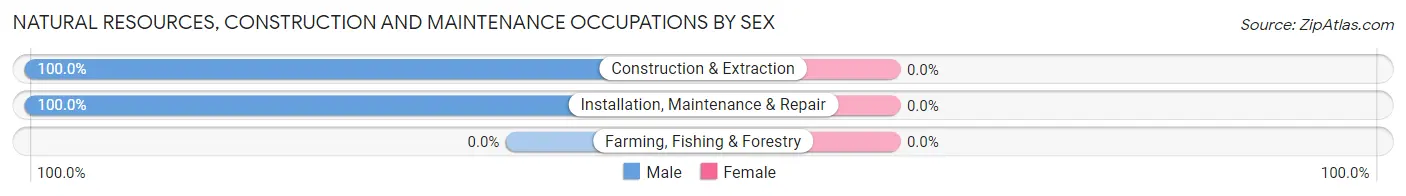
| Occupation | Male | Female |
| Farming, Fishing & Forestry | 0 (0.0%) | 0 (0.0%) |
| Construction & Extraction | 48 (100.0%) | 0 (0.0%) |
| Installation, Maintenance & Repair | 66 (100.0%) | 0 (0.0%) |
| Total (Category) | 114 (100.0%) | 0 (0.0%) |
| Total (Overall) | 520 (60.8%) | 335 (39.2%) |
Production, Transportation and Moving Occupations
The most common Production, Transportation and Moving occupations in Riverside are , and Transportation (21 | 2.5%).
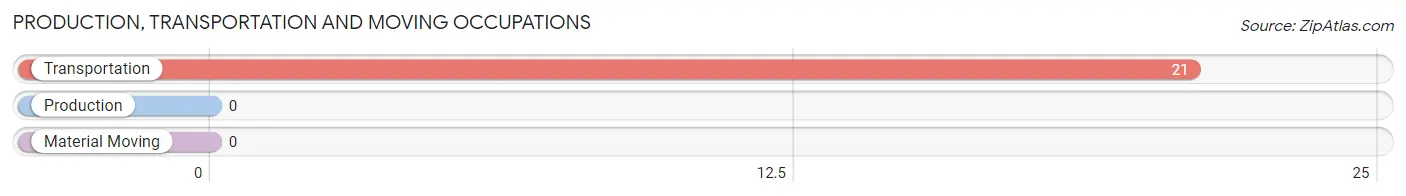
Production, Transportation and Moving Occupations by Sex
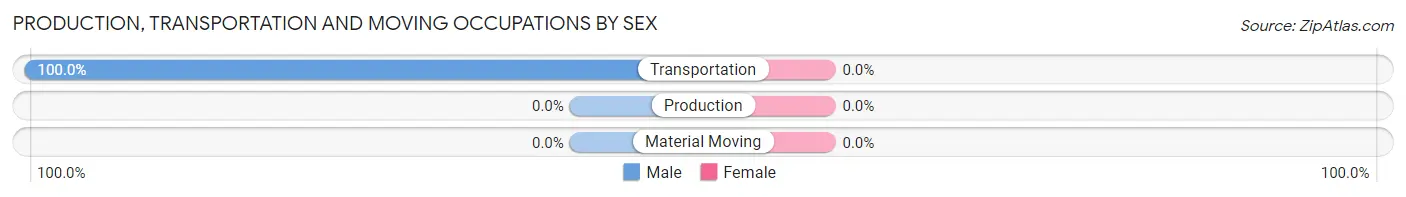
| Occupation | Male | Female |
| Production | 0 (0.0%) | 0 (0.0%) |
| Transportation | 21 (100.0%) | 0 (0.0%) |
| Material Moving | 0 (0.0%) | 0 (0.0%) |
| Total (Category) | 21 (100.0%) | 0 (0.0%) |
| Total (Overall) | 520 (60.8%) | 335 (39.2%) |
Employment Industries by Sex in Riverside
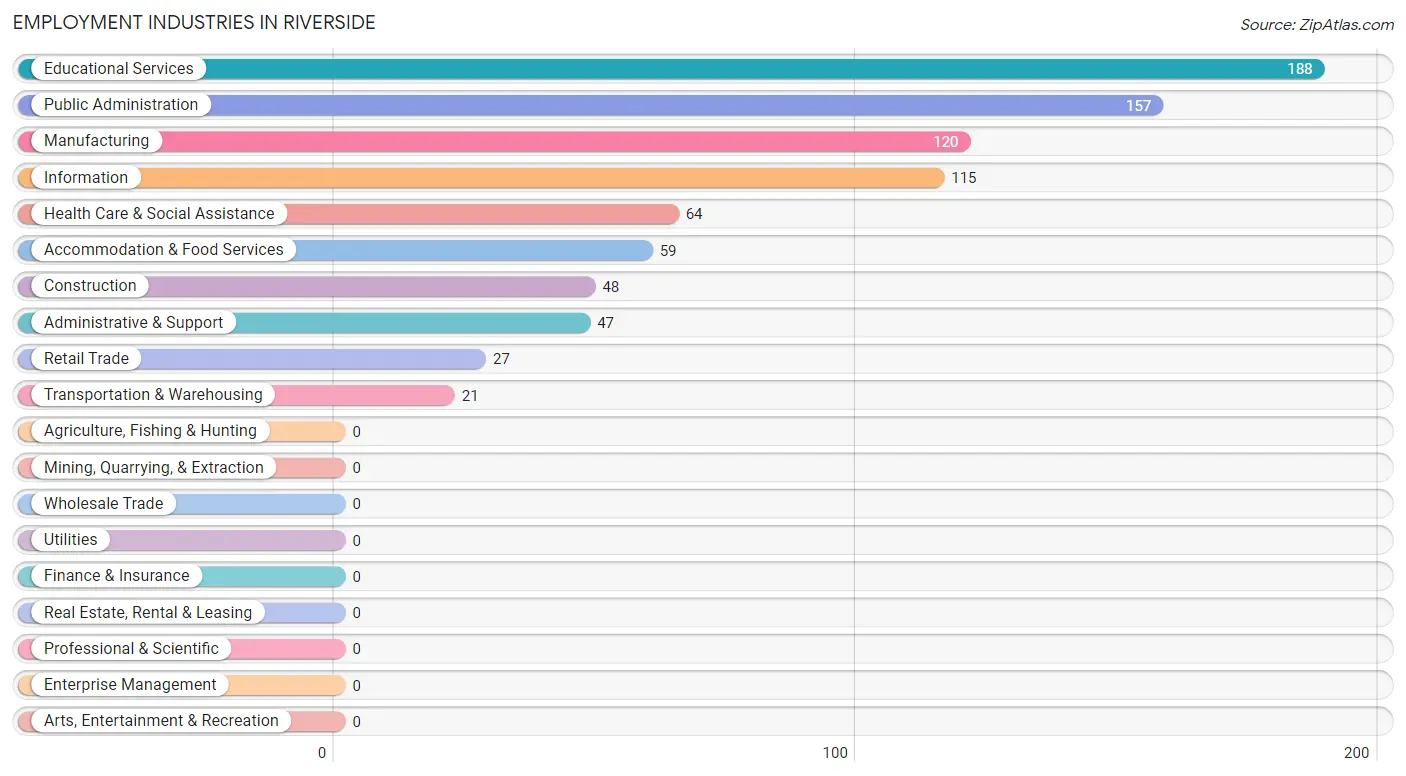
Employment Industries in Riverside
The major employment industries in Riverside include Educational Services (188 | 22.0%), Public Administration (157 | 18.4%), Manufacturing (120 | 14.0%), Information (115 | 13.5%), and Health Care & Social Assistance (64 | 7.5%).
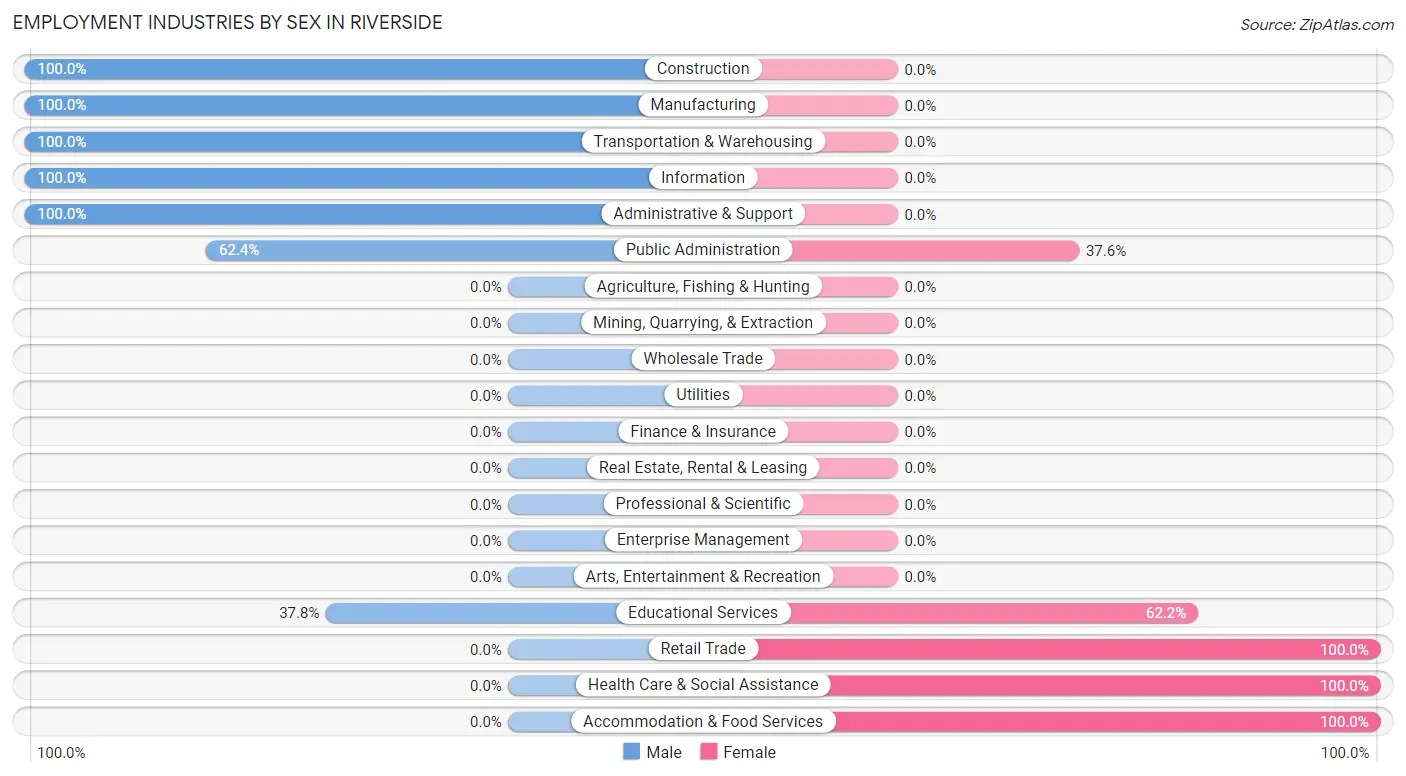
Employment Industries by Sex in Riverside
The Riverside industries that see more men than women are Construction (100.0%), Manufacturing (100.0%), and Transportation & Warehousing (100.0%), whereas the industries that tend to have a higher number of women are Retail Trade (100.0%), Health Care & Social Assistance (100.0%), and Accommodation & Food Services (100.0%).
| Industry | Male | Female |
| Agriculture, Fishing & Hunting | 0 (0.0%) | 0 (0.0%) |
| Mining, Quarrying, & Extraction | 0 (0.0%) | 0 (0.0%) |
| Construction | 48 (100.0%) | 0 (0.0%) |
| Manufacturing | 120 (100.0%) | 0 (0.0%) |
| Wholesale Trade | 0 (0.0%) | 0 (0.0%) |
| Retail Trade | 0 (0.0%) | 27 (100.0%) |
| Transportation & Warehousing | 21 (100.0%) | 0 (0.0%) |
| Utilities | 0 (0.0%) | 0 (0.0%) |
| Information | 115 (100.0%) | 0 (0.0%) |
| Finance & Insurance | 0 (0.0%) | 0 (0.0%) |
| Real Estate, Rental & Leasing | 0 (0.0%) | 0 (0.0%) |
| Professional & Scientific | 0 (0.0%) | 0 (0.0%) |
| Enterprise Management | 0 (0.0%) | 0 (0.0%) |
| Administrative & Support | 47 (100.0%) | 0 (0.0%) |
| Educational Services | 71 (37.8%) | 117 (62.2%) |
| Health Care & Social Assistance | 0 (0.0%) | 64 (100.0%) |
| Arts, Entertainment & Recreation | 0 (0.0%) | 0 (0.0%) |
| Accommodation & Food Services | 0 (0.0%) | 59 (100.0%) |
| Public Administration | 98 (62.4%) | 59 (37.6%) |
| Total | 520 (60.8%) | 335 (39.2%) |
Education in Riverside
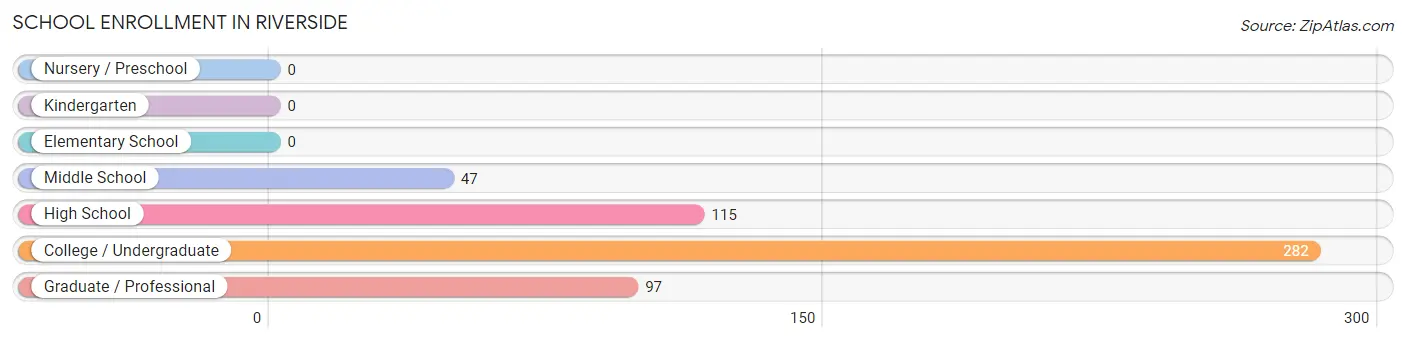
School Enrollment in Riverside
The most common levels of schooling among the 541 students in Riverside are college / undergraduate (282 | 52.1%), high school (115 | 21.3%), and graduate / professional (97 | 17.9%).
| School Level | # Students | % Students |
| Nursery / Preschool | 0 | 0.0% |
| Kindergarten | 0 | 0.0% |
| Elementary School | 0 | 0.0% |
| Middle School | 47 | 8.7% |
| High School | 115 | 21.3% |
| College / Undergraduate | 282 | 52.1% |
| Graduate / Professional | 97 | 17.9% |
| Total | 541 | 100.0% |
School Enrollment by Age by Funding Source in Riverside
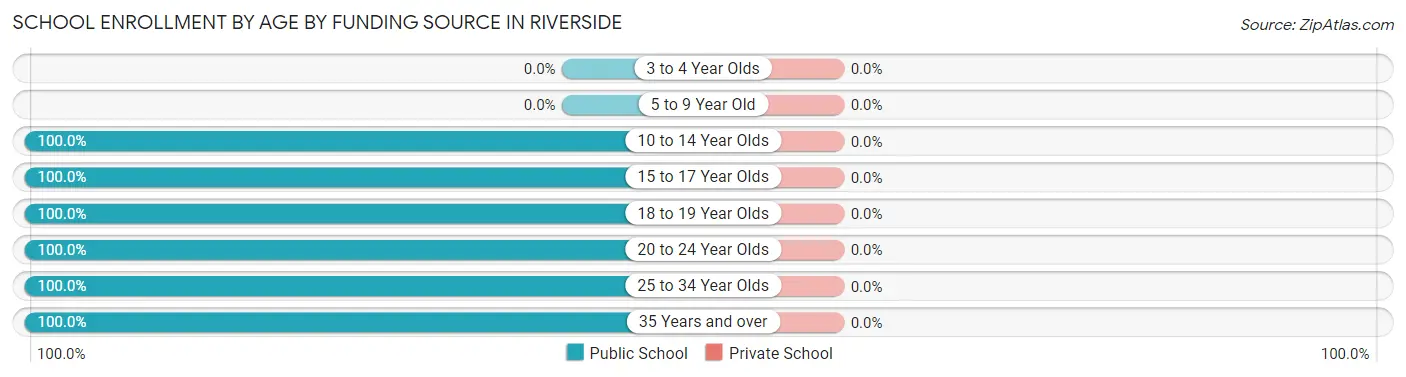
| Age Bracket | Public School | Private School |
| 3 to 4 Year Olds | 0 (0.0%) | 0 (0.0%) |
| 5 to 9 Year Old | 0 (0.0%) | 0 (0.0%) |
| 10 to 14 Year Olds | 66 (100.0%) | 0 (0.0%) |
| 15 to 17 Year Olds | 96 (100.0%) | 0 (0.0%) |
| 18 to 19 Year Olds | 59 (100.0%) | 0 (0.0%) |
| 20 to 24 Year Olds | 94 (100.0%) | 0 (0.0%) |
| 25 to 34 Year Olds | 218 (100.0%) | 0 (0.0%) |
| 35 Years and over | 8 (100.0%) | 0 (0.0%) |
| Total | 541 (100.0%) | 0 (0.0%) |
Educational Attainment by Field of Study in Riverside
Liberal arts & history (194 | 28.8%), business (157 | 23.3%), literature & languages (71 | 10.5%), science & technology (62 | 9.2%), and education (54 | 8.0%) are the most common fields of study among 673 individuals in Riverside who have obtained a bachelor's degree or higher.
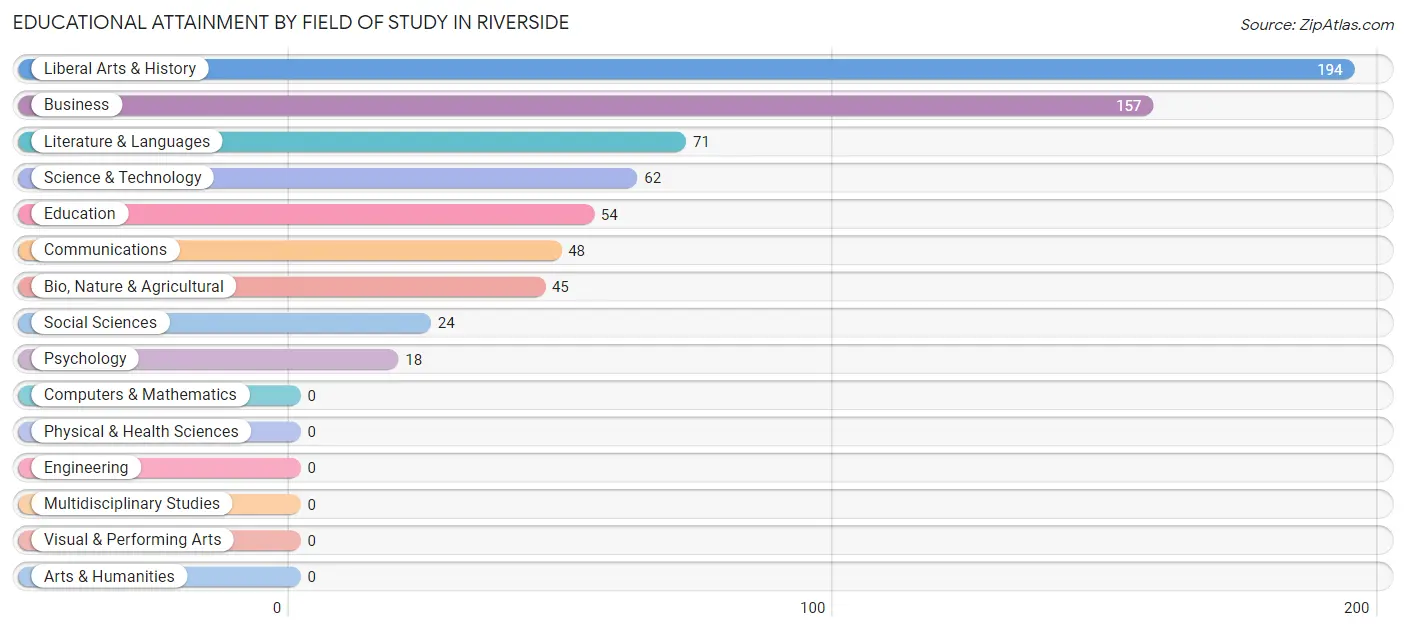
| Field of Study | # Graduates | % Graduates |
| Computers & Mathematics | 0 | 0.0% |
| Bio, Nature & Agricultural | 45 | 6.7% |
| Physical & Health Sciences | 0 | 0.0% |
| Psychology | 18 | 2.7% |
| Social Sciences | 24 | 3.6% |
| Engineering | 0 | 0.0% |
| Multidisciplinary Studies | 0 | 0.0% |
| Science & Technology | 62 | 9.2% |
| Business | 157 | 23.3% |
| Education | 54 | 8.0% |
| Literature & Languages | 71 | 10.5% |
| Liberal Arts & History | 194 | 28.8% |
| Visual & Performing Arts | 0 | 0.0% |
| Communications | 48 | 7.1% |
| Arts & Humanities | 0 | 0.0% |
| Total | 673 | 100.0% |
Transportation & Commute in Riverside
Vehicle Availability by Sex in Riverside
The most prevalent vehicle ownership categories in Riverside are males with 2 vehicles (215, accounting for 41.3%) and females with 2 vehicles (72, making up 64.2%).
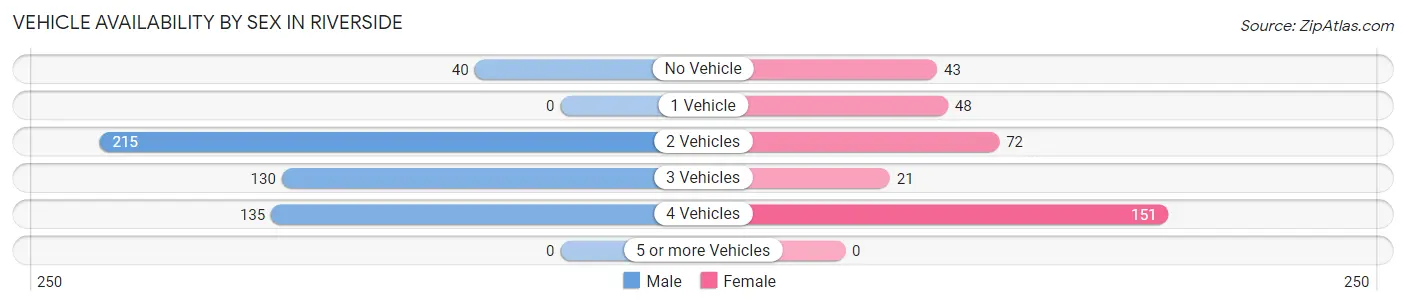
| Vehicles Available | Male | Female |
| No Vehicle | 40 (7.7%) | 43 (12.8%) |
| 1 Vehicle | 0 (0.0%) | 48 (14.3%) |
| 2 Vehicles | 215 (41.3%) | 72 (21.5%) |
| 3 Vehicles | 130 (25.0%) | 21 (6.3%) |
| 4 Vehicles | 135 (26.0%) | 151 (45.1%) |
| 5 or more Vehicles | 0 (0.0%) | 0 (0.0%) |
| Total | 520 (100.0%) | 335 (100.0%) |
Commute Time in Riverside
The most frequently occuring commute durations in Riverside are 10 to 14 minutes (156 commuters, 18.7%), 45 to 59 minutes (155 commuters, 18.6%), and 60 to 89 minutes (151 commuters, 18.1%).
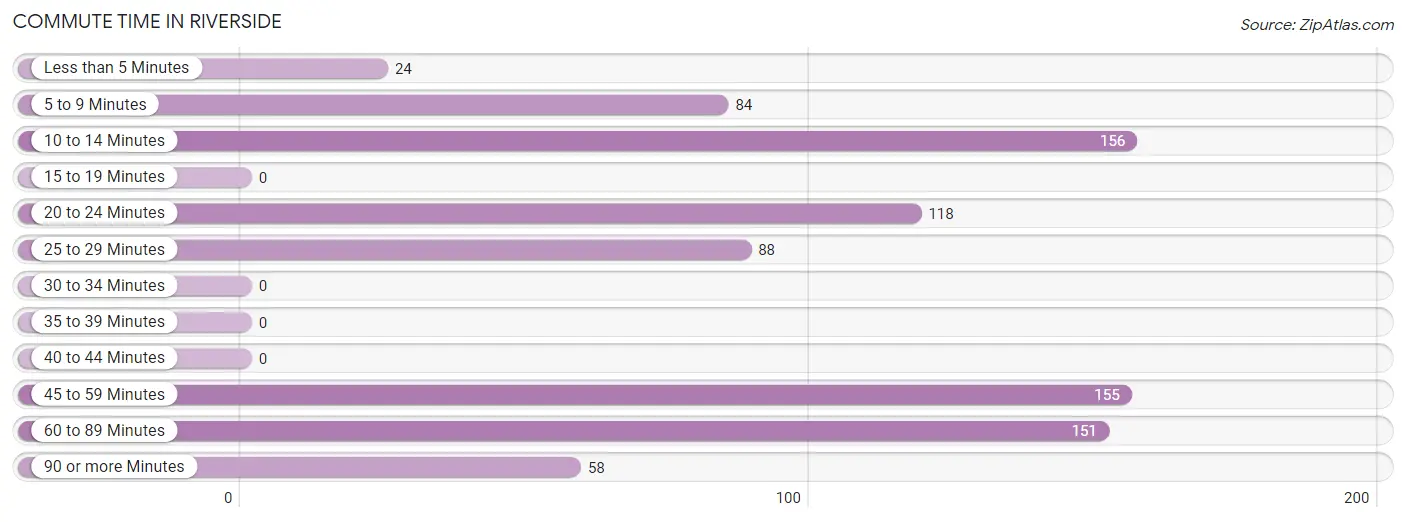
| Commute Time | # Commuters | % Commuters |
| Less than 5 Minutes | 24 | 2.9% |
| 5 to 9 Minutes | 84 | 10.1% |
| 10 to 14 Minutes | 156 | 18.7% |
| 15 to 19 Minutes | 0 | 0.0% |
| 20 to 24 Minutes | 118 | 14.1% |
| 25 to 29 Minutes | 88 | 10.5% |
| 30 to 34 Minutes | 0 | 0.0% |
| 35 to 39 Minutes | 0 | 0.0% |
| 40 to 44 Minutes | 0 | 0.0% |
| 45 to 59 Minutes | 155 | 18.6% |
| 60 to 89 Minutes | 151 | 18.1% |
| 90 or more Minutes | 58 | 7.0% |
Commute Time by Sex in Riverside
The most common commute times in Riverside are 45 to 59 minutes (120 commuters, 23.1%) for males and 10 to 14 minutes (156 commuters, 49.7%) for females.
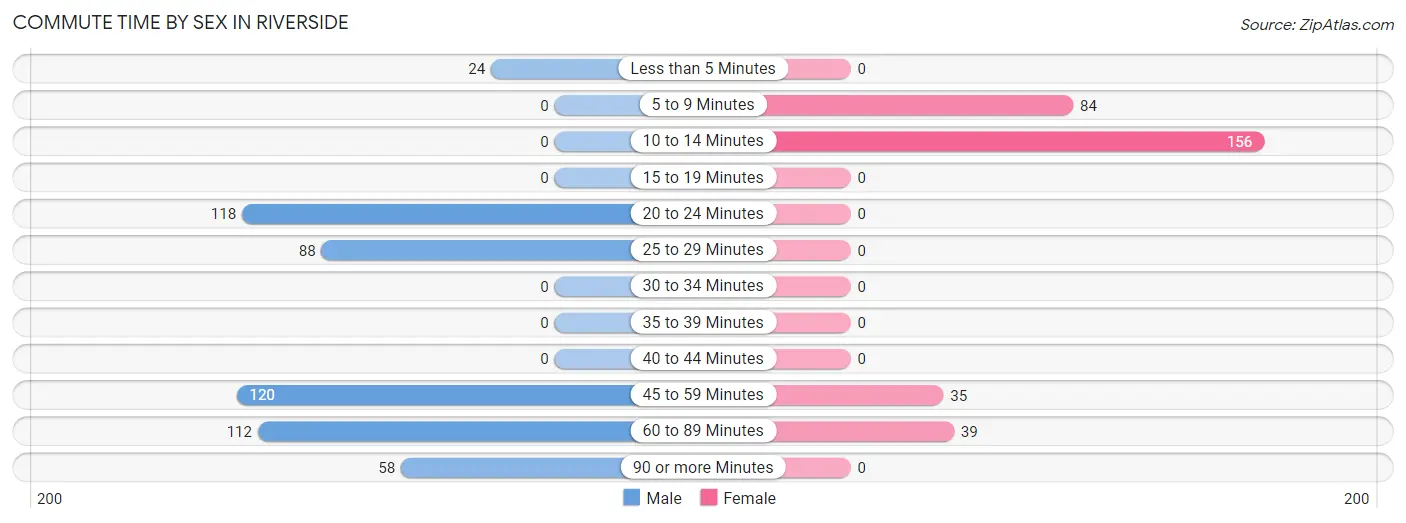
| Commute Time | Male | Female |
| Less than 5 Minutes | 24 (4.6%) | 0 (0.0%) |
| 5 to 9 Minutes | 0 (0.0%) | 84 (26.8%) |
| 10 to 14 Minutes | 0 (0.0%) | 156 (49.7%) |
| 15 to 19 Minutes | 0 (0.0%) | 0 (0.0%) |
| 20 to 24 Minutes | 118 (22.7%) | 0 (0.0%) |
| 25 to 29 Minutes | 88 (16.9%) | 0 (0.0%) |
| 30 to 34 Minutes | 0 (0.0%) | 0 (0.0%) |
| 35 to 39 Minutes | 0 (0.0%) | 0 (0.0%) |
| 40 to 44 Minutes | 0 (0.0%) | 0 (0.0%) |
| 45 to 59 Minutes | 120 (23.1%) | 35 (11.2%) |
| 60 to 89 Minutes | 112 (21.5%) | 39 (12.4%) |
| 90 or more Minutes | 58 (11.2%) | 0 (0.0%) |
Time of Departure to Work by Sex in Riverside
The most frequent times of departure to work in Riverside are 6:00 AM to 6:29 AM (161, 31.0%) for males and 7:00 AM to 7:29 AM (114, 36.3%) for females.
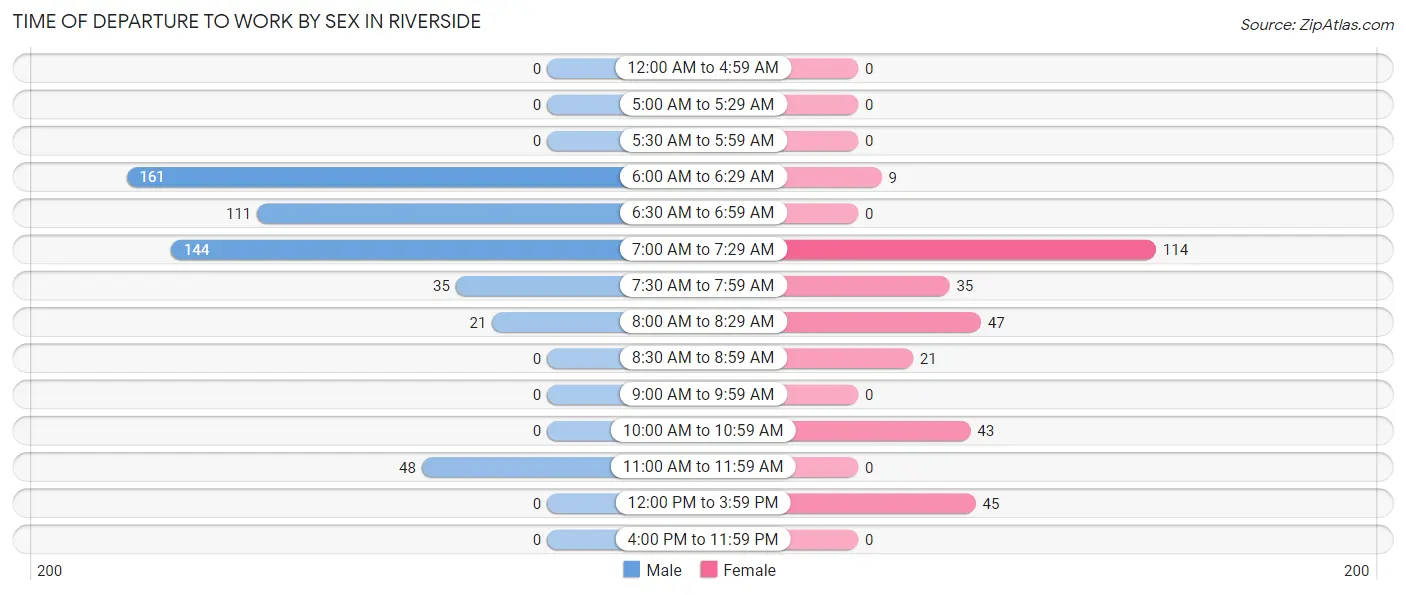
| Time of Departure | Male | Female |
| 12:00 AM to 4:59 AM | 0 (0.0%) | 0 (0.0%) |
| 5:00 AM to 5:29 AM | 0 (0.0%) | 0 (0.0%) |
| 5:30 AM to 5:59 AM | 0 (0.0%) | 0 (0.0%) |
| 6:00 AM to 6:29 AM | 161 (31.0%) | 9 (2.9%) |
| 6:30 AM to 6:59 AM | 111 (21.3%) | 0 (0.0%) |
| 7:00 AM to 7:29 AM | 144 (27.7%) | 114 (36.3%) |
| 7:30 AM to 7:59 AM | 35 (6.7%) | 35 (11.2%) |
| 8:00 AM to 8:29 AM | 21 (4.0%) | 47 (15.0%) |
| 8:30 AM to 8:59 AM | 0 (0.0%) | 21 (6.7%) |
| 9:00 AM to 9:59 AM | 0 (0.0%) | 0 (0.0%) |
| 10:00 AM to 10:59 AM | 0 (0.0%) | 43 (13.7%) |
| 11:00 AM to 11:59 AM | 48 (9.2%) | 0 (0.0%) |
| 12:00 PM to 3:59 PM | 0 (0.0%) | 45 (14.3%) |
| 4:00 PM to 11:59 PM | 0 (0.0%) | 0 (0.0%) |
| Total | 520 (100.0%) | 314 (100.0%) |
Housing Occupancy in Riverside
Occupancy by Ownership in Riverside
Of the total 666 dwellings in Riverside, owner-occupied units account for 623 (93.5%), while renter-occupied units make up 43 (6.5%).
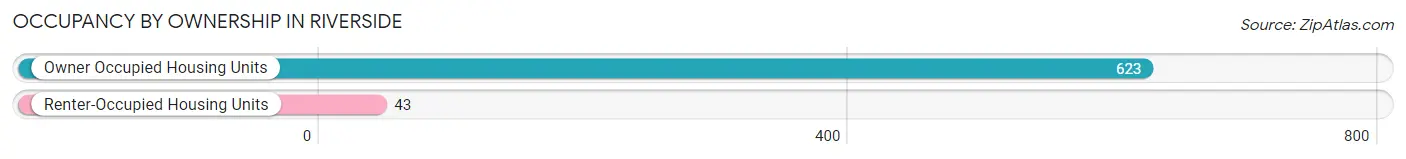
| Occupancy | # Housing Units | % Housing Units |
| Owner Occupied Housing Units | 623 | 93.5% |
| Renter-Occupied Housing Units | 43 | 6.5% |
| Total Occupied Housing Units | 666 | 100.0% |
Occupancy by Household Size in Riverside
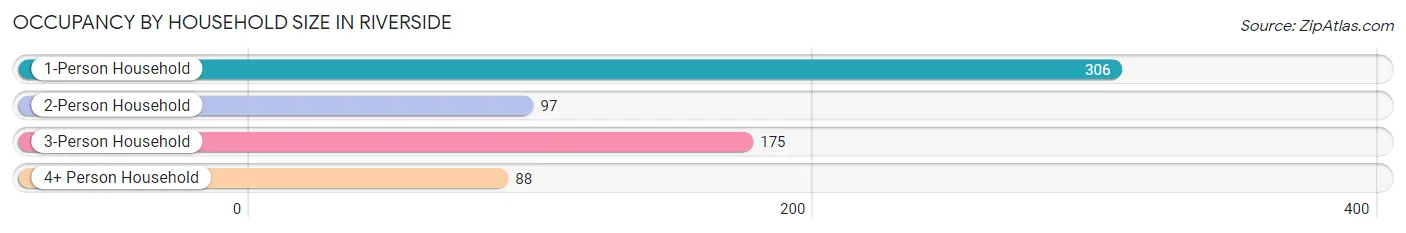
| Household Size | # Housing Units | % Housing Units |
| 1-Person Household | 306 | 46.0% |
| 2-Person Household | 97 | 14.6% |
| 3-Person Household | 175 | 26.3% |
| 4+ Person Household | 88 | 13.2% |
| Total Housing Units | 666 | 100.0% |
Occupancy by Ownership by Household Size in Riverside
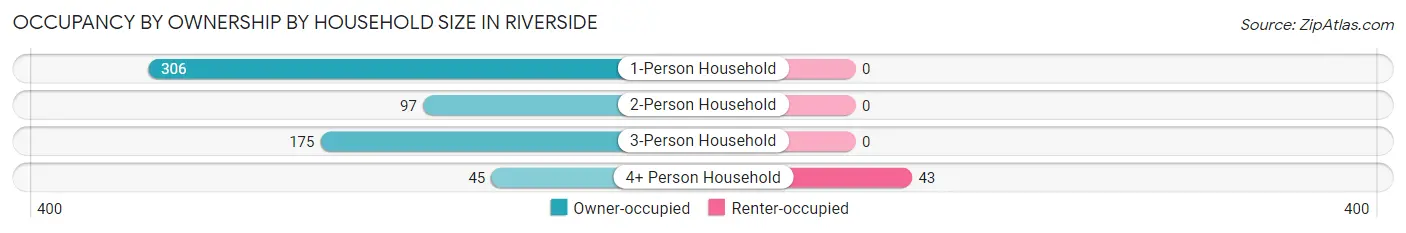
| Household Size | Owner-occupied | Renter-occupied |
| 1-Person Household | 306 (100.0%) | 0 (0.0%) |
| 2-Person Household | 97 (100.0%) | 0 (0.0%) |
| 3-Person Household | 175 (100.0%) | 0 (0.0%) |
| 4+ Person Household | 45 (51.1%) | 43 (48.9%) |
| Total Housing Units | 623 (93.5%) | 43 (6.5%) |
Occupancy by Educational Attainment in Riverside
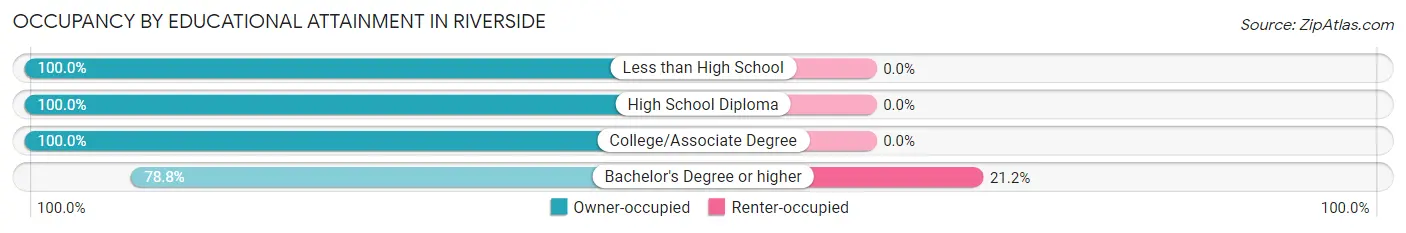
| Household Size | Owner-occupied | Renter-occupied |
| Less than High School | 140 (100.0%) | 0 (0.0%) |
| High School Diploma | 142 (100.0%) | 0 (0.0%) |
| College/Associate Degree | 181 (100.0%) | 0 (0.0%) |
| Bachelor's Degree or higher | 160 (78.8%) | 43 (21.2%) |
Occupancy by Age of Householder in Riverside
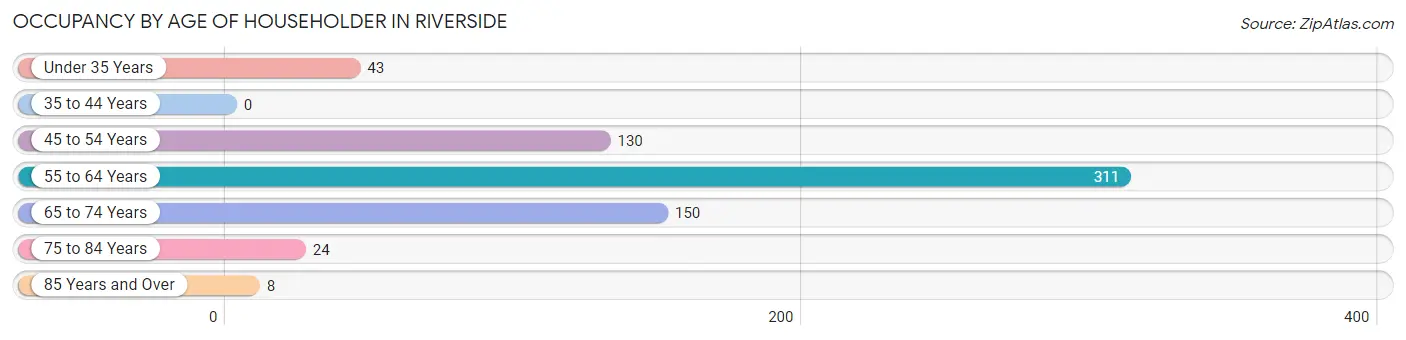
| Age Bracket | # Households | % Households |
| Under 35 Years | 43 | 6.5% |
| 35 to 44 Years | 0 | 0.0% |
| 45 to 54 Years | 130 | 19.5% |
| 55 to 64 Years | 311 | 46.7% |
| 65 to 74 Years | 150 | 22.5% |
| 75 to 84 Years | 24 | 3.6% |
| 85 Years and Over | 8 | 1.2% |
| Total | 666 | 100.0% |
Housing Finances in Riverside
Median Income by Occupancy in Riverside
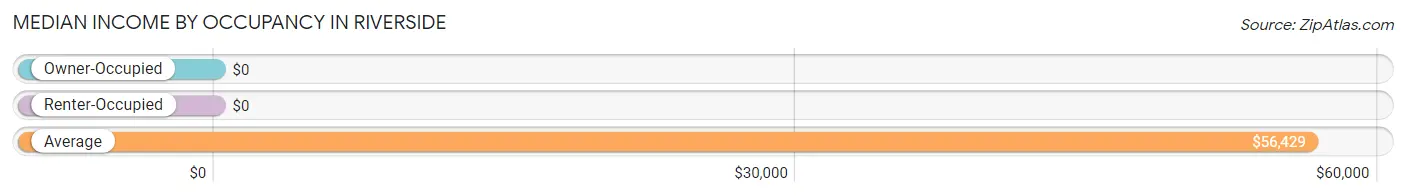
| Occupancy Type | # Households | Median Income |
| Owner-Occupied | 623 (93.5%) | $0 |
| Renter-Occupied | 43 (6.5%) | $0 |
| Average | 666 (100.0%) | $56,429 |
Occupancy by Householder Income Bracket in Riverside
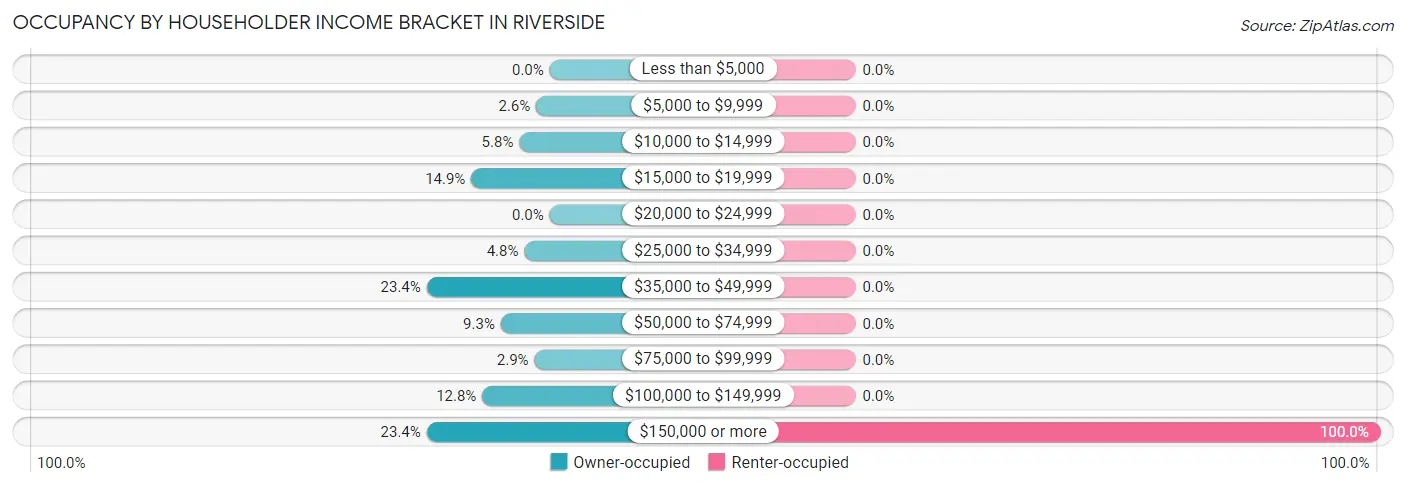
| Income Bracket | Owner-occupied | Renter-occupied |
| Less than $5,000 | 0 (0.0%) | 0 (0.0%) |
| $5,000 to $9,999 | 16 (2.6%) | 0 (0.0%) |
| $10,000 to $14,999 | 36 (5.8%) | 0 (0.0%) |
| $15,000 to $19,999 | 93 (14.9%) | 0 (0.0%) |
| $20,000 to $24,999 | 0 (0.0%) | 0 (0.0%) |
| $25,000 to $34,999 | 30 (4.8%) | 0 (0.0%) |
| $35,000 to $49,999 | 146 (23.4%) | 0 (0.0%) |
| $50,000 to $74,999 | 58 (9.3%) | 0 (0.0%) |
| $75,000 to $99,999 | 18 (2.9%) | 0 (0.0%) |
| $100,000 to $149,999 | 80 (12.8%) | 0 (0.0%) |
| $150,000 or more | 146 (23.4%) | 43 (100.0%) |
| Total | 623 (100.0%) | 43 (100.0%) |
Monthly Housing Cost Tiers in Riverside
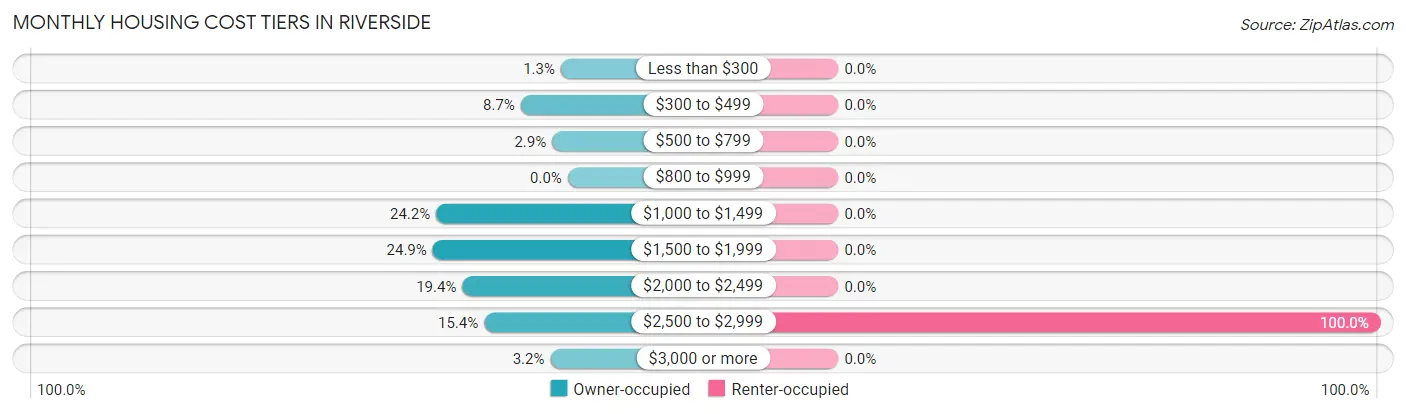
| Monthly Cost | Owner-occupied | Renter-occupied |
| Less than $300 | 8 (1.3%) | 0 (0.0%) |
| $300 to $499 | 54 (8.7%) | 0 (0.0%) |
| $500 to $799 | 18 (2.9%) | 0 (0.0%) |
| $800 to $999 | 0 (0.0%) | 0 (0.0%) |
| $1,000 to $1,499 | 151 (24.2%) | 0 (0.0%) |
| $1,500 to $1,999 | 155 (24.9%) | 0 (0.0%) |
| $2,000 to $2,499 | 121 (19.4%) | 0 (0.0%) |
| $2,500 to $2,999 | 96 (15.4%) | 43 (100.0%) |
| $3,000 or more | 20 (3.2%) | 0 (0.0%) |
| Total | 623 (100.0%) | 43 (100.0%) |
Physical Housing Characteristics in Riverside
Housing Structures in Riverside
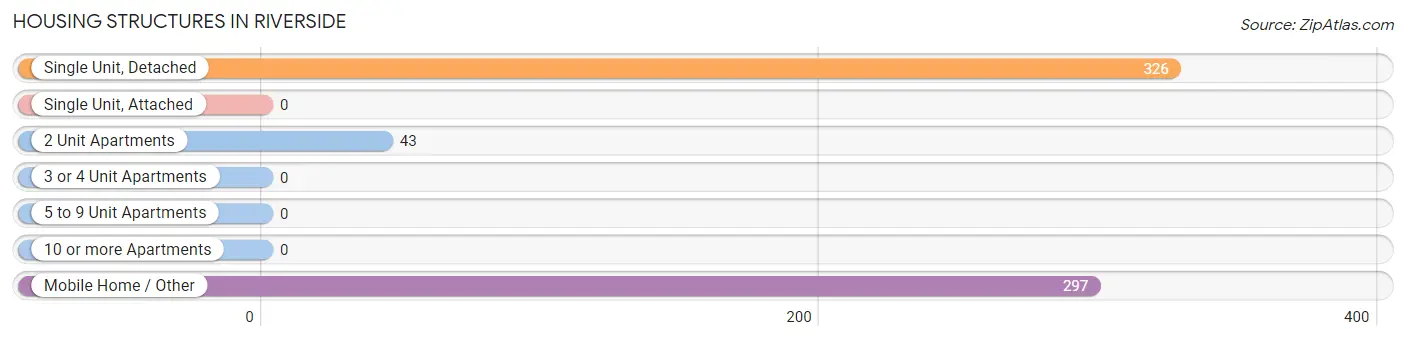
| Structure Type | # Housing Units | % Housing Units |
| Single Unit, Detached | 326 | 48.9% |
| Single Unit, Attached | 0 | 0.0% |
| 2 Unit Apartments | 43 | 6.5% |
| 3 or 4 Unit Apartments | 0 | 0.0% |
| 5 to 9 Unit Apartments | 0 | 0.0% |
| 10 or more Apartments | 0 | 0.0% |
| Mobile Home / Other | 297 | 44.6% |
| Total | 666 | 100.0% |
Housing Structures by Occupancy in Riverside
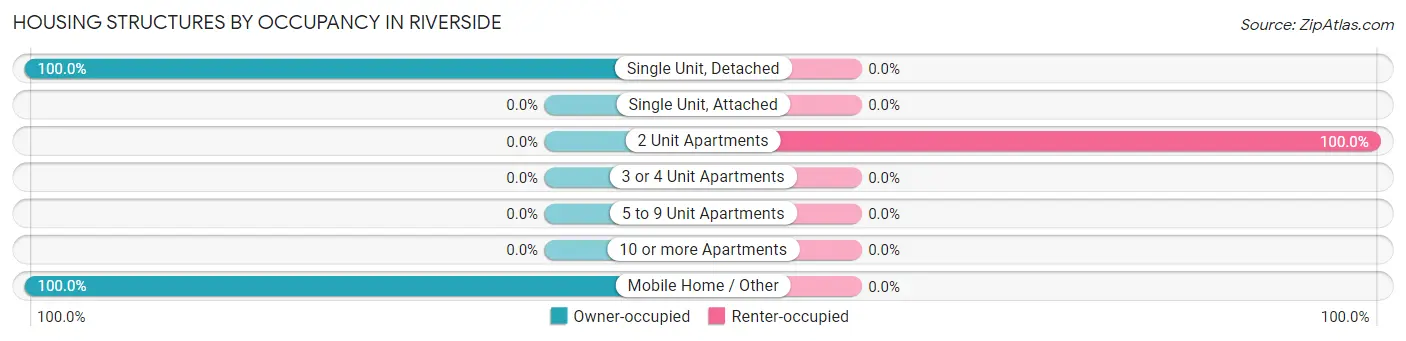
| Structure Type | Owner-occupied | Renter-occupied |
| Single Unit, Detached | 326 (100.0%) | 0 (0.0%) |
| Single Unit, Attached | 0 (0.0%) | 0 (0.0%) |
| 2 Unit Apartments | 0 (0.0%) | 43 (100.0%) |
| 3 or 4 Unit Apartments | 0 (0.0%) | 0 (0.0%) |
| 5 to 9 Unit Apartments | 0 (0.0%) | 0 (0.0%) |
| 10 or more Apartments | 0 (0.0%) | 0 (0.0%) |
| Mobile Home / Other | 297 (100.0%) | 0 (0.0%) |
| Total | 623 (93.5%) | 43 (6.5%) |
Housing Structures by Number of Rooms in Riverside
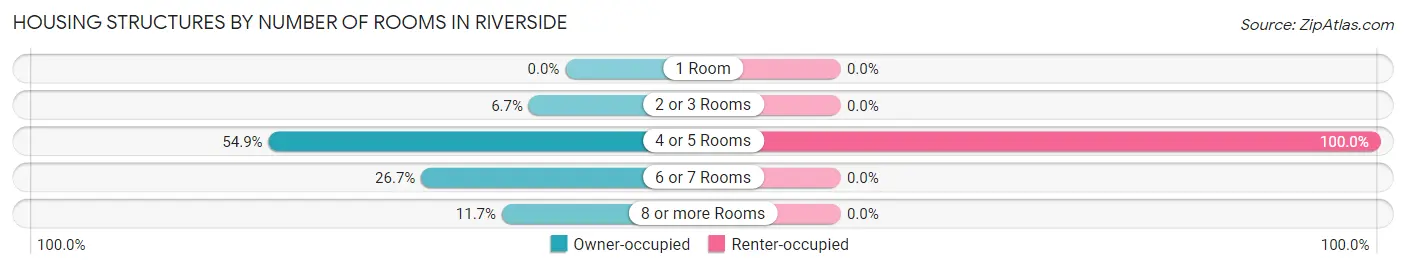
| Number of Rooms | Owner-occupied | Renter-occupied |
| 1 Room | 0 (0.0%) | 0 (0.0%) |
| 2 or 3 Rooms | 42 (6.7%) | 0 (0.0%) |
| 4 or 5 Rooms | 342 (54.9%) | 43 (100.0%) |
| 6 or 7 Rooms | 166 (26.7%) | 0 (0.0%) |
| 8 or more Rooms | 73 (11.7%) | 0 (0.0%) |
| Total | 623 (100.0%) | 43 (100.0%) |
Housing Structure by Heating Type in Riverside
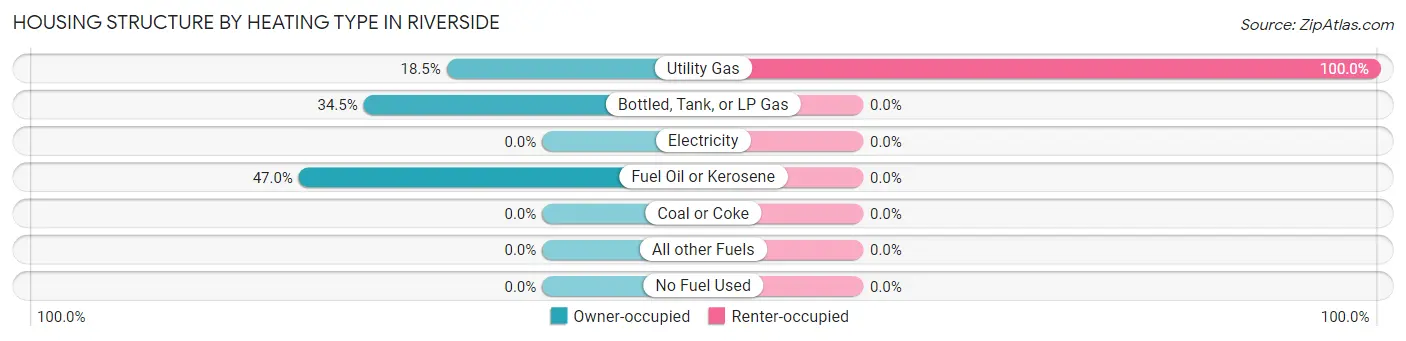
| Heating Type | Owner-occupied | Renter-occupied |
| Utility Gas | 115 (18.5%) | 43 (100.0%) |
| Bottled, Tank, or LP Gas | 215 (34.5%) | 0 (0.0%) |
| Electricity | 0 (0.0%) | 0 (0.0%) |
| Fuel Oil or Kerosene | 293 (47.0%) | 0 (0.0%) |
| Coal or Coke | 0 (0.0%) | 0 (0.0%) |
| All other Fuels | 0 (0.0%) | 0 (0.0%) |
| No Fuel Used | 0 (0.0%) | 0 (0.0%) |
| Total | 623 (100.0%) | 43 (100.0%) |
Household Vehicle Usage in Riverside
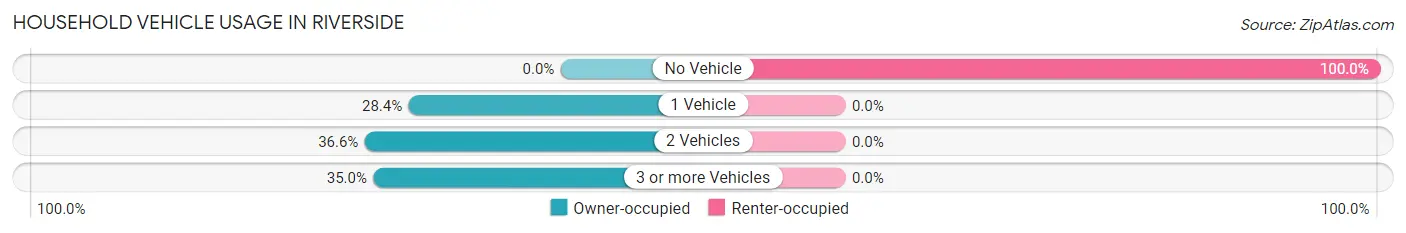
| Vehicles per Household | Owner-occupied | Renter-occupied |
| No Vehicle | 0 (0.0%) | 43 (100.0%) |
| 1 Vehicle | 177 (28.4%) | 0 (0.0%) |
| 2 Vehicles | 228 (36.6%) | 0 (0.0%) |
| 3 or more Vehicles | 218 (35.0%) | 0 (0.0%) |
| Total | 623 (100.0%) | 43 (100.0%) |
Real Estate & Mortgages in Riverside
Real Estate and Mortgage Overview in Riverside
| Characteristic | Without Mortgage | With Mortgage |
| Housing Units | 62 | 307 |
| Median Property Value | $94,400 | $467,400 |
| Median Household Income | $58,750 | $146 |
| Monthly Housing Costs | $456 | $20 |
| Real Estate Taxes | $1,893 | $0 |
Property Value by Mortgage Status in Riverside
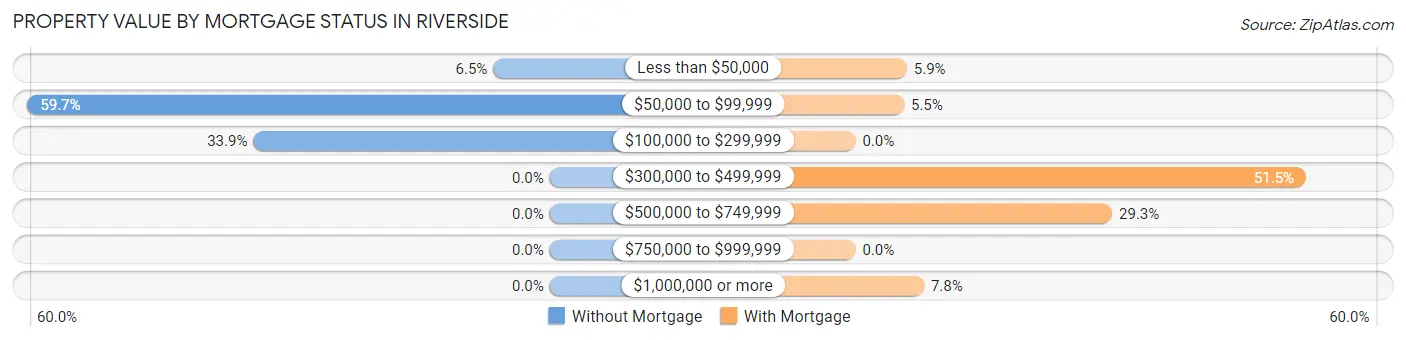
| Property Value | Without Mortgage | With Mortgage |
| Less than $50,000 | 4 (6.5%) | 18 (5.9%) |
| $50,000 to $99,999 | 37 (59.7%) | 17 (5.5%) |
| $100,000 to $299,999 | 21 (33.9%) | 0 (0.0%) |
| $300,000 to $499,999 | 0 (0.0%) | 158 (51.5%) |
| $500,000 to $749,999 | 0 (0.0%) | 90 (29.3%) |
| $750,000 to $999,999 | 0 (0.0%) | 0 (0.0%) |
| $1,000,000 or more | 0 (0.0%) | 24 (7.8%) |
| Total | 62 (100.0%) | 307 (100.0%) |
Household Income by Mortgage Status in Riverside
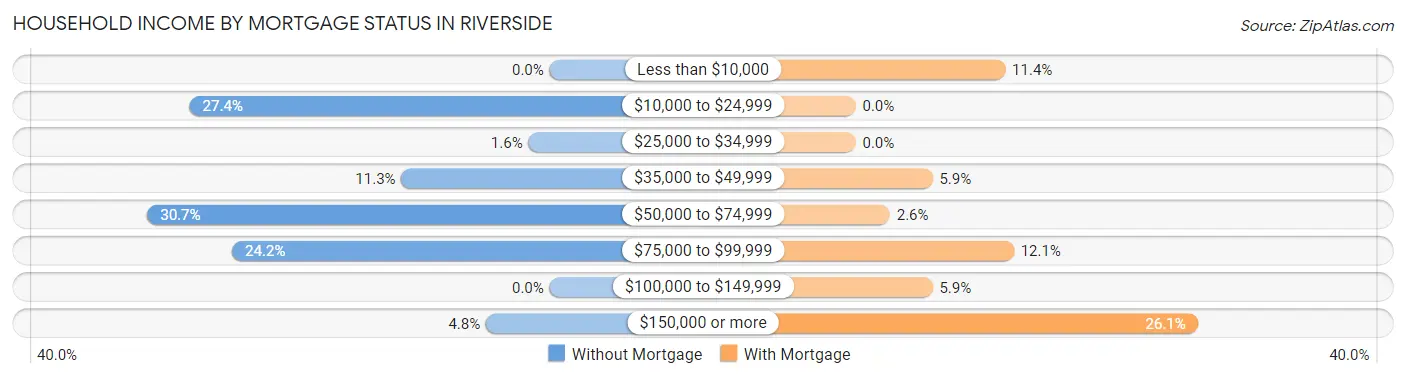
| Household Income | Without Mortgage | With Mortgage |
| Less than $10,000 | 0 (0.0%) | 35 (11.4%) |
| $10,000 to $24,999 | 17 (27.4%) | 0 (0.0%) |
| $25,000 to $34,999 | 1 (1.6%) | 0 (0.0%) |
| $35,000 to $49,999 | 7 (11.3%) | 18 (5.9%) |
| $50,000 to $74,999 | 19 (30.6%) | 8 (2.6%) |
| $75,000 to $99,999 | 15 (24.2%) | 37 (12.0%) |
| $100,000 to $149,999 | 0 (0.0%) | 18 (5.9%) |
| $150,000 or more | 3 (4.8%) | 80 (26.1%) |
| Total | 62 (100.0%) | 307 (100.0%) |
Property Value to Household Income Ratio in Riverside
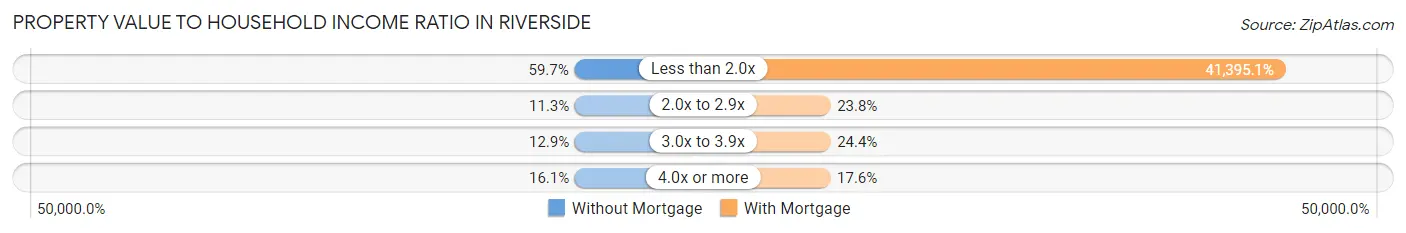
| Value-to-Income Ratio | Without Mortgage | With Mortgage |
| Less than 2.0x | 37 (59.7%) | 127,083 (41,395.1%) |
| 2.0x to 2.9x | 7 (11.3%) | 73 (23.8%) |
| 3.0x to 3.9x | 8 (12.9%) | 75 (24.4%) |
| 4.0x or more | 10 (16.1%) | 54 (17.6%) |
| Total | 62 (100.0%) | 307 (100.0%) |
Real Estate Taxes by Mortgage Status in Riverside
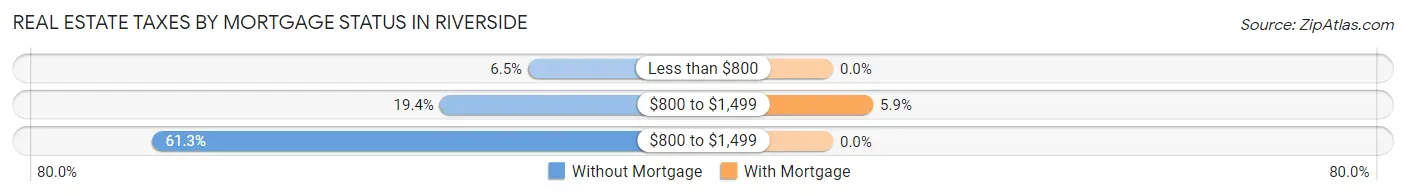
| Property Taxes | Without Mortgage | With Mortgage |
| Less than $800 | 4 (6.5%) | 0 (0.0%) |
| $800 to $1,499 | 12 (19.4%) | 18 (5.9%) |
| $800 to $1,499 | 38 (61.3%) | 0 (0.0%) |
| Total | 62 (100.0%) | 307 (100.0%) |
Health & Disability in Riverside
Health Insurance Coverage by Age in Riverside
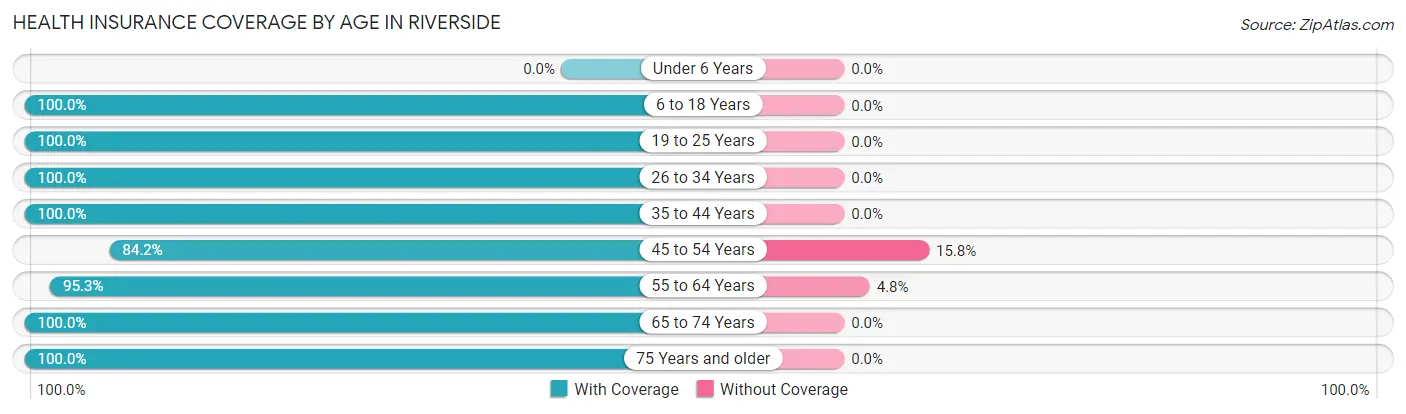
| Age Bracket | With Coverage | Without Coverage |
| Under 6 Years | 0 (0.0%) | 0 (0.0%) |
| 6 to 18 Years | 162 (100.0%) | 0 (0.0%) |
| 19 to 25 Years | 394 (100.0%) | 0 (0.0%) |
| 26 to 34 Years | 81 (100.0%) | 0 (0.0%) |
| 35 to 44 Years | 47 (100.0%) | 0 (0.0%) |
| 45 to 54 Years | 197 (84.2%) | 37 (15.8%) |
| 55 to 64 Years | 421 (95.3%) | 21 (4.8%) |
| 65 to 74 Years | 207 (100.0%) | 0 (0.0%) |
| 75 Years and older | 32 (100.0%) | 0 (0.0%) |
| Total | 1,541 (96.4%) | 58 (3.6%) |
Health Insurance Coverage by Citizenship Status in Riverside
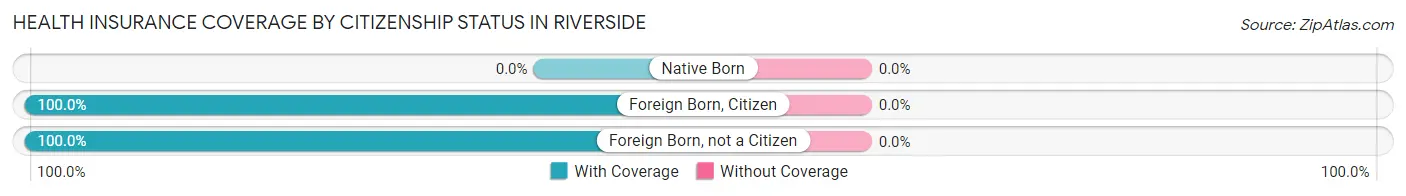
| Citizenship Status | With Coverage | Without Coverage |
| Native Born | 0 (0.0%) | 0 (0.0%) |
| Foreign Born, Citizen | 162 (100.0%) | 0 (0.0%) |
| Foreign Born, not a Citizen | 394 (100.0%) | 0 (0.0%) |
Health Insurance Coverage by Household Income in Riverside
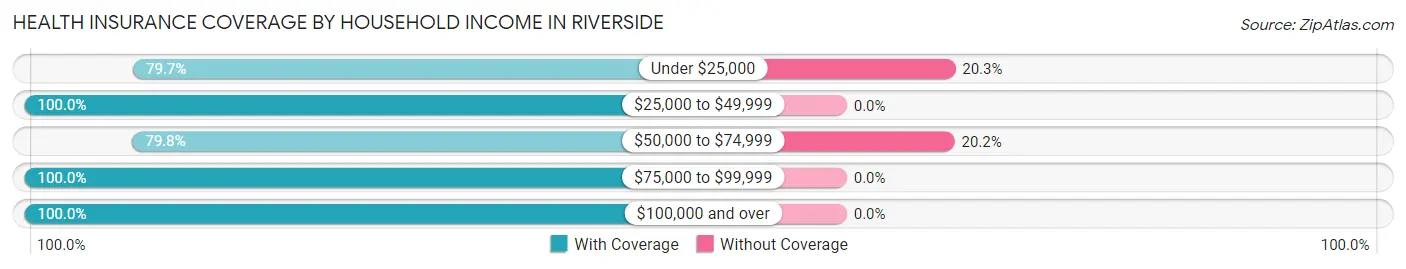
| Household Income | With Coverage | Without Coverage |
| Under $25,000 | 145 (79.7%) | 37 (20.3%) |
| $25,000 to $49,999 | 176 (100.0%) | 0 (0.0%) |
| $50,000 to $74,999 | 83 (79.8%) | 21 (20.2%) |
| $75,000 to $99,999 | 56 (100.0%) | 0 (0.0%) |
| $100,000 and over | 1,062 (100.0%) | 0 (0.0%) |
Public vs Private Health Insurance Coverage by Age in Riverside
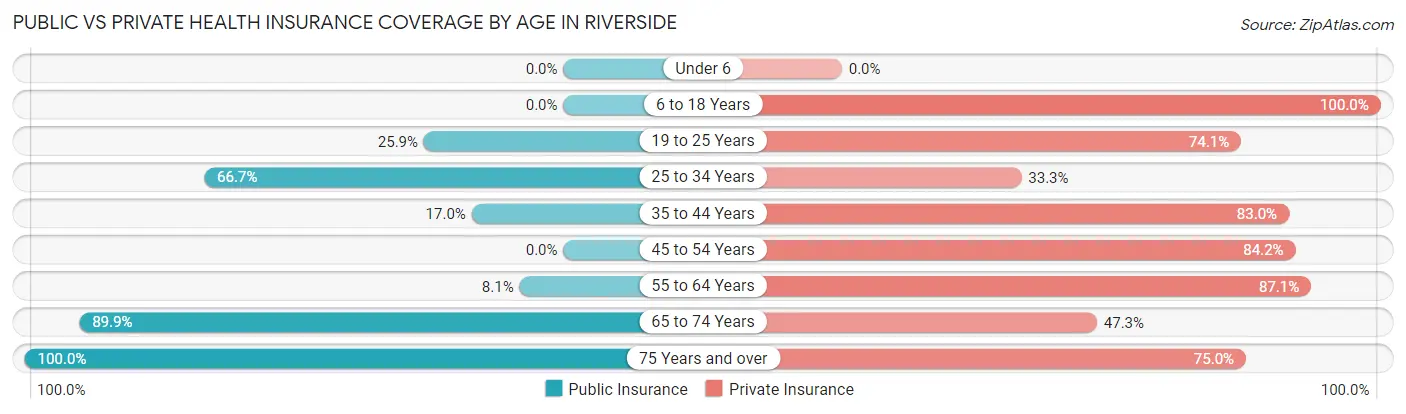
| Age Bracket | Public Insurance | Private Insurance |
| Under 6 | 0 (0.0%) | 0 (0.0%) |
| 6 to 18 Years | 0 (0.0%) | 162 (100.0%) |
| 19 to 25 Years | 102 (25.9%) | 292 (74.1%) |
| 25 to 34 Years | 54 (66.7%) | 27 (33.3%) |
| 35 to 44 Years | 8 (17.0%) | 39 (83.0%) |
| 45 to 54 Years | 0 (0.0%) | 197 (84.2%) |
| 55 to 64 Years | 36 (8.1%) | 385 (87.1%) |
| 65 to 74 Years | 186 (89.9%) | 98 (47.3%) |
| 75 Years and over | 32 (100.0%) | 24 (75.0%) |
| Total | 418 (26.1%) | 1,224 (76.5%) |
Disability Status by Sex by Age in Riverside
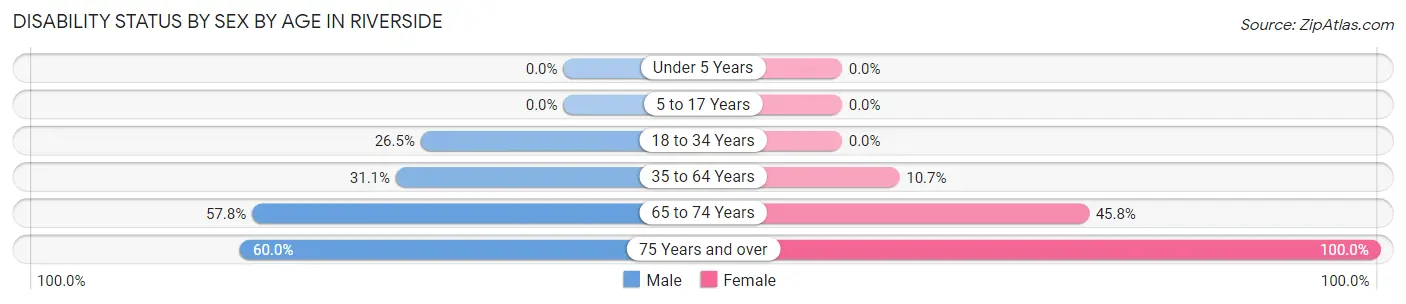
| Age Bracket | Male | Female |
| Under 5 Years | 0 (0.0%) | 0 (0.0%) |
| 5 to 17 Years | 0 (0.0%) | 0 (0.0%) |
| 18 to 34 Years | 54 (26.5%) | 0 (0.0%) |
| 35 to 64 Years | 120 (31.1%) | 36 (10.7%) |
| 65 to 74 Years | 78 (57.8%) | 33 (45.8%) |
| 75 Years and over | 12 (60.0%) | 12 (100.0%) |
Disability Class by Sex by Age in Riverside
Disability Class: Hearing Difficulty
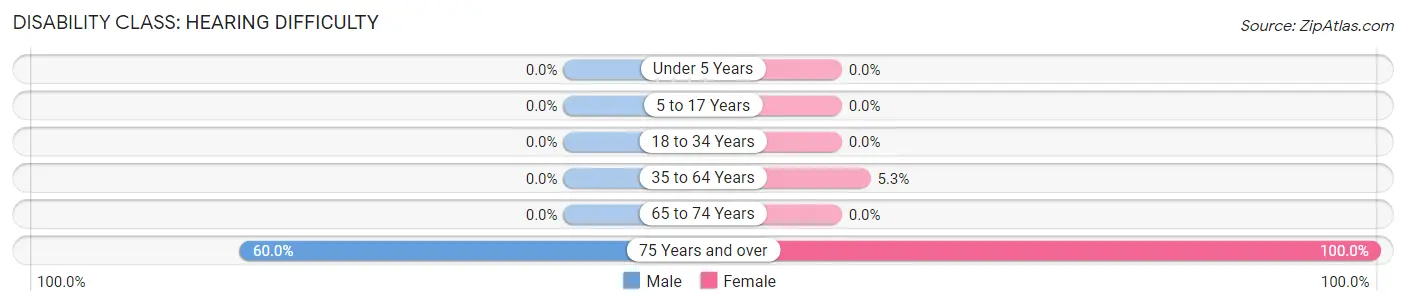
| Age Bracket | Male | Female |
| Under 5 Years | 0 (0.0%) | 0 (0.0%) |
| 5 to 17 Years | 0 (0.0%) | 0 (0.0%) |
| 18 to 34 Years | 0 (0.0%) | 0 (0.0%) |
| 35 to 64 Years | 0 (0.0%) | 18 (5.3%) |
| 65 to 74 Years | 0 (0.0%) | 0 (0.0%) |
| 75 Years and over | 12 (60.0%) | 12 (100.0%) |
Disability Class: Vision Difficulty
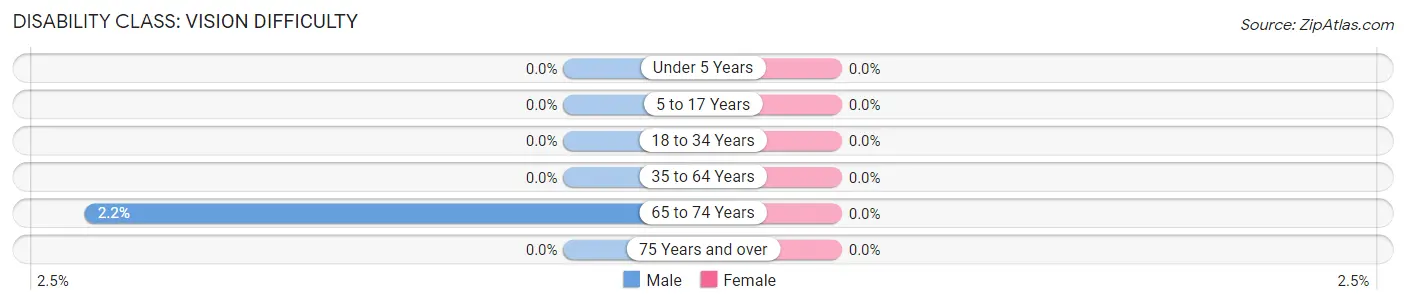
| Age Bracket | Male | Female |
| Under 5 Years | 0 (0.0%) | 0 (0.0%) |
| 5 to 17 Years | 0 (0.0%) | 0 (0.0%) |
| 18 to 34 Years | 0 (0.0%) | 0 (0.0%) |
| 35 to 64 Years | 0 (0.0%) | 0 (0.0%) |
| 65 to 74 Years | 3 (2.2%) | 0 (0.0%) |
| 75 Years and over | 0 (0.0%) | 0 (0.0%) |
Disability Class: Cognitive Difficulty
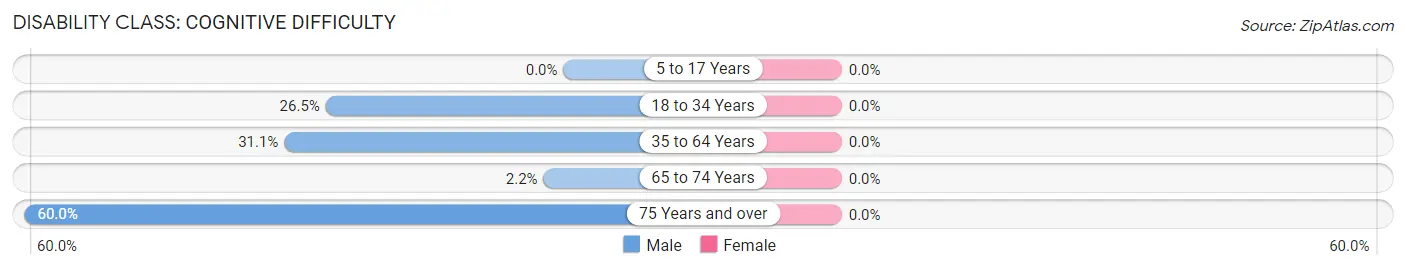
| Age Bracket | Male | Female |
| 5 to 17 Years | 0 (0.0%) | 0 (0.0%) |
| 18 to 34 Years | 54 (26.5%) | 0 (0.0%) |
| 35 to 64 Years | 120 (31.1%) | 0 (0.0%) |
| 65 to 74 Years | 3 (2.2%) | 0 (0.0%) |
| 75 Years and over | 12 (60.0%) | 0 (0.0%) |
Disability Class: Ambulatory Difficulty
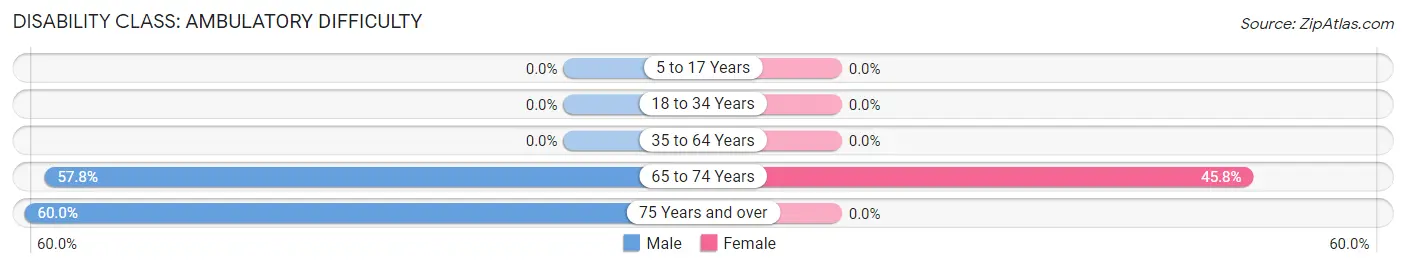
| Age Bracket | Male | Female |
| 5 to 17 Years | 0 (0.0%) | 0 (0.0%) |
| 18 to 34 Years | 0 (0.0%) | 0 (0.0%) |
| 35 to 64 Years | 0 (0.0%) | 0 (0.0%) |
| 65 to 74 Years | 78 (57.8%) | 33 (45.8%) |
| 75 Years and over | 12 (60.0%) | 0 (0.0%) |
Disability Class: Self-Care Difficulty
| Age Bracket | Male | Female |
| 5 to 17 Years | 0 (0.0%) | 0 (0.0%) |
| 18 to 34 Years | 0 (0.0%) | 0 (0.0%) |
| 35 to 64 Years | 0 (0.0%) | 0 (0.0%) |
| 65 to 74 Years | 3 (2.2%) | 0 (0.0%) |
| 75 Years and over | 0 (0.0%) | 0 (0.0%) |
Technology Access in Riverside
Computing Device Access in Riverside
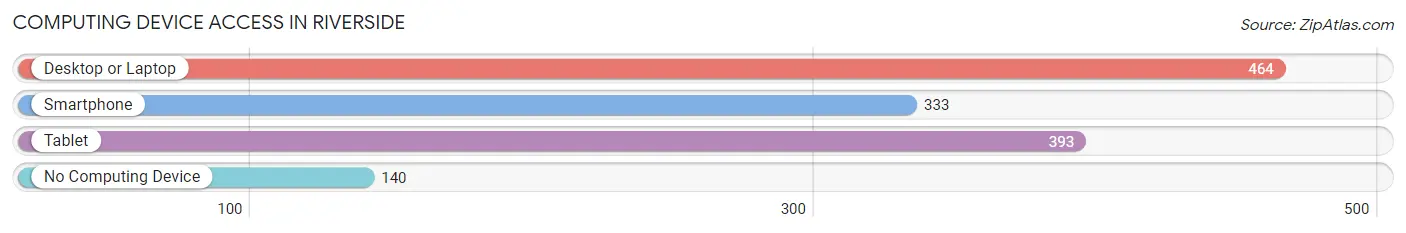
| Device Type | # Households | % Households |
| Desktop or Laptop | 464 | 69.7% |
| Smartphone | 333 | 50.0% |
| Tablet | 393 | 59.0% |
| No Computing Device | 140 | 21.0% |
| Total | 666 | 100.0% |
Internet Access in Riverside
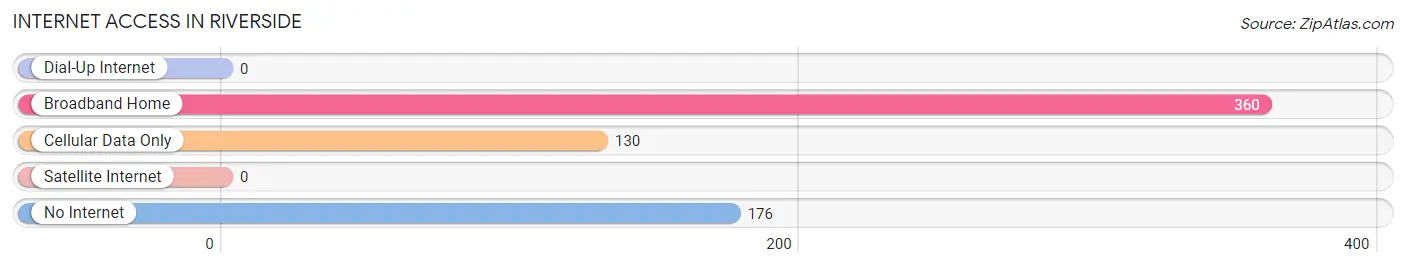
| Internet Type | # Households | % Households |
| Dial-Up Internet | 0 | 0.0% |
| Broadband Home | 360 | 54.0% |
| Cellular Data Only | 130 | 19.5% |
| Satellite Internet | 0 | 0.0% |
| No Internet | 176 | 26.4% |
| Total | 666 | 100.0% |
Riverside Summary
Riverside is a hamlet located in the Town of Greenburgh in Westchester County, New York. It is situated on the east bank of the Hudson River, about 25 miles north of New York City. The hamlet is bordered by the villages of Ardsley and Dobbs Ferry to the north, and the village of Hastings-on-Hudson to the south.
History
Riverside was originally part of the land purchased by Frederick Philipse in 1682. The area was known as “Philipsburg Manor” and was part of the original Philipse Patent. The area was settled in the late 1700s and was known as “Riverside” by the early 1800s. The hamlet was incorporated in 1872.
In the late 1800s, Riverside was a popular summer resort for wealthy New Yorkers. The area was known for its grand estates and mansions, many of which were built by prominent families such as the Astors, Vanderbilts, and Rockefellers.
In the early 1900s, Riverside began to develop into a residential community. The area was served by the New York Central Railroad, which provided easy access to New York City. The hamlet was also home to several large estates, including the Astor Estate, which was later converted into a public park.
Geography
Riverside is located in the Town of Greenburgh in Westchester County, New York. It is situated on the east bank of the Hudson River, about 25 miles north of New York City. The hamlet is bordered by the villages of Ardsley and Dobbs Ferry to the north, and the village of Hastings-on-Hudson to the south.
The area is characterized by rolling hills and wooded areas. The highest point in Riverside is the summit of the Astor Estate, which is approximately 300 feet above sea level. The hamlet is home to several parks, including the Astor Estate, which is now a public park.
Economy
Riverside is primarily a residential community, with most of its residents commuting to New York City for work. The hamlet is home to several small businesses, including restaurants, retail stores, and professional services.
The hamlet is also home to several large employers, including the Astor Estate, which is now a public park. The Astor Estate is a popular tourist destination and provides employment for many local residents.
Demographics
As of the 2010 census, Riverside had a population of 8,945. The population is predominantly white (86.3%), with a small percentage of African Americans (4.2%), Asians (3.7%), and Hispanics (2.7%). The median household income is $90,945, and the median home value is $817,500.
Riverside is a relatively affluent community, with a high percentage of college-educated residents. The hamlet is home to several private schools, including the prestigious Hackley School.
Conclusion
Riverside is a hamlet located in the Town of Greenburgh in Westchester County, New York. It is situated on the east bank of the Hudson River, about 25 miles north of New York City. The hamlet is bordered by the villages of Ardsley and Dobbs Ferry to the north, and the village of Hastings-on-Hudson to the south. Riverside was originally part of the land purchased by Frederick Philipse in 1682 and was known as “Philipsburg Manor”. The area was settled in the late 1700s and was known as “Riverside” by the early 1800s. In the late 1800s, Riverside was a popular summer resort for wealthy New Yorkers. The area is characterized by rolling hills and wooded areas, and is home to several parks, including the Astor Estate, which is now a public park. Riverside is primarily a residential community, with most of its residents commuting to New York City for work. The population is predominantly white, with a median household income of $90,945 and a median home value of $817,500. Riverside is a relatively affluent community, with a high percentage of college-educated residents.
Common Questions
What is Per Capita Income in Riverside?
Per Capita income in Riverside is $29,636.
What is the Median Family Income in Riverside?
Median Family Income in Riverside is $126,806.
What is the Median Household income in Riverside?
Median Household Income in Riverside is $56,429.
What is Income or Wage Gap in Riverside?
Income or Wage Gap in Riverside is 28.9%.
Women in Riverside earn 71.1 cents for every dollar earned by a man.
What is Inequality or Gini Index in Riverside?
Inequality or Gini Index in Riverside is 0.49.
What is the Total Population of Riverside?
Total Population of Riverside is 2,945.
What is the Total Male Population of Riverside?
Total Male Population of Riverside is 2,006.
What is the Total Female Population of Riverside?
Total Female Population of Riverside is 939.
What is the Ratio of Males per 100 Females in Riverside?
There are 213.63 Males per 100 Females in Riverside.
What is the Ratio of Females per 100 Males in Riverside?
There are 46.81 Females per 100 Males in Riverside.
What is the Median Population Age in Riverside?
Median Population Age in Riverside is 36.3 Years.
What is the Average Family Size in Riverside
Average Family Size in Riverside is 3.4 People.
What is the Average Household Size in Riverside
Average Household Size in Riverside is 2.4 People.
How Large is the Labor Force in Riverside?
There are 1,024 People in the Labor Forcein in Riverside.
What is the Percentage of People in the Labor Force in Riverside?
36.2% of People are in the Labor Force in Riverside.
What is the Unemployment Rate in Riverside?
Unemployment Rate in Riverside is 16.5%.