Bay Park, NY Map & Demographics
Bay Park Map
Bay Park Overview
$58,236
PER CAPITA INCOME
$106,250
AVG FAMILY INCOME
$100,972
AVG HOUSEHOLD INCOME
2.6%
WAGE / INCOME GAP [ % ]
97.4¢/ $1
WAGE / INCOME GAP [ $ ]
0.50
INEQUALITY / GINI INDEX
1,389
TOTAL POPULATION
556
MALE POPULATION
833
FEMALE POPULATION
66.75
MALES / 100 FEMALES
149.82
FEMALES / 100 MALES
46.4
MEDIAN AGE
3.2
AVG FAMILY SIZE
2.3
AVG HOUSEHOLD SIZE
666
LABOR FORCE [ PEOPLE ]
60.8%
PERCENT IN LABOR FORCE
6.6%
UNEMPLOYMENT RATE
Income in Bay Park
Income Overview in Bay Park
Per Capita Income in Bay Park is $58,236, while median incomes of families and households are $106,250 and $100,972 respectively.
| Characteristic | Number | Measure |
| Per Capita Income | 1,389 | $58,236 |
| Median Family Income | 348 | $106,250 |
| Mean Family Income | 348 | $154,304 |
| Median Household Income | 593 | $100,972 |
| Mean Household Income | 593 | $138,565 |
| Income Deficit | 348 | $0 |
| Wage / Income Gap (%) | 1,389 | 2.61% |
| Wage / Income Gap ($) | 1,389 | 97.39¢ per $1 |
| Gini / Inequality Index | 1,389 | 0.50 |
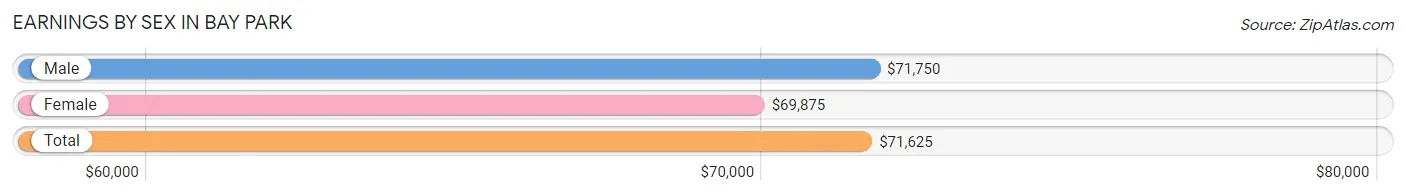
Earnings by Sex in Bay Park
Average Earnings in Bay Park are $71,625, $71,750 for men and $69,875 for women, a difference of 2.6%.
| Sex | Number | Average Earnings |
| Male | 300 (44.3%) | $71,750 |
| Female | 378 (55.7%) | $69,875 |
| Total | 678 (100.0%) | $71,625 |
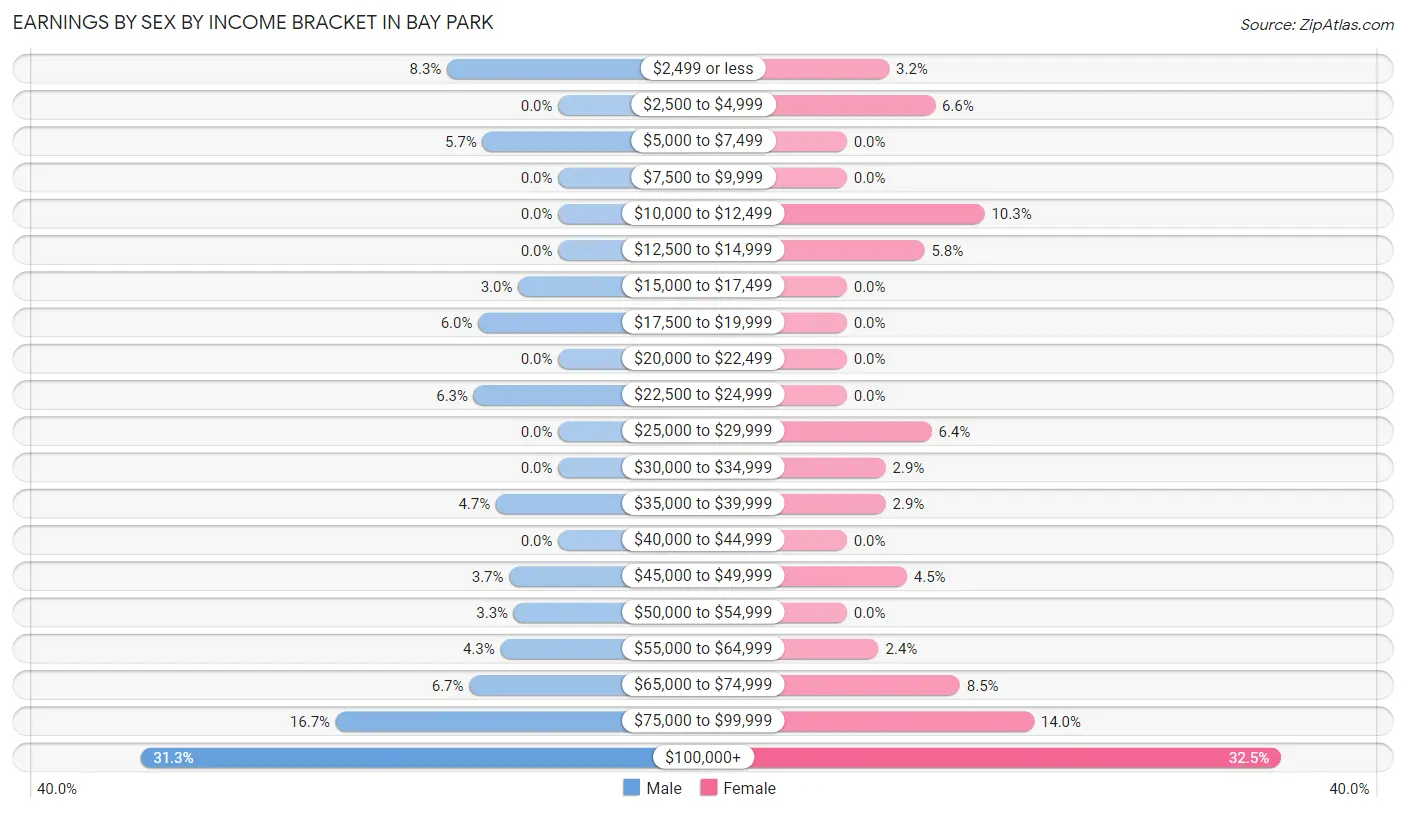
Earnings by Sex by Income Bracket in Bay Park
The most common earnings brackets in Bay Park are $100,000+ for men (94 | 31.3%) and $100,000+ for women (123 | 32.5%).
| Income | Male | Female |
| $2,499 or less | 25 (8.3%) | 12 (3.2%) |
| $2,500 to $4,999 | 0 (0.0%) | 25 (6.6%) |
| $5,000 to $7,499 | 17 (5.7%) | 0 (0.0%) |
| $7,500 to $9,999 | 0 (0.0%) | 0 (0.0%) |
| $10,000 to $12,499 | 0 (0.0%) | 39 (10.3%) |
| $12,500 to $14,999 | 0 (0.0%) | 22 (5.8%) |
| $15,000 to $17,499 | 9 (3.0%) | 0 (0.0%) |
| $17,500 to $19,999 | 18 (6.0%) | 0 (0.0%) |
| $20,000 to $22,499 | 0 (0.0%) | 0 (0.0%) |
| $22,500 to $24,999 | 19 (6.3%) | 0 (0.0%) |
| $25,000 to $29,999 | 0 (0.0%) | 24 (6.4%) |
| $30,000 to $34,999 | 0 (0.0%) | 11 (2.9%) |
| $35,000 to $39,999 | 14 (4.7%) | 11 (2.9%) |
| $40,000 to $44,999 | 0 (0.0%) | 0 (0.0%) |
| $45,000 to $49,999 | 11 (3.7%) | 17 (4.5%) |
| $50,000 to $54,999 | 10 (3.3%) | 0 (0.0%) |
| $55,000 to $64,999 | 13 (4.3%) | 9 (2.4%) |
| $65,000 to $74,999 | 20 (6.7%) | 32 (8.5%) |
| $75,000 to $99,999 | 50 (16.7%) | 53 (14.0%) |
| $100,000+ | 94 (31.3%) | 123 (32.5%) |
| Total | 300 (100.0%) | 378 (100.0%) |
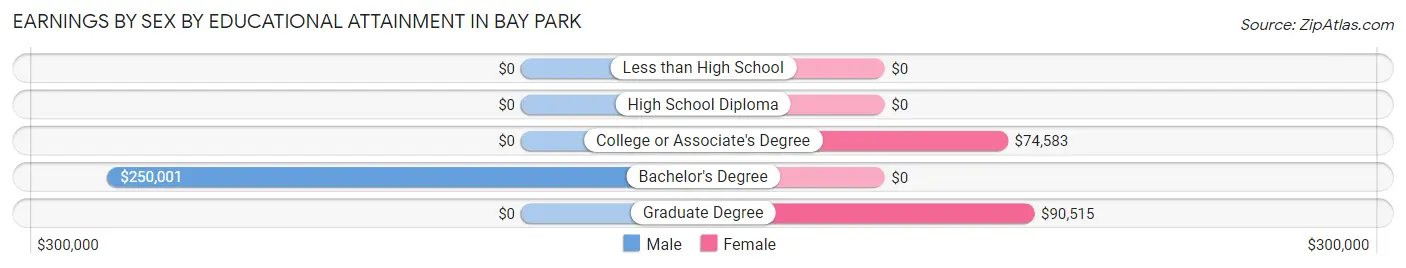
Earnings by Sex by Educational Attainment in Bay Park
Average earnings in Bay Park are $83,711 for men and $74,896 for women, a difference of 10.5%. Men with an educational attainment of bachelor's degree enjoy the highest average annual earnings of $250,001, while those with bachelor's degree education earn the least with $250,001. Women with an educational attainment of graduate degree earn the most with the average annual earnings of $90,515, while those with college or associate's degree education have the smallest earnings of $74,583.
| Educational Attainment | Male Income | Female Income |
| Less than High School | - | - |
| High School Diploma | - | - |
| College or Associate's Degree | - | - |
| Bachelor's Degree | $250,001 | $0 |
| Graduate Degree | - | - |
| Total | $83,711 | $74,896 |
Family Income in Bay Park
Family Income Brackets in Bay Park
According to the Bay Park family income data, there are 116 families falling into the $200,000+ income range, which is the most common income bracket and makes up 33.3% of all families.
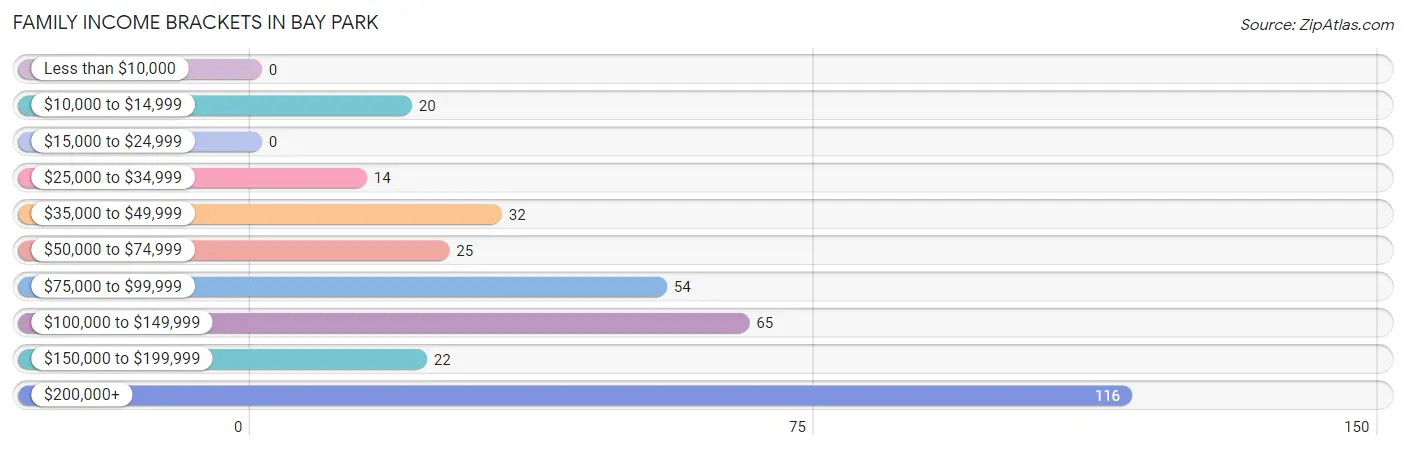
| Income Bracket | # Families | % Families |
| Less than $10,000 | 0 | 0.0% |
| $10,000 to $14,999 | 20 | 5.7% |
| $15,000 to $24,999 | 0 | 0.0% |
| $25,000 to $34,999 | 14 | 4.0% |
| $35,000 to $49,999 | 32 | 9.2% |
| $50,000 to $74,999 | 25 | 7.2% |
| $75,000 to $99,999 | 54 | 15.5% |
| $100,000 to $149,999 | 65 | 18.7% |
| $150,000 to $199,999 | 22 | 6.3% |
| $200,000+ | 116 | 33.3% |
Family Income by Famaliy Size in Bay Park
4-person families (98 | 28.2%) account for the highest median family income in Bay Park with $208,500 per family, while 3-person families (82 | 23.6%) have the highest median income of $57,083 per family member.
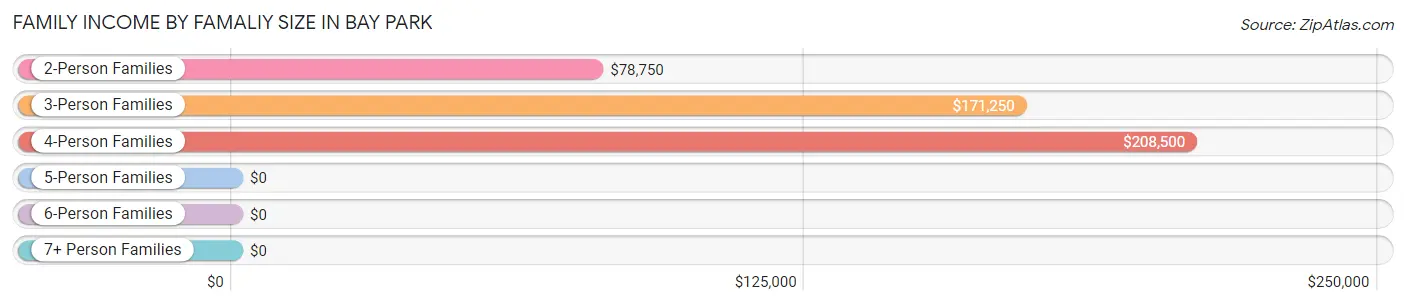
| Income Bracket | # Families | Median Income |
| 2-Person Families | 128 (36.8%) | $78,750 |
| 3-Person Families | 82 (23.6%) | $171,250 |
| 4-Person Families | 98 (28.2%) | $208,500 |
| 5-Person Families | 40 (11.5%) | $0 |
| 6-Person Families | 0 (0.0%) | $0 |
| 7+ Person Families | 0 (0.0%) | $0 |
| Total | 348 (100.0%) | $106,250 |
Family Income by Number of Earners in Bay Park
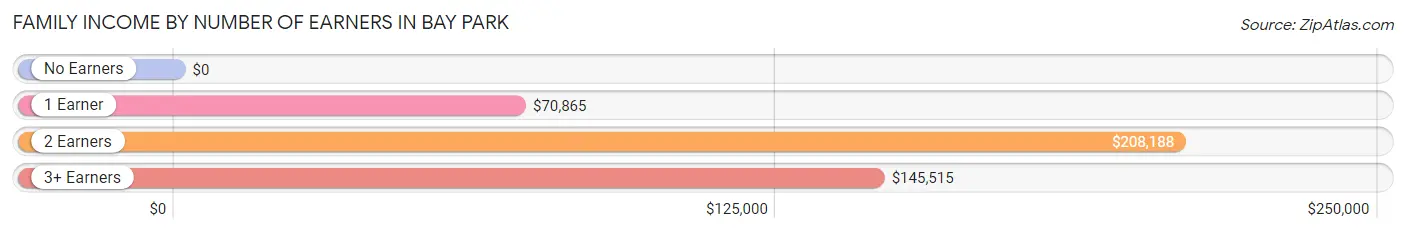
| Number of Earners | # Families | Median Income |
| No Earners | 21 (6.0%) | $0 |
| 1 Earner | 141 (40.5%) | $70,865 |
| 2 Earners | 119 (34.2%) | $208,188 |
| 3+ Earners | 67 (19.3%) | $145,515 |
| Total | 348 (100.0%) | $106,250 |
Household Income in Bay Park
Household Income Brackets in Bay Park
With 142 households falling in the category, the $200,000+ income range is the most frequent in Bay Park, accounting for 23.9% of all households.
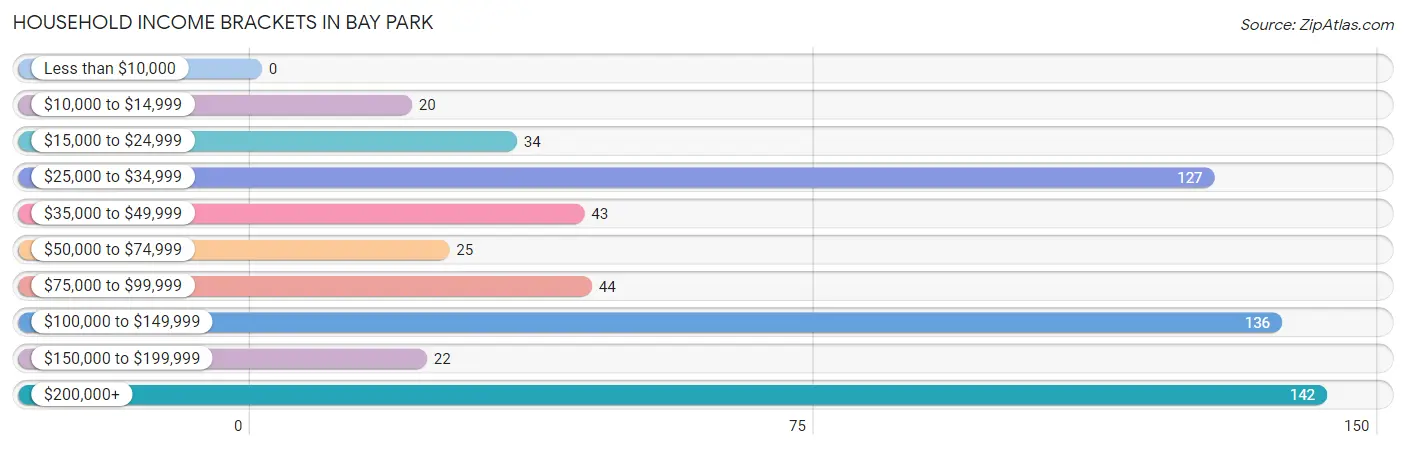
| Income Bracket | # Households | % Households |
| Less than $10,000 | 0 | 0.0% |
| $10,000 to $14,999 | 20 | 3.4% |
| $15,000 to $24,999 | 34 | 5.7% |
| $25,000 to $34,999 | 127 | 21.4% |
| $35,000 to $49,999 | 43 | 7.3% |
| $50,000 to $74,999 | 25 | 4.2% |
| $75,000 to $99,999 | 44 | 7.4% |
| $100,000 to $149,999 | 136 | 22.9% |
| $150,000 to $199,999 | 22 | 3.7% |
| $200,000+ | 142 | 23.9% |
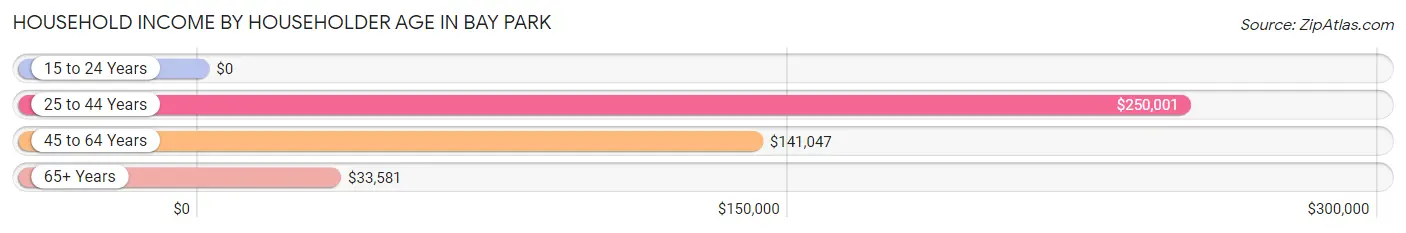
Household Income by Householder Age in Bay Park
The median household income in Bay Park is $100,972, with the highest median household income of $250,001 found in the 25 to 44 years age bracket for the primary householder. A total of 92 households (15.5%) fall into this category.
| Income Bracket | # Households | Median Income |
| 15 to 24 Years | 0 (0.0%) | $0 |
| 25 to 44 Years | 92 (15.5%) | $250,001 |
| 45 to 64 Years | 246 (41.5%) | $141,047 |
| 65+ Years | 255 (43.0%) | $33,581 |
| Total | 593 (100.0%) | $100,972 |
Poverty in Bay Park
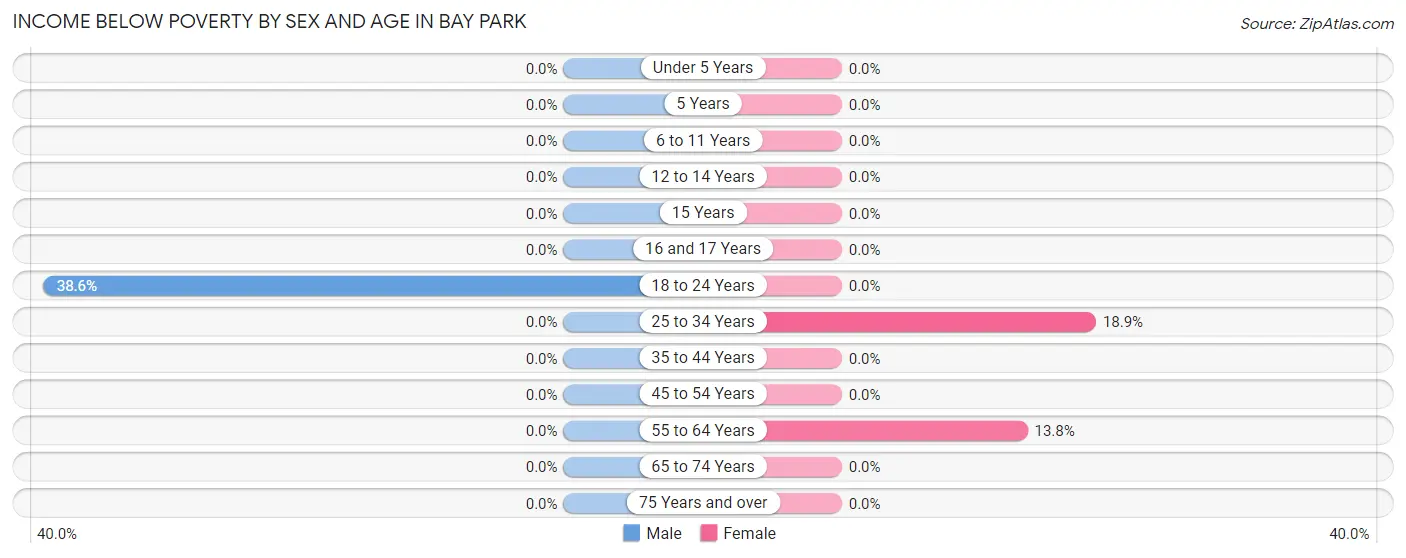
Income Below Poverty by Sex and Age in Bay Park
With 4.9% poverty level for males and 3.6% for females among the residents of Bay Park, 18 to 24 year old males and 25 to 34 year old females are the most vulnerable to poverty, with 27 males (38.6%) and 10 females (18.9%) in their respective age groups living below the poverty level.
| Age Bracket | Male | Female |
| Under 5 Years | 0 (0.0%) | 0 (0.0%) |
| 5 Years | 0 (0.0%) | 0 (0.0%) |
| 6 to 11 Years | 0 (0.0%) | 0 (0.0%) |
| 12 to 14 Years | 0 (0.0%) | 0 (0.0%) |
| 15 Years | 0 (0.0%) | 0 (0.0%) |
| 16 and 17 Years | 0 (0.0%) | 0 (0.0%) |
| 18 to 24 Years | 27 (38.6%) | 0 (0.0%) |
| 25 to 34 Years | 0 (0.0%) | 10 (18.9%) |
| 35 to 44 Years | 0 (0.0%) | 0 (0.0%) |
| 45 to 54 Years | 0 (0.0%) | 0 (0.0%) |
| 55 to 64 Years | 0 (0.0%) | 20 (13.8%) |
| 65 to 74 Years | 0 (0.0%) | 0 (0.0%) |
| 75 Years and over | 0 (0.0%) | 0 (0.0%) |
| Total | 27 (4.9%) | 30 (3.6%) |
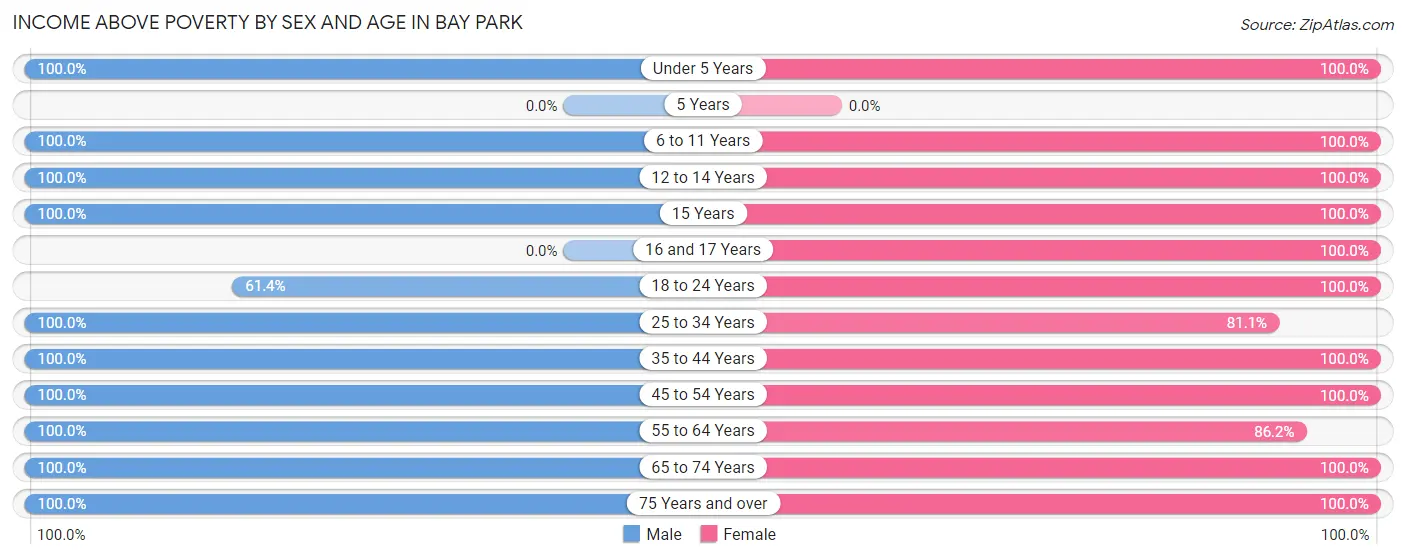
Income Above Poverty by Sex and Age in Bay Park
According to the poverty statistics in Bay Park, males aged under 5 years and females aged under 5 years are the age groups that are most secure financially, with 100.0% of males and 100.0% of females in these age groups living above the poverty line.
| Age Bracket | Male | Female |
| Under 5 Years | 45 (100.0%) | 45 (100.0%) |
| 5 Years | 0 (0.0%) | 0 (0.0%) |
| 6 to 11 Years | 76 (100.0%) | 51 (100.0%) |
| 12 to 14 Years | 20 (100.0%) | 15 (100.0%) |
| 15 Years | 17 (100.0%) | 25 (100.0%) |
| 16 and 17 Years | 0 (0.0%) | 17 (100.0%) |
| 18 to 24 Years | 43 (61.4%) | 25 (100.0%) |
| 25 to 34 Years | 32 (100.0%) | 43 (81.1%) |
| 35 to 44 Years | 75 (100.0%) | 92 (100.0%) |
| 45 to 54 Years | 65 (100.0%) | 90 (100.0%) |
| 55 to 64 Years | 86 (100.0%) | 125 (86.2%) |
| 65 to 74 Years | 28 (100.0%) | 82 (100.0%) |
| 75 Years and over | 42 (100.0%) | 193 (100.0%) |
| Total | 529 (95.1%) | 803 (96.4%) |
Income Below Poverty Among Married-Couple Families in Bay Park
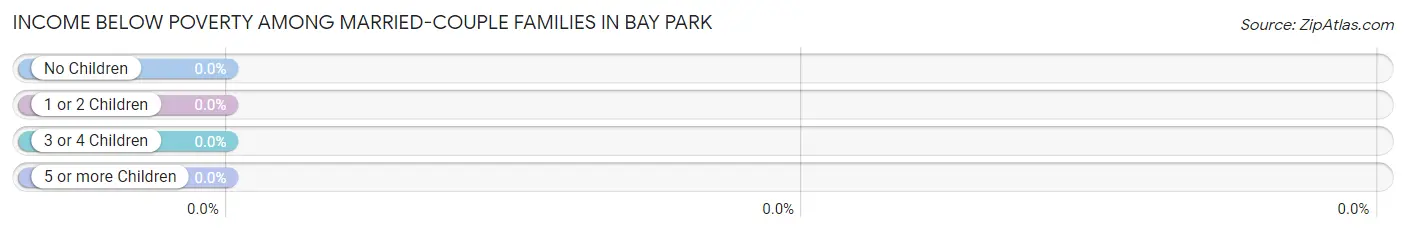
| Children | Above Poverty | Below Poverty |
| No Children | 109 (100.0%) | 0 (0.0%) |
| 1 or 2 Children | 137 (100.0%) | 0 (0.0%) |
| 3 or 4 Children | 0 (0.0%) | 0 (0.0%) |
| 5 or more Children | 0 (0.0%) | 0 (0.0%) |
| Total | 246 (100.0%) | 0 (0.0%) |
Income Below Poverty Among Single-Parent Households in Bay Park
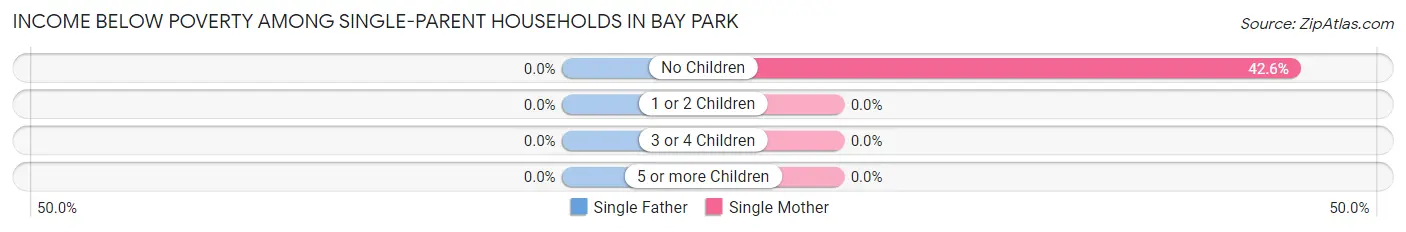
| Children | Single Father | Single Mother |
| No Children | 0 (0.0%) | 20 (42.5%) |
| 1 or 2 Children | 0 (0.0%) | 0 (0.0%) |
| 3 or 4 Children | 0 (0.0%) | 0 (0.0%) |
| 5 or more Children | 0 (0.0%) | 0 (0.0%) |
| Total | 0 (0.0%) | 20 (22.0%) |
Income Below Poverty Among Married-Couple vs Single-Parent Households in Bay Park
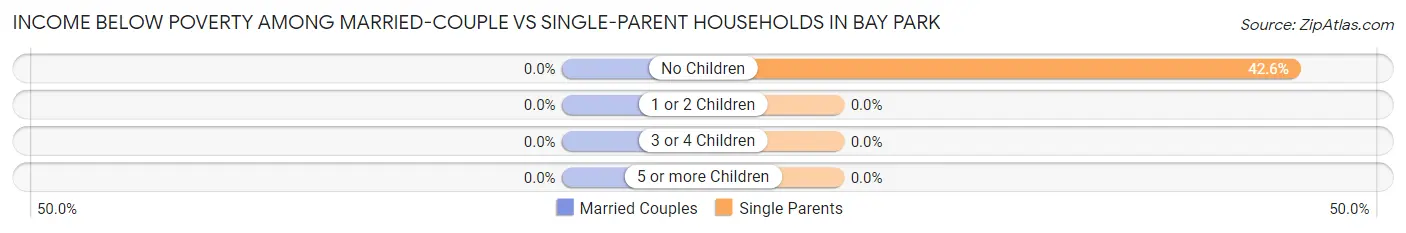
| Children | Married-Couple Families | Single-Parent Households |
| No Children | 0 (0.0%) | 20 (42.5%) |
| 1 or 2 Children | 0 (0.0%) | 0 (0.0%) |
| 3 or 4 Children | 0 (0.0%) | 0 (0.0%) |
| 5 or more Children | 0 (0.0%) | 0 (0.0%) |
| Total | 0 (0.0%) | 20 (19.6%) |
Race in Bay Park
The most populous races in Bay Park are White / Caucasian (1,297 | 93.4%), Hispanic or Latino (109 | 7.9%), and Two or more Races (52 | 3.7%).
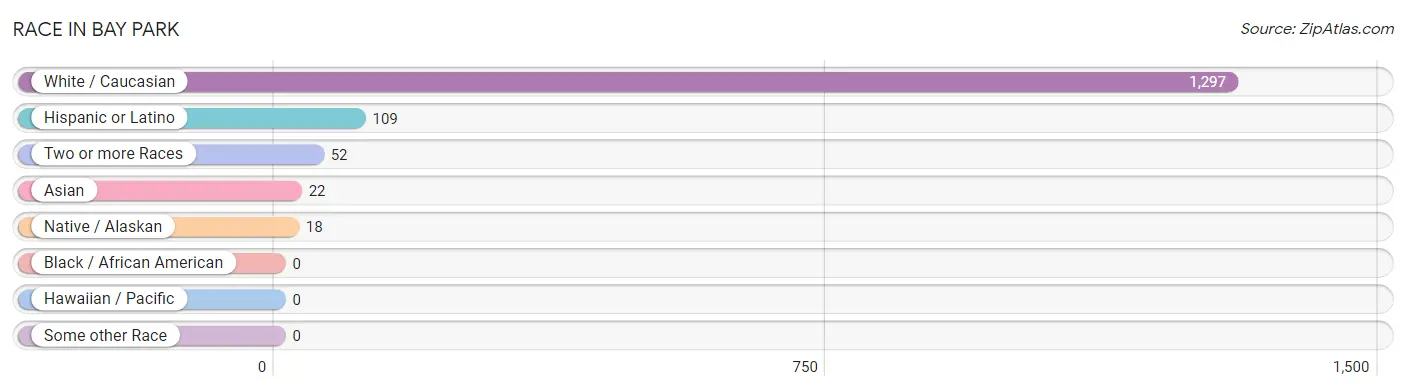
| Race | # Population | % Population |
| Asian | 22 | 1.6% |
| Black / African American | 0 | 0.0% |
| Hawaiian / Pacific | 0 | 0.0% |
| Hispanic or Latino | 109 | 7.9% |
| Native / Alaskan | 18 | 1.3% |
| White / Caucasian | 1,297 | 93.4% |
| Two or more Races | 52 | 3.7% |
| Some other Race | 0 | 0.0% |
| Total | 1,389 | 100.0% |
Ancestry in Bay Park
The most populous ancestries reported in Bay Park are Irish (656 | 47.2%), Italian (533 | 38.4%), German (204 | 14.7%), English (116 | 8.4%), and Polish (110 | 7.9%), together accounting for 116.6% of all Bay Park residents.
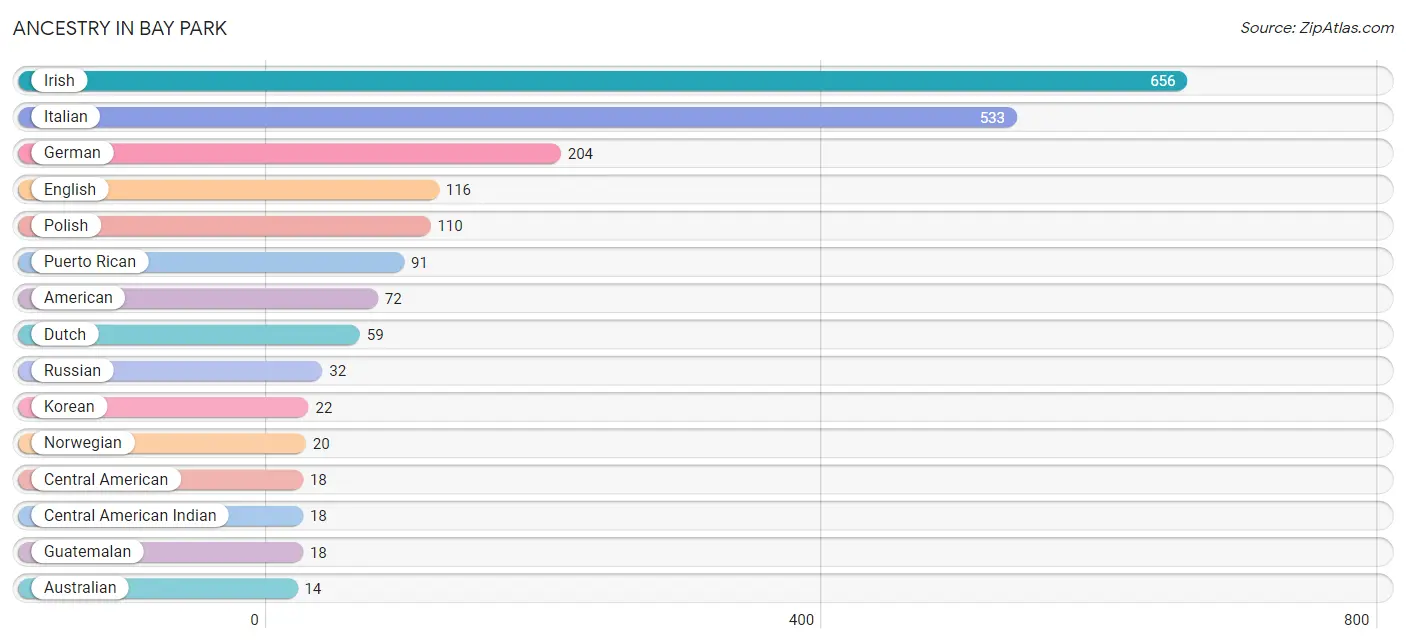
| Ancestry | # Population | % Population |
| American | 72 | 5.2% |
| Australian | 14 | 1.0% |
| Central American | 18 | 1.3% |
| Central American Indian | 18 | 1.3% |
| Dutch | 59 | 4.3% |
| English | 116 | 8.4% |
| German | 204 | 14.7% |
| Guatemalan | 18 | 1.3% |
| Hungarian | 8 | 0.6% |
| Irish | 656 | 47.2% |
| Italian | 533 | 38.4% |
| Korean | 22 | 1.6% |
| Norwegian | 20 | 1.4% |
| Polish | 110 | 7.9% |
| Puerto Rican | 91 | 6.6% |
| Russian | 32 | 2.3% | View All 16 Rows |
Immigrants in Bay Park
The most numerous immigrant groups reported in Bay Park came from Central America (18 | 1.3%), Guatemala (18 | 1.3%), Latin America (18 | 1.3%), Australia (14 | 1.0%), and Oceania (14 | 1.0%), together accounting for 5.9% of all Bay Park residents.
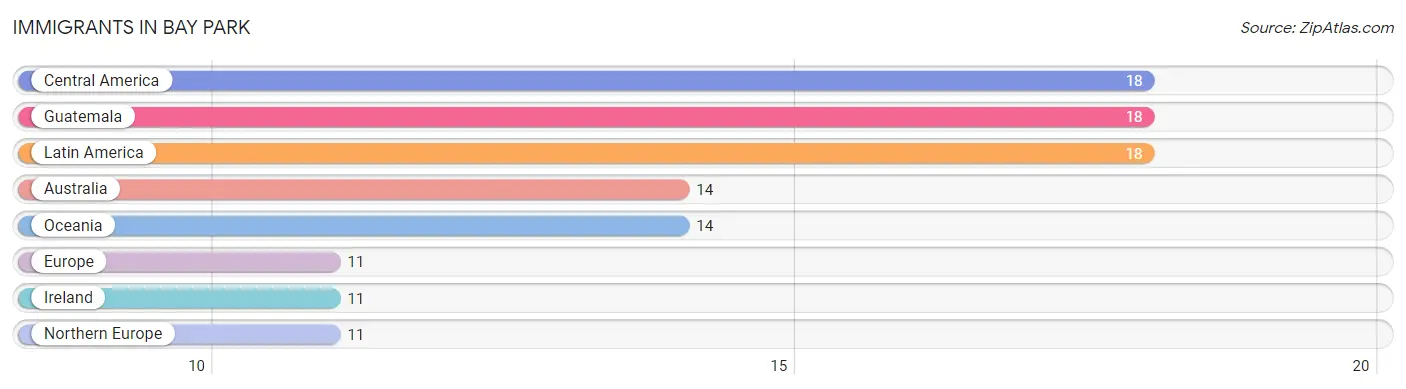
| Immigration Origin | # Population | % Population |
| Australia | 14 | 1.0% |
| Central America | 18 | 1.3% |
| Europe | 11 | 0.8% |
| Guatemala | 18 | 1.3% |
| Ireland | 11 | 0.8% |
| Latin America | 18 | 1.3% |
| Northern Europe | 11 | 0.8% |
| Oceania | 14 | 1.0% | View All 8 Rows |
Sex and Age in Bay Park
Sex and Age in Bay Park
The most populous age groups in Bay Park are 5 to 9 Years (57 | 10.2%) for men and 85 Years and over (125 | 15.0%) for women.
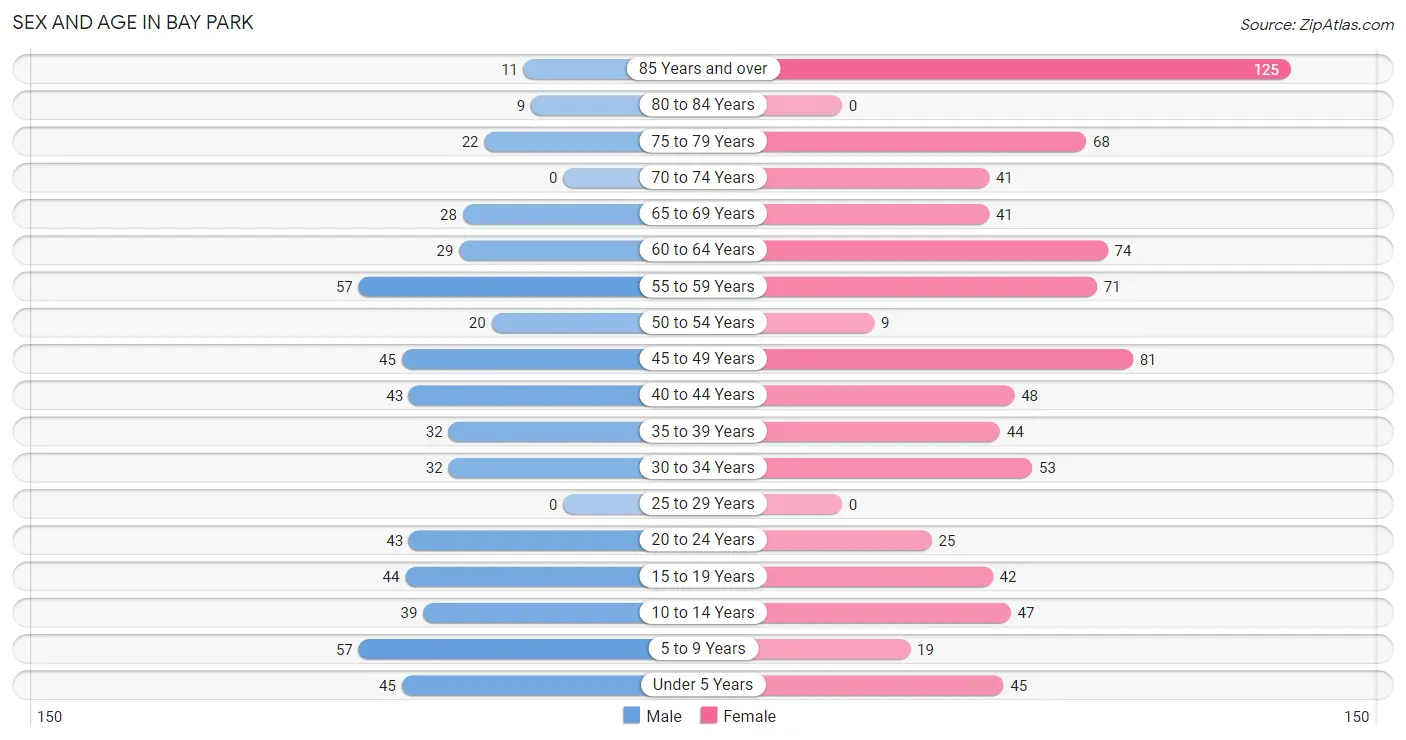
| Age Bracket | Male | Female |
| Under 5 Years | 45 (8.1%) | 45 (5.4%) |
| 5 to 9 Years | 57 (10.2%) | 19 (2.3%) |
| 10 to 14 Years | 39 (7.0%) | 47 (5.6%) |
| 15 to 19 Years | 44 (7.9%) | 42 (5.0%) |
| 20 to 24 Years | 43 (7.7%) | 25 (3.0%) |
| 25 to 29 Years | 0 (0.0%) | 0 (0.0%) |
| 30 to 34 Years | 32 (5.8%) | 53 (6.4%) |
| 35 to 39 Years | 32 (5.8%) | 44 (5.3%) |
| 40 to 44 Years | 43 (7.7%) | 48 (5.8%) |
| 45 to 49 Years | 45 (8.1%) | 81 (9.7%) |
| 50 to 54 Years | 20 (3.6%) | 9 (1.1%) |
| 55 to 59 Years | 57 (10.2%) | 71 (8.5%) |
| 60 to 64 Years | 29 (5.2%) | 74 (8.9%) |
| 65 to 69 Years | 28 (5.0%) | 41 (4.9%) |
| 70 to 74 Years | 0 (0.0%) | 41 (4.9%) |
| 75 to 79 Years | 22 (4.0%) | 68 (8.2%) |
| 80 to 84 Years | 9 (1.6%) | 0 (0.0%) |
| 85 Years and over | 11 (2.0%) | 125 (15.0%) |
| Total | 556 (100.0%) | 833 (100.0%) |
Families and Households in Bay Park
Median Family Size in Bay Park
The median family size in Bay Park is 3.19 persons per family, with single male/father families (11 | 3.2%) accounting for the largest median family size of 4.82 persons per family. On the other hand, single female/mother families (91 | 26.2%) represent the smallest median family size with 3.04 persons per family.
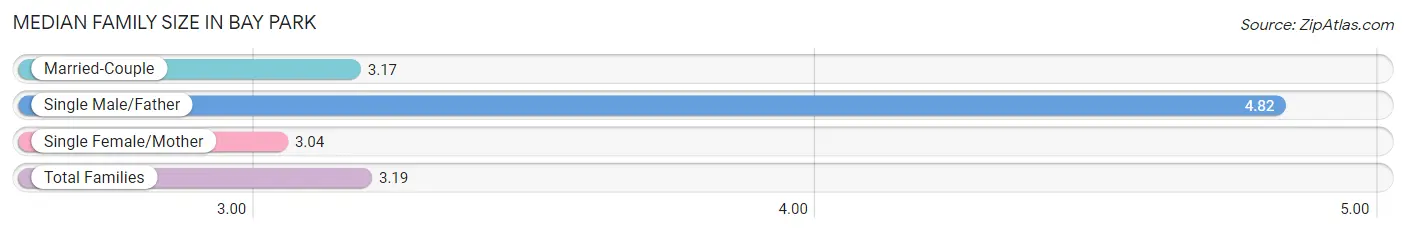
| Family Type | # Families | Family Size |
| Married-Couple | 246 (70.7%) | 3.17 |
| Single Male/Father | 11 (3.2%) | 4.82 |
| Single Female/Mother | 91 (26.2%) | 3.04 |
| Total Families | 348 (100.0%) | 3.19 |
Median Household Size in Bay Park
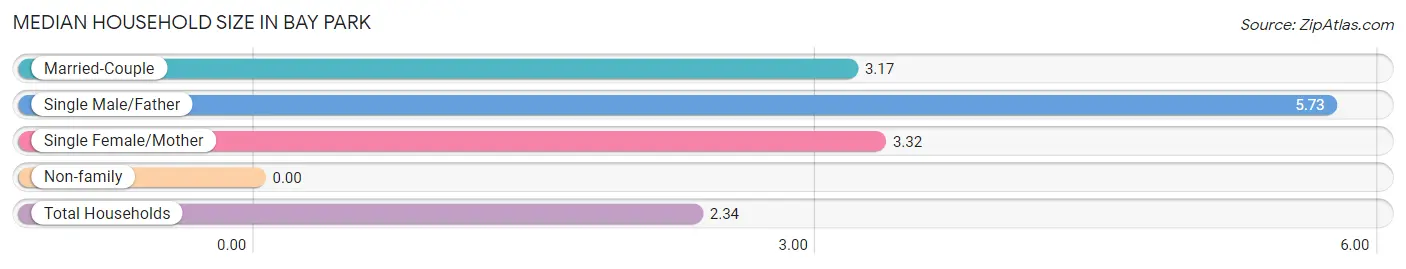
| Household Type | # Households | Household Size |
| Married-Couple | 246 (41.5%) | 3.17 |
| Single Male/Father | 11 (1.8%) | 5.73 |
| Single Female/Mother | 91 (15.3%) | 3.32 |
| Non-family | 245 (41.3%) | - |
| Total Households | 593 (100.0%) | 2.34 |
Household Size by Marriage Status in Bay Park
Out of a total of 593 households in Bay Park, 348 (58.7%) are family households, while 245 (41.3%) are nonfamily households. The most numerous type of family households are 2-person households, comprising 118, and the most common type of nonfamily households are 1-person households, comprising 245.
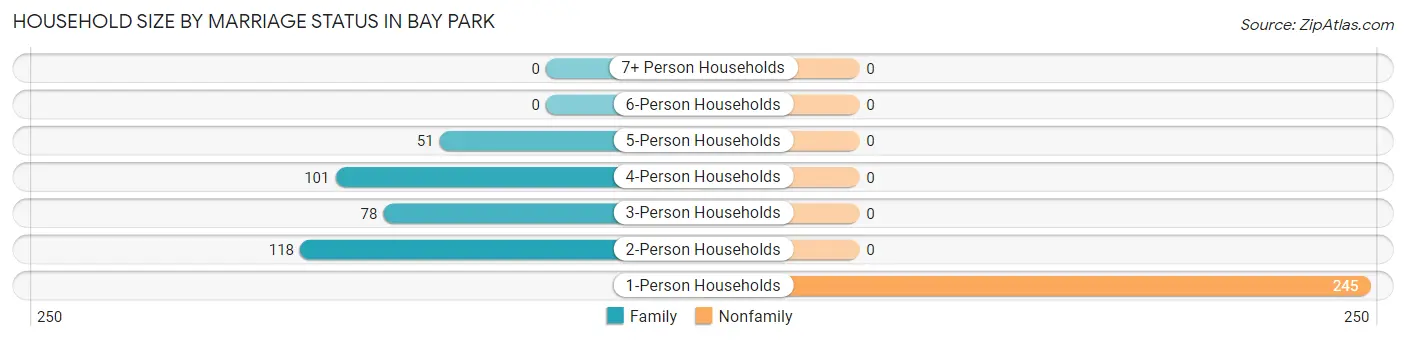
| Household Size | Family Households | Nonfamily Households |
| 1-Person Households | - | 245 (41.3%) |
| 2-Person Households | 118 (19.9%) | 0 (0.0%) |
| 3-Person Households | 78 (13.2%) | 0 (0.0%) |
| 4-Person Households | 101 (17.0%) | 0 (0.0%) |
| 5-Person Households | 51 (8.6%) | 0 (0.0%) |
| 6-Person Households | 0 (0.0%) | 0 (0.0%) |
| 7+ Person Households | 0 (0.0%) | 0 (0.0%) |
| Total | 348 (58.7%) | 245 (41.3%) |
Female Fertility in Bay Park
Fertility by Age in Bay Park
Average fertility rate in Bay Park is 99.0 births per 1,000 women. Women in the age bracket of 20 to 34 years have the highest fertility rate with 128.0 births per 1,000 women. Women in the age bracket of 35 to 50 years acount for 66.7% of all women with births.
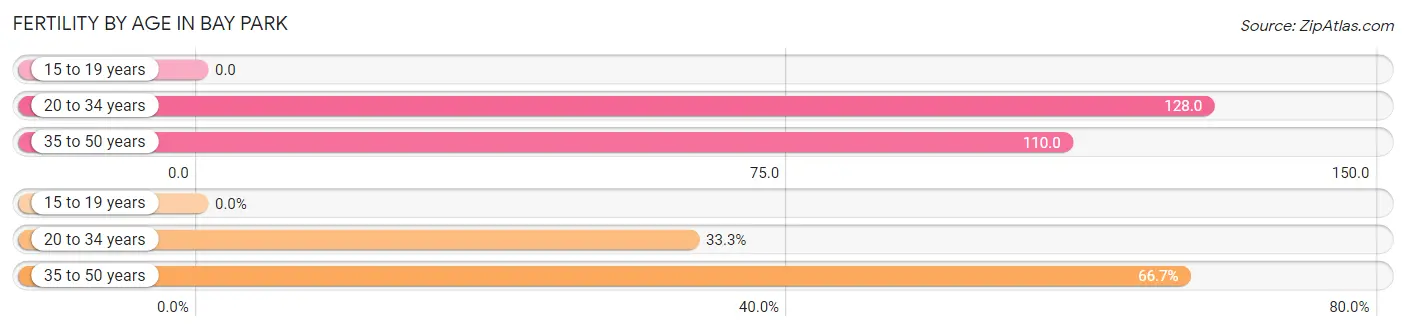
| Age Bracket | Women with Births | Births / 1,000 Women |
| 15 to 19 years | 0 (0.0%) | 0.0 |
| 20 to 34 years | 10 (33.3%) | 128.0 |
| 35 to 50 years | 20 (66.7%) | 110.0 |
| Total | 30 (100.0%) | 99.0 |
Fertility by Age by Marriage Status in Bay Park
66.7% of women with births (30) in Bay Park are married. The highest percentage of unmarried women with births falls into 20 to 34 years age bracket with 100.0% of them unmarried at the time of birth, while the lowest percentage of unmarried women with births belong to 35 to 50 years age bracket with 0.0% of them unmarried.
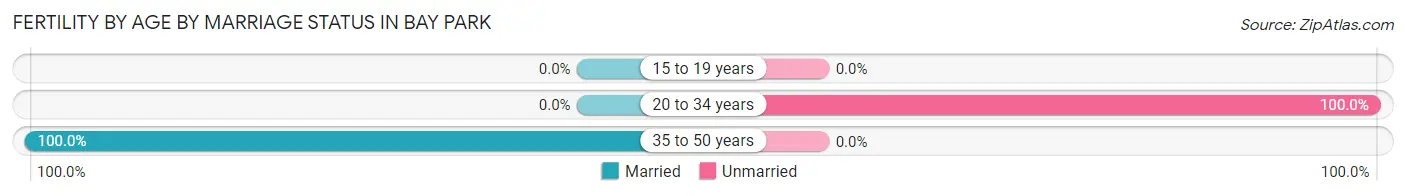
| Age Bracket | Married | Unmarried |
| 15 to 19 years | 0 (0.0%) | 0 (0.0%) |
| 20 to 34 years | 0 (0.0%) | 10 (100.0%) |
| 35 to 50 years | 20 (100.0%) | 0 (0.0%) |
| Total | 20 (66.7%) | 10 (33.3%) |
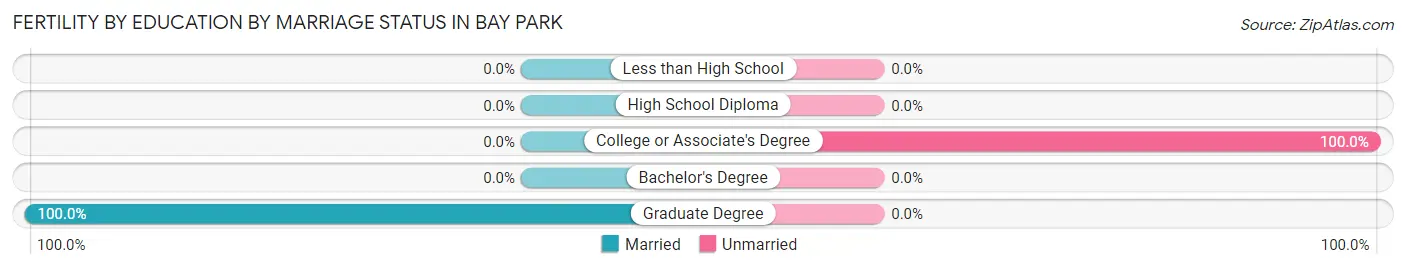
Fertility by Education in Bay Park
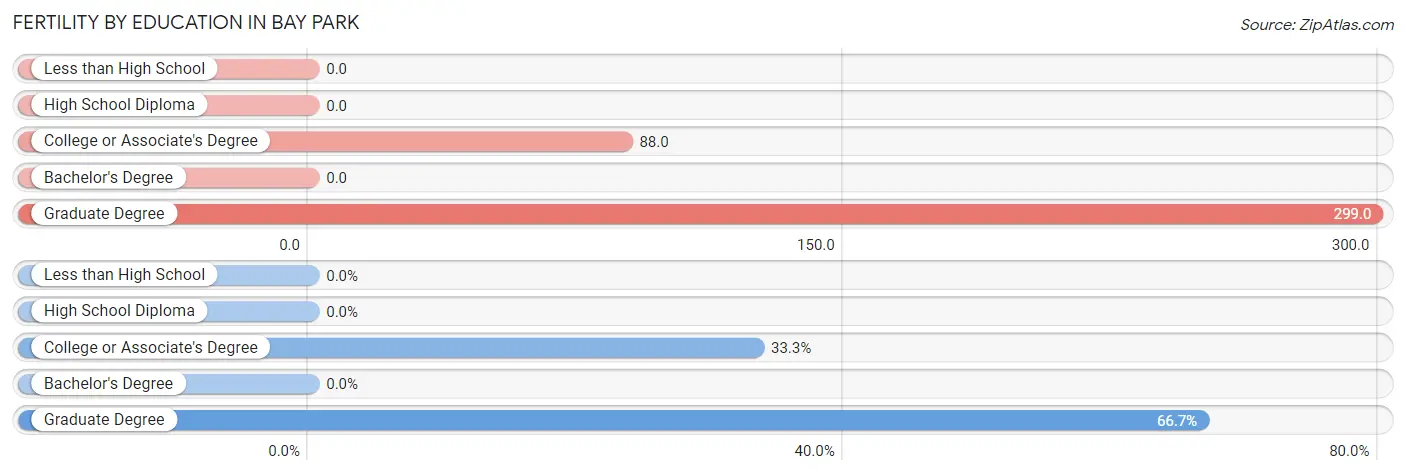
| Educational Attainment | Women with Births | Births / 1,000 Women |
| Less than High School | 0 (0.0%) | 0.0 |
| High School Diploma | 0 (0.0%) | 0.0 |
| College or Associate's Degree | 10 (33.3%) | 88.0 |
| Bachelor's Degree | 0 (0.0%) | 0.0 |
| Graduate Degree | 20 (66.7%) | 299.0 |
| Total | 30 (100.0%) | 99.0 |
Fertility by Education by Marriage Status in Bay Park
33.3% of women with births in Bay Park are unmarried. Women with the educational attainment of graduate degree are most likely to be married with 100.0% of them married at childbirth, while women with the educational attainment of college or associate's degree are least likely to be married with 100.0% of them unmarried at childbirth.
| Educational Attainment | Married | Unmarried |
| Less than High School | 0 (0.0%) | 0 (0.0%) |
| High School Diploma | 0 (0.0%) | 0 (0.0%) |
| College or Associate's Degree | 0 (0.0%) | 10 (100.0%) |
| Bachelor's Degree | 0 (0.0%) | 0 (0.0%) |
| Graduate Degree | 20 (100.0%) | 0 (0.0%) |
| Total | 20 (66.7%) | 10 (33.3%) |
Employment Characteristics in Bay Park
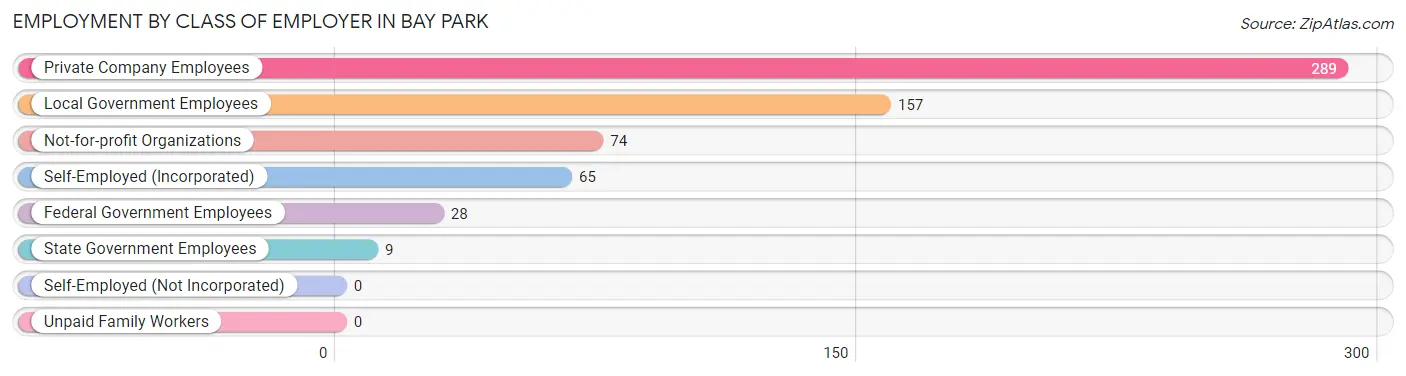
Employment by Class of Employer in Bay Park
Among the 622 employed individuals in Bay Park, private company employees (289 | 46.5%), local government employees (157 | 25.2%), and not-for-profit organizations (74 | 11.9%) make up the most common classes of employment.
| Employer Class | # Employees | % Employees |
| Private Company Employees | 289 | 46.5% |
| Self-Employed (Incorporated) | 65 | 10.4% |
| Self-Employed (Not Incorporated) | 0 | 0.0% |
| Not-for-profit Organizations | 74 | 11.9% |
| Local Government Employees | 157 | 25.2% |
| State Government Employees | 9 | 1.5% |
| Federal Government Employees | 28 | 4.5% |
| Unpaid Family Workers | 0 | 0.0% |
| Total | 622 | 100.0% |
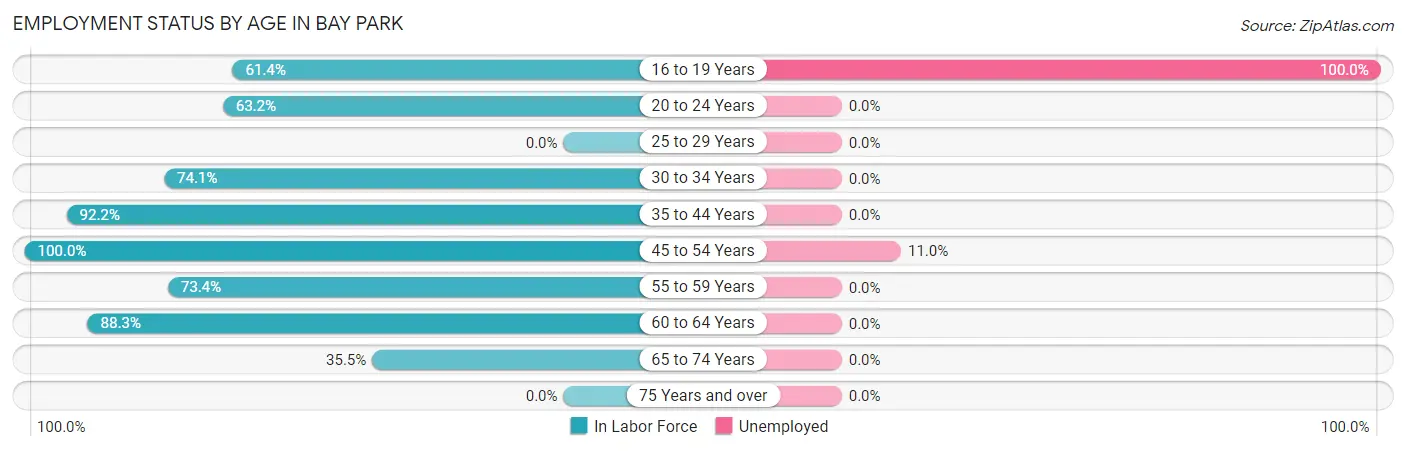
Employment Status by Age in Bay Park
According to the labor force statistics for Bay Park, out of the total population over 16 years of age (1,095), 60.8% or 666 individuals are in the labor force, with 6.6% or 44 of them unemployed. The age group with the highest labor force participation rate is 45 to 54 years, with 100.0% or 155 individuals in the labor force. Within the labor force, the 16 to 19 years age range has the highest percentage of unemployed individuals, with 100.0% or 27 of them being unemployed.
| Age Bracket | In Labor Force | Unemployed |
| 16 to 19 Years | 27 (61.4%) | 27 (100.0%) |
| 20 to 24 Years | 43 (63.2%) | 0 (0.0%) |
| 25 to 29 Years | 0 (0.0%) | 0 (0.0%) |
| 30 to 34 Years | 63 (74.1%) | 0 (0.0%) |
| 35 to 44 Years | 154 (92.2%) | 0 (0.0%) |
| 45 to 54 Years | 155 (100.0%) | 17 (11.0%) |
| 55 to 59 Years | 94 (73.4%) | 0 (0.0%) |
| 60 to 64 Years | 91 (88.3%) | 0 (0.0%) |
| 65 to 74 Years | 39 (35.5%) | 0 (0.0%) |
| 75 Years and over | 0 (0.0%) | 0 (0.0%) |
| Total | 666 (60.8%) | 44 (6.6%) |
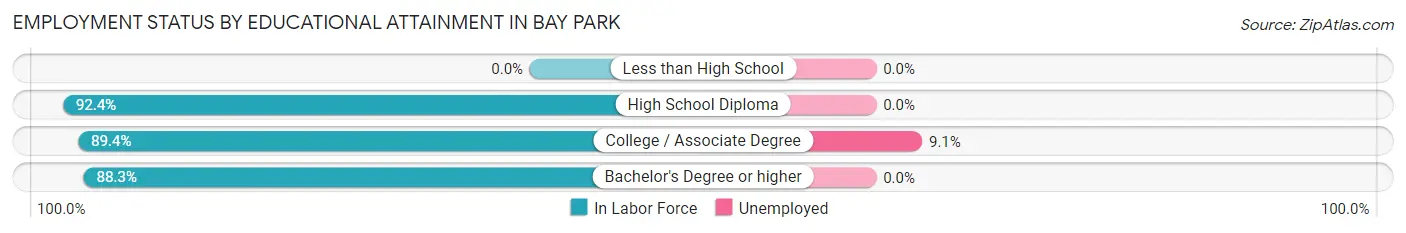
Employment Status by Educational Attainment in Bay Park
According to labor force statistics for Bay Park, 87.3% of individuals (557) out of the total population between 25 and 64 years of age (638) are in the labor force, with 3.1% or 17 of them being unemployed. The group with the highest labor force participation rate are those with the educational attainment of high school diploma, with 92.4% or 182 individuals in the labor force. Within the labor force, individuals with college / associate degree education have the highest percentage of unemployment, with 9.1% or 17 of them being unemployed.
| Educational Attainment | In Labor Force | Unemployed |
| Less than High School | 0 (0.0%) | 0 (0.0%) |
| High School Diploma | 182 (92.4%) | 0 (0.0%) |
| College / Associate Degree | 186 (89.4%) | 19 (9.1%) |
| Bachelor's Degree or higher | 189 (88.3%) | 0 (0.0%) |
| Total | 557 (87.3%) | 20 (3.1%) |
Employment Occupations by Sex in Bay Park
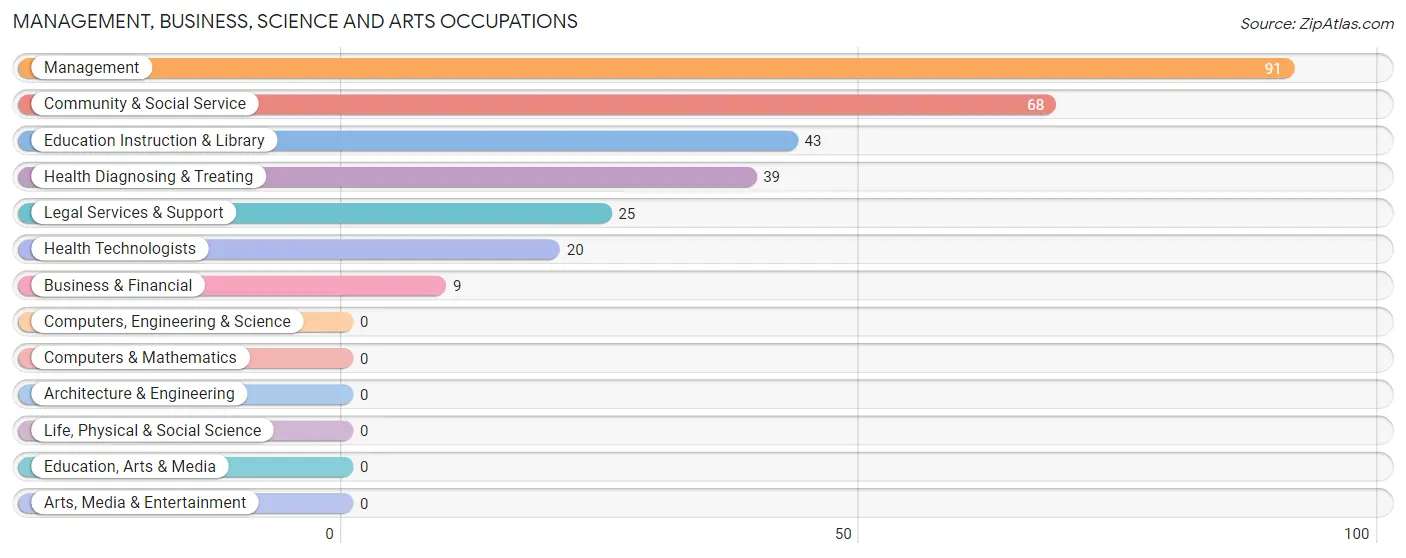
Management, Business, Science and Arts Occupations
The most common Management, Business, Science and Arts occupations in Bay Park are Management (91 | 14.6%), Community & Social Service (68 | 10.9%), Education Instruction & Library (43 | 6.9%), Health Diagnosing & Treating (39 | 6.3%), and Legal Services & Support (25 | 4.0%).
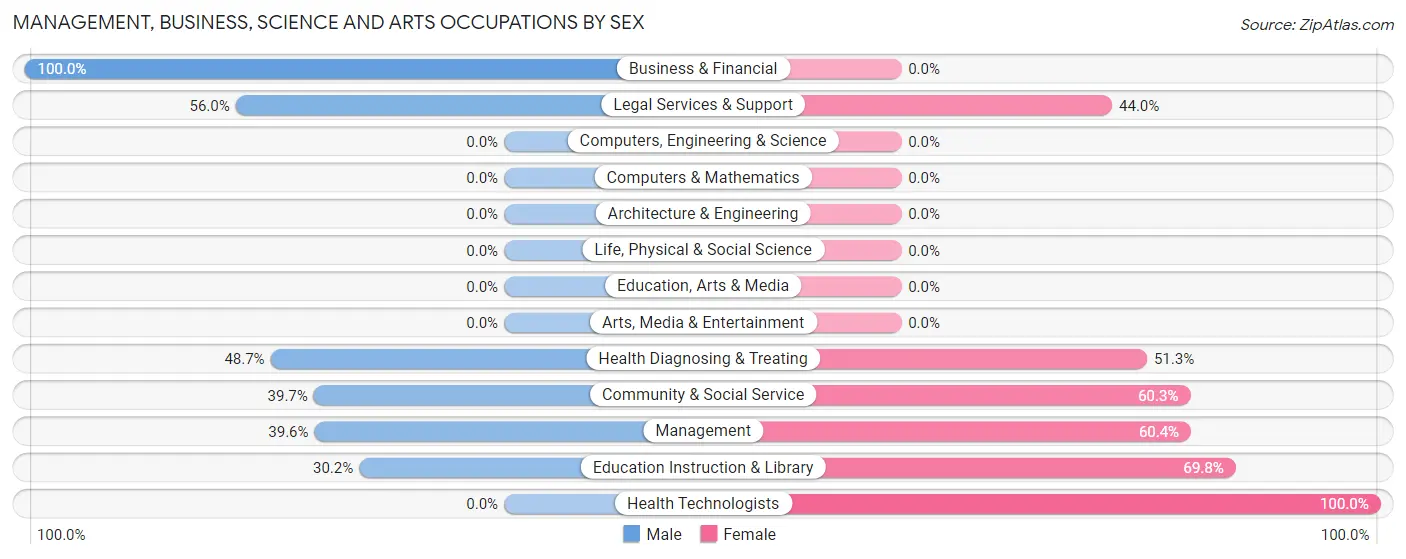
Management, Business, Science and Arts Occupations by Sex
Within the Management, Business, Science and Arts occupations in Bay Park, the most male-oriented occupations are Business & Financial (100.0%), Legal Services & Support (56.0%), and Health Diagnosing & Treating (48.7%), while the most female-oriented occupations are Health Technologists (100.0%), Education Instruction & Library (69.8%), and Management (60.4%).
| Occupation | Male | Female |
| Management | 36 (39.6%) | 55 (60.4%) |
| Business & Financial | 9 (100.0%) | 0 (0.0%) |
| Computers, Engineering & Science | 0 (0.0%) | 0 (0.0%) |
| Computers & Mathematics | 0 (0.0%) | 0 (0.0%) |
| Architecture & Engineering | 0 (0.0%) | 0 (0.0%) |
| Life, Physical & Social Science | 0 (0.0%) | 0 (0.0%) |
| Community & Social Service | 27 (39.7%) | 41 (60.3%) |
| Education, Arts & Media | 0 (0.0%) | 0 (0.0%) |
| Legal Services & Support | 14 (56.0%) | 11 (44.0%) |
| Education Instruction & Library | 13 (30.2%) | 30 (69.8%) |
| Arts, Media & Entertainment | 0 (0.0%) | 0 (0.0%) |
| Health Diagnosing & Treating | 19 (48.7%) | 20 (51.3%) |
| Health Technologists | 0 (0.0%) | 20 (100.0%) |
| Total (Category) | 91 (44.0%) | 116 (56.0%) |
| Total (Overall) | 300 (48.2%) | 322 (51.8%) |
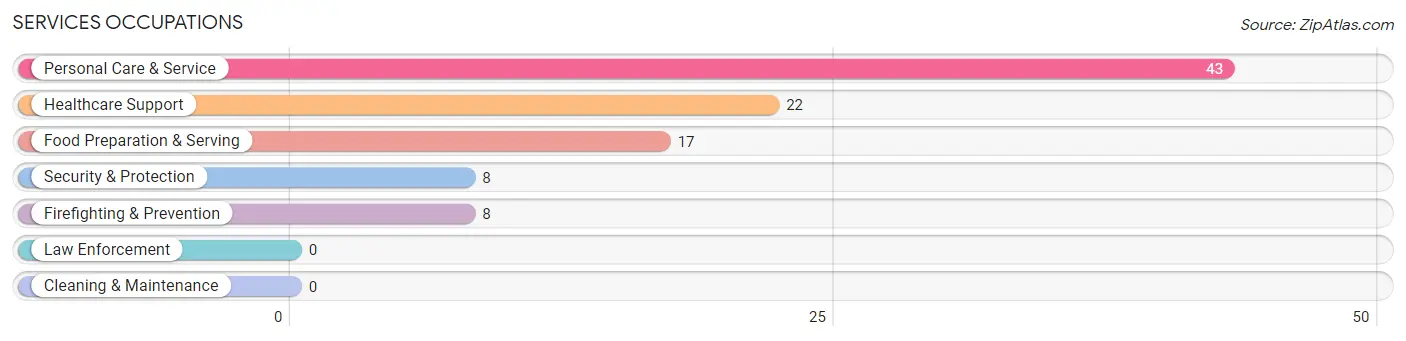
Services Occupations
The most common Services occupations in Bay Park are Personal Care & Service (43 | 6.9%), Healthcare Support (22 | 3.5%), Food Preparation & Serving (17 | 2.7%), Security & Protection (8 | 1.3%), and Firefighting & Prevention (8 | 1.3%).
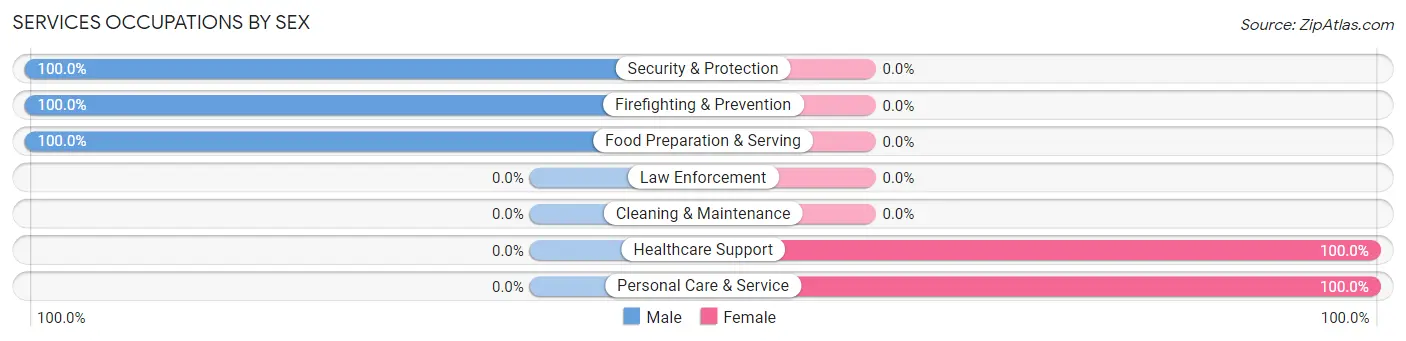
Services Occupations by Sex
Within the Services occupations in Bay Park, the most male-oriented occupations are Security & Protection (100.0%), Firefighting & Prevention (100.0%), and Food Preparation & Serving (100.0%), while the most female-oriented occupations are Healthcare Support (100.0%), and Personal Care & Service (100.0%).
| Occupation | Male | Female |
| Healthcare Support | 0 (0.0%) | 22 (100.0%) |
| Security & Protection | 8 (100.0%) | 0 (0.0%) |
| Firefighting & Prevention | 8 (100.0%) | 0 (0.0%) |
| Law Enforcement | 0 (0.0%) | 0 (0.0%) |
| Food Preparation & Serving | 17 (100.0%) | 0 (0.0%) |
| Cleaning & Maintenance | 0 (0.0%) | 0 (0.0%) |
| Personal Care & Service | 0 (0.0%) | 43 (100.0%) |
| Total (Category) | 25 (27.8%) | 65 (72.2%) |
| Total (Overall) | 300 (48.2%) | 322 (51.8%) |
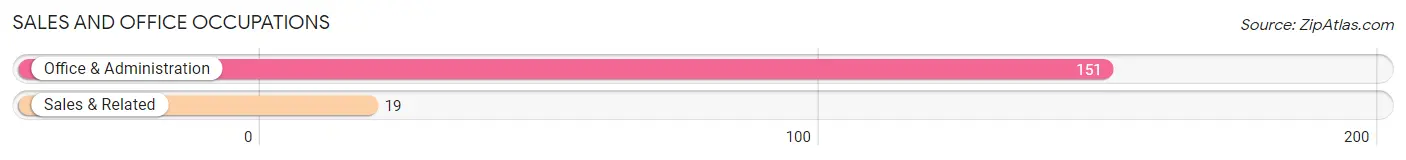
Sales and Office Occupations
The most common Sales and Office occupations in Bay Park are Office & Administration (151 | 24.3%), and Sales & Related (19 | 3.0%).
Sales and Office Occupations by Sex
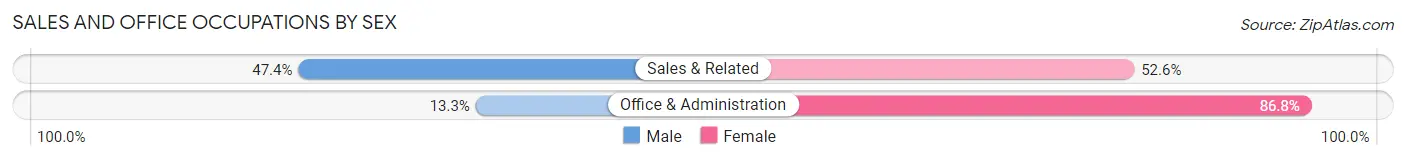
| Occupation | Male | Female |
| Sales & Related | 9 (47.4%) | 10 (52.6%) |
| Office & Administration | 20 (13.3%) | 131 (86.8%) |
| Total (Category) | 29 (17.1%) | 141 (82.9%) |
| Total (Overall) | 300 (48.2%) | 322 (51.8%) |
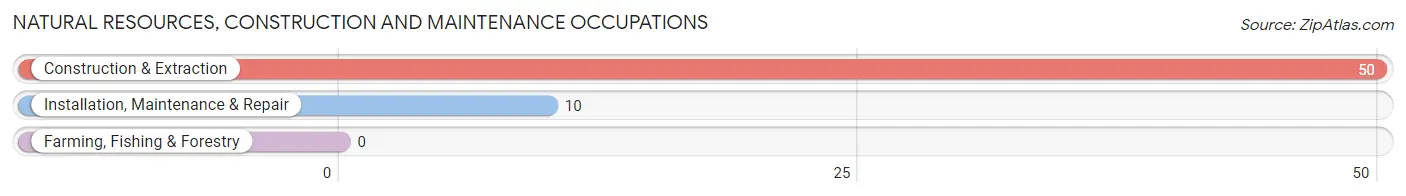
Natural Resources, Construction and Maintenance Occupations
The most common Natural Resources, Construction and Maintenance occupations in Bay Park are Construction & Extraction (50 | 8.0%), and Installation, Maintenance & Repair (10 | 1.6%).
Natural Resources, Construction and Maintenance Occupations by Sex
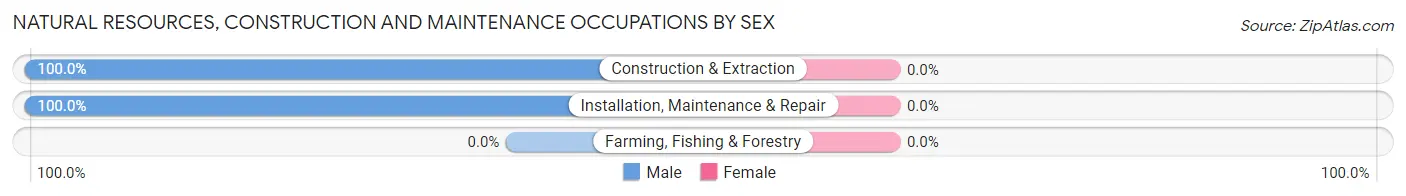
| Occupation | Male | Female |
| Farming, Fishing & Forestry | 0 (0.0%) | 0 (0.0%) |
| Construction & Extraction | 50 (100.0%) | 0 (0.0%) |
| Installation, Maintenance & Repair | 10 (100.0%) | 0 (0.0%) |
| Total (Category) | 60 (100.0%) | 0 (0.0%) |
| Total (Overall) | 300 (48.2%) | 322 (51.8%) |
Production, Transportation and Moving Occupations
The most common Production, Transportation and Moving occupations in Bay Park are Production (75 | 12.1%), and Transportation (20 | 3.2%).
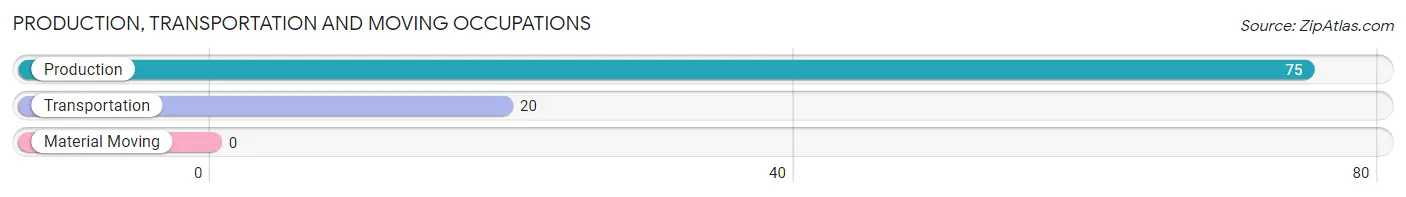
Production, Transportation and Moving Occupations by Sex
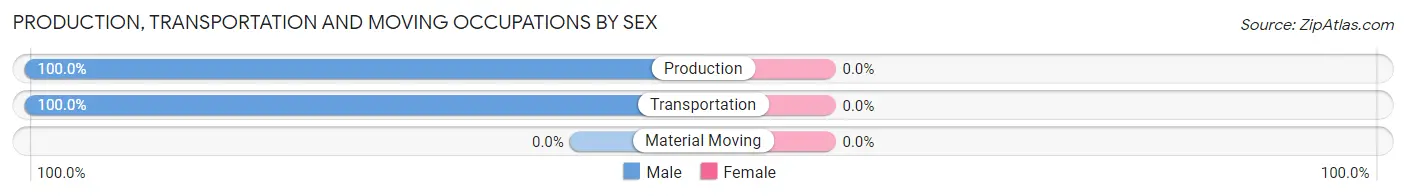
| Occupation | Male | Female |
| Production | 75 (100.0%) | 0 (0.0%) |
| Transportation | 20 (100.0%) | 0 (0.0%) |
| Material Moving | 0 (0.0%) | 0 (0.0%) |
| Total (Category) | 95 (100.0%) | 0 (0.0%) |
| Total (Overall) | 300 (48.2%) | 322 (51.8%) |
Employment Industries by Sex in Bay Park
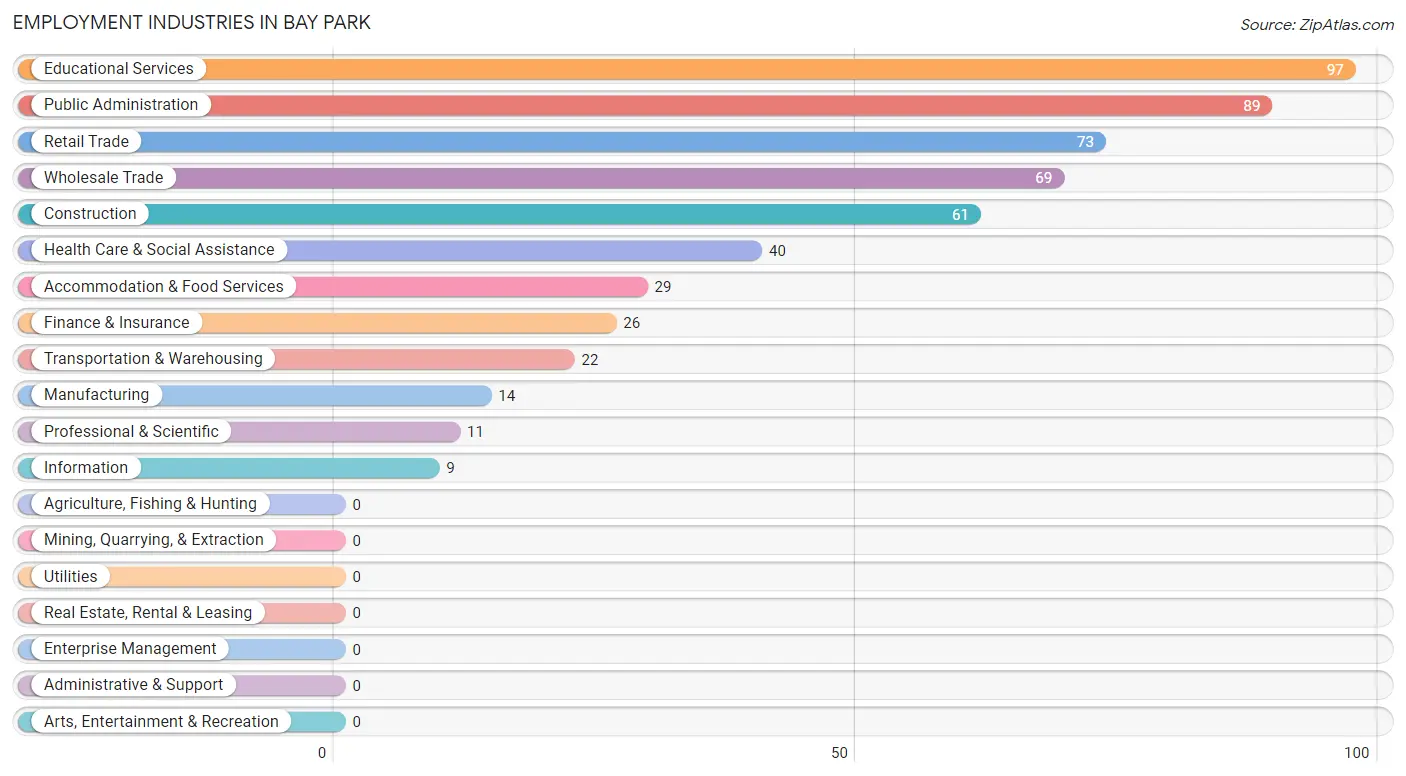
Employment Industries in Bay Park
The major employment industries in Bay Park include Educational Services (97 | 15.6%), Public Administration (89 | 14.3%), Retail Trade (73 | 11.7%), Wholesale Trade (69 | 11.1%), and Construction (61 | 9.8%).
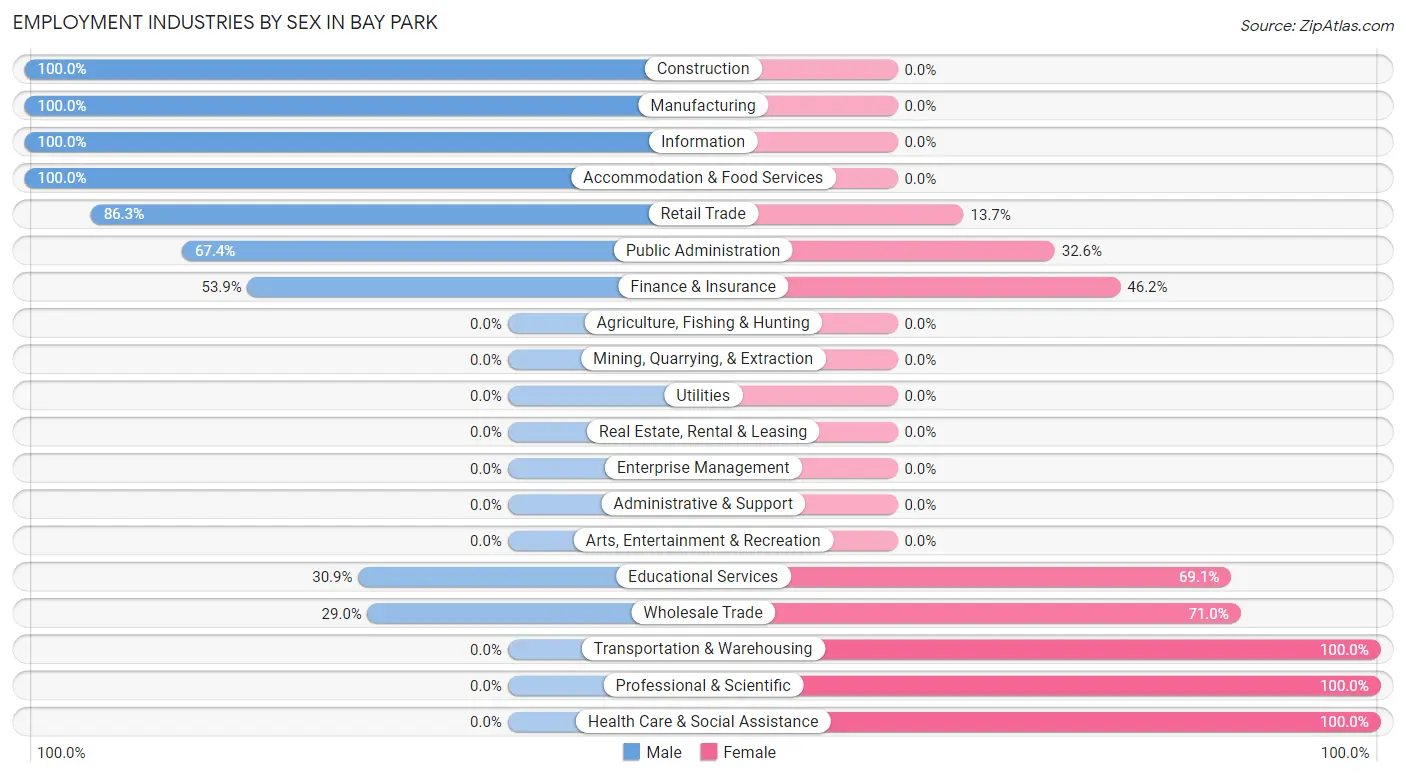
Employment Industries by Sex in Bay Park
The Bay Park industries that see more men than women are Construction (100.0%), Manufacturing (100.0%), and Information (100.0%), whereas the industries that tend to have a higher number of women are Transportation & Warehousing (100.0%), Professional & Scientific (100.0%), and Health Care & Social Assistance (100.0%).
| Industry | Male | Female |
| Agriculture, Fishing & Hunting | 0 (0.0%) | 0 (0.0%) |
| Mining, Quarrying, & Extraction | 0 (0.0%) | 0 (0.0%) |
| Construction | 61 (100.0%) | 0 (0.0%) |
| Manufacturing | 14 (100.0%) | 0 (0.0%) |
| Wholesale Trade | 20 (29.0%) | 49 (71.0%) |
| Retail Trade | 63 (86.3%) | 10 (13.7%) |
| Transportation & Warehousing | 0 (0.0%) | 22 (100.0%) |
| Utilities | 0 (0.0%) | 0 (0.0%) |
| Information | 9 (100.0%) | 0 (0.0%) |
| Finance & Insurance | 14 (53.8%) | 12 (46.2%) |
| Real Estate, Rental & Leasing | 0 (0.0%) | 0 (0.0%) |
| Professional & Scientific | 0 (0.0%) | 11 (100.0%) |
| Enterprise Management | 0 (0.0%) | 0 (0.0%) |
| Administrative & Support | 0 (0.0%) | 0 (0.0%) |
| Educational Services | 30 (30.9%) | 67 (69.1%) |
| Health Care & Social Assistance | 0 (0.0%) | 40 (100.0%) |
| Arts, Entertainment & Recreation | 0 (0.0%) | 0 (0.0%) |
| Accommodation & Food Services | 29 (100.0%) | 0 (0.0%) |
| Public Administration | 60 (67.4%) | 29 (32.6%) |
| Total | 300 (48.2%) | 322 (51.8%) |
Education in Bay Park
School Enrollment in Bay Park
The most common levels of schooling among the 329 students in Bay Park are college / undergraduate (94 | 28.6%), middle school (86 | 26.1%), and elementary school (61 | 18.5%).
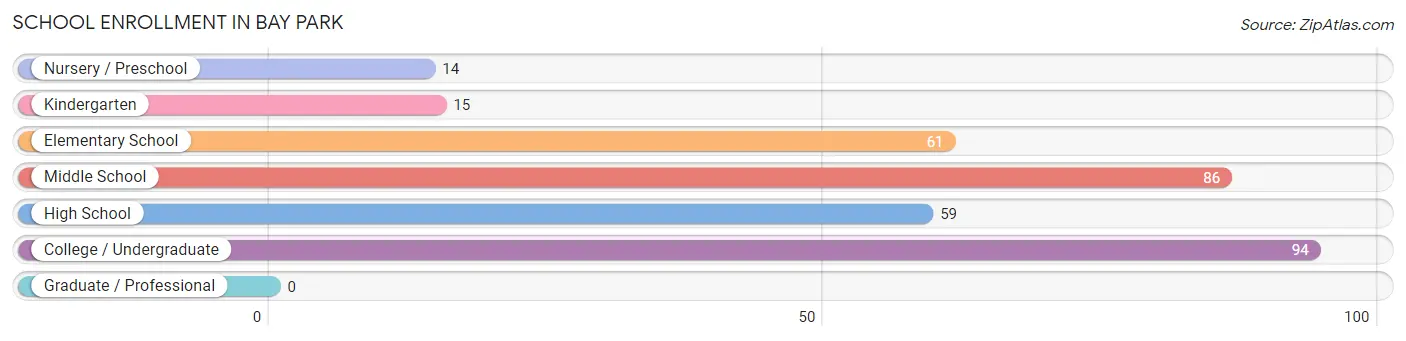
| School Level | # Students | % Students |
| Nursery / Preschool | 14 | 4.3% |
| Kindergarten | 15 | 4.6% |
| Elementary School | 61 | 18.5% |
| Middle School | 86 | 26.1% |
| High School | 59 | 17.9% |
| College / Undergraduate | 94 | 28.6% |
| Graduate / Professional | 0 | 0.0% |
| Total | 329 | 100.0% |
School Enrollment by Age by Funding Source in Bay Park
Out of a total of 329 students who are enrolled in schools in Bay Park, 73 (22.2%) attend a private institution, while the remaining 256 (77.8%) are enrolled in public schools. The age group of 3 to 4 year olds has the highest likelihood of being enrolled in private schools, with 14 (100.0% in the age bracket) enrolled. Conversely, the age group of 15 to 17 year olds has the lowest likelihood of being enrolled in a private school, with 59 (100.0% in the age bracket) attending a public institution.
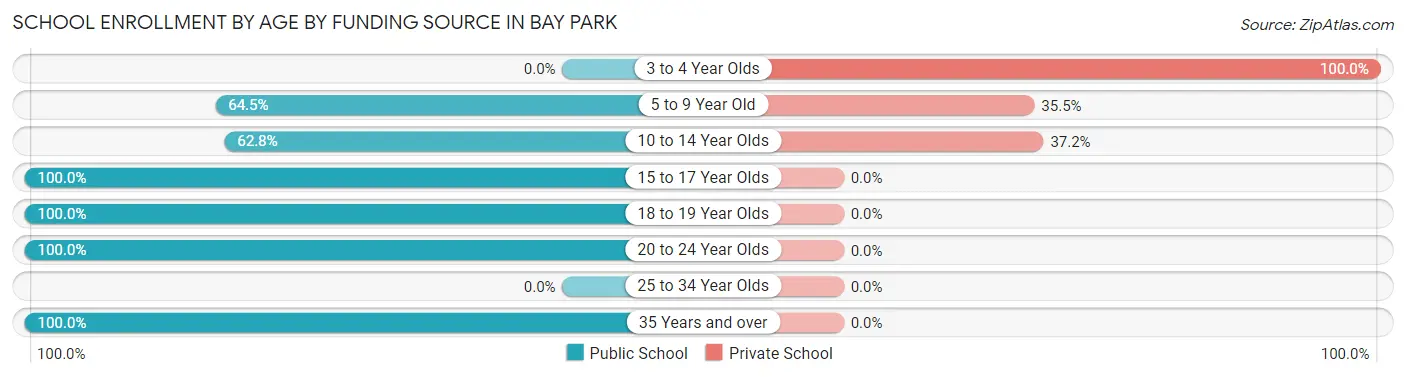
| Age Bracket | Public School | Private School |
| 3 to 4 Year Olds | 0 (0.0%) | 14 (100.0%) |
| 5 to 9 Year Old | 49 (64.5%) | 27 (35.5%) |
| 10 to 14 Year Olds | 54 (62.8%) | 32 (37.2%) |
| 15 to 17 Year Olds | 59 (100.0%) | 0 (0.0%) |
| 18 to 19 Year Olds | 27 (100.0%) | 0 (0.0%) |
| 20 to 24 Year Olds | 50 (100.0%) | 0 (0.0%) |
| 25 to 34 Year Olds | 0 (0.0%) | 0 (0.0%) |
| 35 Years and over | 17 (100.0%) | 0 (0.0%) |
| Total | 256 (77.8%) | 73 (22.2%) |
Educational Attainment by Field of Study in Bay Park
Science & technology (69 | 23.0%), social sciences (44 | 14.7%), business (42 | 14.0%), education (40 | 13.3%), and visual & performing arts (36 | 12.0%) are the most common fields of study among 300 individuals in Bay Park who have obtained a bachelor's degree or higher.
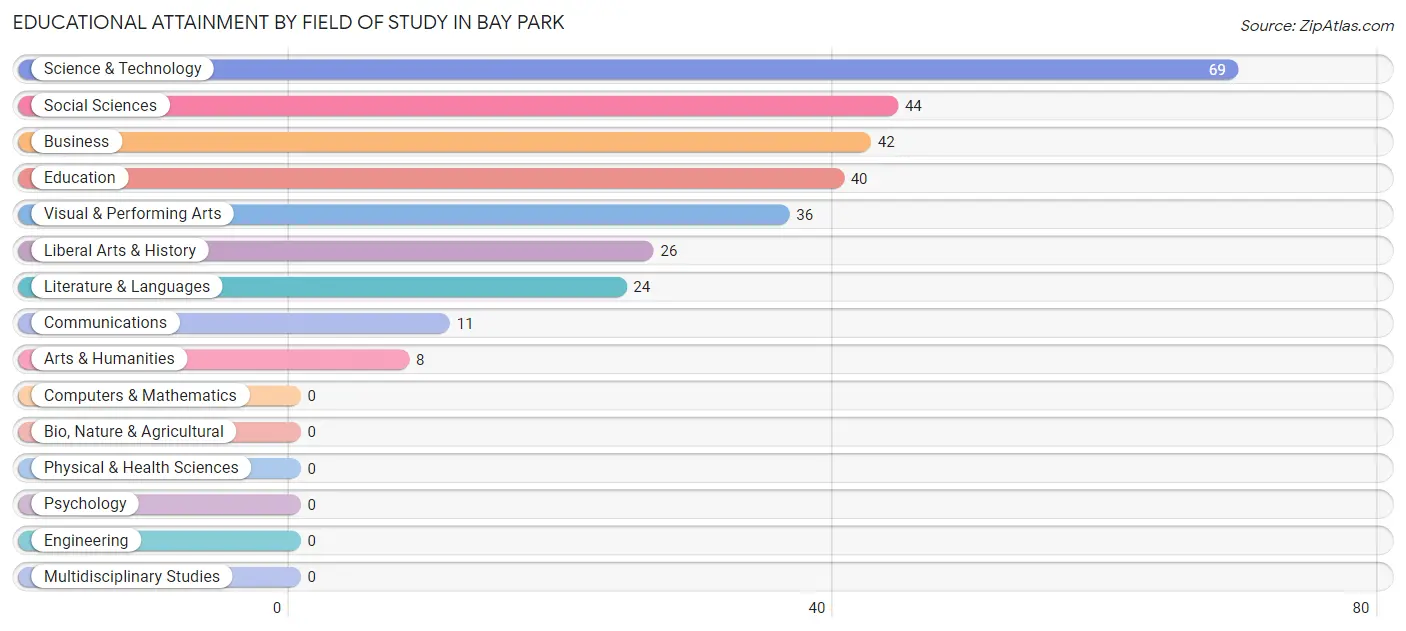
| Field of Study | # Graduates | % Graduates |
| Computers & Mathematics | 0 | 0.0% |
| Bio, Nature & Agricultural | 0 | 0.0% |
| Physical & Health Sciences | 0 | 0.0% |
| Psychology | 0 | 0.0% |
| Social Sciences | 44 | 14.7% |
| Engineering | 0 | 0.0% |
| Multidisciplinary Studies | 0 | 0.0% |
| Science & Technology | 69 | 23.0% |
| Business | 42 | 14.0% |
| Education | 40 | 13.3% |
| Literature & Languages | 24 | 8.0% |
| Liberal Arts & History | 26 | 8.7% |
| Visual & Performing Arts | 36 | 12.0% |
| Communications | 11 | 3.7% |
| Arts & Humanities | 8 | 2.7% |
| Total | 300 | 100.0% |
Transportation & Commute in Bay Park
Vehicle Availability by Sex in Bay Park
The most prevalent vehicle ownership categories in Bay Park are males with 2 vehicles (164, accounting for 54.7%) and females with 2 vehicles (158, making up 50.9%).
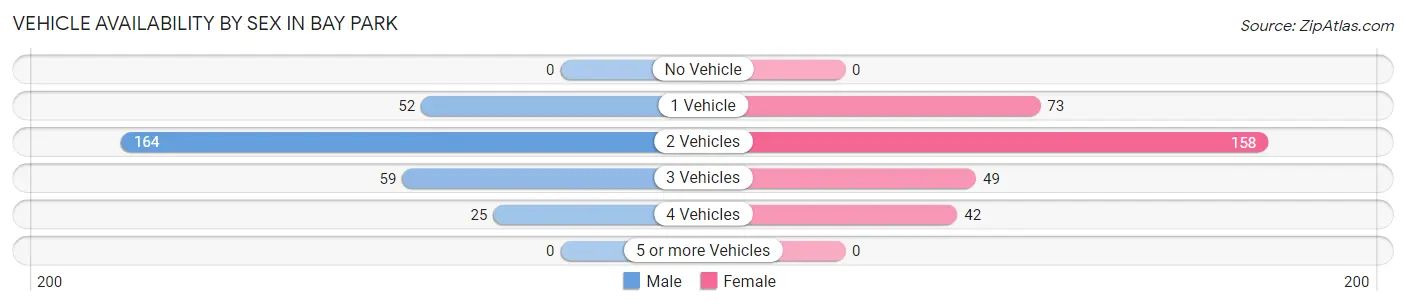
| Vehicles Available | Male | Female |
| No Vehicle | 0 (0.0%) | 0 (0.0%) |
| 1 Vehicle | 52 (17.3%) | 73 (22.7%) |
| 2 Vehicles | 164 (54.7%) | 158 (49.1%) |
| 3 Vehicles | 59 (19.7%) | 49 (15.2%) |
| 4 Vehicles | 25 (8.3%) | 42 (13.0%) |
| 5 or more Vehicles | 0 (0.0%) | 0 (0.0%) |
| Total | 300 (100.0%) | 322 (100.0%) |
Commute Time in Bay Park
The most frequently occuring commute durations in Bay Park are 60 to 89 minutes (108 commuters, 19.2%), 10 to 14 minutes (92 commuters, 16.3%), and 30 to 34 minutes (91 commuters, 16.1%).
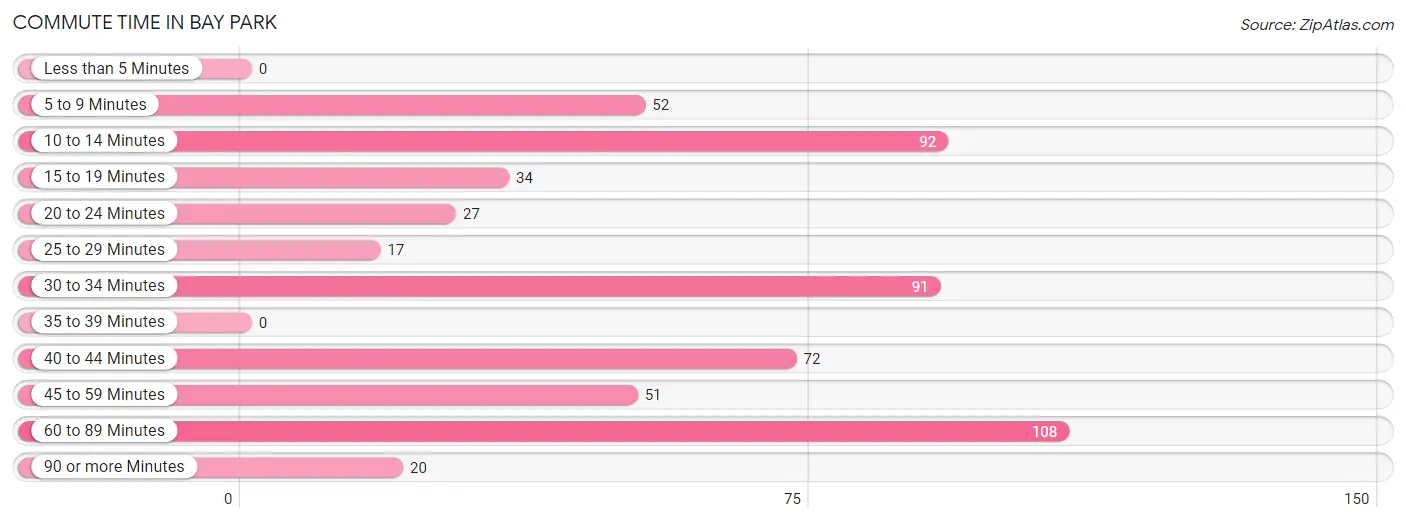
| Commute Time | # Commuters | % Commuters |
| Less than 5 Minutes | 0 | 0.0% |
| 5 to 9 Minutes | 52 | 9.2% |
| 10 to 14 Minutes | 92 | 16.3% |
| 15 to 19 Minutes | 34 | 6.0% |
| 20 to 24 Minutes | 27 | 4.8% |
| 25 to 29 Minutes | 17 | 3.0% |
| 30 to 34 Minutes | 91 | 16.1% |
| 35 to 39 Minutes | 0 | 0.0% |
| 40 to 44 Minutes | 72 | 12.8% |
| 45 to 59 Minutes | 51 | 9.0% |
| 60 to 89 Minutes | 108 | 19.2% |
| 90 or more Minutes | 20 | 3.5% |
Commute Time by Sex in Bay Park
The most common commute times in Bay Park are 30 to 34 minutes (70 commuters, 24.0%) for males and 40 to 44 minutes (72 commuters, 26.5%) for females.
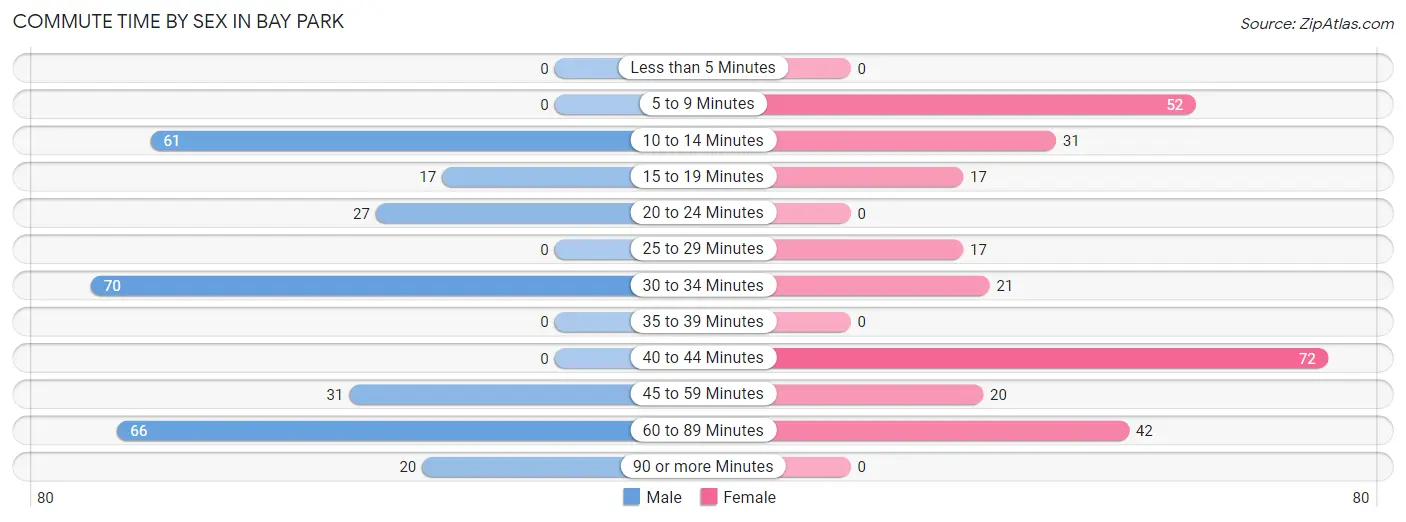
| Commute Time | Male | Female |
| Less than 5 Minutes | 0 (0.0%) | 0 (0.0%) |
| 5 to 9 Minutes | 0 (0.0%) | 52 (19.1%) |
| 10 to 14 Minutes | 61 (20.9%) | 31 (11.4%) |
| 15 to 19 Minutes | 17 (5.8%) | 17 (6.2%) |
| 20 to 24 Minutes | 27 (9.2%) | 0 (0.0%) |
| 25 to 29 Minutes | 0 (0.0%) | 17 (6.2%) |
| 30 to 34 Minutes | 70 (24.0%) | 21 (7.7%) |
| 35 to 39 Minutes | 0 (0.0%) | 0 (0.0%) |
| 40 to 44 Minutes | 0 (0.0%) | 72 (26.5%) |
| 45 to 59 Minutes | 31 (10.6%) | 20 (7.3%) |
| 60 to 89 Minutes | 66 (22.6%) | 42 (15.4%) |
| 90 or more Minutes | 20 (6.9%) | 0 (0.0%) |
Time of Departure to Work by Sex in Bay Park
The most frequent times of departure to work in Bay Park are 8:00 AM to 8:29 AM (63, 21.6%) for males and 7:30 AM to 7:59 AM (108, 39.7%) for females.
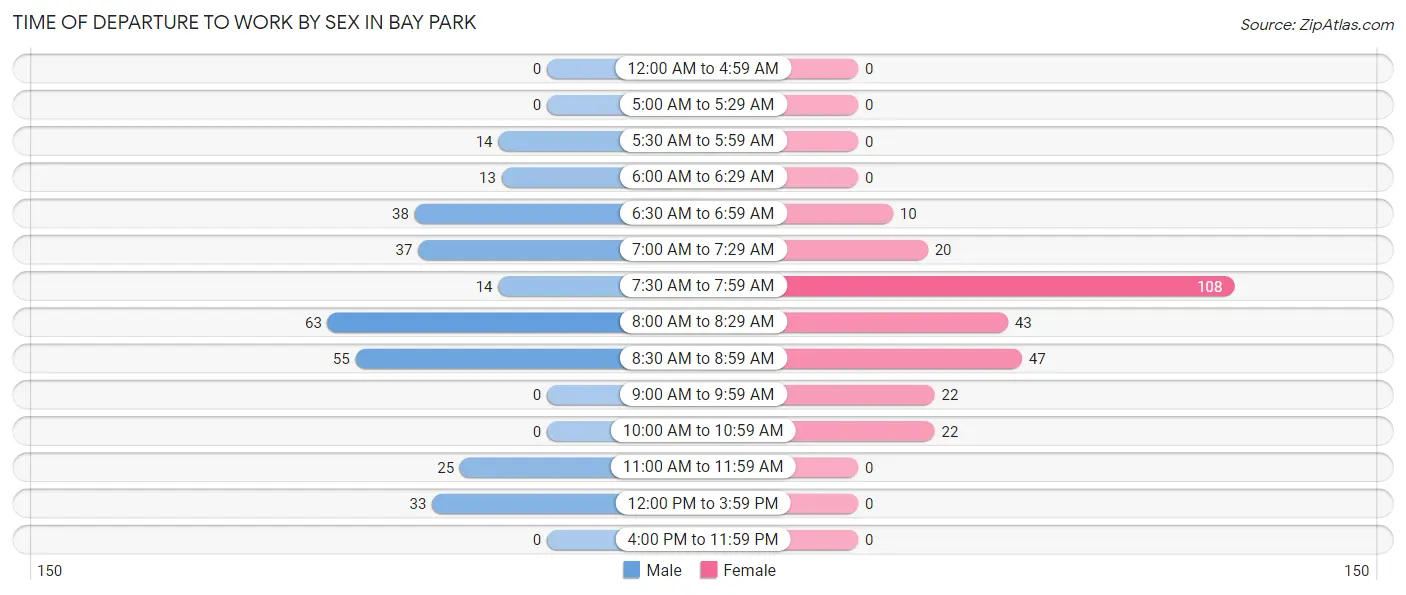
| Time of Departure | Male | Female |
| 12:00 AM to 4:59 AM | 0 (0.0%) | 0 (0.0%) |
| 5:00 AM to 5:29 AM | 0 (0.0%) | 0 (0.0%) |
| 5:30 AM to 5:59 AM | 14 (4.8%) | 0 (0.0%) |
| 6:00 AM to 6:29 AM | 13 (4.4%) | 0 (0.0%) |
| 6:30 AM to 6:59 AM | 38 (13.0%) | 10 (3.7%) |
| 7:00 AM to 7:29 AM | 37 (12.7%) | 20 (7.3%) |
| 7:30 AM to 7:59 AM | 14 (4.8%) | 108 (39.7%) |
| 8:00 AM to 8:29 AM | 63 (21.6%) | 43 (15.8%) |
| 8:30 AM to 8:59 AM | 55 (18.8%) | 47 (17.3%) |
| 9:00 AM to 9:59 AM | 0 (0.0%) | 22 (8.1%) |
| 10:00 AM to 10:59 AM | 0 (0.0%) | 22 (8.1%) |
| 11:00 AM to 11:59 AM | 25 (8.6%) | 0 (0.0%) |
| 12:00 PM to 3:59 PM | 33 (11.3%) | 0 (0.0%) |
| 4:00 PM to 11:59 PM | 0 (0.0%) | 0 (0.0%) |
| Total | 292 (100.0%) | 272 (100.0%) |
Housing Occupancy in Bay Park
Occupancy by Ownership in Bay Park
Of the total 593 dwellings in Bay Park, owner-occupied units account for 547 (92.2%), while renter-occupied units make up 46 (7.8%).
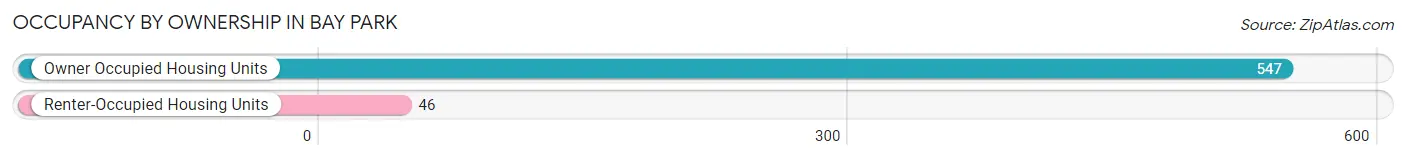
| Occupancy | # Housing Units | % Housing Units |
| Owner Occupied Housing Units | 547 | 92.2% |
| Renter-Occupied Housing Units | 46 | 7.8% |
| Total Occupied Housing Units | 593 | 100.0% |
Occupancy by Household Size in Bay Park
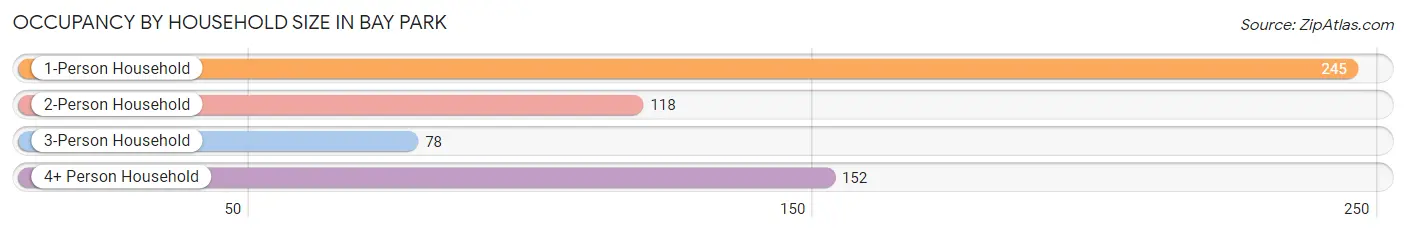
| Household Size | # Housing Units | % Housing Units |
| 1-Person Household | 245 | 41.3% |
| 2-Person Household | 118 | 19.9% |
| 3-Person Household | 78 | 13.2% |
| 4+ Person Household | 152 | 25.6% |
| Total Housing Units | 593 | 100.0% |
Occupancy by Ownership by Household Size in Bay Park
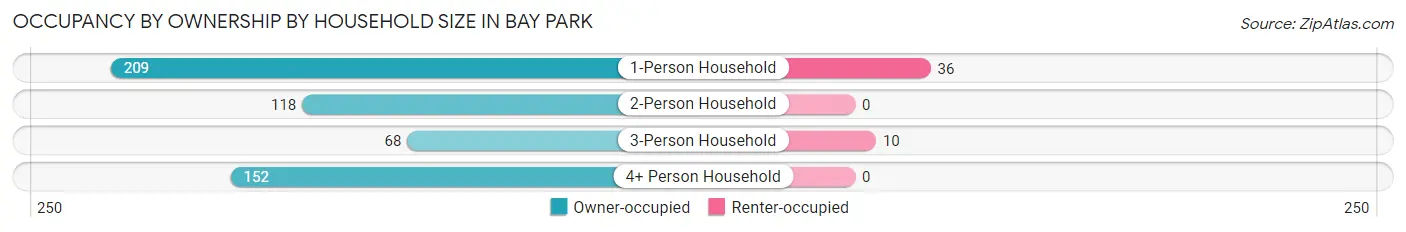
| Household Size | Owner-occupied | Renter-occupied |
| 1-Person Household | 209 (85.3%) | 36 (14.7%) |
| 2-Person Household | 118 (100.0%) | 0 (0.0%) |
| 3-Person Household | 68 (87.2%) | 10 (12.8%) |
| 4+ Person Household | 152 (100.0%) | 0 (0.0%) |
| Total Housing Units | 547 (92.2%) | 46 (7.8%) |
Occupancy by Educational Attainment in Bay Park
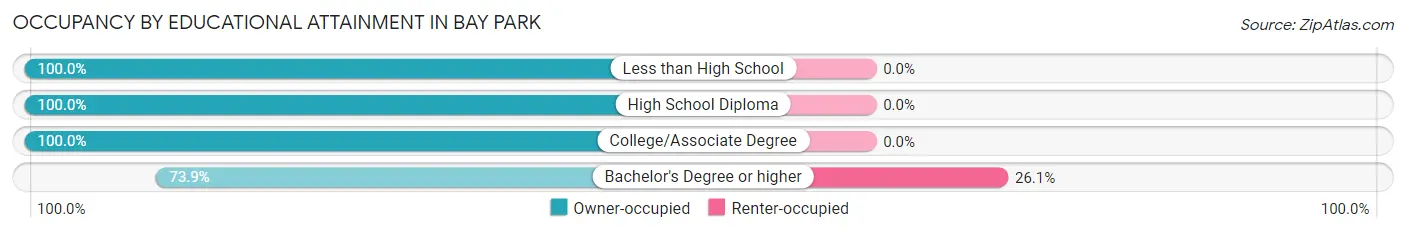
| Household Size | Owner-occupied | Renter-occupied |
| Less than High School | 69 (100.0%) | 0 (0.0%) |
| High School Diploma | 251 (100.0%) | 0 (0.0%) |
| College/Associate Degree | 97 (100.0%) | 0 (0.0%) |
| Bachelor's Degree or higher | 130 (73.9%) | 46 (26.1%) |
Occupancy by Age of Householder in Bay Park
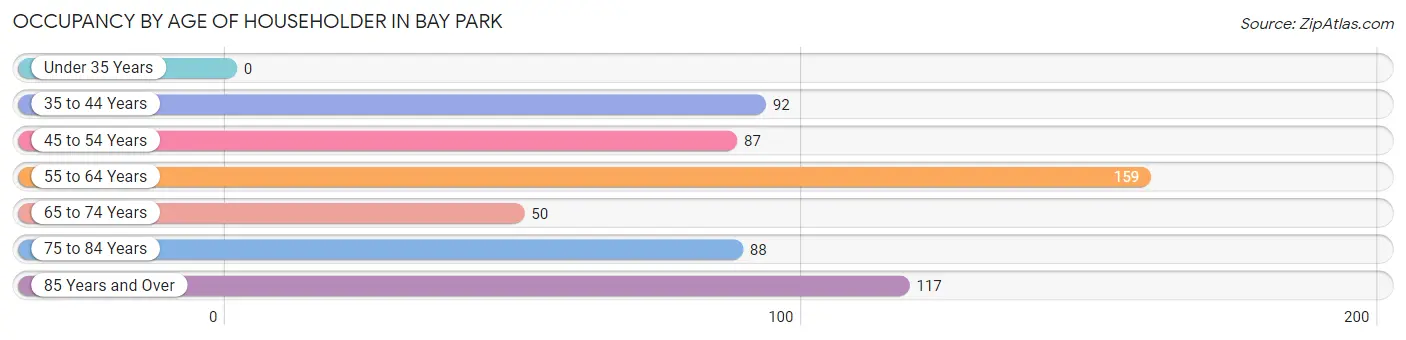
| Age Bracket | # Households | % Households |
| Under 35 Years | 0 | 0.0% |
| 35 to 44 Years | 92 | 15.5% |
| 45 to 54 Years | 87 | 14.7% |
| 55 to 64 Years | 159 | 26.8% |
| 65 to 74 Years | 50 | 8.4% |
| 75 to 84 Years | 88 | 14.8% |
| 85 Years and Over | 117 | 19.7% |
| Total | 593 | 100.0% |
Housing Finances in Bay Park
Median Income by Occupancy in Bay Park
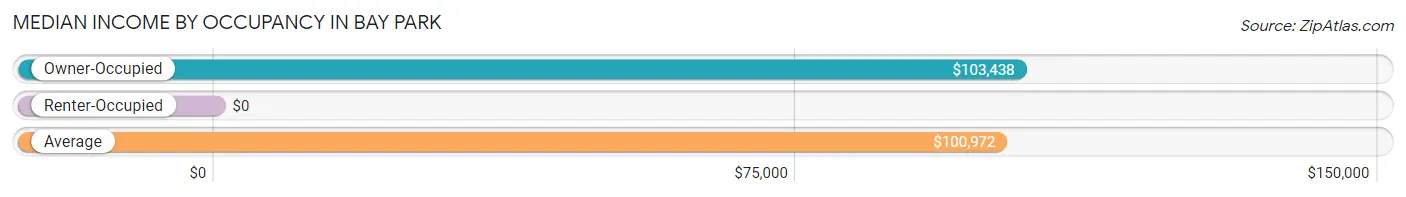
| Occupancy Type | # Households | Median Income |
| Owner-Occupied | 547 (92.2%) | $103,438 |
| Renter-Occupied | 46 (7.8%) | $0 |
| Average | 593 (100.0%) | $100,972 |
Occupancy by Householder Income Bracket in Bay Park
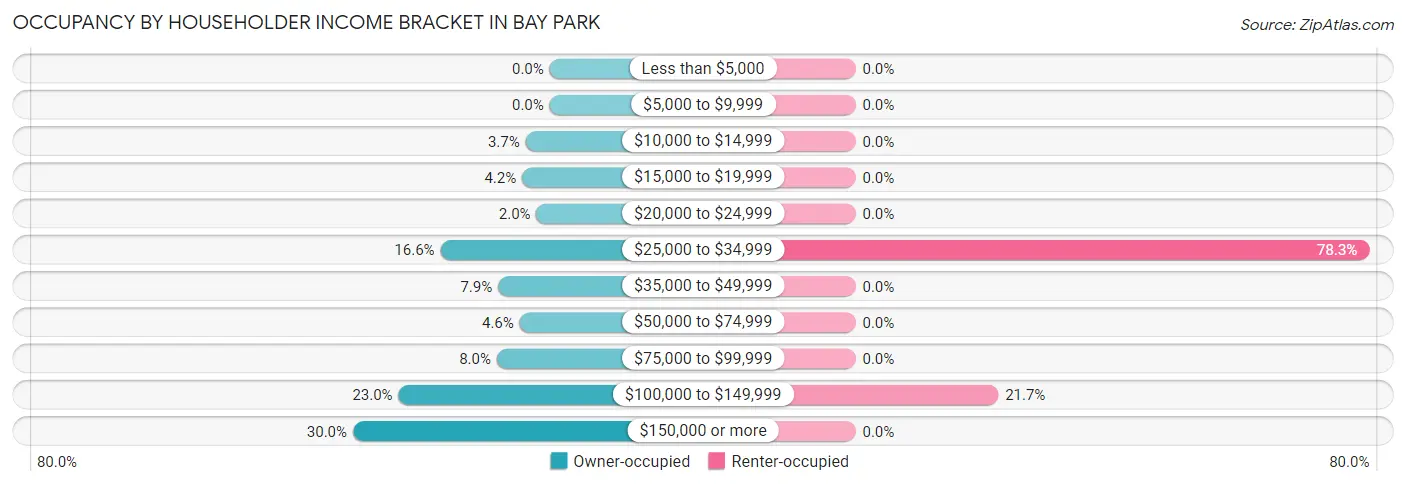
| Income Bracket | Owner-occupied | Renter-occupied |
| Less than $5,000 | 0 (0.0%) | 0 (0.0%) |
| $5,000 to $9,999 | 0 (0.0%) | 0 (0.0%) |
| $10,000 to $14,999 | 20 (3.7%) | 0 (0.0%) |
| $15,000 to $19,999 | 23 (4.2%) | 0 (0.0%) |
| $20,000 to $24,999 | 11 (2.0%) | 0 (0.0%) |
| $25,000 to $34,999 | 91 (16.6%) | 36 (78.3%) |
| $35,000 to $49,999 | 43 (7.9%) | 0 (0.0%) |
| $50,000 to $74,999 | 25 (4.6%) | 0 (0.0%) |
| $75,000 to $99,999 | 44 (8.0%) | 0 (0.0%) |
| $100,000 to $149,999 | 126 (23.0%) | 10 (21.7%) |
| $150,000 or more | 164 (30.0%) | 0 (0.0%) |
| Total | 547 (100.0%) | 46 (100.0%) |
Monthly Housing Cost Tiers in Bay Park
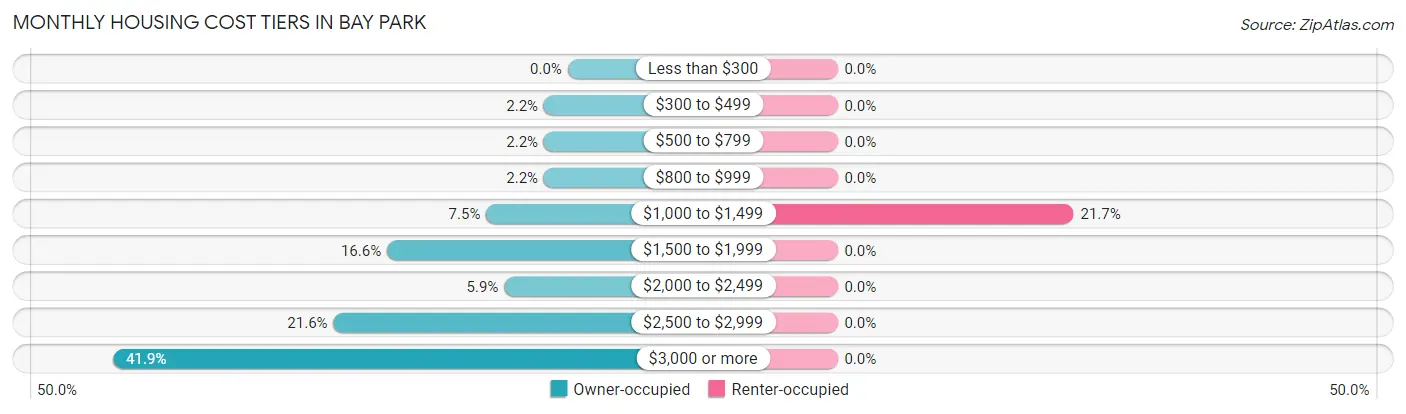
| Monthly Cost | Owner-occupied | Renter-occupied |
| Less than $300 | 0 (0.0%) | 0 (0.0%) |
| $300 to $499 | 12 (2.2%) | 0 (0.0%) |
| $500 to $799 | 12 (2.2%) | 0 (0.0%) |
| $800 to $999 | 12 (2.2%) | 0 (0.0%) |
| $1,000 to $1,499 | 41 (7.5%) | 10 (21.7%) |
| $1,500 to $1,999 | 91 (16.6%) | 0 (0.0%) |
| $2,000 to $2,499 | 32 (5.9%) | 0 (0.0%) |
| $2,500 to $2,999 | 118 (21.6%) | 0 (0.0%) |
| $3,000 or more | 229 (41.9%) | 0 (0.0%) |
| Total | 547 (100.0%) | 46 (100.0%) |
Physical Housing Characteristics in Bay Park
Housing Structures in Bay Park
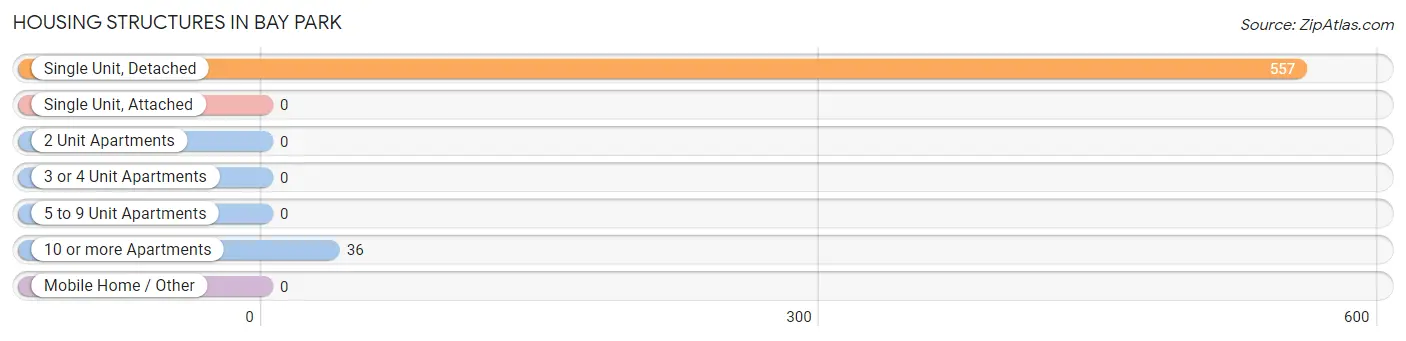
| Structure Type | # Housing Units | % Housing Units |
| Single Unit, Detached | 557 | 93.9% |
| Single Unit, Attached | 0 | 0.0% |
| 2 Unit Apartments | 0 | 0.0% |
| 3 or 4 Unit Apartments | 0 | 0.0% |
| 5 to 9 Unit Apartments | 0 | 0.0% |
| 10 or more Apartments | 36 | 6.1% |
| Mobile Home / Other | 0 | 0.0% |
| Total | 593 | 100.0% |
Housing Structures by Occupancy in Bay Park
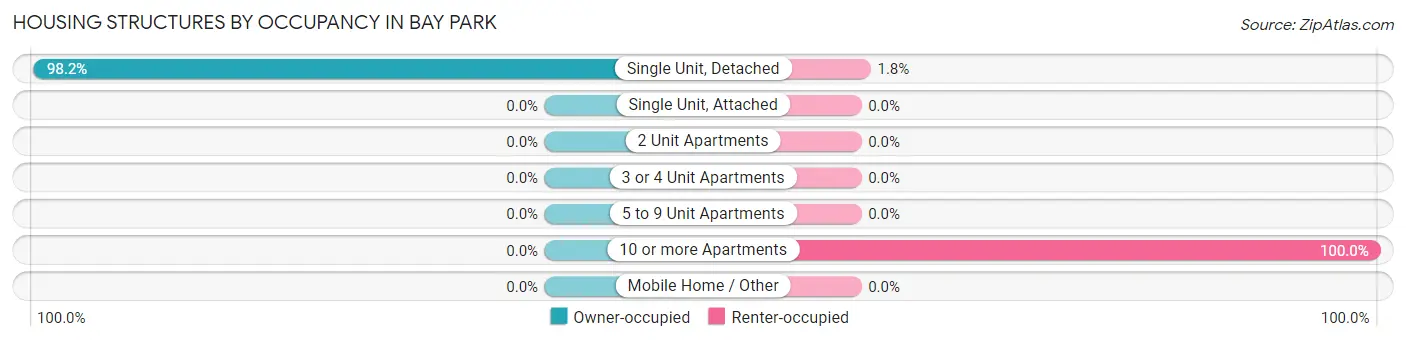
| Structure Type | Owner-occupied | Renter-occupied |
| Single Unit, Detached | 547 (98.2%) | 10 (1.8%) |
| Single Unit, Attached | 0 (0.0%) | 0 (0.0%) |
| 2 Unit Apartments | 0 (0.0%) | 0 (0.0%) |
| 3 or 4 Unit Apartments | 0 (0.0%) | 0 (0.0%) |
| 5 to 9 Unit Apartments | 0 (0.0%) | 0 (0.0%) |
| 10 or more Apartments | 0 (0.0%) | 36 (100.0%) |
| Mobile Home / Other | 0 (0.0%) | 0 (0.0%) |
| Total | 547 (92.2%) | 46 (7.8%) |
Housing Structures by Number of Rooms in Bay Park
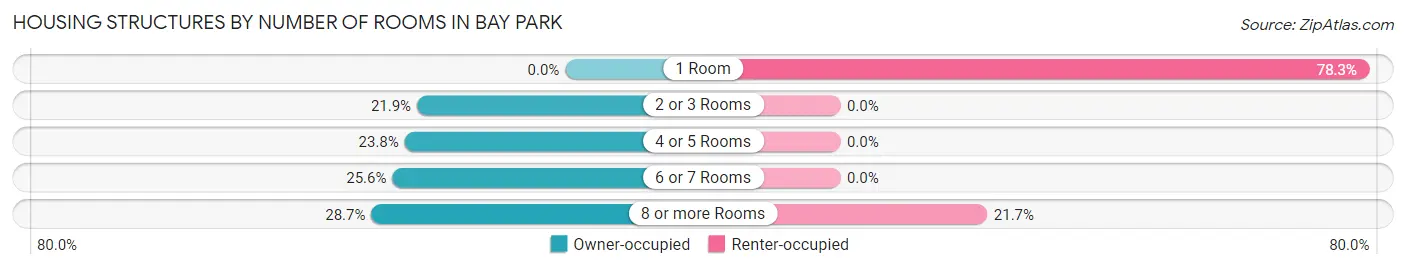
| Number of Rooms | Owner-occupied | Renter-occupied |
| 1 Room | 0 (0.0%) | 36 (78.3%) |
| 2 or 3 Rooms | 120 (21.9%) | 0 (0.0%) |
| 4 or 5 Rooms | 130 (23.8%) | 0 (0.0%) |
| 6 or 7 Rooms | 140 (25.6%) | 0 (0.0%) |
| 8 or more Rooms | 157 (28.7%) | 10 (21.7%) |
| Total | 547 (100.0%) | 46 (100.0%) |
Housing Structure by Heating Type in Bay Park
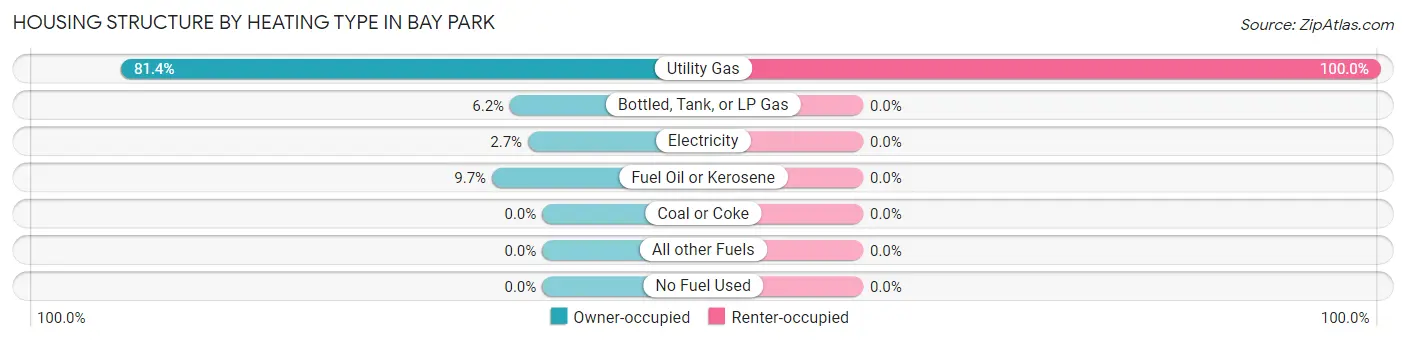
| Heating Type | Owner-occupied | Renter-occupied |
| Utility Gas | 445 (81.4%) | 46 (100.0%) |
| Bottled, Tank, or LP Gas | 34 (6.2%) | 0 (0.0%) |
| Electricity | 15 (2.7%) | 0 (0.0%) |
| Fuel Oil or Kerosene | 53 (9.7%) | 0 (0.0%) |
| Coal or Coke | 0 (0.0%) | 0 (0.0%) |
| All other Fuels | 0 (0.0%) | 0 (0.0%) |
| No Fuel Used | 0 (0.0%) | 0 (0.0%) |
| Total | 547 (100.0%) | 46 (100.0%) |
Household Vehicle Usage in Bay Park
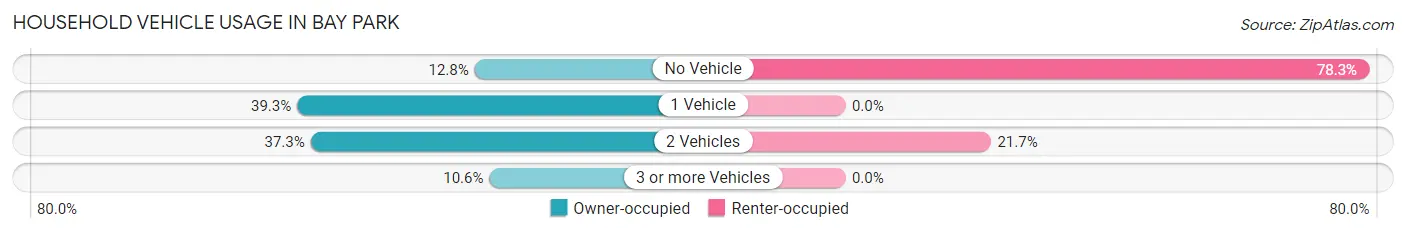
| Vehicles per Household | Owner-occupied | Renter-occupied |
| No Vehicle | 70 (12.8%) | 36 (78.3%) |
| 1 Vehicle | 215 (39.3%) | 0 (0.0%) |
| 2 Vehicles | 204 (37.3%) | 10 (21.7%) |
| 3 or more Vehicles | 58 (10.6%) | 0 (0.0%) |
| Total | 547 (100.0%) | 46 (100.0%) |
Real Estate & Mortgages in Bay Park
Real Estate and Mortgage Overview in Bay Park
| Characteristic | Without Mortgage | With Mortgage |
| Housing Units | 136 | 411 |
| Median Property Value | $500,000 | $472,700 |
| Median Household Income | - | - |
| Monthly Housing Costs | $1,350 | $229 |
| Real Estate Taxes | $10,001 | $17 |
Property Value by Mortgage Status in Bay Park
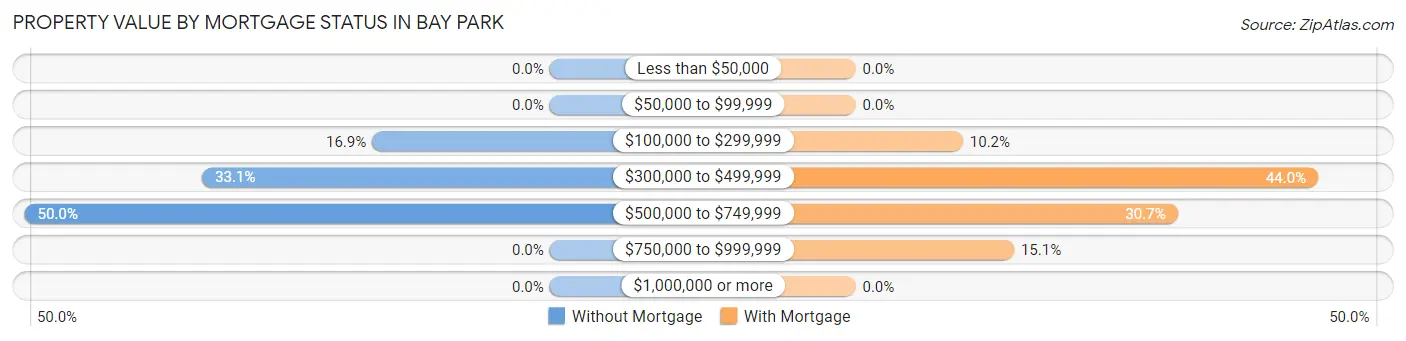
| Property Value | Without Mortgage | With Mortgage |
| Less than $50,000 | 0 (0.0%) | 0 (0.0%) |
| $50,000 to $99,999 | 0 (0.0%) | 0 (0.0%) |
| $100,000 to $299,999 | 23 (16.9%) | 42 (10.2%) |
| $300,000 to $499,999 | 45 (33.1%) | 181 (44.0%) |
| $500,000 to $749,999 | 68 (50.0%) | 126 (30.7%) |
| $750,000 to $999,999 | 0 (0.0%) | 62 (15.1%) |
| $1,000,000 or more | 0 (0.0%) | 0 (0.0%) |
| Total | 136 (100.0%) | 411 (100.0%) |
Household Income by Mortgage Status in Bay Park
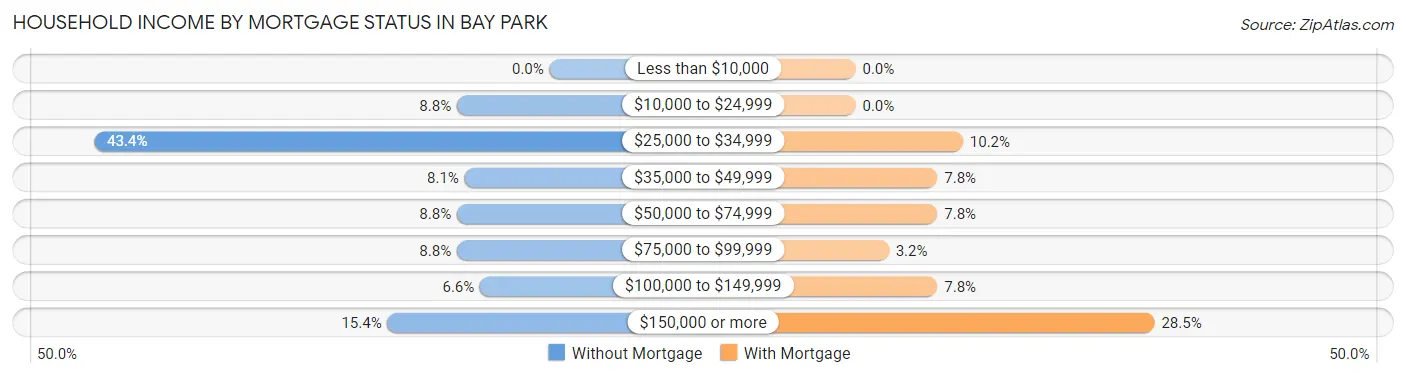
| Household Income | Without Mortgage | With Mortgage |
| Less than $10,000 | 0 (0.0%) | 0 (0.0%) |
| $10,000 to $24,999 | 12 (8.8%) | 0 (0.0%) |
| $25,000 to $34,999 | 59 (43.4%) | 42 (10.2%) |
| $35,000 to $49,999 | 11 (8.1%) | 32 (7.8%) |
| $50,000 to $74,999 | 12 (8.8%) | 32 (7.8%) |
| $75,000 to $99,999 | 12 (8.8%) | 13 (3.2%) |
| $100,000 to $149,999 | 9 (6.6%) | 32 (7.8%) |
| $150,000 or more | 21 (15.4%) | 117 (28.5%) |
| Total | 136 (100.0%) | 411 (100.0%) |
Property Value to Household Income Ratio in Bay Park
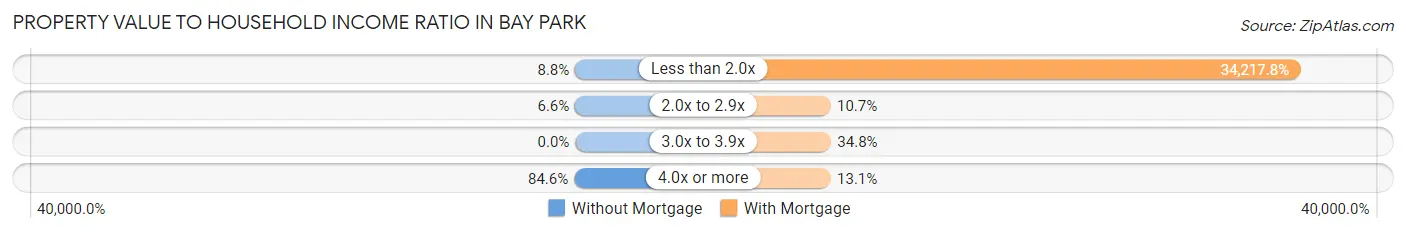
| Value-to-Income Ratio | Without Mortgage | With Mortgage |
| Less than 2.0x | 12 (8.8%) | 140,635 (34,217.8%) |
| 2.0x to 2.9x | 9 (6.6%) | 44 (10.7%) |
| 3.0x to 3.9x | 0 (0.0%) | 143 (34.8%) |
| 4.0x or more | 115 (84.6%) | 54 (13.1%) |
| Total | 136 (100.0%) | 411 (100.0%) |
Real Estate Taxes by Mortgage Status in Bay Park
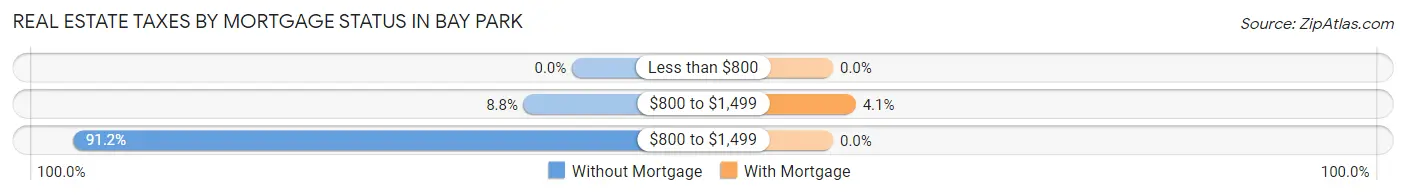
| Property Taxes | Without Mortgage | With Mortgage |
| Less than $800 | 0 (0.0%) | 0 (0.0%) |
| $800 to $1,499 | 12 (8.8%) | 17 (4.1%) |
| $800 to $1,499 | 124 (91.2%) | 0 (0.0%) |
| Total | 136 (100.0%) | 411 (100.0%) |
Health & Disability in Bay Park
Health Insurance Coverage by Age in Bay Park
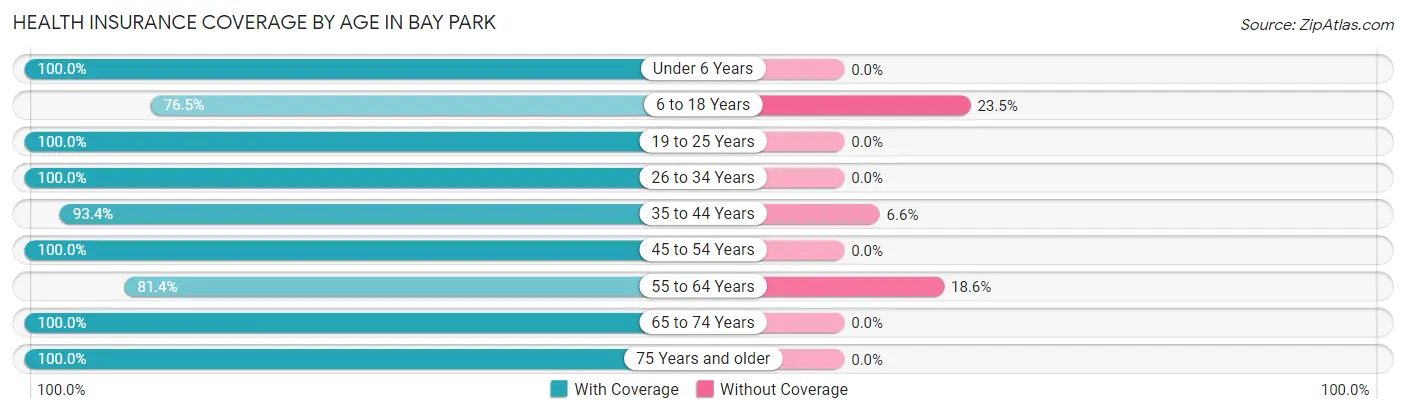
| Age Bracket | With Coverage | Without Coverage |
| Under 6 Years | 90 (100.0%) | 0 (0.0%) |
| 6 to 18 Years | 169 (76.5%) | 52 (23.5%) |
| 19 to 25 Years | 95 (100.0%) | 0 (0.0%) |
| 26 to 34 Years | 85 (100.0%) | 0 (0.0%) |
| 35 to 44 Years | 156 (93.4%) | 11 (6.6%) |
| 45 to 54 Years | 155 (100.0%) | 0 (0.0%) |
| 55 to 64 Years | 188 (81.4%) | 43 (18.6%) |
| 65 to 74 Years | 110 (100.0%) | 0 (0.0%) |
| 75 Years and older | 235 (100.0%) | 0 (0.0%) |
| Total | 1,283 (92.4%) | 106 (7.6%) |
Health Insurance Coverage by Citizenship Status in Bay Park
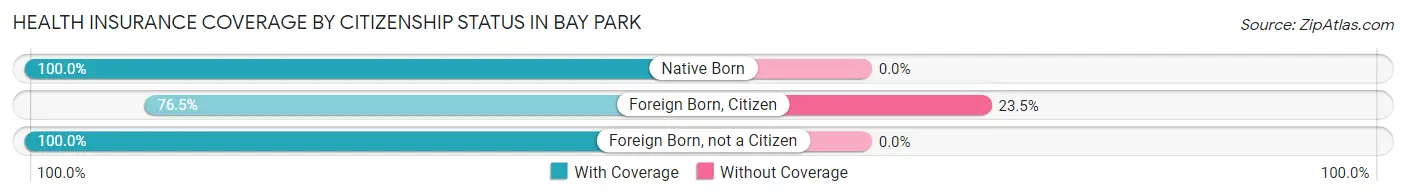
| Citizenship Status | With Coverage | Without Coverage |
| Native Born | 90 (100.0%) | 0 (0.0%) |
| Foreign Born, Citizen | 169 (76.5%) | 52 (23.5%) |
| Foreign Born, not a Citizen | 95 (100.0%) | 0 (0.0%) |
Health Insurance Coverage by Household Income in Bay Park
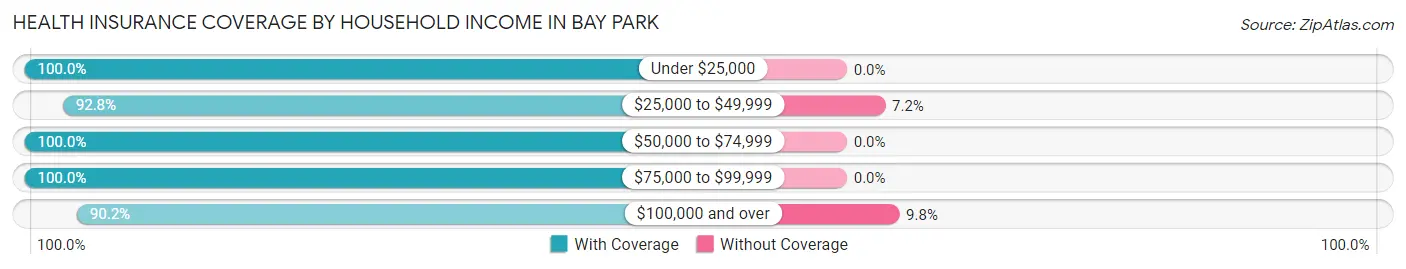
| Household Income | With Coverage | Without Coverage |
| Under $25,000 | 81 (100.0%) | 0 (0.0%) |
| $25,000 to $49,999 | 220 (92.8%) | 17 (7.2%) |
| $50,000 to $74,999 | 77 (100.0%) | 0 (0.0%) |
| $75,000 to $99,999 | 87 (100.0%) | 0 (0.0%) |
| $100,000 and over | 818 (90.2%) | 89 (9.8%) |
Public vs Private Health Insurance Coverage by Age in Bay Park
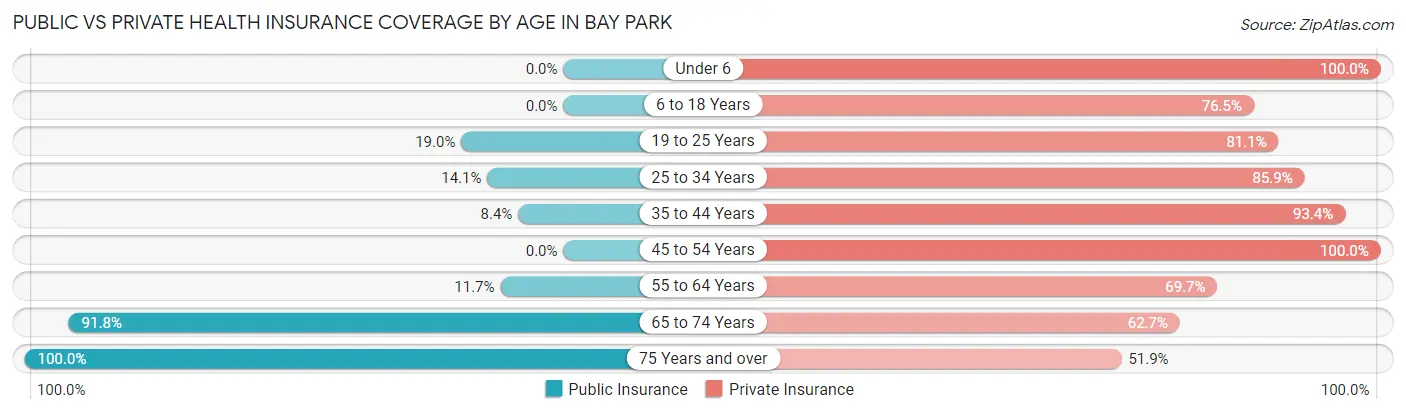
| Age Bracket | Public Insurance | Private Insurance |
| Under 6 | 0 (0.0%) | 90 (100.0%) |
| 6 to 18 Years | 0 (0.0%) | 169 (76.5%) |
| 19 to 25 Years | 18 (19.0%) | 77 (81.0%) |
| 25 to 34 Years | 12 (14.1%) | 73 (85.9%) |
| 35 to 44 Years | 14 (8.4%) | 156 (93.4%) |
| 45 to 54 Years | 0 (0.0%) | 155 (100.0%) |
| 55 to 64 Years | 27 (11.7%) | 161 (69.7%) |
| 65 to 74 Years | 101 (91.8%) | 69 (62.7%) |
| 75 Years and over | 235 (100.0%) | 122 (51.9%) |
| Total | 407 (29.3%) | 1,072 (77.2%) |
Disability Status by Sex by Age in Bay Park
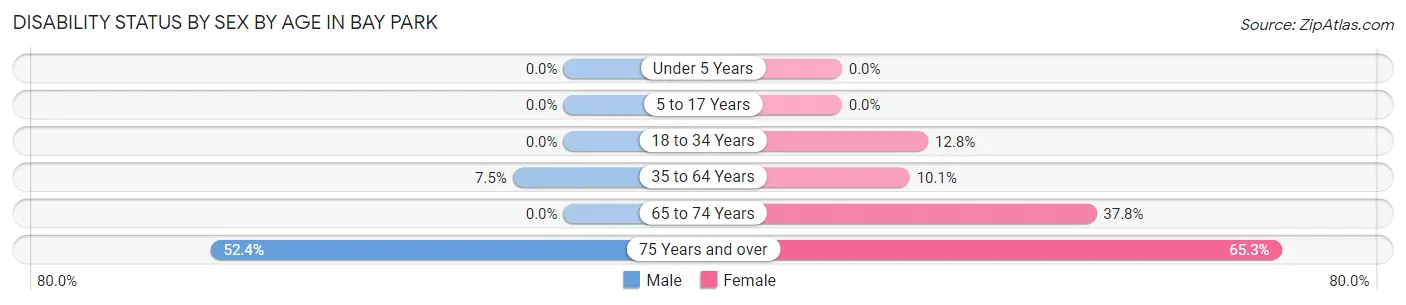
| Age Bracket | Male | Female |
| Under 5 Years | 0 (0.0%) | 0 (0.0%) |
| 5 to 17 Years | 0 (0.0%) | 0 (0.0%) |
| 18 to 34 Years | 0 (0.0%) | 10 (12.8%) |
| 35 to 64 Years | 17 (7.5%) | 33 (10.1%) |
| 65 to 74 Years | 0 (0.0%) | 31 (37.8%) |
| 75 Years and over | 22 (52.4%) | 126 (65.3%) |
Disability Class by Sex by Age in Bay Park
Disability Class: Hearing Difficulty
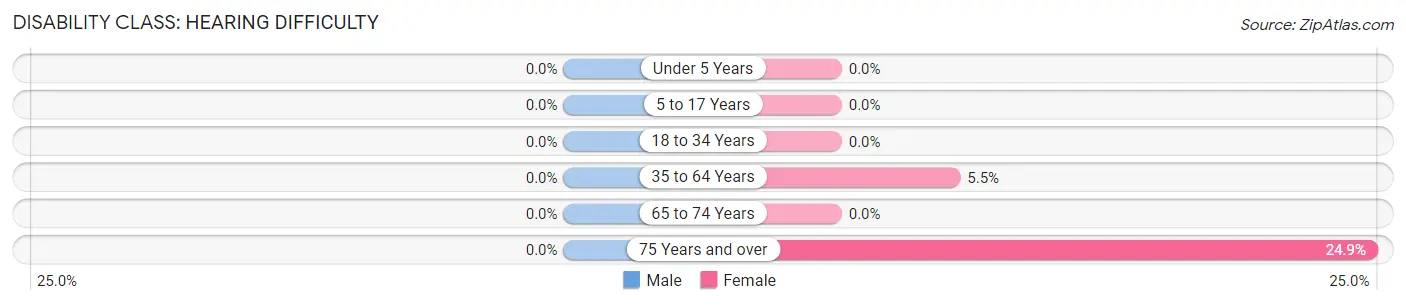
| Age Bracket | Male | Female |
| Under 5 Years | 0 (0.0%) | 0 (0.0%) |
| 5 to 17 Years | 0 (0.0%) | 0 (0.0%) |
| 18 to 34 Years | 0 (0.0%) | 0 (0.0%) |
| 35 to 64 Years | 0 (0.0%) | 18 (5.5%) |
| 65 to 74 Years | 0 (0.0%) | 0 (0.0%) |
| 75 Years and over | 0 (0.0%) | 48 (24.9%) |
Disability Class: Vision Difficulty
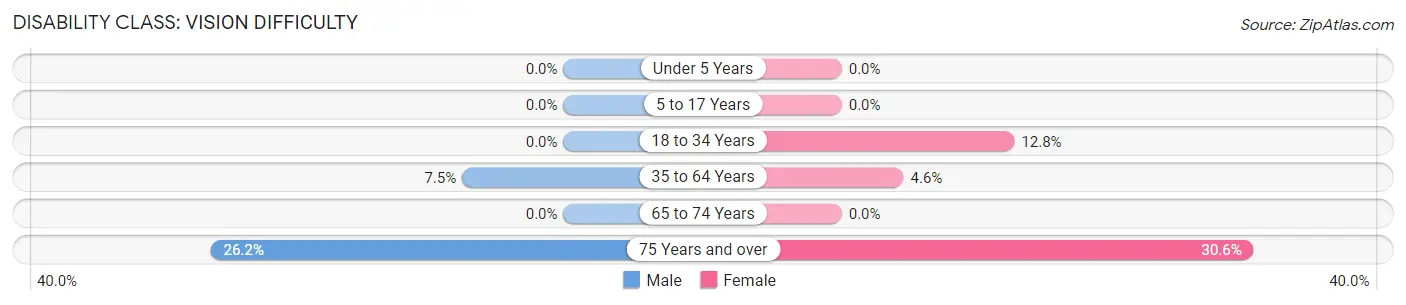
| Age Bracket | Male | Female |
| Under 5 Years | 0 (0.0%) | 0 (0.0%) |
| 5 to 17 Years | 0 (0.0%) | 0 (0.0%) |
| 18 to 34 Years | 0 (0.0%) | 10 (12.8%) |
| 35 to 64 Years | 17 (7.5%) | 15 (4.6%) |
| 65 to 74 Years | 0 (0.0%) | 0 (0.0%) |
| 75 Years and over | 11 (26.2%) | 59 (30.6%) |
Disability Class: Cognitive Difficulty
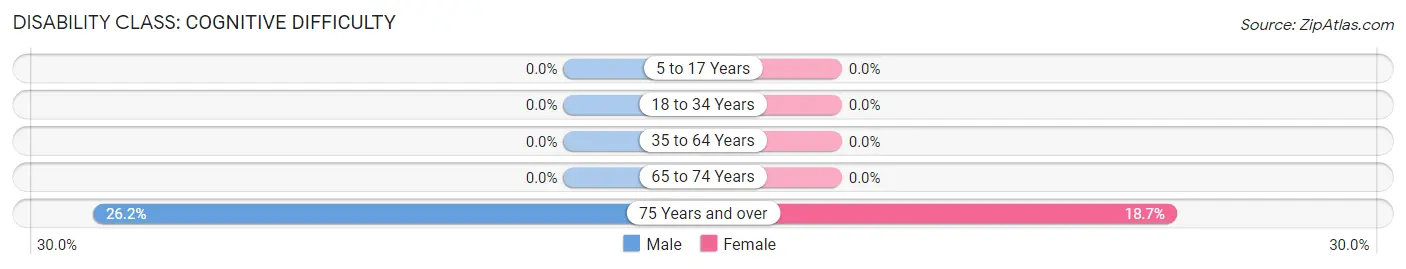
| Age Bracket | Male | Female |
| 5 to 17 Years | 0 (0.0%) | 0 (0.0%) |
| 18 to 34 Years | 0 (0.0%) | 0 (0.0%) |
| 35 to 64 Years | 0 (0.0%) | 0 (0.0%) |
| 65 to 74 Years | 0 (0.0%) | 0 (0.0%) |
| 75 Years and over | 11 (26.2%) | 36 (18.6%) |
Disability Class: Ambulatory Difficulty

| Age Bracket | Male | Female |
| 5 to 17 Years | 0 (0.0%) | 0 (0.0%) |
| 18 to 34 Years | 0 (0.0%) | 0 (0.0%) |
| 35 to 64 Years | 0 (0.0%) | 0 (0.0%) |
| 65 to 74 Years | 0 (0.0%) | 31 (37.8%) |
| 75 Years and over | 11 (26.2%) | 55 (28.5%) |
Disability Class: Self-Care Difficulty
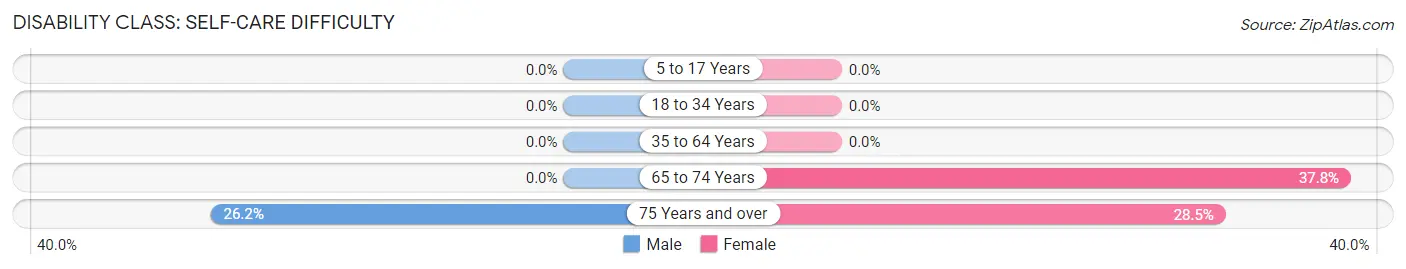
| Age Bracket | Male | Female |
| 5 to 17 Years | 0 (0.0%) | 0 (0.0%) |
| 18 to 34 Years | 0 (0.0%) | 0 (0.0%) |
| 35 to 64 Years | 0 (0.0%) | 0 (0.0%) |
| 65 to 74 Years | 0 (0.0%) | 31 (37.8%) |
| 75 Years and over | 11 (26.2%) | 55 (28.5%) |
Technology Access in Bay Park
Computing Device Access in Bay Park
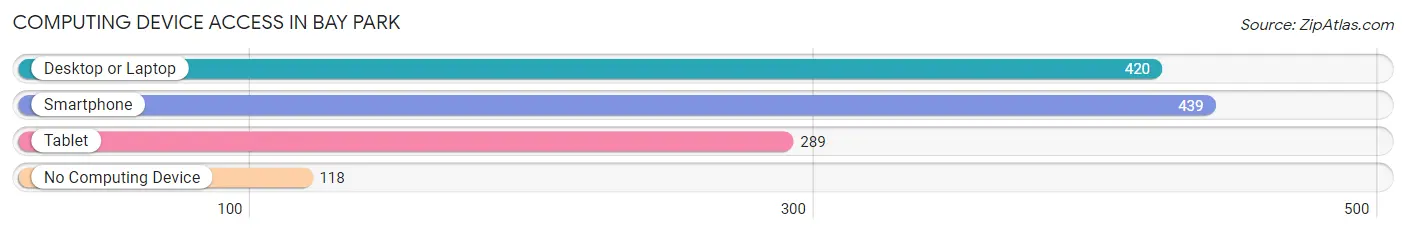
| Device Type | # Households | % Households |
| Desktop or Laptop | 420 | 70.8% |
| Smartphone | 439 | 74.0% |
| Tablet | 289 | 48.7% |
| No Computing Device | 118 | 19.9% |
| Total | 593 | 100.0% |
Internet Access in Bay Park
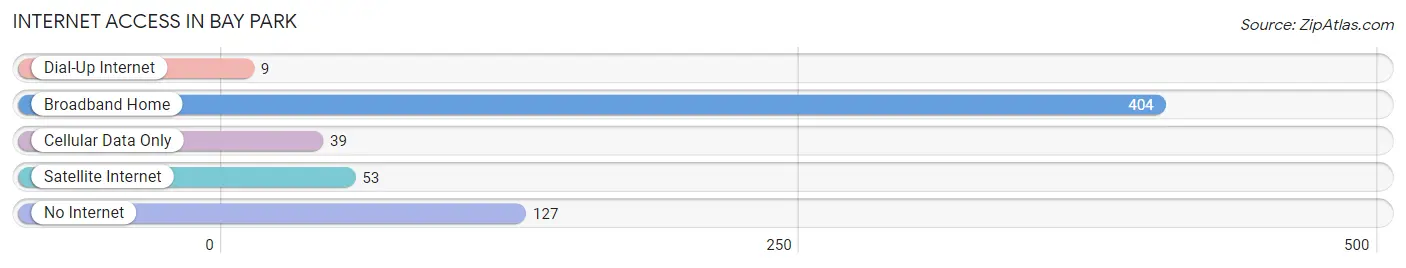
| Internet Type | # Households | % Households |
| Dial-Up Internet | 9 | 1.5% |
| Broadband Home | 404 | 68.1% |
| Cellular Data Only | 39 | 6.6% |
| Satellite Internet | 53 | 8.9% |
| No Internet | 127 | 21.4% |
| Total | 593 | 100.0% |
Bay Park Summary
Bay Park is a hamlet located in the Town of Hempstead in Nassau County, New York. It is situated on the South Shore of Long Island, approximately 25 miles east of Manhattan. The hamlet is bordered by East Rockaway to the west, East Meadow to the north, and the Atlantic Ocean to the south.
History
The area that is now Bay Park was originally inhabited by the Meroke Indians, who were part of the Algonquin tribe. The first European settlers arrived in the area in the late 1600s, and the area was known as “Hempstead Harbor”. In the early 1800s, the area was renamed “Bay Park” after the bay that was created by the construction of a dam across the Hempstead Harbor.
In the late 1800s, Bay Park began to develop as a summer resort community. The area was known for its beaches, fishing, and boating. In the early 1900s, the area was further developed with the construction of a boardwalk, amusement park, and a casino.
In the 1950s, Bay Park began to transition from a summer resort community to a residential community. The area was further developed with the construction of single-family homes, apartment buildings, and condominiums.
Geography
Bay Park is located on the South Shore of Long Island, approximately 25 miles east of Manhattan. The hamlet is bordered by East Rockaway to the west, East Meadow to the north, and the Atlantic Ocean to the south.
The area is mostly flat, with some hills in the northern part of the hamlet. The highest point in Bay Park is located at the intersection of Bay Park Avenue and East Meadow Road, which is approximately 50 feet above sea level.
The area is home to several parks, including Bay Park, which is located on the waterfront and features a playground, basketball court, and picnic area.
Economy
The economy of Bay Park is largely based on tourism and retail. The area is home to several restaurants, bars, and shops, as well as a few hotels. The area is also home to several marinas, which provide boat rentals and fishing charters.
The area is also home to several manufacturing and industrial businesses, including a plastics factory and a metal fabrication plant.
Demographics
As of the 2010 census, the population of Bay Park was 8,945. The population is largely white (77.3%), with smaller percentages of African American (7.2%), Asian (7.1%), and Hispanic (6.4%) residents.
The median household income in Bay Park is $77,845, which is higher than the national average of $55,322. The median home value in Bay Park is $521,400, which is higher than the national average of $184,700.
The unemployment rate in Bay Park is 4.2%, which is lower than the national average of 6.7%. The poverty rate in Bay Park is 5.2%, which is lower than the national average of 12.3%.
Common Questions
What is Per Capita Income in Bay Park?
Per Capita income in Bay Park is $58,236.
What is the Median Family Income in Bay Park?
Median Family Income in Bay Park is $106,250.
What is the Median Household income in Bay Park?
Median Household Income in Bay Park is $100,972.
What is Income or Wage Gap in Bay Park?
Income or Wage Gap in Bay Park is 2.6%.
Women in Bay Park earn 97.4 cents for every dollar earned by a man.
What is Inequality or Gini Index in Bay Park?
Inequality or Gini Index in Bay Park is 0.50.
What is the Total Population of Bay Park?
Total Population of Bay Park is 1,389.
What is the Total Male Population of Bay Park?
Total Male Population of Bay Park is 556.
What is the Total Female Population of Bay Park?
Total Female Population of Bay Park is 833.
What is the Ratio of Males per 100 Females in Bay Park?
There are 66.75 Males per 100 Females in Bay Park.
What is the Ratio of Females per 100 Males in Bay Park?
There are 149.82 Females per 100 Males in Bay Park.
What is the Median Population Age in Bay Park?
Median Population Age in Bay Park is 46.4 Years.
What is the Average Family Size in Bay Park
Average Family Size in Bay Park is 3.2 People.
What is the Average Household Size in Bay Park
Average Household Size in Bay Park is 2.3 People.
How Large is the Labor Force in Bay Park?
There are 666 People in the Labor Forcein in Bay Park.
What is the Percentage of People in the Labor Force in Bay Park?
60.8% of People are in the Labor Force in Bay Park.
What is the Unemployment Rate in Bay Park?
Unemployment Rate in Bay Park is 6.6%.