Castleton On Hudson, NY Map & Demographics
Castleton On Hudson Map
Castleton On Hudson Overview
$33,761
PER CAPITA INCOME
$85,625
AVG FAMILY INCOME
$59,453
AVG HOUSEHOLD INCOME
2.9%
WAGE / INCOME GAP [ % ]
97.1¢/ $1
WAGE / INCOME GAP [ $ ]
0.39
INEQUALITY / GINI INDEX
1,480
TOTAL POPULATION
640
MALE POPULATION
840
FEMALE POPULATION
76.19
MALES / 100 FEMALES
131.25
FEMALES / 100 MALES
41.7
MEDIAN AGE
2.9
AVG FAMILY SIZE
2.2
AVG HOUSEHOLD SIZE
822
LABOR FORCE [ PEOPLE ]
67.4%
PERCENT IN LABOR FORCE
22.1%
UNEMPLOYMENT RATE
Castleton On Hudson Zip Codes
Castleton On Hudson Area Codes
Income in Castleton On Hudson
Income Overview in Castleton On Hudson
Per Capita Income in Castleton On Hudson is $33,761, while median incomes of families and households are $85,625 and $59,453 respectively.
| Characteristic | Number | Measure |
| Per Capita Income | 1,480 | $33,761 |
| Median Family Income | 342 | $85,625 |
| Mean Family Income | 342 | $97,573 |
| Median Household Income | 626 | $59,453 |
| Mean Household Income | 626 | $77,443 |
| Income Deficit | 342 | $0 |
| Wage / Income Gap (%) | 1,480 | 2.90% |
| Wage / Income Gap ($) | 1,480 | 97.10¢ per $1 |
| Gini / Inequality Index | 1,480 | 0.39 |
Earnings by Sex in Castleton On Hudson
Average Earnings in Castleton On Hudson are $40,921, $39,861 for men and $41,053 for women, a difference of 2.9%.
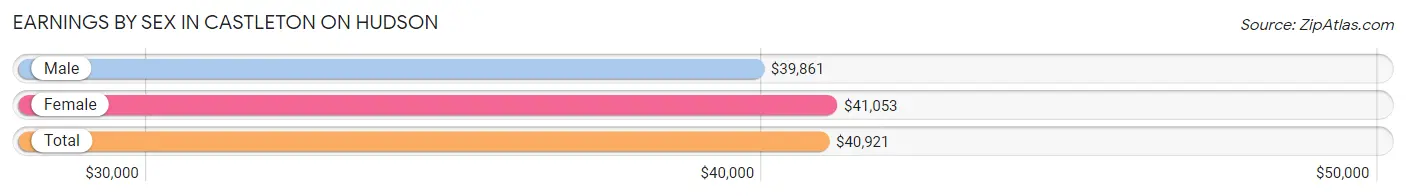
| Sex | Number | Average Earnings |
| Male | 364 (46.2%) | $39,861 |
| Female | 424 (53.8%) | $41,053 |
| Total | 788 (100.0%) | $40,921 |
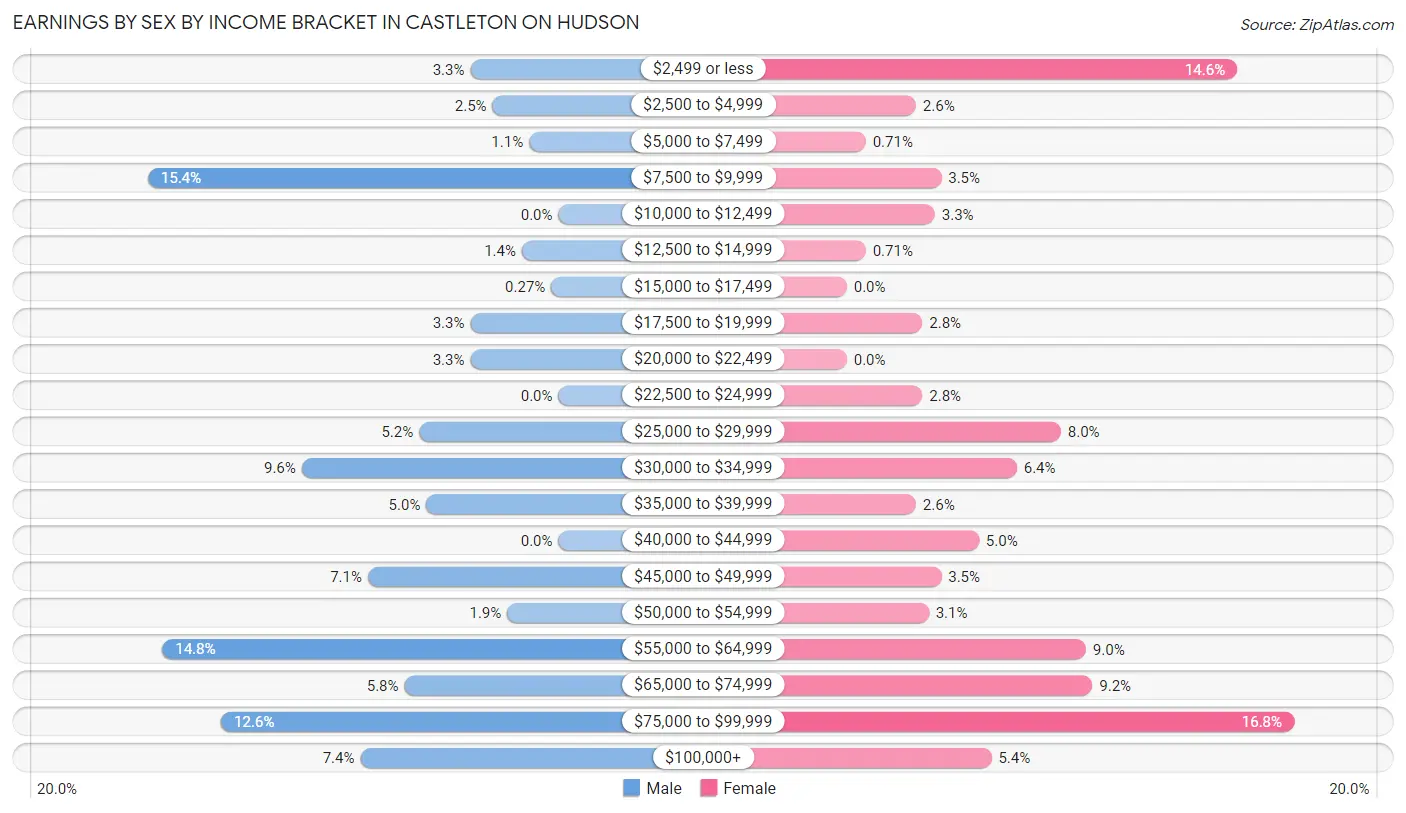
Earnings by Sex by Income Bracket in Castleton On Hudson
The most common earnings brackets in Castleton On Hudson are $7,500 to $9,999 for men (56 | 15.4%) and $75,000 to $99,999 for women (71 | 16.8%).
| Income | Male | Female |
| $2,499 or less | 12 (3.3%) | 62 (14.6%) |
| $2,500 to $4,999 | 9 (2.5%) | 11 (2.6%) |
| $5,000 to $7,499 | 4 (1.1%) | 3 (0.7%) |
| $7,500 to $9,999 | 56 (15.4%) | 15 (3.5%) |
| $10,000 to $12,499 | 0 (0.0%) | 14 (3.3%) |
| $12,500 to $14,999 | 5 (1.4%) | 3 (0.7%) |
| $15,000 to $17,499 | 1 (0.3%) | 0 (0.0%) |
| $17,500 to $19,999 | 12 (3.3%) | 12 (2.8%) |
| $20,000 to $22,499 | 12 (3.3%) | 0 (0.0%) |
| $22,500 to $24,999 | 0 (0.0%) | 12 (2.8%) |
| $25,000 to $29,999 | 19 (5.2%) | 34 (8.0%) |
| $30,000 to $34,999 | 35 (9.6%) | 27 (6.4%) |
| $35,000 to $39,999 | 18 (5.0%) | 11 (2.6%) |
| $40,000 to $44,999 | 0 (0.0%) | 21 (5.0%) |
| $45,000 to $49,999 | 26 (7.1%) | 15 (3.5%) |
| $50,000 to $54,999 | 7 (1.9%) | 13 (3.1%) |
| $55,000 to $64,999 | 54 (14.8%) | 38 (9.0%) |
| $65,000 to $74,999 | 21 (5.8%) | 39 (9.2%) |
| $75,000 to $99,999 | 46 (12.6%) | 71 (16.8%) |
| $100,000+ | 27 (7.4%) | 23 (5.4%) |
| Total | 364 (100.0%) | 424 (100.0%) |
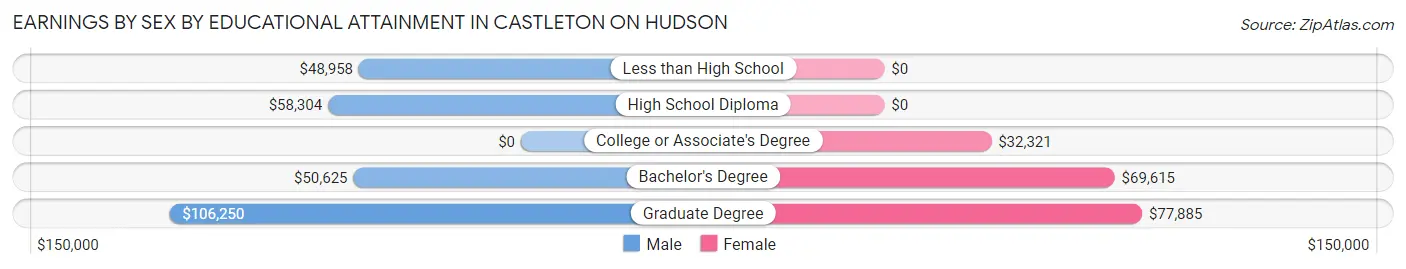
Earnings by Sex by Educational Attainment in Castleton On Hudson
Average earnings in Castleton On Hudson are $46,912 for men and $42,171 for women, a difference of 10.1%. Men with an educational attainment of graduate degree enjoy the highest average annual earnings of $106,250, while those with less than high school education earn the least with $48,958. Women with an educational attainment of graduate degree earn the most with the average annual earnings of $77,885, while those with college or associate's degree education have the smallest earnings of $32,321.
| Educational Attainment | Male Income | Female Income |
| Less than High School | $48,958 | $0 |
| High School Diploma | $58,304 | $0 |
| College or Associate's Degree | - | - |
| Bachelor's Degree | $50,625 | $69,615 |
| Graduate Degree | $106,250 | $77,885 |
| Total | $46,912 | $42,171 |
Family Income in Castleton On Hudson
Family Income Brackets in Castleton On Hudson
According to the Castleton On Hudson family income data, there are 90 families falling into the $35,000 to $49,999 income range, which is the most common income bracket and makes up 26.3% of all families.
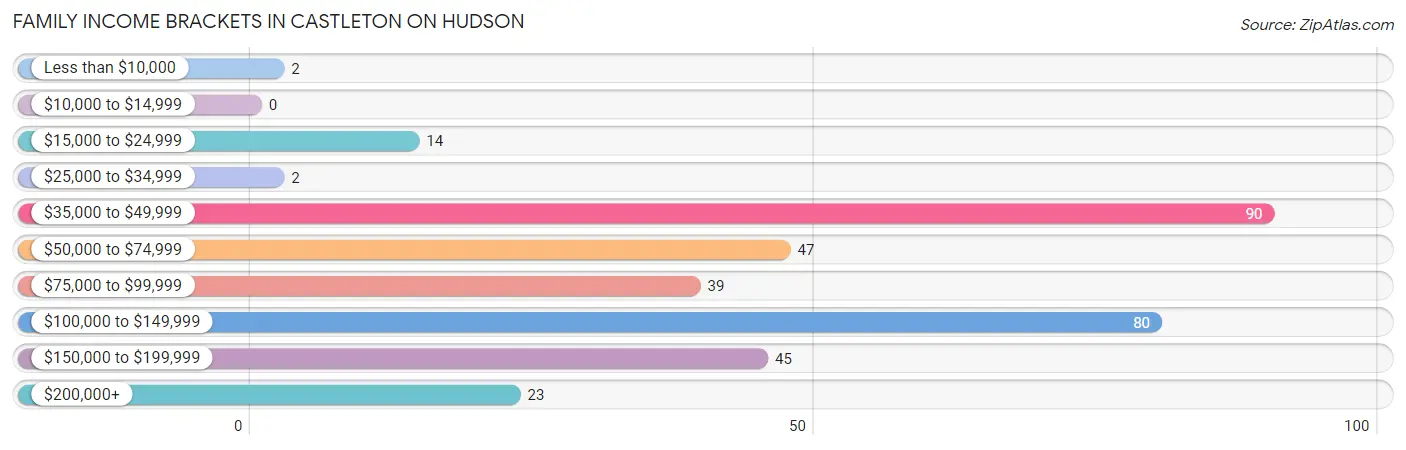
| Income Bracket | # Families | % Families |
| Less than $10,000 | 2 | 0.6% |
| $10,000 to $14,999 | 0 | 0.0% |
| $15,000 to $24,999 | 14 | 4.1% |
| $25,000 to $34,999 | 2 | 0.6% |
| $35,000 to $49,999 | 90 | 26.3% |
| $50,000 to $74,999 | 47 | 13.7% |
| $75,000 to $99,999 | 39 | 11.4% |
| $100,000 to $149,999 | 80 | 23.4% |
| $150,000 to $199,999 | 45 | 13.2% |
| $200,000+ | 23 | 6.7% |
Family Income by Famaliy Size in Castleton On Hudson
4-person families (76 | 22.2%) account for the highest median family income in Castleton On Hudson with $137,500 per family, while 4-person families (76 | 22.2%) have the highest median income of $34,375 per family member.
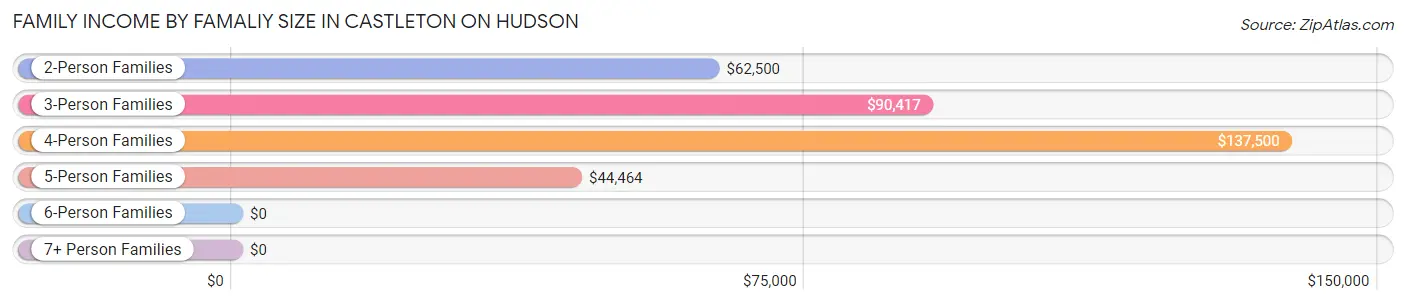
| Income Bracket | # Families | Median Income |
| 2-Person Families | 174 (50.9%) | $62,500 |
| 3-Person Families | 76 (22.2%) | $90,417 |
| 4-Person Families | 76 (22.2%) | $137,500 |
| 5-Person Families | 11 (3.2%) | $44,464 |
| 6-Person Families | 2 (0.6%) | $0 |
| 7+ Person Families | 3 (0.9%) | $0 |
| Total | 342 (100.0%) | $85,625 |
Family Income by Number of Earners in Castleton On Hudson
The median family income in Castleton On Hudson is $85,625, with families comprising 3+ earners (27) having the highest median family income of $210,625, while families with no earners (81) have the lowest median family income of $46,449, accounting for 7.9% and 23.7% of families, respectively.
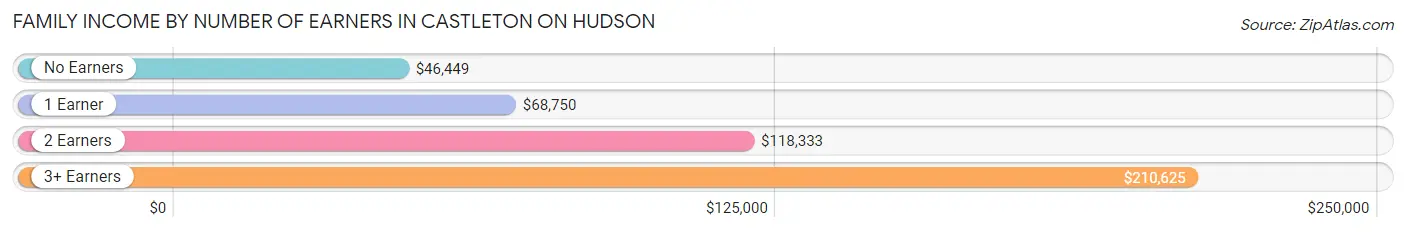
| Number of Earners | # Families | Median Income |
| No Earners | 81 (23.7%) | $46,449 |
| 1 Earner | 82 (24.0%) | $68,750 |
| 2 Earners | 152 (44.4%) | $118,333 |
| 3+ Earners | 27 (7.9%) | $210,625 |
| Total | 342 (100.0%) | $85,625 |
Household Income in Castleton On Hudson
Household Income Brackets in Castleton On Hudson
With 120 households falling in the category, the $35,000 to $49,999 income range is the most frequent in Castleton On Hudson, accounting for 19.2% of all households. In contrast, only 14 households (2.2%) fall into the less than $10,000 income bracket, making it the least populous group.
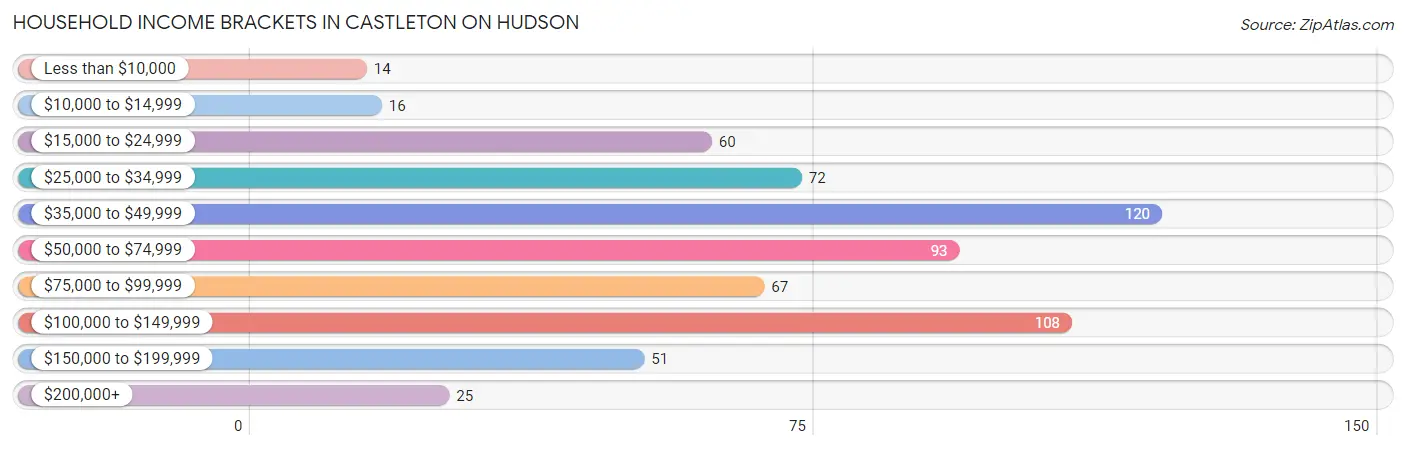
| Income Bracket | # Households | % Households |
| Less than $10,000 | 14 | 2.2% |
| $10,000 to $14,999 | 16 | 2.6% |
| $15,000 to $24,999 | 60 | 9.6% |
| $25,000 to $34,999 | 72 | 11.5% |
| $35,000 to $49,999 | 120 | 19.2% |
| $50,000 to $74,999 | 93 | 14.9% |
| $75,000 to $99,999 | 67 | 10.7% |
| $100,000 to $149,999 | 108 | 17.3% |
| $150,000 to $199,999 | 51 | 8.1% |
| $200,000+ | 25 | 4.0% |
Household Income by Householder Age in Castleton On Hudson
The median household income in Castleton On Hudson is $59,453, with the highest median household income of $88,750 found in the 15 to 24 years age bracket for the primary householder. A total of 12 households (1.9%) fall into this category. Meanwhile, the 65+ years age bracket for the primary householder has the lowest median household income of $41,667, with 114 households (18.2%) in this group.
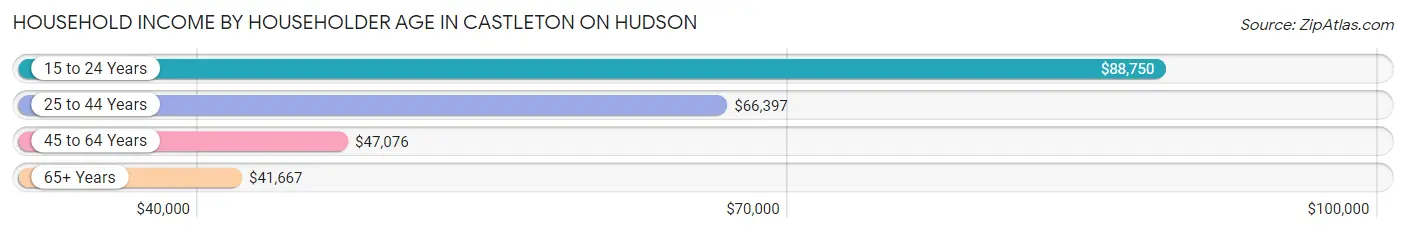
| Income Bracket | # Households | Median Income |
| 15 to 24 Years | 12 (1.9%) | $88,750 |
| 25 to 44 Years | 187 (29.9%) | $66,397 |
| 45 to 64 Years | 313 (50.0%) | $47,076 |
| 65+ Years | 114 (18.2%) | $41,667 |
| Total | 626 (100.0%) | $59,453 |
Poverty in Castleton On Hudson
Income Below Poverty by Sex and Age in Castleton On Hudson
With 7.2% poverty level for males and 13.8% for females among the residents of Castleton On Hudson, under 5 year old males and 35 to 44 year old females are the most vulnerable to poverty, with 13 males (29.5%) and 61 females (45.2%) in their respective age groups living below the poverty level.
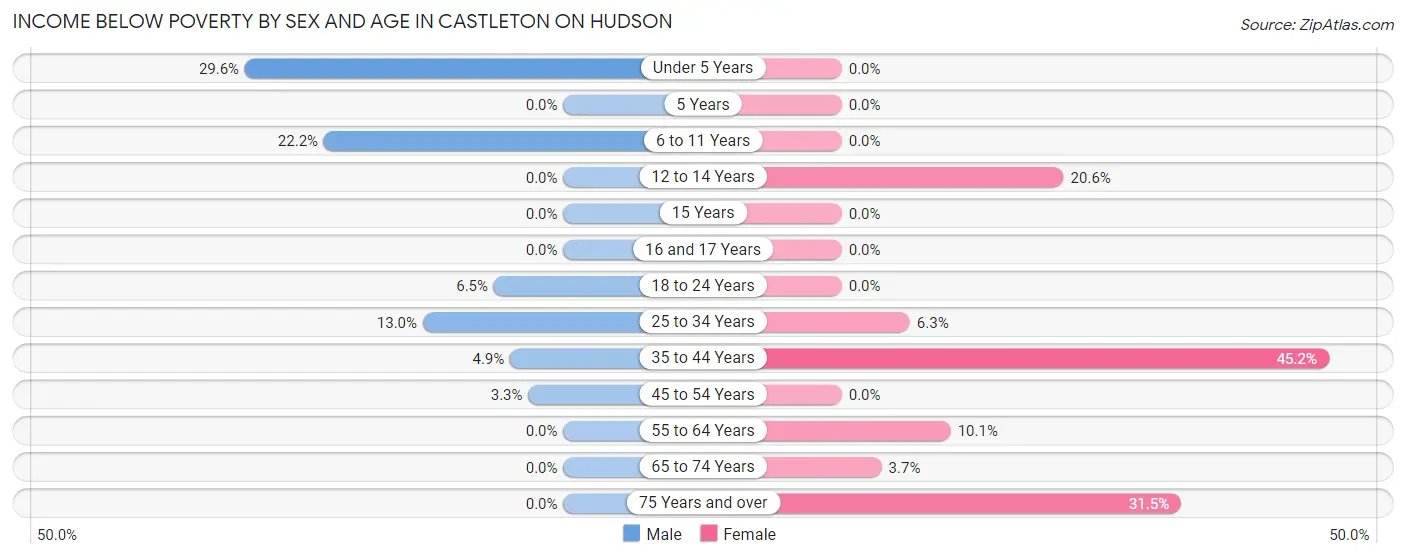
| Age Bracket | Male | Female |
| Under 5 Years | 13 (29.5%) | 0 (0.0%) |
| 5 Years | 0 (0.0%) | 0 (0.0%) |
| 6 to 11 Years | 8 (22.2%) | 0 (0.0%) |
| 12 to 14 Years | 0 (0.0%) | 7 (20.6%) |
| 15 Years | 0 (0.0%) | 0 (0.0%) |
| 16 and 17 Years | 0 (0.0%) | 0 (0.0%) |
| 18 to 24 Years | 2 (6.5%) | 0 (0.0%) |
| 25 to 34 Years | 12 (13.0%) | 6 (6.3%) |
| 35 to 44 Years | 4 (4.9%) | 61 (45.2%) |
| 45 to 54 Years | 4 (3.3%) | 0 (0.0%) |
| 55 to 64 Years | 0 (0.0%) | 19 (10.1%) |
| 65 to 74 Years | 0 (0.0%) | 2 (3.7%) |
| 75 Years and over | 0 (0.0%) | 17 (31.5%) |
| Total | 43 (7.2%) | 112 (13.8%) |
Income Above Poverty by Sex and Age in Castleton On Hudson
According to the poverty statistics in Castleton On Hudson, males aged 5 years and females aged under 5 years are the age groups that are most secure financially, with 100.0% of males and 100.0% of females in these age groups living above the poverty line.
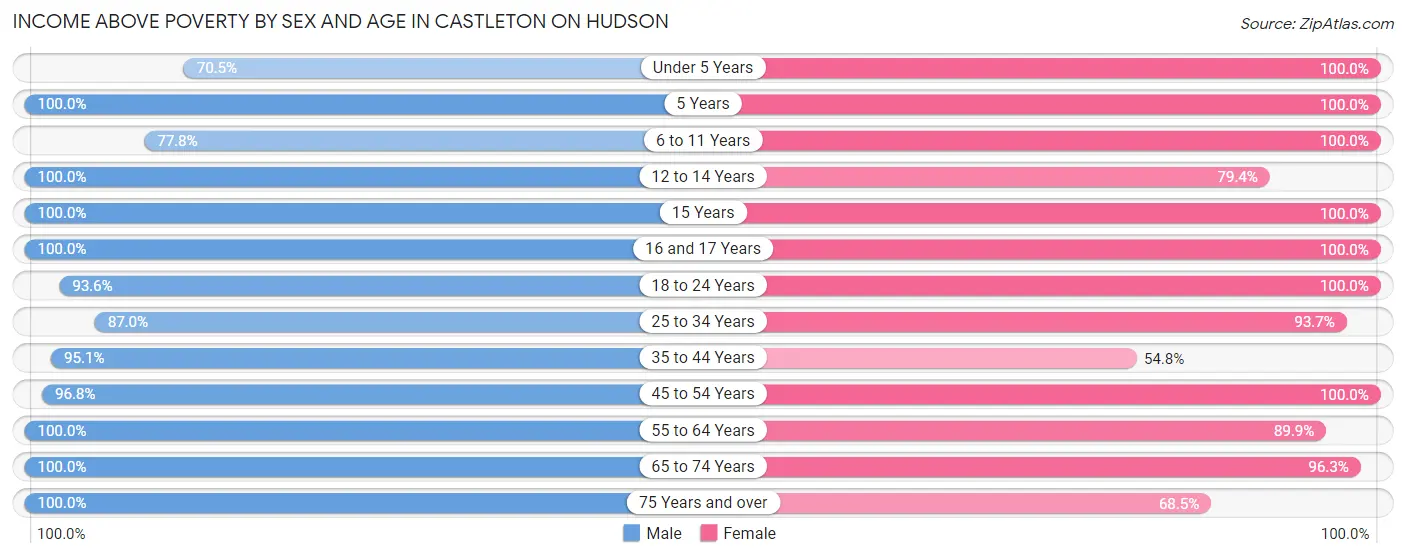
| Age Bracket | Male | Female |
| Under 5 Years | 31 (70.5%) | 26 (100.0%) |
| 5 Years | 12 (100.0%) | 8 (100.0%) |
| 6 to 11 Years | 28 (77.8%) | 72 (100.0%) |
| 12 to 14 Years | 16 (100.0%) | 27 (79.4%) |
| 15 Years | 3 (100.0%) | 6 (100.0%) |
| 16 and 17 Years | 22 (100.0%) | 3 (100.0%) |
| 18 to 24 Years | 29 (93.5%) | 73 (100.0%) |
| 25 to 34 Years | 80 (87.0%) | 89 (93.7%) |
| 35 to 44 Years | 77 (95.1%) | 74 (54.8%) |
| 45 to 54 Years | 119 (96.8%) | 63 (100.0%) |
| 55 to 64 Years | 55 (100.0%) | 169 (89.9%) |
| 65 to 74 Years | 72 (100.0%) | 52 (96.3%) |
| 75 Years and over | 11 (100.0%) | 37 (68.5%) |
| Total | 555 (92.8%) | 699 (86.2%) |
Income Below Poverty Among Married-Couple Families in Castleton On Hudson
The poverty statistics for married-couple families in Castleton On Hudson show that 1.0% or 2 of the total 209 families live below the poverty line. Families with no children have the highest poverty rate of 2.1%, comprising of 2 families. On the other hand, families with 1 or 2 children have the lowest poverty rate of 0.0%, which includes 0 families.
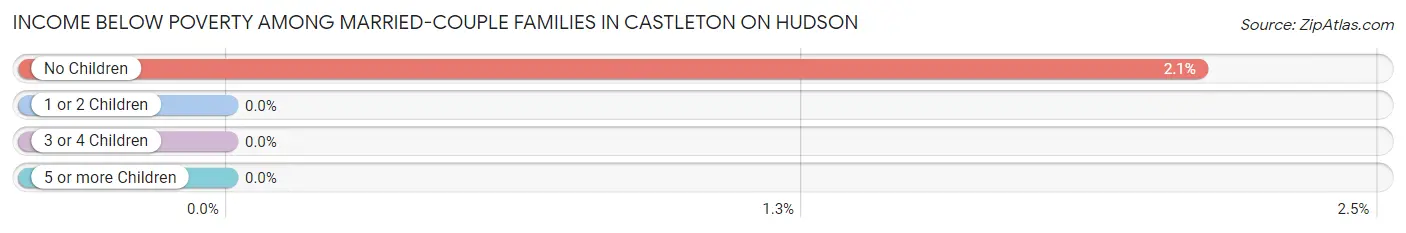
| Children | Above Poverty | Below Poverty |
| No Children | 93 (97.9%) | 2 (2.1%) |
| 1 or 2 Children | 109 (100.0%) | 0 (0.0%) |
| 3 or 4 Children | 2 (100.0%) | 0 (0.0%) |
| 5 or more Children | 3 (100.0%) | 0 (0.0%) |
| Total | 207 (99.0%) | 2 (1.0%) |
Income Below Poverty Among Single-Parent Households in Castleton On Hudson
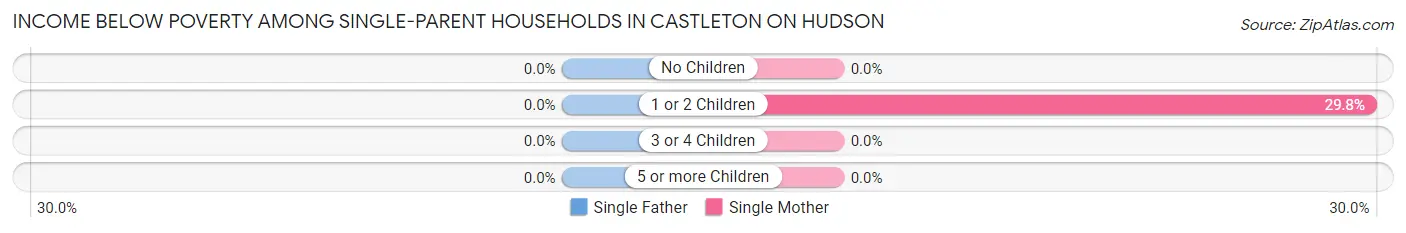
| Children | Single Father | Single Mother |
| No Children | 0 (0.0%) | 0 (0.0%) |
| 1 or 2 Children | 0 (0.0%) | 14 (29.8%) |
| 3 or 4 Children | 0 (0.0%) | 0 (0.0%) |
| 5 or more Children | 0 (0.0%) | 0 (0.0%) |
| Total | 0 (0.0%) | 14 (11.1%) |
Income Below Poverty Among Married-Couple vs Single-Parent Households in Castleton On Hudson
The poverty data for Castleton On Hudson shows that 2 of the married-couple family households (1.0%) and 14 of the single-parent households (10.5%) are living below the poverty level. Within the married-couple family households, those with no children have the highest poverty rate, with 2 households (2.1%) falling below the poverty line. Among the single-parent households, those with 1 or 2 children have the highest poverty rate, with 14 household (29.8%) living below poverty.
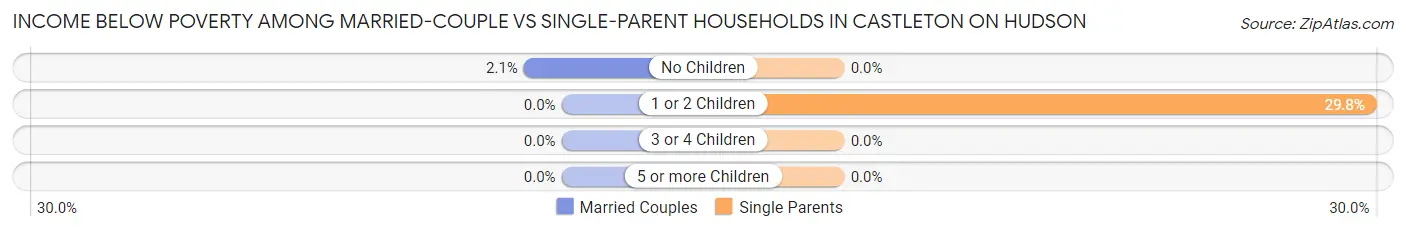
| Children | Married-Couple Families | Single-Parent Households |
| No Children | 2 (2.1%) | 0 (0.0%) |
| 1 or 2 Children | 0 (0.0%) | 14 (29.8%) |
| 3 or 4 Children | 0 (0.0%) | 0 (0.0%) |
| 5 or more Children | 0 (0.0%) | 0 (0.0%) |
| Total | 2 (1.0%) | 14 (10.5%) |
Race in Castleton On Hudson
The most populous races in Castleton On Hudson are White / Caucasian (1,370 | 92.6%), Hispanic or Latino (69 | 4.7%), and Black / African American (44 | 3.0%).
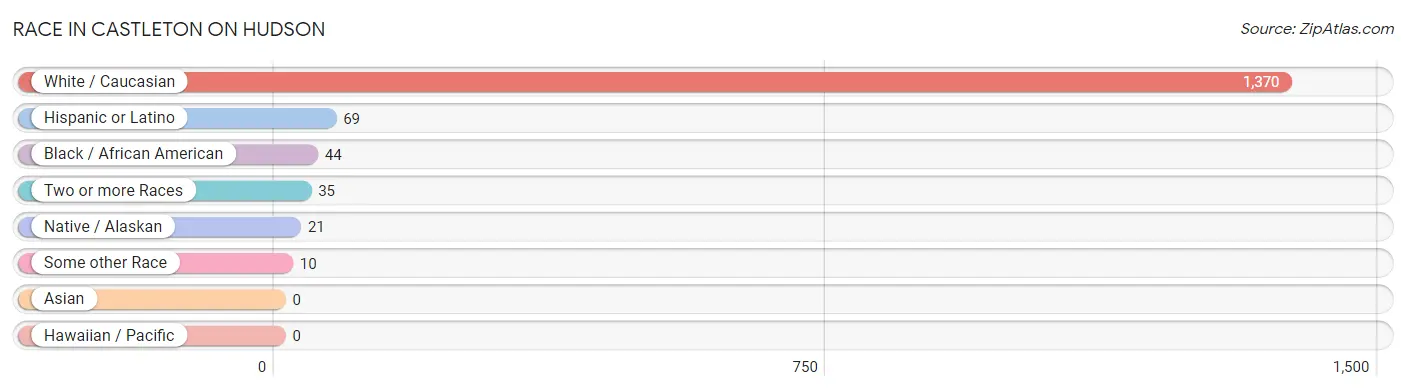
| Race | # Population | % Population |
| Asian | 0 | 0.0% |
| Black / African American | 44 | 3.0% |
| Hawaiian / Pacific | 0 | 0.0% |
| Hispanic or Latino | 69 | 4.7% |
| Native / Alaskan | 21 | 1.4% |
| White / Caucasian | 1,370 | 92.6% |
| Two or more Races | 35 | 2.4% |
| Some other Race | 10 | 0.7% |
| Total | 1,480 | 100.0% |
Ancestry in Castleton On Hudson
The most populous ancestries reported in Castleton On Hudson are German (399 | 27.0%), Irish (351 | 23.7%), English (204 | 13.8%), Italian (180 | 12.2%), and French (97 | 6.6%), together accounting for 83.2% of all Castleton On Hudson residents.
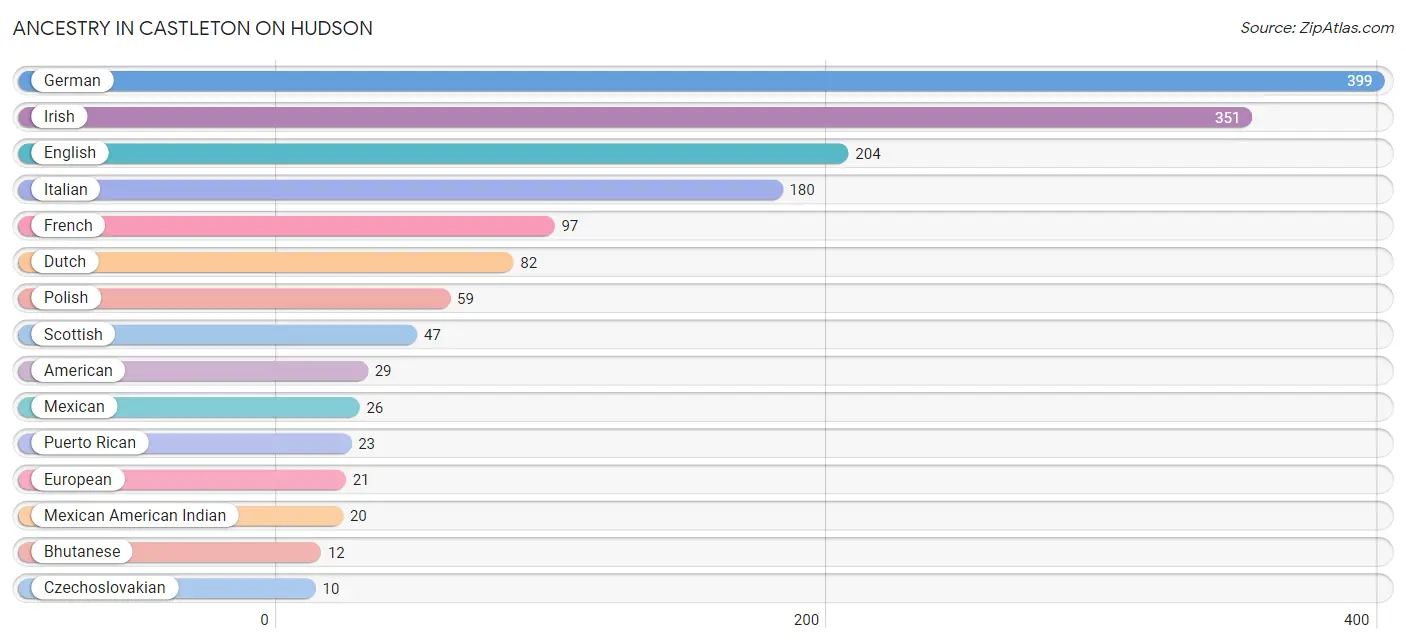
| Ancestry | # Population | % Population |
| American | 29 | 2.0% |
| Arab | 3 | 0.2% |
| Austrian | 5 | 0.3% |
| Belgian | 7 | 0.5% |
| Bhutanese | 12 | 0.8% |
| British | 6 | 0.4% |
| Canadian | 7 | 0.5% |
| Czechoslovakian | 10 | 0.7% |
| Dutch | 82 | 5.5% |
| Eastern European | 3 | 0.2% |
| English | 204 | 13.8% |
| European | 21 | 1.4% |
| French | 97 | 6.6% |
| French American Indian | 1 | 0.1% |
| German | 399 | 27.0% |
| Hungarian | 2 | 0.1% |
| Irish | 351 | 23.7% |
| Italian | 180 | 12.2% |
| Kenyan | 4 | 0.3% |
| Lebanese | 3 | 0.2% |
| Lithuanian | 7 | 0.5% |
| Mexican | 26 | 1.8% |
| Mexican American Indian | 20 | 1.3% |
| Polish | 59 | 4.0% |
| Puerto Rican | 23 | 1.5% |
| Russian | 8 | 0.5% |
| Scotch-Irish | 8 | 0.5% |
| Scottish | 47 | 3.2% |
| South American | 5 | 0.3% |
| Spaniard | 8 | 0.5% |
| Spanish | 7 | 0.5% |
| Subsaharan African | 4 | 0.3% |
| Ukrainian | 4 | 0.3% |
| Welsh | 3 | 0.2% | View All 34 Rows |
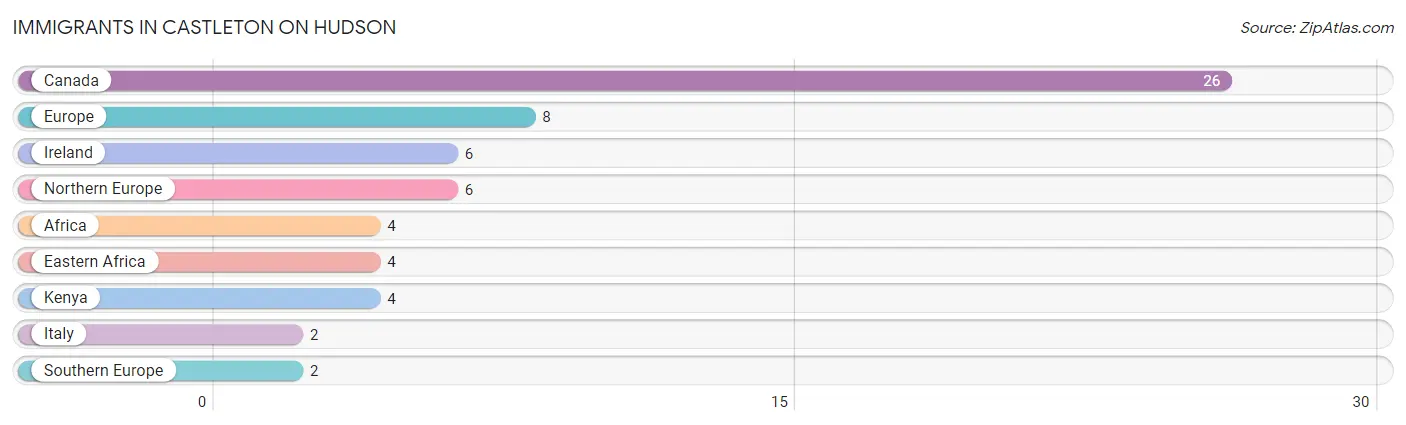
Immigrants in Castleton On Hudson
The most numerous immigrant groups reported in Castleton On Hudson came from Canada (26 | 1.8%), Europe (8 | 0.5%), Ireland (6 | 0.4%), Northern Europe (6 | 0.4%), and Africa (4 | 0.3%), together accounting for 3.4% of all Castleton On Hudson residents.
| Immigration Origin | # Population | % Population |
| Africa | 4 | 0.3% |
| Canada | 26 | 1.8% |
| Eastern Africa | 4 | 0.3% |
| Europe | 8 | 0.5% |
| Ireland | 6 | 0.4% |
| Italy | 2 | 0.1% |
| Kenya | 4 | 0.3% |
| Northern Europe | 6 | 0.4% |
| Southern Europe | 2 | 0.1% | View All 9 Rows |
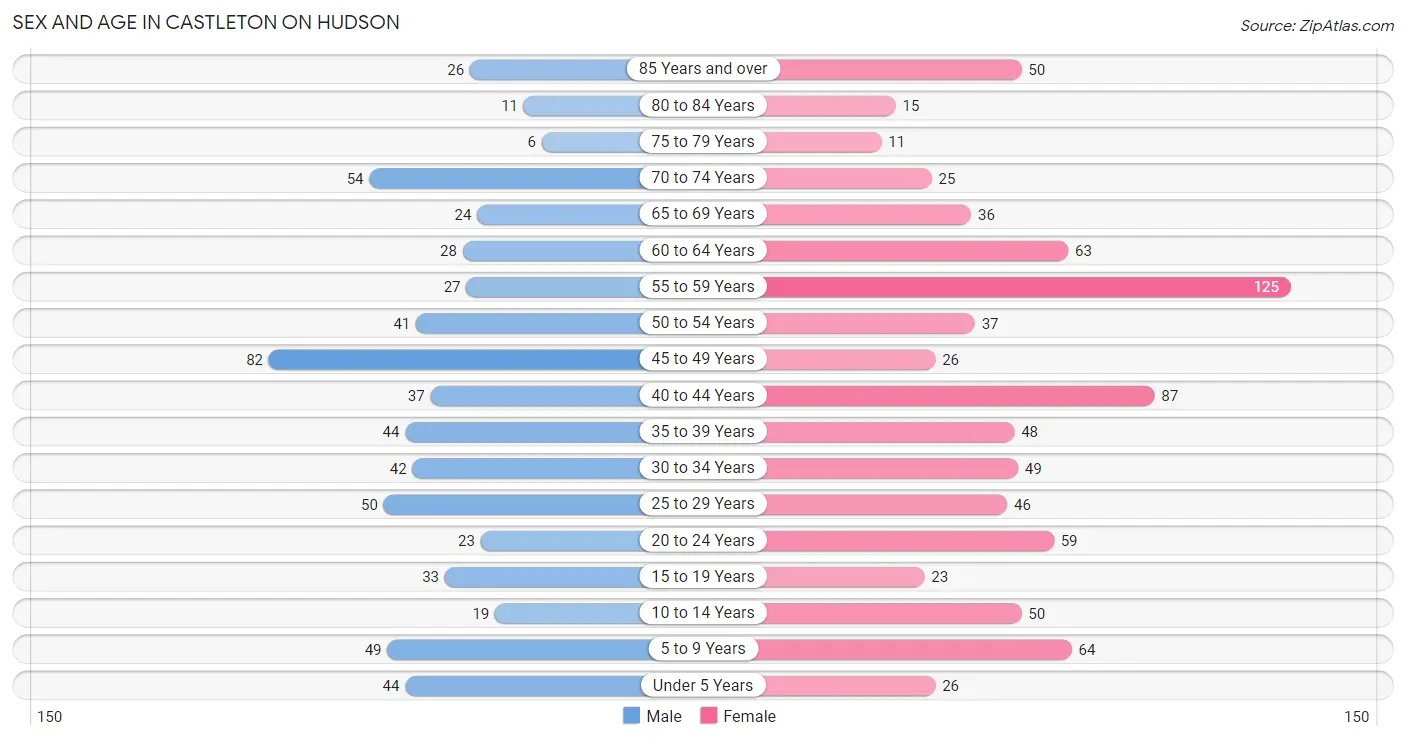
Sex and Age in Castleton On Hudson
Sex and Age in Castleton On Hudson
The most populous age groups in Castleton On Hudson are 45 to 49 Years (82 | 12.8%) for men and 55 to 59 Years (125 | 14.9%) for women.
| Age Bracket | Male | Female |
| Under 5 Years | 44 (6.9%) | 26 (3.1%) |
| 5 to 9 Years | 49 (7.7%) | 64 (7.6%) |
| 10 to 14 Years | 19 (3.0%) | 50 (5.9%) |
| 15 to 19 Years | 33 (5.2%) | 23 (2.7%) |
| 20 to 24 Years | 23 (3.6%) | 59 (7.0%) |
| 25 to 29 Years | 50 (7.8%) | 46 (5.5%) |
| 30 to 34 Years | 42 (6.6%) | 49 (5.8%) |
| 35 to 39 Years | 44 (6.9%) | 48 (5.7%) |
| 40 to 44 Years | 37 (5.8%) | 87 (10.4%) |
| 45 to 49 Years | 82 (12.8%) | 26 (3.1%) |
| 50 to 54 Years | 41 (6.4%) | 37 (4.4%) |
| 55 to 59 Years | 27 (4.2%) | 125 (14.9%) |
| 60 to 64 Years | 28 (4.4%) | 63 (7.5%) |
| 65 to 69 Years | 24 (3.7%) | 36 (4.3%) |
| 70 to 74 Years | 54 (8.4%) | 25 (3.0%) |
| 75 to 79 Years | 6 (0.9%) | 11 (1.3%) |
| 80 to 84 Years | 11 (1.7%) | 15 (1.8%) |
| 85 Years and over | 26 (4.1%) | 50 (5.9%) |
| Total | 640 (100.0%) | 840 (100.0%) |
Families and Households in Castleton On Hudson
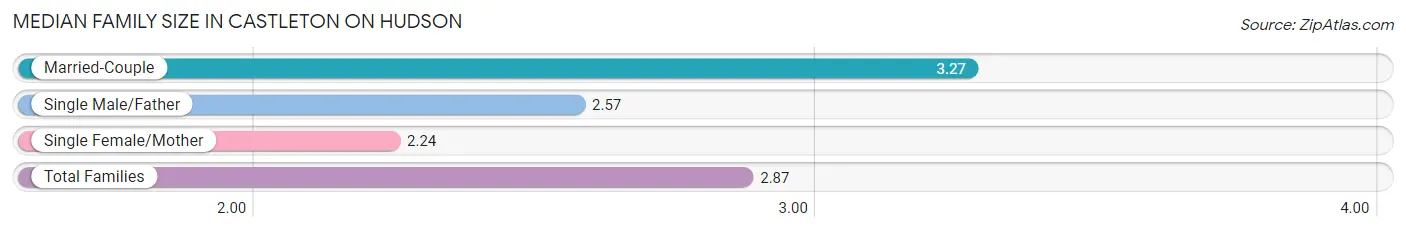
Median Family Size in Castleton On Hudson
The median family size in Castleton On Hudson is 2.87 persons per family, with married-couple families (209 | 61.1%) accounting for the largest median family size of 3.27 persons per family. On the other hand, single female/mother families (126 | 36.8%) represent the smallest median family size with 2.24 persons per family.
| Family Type | # Families | Family Size |
| Married-Couple | 209 (61.1%) | 3.27 |
| Single Male/Father | 7 (2.1%) | 2.57 |
| Single Female/Mother | 126 (36.8%) | 2.24 |
| Total Families | 342 (100.0%) | 2.87 |
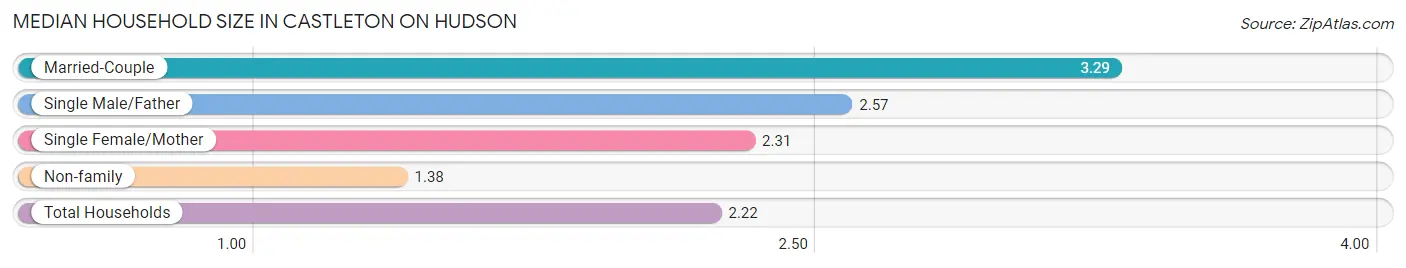
Median Household Size in Castleton On Hudson
The median household size in Castleton On Hudson is 2.22 persons per household, with married-couple households (209 | 33.4%) accounting for the largest median household size of 3.29 persons per household. non-family households (284 | 45.4%) represent the smallest median household size with 1.38 persons per household.
| Household Type | # Households | Household Size |
| Married-Couple | 209 (33.4%) | 3.29 |
| Single Male/Father | 7 (1.1%) | 2.57 |
| Single Female/Mother | 126 (20.1%) | 2.31 |
| Non-family | 284 (45.4%) | 1.38 |
| Total Households | 626 (100.0%) | 2.22 |
Household Size by Marriage Status in Castleton On Hudson
Out of a total of 626 households in Castleton On Hudson, 342 (54.6%) are family households, while 284 (45.4%) are nonfamily households. The most numerous type of family households are 2-person households, comprising 166, and the most common type of nonfamily households are 1-person households, comprising 194.
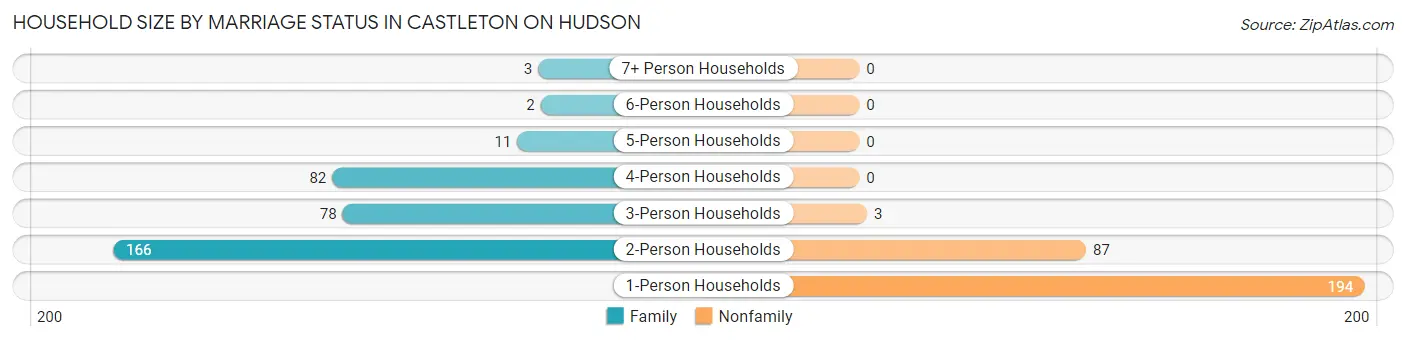
| Household Size | Family Households | Nonfamily Households |
| 1-Person Households | - | 194 (31.0%) |
| 2-Person Households | 166 (26.5%) | 87 (13.9%) |
| 3-Person Households | 78 (12.5%) | 3 (0.5%) |
| 4-Person Households | 82 (13.1%) | 0 (0.0%) |
| 5-Person Households | 11 (1.8%) | 0 (0.0%) |
| 6-Person Households | 2 (0.3%) | 0 (0.0%) |
| 7+ Person Households | 3 (0.5%) | 0 (0.0%) |
| Total | 342 (54.6%) | 284 (45.4%) |
Female Fertility in Castleton On Hudson
Fertility by Age in Castleton On Hudson
| Age Bracket | Women with Births | Births / 1,000 Women |
| 15 to 19 years | 0 (0.0%) | 0.0 |
| 20 to 34 years | 0 (0.0%) | 0.0 |
| 35 to 50 years | 0 (0.0%) | 0.0 |
| Total | 0 (0.0%) | 0.0 |
Fertility by Age by Marriage Status in Castleton On Hudson
| Age Bracket | Married | Unmarried |
| 15 to 19 years | 0 (0.0%) | 0 (0.0%) |
| 20 to 34 years | 0 (0.0%) | 0 (0.0%) |
| 35 to 50 years | 0 (0.0%) | 0 (0.0%) |
| Total | 0 (0.0%) | 0 (0.0%) |
Fertility by Education in Castleton On Hudson
| Educational Attainment | Women with Births | Births / 1,000 Women |
| Less than High School | 0 (0.0%) | 0.0 |
| High School Diploma | 0 (0.0%) | 0.0 |
| College or Associate's Degree | 0 (0.0%) | 0.0 |
| Bachelor's Degree | 0 (0.0%) | 0.0 |
| Graduate Degree | 0 (0.0%) | 0.0 |
| Total | 0 (0.0%) | 0.0 |
Fertility by Education by Marriage Status in Castleton On Hudson
| Educational Attainment | Married | Unmarried |
| Less than High School | 0 (0.0%) | 0 (0.0%) |
| High School Diploma | 0 (0.0%) | 0 (0.0%) |
| College or Associate's Degree | 0 (0.0%) | 0 (0.0%) |
| Bachelor's Degree | 0 (0.0%) | 0 (0.0%) |
| Graduate Degree | 0 (0.0%) | 0 (0.0%) |
| Total | 0 (0.0%) | 0 (0.0%) |
Employment Characteristics in Castleton On Hudson
Employment by Class of Employer in Castleton On Hudson
Among the 627 employed individuals in Castleton On Hudson, private company employees (431 | 68.7%), state government employees (63 | 10.1%), and local government employees (57 | 9.1%) make up the most common classes of employment.
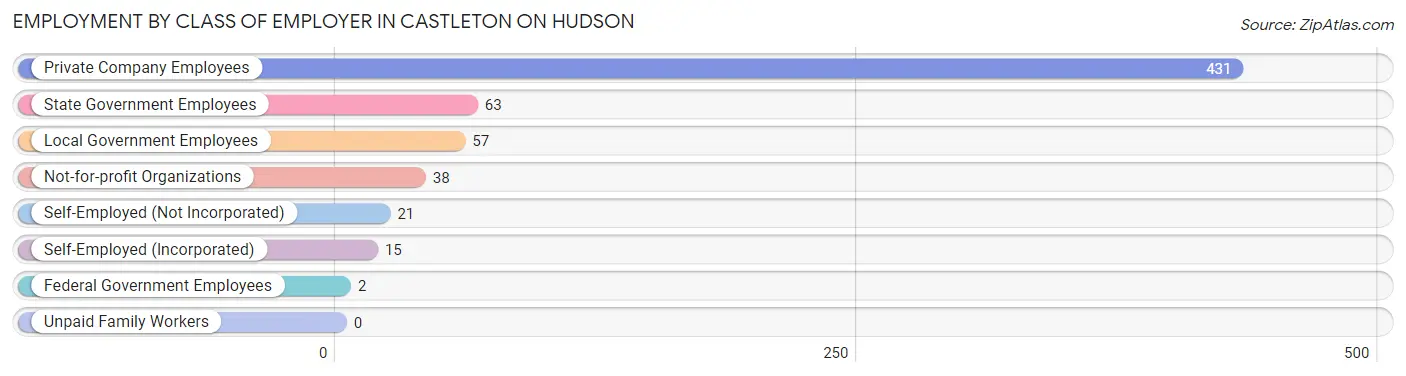
| Employer Class | # Employees | % Employees |
| Private Company Employees | 431 | 68.7% |
| Self-Employed (Incorporated) | 15 | 2.4% |
| Self-Employed (Not Incorporated) | 21 | 3.4% |
| Not-for-profit Organizations | 38 | 6.1% |
| Local Government Employees | 57 | 9.1% |
| State Government Employees | 63 | 10.1% |
| Federal Government Employees | 2 | 0.3% |
| Unpaid Family Workers | 0 | 0.0% |
| Total | 627 | 100.0% |
Employment Status by Age in Castleton On Hudson
According to the labor force statistics for Castleton On Hudson, out of the total population over 16 years of age (1,219), 67.4% or 822 individuals are in the labor force, with 22.1% or 182 of them unemployed. The age group with the highest labor force participation rate is 20 to 24 years, with 100.0% or 82 individuals in the labor force. Within the labor force, the 20 to 24 years age range has the highest percentage of unemployed individuals, with 47.6% or 39 of them being unemployed.
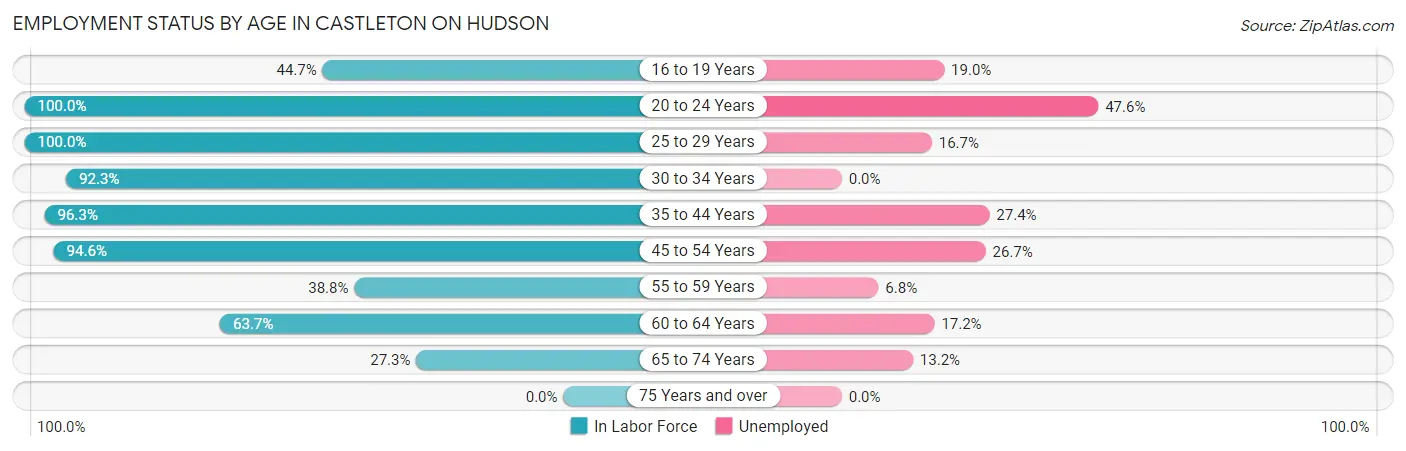
| Age Bracket | In Labor Force | Unemployed |
| 16 to 19 Years | 21 (44.7%) | 4 (19.0%) |
| 20 to 24 Years | 82 (100.0%) | 39 (47.6%) |
| 25 to 29 Years | 96 (100.0%) | 16 (16.7%) |
| 30 to 34 Years | 84 (92.3%) | 0 (0.0%) |
| 35 to 44 Years | 208 (96.3%) | 57 (27.4%) |
| 45 to 54 Years | 176 (94.6%) | 47 (26.7%) |
| 55 to 59 Years | 59 (38.8%) | 4 (6.8%) |
| 60 to 64 Years | 58 (63.7%) | 10 (17.2%) |
| 65 to 74 Years | 38 (27.3%) | 5 (13.2%) |
| 75 Years and over | 0 (0.0%) | 0 (0.0%) |
| Total | 822 (67.4%) | 182 (22.1%) |
Employment Status by Educational Attainment in Castleton On Hudson
According to labor force statistics for Castleton On Hudson, 81.9% of individuals (681) out of the total population between 25 and 64 years of age (832) are in the labor force, with 19.7% or 134 of them being unemployed. The group with the highest labor force participation rate are those with the educational attainment of high school diploma, with 95.8% or 226 individuals in the labor force. Within the labor force, individuals with high school diploma education have the highest percentage of unemployment, with 32.7% or 74 of them being unemployed.
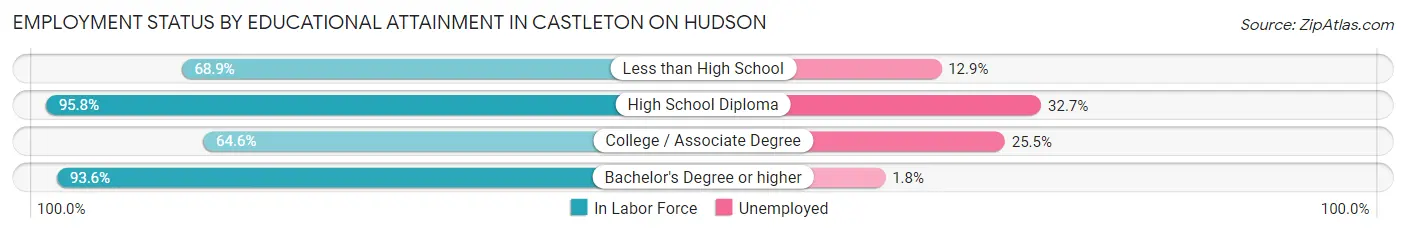
| Educational Attainment | In Labor Force | Unemployed |
| Less than High School | 31 (68.9%) | 6 (12.9%) |
| High School Diploma | 226 (95.8%) | 77 (32.7%) |
| College / Associate Degree | 204 (64.6%) | 81 (25.5%) |
| Bachelor's Degree or higher | 220 (93.6%) | 4 (1.8%) |
| Total | 681 (81.9%) | 164 (19.7%) |
Employment Occupations by Sex in Castleton On Hudson
Management, Business, Science and Arts Occupations
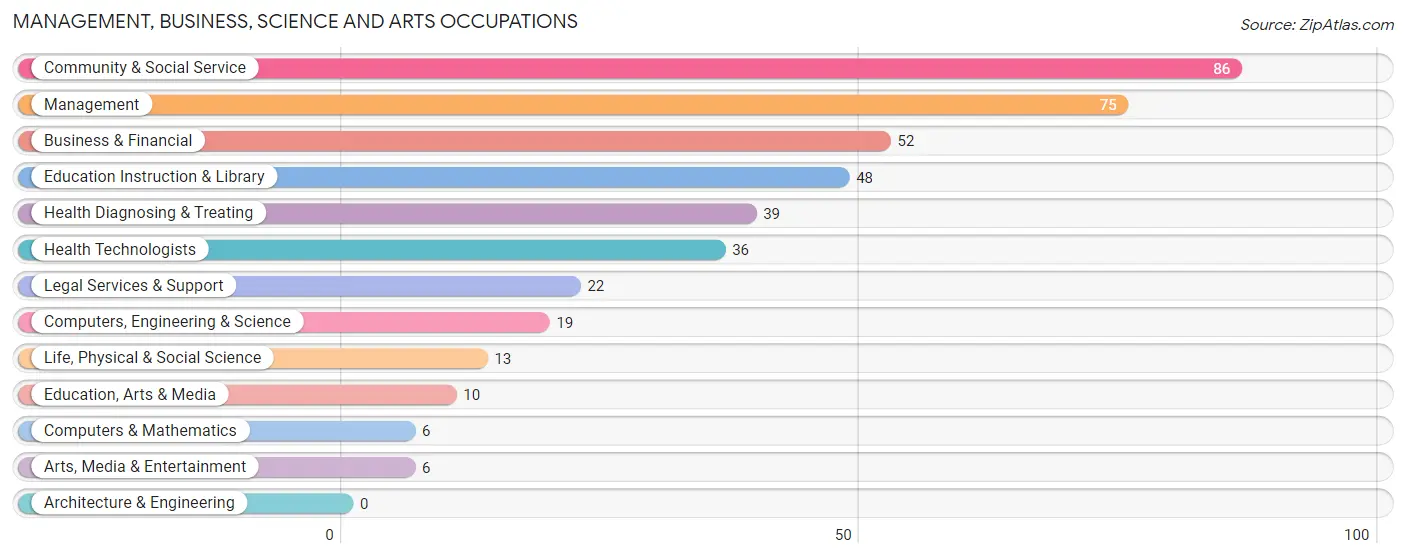
The most common Management, Business, Science and Arts occupations in Castleton On Hudson are Community & Social Service (86 | 13.4%), Management (75 | 11.7%), Business & Financial (52 | 8.1%), Education Instruction & Library (48 | 7.5%), and Health Diagnosing & Treating (39 | 6.1%).
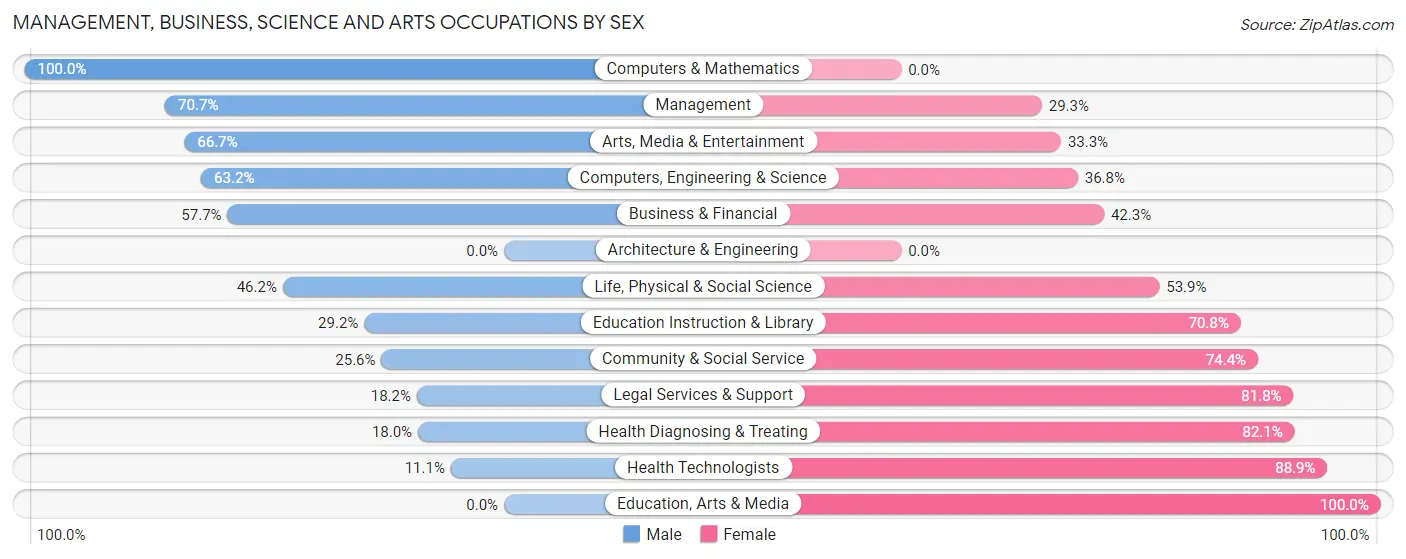
Management, Business, Science and Arts Occupations by Sex
Within the Management, Business, Science and Arts occupations in Castleton On Hudson, the most male-oriented occupations are Computers & Mathematics (100.0%), Management (70.7%), and Arts, Media & Entertainment (66.7%), while the most female-oriented occupations are Education, Arts & Media (100.0%), Health Technologists (88.9%), and Health Diagnosing & Treating (82.1%).
| Occupation | Male | Female |
| Management | 53 (70.7%) | 22 (29.3%) |
| Business & Financial | 30 (57.7%) | 22 (42.3%) |
| Computers, Engineering & Science | 12 (63.2%) | 7 (36.8%) |
| Computers & Mathematics | 6 (100.0%) | 0 (0.0%) |
| Architecture & Engineering | 0 (0.0%) | 0 (0.0%) |
| Life, Physical & Social Science | 6 (46.2%) | 7 (53.8%) |
| Community & Social Service | 22 (25.6%) | 64 (74.4%) |
| Education, Arts & Media | 0 (0.0%) | 10 (100.0%) |
| Legal Services & Support | 4 (18.2%) | 18 (81.8%) |
| Education Instruction & Library | 14 (29.2%) | 34 (70.8%) |
| Arts, Media & Entertainment | 4 (66.7%) | 2 (33.3%) |
| Health Diagnosing & Treating | 7 (17.9%) | 32 (82.1%) |
| Health Technologists | 4 (11.1%) | 32 (88.9%) |
| Total (Category) | 124 (45.8%) | 147 (54.2%) |
| Total (Overall) | 313 (48.9%) | 327 (51.1%) |
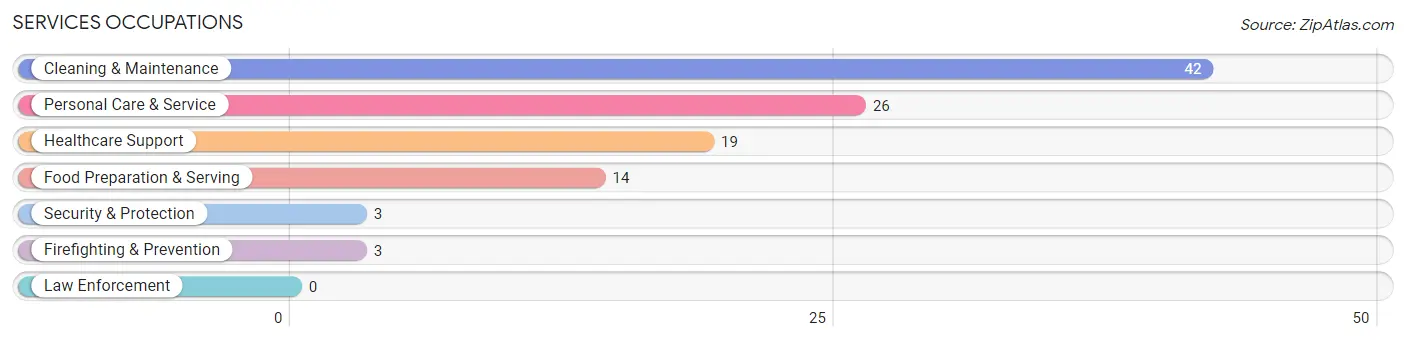
Services Occupations
The most common Services occupations in Castleton On Hudson are Cleaning & Maintenance (42 | 6.6%), Personal Care & Service (26 | 4.1%), Healthcare Support (19 | 3.0%), Food Preparation & Serving (14 | 2.2%), and Security & Protection (3 | 0.5%).
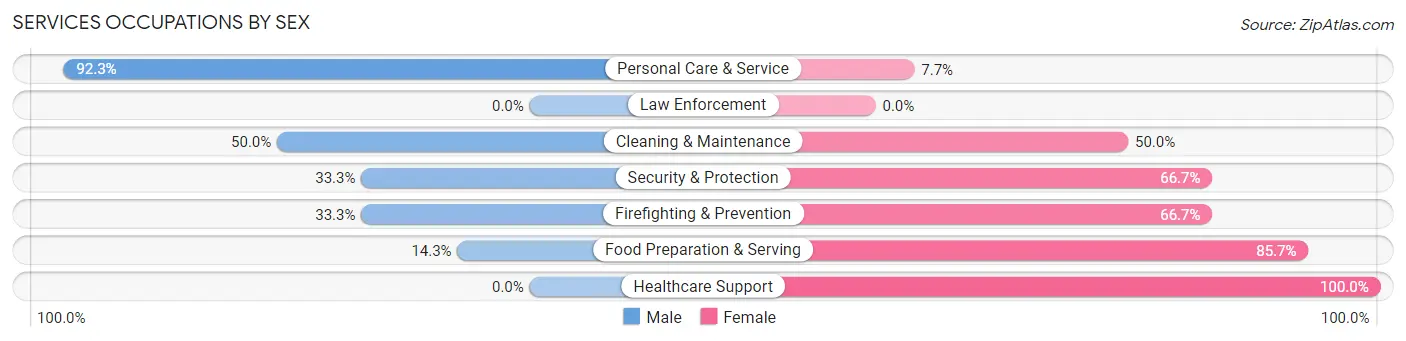
Services Occupations by Sex
Within the Services occupations in Castleton On Hudson, the most male-oriented occupations are Personal Care & Service (92.3%), Cleaning & Maintenance (50.0%), and Security & Protection (33.3%), while the most female-oriented occupations are Healthcare Support (100.0%), Food Preparation & Serving (85.7%), and Security & Protection (66.7%).
| Occupation | Male | Female |
| Healthcare Support | 0 (0.0%) | 19 (100.0%) |
| Security & Protection | 1 (33.3%) | 2 (66.7%) |
| Firefighting & Prevention | 1 (33.3%) | 2 (66.7%) |
| Law Enforcement | 0 (0.0%) | 0 (0.0%) |
| Food Preparation & Serving | 2 (14.3%) | 12 (85.7%) |
| Cleaning & Maintenance | 21 (50.0%) | 21 (50.0%) |
| Personal Care & Service | 24 (92.3%) | 2 (7.7%) |
| Total (Category) | 48 (46.2%) | 56 (53.8%) |
| Total (Overall) | 313 (48.9%) | 327 (51.1%) |
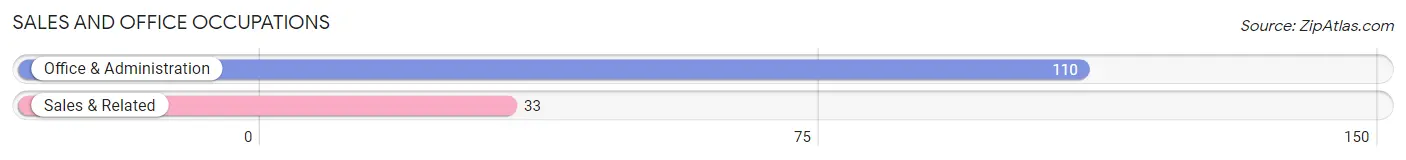
Sales and Office Occupations
The most common Sales and Office occupations in Castleton On Hudson are Office & Administration (110 | 17.2%), and Sales & Related (33 | 5.2%).
Sales and Office Occupations by Sex
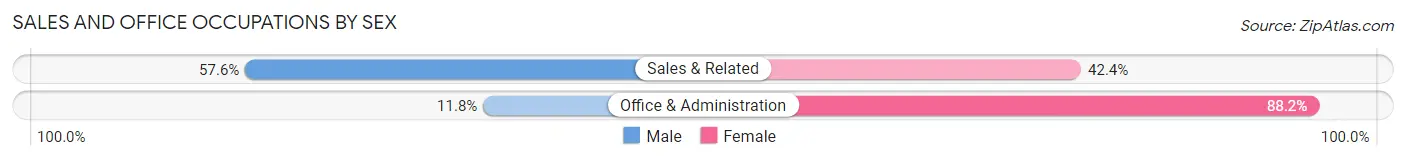
| Occupation | Male | Female |
| Sales & Related | 19 (57.6%) | 14 (42.4%) |
| Office & Administration | 13 (11.8%) | 97 (88.2%) |
| Total (Category) | 32 (22.4%) | 111 (77.6%) |
| Total (Overall) | 313 (48.9%) | 327 (51.1%) |
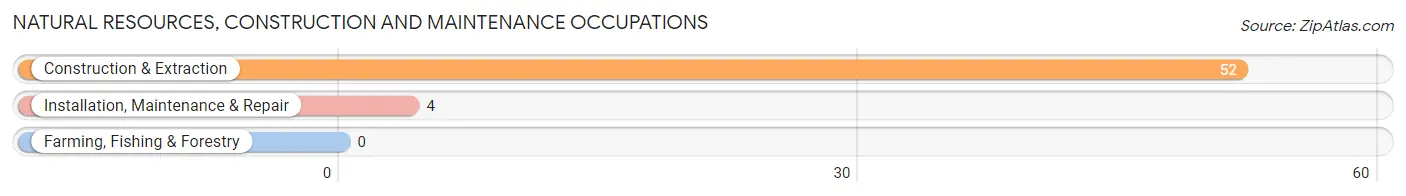
Natural Resources, Construction and Maintenance Occupations
The most common Natural Resources, Construction and Maintenance occupations in Castleton On Hudson are Construction & Extraction (52 | 8.1%), and Installation, Maintenance & Repair (4 | 0.6%).
Natural Resources, Construction and Maintenance Occupations by Sex
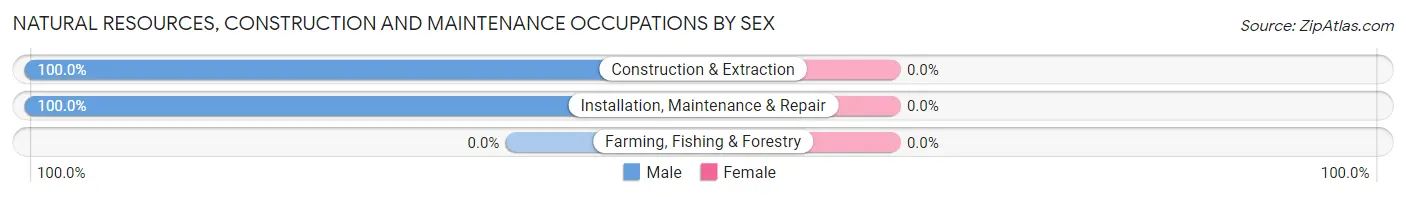
| Occupation | Male | Female |
| Farming, Fishing & Forestry | 0 (0.0%) | 0 (0.0%) |
| Construction & Extraction | 52 (100.0%) | 0 (0.0%) |
| Installation, Maintenance & Repair | 4 (100.0%) | 0 (0.0%) |
| Total (Category) | 56 (100.0%) | 0 (0.0%) |
| Total (Overall) | 313 (48.9%) | 327 (51.1%) |
Production, Transportation and Moving Occupations
The most common Production, Transportation and Moving occupations in Castleton On Hudson are Material Moving (30 | 4.7%), Production (24 | 3.7%), and Transportation (12 | 1.9%).
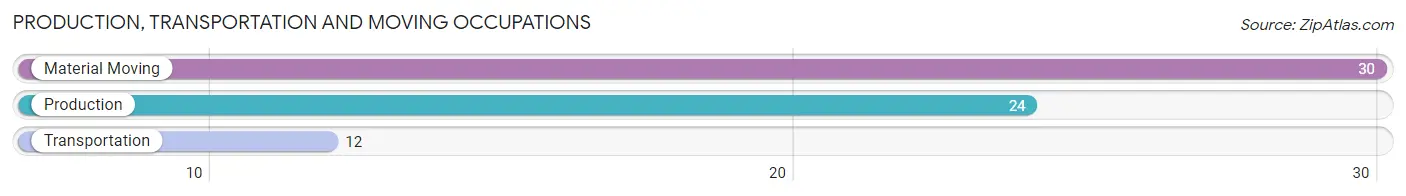
Production, Transportation and Moving Occupations by Sex
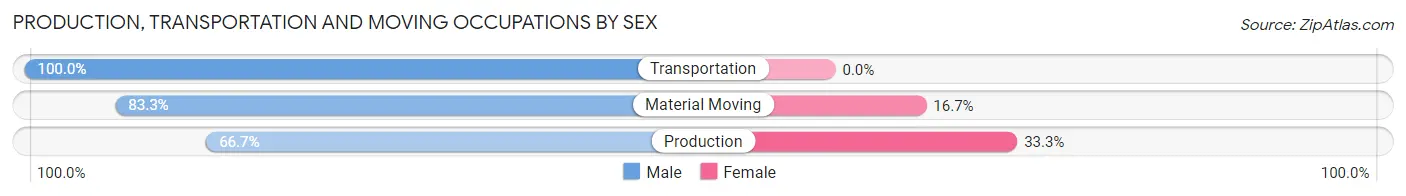
| Occupation | Male | Female |
| Production | 16 (66.7%) | 8 (33.3%) |
| Transportation | 12 (100.0%) | 0 (0.0%) |
| Material Moving | 25 (83.3%) | 5 (16.7%) |
| Total (Category) | 53 (80.3%) | 13 (19.7%) |
| Total (Overall) | 313 (48.9%) | 327 (51.1%) |
Employment Industries by Sex in Castleton On Hudson
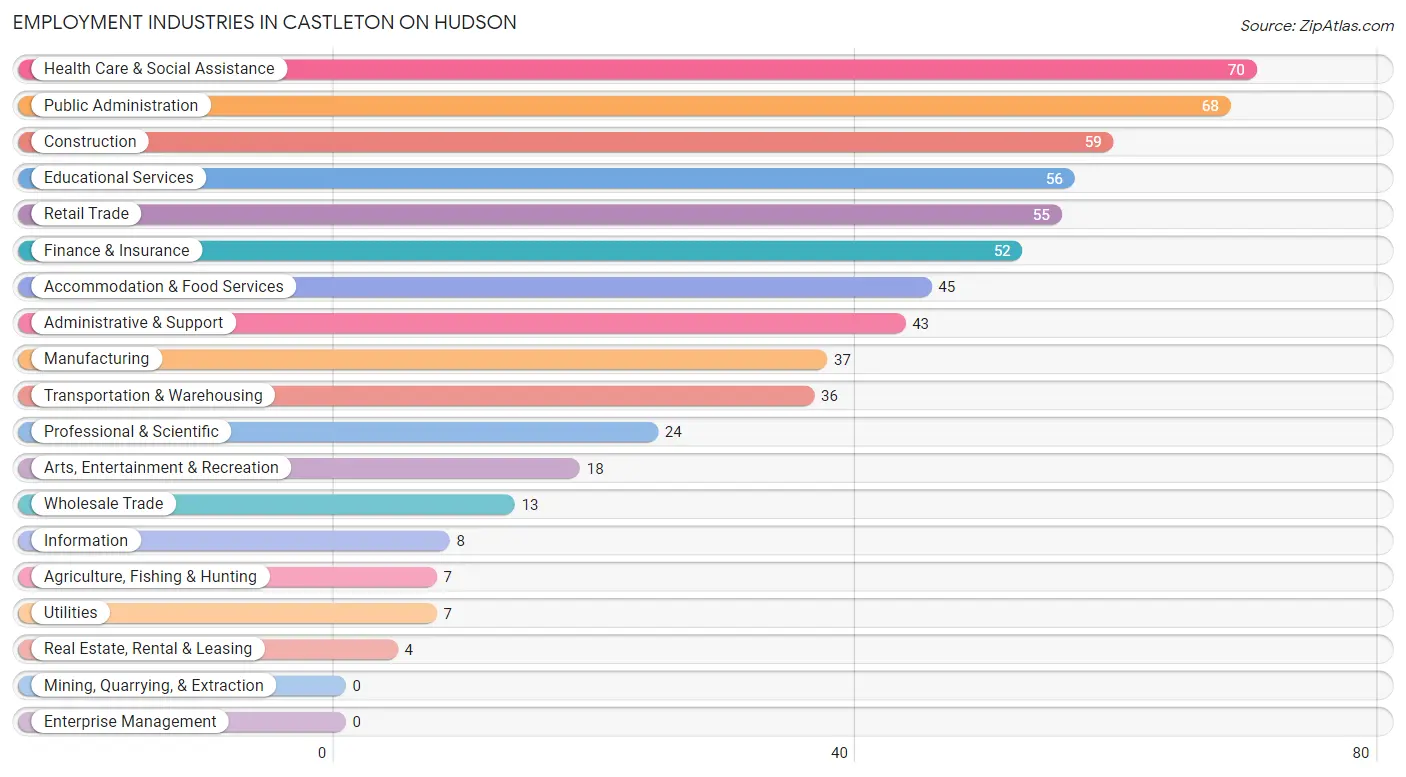
Employment Industries in Castleton On Hudson
The major employment industries in Castleton On Hudson include Health Care & Social Assistance (70 | 10.9%), Public Administration (68 | 10.6%), Construction (59 | 9.2%), Educational Services (56 | 8.7%), and Retail Trade (55 | 8.6%).
Employment Industries by Sex in Castleton On Hudson
The Castleton On Hudson industries that see more men than women are Construction (91.5%), Arts, Entertainment & Recreation (88.9%), and Transportation & Warehousing (83.3%), whereas the industries that tend to have a higher number of women are Real Estate, Rental & Leasing (100.0%), Finance & Insurance (80.8%), and Educational Services (75.0%).
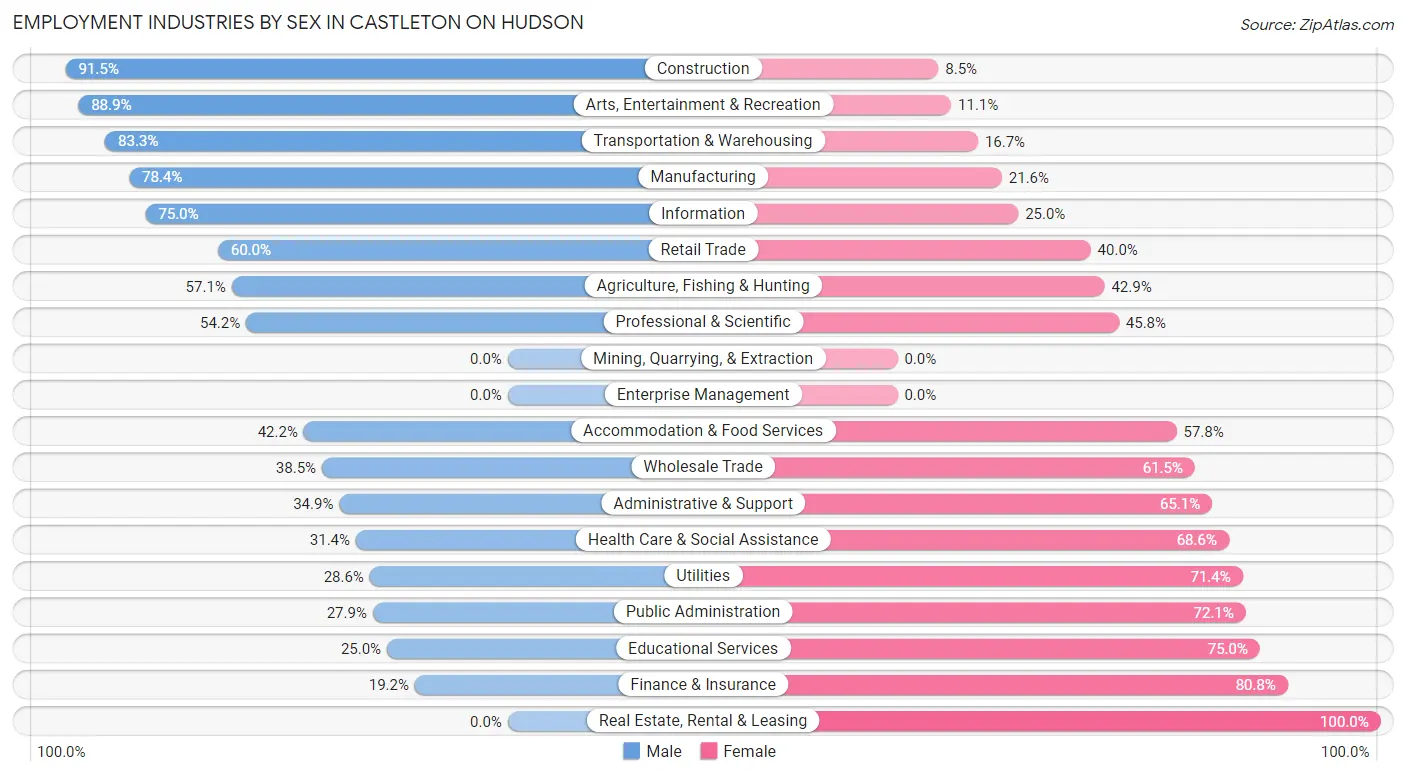
| Industry | Male | Female |
| Agriculture, Fishing & Hunting | 4 (57.1%) | 3 (42.9%) |
| Mining, Quarrying, & Extraction | 0 (0.0%) | 0 (0.0%) |
| Construction | 54 (91.5%) | 5 (8.5%) |
| Manufacturing | 29 (78.4%) | 8 (21.6%) |
| Wholesale Trade | 5 (38.5%) | 8 (61.5%) |
| Retail Trade | 33 (60.0%) | 22 (40.0%) |
| Transportation & Warehousing | 30 (83.3%) | 6 (16.7%) |
| Utilities | 2 (28.6%) | 5 (71.4%) |
| Information | 6 (75.0%) | 2 (25.0%) |
| Finance & Insurance | 10 (19.2%) | 42 (80.8%) |
| Real Estate, Rental & Leasing | 0 (0.0%) | 4 (100.0%) |
| Professional & Scientific | 13 (54.2%) | 11 (45.8%) |
| Enterprise Management | 0 (0.0%) | 0 (0.0%) |
| Administrative & Support | 15 (34.9%) | 28 (65.1%) |
| Educational Services | 14 (25.0%) | 42 (75.0%) |
| Health Care & Social Assistance | 22 (31.4%) | 48 (68.6%) |
| Arts, Entertainment & Recreation | 16 (88.9%) | 2 (11.1%) |
| Accommodation & Food Services | 19 (42.2%) | 26 (57.8%) |
| Public Administration | 19 (27.9%) | 49 (72.1%) |
| Total | 313 (48.9%) | 327 (51.1%) |
Education in Castleton On Hudson
School Enrollment in Castleton On Hudson
The most common levels of schooling among the 281 students in Castleton On Hudson are elementary school (90 | 32.0%), high school (57 | 20.3%), and middle school (48 | 17.1%).
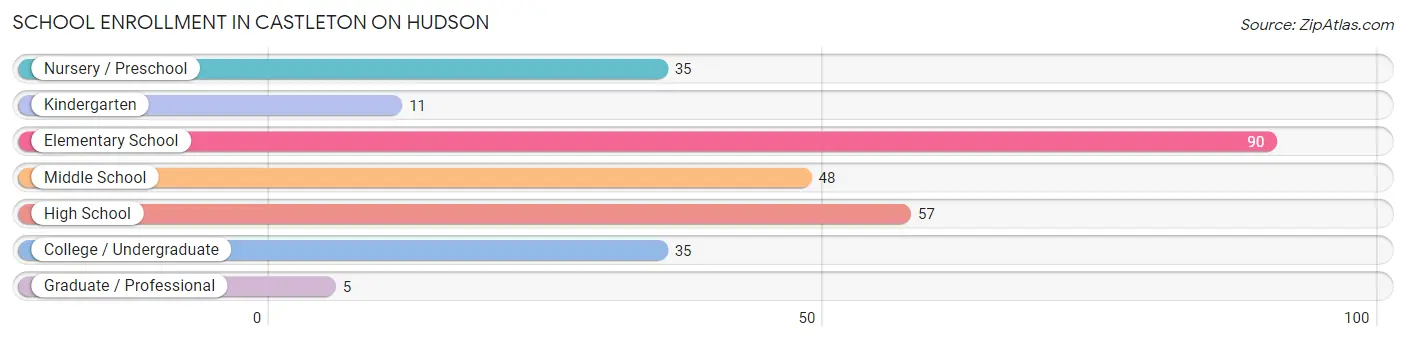
| School Level | # Students | % Students |
| Nursery / Preschool | 35 | 12.5% |
| Kindergarten | 11 | 3.9% |
| Elementary School | 90 | 32.0% |
| Middle School | 48 | 17.1% |
| High School | 57 | 20.3% |
| College / Undergraduate | 35 | 12.5% |
| Graduate / Professional | 5 | 1.8% |
| Total | 281 | 100.0% |
School Enrollment by Age by Funding Source in Castleton On Hudson
Out of a total of 281 students who are enrolled in schools in Castleton On Hudson, 53 (18.9%) attend a private institution, while the remaining 228 (81.1%) are enrolled in public schools. The age group of 5 to 9 year old has the highest likelihood of being enrolled in private schools, with 26 (23.0% in the age bracket) enrolled. Conversely, the age group of 20 to 24 year olds has the lowest likelihood of being enrolled in a private school, with 5 (100.0% in the age bracket) attending a public institution.
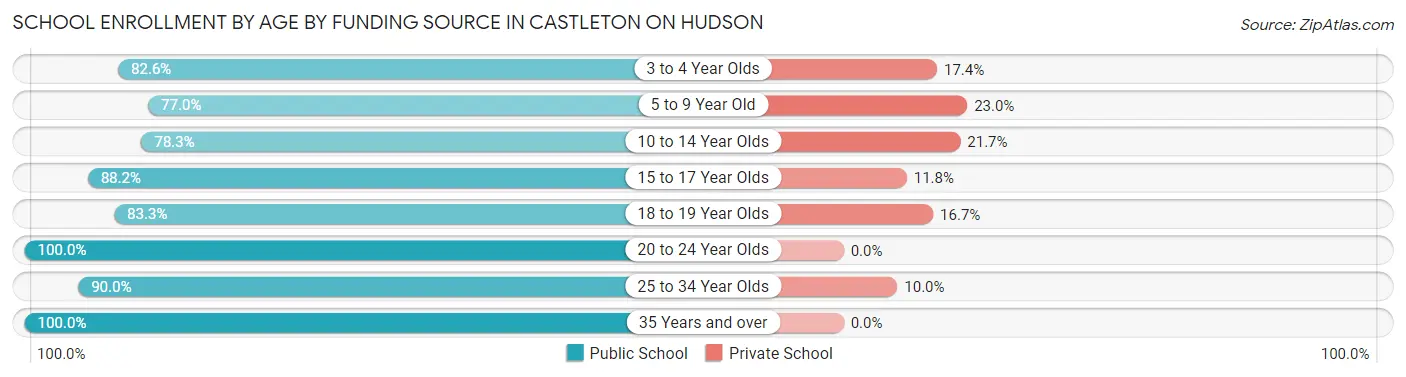
| Age Bracket | Public School | Private School |
| 3 to 4 Year Olds | 19 (82.6%) | 4 (17.4%) |
| 5 to 9 Year Old | 87 (77.0%) | 26 (23.0%) |
| 10 to 14 Year Olds | 54 (78.3%) | 15 (21.7%) |
| 15 to 17 Year Olds | 30 (88.2%) | 4 (11.8%) |
| 18 to 19 Year Olds | 15 (83.3%) | 3 (16.7%) |
| 20 to 24 Year Olds | 5 (100.0%) | 0 (0.0%) |
| 25 to 34 Year Olds | 9 (90.0%) | 1 (10.0%) |
| 35 Years and over | 9 (100.0%) | 0 (0.0%) |
| Total | 228 (81.1%) | 53 (18.9%) |
Educational Attainment by Field of Study in Castleton On Hudson
Business (59 | 19.2%), education (41 | 13.3%), science & technology (40 | 13.0%), social sciences (29 | 9.4%), and literature & languages (25 | 8.1%) are the most common fields of study among 308 individuals in Castleton On Hudson who have obtained a bachelor's degree or higher.
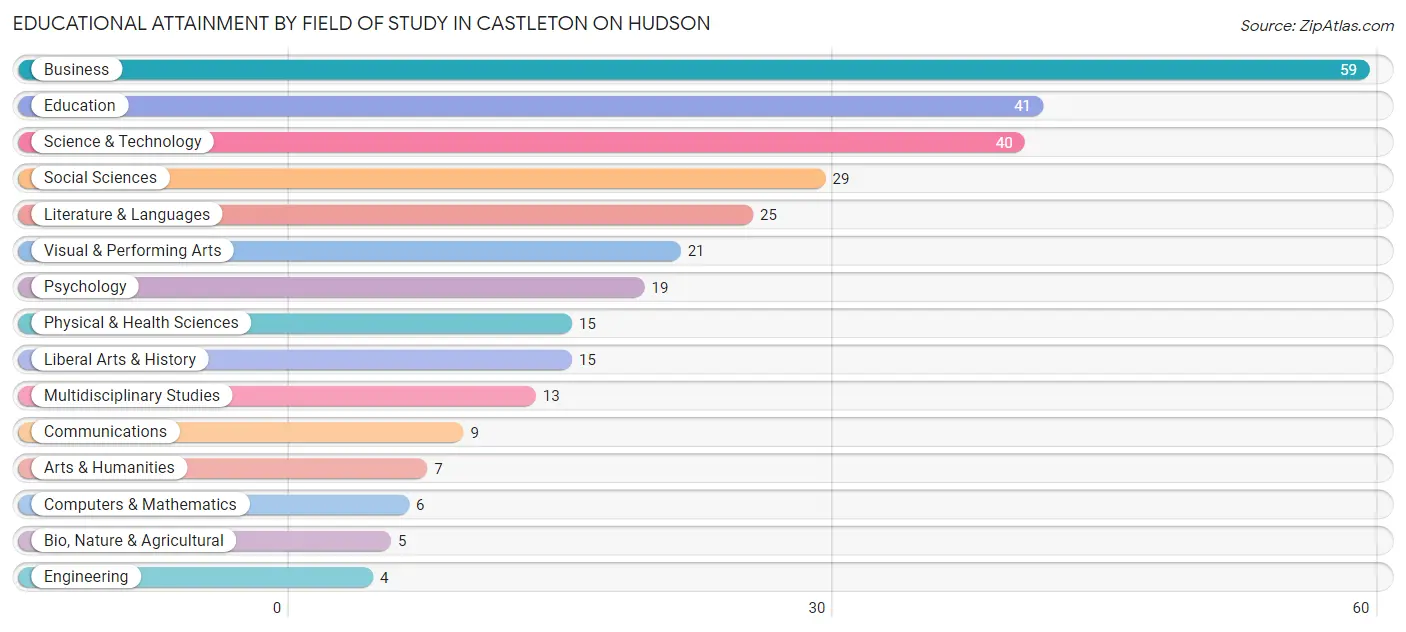
| Field of Study | # Graduates | % Graduates |
| Computers & Mathematics | 6 | 1.9% |
| Bio, Nature & Agricultural | 5 | 1.6% |
| Physical & Health Sciences | 15 | 4.9% |
| Psychology | 19 | 6.2% |
| Social Sciences | 29 | 9.4% |
| Engineering | 4 | 1.3% |
| Multidisciplinary Studies | 13 | 4.2% |
| Science & Technology | 40 | 13.0% |
| Business | 59 | 19.2% |
| Education | 41 | 13.3% |
| Literature & Languages | 25 | 8.1% |
| Liberal Arts & History | 15 | 4.9% |
| Visual & Performing Arts | 21 | 6.8% |
| Communications | 9 | 2.9% |
| Arts & Humanities | 7 | 2.3% |
| Total | 308 | 100.0% |
Transportation & Commute in Castleton On Hudson
Vehicle Availability by Sex in Castleton On Hudson
The most prevalent vehicle ownership categories in Castleton On Hudson are males with 2 vehicles (146, accounting for 48.2%) and females with 2 vehicles (129, making up 45.5%).
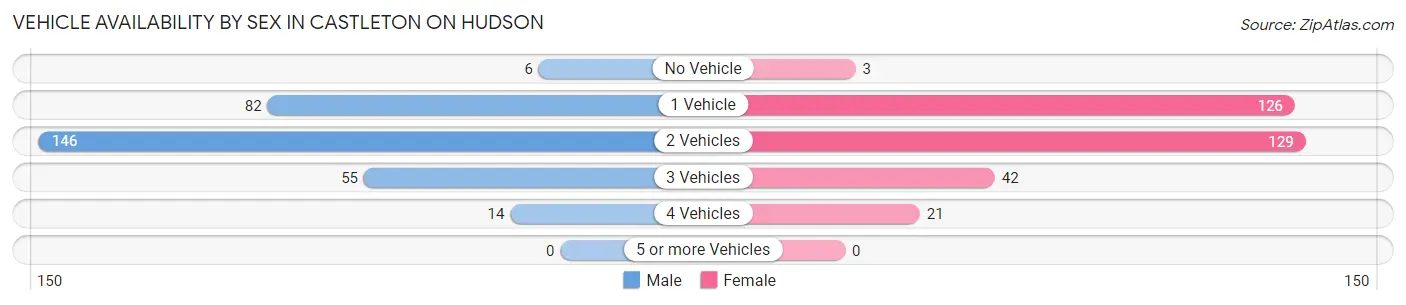
| Vehicles Available | Male | Female |
| No Vehicle | 6 (2.0%) | 3 (0.9%) |
| 1 Vehicle | 82 (27.1%) | 126 (39.3%) |
| 2 Vehicles | 146 (48.2%) | 129 (40.2%) |
| 3 Vehicles | 55 (18.1%) | 42 (13.1%) |
| 4 Vehicles | 14 (4.6%) | 21 (6.5%) |
| 5 or more Vehicles | 0 (0.0%) | 0 (0.0%) |
| Total | 303 (100.0%) | 321 (100.0%) |
Commute Time in Castleton On Hudson
The most frequently occuring commute durations in Castleton On Hudson are 20 to 24 minutes (126 commuters, 23.3%), 15 to 19 minutes (86 commuters, 15.9%), and 30 to 34 minutes (81 commuters, 14.9%).
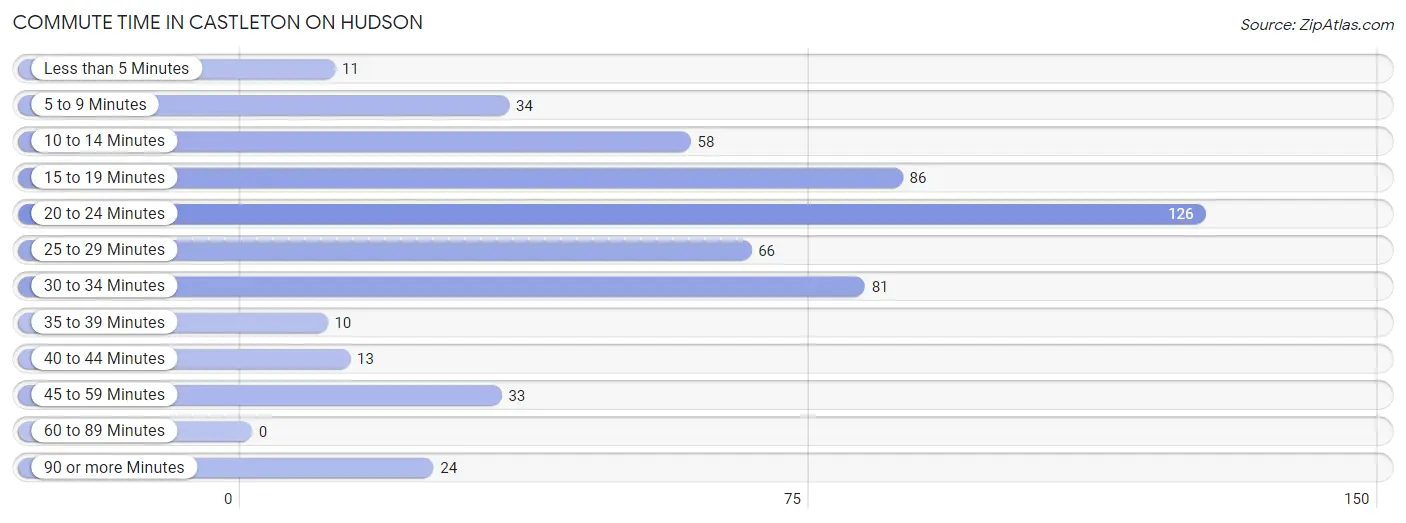
| Commute Time | # Commuters | % Commuters |
| Less than 5 Minutes | 11 | 2.0% |
| 5 to 9 Minutes | 34 | 6.3% |
| 10 to 14 Minutes | 58 | 10.7% |
| 15 to 19 Minutes | 86 | 15.9% |
| 20 to 24 Minutes | 126 | 23.3% |
| 25 to 29 Minutes | 66 | 12.2% |
| 30 to 34 Minutes | 81 | 14.9% |
| 35 to 39 Minutes | 10 | 1.8% |
| 40 to 44 Minutes | 13 | 2.4% |
| 45 to 59 Minutes | 33 | 6.1% |
| 60 to 89 Minutes | 0 | 0.0% |
| 90 or more Minutes | 24 | 4.4% |
Commute Time by Sex in Castleton On Hudson
The most common commute times in Castleton On Hudson are 10 to 14 minutes (52 commuters, 18.2%) for males and 20 to 24 minutes (76 commuters, 29.6%) for females.
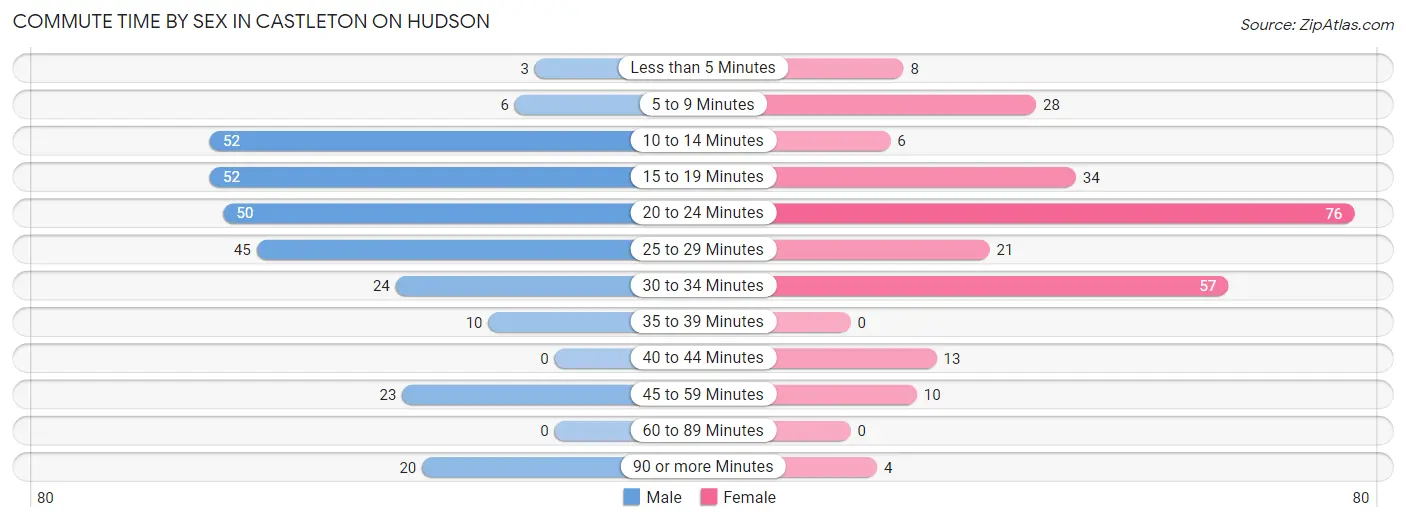
| Commute Time | Male | Female |
| Less than 5 Minutes | 3 (1.1%) | 8 (3.1%) |
| 5 to 9 Minutes | 6 (2.1%) | 28 (10.9%) |
| 10 to 14 Minutes | 52 (18.2%) | 6 (2.3%) |
| 15 to 19 Minutes | 52 (18.2%) | 34 (13.2%) |
| 20 to 24 Minutes | 50 (17.5%) | 76 (29.6%) |
| 25 to 29 Minutes | 45 (15.8%) | 21 (8.2%) |
| 30 to 34 Minutes | 24 (8.4%) | 57 (22.2%) |
| 35 to 39 Minutes | 10 (3.5%) | 0 (0.0%) |
| 40 to 44 Minutes | 0 (0.0%) | 13 (5.1%) |
| 45 to 59 Minutes | 23 (8.1%) | 10 (3.9%) |
| 60 to 89 Minutes | 0 (0.0%) | 0 (0.0%) |
| 90 or more Minutes | 20 (7.0%) | 4 (1.6%) |
Time of Departure to Work by Sex in Castleton On Hudson
The most frequent times of departure to work in Castleton On Hudson are 6:00 AM to 6:29 AM (43, 15.1%) for males and 7:00 AM to 7:29 AM (54, 21.0%) for females.
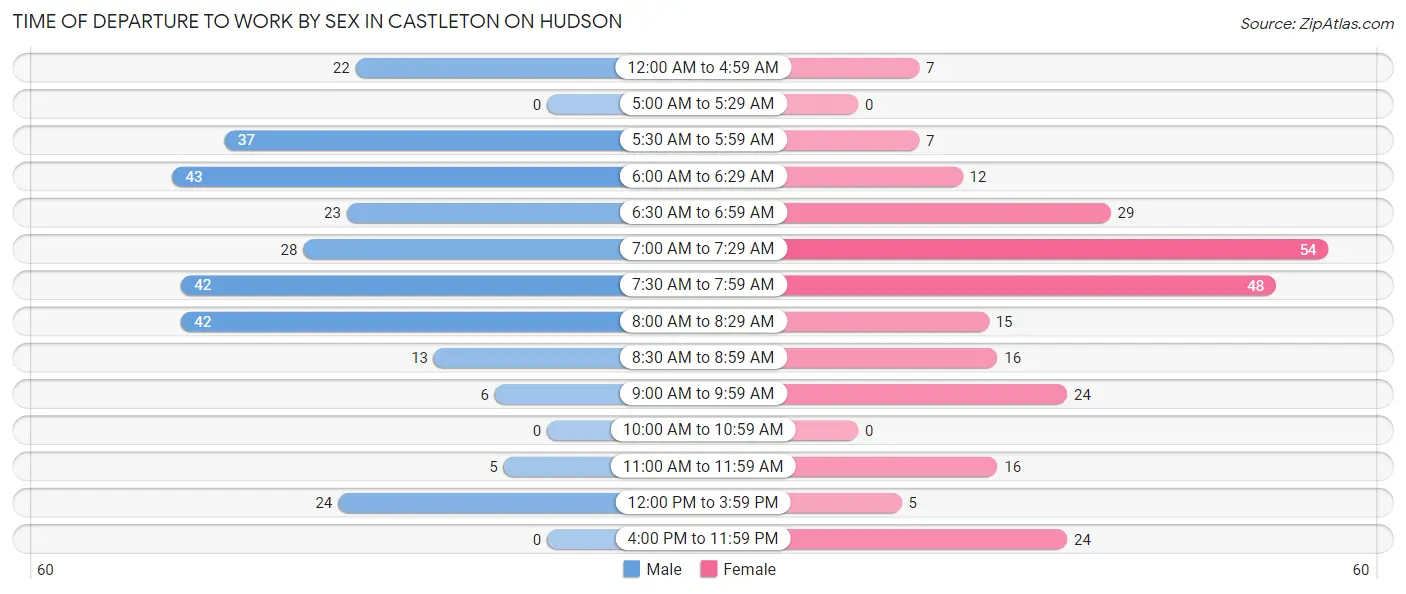
| Time of Departure | Male | Female |
| 12:00 AM to 4:59 AM | 22 (7.7%) | 7 (2.7%) |
| 5:00 AM to 5:29 AM | 0 (0.0%) | 0 (0.0%) |
| 5:30 AM to 5:59 AM | 37 (13.0%) | 7 (2.7%) |
| 6:00 AM to 6:29 AM | 43 (15.1%) | 12 (4.7%) |
| 6:30 AM to 6:59 AM | 23 (8.1%) | 29 (11.3%) |
| 7:00 AM to 7:29 AM | 28 (9.8%) | 54 (21.0%) |
| 7:30 AM to 7:59 AM | 42 (14.7%) | 48 (18.7%) |
| 8:00 AM to 8:29 AM | 42 (14.7%) | 15 (5.8%) |
| 8:30 AM to 8:59 AM | 13 (4.6%) | 16 (6.2%) |
| 9:00 AM to 9:59 AM | 6 (2.1%) | 24 (9.3%) |
| 10:00 AM to 10:59 AM | 0 (0.0%) | 0 (0.0%) |
| 11:00 AM to 11:59 AM | 5 (1.8%) | 16 (6.2%) |
| 12:00 PM to 3:59 PM | 24 (8.4%) | 5 (1.9%) |
| 4:00 PM to 11:59 PM | 0 (0.0%) | 24 (9.3%) |
| Total | 285 (100.0%) | 257 (100.0%) |
Housing Occupancy in Castleton On Hudson
Occupancy by Ownership in Castleton On Hudson
Of the total 626 dwellings in Castleton On Hudson, owner-occupied units account for 388 (62.0%), while renter-occupied units make up 238 (38.0%).
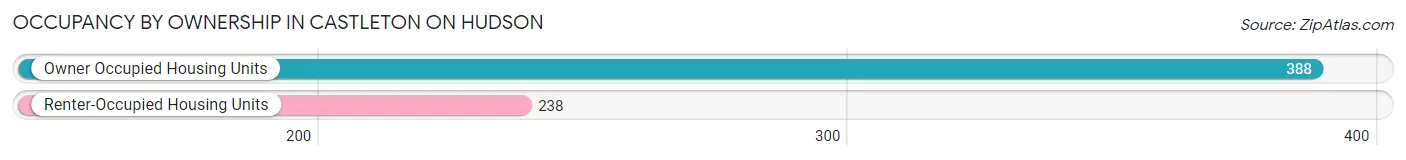
| Occupancy | # Housing Units | % Housing Units |
| Owner Occupied Housing Units | 388 | 62.0% |
| Renter-Occupied Housing Units | 238 | 38.0% |
| Total Occupied Housing Units | 626 | 100.0% |
Occupancy by Household Size in Castleton On Hudson
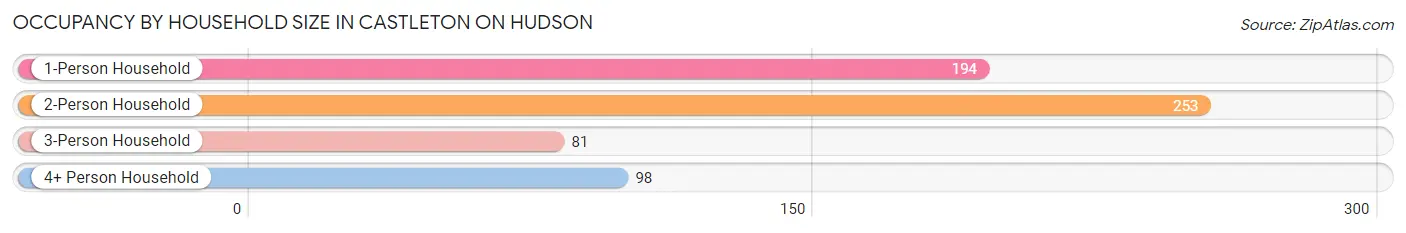
| Household Size | # Housing Units | % Housing Units |
| 1-Person Household | 194 | 31.0% |
| 2-Person Household | 253 | 40.4% |
| 3-Person Household | 81 | 12.9% |
| 4+ Person Household | 98 | 15.7% |
| Total Housing Units | 626 | 100.0% |
Occupancy by Ownership by Household Size in Castleton On Hudson
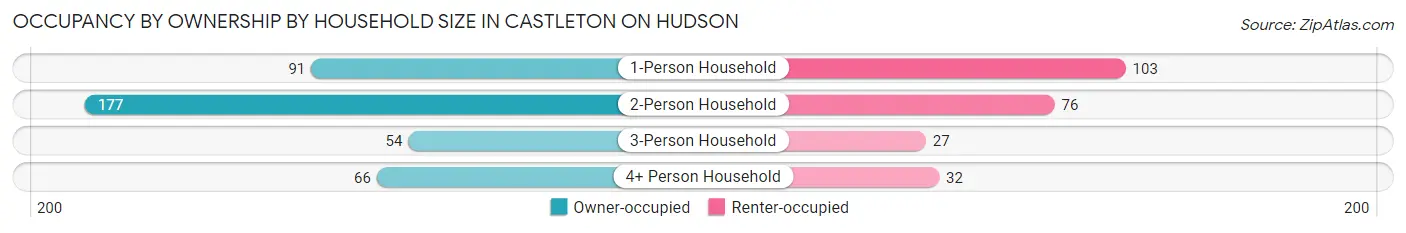
| Household Size | Owner-occupied | Renter-occupied |
| 1-Person Household | 91 (46.9%) | 103 (53.1%) |
| 2-Person Household | 177 (70.0%) | 76 (30.0%) |
| 3-Person Household | 54 (66.7%) | 27 (33.3%) |
| 4+ Person Household | 66 (67.3%) | 32 (32.7%) |
| Total Housing Units | 388 (62.0%) | 238 (38.0%) |
Occupancy by Educational Attainment in Castleton On Hudson
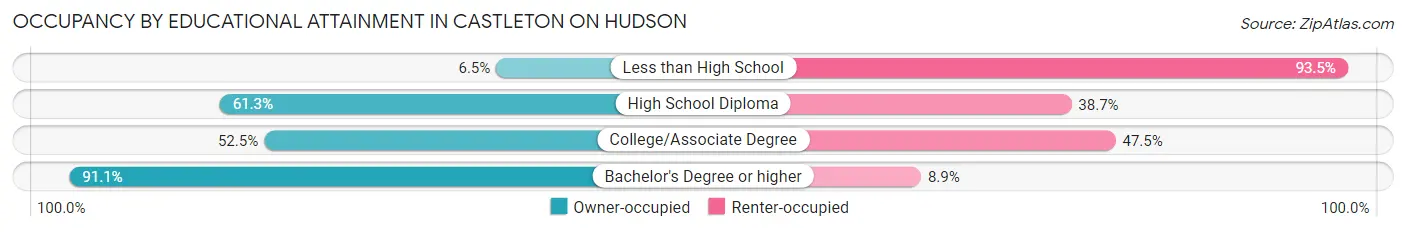
| Household Size | Owner-occupied | Renter-occupied |
| Less than High School | 3 (6.5%) | 43 (93.5%) |
| High School Diploma | 76 (61.3%) | 48 (38.7%) |
| College/Associate Degree | 145 (52.5%) | 131 (47.5%) |
| Bachelor's Degree or higher | 164 (91.1%) | 16 (8.9%) |
Occupancy by Age of Householder in Castleton On Hudson
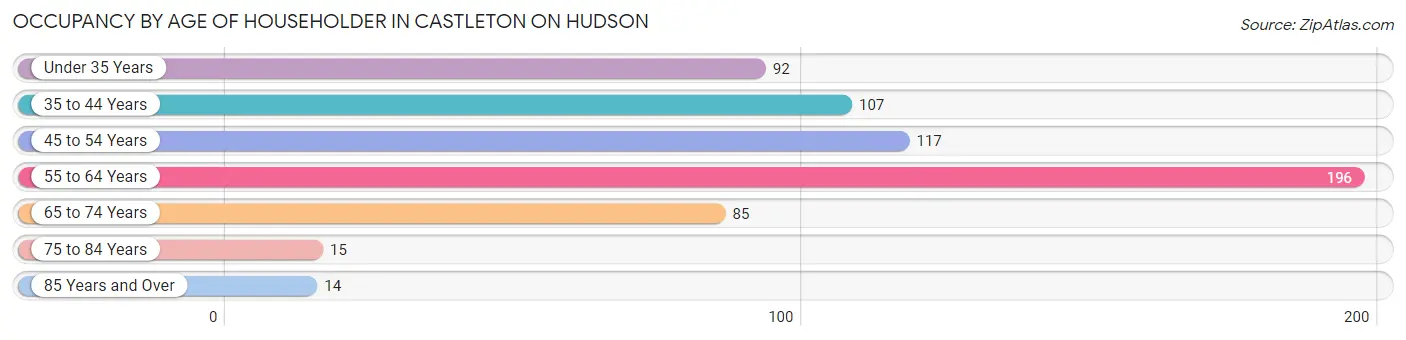
| Age Bracket | # Households | % Households |
| Under 35 Years | 92 | 14.7% |
| 35 to 44 Years | 107 | 17.1% |
| 45 to 54 Years | 117 | 18.7% |
| 55 to 64 Years | 196 | 31.3% |
| 65 to 74 Years | 85 | 13.6% |
| 75 to 84 Years | 15 | 2.4% |
| 85 Years and Over | 14 | 2.2% |
| Total | 626 | 100.0% |
Housing Finances in Castleton On Hudson
Median Income by Occupancy in Castleton On Hudson
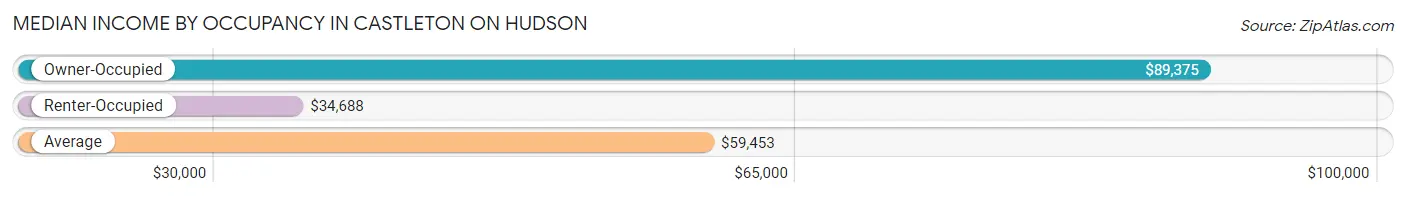
| Occupancy Type | # Households | Median Income |
| Owner-Occupied | 388 (62.0%) | $89,375 |
| Renter-Occupied | 238 (38.0%) | $34,688 |
| Average | 626 (100.0%) | $59,453 |
Occupancy by Householder Income Bracket in Castleton On Hudson
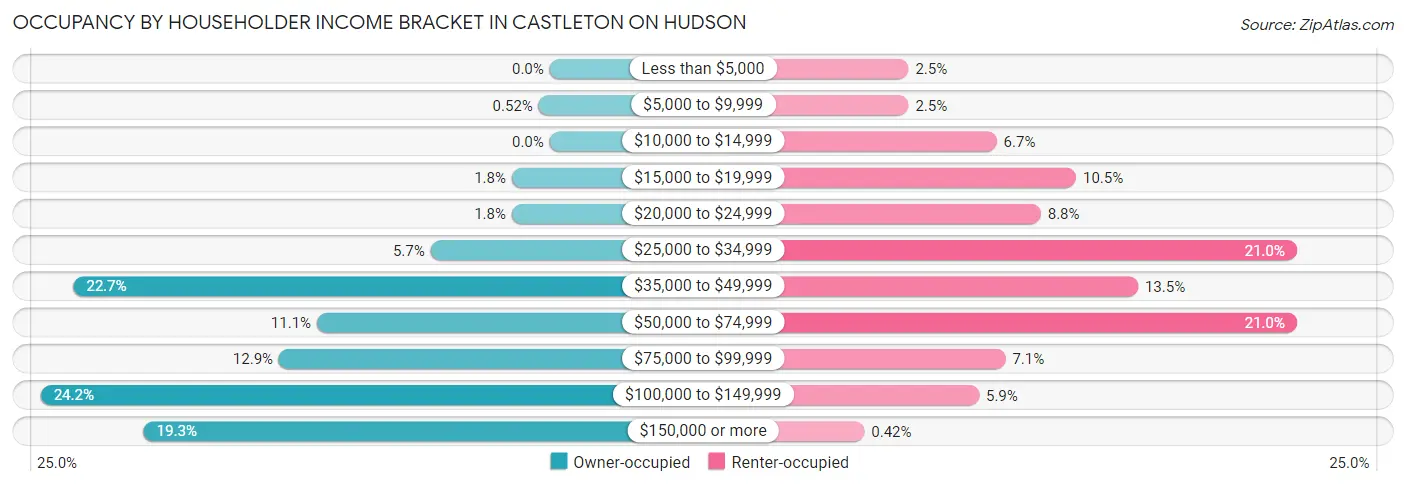
| Income Bracket | Owner-occupied | Renter-occupied |
| Less than $5,000 | 0 (0.0%) | 6 (2.5%) |
| $5,000 to $9,999 | 2 (0.5%) | 6 (2.5%) |
| $10,000 to $14,999 | 0 (0.0%) | 16 (6.7%) |
| $15,000 to $19,999 | 7 (1.8%) | 25 (10.5%) |
| $20,000 to $24,999 | 7 (1.8%) | 21 (8.8%) |
| $25,000 to $34,999 | 22 (5.7%) | 50 (21.0%) |
| $35,000 to $49,999 | 88 (22.7%) | 32 (13.5%) |
| $50,000 to $74,999 | 43 (11.1%) | 50 (21.0%) |
| $75,000 to $99,999 | 50 (12.9%) | 17 (7.1%) |
| $100,000 to $149,999 | 94 (24.2%) | 14 (5.9%) |
| $150,000 or more | 75 (19.3%) | 1 (0.4%) |
| Total | 388 (100.0%) | 238 (100.0%) |
Monthly Housing Cost Tiers in Castleton On Hudson
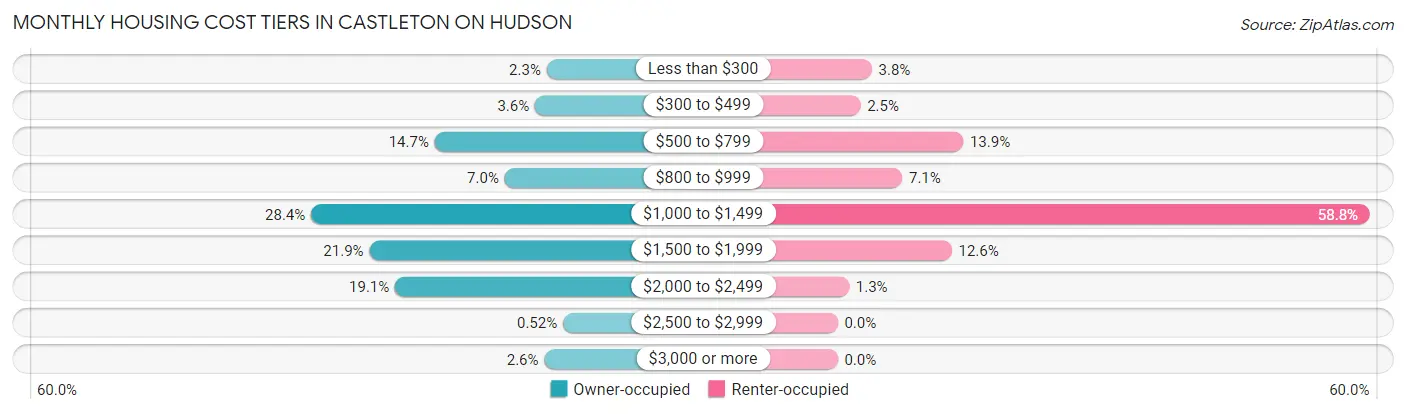
| Monthly Cost | Owner-occupied | Renter-occupied |
| Less than $300 | 9 (2.3%) | 9 (3.8%) |
| $300 to $499 | 14 (3.6%) | 6 (2.5%) |
| $500 to $799 | 57 (14.7%) | 33 (13.9%) |
| $800 to $999 | 27 (7.0%) | 17 (7.1%) |
| $1,000 to $1,499 | 110 (28.3%) | 140 (58.8%) |
| $1,500 to $1,999 | 85 (21.9%) | 30 (12.6%) |
| $2,000 to $2,499 | 74 (19.1%) | 3 (1.3%) |
| $2,500 to $2,999 | 2 (0.5%) | 0 (0.0%) |
| $3,000 or more | 10 (2.6%) | 0 (0.0%) |
| Total | 388 (100.0%) | 238 (100.0%) |
Physical Housing Characteristics in Castleton On Hudson
Housing Structures in Castleton On Hudson
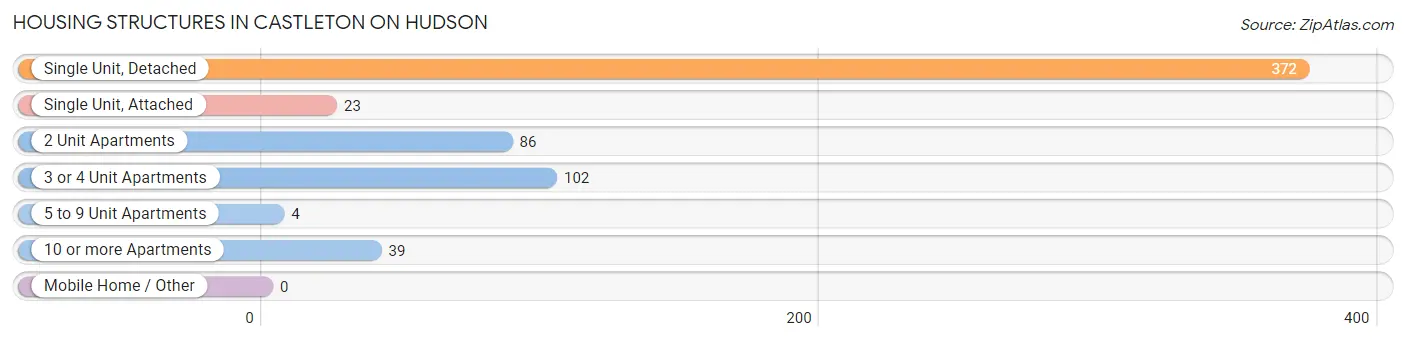
| Structure Type | # Housing Units | % Housing Units |
| Single Unit, Detached | 372 | 59.4% |
| Single Unit, Attached | 23 | 3.7% |
| 2 Unit Apartments | 86 | 13.7% |
| 3 or 4 Unit Apartments | 102 | 16.3% |
| 5 to 9 Unit Apartments | 4 | 0.6% |
| 10 or more Apartments | 39 | 6.2% |
| Mobile Home / Other | 0 | 0.0% |
| Total | 626 | 100.0% |
Housing Structures by Occupancy in Castleton On Hudson
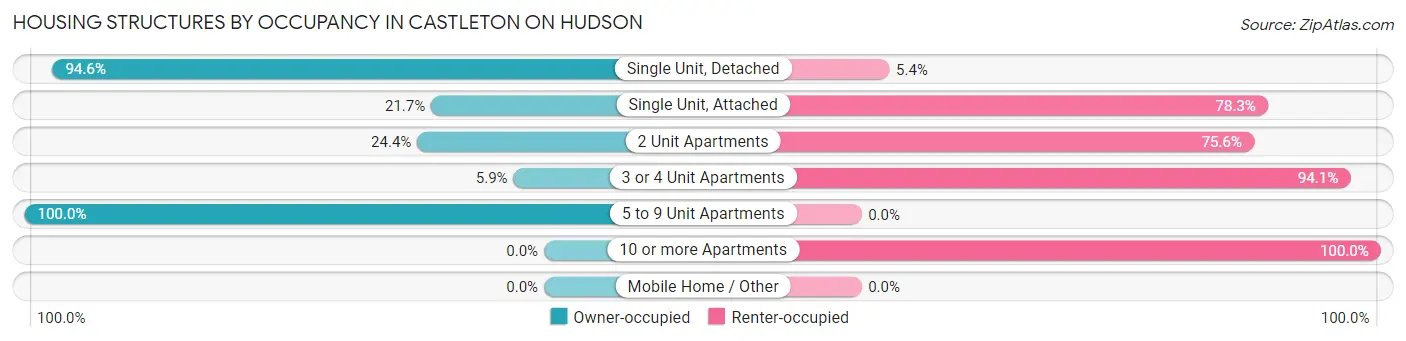
| Structure Type | Owner-occupied | Renter-occupied |
| Single Unit, Detached | 352 (94.6%) | 20 (5.4%) |
| Single Unit, Attached | 5 (21.7%) | 18 (78.3%) |
| 2 Unit Apartments | 21 (24.4%) | 65 (75.6%) |
| 3 or 4 Unit Apartments | 6 (5.9%) | 96 (94.1%) |
| 5 to 9 Unit Apartments | 4 (100.0%) | 0 (0.0%) |
| 10 or more Apartments | 0 (0.0%) | 39 (100.0%) |
| Mobile Home / Other | 0 (0.0%) | 0 (0.0%) |
| Total | 388 (62.0%) | 238 (38.0%) |
Housing Structures by Number of Rooms in Castleton On Hudson
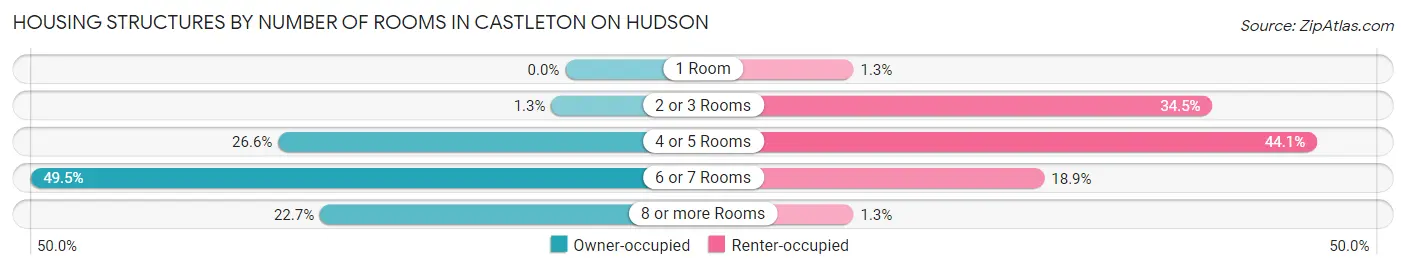
| Number of Rooms | Owner-occupied | Renter-occupied |
| 1 Room | 0 (0.0%) | 3 (1.3%) |
| 2 or 3 Rooms | 5 (1.3%) | 82 (34.4%) |
| 4 or 5 Rooms | 103 (26.6%) | 105 (44.1%) |
| 6 or 7 Rooms | 192 (49.5%) | 45 (18.9%) |
| 8 or more Rooms | 88 (22.7%) | 3 (1.3%) |
| Total | 388 (100.0%) | 238 (100.0%) |
Housing Structure by Heating Type in Castleton On Hudson
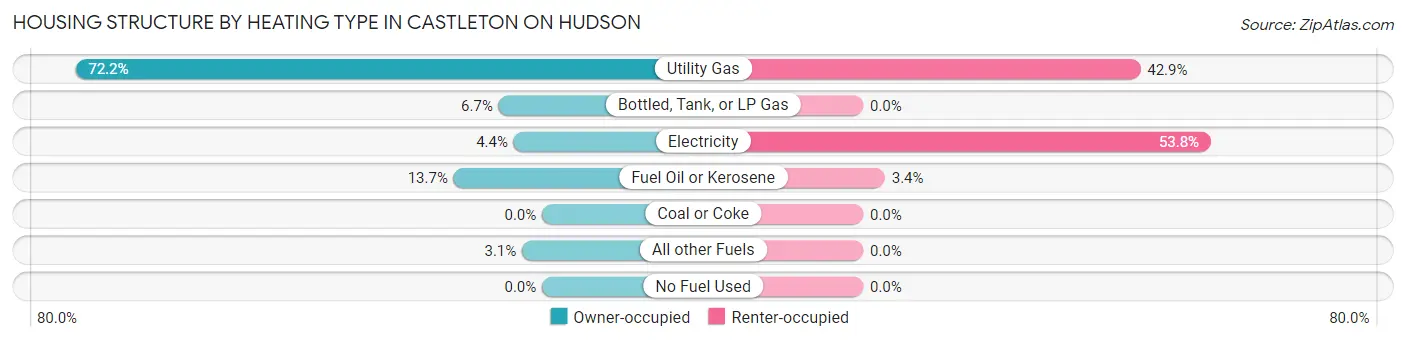
| Heating Type | Owner-occupied | Renter-occupied |
| Utility Gas | 280 (72.2%) | 102 (42.9%) |
| Bottled, Tank, or LP Gas | 26 (6.7%) | 0 (0.0%) |
| Electricity | 17 (4.4%) | 128 (53.8%) |
| Fuel Oil or Kerosene | 53 (13.7%) | 8 (3.4%) |
| Coal or Coke | 0 (0.0%) | 0 (0.0%) |
| All other Fuels | 12 (3.1%) | 0 (0.0%) |
| No Fuel Used | 0 (0.0%) | 0 (0.0%) |
| Total | 388 (100.0%) | 238 (100.0%) |
Household Vehicle Usage in Castleton On Hudson
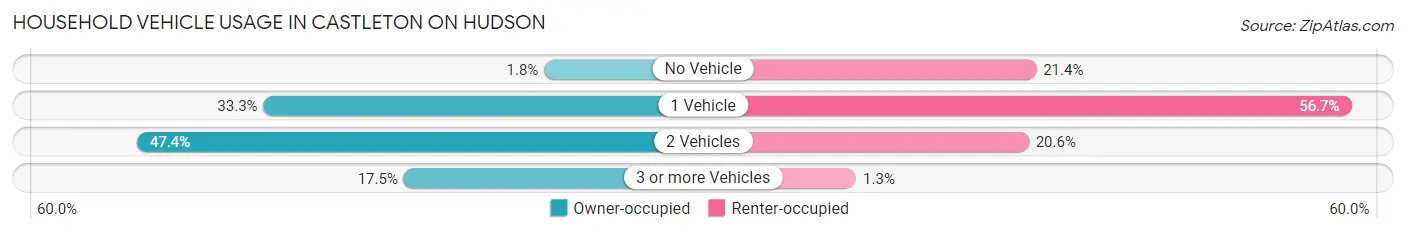
| Vehicles per Household | Owner-occupied | Renter-occupied |
| No Vehicle | 7 (1.8%) | 51 (21.4%) |
| 1 Vehicle | 129 (33.3%) | 135 (56.7%) |
| 2 Vehicles | 184 (47.4%) | 49 (20.6%) |
| 3 or more Vehicles | 68 (17.5%) | 3 (1.3%) |
| Total | 388 (100.0%) | 238 (100.0%) |
Real Estate & Mortgages in Castleton On Hudson
Real Estate and Mortgage Overview in Castleton On Hudson
| Characteristic | Without Mortgage | With Mortgage |
| Housing Units | 111 | 277 |
| Median Property Value | $180,500 | $197,000 |
| Median Household Income | $72,292 | $66 |
| Monthly Housing Costs | $643 | $10 |
| Real Estate Taxes | $3,850 | $5 |
Property Value by Mortgage Status in Castleton On Hudson
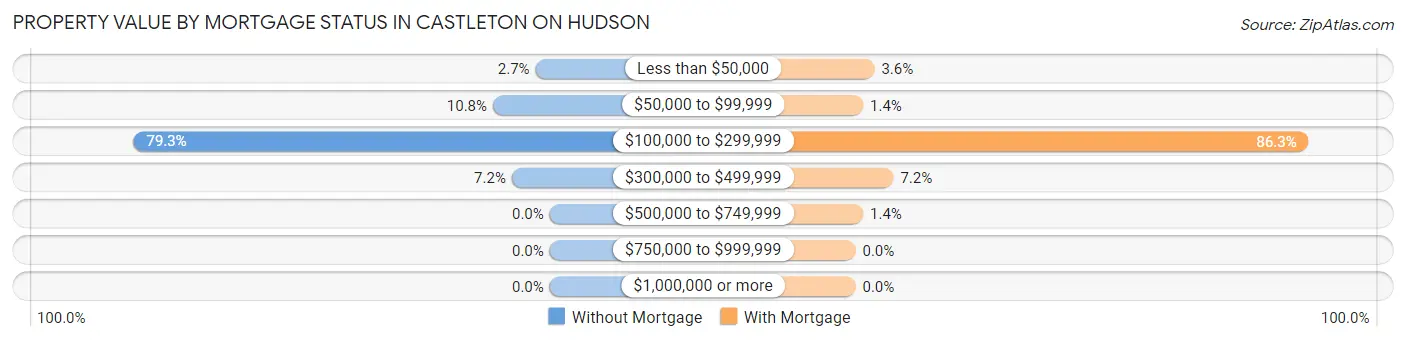
| Property Value | Without Mortgage | With Mortgage |
| Less than $50,000 | 3 (2.7%) | 10 (3.6%) |
| $50,000 to $99,999 | 12 (10.8%) | 4 (1.4%) |
| $100,000 to $299,999 | 88 (79.3%) | 239 (86.3%) |
| $300,000 to $499,999 | 8 (7.2%) | 20 (7.2%) |
| $500,000 to $749,999 | 0 (0.0%) | 4 (1.4%) |
| $750,000 to $999,999 | 0 (0.0%) | 0 (0.0%) |
| $1,000,000 or more | 0 (0.0%) | 0 (0.0%) |
| Total | 111 (100.0%) | 277 (100.0%) |
Household Income by Mortgage Status in Castleton On Hudson
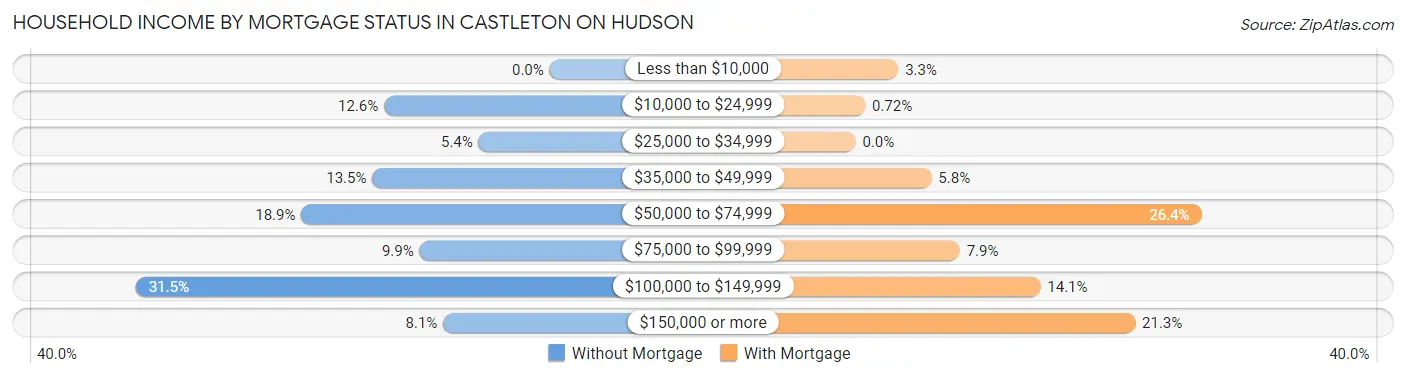
| Household Income | Without Mortgage | With Mortgage |
| Less than $10,000 | 0 (0.0%) | 9 (3.3%) |
| $10,000 to $24,999 | 14 (12.6%) | 2 (0.7%) |
| $25,000 to $34,999 | 6 (5.4%) | 0 (0.0%) |
| $35,000 to $49,999 | 15 (13.5%) | 16 (5.8%) |
| $50,000 to $74,999 | 21 (18.9%) | 73 (26.4%) |
| $75,000 to $99,999 | 11 (9.9%) | 22 (7.9%) |
| $100,000 to $149,999 | 35 (31.5%) | 39 (14.1%) |
| $150,000 or more | 9 (8.1%) | 59 (21.3%) |
| Total | 111 (100.0%) | 277 (100.0%) |
Property Value to Household Income Ratio in Castleton On Hudson
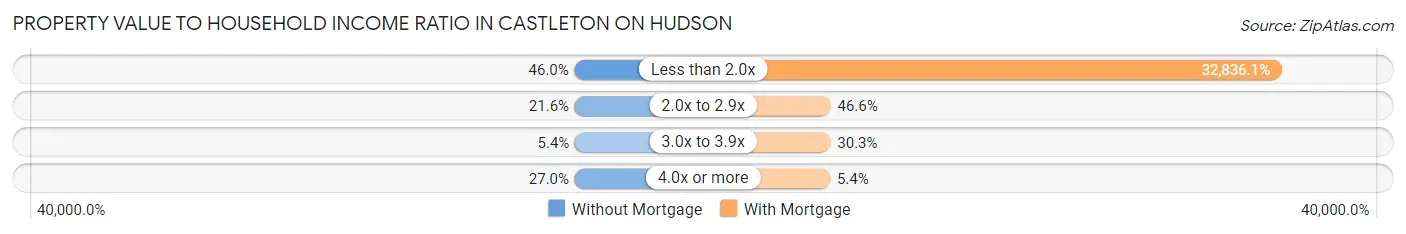
| Value-to-Income Ratio | Without Mortgage | With Mortgage |
| Less than 2.0x | 51 (46.0%) | 90,956 (32,836.1%) |
| 2.0x to 2.9x | 24 (21.6%) | 129 (46.6%) |
| 3.0x to 3.9x | 6 (5.4%) | 84 (30.3%) |
| 4.0x or more | 30 (27.0%) | 15 (5.4%) |
| Total | 111 (100.0%) | 277 (100.0%) |
Real Estate Taxes by Mortgage Status in Castleton On Hudson
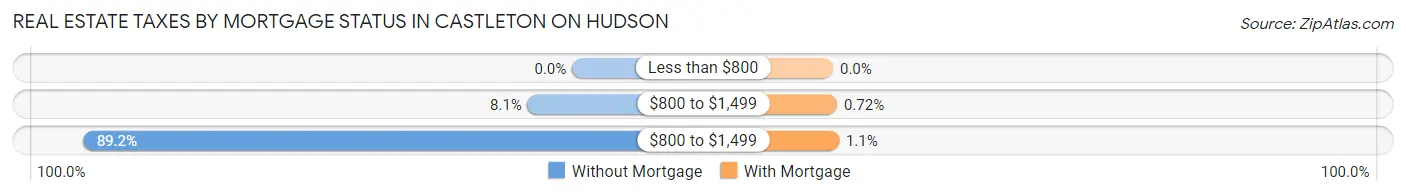
| Property Taxes | Without Mortgage | With Mortgage |
| Less than $800 | 0 (0.0%) | 0 (0.0%) |
| $800 to $1,499 | 9 (8.1%) | 2 (0.7%) |
| $800 to $1,499 | 99 (89.2%) | 3 (1.1%) |
| Total | 111 (100.0%) | 277 (100.0%) |
Health & Disability in Castleton On Hudson
Health Insurance Coverage by Age in Castleton On Hudson
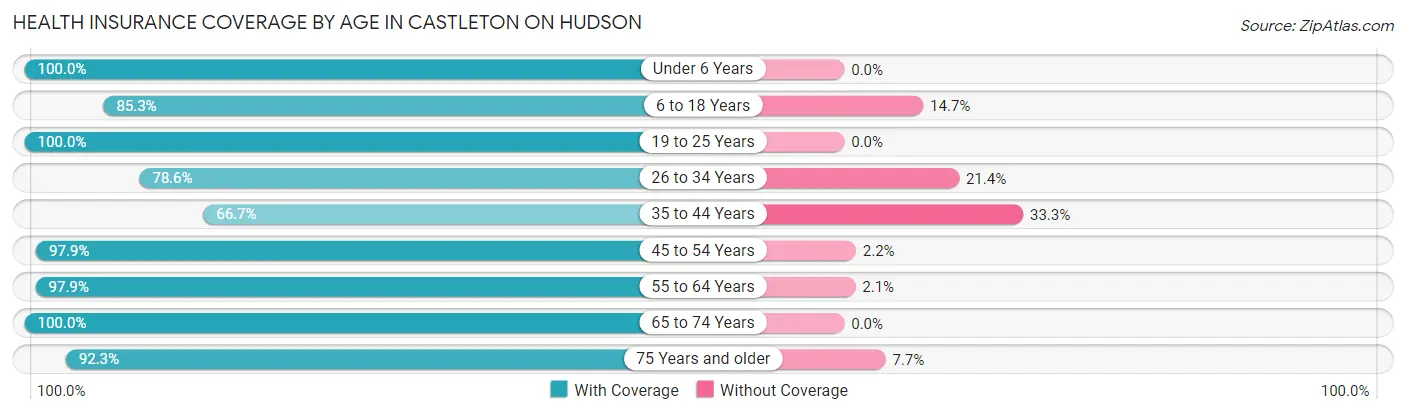
| Age Bracket | With Coverage | Without Coverage |
| Under 6 Years | 90 (100.0%) | 0 (0.0%) |
| 6 to 18 Years | 174 (85.3%) | 30 (14.7%) |
| 19 to 25 Years | 96 (100.0%) | 0 (0.0%) |
| 26 to 34 Years | 147 (78.6%) | 40 (21.4%) |
| 35 to 44 Years | 144 (66.7%) | 72 (33.3%) |
| 45 to 54 Years | 182 (97.9%) | 4 (2.1%) |
| 55 to 64 Years | 238 (97.9%) | 5 (2.1%) |
| 65 to 74 Years | 126 (100.0%) | 0 (0.0%) |
| 75 Years and older | 60 (92.3%) | 5 (7.7%) |
| Total | 1,257 (89.0%) | 156 (11.0%) |
Health Insurance Coverage by Citizenship Status in Castleton On Hudson
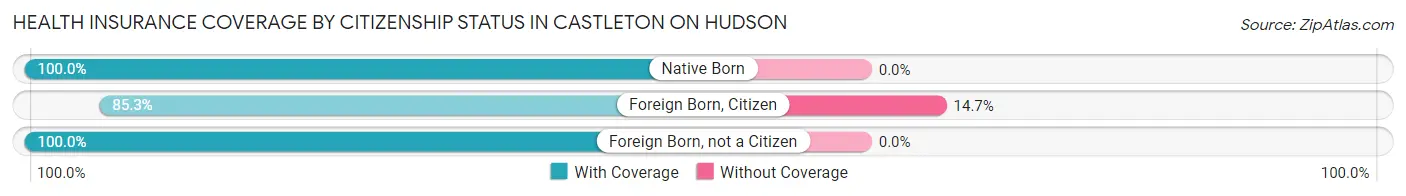
| Citizenship Status | With Coverage | Without Coverage |
| Native Born | 90 (100.0%) | 0 (0.0%) |
| Foreign Born, Citizen | 174 (85.3%) | 30 (14.7%) |
| Foreign Born, not a Citizen | 96 (100.0%) | 0 (0.0%) |
Health Insurance Coverage by Household Income in Castleton On Hudson
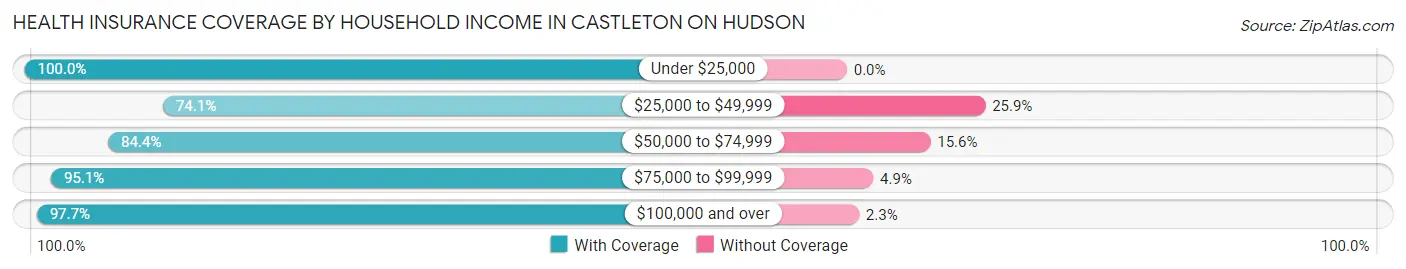
| Household Income | With Coverage | Without Coverage |
| Under $25,000 | 108 (100.0%) | 0 (0.0%) |
| $25,000 to $49,999 | 280 (74.1%) | 98 (25.9%) |
| $50,000 to $74,999 | 178 (84.4%) | 33 (15.6%) |
| $75,000 to $99,999 | 154 (95.1%) | 8 (4.9%) |
| $100,000 and over | 517 (97.7%) | 12 (2.3%) |
Public vs Private Health Insurance Coverage by Age in Castleton On Hudson
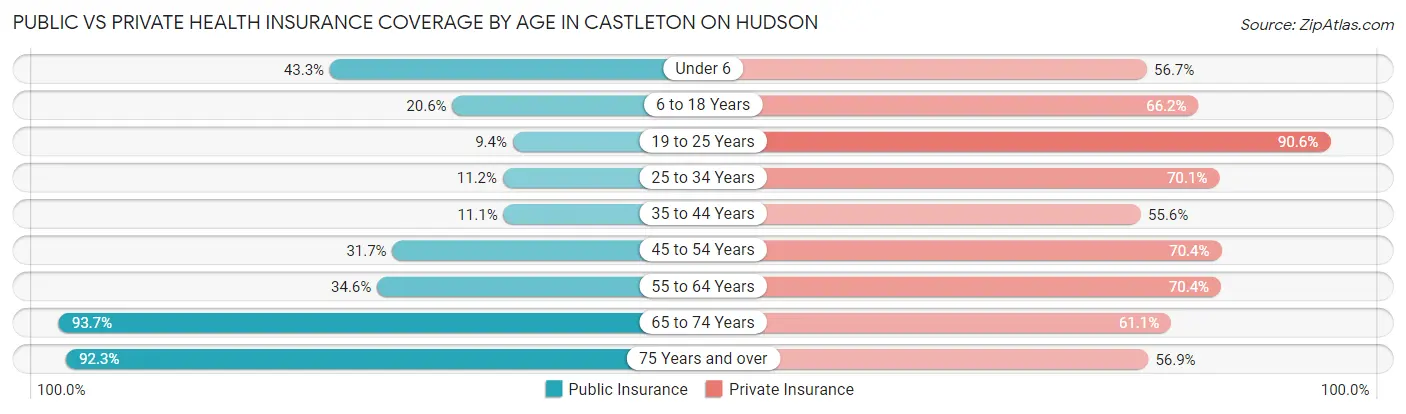
| Age Bracket | Public Insurance | Private Insurance |
| Under 6 | 39 (43.3%) | 51 (56.7%) |
| 6 to 18 Years | 42 (20.6%) | 135 (66.2%) |
| 19 to 25 Years | 9 (9.4%) | 87 (90.6%) |
| 25 to 34 Years | 21 (11.2%) | 131 (70.1%) |
| 35 to 44 Years | 24 (11.1%) | 120 (55.6%) |
| 45 to 54 Years | 59 (31.7%) | 131 (70.4%) |
| 55 to 64 Years | 84 (34.6%) | 171 (70.4%) |
| 65 to 74 Years | 118 (93.6%) | 77 (61.1%) |
| 75 Years and over | 60 (92.3%) | 37 (56.9%) |
| Total | 456 (32.3%) | 940 (66.5%) |
Disability Status by Sex by Age in Castleton On Hudson
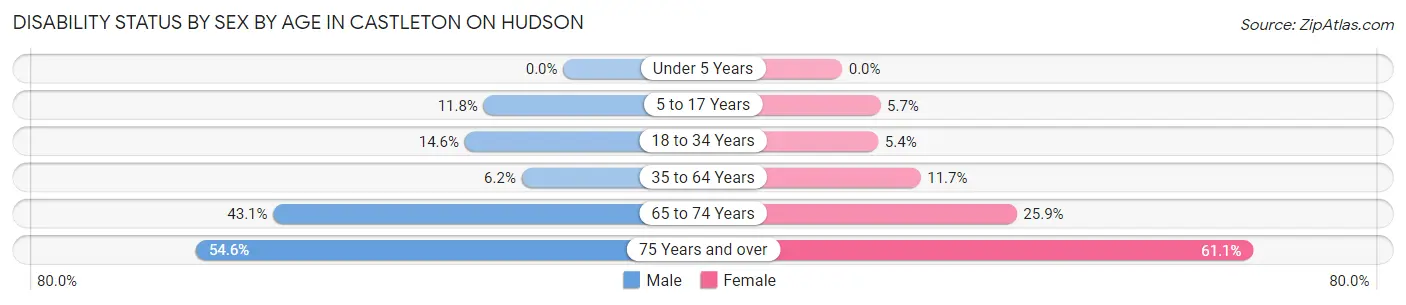
| Age Bracket | Male | Female |
| Under 5 Years | 0 (0.0%) | 0 (0.0%) |
| 5 to 17 Years | 11 (11.8%) | 7 (5.7%) |
| 18 to 34 Years | 18 (14.6%) | 9 (5.4%) |
| 35 to 64 Years | 16 (6.2%) | 45 (11.7%) |
| 65 to 74 Years | 31 (43.1%) | 14 (25.9%) |
| 75 Years and over | 6 (54.5%) | 33 (61.1%) |
Disability Class by Sex by Age in Castleton On Hudson
Disability Class: Hearing Difficulty
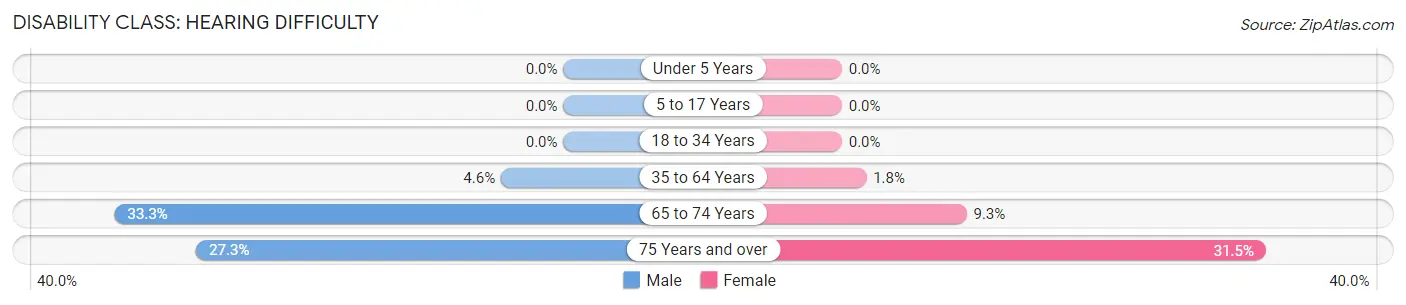
| Age Bracket | Male | Female |
| Under 5 Years | 0 (0.0%) | 0 (0.0%) |
| 5 to 17 Years | 0 (0.0%) | 0 (0.0%) |
| 18 to 34 Years | 0 (0.0%) | 0 (0.0%) |
| 35 to 64 Years | 12 (4.6%) | 7 (1.8%) |
| 65 to 74 Years | 24 (33.3%) | 5 (9.3%) |
| 75 Years and over | 3 (27.3%) | 17 (31.5%) |
Disability Class: Vision Difficulty
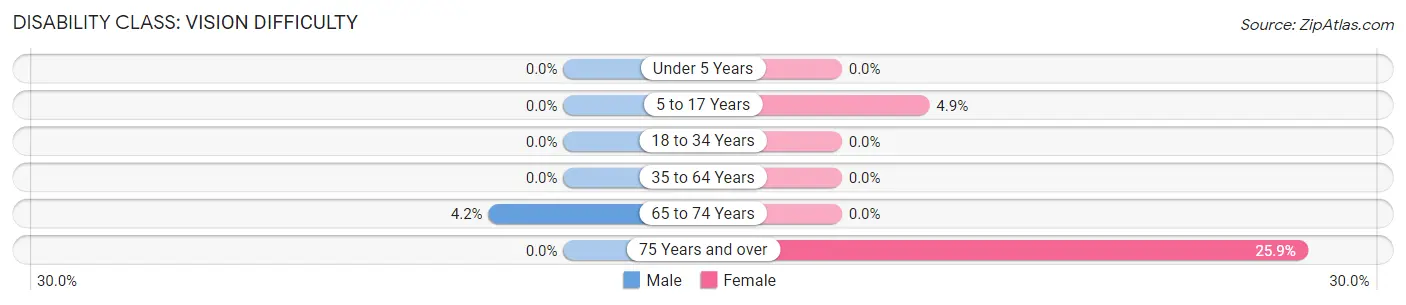
| Age Bracket | Male | Female |
| Under 5 Years | 0 (0.0%) | 0 (0.0%) |
| 5 to 17 Years | 0 (0.0%) | 6 (4.9%) |
| 18 to 34 Years | 0 (0.0%) | 0 (0.0%) |
| 35 to 64 Years | 0 (0.0%) | 0 (0.0%) |
| 65 to 74 Years | 3 (4.2%) | 0 (0.0%) |
| 75 Years and over | 0 (0.0%) | 14 (25.9%) |
Disability Class: Cognitive Difficulty
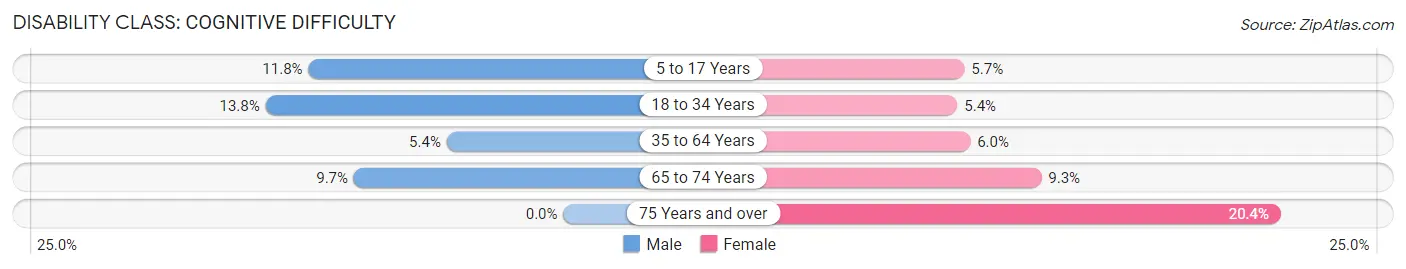
| Age Bracket | Male | Female |
| 5 to 17 Years | 11 (11.8%) | 7 (5.7%) |
| 18 to 34 Years | 17 (13.8%) | 9 (5.4%) |
| 35 to 64 Years | 14 (5.4%) | 23 (6.0%) |
| 65 to 74 Years | 7 (9.7%) | 5 (9.3%) |
| 75 Years and over | 0 (0.0%) | 11 (20.4%) |
Disability Class: Ambulatory Difficulty
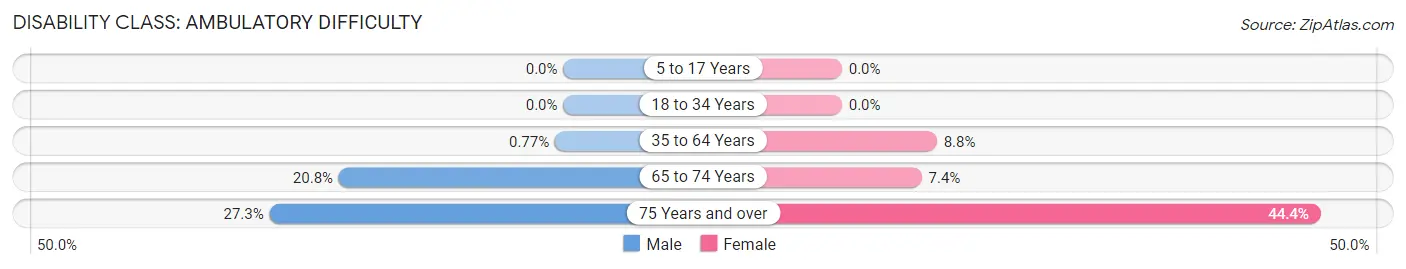
| Age Bracket | Male | Female |
| 5 to 17 Years | 0 (0.0%) | 0 (0.0%) |
| 18 to 34 Years | 0 (0.0%) | 0 (0.0%) |
| 35 to 64 Years | 2 (0.8%) | 34 (8.8%) |
| 65 to 74 Years | 15 (20.8%) | 4 (7.4%) |
| 75 Years and over | 3 (27.3%) | 24 (44.4%) |
Disability Class: Self-Care Difficulty
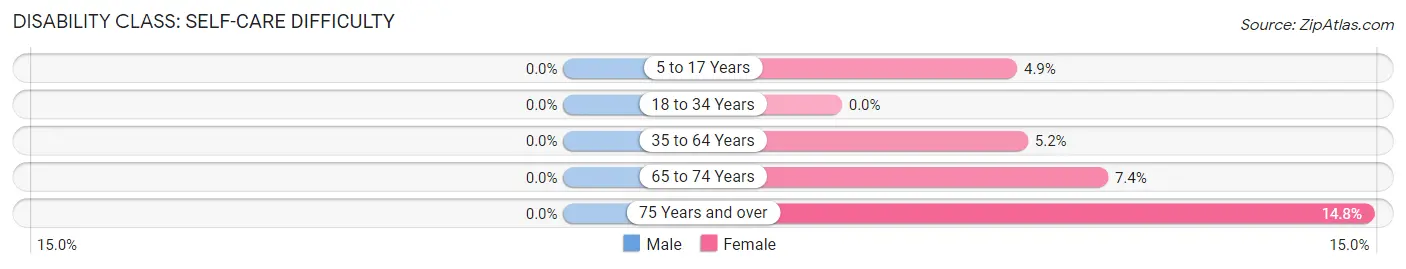
| Age Bracket | Male | Female |
| 5 to 17 Years | 0 (0.0%) | 6 (4.9%) |
| 18 to 34 Years | 0 (0.0%) | 0 (0.0%) |
| 35 to 64 Years | 0 (0.0%) | 20 (5.2%) |
| 65 to 74 Years | 0 (0.0%) | 4 (7.4%) |
| 75 Years and over | 0 (0.0%) | 8 (14.8%) |
Technology Access in Castleton On Hudson
Computing Device Access in Castleton On Hudson
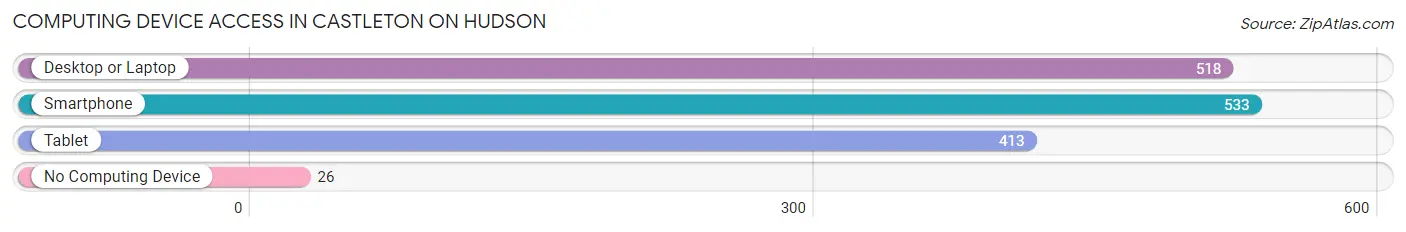
| Device Type | # Households | % Households |
| Desktop or Laptop | 518 | 82.8% |
| Smartphone | 533 | 85.1% |
| Tablet | 413 | 66.0% |
| No Computing Device | 26 | 4.2% |
| Total | 626 | 100.0% |
Internet Access in Castleton On Hudson
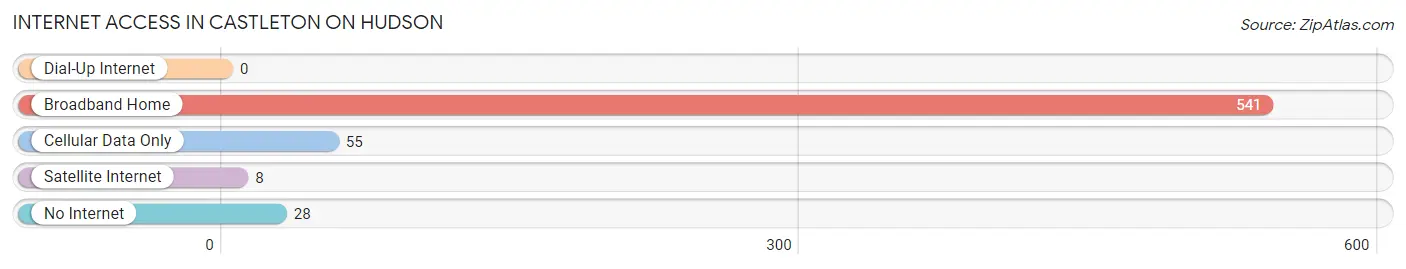
| Internet Type | # Households | % Households |
| Dial-Up Internet | 0 | 0.0% |
| Broadband Home | 541 | 86.4% |
| Cellular Data Only | 55 | 8.8% |
| Satellite Internet | 8 | 1.3% |
| No Internet | 28 | 4.5% |
| Total | 626 | 100.0% |
Castleton On Hudson Summary
Castleton On Hudson, NY is a small village located in the town of Schodack, New York. It is situated on the east bank of the Hudson River, approximately 10 miles south of Albany. The village is part of the Albany-Schenectady-Troy Metropolitan Statistical Area. As of the 2010 census, the population of Castleton On Hudson was 1,817.
History
The area that is now Castleton On Hudson was originally inhabited by the Mahican Native American tribe. The first European settlers arrived in the area in the late 17th century. The village was originally known as “Castleton” and was part of the town of Schodack. In 1820, the village was incorporated as the “Village of Castleton On Hudson”.
The village was an important port on the Hudson River during the 19th century. It was a major shipping center for goods such as coal, lumber, and grain. The village was also home to several factories, including a paper mill, a brickyard, and a tannery.
In the late 19th century, the village began to decline as the shipping industry moved away from the Hudson River. The village was further impacted by the Great Depression and World War II. By the 1950s, the village had become a quiet, rural community.
Geography
Castleton On Hudson is located at 42°41'N 73°45'W. It is situated on the east bank of the Hudson River, approximately 10 miles south of Albany. The village is part of the Albany-Schenectady-Troy Metropolitan Statistical Area.
The village has a total area of 1.2 square miles, all of which is land. The terrain is mostly flat, with some rolling hills. The village is bordered by the town of Schodack to the north, east, and south, and by the Hudson River to the west.
Economy
The economy of Castleton On Hudson is largely based on agriculture and tourism. The village is home to several farms, which produce a variety of crops, including corn, soybeans, and hay. The village is also home to several wineries, which produce a variety of wines.
The village is also a popular tourist destination. It is home to several historic sites, including the Castleton On Hudson Historic District, which is listed on the National Register of Historic Places. The village also hosts several annual events, such as the Castleton On Hudson Summer Festival and the Castleton On Hudson Car Show.
Demographics
As of the 2010 census, the population of Castleton On Hudson was 1,817. The racial makeup of the village was 94.2% White, 1.7% African American, 0.3% Native American, 0.7% Asian, 0.1% Pacific Islander, 1.2% from other races, and 1.9% from two or more races. Hispanic or Latino of any race were 3.3% of the population.
The median household income in the village was $50,938, and the median family income was $60,938. The per capita income in the village was $25,938. About 8.2% of families and 10.2% of the population were below the poverty line, including 14.2% of those under age 18 and 5.2% of those age 65 or over.
Common Questions
What is Per Capita Income in Castleton On Hudson?
Per Capita income in Castleton On Hudson is $33,761.
What is the Median Family Income in Castleton On Hudson?
Median Family Income in Castleton On Hudson is $85,625.
What is the Median Household income in Castleton On Hudson?
Median Household Income in Castleton On Hudson is $59,453.
What is Income or Wage Gap in Castleton On Hudson?
Income or Wage Gap in Castleton On Hudson is 2.9%.
Women in Castleton On Hudson earn 97.1 cents for every dollar earned by a man.
What is Inequality or Gini Index in Castleton On Hudson?
Inequality or Gini Index in Castleton On Hudson is 0.39.
What is the Total Population of Castleton On Hudson?
Total Population of Castleton On Hudson is 1,480.
What is the Total Male Population of Castleton On Hudson?
Total Male Population of Castleton On Hudson is 640.
What is the Total Female Population of Castleton On Hudson?
Total Female Population of Castleton On Hudson is 840.
What is the Ratio of Males per 100 Females in Castleton On Hudson?
There are 76.19 Males per 100 Females in Castleton On Hudson.
What is the Ratio of Females per 100 Males in Castleton On Hudson?
There are 131.25 Females per 100 Males in Castleton On Hudson.
What is the Median Population Age in Castleton On Hudson?
Median Population Age in Castleton On Hudson is 41.7 Years.
What is the Average Family Size in Castleton On Hudson
Average Family Size in Castleton On Hudson is 2.9 People.
What is the Average Household Size in Castleton On Hudson
Average Household Size in Castleton On Hudson is 2.2 People.
How Large is the Labor Force in Castleton On Hudson?
There are 822 People in the Labor Forcein in Castleton On Hudson.
What is the Percentage of People in the Labor Force in Castleton On Hudson?
67.4% of People are in the Labor Force in Castleton On Hudson.
What is the Unemployment Rate in Castleton On Hudson?
Unemployment Rate in Castleton On Hudson is 22.1%.