Honeoye Falls, NY Map & Demographics
Honeoye Falls Map
Honeoye Falls Overview
$42,806
PER CAPITA INCOME
$121,406
AVG FAMILY INCOME
$78,235
AVG HOUSEHOLD INCOME
42.2%
WAGE / INCOME GAP [ % ]
57.8¢/ $1
WAGE / INCOME GAP [ $ ]
0.40
INEQUALITY / GINI INDEX
2,774
TOTAL POPULATION
1,439
MALE POPULATION
1,335
FEMALE POPULATION
107.79
MALES / 100 FEMALES
92.77
FEMALES / 100 MALES
40.3
MEDIAN AGE
3.0
AVG FAMILY SIZE
2.2
AVG HOUSEHOLD SIZE
1,494
LABOR FORCE [ PEOPLE ]
63.0%
PERCENT IN LABOR FORCE
10.1%
UNEMPLOYMENT RATE
Honeoye Falls Zip Codes
Honeoye Falls Area Codes
Income in Honeoye Falls
Income Overview in Honeoye Falls
Per Capita Income in Honeoye Falls is $42,806, while median incomes of families and households are $121,406 and $78,235 respectively.
| Characteristic | Number | Measure |
| Per Capita Income | 2,774 | $42,806 |
| Median Family Income | 692 | $121,406 |
| Mean Family Income | 692 | $128,926 |
| Median Household Income | 1,252 | $78,235 |
| Mean Household Income | 1,252 | $94,715 |
| Income Deficit | 692 | $0 |
| Wage / Income Gap (%) | 2,774 | 42.19% |
| Wage / Income Gap ($) | 2,774 | 57.81¢ per $1 |
| Gini / Inequality Index | 2,774 | 0.40 |
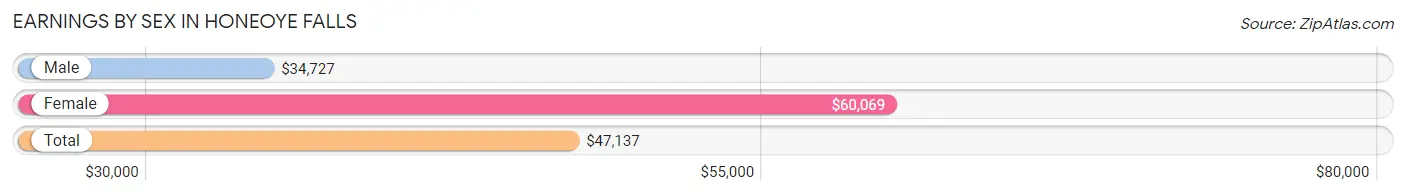
Earnings by Sex in Honeoye Falls
Average Earnings in Honeoye Falls are $47,137, $34,727 for men and $60,069 for women, a difference of 42.2%.
| Sex | Number | Average Earnings |
| Male | 821 (51.6%) | $34,727 |
| Female | 770 (48.4%) | $60,069 |
| Total | 1,591 (100.0%) | $47,137 |
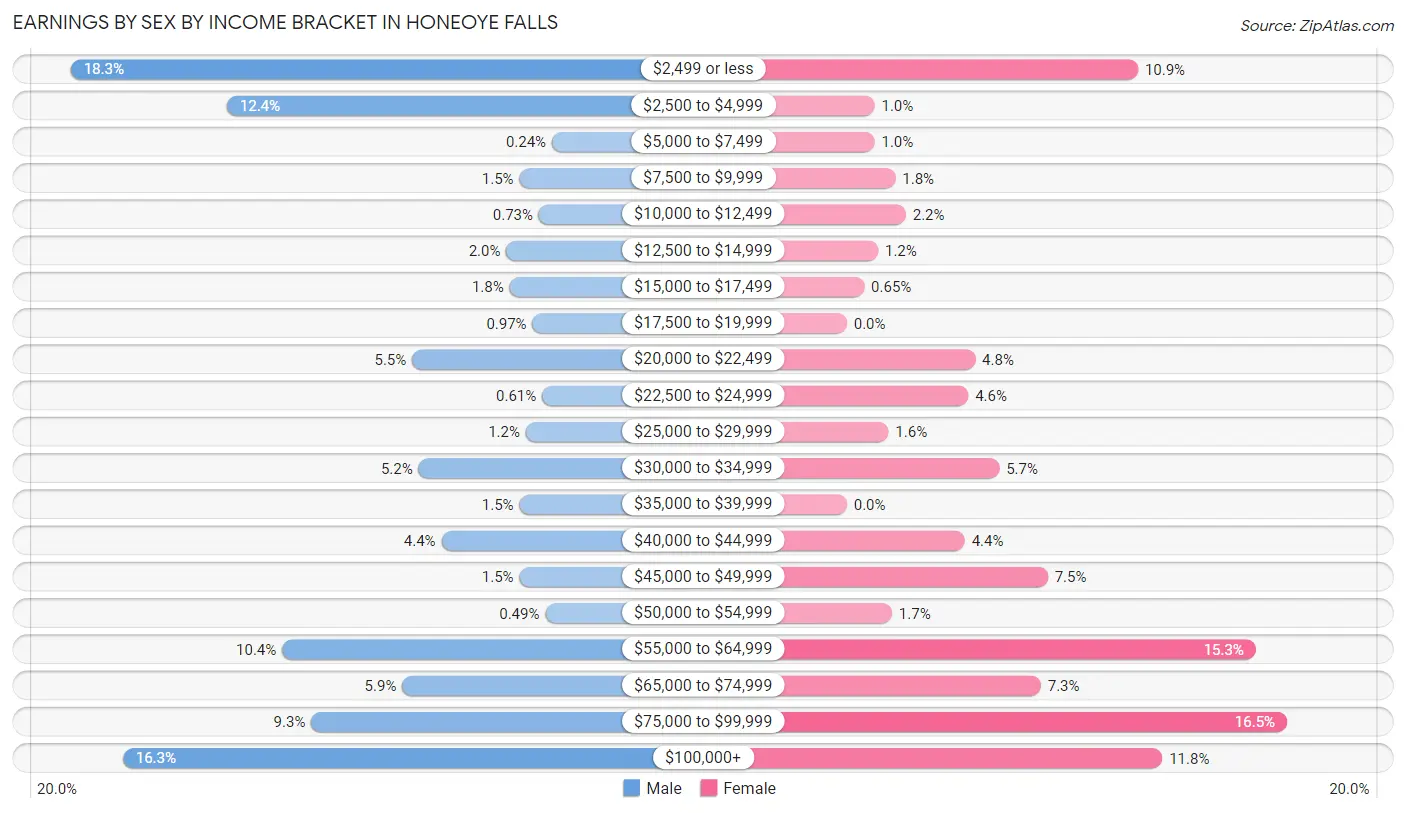
Earnings by Sex by Income Bracket in Honeoye Falls
The most common earnings brackets in Honeoye Falls are $2,499 or less for men (150 | 18.3%) and $75,000 to $99,999 for women (127 | 16.5%).
| Income | Male | Female |
| $2,499 or less | 150 (18.3%) | 84 (10.9%) |
| $2,500 to $4,999 | 102 (12.4%) | 8 (1.0%) |
| $5,000 to $7,499 | 2 (0.2%) | 8 (1.0%) |
| $7,500 to $9,999 | 12 (1.5%) | 14 (1.8%) |
| $10,000 to $12,499 | 6 (0.7%) | 17 (2.2%) |
| $12,500 to $14,999 | 16 (1.9%) | 9 (1.2%) |
| $15,000 to $17,499 | 15 (1.8%) | 5 (0.6%) |
| $17,500 to $19,999 | 8 (1.0%) | 0 (0.0%) |
| $20,000 to $22,499 | 45 (5.5%) | 37 (4.8%) |
| $22,500 to $24,999 | 5 (0.6%) | 35 (4.5%) |
| $25,000 to $29,999 | 10 (1.2%) | 12 (1.6%) |
| $30,000 to $34,999 | 43 (5.2%) | 44 (5.7%) |
| $35,000 to $39,999 | 12 (1.5%) | 0 (0.0%) |
| $40,000 to $44,999 | 36 (4.4%) | 34 (4.4%) |
| $45,000 to $49,999 | 12 (1.5%) | 58 (7.5%) |
| $50,000 to $54,999 | 4 (0.5%) | 13 (1.7%) |
| $55,000 to $64,999 | 85 (10.3%) | 118 (15.3%) |
| $65,000 to $74,999 | 48 (5.9%) | 56 (7.3%) |
| $75,000 to $99,999 | 76 (9.3%) | 127 (16.5%) |
| $100,000+ | 134 (16.3%) | 91 (11.8%) |
| Total | 821 (100.0%) | 770 (100.0%) |
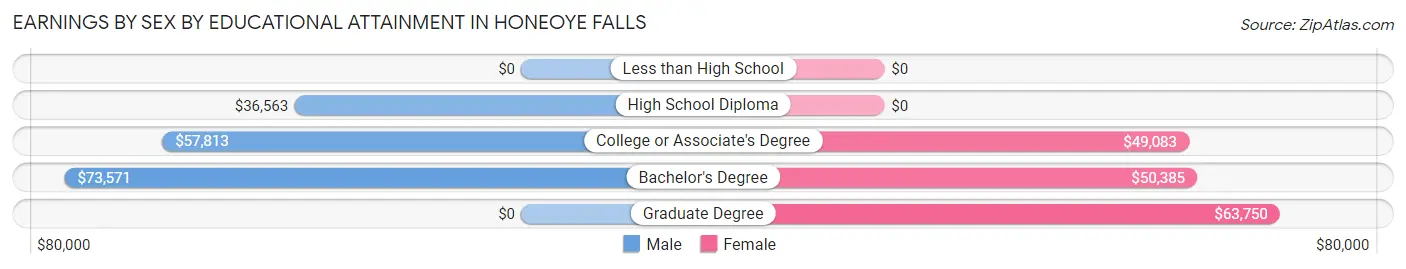
Earnings by Sex by Educational Attainment in Honeoye Falls
Average earnings in Honeoye Falls are $61,226 for men and $62,664 for women, a difference of 2.3%. Men with an educational attainment of bachelor's degree enjoy the highest average annual earnings of $73,571, while those with high school diploma education earn the least with $36,563. Women with an educational attainment of graduate degree earn the most with the average annual earnings of $63,750, while those with college or associate's degree education have the smallest earnings of $49,083.
| Educational Attainment | Male Income | Female Income |
| Less than High School | - | - |
| High School Diploma | $36,563 | $0 |
| College or Associate's Degree | $57,813 | $49,083 |
| Bachelor's Degree | $73,571 | $50,385 |
| Graduate Degree | - | - |
| Total | $61,226 | $62,664 |
Family Income in Honeoye Falls
Family Income Brackets in Honeoye Falls
According to the Honeoye Falls family income data, there are 235 families falling into the $100,000 to $149,999 income range, which is the most common income bracket and makes up 34.0% of all families.
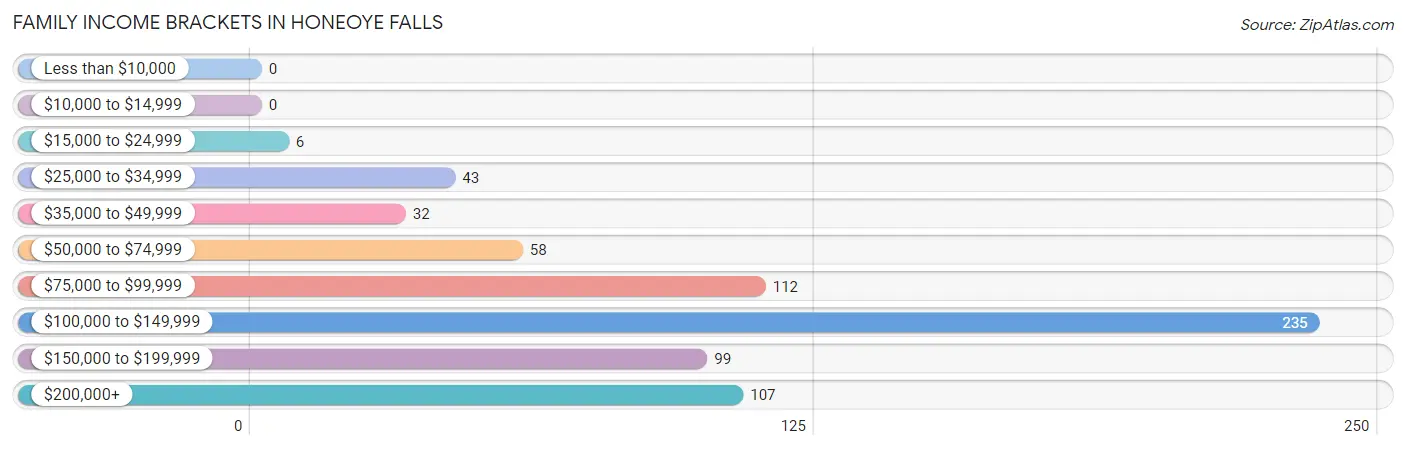
| Income Bracket | # Families | % Families |
| Less than $10,000 | 0 | 0.0% |
| $10,000 to $14,999 | 0 | 0.0% |
| $15,000 to $24,999 | 6 | 0.9% |
| $25,000 to $34,999 | 43 | 6.2% |
| $35,000 to $49,999 | 32 | 4.6% |
| $50,000 to $74,999 | 58 | 8.4% |
| $75,000 to $99,999 | 112 | 16.2% |
| $100,000 to $149,999 | 235 | 34.0% |
| $150,000 to $199,999 | 99 | 14.3% |
| $200,000+ | 107 | 15.5% |
Family Income by Famaliy Size in Honeoye Falls
5-person families (148 | 21.4%) account for the highest median family income in Honeoye Falls with $210,551 per family, while 2-person families (401 | 58.0%) have the highest median income of $47,316 per family member.
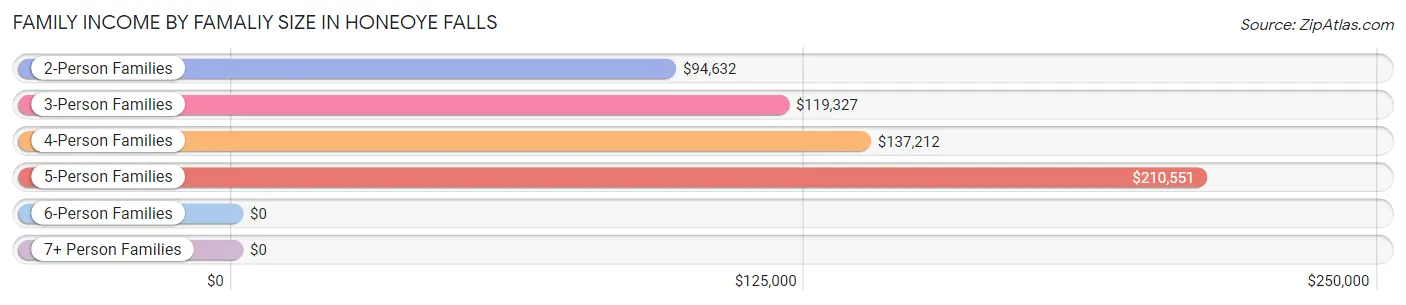
| Income Bracket | # Families | Median Income |
| 2-Person Families | 401 (58.0%) | $94,632 |
| 3-Person Families | 97 (14.0%) | $119,327 |
| 4-Person Families | 46 (6.7%) | $137,212 |
| 5-Person Families | 148 (21.4%) | $210,551 |
| 6-Person Families | 0 (0.0%) | $0 |
| 7+ Person Families | 0 (0.0%) | $0 |
| Total | 692 (100.0%) | $121,406 |
Family Income by Number of Earners in Honeoye Falls
The median family income in Honeoye Falls is $121,406, with families comprising 3+ earners (98) having the highest median family income of $210,424, while families with no earners (78) have the lowest median family income of $60,341, accounting for 14.2% and 11.3% of families, respectively.
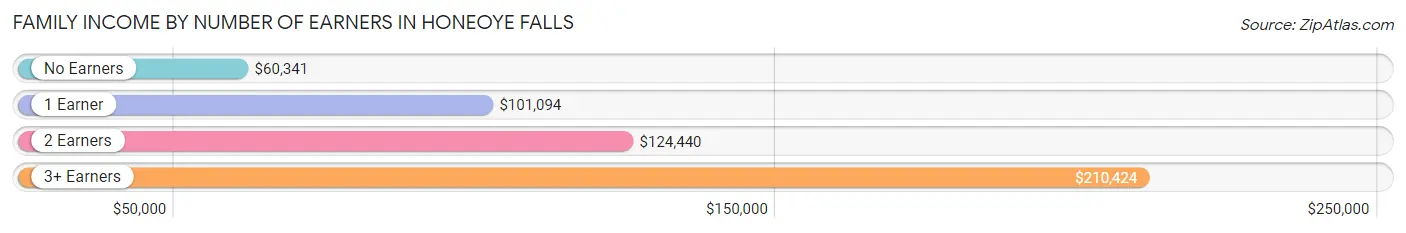
| Number of Earners | # Families | Median Income |
| No Earners | 78 (11.3%) | $60,341 |
| 1 Earner | 167 (24.1%) | $101,094 |
| 2 Earners | 349 (50.4%) | $124,440 |
| 3+ Earners | 98 (14.2%) | $210,424 |
| Total | 692 (100.0%) | $121,406 |
Household Income in Honeoye Falls
Household Income Brackets in Honeoye Falls
With 287 households falling in the category, the $100,000 to $149,999 income range is the most frequent in Honeoye Falls, accounting for 22.9% of all households. In contrast, only 9 households (0.7%) fall into the less than $10,000 income bracket, making it the least populous group.
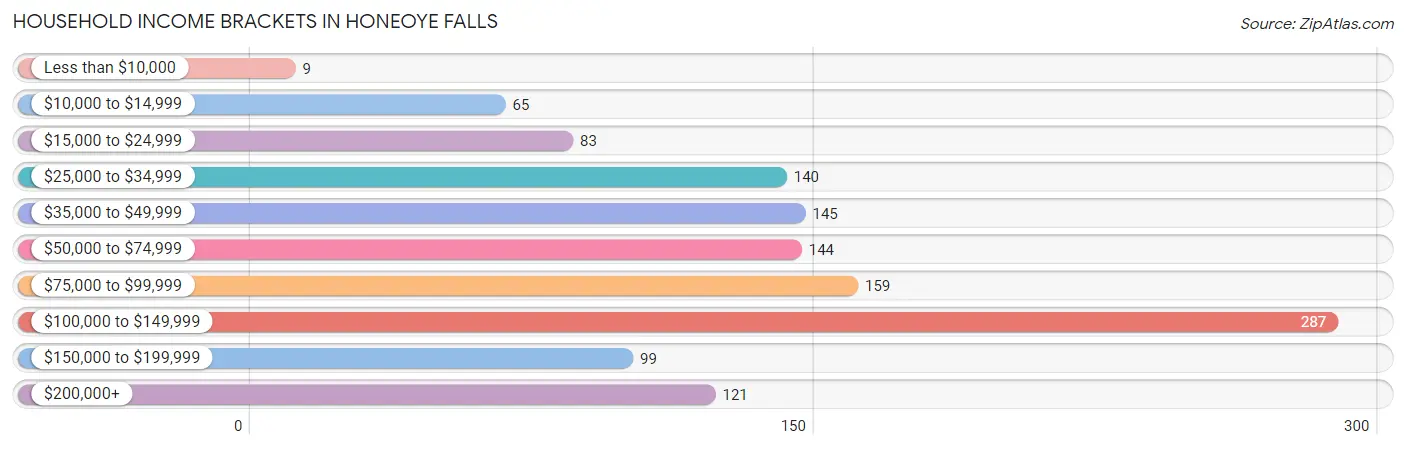
| Income Bracket | # Households | % Households |
| Less than $10,000 | 9 | 0.7% |
| $10,000 to $14,999 | 65 | 5.2% |
| $15,000 to $24,999 | 83 | 6.6% |
| $25,000 to $34,999 | 140 | 11.2% |
| $35,000 to $49,999 | 145 | 11.6% |
| $50,000 to $74,999 | 144 | 11.5% |
| $75,000 to $99,999 | 159 | 12.7% |
| $100,000 to $149,999 | 287 | 22.9% |
| $150,000 to $199,999 | 99 | 7.9% |
| $200,000+ | 121 | 9.7% |
Household Income by Householder Age in Honeoye Falls
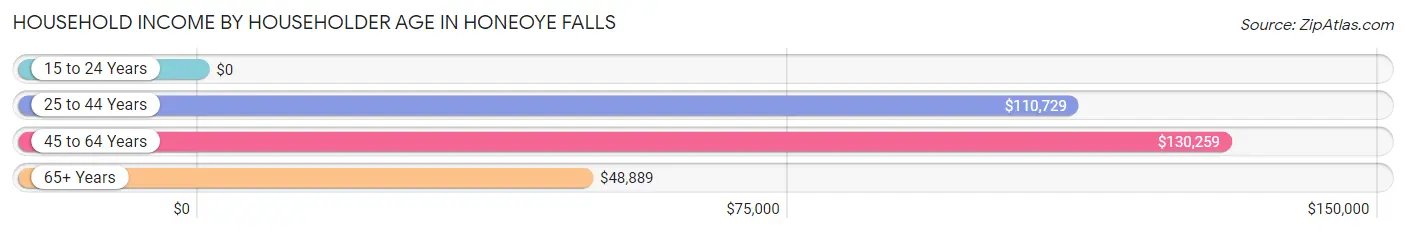
The median household income in Honeoye Falls is $78,235, with the highest median household income of $130,259 found in the 45 to 64 years age bracket for the primary householder. A total of 414 households (33.1%) fall into this category. Meanwhile, the 15 to 24 years age bracket for the primary householder has the lowest median household income of $0, with 23 households (1.8%) in this group.
| Income Bracket | # Households | Median Income |
| 15 to 24 Years | 23 (1.8%) | $0 |
| 25 to 44 Years | 361 (28.8%) | $110,729 |
| 45 to 64 Years | 414 (33.1%) | $130,259 |
| 65+ Years | 454 (36.3%) | $48,889 |
| Total | 1,252 (100.0%) | $78,235 |
Poverty in Honeoye Falls
Income Below Poverty by Sex and Age in Honeoye Falls
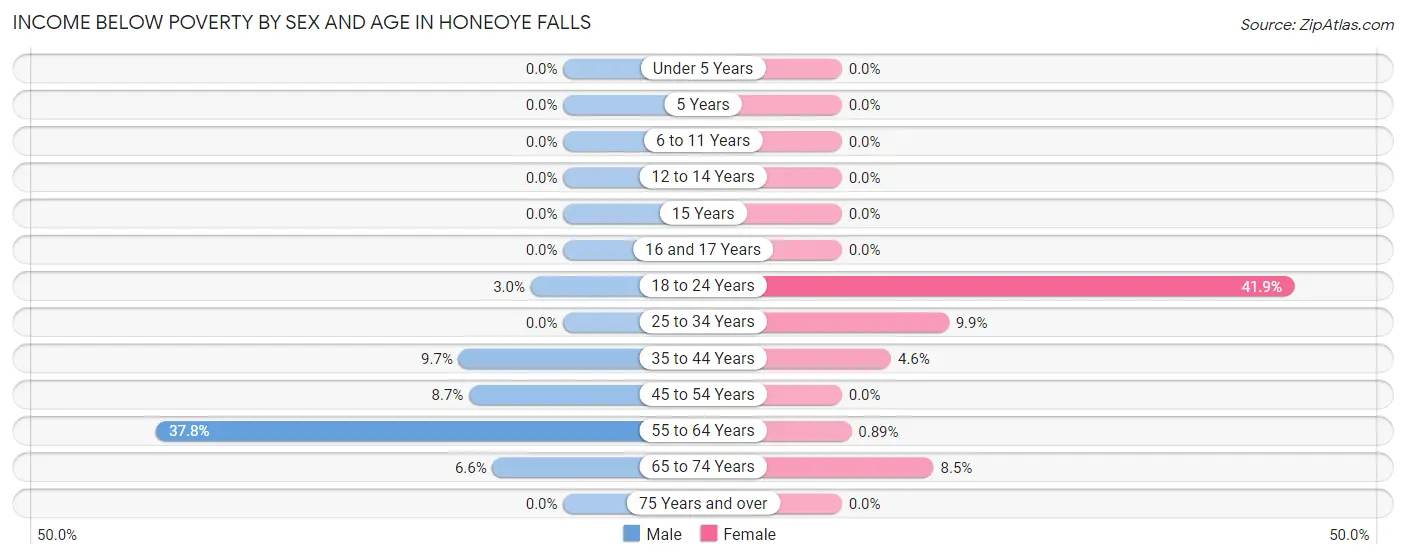
With 7.6% poverty level for males and 4.8% for females among the residents of Honeoye Falls, 55 to 64 year old males and 18 to 24 year old females are the most vulnerable to poverty, with 65 males (37.8%) and 26 females (41.9%) in their respective age groups living below the poverty level.
| Age Bracket | Male | Female |
| Under 5 Years | 0 (0.0%) | 0 (0.0%) |
| 5 Years | 0 (0.0%) | 0 (0.0%) |
| 6 to 11 Years | 0 (0.0%) | 0 (0.0%) |
| 12 to 14 Years | 0 (0.0%) | 0 (0.0%) |
| 15 Years | 0 (0.0%) | 0 (0.0%) |
| 16 and 17 Years | 0 (0.0%) | 0 (0.0%) |
| 18 to 24 Years | 6 (3.0%) | 26 (41.9%) |
| 25 to 34 Years | 0 (0.0%) | 13 (9.9%) |
| 35 to 44 Years | 20 (9.7%) | 8 (4.6%) |
| 45 to 54 Years | 9 (8.7%) | 0 (0.0%) |
| 55 to 64 Years | 65 (37.8%) | 2 (0.9%) |
| 65 to 74 Years | 9 (6.6%) | 15 (8.5%) |
| 75 Years and over | 0 (0.0%) | 0 (0.0%) |
| Total | 109 (7.6%) | 64 (4.8%) |
Income Above Poverty by Sex and Age in Honeoye Falls
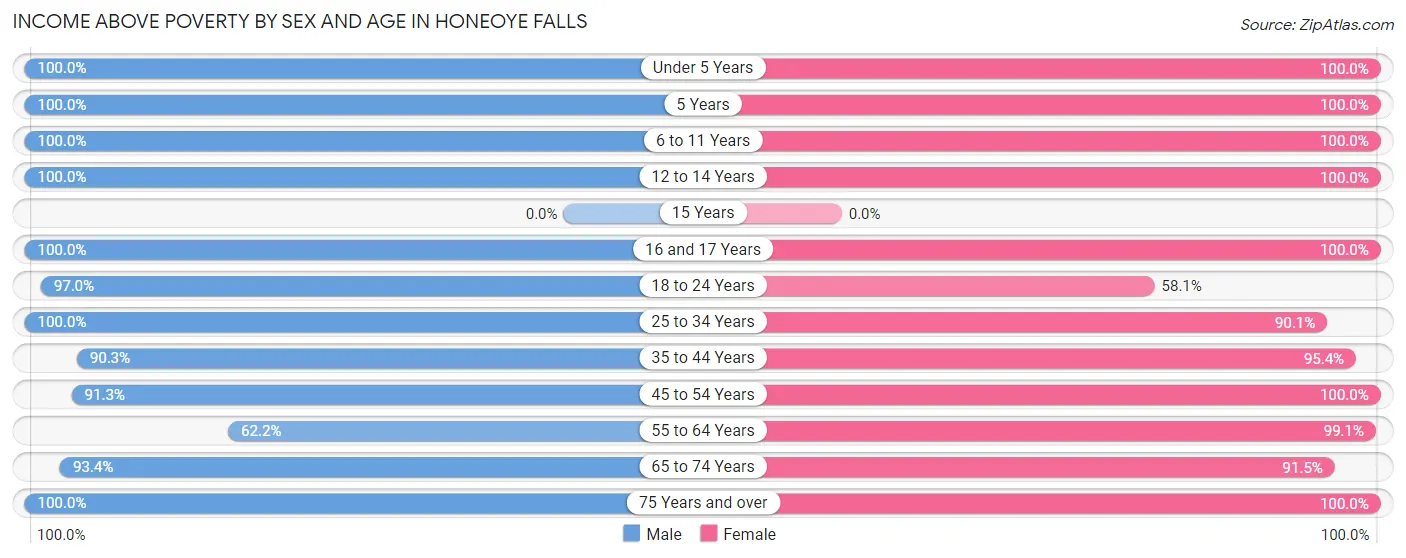
According to the poverty statistics in Honeoye Falls, males aged under 5 years and females aged under 5 years are the age groups that are most secure financially, with 100.0% of males and 100.0% of females in these age groups living above the poverty line.
| Age Bracket | Male | Female |
| Under 5 Years | 115 (100.0%) | 73 (100.0%) |
| 5 Years | 14 (100.0%) | 25 (100.0%) |
| 6 to 11 Years | 119 (100.0%) | 25 (100.0%) |
| 12 to 14 Years | 24 (100.0%) | 7 (100.0%) |
| 15 Years | 0 (0.0%) | 0 (0.0%) |
| 16 and 17 Years | 108 (100.0%) | 46 (100.0%) |
| 18 to 24 Years | 193 (97.0%) | 36 (58.1%) |
| 25 to 34 Years | 124 (100.0%) | 118 (90.1%) |
| 35 to 44 Years | 186 (90.3%) | 167 (95.4%) |
| 45 to 54 Years | 94 (91.3%) | 139 (100.0%) |
| 55 to 64 Years | 107 (62.2%) | 223 (99.1%) |
| 65 to 74 Years | 128 (93.4%) | 161 (91.5%) |
| 75 Years and over | 118 (100.0%) | 239 (100.0%) |
| Total | 1,330 (92.4%) | 1,259 (95.2%) |
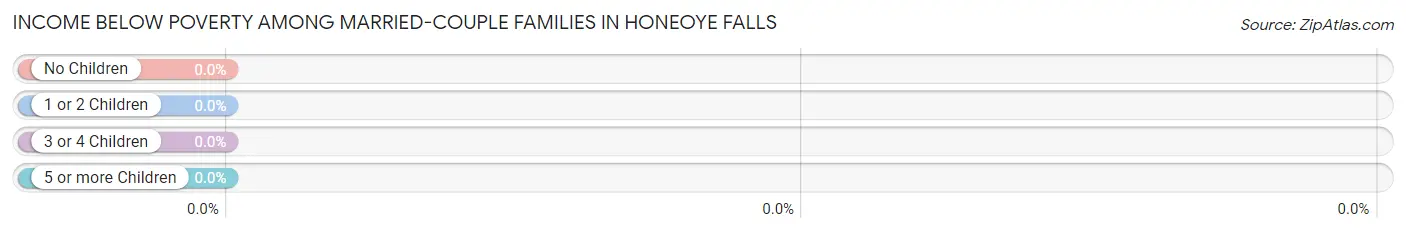
Income Below Poverty Among Married-Couple Families in Honeoye Falls
| Children | Above Poverty | Below Poverty |
| No Children | 297 (100.0%) | 0 (0.0%) |
| 1 or 2 Children | 159 (100.0%) | 0 (0.0%) |
| 3 or 4 Children | 83 (100.0%) | 0 (0.0%) |
| 5 or more Children | 0 (0.0%) | 0 (0.0%) |
| Total | 539 (100.0%) | 0 (0.0%) |
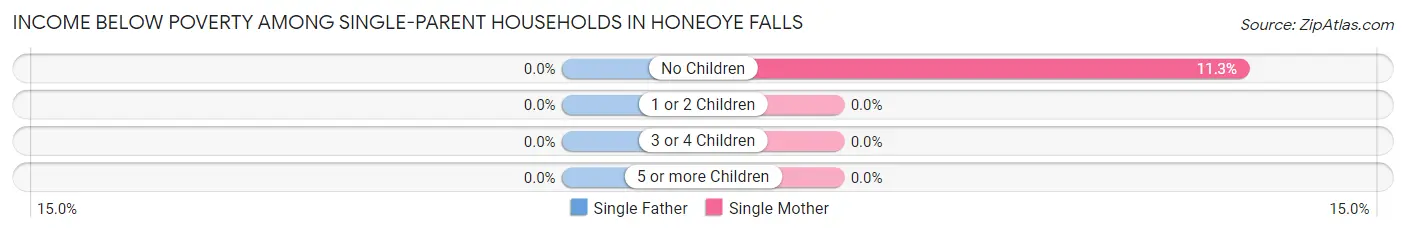
Income Below Poverty Among Single-Parent Households in Honeoye Falls
| Children | Single Father | Single Mother |
| No Children | 0 (0.0%) | 6 (11.3%) |
| 1 or 2 Children | 0 (0.0%) | 0 (0.0%) |
| 3 or 4 Children | 0 (0.0%) | 0 (0.0%) |
| 5 or more Children | 0 (0.0%) | 0 (0.0%) |
| Total | 0 (0.0%) | 6 (4.9%) |
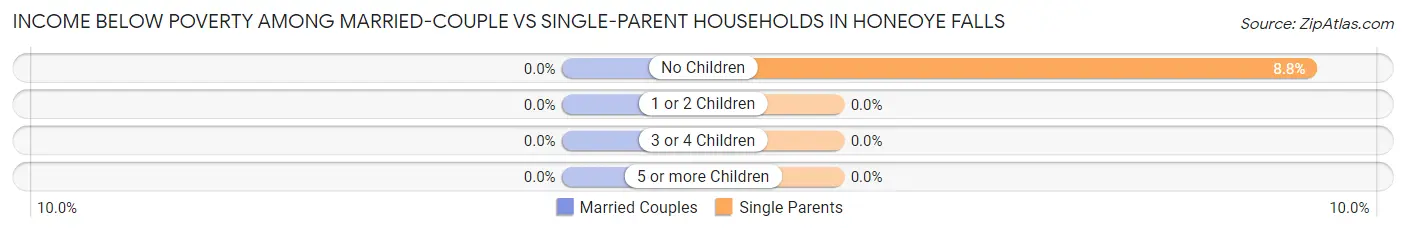
Income Below Poverty Among Married-Couple vs Single-Parent Households in Honeoye Falls
| Children | Married-Couple Families | Single-Parent Households |
| No Children | 0 (0.0%) | 6 (8.8%) |
| 1 or 2 Children | 0 (0.0%) | 0 (0.0%) |
| 3 or 4 Children | 0 (0.0%) | 0 (0.0%) |
| 5 or more Children | 0 (0.0%) | 0 (0.0%) |
| Total | 0 (0.0%) | 6 (3.9%) |
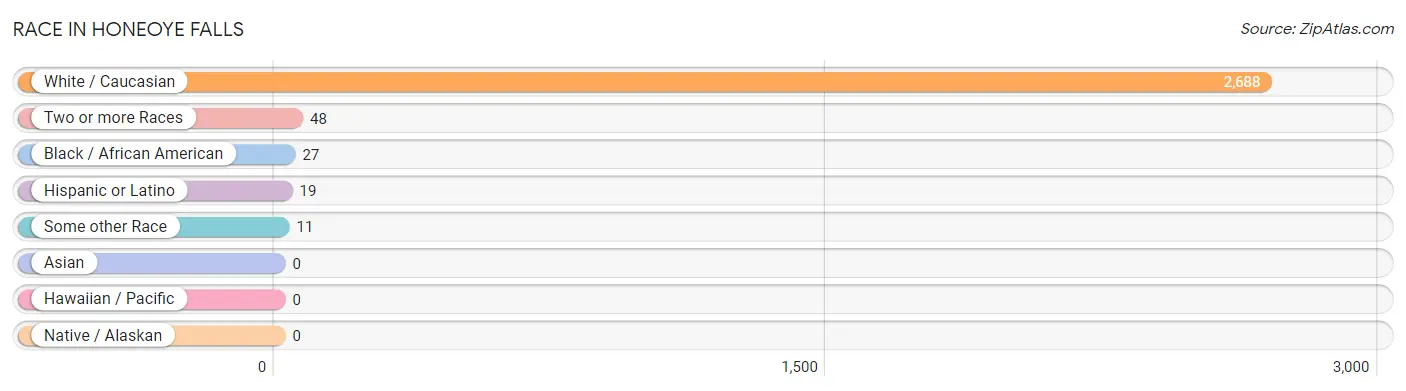
Race in Honeoye Falls
The most populous races in Honeoye Falls are White / Caucasian (2,688 | 96.9%), Two or more Races (48 | 1.7%), and Black / African American (27 | 1.0%).
| Race | # Population | % Population |
| Asian | 0 | 0.0% |
| Black / African American | 27 | 1.0% |
| Hawaiian / Pacific | 0 | 0.0% |
| Hispanic or Latino | 19 | 0.7% |
| Native / Alaskan | 0 | 0.0% |
| White / Caucasian | 2,688 | 96.9% |
| Two or more Races | 48 | 1.7% |
| Some other Race | 11 | 0.4% |
| Total | 2,774 | 100.0% |
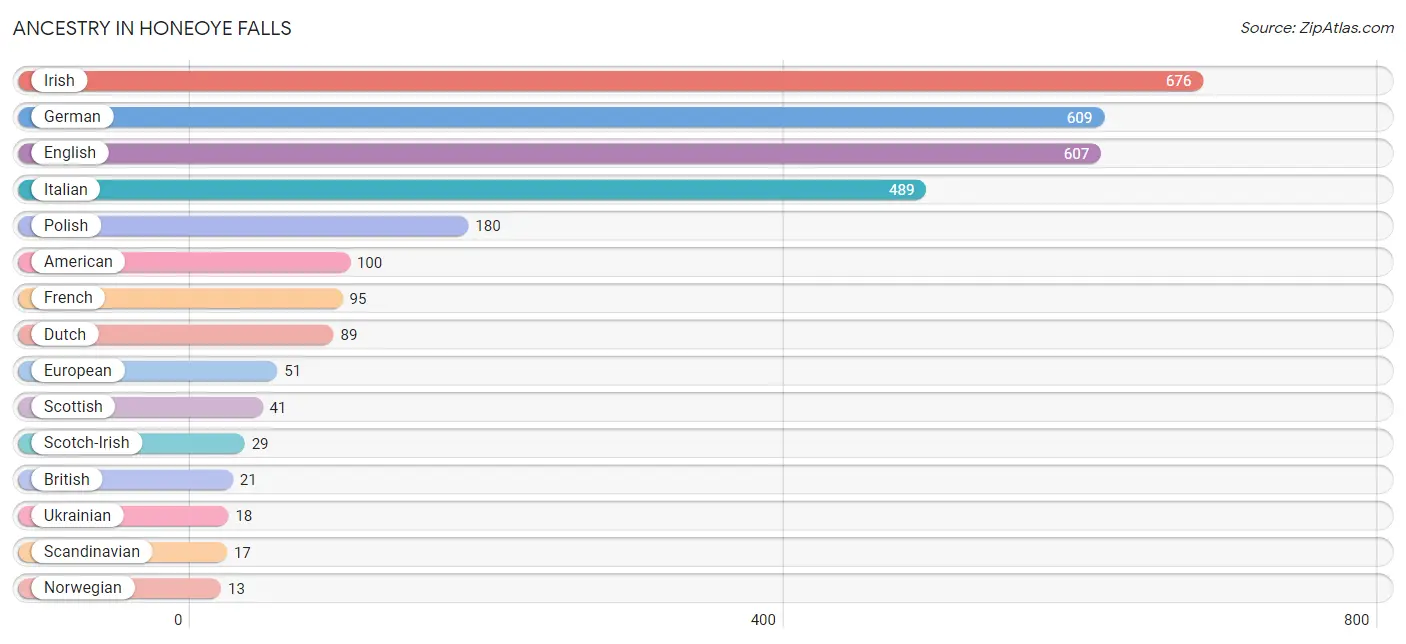
Ancestry in Honeoye Falls
The most populous ancestries reported in Honeoye Falls are Irish (676 | 24.4%), German (609 | 22.0%), English (607 | 21.9%), Italian (489 | 17.6%), and Polish (180 | 6.5%), together accounting for 92.3% of all Honeoye Falls residents.
| Ancestry | # Population | % Population |
| American | 100 | 3.6% |
| British | 21 | 0.8% |
| Canadian | 8 | 0.3% |
| Central American | 11 | 0.4% |
| Dutch | 89 | 3.2% |
| English | 607 | 21.9% |
| European | 51 | 1.8% |
| French | 95 | 3.4% |
| German | 609 | 22.0% |
| Greek | 7 | 0.3% |
| Honduran | 5 | 0.2% |
| Irish | 676 | 24.4% |
| Italian | 489 | 17.6% |
| Korean | 5 | 0.2% |
| Lithuanian | 7 | 0.3% |
| Mexican | 2 | 0.1% |
| Norwegian | 13 | 0.5% |
| Polish | 180 | 6.5% |
| Russian | 9 | 0.3% |
| Salvadoran | 6 | 0.2% |
| Scandinavian | 17 | 0.6% |
| Scotch-Irish | 29 | 1.1% |
| Scottish | 41 | 1.5% |
| Swedish | 12 | 0.4% |
| Ukrainian | 18 | 0.6% |
| Welsh | 10 | 0.4% | View All 26 Rows |
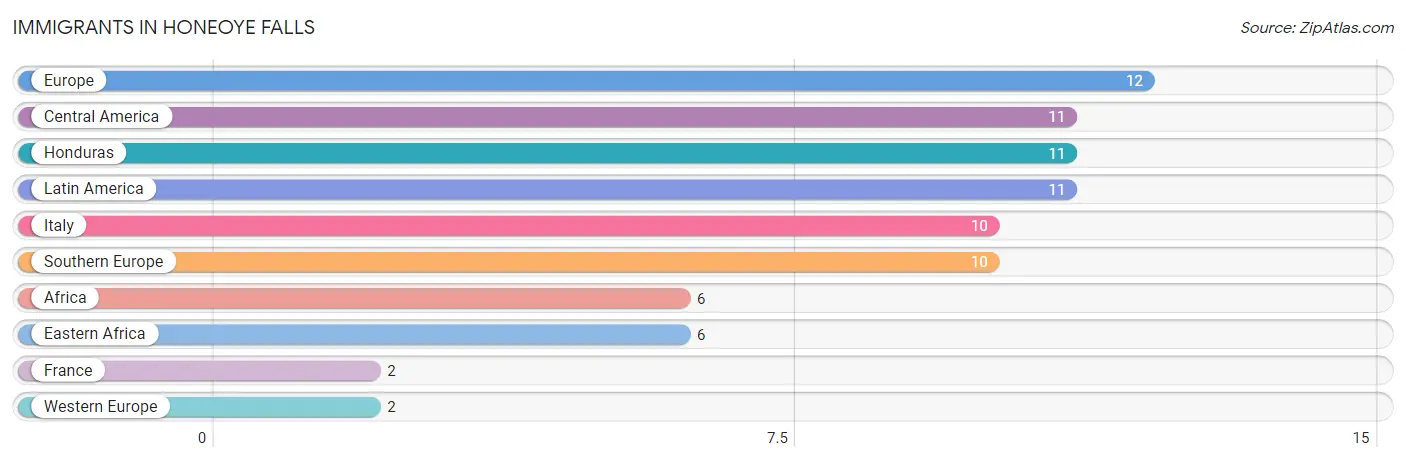
Immigrants in Honeoye Falls
The most numerous immigrant groups reported in Honeoye Falls came from Europe (12 | 0.4%), Central America (11 | 0.4%), Honduras (11 | 0.4%), Latin America (11 | 0.4%), and Italy (10 | 0.4%), together accounting for 2.0% of all Honeoye Falls residents.
| Immigration Origin | # Population | % Population |
| Africa | 6 | 0.2% |
| Central America | 11 | 0.4% |
| Eastern Africa | 6 | 0.2% |
| Europe | 12 | 0.4% |
| France | 2 | 0.1% |
| Honduras | 11 | 0.4% |
| Italy | 10 | 0.4% |
| Latin America | 11 | 0.4% |
| Southern Europe | 10 | 0.4% |
| Western Europe | 2 | 0.1% | View All 10 Rows |
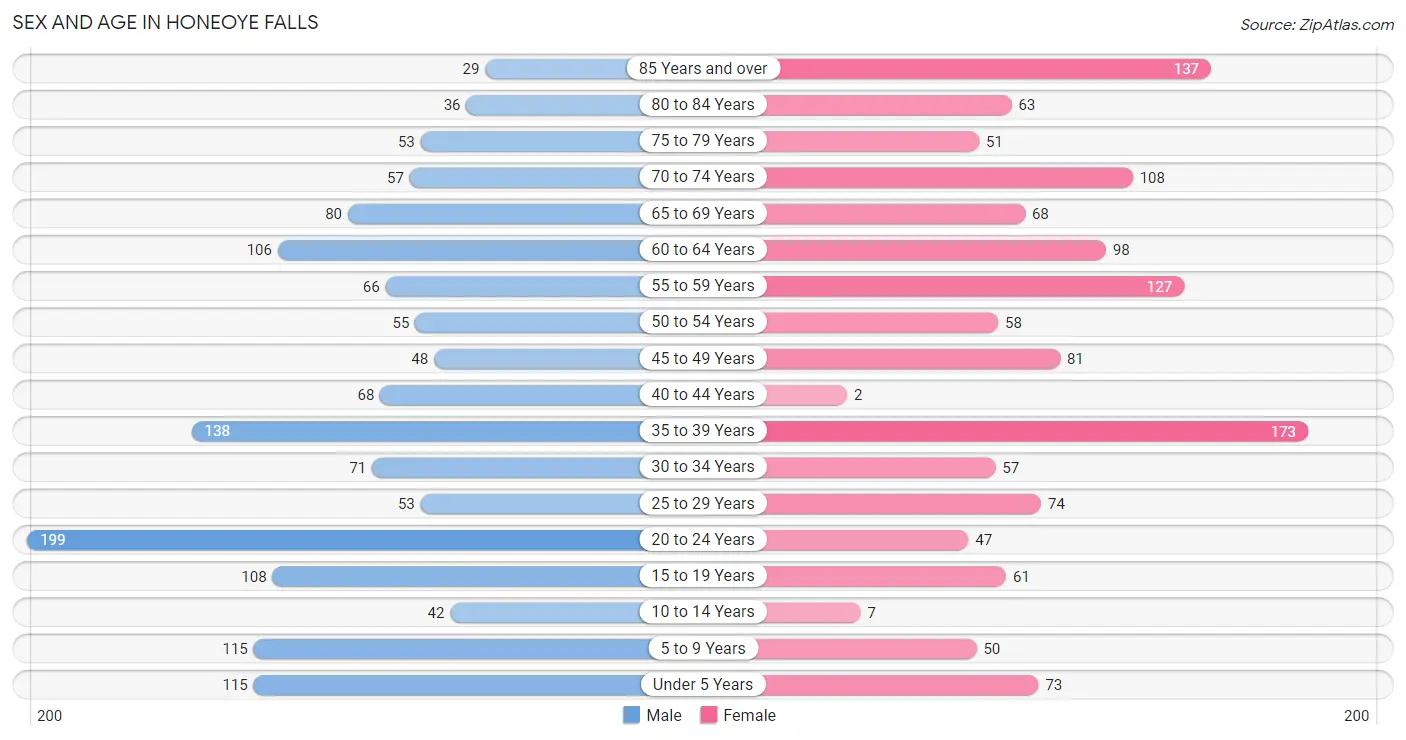
Sex and Age in Honeoye Falls
Sex and Age in Honeoye Falls
The most populous age groups in Honeoye Falls are 20 to 24 Years (199 | 13.8%) for men and 35 to 39 Years (173 | 13.0%) for women.
| Age Bracket | Male | Female |
| Under 5 Years | 115 (8.0%) | 73 (5.5%) |
| 5 to 9 Years | 115 (8.0%) | 50 (3.7%) |
| 10 to 14 Years | 42 (2.9%) | 7 (0.5%) |
| 15 to 19 Years | 108 (7.5%) | 61 (4.6%) |
| 20 to 24 Years | 199 (13.8%) | 47 (3.5%) |
| 25 to 29 Years | 53 (3.7%) | 74 (5.5%) |
| 30 to 34 Years | 71 (4.9%) | 57 (4.3%) |
| 35 to 39 Years | 138 (9.6%) | 173 (13.0%) |
| 40 to 44 Years | 68 (4.7%) | 2 (0.2%) |
| 45 to 49 Years | 48 (3.3%) | 81 (6.1%) |
| 50 to 54 Years | 55 (3.8%) | 58 (4.3%) |
| 55 to 59 Years | 66 (4.6%) | 127 (9.5%) |
| 60 to 64 Years | 106 (7.4%) | 98 (7.3%) |
| 65 to 69 Years | 80 (5.6%) | 68 (5.1%) |
| 70 to 74 Years | 57 (4.0%) | 108 (8.1%) |
| 75 to 79 Years | 53 (3.7%) | 51 (3.8%) |
| 80 to 84 Years | 36 (2.5%) | 63 (4.7%) |
| 85 Years and over | 29 (2.0%) | 137 (10.3%) |
| Total | 1,439 (100.0%) | 1,335 (100.0%) |
Families and Households in Honeoye Falls
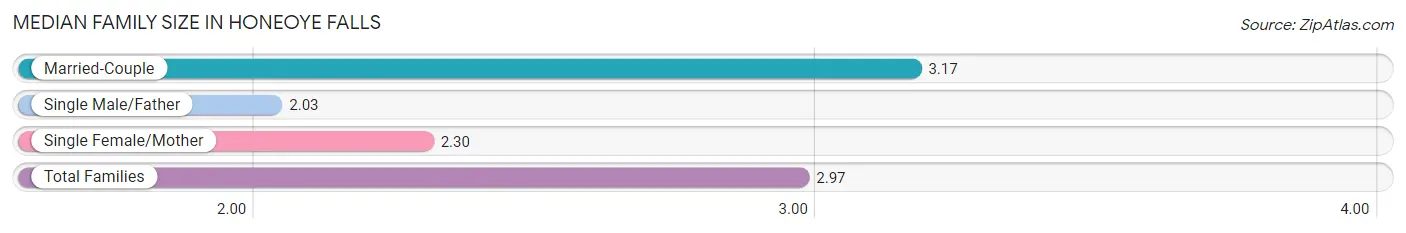
Median Family Size in Honeoye Falls
The median family size in Honeoye Falls is 2.97 persons per family, with married-couple families (539 | 77.9%) accounting for the largest median family size of 3.17 persons per family. On the other hand, single male/father families (31 | 4.5%) represent the smallest median family size with 2.03 persons per family.
| Family Type | # Families | Family Size |
| Married-Couple | 539 (77.9%) | 3.17 |
| Single Male/Father | 31 (4.5%) | 2.03 |
| Single Female/Mother | 122 (17.6%) | 2.30 |
| Total Families | 692 (100.0%) | 2.97 |
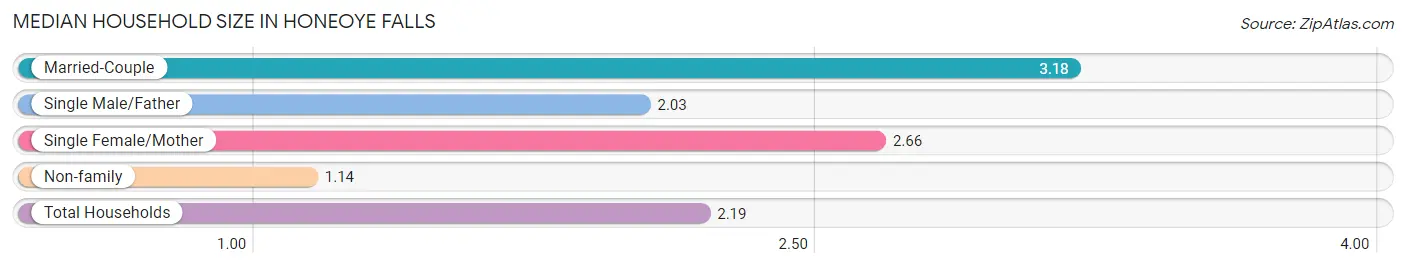
Median Household Size in Honeoye Falls
The median household size in Honeoye Falls is 2.19 persons per household, with married-couple households (539 | 43.0%) accounting for the largest median household size of 3.18 persons per household. non-family households (560 | 44.7%) represent the smallest median household size with 1.14 persons per household.
| Household Type | # Households | Household Size |
| Married-Couple | 539 (43.0%) | 3.18 |
| Single Male/Father | 31 (2.5%) | 2.03 |
| Single Female/Mother | 122 (9.7%) | 2.66 |
| Non-family | 560 (44.7%) | 1.14 |
| Total Households | 1,252 (100.0%) | 2.19 |
Household Size by Marriage Status in Honeoye Falls
Out of a total of 1,252 households in Honeoye Falls, 692 (55.3%) are family households, while 560 (44.7%) are nonfamily households. The most numerous type of family households are 2-person households, comprising 390, and the most common type of nonfamily households are 1-person households, comprising 491.
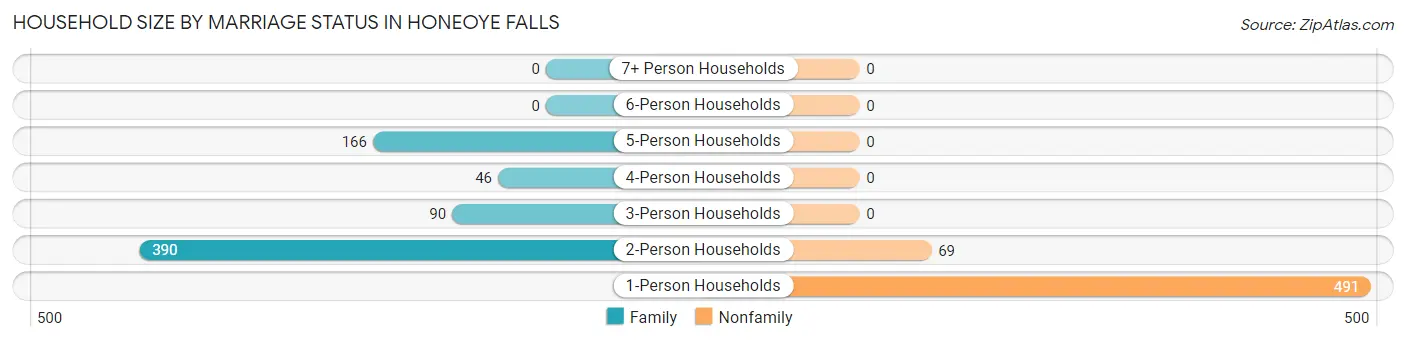
| Household Size | Family Households | Nonfamily Households |
| 1-Person Households | - | 491 (39.2%) |
| 2-Person Households | 390 (31.1%) | 69 (5.5%) |
| 3-Person Households | 90 (7.2%) | 0 (0.0%) |
| 4-Person Households | 46 (3.7%) | 0 (0.0%) |
| 5-Person Households | 166 (13.3%) | 0 (0.0%) |
| 6-Person Households | 0 (0.0%) | 0 (0.0%) |
| 7+ Person Households | 0 (0.0%) | 0 (0.0%) |
| Total | 692 (55.3%) | 560 (44.7%) |
Female Fertility in Honeoye Falls
Fertility by Age in Honeoye Falls
Average fertility rate in Honeoye Falls is 54.0 births per 1,000 women. Women in the age bracket of 35 to 50 years have the highest fertility rate with 102.0 births per 1,000 women. Women in the age bracket of 35 to 50 years acount for 100.0% of all women with births.
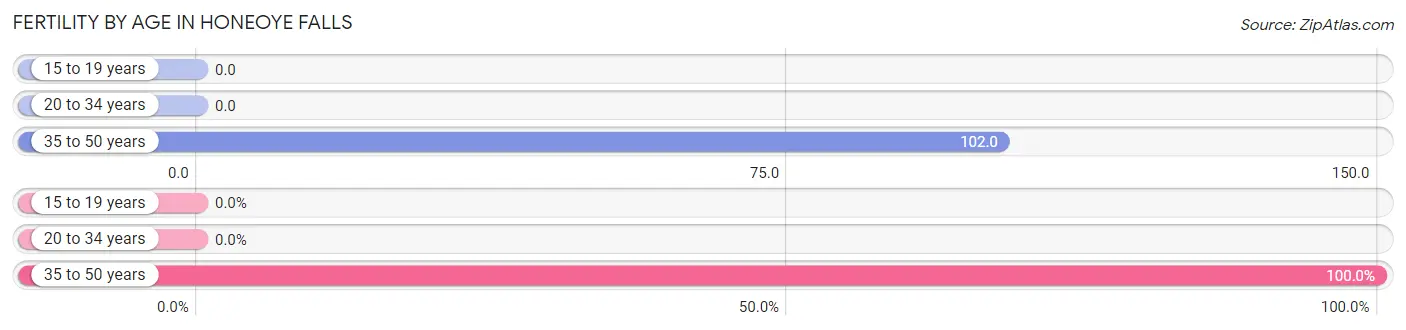
| Age Bracket | Women with Births | Births / 1,000 Women |
| 15 to 19 years | 0 (0.0%) | 0.0 |
| 20 to 34 years | 0 (0.0%) | 0.0 |
| 35 to 50 years | 27 (100.0%) | 102.0 |
| Total | 27 (100.0%) | 54.0 |
Fertility by Age by Marriage Status in Honeoye Falls
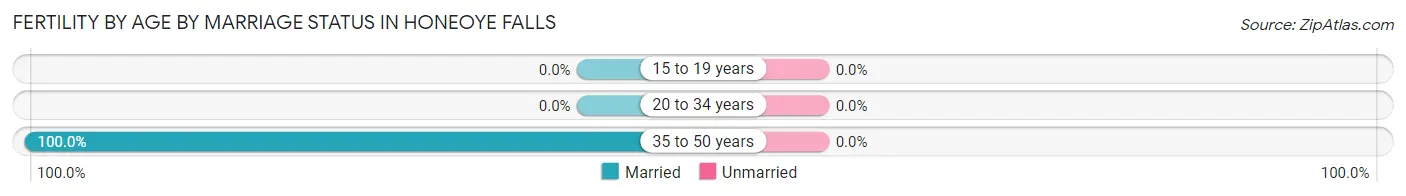
| Age Bracket | Married | Unmarried |
| 15 to 19 years | 0 (0.0%) | 0 (0.0%) |
| 20 to 34 years | 0 (0.0%) | 0 (0.0%) |
| 35 to 50 years | 27 (100.0%) | 0 (0.0%) |
| Total | 27 (100.0%) | 0 (0.0%) |
Fertility by Education in Honeoye Falls
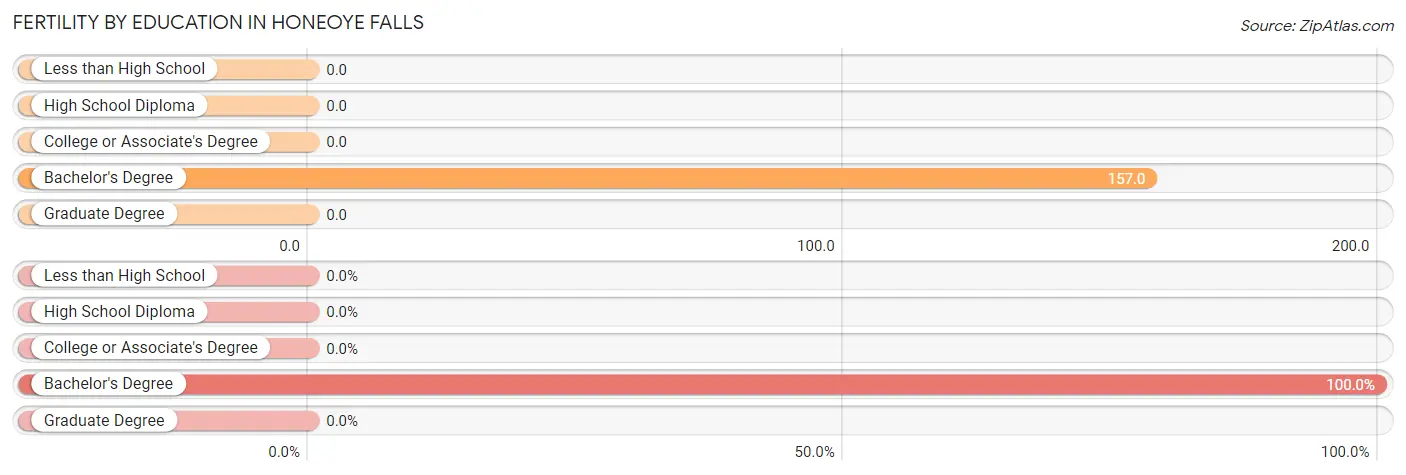
| Educational Attainment | Women with Births | Births / 1,000 Women |
| Less than High School | 0 (0.0%) | 0.0 |
| High School Diploma | 0 (0.0%) | 0.0 |
| College or Associate's Degree | 0 (0.0%) | 0.0 |
| Bachelor's Degree | 27 (100.0%) | 157.0 |
| Graduate Degree | 0 (0.0%) | 0.0 |
| Total | 27 (100.0%) | 54.0 |
Fertility by Education by Marriage Status in Honeoye Falls
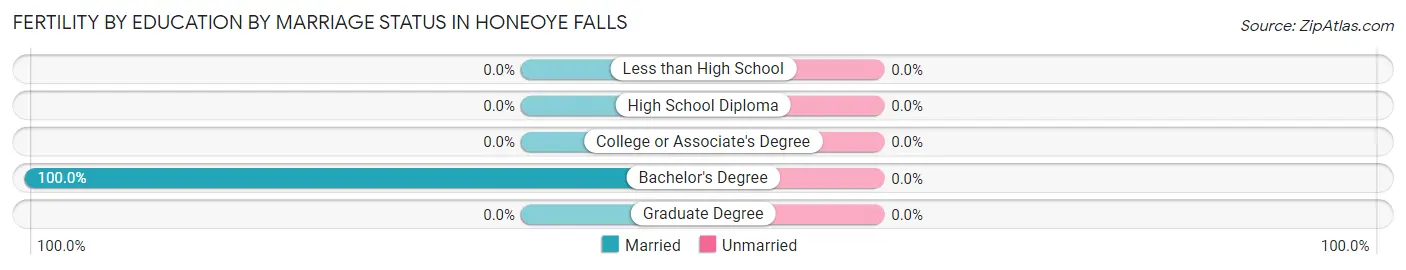
| Educational Attainment | Married | Unmarried |
| Less than High School | 0 (0.0%) | 0 (0.0%) |
| High School Diploma | 0 (0.0%) | 0 (0.0%) |
| College or Associate's Degree | 0 (0.0%) | 0 (0.0%) |
| Bachelor's Degree | 27 (100.0%) | 0 (0.0%) |
| Graduate Degree | 0 (0.0%) | 0 (0.0%) |
| Total | 27 (100.0%) | 0 (0.0%) |
Employment Characteristics in Honeoye Falls
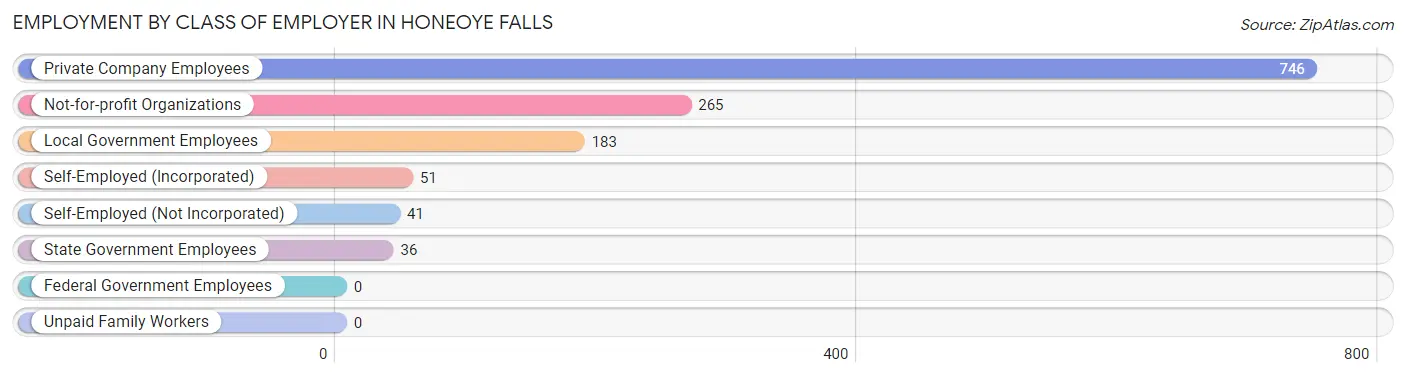
Employment by Class of Employer in Honeoye Falls
Among the 1,322 employed individuals in Honeoye Falls, private company employees (746 | 56.4%), not-for-profit organizations (265 | 20.1%), and local government employees (183 | 13.8%) make up the most common classes of employment.
| Employer Class | # Employees | % Employees |
| Private Company Employees | 746 | 56.4% |
| Self-Employed (Incorporated) | 51 | 3.9% |
| Self-Employed (Not Incorporated) | 41 | 3.1% |
| Not-for-profit Organizations | 265 | 20.1% |
| Local Government Employees | 183 | 13.8% |
| State Government Employees | 36 | 2.7% |
| Federal Government Employees | 0 | 0.0% |
| Unpaid Family Workers | 0 | 0.0% |
| Total | 1,322 | 100.0% |
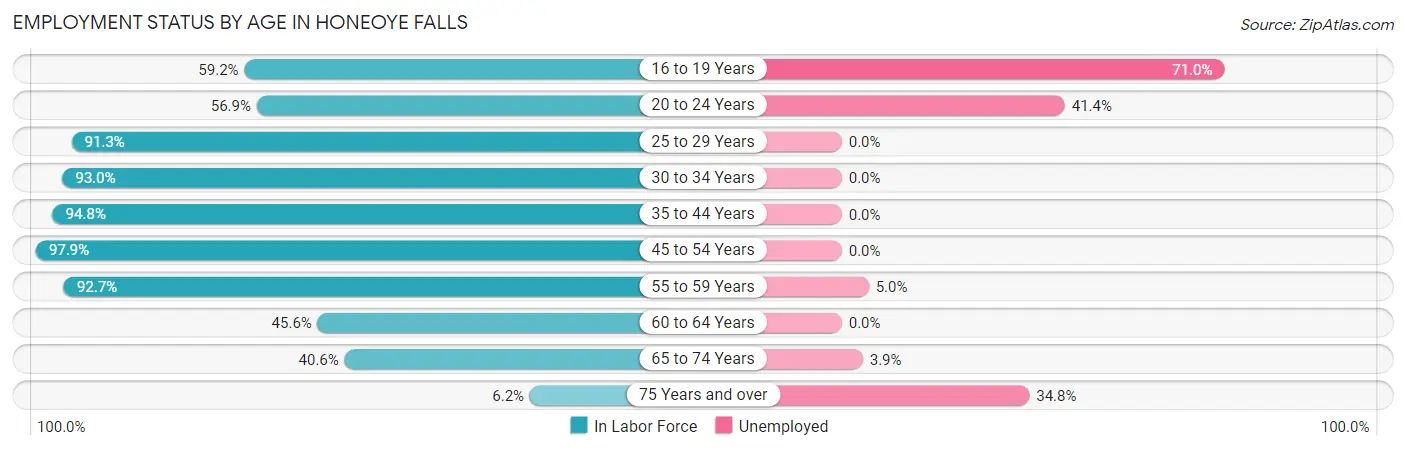
Employment Status by Age in Honeoye Falls
According to the labor force statistics for Honeoye Falls, out of the total population over 16 years of age (2,372), 63.0% or 1,494 individuals are in the labor force, with 10.1% or 151 of them unemployed. The age group with the highest labor force participation rate is 45 to 54 years, with 97.9% or 237 individuals in the labor force. Within the labor force, the 16 to 19 years age range has the highest percentage of unemployed individuals, with 71.0% or 71 of them being unemployed.
| Age Bracket | In Labor Force | Unemployed |
| 16 to 19 Years | 100 (59.2%) | 71 (71.0%) |
| 20 to 24 Years | 140 (56.9%) | 58 (41.4%) |
| 25 to 29 Years | 116 (91.3%) | 0 (0.0%) |
| 30 to 34 Years | 119 (93.0%) | 0 (0.0%) |
| 35 to 44 Years | 361 (94.8%) | 0 (0.0%) |
| 45 to 54 Years | 237 (97.9%) | 0 (0.0%) |
| 55 to 59 Years | 179 (92.7%) | 9 (5.0%) |
| 60 to 64 Years | 93 (45.6%) | 0 (0.0%) |
| 65 to 74 Years | 127 (40.6%) | 5 (3.9%) |
| 75 Years and over | 23 (6.2%) | 8 (34.8%) |
| Total | 1,494 (63.0%) | 151 (10.1%) |
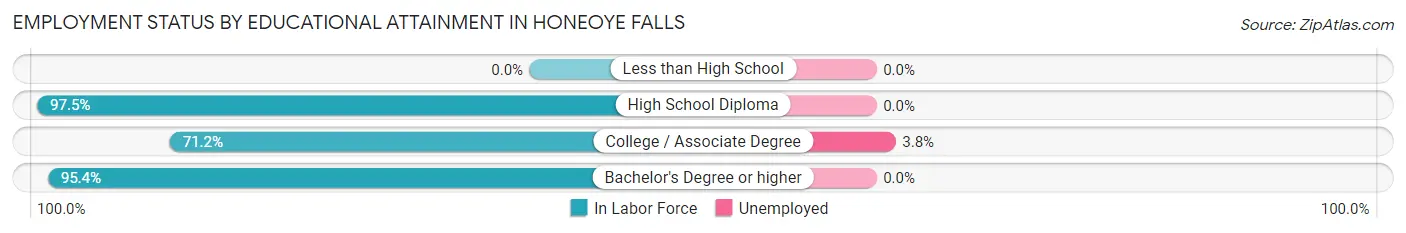
Employment Status by Educational Attainment in Honeoye Falls
According to labor force statistics for Honeoye Falls, 86.7% of individuals (1,105) out of the total population between 25 and 64 years of age (1,275) are in the labor force, with 0.8% or 9 of them being unemployed. The group with the highest labor force participation rate are those with the educational attainment of high school diploma, with 97.5% or 159 individuals in the labor force. Within the labor force, individuals with college / associate degree education have the highest percentage of unemployment, with 3.8% or 9 of them being unemployed.
| Educational Attainment | In Labor Force | Unemployed |
| Less than High School | 0 (0.0%) | 0 (0.0%) |
| High School Diploma | 159 (97.5%) | 0 (0.0%) |
| College / Associate Degree | 235 (71.2%) | 13 (3.8%) |
| Bachelor's Degree or higher | 711 (95.4%) | 0 (0.0%) |
| Total | 1,105 (86.7%) | 10 (0.8%) |
Employment Occupations by Sex in Honeoye Falls
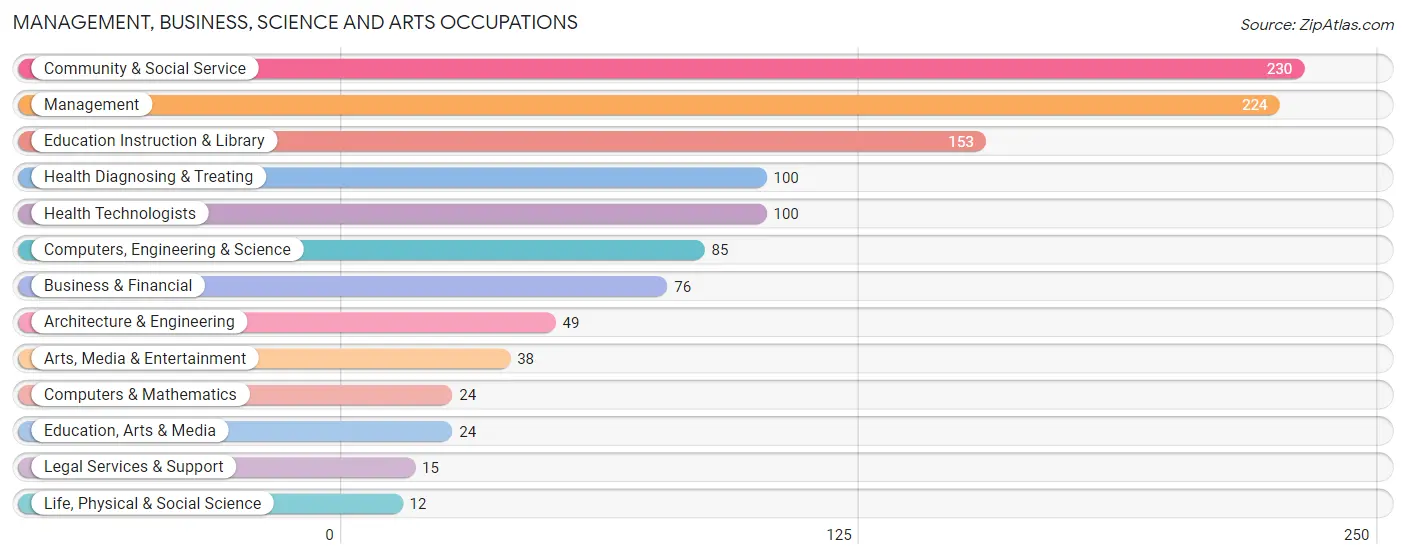
Management, Business, Science and Arts Occupations
The most common Management, Business, Science and Arts occupations in Honeoye Falls are Community & Social Service (230 | 17.1%), Management (224 | 16.7%), Education Instruction & Library (153 | 11.4%), Health Diagnosing & Treating (100 | 7.4%), and Health Technologists (100 | 7.4%).
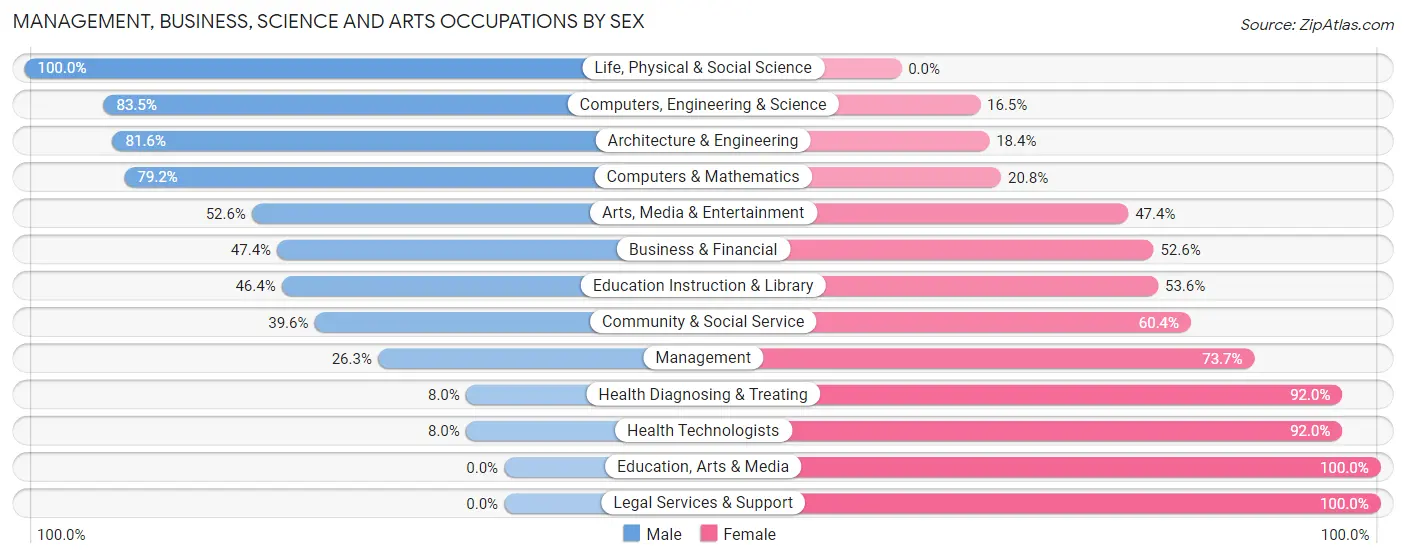
Management, Business, Science and Arts Occupations by Sex
Within the Management, Business, Science and Arts occupations in Honeoye Falls, the most male-oriented occupations are Life, Physical & Social Science (100.0%), Computers, Engineering & Science (83.5%), and Architecture & Engineering (81.6%), while the most female-oriented occupations are Education, Arts & Media (100.0%), Legal Services & Support (100.0%), and Health Diagnosing & Treating (92.0%).
| Occupation | Male | Female |
| Management | 59 (26.3%) | 165 (73.7%) |
| Business & Financial | 36 (47.4%) | 40 (52.6%) |
| Computers, Engineering & Science | 71 (83.5%) | 14 (16.5%) |
| Computers & Mathematics | 19 (79.2%) | 5 (20.8%) |
| Architecture & Engineering | 40 (81.6%) | 9 (18.4%) |
| Life, Physical & Social Science | 12 (100.0%) | 0 (0.0%) |
| Community & Social Service | 91 (39.6%) | 139 (60.4%) |
| Education, Arts & Media | 0 (0.0%) | 24 (100.0%) |
| Legal Services & Support | 0 (0.0%) | 15 (100.0%) |
| Education Instruction & Library | 71 (46.4%) | 82 (53.6%) |
| Arts, Media & Entertainment | 20 (52.6%) | 18 (47.4%) |
| Health Diagnosing & Treating | 8 (8.0%) | 92 (92.0%) |
| Health Technologists | 8 (8.0%) | 92 (92.0%) |
| Total (Category) | 265 (37.1%) | 450 (62.9%) |
| Total (Overall) | 623 (46.4%) | 721 (53.6%) |
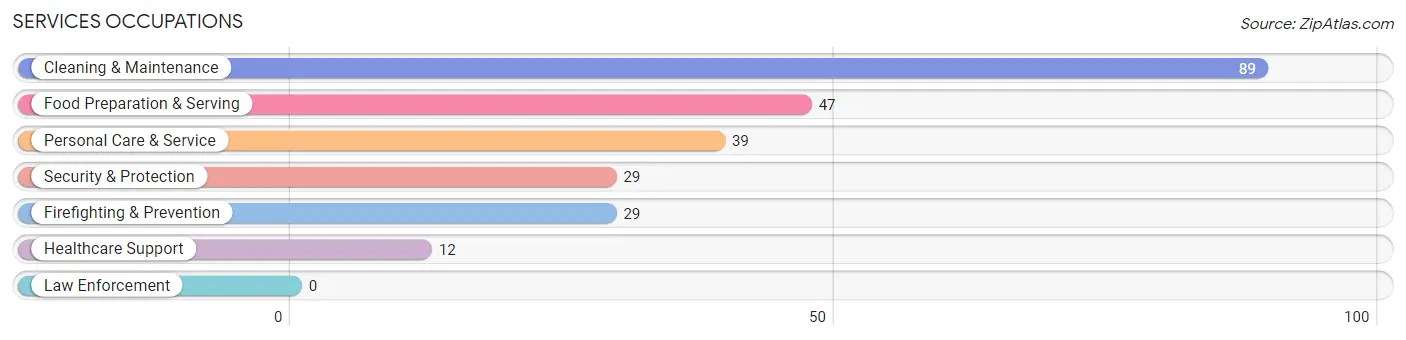
Services Occupations
The most common Services occupations in Honeoye Falls are Cleaning & Maintenance (89 | 6.6%), Food Preparation & Serving (47 | 3.5%), Personal Care & Service (39 | 2.9%), Security & Protection (29 | 2.2%), and Firefighting & Prevention (29 | 2.2%).
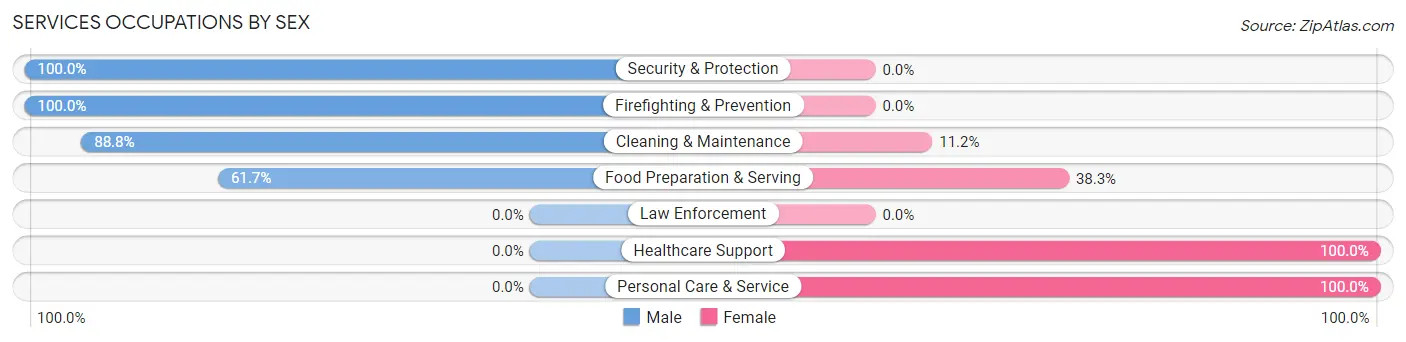
Services Occupations by Sex
Within the Services occupations in Honeoye Falls, the most male-oriented occupations are Security & Protection (100.0%), Firefighting & Prevention (100.0%), and Cleaning & Maintenance (88.8%), while the most female-oriented occupations are Healthcare Support (100.0%), Personal Care & Service (100.0%), and Food Preparation & Serving (38.3%).
| Occupation | Male | Female |
| Healthcare Support | 0 (0.0%) | 12 (100.0%) |
| Security & Protection | 29 (100.0%) | 0 (0.0%) |
| Firefighting & Prevention | 29 (100.0%) | 0 (0.0%) |
| Law Enforcement | 0 (0.0%) | 0 (0.0%) |
| Food Preparation & Serving | 29 (61.7%) | 18 (38.3%) |
| Cleaning & Maintenance | 79 (88.8%) | 10 (11.2%) |
| Personal Care & Service | 0 (0.0%) | 39 (100.0%) |
| Total (Category) | 137 (63.4%) | 79 (36.6%) |
| Total (Overall) | 623 (46.4%) | 721 (53.6%) |
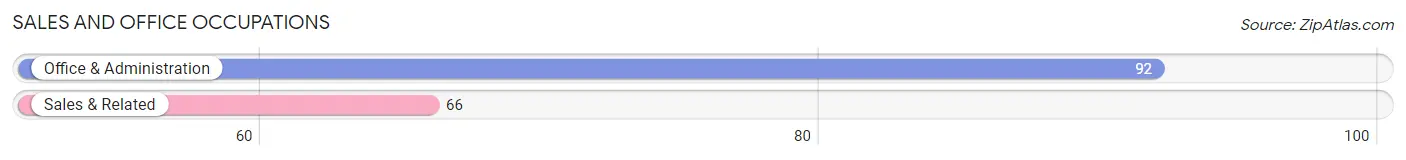
Sales and Office Occupations
The most common Sales and Office occupations in Honeoye Falls are Office & Administration (92 | 6.9%), and Sales & Related (66 | 4.9%).
Sales and Office Occupations by Sex
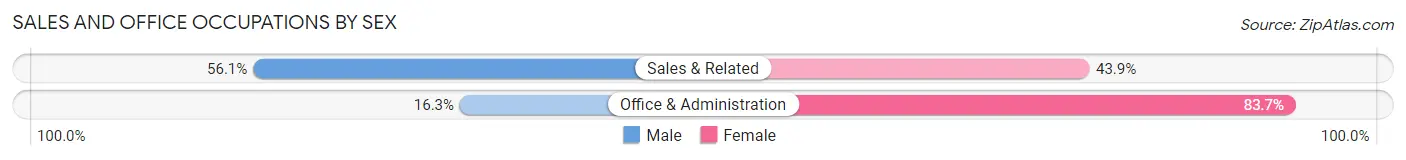
| Occupation | Male | Female |
| Sales & Related | 37 (56.1%) | 29 (43.9%) |
| Office & Administration | 15 (16.3%) | 77 (83.7%) |
| Total (Category) | 52 (32.9%) | 106 (67.1%) |
| Total (Overall) | 623 (46.4%) | 721 (53.6%) |
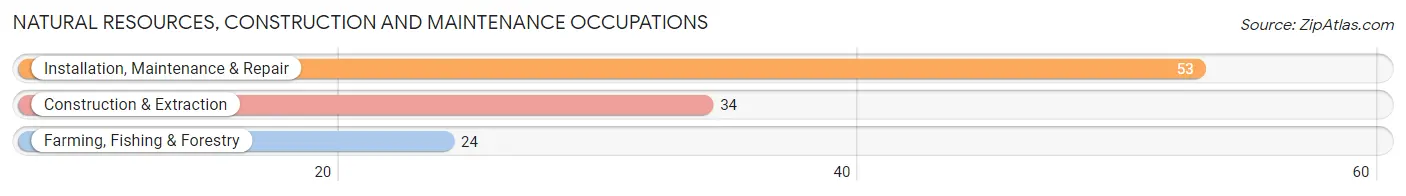
Natural Resources, Construction and Maintenance Occupations
The most common Natural Resources, Construction and Maintenance occupations in Honeoye Falls are Installation, Maintenance & Repair (53 | 3.9%), Construction & Extraction (34 | 2.5%), and Farming, Fishing & Forestry (24 | 1.8%).
Natural Resources, Construction and Maintenance Occupations by Sex
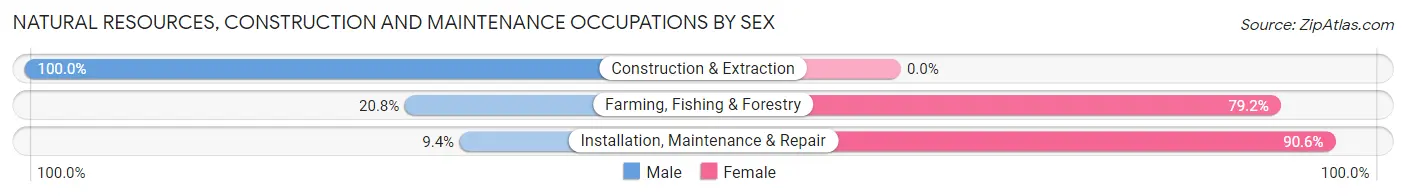
| Occupation | Male | Female |
| Farming, Fishing & Forestry | 5 (20.8%) | 19 (79.2%) |
| Construction & Extraction | 34 (100.0%) | 0 (0.0%) |
| Installation, Maintenance & Repair | 5 (9.4%) | 48 (90.6%) |
| Total (Category) | 44 (39.6%) | 67 (60.4%) |
| Total (Overall) | 623 (46.4%) | 721 (53.6%) |
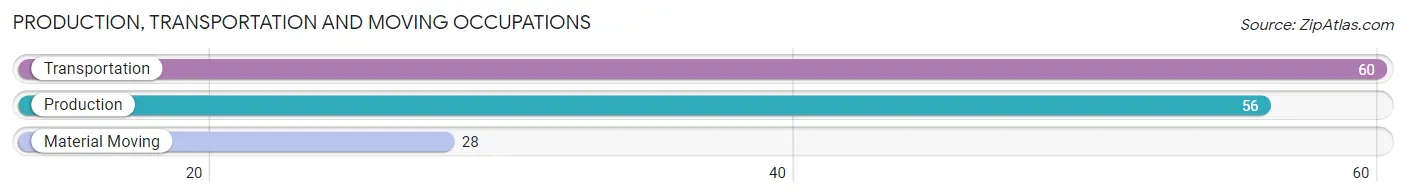
Production, Transportation and Moving Occupations
The most common Production, Transportation and Moving occupations in Honeoye Falls are Transportation (60 | 4.5%), Production (56 | 4.2%), and Material Moving (28 | 2.1%).
Production, Transportation and Moving Occupations by Sex
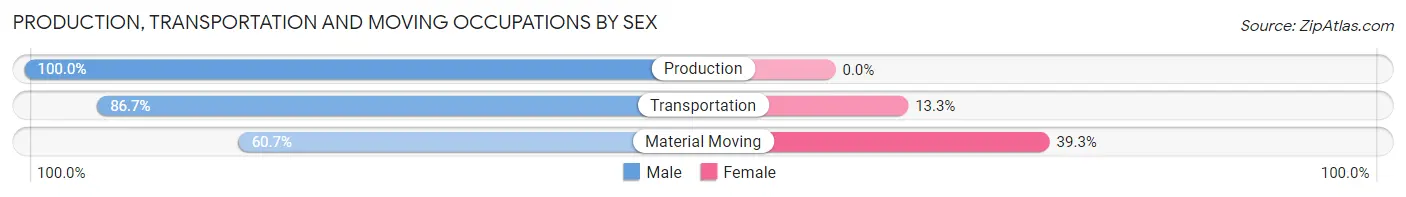
| Occupation | Male | Female |
| Production | 56 (100.0%) | 0 (0.0%) |
| Transportation | 52 (86.7%) | 8 (13.3%) |
| Material Moving | 17 (60.7%) | 11 (39.3%) |
| Total (Category) | 125 (86.8%) | 19 (13.2%) |
| Total (Overall) | 623 (46.4%) | 721 (53.6%) |
Employment Industries by Sex in Honeoye Falls
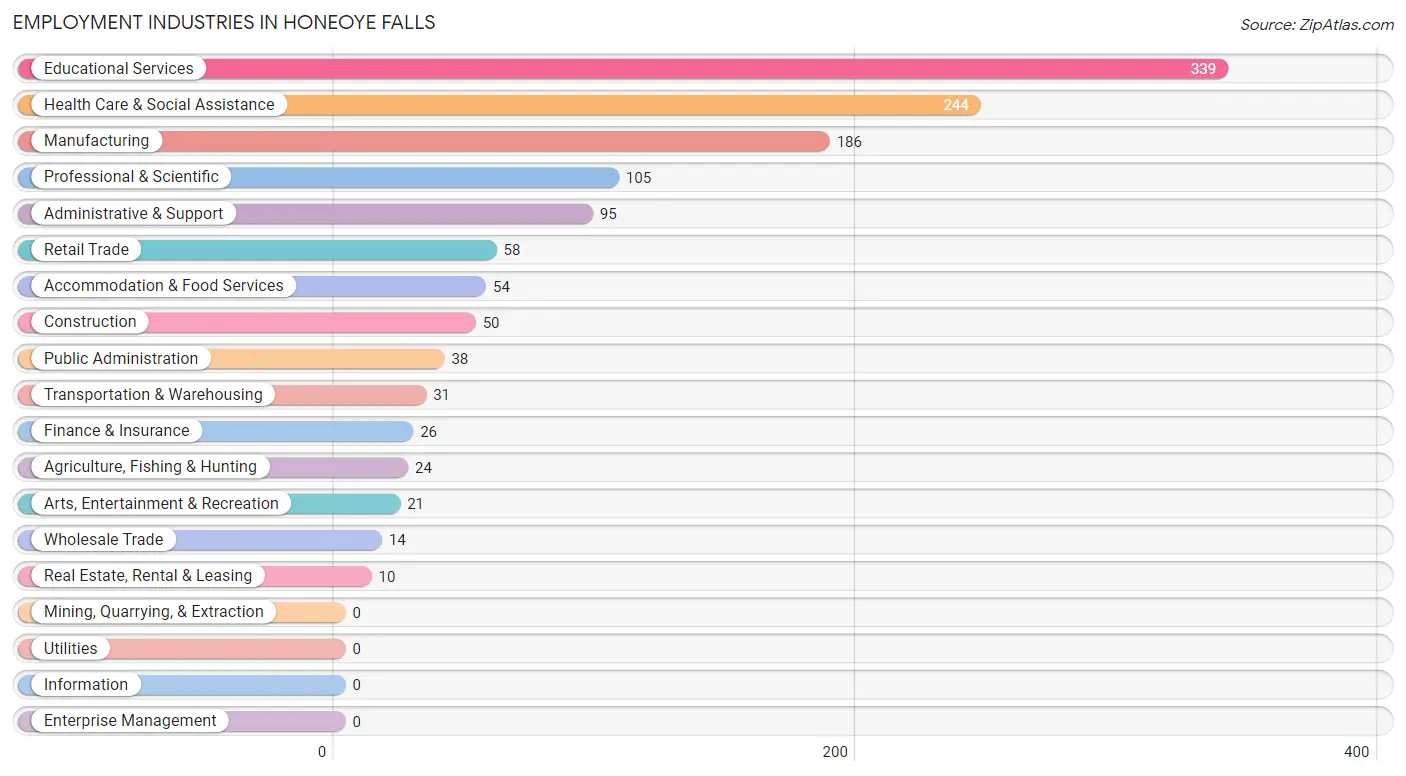
Employment Industries in Honeoye Falls
The major employment industries in Honeoye Falls include Educational Services (339 | 25.2%), Health Care & Social Assistance (244 | 18.1%), Manufacturing (186 | 13.8%), Professional & Scientific (105 | 7.8%), and Administrative & Support (95 | 7.1%).
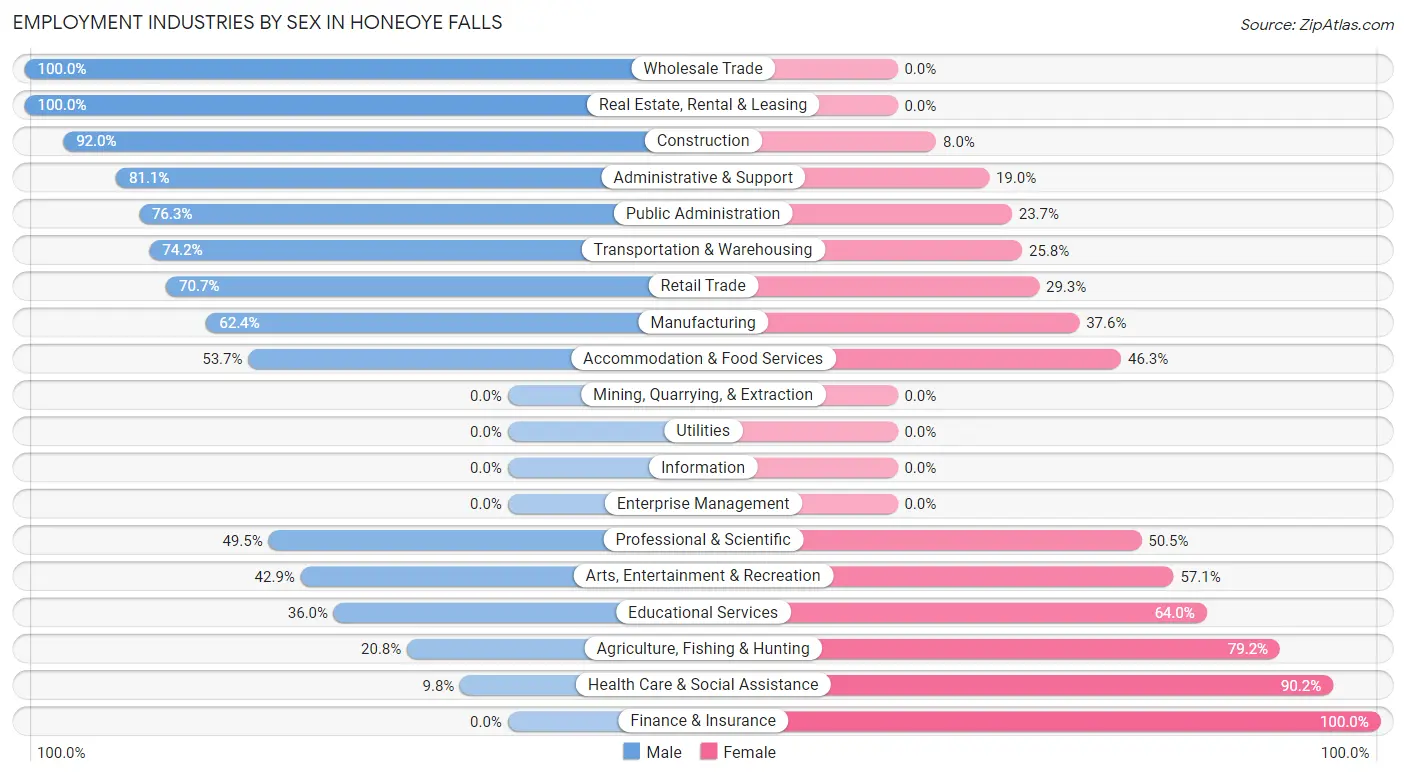
Employment Industries by Sex in Honeoye Falls
The Honeoye Falls industries that see more men than women are Wholesale Trade (100.0%), Real Estate, Rental & Leasing (100.0%), and Construction (92.0%), whereas the industries that tend to have a higher number of women are Finance & Insurance (100.0%), Health Care & Social Assistance (90.2%), and Agriculture, Fishing & Hunting (79.2%).
| Industry | Male | Female |
| Agriculture, Fishing & Hunting | 5 (20.8%) | 19 (79.2%) |
| Mining, Quarrying, & Extraction | 0 (0.0%) | 0 (0.0%) |
| Construction | 46 (92.0%) | 4 (8.0%) |
| Manufacturing | 116 (62.4%) | 70 (37.6%) |
| Wholesale Trade | 14 (100.0%) | 0 (0.0%) |
| Retail Trade | 41 (70.7%) | 17 (29.3%) |
| Transportation & Warehousing | 23 (74.2%) | 8 (25.8%) |
| Utilities | 0 (0.0%) | 0 (0.0%) |
| Information | 0 (0.0%) | 0 (0.0%) |
| Finance & Insurance | 0 (0.0%) | 26 (100.0%) |
| Real Estate, Rental & Leasing | 10 (100.0%) | 0 (0.0%) |
| Professional & Scientific | 52 (49.5%) | 53 (50.5%) |
| Enterprise Management | 0 (0.0%) | 0 (0.0%) |
| Administrative & Support | 77 (81.0%) | 18 (19.0%) |
| Educational Services | 122 (36.0%) | 217 (64.0%) |
| Health Care & Social Assistance | 24 (9.8%) | 220 (90.2%) |
| Arts, Entertainment & Recreation | 9 (42.9%) | 12 (57.1%) |
| Accommodation & Food Services | 29 (53.7%) | 25 (46.3%) |
| Public Administration | 29 (76.3%) | 9 (23.7%) |
| Total | 623 (46.4%) | 721 (53.6%) |
Education in Honeoye Falls
School Enrollment in Honeoye Falls
The most common levels of schooling among the 556 students in Honeoye Falls are high school (182 | 32.7%), elementary school (144 | 25.9%), and college / undergraduate (86 | 15.5%).
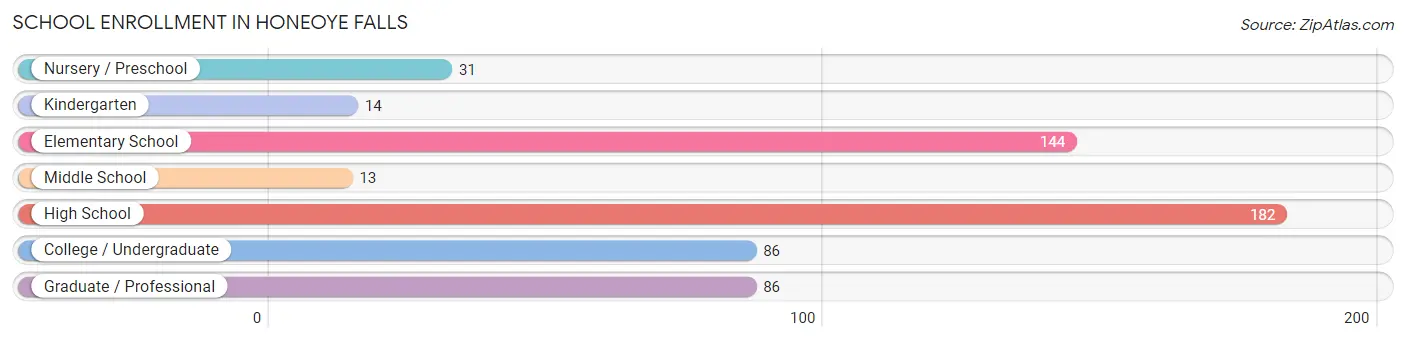
| School Level | # Students | % Students |
| Nursery / Preschool | 31 | 5.6% |
| Kindergarten | 14 | 2.5% |
| Elementary School | 144 | 25.9% |
| Middle School | 13 | 2.3% |
| High School | 182 | 32.7% |
| College / Undergraduate | 86 | 15.5% |
| Graduate / Professional | 86 | 15.5% |
| Total | 556 | 100.0% |
School Enrollment by Age by Funding Source in Honeoye Falls
Out of a total of 556 students who are enrolled in schools in Honeoye Falls, 175 (31.5%) attend a private institution, while the remaining 381 (68.5%) are enrolled in public schools. The age group of 3 to 4 year olds has the highest likelihood of being enrolled in private schools, with 6 (100.0% in the age bracket) enrolled. Conversely, the age group of 5 to 9 year old has the lowest likelihood of being enrolled in a private school, with 165 (100.0% in the age bracket) attending a public institution.
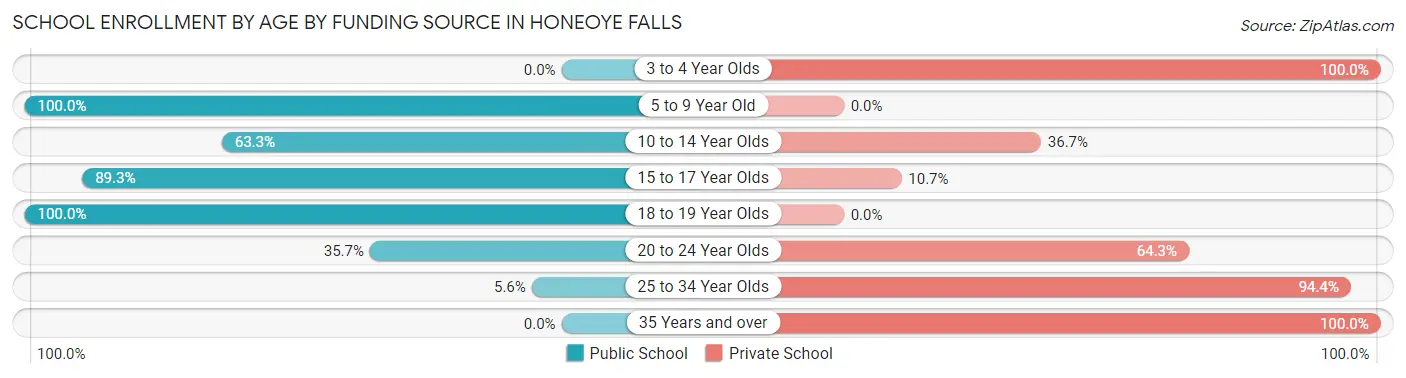
| Age Bracket | Public School | Private School |
| 3 to 4 Year Olds | 0 (0.0%) | 6 (100.0%) |
| 5 to 9 Year Old | 165 (100.0%) | 0 (0.0%) |
| 10 to 14 Year Olds | 31 (63.3%) | 18 (36.7%) |
| 15 to 17 Year Olds | 133 (89.3%) | 16 (10.7%) |
| 18 to 19 Year Olds | 15 (100.0%) | 0 (0.0%) |
| 20 to 24 Year Olds | 35 (35.7%) | 63 (64.3%) |
| 25 to 34 Year Olds | 2 (5.6%) | 34 (94.4%) |
| 35 Years and over | 0 (0.0%) | 38 (100.0%) |
| Total | 381 (68.5%) | 175 (31.5%) |
Educational Attainment by Field of Study in Honeoye Falls
Business (162 | 13.7%), social sciences (154 | 13.1%), education (144 | 12.2%), science & technology (141 | 11.9%), and liberal arts & history (131 | 11.1%) are the most common fields of study among 1,180 individuals in Honeoye Falls who have obtained a bachelor's degree or higher.
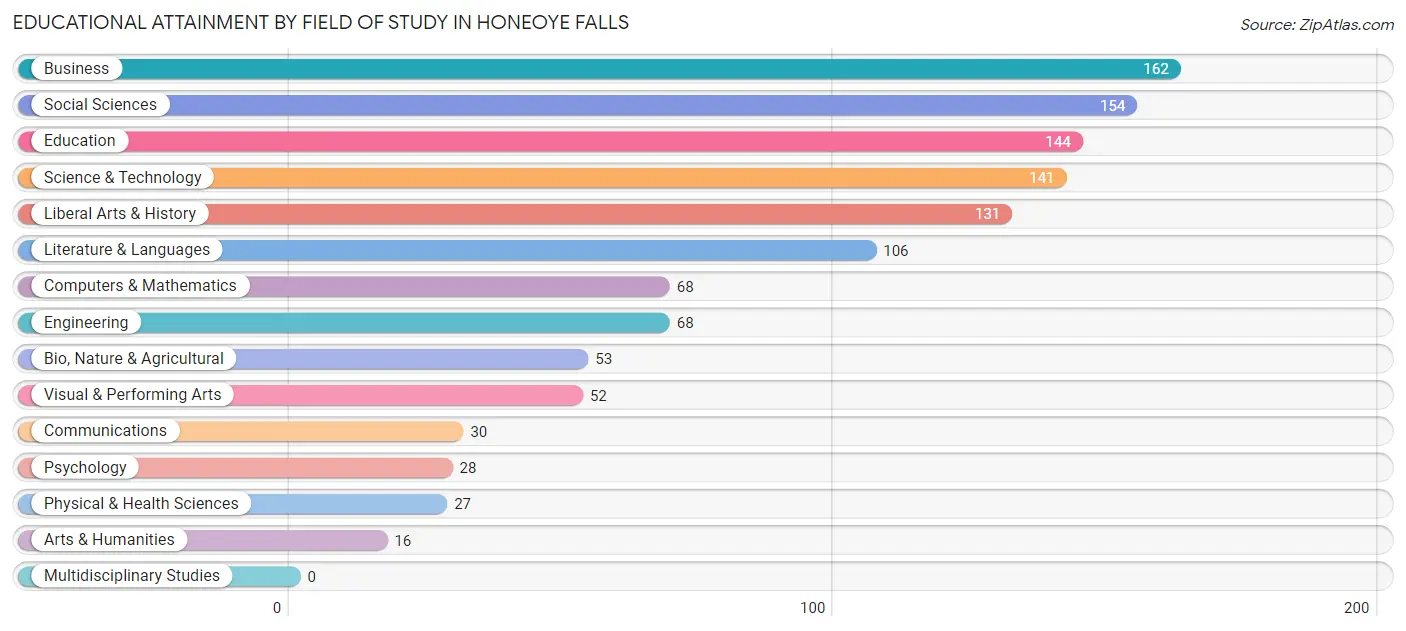
| Field of Study | # Graduates | % Graduates |
| Computers & Mathematics | 68 | 5.8% |
| Bio, Nature & Agricultural | 53 | 4.5% |
| Physical & Health Sciences | 27 | 2.3% |
| Psychology | 28 | 2.4% |
| Social Sciences | 154 | 13.1% |
| Engineering | 68 | 5.8% |
| Multidisciplinary Studies | 0 | 0.0% |
| Science & Technology | 141 | 11.9% |
| Business | 162 | 13.7% |
| Education | 144 | 12.2% |
| Literature & Languages | 106 | 9.0% |
| Liberal Arts & History | 131 | 11.1% |
| Visual & Performing Arts | 52 | 4.4% |
| Communications | 30 | 2.5% |
| Arts & Humanities | 16 | 1.4% |
| Total | 1,180 | 100.0% |
Transportation & Commute in Honeoye Falls
Vehicle Availability by Sex in Honeoye Falls
The most prevalent vehicle ownership categories in Honeoye Falls are males with 2 vehicles (329, accounting for 54.0%) and females with 2 vehicles (322, making up 46.1%).
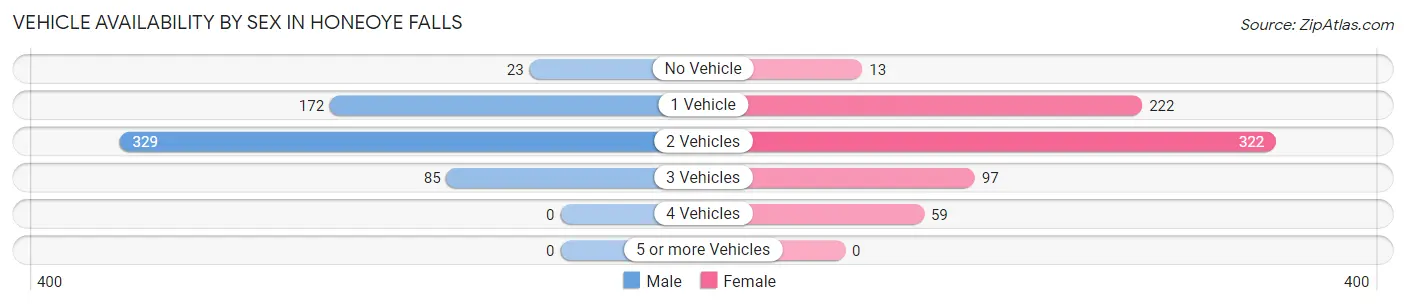
| Vehicles Available | Male | Female |
| No Vehicle | 23 (3.8%) | 13 (1.8%) |
| 1 Vehicle | 172 (28.2%) | 222 (31.1%) |
| 2 Vehicles | 329 (54.0%) | 322 (45.2%) |
| 3 Vehicles | 85 (14.0%) | 97 (13.6%) |
| 4 Vehicles | 0 (0.0%) | 59 (8.3%) |
| 5 or more Vehicles | 0 (0.0%) | 0 (0.0%) |
| Total | 609 (100.0%) | 713 (100.0%) |
Commute Time in Honeoye Falls
The most frequently occuring commute durations in Honeoye Falls are 20 to 24 minutes (249 commuters, 21.2%), 25 to 29 minutes (236 commuters, 20.1%), and 30 to 34 minutes (198 commuters, 16.8%).
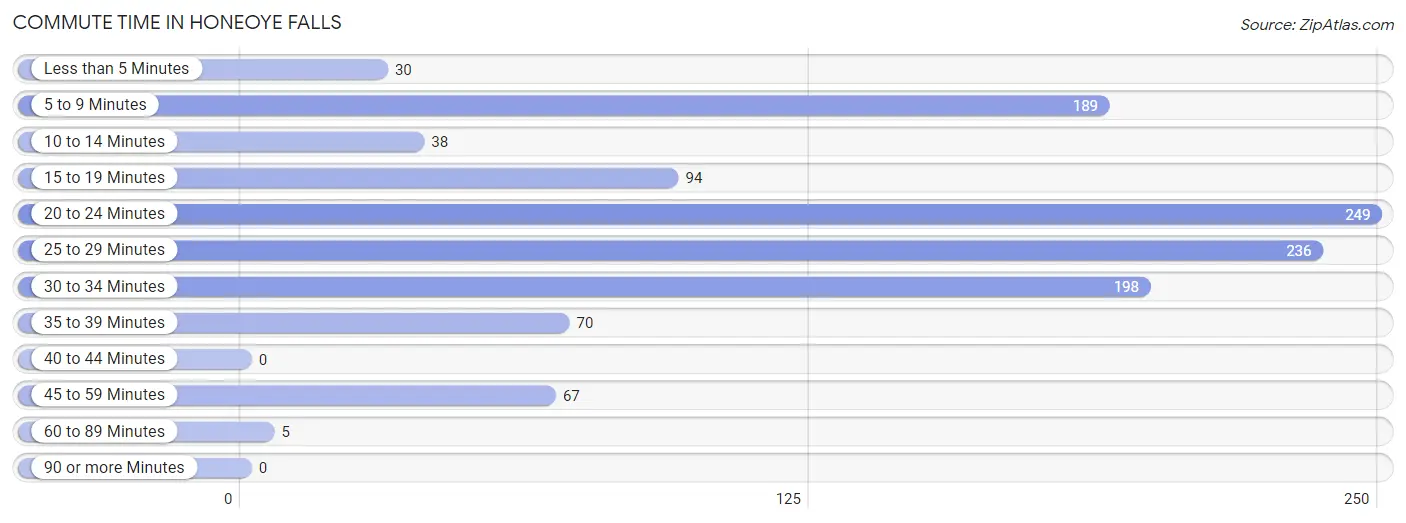
| Commute Time | # Commuters | % Commuters |
| Less than 5 Minutes | 30 | 2.5% |
| 5 to 9 Minutes | 189 | 16.1% |
| 10 to 14 Minutes | 38 | 3.2% |
| 15 to 19 Minutes | 94 | 8.0% |
| 20 to 24 Minutes | 249 | 21.2% |
| 25 to 29 Minutes | 236 | 20.1% |
| 30 to 34 Minutes | 198 | 16.8% |
| 35 to 39 Minutes | 70 | 5.9% |
| 40 to 44 Minutes | 0 | 0.0% |
| 45 to 59 Minutes | 67 | 5.7% |
| 60 to 89 Minutes | 5 | 0.4% |
| 90 or more Minutes | 0 | 0.0% |
Commute Time by Sex in Honeoye Falls
The most common commute times in Honeoye Falls are 5 to 9 minutes (129 commuters, 22.4%) for males and 20 to 24 minutes (178 commuters, 29.7%) for females.
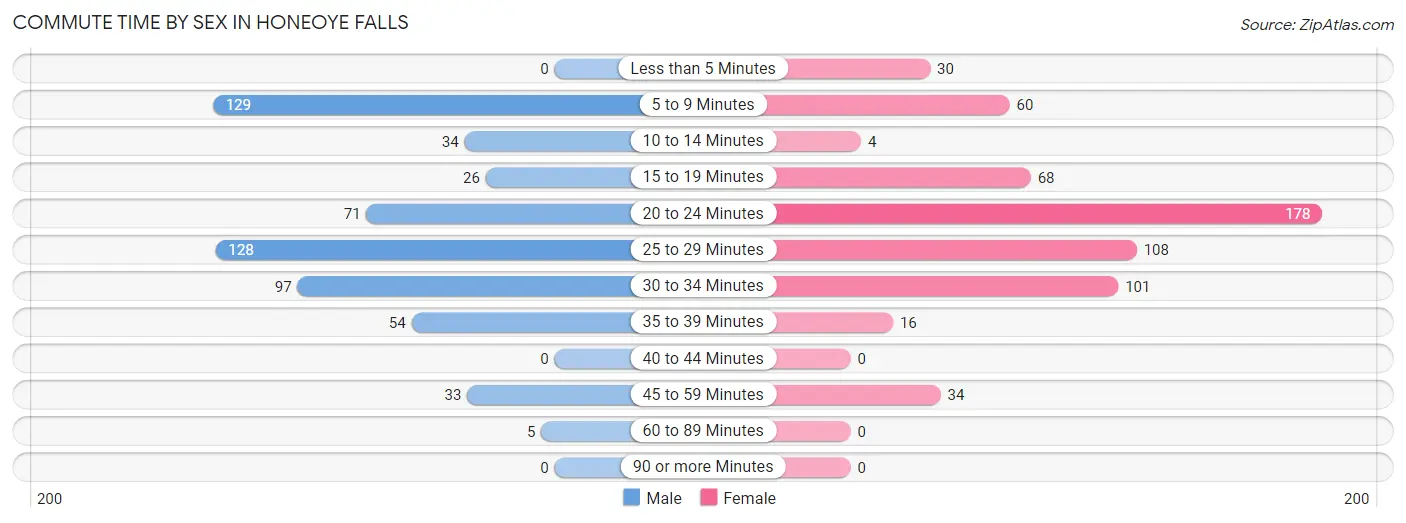
| Commute Time | Male | Female |
| Less than 5 Minutes | 0 (0.0%) | 30 (5.0%) |
| 5 to 9 Minutes | 129 (22.4%) | 60 (10.0%) |
| 10 to 14 Minutes | 34 (5.9%) | 4 (0.7%) |
| 15 to 19 Minutes | 26 (4.5%) | 68 (11.4%) |
| 20 to 24 Minutes | 71 (12.3%) | 178 (29.7%) |
| 25 to 29 Minutes | 128 (22.2%) | 108 (18.0%) |
| 30 to 34 Minutes | 97 (16.8%) | 101 (16.9%) |
| 35 to 39 Minutes | 54 (9.4%) | 16 (2.7%) |
| 40 to 44 Minutes | 0 (0.0%) | 0 (0.0%) |
| 45 to 59 Minutes | 33 (5.7%) | 34 (5.7%) |
| 60 to 89 Minutes | 5 (0.9%) | 0 (0.0%) |
| 90 or more Minutes | 0 (0.0%) | 0 (0.0%) |
Time of Departure to Work by Sex in Honeoye Falls
The most frequent times of departure to work in Honeoye Falls are 6:00 AM to 6:29 AM (116, 20.1%) for males and 7:00 AM to 7:29 AM (111, 18.5%) for females.
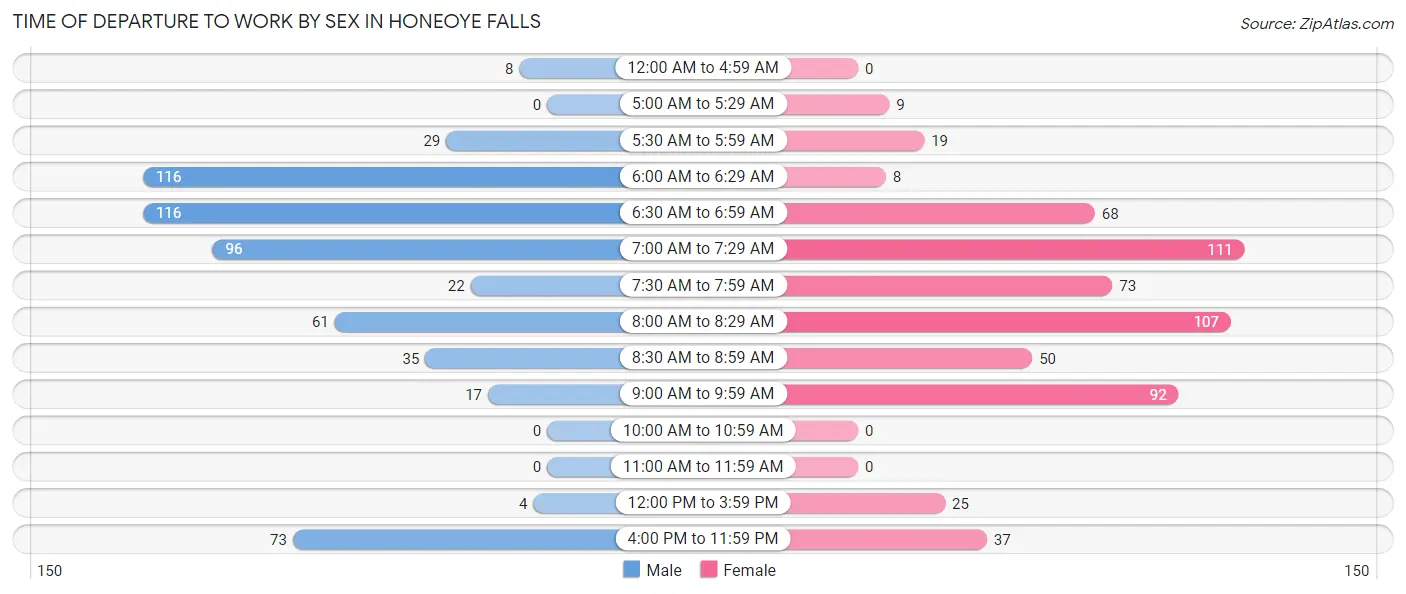
| Time of Departure | Male | Female |
| 12:00 AM to 4:59 AM | 8 (1.4%) | 0 (0.0%) |
| 5:00 AM to 5:29 AM | 0 (0.0%) | 9 (1.5%) |
| 5:30 AM to 5:59 AM | 29 (5.0%) | 19 (3.2%) |
| 6:00 AM to 6:29 AM | 116 (20.1%) | 8 (1.3%) |
| 6:30 AM to 6:59 AM | 116 (20.1%) | 68 (11.4%) |
| 7:00 AM to 7:29 AM | 96 (16.6%) | 111 (18.5%) |
| 7:30 AM to 7:59 AM | 22 (3.8%) | 73 (12.2%) |
| 8:00 AM to 8:29 AM | 61 (10.6%) | 107 (17.9%) |
| 8:30 AM to 8:59 AM | 35 (6.1%) | 50 (8.4%) |
| 9:00 AM to 9:59 AM | 17 (2.9%) | 92 (15.4%) |
| 10:00 AM to 10:59 AM | 0 (0.0%) | 0 (0.0%) |
| 11:00 AM to 11:59 AM | 0 (0.0%) | 0 (0.0%) |
| 12:00 PM to 3:59 PM | 4 (0.7%) | 25 (4.2%) |
| 4:00 PM to 11:59 PM | 73 (12.7%) | 37 (6.2%) |
| Total | 577 (100.0%) | 599 (100.0%) |
Housing Occupancy in Honeoye Falls
Occupancy by Ownership in Honeoye Falls
Of the total 1,252 dwellings in Honeoye Falls, owner-occupied units account for 661 (52.8%), while renter-occupied units make up 591 (47.2%).
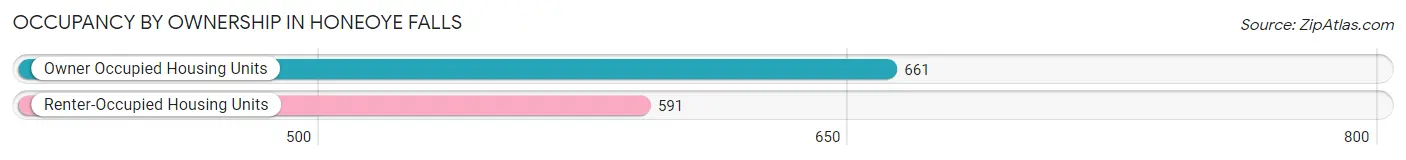
| Occupancy | # Housing Units | % Housing Units |
| Owner Occupied Housing Units | 661 | 52.8% |
| Renter-Occupied Housing Units | 591 | 47.2% |
| Total Occupied Housing Units | 1,252 | 100.0% |
Occupancy by Household Size in Honeoye Falls
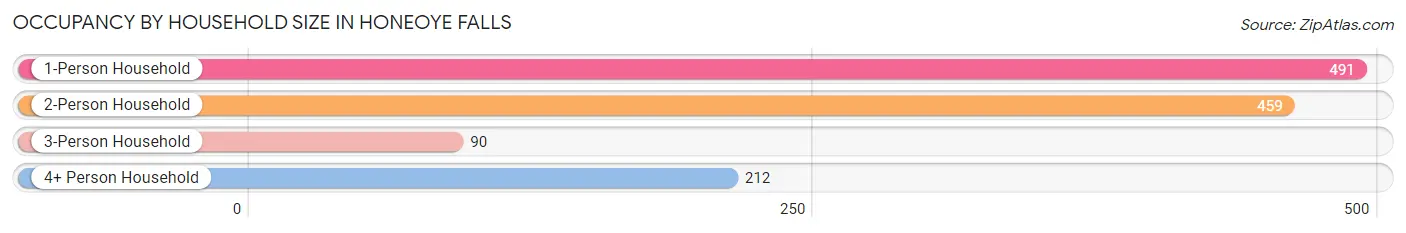
| Household Size | # Housing Units | % Housing Units |
| 1-Person Household | 491 | 39.2% |
| 2-Person Household | 459 | 36.7% |
| 3-Person Household | 90 | 7.2% |
| 4+ Person Household | 212 | 16.9% |
| Total Housing Units | 1,252 | 100.0% |
Occupancy by Ownership by Household Size in Honeoye Falls
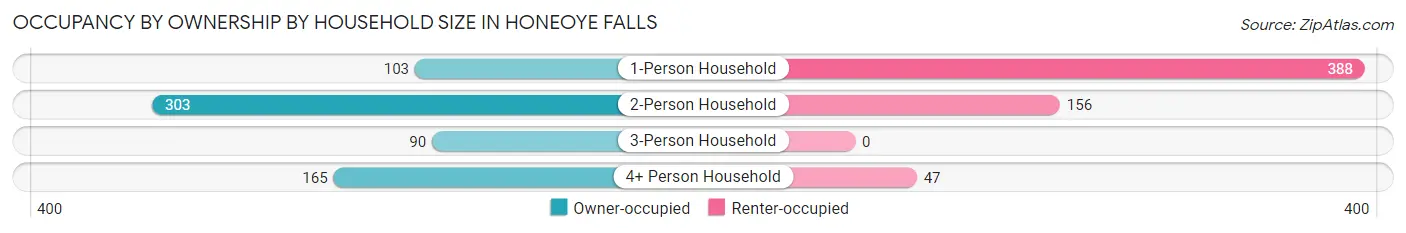
| Household Size | Owner-occupied | Renter-occupied |
| 1-Person Household | 103 (21.0%) | 388 (79.0%) |
| 2-Person Household | 303 (66.0%) | 156 (34.0%) |
| 3-Person Household | 90 (100.0%) | 0 (0.0%) |
| 4+ Person Household | 165 (77.8%) | 47 (22.2%) |
| Total Housing Units | 661 (52.8%) | 591 (47.2%) |
Occupancy by Educational Attainment in Honeoye Falls
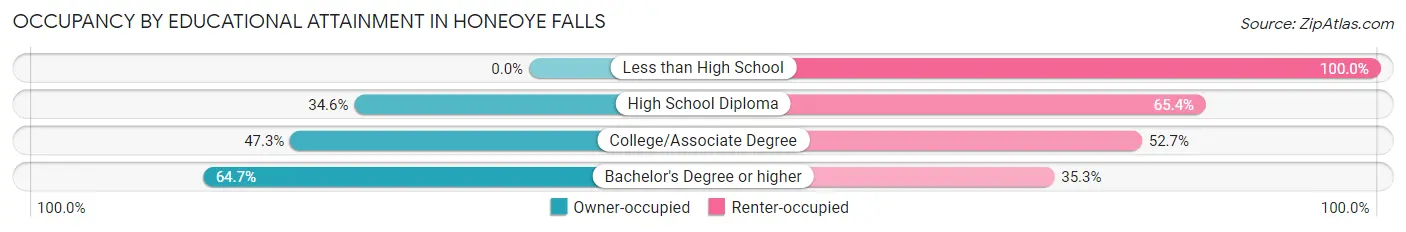
| Household Size | Owner-occupied | Renter-occupied |
| Less than High School | 0 (0.0%) | 27 (100.0%) |
| High School Diploma | 80 (34.6%) | 151 (65.4%) |
| College/Associate Degree | 169 (47.3%) | 188 (52.7%) |
| Bachelor's Degree or higher | 412 (64.7%) | 225 (35.3%) |
Occupancy by Age of Householder in Honeoye Falls
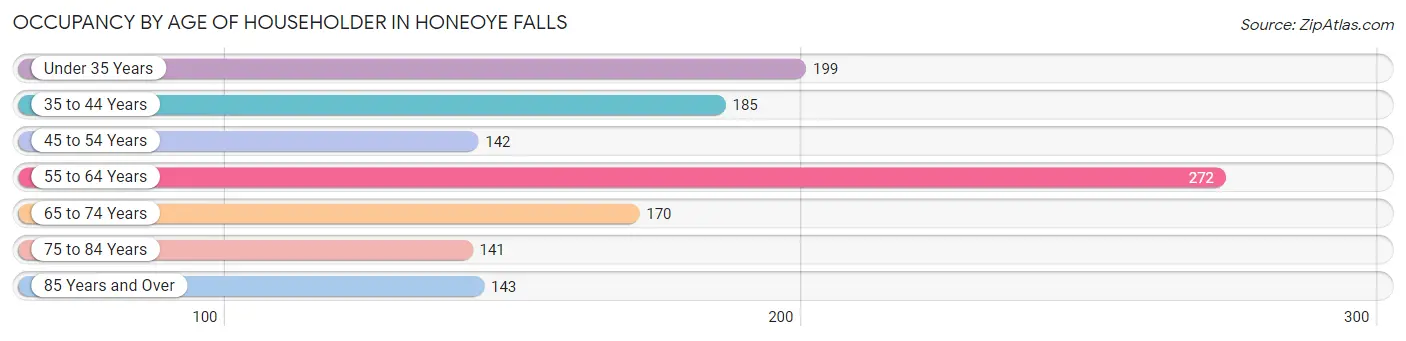
| Age Bracket | # Households | % Households |
| Under 35 Years | 199 | 15.9% |
| 35 to 44 Years | 185 | 14.8% |
| 45 to 54 Years | 142 | 11.3% |
| 55 to 64 Years | 272 | 21.7% |
| 65 to 74 Years | 170 | 13.6% |
| 75 to 84 Years | 141 | 11.3% |
| 85 Years and Over | 143 | 11.4% |
| Total | 1,252 | 100.0% |
Housing Finances in Honeoye Falls
Median Income by Occupancy in Honeoye Falls
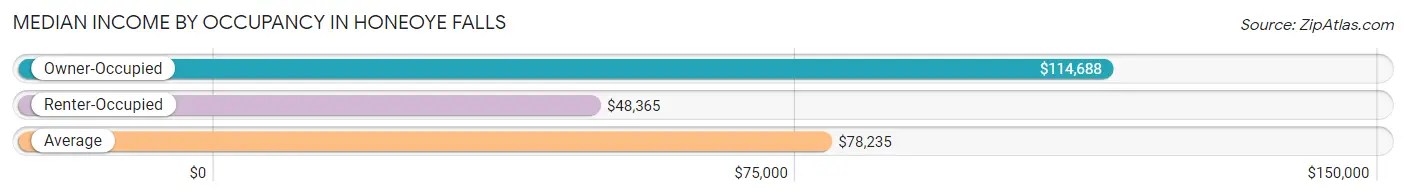
| Occupancy Type | # Households | Median Income |
| Owner-Occupied | 661 (52.8%) | $114,688 |
| Renter-Occupied | 591 (47.2%) | $48,365 |
| Average | 1,252 (100.0%) | $78,235 |
Occupancy by Householder Income Bracket in Honeoye Falls
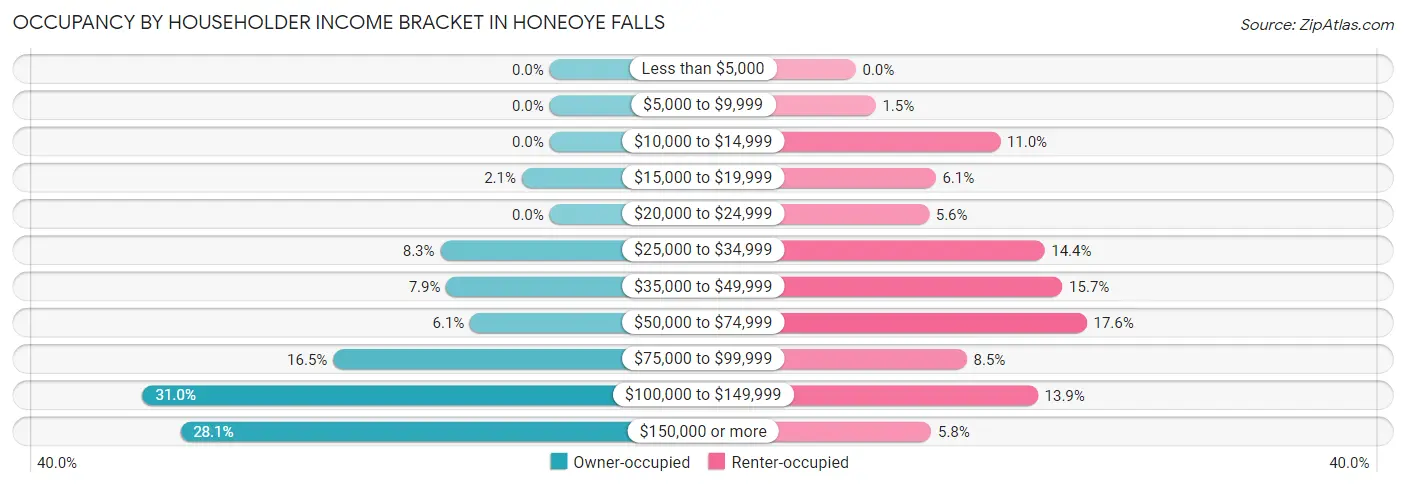
| Income Bracket | Owner-occupied | Renter-occupied |
| Less than $5,000 | 0 (0.0%) | 0 (0.0%) |
| $5,000 to $9,999 | 0 (0.0%) | 9 (1.5%) |
| $10,000 to $14,999 | 0 (0.0%) | 65 (11.0%) |
| $15,000 to $19,999 | 14 (2.1%) | 36 (6.1%) |
| $20,000 to $24,999 | 0 (0.0%) | 33 (5.6%) |
| $25,000 to $34,999 | 55 (8.3%) | 85 (14.4%) |
| $35,000 to $49,999 | 52 (7.9%) | 93 (15.7%) |
| $50,000 to $74,999 | 40 (6.0%) | 104 (17.6%) |
| $75,000 to $99,999 | 109 (16.5%) | 50 (8.5%) |
| $100,000 to $149,999 | 205 (31.0%) | 82 (13.9%) |
| $150,000 or more | 186 (28.1%) | 34 (5.8%) |
| Total | 661 (100.0%) | 591 (100.0%) |
Monthly Housing Cost Tiers in Honeoye Falls
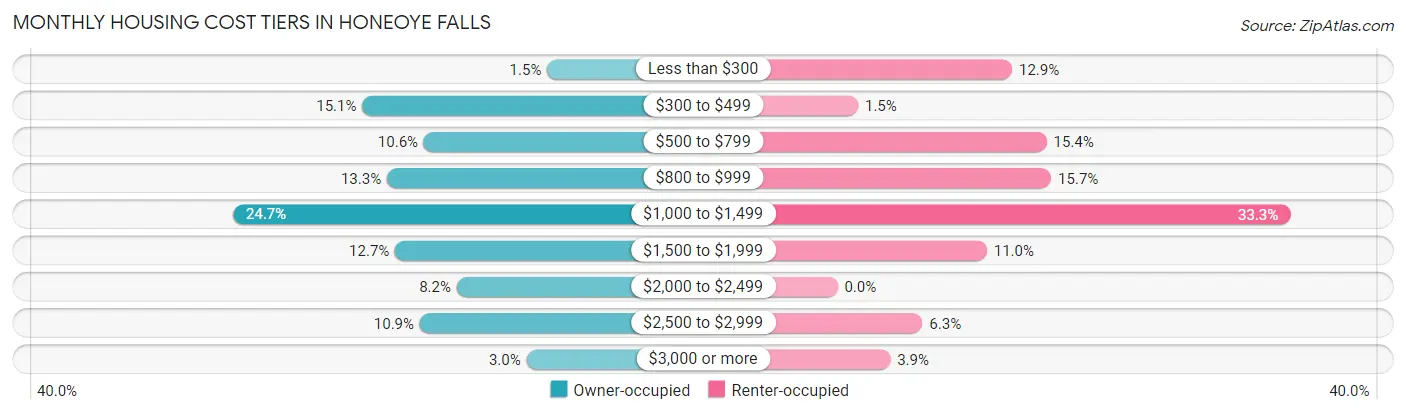
| Monthly Cost | Owner-occupied | Renter-occupied |
| Less than $300 | 10 (1.5%) | 76 (12.9%) |
| $300 to $499 | 100 (15.1%) | 9 (1.5%) |
| $500 to $799 | 70 (10.6%) | 91 (15.4%) |
| $800 to $999 | 88 (13.3%) | 93 (15.7%) |
| $1,000 to $1,499 | 163 (24.7%) | 197 (33.3%) |
| $1,500 to $1,999 | 84 (12.7%) | 65 (11.0%) |
| $2,000 to $2,499 | 54 (8.2%) | 0 (0.0%) |
| $2,500 to $2,999 | 72 (10.9%) | 37 (6.3%) |
| $3,000 or more | 20 (3.0%) | 23 (3.9%) |
| Total | 661 (100.0%) | 591 (100.0%) |
Physical Housing Characteristics in Honeoye Falls
Housing Structures in Honeoye Falls
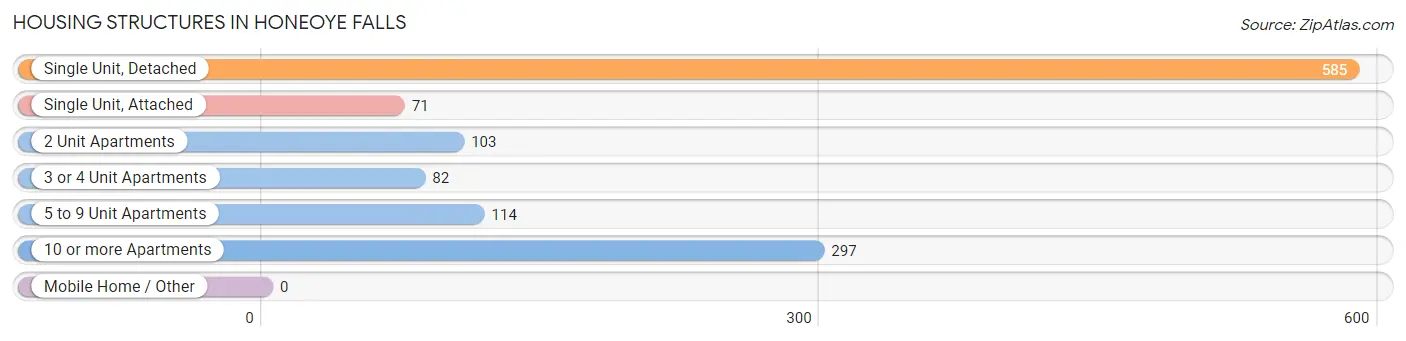
| Structure Type | # Housing Units | % Housing Units |
| Single Unit, Detached | 585 | 46.7% |
| Single Unit, Attached | 71 | 5.7% |
| 2 Unit Apartments | 103 | 8.2% |
| 3 or 4 Unit Apartments | 82 | 6.6% |
| 5 to 9 Unit Apartments | 114 | 9.1% |
| 10 or more Apartments | 297 | 23.7% |
| Mobile Home / Other | 0 | 0.0% |
| Total | 1,252 | 100.0% |
Housing Structures by Occupancy in Honeoye Falls
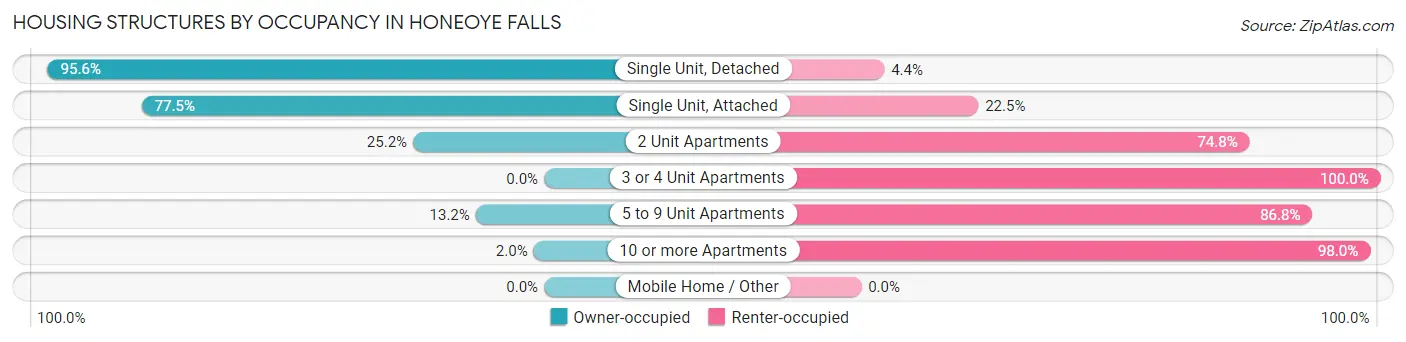
| Structure Type | Owner-occupied | Renter-occupied |
| Single Unit, Detached | 559 (95.6%) | 26 (4.4%) |
| Single Unit, Attached | 55 (77.5%) | 16 (22.5%) |
| 2 Unit Apartments | 26 (25.2%) | 77 (74.8%) |
| 3 or 4 Unit Apartments | 0 (0.0%) | 82 (100.0%) |
| 5 to 9 Unit Apartments | 15 (13.2%) | 99 (86.8%) |
| 10 or more Apartments | 6 (2.0%) | 291 (98.0%) |
| Mobile Home / Other | 0 (0.0%) | 0 (0.0%) |
| Total | 661 (52.8%) | 591 (47.2%) |
Housing Structures by Number of Rooms in Honeoye Falls
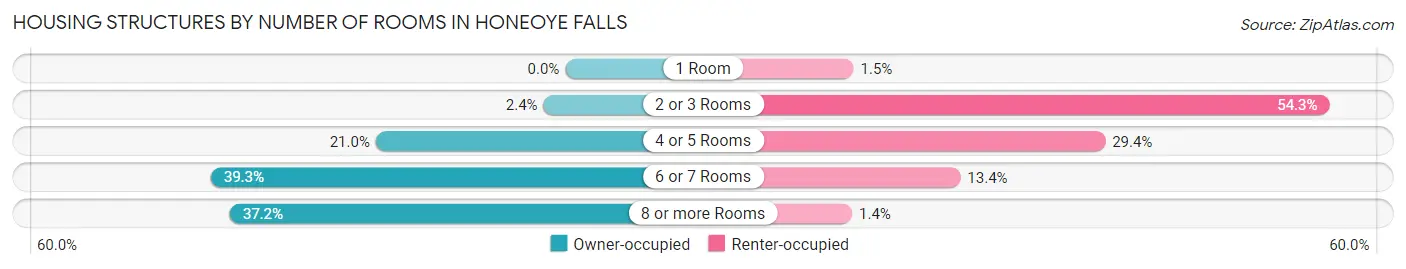
| Number of Rooms | Owner-occupied | Renter-occupied |
| 1 Room | 0 (0.0%) | 9 (1.5%) |
| 2 or 3 Rooms | 16 (2.4%) | 321 (54.3%) |
| 4 or 5 Rooms | 139 (21.0%) | 174 (29.4%) |
| 6 or 7 Rooms | 260 (39.3%) | 79 (13.4%) |
| 8 or more Rooms | 246 (37.2%) | 8 (1.3%) |
| Total | 661 (100.0%) | 591 (100.0%) |
Housing Structure by Heating Type in Honeoye Falls
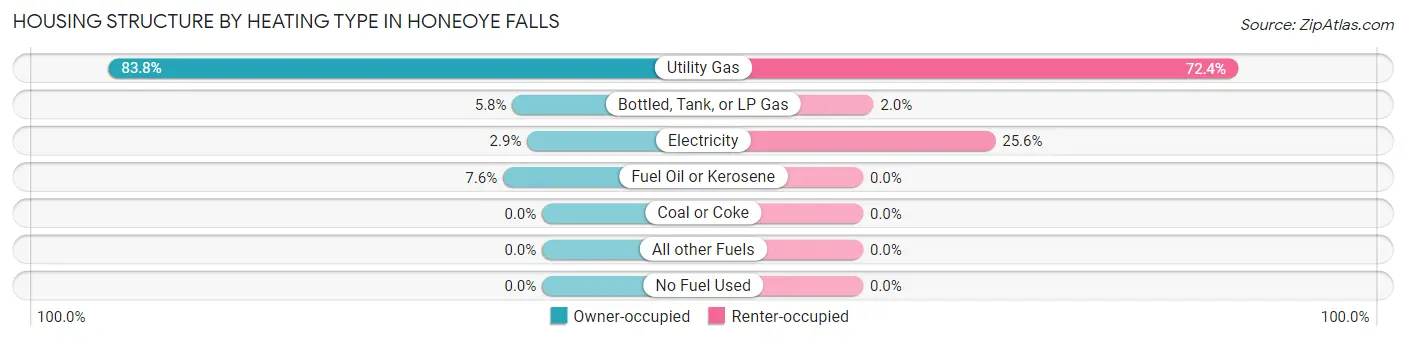
| Heating Type | Owner-occupied | Renter-occupied |
| Utility Gas | 554 (83.8%) | 428 (72.4%) |
| Bottled, Tank, or LP Gas | 38 (5.8%) | 12 (2.0%) |
| Electricity | 19 (2.9%) | 151 (25.6%) |
| Fuel Oil or Kerosene | 50 (7.6%) | 0 (0.0%) |
| Coal or Coke | 0 (0.0%) | 0 (0.0%) |
| All other Fuels | 0 (0.0%) | 0 (0.0%) |
| No Fuel Used | 0 (0.0%) | 0 (0.0%) |
| Total | 661 (100.0%) | 591 (100.0%) |
Household Vehicle Usage in Honeoye Falls
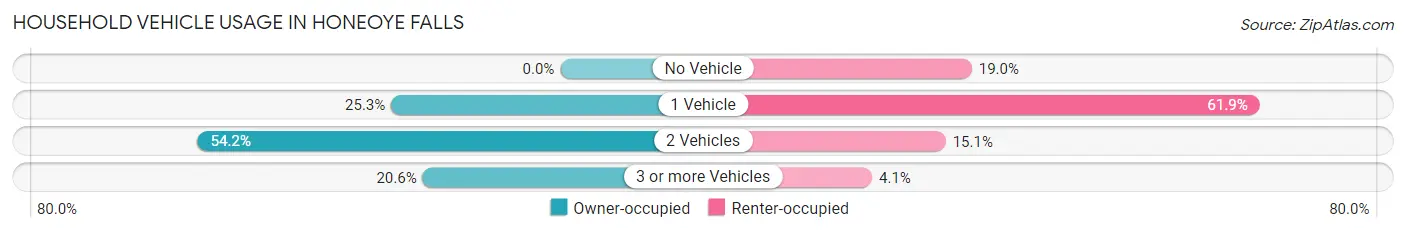
| Vehicles per Household | Owner-occupied | Renter-occupied |
| No Vehicle | 0 (0.0%) | 112 (19.0%) |
| 1 Vehicle | 167 (25.3%) | 366 (61.9%) |
| 2 Vehicles | 358 (54.2%) | 89 (15.1%) |
| 3 or more Vehicles | 136 (20.6%) | 24 (4.1%) |
| Total | 661 (100.0%) | 591 (100.0%) |
Real Estate & Mortgages in Honeoye Falls
Real Estate and Mortgage Overview in Honeoye Falls
| Characteristic | Without Mortgage | With Mortgage |
| Housing Units | 346 | 315 |
| Median Property Value | $219,800 | $234,800 |
| Median Household Income | $85,833 | $82 |
| Monthly Housing Costs | $768 | $20 |
| Real Estate Taxes | $5,278 | $0 |
Property Value by Mortgage Status in Honeoye Falls
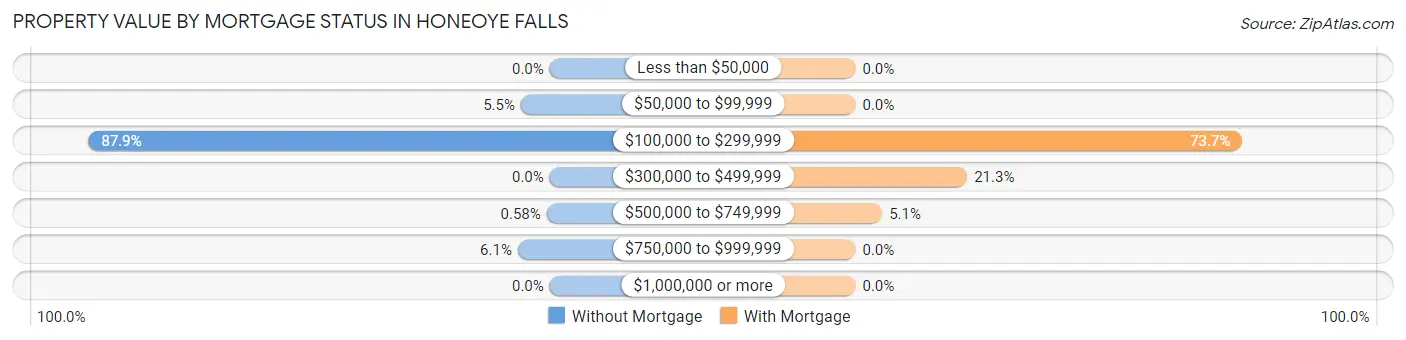
| Property Value | Without Mortgage | With Mortgage |
| Less than $50,000 | 0 (0.0%) | 0 (0.0%) |
| $50,000 to $99,999 | 19 (5.5%) | 0 (0.0%) |
| $100,000 to $299,999 | 304 (87.9%) | 232 (73.7%) |
| $300,000 to $499,999 | 0 (0.0%) | 67 (21.3%) |
| $500,000 to $749,999 | 2 (0.6%) | 16 (5.1%) |
| $750,000 to $999,999 | 21 (6.1%) | 0 (0.0%) |
| $1,000,000 or more | 0 (0.0%) | 0 (0.0%) |
| Total | 346 (100.0%) | 315 (100.0%) |
Household Income by Mortgage Status in Honeoye Falls
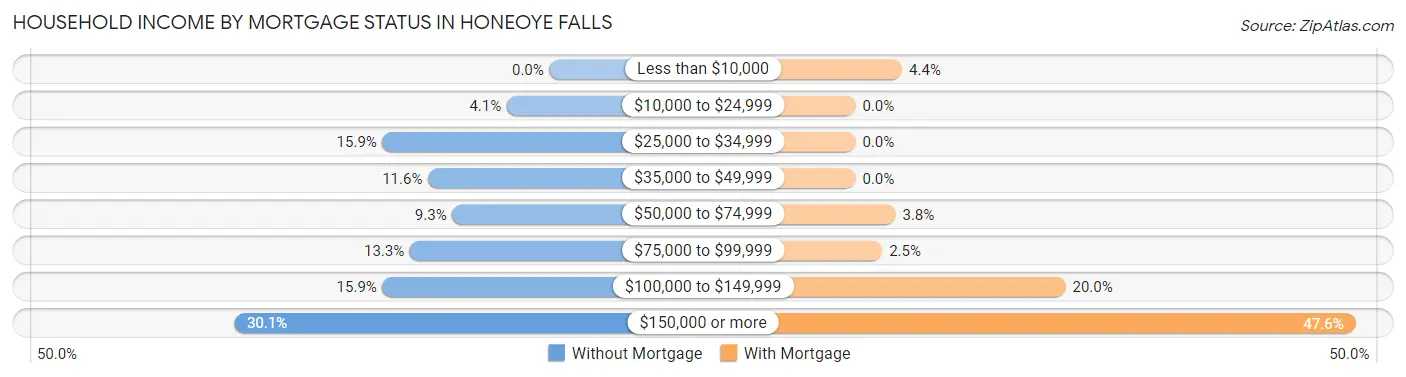
| Household Income | Without Mortgage | With Mortgage |
| Less than $10,000 | 0 (0.0%) | 14 (4.4%) |
| $10,000 to $24,999 | 14 (4.1%) | 0 (0.0%) |
| $25,000 to $34,999 | 55 (15.9%) | 0 (0.0%) |
| $35,000 to $49,999 | 40 (11.6%) | 0 (0.0%) |
| $50,000 to $74,999 | 32 (9.2%) | 12 (3.8%) |
| $75,000 to $99,999 | 46 (13.3%) | 8 (2.5%) |
| $100,000 to $149,999 | 55 (15.9%) | 63 (20.0%) |
| $150,000 or more | 104 (30.1%) | 150 (47.6%) |
| Total | 346 (100.0%) | 315 (100.0%) |
Property Value to Household Income Ratio in Honeoye Falls
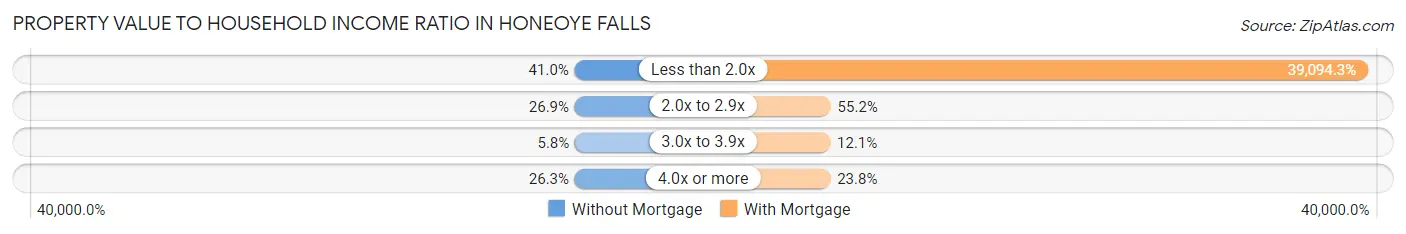
| Value-to-Income Ratio | Without Mortgage | With Mortgage |
| Less than 2.0x | 142 (41.0%) | 123,147 (39,094.3%) |
| 2.0x to 2.9x | 93 (26.9%) | 174 (55.2%) |
| 3.0x to 3.9x | 20 (5.8%) | 38 (12.1%) |
| 4.0x or more | 91 (26.3%) | 75 (23.8%) |
| Total | 346 (100.0%) | 315 (100.0%) |
Real Estate Taxes by Mortgage Status in Honeoye Falls
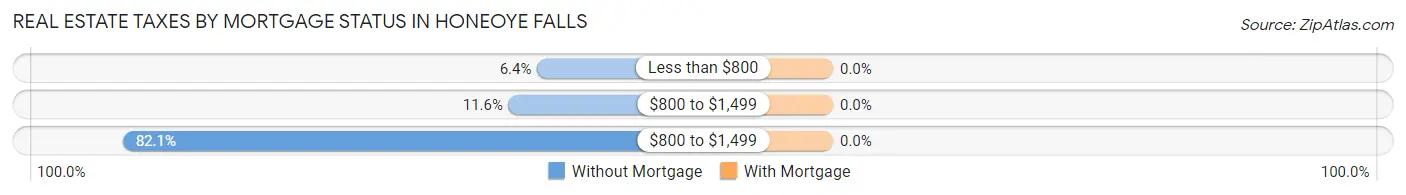
| Property Taxes | Without Mortgage | With Mortgage |
| Less than $800 | 22 (6.4%) | 0 (0.0%) |
| $800 to $1,499 | 40 (11.6%) | 0 (0.0%) |
| $800 to $1,499 | 284 (82.1%) | 0 (0.0%) |
| Total | 346 (100.0%) | 315 (100.0%) |
Health & Disability in Honeoye Falls
Health Insurance Coverage by Age in Honeoye Falls
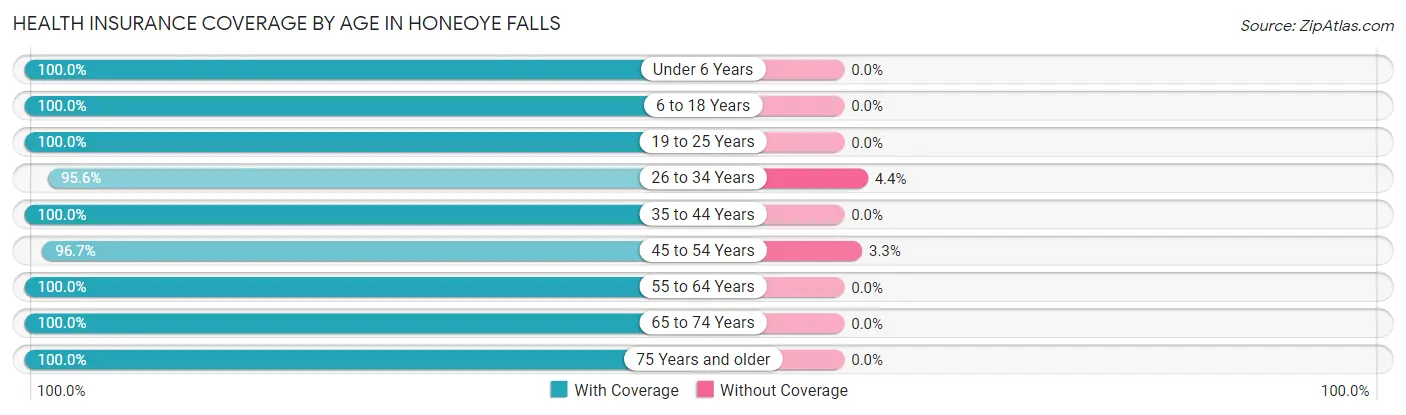
| Age Bracket | With Coverage | Without Coverage |
| Under 6 Years | 227 (100.0%) | 0 (0.0%) |
| 6 to 18 Years | 344 (100.0%) | 0 (0.0%) |
| 19 to 25 Years | 272 (100.0%) | 0 (0.0%) |
| 26 to 34 Years | 219 (95.6%) | 10 (4.4%) |
| 35 to 44 Years | 381 (100.0%) | 0 (0.0%) |
| 45 to 54 Years | 234 (96.7%) | 8 (3.3%) |
| 55 to 64 Years | 397 (100.0%) | 0 (0.0%) |
| 65 to 74 Years | 313 (100.0%) | 0 (0.0%) |
| 75 Years and older | 357 (100.0%) | 0 (0.0%) |
| Total | 2,744 (99.4%) | 18 (0.6%) |
Health Insurance Coverage by Citizenship Status in Honeoye Falls
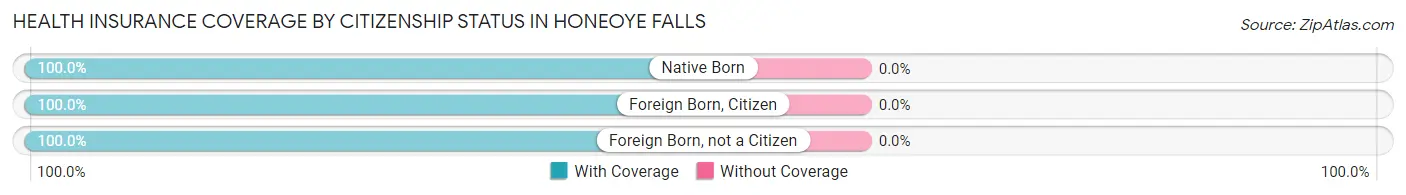
| Citizenship Status | With Coverage | Without Coverage |
| Native Born | 227 (100.0%) | 0 (0.0%) |
| Foreign Born, Citizen | 344 (100.0%) | 0 (0.0%) |
| Foreign Born, not a Citizen | 272 (100.0%) | 0 (0.0%) |
Health Insurance Coverage by Household Income in Honeoye Falls
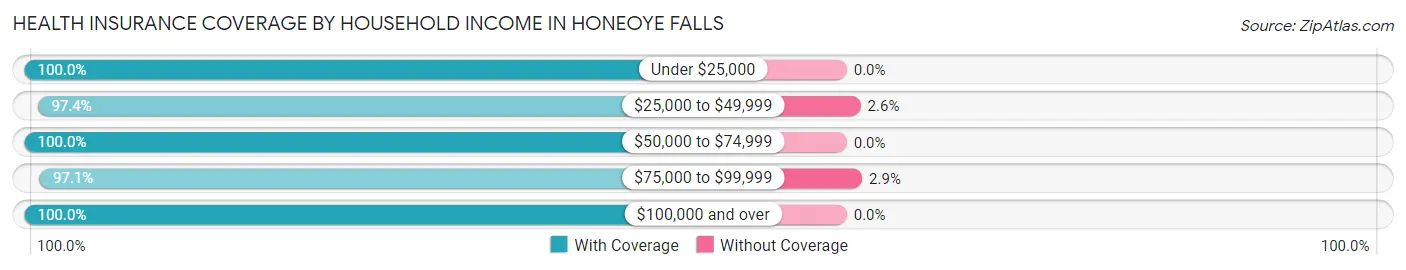
| Household Income | With Coverage | Without Coverage |
| Under $25,000 | 178 (100.0%) | 0 (0.0%) |
| $25,000 to $49,999 | 375 (97.4%) | 10 (2.6%) |
| $50,000 to $74,999 | 306 (100.0%) | 0 (0.0%) |
| $75,000 to $99,999 | 270 (97.1%) | 8 (2.9%) |
| $100,000 and over | 1,598 (100.0%) | 0 (0.0%) |
Public vs Private Health Insurance Coverage by Age in Honeoye Falls
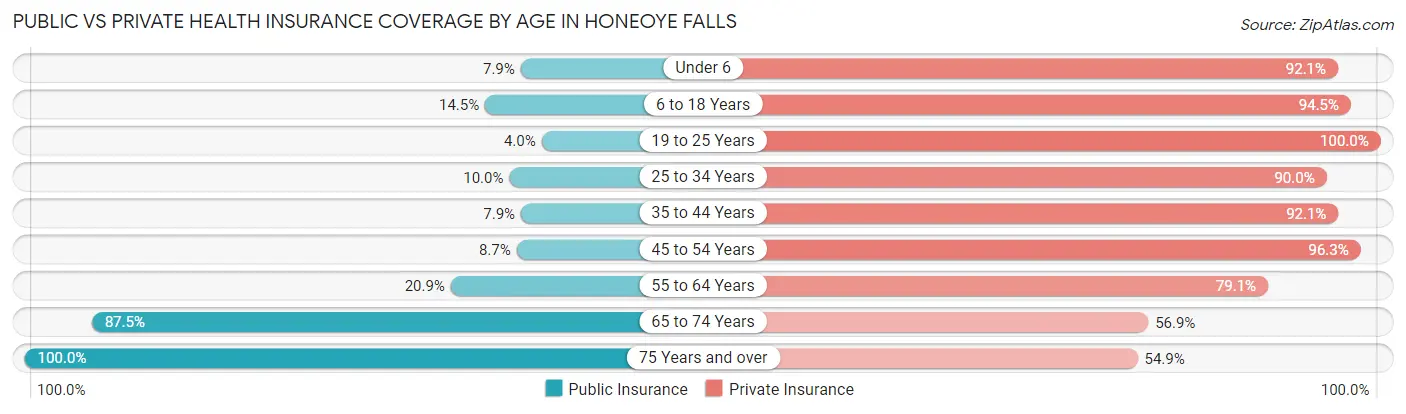
| Age Bracket | Public Insurance | Private Insurance |
| Under 6 | 18 (7.9%) | 209 (92.1%) |
| 6 to 18 Years | 50 (14.5%) | 325 (94.5%) |
| 19 to 25 Years | 11 (4.0%) | 272 (100.0%) |
| 25 to 34 Years | 23 (10.0%) | 206 (90.0%) |
| 35 to 44 Years | 30 (7.9%) | 351 (92.1%) |
| 45 to 54 Years | 21 (8.7%) | 233 (96.3%) |
| 55 to 64 Years | 83 (20.9%) | 314 (79.1%) |
| 65 to 74 Years | 274 (87.5%) | 178 (56.9%) |
| 75 Years and over | 357 (100.0%) | 196 (54.9%) |
| Total | 867 (31.4%) | 2,284 (82.7%) |
Disability Status by Sex by Age in Honeoye Falls
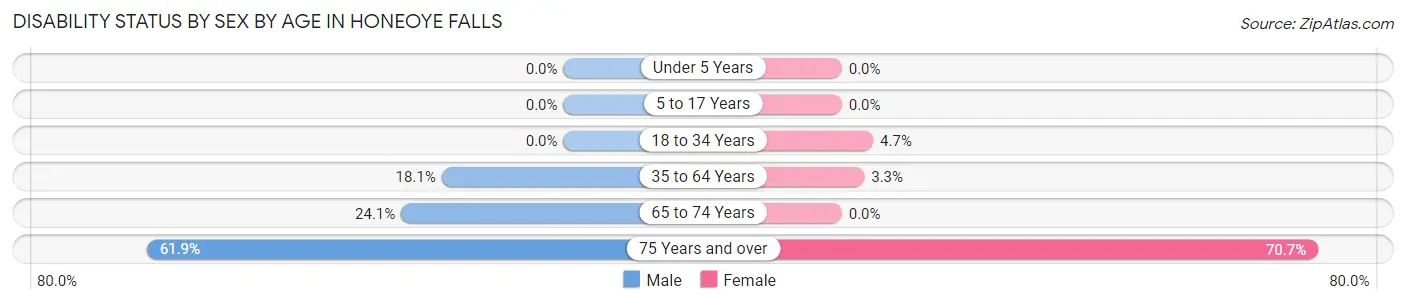
| Age Bracket | Male | Female |
| Under 5 Years | 0 (0.0%) | 0 (0.0%) |
| 5 to 17 Years | 0 (0.0%) | 0 (0.0%) |
| 18 to 34 Years | 0 (0.0%) | 9 (4.7%) |
| 35 to 64 Years | 87 (18.1%) | 18 (3.3%) |
| 65 to 74 Years | 33 (24.1%) | 0 (0.0%) |
| 75 Years and over | 73 (61.9%) | 169 (70.7%) |
Disability Class by Sex by Age in Honeoye Falls
Disability Class: Hearing Difficulty
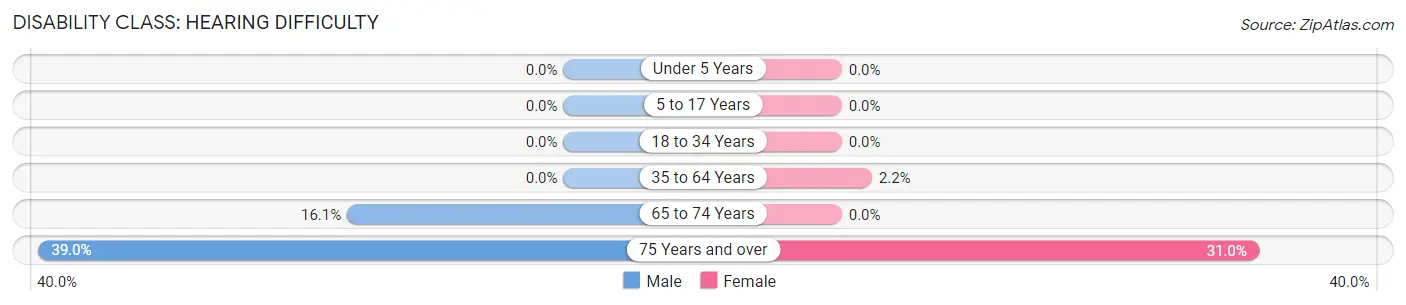
| Age Bracket | Male | Female |
| Under 5 Years | 0 (0.0%) | 0 (0.0%) |
| 5 to 17 Years | 0 (0.0%) | 0 (0.0%) |
| 18 to 34 Years | 0 (0.0%) | 0 (0.0%) |
| 35 to 64 Years | 0 (0.0%) | 12 (2.2%) |
| 65 to 74 Years | 22 (16.1%) | 0 (0.0%) |
| 75 Years and over | 46 (39.0%) | 74 (31.0%) |
Disability Class: Vision Difficulty
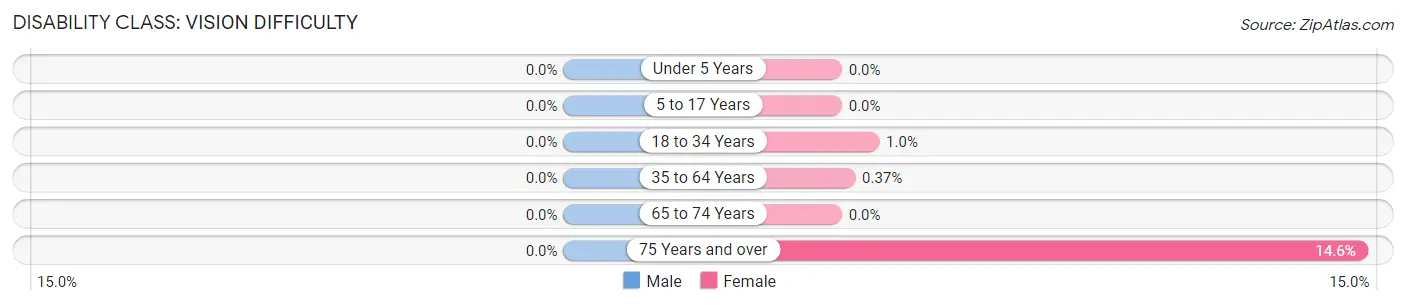
| Age Bracket | Male | Female |
| Under 5 Years | 0 (0.0%) | 0 (0.0%) |
| 5 to 17 Years | 0 (0.0%) | 0 (0.0%) |
| 18 to 34 Years | 0 (0.0%) | 2 (1.0%) |
| 35 to 64 Years | 0 (0.0%) | 2 (0.4%) |
| 65 to 74 Years | 0 (0.0%) | 0 (0.0%) |
| 75 Years and over | 0 (0.0%) | 35 (14.6%) |
Disability Class: Cognitive Difficulty
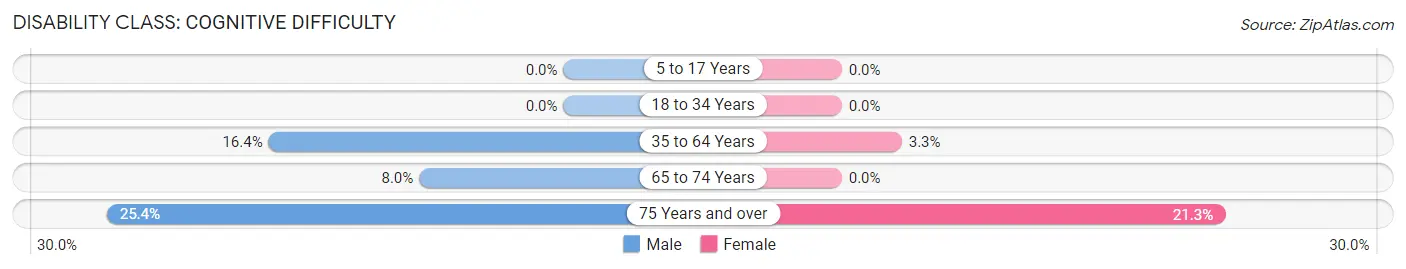
| Age Bracket | Male | Female |
| 5 to 17 Years | 0 (0.0%) | 0 (0.0%) |
| 18 to 34 Years | 0 (0.0%) | 0 (0.0%) |
| 35 to 64 Years | 79 (16.4%) | 18 (3.3%) |
| 65 to 74 Years | 11 (8.0%) | 0 (0.0%) |
| 75 Years and over | 30 (25.4%) | 51 (21.3%) |
Disability Class: Ambulatory Difficulty
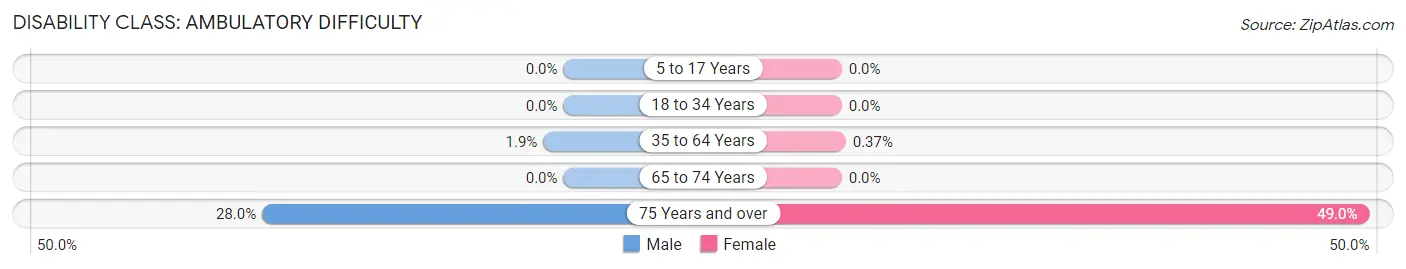
| Age Bracket | Male | Female |
| 5 to 17 Years | 0 (0.0%) | 0 (0.0%) |
| 18 to 34 Years | 0 (0.0%) | 0 (0.0%) |
| 35 to 64 Years | 9 (1.9%) | 2 (0.4%) |
| 65 to 74 Years | 0 (0.0%) | 0 (0.0%) |
| 75 Years and over | 33 (28.0%) | 117 (48.9%) |
Disability Class: Self-Care Difficulty
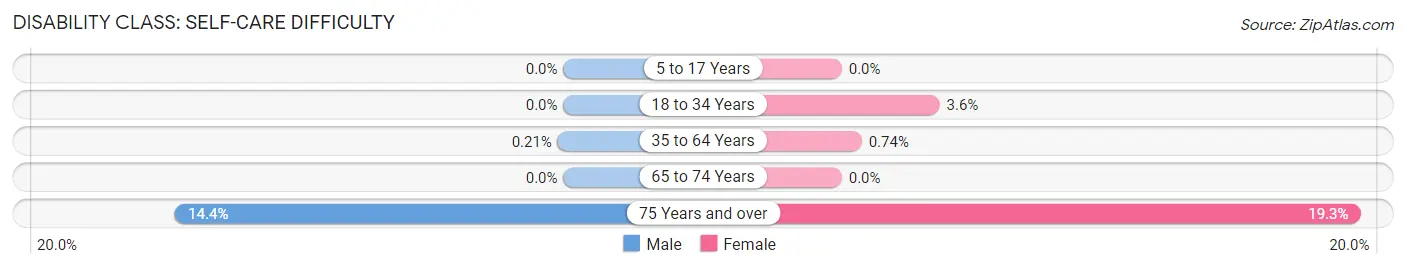
| Age Bracket | Male | Female |
| 5 to 17 Years | 0 (0.0%) | 0 (0.0%) |
| 18 to 34 Years | 0 (0.0%) | 7 (3.6%) |
| 35 to 64 Years | 1 (0.2%) | 4 (0.7%) |
| 65 to 74 Years | 0 (0.0%) | 0 (0.0%) |
| 75 Years and over | 17 (14.4%) | 46 (19.3%) |
Technology Access in Honeoye Falls
Computing Device Access in Honeoye Falls
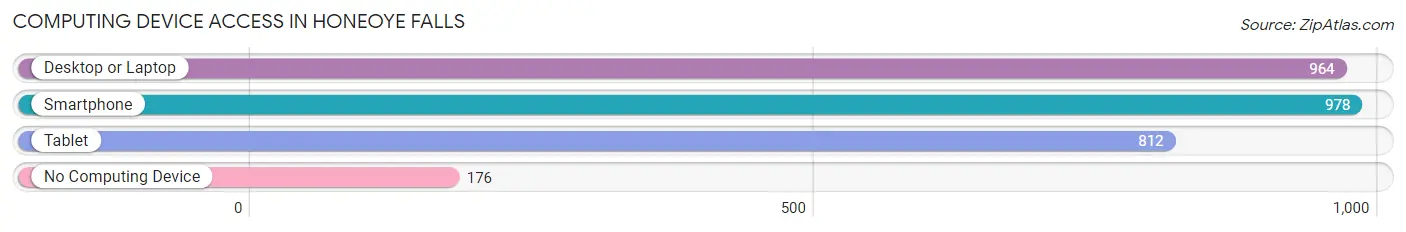
| Device Type | # Households | % Households |
| Desktop or Laptop | 964 | 77.0% |
| Smartphone | 978 | 78.1% |
| Tablet | 812 | 64.9% |
| No Computing Device | 176 | 14.1% |
| Total | 1,252 | 100.0% |
Internet Access in Honeoye Falls
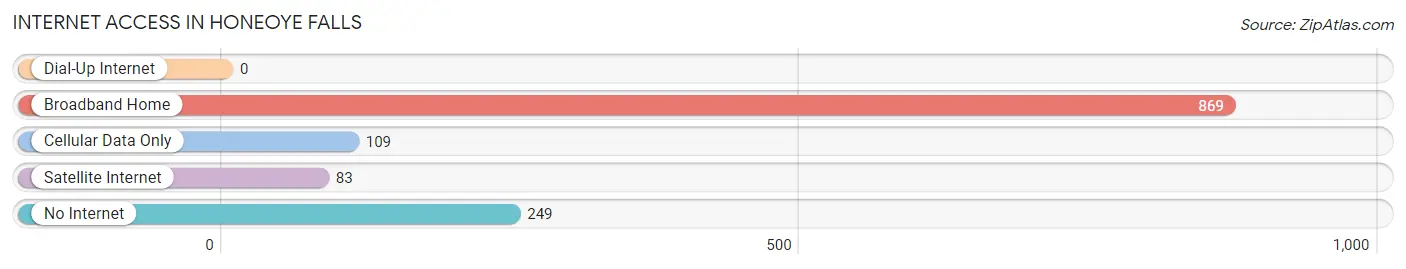
| Internet Type | # Households | % Households |
| Dial-Up Internet | 0 | 0.0% |
| Broadband Home | 869 | 69.4% |
| Cellular Data Only | 109 | 8.7% |
| Satellite Internet | 83 | 6.6% |
| No Internet | 249 | 19.9% |
| Total | 1,252 | 100.0% |
Honeoye Falls Summary
Honeoye Falls is a village located in the town of Mendon in Monroe County, New York. It is situated on the banks of Honeoye Creek, a tributary of the Genesee River. The village is located approximately 15 miles south of Rochester and is part of the Rochester Metropolitan Statistical Area. The population of Honeoye Falls was 2,674 at the 2010 census.
History
The area that is now Honeoye Falls was originally inhabited by the Seneca Nation of the Iroquois Confederacy. The first European settlers arrived in the area in the late 1700s. The village was founded in 1812 and was originally known as “Honeoye”. The name was changed to “Honeoye Falls” in 1826 to reflect the presence of a waterfall on the Honeoye Creek.
The village was an important stop on the Underground Railroad, with many escaped slaves passing through on their way to freedom in Canada. The village was also the site of a major battle during the War of 1812.
Geography
Honeoye Falls is located at 43°7′17″N 77°37′17″W (43.1214, -77.6213). According to the United States Census Bureau, the village has a total area of 1.2 square miles (3.1 km2), all of it land.
The village is located on the banks of Honeoye Creek, a tributary of the Genesee River. The creek is a popular spot for fishing and canoeing. The village is also home to a number of parks and trails, including the Honeoye Falls Trail, which follows the creek through the village.
Economy
Honeoye Falls is a small, rural village with a population of just over 2,600. The village is home to a number of small businesses, including restaurants, retail stores, and professional services. The village is also home to a number of manufacturing companies, including a paper mill, a plastics manufacturer, and a metal fabrication company.
The village is also home to a number of educational institutions, including Honeoye Falls-Lima High School, Honeoye Falls-Lima Middle School, and Honeoye Falls-Lima Elementary School.
Demographics
As of the 2010 census, there were 2,674 people, 1,072 households, and 717 families residing in the village. The population density was 2,213.3 people per square mile (854.7/km2). There were 1,133 housing units at an average density of 937.5 per square mile (362.3/km2). The racial makeup of the village was 97.2% White, 0.7% African American, 0.2% Native American, 0.7% Asian, 0.1% Pacific Islander, 0.3% from other races, and 0.9% from two or more races. Hispanic or Latino of any race were 1.2% of the population.
There were 1,072 households, out of which 33.2% had children under the age of 18 living with them, 53.2% were married couples living together, 10.2% had a female householder with no husband present, and 32.2% were non-families. 27.2% of all households were made up of individuals, and 11.2% had someone living alone who was 65 years of age or older. The average household size was 2.50 and the average family size was 3.06.
In the village, the population was spread out, with 25.7% under the age of 18, 6.2% from 18 to 24, 28.2% from 25 to 44, 25.2% from 45 to 64, and 14.7% who were 65 years of age or older. The median age was 39 years. For every 100 females, there were 93.2 males. For every 100 females age 18 and over, there were 89.2 males.
The median income for a household in the village was $50,938, and the median income for a family was $60,938. Males had a median income of $41,938 versus $30,938 for females. The per capita income for the village was $24,938. About 4.2% of families and 5.2% of the population were below the poverty line, including 6.2% of those under age 18 and 4.2% of those age 65 or over.
Common Questions
What is Per Capita Income in Honeoye Falls?
Per Capita income in Honeoye Falls is $42,806.
What is the Median Family Income in Honeoye Falls?
Median Family Income in Honeoye Falls is $121,406.
What is the Median Household income in Honeoye Falls?
Median Household Income in Honeoye Falls is $78,235.
What is Income or Wage Gap in Honeoye Falls?
Income or Wage Gap in Honeoye Falls is 42.2%.
Women in Honeoye Falls earn 57.8 cents for every dollar earned by a man.
What is Inequality or Gini Index in Honeoye Falls?
Inequality or Gini Index in Honeoye Falls is 0.40.
What is the Total Population of Honeoye Falls?
Total Population of Honeoye Falls is 2,774.
What is the Total Male Population of Honeoye Falls?
Total Male Population of Honeoye Falls is 1,439.
What is the Total Female Population of Honeoye Falls?
Total Female Population of Honeoye Falls is 1,335.
What is the Ratio of Males per 100 Females in Honeoye Falls?
There are 107.79 Males per 100 Females in Honeoye Falls.
What is the Ratio of Females per 100 Males in Honeoye Falls?
There are 92.77 Females per 100 Males in Honeoye Falls.
What is the Median Population Age in Honeoye Falls?
Median Population Age in Honeoye Falls is 40.3 Years.
What is the Average Family Size in Honeoye Falls
Average Family Size in Honeoye Falls is 3.0 People.
What is the Average Household Size in Honeoye Falls
Average Household Size in Honeoye Falls is 2.2 People.
How Large is the Labor Force in Honeoye Falls?
There are 1,494 People in the Labor Forcein in Honeoye Falls.
What is the Percentage of People in the Labor Force in Honeoye Falls?
63.0% of People are in the Labor Force in Honeoye Falls.
What is the Unemployment Rate in Honeoye Falls?
Unemployment Rate in Honeoye Falls is 10.1%.