Great Bend, NY Map & Demographics
Great Bend Map
Great Bend Overview
$19,332
PER CAPITA INCOME
0.59
INEQUALITY / GINI INDEX
1,208
TOTAL POPULATION
569
MALE POPULATION
639
FEMALE POPULATION
89.05
MALES / 100 FEMALES
112.30
FEMALES / 100 MALES
26.2
MEDIAN AGE
3.3
AVG FAMILY SIZE
3.5
AVG HOUSEHOLD SIZE
617
LABOR FORCE [ PEOPLE ]
71.2%
PERCENT IN LABOR FORCE
28.9%
UNEMPLOYMENT RATE
Great Bend Zip Codes
Great Bend Area Codes
Income in Great Bend
Income Overview in Great Bend
| Characteristic | Number | Measure |
| Per Capita Income | 1,208 | $19,332 |
| Median Family Income | 321 | $0 |
| Mean Family Income | 321 | $55,980 |
| Median Household Income | 347 | $0 |
| Mean Household Income | 347 | $57,323 |
| Income Deficit | 321 | $0 |
| Wage / Income Gap (%) | 1,208 | 0.00% |
| Wage / Income Gap ($) | 1,208 | 100.00¢ per $1 |
| Gini / Inequality Index | 1,208 | 0.59 |
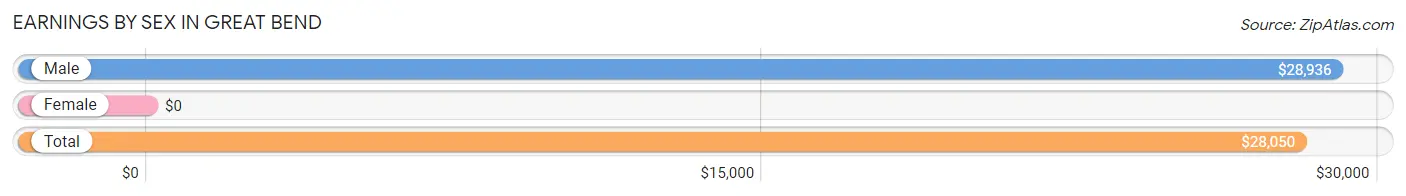
Earnings by Sex in Great Bend
| Sex | Number | Average Earnings |
| Male | 295 (49.6%) | $28,936 |
| Female | 300 (50.4%) | $0 |
| Total | 595 (100.0%) | $28,050 |
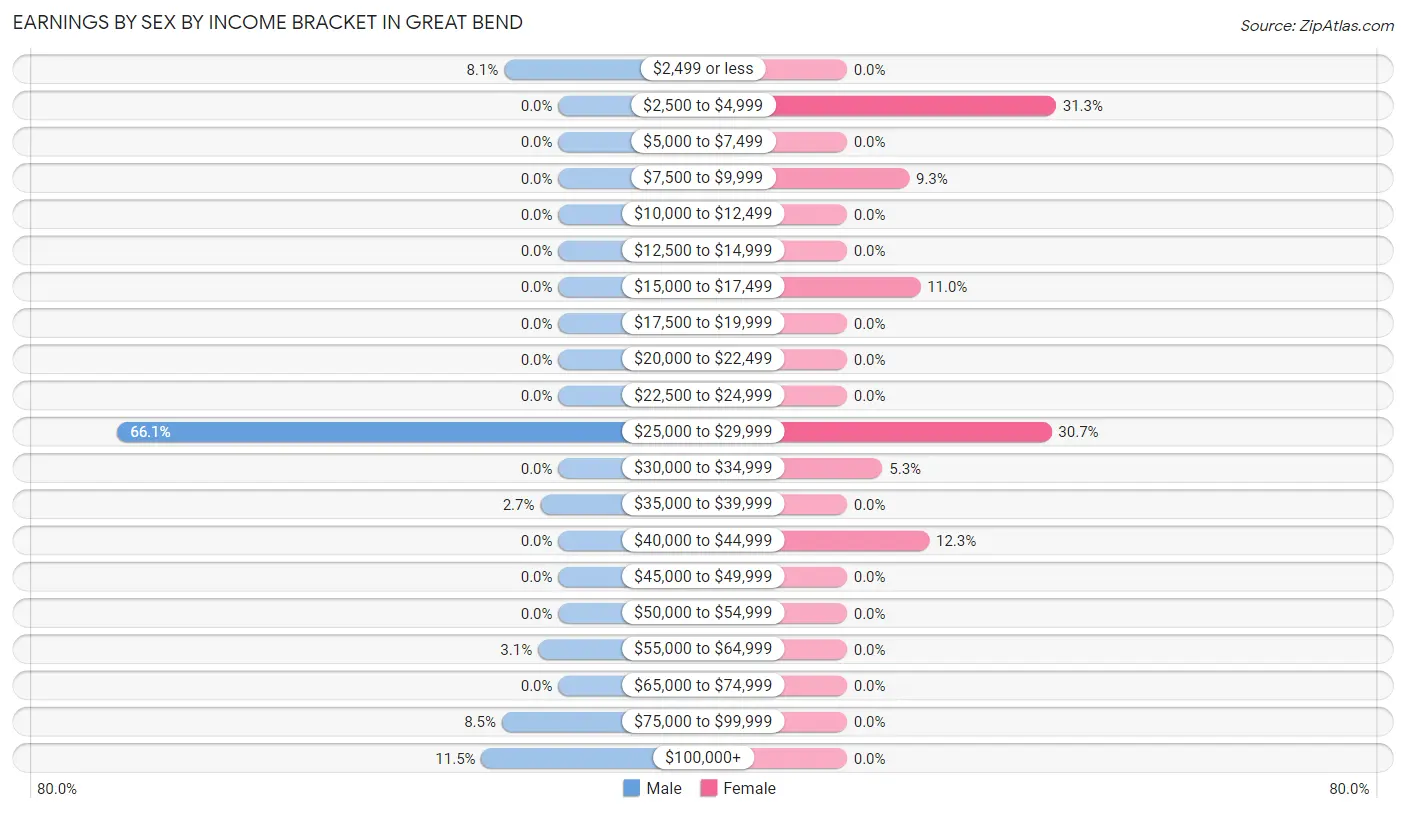
Earnings by Sex by Income Bracket in Great Bend
The most common earnings brackets in Great Bend are $25,000 to $29,999 for men (195 | 66.1%) and $2,500 to $4,999 for women (94 | 31.3%).
| Income | Male | Female |
| $2,499 or less | 24 (8.1%) | 0 (0.0%) |
| $2,500 to $4,999 | 0 (0.0%) | 94 (31.3%) |
| $5,000 to $7,499 | 0 (0.0%) | 0 (0.0%) |
| $7,500 to $9,999 | 0 (0.0%) | 28 (9.3%) |
| $10,000 to $12,499 | 0 (0.0%) | 0 (0.0%) |
| $12,500 to $14,999 | 0 (0.0%) | 0 (0.0%) |
| $15,000 to $17,499 | 0 (0.0%) | 33 (11.0%) |
| $17,500 to $19,999 | 0 (0.0%) | 0 (0.0%) |
| $20,000 to $22,499 | 0 (0.0%) | 0 (0.0%) |
| $22,500 to $24,999 | 0 (0.0%) | 0 (0.0%) |
| $25,000 to $29,999 | 195 (66.1%) | 92 (30.7%) |
| $30,000 to $34,999 | 0 (0.0%) | 16 (5.3%) |
| $35,000 to $39,999 | 8 (2.7%) | 0 (0.0%) |
| $40,000 to $44,999 | 0 (0.0%) | 37 (12.3%) |
| $45,000 to $49,999 | 0 (0.0%) | 0 (0.0%) |
| $50,000 to $54,999 | 0 (0.0%) | 0 (0.0%) |
| $55,000 to $64,999 | 9 (3.0%) | 0 (0.0%) |
| $65,000 to $74,999 | 0 (0.0%) | 0 (0.0%) |
| $75,000 to $99,999 | 25 (8.5%) | 0 (0.0%) |
| $100,000+ | 34 (11.5%) | 0 (0.0%) |
| Total | 295 (100.0%) | 300 (100.0%) |
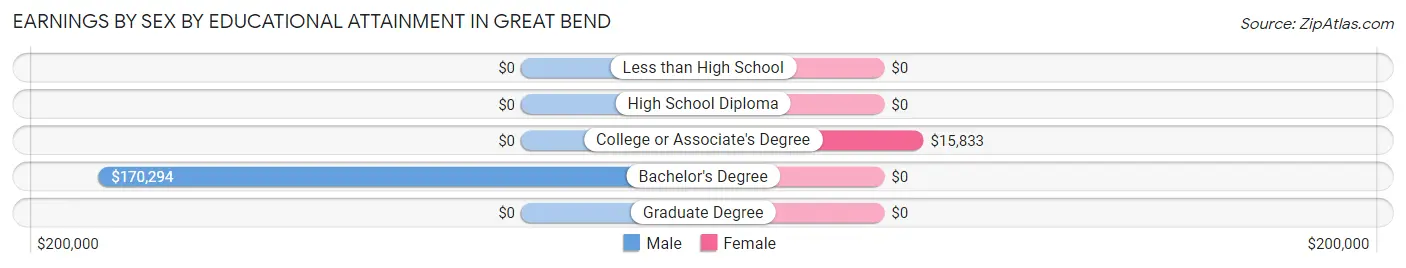
Earnings by Sex by Educational Attainment in Great Bend
| Educational Attainment | Male Income | Female Income |
| Less than High School | - | - |
| High School Diploma | - | - |
| College or Associate's Degree | - | - |
| Bachelor's Degree | $170,294 | $0 |
| Graduate Degree | - | - |
| Total | $78,542 | $0 |
Family Income in Great Bend
Family Income Brackets in Great Bend
According to the Great Bend family income data, there are 133 families falling into the less than $10,000 income range, which is the most common income bracket and makes up 41.4% of all families.
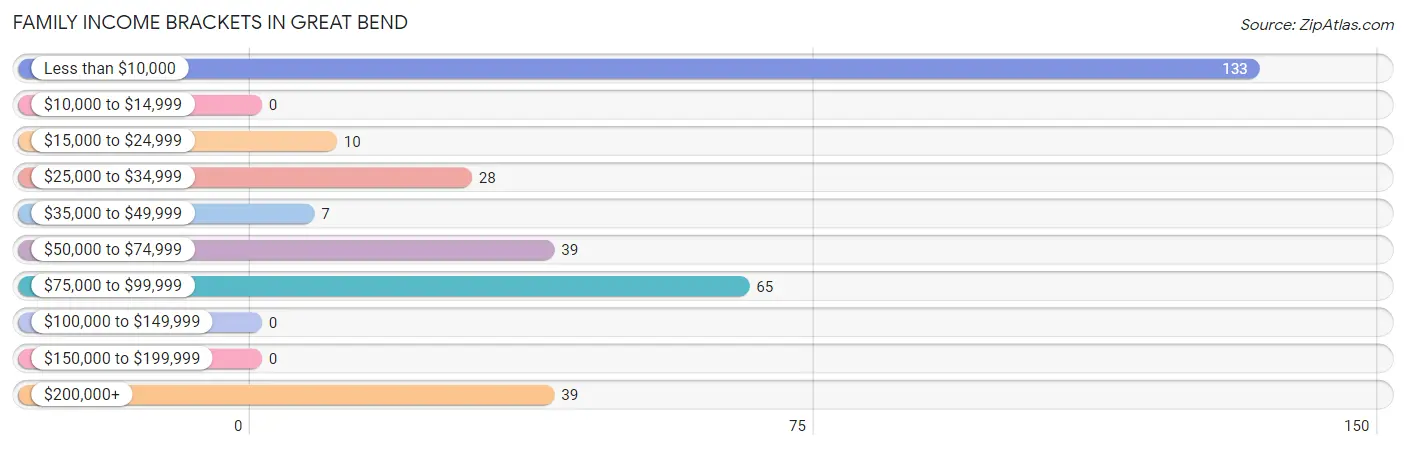
| Income Bracket | # Families | % Families |
| Less than $10,000 | 133 | 41.4% |
| $10,000 to $14,999 | 0 | 0.0% |
| $15,000 to $24,999 | 10 | 3.1% |
| $25,000 to $34,999 | 28 | 8.7% |
| $35,000 to $49,999 | 7 | 2.2% |
| $50,000 to $74,999 | 39 | 12.1% |
| $75,000 to $99,999 | 65 | 20.2% |
| $100,000 to $149,999 | 0 | 0.0% |
| $150,000 to $199,999 | 0 | 0.0% |
| $200,000+ | 39 | 12.1% |
Family Income by Famaliy Size in Great Bend
2-person families (149 | 46.4%) account for the highest median family income in Great Bend with $8,555 per family, while 2-person families (149 | 46.4%) have the highest median income of $4,278 per family member.
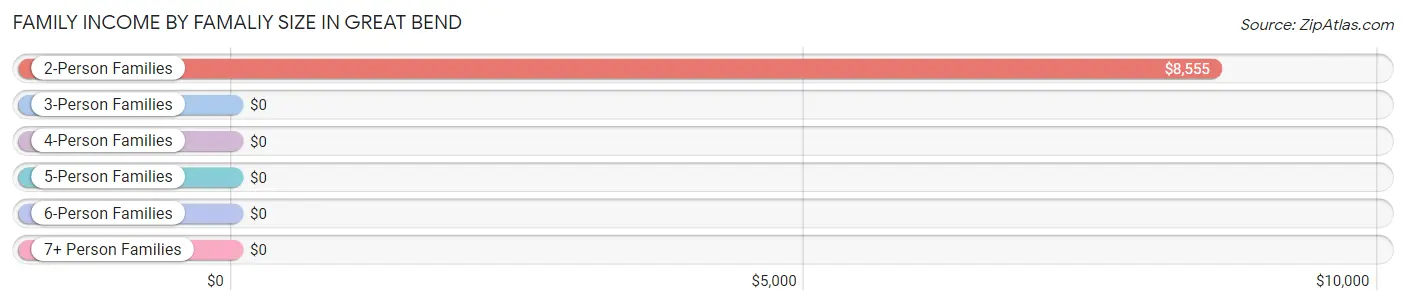
| Income Bracket | # Families | Median Income |
| 2-Person Families | 149 (46.4%) | $8,555 |
| 3-Person Families | 81 (25.2%) | $0 |
| 4-Person Families | 31 (9.7%) | $0 |
| 5-Person Families | 60 (18.7%) | $0 |
| 6-Person Families | 0 (0.0%) | $0 |
| 7+ Person Families | 0 (0.0%) | $0 |
| Total | 321 (100.0%) | $0 |
Family Income by Number of Earners in Great Bend
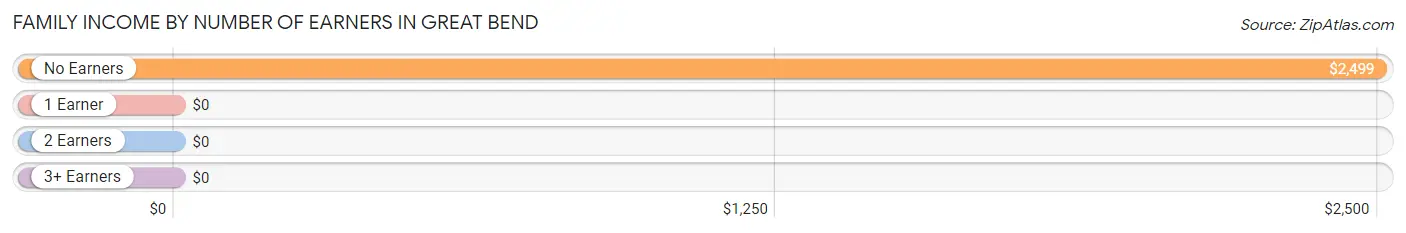
| Number of Earners | # Families | Median Income |
| No Earners | 73 (22.7%) | $2,499 |
| 1 Earner | 131 (40.8%) | $0 |
| 2 Earners | 50 (15.6%) | $0 |
| 3+ Earners | 67 (20.9%) | $0 |
| Total | 321 (100.0%) | $0 |
Household Income in Great Bend
Household Income Brackets in Great Bend
With 133 households falling in the category, the less than $10,000 income range is the most frequent in Great Bend, accounting for 38.3% of all households.
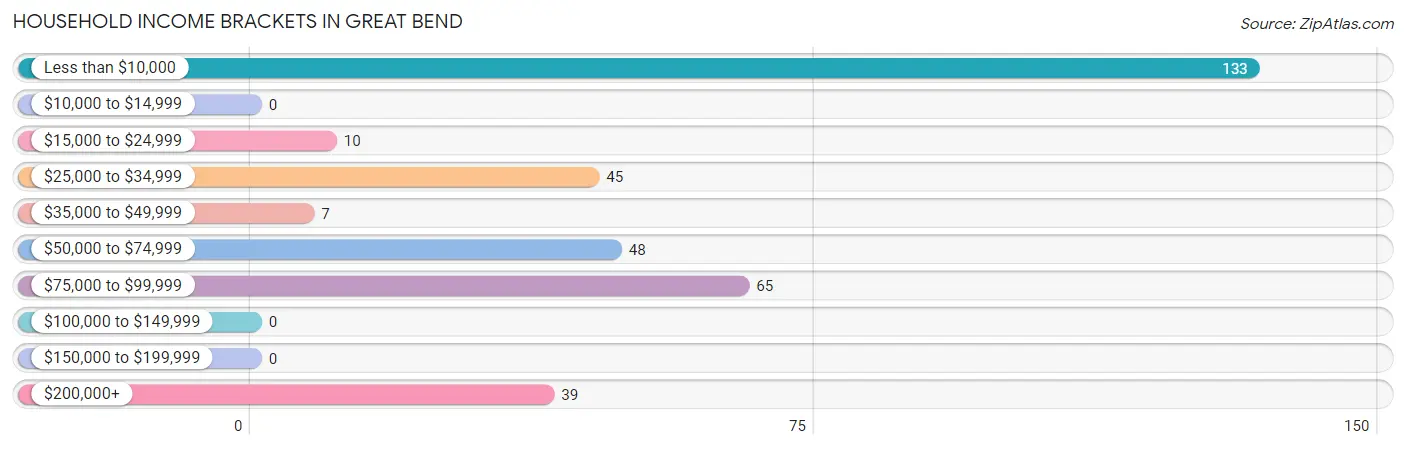
| Income Bracket | # Households | % Households |
| Less than $10,000 | 133 | 38.3% |
| $10,000 to $14,999 | 0 | 0.0% |
| $15,000 to $24,999 | 10 | 2.9% |
| $25,000 to $34,999 | 45 | 13.0% |
| $35,000 to $49,999 | 7 | 2.0% |
| $50,000 to $74,999 | 48 | 13.8% |
| $75,000 to $99,999 | 65 | 18.7% |
| $100,000 to $149,999 | 0 | 0.0% |
| $150,000 to $199,999 | 0 | 0.0% |
| $200,000+ | 39 | 11.2% |
Household Income by Householder Age in Great Bend
| Income Bracket | # Households | Median Income |
| 15 to 24 Years | 8 (2.3%) | $0 |
| 25 to 44 Years | 120 (34.6%) | $0 |
| 45 to 64 Years | 187 (53.9%) | $0 |
| 65+ Years | 32 (9.2%) | $0 |
| Total | 347 (100.0%) | $0 |
Poverty in Great Bend
Income Below Poverty by Sex and Age in Great Bend
With 16.7% poverty level for males and 34.4% for females among the residents of Great Bend, under 5 year old males and 6 to 11 year old females are the most vulnerable to poverty, with 13 males (100.0%) and 51 females (69.9%) in their respective age groups living below the poverty level.
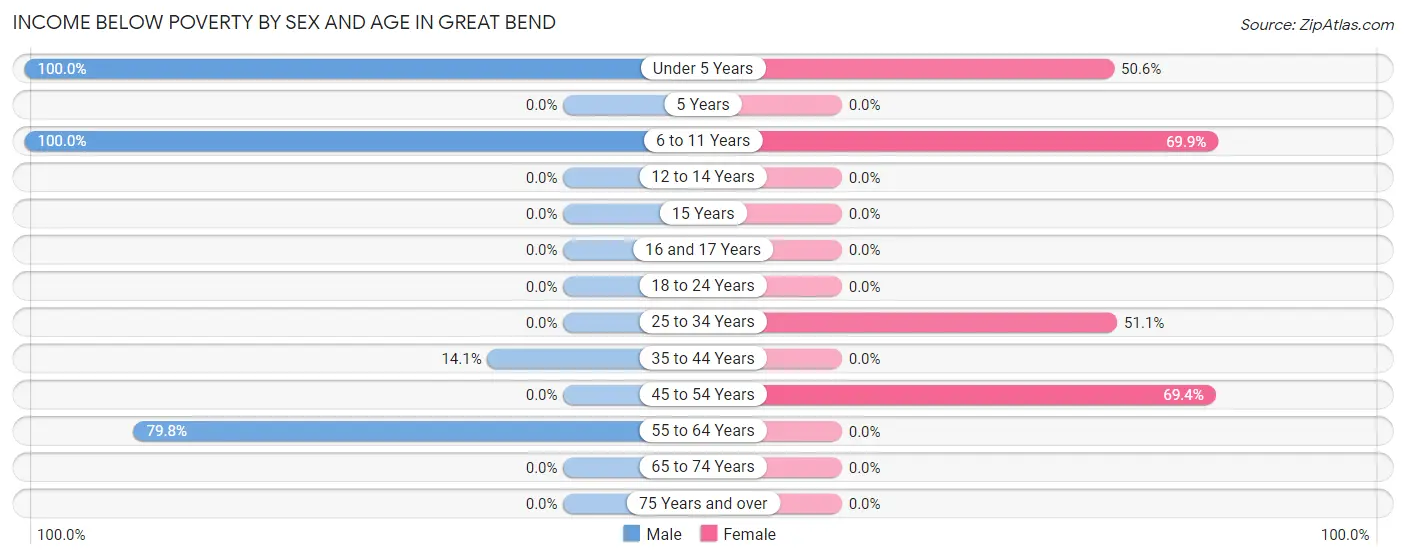
| Age Bracket | Male | Female |
| Under 5 Years | 13 (100.0%) | 46 (50.5%) |
| 5 Years | 0 (0.0%) | 0 (0.0%) |
| 6 to 11 Years | 9 (100.0%) | 51 (69.9%) |
| 12 to 14 Years | 0 (0.0%) | 0 (0.0%) |
| 15 Years | 0 (0.0%) | 0 (0.0%) |
| 16 and 17 Years | 0 (0.0%) | 0 (0.0%) |
| 18 to 24 Years | 0 (0.0%) | 0 (0.0%) |
| 25 to 34 Years | 0 (0.0%) | 46 (51.1%) |
| 35 to 44 Years | 10 (14.1%) | 0 (0.0%) |
| 45 to 54 Years | 0 (0.0%) | 77 (69.4%) |
| 55 to 64 Years | 63 (79.7%) | 0 (0.0%) |
| 65 to 74 Years | 0 (0.0%) | 0 (0.0%) |
| 75 Years and over | 0 (0.0%) | 0 (0.0%) |
| Total | 95 (16.7%) | 220 (34.4%) |
Income Above Poverty by Sex and Age in Great Bend
According to the poverty statistics in Great Bend, males aged 12 to 14 years and females aged 12 to 14 years are the age groups that are most secure financially, with 100.0% of males and 100.0% of females in these age groups living above the poverty line.
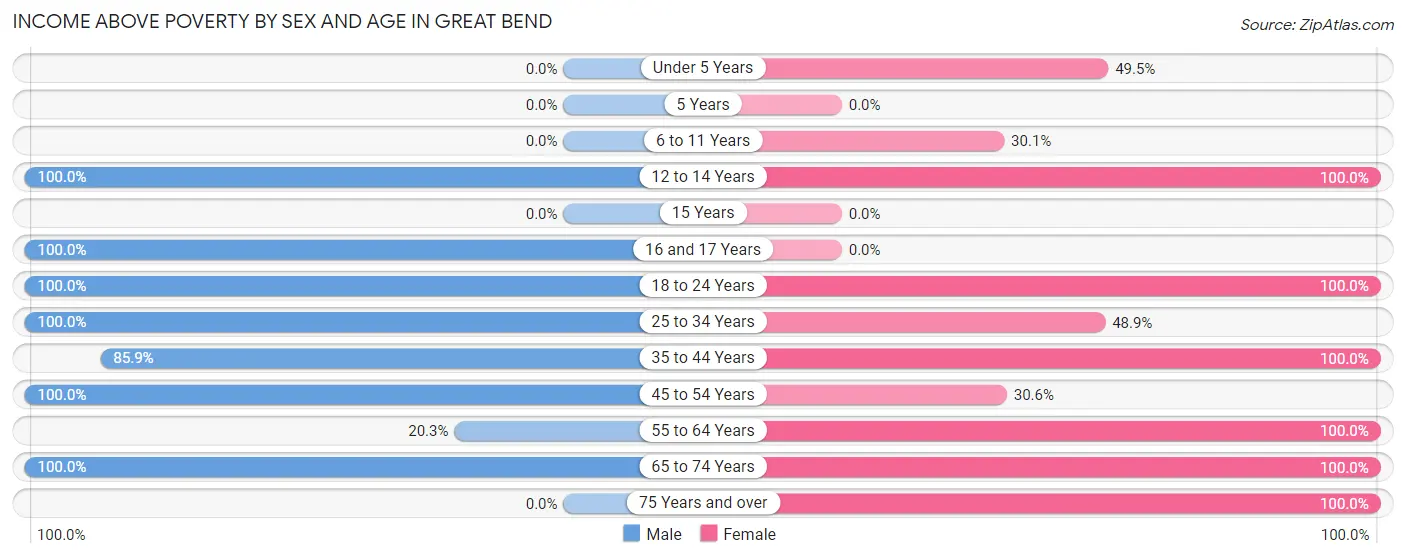
| Age Bracket | Male | Female |
| Under 5 Years | 0 (0.0%) | 45 (49.4%) |
| 5 Years | 0 (0.0%) | 0 (0.0%) |
| 6 to 11 Years | 0 (0.0%) | 22 (30.1%) |
| 12 to 14 Years | 120 (100.0%) | 36 (100.0%) |
| 15 Years | 0 (0.0%) | 0 (0.0%) |
| 16 and 17 Years | 24 (100.0%) | 0 (0.0%) |
| 18 to 24 Years | 168 (100.0%) | 64 (100.0%) |
| 25 to 34 Years | 8 (100.0%) | 44 (48.9%) |
| 35 to 44 Years | 61 (85.9%) | 83 (100.0%) |
| 45 to 54 Years | 67 (100.0%) | 34 (30.6%) |
| 55 to 64 Years | 16 (20.3%) | 28 (100.0%) |
| 65 to 74 Years | 10 (100.0%) | 22 (100.0%) |
| 75 Years and over | 0 (0.0%) | 41 (100.0%) |
| Total | 474 (83.3%) | 419 (65.6%) |
Income Below Poverty Among Married-Couple Families in Great Bend
| Children | Above Poverty | Below Poverty |
| No Children | 64 (100.0%) | 0 (0.0%) |
| 1 or 2 Children | 70 (100.0%) | 0 (0.0%) |
| 3 or 4 Children | 18 (100.0%) | 0 (0.0%) |
| 5 or more Children | 0 (0.0%) | 0 (0.0%) |
| Total | 152 (100.0%) | 0 (0.0%) |
Income Below Poverty Among Single-Parent Households in Great Bend
According to the poverty data in Great Bend, 100.0% or 10 single-father households and 77.4% or 123 single-mother households are living below the poverty line. Among single-father households, those with 1 or 2 children have the highest poverty rate, with 10 households (100.0%) experiencing poverty. Likewise, among single-mother households, those with 1 or 2 children have the highest poverty rate, with 123 households (79.9%) falling below the poverty line.
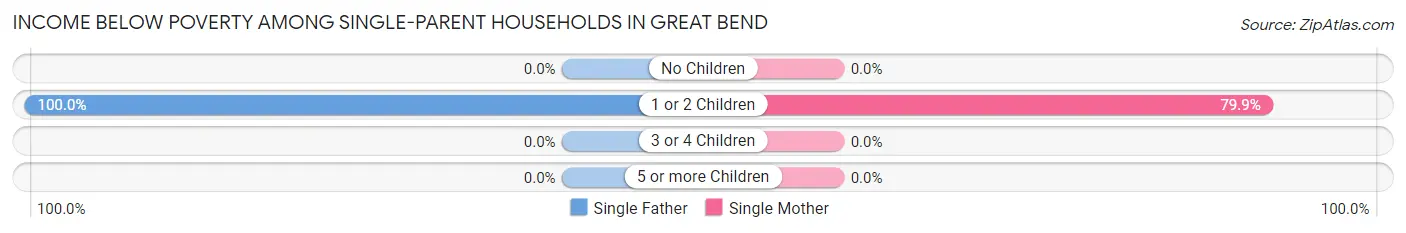
| Children | Single Father | Single Mother |
| No Children | 0 (0.0%) | 0 (0.0%) |
| 1 or 2 Children | 10 (100.0%) | 123 (79.9%) |
| 3 or 4 Children | 0 (0.0%) | 0 (0.0%) |
| 5 or more Children | 0 (0.0%) | 0 (0.0%) |
| Total | 10 (100.0%) | 123 (77.4%) |
Income Below Poverty Among Married-Couple vs Single-Parent Households in Great Bend
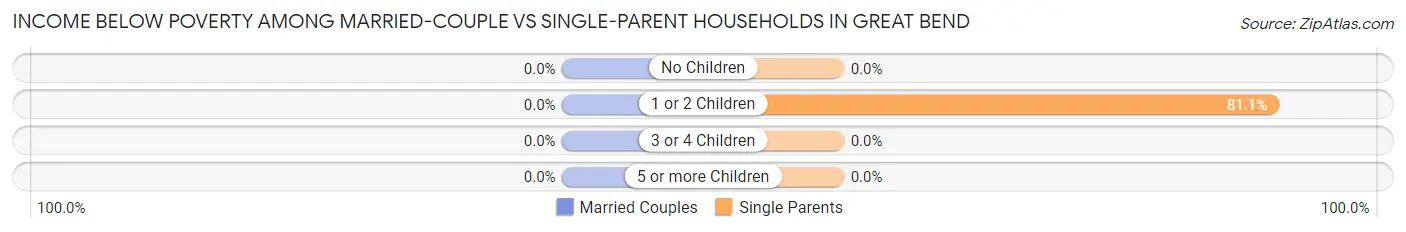
| Children | Married-Couple Families | Single-Parent Households |
| No Children | 0 (0.0%) | 0 (0.0%) |
| 1 or 2 Children | 0 (0.0%) | 133 (81.1%) |
| 3 or 4 Children | 0 (0.0%) | 0 (0.0%) |
| 5 or more Children | 0 (0.0%) | 0 (0.0%) |
| Total | 0 (0.0%) | 133 (78.7%) |
Race in Great Bend
The most populous races in Great Bend are White / Caucasian (1,175 | 97.3%), Asian (17 | 1.4%), and Two or more Races (16 | 1.3%).
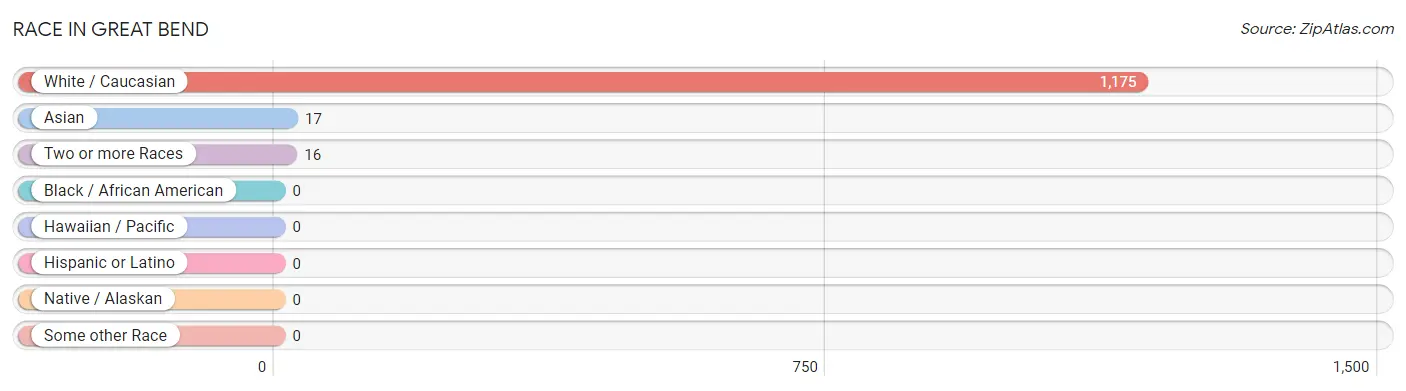
| Race | # Population | % Population |
| Asian | 17 | 1.4% |
| Black / African American | 0 | 0.0% |
| Hawaiian / Pacific | 0 | 0.0% |
| Hispanic or Latino | 0 | 0.0% |
| Native / Alaskan | 0 | 0.0% |
| White / Caucasian | 1,175 | 97.3% |
| Two or more Races | 16 | 1.3% |
| Some other Race | 0 | 0.0% |
| Total | 1,208 | 100.0% |
Ancestry in Great Bend
The most populous ancestries reported in Great Bend are Irish (265 | 21.9%), English (128 | 10.6%), Italian (27 | 2.2%), German (19 | 1.6%), and British (18 | 1.5%), together accounting for 37.8% of all Great Bend residents.
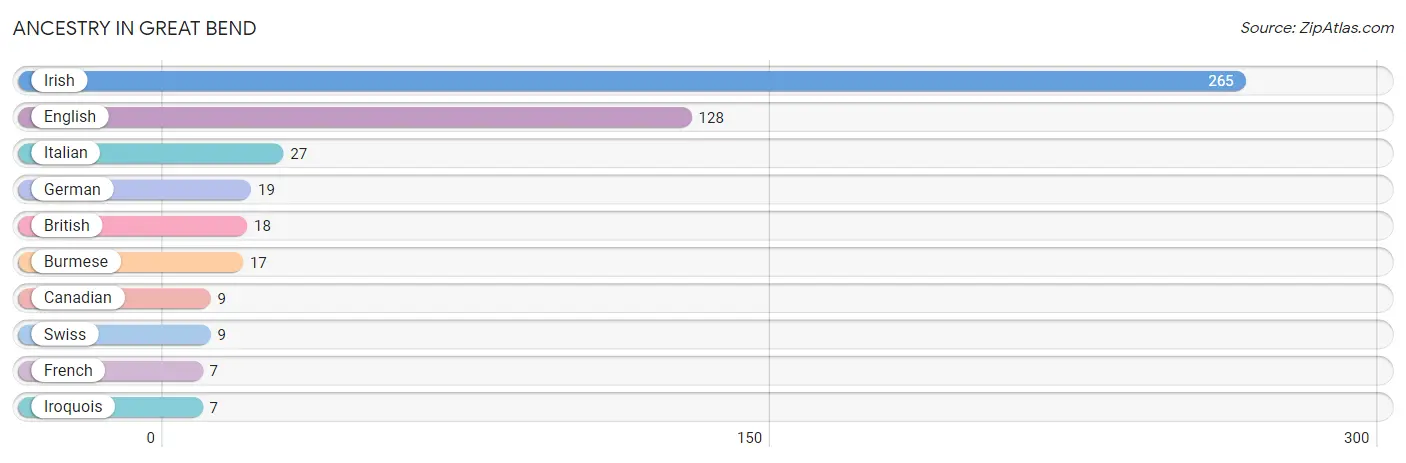
| Ancestry | # Population | % Population |
| British | 18 | 1.5% |
| Burmese | 17 | 1.4% |
| Canadian | 9 | 0.7% |
| English | 128 | 10.6% |
| French | 7 | 0.6% |
| German | 19 | 1.6% |
| Irish | 265 | 21.9% |
| Iroquois | 7 | 0.6% |
| Italian | 27 | 2.2% |
| Swiss | 9 | 0.7% | View All 10 Rows |
Immigrants in Great Bend
The most numerous immigrant groups reported in Great Bend came from Asia (17 | 1.4%), Eastern Asia (17 | 1.4%), and Korea (17 | 1.4%), together accounting for 4.2% of all Great Bend residents.
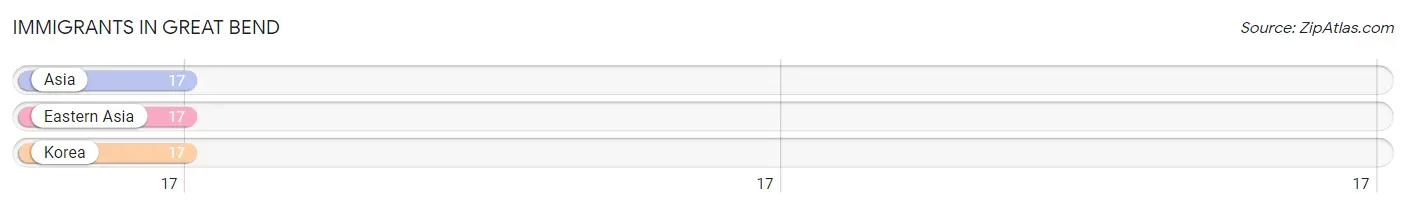
| Immigration Origin | # Population | % Population |
| Asia | 17 | 1.4% |
| Eastern Asia | 17 | 1.4% |
| Korea | 17 | 1.4% | View All 3 Rows |
Sex and Age in Great Bend
Sex and Age in Great Bend
The most populous age groups in Great Bend are 20 to 24 Years (168 | 29.5%) for men and Under 5 Years (91 | 14.2%) for women.
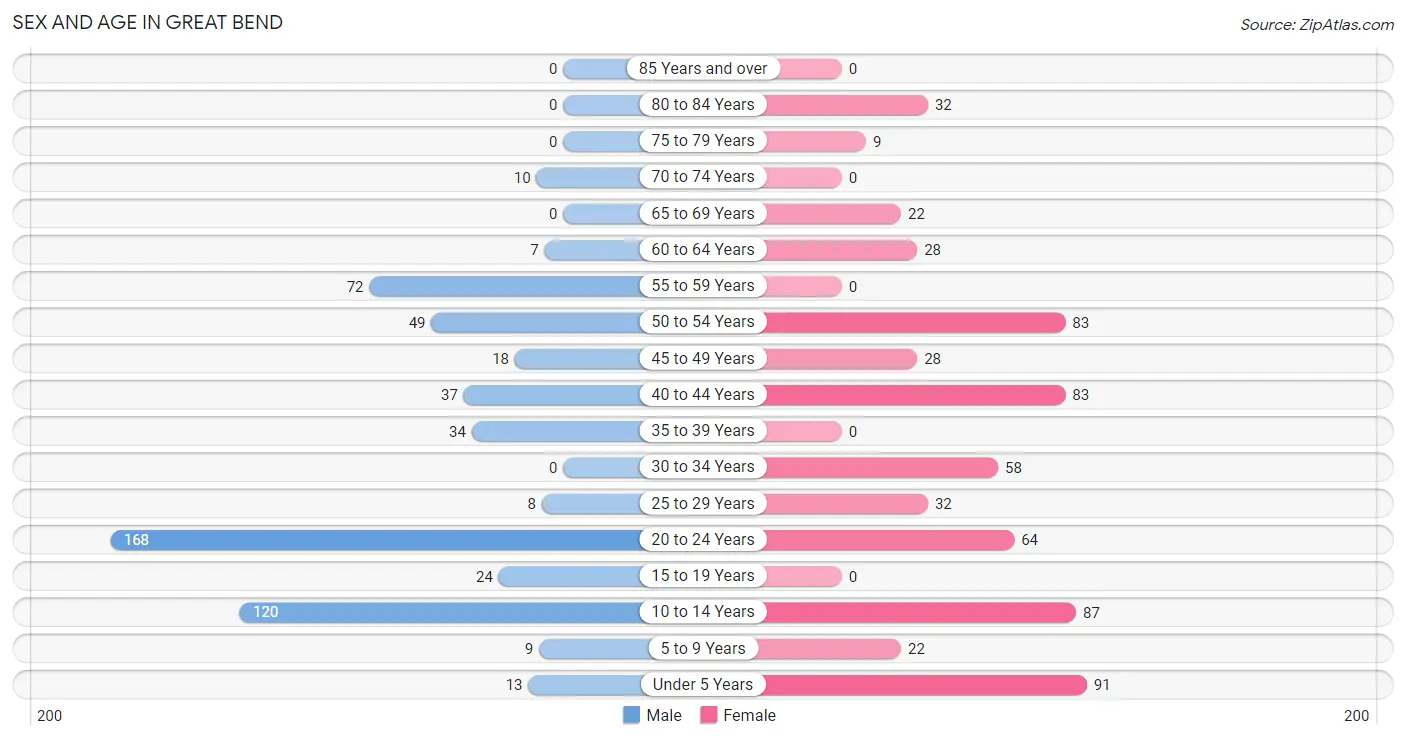
| Age Bracket | Male | Female |
| Under 5 Years | 13 (2.3%) | 91 (14.2%) |
| 5 to 9 Years | 9 (1.6%) | 22 (3.4%) |
| 10 to 14 Years | 120 (21.1%) | 87 (13.6%) |
| 15 to 19 Years | 24 (4.2%) | 0 (0.0%) |
| 20 to 24 Years | 168 (29.5%) | 64 (10.0%) |
| 25 to 29 Years | 8 (1.4%) | 32 (5.0%) |
| 30 to 34 Years | 0 (0.0%) | 58 (9.1%) |
| 35 to 39 Years | 34 (6.0%) | 0 (0.0%) |
| 40 to 44 Years | 37 (6.5%) | 83 (13.0%) |
| 45 to 49 Years | 18 (3.2%) | 28 (4.4%) |
| 50 to 54 Years | 49 (8.6%) | 83 (13.0%) |
| 55 to 59 Years | 72 (12.7%) | 0 (0.0%) |
| 60 to 64 Years | 7 (1.2%) | 28 (4.4%) |
| 65 to 69 Years | 0 (0.0%) | 22 (3.4%) |
| 70 to 74 Years | 10 (1.8%) | 0 (0.0%) |
| 75 to 79 Years | 0 (0.0%) | 9 (1.4%) |
| 80 to 84 Years | 0 (0.0%) | 32 (5.0%) |
| 85 Years and over | 0 (0.0%) | 0 (0.0%) |
| Total | 569 (100.0%) | 639 (100.0%) |
Families and Households in Great Bend
Median Family Size in Great Bend
The median family size in Great Bend is 3.34 persons per family, with married-couple families (152 | 47.3%) accounting for the largest median family size of 4.43 persons per family. On the other hand, single male/father families (10 | 3.1%) represent the smallest median family size with 1.90 persons per family.
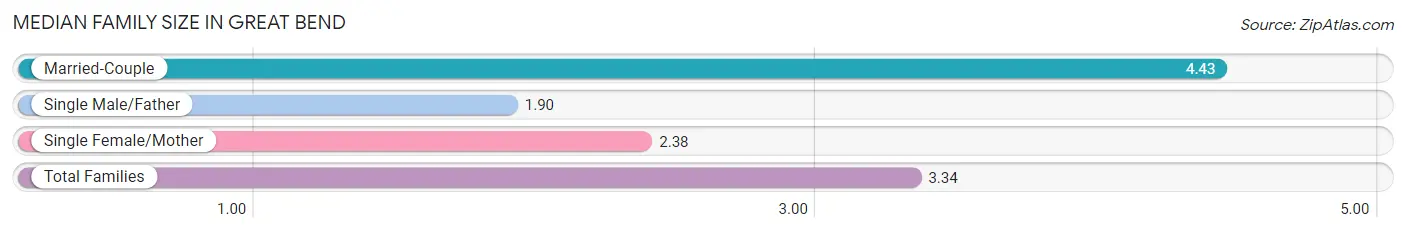
| Family Type | # Families | Family Size |
| Married-Couple | 152 (47.3%) | 4.43 |
| Single Male/Father | 10 (3.1%) | 1.90 |
| Single Female/Mother | 159 (49.5%) | 2.38 |
| Total Families | 321 (100.0%) | 3.34 |
Median Household Size in Great Bend
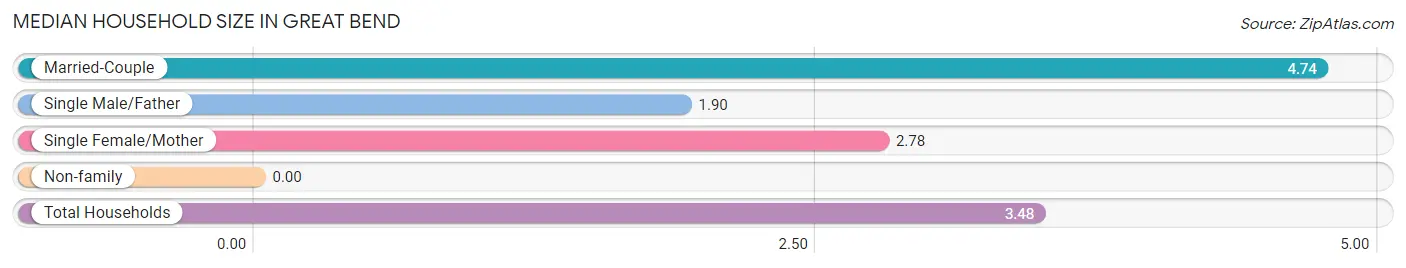
| Household Type | # Households | Household Size |
| Married-Couple | 152 (43.8%) | 4.74 |
| Single Male/Father | 10 (2.9%) | 1.90 |
| Single Female/Mother | 159 (45.8%) | 2.78 |
| Non-family | 26 (7.5%) | - |
| Total Households | 347 (100.0%) | 3.48 |
Household Size by Marriage Status in Great Bend
Out of a total of 347 households in Great Bend, 321 (92.5%) are family households, while 26 (7.5%) are nonfamily households. The most numerous type of family households are 3-person households, comprising 125, and the most common type of nonfamily households are 1-person households, comprising 26.
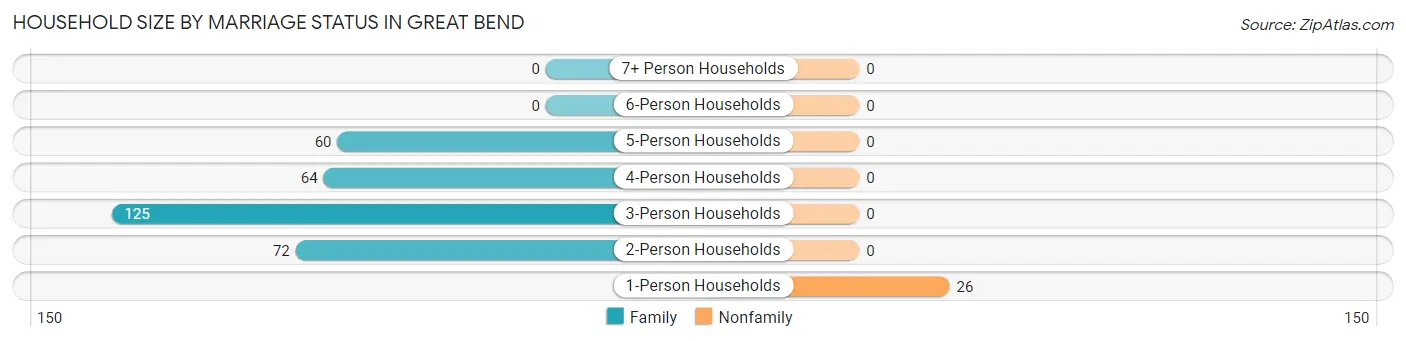
| Household Size | Family Households | Nonfamily Households |
| 1-Person Households | - | 26 (7.5%) |
| 2-Person Households | 72 (20.7%) | 0 (0.0%) |
| 3-Person Households | 125 (36.0%) | 0 (0.0%) |
| 4-Person Households | 64 (18.4%) | 0 (0.0%) |
| 5-Person Households | 60 (17.3%) | 0 (0.0%) |
| 6-Person Households | 0 (0.0%) | 0 (0.0%) |
| 7+ Person Households | 0 (0.0%) | 0 (0.0%) |
| Total | 321 (92.5%) | 26 (7.5%) |
Female Fertility in Great Bend
Fertility by Age in Great Bend
Average fertility rate in Great Bend is 219.0 births per 1,000 women. Women in the age bracket of 20 to 34 years have the highest fertility rate with 377.0 births per 1,000 women. Women in the age bracket of 20 to 34 years acount for 100.0% of all women with births.
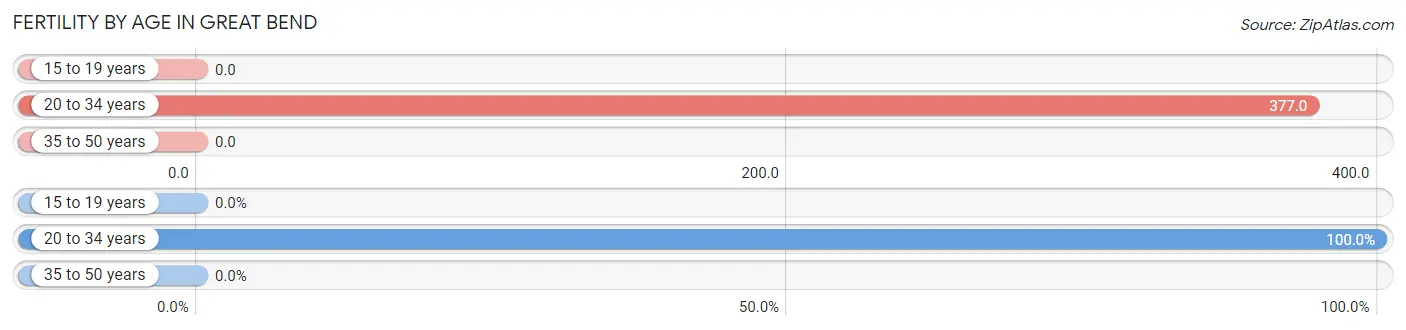
| Age Bracket | Women with Births | Births / 1,000 Women |
| 15 to 19 years | 0 (0.0%) | 0.0 |
| 20 to 34 years | 58 (100.0%) | 377.0 |
| 35 to 50 years | 0 (0.0%) | 0.0 |
| Total | 58 (100.0%) | 219.0 |
Fertility by Age by Marriage Status in Great Bend
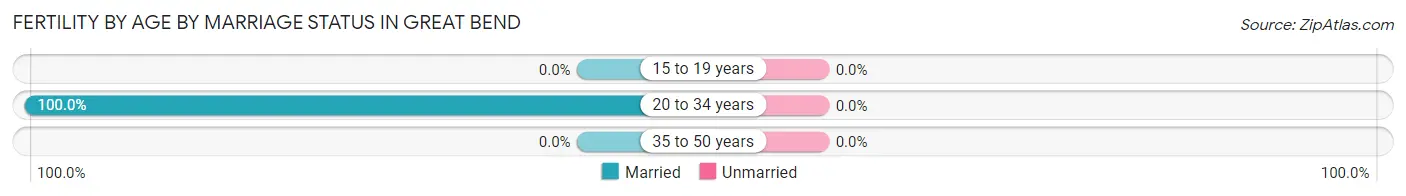
| Age Bracket | Married | Unmarried |
| 15 to 19 years | 0 (0.0%) | 0 (0.0%) |
| 20 to 34 years | 58 (100.0%) | 0 (0.0%) |
| 35 to 50 years | 0 (0.0%) | 0 (0.0%) |
| Total | 58 (100.0%) | 0 (0.0%) |
Fertility by Education in Great Bend
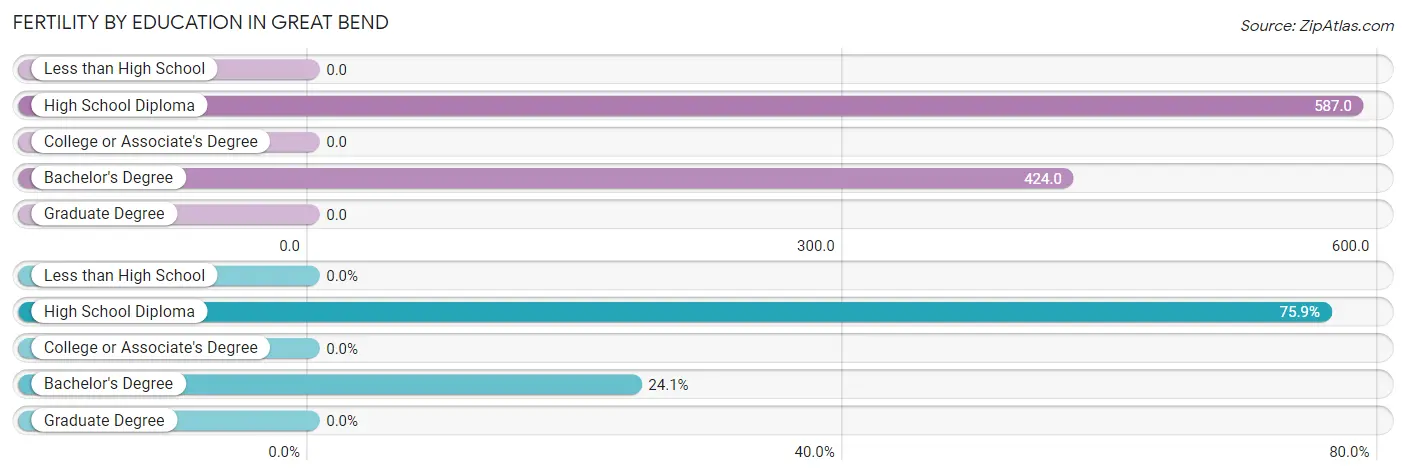
| Educational Attainment | Women with Births | Births / 1,000 Women |
| Less than High School | 0 (0.0%) | 0.0 |
| High School Diploma | 44 (75.9%) | 587.0 |
| College or Associate's Degree | 0 (0.0%) | 0.0 |
| Bachelor's Degree | 14 (24.1%) | 424.0 |
| Graduate Degree | 0 (0.0%) | 0.0 |
| Total | 58 (100.0%) | 219.0 |
Fertility by Education by Marriage Status in Great Bend
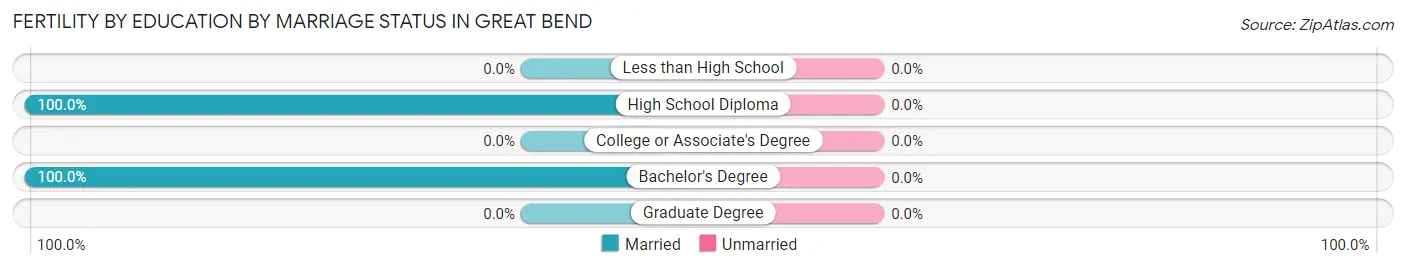
| Educational Attainment | Married | Unmarried |
| Less than High School | 0 (0.0%) | 0 (0.0%) |
| High School Diploma | 44 (100.0%) | 0 (0.0%) |
| College or Associate's Degree | 0 (0.0%) | 0 (0.0%) |
| Bachelor's Degree | 14 (100.0%) | 0 (0.0%) |
| Graduate Degree | 0 (0.0%) | 0 (0.0%) |
| Total | 58 (100.0%) | 0 (0.0%) |
Employment Characteristics in Great Bend
Employment by Class of Employer in Great Bend
Among the 446 employed individuals in Great Bend, private company employees (388 | 87.0%), and federal government employees (58 | 13.0%) make up the most common classes of employment.
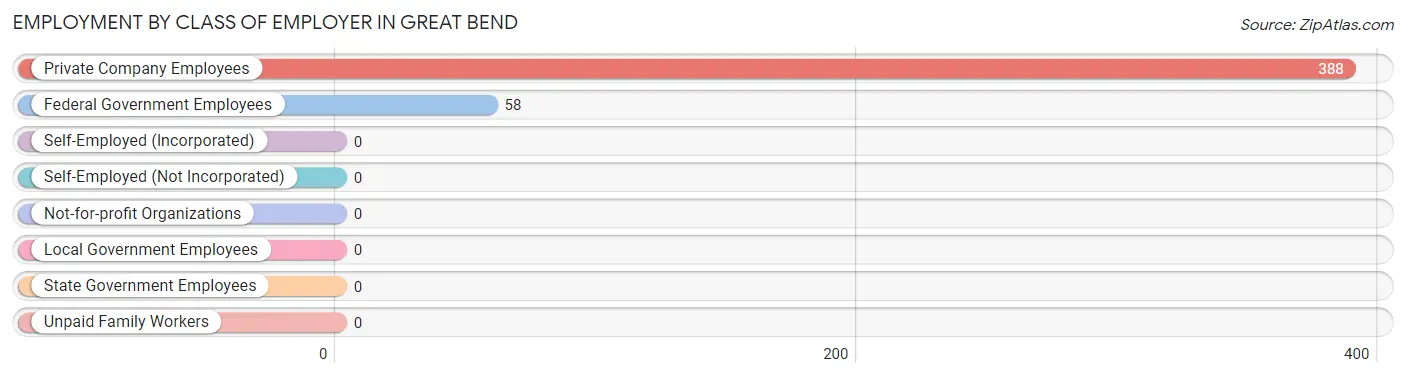
| Employer Class | # Employees | % Employees |
| Private Company Employees | 388 | 87.0% |
| Self-Employed (Incorporated) | 0 | 0.0% |
| Self-Employed (Not Incorporated) | 0 | 0.0% |
| Not-for-profit Organizations | 0 | 0.0% |
| Local Government Employees | 0 | 0.0% |
| State Government Employees | 0 | 0.0% |
| Federal Government Employees | 58 | 13.0% |
| Unpaid Family Workers | 0 | 0.0% |
| Total | 446 | 100.0% |
Employment Status by Age in Great Bend
According to the labor force statistics for Great Bend, out of the total population over 16 years of age (866), 71.2% or 617 individuals are in the labor force, with 28.9% or 178 of them unemployed. The age group with the highest labor force participation rate is 20 to 24 years, with 100.0% or 232 individuals in the labor force. Within the labor force, the 25 to 29 years age range has the highest percentage of unemployed individuals, with 100.0% or 8 of them being unemployed.
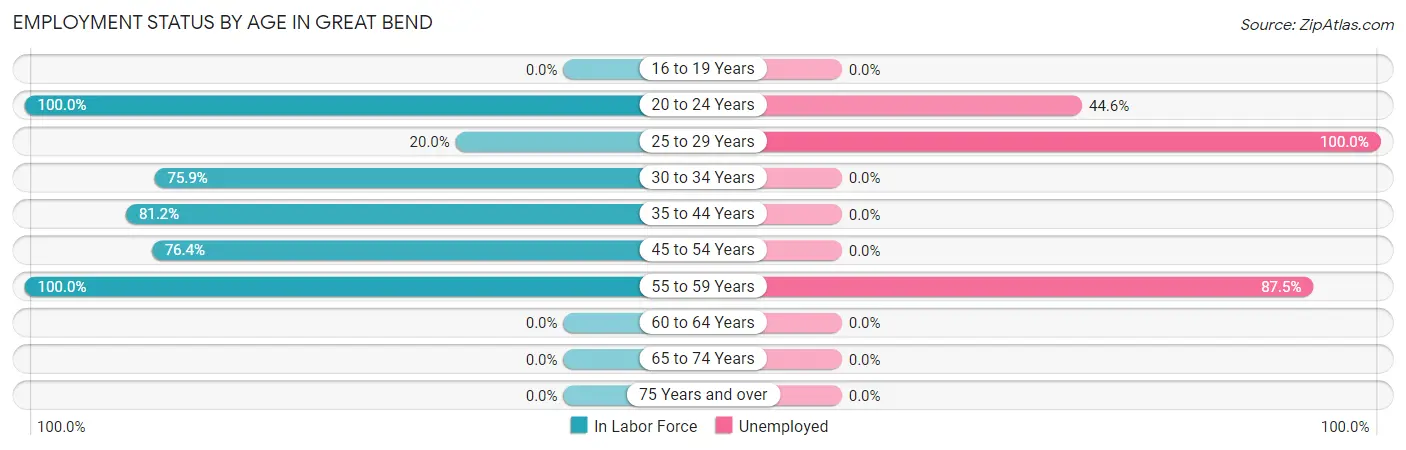
| Age Bracket | In Labor Force | Unemployed |
| 16 to 19 Years | 0 (0.0%) | 0 (0.0%) |
| 20 to 24 Years | 232 (100.0%) | 103 (44.6%) |
| 25 to 29 Years | 8 (20.0%) | 8 (100.0%) |
| 30 to 34 Years | 44 (75.9%) | 0 (0.0%) |
| 35 to 44 Years | 125 (81.2%) | 0 (0.0%) |
| 45 to 54 Years | 136 (76.4%) | 0 (0.0%) |
| 55 to 59 Years | 72 (100.0%) | 63 (87.5%) |
| 60 to 64 Years | 0 (0.0%) | 0 (0.0%) |
| 65 to 74 Years | 0 (0.0%) | 0 (0.0%) |
| 75 Years and over | 0 (0.0%) | 0 (0.0%) |
| Total | 617 (71.2%) | 178 (28.9%) |
Employment Status by Educational Attainment in Great Bend
According to labor force statistics for Great Bend, 71.7% of individuals (385) out of the total population between 25 and 64 years of age (537) are in the labor force, with 19.3% or 74 of them being unemployed. The group with the highest labor force participation rate are those with the educational attainment of less than high school, with 100.0% or 28 individuals in the labor force. Within the labor force, individuals with high school diploma education have the highest percentage of unemployment, with 26.0% or 63 of them being unemployed.
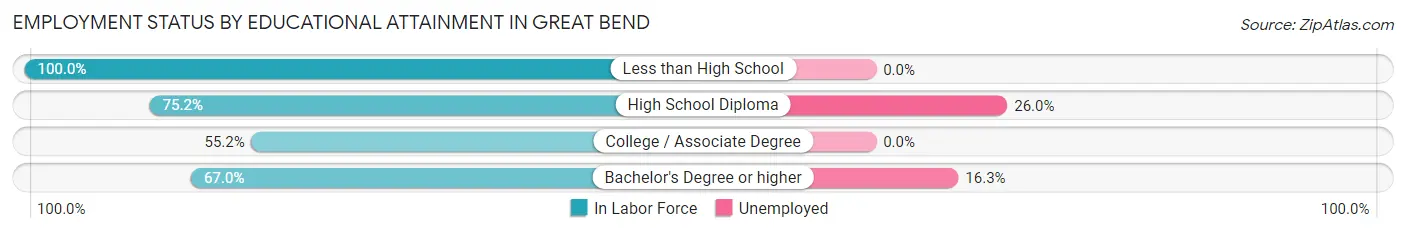
| Educational Attainment | In Labor Force | Unemployed |
| Less than High School | 28 (100.0%) | 0 (0.0%) |
| High School Diploma | 242 (75.2%) | 84 (26.0%) |
| College / Associate Degree | 48 (55.2%) | 0 (0.0%) |
| Bachelor's Degree or higher | 67 (67.0%) | 16 (16.3%) |
| Total | 385 (71.7%) | 104 (19.3%) |
Employment Occupations by Sex in Great Bend
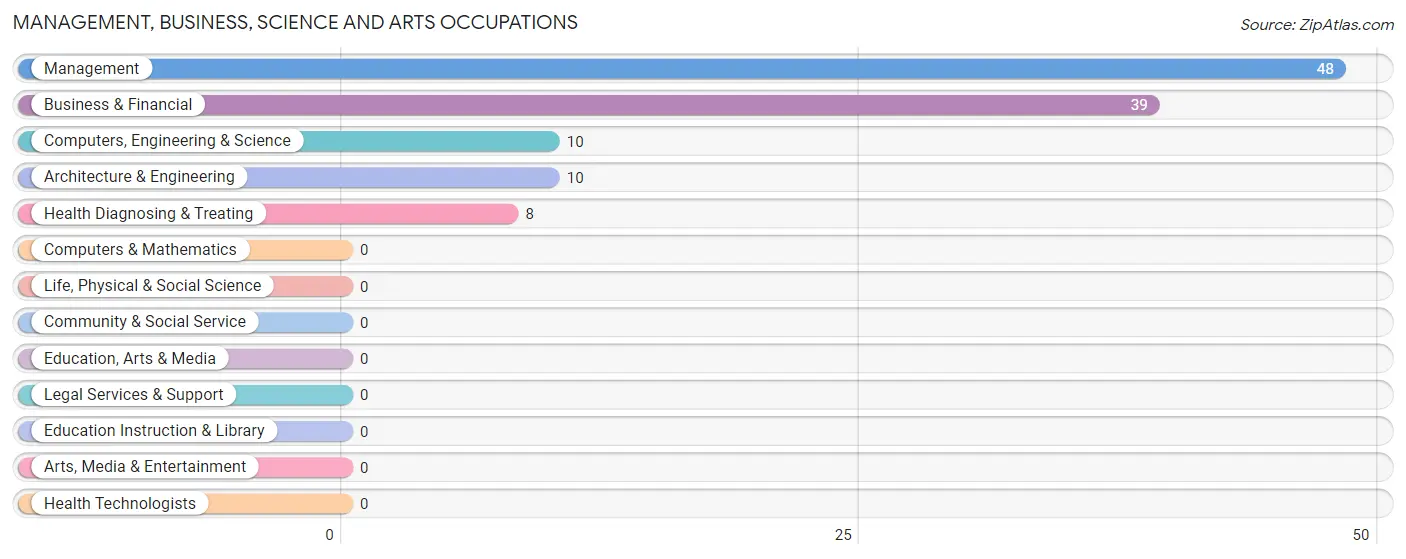
Management, Business, Science and Arts Occupations
The most common Management, Business, Science and Arts occupations in Great Bend are Management (48 | 11.4%), Business & Financial (39 | 9.3%), Computers, Engineering & Science (10 | 2.4%), Architecture & Engineering (10 | 2.4%), and Health Diagnosing & Treating (8 | 1.9%).
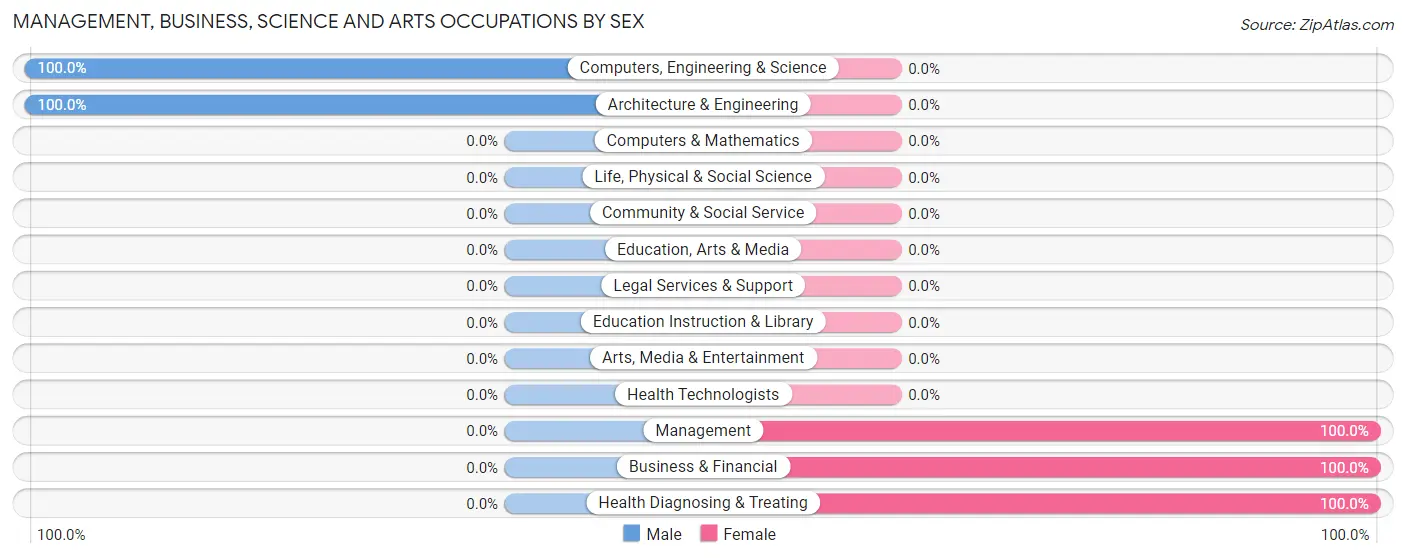
Management, Business, Science and Arts Occupations by Sex
Within the Management, Business, Science and Arts occupations in Great Bend, the most male-oriented occupations are Computers, Engineering & Science (100.0%), and Architecture & Engineering (100.0%), while the most female-oriented occupations are Management (100.0%), Business & Financial (100.0%), and Health Diagnosing & Treating (100.0%).
| Occupation | Male | Female |
| Management | 0 (0.0%) | 48 (100.0%) |
| Business & Financial | 0 (0.0%) | 39 (100.0%) |
| Computers, Engineering & Science | 10 (100.0%) | 0 (0.0%) |
| Computers & Mathematics | 0 (0.0%) | 0 (0.0%) |
| Architecture & Engineering | 10 (100.0%) | 0 (0.0%) |
| Life, Physical & Social Science | 0 (0.0%) | 0 (0.0%) |
| Community & Social Service | 0 (0.0%) | 0 (0.0%) |
| Education, Arts & Media | 0 (0.0%) | 0 (0.0%) |
| Legal Services & Support | 0 (0.0%) | 0 (0.0%) |
| Education Instruction & Library | 0 (0.0%) | 0 (0.0%) |
| Arts, Media & Entertainment | 0 (0.0%) | 0 (0.0%) |
| Health Diagnosing & Treating | 0 (0.0%) | 8 (100.0%) |
| Health Technologists | 0 (0.0%) | 0 (0.0%) |
| Total (Category) | 10 (9.5%) | 95 (90.5%) |
| Total (Overall) | 145 (34.5%) | 275 (65.5%) |
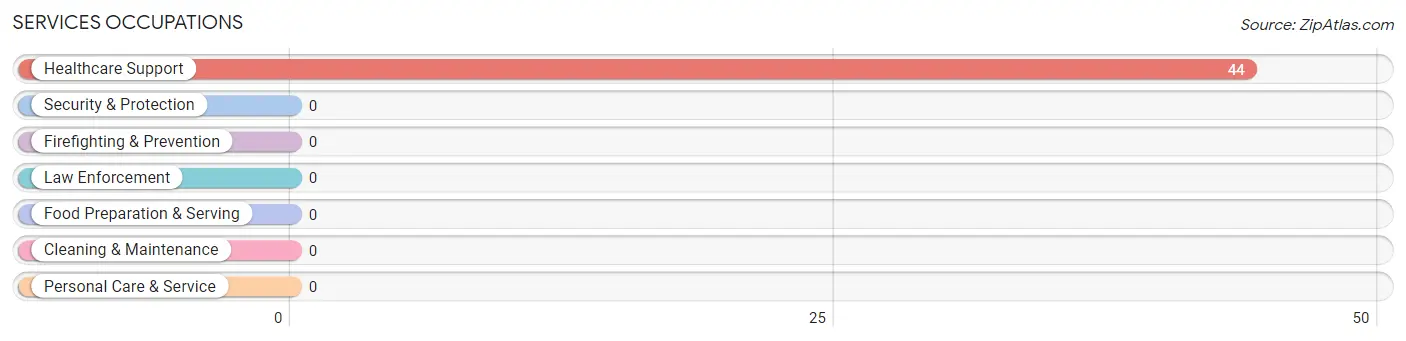
Services Occupations
The most common Services occupations in Great Bend are , and Healthcare Support (44 | 10.5%).
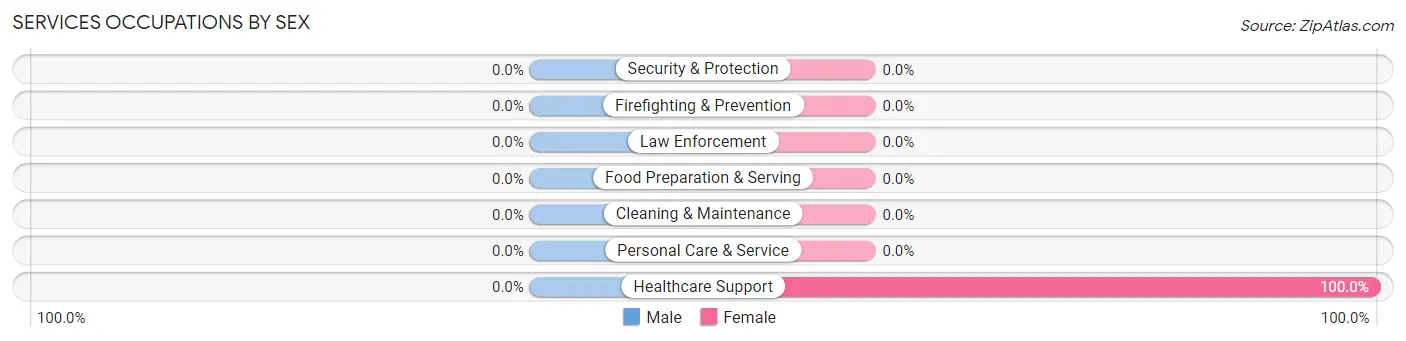
Services Occupations by Sex
| Occupation | Male | Female |
| Healthcare Support | 0 (0.0%) | 44 (100.0%) |
| Security & Protection | 0 (0.0%) | 0 (0.0%) |
| Firefighting & Prevention | 0 (0.0%) | 0 (0.0%) |
| Law Enforcement | 0 (0.0%) | 0 (0.0%) |
| Food Preparation & Serving | 0 (0.0%) | 0 (0.0%) |
| Cleaning & Maintenance | 0 (0.0%) | 0 (0.0%) |
| Personal Care & Service | 0 (0.0%) | 0 (0.0%) |
| Total (Category) | 0 (0.0%) | 44 (100.0%) |
| Total (Overall) | 145 (34.5%) | 275 (65.5%) |
Sales and Office Occupations
The most common Sales and Office occupations in Great Bend are , and Office & Administration (201 | 47.9%).
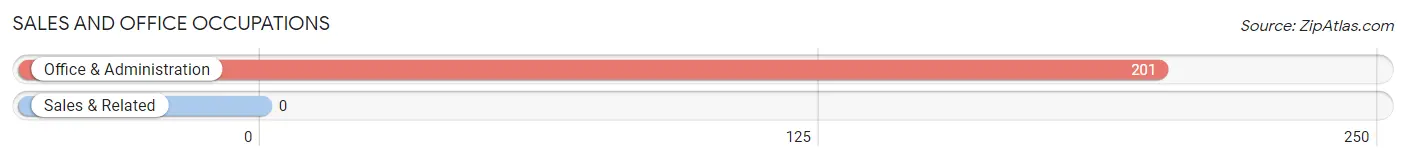
Sales and Office Occupations by Sex
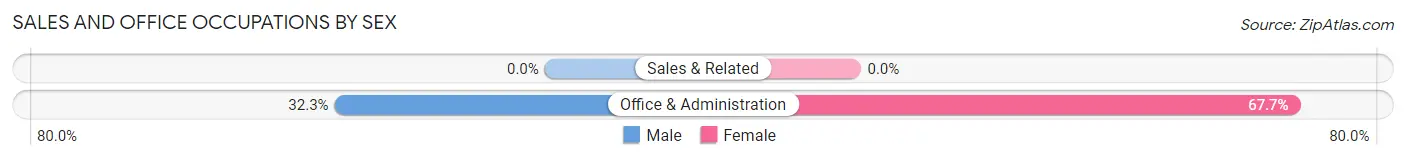
| Occupation | Male | Female |
| Sales & Related | 0 (0.0%) | 0 (0.0%) |
| Office & Administration | 65 (32.3%) | 136 (67.7%) |
| Total (Category) | 65 (32.3%) | 136 (67.7%) |
| Total (Overall) | 145 (34.5%) | 275 (65.5%) |
Natural Resources, Construction and Maintenance Occupations
The most common Natural Resources, Construction and Maintenance occupations in Great Bend are , and Construction & Extraction (43 | 10.2%).
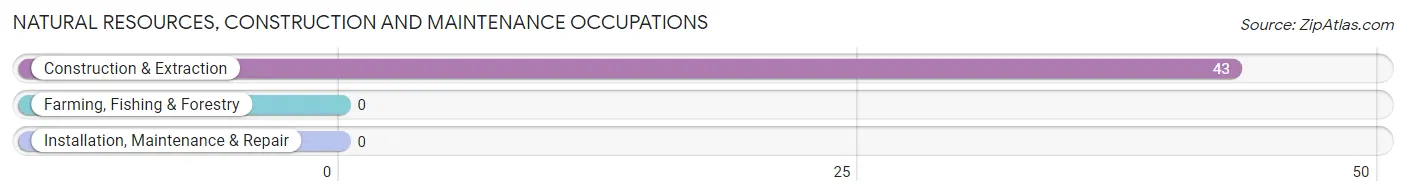
Natural Resources, Construction and Maintenance Occupations by Sex
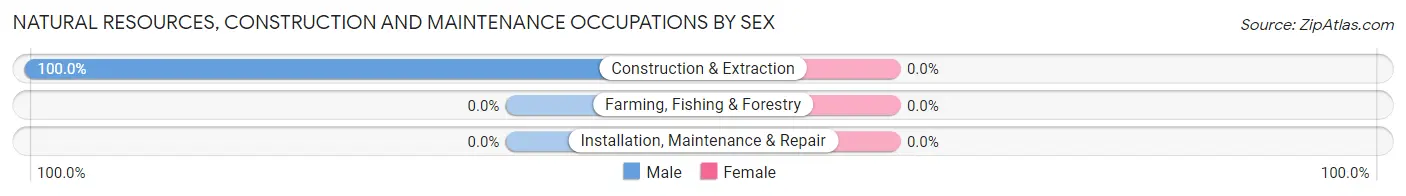
| Occupation | Male | Female |
| Farming, Fishing & Forestry | 0 (0.0%) | 0 (0.0%) |
| Construction & Extraction | 43 (100.0%) | 0 (0.0%) |
| Installation, Maintenance & Repair | 0 (0.0%) | 0 (0.0%) |
| Total (Category) | 43 (100.0%) | 0 (0.0%) |
| Total (Overall) | 145 (34.5%) | 275 (65.5%) |
Production, Transportation and Moving Occupations
The most common Production, Transportation and Moving occupations in Great Bend are , and Transportation (27 | 6.4%).
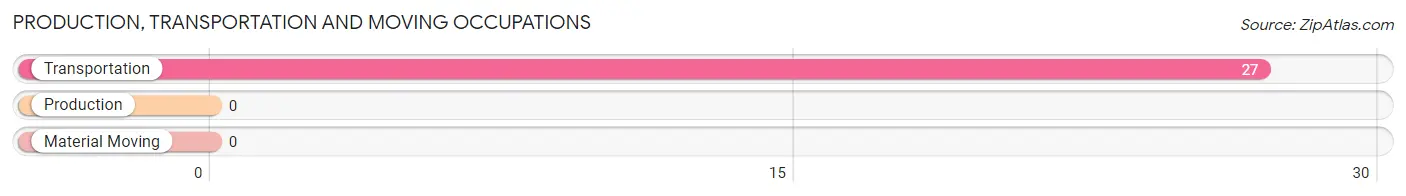
Production, Transportation and Moving Occupations by Sex
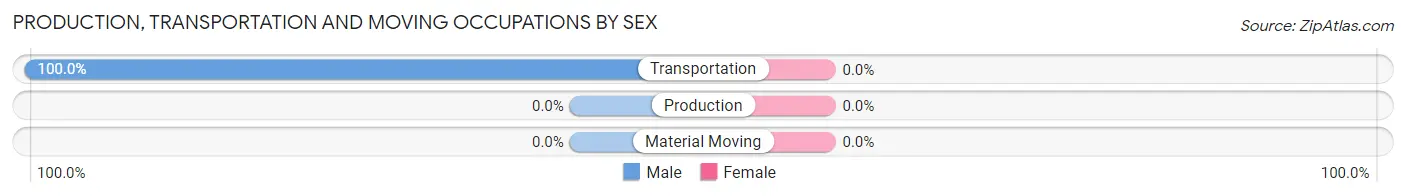
| Occupation | Male | Female |
| Production | 0 (0.0%) | 0 (0.0%) |
| Transportation | 27 (100.0%) | 0 (0.0%) |
| Material Moving | 0 (0.0%) | 0 (0.0%) |
| Total (Category) | 27 (100.0%) | 0 (0.0%) |
| Total (Overall) | 145 (34.5%) | 275 (65.5%) |
Employment Industries by Sex in Great Bend
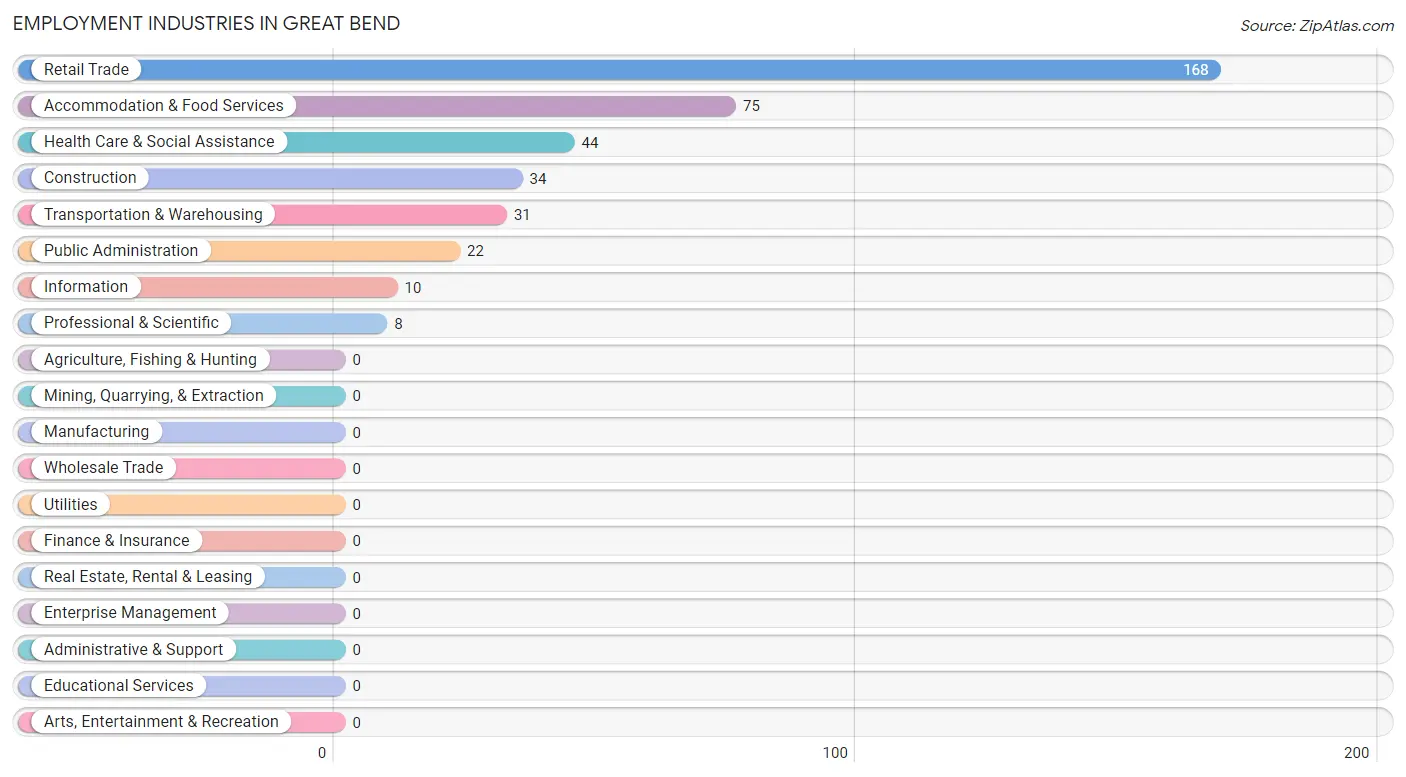
Employment Industries in Great Bend
The major employment industries in Great Bend include Retail Trade (168 | 40.0%), Accommodation & Food Services (75 | 17.9%), Health Care & Social Assistance (44 | 10.5%), Construction (34 | 8.1%), and Transportation & Warehousing (31 | 7.4%).
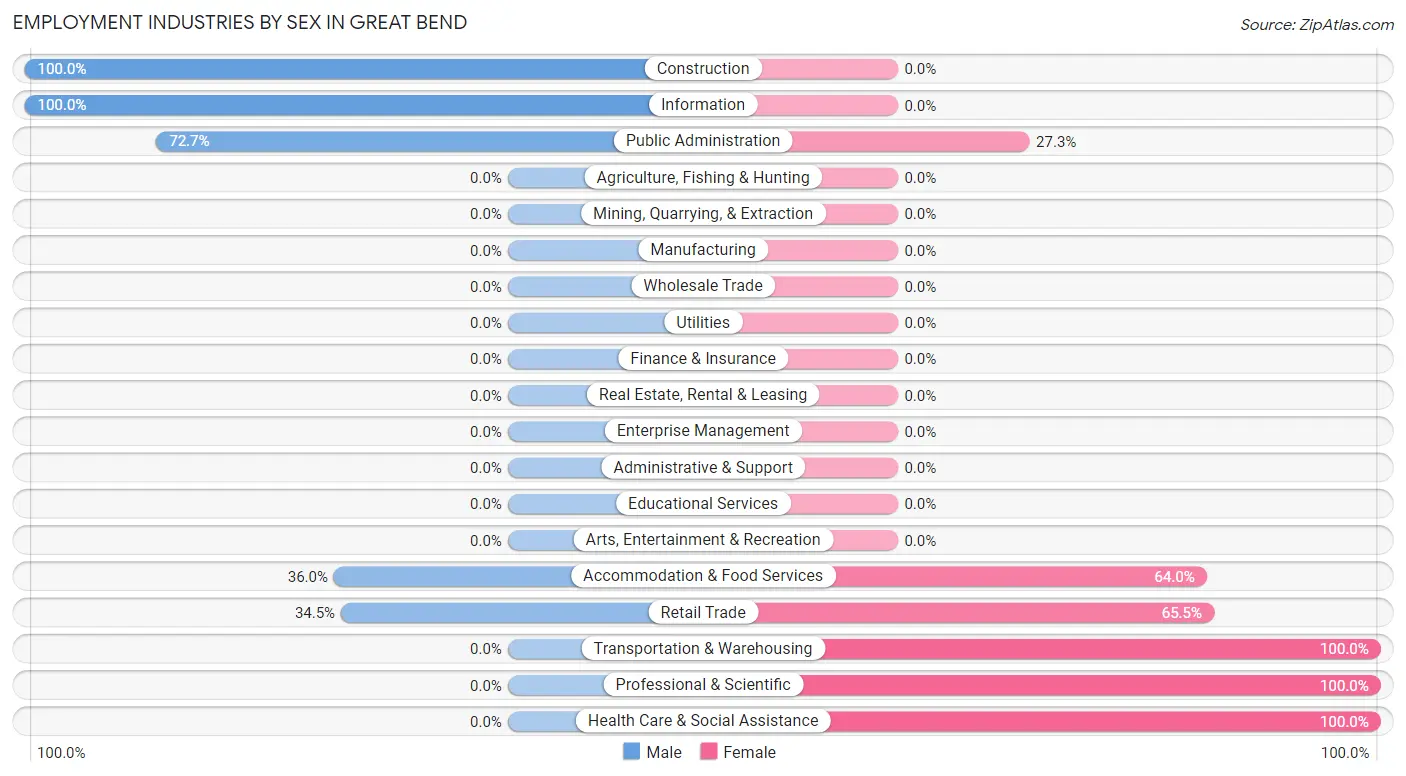
Employment Industries by Sex in Great Bend
The Great Bend industries that see more men than women are Construction (100.0%), Information (100.0%), and Public Administration (72.7%), whereas the industries that tend to have a higher number of women are Transportation & Warehousing (100.0%), Professional & Scientific (100.0%), and Health Care & Social Assistance (100.0%).
| Industry | Male | Female |
| Agriculture, Fishing & Hunting | 0 (0.0%) | 0 (0.0%) |
| Mining, Quarrying, & Extraction | 0 (0.0%) | 0 (0.0%) |
| Construction | 34 (100.0%) | 0 (0.0%) |
| Manufacturing | 0 (0.0%) | 0 (0.0%) |
| Wholesale Trade | 0 (0.0%) | 0 (0.0%) |
| Retail Trade | 58 (34.5%) | 110 (65.5%) |
| Transportation & Warehousing | 0 (0.0%) | 31 (100.0%) |
| Utilities | 0 (0.0%) | 0 (0.0%) |
| Information | 10 (100.0%) | 0 (0.0%) |
| Finance & Insurance | 0 (0.0%) | 0 (0.0%) |
| Real Estate, Rental & Leasing | 0 (0.0%) | 0 (0.0%) |
| Professional & Scientific | 0 (0.0%) | 8 (100.0%) |
| Enterprise Management | 0 (0.0%) | 0 (0.0%) |
| Administrative & Support | 0 (0.0%) | 0 (0.0%) |
| Educational Services | 0 (0.0%) | 0 (0.0%) |
| Health Care & Social Assistance | 0 (0.0%) | 44 (100.0%) |
| Arts, Entertainment & Recreation | 0 (0.0%) | 0 (0.0%) |
| Accommodation & Food Services | 27 (36.0%) | 48 (64.0%) |
| Public Administration | 16 (72.7%) | 6 (27.3%) |
| Total | 145 (34.5%) | 275 (65.5%) |
Education in Great Bend
School Enrollment in Great Bend
The most common levels of schooling among the 317 students in Great Bend are middle school (112 | 35.3%), elementary school (73 | 23.0%), and high school (68 | 21.4%).
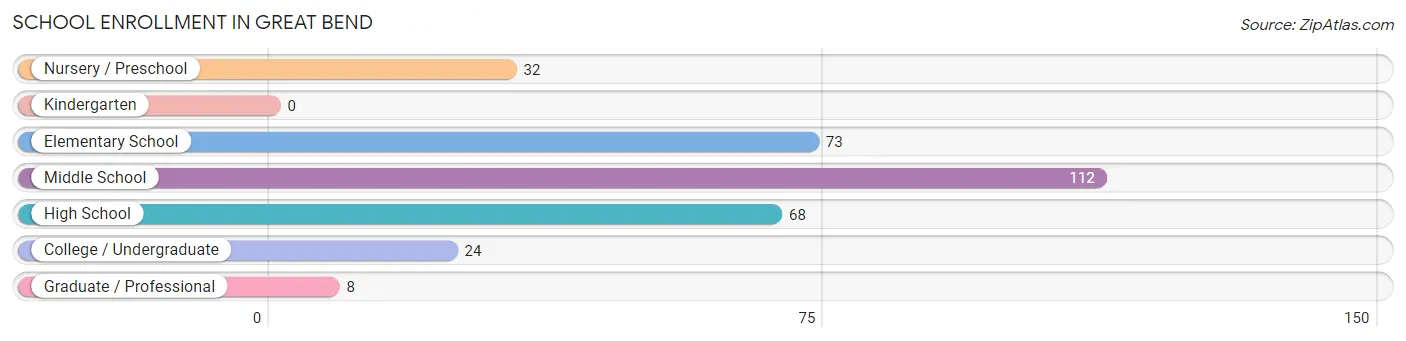
| School Level | # Students | % Students |
| Nursery / Preschool | 32 | 10.1% |
| Kindergarten | 0 | 0.0% |
| Elementary School | 73 | 23.0% |
| Middle School | 112 | 35.3% |
| High School | 68 | 21.4% |
| College / Undergraduate | 24 | 7.6% |
| Graduate / Professional | 8 | 2.5% |
| Total | 317 | 100.0% |
School Enrollment by Age by Funding Source in Great Bend
Out of a total of 317 students who are enrolled in schools in Great Bend, 8 (2.5%) attend a private institution, while the remaining 309 (97.5%) are enrolled in public schools. The age group of 25 to 34 year olds has the highest likelihood of being enrolled in private schools, with 8 (100.0% in the age bracket) enrolled. Conversely, the age group of 3 to 4 year olds has the lowest likelihood of being enrolled in a private school, with 32 (100.0% in the age bracket) attending a public institution.
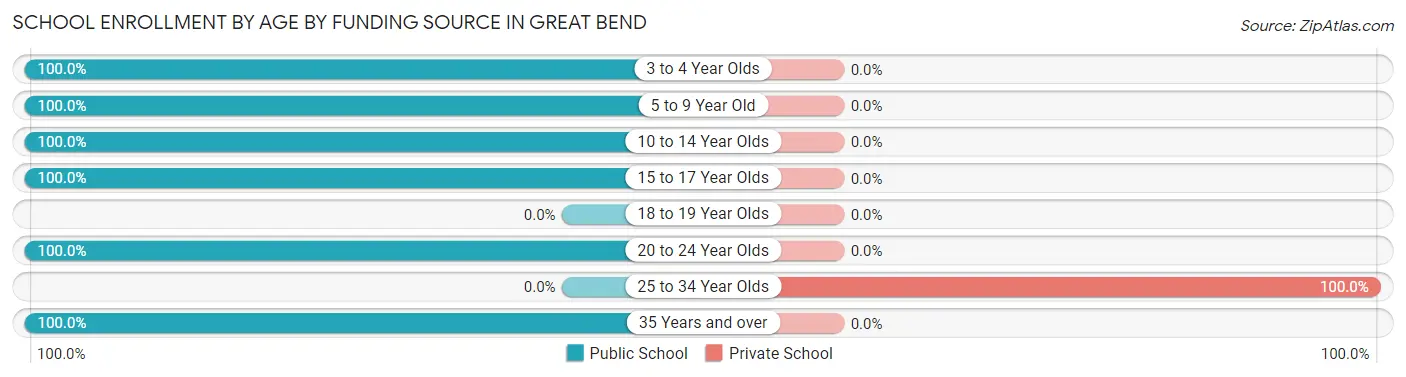
| Age Bracket | Public School | Private School |
| 3 to 4 Year Olds | 32 (100.0%) | 0 (0.0%) |
| 5 to 9 Year Old | 22 (100.0%) | 0 (0.0%) |
| 10 to 14 Year Olds | 207 (100.0%) | 0 (0.0%) |
| 15 to 17 Year Olds | 24 (100.0%) | 0 (0.0%) |
| 18 to 19 Year Olds | 0 (0.0%) | 0 (0.0%) |
| 20 to 24 Year Olds | 18 (100.0%) | 0 (0.0%) |
| 25 to 34 Year Olds | 0 (0.0%) | 8 (100.0%) |
| 35 Years and over | 6 (100.0%) | 0 (0.0%) |
| Total | 309 (97.5%) | 8 (2.5%) |
Educational Attainment by Field of Study in Great Bend
Business (34 | 20.9%), education (33 | 20.3%), social sciences (27 | 16.6%), arts & humanities (25 | 15.3%), and psychology (19 | 11.7%) are the most common fields of study among 163 individuals in Great Bend who have obtained a bachelor's degree or higher.
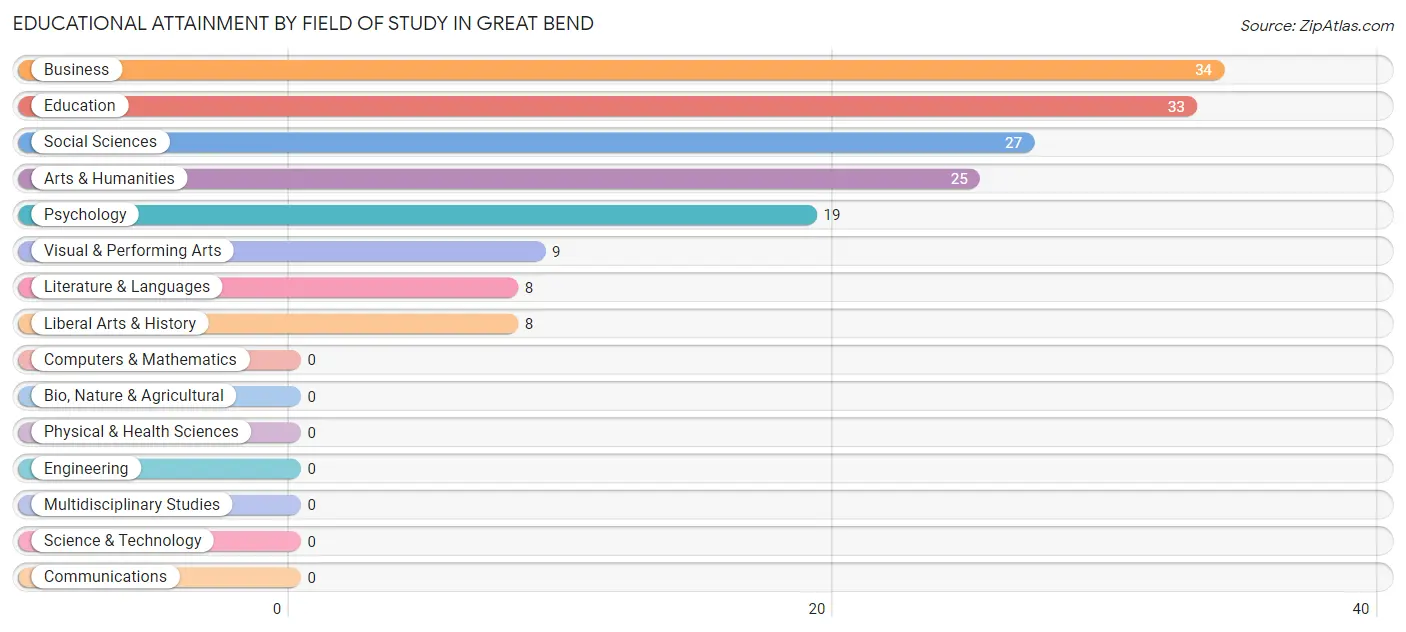
| Field of Study | # Graduates | % Graduates |
| Computers & Mathematics | 0 | 0.0% |
| Bio, Nature & Agricultural | 0 | 0.0% |
| Physical & Health Sciences | 0 | 0.0% |
| Psychology | 19 | 11.7% |
| Social Sciences | 27 | 16.6% |
| Engineering | 0 | 0.0% |
| Multidisciplinary Studies | 0 | 0.0% |
| Science & Technology | 0 | 0.0% |
| Business | 34 | 20.9% |
| Education | 33 | 20.3% |
| Literature & Languages | 8 | 4.9% |
| Liberal Arts & History | 8 | 4.9% |
| Visual & Performing Arts | 9 | 5.5% |
| Communications | 0 | 0.0% |
| Arts & Humanities | 25 | 15.3% |
| Total | 163 | 100.0% |
Transportation & Commute in Great Bend
Vehicle Availability by Sex in Great Bend
The most prevalent vehicle ownership categories in Great Bend are males with 2 vehicles (64, accounting for 39.3%) and females with 2 vehicles (36, making up 22.6%).
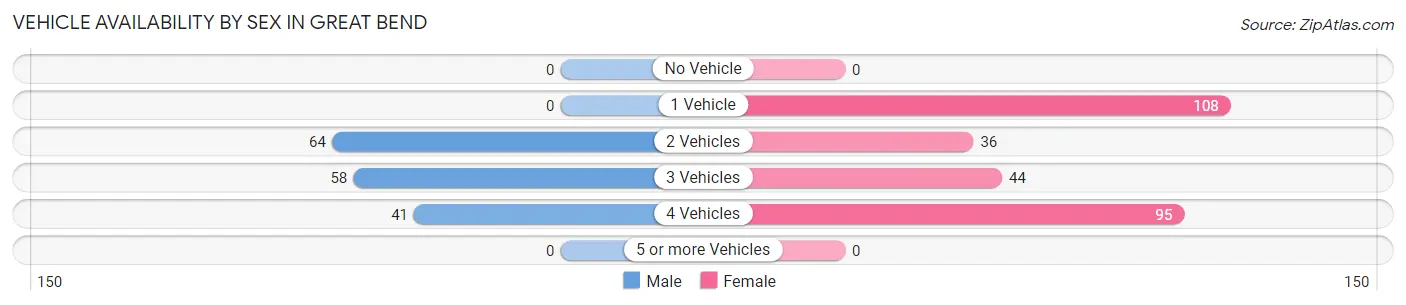
| Vehicles Available | Male | Female |
| No Vehicle | 0 (0.0%) | 0 (0.0%) |
| 1 Vehicle | 0 (0.0%) | 108 (38.2%) |
| 2 Vehicles | 64 (39.3%) | 36 (12.7%) |
| 3 Vehicles | 58 (35.6%) | 44 (15.5%) |
| 4 Vehicles | 41 (25.2%) | 95 (33.6%) |
| 5 or more Vehicles | 0 (0.0%) | 0 (0.0%) |
| Total | 163 (100.0%) | 283 (100.0%) |
Commute Time in Great Bend
The most frequently occuring commute durations in Great Bend are 15 to 19 minutes (186 commuters, 41.7%), 5 to 9 minutes (76 commuters, 17.0%), and 10 to 14 minutes (71 commuters, 15.9%).
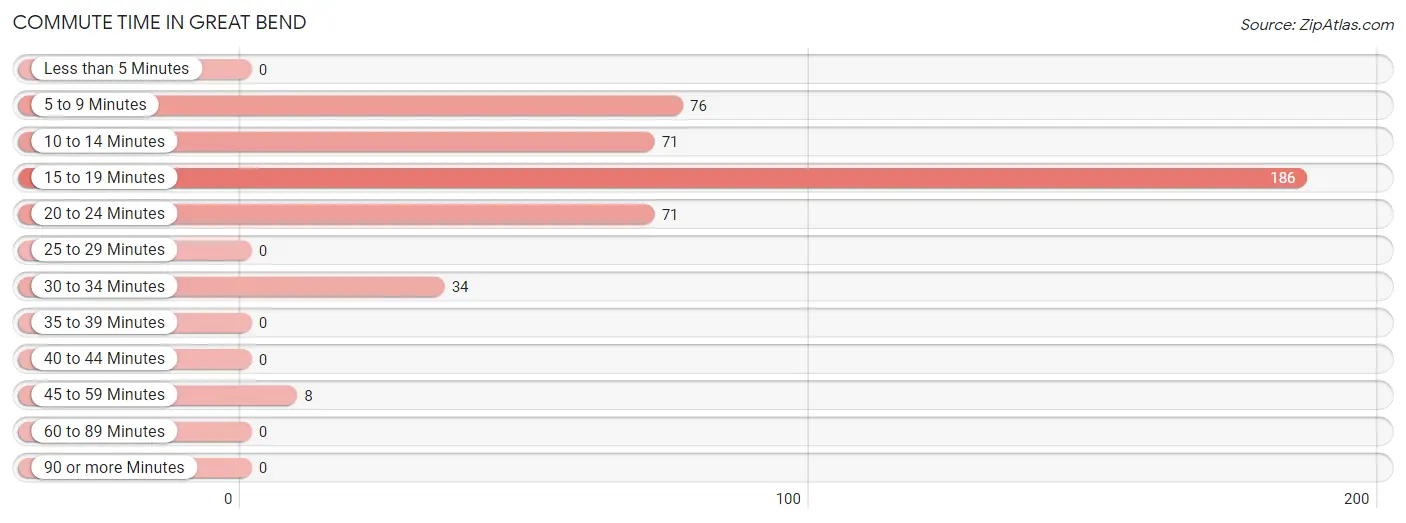
| Commute Time | # Commuters | % Commuters |
| Less than 5 Minutes | 0 | 0.0% |
| 5 to 9 Minutes | 76 | 17.0% |
| 10 to 14 Minutes | 71 | 15.9% |
| 15 to 19 Minutes | 186 | 41.7% |
| 20 to 24 Minutes | 71 | 15.9% |
| 25 to 29 Minutes | 0 | 0.0% |
| 30 to 34 Minutes | 34 | 7.6% |
| 35 to 39 Minutes | 0 | 0.0% |
| 40 to 44 Minutes | 0 | 0.0% |
| 45 to 59 Minutes | 8 | 1.8% |
| 60 to 89 Minutes | 0 | 0.0% |
| 90 or more Minutes | 0 | 0.0% |
Commute Time by Sex in Great Bend
The most common commute times in Great Bend are 20 to 24 minutes (65 commuters, 39.9%) for males and 15 to 19 minutes (149 commuters, 52.6%) for females.
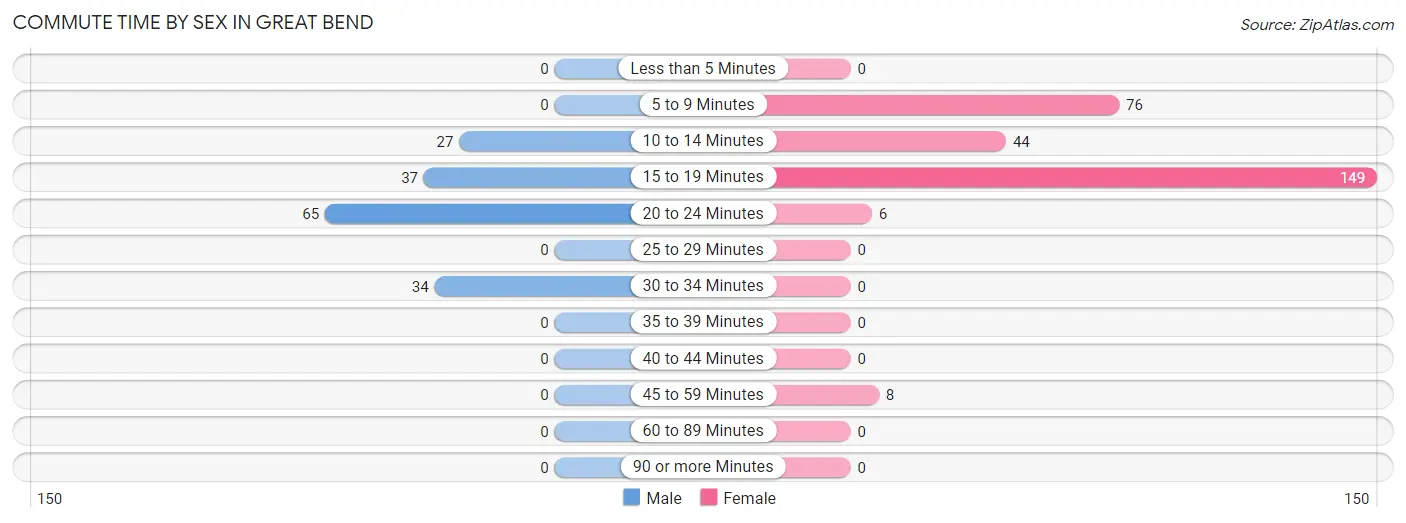
| Commute Time | Male | Female |
| Less than 5 Minutes | 0 (0.0%) | 0 (0.0%) |
| 5 to 9 Minutes | 0 (0.0%) | 76 (26.9%) |
| 10 to 14 Minutes | 27 (16.6%) | 44 (15.5%) |
| 15 to 19 Minutes | 37 (22.7%) | 149 (52.6%) |
| 20 to 24 Minutes | 65 (39.9%) | 6 (2.1%) |
| 25 to 29 Minutes | 0 (0.0%) | 0 (0.0%) |
| 30 to 34 Minutes | 34 (20.9%) | 0 (0.0%) |
| 35 to 39 Minutes | 0 (0.0%) | 0 (0.0%) |
| 40 to 44 Minutes | 0 (0.0%) | 0 (0.0%) |
| 45 to 59 Minutes | 0 (0.0%) | 8 (2.8%) |
| 60 to 89 Minutes | 0 (0.0%) | 0 (0.0%) |
| 90 or more Minutes | 0 (0.0%) | 0 (0.0%) |
Time of Departure to Work by Sex in Great Bend
The most frequent times of departure to work in Great Bend are 9:00 AM to 9:59 AM (58, 35.6%) for males and 6:00 AM to 6:29 AM (92, 32.5%) for females.
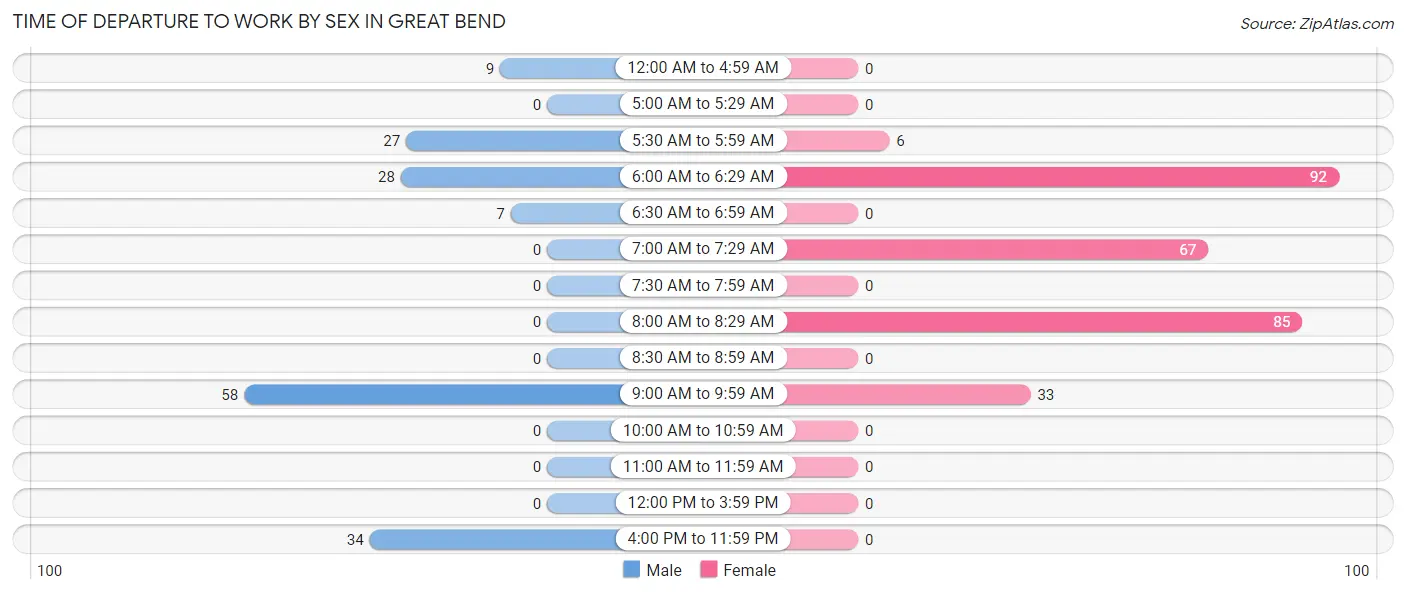
| Time of Departure | Male | Female |
| 12:00 AM to 4:59 AM | 9 (5.5%) | 0 (0.0%) |
| 5:00 AM to 5:29 AM | 0 (0.0%) | 0 (0.0%) |
| 5:30 AM to 5:59 AM | 27 (16.6%) | 6 (2.1%) |
| 6:00 AM to 6:29 AM | 28 (17.2%) | 92 (32.5%) |
| 6:30 AM to 6:59 AM | 7 (4.3%) | 0 (0.0%) |
| 7:00 AM to 7:29 AM | 0 (0.0%) | 67 (23.7%) |
| 7:30 AM to 7:59 AM | 0 (0.0%) | 0 (0.0%) |
| 8:00 AM to 8:29 AM | 0 (0.0%) | 85 (30.0%) |
| 8:30 AM to 8:59 AM | 0 (0.0%) | 0 (0.0%) |
| 9:00 AM to 9:59 AM | 58 (35.6%) | 33 (11.7%) |
| 10:00 AM to 10:59 AM | 0 (0.0%) | 0 (0.0%) |
| 11:00 AM to 11:59 AM | 0 (0.0%) | 0 (0.0%) |
| 12:00 PM to 3:59 PM | 0 (0.0%) | 0 (0.0%) |
| 4:00 PM to 11:59 PM | 34 (20.9%) | 0 (0.0%) |
| Total | 163 (100.0%) | 283 (100.0%) |
Housing Occupancy in Great Bend
Occupancy by Ownership in Great Bend
Of the total 347 dwellings in Great Bend, owner-occupied units account for 137 (39.5%), while renter-occupied units make up 210 (60.5%).
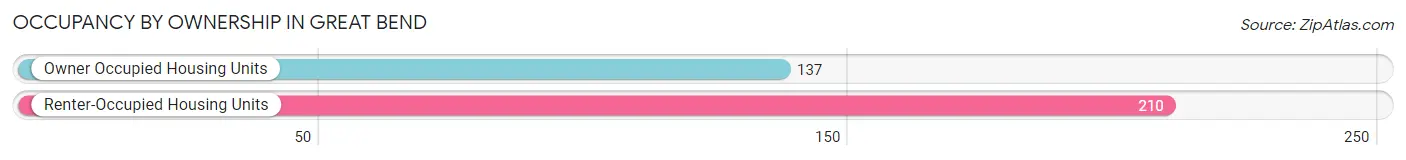
| Occupancy | # Housing Units | % Housing Units |
| Owner Occupied Housing Units | 137 | 39.5% |
| Renter-Occupied Housing Units | 210 | 60.5% |
| Total Occupied Housing Units | 347 | 100.0% |
Occupancy by Household Size in Great Bend
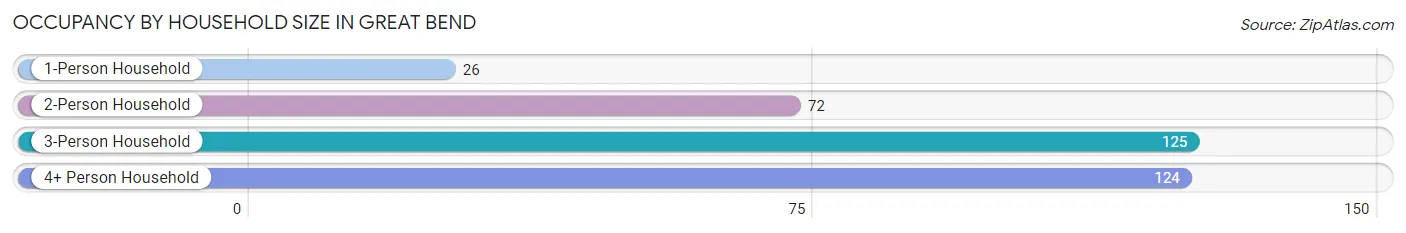
| Household Size | # Housing Units | % Housing Units |
| 1-Person Household | 26 | 7.5% |
| 2-Person Household | 72 | 20.7% |
| 3-Person Household | 125 | 36.0% |
| 4+ Person Household | 124 | 35.7% |
| Total Housing Units | 347 | 100.0% |
Occupancy by Ownership by Household Size in Great Bend
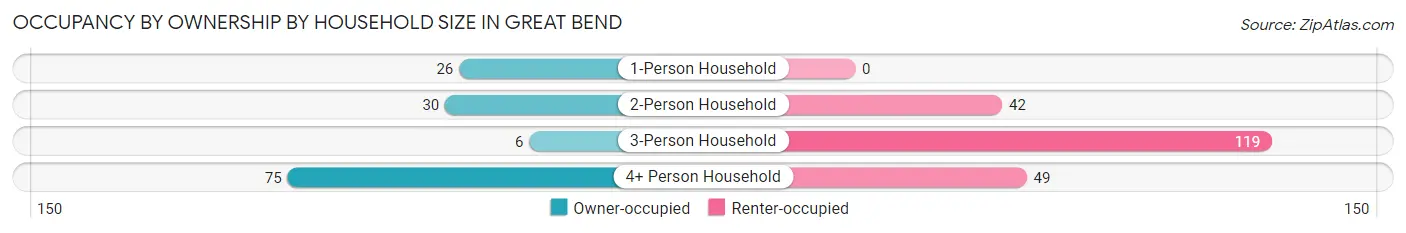
| Household Size | Owner-occupied | Renter-occupied |
| 1-Person Household | 26 (100.0%) | 0 (0.0%) |
| 2-Person Household | 30 (41.7%) | 42 (58.3%) |
| 3-Person Household | 6 (4.8%) | 119 (95.2%) |
| 4+ Person Household | 75 (60.5%) | 49 (39.5%) |
| Total Housing Units | 137 (39.5%) | 210 (60.5%) |
Occupancy by Educational Attainment in Great Bend
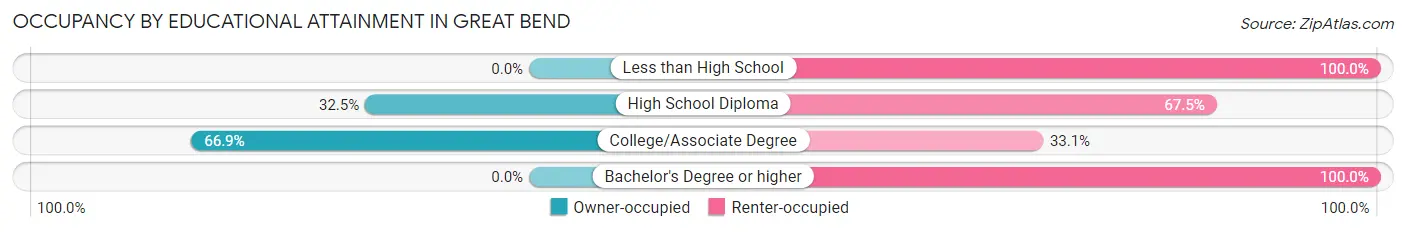
| Household Size | Owner-occupied | Renter-occupied |
| Less than High School | 0 (0.0%) | 28 (100.0%) |
| High School Diploma | 52 (32.5%) | 108 (67.5%) |
| College/Associate Degree | 85 (66.9%) | 42 (33.1%) |
| Bachelor's Degree or higher | 0 (0.0%) | 32 (100.0%) |
Occupancy by Age of Householder in Great Bend
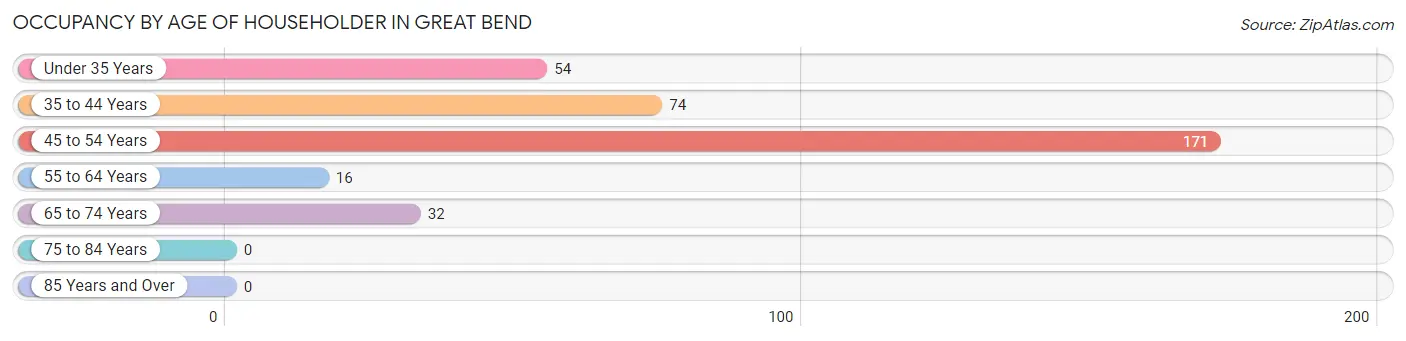
| Age Bracket | # Households | % Households |
| Under 35 Years | 54 | 15.6% |
| 35 to 44 Years | 74 | 21.3% |
| 45 to 54 Years | 171 | 49.3% |
| 55 to 64 Years | 16 | 4.6% |
| 65 to 74 Years | 32 | 9.2% |
| 75 to 84 Years | 0 | 0.0% |
| 85 Years and Over | 0 | 0.0% |
| Total | 347 | 100.0% |
Housing Finances in Great Bend
Median Income by Occupancy in Great Bend
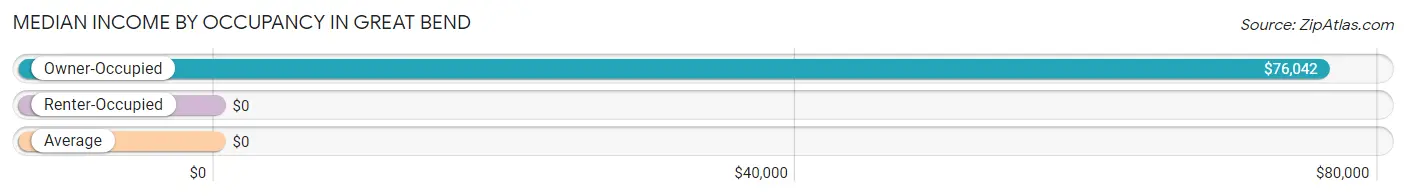
| Occupancy Type | # Households | Median Income |
| Owner-Occupied | 137 (39.5%) | $76,042 |
| Renter-Occupied | 210 (60.5%) | $0 |
| Average | 347 (100.0%) | $0 |
Occupancy by Householder Income Bracket in Great Bend
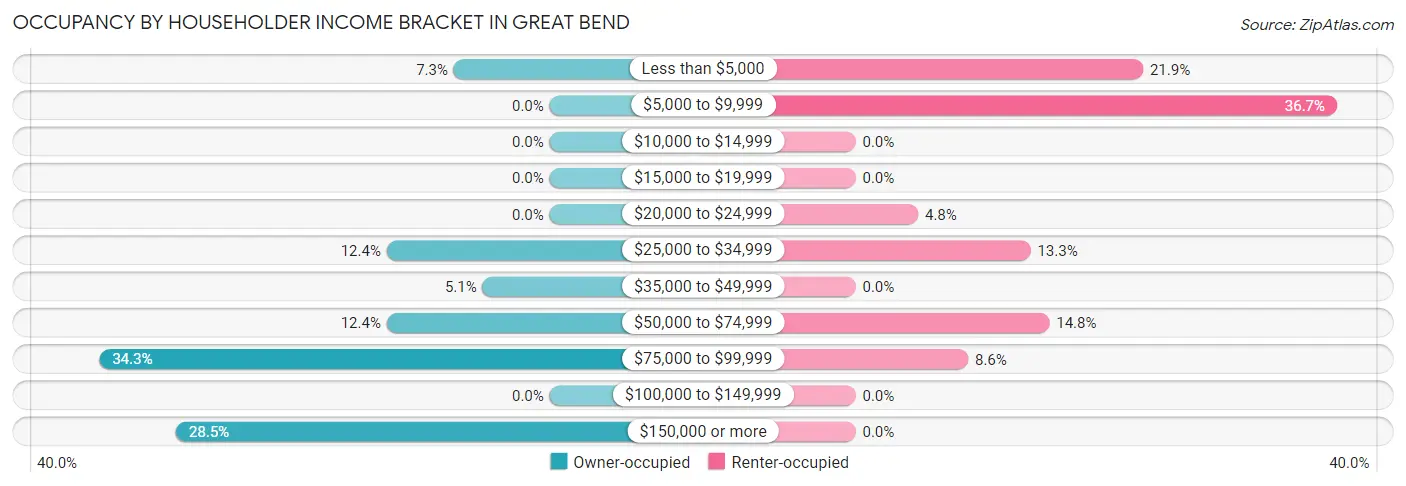
| Income Bracket | Owner-occupied | Renter-occupied |
| Less than $5,000 | 10 (7.3%) | 46 (21.9%) |
| $5,000 to $9,999 | 0 (0.0%) | 77 (36.7%) |
| $10,000 to $14,999 | 0 (0.0%) | 0 (0.0%) |
| $15,000 to $19,999 | 0 (0.0%) | 0 (0.0%) |
| $20,000 to $24,999 | 0 (0.0%) | 10 (4.8%) |
| $25,000 to $34,999 | 17 (12.4%) | 28 (13.3%) |
| $35,000 to $49,999 | 7 (5.1%) | 0 (0.0%) |
| $50,000 to $74,999 | 17 (12.4%) | 31 (14.8%) |
| $75,000 to $99,999 | 47 (34.3%) | 18 (8.6%) |
| $100,000 to $149,999 | 0 (0.0%) | 0 (0.0%) |
| $150,000 or more | 39 (28.5%) | 0 (0.0%) |
| Total | 137 (100.0%) | 210 (100.0%) |
Monthly Housing Cost Tiers in Great Bend
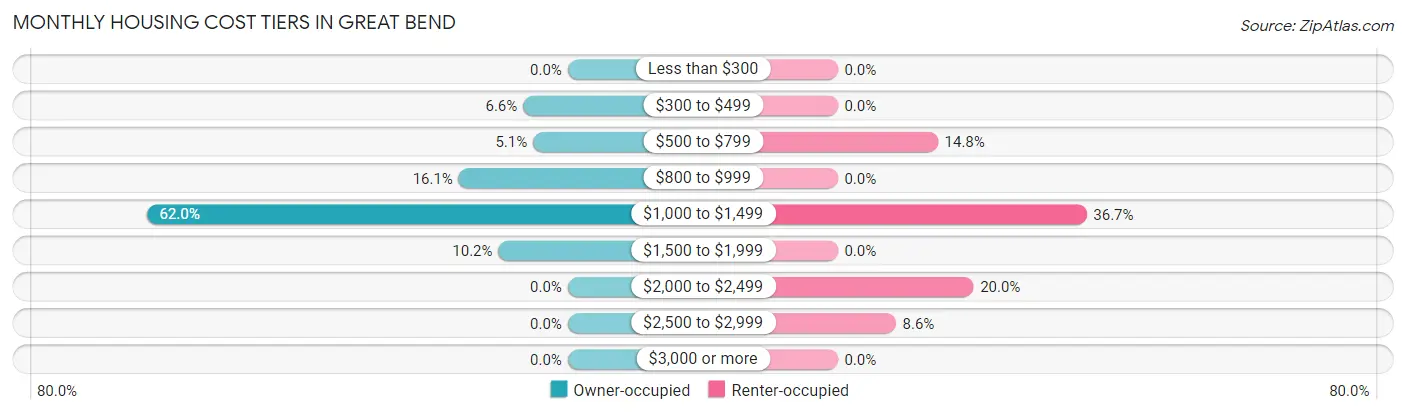
| Monthly Cost | Owner-occupied | Renter-occupied |
| Less than $300 | 0 (0.0%) | 0 (0.0%) |
| $300 to $499 | 9 (6.6%) | 0 (0.0%) |
| $500 to $799 | 7 (5.1%) | 31 (14.8%) |
| $800 to $999 | 22 (16.1%) | 0 (0.0%) |
| $1,000 to $1,499 | 85 (62.0%) | 77 (36.7%) |
| $1,500 to $1,999 | 14 (10.2%) | 0 (0.0%) |
| $2,000 to $2,499 | 0 (0.0%) | 42 (20.0%) |
| $2,500 to $2,999 | 0 (0.0%) | 18 (8.6%) |
| $3,000 or more | 0 (0.0%) | 0 (0.0%) |
| Total | 137 (100.0%) | 210 (100.0%) |
Physical Housing Characteristics in Great Bend
Housing Structures in Great Bend
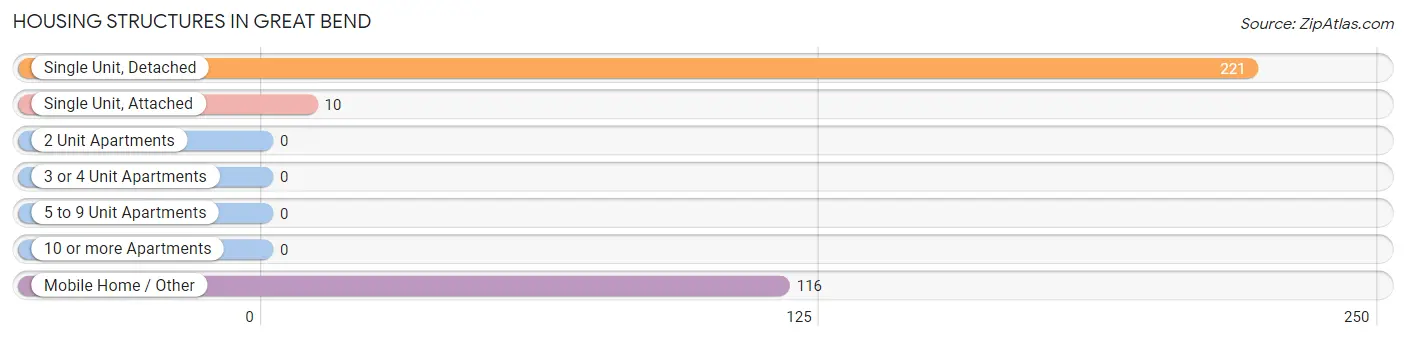
| Structure Type | # Housing Units | % Housing Units |
| Single Unit, Detached | 221 | 63.7% |
| Single Unit, Attached | 10 | 2.9% |
| 2 Unit Apartments | 0 | 0.0% |
| 3 or 4 Unit Apartments | 0 | 0.0% |
| 5 to 9 Unit Apartments | 0 | 0.0% |
| 10 or more Apartments | 0 | 0.0% |
| Mobile Home / Other | 116 | 33.4% |
| Total | 347 | 100.0% |
Housing Structures by Occupancy in Great Bend
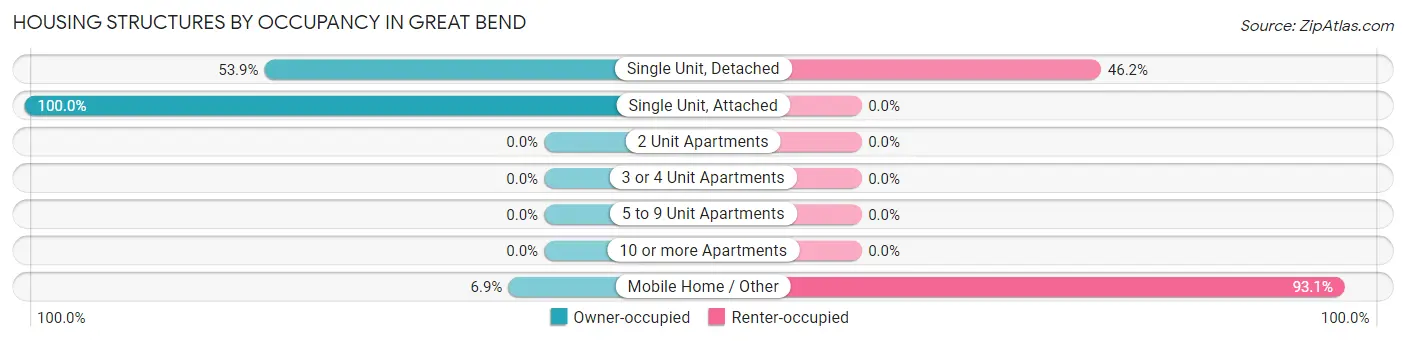
| Structure Type | Owner-occupied | Renter-occupied |
| Single Unit, Detached | 119 (53.8%) | 102 (46.2%) |
| Single Unit, Attached | 10 (100.0%) | 0 (0.0%) |
| 2 Unit Apartments | 0 (0.0%) | 0 (0.0%) |
| 3 or 4 Unit Apartments | 0 (0.0%) | 0 (0.0%) |
| 5 to 9 Unit Apartments | 0 (0.0%) | 0 (0.0%) |
| 10 or more Apartments | 0 (0.0%) | 0 (0.0%) |
| Mobile Home / Other | 8 (6.9%) | 108 (93.1%) |
| Total | 137 (39.5%) | 210 (60.5%) |
Housing Structures by Number of Rooms in Great Bend
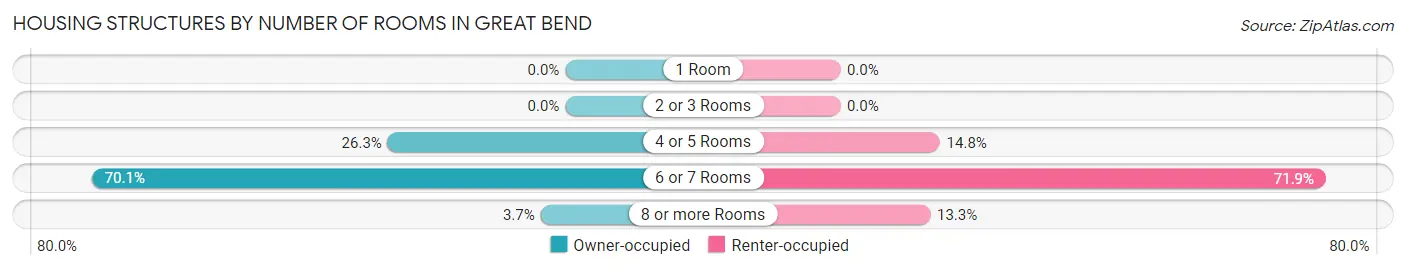
| Number of Rooms | Owner-occupied | Renter-occupied |
| 1 Room | 0 (0.0%) | 0 (0.0%) |
| 2 or 3 Rooms | 0 (0.0%) | 0 (0.0%) |
| 4 or 5 Rooms | 36 (26.3%) | 31 (14.8%) |
| 6 or 7 Rooms | 96 (70.1%) | 151 (71.9%) |
| 8 or more Rooms | 5 (3.6%) | 28 (13.3%) |
| Total | 137 (100.0%) | 210 (100.0%) |
Housing Structure by Heating Type in Great Bend
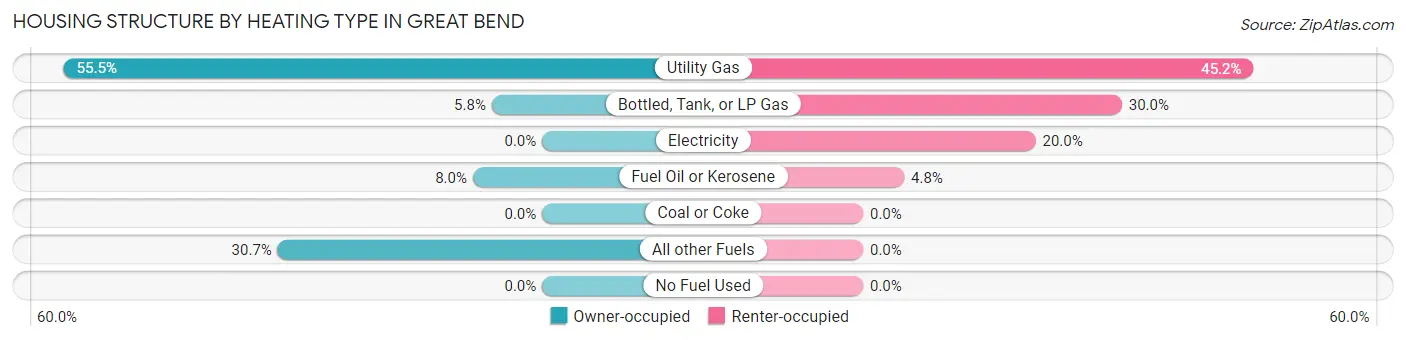
| Heating Type | Owner-occupied | Renter-occupied |
| Utility Gas | 76 (55.5%) | 95 (45.2%) |
| Bottled, Tank, or LP Gas | 8 (5.8%) | 63 (30.0%) |
| Electricity | 0 (0.0%) | 42 (20.0%) |
| Fuel Oil or Kerosene | 11 (8.0%) | 10 (4.8%) |
| Coal or Coke | 0 (0.0%) | 0 (0.0%) |
| All other Fuels | 42 (30.7%) | 0 (0.0%) |
| No Fuel Used | 0 (0.0%) | 0 (0.0%) |
| Total | 137 (100.0%) | 210 (100.0%) |
Household Vehicle Usage in Great Bend
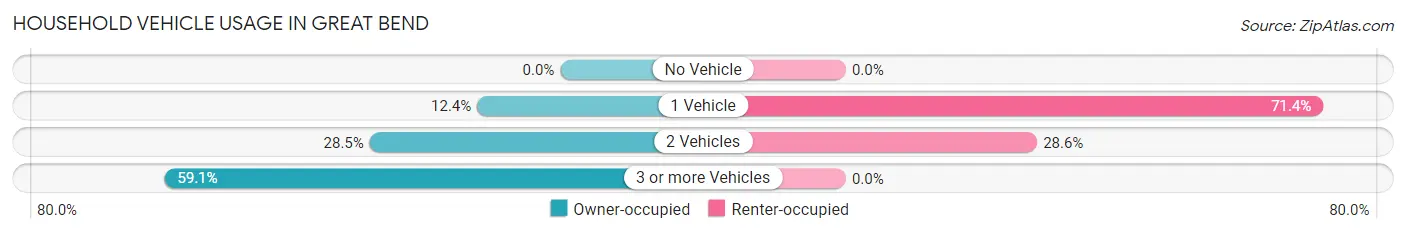
| Vehicles per Household | Owner-occupied | Renter-occupied |
| No Vehicle | 0 (0.0%) | 0 (0.0%) |
| 1 Vehicle | 17 (12.4%) | 150 (71.4%) |
| 2 Vehicles | 39 (28.5%) | 60 (28.6%) |
| 3 or more Vehicles | 81 (59.1%) | 0 (0.0%) |
| Total | 137 (100.0%) | 210 (100.0%) |
Real Estate & Mortgages in Great Bend
Real Estate and Mortgage Overview in Great Bend
| Characteristic | Without Mortgage | With Mortgage |
| Housing Units | 31 | 106 |
| Median Property Value | - | - |
| Median Household Income | - | - |
| Monthly Housing Costs | - | - |
| Real Estate Taxes | $2,262 | $0 |
Property Value by Mortgage Status in Great Bend
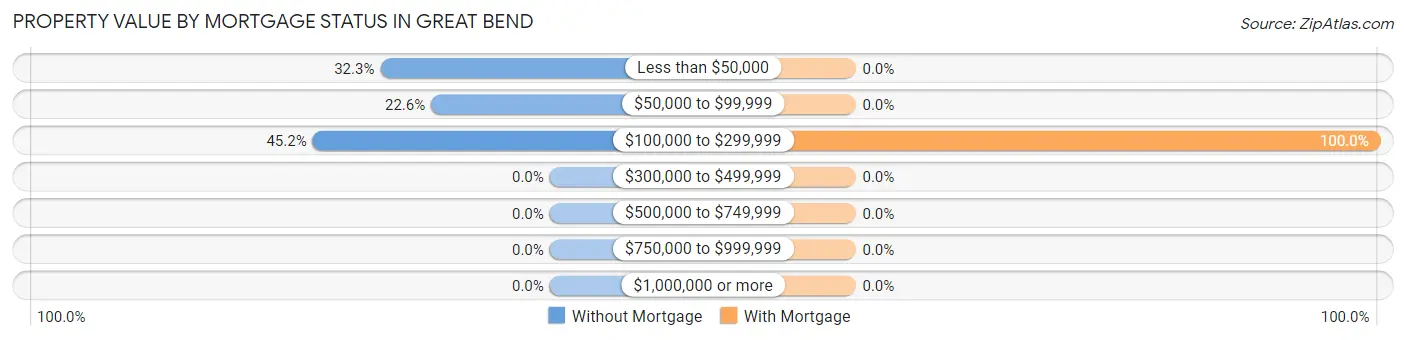
| Property Value | Without Mortgage | With Mortgage |
| Less than $50,000 | 10 (32.3%) | 0 (0.0%) |
| $50,000 to $99,999 | 7 (22.6%) | 0 (0.0%) |
| $100,000 to $299,999 | 14 (45.2%) | 106 (100.0%) |
| $300,000 to $499,999 | 0 (0.0%) | 0 (0.0%) |
| $500,000 to $749,999 | 0 (0.0%) | 0 (0.0%) |
| $750,000 to $999,999 | 0 (0.0%) | 0 (0.0%) |
| $1,000,000 or more | 0 (0.0%) | 0 (0.0%) |
| Total | 31 (100.0%) | 106 (100.0%) |
Household Income by Mortgage Status in Great Bend
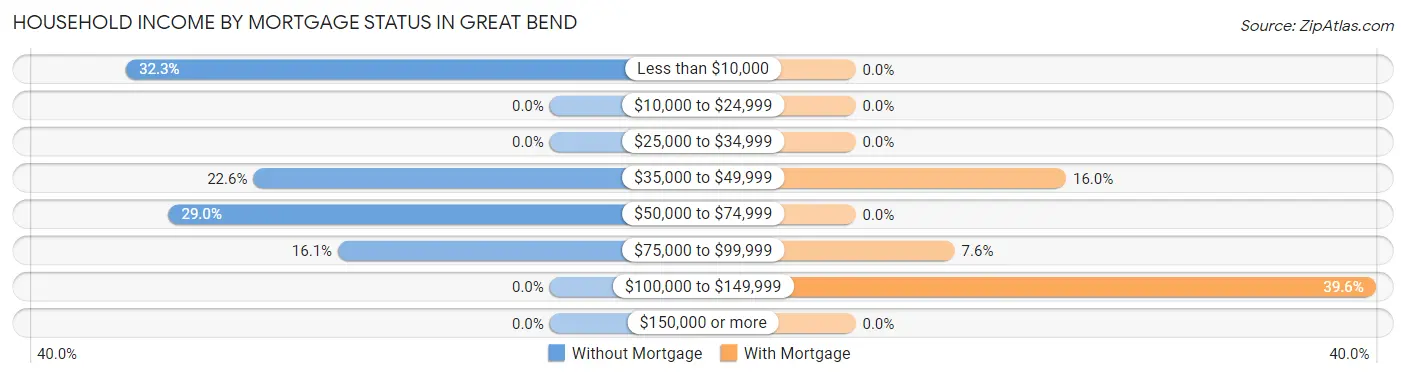
| Household Income | Without Mortgage | With Mortgage |
| Less than $10,000 | 10 (32.3%) | 0 (0.0%) |
| $10,000 to $24,999 | 0 (0.0%) | 0 (0.0%) |
| $25,000 to $34,999 | 0 (0.0%) | 0 (0.0%) |
| $35,000 to $49,999 | 7 (22.6%) | 17 (16.0%) |
| $50,000 to $74,999 | 9 (29.0%) | 0 (0.0%) |
| $75,000 to $99,999 | 5 (16.1%) | 8 (7.5%) |
| $100,000 to $149,999 | 0 (0.0%) | 42 (39.6%) |
| $150,000 or more | 0 (0.0%) | 0 (0.0%) |
| Total | 31 (100.0%) | 106 (100.0%) |
Property Value to Household Income Ratio in Great Bend
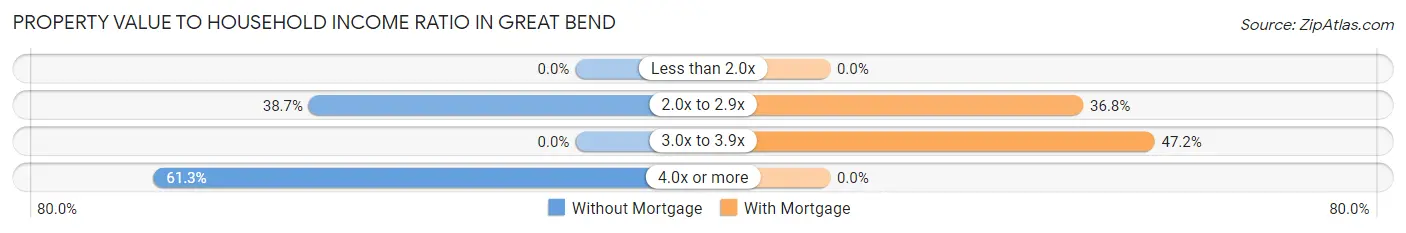
| Value-to-Income Ratio | Without Mortgage | With Mortgage |
| Less than 2.0x | 0 (0.0%) | 0 (0.0%) |
| 2.0x to 2.9x | 12 (38.7%) | 39 (36.8%) |
| 3.0x to 3.9x | 0 (0.0%) | 50 (47.2%) |
| 4.0x or more | 19 (61.3%) | 0 (0.0%) |
| Total | 31 (100.0%) | 106 (100.0%) |
Real Estate Taxes by Mortgage Status in Great Bend
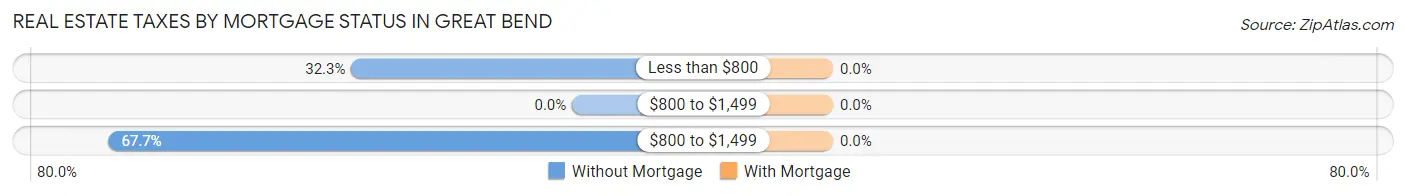
| Property Taxes | Without Mortgage | With Mortgage |
| Less than $800 | 10 (32.3%) | 0 (0.0%) |
| $800 to $1,499 | 0 (0.0%) | 0 (0.0%) |
| $800 to $1,499 | 21 (67.7%) | 0 (0.0%) |
| Total | 31 (100.0%) | 106 (100.0%) |
Health & Disability in Great Bend
Health Insurance Coverage by Age in Great Bend
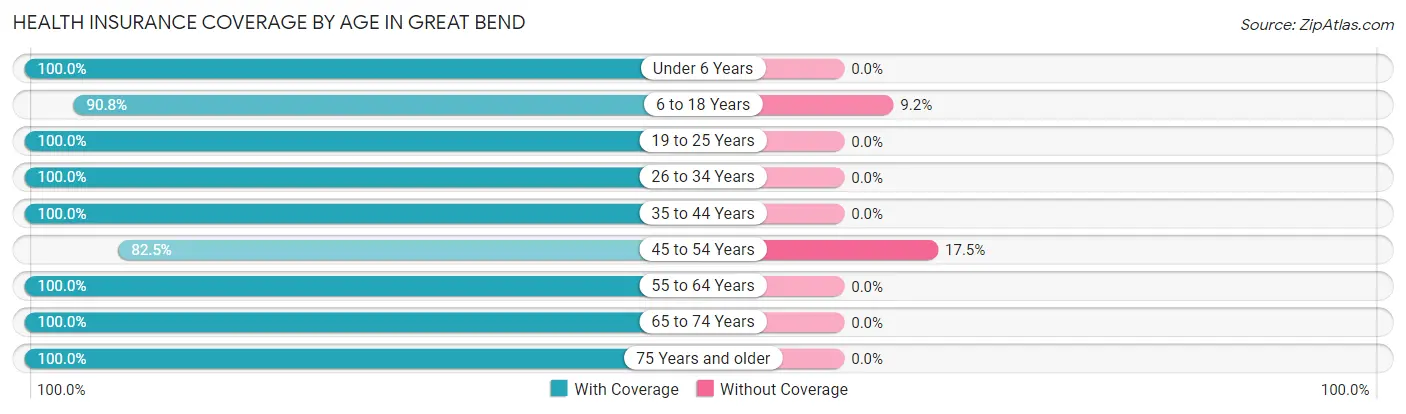
| Age Bracket | With Coverage | Without Coverage |
| Under 6 Years | 104 (100.0%) | 0 (0.0%) |
| 6 to 18 Years | 238 (90.8%) | 24 (9.2%) |
| 19 to 25 Years | 224 (100.0%) | 0 (0.0%) |
| 26 to 34 Years | 98 (100.0%) | 0 (0.0%) |
| 35 to 44 Years | 154 (100.0%) | 0 (0.0%) |
| 45 to 54 Years | 132 (82.5%) | 28 (17.5%) |
| 55 to 64 Years | 107 (100.0%) | 0 (0.0%) |
| 65 to 74 Years | 32 (100.0%) | 0 (0.0%) |
| 75 Years and older | 41 (100.0%) | 0 (0.0%) |
| Total | 1,130 (95.6%) | 52 (4.4%) |
Health Insurance Coverage by Citizenship Status in Great Bend
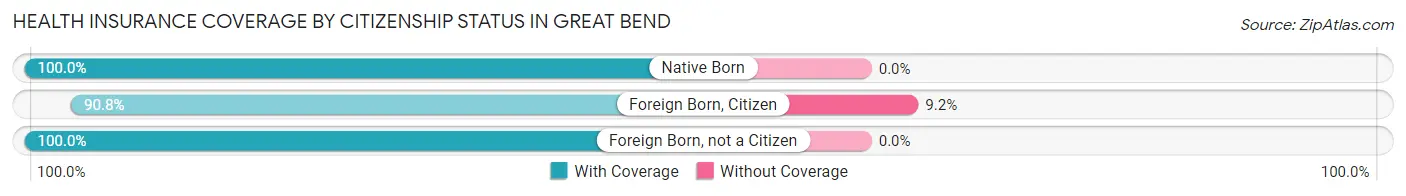
| Citizenship Status | With Coverage | Without Coverage |
| Native Born | 104 (100.0%) | 0 (0.0%) |
| Foreign Born, Citizen | 238 (90.8%) | 24 (9.2%) |
| Foreign Born, not a Citizen | 224 (100.0%) | 0 (0.0%) |
Health Insurance Coverage by Household Income in Great Bend
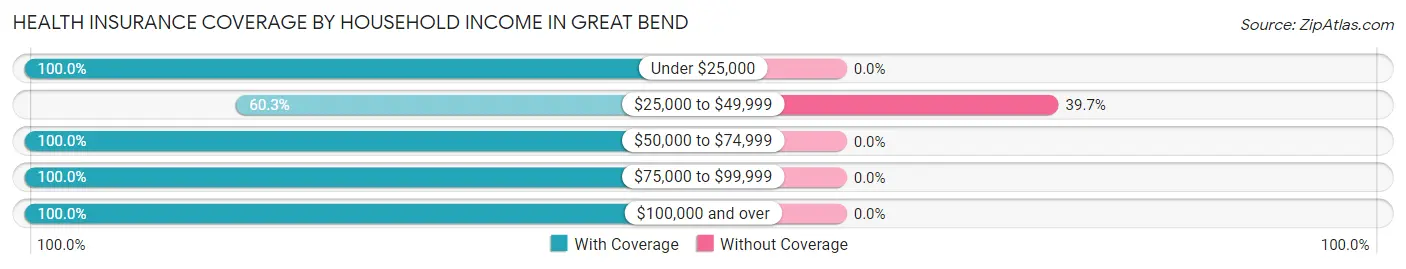
| Household Income | With Coverage | Without Coverage |
| Under $25,000 | 334 (100.0%) | 0 (0.0%) |
| $25,000 to $49,999 | 79 (60.3%) | 52 (39.7%) |
| $50,000 to $74,999 | 152 (100.0%) | 0 (0.0%) |
| $75,000 to $99,999 | 329 (100.0%) | 0 (0.0%) |
| $100,000 and over | 236 (100.0%) | 0 (0.0%) |
Public vs Private Health Insurance Coverage by Age in Great Bend
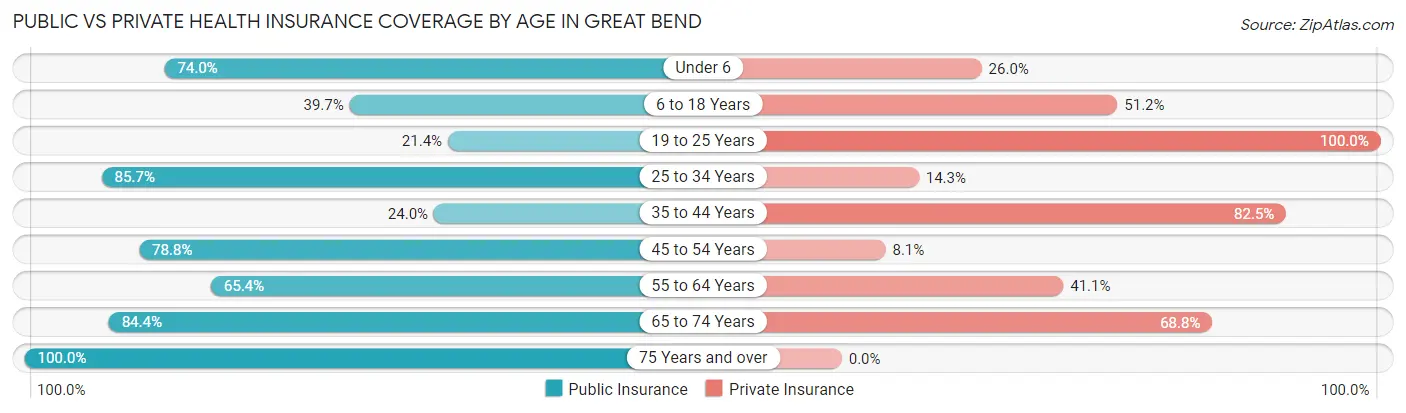
| Age Bracket | Public Insurance | Private Insurance |
| Under 6 | 77 (74.0%) | 27 (26.0%) |
| 6 to 18 Years | 104 (39.7%) | 134 (51.1%) |
| 19 to 25 Years | 48 (21.4%) | 224 (100.0%) |
| 25 to 34 Years | 84 (85.7%) | 14 (14.3%) |
| 35 to 44 Years | 37 (24.0%) | 127 (82.5%) |
| 45 to 54 Years | 126 (78.7%) | 13 (8.1%) |
| 55 to 64 Years | 70 (65.4%) | 44 (41.1%) |
| 65 to 74 Years | 27 (84.4%) | 22 (68.8%) |
| 75 Years and over | 41 (100.0%) | 0 (0.0%) |
| Total | 614 (51.9%) | 605 (51.2%) |
Disability Status by Sex by Age in Great Bend
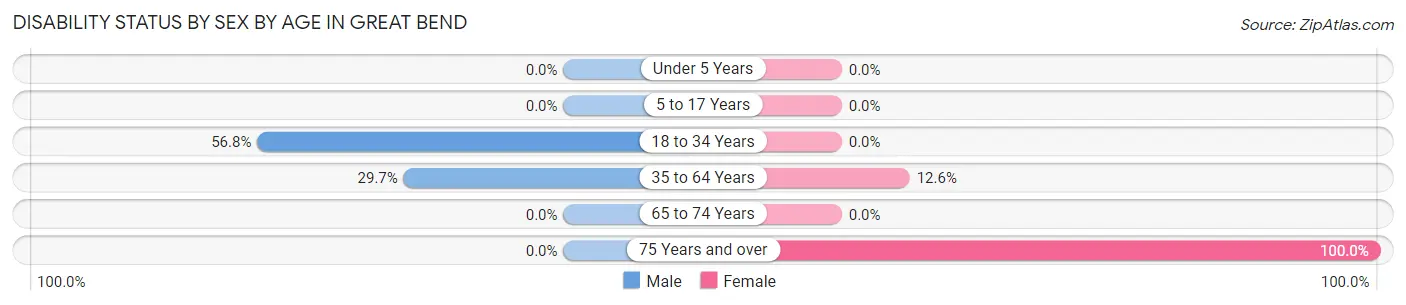
| Age Bracket | Male | Female |
| Under 5 Years | 0 (0.0%) | 0 (0.0%) |
| 5 to 17 Years | 0 (0.0%) | 0 (0.0%) |
| 18 to 34 Years | 100 (56.8%) | 0 (0.0%) |
| 35 to 64 Years | 59 (29.6%) | 28 (12.6%) |
| 65 to 74 Years | 0 (0.0%) | 0 (0.0%) |
| 75 Years and over | 0 (0.0%) | 41 (100.0%) |
Disability Class by Sex by Age in Great Bend
Disability Class: Hearing Difficulty
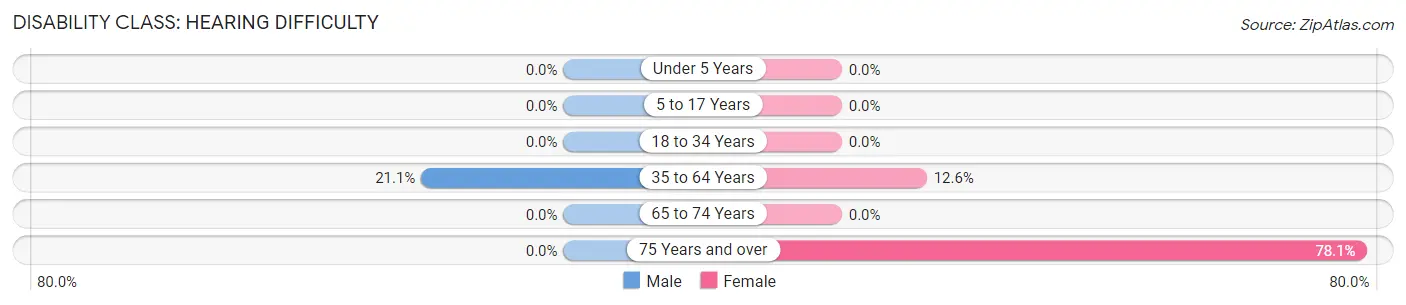
| Age Bracket | Male | Female |
| Under 5 Years | 0 (0.0%) | 0 (0.0%) |
| 5 to 17 Years | 0 (0.0%) | 0 (0.0%) |
| 18 to 34 Years | 0 (0.0%) | 0 (0.0%) |
| 35 to 64 Years | 42 (21.1%) | 28 (12.6%) |
| 65 to 74 Years | 0 (0.0%) | 0 (0.0%) |
| 75 Years and over | 0 (0.0%) | 32 (78.0%) |
Disability Class: Vision Difficulty
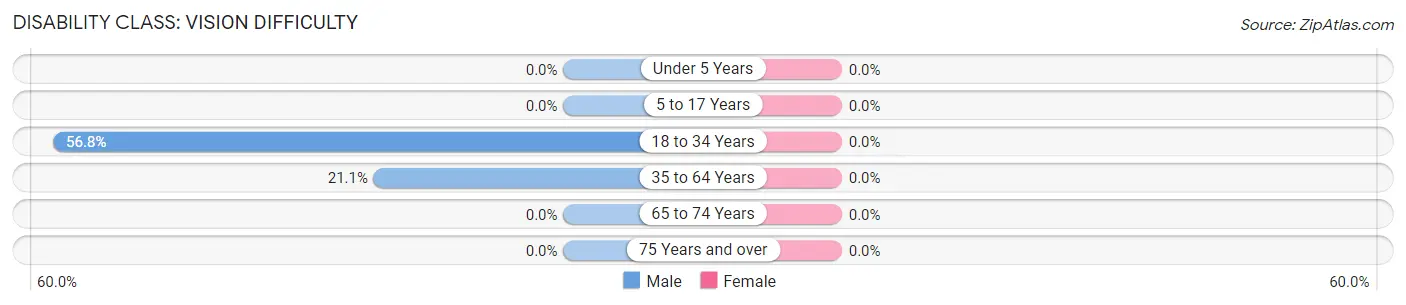
| Age Bracket | Male | Female |
| Under 5 Years | 0 (0.0%) | 0 (0.0%) |
| 5 to 17 Years | 0 (0.0%) | 0 (0.0%) |
| 18 to 34 Years | 100 (56.8%) | 0 (0.0%) |
| 35 to 64 Years | 42 (21.1%) | 0 (0.0%) |
| 65 to 74 Years | 0 (0.0%) | 0 (0.0%) |
| 75 Years and over | 0 (0.0%) | 0 (0.0%) |
Disability Class: Cognitive Difficulty
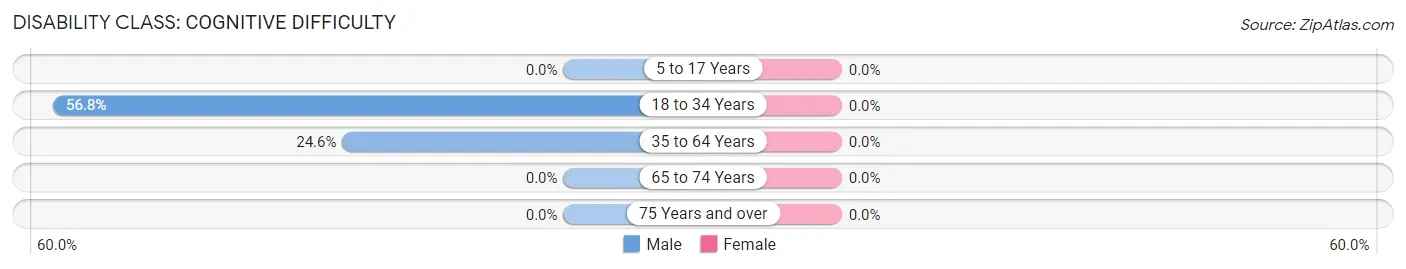
| Age Bracket | Male | Female |
| 5 to 17 Years | 0 (0.0%) | 0 (0.0%) |
| 18 to 34 Years | 100 (56.8%) | 0 (0.0%) |
| 35 to 64 Years | 49 (24.6%) | 0 (0.0%) |
| 65 to 74 Years | 0 (0.0%) | 0 (0.0%) |
| 75 Years and over | 0 (0.0%) | 0 (0.0%) |
Disability Class: Ambulatory Difficulty
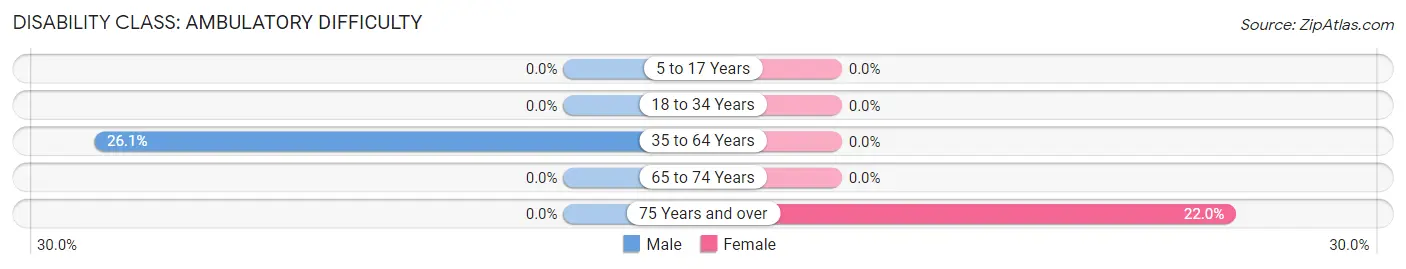
| Age Bracket | Male | Female |
| 5 to 17 Years | 0 (0.0%) | 0 (0.0%) |
| 18 to 34 Years | 0 (0.0%) | 0 (0.0%) |
| 35 to 64 Years | 52 (26.1%) | 0 (0.0%) |
| 65 to 74 Years | 0 (0.0%) | 0 (0.0%) |
| 75 Years and over | 0 (0.0%) | 9 (22.0%) |
Disability Class: Self-Care Difficulty
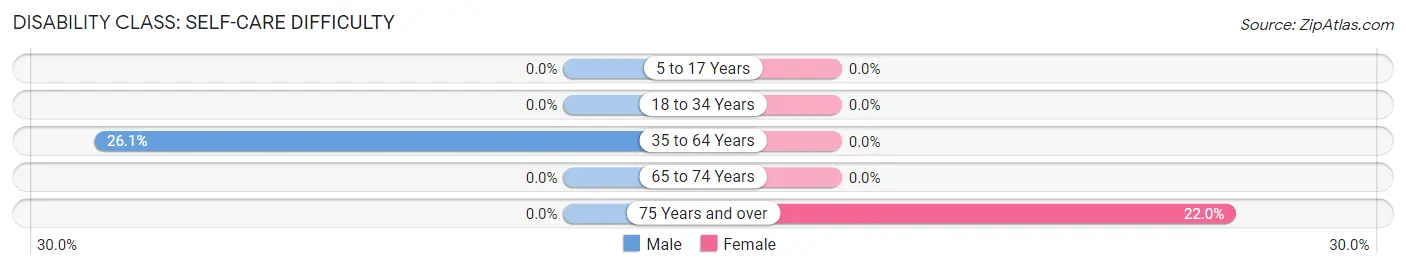
| Age Bracket | Male | Female |
| 5 to 17 Years | 0 (0.0%) | 0 (0.0%) |
| 18 to 34 Years | 0 (0.0%) | 0 (0.0%) |
| 35 to 64 Years | 52 (26.1%) | 0 (0.0%) |
| 65 to 74 Years | 0 (0.0%) | 0 (0.0%) |
| 75 Years and over | 0 (0.0%) | 9 (22.0%) |
Technology Access in Great Bend
Computing Device Access in Great Bend
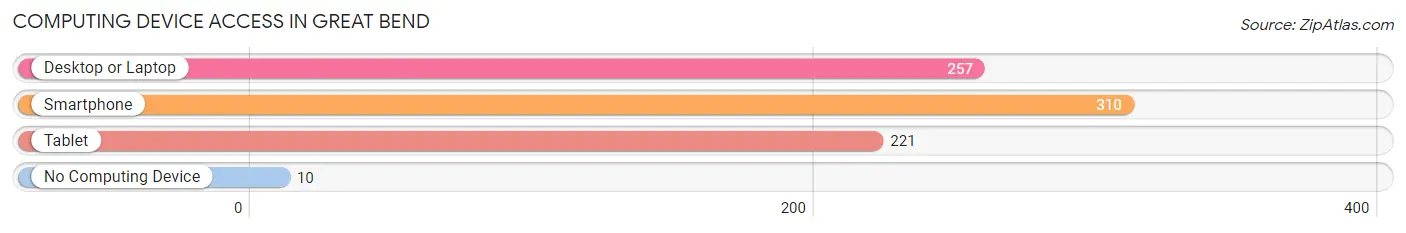
| Device Type | # Households | % Households |
| Desktop or Laptop | 257 | 74.1% |
| Smartphone | 310 | 89.3% |
| Tablet | 221 | 63.7% |
| No Computing Device | 10 | 2.9% |
| Total | 347 | 100.0% |
Internet Access in Great Bend
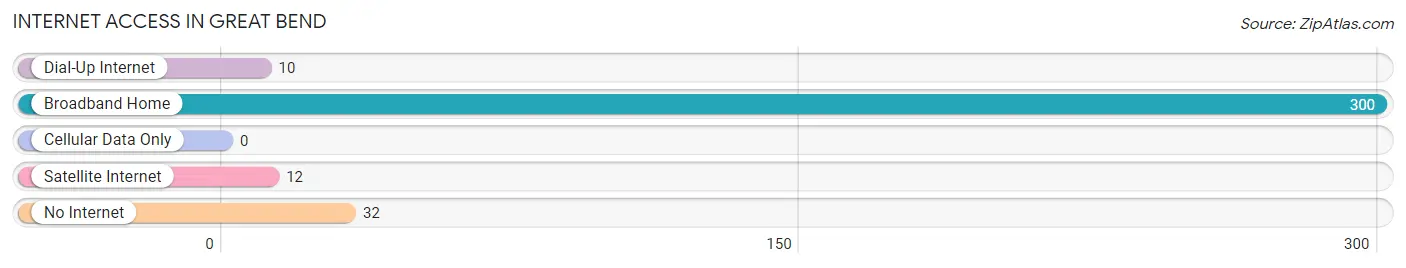
| Internet Type | # Households | % Households |
| Dial-Up Internet | 10 | 2.9% |
| Broadband Home | 300 | 86.5% |
| Cellular Data Only | 0 | 0.0% |
| Satellite Internet | 12 | 3.5% |
| No Internet | 32 | 9.2% |
| Total | 347 | 100.0% |
Great Bend Summary
History
Great Bend is a small town located in Broome County, New York. It is situated on the Susquehanna River, near the Pennsylvania border. The town was first settled in 1790 by a group of settlers from Connecticut. The town was originally known as “Great Bend” due to its location at the bend of the Susquehanna River. The town was officially incorporated in 1808.
In the early 19th century, Great Bend was a thriving agricultural community. The town was home to several mills, including a grist mill, a saw mill, and a woolen mill. The town also had a tannery, a blacksmith shop, and a general store. The town was also home to a number of churches, including the First Presbyterian Church, which was founded in 1810.
In the late 19th century, the town began to decline as the local economy shifted away from agriculture. The mills and other businesses began to close, and the population began to decline. By the early 20th century, the town was largely abandoned.
Geography
Great Bend is located in the southern part of Broome County, New York. It is situated on the Susquehanna River, near the Pennsylvania border. The town is bordered by the towns of Windsor to the north, Sanford to the east, and Kirkwood to the south. The town has a total area of 8.2 square miles, all of which is land.
The terrain of Great Bend is mostly flat, with some rolling hills. The town is located in the Appalachian Plateau region of New York. The climate is humid continental, with cold winters and warm summers. The average annual temperature is around 50 degrees Fahrenheit.
Economy
The economy of Great Bend is largely based on agriculture. The town is home to several farms, which produce a variety of crops, including corn, soybeans, hay, and wheat. The town also has a number of small businesses, including a general store, a gas station, and a few restaurants.
The town is also home to a number of manufacturing companies, including a plastics factory and a paper mill. The town is also home to a number of small businesses, including a hardware store, a lumber yard, and a few auto repair shops.
Demographics
As of the 2010 census, the population of Great Bend was 1,845. The racial makeup of the town was 97.3% White, 0.7% African American, 0.3% Native American, 0.2% Asian, and 1.5% from other races. The median household income was $41,250, and the median family income was $50,000.
The town is home to a number of churches, including the First Presbyterian Church, which was founded in 1810. The town also has a public library, a post office, and a few parks. The town is served by the Susquehanna Valley Central School District.
Conclusion
Great Bend is a small town located in Broome County, New York. It is situated on the Susquehanna River, near the Pennsylvania border. The town was first settled in 1790 by a group of settlers from Connecticut. The town was originally known as “Great Bend” due to its location at the bend of the Susquehanna River. The town was officially incorporated in 1808.
The economy of Great Bend is largely based on agriculture. The town is home to several farms, which produce a variety of crops, including corn, soybeans, hay, and wheat. The town also has a number of small businesses, including a general store, a gas station, and a few restaurants. The town is also home to a number of manufacturing companies, including a plastics factory and a paper mill.
As of the 2010 census, the population of Great Bend was 1,845. The racial makeup of the town was 97.3% White, 0.7% African American, 0.3% Native American, 0.2% Asian, and 1.5% from other races. The median household income was $41,250, and the median family income was $50,000. The town is home to a number of churches, including the First Presbyterian Church, which was founded in 1810. The town also has a public library, a post office, and a few parks.
Common Questions
What is Per Capita Income in Great Bend?
Per Capita income in Great Bend is $19,332.
What is Inequality or Gini Index in Great Bend?
Inequality or Gini Index in Great Bend is 0.59.
What is the Total Population of Great Bend?
Total Population of Great Bend is 1,208.
What is the Total Male Population of Great Bend?
Total Male Population of Great Bend is 569.
What is the Total Female Population of Great Bend?
Total Female Population of Great Bend is 639.
What is the Ratio of Males per 100 Females in Great Bend?
There are 89.05 Males per 100 Females in Great Bend.
What is the Ratio of Females per 100 Males in Great Bend?
There are 112.30 Females per 100 Males in Great Bend.
What is the Median Population Age in Great Bend?
Median Population Age in Great Bend is 26.2 Years.
What is the Average Family Size in Great Bend
Average Family Size in Great Bend is 3.3 People.
What is the Average Household Size in Great Bend
Average Household Size in Great Bend is 3.5 People.
How Large is the Labor Force in Great Bend?
There are 617 People in the Labor Forcein in Great Bend.
What is the Percentage of People in the Labor Force in Great Bend?
71.2% of People are in the Labor Force in Great Bend.
What is the Unemployment Rate in Great Bend?
Unemployment Rate in Great Bend is 28.9%.