Nelsonville, NY Map & Demographics
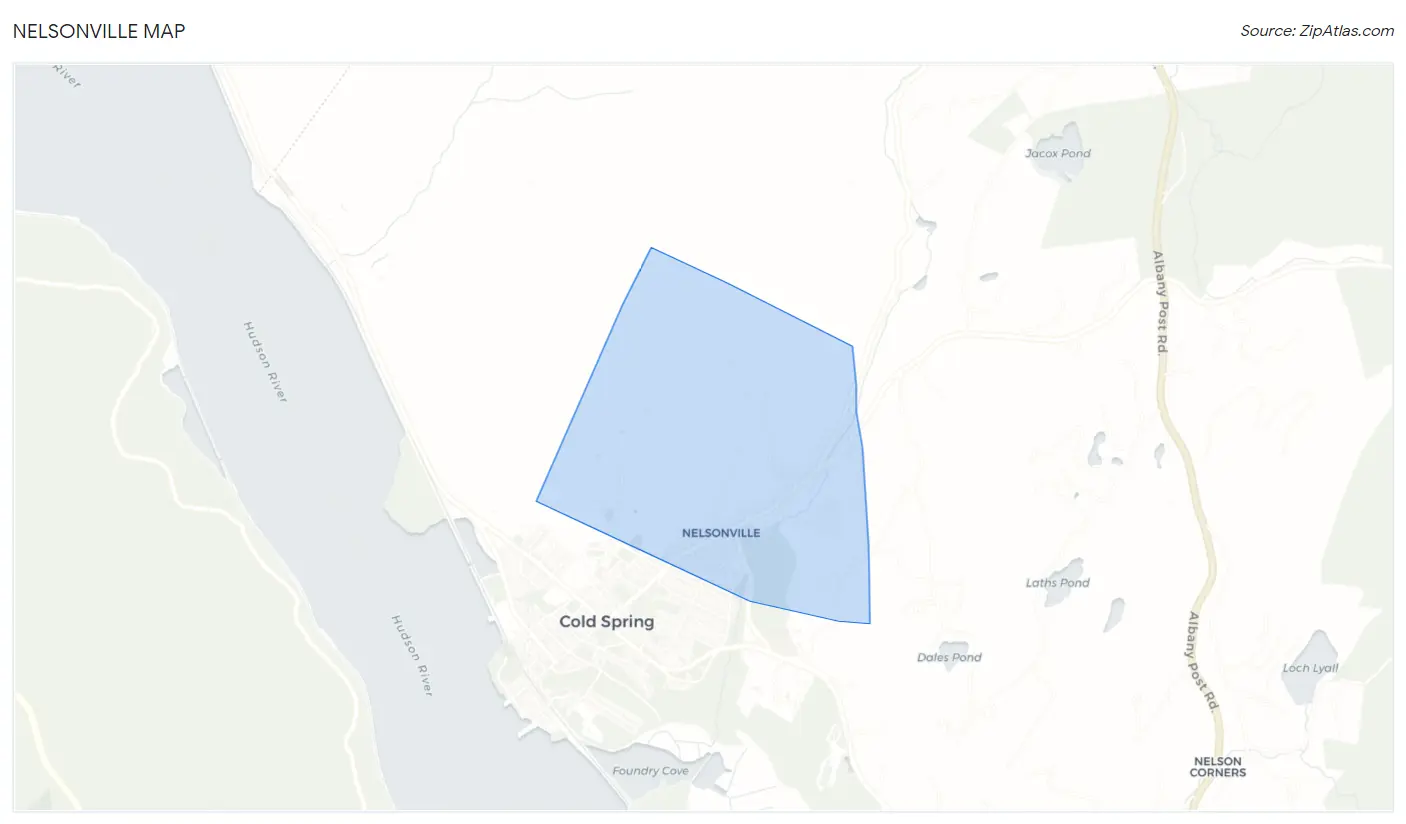
Nelsonville Map
Nelsonville Overview
$63,050
PER CAPITA INCOME
$153,250
AVG FAMILY INCOME
$127,292
AVG HOUSEHOLD INCOME
0.45
INEQUALITY / GINI INDEX
674
TOTAL POPULATION
368
MALE POPULATION
306
FEMALE POPULATION
120.26
MALES / 100 FEMALES
83.15
FEMALES / 100 MALES
44.6
MEDIAN AGE
3.2
AVG FAMILY SIZE
2.6
AVG HOUSEHOLD SIZE
371
LABOR FORCE [ PEOPLE ]
67.5%
PERCENT IN LABOR FORCE
5.9%
UNEMPLOYMENT RATE
Nelsonville Area Codes
Income in Nelsonville
Income Overview in Nelsonville
Per Capita Income in Nelsonville is $63,050, while median incomes of families and households are $153,250 and $127,292 respectively.
| Characteristic | Number | Measure |
| Per Capita Income | 674 | $63,050 |
| Median Family Income | 167 | $153,250 |
| Mean Family Income | 167 | $194,557 |
| Median Household Income | 251 | $127,292 |
| Mean Household Income | 251 | $167,029 |
| Income Deficit | 167 | $0 |
| Wage / Income Gap (%) | 674 | 0.00% |
| Wage / Income Gap ($) | 674 | 100.00¢ per $1 |
| Gini / Inequality Index | 674 | 0.45 |
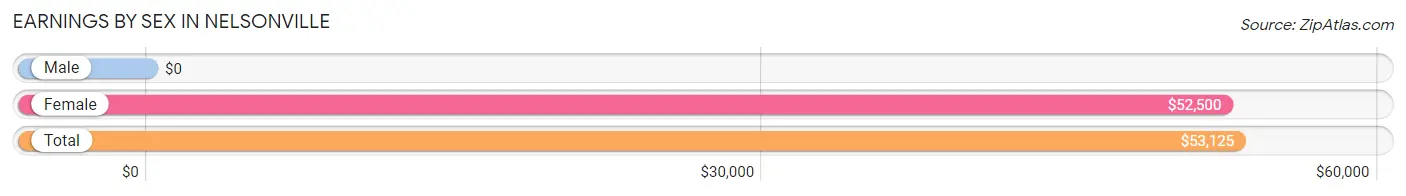
Earnings by Sex in Nelsonville
| Sex | Number | Average Earnings |
| Male | 201 (50.4%) | $0 |
| Female | 198 (49.6%) | $52,500 |
| Total | 399 (100.0%) | $53,125 |
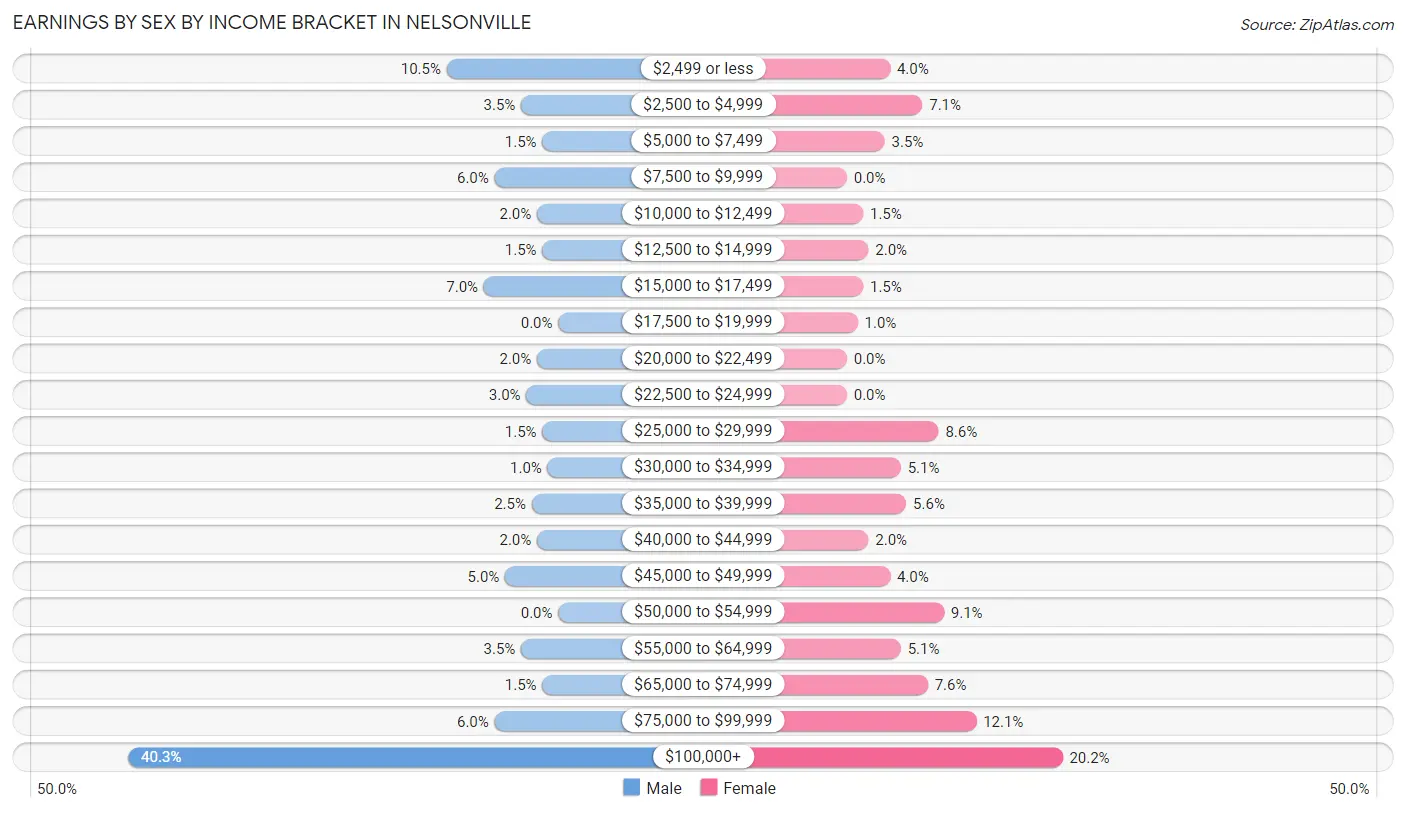
Earnings by Sex by Income Bracket in Nelsonville
The most common earnings brackets in Nelsonville are $100,000+ for men (81 | 40.3%) and $100,000+ for women (40 | 20.2%).
| Income | Male | Female |
| $2,499 or less | 21 (10.4%) | 8 (4.0%) |
| $2,500 to $4,999 | 7 (3.5%) | 14 (7.1%) |
| $5,000 to $7,499 | 3 (1.5%) | 7 (3.5%) |
| $7,500 to $9,999 | 12 (6.0%) | 0 (0.0%) |
| $10,000 to $12,499 | 4 (2.0%) | 3 (1.5%) |
| $12,500 to $14,999 | 3 (1.5%) | 4 (2.0%) |
| $15,000 to $17,499 | 14 (7.0%) | 3 (1.5%) |
| $17,500 to $19,999 | 0 (0.0%) | 2 (1.0%) |
| $20,000 to $22,499 | 4 (2.0%) | 0 (0.0%) |
| $22,500 to $24,999 | 6 (3.0%) | 0 (0.0%) |
| $25,000 to $29,999 | 3 (1.5%) | 17 (8.6%) |
| $30,000 to $34,999 | 2 (1.0%) | 10 (5.1%) |
| $35,000 to $39,999 | 5 (2.5%) | 11 (5.6%) |
| $40,000 to $44,999 | 4 (2.0%) | 4 (2.0%) |
| $45,000 to $49,999 | 10 (5.0%) | 8 (4.0%) |
| $50,000 to $54,999 | 0 (0.0%) | 18 (9.1%) |
| $55,000 to $64,999 | 7 (3.5%) | 10 (5.1%) |
| $65,000 to $74,999 | 3 (1.5%) | 15 (7.6%) |
| $75,000 to $99,999 | 12 (6.0%) | 24 (12.1%) |
| $100,000+ | 81 (40.3%) | 40 (20.2%) |
| Total | 201 (100.0%) | 198 (100.0%) |
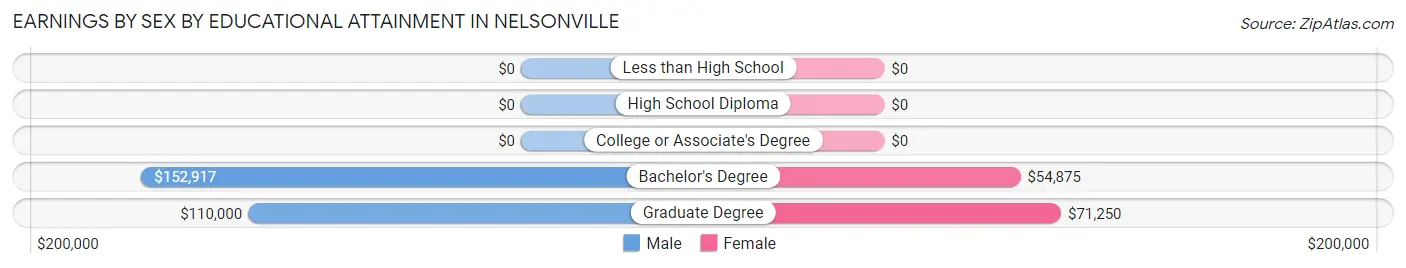
Earnings by Sex by Educational Attainment in Nelsonville
Average earnings in Nelsonville are $93,750 for men and $54,125 for women, a difference of 42.3%. Men with an educational attainment of bachelor's degree enjoy the highest average annual earnings of $152,917, while those with graduate degree education earn the least with $110,000. Women with an educational attainment of graduate degree earn the most with the average annual earnings of $71,250, while those with bachelor's degree education have the smallest earnings of $54,875.
| Educational Attainment | Male Income | Female Income |
| Less than High School | - | - |
| High School Diploma | - | - |
| College or Associate's Degree | - | - |
| Bachelor's Degree | $152,917 | $54,875 |
| Graduate Degree | $110,000 | $71,250 |
| Total | $93,750 | $54,125 |
Family Income in Nelsonville
Family Income Brackets in Nelsonville
According to the Nelsonville family income data, there are 64 families falling into the $200,000+ income range, which is the most common income bracket and makes up 38.3% of all families.
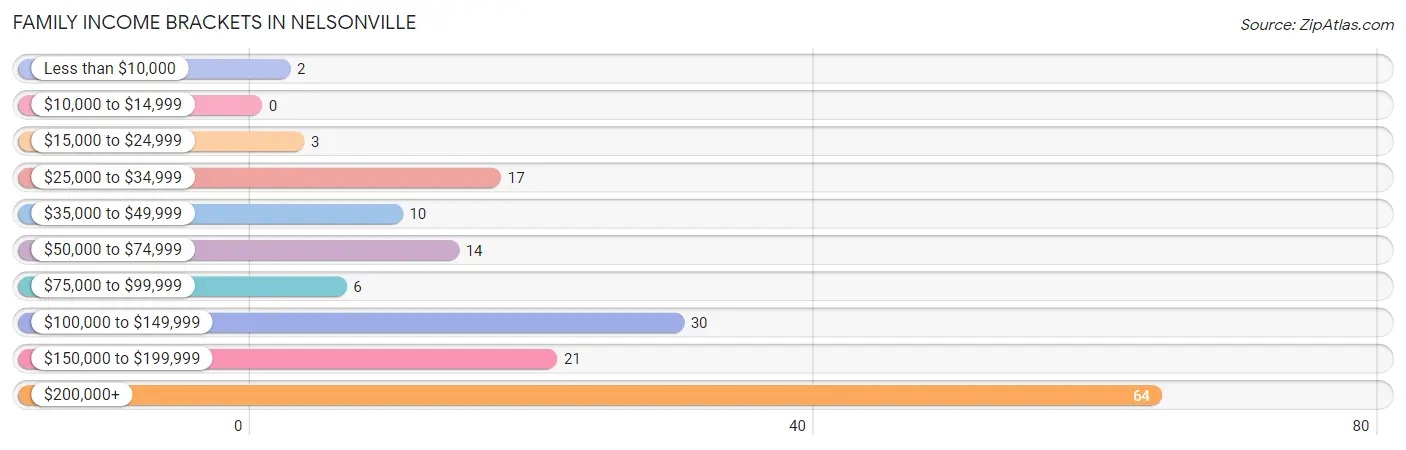
| Income Bracket | # Families | % Families |
| Less than $10,000 | 2 | 1.2% |
| $10,000 to $14,999 | 0 | 0.0% |
| $15,000 to $24,999 | 3 | 1.8% |
| $25,000 to $34,999 | 17 | 10.2% |
| $35,000 to $49,999 | 10 | 6.0% |
| $50,000 to $74,999 | 14 | 8.4% |
| $75,000 to $99,999 | 6 | 3.6% |
| $100,000 to $149,999 | 30 | 18.0% |
| $150,000 to $199,999 | 21 | 12.6% |
| $200,000+ | 64 | 38.3% |
Family Income by Famaliy Size in Nelsonville
4-person families (30 | 18.0%) account for the highest median family income in Nelsonville with $218,750 per family, while 3-person families (56 | 33.5%) have the highest median income of $72,333 per family member.
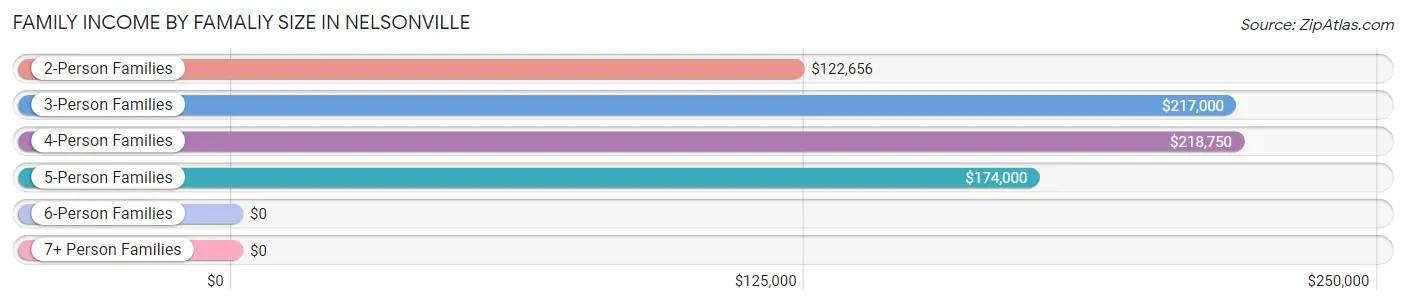
| Income Bracket | # Families | Median Income |
| 2-Person Families | 65 (38.9%) | $122,656 |
| 3-Person Families | 56 (33.5%) | $217,000 |
| 4-Person Families | 30 (18.0%) | $218,750 |
| 5-Person Families | 8 (4.8%) | $174,000 |
| 6-Person Families | 6 (3.6%) | $0 |
| 7+ Person Families | 2 (1.2%) | $0 |
| Total | 167 (100.0%) | $153,250 |
Family Income by Number of Earners in Nelsonville
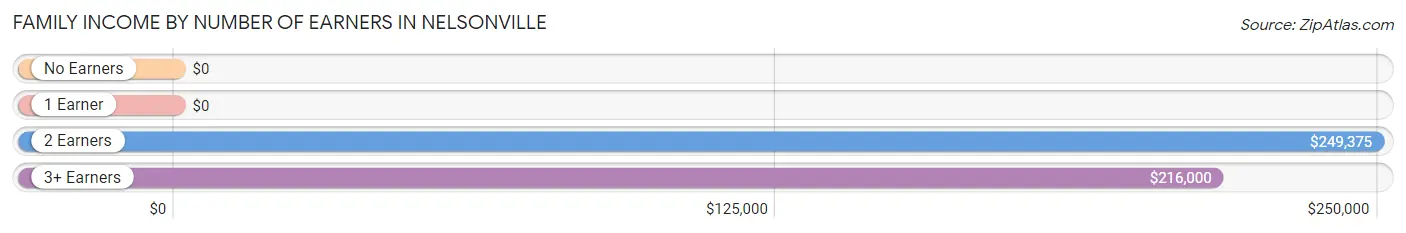
| Number of Earners | # Families | Median Income |
| No Earners | 18 (10.8%) | $0 |
| 1 Earner | 48 (28.7%) | $0 |
| 2 Earners | 69 (41.3%) | $249,375 |
| 3+ Earners | 32 (19.2%) | $216,000 |
| Total | 167 (100.0%) | $153,250 |
Household Income in Nelsonville
Household Income Brackets in Nelsonville
With 80 households falling in the category, the $200,000+ income range is the most frequent in Nelsonville, accounting for 31.9% of all households. In contrast, only 2 households (0.8%) fall into the less than $10,000 income bracket, making it the least populous group.
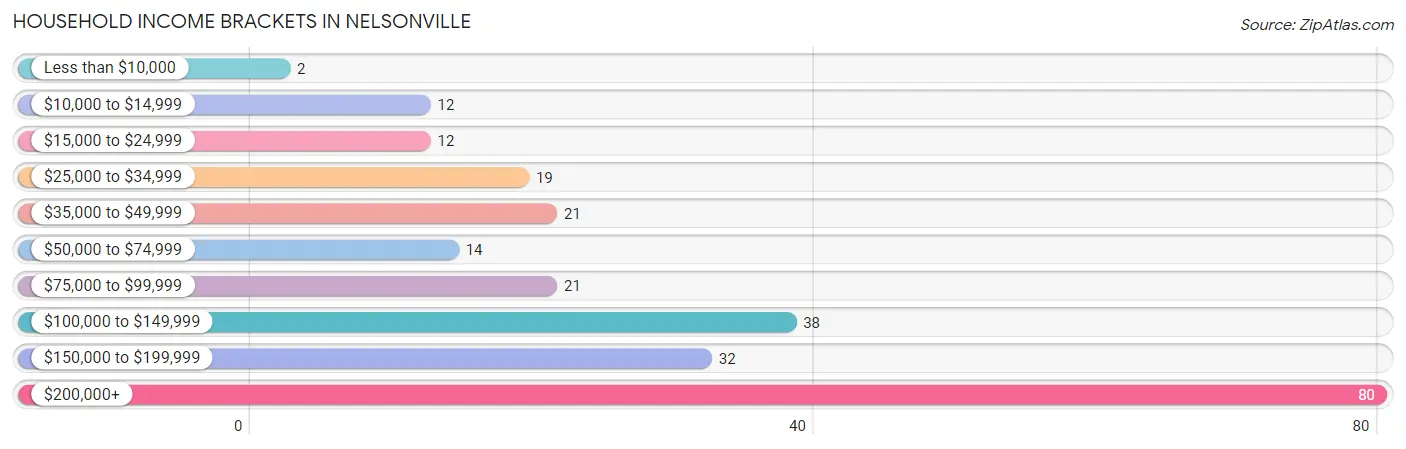
| Income Bracket | # Households | % Households |
| Less than $10,000 | 2 | 0.8% |
| $10,000 to $14,999 | 12 | 4.8% |
| $15,000 to $24,999 | 12 | 4.8% |
| $25,000 to $34,999 | 19 | 7.6% |
| $35,000 to $49,999 | 21 | 8.4% |
| $50,000 to $74,999 | 14 | 5.6% |
| $75,000 to $99,999 | 21 | 8.4% |
| $100,000 to $149,999 | 38 | 15.1% |
| $150,000 to $199,999 | 32 | 12.7% |
| $200,000+ | 80 | 31.9% |
Household Income by Householder Age in Nelsonville
The median household income in Nelsonville is $127,292, with the highest median household income of $178,750 found in the 45 to 64 years age bracket for the primary householder. A total of 126 households (50.2%) fall into this category.
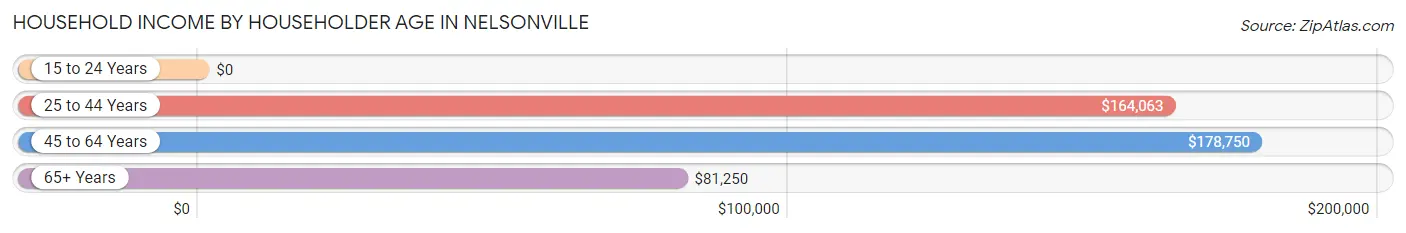
| Income Bracket | # Households | Median Income |
| 15 to 24 Years | 0 (0.0%) | $0 |
| 25 to 44 Years | 49 (19.5%) | $164,063 |
| 45 to 64 Years | 126 (50.2%) | $178,750 |
| 65+ Years | 76 (30.3%) | $81,250 |
| Total | 251 (100.0%) | $127,292 |
Poverty in Nelsonville
Income Below Poverty by Sex and Age in Nelsonville
With 3.0% poverty level for males and 10.2% for females among the residents of Nelsonville, 75 year old and over males and 15 year old females are the most vulnerable to poverty, with 3 males (18.8%) and 6 females (75.0%) in their respective age groups living below the poverty level.
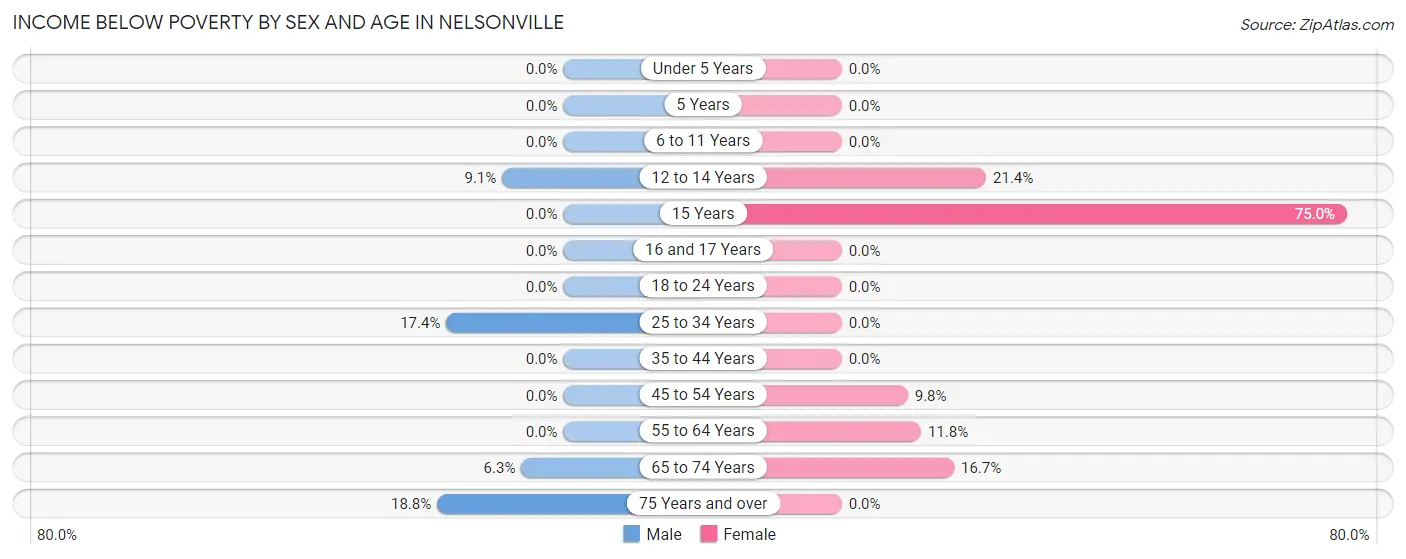
| Age Bracket | Male | Female |
| Under 5 Years | 0 (0.0%) | 0 (0.0%) |
| 5 Years | 0 (0.0%) | 0 (0.0%) |
| 6 to 11 Years | 0 (0.0%) | 0 (0.0%) |
| 12 to 14 Years | 3 (9.1%) | 3 (21.4%) |
| 15 Years | 0 (0.0%) | 6 (75.0%) |
| 16 and 17 Years | 0 (0.0%) | 0 (0.0%) |
| 18 to 24 Years | 0 (0.0%) | 0 (0.0%) |
| 25 to 34 Years | 4 (17.4%) | 0 (0.0%) |
| 35 to 44 Years | 0 (0.0%) | 0 (0.0%) |
| 45 to 54 Years | 0 (0.0%) | 5 (9.8%) |
| 55 to 64 Years | 0 (0.0%) | 8 (11.8%) |
| 65 to 74 Years | 1 (6.2%) | 9 (16.7%) |
| 75 Years and over | 3 (18.8%) | 0 (0.0%) |
| Total | 11 (3.0%) | 31 (10.2%) |
Income Above Poverty by Sex and Age in Nelsonville
According to the poverty statistics in Nelsonville, males aged under 5 years and females aged under 5 years are the age groups that are most secure financially, with 100.0% of males and 100.0% of females in these age groups living above the poverty line.
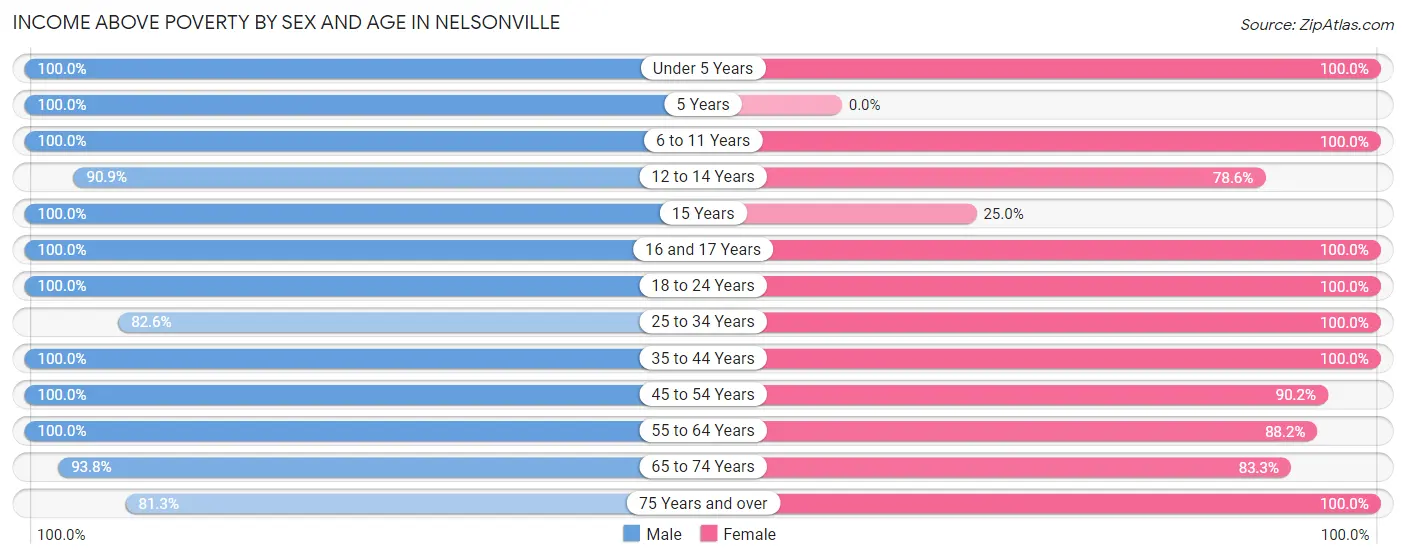
| Age Bracket | Male | Female |
| Under 5 Years | 17 (100.0%) | 5 (100.0%) |
| 5 Years | 14 (100.0%) | 0 (0.0%) |
| 6 to 11 Years | 22 (100.0%) | 3 (100.0%) |
| 12 to 14 Years | 30 (90.9%) | 11 (78.6%) |
| 15 Years | 5 (100.0%) | 2 (25.0%) |
| 16 and 17 Years | 14 (100.0%) | 8 (100.0%) |
| 18 to 24 Years | 40 (100.0%) | 12 (100.0%) |
| 25 to 34 Years | 19 (82.6%) | 34 (100.0%) |
| 35 to 44 Years | 50 (100.0%) | 35 (100.0%) |
| 45 to 54 Years | 37 (100.0%) | 46 (90.2%) |
| 55 to 64 Years | 81 (100.0%) | 60 (88.2%) |
| 65 to 74 Years | 15 (93.8%) | 45 (83.3%) |
| 75 Years and over | 13 (81.2%) | 11 (100.0%) |
| Total | 357 (97.0%) | 272 (89.8%) |
Income Below Poverty Among Married-Couple Families in Nelsonville
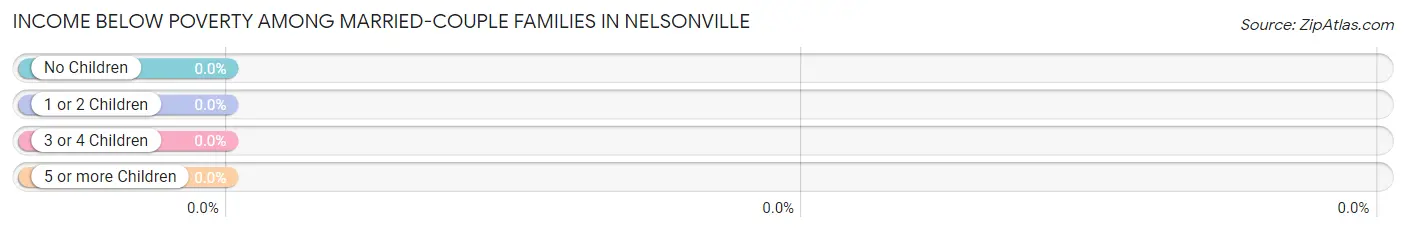
| Children | Above Poverty | Below Poverty |
| No Children | 68 (100.0%) | 0 (0.0%) |
| 1 or 2 Children | 36 (100.0%) | 0 (0.0%) |
| 3 or 4 Children | 11 (100.0%) | 0 (0.0%) |
| 5 or more Children | 0 (0.0%) | 0 (0.0%) |
| Total | 115 (100.0%) | 0 (0.0%) |
Income Below Poverty Among Single-Parent Households in Nelsonville
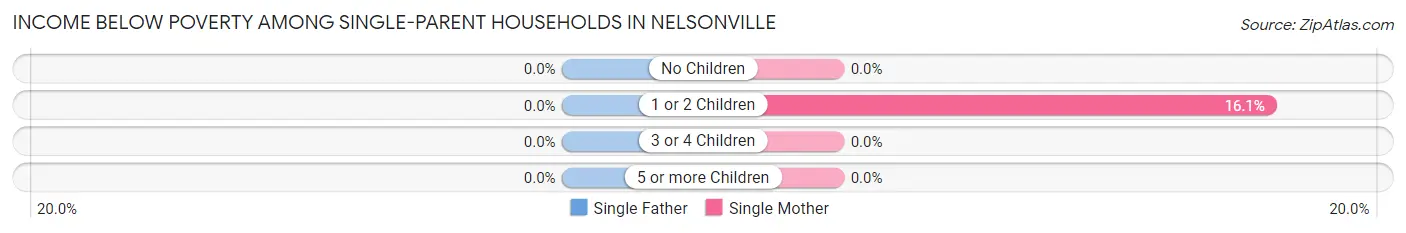
| Children | Single Father | Single Mother |
| No Children | 0 (0.0%) | 0 (0.0%) |
| 1 or 2 Children | 0 (0.0%) | 5 (16.1%) |
| 3 or 4 Children | 0 (0.0%) | 0 (0.0%) |
| 5 or more Children | 0 (0.0%) | 0 (0.0%) |
| Total | 0 (0.0%) | 5 (9.8%) |
Income Below Poverty Among Married-Couple vs Single-Parent Households in Nelsonville
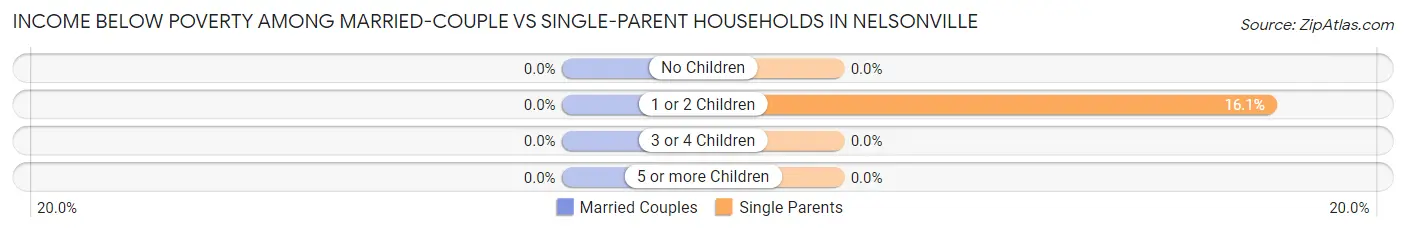
| Children | Married-Couple Families | Single-Parent Households |
| No Children | 0 (0.0%) | 0 (0.0%) |
| 1 or 2 Children | 0 (0.0%) | 5 (16.1%) |
| 3 or 4 Children | 0 (0.0%) | 0 (0.0%) |
| 5 or more Children | 0 (0.0%) | 0 (0.0%) |
| Total | 0 (0.0%) | 5 (9.6%) |
Race in Nelsonville
The most populous races in Nelsonville are White / Caucasian (583 | 86.5%), Two or more Races (62 | 9.2%), and Hispanic or Latino (27 | 4.0%).
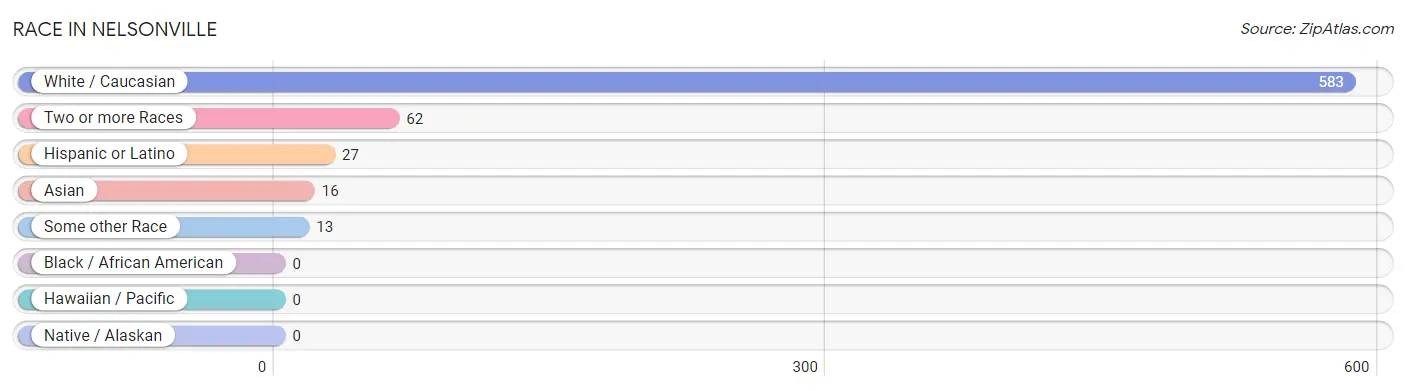
| Race | # Population | % Population |
| Asian | 16 | 2.4% |
| Black / African American | 0 | 0.0% |
| Hawaiian / Pacific | 0 | 0.0% |
| Hispanic or Latino | 27 | 4.0% |
| Native / Alaskan | 0 | 0.0% |
| White / Caucasian | 583 | 86.5% |
| Two or more Races | 62 | 9.2% |
| Some other Race | 13 | 1.9% |
| Total | 674 | 100.0% |
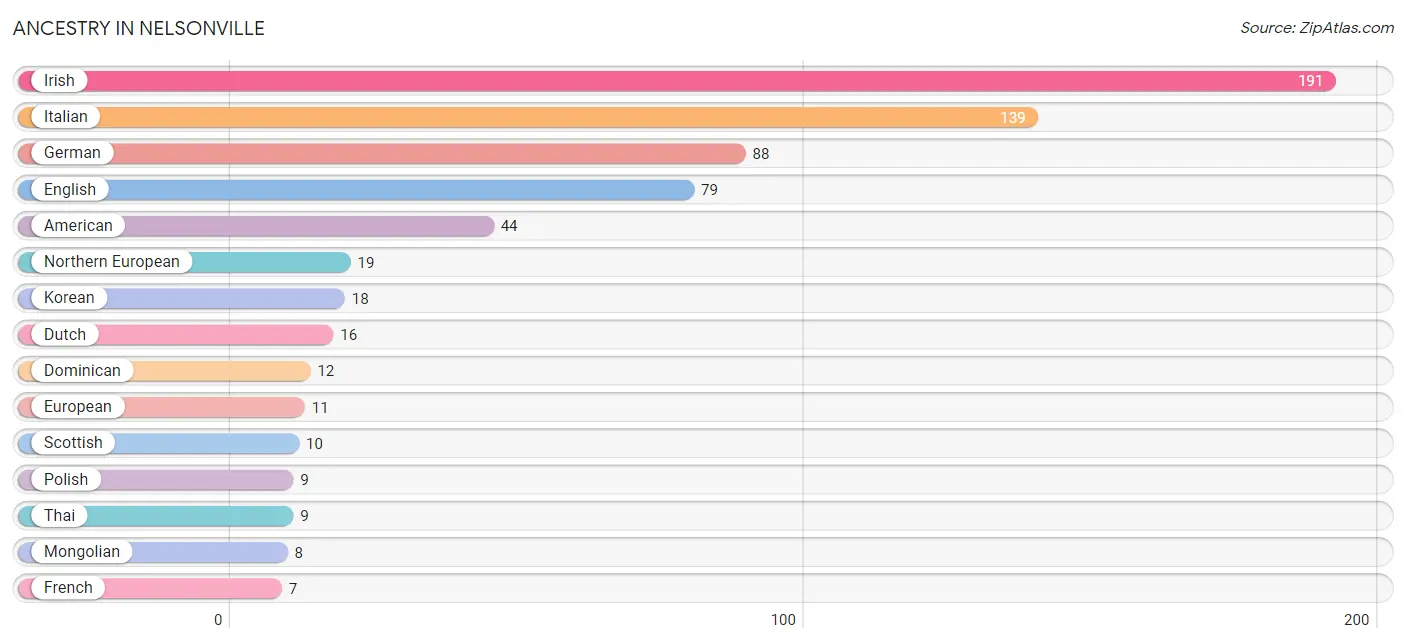
Ancestry in Nelsonville
The most populous ancestries reported in Nelsonville are Irish (191 | 28.3%), Italian (139 | 20.6%), German (88 | 13.1%), English (79 | 11.7%), and American (44 | 6.5%), together accounting for 80.3% of all Nelsonville residents.
| Ancestry | # Population | % Population |
| Albanian | 4 | 0.6% |
| American | 44 | 6.5% |
| Austrian | 2 | 0.3% |
| Basque | 2 | 0.3% |
| British | 3 | 0.4% |
| Dominican | 12 | 1.8% |
| Dutch | 16 | 2.4% |
| Eastern European | 4 | 0.6% |
| English | 79 | 11.7% |
| European | 11 | 1.6% |
| French | 7 | 1.0% |
| German | 88 | 13.1% |
| Greek | 3 | 0.4% |
| Irish | 191 | 28.3% |
| Italian | 139 | 20.6% |
| Korean | 18 | 2.7% |
| Latvian | 6 | 0.9% |
| Mexican | 2 | 0.3% |
| Mongolian | 8 | 1.2% |
| New Zealander | 1 | 0.2% |
| Northern European | 19 | 2.8% |
| Norwegian | 2 | 0.3% |
| Polish | 9 | 1.3% |
| Puerto Rican | 7 | 1.0% |
| Russian | 5 | 0.7% |
| Scotch-Irish | 5 | 0.7% |
| Scottish | 10 | 1.5% |
| Spaniard | 6 | 0.9% |
| Swedish | 5 | 0.7% |
| Swiss | 2 | 0.3% |
| Thai | 9 | 1.3% |
| Ukrainian | 3 | 0.4% |
| Welsh | 4 | 0.6% | View All 33 Rows |
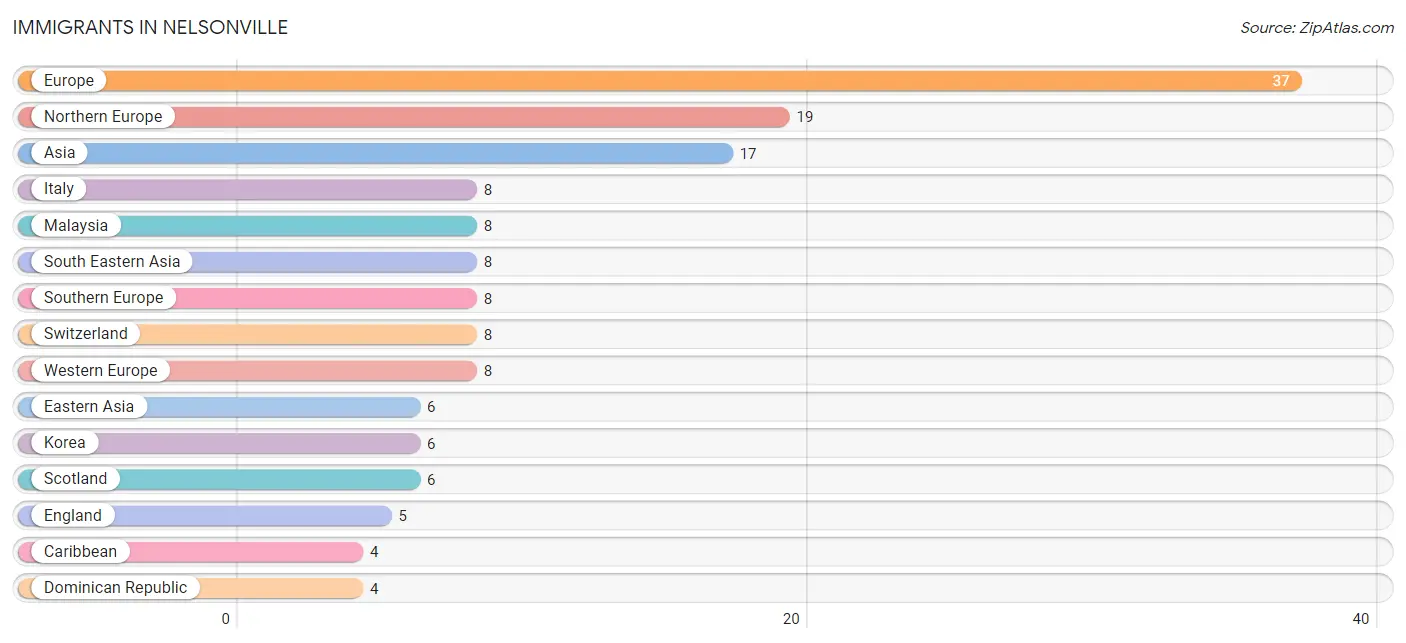
Immigrants in Nelsonville
The most numerous immigrant groups reported in Nelsonville came from Europe (37 | 5.5%), Northern Europe (19 | 2.8%), Asia (17 | 2.5%), Italy (8 | 1.2%), and Malaysia (8 | 1.2%), together accounting for 13.2% of all Nelsonville residents.
| Immigration Origin | # Population | % Population |
| Asia | 17 | 2.5% |
| Canada | 2 | 0.3% |
| Caribbean | 4 | 0.6% |
| Dominican Republic | 4 | 0.6% |
| Eastern Asia | 6 | 0.9% |
| Eastern Europe | 2 | 0.3% |
| England | 5 | 0.7% |
| Europe | 37 | 5.5% |
| India | 3 | 0.4% |
| Ireland | 3 | 0.4% |
| Italy | 8 | 1.2% |
| Korea | 6 | 0.9% |
| Latin America | 4 | 0.6% |
| Malaysia | 8 | 1.2% |
| Northern Europe | 19 | 2.8% |
| Scotland | 6 | 0.9% |
| South Central Asia | 3 | 0.4% |
| South Eastern Asia | 8 | 1.2% |
| Southern Europe | 8 | 1.2% |
| Switzerland | 8 | 1.2% |
| Western Europe | 8 | 1.2% | View All 21 Rows |
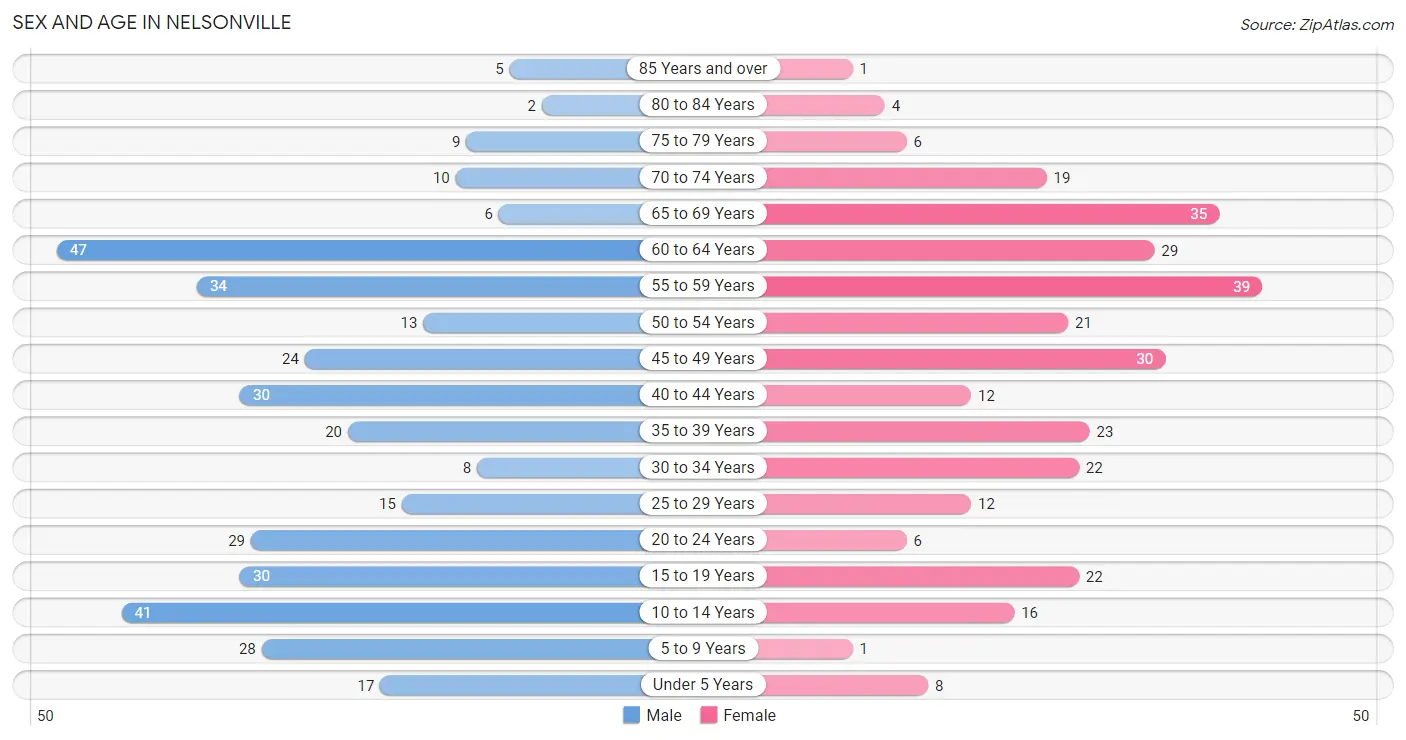
Sex and Age in Nelsonville
Sex and Age in Nelsonville
The most populous age groups in Nelsonville are 60 to 64 Years (47 | 12.8%) for men and 55 to 59 Years (39 | 12.8%) for women.
| Age Bracket | Male | Female |
| Under 5 Years | 17 (4.6%) | 8 (2.6%) |
| 5 to 9 Years | 28 (7.6%) | 1 (0.3%) |
| 10 to 14 Years | 41 (11.1%) | 16 (5.2%) |
| 15 to 19 Years | 30 (8.2%) | 22 (7.2%) |
| 20 to 24 Years | 29 (7.9%) | 6 (2.0%) |
| 25 to 29 Years | 15 (4.1%) | 12 (3.9%) |
| 30 to 34 Years | 8 (2.2%) | 22 (7.2%) |
| 35 to 39 Years | 20 (5.4%) | 23 (7.5%) |
| 40 to 44 Years | 30 (8.2%) | 12 (3.9%) |
| 45 to 49 Years | 24 (6.5%) | 30 (9.8%) |
| 50 to 54 Years | 13 (3.5%) | 21 (6.9%) |
| 55 to 59 Years | 34 (9.2%) | 39 (12.8%) |
| 60 to 64 Years | 47 (12.8%) | 29 (9.5%) |
| 65 to 69 Years | 6 (1.6%) | 35 (11.4%) |
| 70 to 74 Years | 10 (2.7%) | 19 (6.2%) |
| 75 to 79 Years | 9 (2.5%) | 6 (2.0%) |
| 80 to 84 Years | 2 (0.5%) | 4 (1.3%) |
| 85 Years and over | 5 (1.4%) | 1 (0.3%) |
| Total | 368 (100.0%) | 306 (100.0%) |
Families and Households in Nelsonville
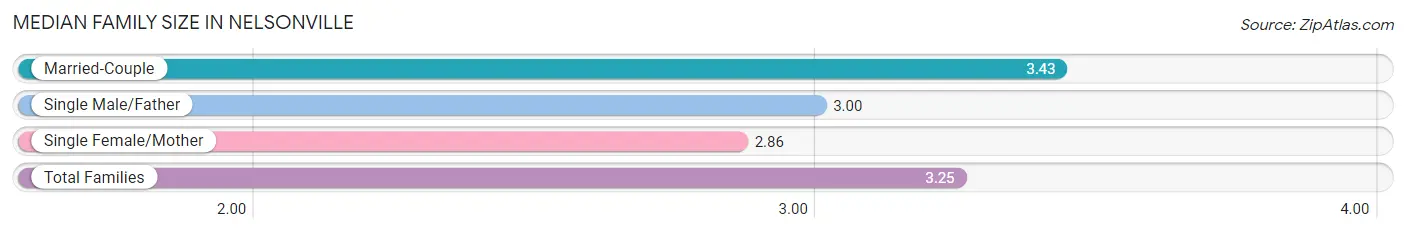
Median Family Size in Nelsonville
The median family size in Nelsonville is 3.25 persons per family, with married-couple families (115 | 68.9%) accounting for the largest median family size of 3.43 persons per family. On the other hand, single female/mother families (51 | 30.5%) represent the smallest median family size with 2.86 persons per family.
| Family Type | # Families | Family Size |
| Married-Couple | 115 (68.9%) | 3.43 |
| Single Male/Father | 1 (0.6%) | 3.00 |
| Single Female/Mother | 51 (30.5%) | 2.86 |
| Total Families | 167 (100.0%) | 3.25 |
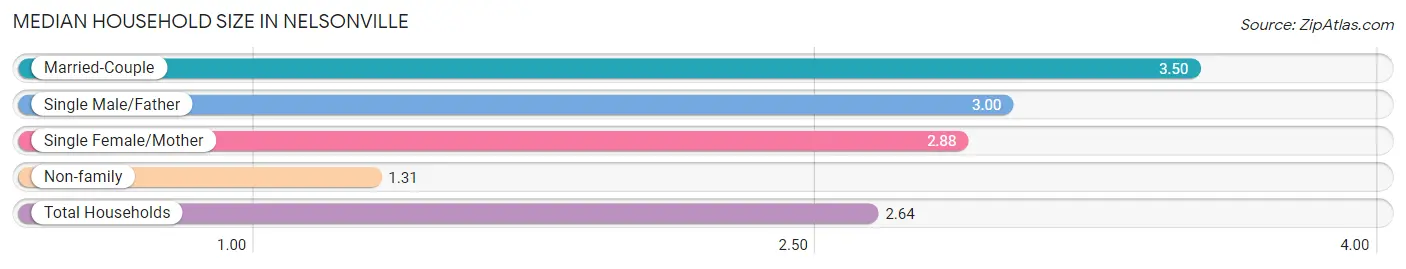
Median Household Size in Nelsonville
The median household size in Nelsonville is 2.64 persons per household, with married-couple households (115 | 45.8%) accounting for the largest median household size of 3.5 persons per household. non-family households (84 | 33.5%) represent the smallest median household size with 1.31 persons per household.
| Household Type | # Households | Household Size |
| Married-Couple | 115 (45.8%) | 3.50 |
| Single Male/Father | 1 (0.4%) | 3.00 |
| Single Female/Mother | 51 (20.3%) | 2.88 |
| Non-family | 84 (33.5%) | 1.31 |
| Total Households | 251 (100.0%) | 2.64 |
Household Size by Marriage Status in Nelsonville
Out of a total of 251 households in Nelsonville, 167 (66.5%) are family households, while 84 (33.5%) are nonfamily households. The most numerous type of family households are 2-person households, comprising 65, and the most common type of nonfamily households are 1-person households, comprising 70.
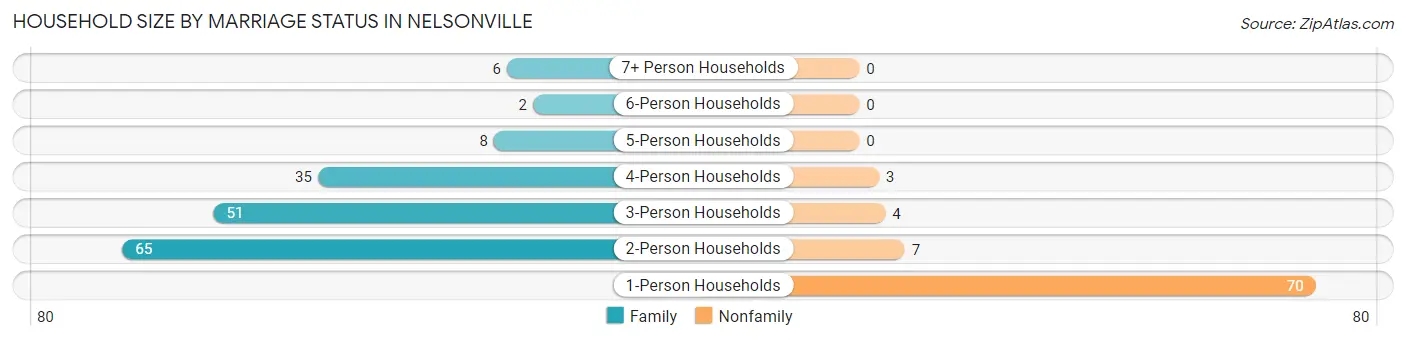
| Household Size | Family Households | Nonfamily Households |
| 1-Person Households | - | 70 (27.9%) |
| 2-Person Households | 65 (25.9%) | 7 (2.8%) |
| 3-Person Households | 51 (20.3%) | 4 (1.6%) |
| 4-Person Households | 35 (13.9%) | 3 (1.2%) |
| 5-Person Households | 8 (3.2%) | 0 (0.0%) |
| 6-Person Households | 2 (0.8%) | 0 (0.0%) |
| 7+ Person Households | 6 (2.4%) | 0 (0.0%) |
| Total | 167 (66.5%) | 84 (33.5%) |
Female Fertility in Nelsonville
Fertility by Age in Nelsonville
| Age Bracket | Women with Births | Births / 1,000 Women |
| 15 to 19 years | 0 (0.0%) | 0.0 |
| 20 to 34 years | 0 (0.0%) | 0.0 |
| 35 to 50 years | 0 (0.0%) | 0.0 |
| Total | 0 (0.0%) | 0.0 |
Fertility by Age by Marriage Status in Nelsonville
| Age Bracket | Married | Unmarried |
| 15 to 19 years | 0 (0.0%) | 0 (0.0%) |
| 20 to 34 years | 0 (0.0%) | 0 (0.0%) |
| 35 to 50 years | 0 (0.0%) | 0 (0.0%) |
| Total | 0 (0.0%) | 0 (0.0%) |
Fertility by Education in Nelsonville
| Educational Attainment | Women with Births | Births / 1,000 Women |
| Less than High School | 0 (0.0%) | 0.0 |
| High School Diploma | 0 (0.0%) | 0.0 |
| College or Associate's Degree | 0 (0.0%) | 0.0 |
| Bachelor's Degree | 0 (0.0%) | 0.0 |
| Graduate Degree | 0 (0.0%) | 0.0 |
| Total | 0 (0.0%) | 0.0 |
Fertility by Education by Marriage Status in Nelsonville
| Educational Attainment | Married | Unmarried |
| Less than High School | 0 (0.0%) | 0 (0.0%) |
| High School Diploma | 0 (0.0%) | 0 (0.0%) |
| College or Associate's Degree | 0 (0.0%) | 0 (0.0%) |
| Bachelor's Degree | 0 (0.0%) | 0 (0.0%) |
| Graduate Degree | 0 (0.0%) | 0 (0.0%) |
| Total | 0 (0.0%) | 0 (0.0%) |
Employment Characteristics in Nelsonville
Employment by Class of Employer in Nelsonville
Among the 343 employed individuals in Nelsonville, private company employees (174 | 50.7%), not-for-profit organizations (65 | 19.0%), and self-employed (not incorporated) (37 | 10.8%) make up the most common classes of employment.
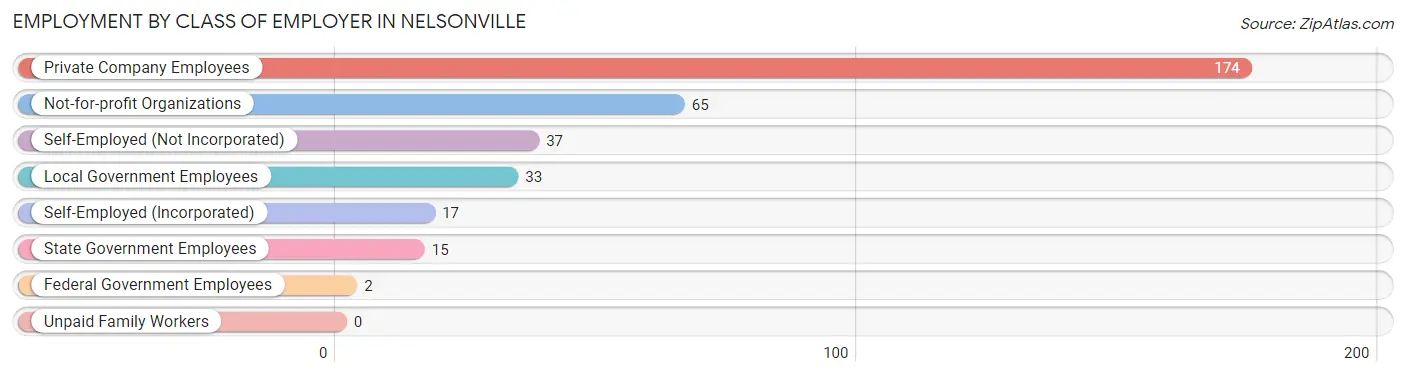
| Employer Class | # Employees | % Employees |
| Private Company Employees | 174 | 50.7% |
| Self-Employed (Incorporated) | 17 | 5.0% |
| Self-Employed (Not Incorporated) | 37 | 10.8% |
| Not-for-profit Organizations | 65 | 19.0% |
| Local Government Employees | 33 | 9.6% |
| State Government Employees | 15 | 4.4% |
| Federal Government Employees | 2 | 0.6% |
| Unpaid Family Workers | 0 | 0.0% |
| Total | 343 | 100.0% |
Employment Status by Age in Nelsonville
According to the labor force statistics for Nelsonville, out of the total population over 16 years of age (550), 67.5% or 371 individuals are in the labor force, with 5.9% or 22 of them unemployed. The age group with the highest labor force participation rate is 30 to 34 years, with 100.0% or 30 individuals in the labor force. Within the labor force, the 20 to 24 years age range has the highest percentage of unemployed individuals, with 58.1% or 18 of them being unemployed.
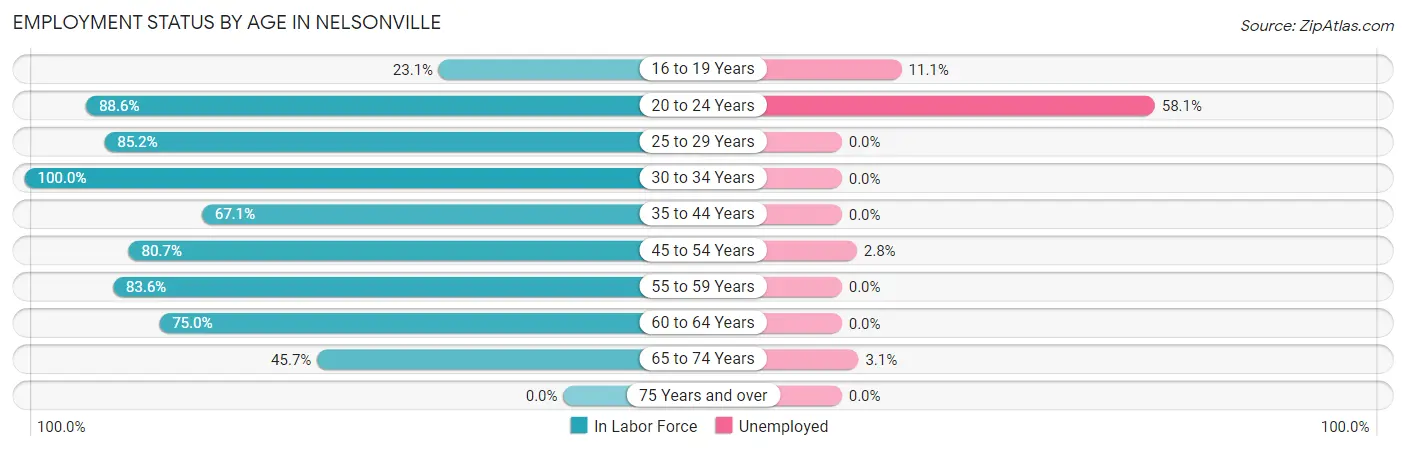
| Age Bracket | In Labor Force | Unemployed |
| 16 to 19 Years | 9 (23.1%) | 1 (11.1%) |
| 20 to 24 Years | 31 (88.6%) | 18 (58.1%) |
| 25 to 29 Years | 23 (85.2%) | 0 (0.0%) |
| 30 to 34 Years | 30 (100.0%) | 0 (0.0%) |
| 35 to 44 Years | 57 (67.1%) | 0 (0.0%) |
| 45 to 54 Years | 71 (80.7%) | 2 (2.8%) |
| 55 to 59 Years | 61 (83.6%) | 0 (0.0%) |
| 60 to 64 Years | 57 (75.0%) | 0 (0.0%) |
| 65 to 74 Years | 32 (45.7%) | 1 (3.1%) |
| 75 Years and over | 0 (0.0%) | 0 (0.0%) |
| Total | 371 (67.5%) | 22 (5.9%) |
Employment Status by Educational Attainment in Nelsonville
According to labor force statistics for Nelsonville, 78.9% of individuals (299) out of the total population between 25 and 64 years of age (379) are in the labor force, with 0.7% or 2 of them being unemployed. The group with the highest labor force participation rate are those with the educational attainment of bachelor's degree or higher, with 87.0% or 201 individuals in the labor force. Within the labor force, individuals with college / associate degree education have the highest percentage of unemployment, with 3.1% or 2 of them being unemployed.
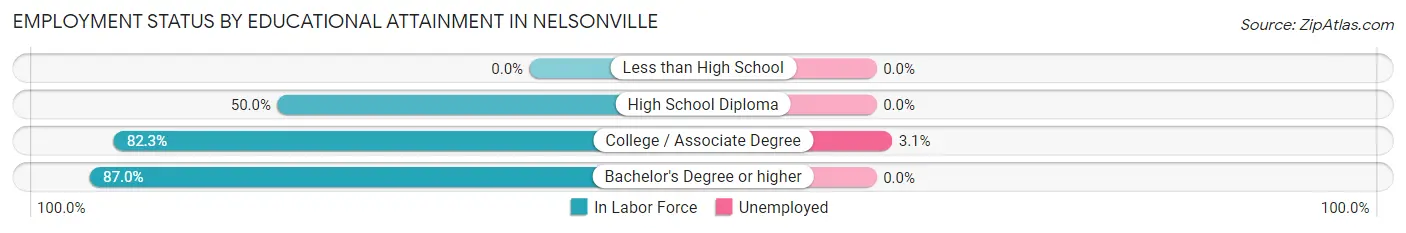
| Educational Attainment | In Labor Force | Unemployed |
| Less than High School | 0 (0.0%) | 0 (0.0%) |
| High School Diploma | 33 (50.0%) | 0 (0.0%) |
| College / Associate Degree | 65 (82.3%) | 2 (3.1%) |
| Bachelor's Degree or higher | 201 (87.0%) | 0 (0.0%) |
| Total | 299 (78.9%) | 3 (0.7%) |
Employment Occupations by Sex in Nelsonville
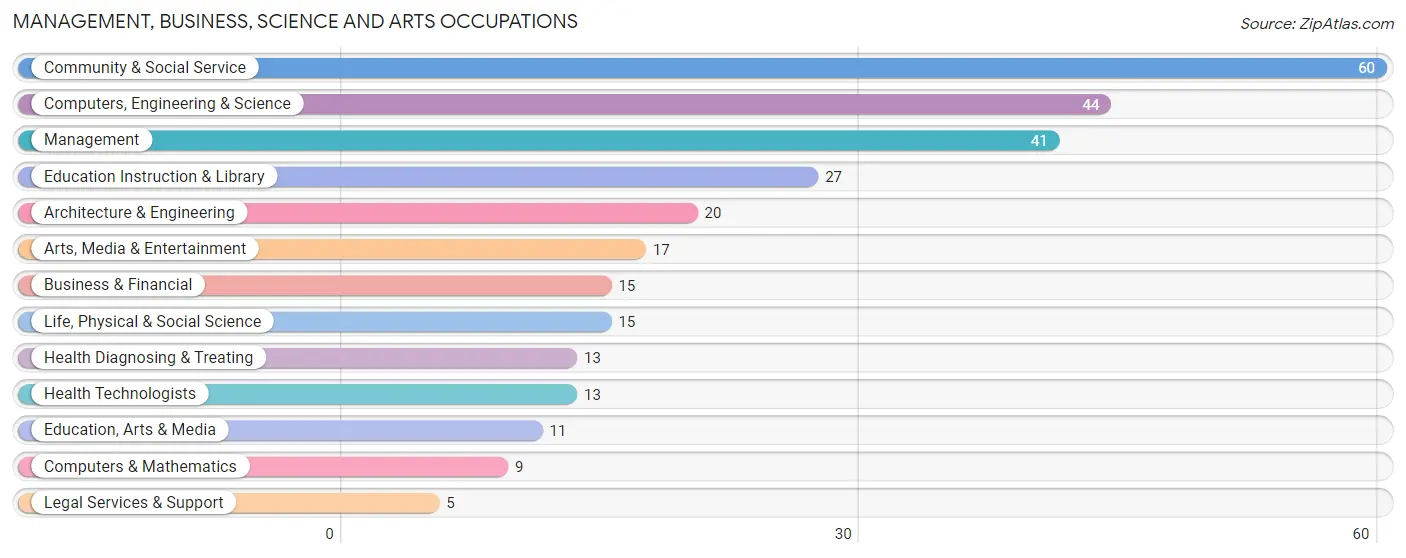
Management, Business, Science and Arts Occupations
The most common Management, Business, Science and Arts occupations in Nelsonville are Community & Social Service (60 | 17.2%), Computers, Engineering & Science (44 | 12.6%), Management (41 | 11.7%), Education Instruction & Library (27 | 7.7%), and Architecture & Engineering (20 | 5.7%).
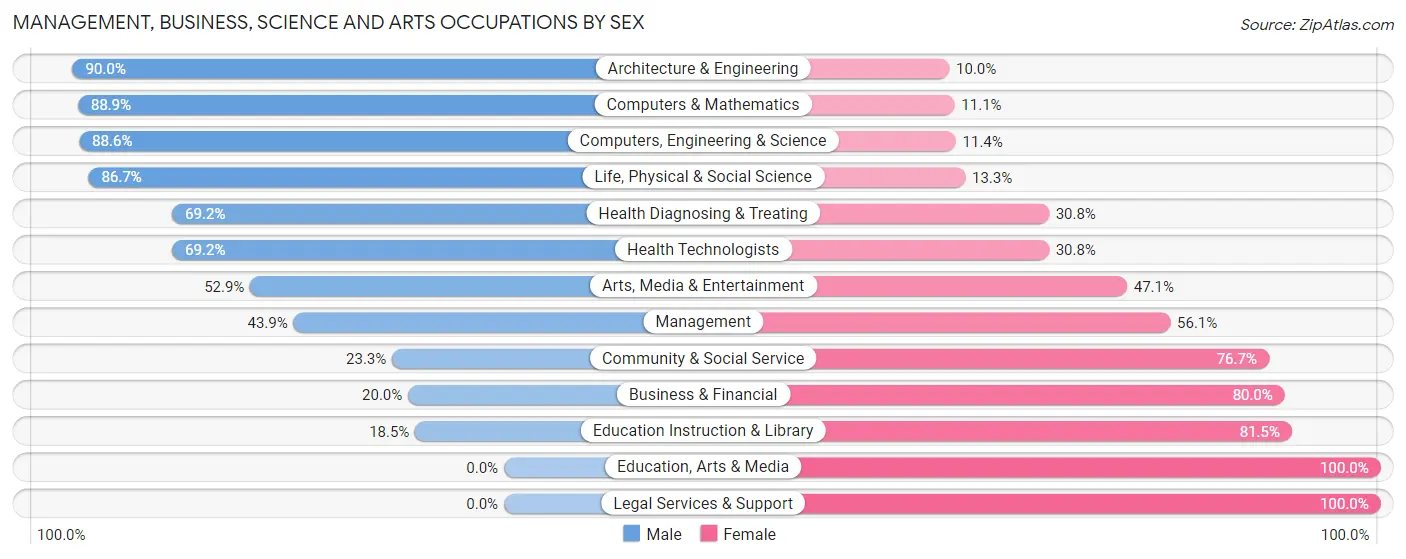
Management, Business, Science and Arts Occupations by Sex
Within the Management, Business, Science and Arts occupations in Nelsonville, the most male-oriented occupations are Architecture & Engineering (90.0%), Computers & Mathematics (88.9%), and Computers, Engineering & Science (88.6%), while the most female-oriented occupations are Education, Arts & Media (100.0%), Legal Services & Support (100.0%), and Education Instruction & Library (81.5%).
| Occupation | Male | Female |
| Management | 18 (43.9%) | 23 (56.1%) |
| Business & Financial | 3 (20.0%) | 12 (80.0%) |
| Computers, Engineering & Science | 39 (88.6%) | 5 (11.4%) |
| Computers & Mathematics | 8 (88.9%) | 1 (11.1%) |
| Architecture & Engineering | 18 (90.0%) | 2 (10.0%) |
| Life, Physical & Social Science | 13 (86.7%) | 2 (13.3%) |
| Community & Social Service | 14 (23.3%) | 46 (76.7%) |
| Education, Arts & Media | 0 (0.0%) | 11 (100.0%) |
| Legal Services & Support | 0 (0.0%) | 5 (100.0%) |
| Education Instruction & Library | 5 (18.5%) | 22 (81.5%) |
| Arts, Media & Entertainment | 9 (52.9%) | 8 (47.1%) |
| Health Diagnosing & Treating | 9 (69.2%) | 4 (30.8%) |
| Health Technologists | 9 (69.2%) | 4 (30.8%) |
| Total (Category) | 83 (48.0%) | 90 (52.0%) |
| Total (Overall) | 171 (49.0%) | 178 (51.0%) |
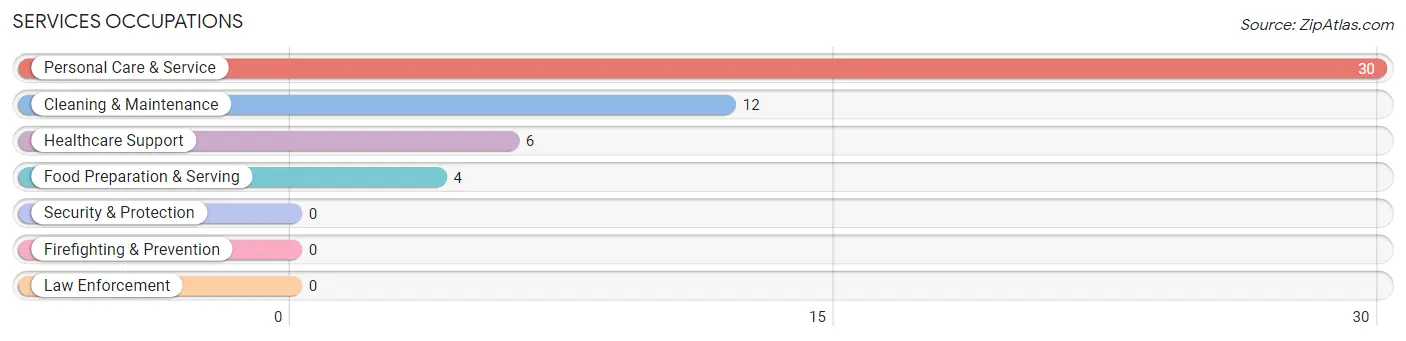
Services Occupations
The most common Services occupations in Nelsonville are Personal Care & Service (30 | 8.6%), Cleaning & Maintenance (12 | 3.4%), Healthcare Support (6 | 1.7%), and Food Preparation & Serving (4 | 1.1%).
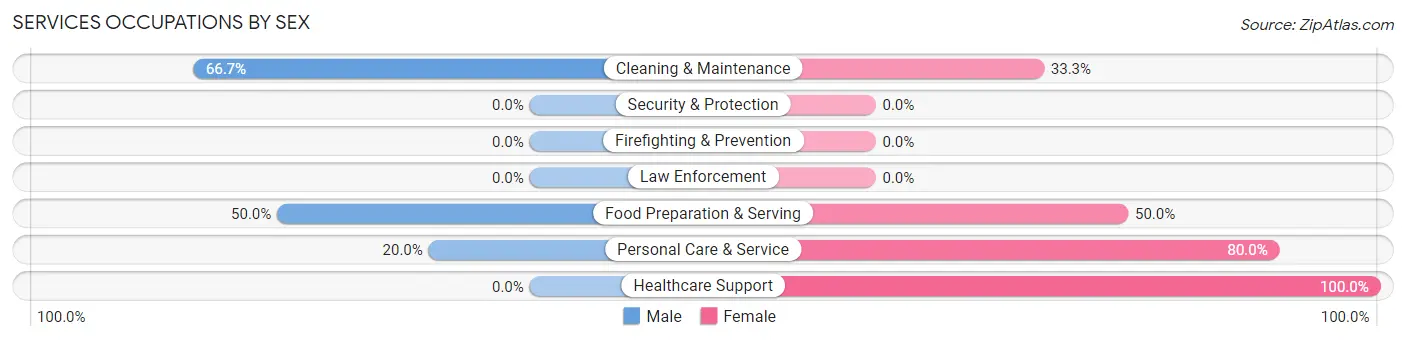
Services Occupations by Sex
Within the Services occupations in Nelsonville, the most male-oriented occupations are Cleaning & Maintenance (66.7%), Food Preparation & Serving (50.0%), and Personal Care & Service (20.0%), while the most female-oriented occupations are Healthcare Support (100.0%), Personal Care & Service (80.0%), and Food Preparation & Serving (50.0%).
| Occupation | Male | Female |
| Healthcare Support | 0 (0.0%) | 6 (100.0%) |
| Security & Protection | 0 (0.0%) | 0 (0.0%) |
| Firefighting & Prevention | 0 (0.0%) | 0 (0.0%) |
| Law Enforcement | 0 (0.0%) | 0 (0.0%) |
| Food Preparation & Serving | 2 (50.0%) | 2 (50.0%) |
| Cleaning & Maintenance | 8 (66.7%) | 4 (33.3%) |
| Personal Care & Service | 6 (20.0%) | 24 (80.0%) |
| Total (Category) | 16 (30.8%) | 36 (69.2%) |
| Total (Overall) | 171 (49.0%) | 178 (51.0%) |
Sales and Office Occupations
The most common Sales and Office occupations in Nelsonville are Office & Administration (50 | 14.3%), and Sales & Related (28 | 8.0%).

Sales and Office Occupations by Sex

| Occupation | Male | Female |
| Sales & Related | 19 (67.9%) | 9 (32.1%) |
| Office & Administration | 16 (32.0%) | 34 (68.0%) |
| Total (Category) | 35 (44.9%) | 43 (55.1%) |
| Total (Overall) | 171 (49.0%) | 178 (51.0%) |
Natural Resources, Construction and Maintenance Occupations
The most common Natural Resources, Construction and Maintenance occupations in Nelsonville are Construction & Extraction (11 | 3.2%), and Installation, Maintenance & Repair (10 | 2.9%).

Natural Resources, Construction and Maintenance Occupations by Sex

| Occupation | Male | Female |
| Farming, Fishing & Forestry | 0 (0.0%) | 0 (0.0%) |
| Construction & Extraction | 11 (100.0%) | 0 (0.0%) |
| Installation, Maintenance & Repair | 3 (30.0%) | 7 (70.0%) |
| Total (Category) | 14 (66.7%) | 7 (33.3%) |
| Total (Overall) | 171 (49.0%) | 178 (51.0%) |
Production, Transportation and Moving Occupations
The most common Production, Transportation and Moving occupations in Nelsonville are Transportation (17 | 4.9%), Production (5 | 1.4%), and Material Moving (3 | 0.9%).
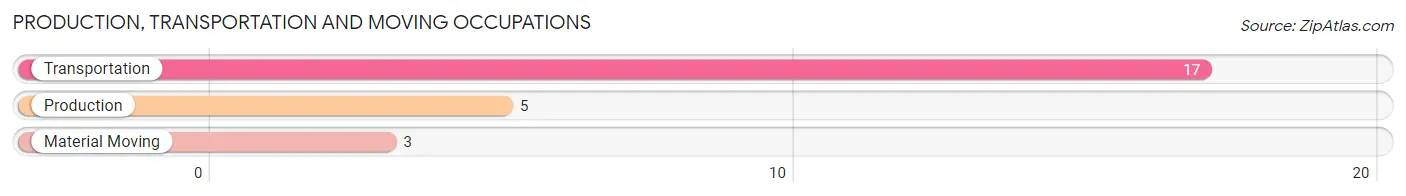
Production, Transportation and Moving Occupations by Sex
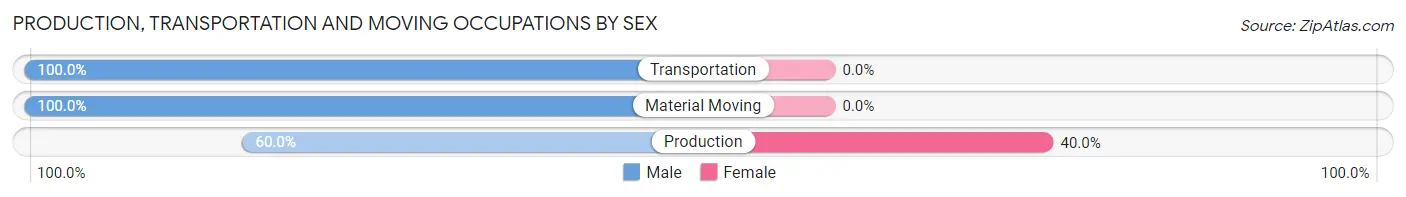
| Occupation | Male | Female |
| Production | 3 (60.0%) | 2 (40.0%) |
| Transportation | 17 (100.0%) | 0 (0.0%) |
| Material Moving | 3 (100.0%) | 0 (0.0%) |
| Total (Category) | 23 (92.0%) | 2 (8.0%) |
| Total (Overall) | 171 (49.0%) | 178 (51.0%) |
Employment Industries by Sex in Nelsonville
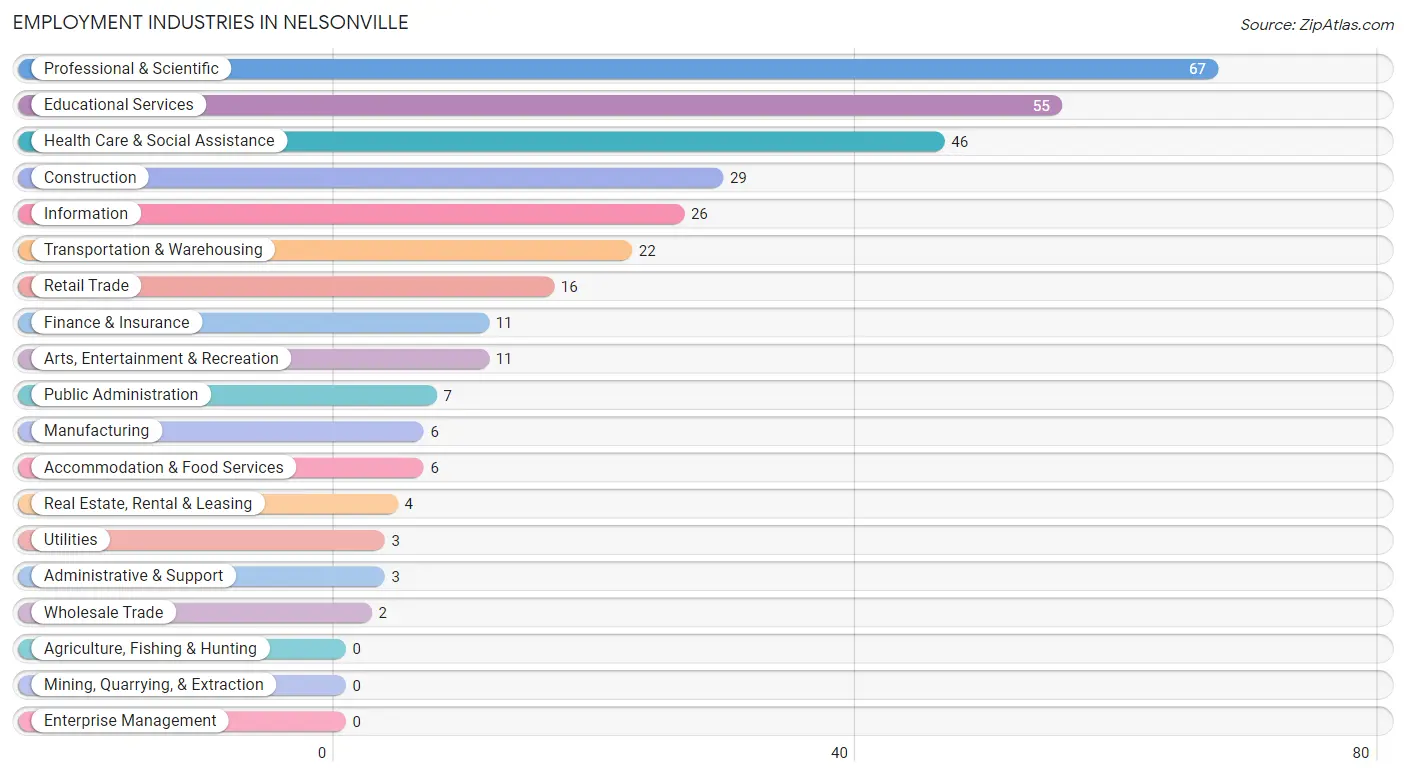
Employment Industries in Nelsonville
The major employment industries in Nelsonville include Professional & Scientific (67 | 19.2%), Educational Services (55 | 15.8%), Health Care & Social Assistance (46 | 13.2%), Construction (29 | 8.3%), and Information (26 | 7.4%).
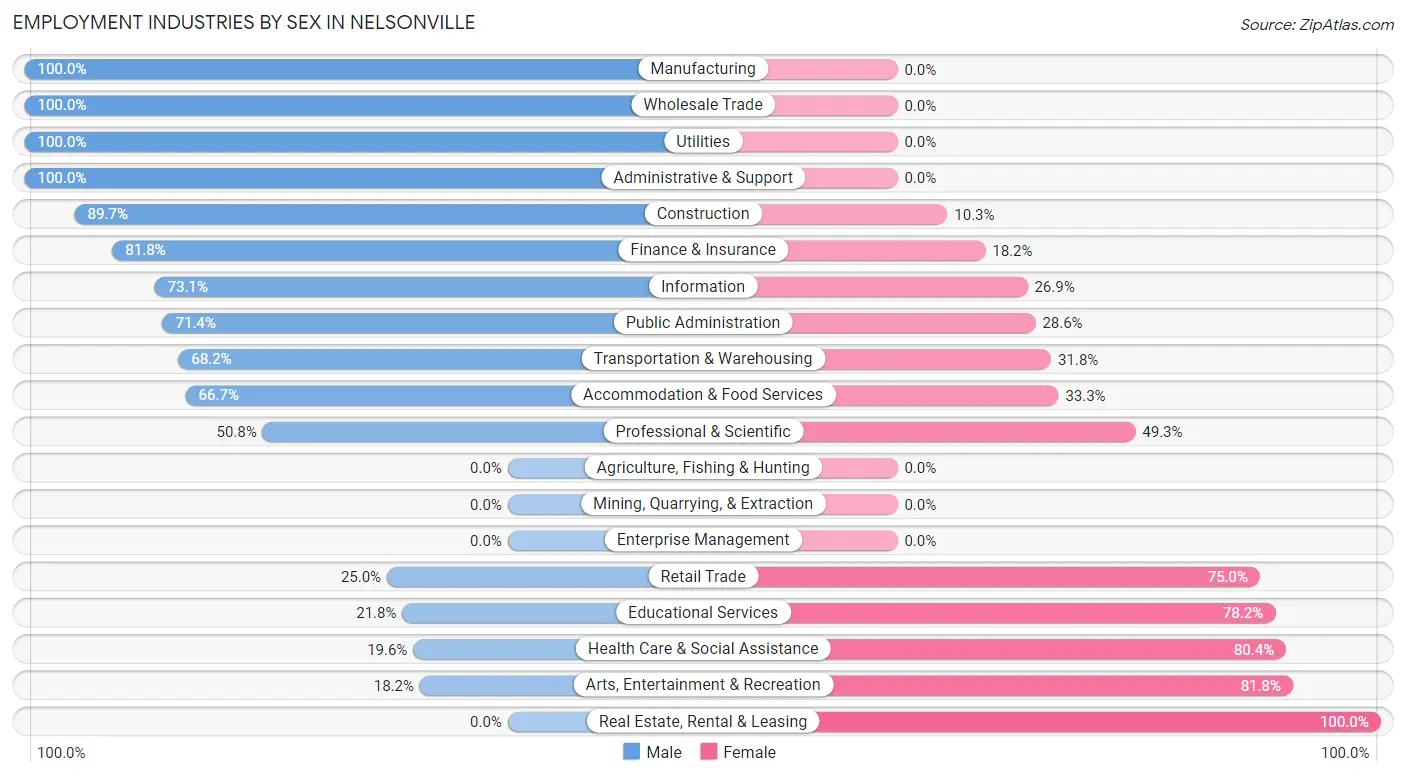
Employment Industries by Sex in Nelsonville
The Nelsonville industries that see more men than women are Manufacturing (100.0%), Wholesale Trade (100.0%), and Utilities (100.0%), whereas the industries that tend to have a higher number of women are Real Estate, Rental & Leasing (100.0%), Arts, Entertainment & Recreation (81.8%), and Health Care & Social Assistance (80.4%).
| Industry | Male | Female |
| Agriculture, Fishing & Hunting | 0 (0.0%) | 0 (0.0%) |
| Mining, Quarrying, & Extraction | 0 (0.0%) | 0 (0.0%) |
| Construction | 26 (89.7%) | 3 (10.3%) |
| Manufacturing | 6 (100.0%) | 0 (0.0%) |
| Wholesale Trade | 2 (100.0%) | 0 (0.0%) |
| Retail Trade | 4 (25.0%) | 12 (75.0%) |
| Transportation & Warehousing | 15 (68.2%) | 7 (31.8%) |
| Utilities | 3 (100.0%) | 0 (0.0%) |
| Information | 19 (73.1%) | 7 (26.9%) |
| Finance & Insurance | 9 (81.8%) | 2 (18.2%) |
| Real Estate, Rental & Leasing | 0 (0.0%) | 4 (100.0%) |
| Professional & Scientific | 34 (50.7%) | 33 (49.2%) |
| Enterprise Management | 0 (0.0%) | 0 (0.0%) |
| Administrative & Support | 3 (100.0%) | 0 (0.0%) |
| Educational Services | 12 (21.8%) | 43 (78.2%) |
| Health Care & Social Assistance | 9 (19.6%) | 37 (80.4%) |
| Arts, Entertainment & Recreation | 2 (18.2%) | 9 (81.8%) |
| Accommodation & Food Services | 4 (66.7%) | 2 (33.3%) |
| Public Administration | 5 (71.4%) | 2 (28.6%) |
| Total | 171 (49.0%) | 178 (51.0%) |
Education in Nelsonville
School Enrollment in Nelsonville
The most common levels of schooling among the 160 students in Nelsonville are middle school (47 | 29.4%), high school (46 | 28.7%), and college / undergraduate (26 | 16.3%).
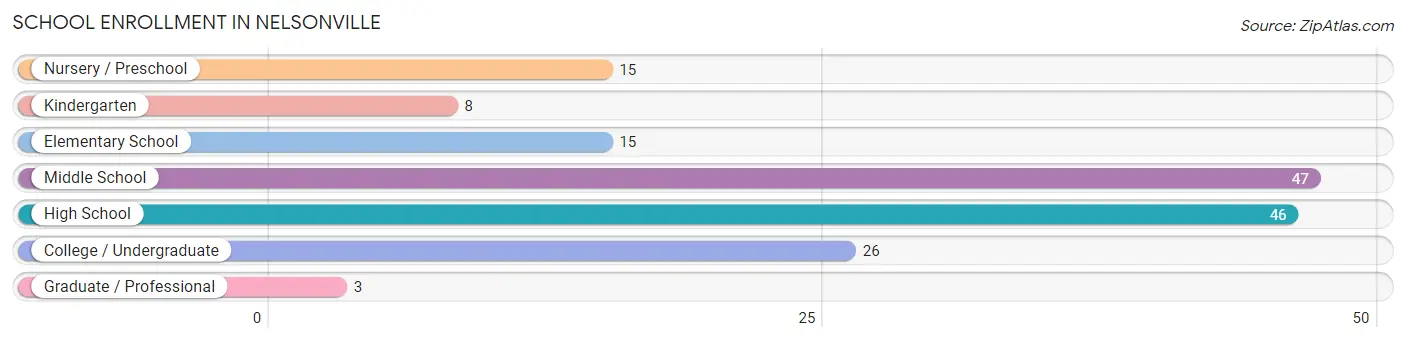
| School Level | # Students | % Students |
| Nursery / Preschool | 15 | 9.4% |
| Kindergarten | 8 | 5.0% |
| Elementary School | 15 | 9.4% |
| Middle School | 47 | 29.4% |
| High School | 46 | 28.7% |
| College / Undergraduate | 26 | 16.3% |
| Graduate / Professional | 3 | 1.9% |
| Total | 160 | 100.0% |
School Enrollment by Age by Funding Source in Nelsonville
Out of a total of 160 students who are enrolled in schools in Nelsonville, 23 (14.4%) attend a private institution, while the remaining 137 (85.6%) are enrolled in public schools. The age group of 35 years and over has the highest likelihood of being enrolled in private schools, with 3 (100.0% in the age bracket) enrolled. Conversely, the age group of 10 to 14 year olds has the lowest likelihood of being enrolled in a private school, with 57 (100.0% in the age bracket) attending a public institution.
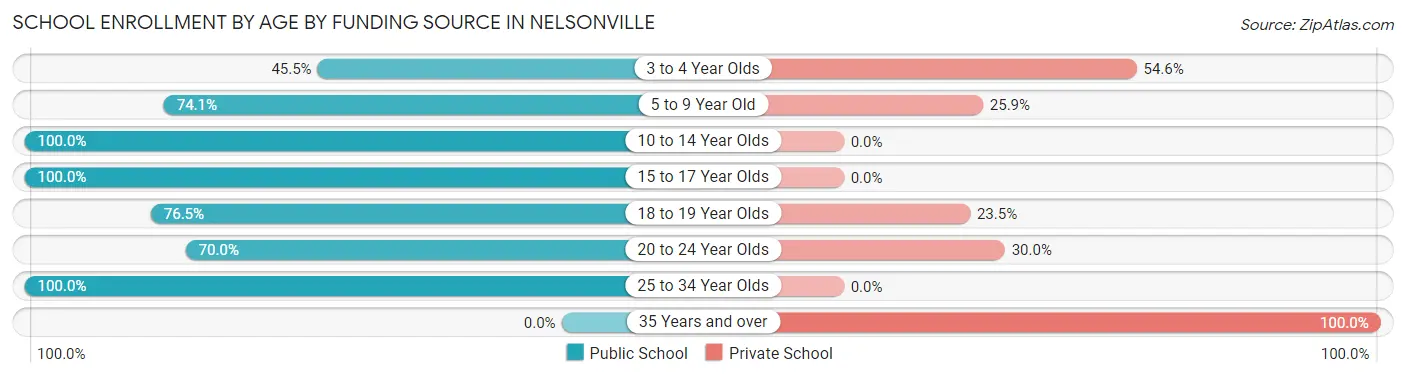
| Age Bracket | Public School | Private School |
| 3 to 4 Year Olds | 5 (45.5%) | 6 (54.5%) |
| 5 to 9 Year Old | 20 (74.1%) | 7 (25.9%) |
| 10 to 14 Year Olds | 57 (100.0%) | 0 (0.0%) |
| 15 to 17 Year Olds | 33 (100.0%) | 0 (0.0%) |
| 18 to 19 Year Olds | 13 (76.5%) | 4 (23.5%) |
| 20 to 24 Year Olds | 7 (70.0%) | 3 (30.0%) |
| 25 to 34 Year Olds | 2 (100.0%) | 0 (0.0%) |
| 35 Years and over | 0 (0.0%) | 3 (100.0%) |
| Total | 137 (85.6%) | 23 (14.4%) |
Educational Attainment by Field of Study in Nelsonville
Literature & languages (57 | 19.1%), education (35 | 11.7%), bio, nature & agricultural (33 | 11.1%), visual & performing arts (28 | 9.4%), and business (23 | 7.7%) are the most common fields of study among 298 individuals in Nelsonville who have obtained a bachelor's degree or higher.
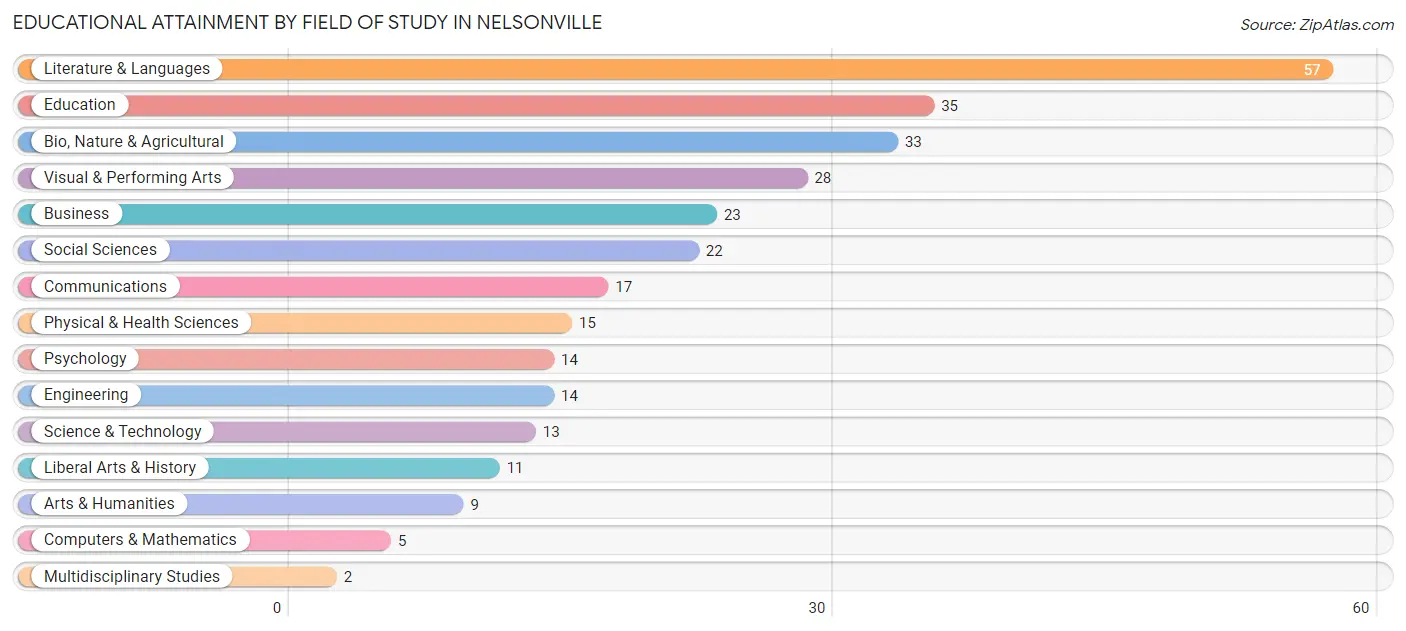
| Field of Study | # Graduates | % Graduates |
| Computers & Mathematics | 5 | 1.7% |
| Bio, Nature & Agricultural | 33 | 11.1% |
| Physical & Health Sciences | 15 | 5.0% |
| Psychology | 14 | 4.7% |
| Social Sciences | 22 | 7.4% |
| Engineering | 14 | 4.7% |
| Multidisciplinary Studies | 2 | 0.7% |
| Science & Technology | 13 | 4.4% |
| Business | 23 | 7.7% |
| Education | 35 | 11.7% |
| Literature & Languages | 57 | 19.1% |
| Liberal Arts & History | 11 | 3.7% |
| Visual & Performing Arts | 28 | 9.4% |
| Communications | 17 | 5.7% |
| Arts & Humanities | 9 | 3.0% |
| Total | 298 | 100.0% |
Transportation & Commute in Nelsonville
Vehicle Availability by Sex in Nelsonville
The most prevalent vehicle ownership categories in Nelsonville are males with 2 vehicles (80, accounting for 48.2%) and females with 2 vehicles (73, making up 46.0%).
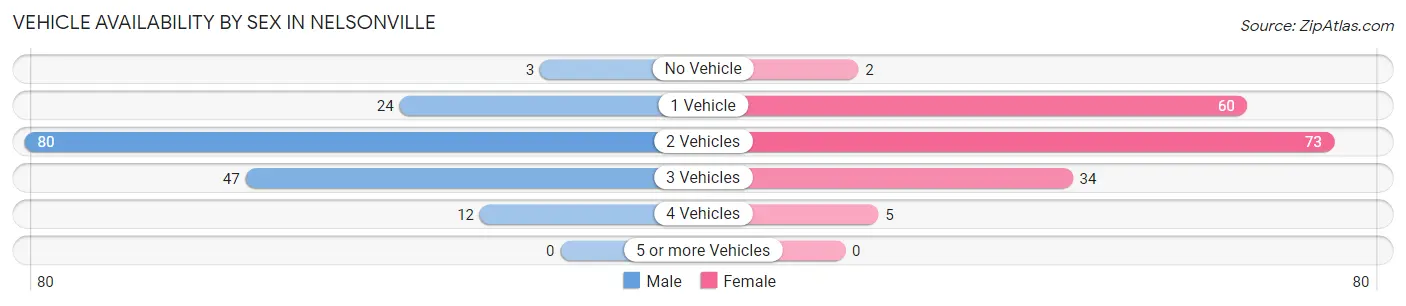
| Vehicles Available | Male | Female |
| No Vehicle | 3 (1.8%) | 2 (1.1%) |
| 1 Vehicle | 24 (14.5%) | 60 (34.5%) |
| 2 Vehicles | 80 (48.2%) | 73 (41.9%) |
| 3 Vehicles | 47 (28.3%) | 34 (19.5%) |
| 4 Vehicles | 12 (7.2%) | 5 (2.9%) |
| 5 or more Vehicles | 0 (0.0%) | 0 (0.0%) |
| Total | 166 (100.0%) | 174 (100.0%) |
Commute Time in Nelsonville
The most frequently occuring commute durations in Nelsonville are 90 or more minutes (55 commuters, 19.8%), 10 to 14 minutes (45 commuters, 16.2%), and 60 to 89 minutes (45 commuters, 16.2%).
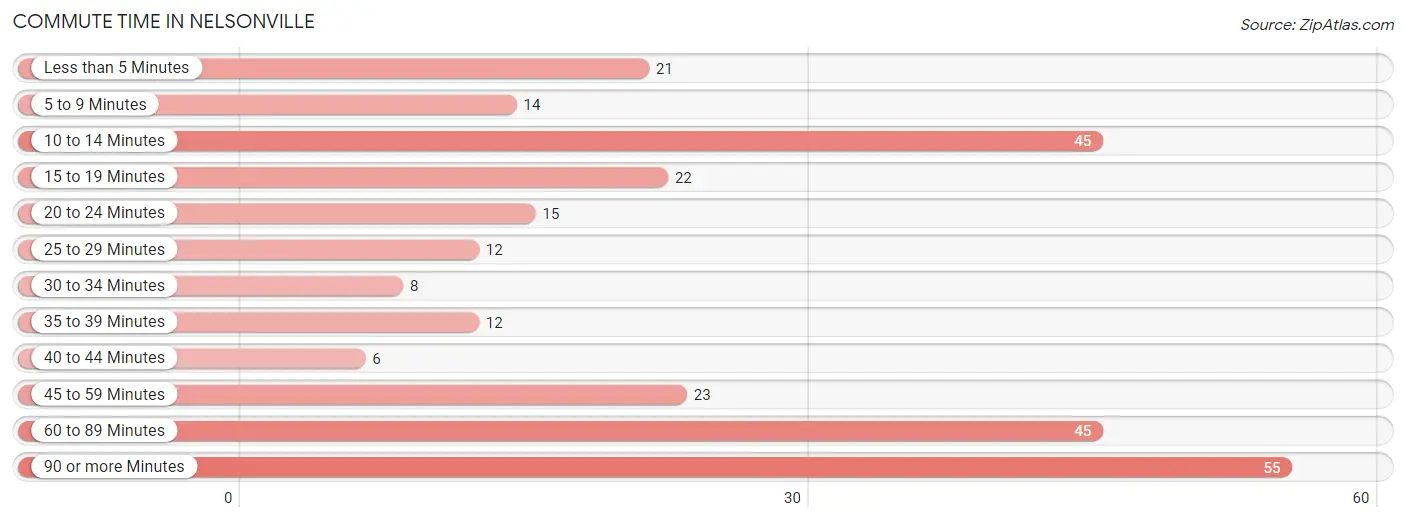
| Commute Time | # Commuters | % Commuters |
| Less than 5 Minutes | 21 | 7.5% |
| 5 to 9 Minutes | 14 | 5.0% |
| 10 to 14 Minutes | 45 | 16.2% |
| 15 to 19 Minutes | 22 | 7.9% |
| 20 to 24 Minutes | 15 | 5.4% |
| 25 to 29 Minutes | 12 | 4.3% |
| 30 to 34 Minutes | 8 | 2.9% |
| 35 to 39 Minutes | 12 | 4.3% |
| 40 to 44 Minutes | 6 | 2.2% |
| 45 to 59 Minutes | 23 | 8.3% |
| 60 to 89 Minutes | 45 | 16.2% |
| 90 or more Minutes | 55 | 19.8% |
Commute Time by Sex in Nelsonville
The most common commute times in Nelsonville are 60 to 89 minutes (31 commuters, 23.7%) for males and 90 or more minutes (40 commuters, 27.2%) for females.
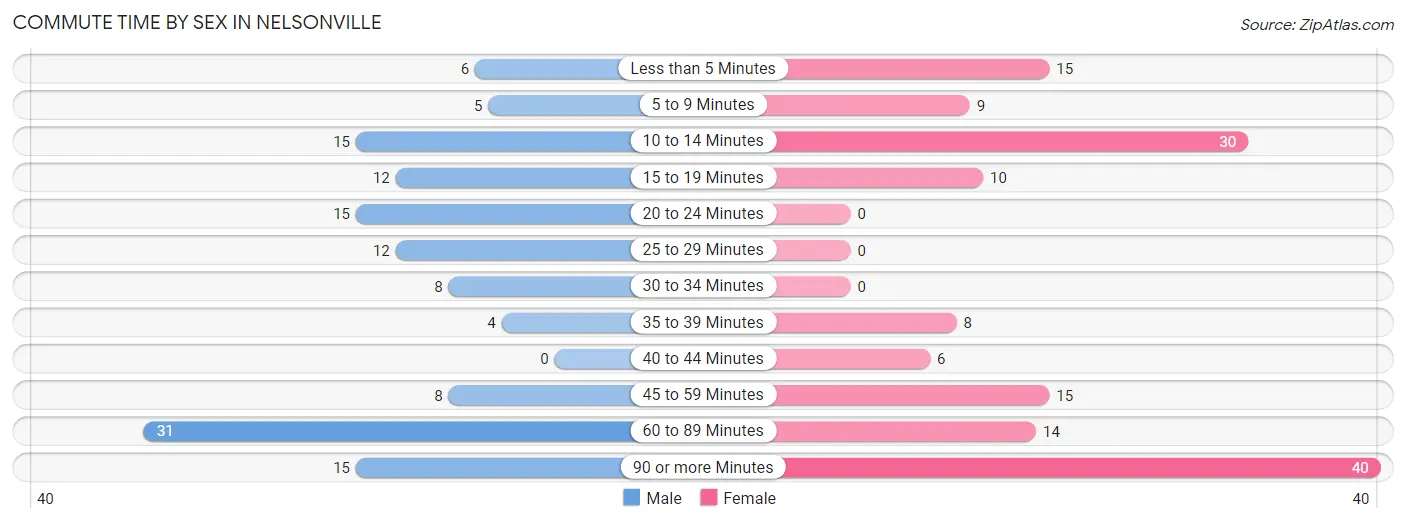
| Commute Time | Male | Female |
| Less than 5 Minutes | 6 (4.6%) | 15 (10.2%) |
| 5 to 9 Minutes | 5 (3.8%) | 9 (6.1%) |
| 10 to 14 Minutes | 15 (11.5%) | 30 (20.4%) |
| 15 to 19 Minutes | 12 (9.2%) | 10 (6.8%) |
| 20 to 24 Minutes | 15 (11.5%) | 0 (0.0%) |
| 25 to 29 Minutes | 12 (9.2%) | 0 (0.0%) |
| 30 to 34 Minutes | 8 (6.1%) | 0 (0.0%) |
| 35 to 39 Minutes | 4 (3.0%) | 8 (5.4%) |
| 40 to 44 Minutes | 0 (0.0%) | 6 (4.1%) |
| 45 to 59 Minutes | 8 (6.1%) | 15 (10.2%) |
| 60 to 89 Minutes | 31 (23.7%) | 14 (9.5%) |
| 90 or more Minutes | 15 (11.5%) | 40 (27.2%) |
Time of Departure to Work by Sex in Nelsonville
The most frequent times of departure to work in Nelsonville are 8:00 AM to 8:29 AM (39, 29.8%) for males and 6:30 AM to 6:59 AM (22, 15.0%) for females.
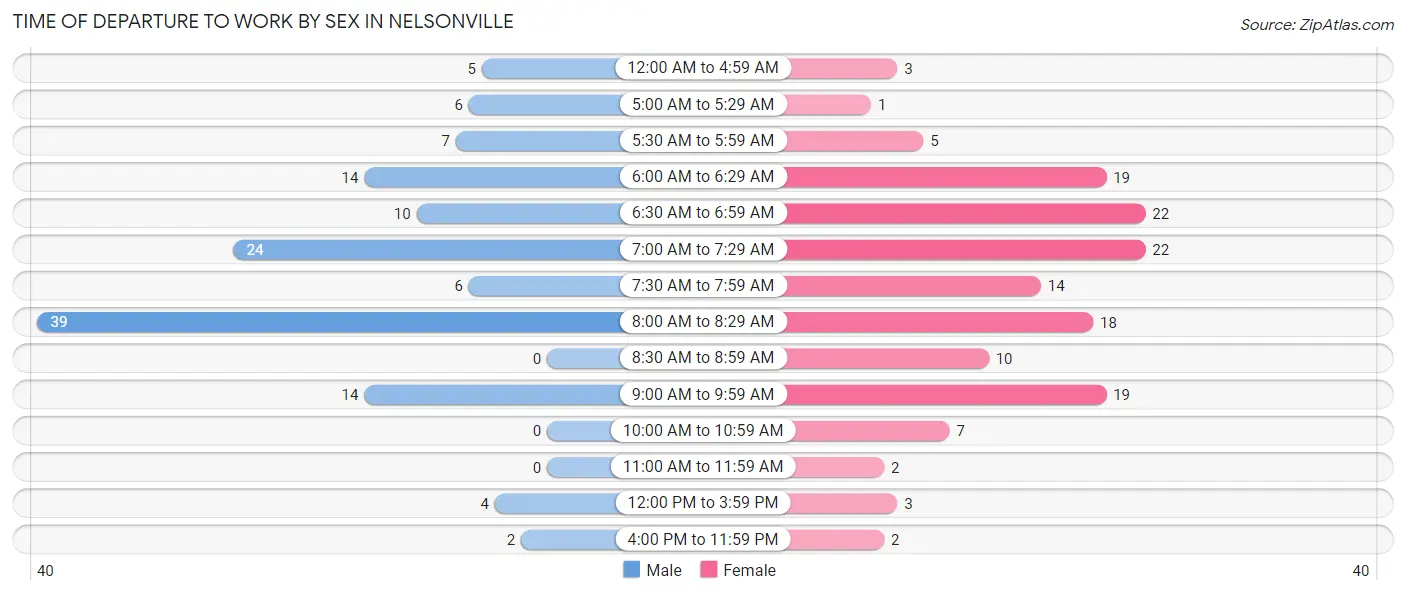
| Time of Departure | Male | Female |
| 12:00 AM to 4:59 AM | 5 (3.8%) | 3 (2.0%) |
| 5:00 AM to 5:29 AM | 6 (4.6%) | 1 (0.7%) |
| 5:30 AM to 5:59 AM | 7 (5.3%) | 5 (3.4%) |
| 6:00 AM to 6:29 AM | 14 (10.7%) | 19 (12.9%) |
| 6:30 AM to 6:59 AM | 10 (7.6%) | 22 (15.0%) |
| 7:00 AM to 7:29 AM | 24 (18.3%) | 22 (15.0%) |
| 7:30 AM to 7:59 AM | 6 (4.6%) | 14 (9.5%) |
| 8:00 AM to 8:29 AM | 39 (29.8%) | 18 (12.2%) |
| 8:30 AM to 8:59 AM | 0 (0.0%) | 10 (6.8%) |
| 9:00 AM to 9:59 AM | 14 (10.7%) | 19 (12.9%) |
| 10:00 AM to 10:59 AM | 0 (0.0%) | 7 (4.8%) |
| 11:00 AM to 11:59 AM | 0 (0.0%) | 2 (1.4%) |
| 12:00 PM to 3:59 PM | 4 (3.0%) | 3 (2.0%) |
| 4:00 PM to 11:59 PM | 2 (1.5%) | 2 (1.4%) |
| Total | 131 (100.0%) | 147 (100.0%) |
Housing Occupancy in Nelsonville
Occupancy by Ownership in Nelsonville
Of the total 251 dwellings in Nelsonville, owner-occupied units account for 186 (74.1%), while renter-occupied units make up 65 (25.9%).
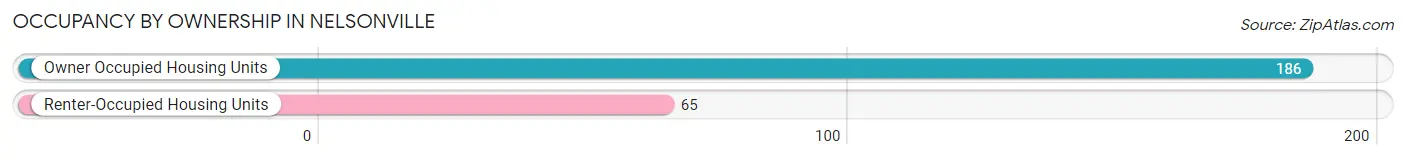
| Occupancy | # Housing Units | % Housing Units |
| Owner Occupied Housing Units | 186 | 74.1% |
| Renter-Occupied Housing Units | 65 | 25.9% |
| Total Occupied Housing Units | 251 | 100.0% |
Occupancy by Household Size in Nelsonville
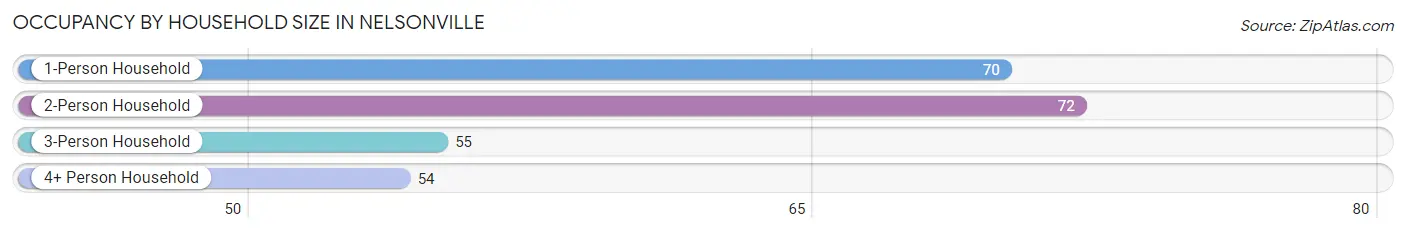
| Household Size | # Housing Units | % Housing Units |
| 1-Person Household | 70 | 27.9% |
| 2-Person Household | 72 | 28.7% |
| 3-Person Household | 55 | 21.9% |
| 4+ Person Household | 54 | 21.5% |
| Total Housing Units | 251 | 100.0% |
Occupancy by Ownership by Household Size in Nelsonville
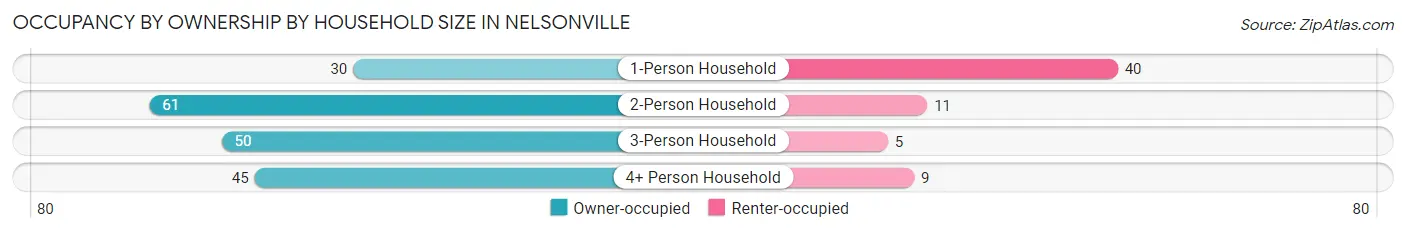
| Household Size | Owner-occupied | Renter-occupied |
| 1-Person Household | 30 (42.9%) | 40 (57.1%) |
| 2-Person Household | 61 (84.7%) | 11 (15.3%) |
| 3-Person Household | 50 (90.9%) | 5 (9.1%) |
| 4+ Person Household | 45 (83.3%) | 9 (16.7%) |
| Total Housing Units | 186 (74.1%) | 65 (25.9%) |
Occupancy by Educational Attainment in Nelsonville
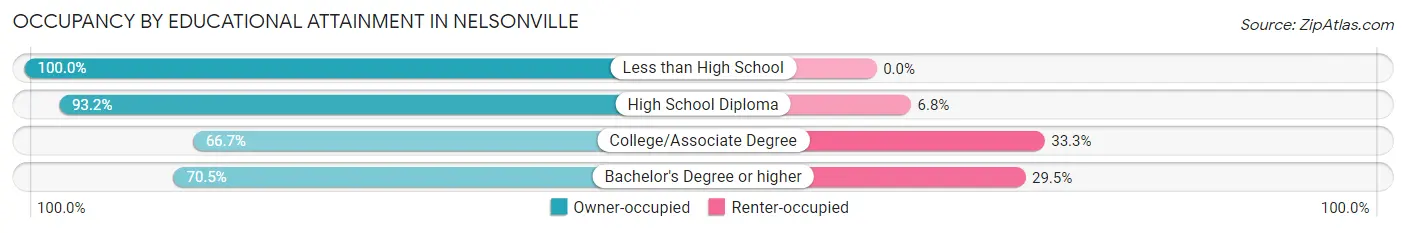
| Household Size | Owner-occupied | Renter-occupied |
| Less than High School | 2 (100.0%) | 0 (0.0%) |
| High School Diploma | 41 (93.2%) | 3 (6.8%) |
| College/Associate Degree | 26 (66.7%) | 13 (33.3%) |
| Bachelor's Degree or higher | 117 (70.5%) | 49 (29.5%) |
Occupancy by Age of Householder in Nelsonville
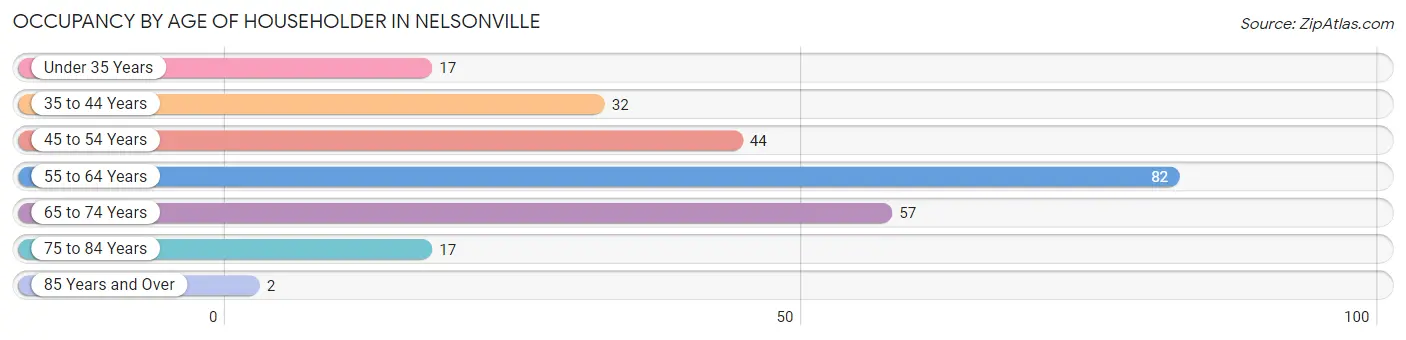
| Age Bracket | # Households | % Households |
| Under 35 Years | 17 | 6.8% |
| 35 to 44 Years | 32 | 12.8% |
| 45 to 54 Years | 44 | 17.5% |
| 55 to 64 Years | 82 | 32.7% |
| 65 to 74 Years | 57 | 22.7% |
| 75 to 84 Years | 17 | 6.8% |
| 85 Years and Over | 2 | 0.8% |
| Total | 251 | 100.0% |
Housing Finances in Nelsonville
Median Income by Occupancy in Nelsonville
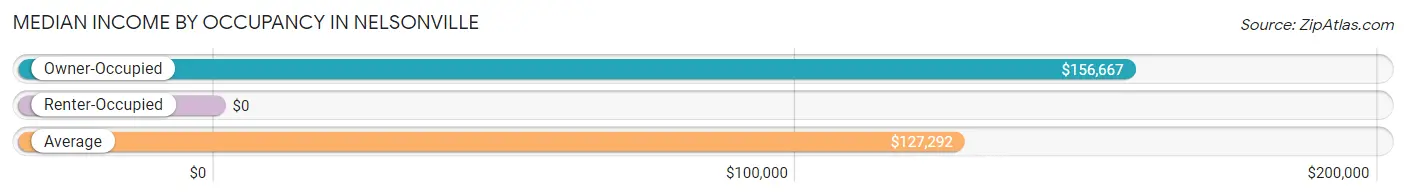
| Occupancy Type | # Households | Median Income |
| Owner-Occupied | 186 (74.1%) | $156,667 |
| Renter-Occupied | 65 (25.9%) | $0 |
| Average | 251 (100.0%) | $127,292 |
Occupancy by Householder Income Bracket in Nelsonville
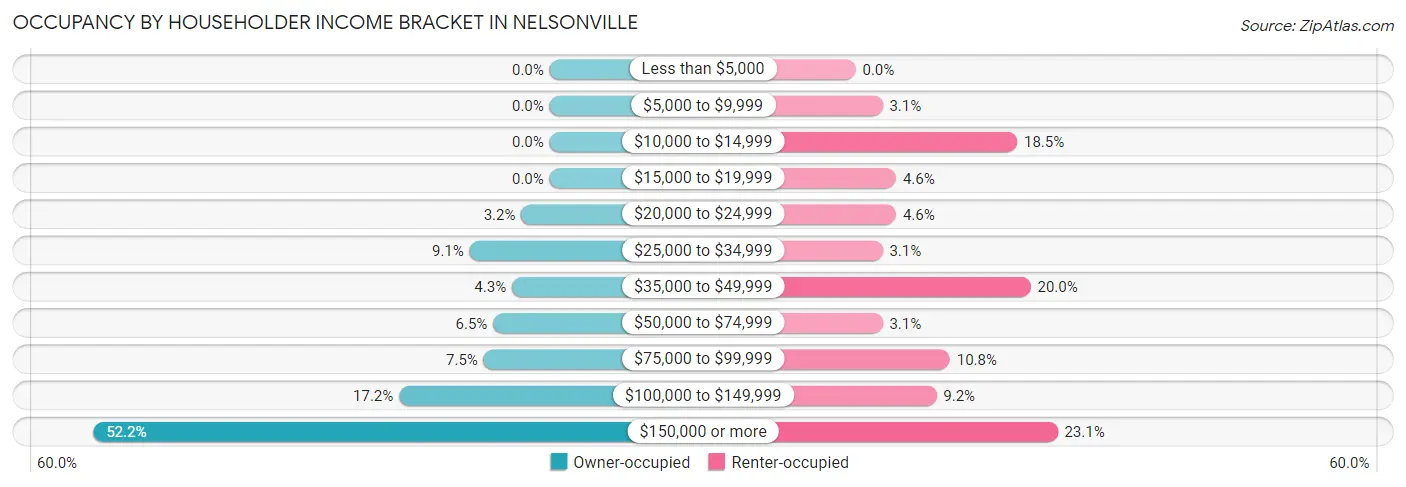
| Income Bracket | Owner-occupied | Renter-occupied |
| Less than $5,000 | 0 (0.0%) | 0 (0.0%) |
| $5,000 to $9,999 | 0 (0.0%) | 2 (3.1%) |
| $10,000 to $14,999 | 0 (0.0%) | 12 (18.5%) |
| $15,000 to $19,999 | 0 (0.0%) | 3 (4.6%) |
| $20,000 to $24,999 | 6 (3.2%) | 3 (4.6%) |
| $25,000 to $34,999 | 17 (9.1%) | 2 (3.1%) |
| $35,000 to $49,999 | 8 (4.3%) | 13 (20.0%) |
| $50,000 to $74,999 | 12 (6.5%) | 2 (3.1%) |
| $75,000 to $99,999 | 14 (7.5%) | 7 (10.8%) |
| $100,000 to $149,999 | 32 (17.2%) | 6 (9.2%) |
| $150,000 or more | 97 (52.1%) | 15 (23.1%) |
| Total | 186 (100.0%) | 65 (100.0%) |
Monthly Housing Cost Tiers in Nelsonville
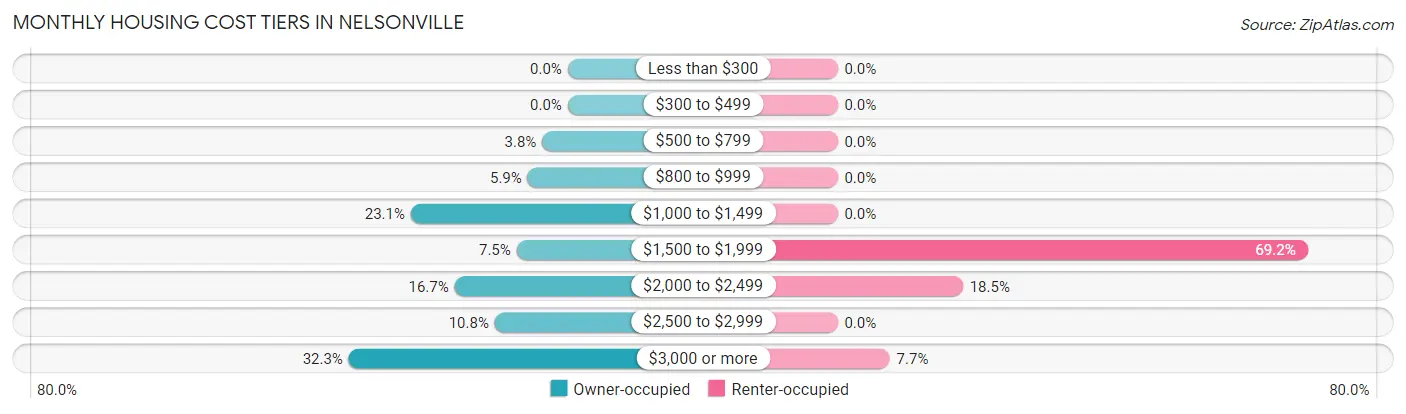
| Monthly Cost | Owner-occupied | Renter-occupied |
| Less than $300 | 0 (0.0%) | 0 (0.0%) |
| $300 to $499 | 0 (0.0%) | 0 (0.0%) |
| $500 to $799 | 7 (3.8%) | 0 (0.0%) |
| $800 to $999 | 11 (5.9%) | 0 (0.0%) |
| $1,000 to $1,499 | 43 (23.1%) | 0 (0.0%) |
| $1,500 to $1,999 | 14 (7.5%) | 45 (69.2%) |
| $2,000 to $2,499 | 31 (16.7%) | 12 (18.5%) |
| $2,500 to $2,999 | 20 (10.7%) | 0 (0.0%) |
| $3,000 or more | 60 (32.3%) | 5 (7.7%) |
| Total | 186 (100.0%) | 65 (100.0%) |
Physical Housing Characteristics in Nelsonville
Housing Structures in Nelsonville
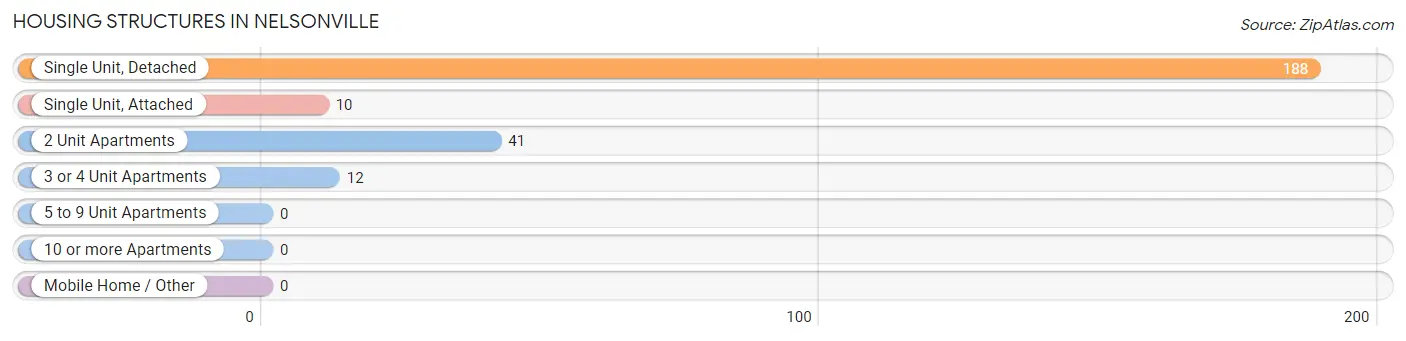
| Structure Type | # Housing Units | % Housing Units |
| Single Unit, Detached | 188 | 74.9% |
| Single Unit, Attached | 10 | 4.0% |
| 2 Unit Apartments | 41 | 16.3% |
| 3 or 4 Unit Apartments | 12 | 4.8% |
| 5 to 9 Unit Apartments | 0 | 0.0% |
| 10 or more Apartments | 0 | 0.0% |
| Mobile Home / Other | 0 | 0.0% |
| Total | 251 | 100.0% |
Housing Structures by Occupancy in Nelsonville
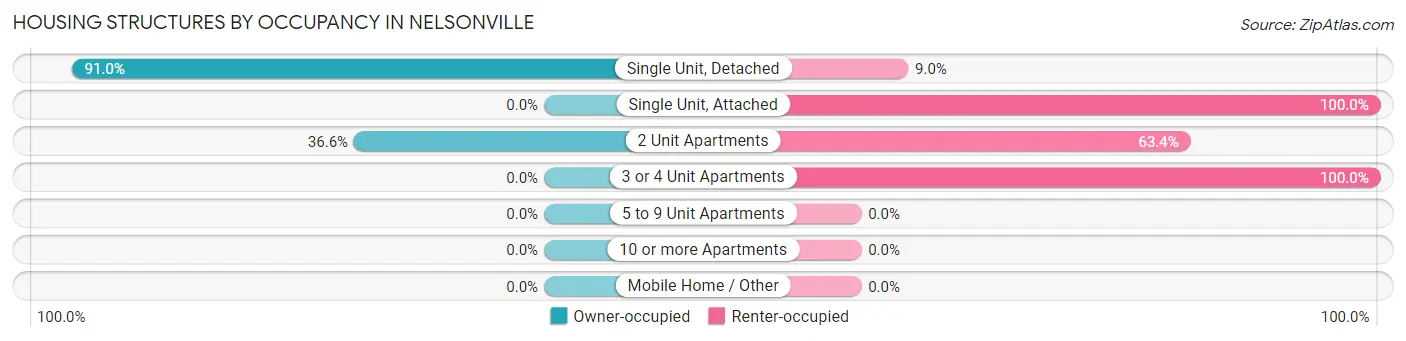
| Structure Type | Owner-occupied | Renter-occupied |
| Single Unit, Detached | 171 (91.0%) | 17 (9.0%) |
| Single Unit, Attached | 0 (0.0%) | 10 (100.0%) |
| 2 Unit Apartments | 15 (36.6%) | 26 (63.4%) |
| 3 or 4 Unit Apartments | 0 (0.0%) | 12 (100.0%) |
| 5 to 9 Unit Apartments | 0 (0.0%) | 0 (0.0%) |
| 10 or more Apartments | 0 (0.0%) | 0 (0.0%) |
| Mobile Home / Other | 0 (0.0%) | 0 (0.0%) |
| Total | 186 (74.1%) | 65 (25.9%) |
Housing Structures by Number of Rooms in Nelsonville
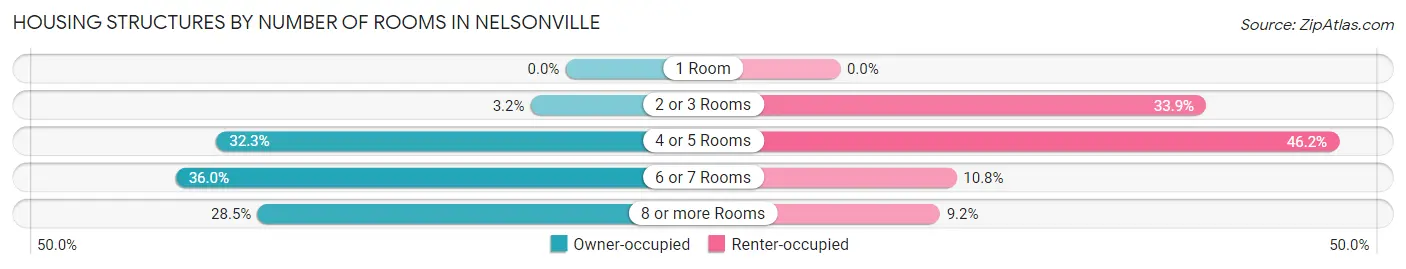
| Number of Rooms | Owner-occupied | Renter-occupied |
| 1 Room | 0 (0.0%) | 0 (0.0%) |
| 2 or 3 Rooms | 6 (3.2%) | 22 (33.9%) |
| 4 or 5 Rooms | 60 (32.3%) | 30 (46.2%) |
| 6 or 7 Rooms | 67 (36.0%) | 7 (10.8%) |
| 8 or more Rooms | 53 (28.5%) | 6 (9.2%) |
| Total | 186 (100.0%) | 65 (100.0%) |
Housing Structure by Heating Type in Nelsonville
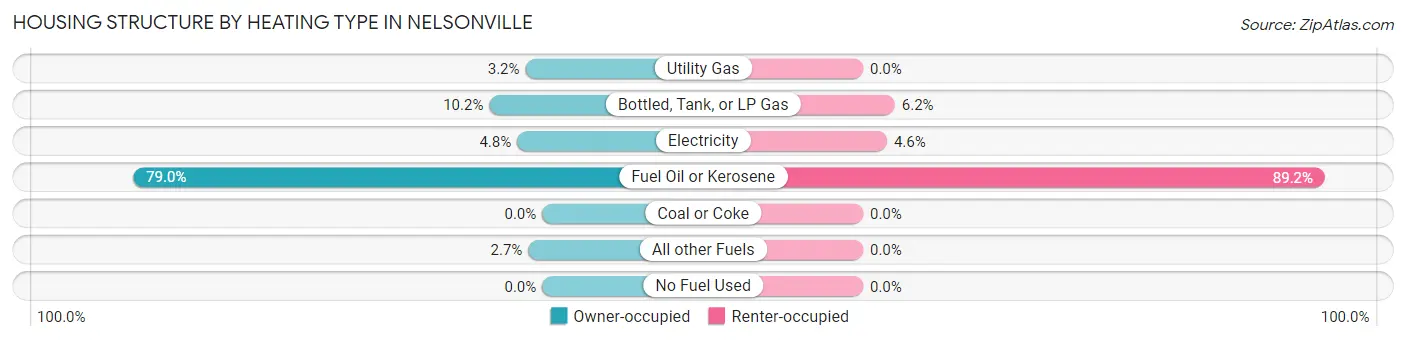
| Heating Type | Owner-occupied | Renter-occupied |
| Utility Gas | 6 (3.2%) | 0 (0.0%) |
| Bottled, Tank, or LP Gas | 19 (10.2%) | 4 (6.1%) |
| Electricity | 9 (4.8%) | 3 (4.6%) |
| Fuel Oil or Kerosene | 147 (79.0%) | 58 (89.2%) |
| Coal or Coke | 0 (0.0%) | 0 (0.0%) |
| All other Fuels | 5 (2.7%) | 0 (0.0%) |
| No Fuel Used | 0 (0.0%) | 0 (0.0%) |
| Total | 186 (100.0%) | 65 (100.0%) |
Household Vehicle Usage in Nelsonville
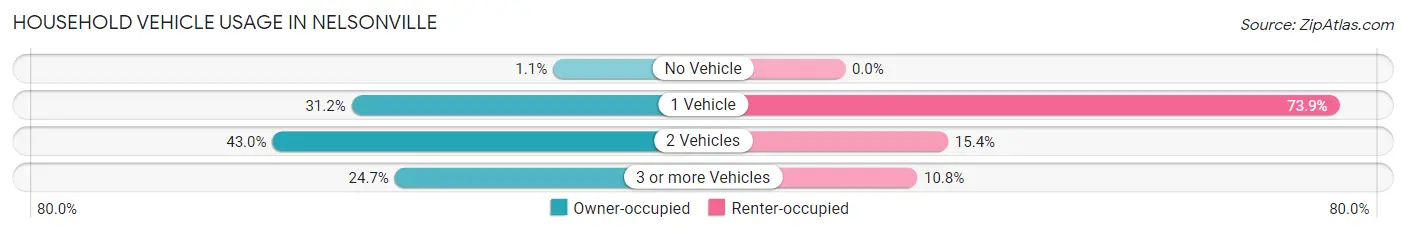
| Vehicles per Household | Owner-occupied | Renter-occupied |
| No Vehicle | 2 (1.1%) | 0 (0.0%) |
| 1 Vehicle | 58 (31.2%) | 48 (73.9%) |
| 2 Vehicles | 80 (43.0%) | 10 (15.4%) |
| 3 or more Vehicles | 46 (24.7%) | 7 (10.8%) |
| Total | 186 (100.0%) | 65 (100.0%) |
Real Estate & Mortgages in Nelsonville
Real Estate and Mortgage Overview in Nelsonville
| Characteristic | Without Mortgage | With Mortgage |
| Housing Units | 63 | 123 |
| Median Property Value | $629,800 | $562,500 |
| Median Household Income | $124,844 | $72 |
| Monthly Housing Costs | $1,227 | $60 |
| Real Estate Taxes | $8,641 | $0 |
Property Value by Mortgage Status in Nelsonville
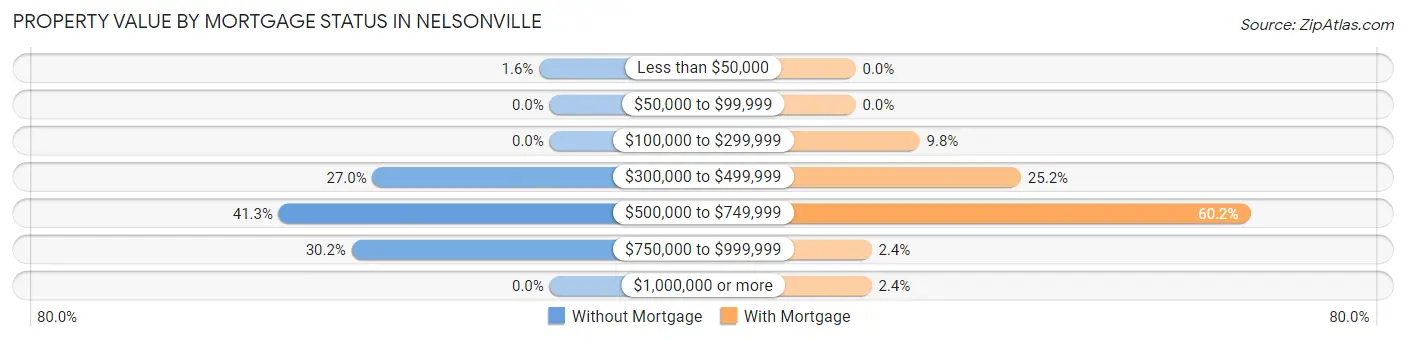
| Property Value | Without Mortgage | With Mortgage |
| Less than $50,000 | 1 (1.6%) | 0 (0.0%) |
| $50,000 to $99,999 | 0 (0.0%) | 0 (0.0%) |
| $100,000 to $299,999 | 0 (0.0%) | 12 (9.8%) |
| $300,000 to $499,999 | 17 (27.0%) | 31 (25.2%) |
| $500,000 to $749,999 | 26 (41.3%) | 74 (60.2%) |
| $750,000 to $999,999 | 19 (30.2%) | 3 (2.4%) |
| $1,000,000 or more | 0 (0.0%) | 3 (2.4%) |
| Total | 63 (100.0%) | 123 (100.0%) |
Household Income by Mortgage Status in Nelsonville
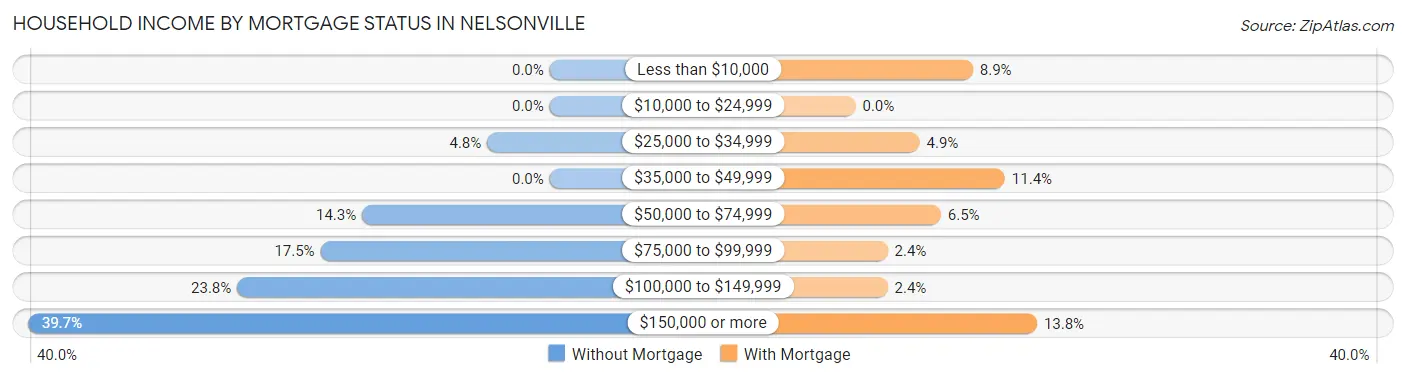
| Household Income | Without Mortgage | With Mortgage |
| Less than $10,000 | 0 (0.0%) | 11 (8.9%) |
| $10,000 to $24,999 | 0 (0.0%) | 0 (0.0%) |
| $25,000 to $34,999 | 3 (4.8%) | 6 (4.9%) |
| $35,000 to $49,999 | 0 (0.0%) | 14 (11.4%) |
| $50,000 to $74,999 | 9 (14.3%) | 8 (6.5%) |
| $75,000 to $99,999 | 11 (17.5%) | 3 (2.4%) |
| $100,000 to $149,999 | 15 (23.8%) | 3 (2.4%) |
| $150,000 or more | 25 (39.7%) | 17 (13.8%) |
| Total | 63 (100.0%) | 123 (100.0%) |
Property Value to Household Income Ratio in Nelsonville
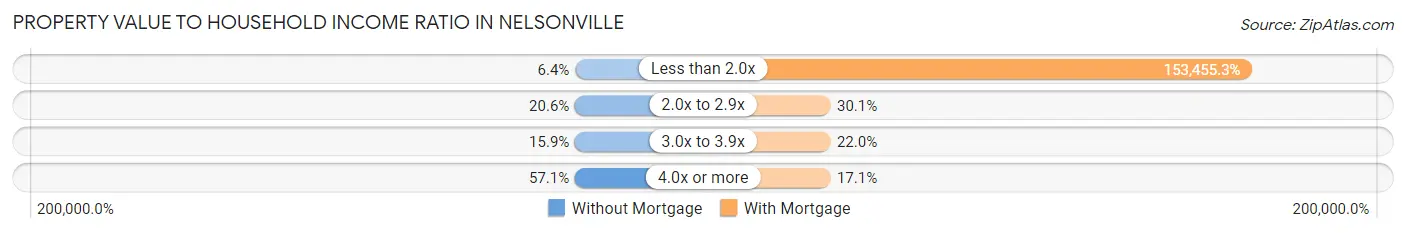
| Value-to-Income Ratio | Without Mortgage | With Mortgage |
| Less than 2.0x | 4 (6.4%) | 188,750 (153,455.3%) |
| 2.0x to 2.9x | 13 (20.6%) | 37 (30.1%) |
| 3.0x to 3.9x | 10 (15.9%) | 27 (22.0%) |
| 4.0x or more | 36 (57.1%) | 21 (17.1%) |
| Total | 63 (100.0%) | 123 (100.0%) |
Real Estate Taxes by Mortgage Status in Nelsonville

| Property Taxes | Without Mortgage | With Mortgage |
| Less than $800 | 0 (0.0%) | 0 (0.0%) |
| $800 to $1,499 | 0 (0.0%) | 0 (0.0%) |
| $800 to $1,499 | 63 (100.0%) | 0 (0.0%) |
| Total | 63 (100.0%) | 123 (100.0%) |
Health & Disability in Nelsonville
Health Insurance Coverage by Age in Nelsonville
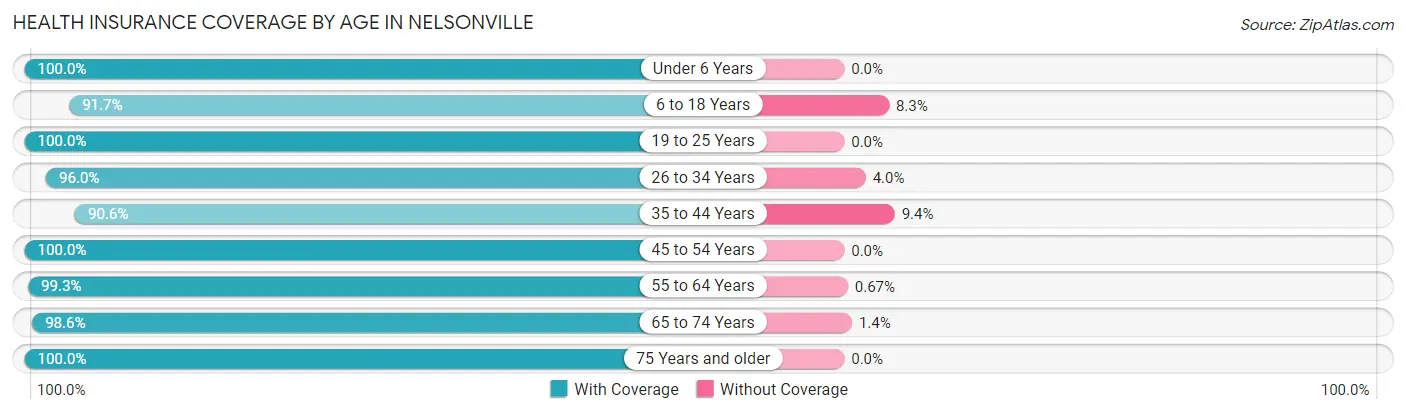
| Age Bracket | With Coverage | Without Coverage |
| Under 6 Years | 39 (100.0%) | 0 (0.0%) |
| 6 to 18 Years | 110 (91.7%) | 10 (8.3%) |
| 19 to 25 Years | 46 (100.0%) | 0 (0.0%) |
| 26 to 34 Years | 48 (96.0%) | 2 (4.0%) |
| 35 to 44 Years | 77 (90.6%) | 8 (9.4%) |
| 45 to 54 Years | 88 (100.0%) | 0 (0.0%) |
| 55 to 64 Years | 148 (99.3%) | 1 (0.7%) |
| 65 to 74 Years | 69 (98.6%) | 1 (1.4%) |
| 75 Years and older | 27 (100.0%) | 0 (0.0%) |
| Total | 652 (96.7%) | 22 (3.3%) |
Health Insurance Coverage by Citizenship Status in Nelsonville
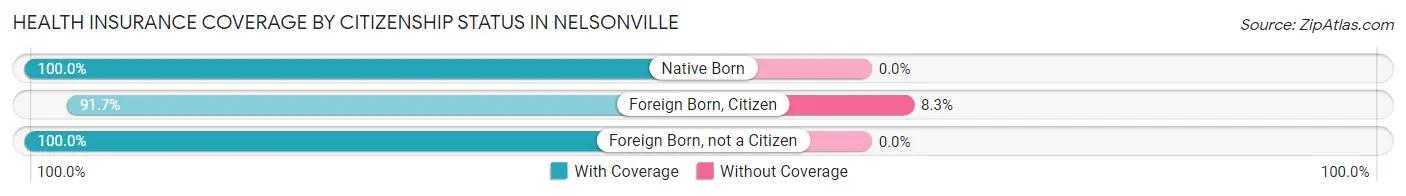
| Citizenship Status | With Coverage | Without Coverage |
| Native Born | 39 (100.0%) | 0 (0.0%) |
| Foreign Born, Citizen | 110 (91.7%) | 10 (8.3%) |
| Foreign Born, not a Citizen | 46 (100.0%) | 0 (0.0%) |
Health Insurance Coverage by Household Income in Nelsonville
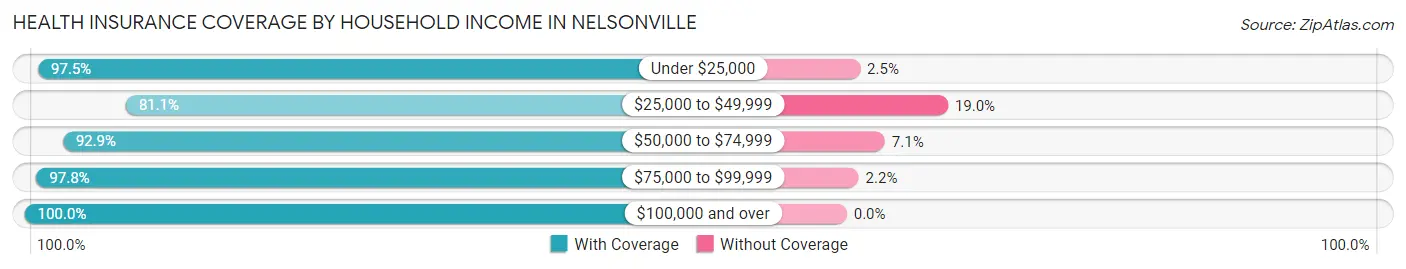
| Household Income | With Coverage | Without Coverage |
| Under $25,000 | 39 (97.5%) | 1 (2.5%) |
| $25,000 to $49,999 | 77 (81.0%) | 18 (19.0%) |
| $50,000 to $74,999 | 26 (92.9%) | 2 (7.1%) |
| $75,000 to $99,999 | 44 (97.8%) | 1 (2.2%) |
| $100,000 and over | 454 (100.0%) | 0 (0.0%) |
Public vs Private Health Insurance Coverage by Age in Nelsonville
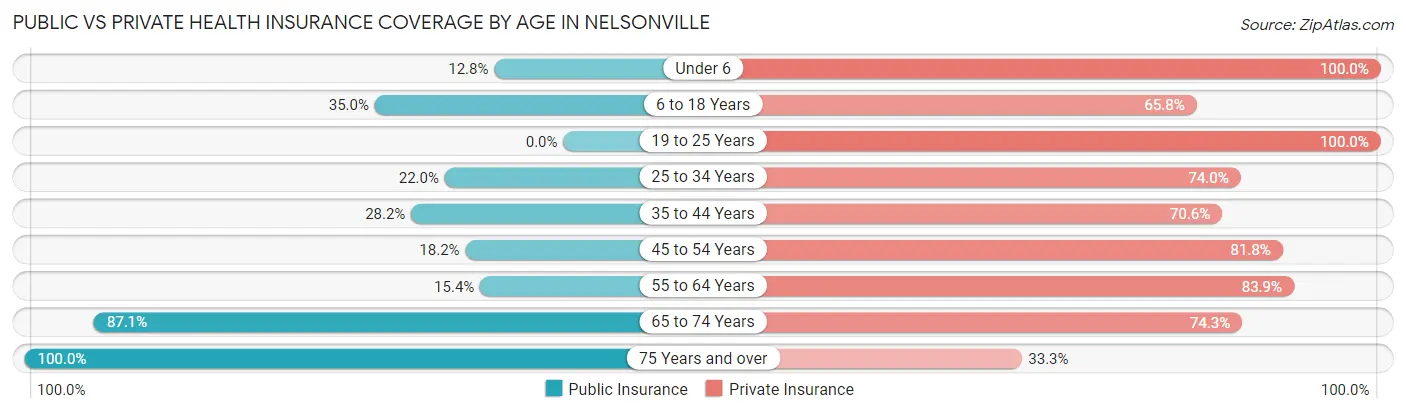
| Age Bracket | Public Insurance | Private Insurance |
| Under 6 | 5 (12.8%) | 39 (100.0%) |
| 6 to 18 Years | 42 (35.0%) | 79 (65.8%) |
| 19 to 25 Years | 0 (0.0%) | 46 (100.0%) |
| 25 to 34 Years | 11 (22.0%) | 37 (74.0%) |
| 35 to 44 Years | 24 (28.2%) | 60 (70.6%) |
| 45 to 54 Years | 16 (18.2%) | 72 (81.8%) |
| 55 to 64 Years | 23 (15.4%) | 125 (83.9%) |
| 65 to 74 Years | 61 (87.1%) | 52 (74.3%) |
| 75 Years and over | 27 (100.0%) | 9 (33.3%) |
| Total | 209 (31.0%) | 519 (77.0%) |
Disability Status by Sex by Age in Nelsonville
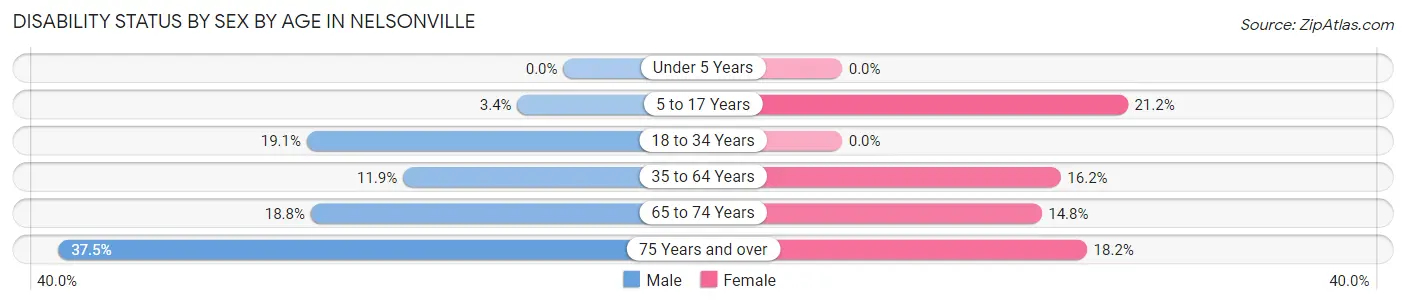
| Age Bracket | Male | Female |
| Under 5 Years | 0 (0.0%) | 0 (0.0%) |
| 5 to 17 Years | 3 (3.4%) | 7 (21.2%) |
| 18 to 34 Years | 12 (19.1%) | 0 (0.0%) |
| 35 to 64 Years | 20 (11.9%) | 25 (16.2%) |
| 65 to 74 Years | 3 (18.8%) | 8 (14.8%) |
| 75 Years and over | 6 (37.5%) | 2 (18.2%) |
Disability Class by Sex by Age in Nelsonville
Disability Class: Hearing Difficulty
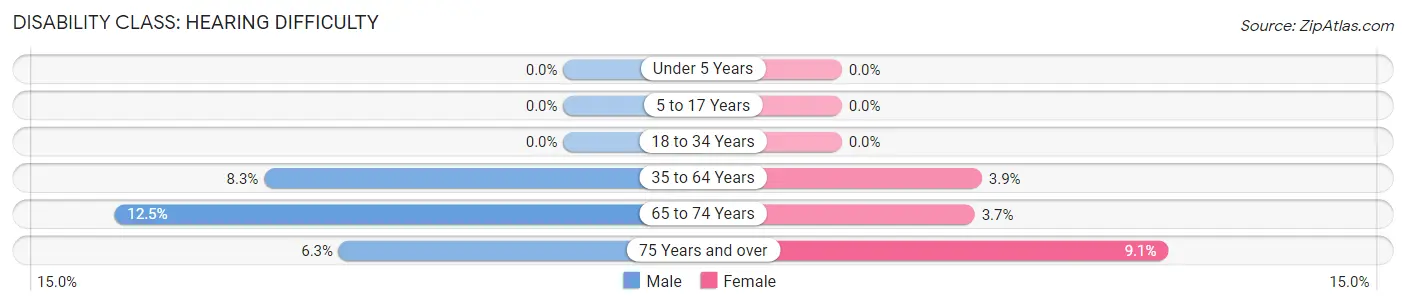
| Age Bracket | Male | Female |
| Under 5 Years | 0 (0.0%) | 0 (0.0%) |
| 5 to 17 Years | 0 (0.0%) | 0 (0.0%) |
| 18 to 34 Years | 0 (0.0%) | 0 (0.0%) |
| 35 to 64 Years | 14 (8.3%) | 6 (3.9%) |
| 65 to 74 Years | 2 (12.5%) | 2 (3.7%) |
| 75 Years and over | 1 (6.2%) | 1 (9.1%) |
Disability Class: Vision Difficulty
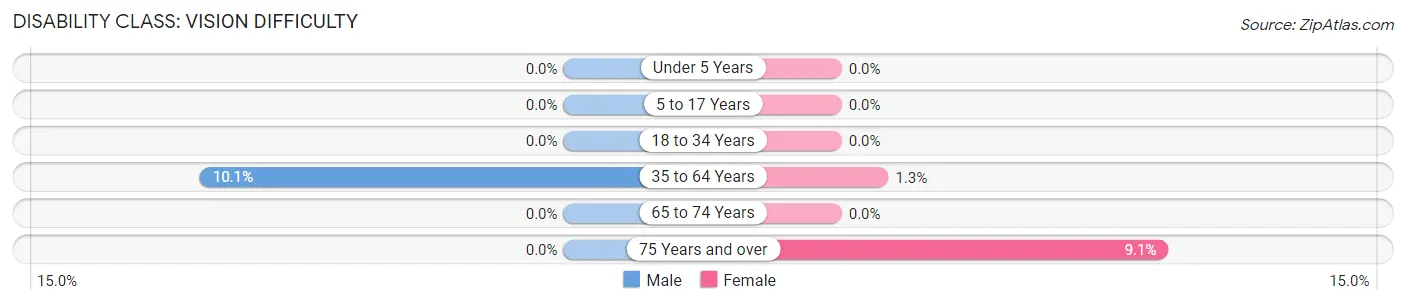
| Age Bracket | Male | Female |
| Under 5 Years | 0 (0.0%) | 0 (0.0%) |
| 5 to 17 Years | 0 (0.0%) | 0 (0.0%) |
| 18 to 34 Years | 0 (0.0%) | 0 (0.0%) |
| 35 to 64 Years | 17 (10.1%) | 2 (1.3%) |
| 65 to 74 Years | 0 (0.0%) | 0 (0.0%) |
| 75 Years and over | 0 (0.0%) | 1 (9.1%) |
Disability Class: Cognitive Difficulty
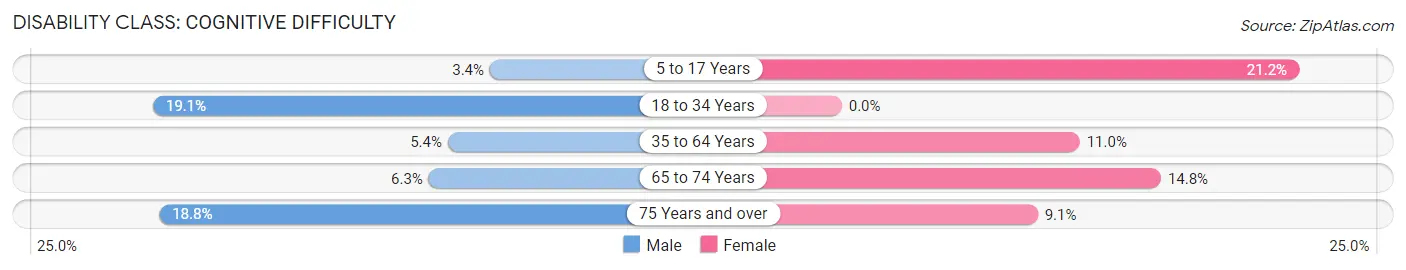
| Age Bracket | Male | Female |
| 5 to 17 Years | 3 (3.4%) | 7 (21.2%) |
| 18 to 34 Years | 12 (19.1%) | 0 (0.0%) |
| 35 to 64 Years | 9 (5.4%) | 17 (11.0%) |
| 65 to 74 Years | 1 (6.2%) | 8 (14.8%) |
| 75 Years and over | 3 (18.8%) | 1 (9.1%) |
Disability Class: Ambulatory Difficulty
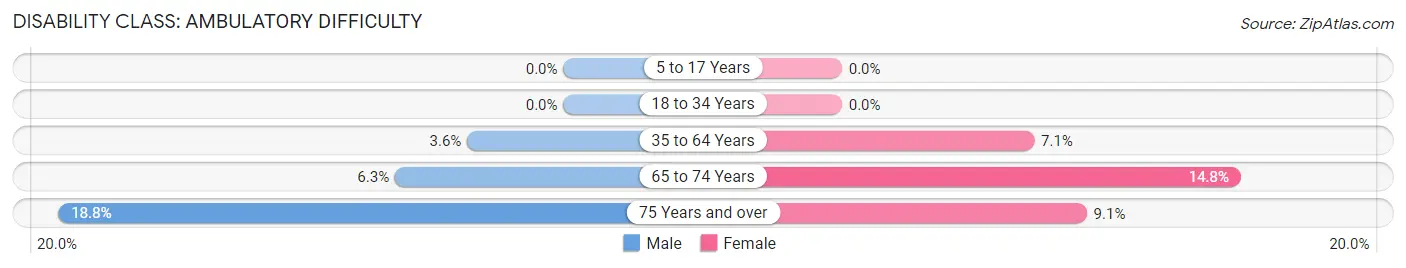
| Age Bracket | Male | Female |
| 5 to 17 Years | 0 (0.0%) | 0 (0.0%) |
| 18 to 34 Years | 0 (0.0%) | 0 (0.0%) |
| 35 to 64 Years | 6 (3.6%) | 11 (7.1%) |
| 65 to 74 Years | 1 (6.2%) | 8 (14.8%) |
| 75 Years and over | 3 (18.8%) | 1 (9.1%) |
Disability Class: Self-Care Difficulty
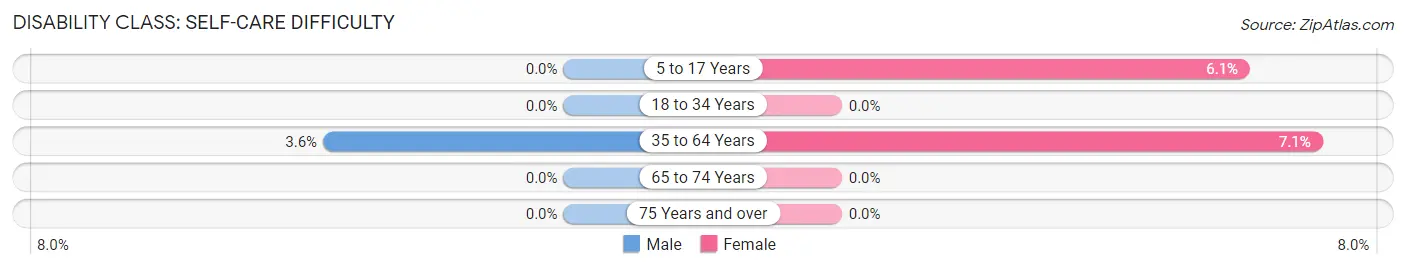
| Age Bracket | Male | Female |
| 5 to 17 Years | 0 (0.0%) | 2 (6.1%) |
| 18 to 34 Years | 0 (0.0%) | 0 (0.0%) |
| 35 to 64 Years | 6 (3.6%) | 11 (7.1%) |
| 65 to 74 Years | 0 (0.0%) | 0 (0.0%) |
| 75 Years and over | 0 (0.0%) | 0 (0.0%) |
Technology Access in Nelsonville
Computing Device Access in Nelsonville
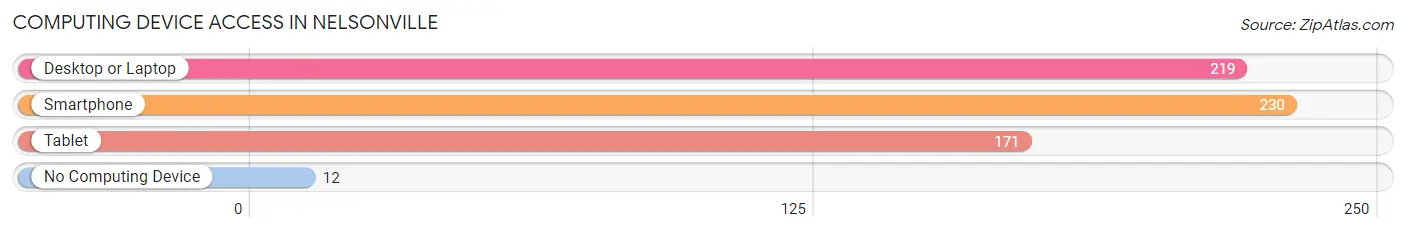
| Device Type | # Households | % Households |
| Desktop or Laptop | 219 | 87.3% |
| Smartphone | 230 | 91.6% |
| Tablet | 171 | 68.1% |
| No Computing Device | 12 | 4.8% |
| Total | 251 | 100.0% |
Internet Access in Nelsonville
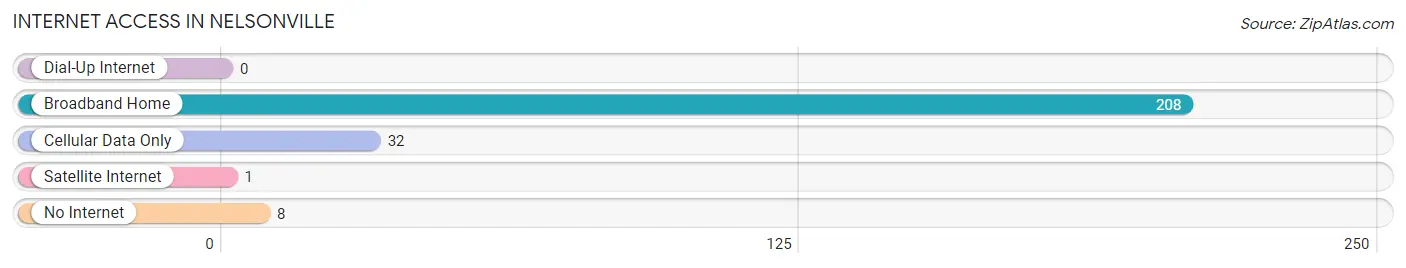
| Internet Type | # Households | % Households |
| Dial-Up Internet | 0 | 0.0% |
| Broadband Home | 208 | 82.9% |
| Cellular Data Only | 32 | 12.8% |
| Satellite Internet | 1 | 0.4% |
| No Internet | 8 | 3.2% |
| Total | 251 | 100.0% |
Nelsonville Summary
Nelsonville is a village located in the town of Philipstown in Putnam County, New York. It is situated on the east bank of the Hudson River, about 50 miles north of New York City. The village has a population of about 1,000 people and is part of the larger Hudson Valley region.
Geography
Nelsonville is located in the Hudson Valley region of New York, about 50 miles north of New York City. The village is situated on the east bank of the Hudson River, and is bordered by the towns of Philipstown to the north, Putnam Valley to the east, and the town of Cortlandt to the south. The village is located in a rural area, with rolling hills and forests surrounding it. The nearest major city is Poughkeepsie, which is about 25 miles to the south.
Climate
Nelsonville has a humid continental climate, with cold winters and warm summers. The average annual temperature is around 50°F, with temperatures ranging from an average low of around 30°F in the winter to an average high of around 70°F in the summer. The area receives an average of around 40 inches of precipitation per year, with most of it falling in the form of snow in the winter months.
Demographics
As of the 2010 census, the population of Nelsonville was 1,037. The racial makeup of the village was 94.3% White, 1.2% African American, 0.3% Native American, 0.7% Asian, 0.1% Pacific Islander, 1.7% from other races, and 1.9% from two or more races. Hispanic or Latino of any race were 4.2% of the population.
Economy
Nelsonville is a small, rural village, and the economy is largely based on agriculture and tourism. The village is home to several small farms, which produce a variety of fruits and vegetables. The village also has several small businesses, including restaurants, shops, and galleries. Tourism is also an important part of the local economy, with visitors coming to the area to enjoy the scenic beauty of the Hudson Valley.
History
Nelsonville was first settled in the late 1700s by Dutch and English settlers. The village was named after General William Nelson, who served in the Revolutionary War. In the early 1800s, the village was a popular stop on the Hudson River steamboat route. The village was incorporated in 1845, and the first post office was established in 1847.
In the late 1800s, Nelsonville was a popular summer resort destination, with many wealthy New Yorkers building large summer homes in the area. The village also had several factories, including a paper mill and a brickyard. In the early 1900s, the village was connected to the rest of the region by the New York Central Railroad.
In the late 20th century, Nelsonville experienced a decline in population as many of the factories closed and people moved away. However, the village has seen a resurgence in recent years, with many new businesses opening and the population increasing.
Conclusion
Nelsonville is a small village located in the Hudson Valley region of New York. It has a population of about 1,000 people and is known for its scenic beauty and rural charm. The economy is largely based on agriculture and tourism, and the village has seen a resurgence in recent years. Nelsonville has a long and interesting history, and is a great place to visit or live.
Common Questions
What is Per Capita Income in Nelsonville?
Per Capita income in Nelsonville is $63,050.
What is the Median Family Income in Nelsonville?
Median Family Income in Nelsonville is $153,250.
What is the Median Household income in Nelsonville?
Median Household Income in Nelsonville is $127,292.
What is Inequality or Gini Index in Nelsonville?
Inequality or Gini Index in Nelsonville is 0.45.
What is the Total Population of Nelsonville?
Total Population of Nelsonville is 674.
What is the Total Male Population of Nelsonville?
Total Male Population of Nelsonville is 368.
What is the Total Female Population of Nelsonville?
Total Female Population of Nelsonville is 306.
What is the Ratio of Males per 100 Females in Nelsonville?
There are 120.26 Males per 100 Females in Nelsonville.
What is the Ratio of Females per 100 Males in Nelsonville?
There are 83.15 Females per 100 Males in Nelsonville.
What is the Median Population Age in Nelsonville?
Median Population Age in Nelsonville is 44.6 Years.
What is the Average Family Size in Nelsonville
Average Family Size in Nelsonville is 3.2 People.
What is the Average Household Size in Nelsonville
Average Household Size in Nelsonville is 2.6 People.
How Large is the Labor Force in Nelsonville?
There are 371 People in the Labor Forcein in Nelsonville.
What is the Percentage of People in the Labor Force in Nelsonville?
67.5% of People are in the Labor Force in Nelsonville.
What is the Unemployment Rate in Nelsonville?
Unemployment Rate in Nelsonville is 5.9%.