Sand Ridge, NY Map & Demographics
Sand Ridge Map
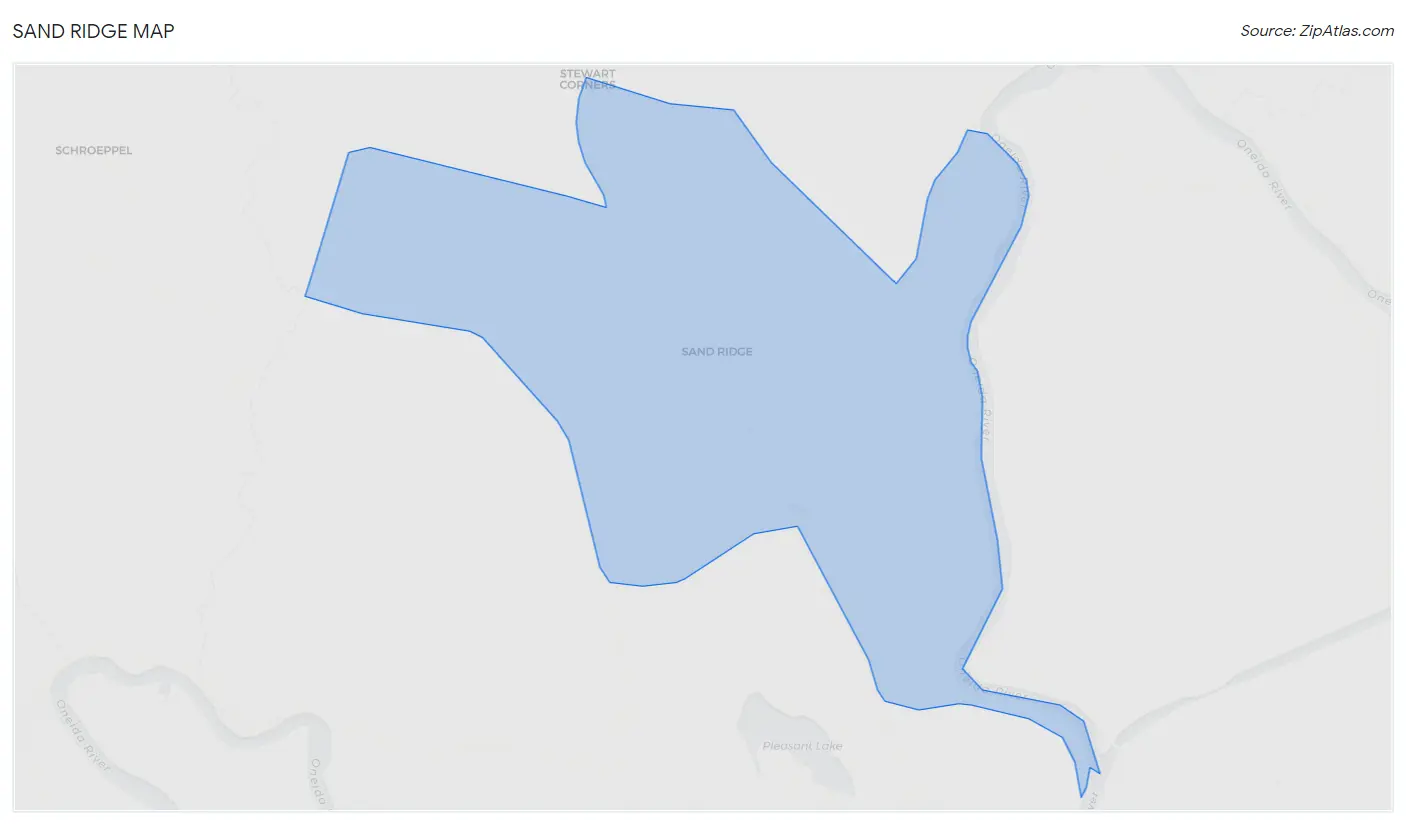
Sand Ridge Overview
$25,418
PER CAPITA INCOME
$44,950
AVG HOUSEHOLD INCOME
0.41
INEQUALITY / GINI INDEX
1,111
TOTAL POPULATION
455
MALE POPULATION
656
FEMALE POPULATION
69.36
MALES / 100 FEMALES
144.18
FEMALES / 100 MALES
44.6
MEDIAN AGE
2.7
AVG FAMILY SIZE
2.3
AVG HOUSEHOLD SIZE
457
LABOR FORCE [ PEOPLE ]
50.7%
PERCENT IN LABOR FORCE
15.3%
UNEMPLOYMENT RATE
Income in Sand Ridge
Income Overview in Sand Ridge
| Characteristic | Number | Measure |
| Per Capita Income | 1,111 | $25,418 |
| Median Family Income | 318 | $0 |
| Mean Family Income | 318 | $60,121 |
| Median Household Income | 476 | $44,950 |
| Mean Household Income | 476 | $62,456 |
| Income Deficit | 318 | $0 |
| Wage / Income Gap (%) | 1,111 | 0.00% |
| Wage / Income Gap ($) | 1,111 | 100.00¢ per $1 |
| Gini / Inequality Index | 1,111 | 0.41 |
Earnings by Sex in Sand Ridge

| Sex | Number | Average Earnings |
| Male | 205 (39.6%) | $51,477 |
| Female | 313 (60.4%) | $0 |
| Total | 518 (100.0%) | $23,902 |
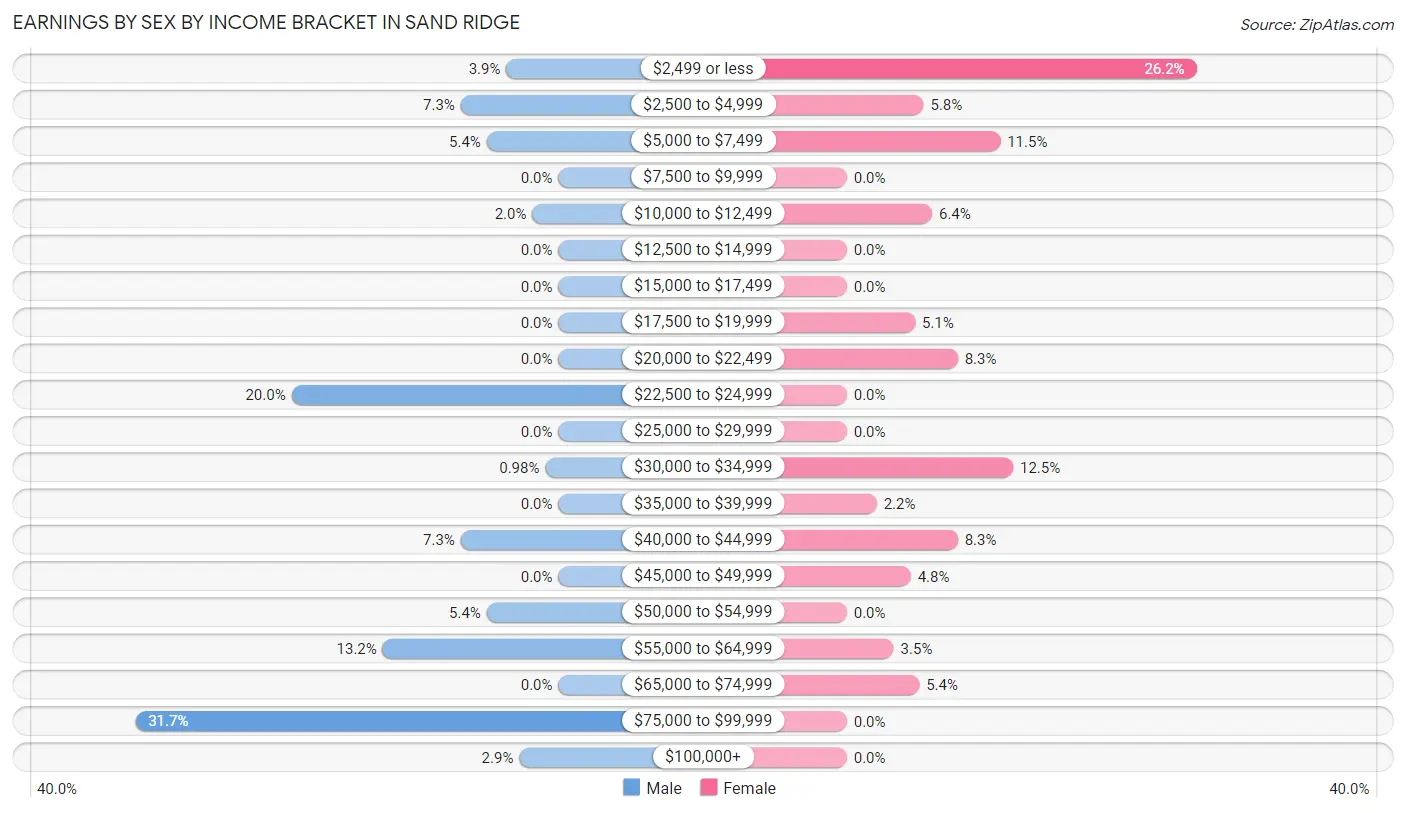
Earnings by Sex by Income Bracket in Sand Ridge
The most common earnings brackets in Sand Ridge are $75,000 to $99,999 for men (65 | 31.7%) and $2,499 or less for women (82 | 26.2%).
| Income | Male | Female |
| $2,499 or less | 8 (3.9%) | 82 (26.2%) |
| $2,500 to $4,999 | 15 (7.3%) | 18 (5.8%) |
| $5,000 to $7,499 | 11 (5.4%) | 36 (11.5%) |
| $7,500 to $9,999 | 0 (0.0%) | 0 (0.0%) |
| $10,000 to $12,499 | 4 (1.9%) | 20 (6.4%) |
| $12,500 to $14,999 | 0 (0.0%) | 0 (0.0%) |
| $15,000 to $17,499 | 0 (0.0%) | 0 (0.0%) |
| $17,500 to $19,999 | 0 (0.0%) | 16 (5.1%) |
| $20,000 to $22,499 | 0 (0.0%) | 26 (8.3%) |
| $22,500 to $24,999 | 41 (20.0%) | 0 (0.0%) |
| $25,000 to $29,999 | 0 (0.0%) | 0 (0.0%) |
| $30,000 to $34,999 | 2 (1.0%) | 39 (12.5%) |
| $35,000 to $39,999 | 0 (0.0%) | 7 (2.2%) |
| $40,000 to $44,999 | 15 (7.3%) | 26 (8.3%) |
| $45,000 to $49,999 | 0 (0.0%) | 15 (4.8%) |
| $50,000 to $54,999 | 11 (5.4%) | 0 (0.0%) |
| $55,000 to $64,999 | 27 (13.2%) | 11 (3.5%) |
| $65,000 to $74,999 | 0 (0.0%) | 17 (5.4%) |
| $75,000 to $99,999 | 65 (31.7%) | 0 (0.0%) |
| $100,000+ | 6 (2.9%) | 0 (0.0%) |
| Total | 205 (100.0%) | 313 (100.0%) |
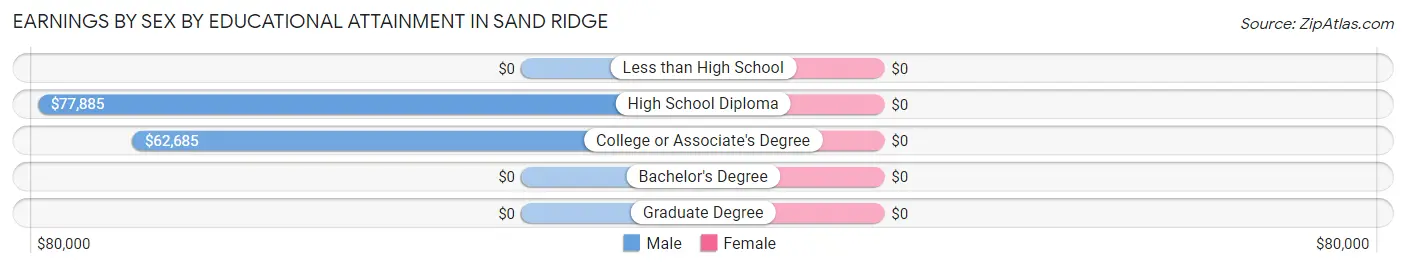
Earnings by Sex by Educational Attainment in Sand Ridge
| Educational Attainment | Male Income | Female Income |
| Less than High School | - | - |
| High School Diploma | $77,885 | $0 |
| College or Associate's Degree | $62,685 | $0 |
| Bachelor's Degree | - | - |
| Graduate Degree | - | - |
| Total | $63,750 | $21,923 |
Family Income in Sand Ridge
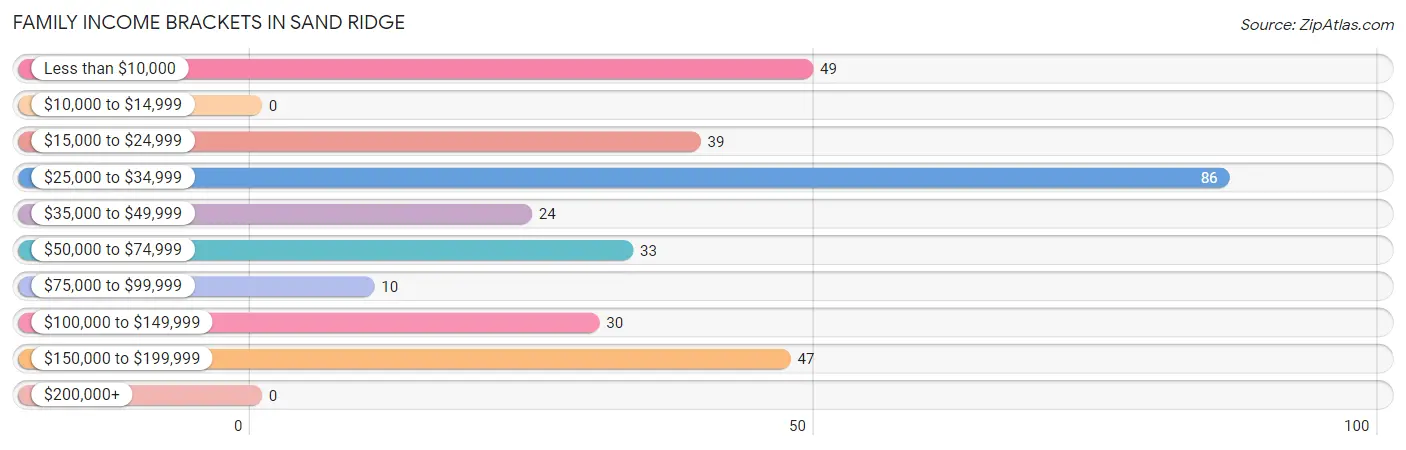
Family Income Brackets in Sand Ridge
According to the Sand Ridge family income data, there are 86 families falling into the $25,000 to $34,999 income range, which is the most common income bracket and makes up 27.0% of all families.
| Income Bracket | # Families | % Families |
| Less than $10,000 | 49 | 15.4% |
| $10,000 to $14,999 | 0 | 0.0% |
| $15,000 to $24,999 | 39 | 12.3% |
| $25,000 to $34,999 | 86 | 27.0% |
| $35,000 to $49,999 | 24 | 7.5% |
| $50,000 to $74,999 | 33 | 10.4% |
| $75,000 to $99,999 | 10 | 3.1% |
| $100,000 to $149,999 | 30 | 9.4% |
| $150,000 to $199,999 | 47 | 14.8% |
| $200,000+ | 0 | 0.0% |
Family Income by Famaliy Size in Sand Ridge
4-person families (110 | 34.6%) account for the highest median family income in Sand Ridge with $28,692 per family, while 4-person families (110 | 34.6%) have the highest median income of $7,173 per family member.
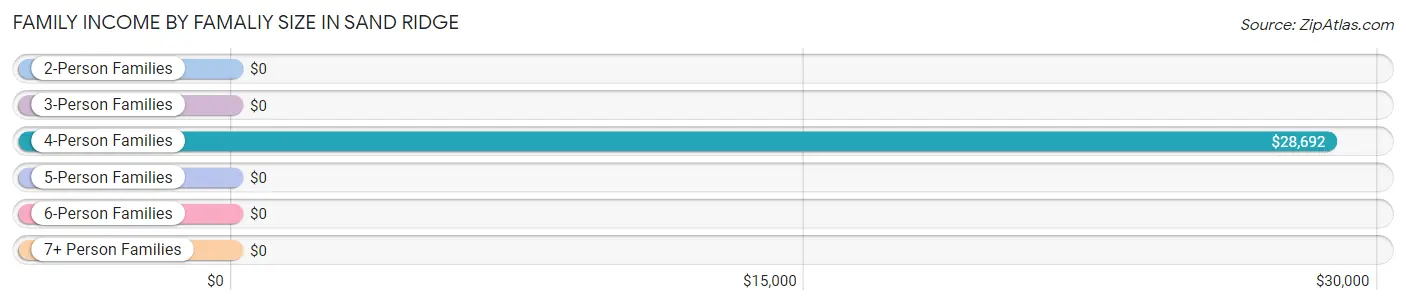
| Income Bracket | # Families | Median Income |
| 2-Person Families | 150 (47.2%) | $0 |
| 3-Person Families | 19 (6.0%) | $0 |
| 4-Person Families | 110 (34.6%) | $28,692 |
| 5-Person Families | 23 (7.2%) | $0 |
| 6-Person Families | 0 (0.0%) | $0 |
| 7+ Person Families | 16 (5.0%) | $0 |
| Total | 318 (100.0%) | $0 |
Family Income by Number of Earners in Sand Ridge
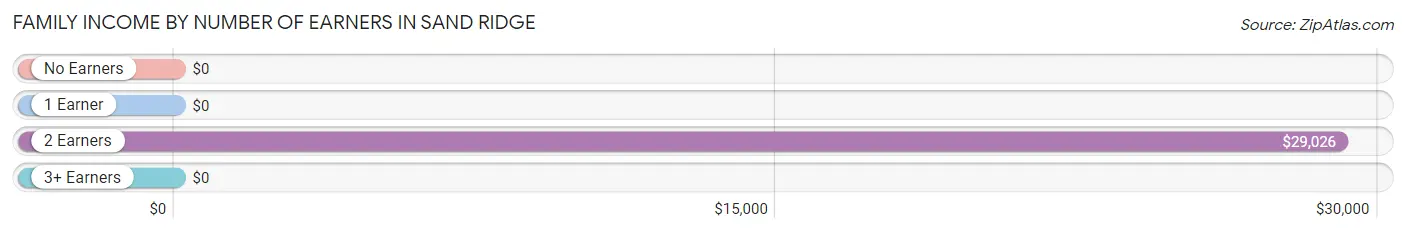
| Number of Earners | # Families | Median Income |
| No Earners | 79 (24.8%) | $0 |
| 1 Earner | 108 (34.0%) | $0 |
| 2 Earners | 105 (33.0%) | $29,026 |
| 3+ Earners | 26 (8.2%) | $0 |
| Total | 318 (100.0%) | $0 |
Household Income in Sand Ridge
Household Income Brackets in Sand Ridge
With 109 households falling in the category, the $35,000 to $49,999 income range is the most frequent in Sand Ridge, accounting for 22.9% of all households.
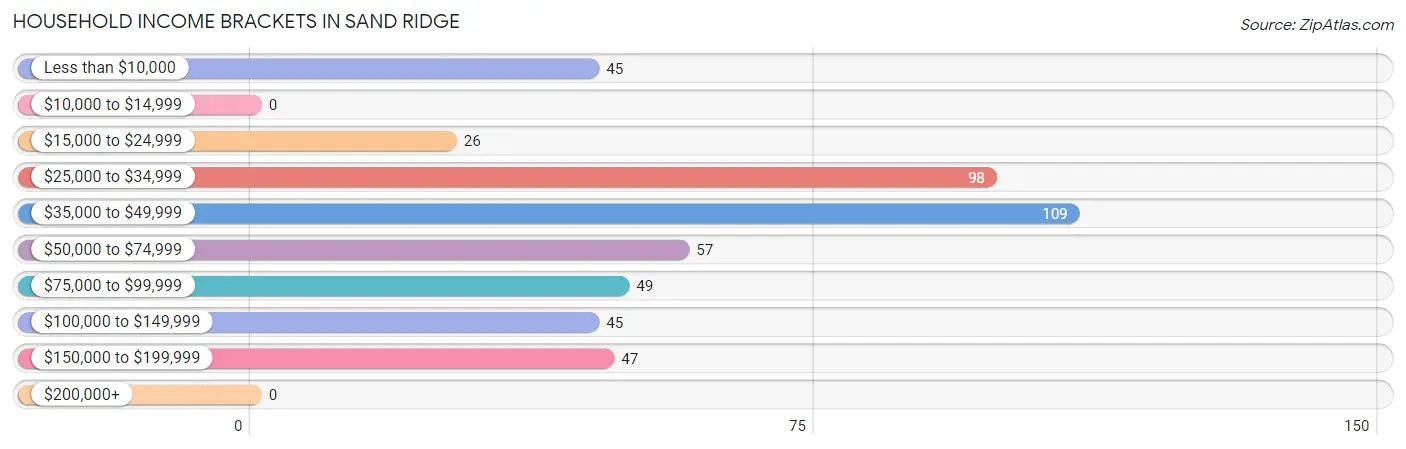
| Income Bracket | # Households | % Households |
| Less than $10,000 | 45 | 9.5% |
| $10,000 to $14,999 | 0 | 0.0% |
| $15,000 to $24,999 | 26 | 5.5% |
| $25,000 to $34,999 | 98 | 20.6% |
| $35,000 to $49,999 | 109 | 22.9% |
| $50,000 to $74,999 | 57 | 12.0% |
| $75,000 to $99,999 | 49 | 10.3% |
| $100,000 to $149,999 | 45 | 9.5% |
| $150,000 to $199,999 | 47 | 9.9% |
| $200,000+ | 0 | 0.0% |
Household Income by Householder Age in Sand Ridge
The median household income in Sand Ridge is $44,950, with the highest median household income of $46,603 found in the 65+ years age bracket for the primary householder. A total of 138 households (29.0%) fall into this category. Meanwhile, the 15 to 24 years age bracket for the primary householder has the lowest median household income of $0, with 50 households (10.5%) in this group.
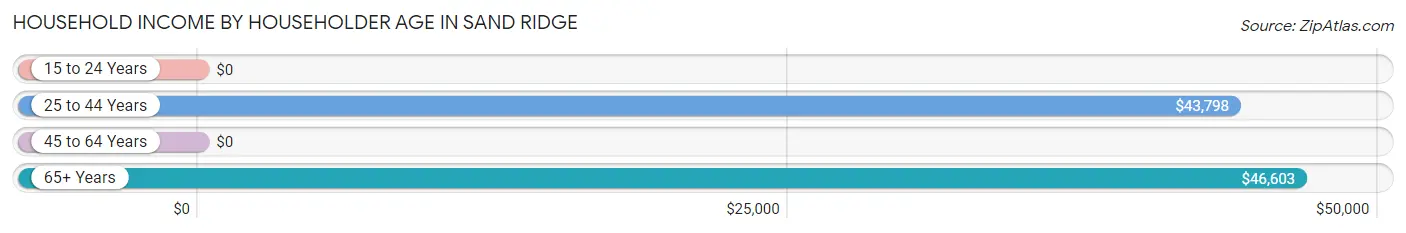
| Income Bracket | # Households | Median Income |
| 15 to 24 Years | 50 (10.5%) | $0 |
| 25 to 44 Years | 117 (24.6%) | $43,798 |
| 45 to 64 Years | 171 (35.9%) | $0 |
| 65+ Years | 138 (29.0%) | $46,603 |
| Total | 476 (100.0%) | $44,950 |
Poverty in Sand Ridge
Income Below Poverty by Sex and Age in Sand Ridge
With 14.5% poverty level for males and 52.7% for females among the residents of Sand Ridge, under 5 year old males and 5 year old females are the most vulnerable to poverty, with 18 males (45.0%) and 7 females (100.0%) in their respective age groups living below the poverty level.
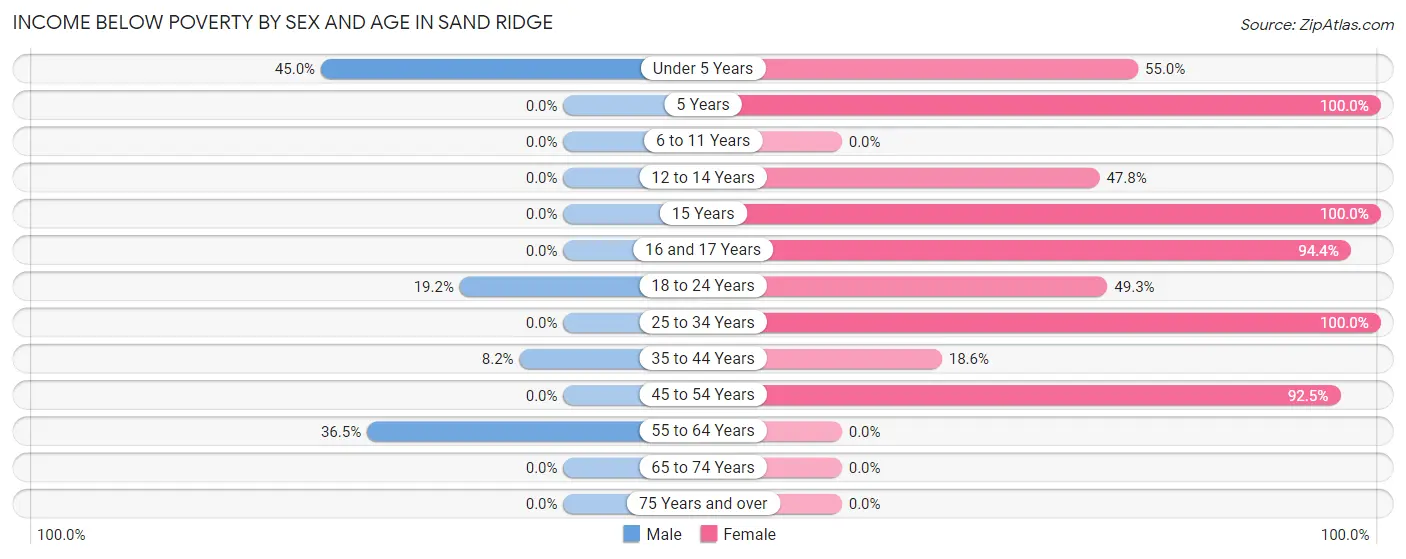
| Age Bracket | Male | Female |
| Under 5 Years | 18 (45.0%) | 22 (55.0%) |
| 5 Years | 0 (0.0%) | 7 (100.0%) |
| 6 to 11 Years | 0 (0.0%) | 0 (0.0%) |
| 12 to 14 Years | 0 (0.0%) | 11 (47.8%) |
| 15 Years | 0 (0.0%) | 53 (100.0%) |
| 16 and 17 Years | 0 (0.0%) | 51 (94.4%) |
| 18 to 24 Years | 5 (19.2%) | 35 (49.3%) |
| 25 to 34 Years | 0 (0.0%) | 14 (100.0%) |
| 35 to 44 Years | 4 (8.2%) | 18 (18.6%) |
| 45 to 54 Years | 0 (0.0%) | 135 (92.5%) |
| 55 to 64 Years | 39 (36.4%) | 0 (0.0%) |
| 65 to 74 Years | 0 (0.0%) | 0 (0.0%) |
| 75 Years and over | 0 (0.0%) | 0 (0.0%) |
| Total | 66 (14.5%) | 346 (52.7%) |
Income Above Poverty by Sex and Age in Sand Ridge
According to the poverty statistics in Sand Ridge, males aged 6 to 11 years and females aged 55 to 64 years are the age groups that are most secure financially, with 100.0% of males and 100.0% of females in these age groups living above the poverty line.
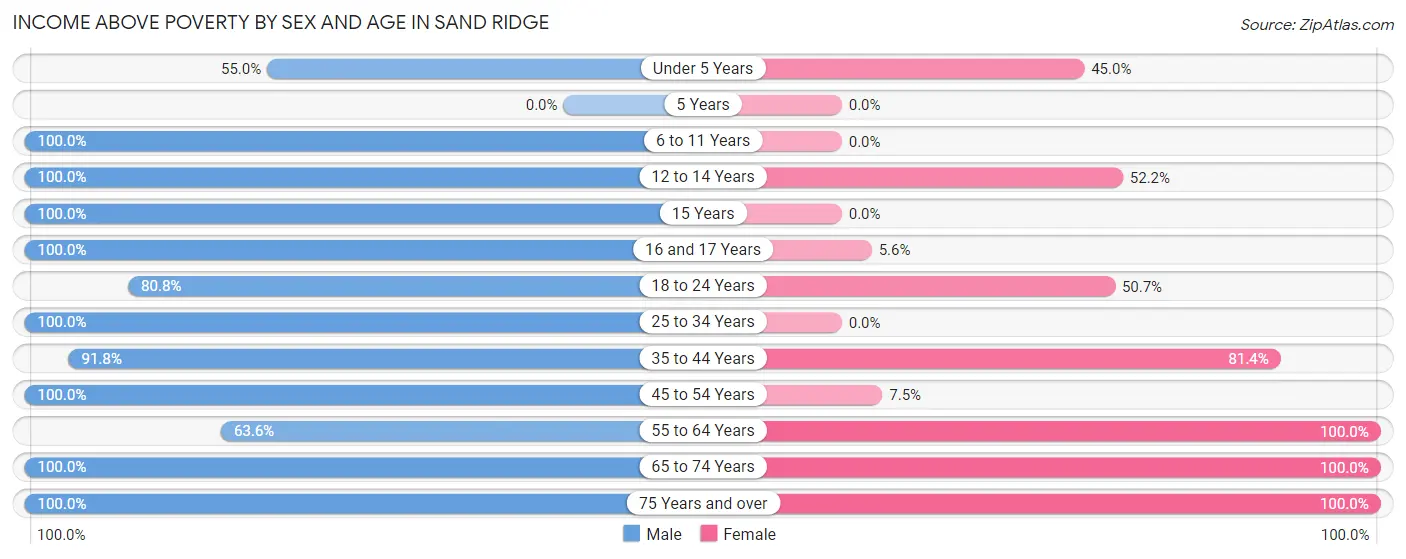
| Age Bracket | Male | Female |
| Under 5 Years | 22 (55.0%) | 18 (45.0%) |
| 5 Years | 0 (0.0%) | 0 (0.0%) |
| 6 to 11 Years | 28 (100.0%) | 0 (0.0%) |
| 12 to 14 Years | 3 (100.0%) | 12 (52.2%) |
| 15 Years | 15 (100.0%) | 0 (0.0%) |
| 16 and 17 Years | 21 (100.0%) | 3 (5.6%) |
| 18 to 24 Years | 21 (80.8%) | 36 (50.7%) |
| 25 to 34 Years | 38 (100.0%) | 0 (0.0%) |
| 35 to 44 Years | 45 (91.8%) | 79 (81.4%) |
| 45 to 54 Years | 13 (100.0%) | 11 (7.5%) |
| 55 to 64 Years | 68 (63.5%) | 30 (100.0%) |
| 65 to 74 Years | 50 (100.0%) | 93 (100.0%) |
| 75 Years and over | 65 (100.0%) | 28 (100.0%) |
| Total | 389 (85.5%) | 310 (47.3%) |
Income Below Poverty Among Married-Couple Families in Sand Ridge
The poverty statistics for married-couple families in Sand Ridge show that 37.4% or 86 of the total 230 families live below the poverty line. Families with 1 or 2 children have the highest poverty rate of 93.5%, comprising of 86 families. On the other hand, families with no children have the lowest poverty rate of 0.0%, which includes 0 families.
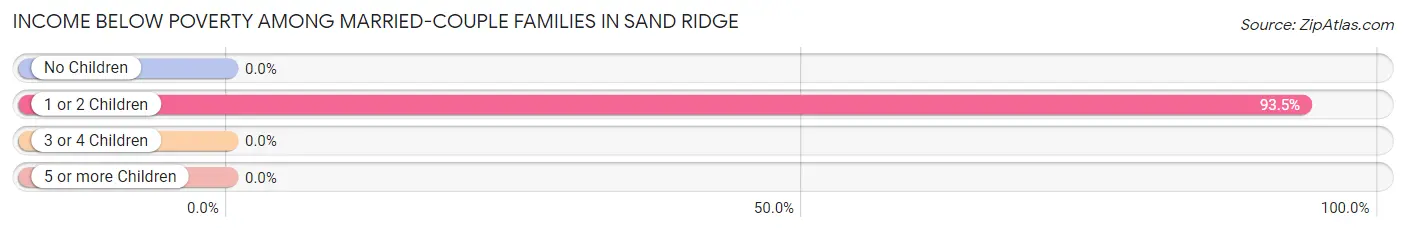
| Children | Above Poverty | Below Poverty |
| No Children | 119 (100.0%) | 0 (0.0%) |
| 1 or 2 Children | 6 (6.5%) | 86 (93.5%) |
| 3 or 4 Children | 3 (100.0%) | 0 (0.0%) |
| 5 or more Children | 16 (100.0%) | 0 (0.0%) |
| Total | 144 (62.6%) | 86 (37.4%) |
Income Below Poverty Among Single-Parent Households in Sand Ridge
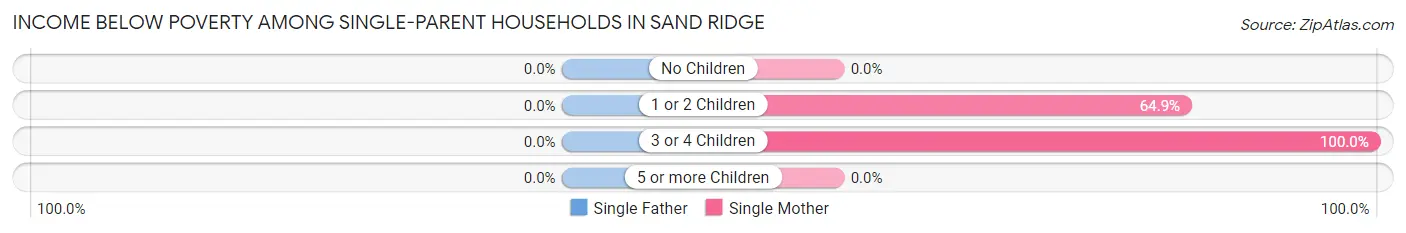
| Children | Single Father | Single Mother |
| No Children | 0 (0.0%) | 0 (0.0%) |
| 1 or 2 Children | 0 (0.0%) | 48 (64.9%) |
| 3 or 4 Children | 0 (0.0%) | 14 (100.0%) |
| 5 or more Children | 0 (0.0%) | 0 (0.0%) |
| Total | 0 (0.0%) | 62 (70.5%) |
Income Below Poverty Among Married-Couple vs Single-Parent Households in Sand Ridge
The poverty data for Sand Ridge shows that 86 of the married-couple family households (37.4%) and 62 of the single-parent households (70.5%) are living below the poverty level. Within the married-couple family households, those with 1 or 2 children have the highest poverty rate, with 86 households (93.5%) falling below the poverty line. Among the single-parent households, those with 3 or 4 children have the highest poverty rate, with 14 household (100.0%) living below poverty.
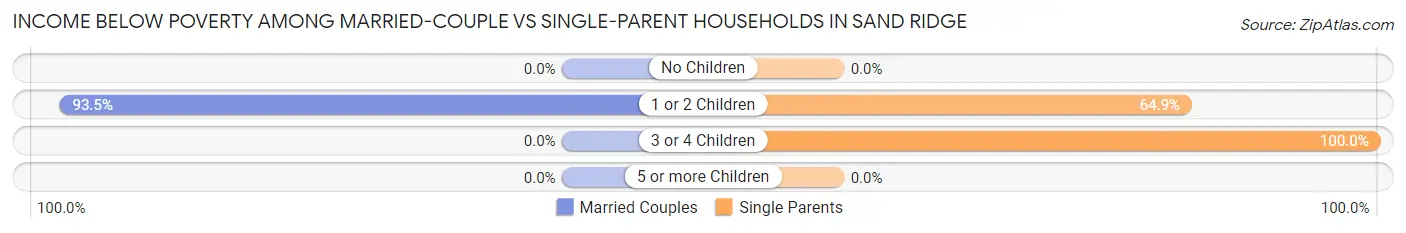
| Children | Married-Couple Families | Single-Parent Households |
| No Children | 0 (0.0%) | 0 (0.0%) |
| 1 or 2 Children | 86 (93.5%) | 48 (64.9%) |
| 3 or 4 Children | 0 (0.0%) | 14 (100.0%) |
| 5 or more Children | 0 (0.0%) | 0 (0.0%) |
| Total | 86 (37.4%) | 62 (70.5%) |
Race in Sand Ridge
The most populous races in Sand Ridge are White / Caucasian (928 | 83.5%), Two or more Races (143 | 12.9%), and Hispanic or Latino (59 | 5.3%).
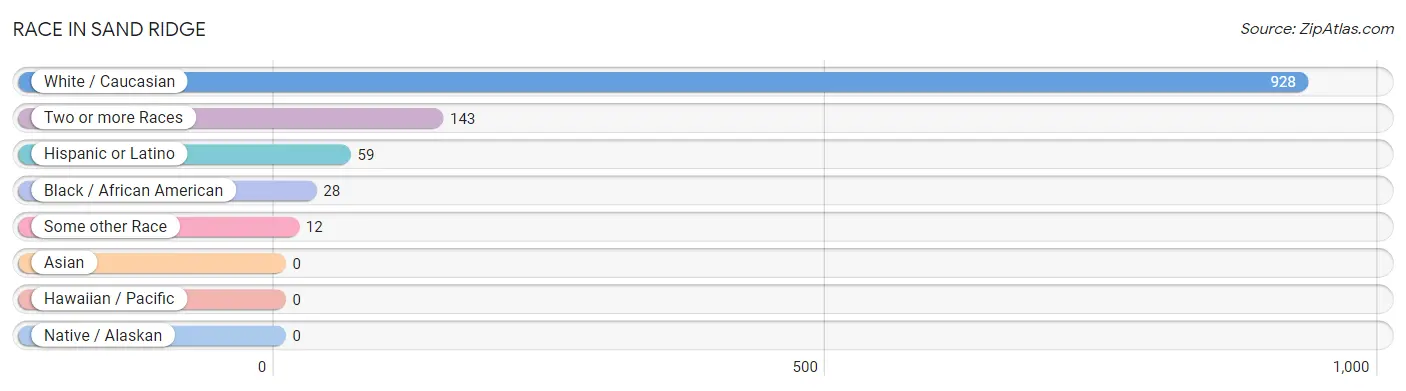
| Race | # Population | % Population |
| Asian | 0 | 0.0% |
| Black / African American | 28 | 2.5% |
| Hawaiian / Pacific | 0 | 0.0% |
| Hispanic or Latino | 59 | 5.3% |
| Native / Alaskan | 0 | 0.0% |
| White / Caucasian | 928 | 83.5% |
| Two or more Races | 143 | 12.9% |
| Some other Race | 12 | 1.1% |
| Total | 1,111 | 100.0% |
Ancestry in Sand Ridge
The most populous ancestries reported in Sand Ridge are German (183 | 16.5%), Polish (127 | 11.4%), English (107 | 9.6%), Irish (99 | 8.9%), and Italian (98 | 8.8%), together accounting for 55.3% of all Sand Ridge residents.
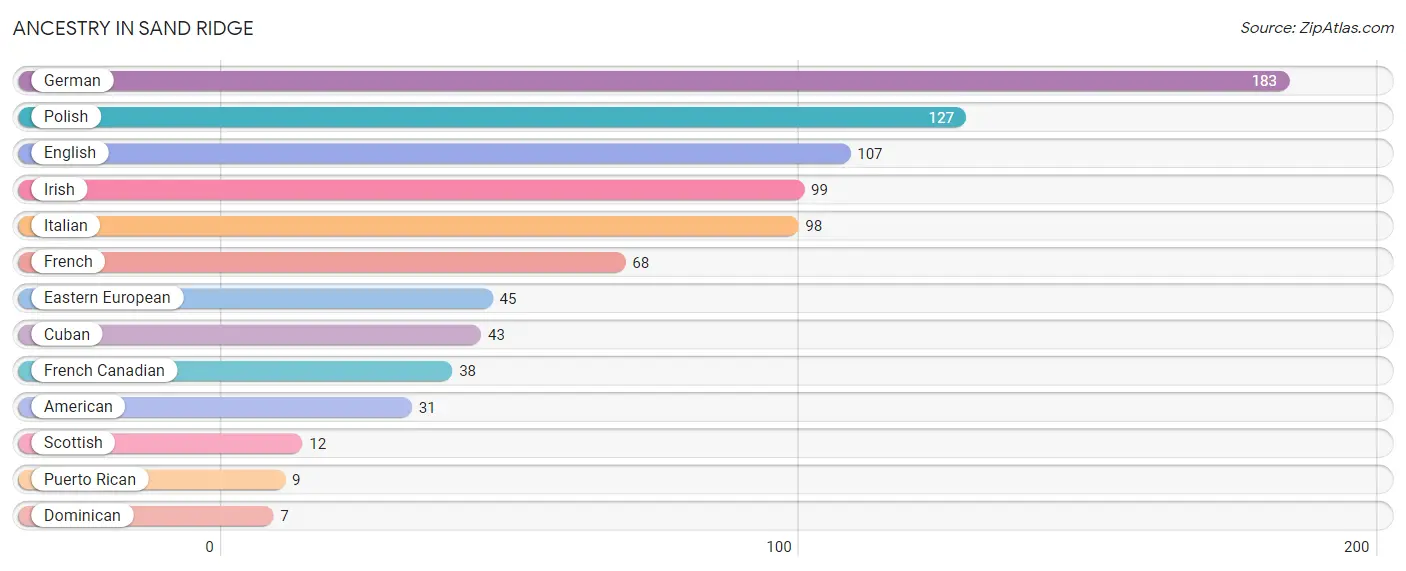
| Ancestry | # Population | % Population |
| American | 31 | 2.8% |
| Cuban | 43 | 3.9% |
| Dominican | 7 | 0.6% |
| Eastern European | 45 | 4.1% |
| English | 107 | 9.6% |
| French | 68 | 6.1% |
| French Canadian | 38 | 3.4% |
| German | 183 | 16.5% |
| Irish | 99 | 8.9% |
| Italian | 98 | 8.8% |
| Polish | 127 | 11.4% |
| Puerto Rican | 9 | 0.8% |
| Scottish | 12 | 1.1% | View All 13 Rows |
Immigrants in Sand Ridge

| Immigration Origin | # Population | % Population | View All 0 Rows |
Sex and Age in Sand Ridge
Sex and Age in Sand Ridge
The most populous age groups in Sand Ridge are 60 to 64 Years (58 | 12.8%) for men and 50 to 54 Years (110 | 16.8%) for women.
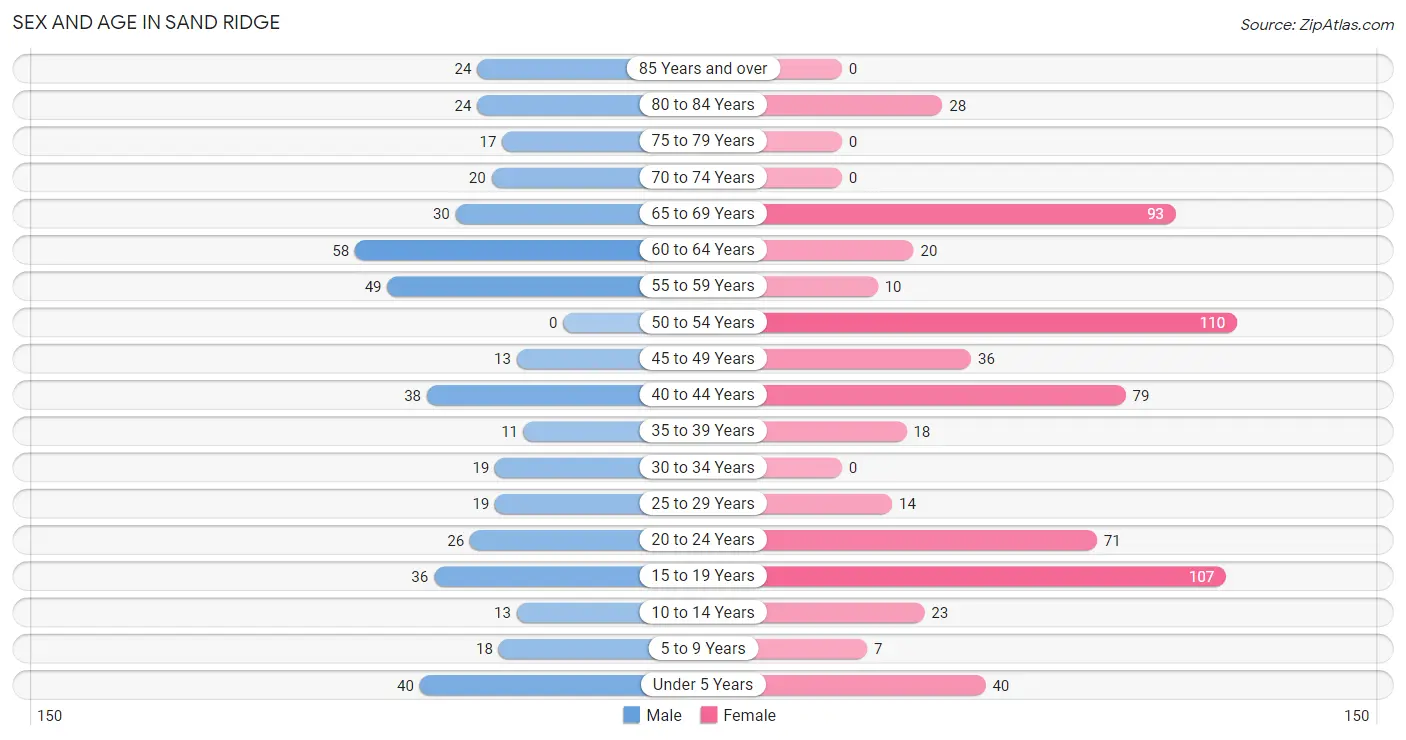
| Age Bracket | Male | Female |
| Under 5 Years | 40 (8.8%) | 40 (6.1%) |
| 5 to 9 Years | 18 (4.0%) | 7 (1.1%) |
| 10 to 14 Years | 13 (2.9%) | 23 (3.5%) |
| 15 to 19 Years | 36 (7.9%) | 107 (16.3%) |
| 20 to 24 Years | 26 (5.7%) | 71 (10.8%) |
| 25 to 29 Years | 19 (4.2%) | 14 (2.1%) |
| 30 to 34 Years | 19 (4.2%) | 0 (0.0%) |
| 35 to 39 Years | 11 (2.4%) | 18 (2.7%) |
| 40 to 44 Years | 38 (8.4%) | 79 (12.0%) |
| 45 to 49 Years | 13 (2.9%) | 36 (5.5%) |
| 50 to 54 Years | 0 (0.0%) | 110 (16.8%) |
| 55 to 59 Years | 49 (10.8%) | 10 (1.5%) |
| 60 to 64 Years | 58 (12.8%) | 20 (3.0%) |
| 65 to 69 Years | 30 (6.6%) | 93 (14.2%) |
| 70 to 74 Years | 20 (4.4%) | 0 (0.0%) |
| 75 to 79 Years | 17 (3.7%) | 0 (0.0%) |
| 80 to 84 Years | 24 (5.3%) | 28 (4.3%) |
| 85 Years and over | 24 (5.3%) | 0 (0.0%) |
| Total | 455 (100.0%) | 656 (100.0%) |
Families and Households in Sand Ridge
Median Family Size in Sand Ridge
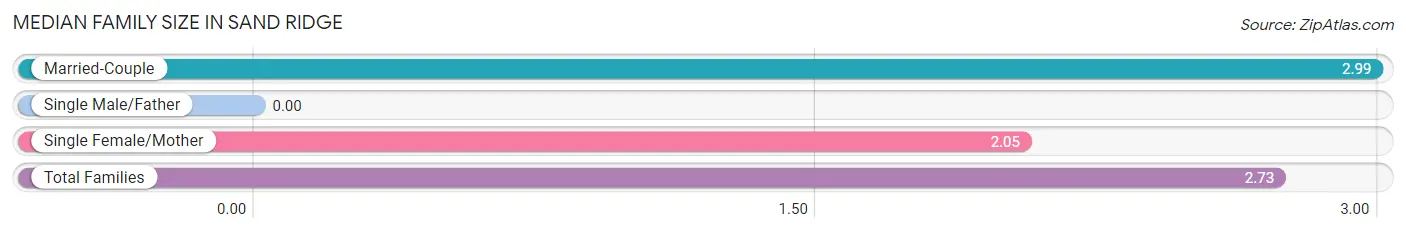
| Family Type | # Families | Family Size |
| Married-Couple | 230 (72.3%) | 2.99 |
| Single Male/Father | 0 (0.0%) | - |
| Single Female/Mother | 88 (27.7%) | 2.05 |
| Total Families | 318 (100.0%) | 2.73 |
Median Household Size in Sand Ridge
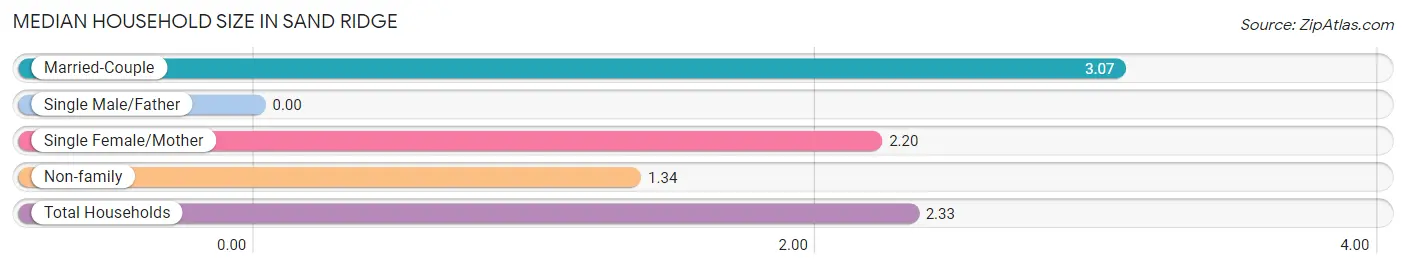
| Household Type | # Households | Household Size |
| Married-Couple | 230 (48.3%) | 3.07 |
| Single Male/Father | 0 (0.0%) | - |
| Single Female/Mother | 88 (18.5%) | 2.20 |
| Non-family | 158 (33.2%) | 1.34 |
| Total Households | 476 (100.0%) | 2.33 |
Household Size by Marriage Status in Sand Ridge
Out of a total of 476 households in Sand Ridge, 318 (66.8%) are family households, while 158 (33.2%) are nonfamily households. The most numerous type of family households are 2-person households, comprising 138, and the most common type of nonfamily households are 1-person households, comprising 104.
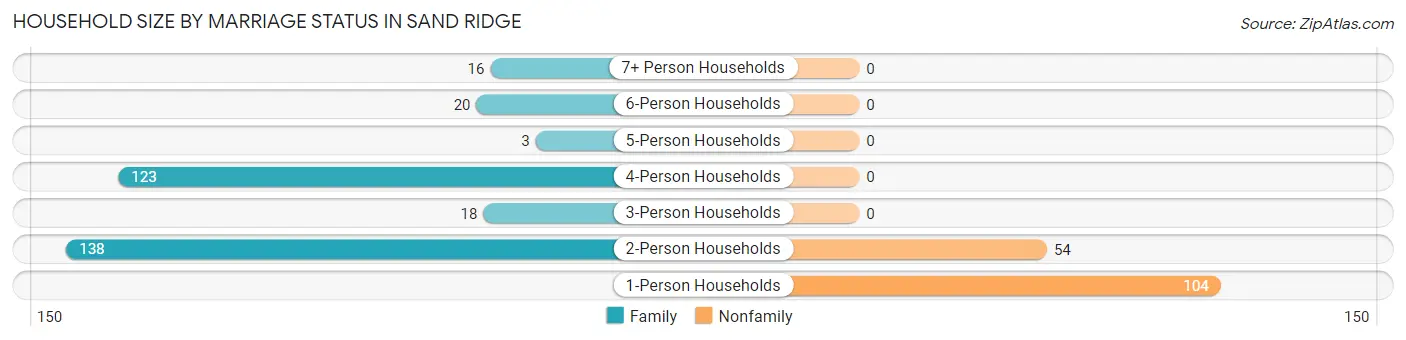
| Household Size | Family Households | Nonfamily Households |
| 1-Person Households | - | 104 (21.8%) |
| 2-Person Households | 138 (29.0%) | 54 (11.3%) |
| 3-Person Households | 18 (3.8%) | 0 (0.0%) |
| 4-Person Households | 123 (25.8%) | 0 (0.0%) |
| 5-Person Households | 3 (0.6%) | 0 (0.0%) |
| 6-Person Households | 20 (4.2%) | 0 (0.0%) |
| 7+ Person Households | 16 (3.4%) | 0 (0.0%) |
| Total | 318 (66.8%) | 158 (33.2%) |
Female Fertility in Sand Ridge
Fertility by Age in Sand Ridge
Average fertility rate in Sand Ridge is 71.0 births per 1,000 women. Women in the age bracket of 20 to 34 years have the highest fertility rate with 271.0 births per 1,000 women. Women in the age bracket of 20 to 34 years acount for 100.0% of all women with births.
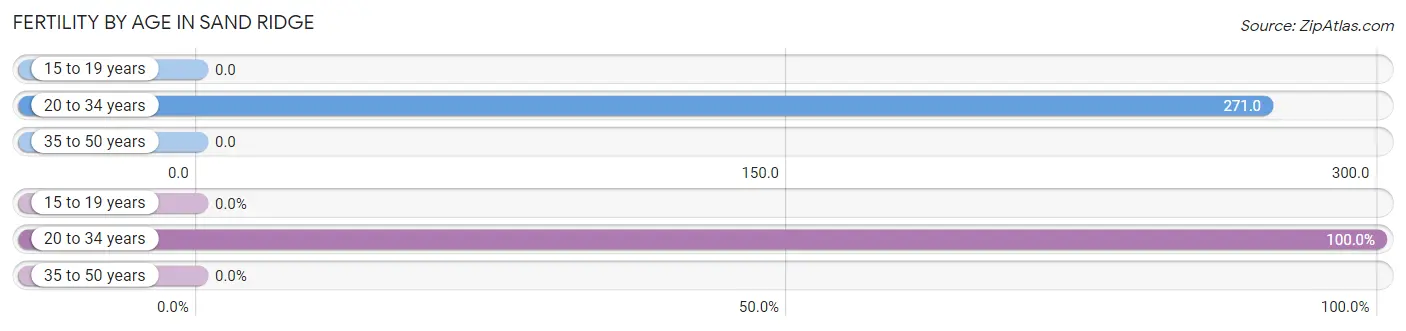
| Age Bracket | Women with Births | Births / 1,000 Women |
| 15 to 19 years | 0 (0.0%) | 0.0 |
| 20 to 34 years | 23 (100.0%) | 271.0 |
| 35 to 50 years | 0 (0.0%) | 0.0 |
| Total | 23 (100.0%) | 71.0 |
Fertility by Age by Marriage Status in Sand Ridge
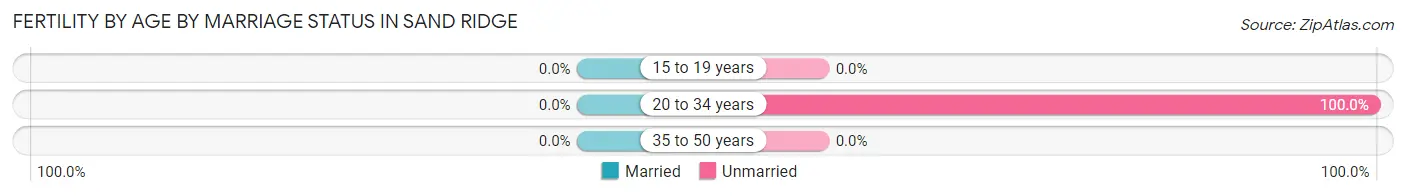
| Age Bracket | Married | Unmarried |
| 15 to 19 years | 0 (0.0%) | 0 (0.0%) |
| 20 to 34 years | 0 (0.0%) | 23 (100.0%) |
| 35 to 50 years | 0 (0.0%) | 0 (0.0%) |
| Total | 0 (0.0%) | 23 (100.0%) |
Fertility by Education in Sand Ridge
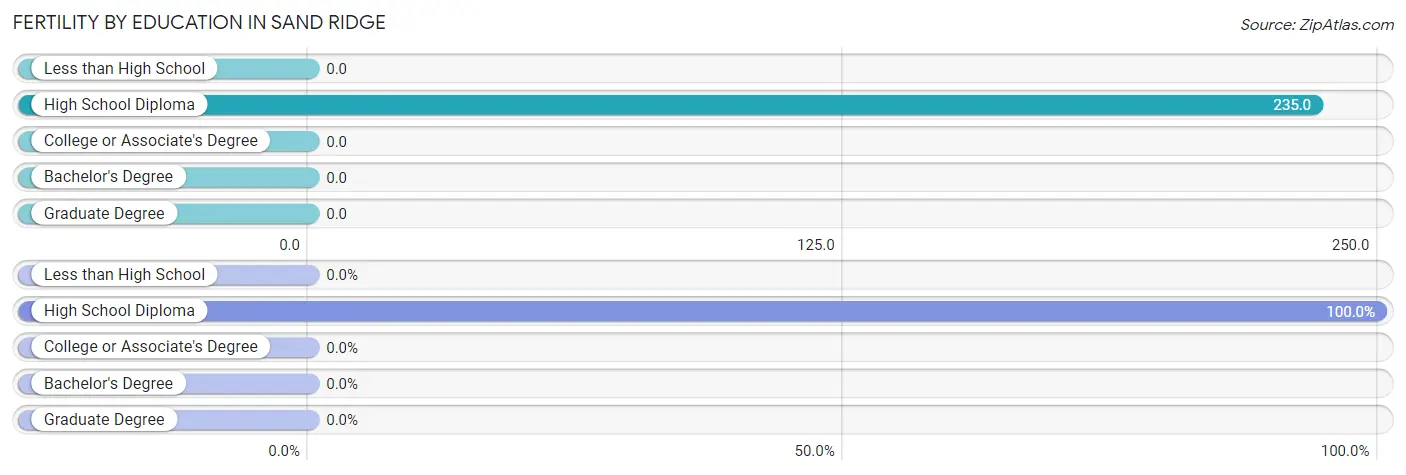
| Educational Attainment | Women with Births | Births / 1,000 Women |
| Less than High School | 0 (0.0%) | 0.0 |
| High School Diploma | 23 (100.0%) | 235.0 |
| College or Associate's Degree | 0 (0.0%) | 0.0 |
| Bachelor's Degree | 0 (0.0%) | 0.0 |
| Graduate Degree | 0 (0.0%) | 0.0 |
| Total | 23 (100.0%) | 71.0 |
Fertility by Education by Marriage Status in Sand Ridge
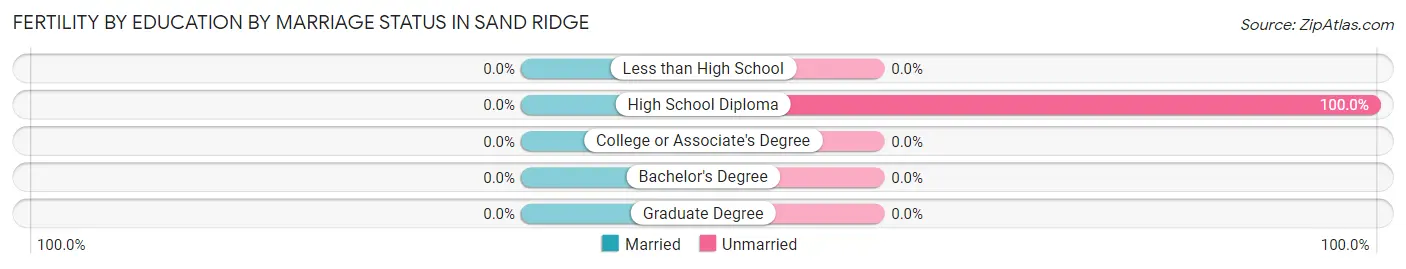
| Educational Attainment | Married | Unmarried |
| Less than High School | 0 (0.0%) | 0 (0.0%) |
| High School Diploma | 0 (0.0%) | 23 (100.0%) |
| College or Associate's Degree | 0 (0.0%) | 0 (0.0%) |
| Bachelor's Degree | 0 (0.0%) | 0 (0.0%) |
| Graduate Degree | 0 (0.0%) | 0 (0.0%) |
| Total | 0 (0.0%) | 23 (100.0%) |
Employment Characteristics in Sand Ridge
Employment by Class of Employer in Sand Ridge
Among the 387 employed individuals in Sand Ridge, private company employees (261 | 67.4%), local government employees (33 | 8.5%), and self-employed (incorporated) (31 | 8.0%) make up the most common classes of employment.
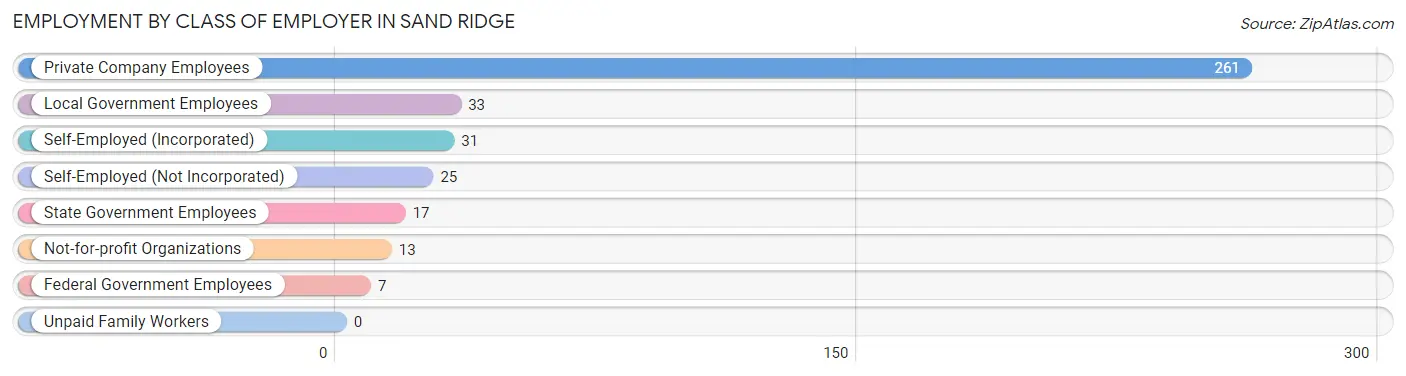
| Employer Class | # Employees | % Employees |
| Private Company Employees | 261 | 67.4% |
| Self-Employed (Incorporated) | 31 | 8.0% |
| Self-Employed (Not Incorporated) | 25 | 6.5% |
| Not-for-profit Organizations | 13 | 3.4% |
| Local Government Employees | 33 | 8.5% |
| State Government Employees | 17 | 4.4% |
| Federal Government Employees | 7 | 1.8% |
| Unpaid Family Workers | 0 | 0.0% |
| Total | 387 | 100.0% |
Employment Status by Age in Sand Ridge
According to the labor force statistics for Sand Ridge, out of the total population over 16 years of age (902), 50.7% or 457 individuals are in the labor force, with 15.3% or 70 of them unemployed. The age group with the highest labor force participation rate is 25 to 29 years, with 100.0% or 33 individuals in the labor force. Within the labor force, the 20 to 24 years age range has the highest percentage of unemployed individuals, with 47.8% or 44 of them being unemployed.
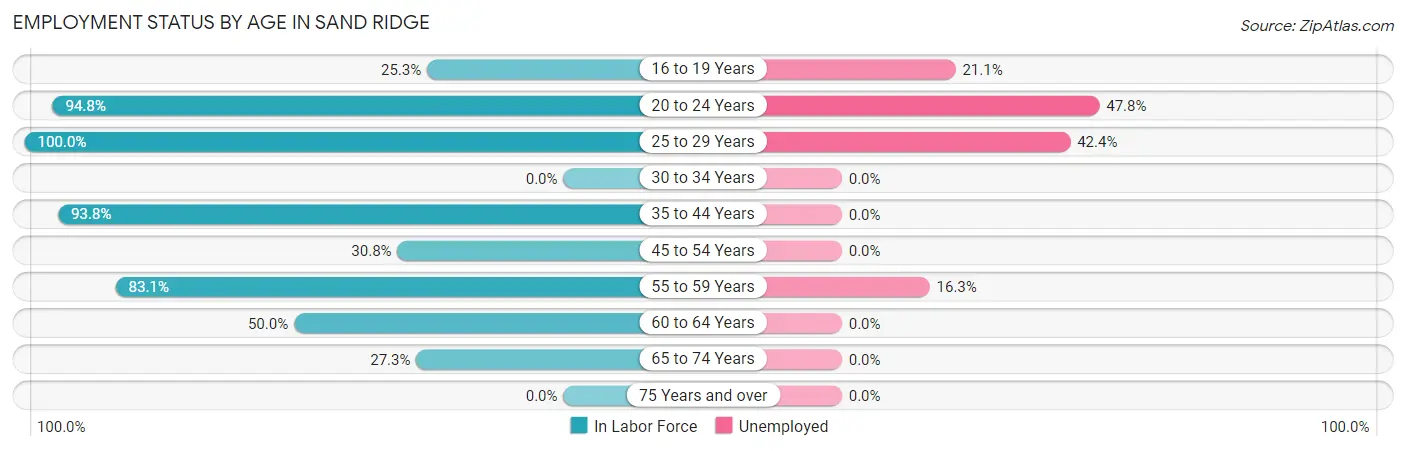
| Age Bracket | In Labor Force | Unemployed |
| 16 to 19 Years | 19 (25.3%) | 4 (21.1%) |
| 20 to 24 Years | 92 (94.8%) | 44 (47.8%) |
| 25 to 29 Years | 33 (100.0%) | 14 (42.4%) |
| 30 to 34 Years | 0 (0.0%) | 0 (0.0%) |
| 35 to 44 Years | 137 (93.8%) | 0 (0.0%) |
| 45 to 54 Years | 49 (30.8%) | 0 (0.0%) |
| 55 to 59 Years | 49 (83.1%) | 8 (16.3%) |
| 60 to 64 Years | 39 (50.0%) | 0 (0.0%) |
| 65 to 74 Years | 39 (27.3%) | 0 (0.0%) |
| 75 Years and over | 0 (0.0%) | 0 (0.0%) |
| Total | 457 (50.7%) | 70 (15.3%) |
Employment Status by Educational Attainment in Sand Ridge
According to labor force statistics for Sand Ridge, 62.1% of individuals (307) out of the total population between 25 and 64 years of age (494) are in the labor force, with 7.2% or 22 of them being unemployed. The group with the highest labor force participation rate are those with the educational attainment of high school diploma, with 78.6% or 125 individuals in the labor force. Within the labor force, individuals with high school diploma education have the highest percentage of unemployment, with 11.2% or 14 of them being unemployed.
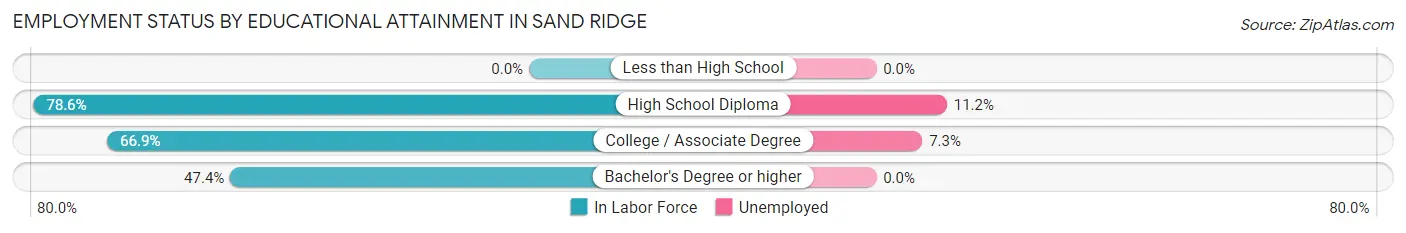
| Educational Attainment | In Labor Force | Unemployed |
| Less than High School | 0 (0.0%) | 0 (0.0%) |
| High School Diploma | 125 (78.6%) | 18 (11.2%) |
| College / Associate Degree | 109 (66.9%) | 12 (7.3%) |
| Bachelor's Degree or higher | 73 (47.4%) | 0 (0.0%) |
| Total | 307 (62.1%) | 36 (7.2%) |
Employment Occupations by Sex in Sand Ridge
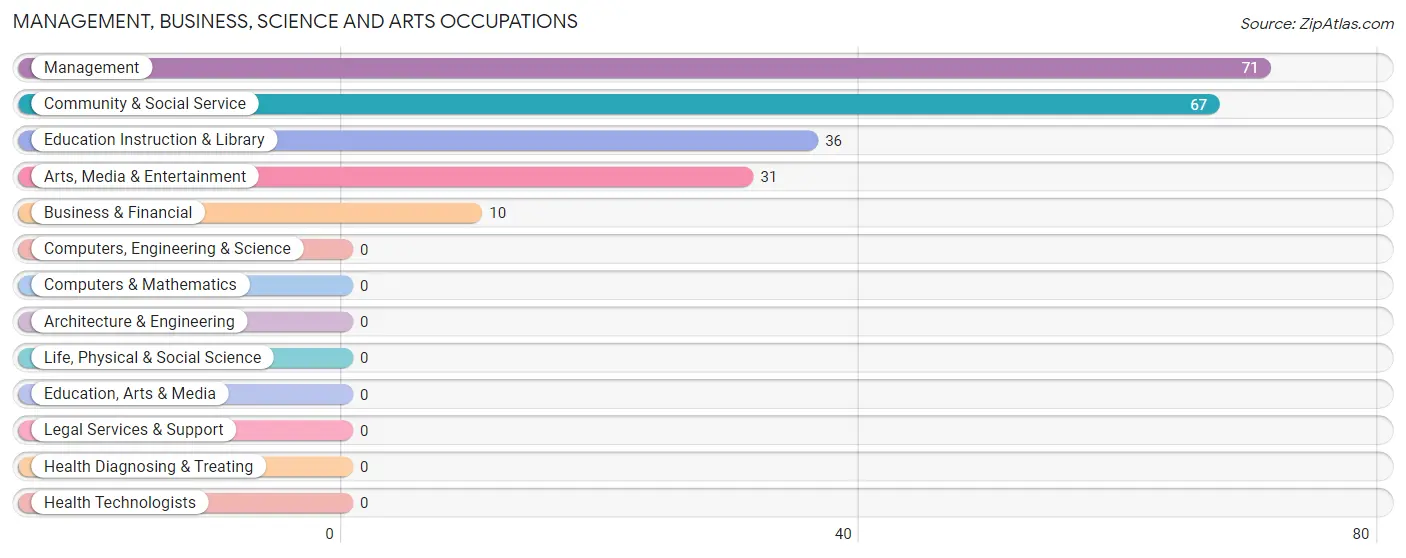
Management, Business, Science and Arts Occupations
The most common Management, Business, Science and Arts occupations in Sand Ridge are Management (71 | 18.3%), Community & Social Service (67 | 17.3%), Education Instruction & Library (36 | 9.3%), Arts, Media & Entertainment (31 | 8.0%), and Business & Financial (10 | 2.6%).
Management, Business, Science and Arts Occupations by Sex
Within the Management, Business, Science and Arts occupations in Sand Ridge, the most male-oriented occupations are Business & Financial (100.0%), Arts, Media & Entertainment (100.0%), and Community & Social Service (70.2%), while the most female-oriented occupations are Education Instruction & Library (55.6%), Management (36.6%), and Community & Social Service (29.8%).
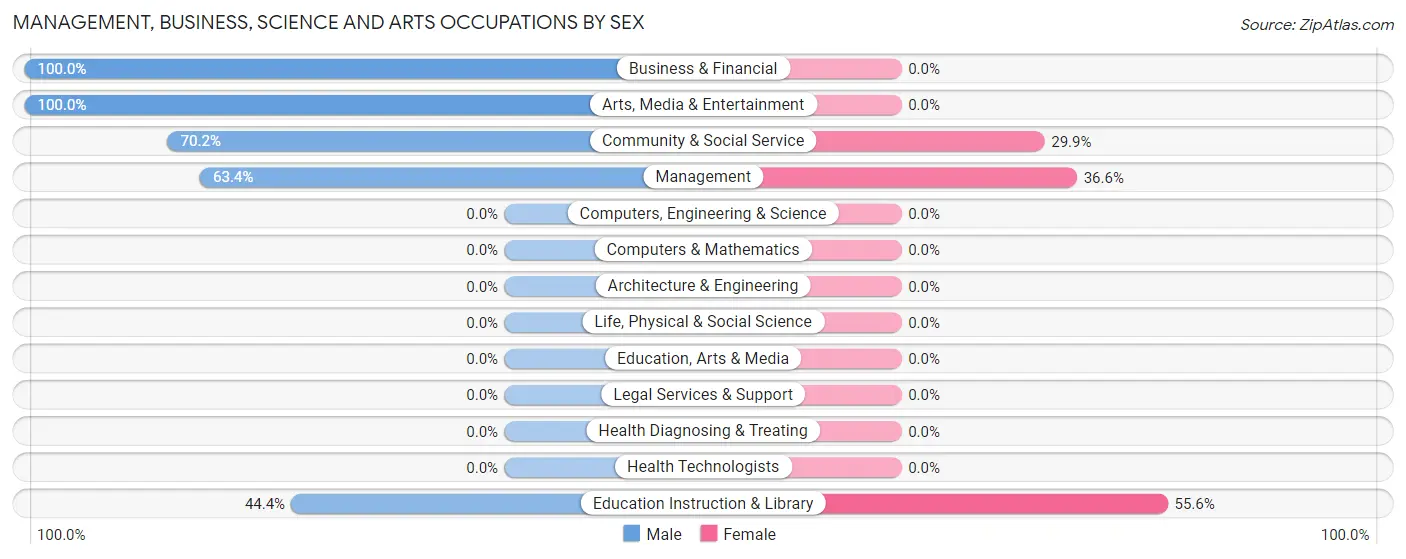
| Occupation | Male | Female |
| Management | 45 (63.4%) | 26 (36.6%) |
| Business & Financial | 10 (100.0%) | 0 (0.0%) |
| Computers, Engineering & Science | 0 (0.0%) | 0 (0.0%) |
| Computers & Mathematics | 0 (0.0%) | 0 (0.0%) |
| Architecture & Engineering | 0 (0.0%) | 0 (0.0%) |
| Life, Physical & Social Science | 0 (0.0%) | 0 (0.0%) |
| Community & Social Service | 47 (70.2%) | 20 (29.8%) |
| Education, Arts & Media | 0 (0.0%) | 0 (0.0%) |
| Legal Services & Support | 0 (0.0%) | 0 (0.0%) |
| Education Instruction & Library | 16 (44.4%) | 20 (55.6%) |
| Arts, Media & Entertainment | 31 (100.0%) | 0 (0.0%) |
| Health Diagnosing & Treating | 0 (0.0%) | 0 (0.0%) |
| Health Technologists | 0 (0.0%) | 0 (0.0%) |
| Total (Category) | 102 (68.9%) | 46 (31.1%) |
| Total (Overall) | 193 (49.9%) | 194 (50.1%) |
Services Occupations
The most common Services occupations in Sand Ridge are Food Preparation & Serving (28 | 7.2%), and Healthcare Support (26 | 6.7%).
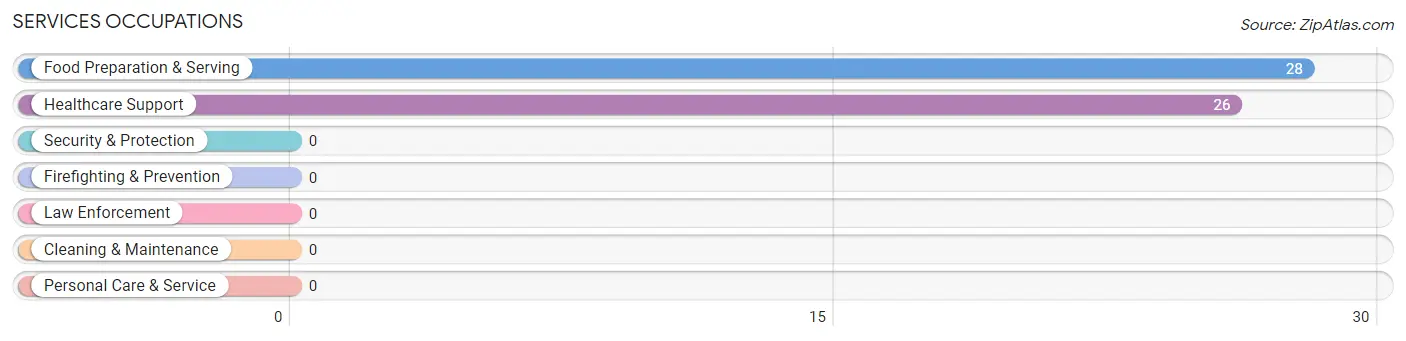
Services Occupations by Sex
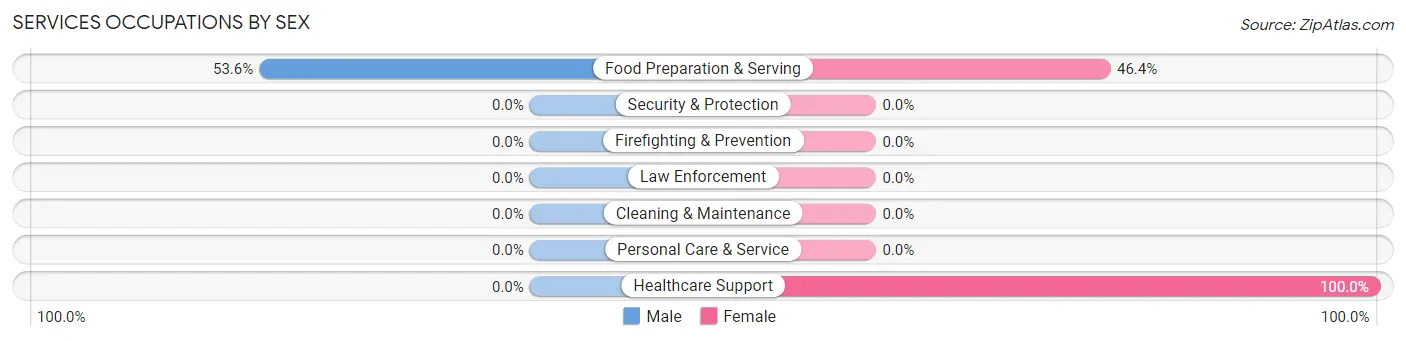
| Occupation | Male | Female |
| Healthcare Support | 0 (0.0%) | 26 (100.0%) |
| Security & Protection | 0 (0.0%) | 0 (0.0%) |
| Firefighting & Prevention | 0 (0.0%) | 0 (0.0%) |
| Law Enforcement | 0 (0.0%) | 0 (0.0%) |
| Food Preparation & Serving | 15 (53.6%) | 13 (46.4%) |
| Cleaning & Maintenance | 0 (0.0%) | 0 (0.0%) |
| Personal Care & Service | 0 (0.0%) | 0 (0.0%) |
| Total (Category) | 15 (27.8%) | 39 (72.2%) |
| Total (Overall) | 193 (49.9%) | 194 (50.1%) |
Sales and Office Occupations
The most common Sales and Office occupations in Sand Ridge are Sales & Related (89 | 23.0%), and Office & Administration (46 | 11.9%).
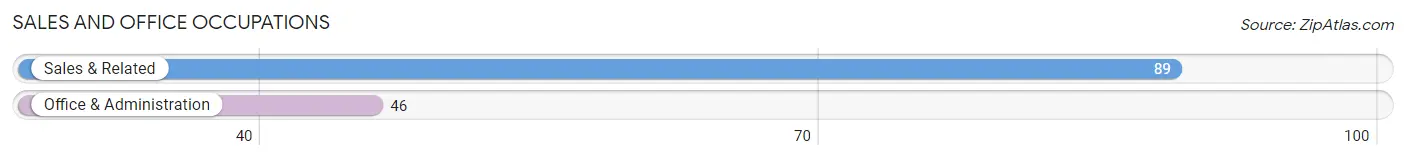
Sales and Office Occupations by Sex
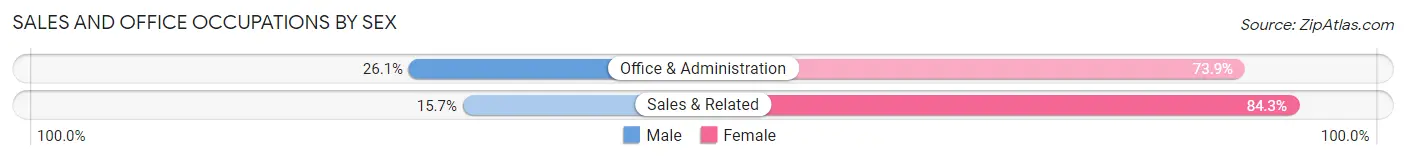
| Occupation | Male | Female |
| Sales & Related | 14 (15.7%) | 75 (84.3%) |
| Office & Administration | 12 (26.1%) | 34 (73.9%) |
| Total (Category) | 26 (19.3%) | 109 (80.7%) |
| Total (Overall) | 193 (49.9%) | 194 (50.1%) |
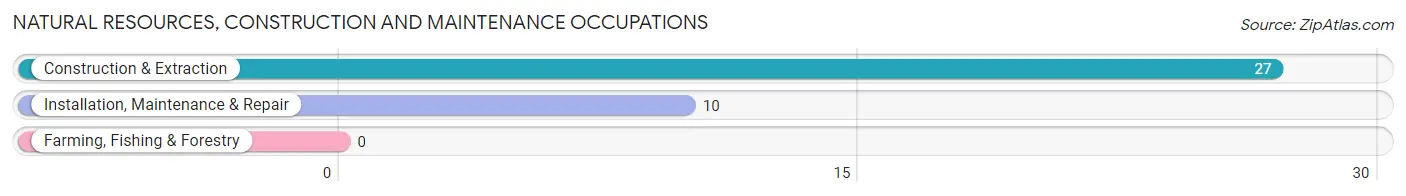
Natural Resources, Construction and Maintenance Occupations
The most common Natural Resources, Construction and Maintenance occupations in Sand Ridge are Construction & Extraction (27 | 7.0%), and Installation, Maintenance & Repair (10 | 2.6%).
Natural Resources, Construction and Maintenance Occupations by Sex
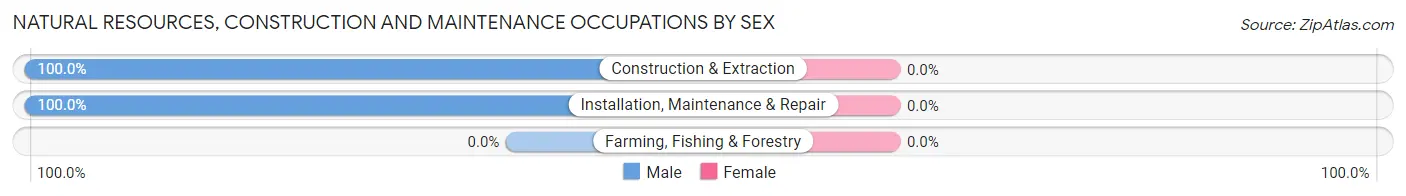
| Occupation | Male | Female |
| Farming, Fishing & Forestry | 0 (0.0%) | 0 (0.0%) |
| Construction & Extraction | 27 (100.0%) | 0 (0.0%) |
| Installation, Maintenance & Repair | 10 (100.0%) | 0 (0.0%) |
| Total (Category) | 37 (100.0%) | 0 (0.0%) |
| Total (Overall) | 193 (49.9%) | 194 (50.1%) |
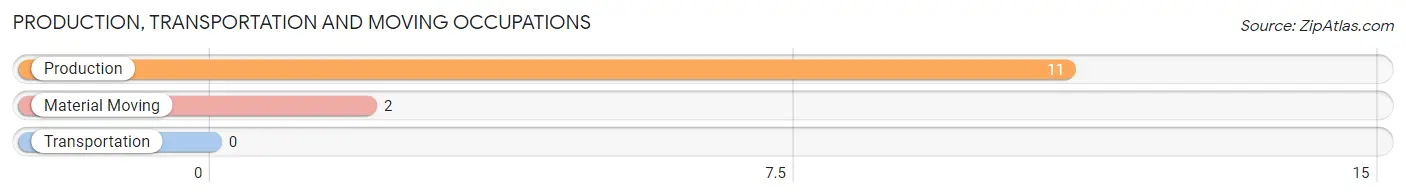
Production, Transportation and Moving Occupations
The most common Production, Transportation and Moving occupations in Sand Ridge are Production (11 | 2.8%), and Material Moving (2 | 0.5%).
Production, Transportation and Moving Occupations by Sex
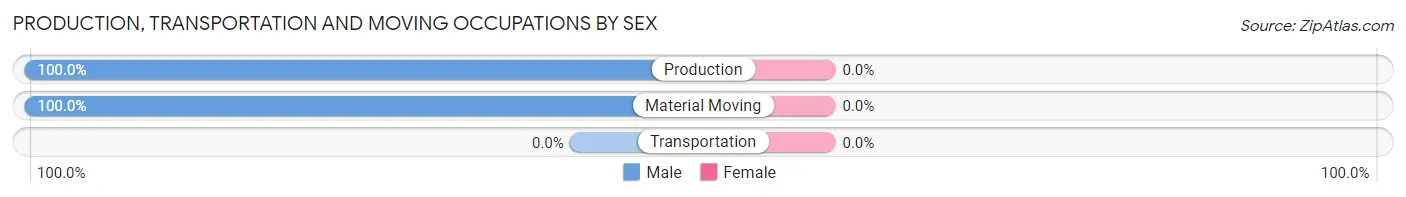
| Occupation | Male | Female |
| Production | 11 (100.0%) | 0 (0.0%) |
| Transportation | 0 (0.0%) | 0 (0.0%) |
| Material Moving | 2 (100.0%) | 0 (0.0%) |
| Total (Category) | 13 (100.0%) | 0 (0.0%) |
| Total (Overall) | 193 (49.9%) | 194 (50.1%) |
Employment Industries by Sex in Sand Ridge
Employment Industries in Sand Ridge
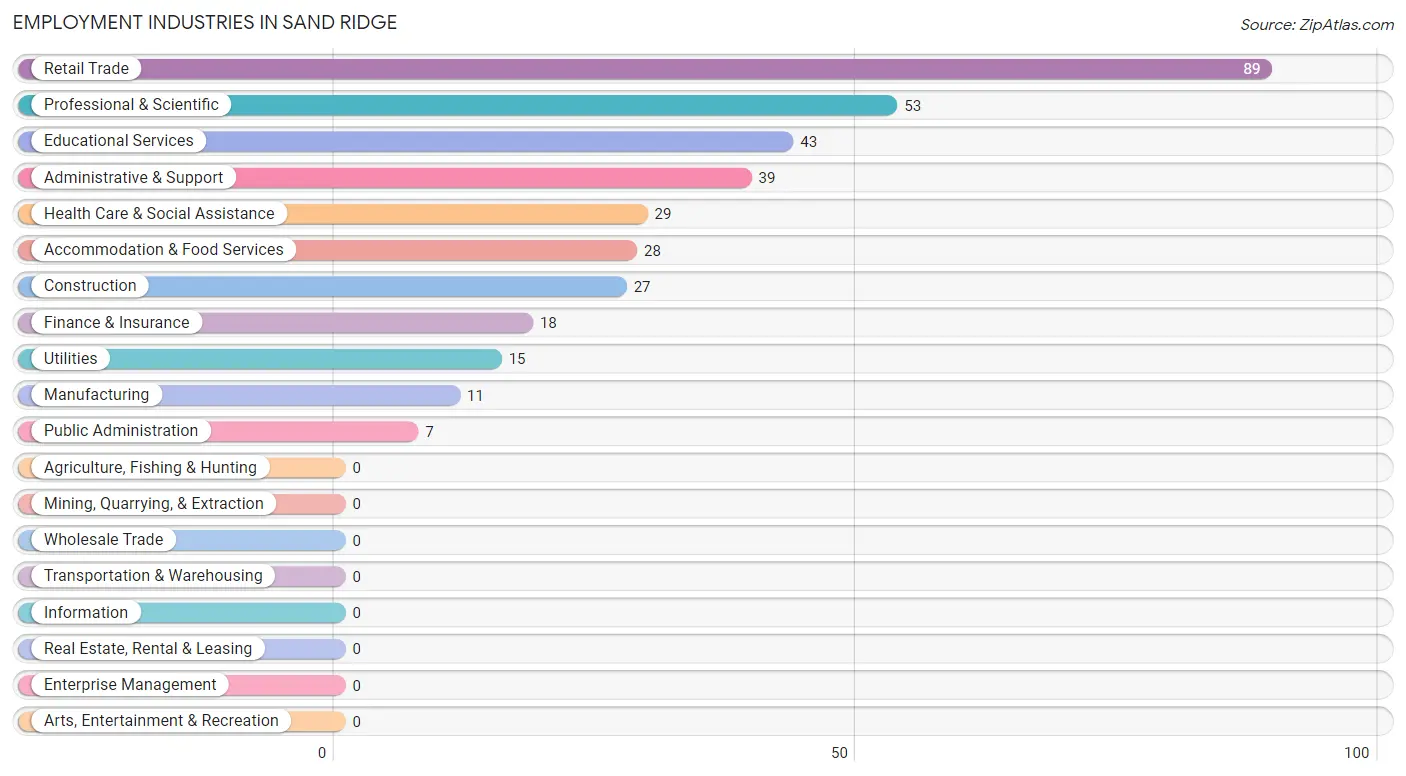
The major employment industries in Sand Ridge include Retail Trade (89 | 23.0%), Professional & Scientific (53 | 13.7%), Educational Services (43 | 11.1%), Administrative & Support (39 | 10.1%), and Health Care & Social Assistance (29 | 7.5%).
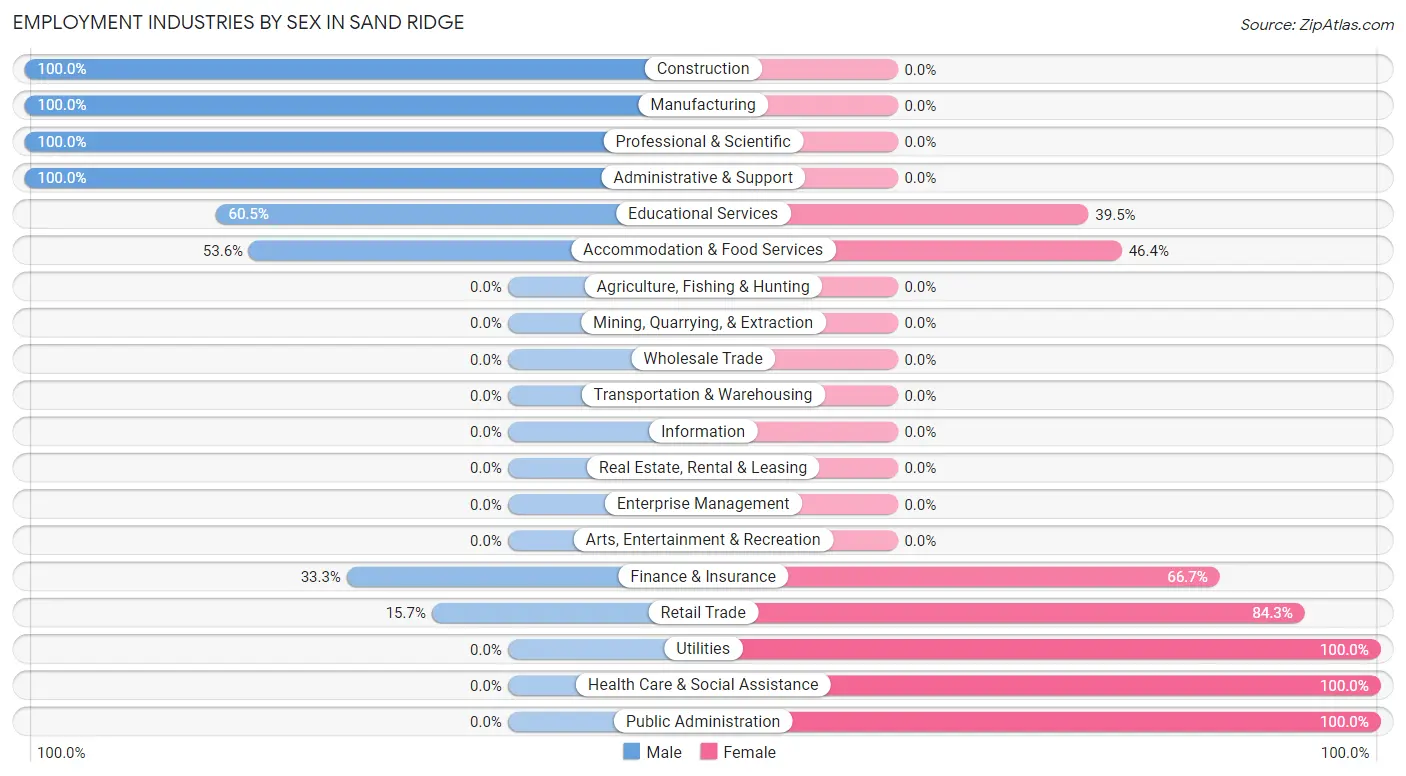
Employment Industries by Sex in Sand Ridge
The Sand Ridge industries that see more men than women are Construction (100.0%), Manufacturing (100.0%), and Professional & Scientific (100.0%), whereas the industries that tend to have a higher number of women are Utilities (100.0%), Health Care & Social Assistance (100.0%), and Public Administration (100.0%).
| Industry | Male | Female |
| Agriculture, Fishing & Hunting | 0 (0.0%) | 0 (0.0%) |
| Mining, Quarrying, & Extraction | 0 (0.0%) | 0 (0.0%) |
| Construction | 27 (100.0%) | 0 (0.0%) |
| Manufacturing | 11 (100.0%) | 0 (0.0%) |
| Wholesale Trade | 0 (0.0%) | 0 (0.0%) |
| Retail Trade | 14 (15.7%) | 75 (84.3%) |
| Transportation & Warehousing | 0 (0.0%) | 0 (0.0%) |
| Utilities | 0 (0.0%) | 15 (100.0%) |
| Information | 0 (0.0%) | 0 (0.0%) |
| Finance & Insurance | 6 (33.3%) | 12 (66.7%) |
| Real Estate, Rental & Leasing | 0 (0.0%) | 0 (0.0%) |
| Professional & Scientific | 53 (100.0%) | 0 (0.0%) |
| Enterprise Management | 0 (0.0%) | 0 (0.0%) |
| Administrative & Support | 39 (100.0%) | 0 (0.0%) |
| Educational Services | 26 (60.5%) | 17 (39.5%) |
| Health Care & Social Assistance | 0 (0.0%) | 29 (100.0%) |
| Arts, Entertainment & Recreation | 0 (0.0%) | 0 (0.0%) |
| Accommodation & Food Services | 15 (53.6%) | 13 (46.4%) |
| Public Administration | 0 (0.0%) | 7 (100.0%) |
| Total | 193 (49.9%) | 194 (50.1%) |
Education in Sand Ridge
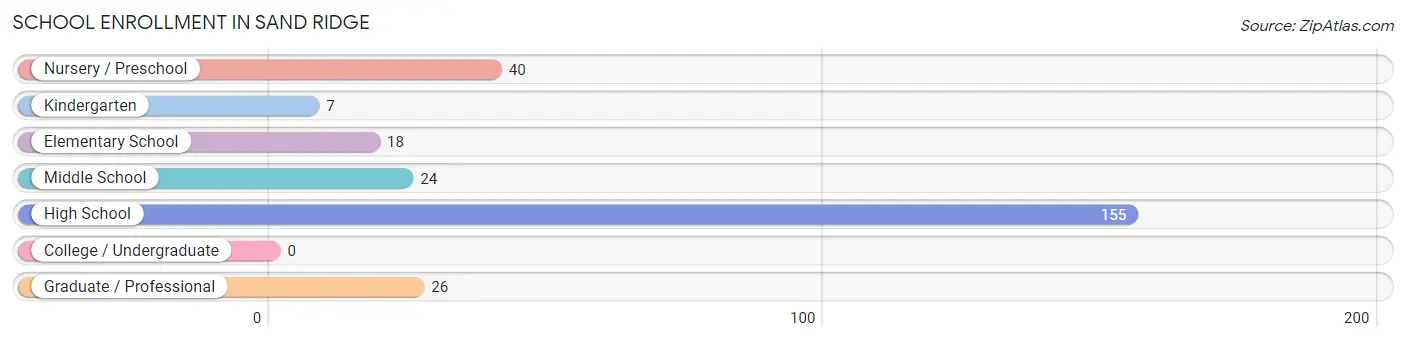
School Enrollment in Sand Ridge
The most common levels of schooling among the 270 students in Sand Ridge are high school (155 | 57.4%), nursery / preschool (40 | 14.8%), and graduate / professional (26 | 9.6%).
| School Level | # Students | % Students |
| Nursery / Preschool | 40 | 14.8% |
| Kindergarten | 7 | 2.6% |
| Elementary School | 18 | 6.7% |
| Middle School | 24 | 8.9% |
| High School | 155 | 57.4% |
| College / Undergraduate | 0 | 0.0% |
| Graduate / Professional | 26 | 9.6% |
| Total | 270 | 100.0% |
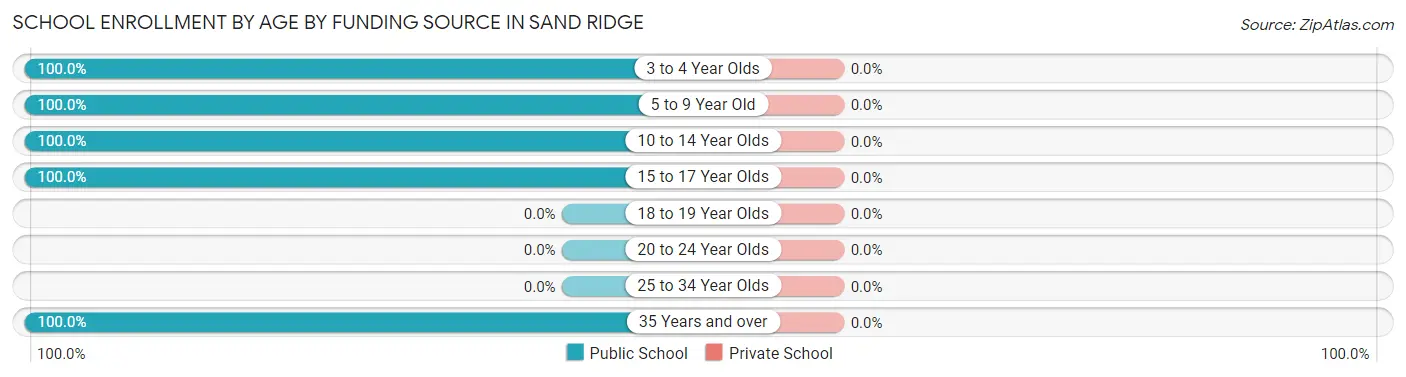
School Enrollment by Age by Funding Source in Sand Ridge
| Age Bracket | Public School | Private School |
| 3 to 4 Year Olds | 40 (100.0%) | 0 (0.0%) |
| 5 to 9 Year Old | 25 (100.0%) | 0 (0.0%) |
| 10 to 14 Year Olds | 36 (100.0%) | 0 (0.0%) |
| 15 to 17 Year Olds | 143 (100.0%) | 0 (0.0%) |
| 18 to 19 Year Olds | 0 (0.0%) | 0 (0.0%) |
| 20 to 24 Year Olds | 0 (0.0%) | 0 (0.0%) |
| 25 to 34 Year Olds | 0 (0.0%) | 0 (0.0%) |
| 35 Years and over | 26 (100.0%) | 0 (0.0%) |
| Total | 270 (100.0%) | 0 (0.0%) |
Educational Attainment by Field of Study in Sand Ridge
Education (113 | 40.5%), liberal arts & history (105 | 37.6%), social sciences (31 | 11.1%), and business (30 | 10.7%) are the most common fields of study among 279 individuals in Sand Ridge who have obtained a bachelor's degree or higher.
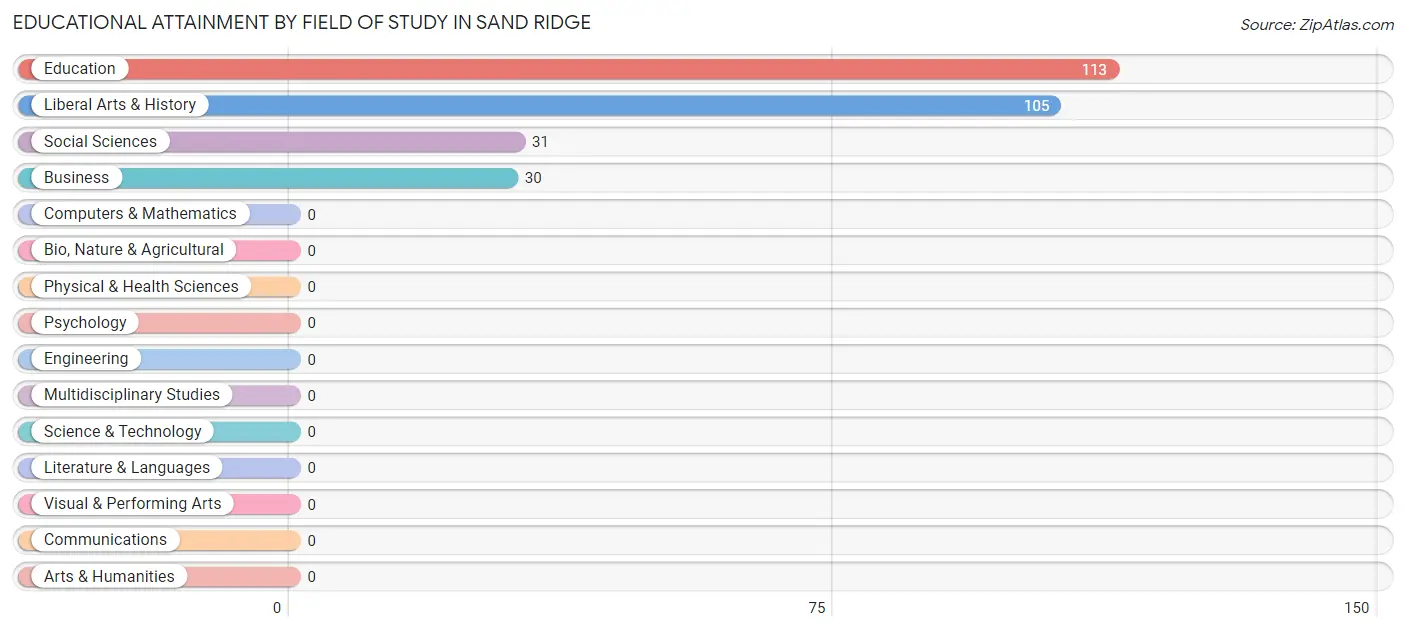
| Field of Study | # Graduates | % Graduates |
| Computers & Mathematics | 0 | 0.0% |
| Bio, Nature & Agricultural | 0 | 0.0% |
| Physical & Health Sciences | 0 | 0.0% |
| Psychology | 0 | 0.0% |
| Social Sciences | 31 | 11.1% |
| Engineering | 0 | 0.0% |
| Multidisciplinary Studies | 0 | 0.0% |
| Science & Technology | 0 | 0.0% |
| Business | 30 | 10.7% |
| Education | 113 | 40.5% |
| Literature & Languages | 0 | 0.0% |
| Liberal Arts & History | 105 | 37.6% |
| Visual & Performing Arts | 0 | 0.0% |
| Communications | 0 | 0.0% |
| Arts & Humanities | 0 | 0.0% |
| Total | 279 | 100.0% |
Transportation & Commute in Sand Ridge
Vehicle Availability by Sex in Sand Ridge
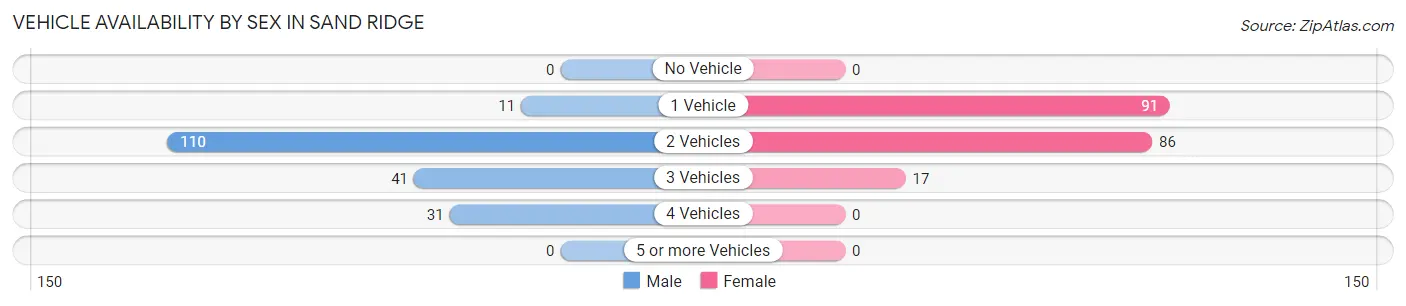
The most prevalent vehicle ownership categories in Sand Ridge are males with 2 vehicles (110, accounting for 57.0%) and females with 2 vehicles (86, making up 56.7%).
| Vehicles Available | Male | Female |
| No Vehicle | 0 (0.0%) | 0 (0.0%) |
| 1 Vehicle | 11 (5.7%) | 91 (46.9%) |
| 2 Vehicles | 110 (57.0%) | 86 (44.3%) |
| 3 Vehicles | 41 (21.2%) | 17 (8.8%) |
| 4 Vehicles | 31 (16.1%) | 0 (0.0%) |
| 5 or more Vehicles | 0 (0.0%) | 0 (0.0%) |
| Total | 193 (100.0%) | 194 (100.0%) |
Commute Time in Sand Ridge
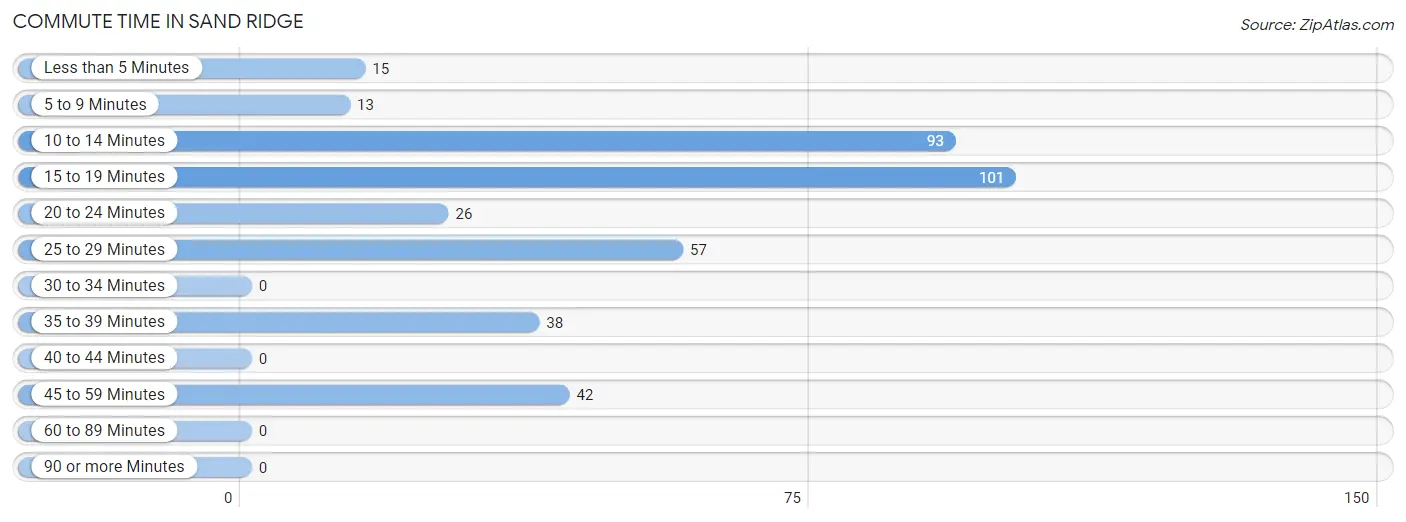
The most frequently occuring commute durations in Sand Ridge are 15 to 19 minutes (101 commuters, 26.2%), 10 to 14 minutes (93 commuters, 24.2%), and 25 to 29 minutes (57 commuters, 14.8%).
| Commute Time | # Commuters | % Commuters |
| Less than 5 Minutes | 15 | 3.9% |
| 5 to 9 Minutes | 13 | 3.4% |
| 10 to 14 Minutes | 93 | 24.2% |
| 15 to 19 Minutes | 101 | 26.2% |
| 20 to 24 Minutes | 26 | 6.8% |
| 25 to 29 Minutes | 57 | 14.8% |
| 30 to 34 Minutes | 0 | 0.0% |
| 35 to 39 Minutes | 38 | 9.9% |
| 40 to 44 Minutes | 0 | 0.0% |
| 45 to 59 Minutes | 42 | 10.9% |
| 60 to 89 Minutes | 0 | 0.0% |
| 90 or more Minutes | 0 | 0.0% |
Commute Time by Sex in Sand Ridge
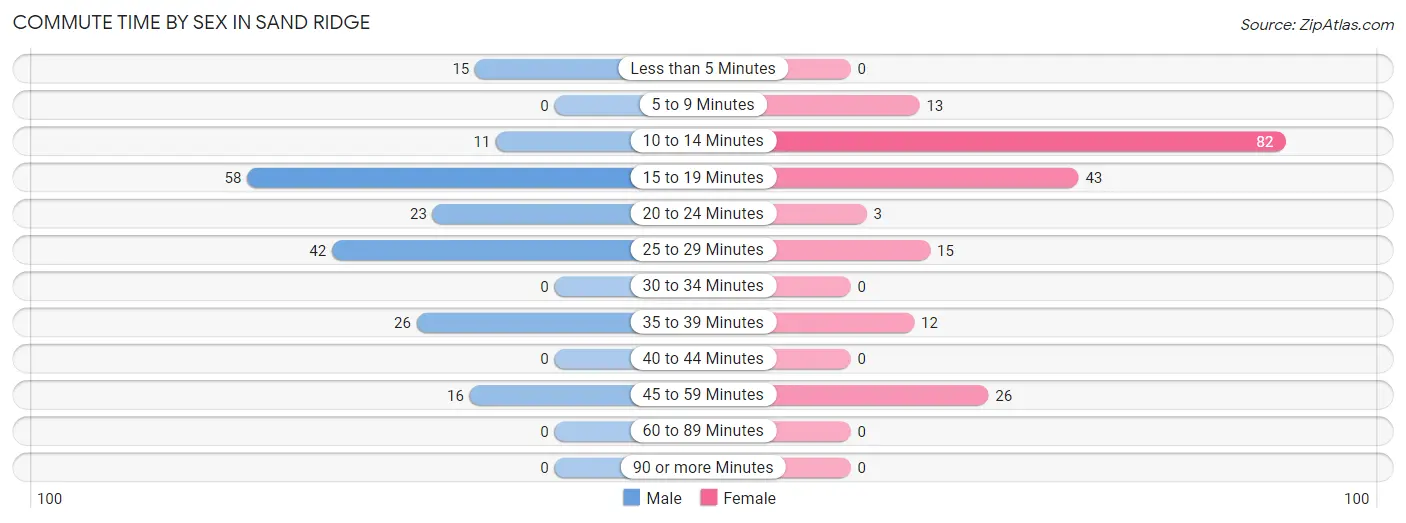
The most common commute times in Sand Ridge are 15 to 19 minutes (58 commuters, 30.4%) for males and 10 to 14 minutes (82 commuters, 42.3%) for females.
| Commute Time | Male | Female |
| Less than 5 Minutes | 15 (7.9%) | 0 (0.0%) |
| 5 to 9 Minutes | 0 (0.0%) | 13 (6.7%) |
| 10 to 14 Minutes | 11 (5.8%) | 82 (42.3%) |
| 15 to 19 Minutes | 58 (30.4%) | 43 (22.2%) |
| 20 to 24 Minutes | 23 (12.0%) | 3 (1.5%) |
| 25 to 29 Minutes | 42 (22.0%) | 15 (7.7%) |
| 30 to 34 Minutes | 0 (0.0%) | 0 (0.0%) |
| 35 to 39 Minutes | 26 (13.6%) | 12 (6.2%) |
| 40 to 44 Minutes | 0 (0.0%) | 0 (0.0%) |
| 45 to 59 Minutes | 16 (8.4%) | 26 (13.4%) |
| 60 to 89 Minutes | 0 (0.0%) | 0 (0.0%) |
| 90 or more Minutes | 0 (0.0%) | 0 (0.0%) |
Time of Departure to Work by Sex in Sand Ridge
The most frequent times of departure to work in Sand Ridge are 7:00 AM to 7:29 AM (76, 39.8%) for males and 12:00 PM to 3:59 PM (51, 26.3%) for females.
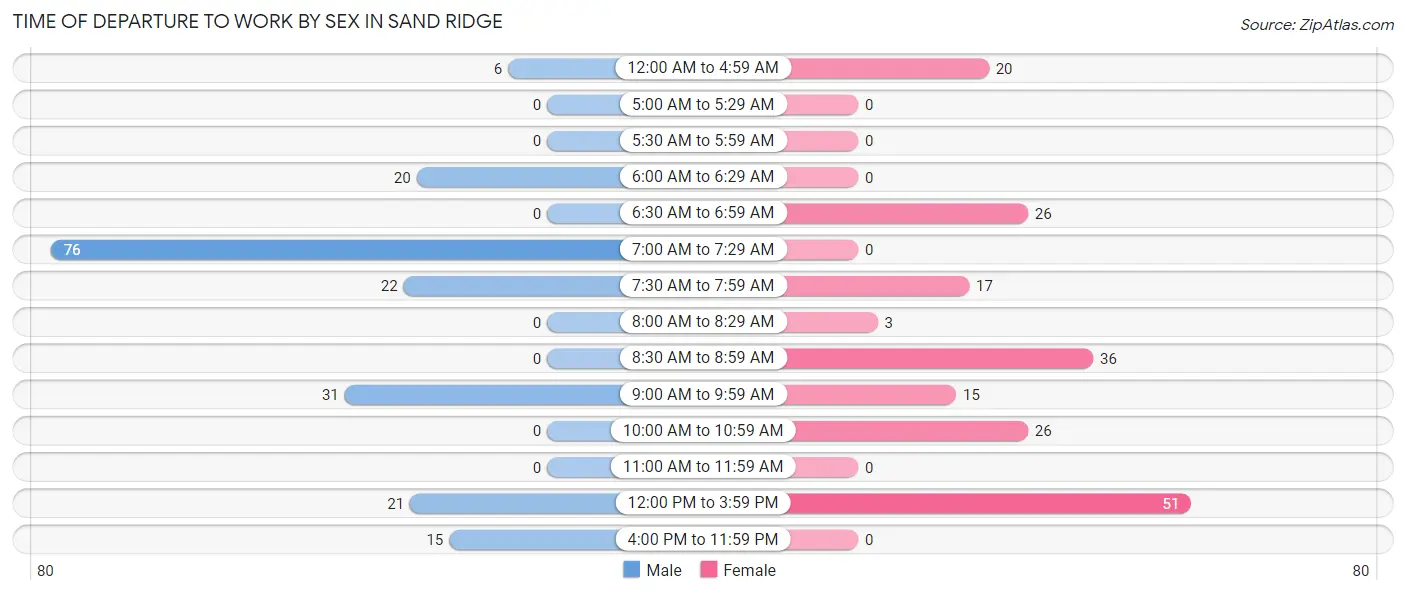
| Time of Departure | Male | Female |
| 12:00 AM to 4:59 AM | 6 (3.1%) | 20 (10.3%) |
| 5:00 AM to 5:29 AM | 0 (0.0%) | 0 (0.0%) |
| 5:30 AM to 5:59 AM | 0 (0.0%) | 0 (0.0%) |
| 6:00 AM to 6:29 AM | 20 (10.5%) | 0 (0.0%) |
| 6:30 AM to 6:59 AM | 0 (0.0%) | 26 (13.4%) |
| 7:00 AM to 7:29 AM | 76 (39.8%) | 0 (0.0%) |
| 7:30 AM to 7:59 AM | 22 (11.5%) | 17 (8.8%) |
| 8:00 AM to 8:29 AM | 0 (0.0%) | 3 (1.5%) |
| 8:30 AM to 8:59 AM | 0 (0.0%) | 36 (18.6%) |
| 9:00 AM to 9:59 AM | 31 (16.2%) | 15 (7.7%) |
| 10:00 AM to 10:59 AM | 0 (0.0%) | 26 (13.4%) |
| 11:00 AM to 11:59 AM | 0 (0.0%) | 0 (0.0%) |
| 12:00 PM to 3:59 PM | 21 (11.0%) | 51 (26.3%) |
| 4:00 PM to 11:59 PM | 15 (7.9%) | 0 (0.0%) |
| Total | 191 (100.0%) | 194 (100.0%) |
Housing Occupancy in Sand Ridge
Occupancy by Ownership in Sand Ridge
Of the total 476 dwellings in Sand Ridge, owner-occupied units account for 427 (89.7%), while renter-occupied units make up 49 (10.3%).
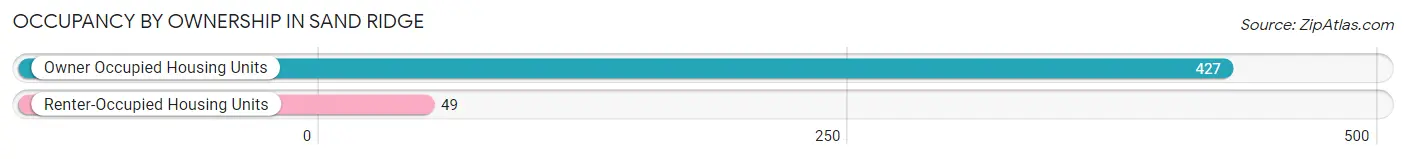
| Occupancy | # Housing Units | % Housing Units |
| Owner Occupied Housing Units | 427 | 89.7% |
| Renter-Occupied Housing Units | 49 | 10.3% |
| Total Occupied Housing Units | 476 | 100.0% |
Occupancy by Household Size in Sand Ridge
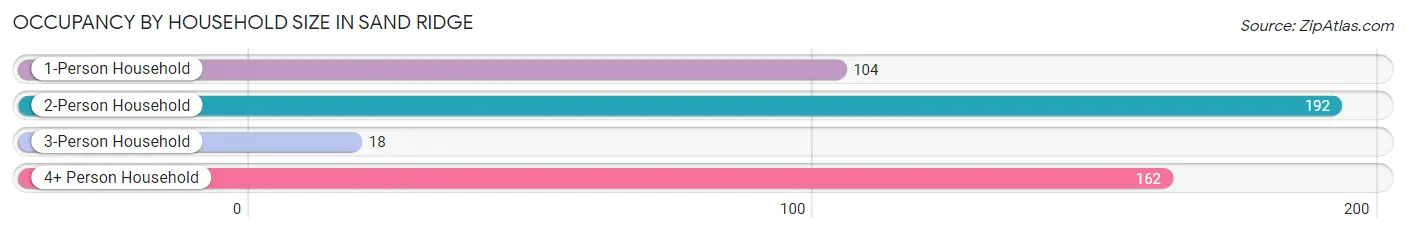
| Household Size | # Housing Units | % Housing Units |
| 1-Person Household | 104 | 21.8% |
| 2-Person Household | 192 | 40.3% |
| 3-Person Household | 18 | 3.8% |
| 4+ Person Household | 162 | 34.0% |
| Total Housing Units | 476 | 100.0% |
Occupancy by Ownership by Household Size in Sand Ridge
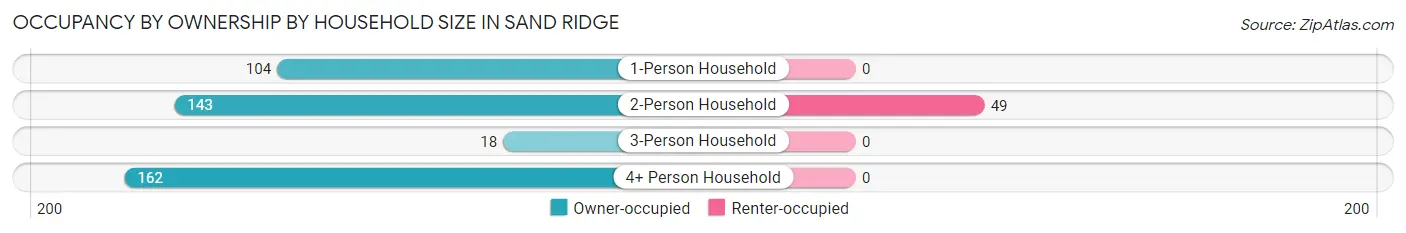
| Household Size | Owner-occupied | Renter-occupied |
| 1-Person Household | 104 (100.0%) | 0 (0.0%) |
| 2-Person Household | 143 (74.5%) | 49 (25.5%) |
| 3-Person Household | 18 (100.0%) | 0 (0.0%) |
| 4+ Person Household | 162 (100.0%) | 0 (0.0%) |
| Total Housing Units | 427 (89.7%) | 49 (10.3%) |
Occupancy by Educational Attainment in Sand Ridge
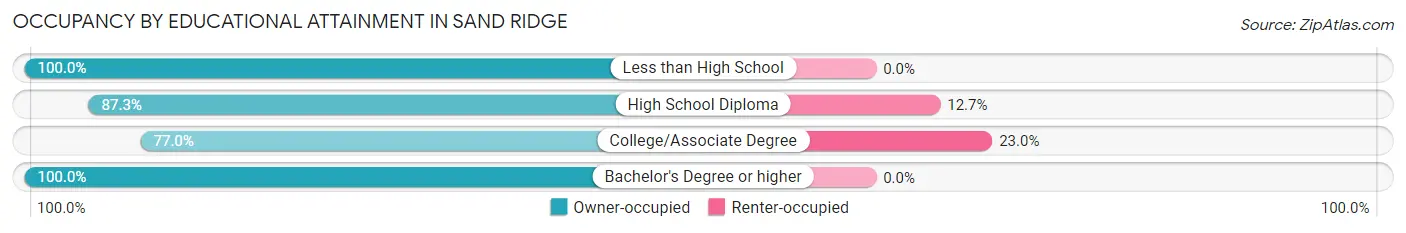
| Household Size | Owner-occupied | Renter-occupied |
| Less than High School | 30 (100.0%) | 0 (0.0%) |
| High School Diploma | 158 (87.3%) | 23 (12.7%) |
| College/Associate Degree | 87 (77.0%) | 26 (23.0%) |
| Bachelor's Degree or higher | 152 (100.0%) | 0 (0.0%) |
Occupancy by Age of Householder in Sand Ridge
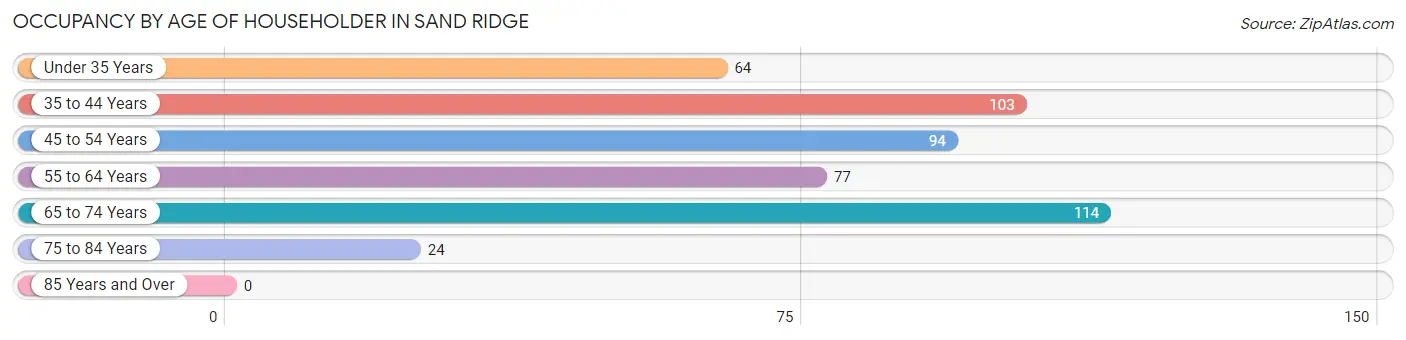
| Age Bracket | # Households | % Households |
| Under 35 Years | 64 | 13.5% |
| 35 to 44 Years | 103 | 21.6% |
| 45 to 54 Years | 94 | 19.8% |
| 55 to 64 Years | 77 | 16.2% |
| 65 to 74 Years | 114 | 23.9% |
| 75 to 84 Years | 24 | 5.0% |
| 85 Years and Over | 0 | 0.0% |
| Total | 476 | 100.0% |
Housing Finances in Sand Ridge
Median Income by Occupancy in Sand Ridge
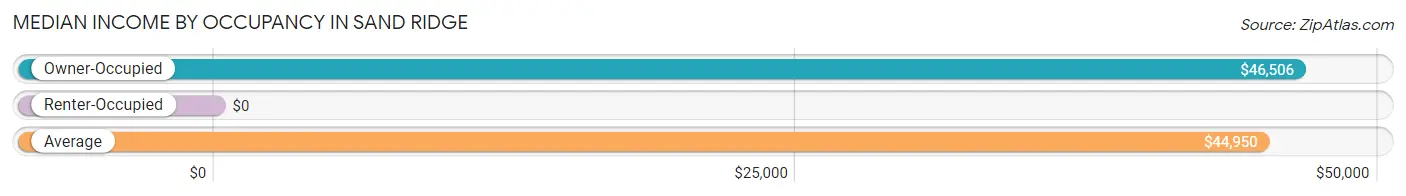
| Occupancy Type | # Households | Median Income |
| Owner-Occupied | 427 (89.7%) | $46,506 |
| Renter-Occupied | 49 (10.3%) | $0 |
| Average | 476 (100.0%) | $44,950 |
Occupancy by Householder Income Bracket in Sand Ridge
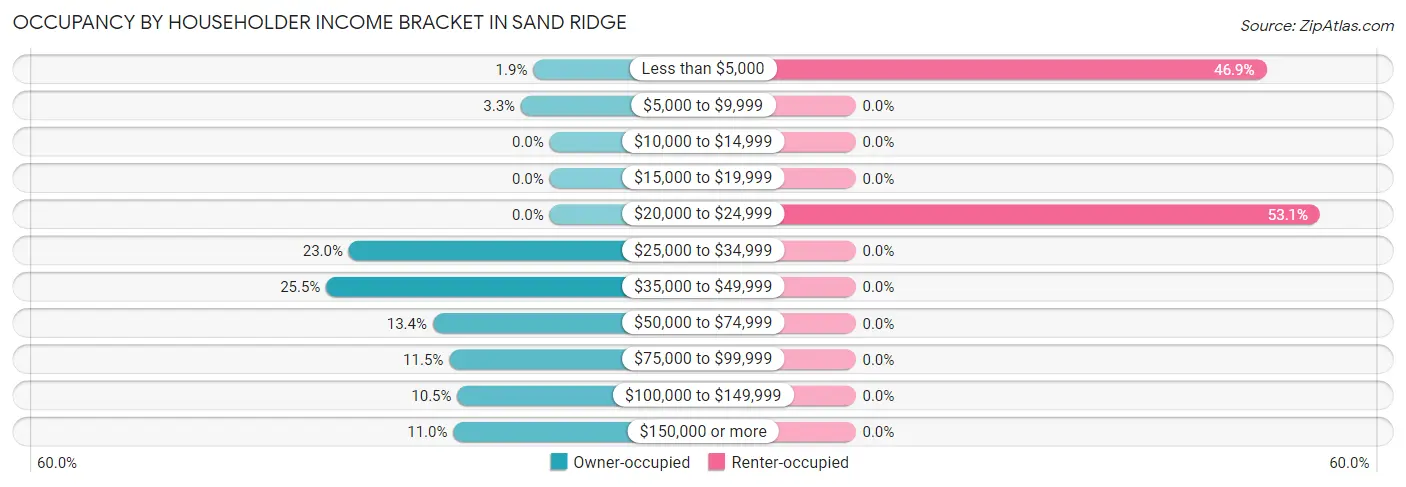
| Income Bracket | Owner-occupied | Renter-occupied |
| Less than $5,000 | 8 (1.9%) | 23 (46.9%) |
| $5,000 to $9,999 | 14 (3.3%) | 0 (0.0%) |
| $10,000 to $14,999 | 0 (0.0%) | 0 (0.0%) |
| $15,000 to $19,999 | 0 (0.0%) | 0 (0.0%) |
| $20,000 to $24,999 | 0 (0.0%) | 26 (53.1%) |
| $25,000 to $34,999 | 98 (23.0%) | 0 (0.0%) |
| $35,000 to $49,999 | 109 (25.5%) | 0 (0.0%) |
| $50,000 to $74,999 | 57 (13.4%) | 0 (0.0%) |
| $75,000 to $99,999 | 49 (11.5%) | 0 (0.0%) |
| $100,000 to $149,999 | 45 (10.5%) | 0 (0.0%) |
| $150,000 or more | 47 (11.0%) | 0 (0.0%) |
| Total | 427 (100.0%) | 49 (100.0%) |
Monthly Housing Cost Tiers in Sand Ridge
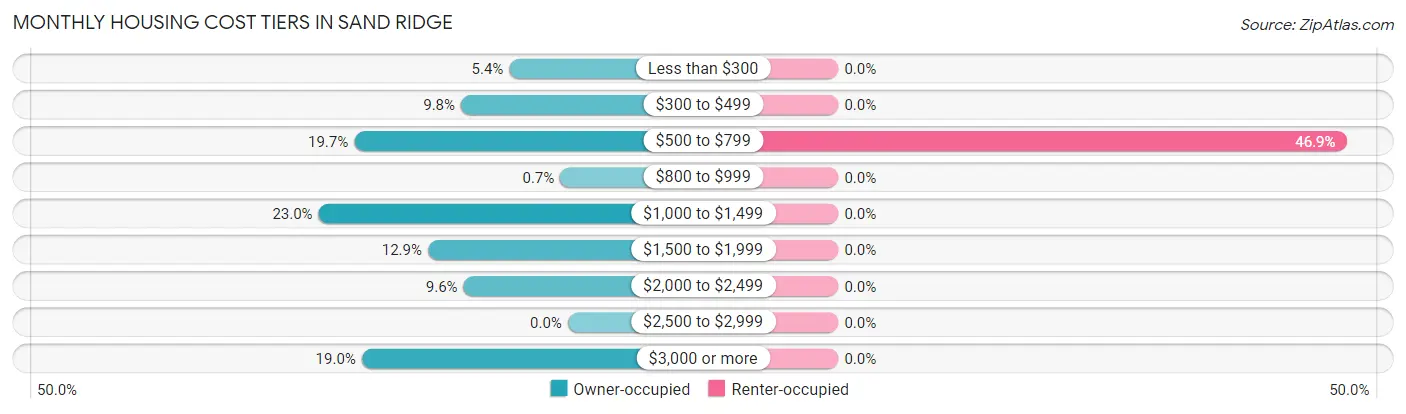
| Monthly Cost | Owner-occupied | Renter-occupied |
| Less than $300 | 23 (5.4%) | 0 (0.0%) |
| $300 to $499 | 42 (9.8%) | 0 (0.0%) |
| $500 to $799 | 84 (19.7%) | 23 (46.9%) |
| $800 to $999 | 3 (0.7%) | 0 (0.0%) |
| $1,000 to $1,499 | 98 (23.0%) | 0 (0.0%) |
| $1,500 to $1,999 | 55 (12.9%) | 0 (0.0%) |
| $2,000 to $2,499 | 41 (9.6%) | 0 (0.0%) |
| $2,500 to $2,999 | 0 (0.0%) | 0 (0.0%) |
| $3,000 or more | 81 (19.0%) | 0 (0.0%) |
| Total | 427 (100.0%) | 49 (100.0%) |
Physical Housing Characteristics in Sand Ridge
Housing Structures in Sand Ridge
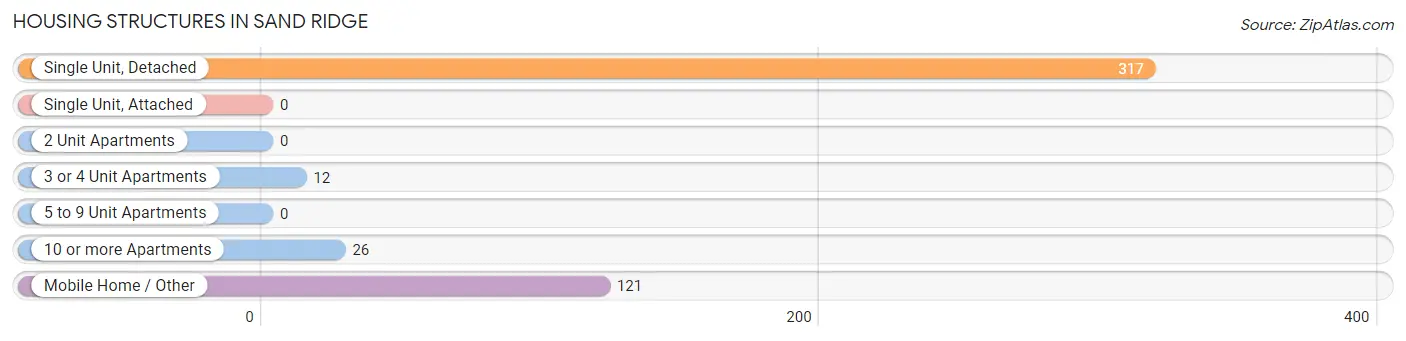
| Structure Type | # Housing Units | % Housing Units |
| Single Unit, Detached | 317 | 66.6% |
| Single Unit, Attached | 0 | 0.0% |
| 2 Unit Apartments | 0 | 0.0% |
| 3 or 4 Unit Apartments | 12 | 2.5% |
| 5 to 9 Unit Apartments | 0 | 0.0% |
| 10 or more Apartments | 26 | 5.5% |
| Mobile Home / Other | 121 | 25.4% |
| Total | 476 | 100.0% |
Housing Structures by Occupancy in Sand Ridge
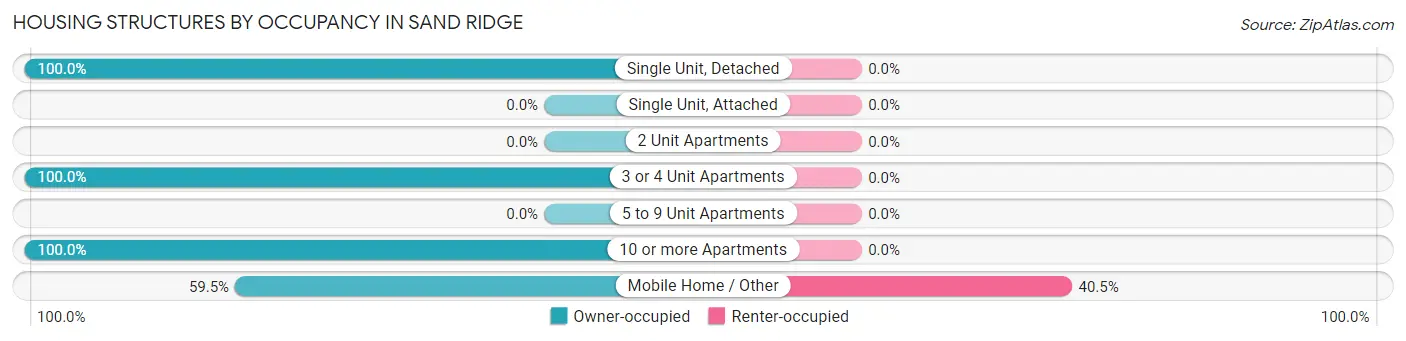
| Structure Type | Owner-occupied | Renter-occupied |
| Single Unit, Detached | 317 (100.0%) | 0 (0.0%) |
| Single Unit, Attached | 0 (0.0%) | 0 (0.0%) |
| 2 Unit Apartments | 0 (0.0%) | 0 (0.0%) |
| 3 or 4 Unit Apartments | 12 (100.0%) | 0 (0.0%) |
| 5 to 9 Unit Apartments | 0 (0.0%) | 0 (0.0%) |
| 10 or more Apartments | 26 (100.0%) | 0 (0.0%) |
| Mobile Home / Other | 72 (59.5%) | 49 (40.5%) |
| Total | 427 (89.7%) | 49 (10.3%) |
Housing Structures by Number of Rooms in Sand Ridge
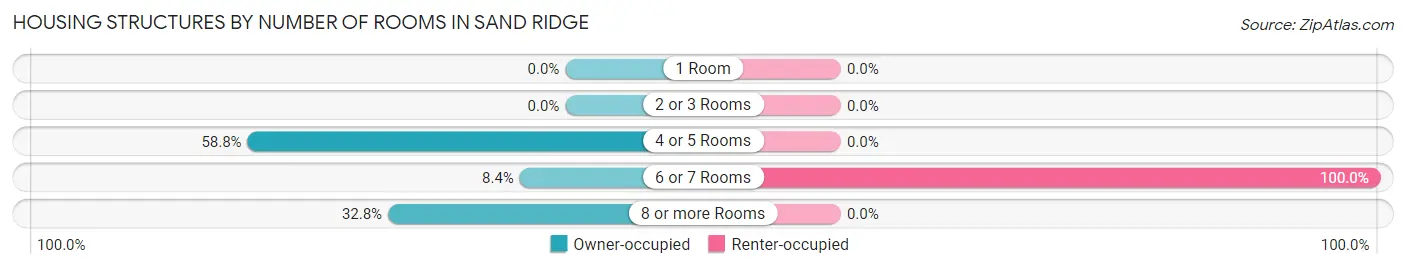
| Number of Rooms | Owner-occupied | Renter-occupied |
| 1 Room | 0 (0.0%) | 0 (0.0%) |
| 2 or 3 Rooms | 0 (0.0%) | 0 (0.0%) |
| 4 or 5 Rooms | 251 (58.8%) | 0 (0.0%) |
| 6 or 7 Rooms | 36 (8.4%) | 49 (100.0%) |
| 8 or more Rooms | 140 (32.8%) | 0 (0.0%) |
| Total | 427 (100.0%) | 49 (100.0%) |
Housing Structure by Heating Type in Sand Ridge
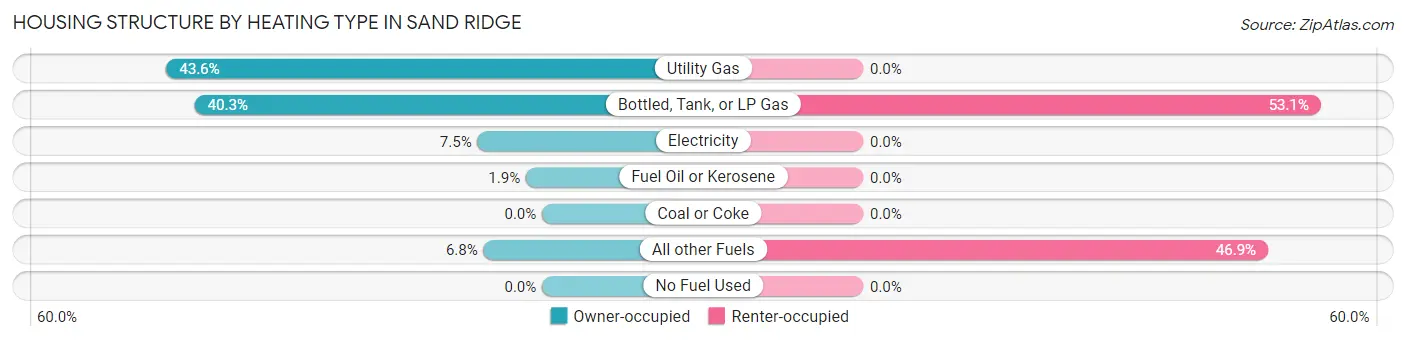
| Heating Type | Owner-occupied | Renter-occupied |
| Utility Gas | 186 (43.6%) | 0 (0.0%) |
| Bottled, Tank, or LP Gas | 172 (40.3%) | 26 (53.1%) |
| Electricity | 32 (7.5%) | 0 (0.0%) |
| Fuel Oil or Kerosene | 8 (1.9%) | 0 (0.0%) |
| Coal or Coke | 0 (0.0%) | 0 (0.0%) |
| All other Fuels | 29 (6.8%) | 23 (46.9%) |
| No Fuel Used | 0 (0.0%) | 0 (0.0%) |
| Total | 427 (100.0%) | 49 (100.0%) |
Household Vehicle Usage in Sand Ridge

| Vehicles per Household | Owner-occupied | Renter-occupied |
| No Vehicle | 14 (3.3%) | 0 (0.0%) |
| 1 Vehicle | 128 (30.0%) | 49 (100.0%) |
| 2 Vehicles | 199 (46.6%) | 0 (0.0%) |
| 3 or more Vehicles | 86 (20.1%) | 0 (0.0%) |
| Total | 427 (100.0%) | 49 (100.0%) |
Real Estate & Mortgages in Sand Ridge
Real Estate and Mortgage Overview in Sand Ridge
| Characteristic | Without Mortgage | With Mortgage |
| Housing Units | 173 | 254 |
| Median Property Value | - | - |
| Median Household Income | $45,545 | $47 |
| Monthly Housing Costs | $617 | $81 |
| Real Estate Taxes | $5,792 | $26 |
Property Value by Mortgage Status in Sand Ridge
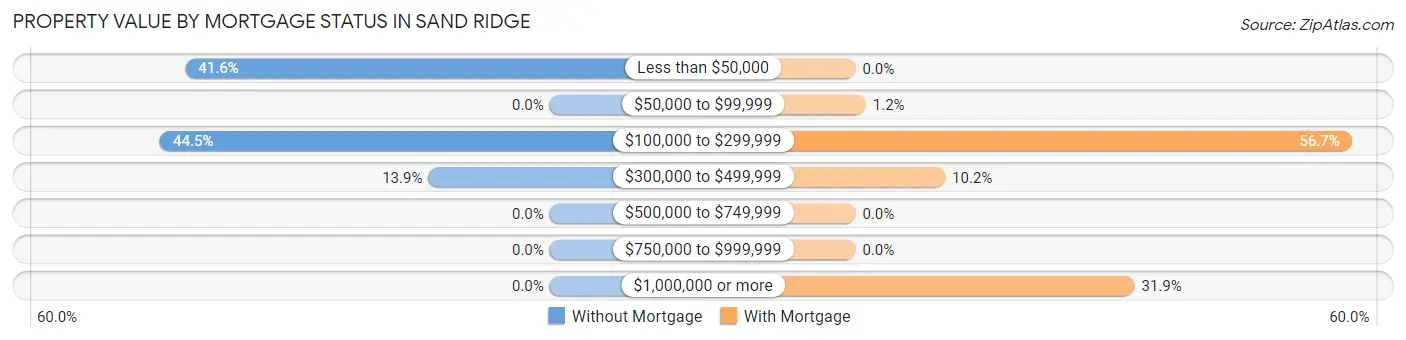
| Property Value | Without Mortgage | With Mortgage |
| Less than $50,000 | 72 (41.6%) | 0 (0.0%) |
| $50,000 to $99,999 | 0 (0.0%) | 3 (1.2%) |
| $100,000 to $299,999 | 77 (44.5%) | 144 (56.7%) |
| $300,000 to $499,999 | 24 (13.9%) | 26 (10.2%) |
| $500,000 to $749,999 | 0 (0.0%) | 0 (0.0%) |
| $750,000 to $999,999 | 0 (0.0%) | 0 (0.0%) |
| $1,000,000 or more | 0 (0.0%) | 81 (31.9%) |
| Total | 173 (100.0%) | 254 (100.0%) |
Household Income by Mortgage Status in Sand Ridge
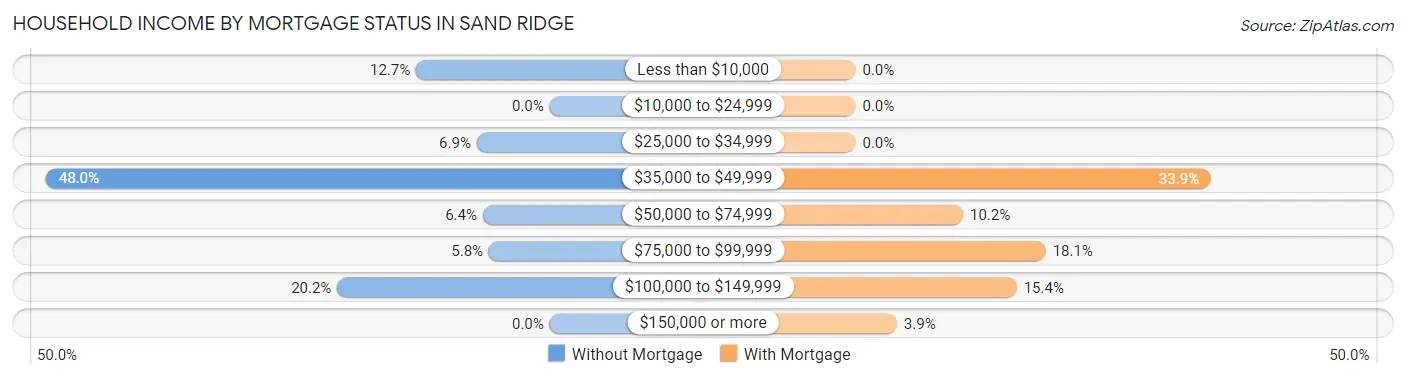
| Household Income | Without Mortgage | With Mortgage |
| Less than $10,000 | 22 (12.7%) | 0 (0.0%) |
| $10,000 to $24,999 | 0 (0.0%) | 0 (0.0%) |
| $25,000 to $34,999 | 12 (6.9%) | 0 (0.0%) |
| $35,000 to $49,999 | 83 (48.0%) | 86 (33.9%) |
| $50,000 to $74,999 | 11 (6.4%) | 26 (10.2%) |
| $75,000 to $99,999 | 10 (5.8%) | 46 (18.1%) |
| $100,000 to $149,999 | 35 (20.2%) | 39 (15.3%) |
| $150,000 or more | 0 (0.0%) | 10 (3.9%) |
| Total | 173 (100.0%) | 254 (100.0%) |
Property Value to Household Income Ratio in Sand Ridge
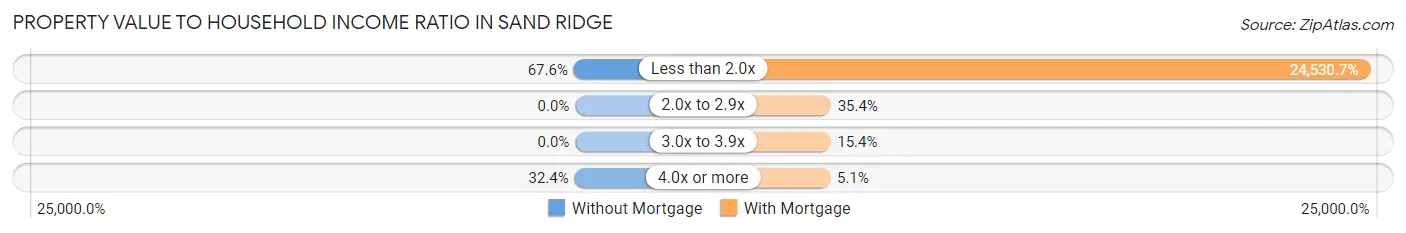
| Value-to-Income Ratio | Without Mortgage | With Mortgage |
| Less than 2.0x | 117 (67.6%) | 62,308 (24,530.7%) |
| 2.0x to 2.9x | 0 (0.0%) | 90 (35.4%) |
| 3.0x to 3.9x | 0 (0.0%) | 39 (15.3%) |
| 4.0x or more | 56 (32.4%) | 13 (5.1%) |
| Total | 173 (100.0%) | 254 (100.0%) |
Real Estate Taxes by Mortgage Status in Sand Ridge
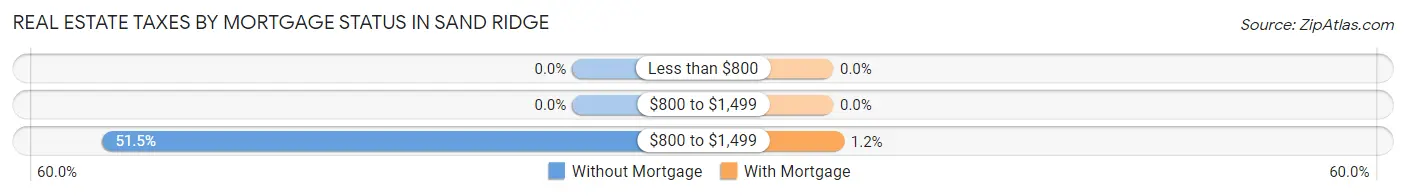
| Property Taxes | Without Mortgage | With Mortgage |
| Less than $800 | 0 (0.0%) | 0 (0.0%) |
| $800 to $1,499 | 0 (0.0%) | 0 (0.0%) |
| $800 to $1,499 | 89 (51.4%) | 3 (1.2%) |
| Total | 173 (100.0%) | 254 (100.0%) |
Health & Disability in Sand Ridge
Health Insurance Coverage by Age in Sand Ridge
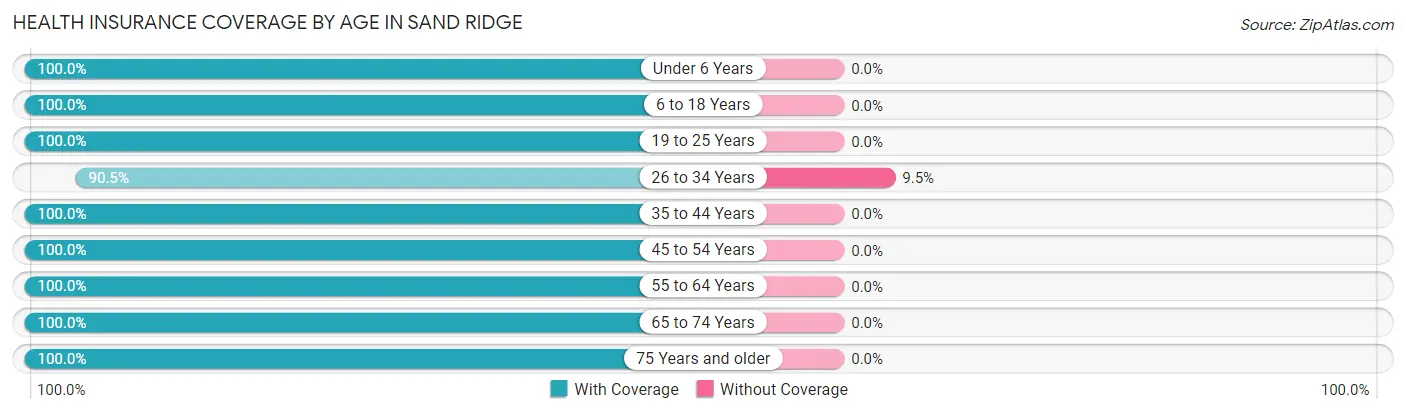
| Age Bracket | With Coverage | Without Coverage |
| Under 6 Years | 87 (100.0%) | 0 (0.0%) |
| 6 to 18 Years | 197 (100.0%) | 0 (0.0%) |
| 19 to 25 Years | 128 (100.0%) | 0 (0.0%) |
| 26 to 34 Years | 19 (90.5%) | 2 (9.5%) |
| 35 to 44 Years | 146 (100.0%) | 0 (0.0%) |
| 45 to 54 Years | 159 (100.0%) | 0 (0.0%) |
| 55 to 64 Years | 137 (100.0%) | 0 (0.0%) |
| 65 to 74 Years | 143 (100.0%) | 0 (0.0%) |
| 75 Years and older | 93 (100.0%) | 0 (0.0%) |
| Total | 1,109 (99.8%) | 2 (0.2%) |
Health Insurance Coverage by Citizenship Status in Sand Ridge
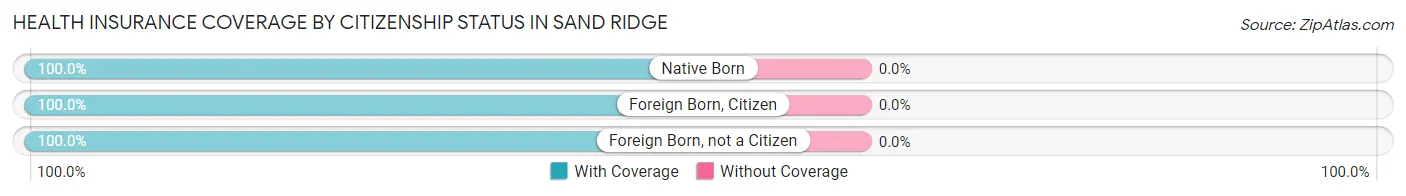
| Citizenship Status | With Coverage | Without Coverage |
| Native Born | 87 (100.0%) | 0 (0.0%) |
| Foreign Born, Citizen | 197 (100.0%) | 0 (0.0%) |
| Foreign Born, not a Citizen | 128 (100.0%) | 0 (0.0%) |
Health Insurance Coverage by Household Income in Sand Ridge
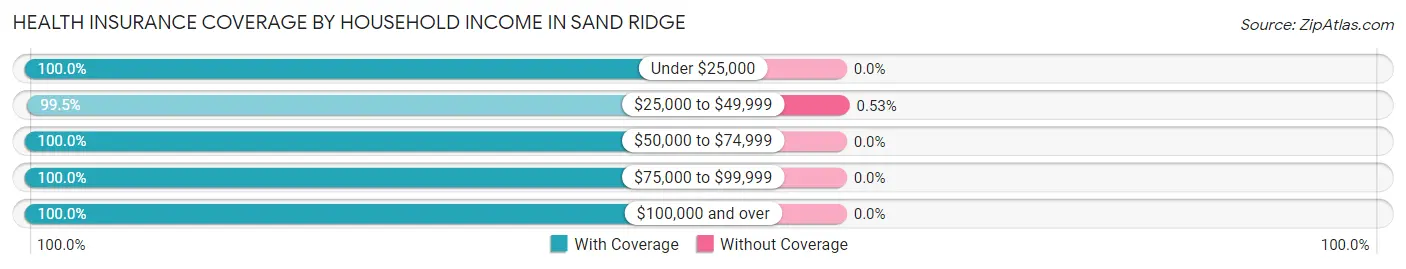
| Household Income | With Coverage | Without Coverage |
| Under $25,000 | 133 (100.0%) | 0 (0.0%) |
| $25,000 to $49,999 | 374 (99.5%) | 2 (0.5%) |
| $50,000 to $74,999 | 133 (100.0%) | 0 (0.0%) |
| $75,000 to $99,999 | 116 (100.0%) | 0 (0.0%) |
| $100,000 and over | 353 (100.0%) | 0 (0.0%) |
Public vs Private Health Insurance Coverage by Age in Sand Ridge
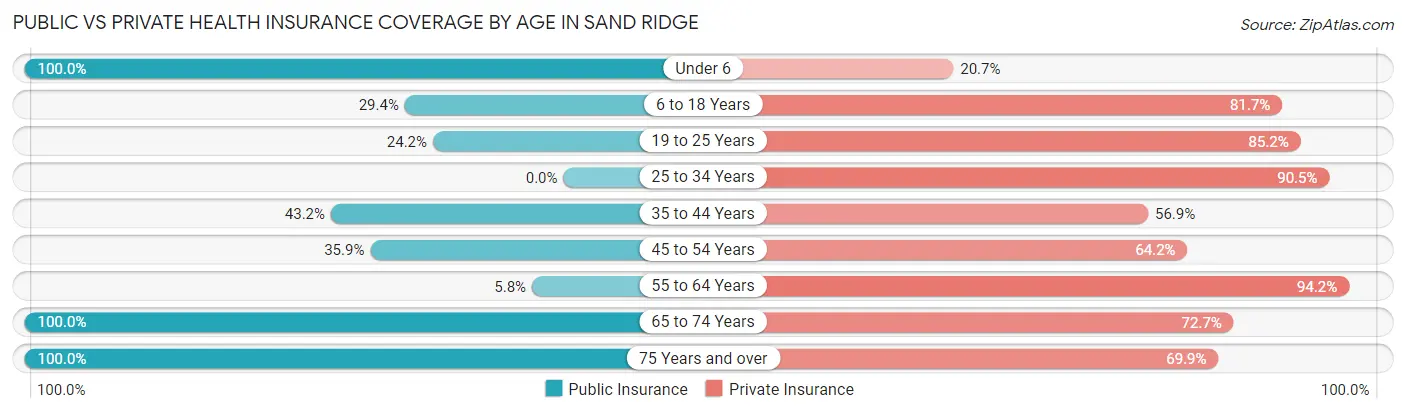
| Age Bracket | Public Insurance | Private Insurance |
| Under 6 | 87 (100.0%) | 18 (20.7%) |
| 6 to 18 Years | 58 (29.4%) | 161 (81.7%) |
| 19 to 25 Years | 31 (24.2%) | 109 (85.2%) |
| 25 to 34 Years | 0 (0.0%) | 19 (90.5%) |
| 35 to 44 Years | 63 (43.1%) | 83 (56.9%) |
| 45 to 54 Years | 57 (35.8%) | 102 (64.1%) |
| 55 to 64 Years | 8 (5.8%) | 129 (94.2%) |
| 65 to 74 Years | 143 (100.0%) | 104 (72.7%) |
| 75 Years and over | 93 (100.0%) | 65 (69.9%) |
| Total | 540 (48.6%) | 790 (71.1%) |
Disability Status by Sex by Age in Sand Ridge
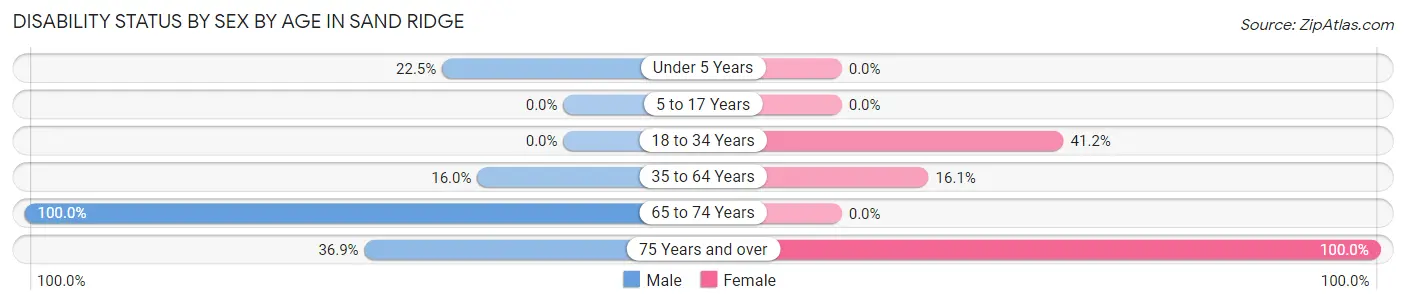
| Age Bracket | Male | Female |
| Under 5 Years | 9 (22.5%) | 0 (0.0%) |
| 5 to 17 Years | 0 (0.0%) | 0 (0.0%) |
| 18 to 34 Years | 0 (0.0%) | 35 (41.2%) |
| 35 to 64 Years | 27 (16.0%) | 44 (16.1%) |
| 65 to 74 Years | 50 (100.0%) | 0 (0.0%) |
| 75 Years and over | 24 (36.9%) | 28 (100.0%) |
Disability Class by Sex by Age in Sand Ridge
Disability Class: Hearing Difficulty
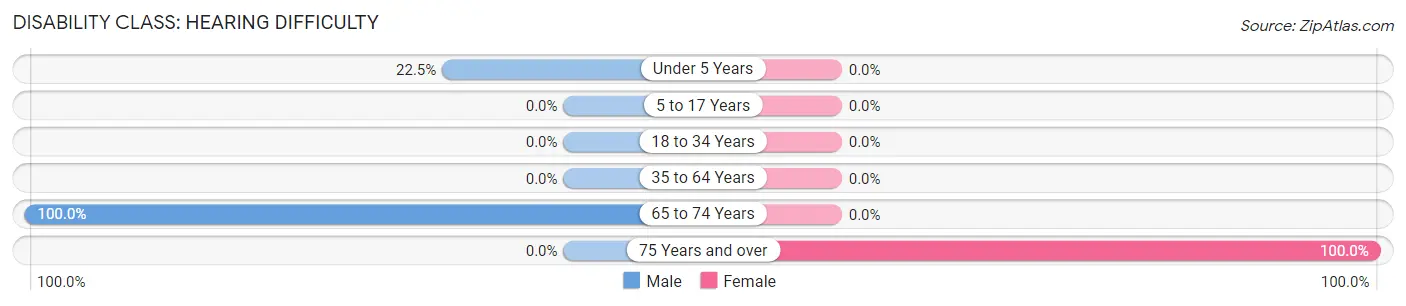
| Age Bracket | Male | Female |
| Under 5 Years | 9 (22.5%) | 0 (0.0%) |
| 5 to 17 Years | 0 (0.0%) | 0 (0.0%) |
| 18 to 34 Years | 0 (0.0%) | 0 (0.0%) |
| 35 to 64 Years | 0 (0.0%) | 0 (0.0%) |
| 65 to 74 Years | 50 (100.0%) | 0 (0.0%) |
| 75 Years and over | 0 (0.0%) | 28 (100.0%) |
Disability Class: Vision Difficulty
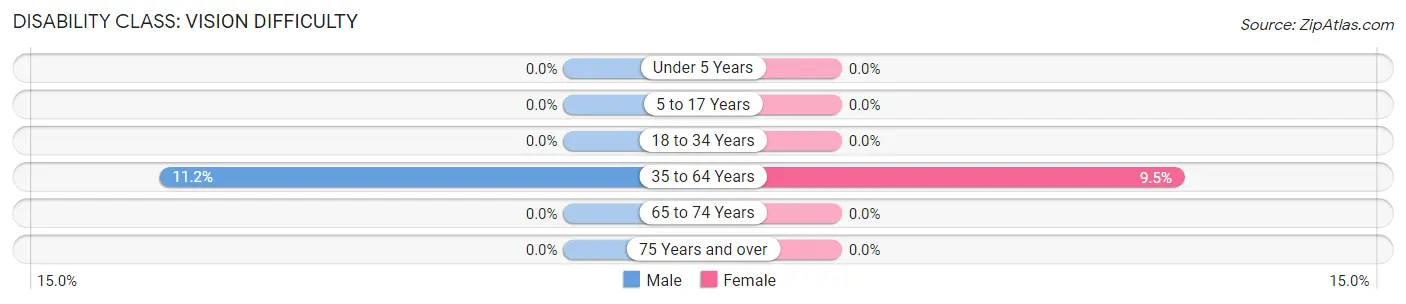
| Age Bracket | Male | Female |
| Under 5 Years | 0 (0.0%) | 0 (0.0%) |
| 5 to 17 Years | 0 (0.0%) | 0 (0.0%) |
| 18 to 34 Years | 0 (0.0%) | 0 (0.0%) |
| 35 to 64 Years | 19 (11.2%) | 26 (9.5%) |
| 65 to 74 Years | 0 (0.0%) | 0 (0.0%) |
| 75 Years and over | 0 (0.0%) | 0 (0.0%) |
Disability Class: Cognitive Difficulty
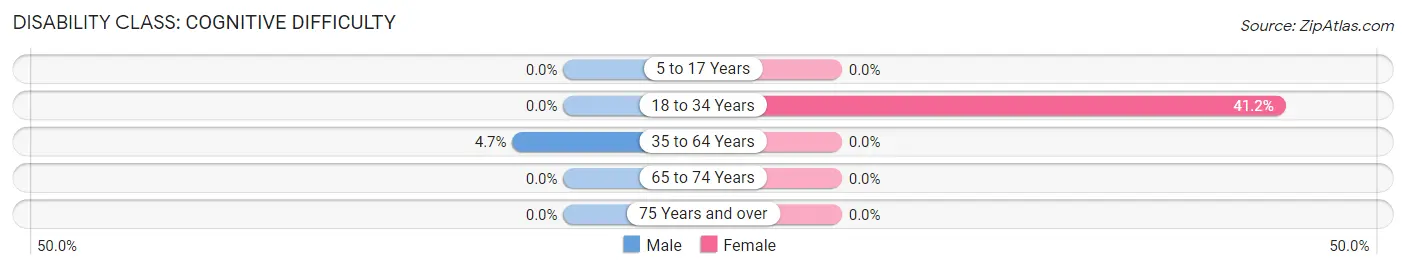
| Age Bracket | Male | Female |
| 5 to 17 Years | 0 (0.0%) | 0 (0.0%) |
| 18 to 34 Years | 0 (0.0%) | 35 (41.2%) |
| 35 to 64 Years | 8 (4.7%) | 0 (0.0%) |
| 65 to 74 Years | 0 (0.0%) | 0 (0.0%) |
| 75 Years and over | 0 (0.0%) | 0 (0.0%) |
Disability Class: Ambulatory Difficulty
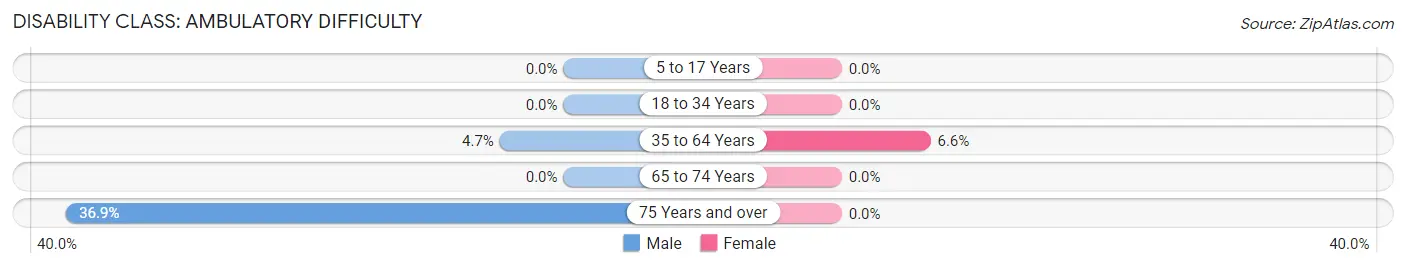
| Age Bracket | Male | Female |
| 5 to 17 Years | 0 (0.0%) | 0 (0.0%) |
| 18 to 34 Years | 0 (0.0%) | 0 (0.0%) |
| 35 to 64 Years | 8 (4.7%) | 18 (6.6%) |
| 65 to 74 Years | 0 (0.0%) | 0 (0.0%) |
| 75 Years and over | 24 (36.9%) | 0 (0.0%) |
Disability Class: Self-Care Difficulty
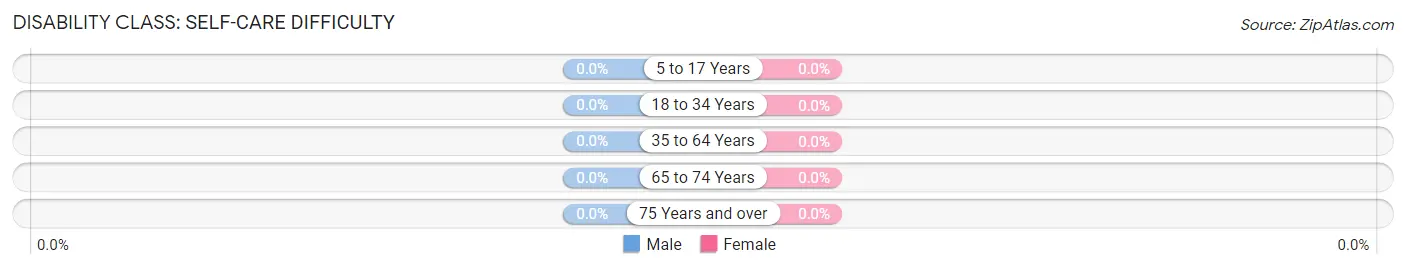
| Age Bracket | Male | Female |
| 5 to 17 Years | 0 (0.0%) | 0 (0.0%) |
| 18 to 34 Years | 0 (0.0%) | 0 (0.0%) |
| 35 to 64 Years | 0 (0.0%) | 0 (0.0%) |
| 65 to 74 Years | 0 (0.0%) | 0 (0.0%) |
| 75 Years and over | 0 (0.0%) | 0 (0.0%) |
Technology Access in Sand Ridge
Computing Device Access in Sand Ridge
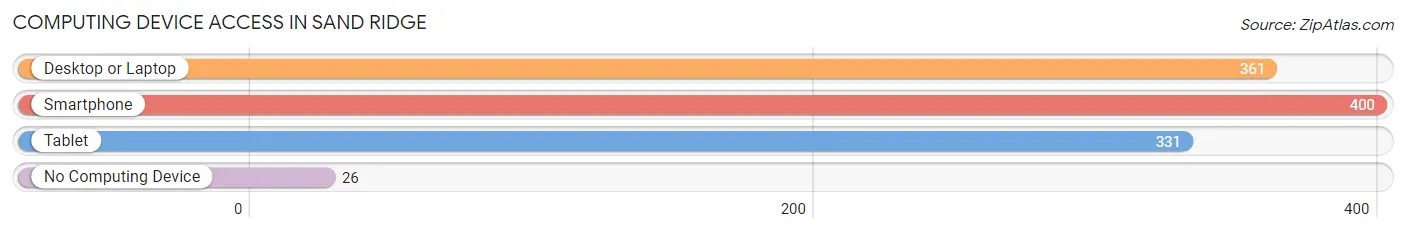
| Device Type | # Households | % Households |
| Desktop or Laptop | 361 | 75.8% |
| Smartphone | 400 | 84.0% |
| Tablet | 331 | 69.5% |
| No Computing Device | 26 | 5.5% |
| Total | 476 | 100.0% |
Internet Access in Sand Ridge
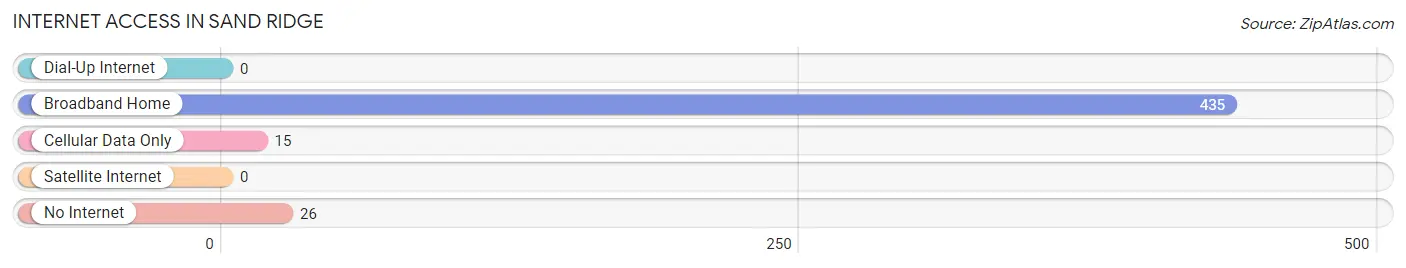
| Internet Type | # Households | % Households |
| Dial-Up Internet | 0 | 0.0% |
| Broadband Home | 435 | 91.4% |
| Cellular Data Only | 15 | 3.2% |
| Satellite Internet | 0 | 0.0% |
| No Internet | 26 | 5.5% |
| Total | 476 | 100.0% |
Sand Ridge Summary
Sand Ridge is a small town located in the state of New York. It is situated in the northern part of the state, near the border with Canada. The town has a population of approximately 1,000 people and is part of the larger town of St. Lawrence County.
History
Sand Ridge was first settled in the late 1700s by a group of settlers from Connecticut. The settlers were attracted to the area due to its abundance of natural resources, including timber and fertile soil. The town was originally known as “Sand Ridge” due to the large amount of sand that was found in the area. The town was officially incorporated in 1810.
In the early 1900s, the town experienced a period of growth and development. The population increased from around 500 people in 1900 to over 1,000 people by the mid-1900s. During this time, the town was home to several businesses, including a sawmill, a gristmill, and a general store.
Geography
Sand Ridge is located in the northern part of New York, near the border with Canada. The town is situated in the St. Lawrence River Valley, which is known for its rolling hills and lush forests. The town is surrounded by several small lakes, including Lake Ontario, Lake Erie, and Lake Champlain.
The town is located approximately 30 miles from the city of Syracuse and is accessible by car or bus. The nearest major airport is located in Syracuse.
Economy
The economy of Sand Ridge is largely based on agriculture and tourism. The town is home to several farms, which produce a variety of crops, including corn, soybeans, and hay. The town is also home to several wineries, which produce a variety of wines.
The town is also home to several small businesses, including restaurants, shops, and a few bed and breakfasts. The town is also home to a small airport, which serves as a hub for private and commercial flights.
Demographics
As of the 2010 census, the population of Sand Ridge was 1,000 people. The town is predominantly white, with approximately 95% of the population identifying as Caucasian. The town is also home to a small Hispanic population, with approximately 5% of the population identifying as Hispanic or Latino.
The median household income in Sand Ridge is approximately $50,000, which is slightly lower than the national average. The town has a poverty rate of approximately 10%, which is slightly higher than the national average.
Conclusion
Sand Ridge is a small town located in the northern part of New York. The town has a population of approximately 1,000 people and is part of the larger town of St. Lawrence County. The town is largely based on agriculture and tourism, with several farms and wineries located in the area. The town is predominantly white, with a small Hispanic population. The median household income in Sand Ridge is approximately $50,000, which is slightly lower than the national average.
Common Questions
What is Per Capita Income in Sand Ridge?
Per Capita income in Sand Ridge is $25,418.
What is the Median Household income in Sand Ridge?
Median Household Income in Sand Ridge is $44,950.
What is Inequality or Gini Index in Sand Ridge?
Inequality or Gini Index in Sand Ridge is 0.41.
What is the Total Population of Sand Ridge?
Total Population of Sand Ridge is 1,111.
What is the Total Male Population of Sand Ridge?
Total Male Population of Sand Ridge is 455.
What is the Total Female Population of Sand Ridge?
Total Female Population of Sand Ridge is 656.
What is the Ratio of Males per 100 Females in Sand Ridge?
There are 69.36 Males per 100 Females in Sand Ridge.
What is the Ratio of Females per 100 Males in Sand Ridge?
There are 144.18 Females per 100 Males in Sand Ridge.
What is the Median Population Age in Sand Ridge?
Median Population Age in Sand Ridge is 44.6 Years.
What is the Average Family Size in Sand Ridge
Average Family Size in Sand Ridge is 2.7 People.
What is the Average Household Size in Sand Ridge
Average Household Size in Sand Ridge is 2.3 People.
How Large is the Labor Force in Sand Ridge?
There are 457 People in the Labor Forcein in Sand Ridge.
What is the Percentage of People in the Labor Force in Sand Ridge?
50.7% of People are in the Labor Force in Sand Ridge.
What is the Unemployment Rate in Sand Ridge?
Unemployment Rate in Sand Ridge is 15.3%.