Oneida Castle, NY Map & Demographics
Oneida Castle Map
Oneida Castle Overview
$36,586
PER CAPITA INCOME
$74,583
AVG FAMILY INCOME
$71,042
AVG HOUSEHOLD INCOME
37.7%
WAGE / INCOME GAP [ % ]
62.3¢/ $1
WAGE / INCOME GAP [ $ ]
0.34
INEQUALITY / GINI INDEX
699
TOTAL POPULATION
341
MALE POPULATION
358
FEMALE POPULATION
95.25
MALES / 100 FEMALES
104.99
FEMALES / 100 MALES
50.5
MEDIAN AGE
2.9
AVG FAMILY SIZE
2.3
AVG HOUSEHOLD SIZE
379
LABOR FORCE [ PEOPLE ]
67.1%
PERCENT IN LABOR FORCE
2.9%
UNEMPLOYMENT RATE
Income in Oneida Castle
Income Overview in Oneida Castle
Per Capita Income in Oneida Castle is $36,586, while median incomes of families and households are $74,583 and $71,042 respectively.
| Characteristic | Number | Measure |
| Per Capita Income | 699 | $36,586 |
| Median Family Income | 157 | $74,583 |
| Mean Family Income | 157 | $79,152 |
| Median Household Income | 307 | $71,042 |
| Mean Household Income | 307 | $81,517 |
| Income Deficit | 157 | $0 |
| Wage / Income Gap (%) | 699 | 37.74% |
| Wage / Income Gap ($) | 699 | 62.26¢ per $1 |
| Gini / Inequality Index | 699 | 0.34 |
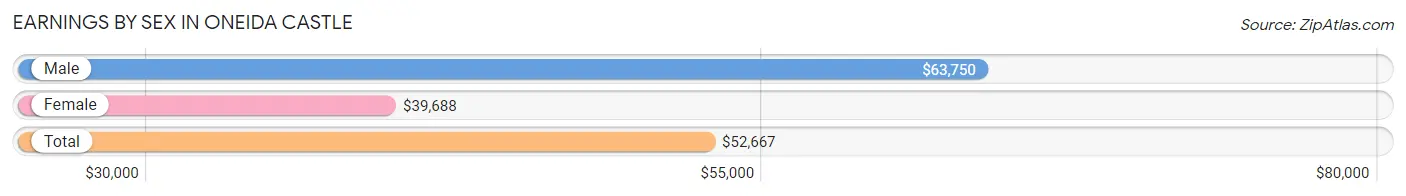
Earnings by Sex in Oneida Castle
Average Earnings in Oneida Castle are $52,667, $63,750 for men and $39,688 for women, a difference of 37.7%.
| Sex | Number | Average Earnings |
| Male | 205 (53.1%) | $63,750 |
| Female | 181 (46.9%) | $39,688 |
| Total | 386 (100.0%) | $52,667 |
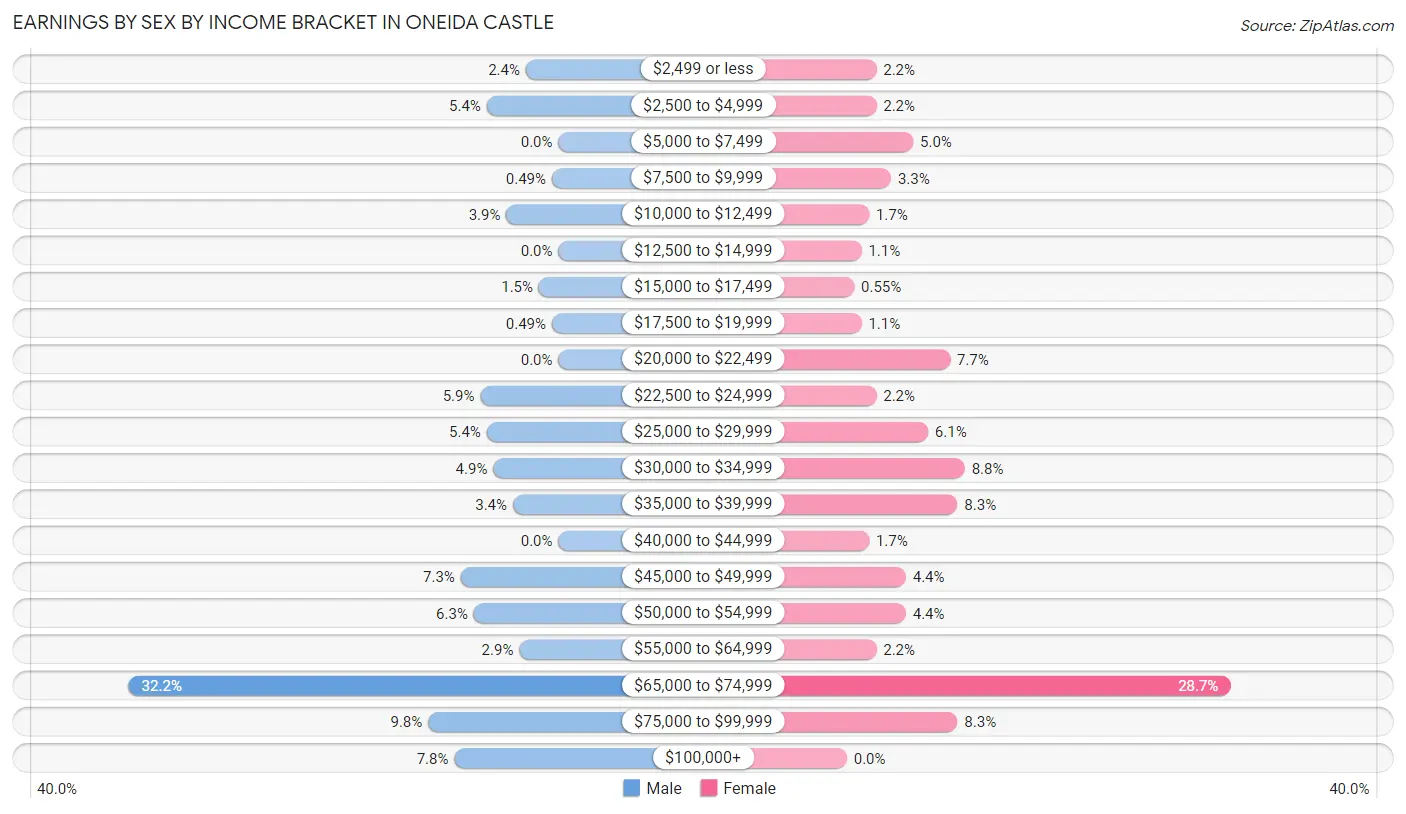
Earnings by Sex by Income Bracket in Oneida Castle
The most common earnings brackets in Oneida Castle are $65,000 to $74,999 for men (66 | 32.2%) and $65,000 to $74,999 for women (52 | 28.7%).
| Income | Male | Female |
| $2,499 or less | 5 (2.4%) | 4 (2.2%) |
| $2,500 to $4,999 | 11 (5.4%) | 4 (2.2%) |
| $5,000 to $7,499 | 0 (0.0%) | 9 (5.0%) |
| $7,500 to $9,999 | 1 (0.5%) | 6 (3.3%) |
| $10,000 to $12,499 | 8 (3.9%) | 3 (1.7%) |
| $12,500 to $14,999 | 0 (0.0%) | 2 (1.1%) |
| $15,000 to $17,499 | 3 (1.5%) | 1 (0.5%) |
| $17,500 to $19,999 | 1 (0.5%) | 2 (1.1%) |
| $20,000 to $22,499 | 0 (0.0%) | 14 (7.7%) |
| $22,500 to $24,999 | 12 (5.9%) | 4 (2.2%) |
| $25,000 to $29,999 | 11 (5.4%) | 11 (6.1%) |
| $30,000 to $34,999 | 10 (4.9%) | 16 (8.8%) |
| $35,000 to $39,999 | 7 (3.4%) | 15 (8.3%) |
| $40,000 to $44,999 | 0 (0.0%) | 3 (1.7%) |
| $45,000 to $49,999 | 15 (7.3%) | 8 (4.4%) |
| $50,000 to $54,999 | 13 (6.3%) | 8 (4.4%) |
| $55,000 to $64,999 | 6 (2.9%) | 4 (2.2%) |
| $65,000 to $74,999 | 66 (32.2%) | 52 (28.7%) |
| $75,000 to $99,999 | 20 (9.8%) | 15 (8.3%) |
| $100,000+ | 16 (7.8%) | 0 (0.0%) |
| Total | 205 (100.0%) | 181 (100.0%) |
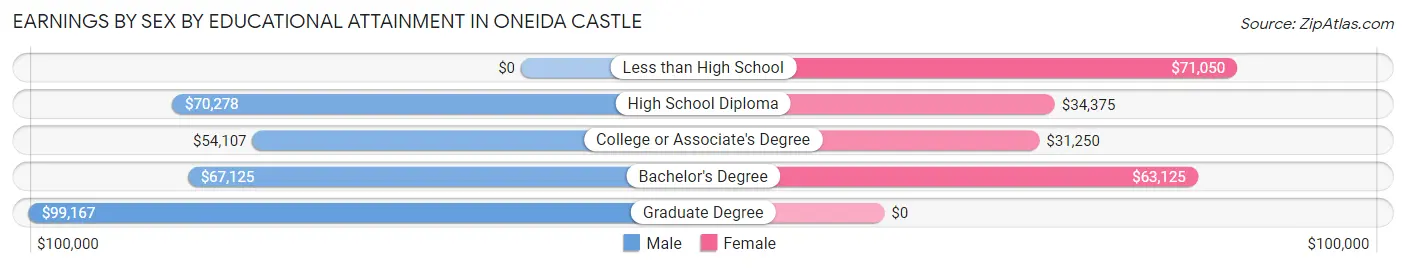
Earnings by Sex by Educational Attainment in Oneida Castle
Average earnings in Oneida Castle are $67,500 for men and $42,500 for women, a difference of 37.0%. Men with an educational attainment of graduate degree enjoy the highest average annual earnings of $99,167, while those with college or associate's degree education earn the least with $54,107. Women with an educational attainment of less than high school earn the most with the average annual earnings of $71,050, while those with college or associate's degree education have the smallest earnings of $31,250.
| Educational Attainment | Male Income | Female Income |
| Less than High School | - | - |
| High School Diploma | $70,278 | $34,375 |
| College or Associate's Degree | $54,107 | $31,250 |
| Bachelor's Degree | $67,125 | $63,125 |
| Graduate Degree | $99,167 | $0 |
| Total | $67,500 | $42,500 |
Family Income in Oneida Castle
Family Income Brackets in Oneida Castle
According to the Oneida Castle family income data, there are 41 families falling into the $100,000 to $149,999 income range, which is the most common income bracket and makes up 26.1% of all families.
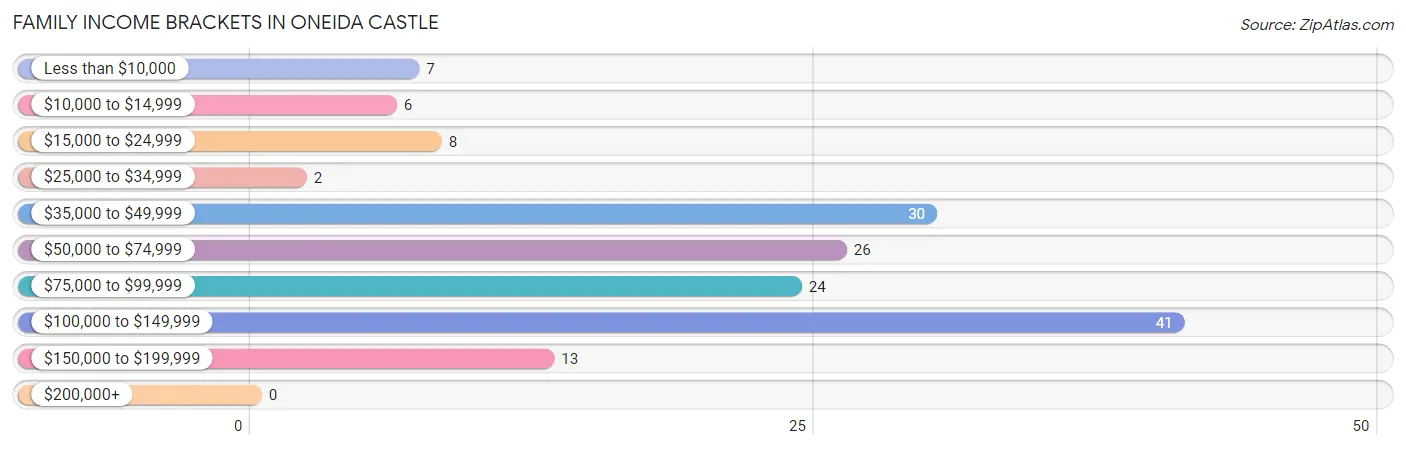
| Income Bracket | # Families | % Families |
| Less than $10,000 | 7 | 4.5% |
| $10,000 to $14,999 | 6 | 3.8% |
| $15,000 to $24,999 | 8 | 5.1% |
| $25,000 to $34,999 | 2 | 1.3% |
| $35,000 to $49,999 | 30 | 19.1% |
| $50,000 to $74,999 | 26 | 16.6% |
| $75,000 to $99,999 | 24 | 15.3% |
| $100,000 to $149,999 | 41 | 26.1% |
| $150,000 to $199,999 | 13 | 8.3% |
| $200,000+ | 0 | 0.0% |
Family Income by Famaliy Size in Oneida Castle
4-person families (22 | 14.0%) account for the highest median family income in Oneida Castle with $70,833 per family, while 2-person families (76 | 48.4%) have the highest median income of $28,194 per family member.
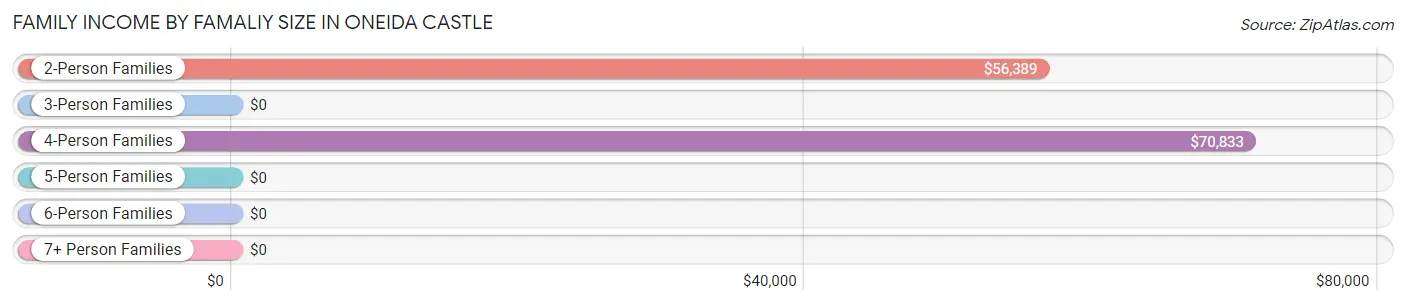
| Income Bracket | # Families | Median Income |
| 2-Person Families | 76 (48.4%) | $56,389 |
| 3-Person Families | 37 (23.6%) | $0 |
| 4-Person Families | 22 (14.0%) | $70,833 |
| 5-Person Families | 22 (14.0%) | $0 |
| 6-Person Families | 0 (0.0%) | $0 |
| 7+ Person Families | 0 (0.0%) | $0 |
| Total | 157 (100.0%) | $74,583 |
Family Income by Number of Earners in Oneida Castle
The median family income in Oneida Castle is $74,583, with families comprising 3+ earners (13) having the highest median family income of $108,646, while families with no earners (36) have the lowest median family income of $44,643, accounting for 8.3% and 22.9% of families, respectively.
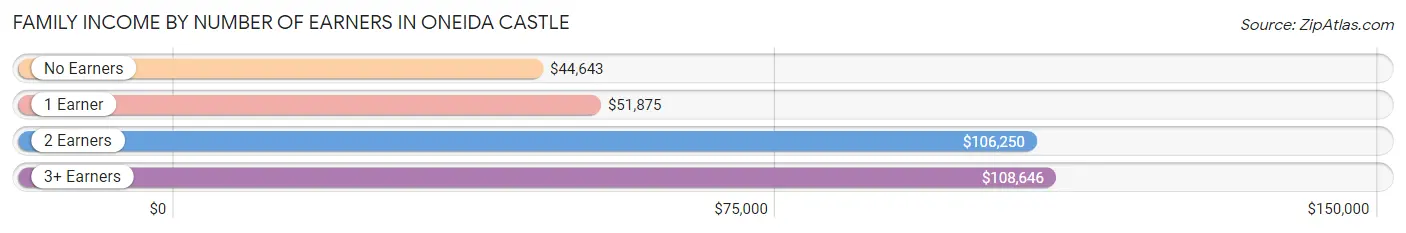
| Number of Earners | # Families | Median Income |
| No Earners | 36 (22.9%) | $44,643 |
| 1 Earner | 62 (39.5%) | $51,875 |
| 2 Earners | 46 (29.3%) | $106,250 |
| 3+ Earners | 13 (8.3%) | $108,646 |
| Total | 157 (100.0%) | $74,583 |
Household Income in Oneida Castle
Household Income Brackets in Oneida Castle
With 98 households falling in the category, the $100,000 to $149,999 income range is the most frequent in Oneida Castle, accounting for 31.9% of all households.
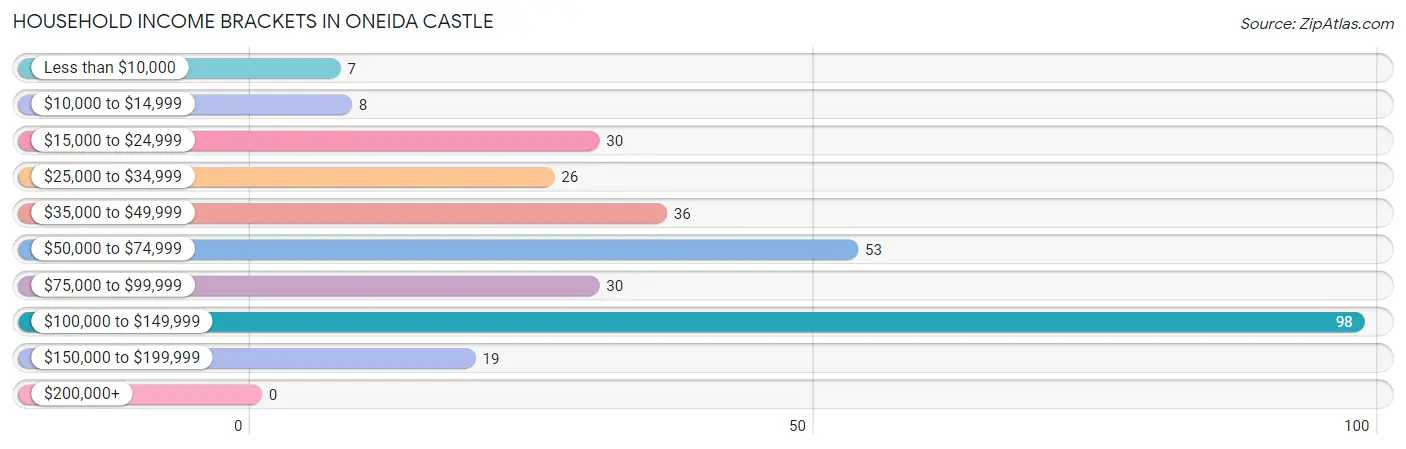
| Income Bracket | # Households | % Households |
| Less than $10,000 | 7 | 2.3% |
| $10,000 to $14,999 | 8 | 2.6% |
| $15,000 to $24,999 | 30 | 9.8% |
| $25,000 to $34,999 | 26 | 8.5% |
| $35,000 to $49,999 | 36 | 11.7% |
| $50,000 to $74,999 | 53 | 17.3% |
| $75,000 to $99,999 | 30 | 9.8% |
| $100,000 to $149,999 | 98 | 31.9% |
| $150,000 to $199,999 | 19 | 6.2% |
| $200,000+ | 0 | 0.0% |
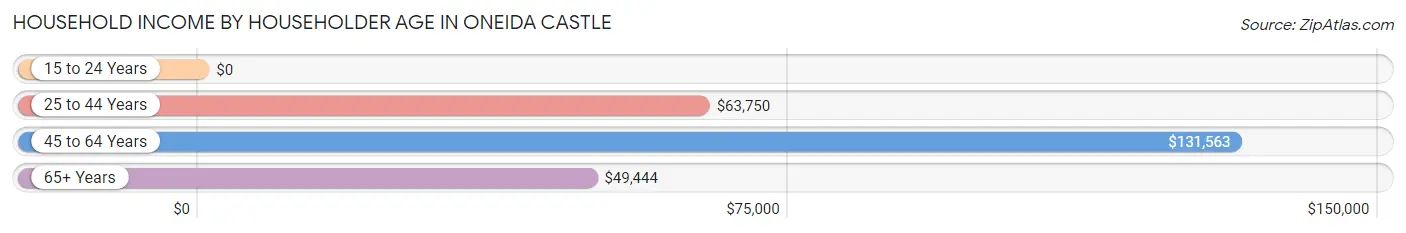
Household Income by Householder Age in Oneida Castle
The median household income in Oneida Castle is $71,042, with the highest median household income of $131,563 found in the 45 to 64 years age bracket for the primary householder. A total of 117 households (38.1%) fall into this category. Meanwhile, the 15 to 24 years age bracket for the primary householder has the lowest median household income of $0, with 5 households (1.6%) in this group.
| Income Bracket | # Households | Median Income |
| 15 to 24 Years | 5 (1.6%) | $0 |
| 25 to 44 Years | 87 (28.3%) | $63,750 |
| 45 to 64 Years | 117 (38.1%) | $131,563 |
| 65+ Years | 98 (31.9%) | $49,444 |
| Total | 307 (100.0%) | $71,042 |
Poverty in Oneida Castle
Income Below Poverty by Sex and Age in Oneida Castle
With 7.4% poverty level for males and 11.5% for females among the residents of Oneida Castle, 5 year old males and under 5 year old females are the most vulnerable to poverty, with 3 males (100.0%) and 6 females (46.2%) in their respective age groups living below the poverty level.
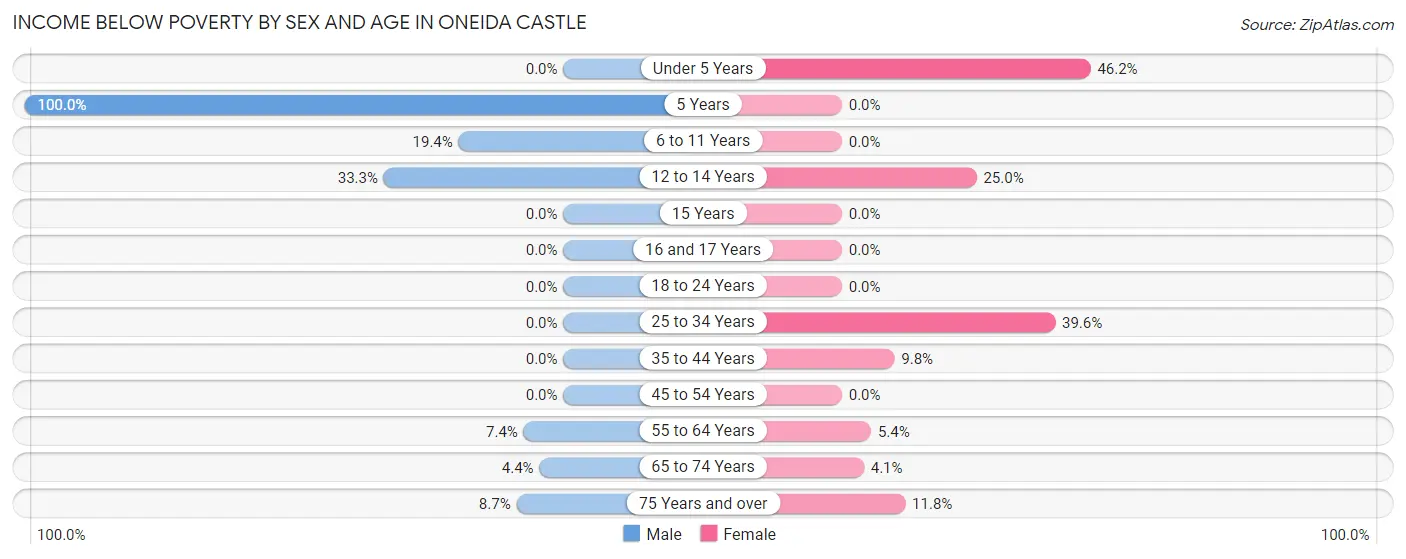
| Age Bracket | Male | Female |
| Under 5 Years | 0 (0.0%) | 6 (46.2%) |
| 5 Years | 3 (100.0%) | 0 (0.0%) |
| 6 to 11 Years | 7 (19.4%) | 0 (0.0%) |
| 12 to 14 Years | 4 (33.3%) | 4 (25.0%) |
| 15 Years | 0 (0.0%) | 0 (0.0%) |
| 16 and 17 Years | 0 (0.0%) | 0 (0.0%) |
| 18 to 24 Years | 0 (0.0%) | 0 (0.0%) |
| 25 to 34 Years | 0 (0.0%) | 19 (39.6%) |
| 35 to 44 Years | 0 (0.0%) | 4 (9.8%) |
| 45 to 54 Years | 0 (0.0%) | 0 (0.0%) |
| 55 to 64 Years | 7 (7.4%) | 2 (5.4%) |
| 65 to 74 Years | 2 (4.4%) | 2 (4.1%) |
| 75 Years and over | 2 (8.7%) | 4 (11.8%) |
| Total | 25 (7.4%) | 41 (11.5%) |
Income Above Poverty by Sex and Age in Oneida Castle
According to the poverty statistics in Oneida Castle, males aged under 5 years and females aged 5 years are the age groups that are most secure financially, with 100.0% of males and 100.0% of females in these age groups living above the poverty line.
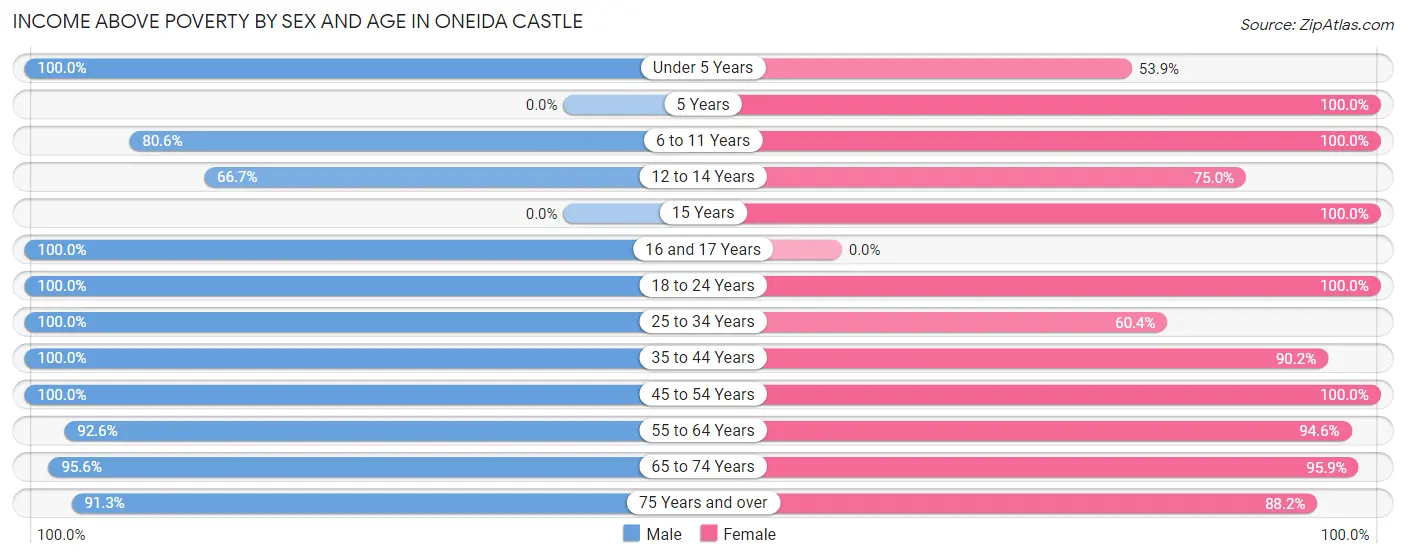
| Age Bracket | Male | Female |
| Under 5 Years | 6 (100.0%) | 7 (53.8%) |
| 5 Years | 0 (0.0%) | 4 (100.0%) |
| 6 to 11 Years | 29 (80.6%) | 37 (100.0%) |
| 12 to 14 Years | 8 (66.7%) | 12 (75.0%) |
| 15 Years | 0 (0.0%) | 3 (100.0%) |
| 16 and 17 Years | 19 (100.0%) | 0 (0.0%) |
| 18 to 24 Years | 15 (100.0%) | 10 (100.0%) |
| 25 to 34 Years | 24 (100.0%) | 29 (60.4%) |
| 35 to 44 Years | 38 (100.0%) | 37 (90.2%) |
| 45 to 54 Years | 21 (100.0%) | 66 (100.0%) |
| 55 to 64 Years | 88 (92.6%) | 35 (94.6%) |
| 65 to 74 Years | 43 (95.6%) | 47 (95.9%) |
| 75 Years and over | 21 (91.3%) | 30 (88.2%) |
| Total | 312 (92.6%) | 317 (88.5%) |
Income Below Poverty Among Married-Couple Families in Oneida Castle
The poverty statistics for married-couple families in Oneida Castle show that 1.8% or 2 of the total 110 families live below the poverty line. Families with no children have the highest poverty rate of 3.3%, comprising of 2 families. On the other hand, families with 1 or 2 children have the lowest poverty rate of 0.0%, which includes 0 families.
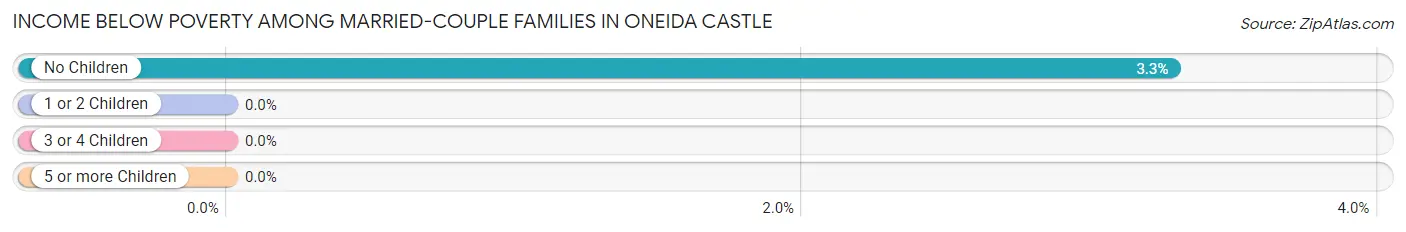
| Children | Above Poverty | Below Poverty |
| No Children | 59 (96.7%) | 2 (3.3%) |
| 1 or 2 Children | 31 (100.0%) | 0 (0.0%) |
| 3 or 4 Children | 18 (100.0%) | 0 (0.0%) |
| 5 or more Children | 0 (0.0%) | 0 (0.0%) |
| Total | 108 (98.2%) | 2 (1.8%) |
Income Below Poverty Among Single-Parent Households in Oneida Castle
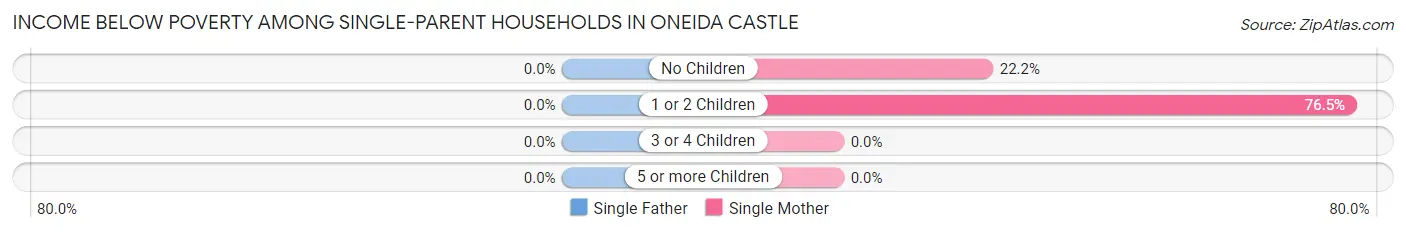
| Children | Single Father | Single Mother |
| No Children | 0 (0.0%) | 2 (22.2%) |
| 1 or 2 Children | 0 (0.0%) | 13 (76.5%) |
| 3 or 4 Children | 0 (0.0%) | 0 (0.0%) |
| 5 or more Children | 0 (0.0%) | 0 (0.0%) |
| Total | 0 (0.0%) | 15 (50.0%) |
Income Below Poverty Among Married-Couple vs Single-Parent Households in Oneida Castle
The poverty data for Oneida Castle shows that 2 of the married-couple family households (1.8%) and 15 of the single-parent households (31.9%) are living below the poverty level. Within the married-couple family households, those with no children have the highest poverty rate, with 2 households (3.3%) falling below the poverty line. Among the single-parent households, those with 1 or 2 children have the highest poverty rate, with 13 household (61.9%) living below poverty.
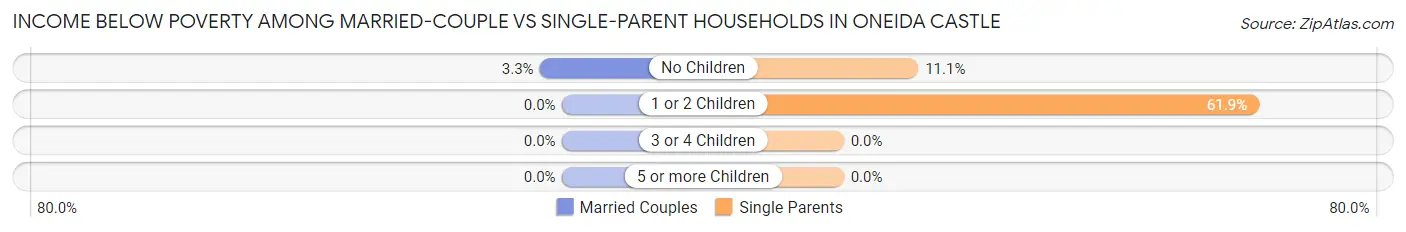
| Children | Married-Couple Families | Single-Parent Households |
| No Children | 2 (3.3%) | 2 (11.1%) |
| 1 or 2 Children | 0 (0.0%) | 13 (61.9%) |
| 3 or 4 Children | 0 (0.0%) | 0 (0.0%) |
| 5 or more Children | 0 (0.0%) | 0 (0.0%) |
| Total | 2 (1.8%) | 15 (31.9%) |
Race in Oneida Castle
The most populous races in Oneida Castle are White / Caucasian (648 | 92.7%), Hispanic or Latino (31 | 4.4%), and Some other Race (25 | 3.6%).
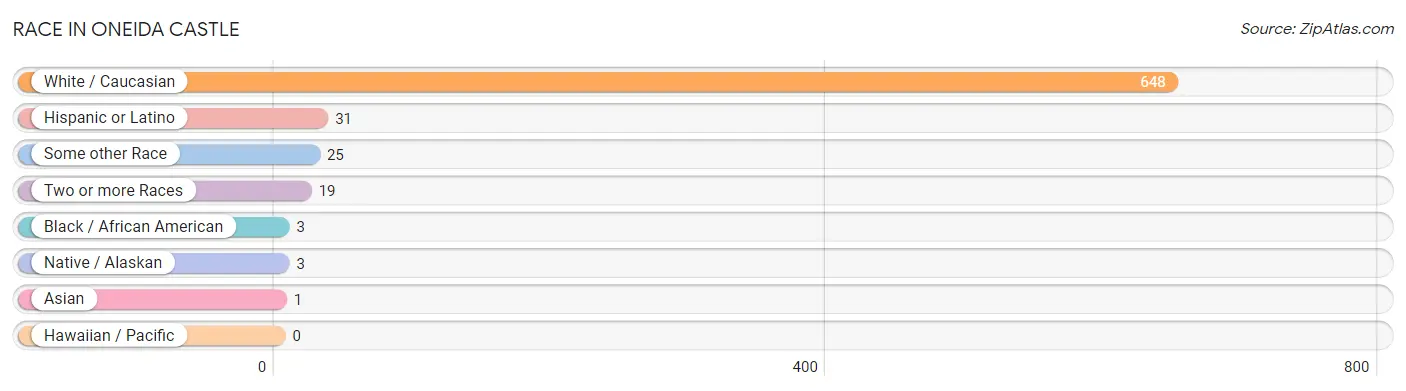
| Race | # Population | % Population |
| Asian | 1 | 0.1% |
| Black / African American | 3 | 0.4% |
| Hawaiian / Pacific | 0 | 0.0% |
| Hispanic or Latino | 31 | 4.4% |
| Native / Alaskan | 3 | 0.4% |
| White / Caucasian | 648 | 92.7% |
| Two or more Races | 19 | 2.7% |
| Some other Race | 25 | 3.6% |
| Total | 699 | 100.0% |
Ancestry in Oneida Castle
The most populous ancestries reported in Oneida Castle are German (140 | 20.0%), English (122 | 17.4%), Italian (118 | 16.9%), Irish (105 | 15.0%), and French (94 | 13.5%), together accounting for 82.8% of all Oneida Castle residents.
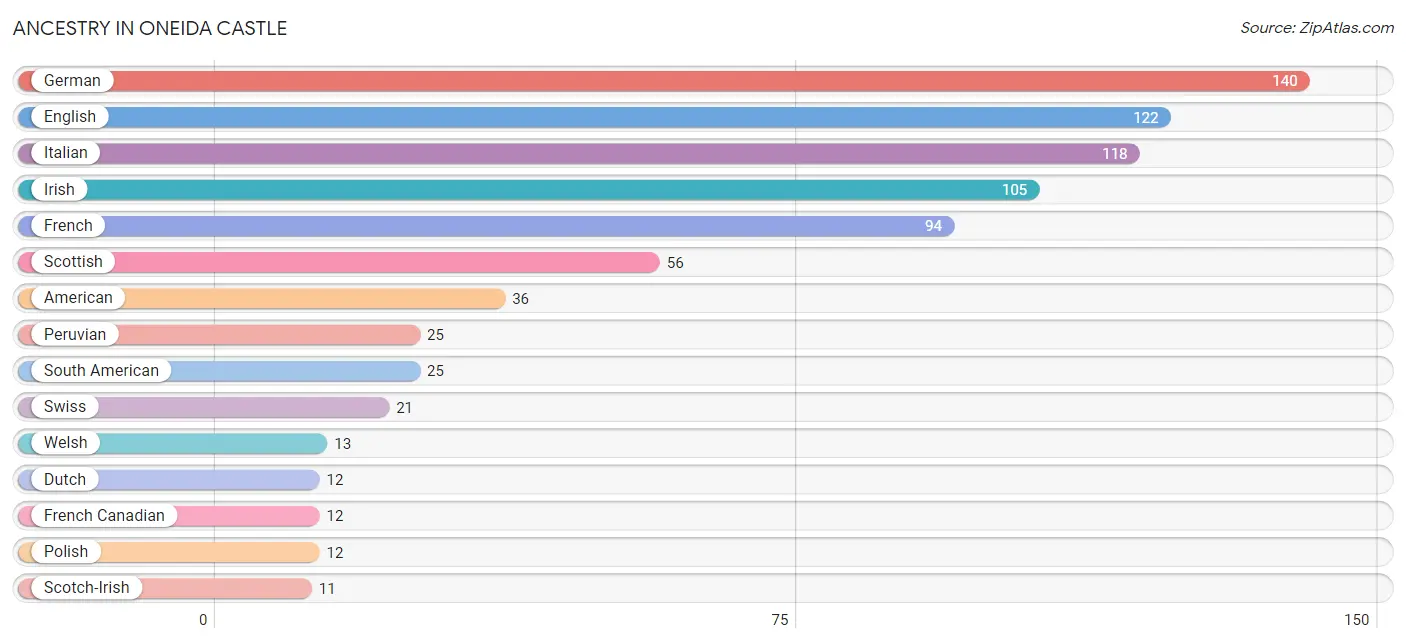
| Ancestry | # Population | % Population |
| American | 36 | 5.1% |
| Austrian | 2 | 0.3% |
| Central American | 6 | 0.9% |
| Danish | 2 | 0.3% |
| Dutch | 12 | 1.7% |
| English | 122 | 17.4% |
| European | 7 | 1.0% |
| French | 94 | 13.5% |
| French Canadian | 12 | 1.7% |
| German | 140 | 20.0% |
| Irish | 105 | 15.0% |
| Iroquois | 3 | 0.4% |
| Italian | 118 | 16.9% |
| Pakistani | 1 | 0.1% |
| Panamanian | 6 | 0.9% |
| Peruvian | 25 | 3.6% |
| Polish | 12 | 1.7% |
| Russian | 4 | 0.6% |
| Scotch-Irish | 11 | 1.6% |
| Scottish | 56 | 8.0% |
| South American | 25 | 3.6% |
| Swedish | 7 | 1.0% |
| Swiss | 21 | 3.0% |
| Ukrainian | 7 | 1.0% |
| Welsh | 13 | 1.9% | View All 25 Rows |
Immigrants in Oneida Castle
The most numerous immigrant groups reported in Oneida Castle came from Canada (4 | 0.6%), Australia (3 | 0.4%), Oceania (3 | 0.4%), Asia (1 | 0.1%), and South Eastern Asia (1 | 0.1%), together accounting for 1.7% of all Oneida Castle residents.
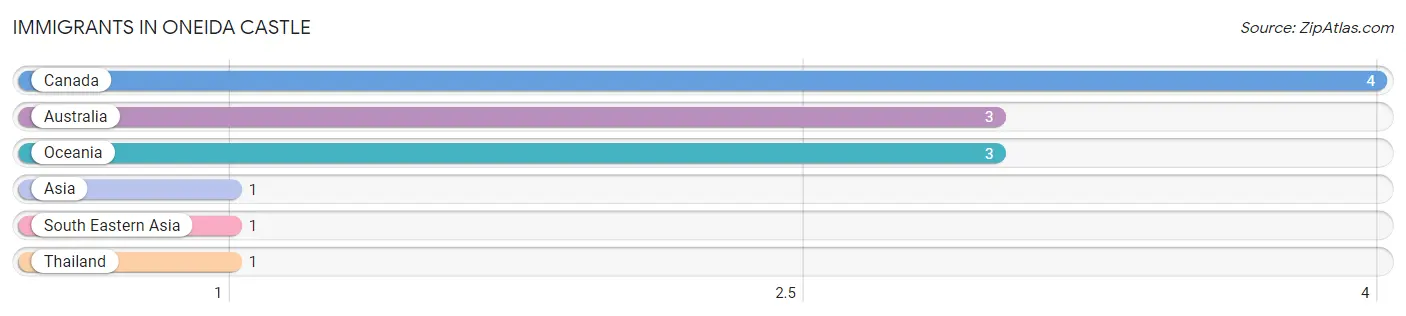
| Immigration Origin | # Population | % Population |
| Asia | 1 | 0.1% |
| Australia | 3 | 0.4% |
| Canada | 4 | 0.6% |
| Oceania | 3 | 0.4% |
| South Eastern Asia | 1 | 0.1% |
| Thailand | 1 | 0.1% | View All 6 Rows |
Sex and Age in Oneida Castle
Sex and Age in Oneida Castle
The most populous age groups in Oneida Castle are 60 to 64 Years (65 | 19.1%) for men and 50 to 54 Years (60 | 16.8%) for women.
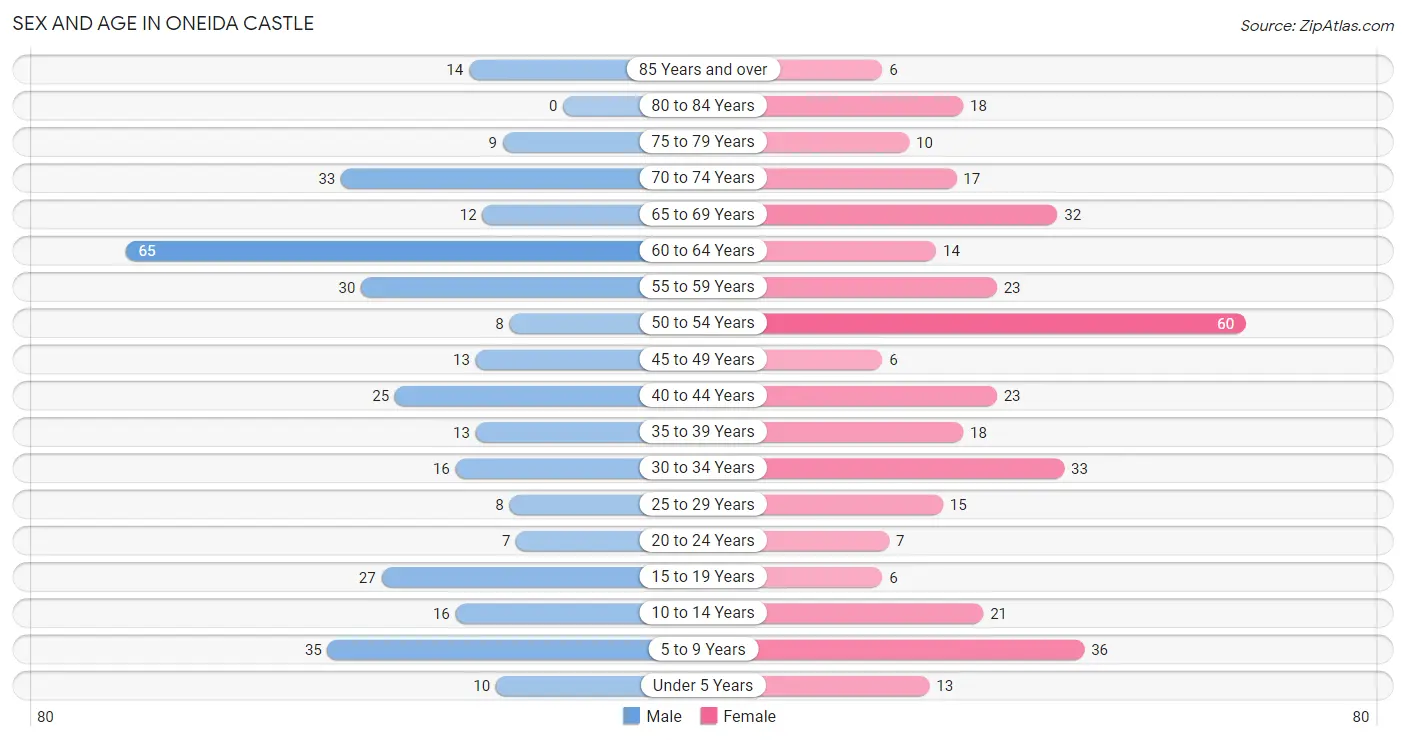
| Age Bracket | Male | Female |
| Under 5 Years | 10 (2.9%) | 13 (3.6%) |
| 5 to 9 Years | 35 (10.3%) | 36 (10.1%) |
| 10 to 14 Years | 16 (4.7%) | 21 (5.9%) |
| 15 to 19 Years | 27 (7.9%) | 6 (1.7%) |
| 20 to 24 Years | 7 (2.1%) | 7 (2.0%) |
| 25 to 29 Years | 8 (2.4%) | 15 (4.2%) |
| 30 to 34 Years | 16 (4.7%) | 33 (9.2%) |
| 35 to 39 Years | 13 (3.8%) | 18 (5.0%) |
| 40 to 44 Years | 25 (7.3%) | 23 (6.4%) |
| 45 to 49 Years | 13 (3.8%) | 6 (1.7%) |
| 50 to 54 Years | 8 (2.4%) | 60 (16.8%) |
| 55 to 59 Years | 30 (8.8%) | 23 (6.4%) |
| 60 to 64 Years | 65 (19.1%) | 14 (3.9%) |
| 65 to 69 Years | 12 (3.5%) | 32 (8.9%) |
| 70 to 74 Years | 33 (9.7%) | 17 (4.8%) |
| 75 to 79 Years | 9 (2.6%) | 10 (2.8%) |
| 80 to 84 Years | 0 (0.0%) | 18 (5.0%) |
| 85 Years and over | 14 (4.1%) | 6 (1.7%) |
| Total | 341 (100.0%) | 358 (100.0%) |
Families and Households in Oneida Castle
Median Family Size in Oneida Castle
The median family size in Oneida Castle is 2.90 persons per family, with married-couple families (110 | 70.1%) accounting for the largest median family size of 3 persons per family. On the other hand, single female/mother families (30 | 19.1%) represent the smallest median family size with 2.67 persons per family.
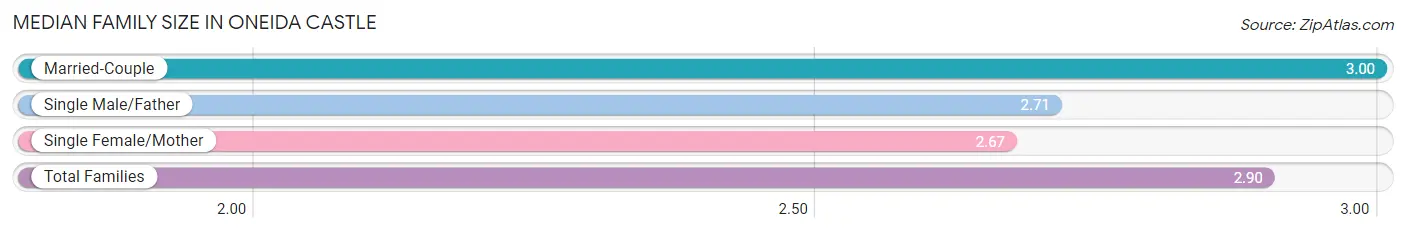
| Family Type | # Families | Family Size |
| Married-Couple | 110 (70.1%) | 3.00 |
| Single Male/Father | 17 (10.8%) | 2.71 |
| Single Female/Mother | 30 (19.1%) | 2.67 |
| Total Families | 157 (100.0%) | 2.90 |
Median Household Size in Oneida Castle
The median household size in Oneida Castle is 2.28 persons per household, with single male/father households (17 | 5.5%) accounting for the largest median household size of 3.18 persons per household. non-family households (150 | 48.9%) represent the smallest median household size with 1.44 persons per household.
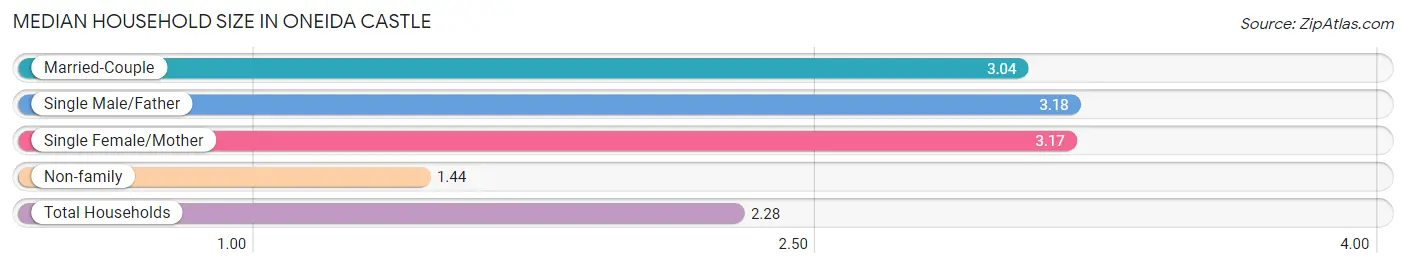
| Household Type | # Households | Household Size |
| Married-Couple | 110 (35.8%) | 3.04 |
| Single Male/Father | 17 (5.5%) | 3.18 |
| Single Female/Mother | 30 (9.8%) | 3.17 |
| Non-family | 150 (48.9%) | 1.44 |
| Total Households | 307 (100.0%) | 2.28 |
Household Size by Marriage Status in Oneida Castle
Out of a total of 307 households in Oneida Castle, 157 (51.1%) are family households, while 150 (48.9%) are nonfamily households. The most numerous type of family households are 2-person households, comprising 69, and the most common type of nonfamily households are 1-person households, comprising 90.
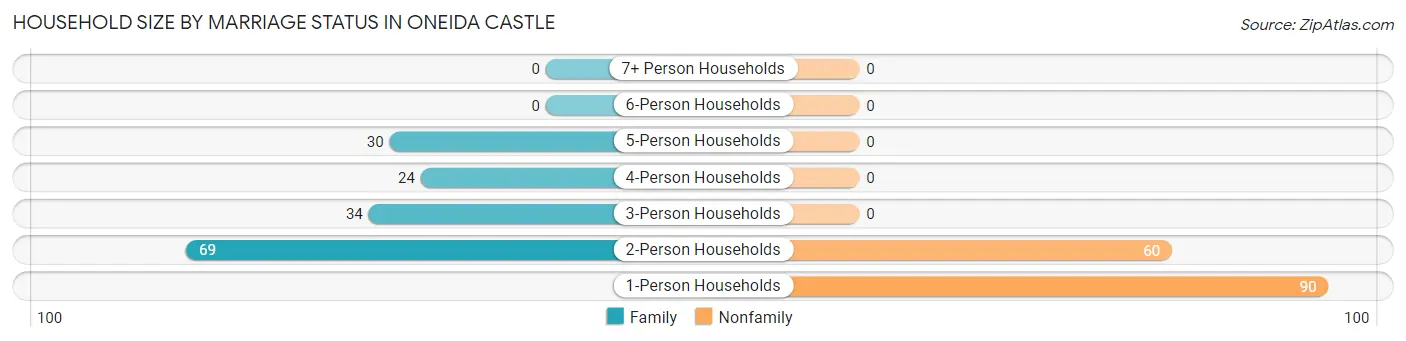
| Household Size | Family Households | Nonfamily Households |
| 1-Person Households | - | 90 (29.3%) |
| 2-Person Households | 69 (22.5%) | 60 (19.5%) |
| 3-Person Households | 34 (11.1%) | 0 (0.0%) |
| 4-Person Households | 24 (7.8%) | 0 (0.0%) |
| 5-Person Households | 30 (9.8%) | 0 (0.0%) |
| 6-Person Households | 0 (0.0%) | 0 (0.0%) |
| 7+ Person Households | 0 (0.0%) | 0 (0.0%) |
| Total | 157 (51.1%) | 150 (48.9%) |
Female Fertility in Oneida Castle
Fertility by Age in Oneida Castle
| Age Bracket | Women with Births | Births / 1,000 Women |
| 15 to 19 years | 0 (0.0%) | 0.0 |
| 20 to 34 years | 0 (0.0%) | 0.0 |
| 35 to 50 years | 0 (0.0%) | 0.0 |
| Total | 0 (0.0%) | 0.0 |
Fertility by Age by Marriage Status in Oneida Castle
| Age Bracket | Married | Unmarried |
| 15 to 19 years | 0 (0.0%) | 0 (0.0%) |
| 20 to 34 years | 0 (0.0%) | 0 (0.0%) |
| 35 to 50 years | 0 (0.0%) | 0 (0.0%) |
| Total | 0 (0.0%) | 0 (0.0%) |
Fertility by Education in Oneida Castle
| Educational Attainment | Women with Births | Births / 1,000 Women |
| Less than High School | 0 (0.0%) | 0.0 |
| High School Diploma | 0 (0.0%) | 0.0 |
| College or Associate's Degree | 0 (0.0%) | 0.0 |
| Bachelor's Degree | 0 (0.0%) | 0.0 |
| Graduate Degree | 0 (0.0%) | 0.0 |
| Total | 0 (0.0%) | 0.0 |
Fertility by Education by Marriage Status in Oneida Castle
| Educational Attainment | Married | Unmarried |
| Less than High School | 0 (0.0%) | 0 (0.0%) |
| High School Diploma | 0 (0.0%) | 0 (0.0%) |
| College or Associate's Degree | 0 (0.0%) | 0 (0.0%) |
| Bachelor's Degree | 0 (0.0%) | 0 (0.0%) |
| Graduate Degree | 0 (0.0%) | 0 (0.0%) |
| Total | 0 (0.0%) | 0 (0.0%) |
Employment Characteristics in Oneida Castle
Employment by Class of Employer in Oneida Castle
Among the 348 employed individuals in Oneida Castle, private company employees (259 | 74.4%), local government employees (40 | 11.5%), and not-for-profit organizations (18 | 5.2%) make up the most common classes of employment.
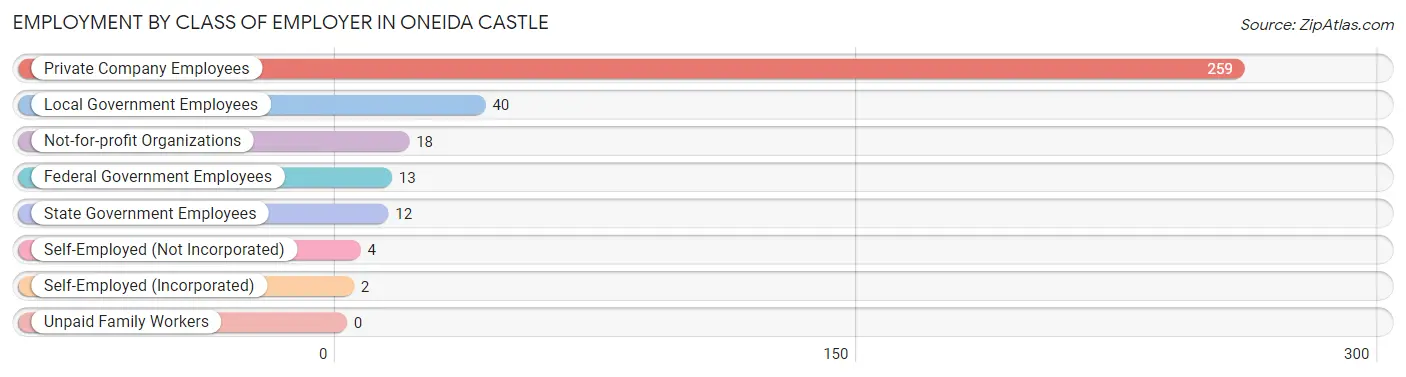
| Employer Class | # Employees | % Employees |
| Private Company Employees | 259 | 74.4% |
| Self-Employed (Incorporated) | 2 | 0.6% |
| Self-Employed (Not Incorporated) | 4 | 1.1% |
| Not-for-profit Organizations | 18 | 5.2% |
| Local Government Employees | 40 | 11.5% |
| State Government Employees | 12 | 3.5% |
| Federal Government Employees | 13 | 3.7% |
| Unpaid Family Workers | 0 | 0.0% |
| Total | 348 | 100.0% |
Employment Status by Age in Oneida Castle
According to the labor force statistics for Oneida Castle, out of the total population over 16 years of age (565), 67.1% or 379 individuals are in the labor force, with 2.9% or 11 of them unemployed. The age group with the highest labor force participation rate is 25 to 29 years, with 100.0% or 23 individuals in the labor force. Within the labor force, the 75 years and over age range has the highest percentage of unemployed individuals, with 50.0% or 2 of them being unemployed.
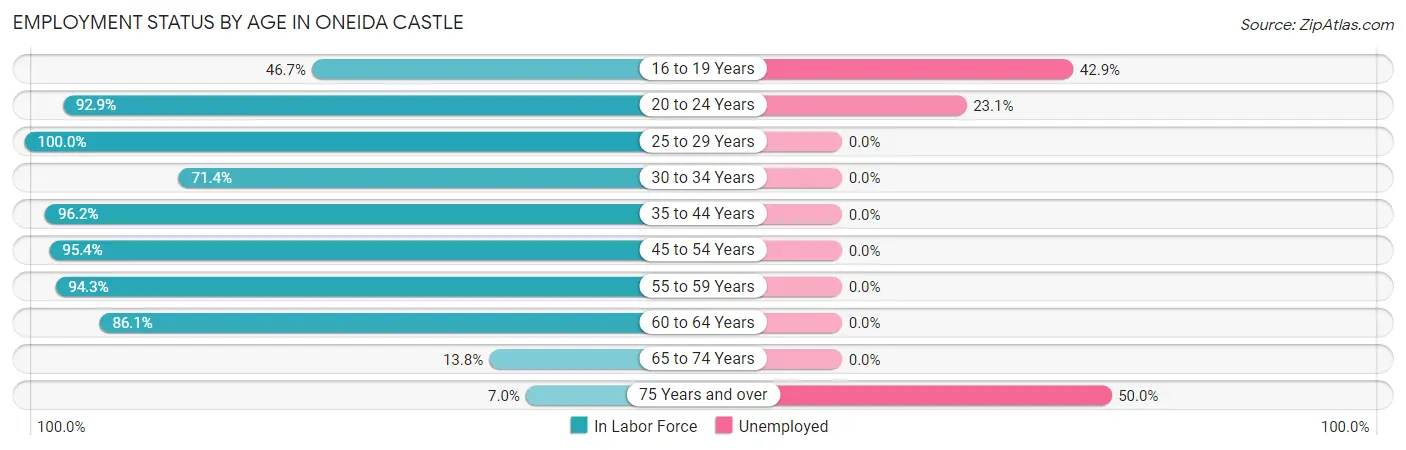
| Age Bracket | In Labor Force | Unemployed |
| 16 to 19 Years | 14 (46.7%) | 6 (42.9%) |
| 20 to 24 Years | 13 (92.9%) | 3 (23.1%) |
| 25 to 29 Years | 23 (100.0%) | 0 (0.0%) |
| 30 to 34 Years | 35 (71.4%) | 0 (0.0%) |
| 35 to 44 Years | 76 (96.2%) | 0 (0.0%) |
| 45 to 54 Years | 83 (95.4%) | 0 (0.0%) |
| 55 to 59 Years | 50 (94.3%) | 0 (0.0%) |
| 60 to 64 Years | 68 (86.1%) | 0 (0.0%) |
| 65 to 74 Years | 13 (13.8%) | 0 (0.0%) |
| 75 Years and over | 4 (7.0%) | 2 (50.0%) |
| Total | 379 (67.1%) | 11 (2.9%) |
Employment Status by Educational Attainment in Oneida Castle
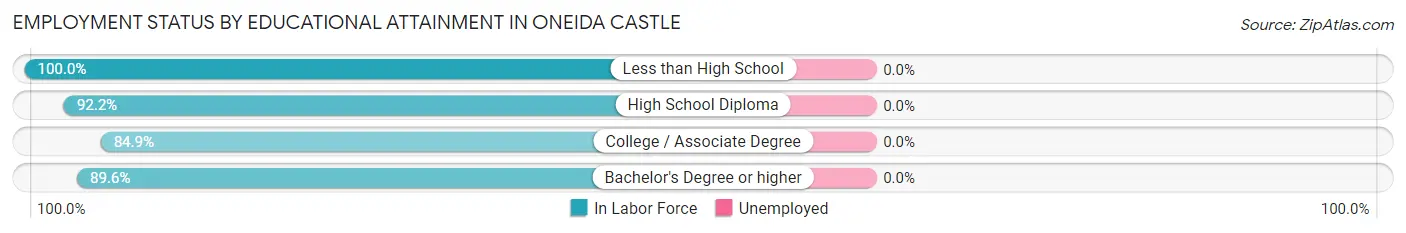
| Educational Attainment | In Labor Force | Unemployed |
| Less than High School | 61 (100.0%) | 0 (0.0%) |
| High School Diploma | 107 (92.2%) | 0 (0.0%) |
| College / Associate Degree | 107 (84.9%) | 0 (0.0%) |
| Bachelor's Degree or higher | 60 (89.6%) | 0 (0.0%) |
| Total | 335 (90.5%) | 0 (0.0%) |
Employment Occupations by Sex in Oneida Castle
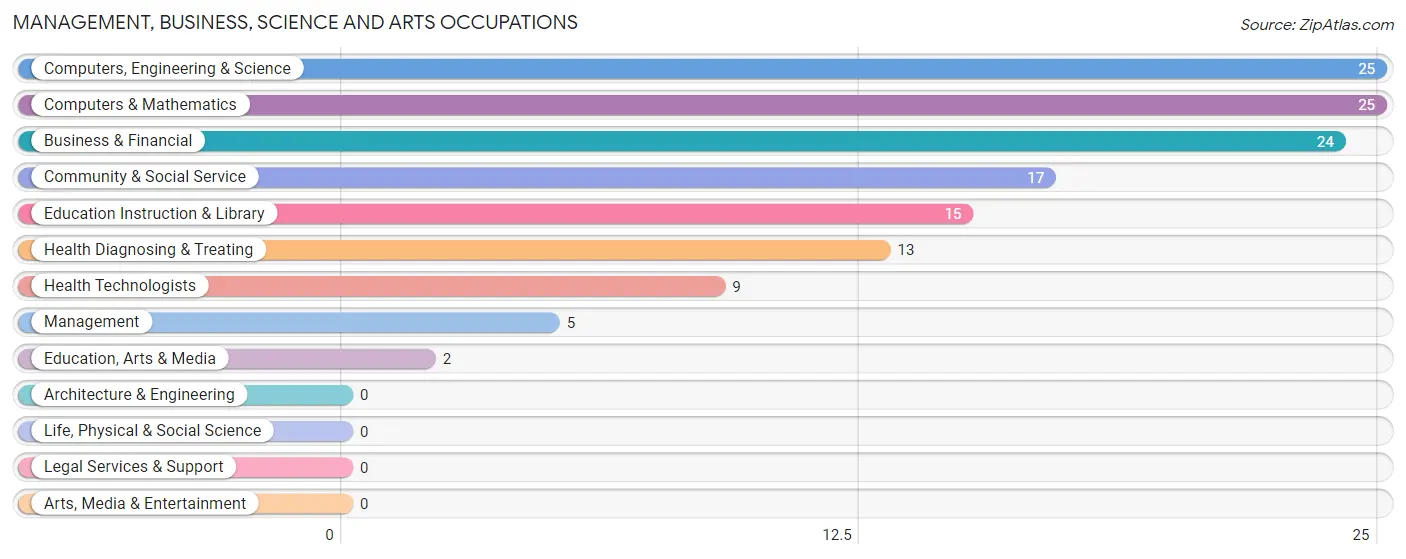
Management, Business, Science and Arts Occupations
The most common Management, Business, Science and Arts occupations in Oneida Castle are Computers, Engineering & Science (25 | 6.8%), Computers & Mathematics (25 | 6.8%), Business & Financial (24 | 6.5%), Community & Social Service (17 | 4.6%), and Education Instruction & Library (15 | 4.1%).
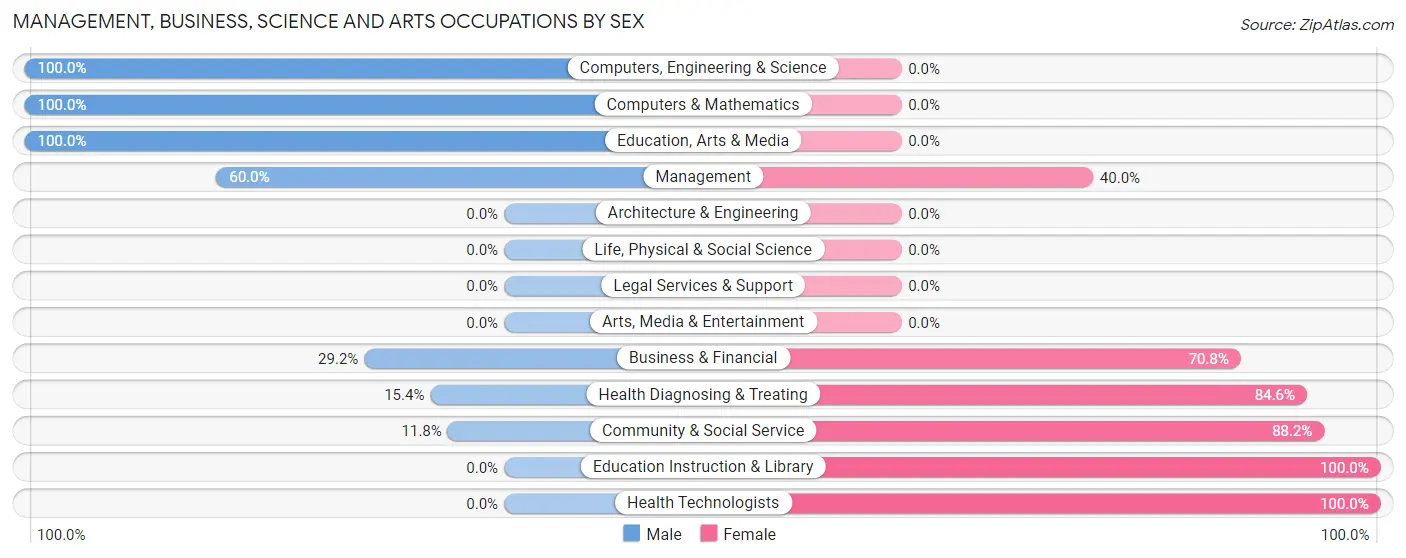
Management, Business, Science and Arts Occupations by Sex
Within the Management, Business, Science and Arts occupations in Oneida Castle, the most male-oriented occupations are Computers, Engineering & Science (100.0%), Computers & Mathematics (100.0%), and Education, Arts & Media (100.0%), while the most female-oriented occupations are Education Instruction & Library (100.0%), Health Technologists (100.0%), and Community & Social Service (88.2%).
| Occupation | Male | Female |
| Management | 3 (60.0%) | 2 (40.0%) |
| Business & Financial | 7 (29.2%) | 17 (70.8%) |
| Computers, Engineering & Science | 25 (100.0%) | 0 (0.0%) |
| Computers & Mathematics | 25 (100.0%) | 0 (0.0%) |
| Architecture & Engineering | 0 (0.0%) | 0 (0.0%) |
| Life, Physical & Social Science | 0 (0.0%) | 0 (0.0%) |
| Community & Social Service | 2 (11.8%) | 15 (88.2%) |
| Education, Arts & Media | 2 (100.0%) | 0 (0.0%) |
| Legal Services & Support | 0 (0.0%) | 0 (0.0%) |
| Education Instruction & Library | 0 (0.0%) | 15 (100.0%) |
| Arts, Media & Entertainment | 0 (0.0%) | 0 (0.0%) |
| Health Diagnosing & Treating | 2 (15.4%) | 11 (84.6%) |
| Health Technologists | 0 (0.0%) | 9 (100.0%) |
| Total (Category) | 39 (46.4%) | 45 (53.6%) |
| Total (Overall) | 195 (53.0%) | 173 (47.0%) |
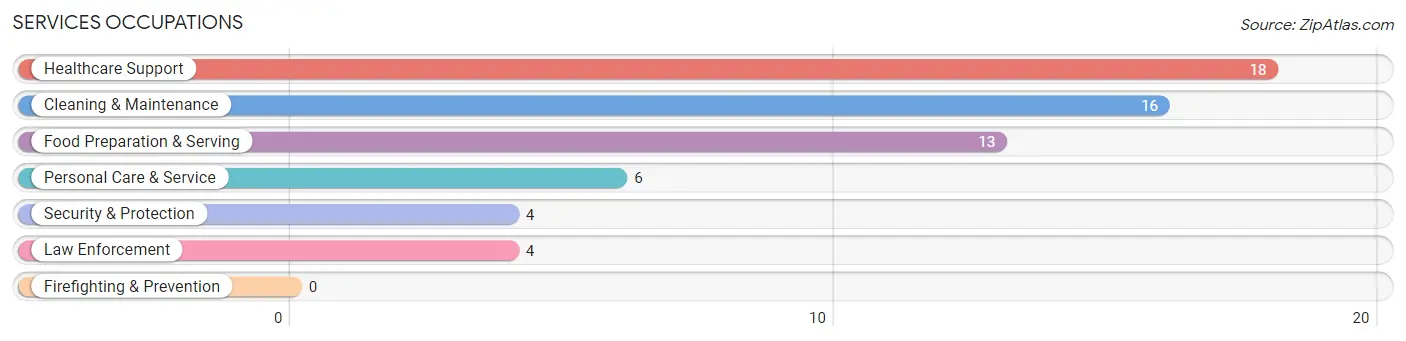
Services Occupations
The most common Services occupations in Oneida Castle are Healthcare Support (18 | 4.9%), Cleaning & Maintenance (16 | 4.3%), Food Preparation & Serving (13 | 3.5%), Personal Care & Service (6 | 1.6%), and Security & Protection (4 | 1.1%).
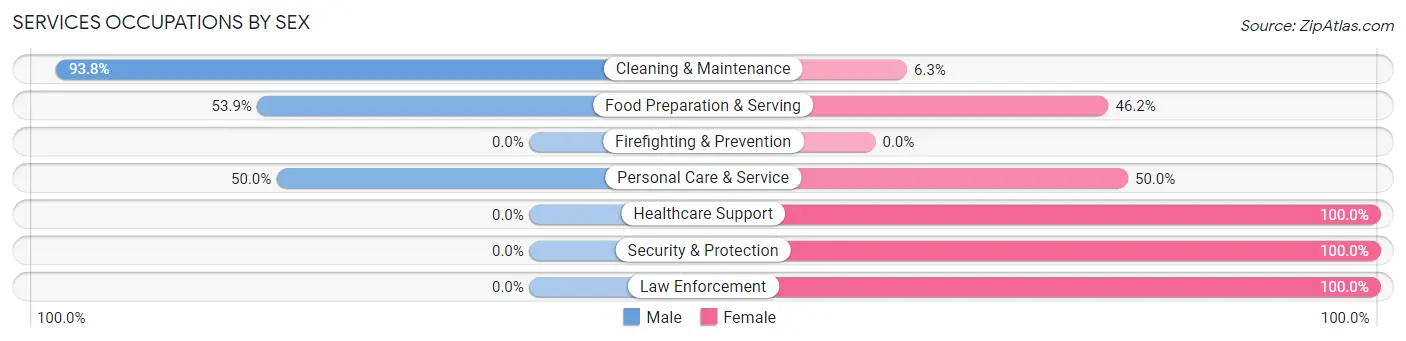
Services Occupations by Sex
Within the Services occupations in Oneida Castle, the most male-oriented occupations are Cleaning & Maintenance (93.8%), Food Preparation & Serving (53.8%), and Personal Care & Service (50.0%), while the most female-oriented occupations are Healthcare Support (100.0%), Security & Protection (100.0%), and Law Enforcement (100.0%).
| Occupation | Male | Female |
| Healthcare Support | 0 (0.0%) | 18 (100.0%) |
| Security & Protection | 0 (0.0%) | 4 (100.0%) |
| Firefighting & Prevention | 0 (0.0%) | 0 (0.0%) |
| Law Enforcement | 0 (0.0%) | 4 (100.0%) |
| Food Preparation & Serving | 7 (53.8%) | 6 (46.2%) |
| Cleaning & Maintenance | 15 (93.8%) | 1 (6.2%) |
| Personal Care & Service | 3 (50.0%) | 3 (50.0%) |
| Total (Category) | 25 (43.9%) | 32 (56.1%) |
| Total (Overall) | 195 (53.0%) | 173 (47.0%) |
Sales and Office Occupations
The most common Sales and Office occupations in Oneida Castle are Office & Administration (74 | 20.1%), and Sales & Related (31 | 8.4%).

Sales and Office Occupations by Sex
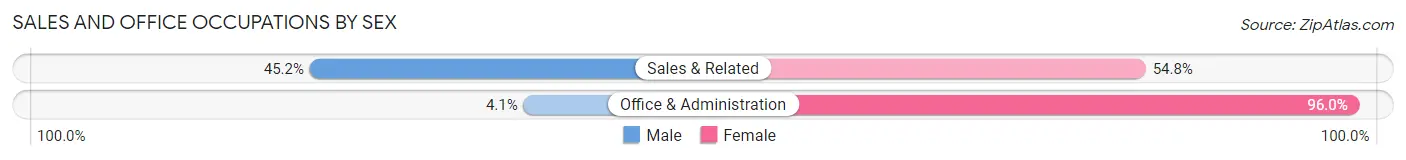
| Occupation | Male | Female |
| Sales & Related | 14 (45.2%) | 17 (54.8%) |
| Office & Administration | 3 (4.1%) | 71 (96.0%) |
| Total (Category) | 17 (16.2%) | 88 (83.8%) |
| Total (Overall) | 195 (53.0%) | 173 (47.0%) |
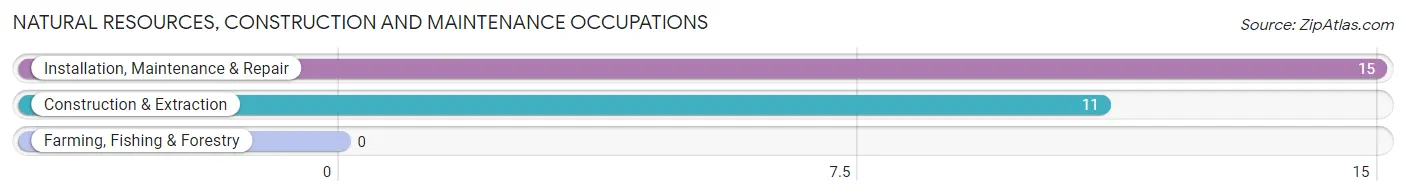
Natural Resources, Construction and Maintenance Occupations
The most common Natural Resources, Construction and Maintenance occupations in Oneida Castle are Installation, Maintenance & Repair (15 | 4.1%), and Construction & Extraction (11 | 3.0%).
Natural Resources, Construction and Maintenance Occupations by Sex
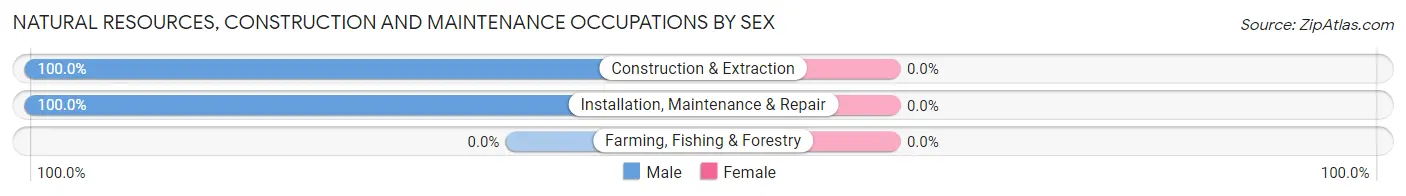
| Occupation | Male | Female |
| Farming, Fishing & Forestry | 0 (0.0%) | 0 (0.0%) |
| Construction & Extraction | 11 (100.0%) | 0 (0.0%) |
| Installation, Maintenance & Repair | 15 (100.0%) | 0 (0.0%) |
| Total (Category) | 26 (100.0%) | 0 (0.0%) |
| Total (Overall) | 195 (53.0%) | 173 (47.0%) |
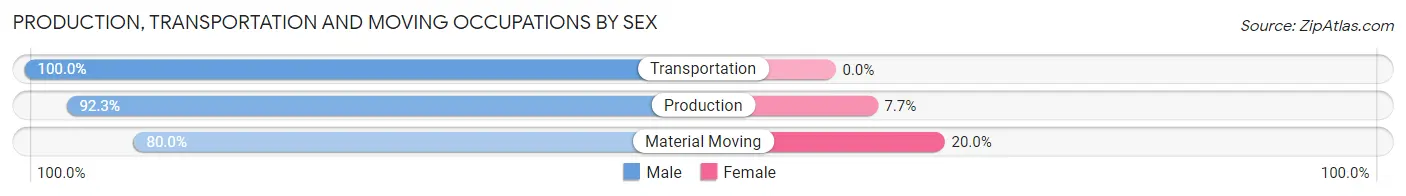
Production, Transportation and Moving Occupations
The most common Production, Transportation and Moving occupations in Oneida Castle are Production (78 | 21.2%), Material Moving (10 | 2.7%), and Transportation (8 | 2.2%).
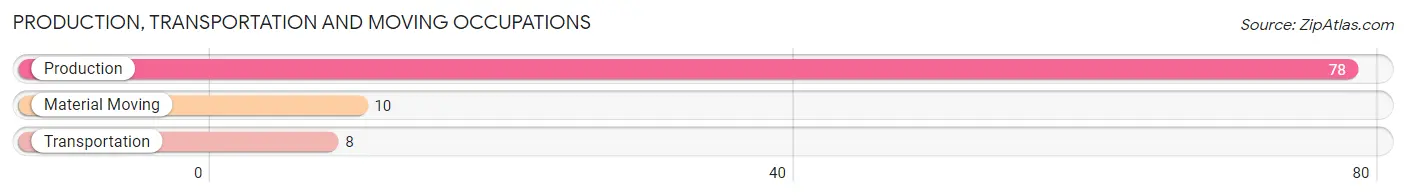
Production, Transportation and Moving Occupations by Sex
| Occupation | Male | Female |
| Production | 72 (92.3%) | 6 (7.7%) |
| Transportation | 8 (100.0%) | 0 (0.0%) |
| Material Moving | 8 (80.0%) | 2 (20.0%) |
| Total (Category) | 88 (91.7%) | 8 (8.3%) |
| Total (Overall) | 195 (53.0%) | 173 (47.0%) |
Employment Industries by Sex in Oneida Castle
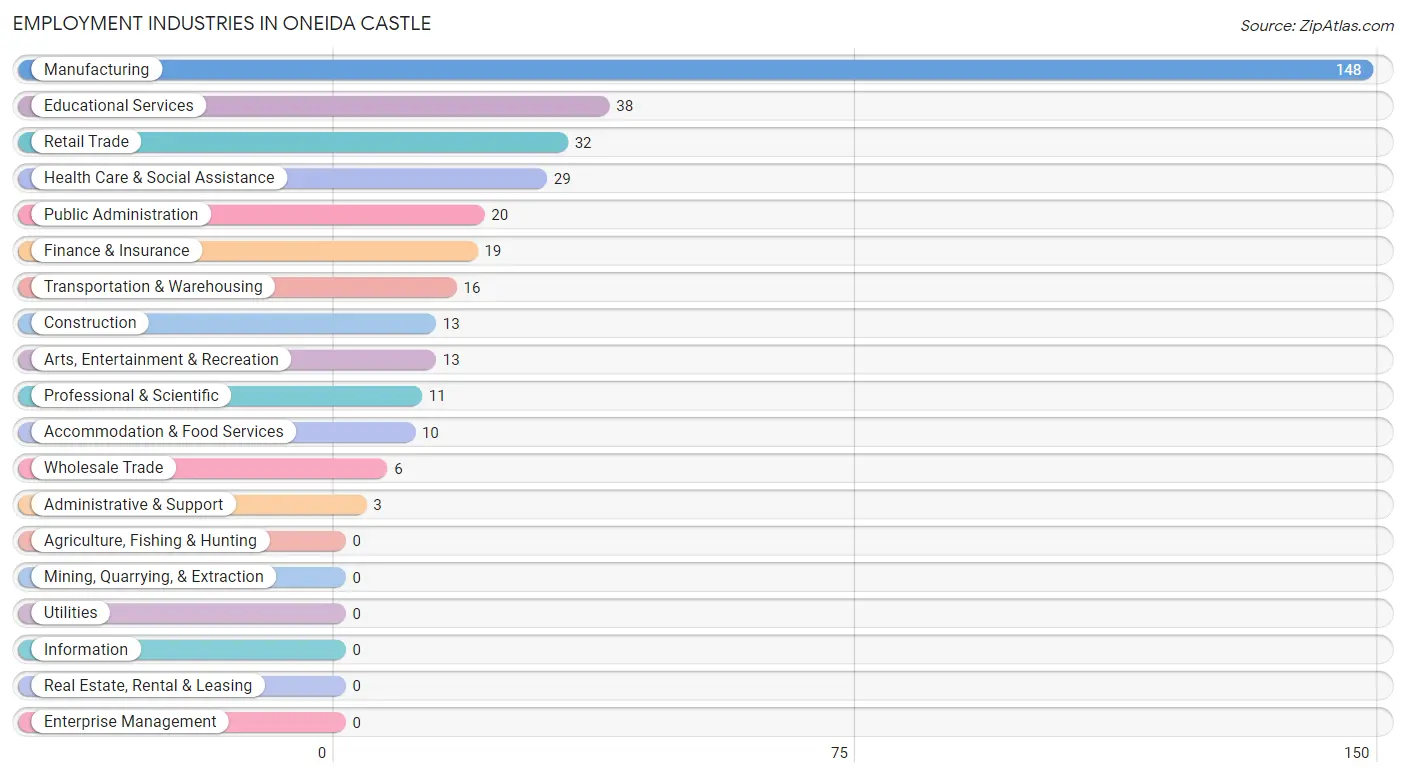
Employment Industries in Oneida Castle
The major employment industries in Oneida Castle include Manufacturing (148 | 40.2%), Educational Services (38 | 10.3%), Retail Trade (32 | 8.7%), Health Care & Social Assistance (29 | 7.9%), and Public Administration (20 | 5.4%).
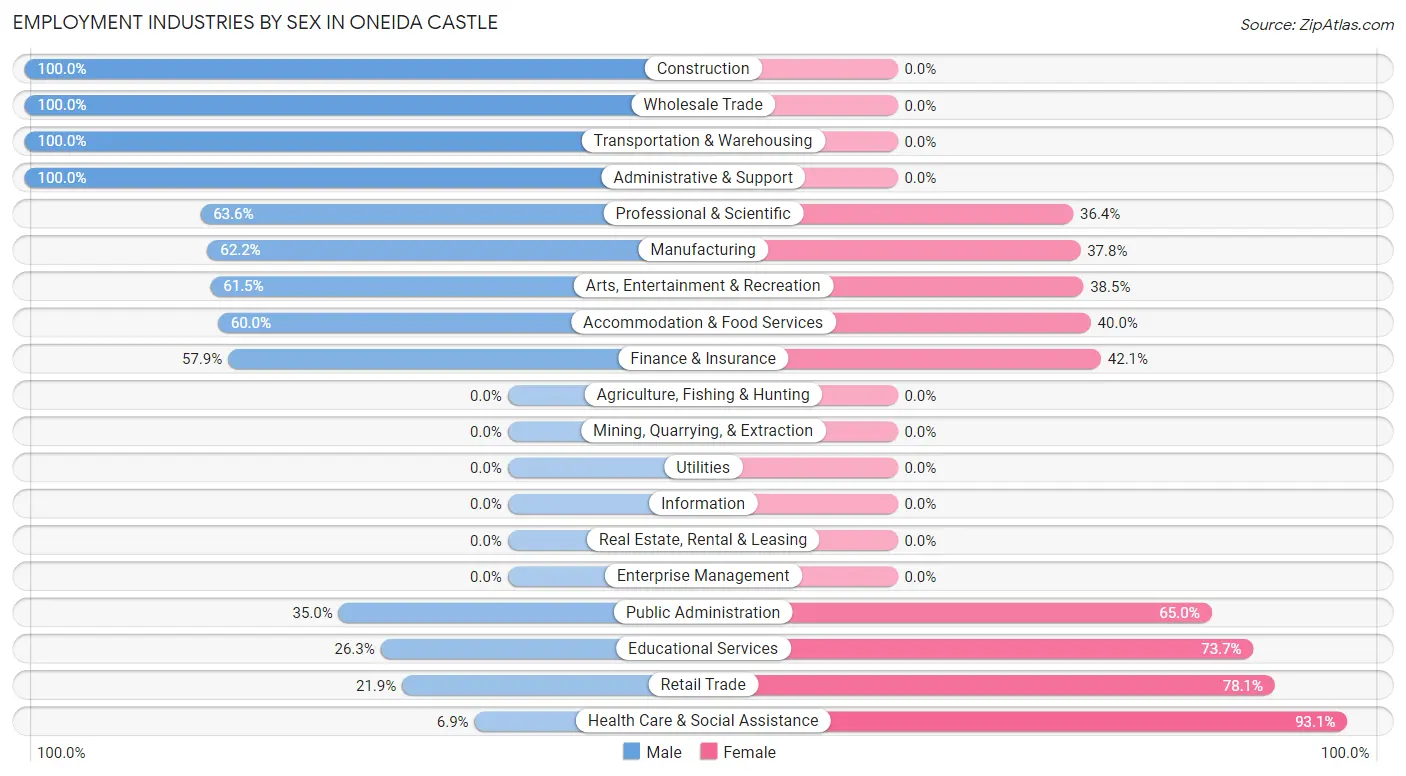
Employment Industries by Sex in Oneida Castle
The Oneida Castle industries that see more men than women are Construction (100.0%), Wholesale Trade (100.0%), and Transportation & Warehousing (100.0%), whereas the industries that tend to have a higher number of women are Health Care & Social Assistance (93.1%), Retail Trade (78.1%), and Educational Services (73.7%).
| Industry | Male | Female |
| Agriculture, Fishing & Hunting | 0 (0.0%) | 0 (0.0%) |
| Mining, Quarrying, & Extraction | 0 (0.0%) | 0 (0.0%) |
| Construction | 13 (100.0%) | 0 (0.0%) |
| Manufacturing | 92 (62.2%) | 56 (37.8%) |
| Wholesale Trade | 6 (100.0%) | 0 (0.0%) |
| Retail Trade | 7 (21.9%) | 25 (78.1%) |
| Transportation & Warehousing | 16 (100.0%) | 0 (0.0%) |
| Utilities | 0 (0.0%) | 0 (0.0%) |
| Information | 0 (0.0%) | 0 (0.0%) |
| Finance & Insurance | 11 (57.9%) | 8 (42.1%) |
| Real Estate, Rental & Leasing | 0 (0.0%) | 0 (0.0%) |
| Professional & Scientific | 7 (63.6%) | 4 (36.4%) |
| Enterprise Management | 0 (0.0%) | 0 (0.0%) |
| Administrative & Support | 3 (100.0%) | 0 (0.0%) |
| Educational Services | 10 (26.3%) | 28 (73.7%) |
| Health Care & Social Assistance | 2 (6.9%) | 27 (93.1%) |
| Arts, Entertainment & Recreation | 8 (61.5%) | 5 (38.5%) |
| Accommodation & Food Services | 6 (60.0%) | 4 (40.0%) |
| Public Administration | 7 (35.0%) | 13 (65.0%) |
| Total | 195 (53.0%) | 173 (47.0%) |
Education in Oneida Castle
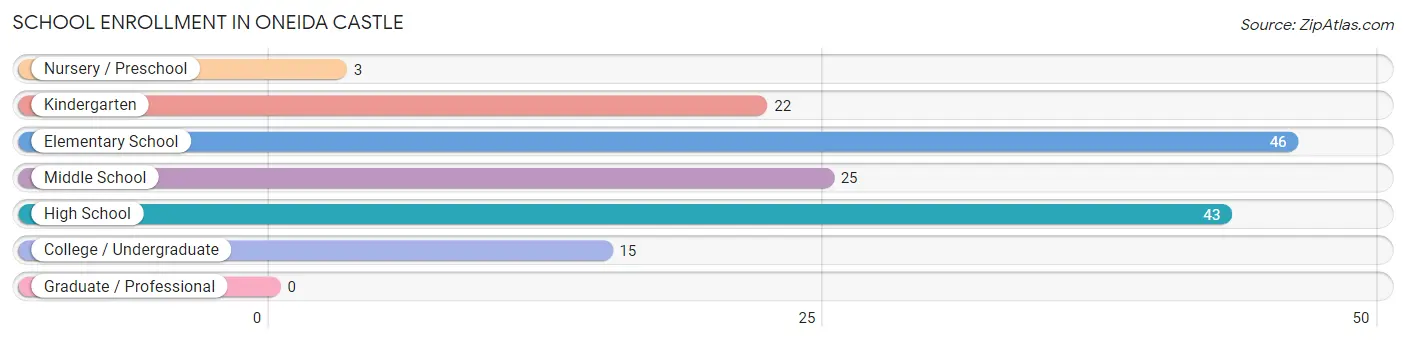
School Enrollment in Oneida Castle
The most common levels of schooling among the 154 students in Oneida Castle are elementary school (46 | 29.9%), high school (43 | 27.9%), and middle school (25 | 16.2%).
| School Level | # Students | % Students |
| Nursery / Preschool | 3 | 1.9% |
| Kindergarten | 22 | 14.3% |
| Elementary School | 46 | 29.9% |
| Middle School | 25 | 16.2% |
| High School | 43 | 27.9% |
| College / Undergraduate | 15 | 9.7% |
| Graduate / Professional | 0 | 0.0% |
| Total | 154 | 100.0% |
School Enrollment by Age by Funding Source in Oneida Castle
Out of a total of 154 students who are enrolled in schools in Oneida Castle, 13 (8.4%) attend a private institution, while the remaining 141 (91.6%) are enrolled in public schools. The age group of 25 to 34 year olds has the highest likelihood of being enrolled in private schools, with 7 (100.0% in the age bracket) enrolled. Conversely, the age group of 5 to 9 year old has the lowest likelihood of being enrolled in a private school, with 71 (100.0% in the age bracket) attending a public institution.
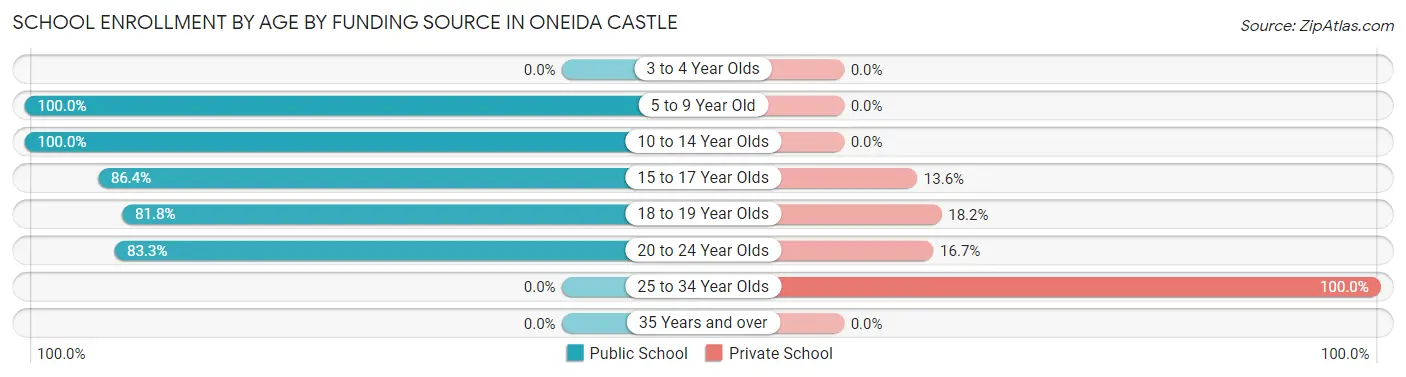
| Age Bracket | Public School | Private School |
| 3 to 4 Year Olds | 0 (0.0%) | 0 (0.0%) |
| 5 to 9 Year Old | 71 (100.0%) | 0 (0.0%) |
| 10 to 14 Year Olds | 37 (100.0%) | 0 (0.0%) |
| 15 to 17 Year Olds | 19 (86.4%) | 3 (13.6%) |
| 18 to 19 Year Olds | 9 (81.8%) | 2 (18.2%) |
| 20 to 24 Year Olds | 5 (83.3%) | 1 (16.7%) |
| 25 to 34 Year Olds | 0 (0.0%) | 7 (100.0%) |
| 35 Years and over | 0 (0.0%) | 0 (0.0%) |
| Total | 141 (91.6%) | 13 (8.4%) |
Educational Attainment by Field of Study in Oneida Castle
Education (32 | 27.4%), social sciences (16 | 13.7%), science & technology (16 | 13.7%), computers & mathematics (13 | 11.1%), and business (10 | 8.6%) are the most common fields of study among 117 individuals in Oneida Castle who have obtained a bachelor's degree or higher.
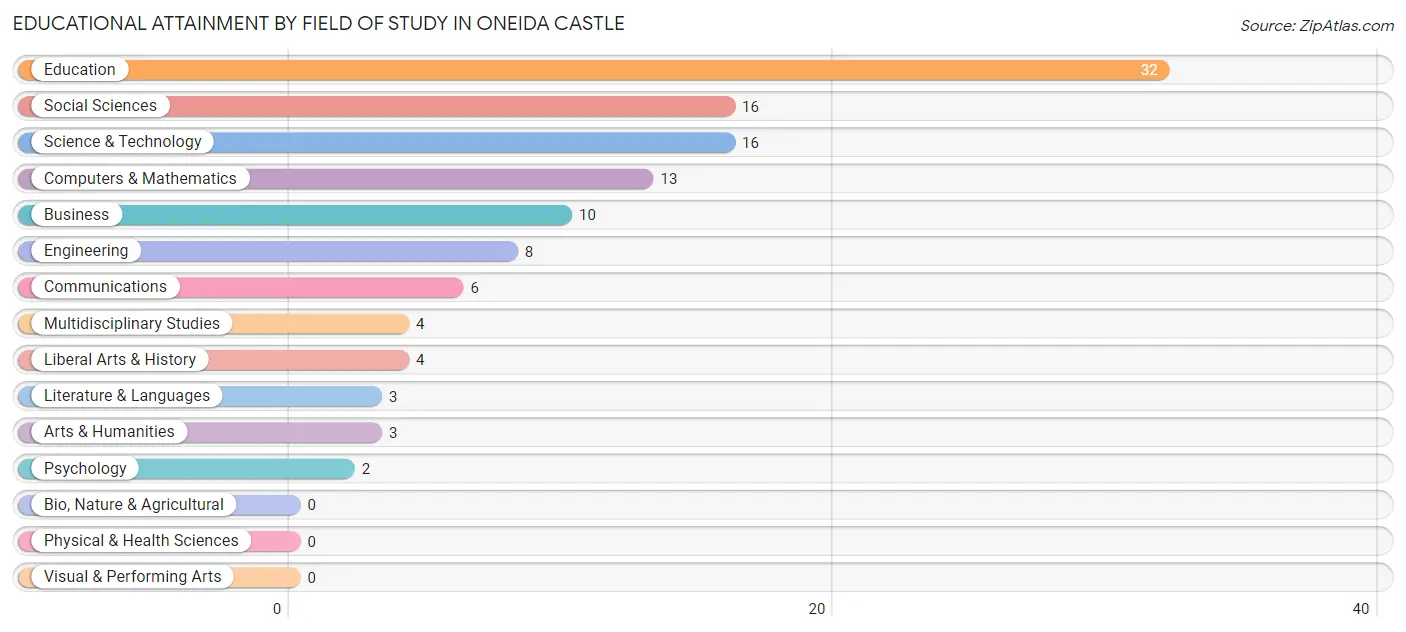
| Field of Study | # Graduates | % Graduates |
| Computers & Mathematics | 13 | 11.1% |
| Bio, Nature & Agricultural | 0 | 0.0% |
| Physical & Health Sciences | 0 | 0.0% |
| Psychology | 2 | 1.7% |
| Social Sciences | 16 | 13.7% |
| Engineering | 8 | 6.8% |
| Multidisciplinary Studies | 4 | 3.4% |
| Science & Technology | 16 | 13.7% |
| Business | 10 | 8.6% |
| Education | 32 | 27.4% |
| Literature & Languages | 3 | 2.6% |
| Liberal Arts & History | 4 | 3.4% |
| Visual & Performing Arts | 0 | 0.0% |
| Communications | 6 | 5.1% |
| Arts & Humanities | 3 | 2.6% |
| Total | 117 | 100.0% |
Transportation & Commute in Oneida Castle
Vehicle Availability by Sex in Oneida Castle
The most prevalent vehicle ownership categories in Oneida Castle are males with 2 vehicles (104, accounting for 54.2%) and females with 2 vehicles (66, making up 66.7%).
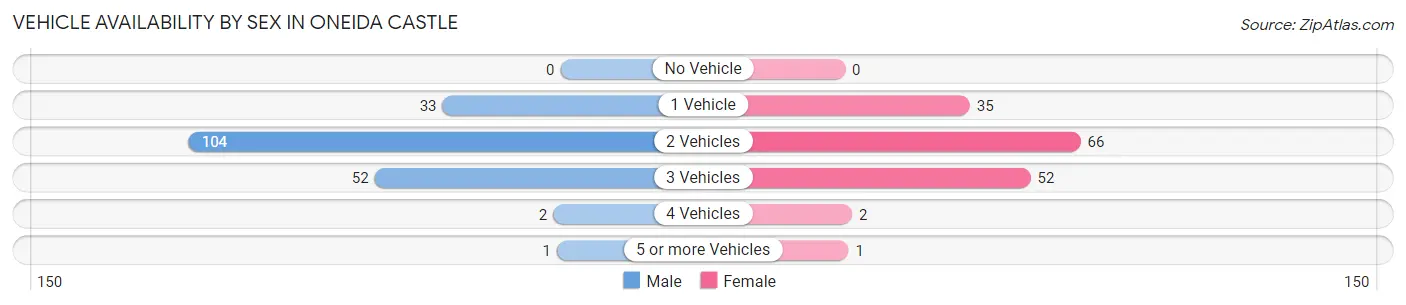
| Vehicles Available | Male | Female |
| No Vehicle | 0 (0.0%) | 0 (0.0%) |
| 1 Vehicle | 33 (17.2%) | 35 (22.4%) |
| 2 Vehicles | 104 (54.2%) | 66 (42.3%) |
| 3 Vehicles | 52 (27.1%) | 52 (33.3%) |
| 4 Vehicles | 2 (1.0%) | 2 (1.3%) |
| 5 or more Vehicles | 1 (0.5%) | 1 (0.6%) |
| Total | 192 (100.0%) | 156 (100.0%) |
Commute Time in Oneida Castle
The most frequently occuring commute durations in Oneida Castle are 5 to 9 minutes (86 commuters, 26.1%), 30 to 34 minutes (73 commuters, 22.2%), and 10 to 14 minutes (47 commuters, 14.3%).
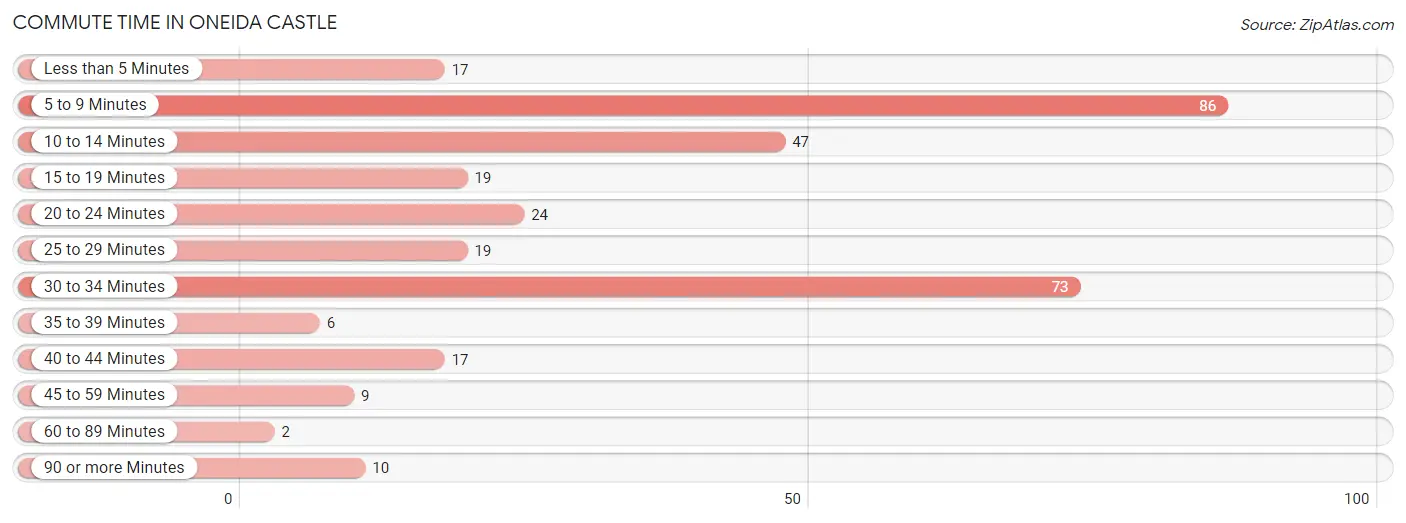
| Commute Time | # Commuters | % Commuters |
| Less than 5 Minutes | 17 | 5.2% |
| 5 to 9 Minutes | 86 | 26.1% |
| 10 to 14 Minutes | 47 | 14.3% |
| 15 to 19 Minutes | 19 | 5.8% |
| 20 to 24 Minutes | 24 | 7.3% |
| 25 to 29 Minutes | 19 | 5.8% |
| 30 to 34 Minutes | 73 | 22.2% |
| 35 to 39 Minutes | 6 | 1.8% |
| 40 to 44 Minutes | 17 | 5.2% |
| 45 to 59 Minutes | 9 | 2.7% |
| 60 to 89 Minutes | 2 | 0.6% |
| 90 or more Minutes | 10 | 3.0% |
Commute Time by Sex in Oneida Castle
The most common commute times in Oneida Castle are 30 to 34 minutes (63 commuters, 35.2%) for males and 5 to 9 minutes (75 commuters, 50.0%) for females.
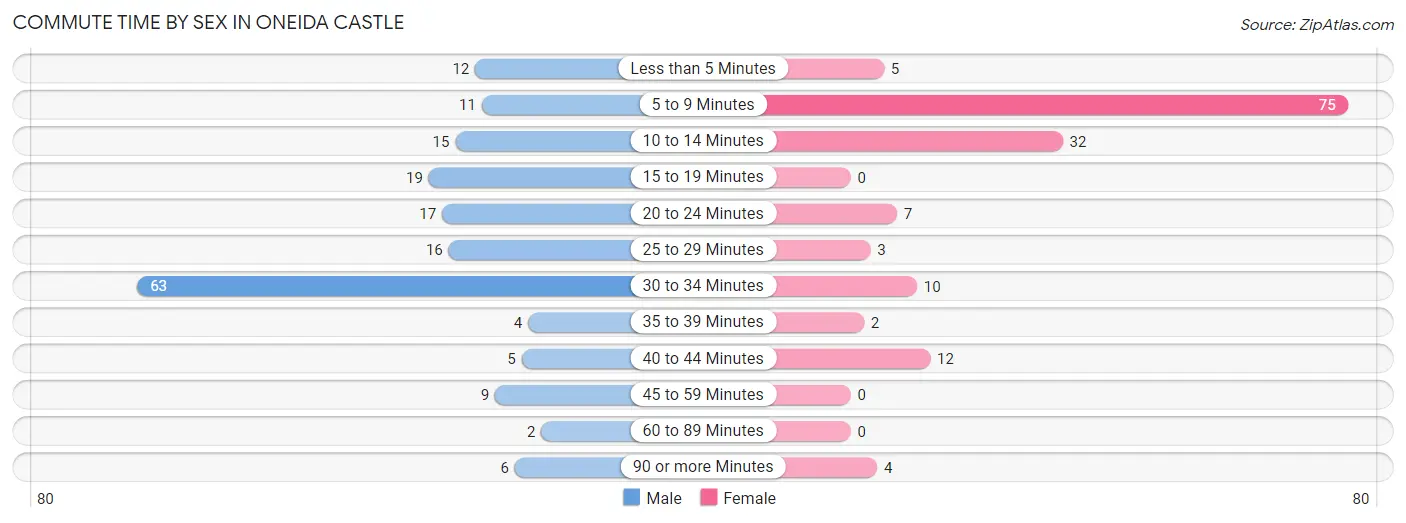
| Commute Time | Male | Female |
| Less than 5 Minutes | 12 (6.7%) | 5 (3.3%) |
| 5 to 9 Minutes | 11 (6.1%) | 75 (50.0%) |
| 10 to 14 Minutes | 15 (8.4%) | 32 (21.3%) |
| 15 to 19 Minutes | 19 (10.6%) | 0 (0.0%) |
| 20 to 24 Minutes | 17 (9.5%) | 7 (4.7%) |
| 25 to 29 Minutes | 16 (8.9%) | 3 (2.0%) |
| 30 to 34 Minutes | 63 (35.2%) | 10 (6.7%) |
| 35 to 39 Minutes | 4 (2.2%) | 2 (1.3%) |
| 40 to 44 Minutes | 5 (2.8%) | 12 (8.0%) |
| 45 to 59 Minutes | 9 (5.0%) | 0 (0.0%) |
| 60 to 89 Minutes | 2 (1.1%) | 0 (0.0%) |
| 90 or more Minutes | 6 (3.4%) | 4 (2.7%) |
Time of Departure to Work by Sex in Oneida Castle
The most frequent times of departure to work in Oneida Castle are 12:00 AM to 4:59 AM (53, 29.6%) for males and 7:30 AM to 7:59 AM (66, 44.0%) for females.
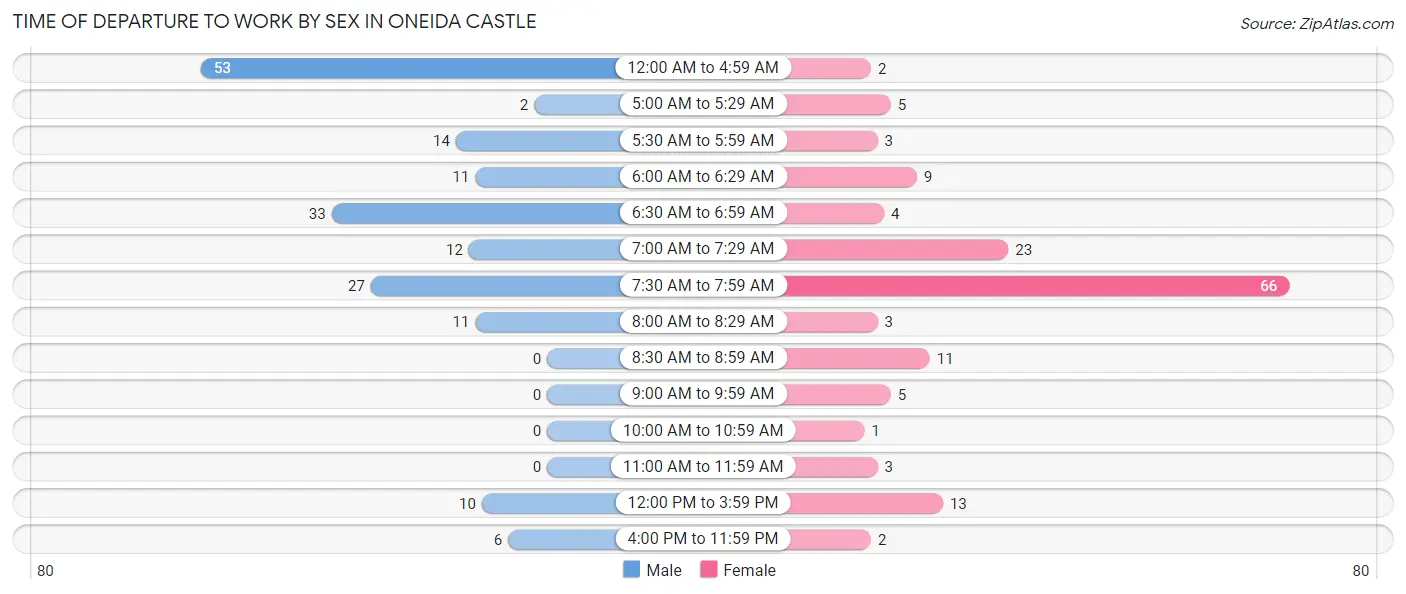
| Time of Departure | Male | Female |
| 12:00 AM to 4:59 AM | 53 (29.6%) | 2 (1.3%) |
| 5:00 AM to 5:29 AM | 2 (1.1%) | 5 (3.3%) |
| 5:30 AM to 5:59 AM | 14 (7.8%) | 3 (2.0%) |
| 6:00 AM to 6:29 AM | 11 (6.1%) | 9 (6.0%) |
| 6:30 AM to 6:59 AM | 33 (18.4%) | 4 (2.7%) |
| 7:00 AM to 7:29 AM | 12 (6.7%) | 23 (15.3%) |
| 7:30 AM to 7:59 AM | 27 (15.1%) | 66 (44.0%) |
| 8:00 AM to 8:29 AM | 11 (6.1%) | 3 (2.0%) |
| 8:30 AM to 8:59 AM | 0 (0.0%) | 11 (7.3%) |
| 9:00 AM to 9:59 AM | 0 (0.0%) | 5 (3.3%) |
| 10:00 AM to 10:59 AM | 0 (0.0%) | 1 (0.7%) |
| 11:00 AM to 11:59 AM | 0 (0.0%) | 3 (2.0%) |
| 12:00 PM to 3:59 PM | 10 (5.6%) | 13 (8.7%) |
| 4:00 PM to 11:59 PM | 6 (3.4%) | 2 (1.3%) |
| Total | 179 (100.0%) | 150 (100.0%) |
Housing Occupancy in Oneida Castle
Occupancy by Ownership in Oneida Castle
Of the total 307 dwellings in Oneida Castle, owner-occupied units account for 243 (79.1%), while renter-occupied units make up 64 (20.8%).
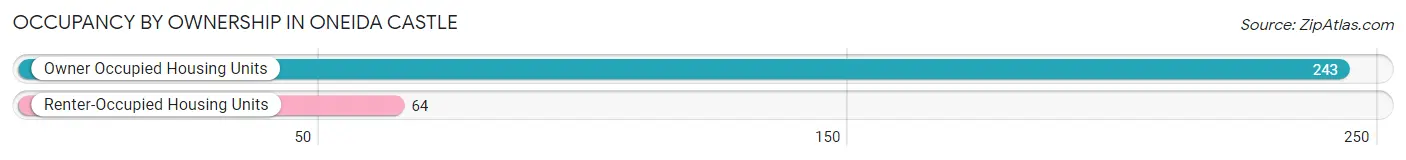
| Occupancy | # Housing Units | % Housing Units |
| Owner Occupied Housing Units | 243 | 79.1% |
| Renter-Occupied Housing Units | 64 | 20.8% |
| Total Occupied Housing Units | 307 | 100.0% |
Occupancy by Household Size in Oneida Castle
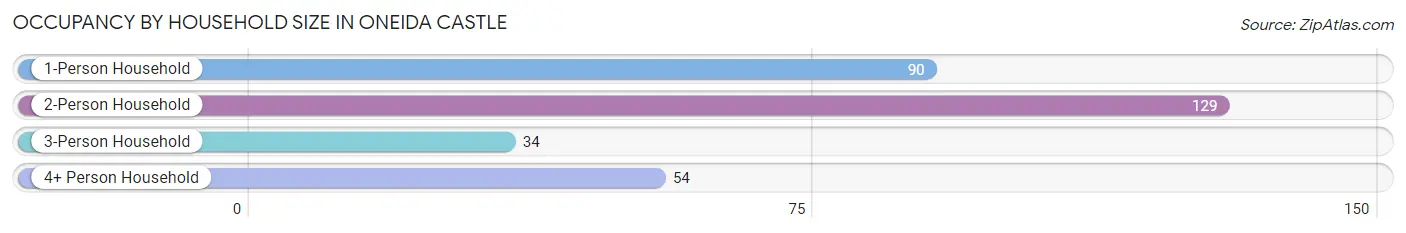
| Household Size | # Housing Units | % Housing Units |
| 1-Person Household | 90 | 29.3% |
| 2-Person Household | 129 | 42.0% |
| 3-Person Household | 34 | 11.1% |
| 4+ Person Household | 54 | 17.6% |
| Total Housing Units | 307 | 100.0% |
Occupancy by Ownership by Household Size in Oneida Castle
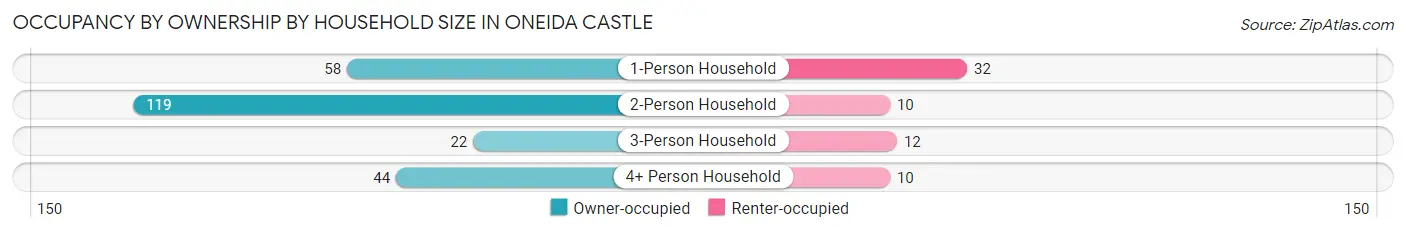
| Household Size | Owner-occupied | Renter-occupied |
| 1-Person Household | 58 (64.4%) | 32 (35.6%) |
| 2-Person Household | 119 (92.2%) | 10 (7.7%) |
| 3-Person Household | 22 (64.7%) | 12 (35.3%) |
| 4+ Person Household | 44 (81.5%) | 10 (18.5%) |
| Total Housing Units | 243 (79.1%) | 64 (20.8%) |
Occupancy by Educational Attainment in Oneida Castle
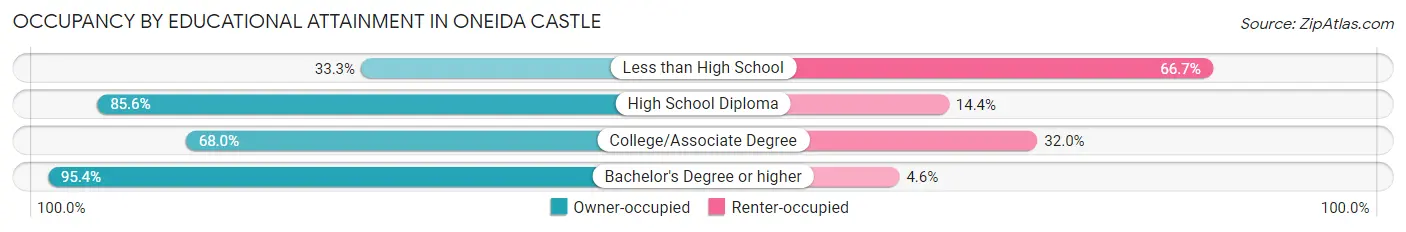
| Household Size | Owner-occupied | Renter-occupied |
| Less than High School | 3 (33.3%) | 6 (66.7%) |
| High School Diploma | 95 (85.6%) | 16 (14.4%) |
| College/Associate Degree | 83 (68.0%) | 39 (32.0%) |
| Bachelor's Degree or higher | 62 (95.4%) | 3 (4.6%) |
Occupancy by Age of Householder in Oneida Castle
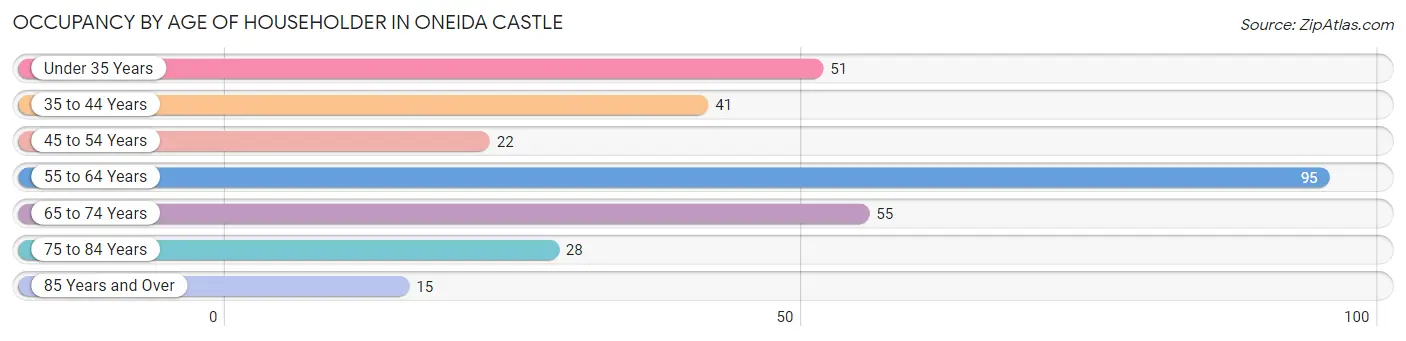
| Age Bracket | # Households | % Households |
| Under 35 Years | 51 | 16.6% |
| 35 to 44 Years | 41 | 13.4% |
| 45 to 54 Years | 22 | 7.2% |
| 55 to 64 Years | 95 | 30.9% |
| 65 to 74 Years | 55 | 17.9% |
| 75 to 84 Years | 28 | 9.1% |
| 85 Years and Over | 15 | 4.9% |
| Total | 307 | 100.0% |
Housing Finances in Oneida Castle
Median Income by Occupancy in Oneida Castle
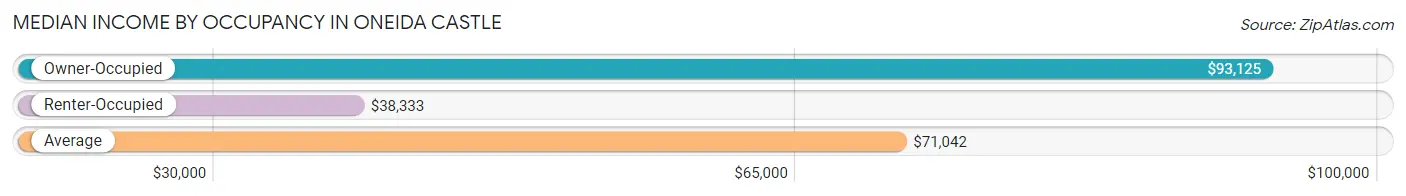
| Occupancy Type | # Households | Median Income |
| Owner-Occupied | 243 (79.1%) | $93,125 |
| Renter-Occupied | 64 (20.8%) | $38,333 |
| Average | 307 (100.0%) | $71,042 |
Occupancy by Householder Income Bracket in Oneida Castle
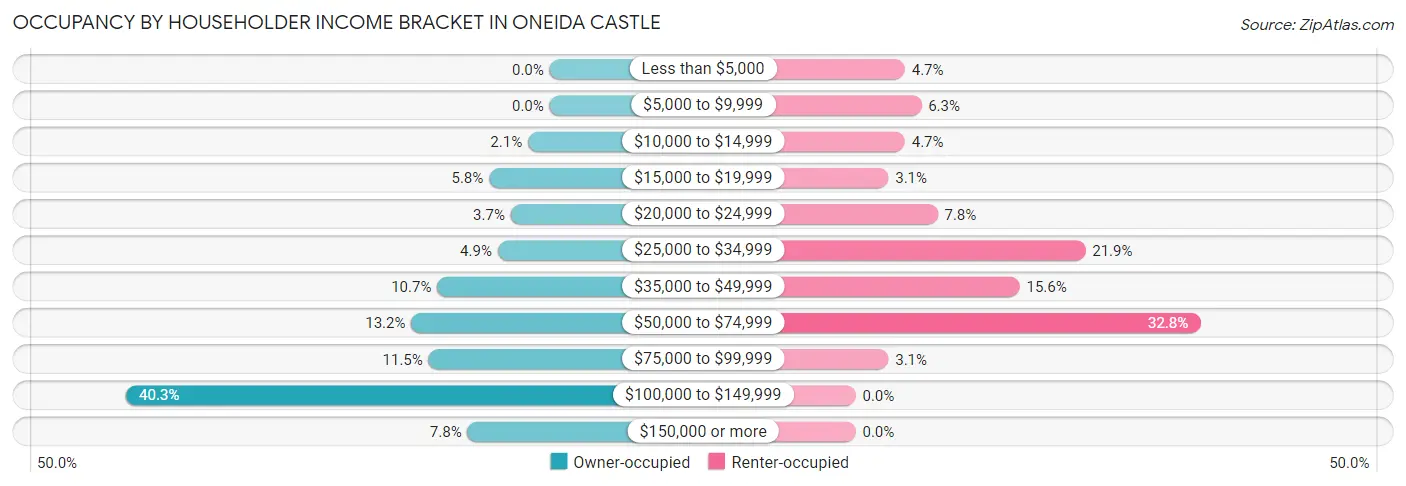
| Income Bracket | Owner-occupied | Renter-occupied |
| Less than $5,000 | 0 (0.0%) | 3 (4.7%) |
| $5,000 to $9,999 | 0 (0.0%) | 4 (6.2%) |
| $10,000 to $14,999 | 5 (2.1%) | 3 (4.7%) |
| $15,000 to $19,999 | 14 (5.8%) | 2 (3.1%) |
| $20,000 to $24,999 | 9 (3.7%) | 5 (7.8%) |
| $25,000 to $34,999 | 12 (4.9%) | 14 (21.9%) |
| $35,000 to $49,999 | 26 (10.7%) | 10 (15.6%) |
| $50,000 to $74,999 | 32 (13.2%) | 21 (32.8%) |
| $75,000 to $99,999 | 28 (11.5%) | 2 (3.1%) |
| $100,000 to $149,999 | 98 (40.3%) | 0 (0.0%) |
| $150,000 or more | 19 (7.8%) | 0 (0.0%) |
| Total | 243 (100.0%) | 64 (100.0%) |
Monthly Housing Cost Tiers in Oneida Castle
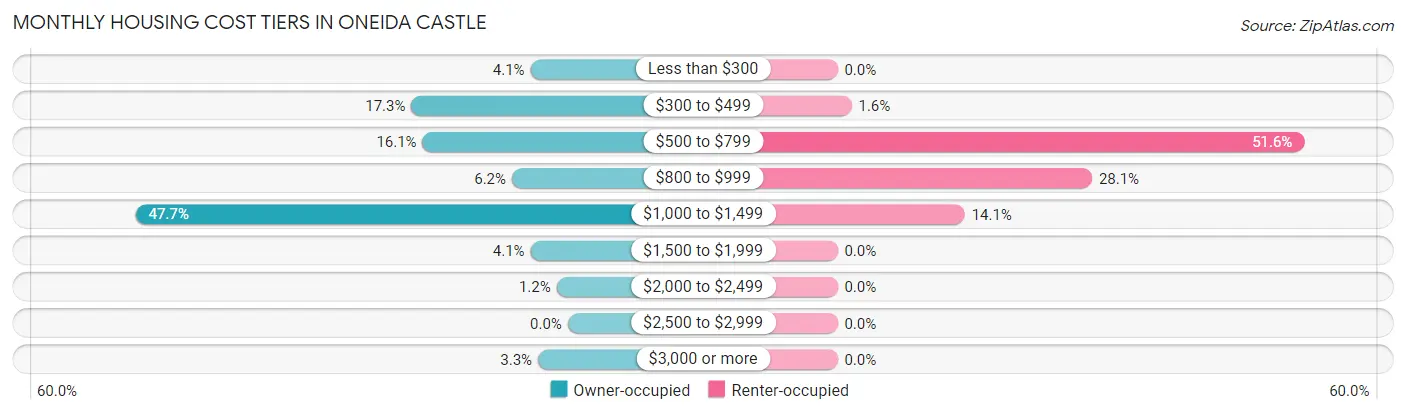
| Monthly Cost | Owner-occupied | Renter-occupied |
| Less than $300 | 10 (4.1%) | 0 (0.0%) |
| $300 to $499 | 42 (17.3%) | 1 (1.6%) |
| $500 to $799 | 39 (16.1%) | 33 (51.6%) |
| $800 to $999 | 15 (6.2%) | 18 (28.1%) |
| $1,000 to $1,499 | 116 (47.7%) | 9 (14.1%) |
| $1,500 to $1,999 | 10 (4.1%) | 0 (0.0%) |
| $2,000 to $2,499 | 3 (1.2%) | 0 (0.0%) |
| $2,500 to $2,999 | 0 (0.0%) | 0 (0.0%) |
| $3,000 or more | 8 (3.3%) | 0 (0.0%) |
| Total | 243 (100.0%) | 64 (100.0%) |
Physical Housing Characteristics in Oneida Castle
Housing Structures in Oneida Castle
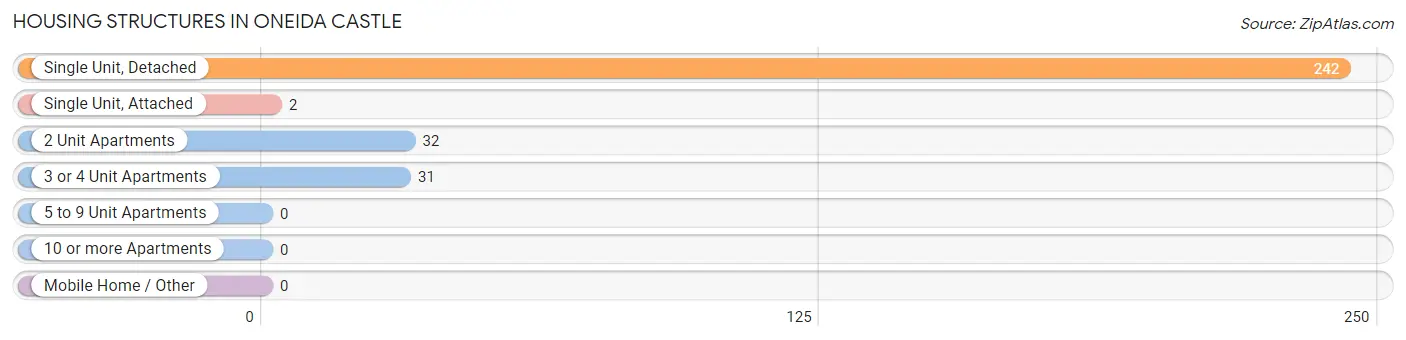
| Structure Type | # Housing Units | % Housing Units |
| Single Unit, Detached | 242 | 78.8% |
| Single Unit, Attached | 2 | 0.6% |
| 2 Unit Apartments | 32 | 10.4% |
| 3 or 4 Unit Apartments | 31 | 10.1% |
| 5 to 9 Unit Apartments | 0 | 0.0% |
| 10 or more Apartments | 0 | 0.0% |
| Mobile Home / Other | 0 | 0.0% |
| Total | 307 | 100.0% |
Housing Structures by Occupancy in Oneida Castle
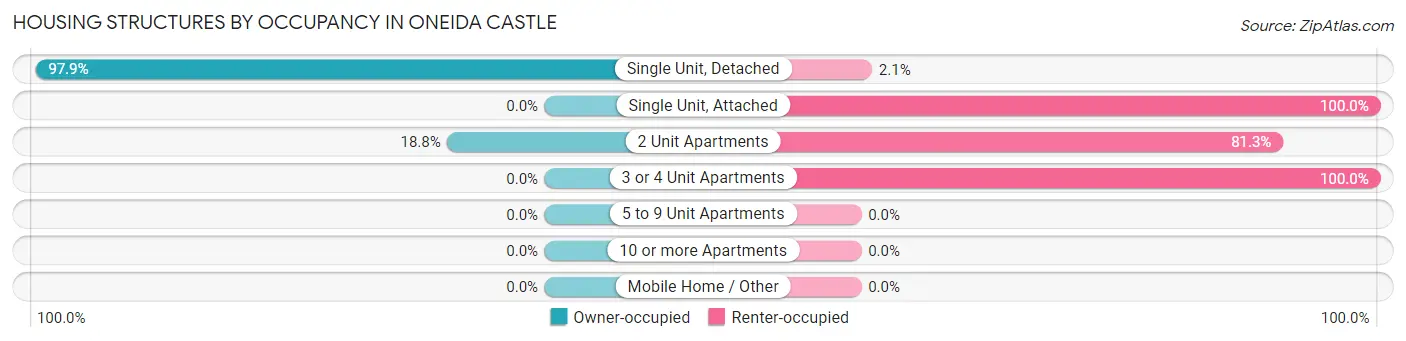
| Structure Type | Owner-occupied | Renter-occupied |
| Single Unit, Detached | 237 (97.9%) | 5 (2.1%) |
| Single Unit, Attached | 0 (0.0%) | 2 (100.0%) |
| 2 Unit Apartments | 6 (18.8%) | 26 (81.2%) |
| 3 or 4 Unit Apartments | 0 (0.0%) | 31 (100.0%) |
| 5 to 9 Unit Apartments | 0 (0.0%) | 0 (0.0%) |
| 10 or more Apartments | 0 (0.0%) | 0 (0.0%) |
| Mobile Home / Other | 0 (0.0%) | 0 (0.0%) |
| Total | 243 (79.1%) | 64 (20.8%) |
Housing Structures by Number of Rooms in Oneida Castle
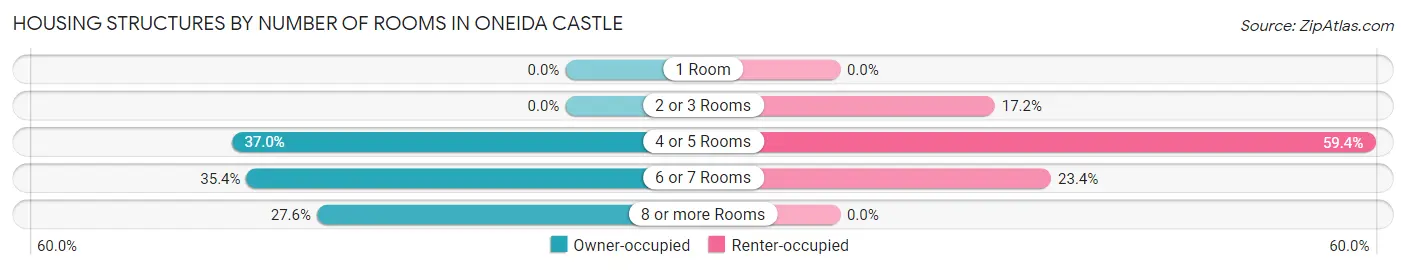
| Number of Rooms | Owner-occupied | Renter-occupied |
| 1 Room | 0 (0.0%) | 0 (0.0%) |
| 2 or 3 Rooms | 0 (0.0%) | 11 (17.2%) |
| 4 or 5 Rooms | 90 (37.0%) | 38 (59.4%) |
| 6 or 7 Rooms | 86 (35.4%) | 15 (23.4%) |
| 8 or more Rooms | 67 (27.6%) | 0 (0.0%) |
| Total | 243 (100.0%) | 64 (100.0%) |
Housing Structure by Heating Type in Oneida Castle
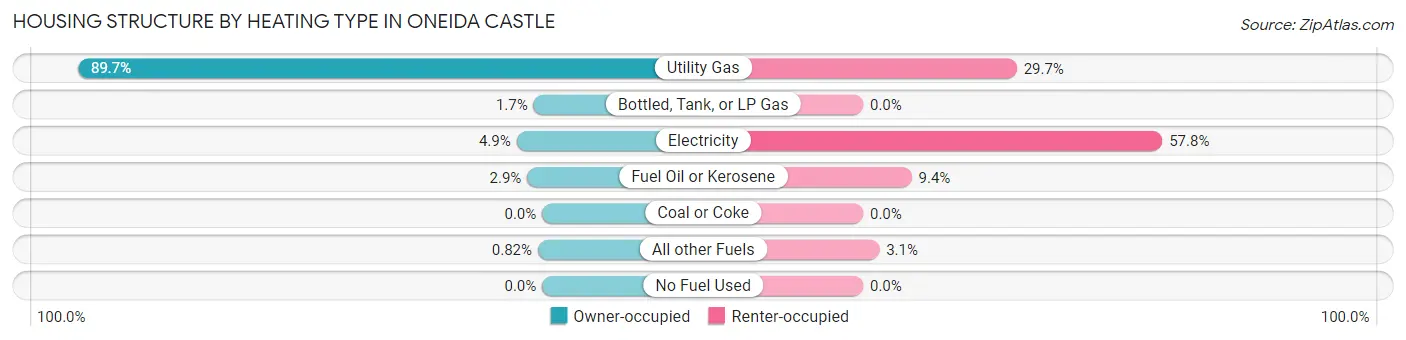
| Heating Type | Owner-occupied | Renter-occupied |
| Utility Gas | 218 (89.7%) | 19 (29.7%) |
| Bottled, Tank, or LP Gas | 4 (1.7%) | 0 (0.0%) |
| Electricity | 12 (4.9%) | 37 (57.8%) |
| Fuel Oil or Kerosene | 7 (2.9%) | 6 (9.4%) |
| Coal or Coke | 0 (0.0%) | 0 (0.0%) |
| All other Fuels | 2 (0.8%) | 2 (3.1%) |
| No Fuel Used | 0 (0.0%) | 0 (0.0%) |
| Total | 243 (100.0%) | 64 (100.0%) |
Household Vehicle Usage in Oneida Castle
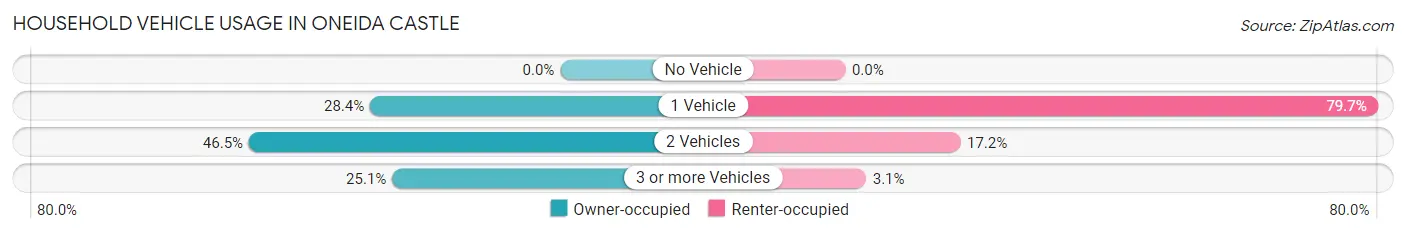
| Vehicles per Household | Owner-occupied | Renter-occupied |
| No Vehicle | 0 (0.0%) | 0 (0.0%) |
| 1 Vehicle | 69 (28.4%) | 51 (79.7%) |
| 2 Vehicles | 113 (46.5%) | 11 (17.2%) |
| 3 or more Vehicles | 61 (25.1%) | 2 (3.1%) |
| Total | 243 (100.0%) | 64 (100.0%) |
Real Estate & Mortgages in Oneida Castle
Real Estate and Mortgage Overview in Oneida Castle
| Characteristic | Without Mortgage | With Mortgage |
| Housing Units | 90 | 153 |
| Median Property Value | $124,300 | $133,100 |
| Median Household Income | $47,778 | $19 |
| Monthly Housing Costs | $478 | $8 |
| Real Estate Taxes | $2,538 | $4 |
Property Value by Mortgage Status in Oneida Castle
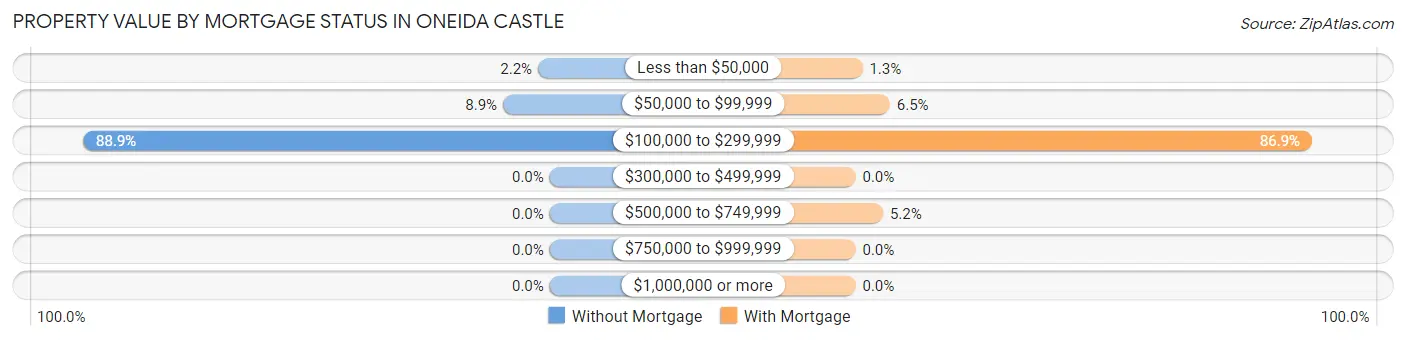
| Property Value | Without Mortgage | With Mortgage |
| Less than $50,000 | 2 (2.2%) | 2 (1.3%) |
| $50,000 to $99,999 | 8 (8.9%) | 10 (6.5%) |
| $100,000 to $299,999 | 80 (88.9%) | 133 (86.9%) |
| $300,000 to $499,999 | 0 (0.0%) | 0 (0.0%) |
| $500,000 to $749,999 | 0 (0.0%) | 8 (5.2%) |
| $750,000 to $999,999 | 0 (0.0%) | 0 (0.0%) |
| $1,000,000 or more | 0 (0.0%) | 0 (0.0%) |
| Total | 90 (100.0%) | 153 (100.0%) |
Household Income by Mortgage Status in Oneida Castle
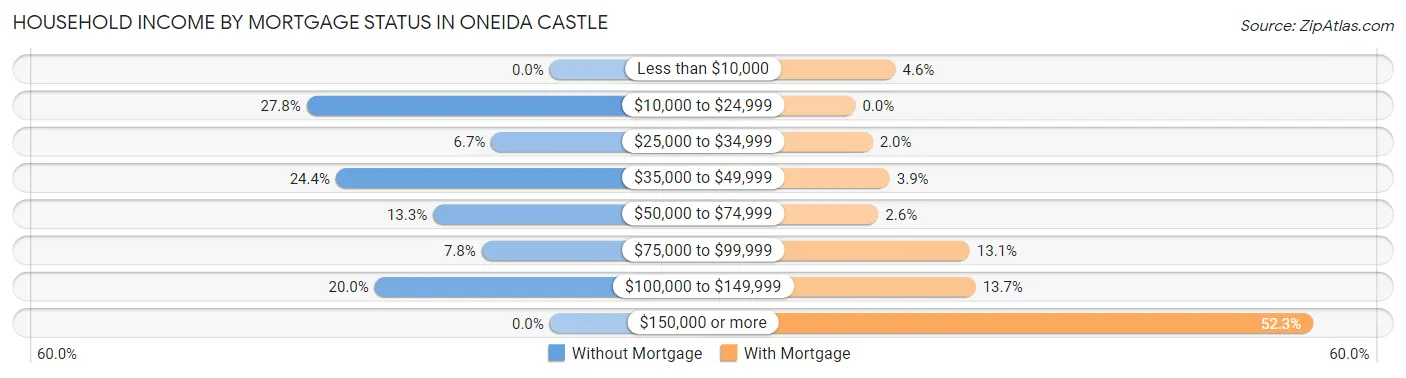
| Household Income | Without Mortgage | With Mortgage |
| Less than $10,000 | 0 (0.0%) | 7 (4.6%) |
| $10,000 to $24,999 | 25 (27.8%) | 0 (0.0%) |
| $25,000 to $34,999 | 6 (6.7%) | 3 (2.0%) |
| $35,000 to $49,999 | 22 (24.4%) | 6 (3.9%) |
| $50,000 to $74,999 | 12 (13.3%) | 4 (2.6%) |
| $75,000 to $99,999 | 7 (7.8%) | 20 (13.1%) |
| $100,000 to $149,999 | 18 (20.0%) | 21 (13.7%) |
| $150,000 or more | 0 (0.0%) | 80 (52.3%) |
| Total | 90 (100.0%) | 153 (100.0%) |
Property Value to Household Income Ratio in Oneida Castle
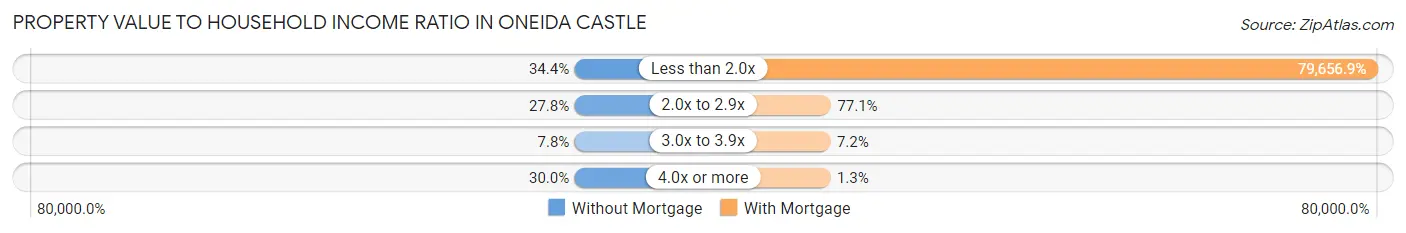
| Value-to-Income Ratio | Without Mortgage | With Mortgage |
| Less than 2.0x | 31 (34.4%) | 121,875 (79,656.9%) |
| 2.0x to 2.9x | 25 (27.8%) | 118 (77.1%) |
| 3.0x to 3.9x | 7 (7.8%) | 11 (7.2%) |
| 4.0x or more | 27 (30.0%) | 2 (1.3%) |
| Total | 90 (100.0%) | 153 (100.0%) |
Real Estate Taxes by Mortgage Status in Oneida Castle
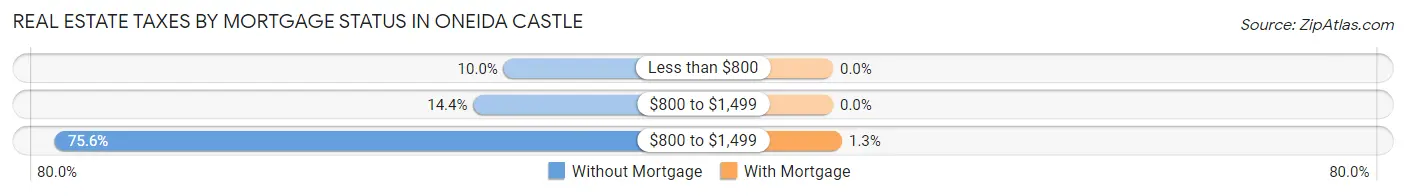
| Property Taxes | Without Mortgage | With Mortgage |
| Less than $800 | 9 (10.0%) | 0 (0.0%) |
| $800 to $1,499 | 13 (14.4%) | 0 (0.0%) |
| $800 to $1,499 | 68 (75.6%) | 2 (1.3%) |
| Total | 90 (100.0%) | 153 (100.0%) |
Health & Disability in Oneida Castle
Health Insurance Coverage by Age in Oneida Castle
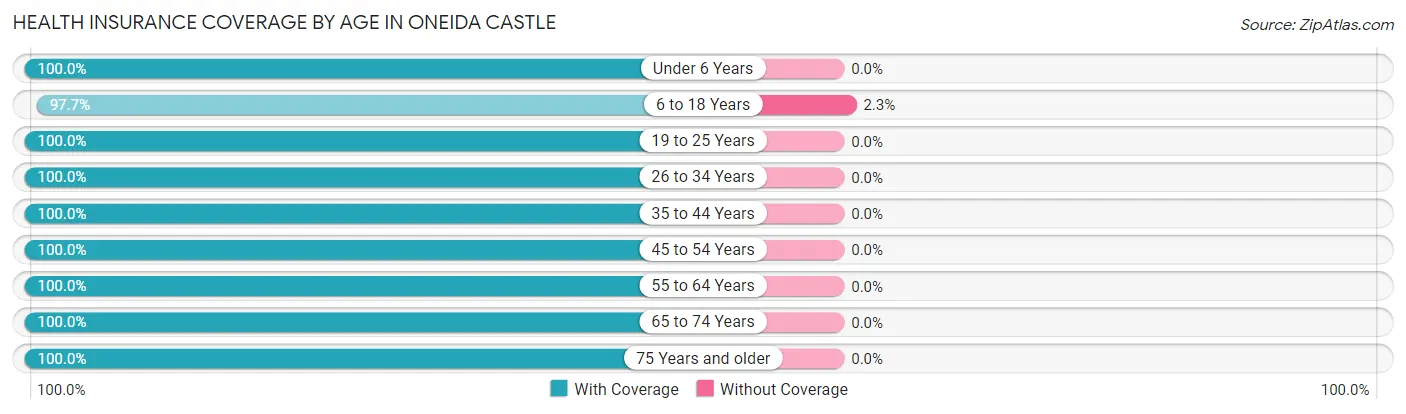
| Age Bracket | With Coverage | Without Coverage |
| Under 6 Years | 30 (100.0%) | 0 (0.0%) |
| 6 to 18 Years | 129 (97.7%) | 3 (2.3%) |
| 19 to 25 Years | 17 (100.0%) | 0 (0.0%) |
| 26 to 34 Years | 71 (100.0%) | 0 (0.0%) |
| 35 to 44 Years | 79 (100.0%) | 0 (0.0%) |
| 45 to 54 Years | 87 (100.0%) | 0 (0.0%) |
| 55 to 64 Years | 132 (100.0%) | 0 (0.0%) |
| 65 to 74 Years | 94 (100.0%) | 0 (0.0%) |
| 75 Years and older | 57 (100.0%) | 0 (0.0%) |
| Total | 696 (99.6%) | 3 (0.4%) |
Health Insurance Coverage by Citizenship Status in Oneida Castle
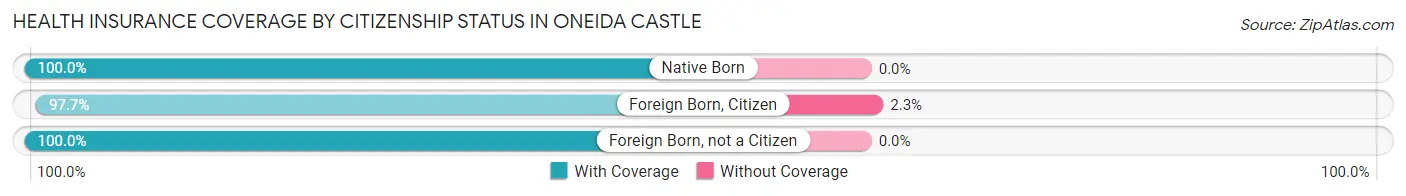
| Citizenship Status | With Coverage | Without Coverage |
| Native Born | 30 (100.0%) | 0 (0.0%) |
| Foreign Born, Citizen | 129 (97.7%) | 3 (2.3%) |
| Foreign Born, not a Citizen | 17 (100.0%) | 0 (0.0%) |
Health Insurance Coverage by Household Income in Oneida Castle
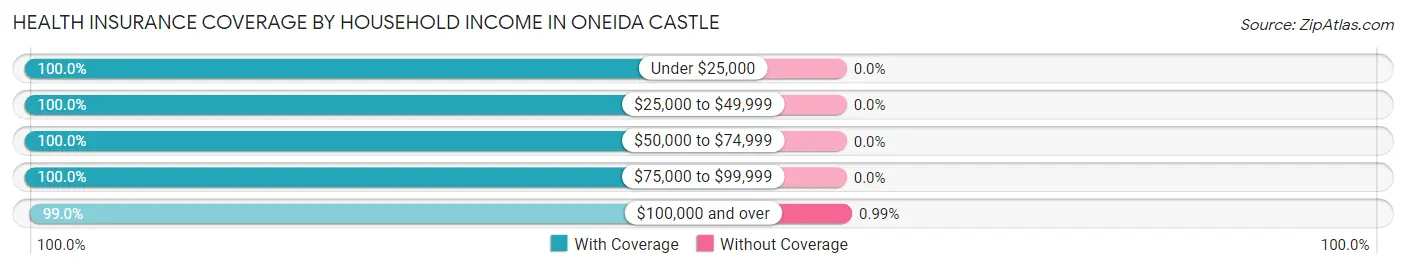
| Household Income | With Coverage | Without Coverage |
| Under $25,000 | 77 (100.0%) | 0 (0.0%) |
| $25,000 to $49,999 | 99 (100.0%) | 0 (0.0%) |
| $50,000 to $74,999 | 131 (100.0%) | 0 (0.0%) |
| $75,000 to $99,999 | 89 (100.0%) | 0 (0.0%) |
| $100,000 and over | 300 (99.0%) | 3 (1.0%) |
Public vs Private Health Insurance Coverage by Age in Oneida Castle
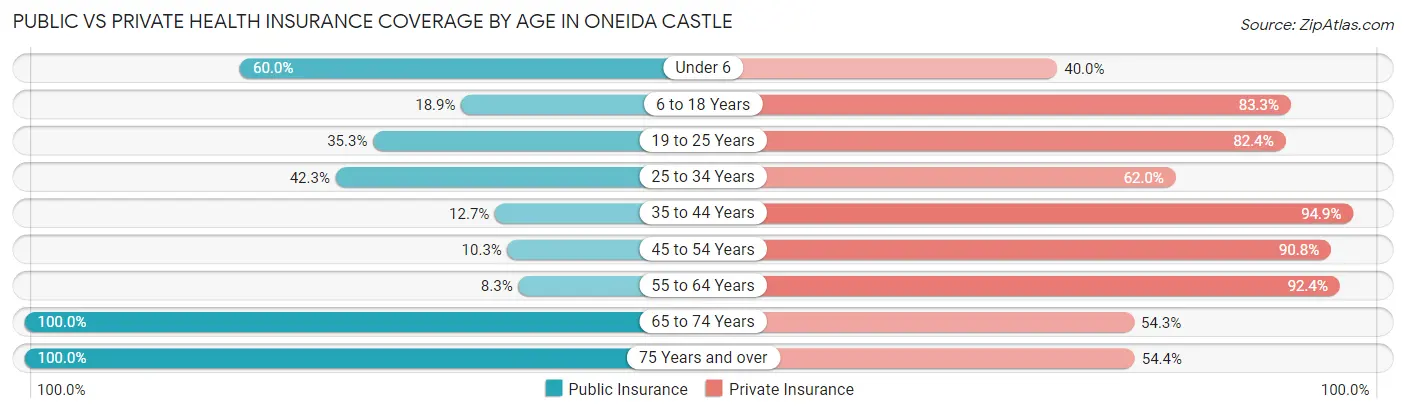
| Age Bracket | Public Insurance | Private Insurance |
| Under 6 | 18 (60.0%) | 12 (40.0%) |
| 6 to 18 Years | 25 (18.9%) | 110 (83.3%) |
| 19 to 25 Years | 6 (35.3%) | 14 (82.4%) |
| 25 to 34 Years | 30 (42.2%) | 44 (62.0%) |
| 35 to 44 Years | 10 (12.7%) | 75 (94.9%) |
| 45 to 54 Years | 9 (10.3%) | 79 (90.8%) |
| 55 to 64 Years | 11 (8.3%) | 122 (92.4%) |
| 65 to 74 Years | 94 (100.0%) | 51 (54.3%) |
| 75 Years and over | 57 (100.0%) | 31 (54.4%) |
| Total | 260 (37.2%) | 538 (77.0%) |
Disability Status by Sex by Age in Oneida Castle
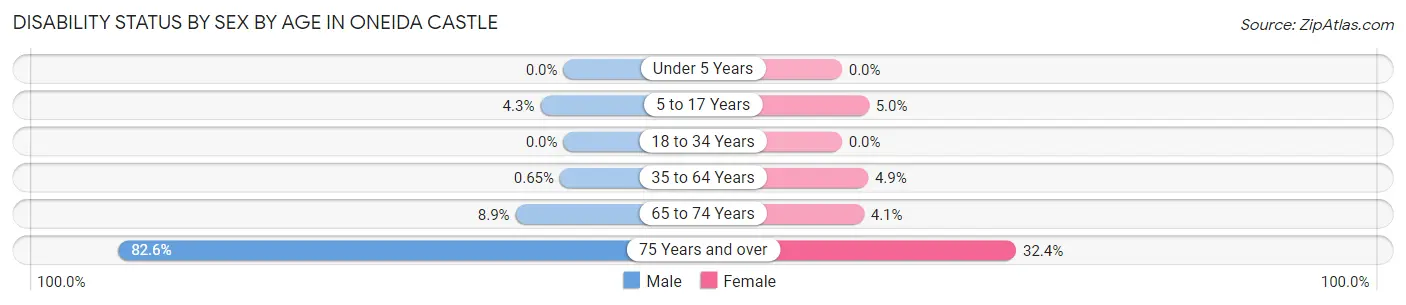
| Age Bracket | Male | Female |
| Under 5 Years | 0 (0.0%) | 0 (0.0%) |
| 5 to 17 Years | 3 (4.3%) | 3 (5.0%) |
| 18 to 34 Years | 0 (0.0%) | 0 (0.0%) |
| 35 to 64 Years | 1 (0.6%) | 7 (4.9%) |
| 65 to 74 Years | 4 (8.9%) | 2 (4.1%) |
| 75 Years and over | 19 (82.6%) | 11 (32.4%) |
Disability Class by Sex by Age in Oneida Castle
Disability Class: Hearing Difficulty
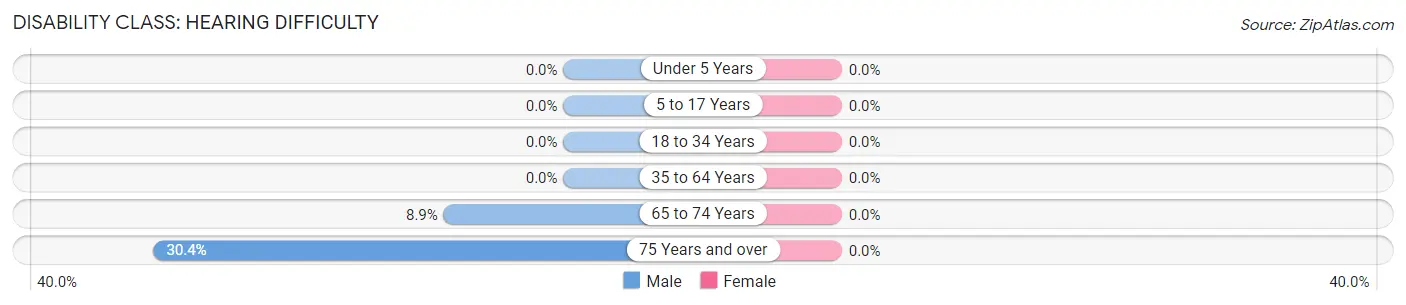
| Age Bracket | Male | Female |
| Under 5 Years | 0 (0.0%) | 0 (0.0%) |
| 5 to 17 Years | 0 (0.0%) | 0 (0.0%) |
| 18 to 34 Years | 0 (0.0%) | 0 (0.0%) |
| 35 to 64 Years | 0 (0.0%) | 0 (0.0%) |
| 65 to 74 Years | 4 (8.9%) | 0 (0.0%) |
| 75 Years and over | 7 (30.4%) | 0 (0.0%) |
Disability Class: Vision Difficulty
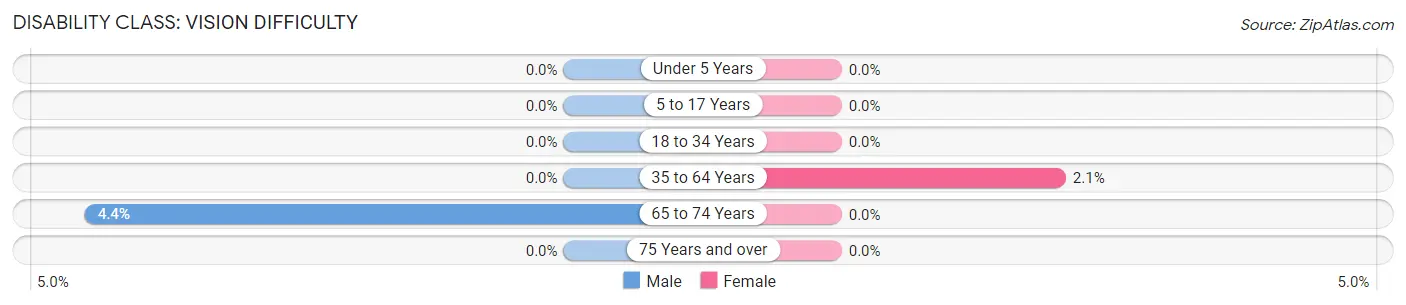
| Age Bracket | Male | Female |
| Under 5 Years | 0 (0.0%) | 0 (0.0%) |
| 5 to 17 Years | 0 (0.0%) | 0 (0.0%) |
| 18 to 34 Years | 0 (0.0%) | 0 (0.0%) |
| 35 to 64 Years | 0 (0.0%) | 3 (2.1%) |
| 65 to 74 Years | 2 (4.4%) | 0 (0.0%) |
| 75 Years and over | 0 (0.0%) | 0 (0.0%) |
Disability Class: Cognitive Difficulty
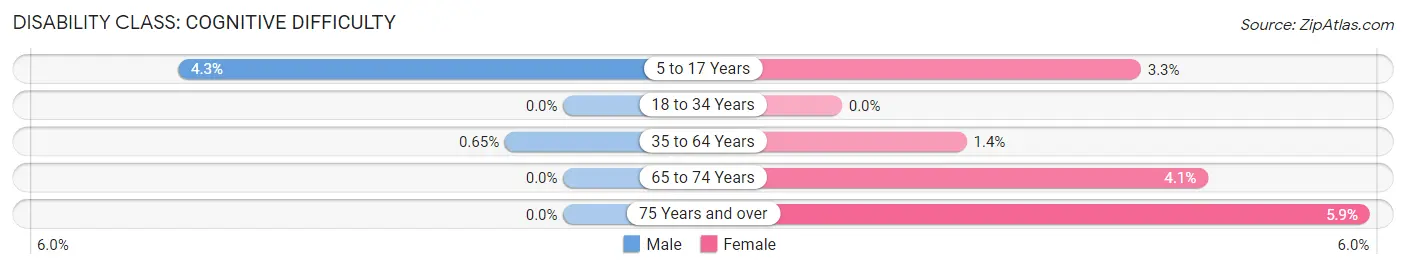
| Age Bracket | Male | Female |
| 5 to 17 Years | 3 (4.3%) | 2 (3.3%) |
| 18 to 34 Years | 0 (0.0%) | 0 (0.0%) |
| 35 to 64 Years | 1 (0.6%) | 2 (1.4%) |
| 65 to 74 Years | 0 (0.0%) | 2 (4.1%) |
| 75 Years and over | 0 (0.0%) | 2 (5.9%) |
Disability Class: Ambulatory Difficulty
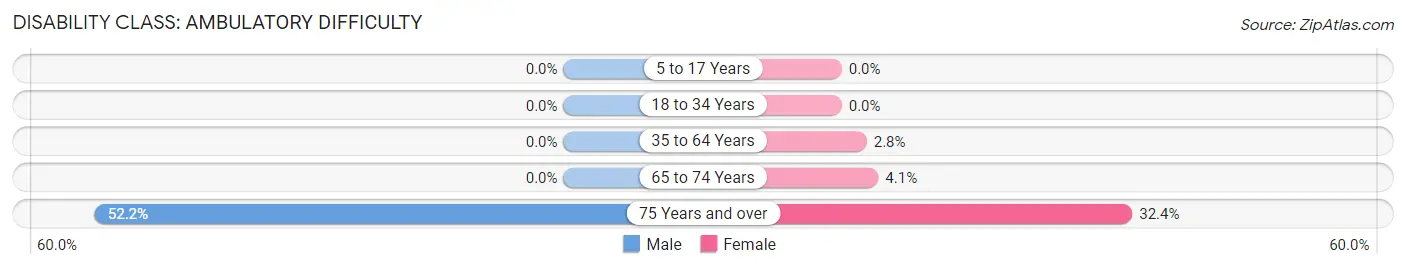
| Age Bracket | Male | Female |
| 5 to 17 Years | 0 (0.0%) | 0 (0.0%) |
| 18 to 34 Years | 0 (0.0%) | 0 (0.0%) |
| 35 to 64 Years | 0 (0.0%) | 4 (2.8%) |
| 65 to 74 Years | 0 (0.0%) | 2 (4.1%) |
| 75 Years and over | 12 (52.2%) | 11 (32.4%) |
Disability Class: Self-Care Difficulty
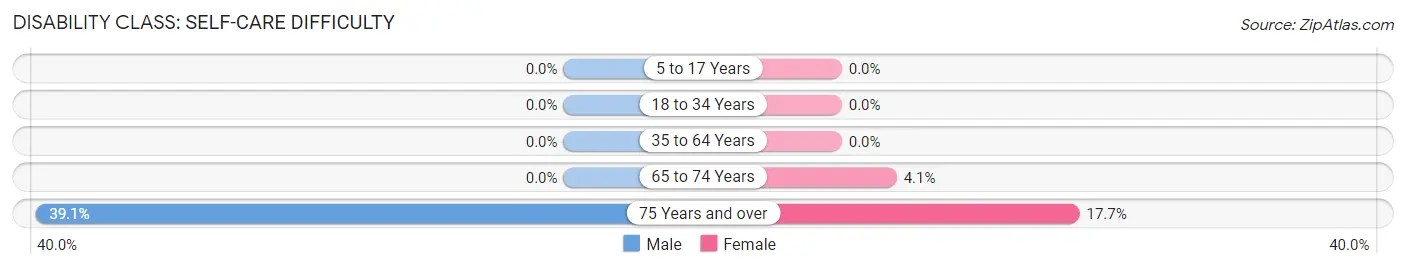
| Age Bracket | Male | Female |
| 5 to 17 Years | 0 (0.0%) | 0 (0.0%) |
| 18 to 34 Years | 0 (0.0%) | 0 (0.0%) |
| 35 to 64 Years | 0 (0.0%) | 0 (0.0%) |
| 65 to 74 Years | 0 (0.0%) | 2 (4.1%) |
| 75 Years and over | 9 (39.1%) | 6 (17.6%) |
Technology Access in Oneida Castle
Computing Device Access in Oneida Castle
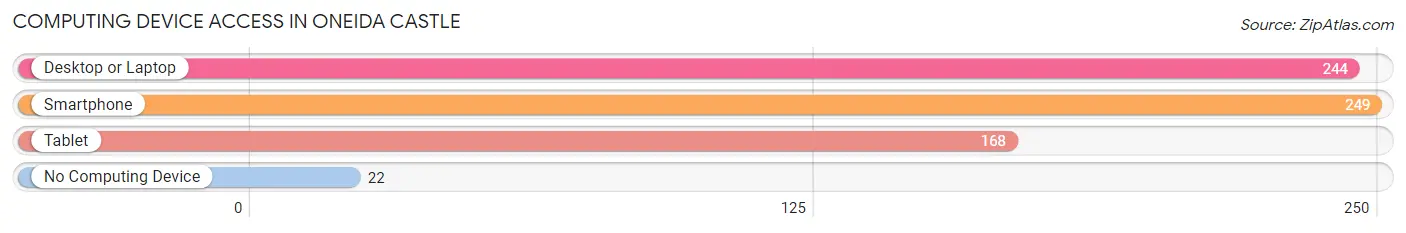
| Device Type | # Households | % Households |
| Desktop or Laptop | 244 | 79.5% |
| Smartphone | 249 | 81.1% |
| Tablet | 168 | 54.7% |
| No Computing Device | 22 | 7.2% |
| Total | 307 | 100.0% |
Internet Access in Oneida Castle
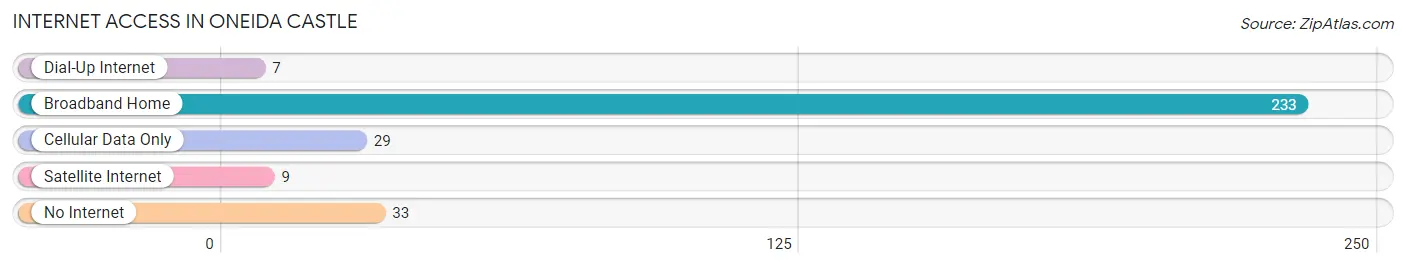
| Internet Type | # Households | % Households |
| Dial-Up Internet | 7 | 2.3% |
| Broadband Home | 233 | 75.9% |
| Cellular Data Only | 29 | 9.5% |
| Satellite Internet | 9 | 2.9% |
| No Internet | 33 | 10.7% |
| Total | 307 | 100.0% |
Oneida Castle Summary
Oneida Castle is a small village located in Oneida County, New York. It is situated on the banks of the Oneida River, about 10 miles east of the city of Utica. The village has a population of about 1,000 people and is part of the larger town of Vernon.
History
Oneida Castle was first settled in 1788 by a group of settlers from New England. The settlers were led by the Reverend Samuel Kirkland, who had been sent by the Oneida Indians to establish a mission in the area. The mission was successful and the village grew rapidly. By 1820, the village had a population of over 500 people.
The village was named after the Oneida Indians, who had lived in the area for centuries. The Oneida were part of the Iroquois Confederacy, a powerful alliance of Native American tribes in the region. The Oneida were known for their skill in farming and hunting, and their village was a major trading center for the region.
In the early 19th century, the village was a major stop on the Erie Canal, which connected the Great Lakes to the Hudson River. The canal brought increased trade and prosperity to the village, and it became a popular destination for travelers.
In the late 19th century, the village began to decline. The Erie Canal was replaced by the New York Central Railroad, and the village was bypassed by the new transportation system. The population began to decline, and by the early 20th century, the village was nearly abandoned.
In the late 20th century, the village began to experience a revival. The village was designated a National Historic Landmark in 1975, and the village was restored to its original appearance. Today, the village is a popular tourist destination, and it is home to a number of historic buildings and sites.
Geography
Oneida Castle is located in the central part of Oneida County, New York. It is situated on the banks of the Oneida River, about 10 miles east of the city of Utica. The village is surrounded by rolling hills and farmland, and it is located in the foothills of the Adirondack Mountains.
The village has a total area of 0.6 square miles, all of which is land. The village is located at an elevation of about 500 feet above sea level.
Economy
The economy of Oneida Castle is largely based on tourism. The village is a popular destination for visitors, and it is home to a number of historic sites and buildings. The village also has a number of small businesses, including restaurants, shops, and galleries.
Demographics
As of the 2010 census, the population of Oneida Castle was 1,000 people. The racial makeup of the village was 97.2% White, 0.7% African American, 0.3% Native American, 0.3% Asian, and 1.5% from other races. The median household income was $41,250, and the median family income was $50,000.
Conclusion
Oneida Castle is a small village located in Oneida County, New York. It is situated on the banks of the Oneida River, about 10 miles east of the city of Utica. The village has a population of about 1,000 people and is part of the larger town of Vernon. The village was first settled in 1788 and has a long history of being a major trading center for the region. Today, the village is a popular tourist destination, and it is home to a number of historic buildings and sites. The economy of the village is largely based on tourism, and the population is mostly White.
Common Questions
What is Per Capita Income in Oneida Castle?
Per Capita income in Oneida Castle is $36,586.
What is the Median Family Income in Oneida Castle?
Median Family Income in Oneida Castle is $74,583.
What is the Median Household income in Oneida Castle?
Median Household Income in Oneida Castle is $71,042.
What is Income or Wage Gap in Oneida Castle?
Income or Wage Gap in Oneida Castle is 37.7%.
Women in Oneida Castle earn 62.3 cents for every dollar earned by a man.
What is Inequality or Gini Index in Oneida Castle?
Inequality or Gini Index in Oneida Castle is 0.34.
What is the Total Population of Oneida Castle?
Total Population of Oneida Castle is 699.
What is the Total Male Population of Oneida Castle?
Total Male Population of Oneida Castle is 341.
What is the Total Female Population of Oneida Castle?
Total Female Population of Oneida Castle is 358.
What is the Ratio of Males per 100 Females in Oneida Castle?
There are 95.25 Males per 100 Females in Oneida Castle.
What is the Ratio of Females per 100 Males in Oneida Castle?
There are 104.99 Females per 100 Males in Oneida Castle.
What is the Median Population Age in Oneida Castle?
Median Population Age in Oneida Castle is 50.5 Years.
What is the Average Family Size in Oneida Castle
Average Family Size in Oneida Castle is 2.9 People.
What is the Average Household Size in Oneida Castle
Average Household Size in Oneida Castle is 2.3 People.
How Large is the Labor Force in Oneida Castle?
There are 379 People in the Labor Forcein in Oneida Castle.
What is the Percentage of People in the Labor Force in Oneida Castle?
67.1% of People are in the Labor Force in Oneida Castle.
What is the Unemployment Rate in Oneida Castle?
Unemployment Rate in Oneida Castle is 2.9%.