Rushville, NY Map & Demographics
Rushville Map
Rushville Overview
$28,019
PER CAPITA INCOME
$65,250
AVG FAMILY INCOME
$50,833
AVG HOUSEHOLD INCOME
7.1%
WAGE / INCOME GAP [ % ]
92.9¢/ $1
WAGE / INCOME GAP [ $ ]
0.43
INEQUALITY / GINI INDEX
547
TOTAL POPULATION
249
MALE POPULATION
298
FEMALE POPULATION
83.56
MALES / 100 FEMALES
119.68
FEMALES / 100 MALES
39.8
MEDIAN AGE
3.4
AVG FAMILY SIZE
2.6
AVG HOUSEHOLD SIZE
216
LABOR FORCE [ PEOPLE ]
55.7%
PERCENT IN LABOR FORCE
6.0%
UNEMPLOYMENT RATE
Rushville Zip Codes
Rushville Area Codes
Income in Rushville
Income Overview in Rushville
Per Capita Income in Rushville is $28,019, while median incomes of families and households are $65,250 and $50,833 respectively.
| Characteristic | Number | Measure |
| Per Capita Income | 547 | $28,019 |
| Median Family Income | 127 | $65,250 |
| Mean Family Income | 127 | $81,639 |
| Median Household Income | 202 | $50,833 |
| Mean Household Income | 202 | $69,995 |
| Income Deficit | 127 | $0 |
| Wage / Income Gap (%) | 547 | 7.11% |
| Wage / Income Gap ($) | 547 | 92.89¢ per $1 |
| Gini / Inequality Index | 547 | 0.43 |
Earnings by Sex in Rushville
Average Earnings in Rushville are $35,083, $33,750 for men and $36,333 for women, a difference of 7.1%.
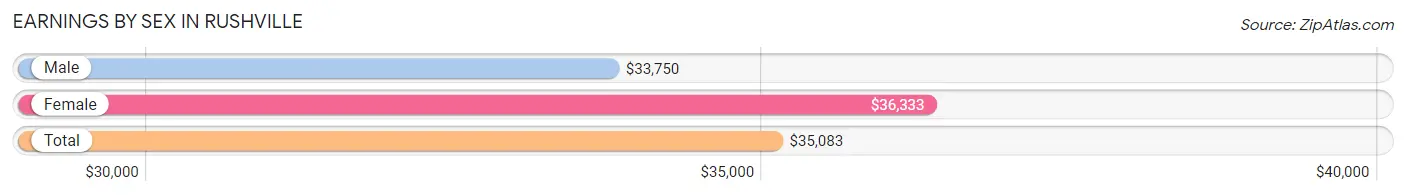
| Sex | Number | Average Earnings |
| Male | 121 (54.3%) | $33,750 |
| Female | 102 (45.7%) | $36,333 |
| Total | 223 (100.0%) | $35,083 |
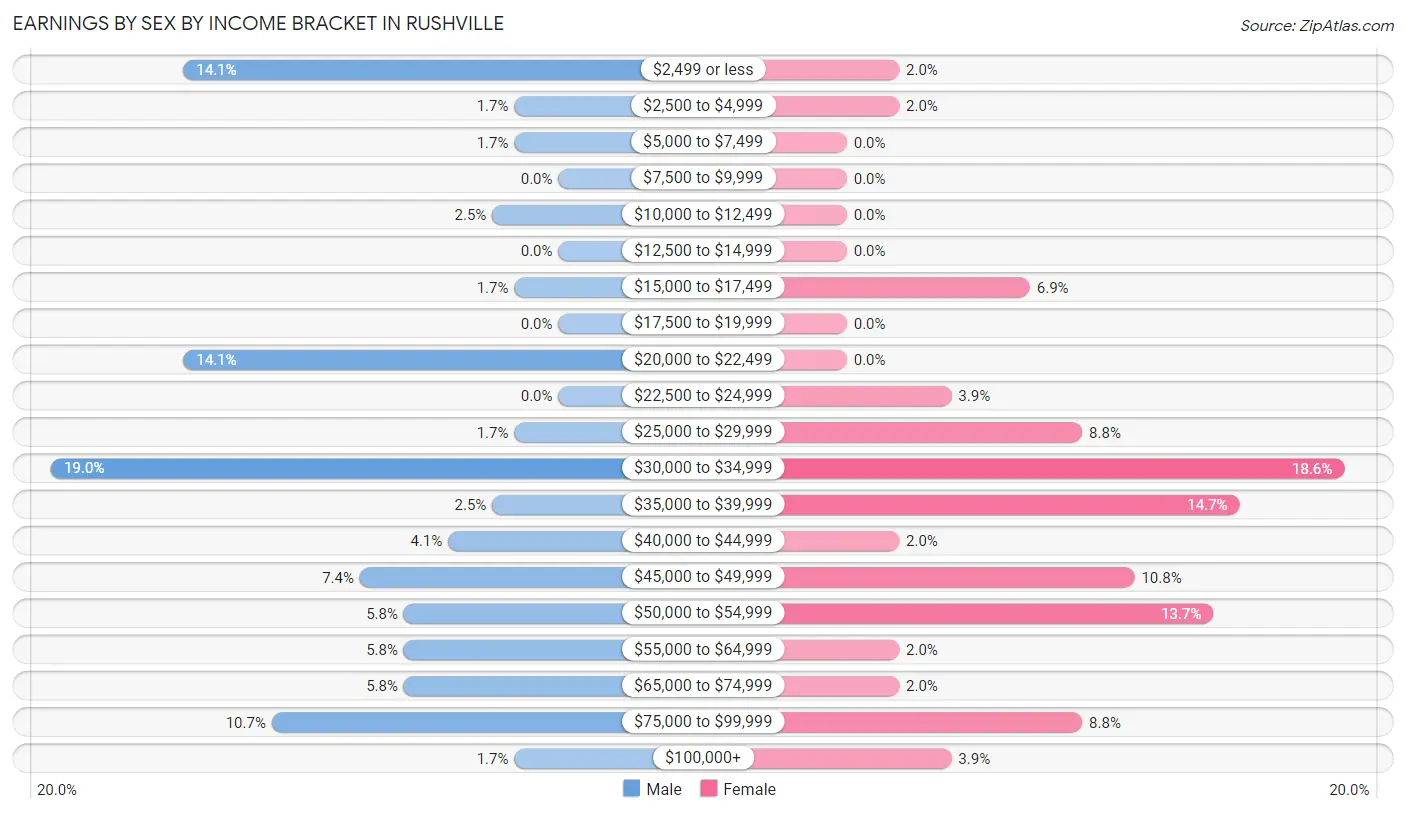
Earnings by Sex by Income Bracket in Rushville
The most common earnings brackets in Rushville are $30,000 to $34,999 for men (23 | 19.0%) and $30,000 to $34,999 for women (19 | 18.6%).
| Income | Male | Female |
| $2,499 or less | 17 (14.1%) | 2 (2.0%) |
| $2,500 to $4,999 | 2 (1.7%) | 2 (2.0%) |
| $5,000 to $7,499 | 2 (1.7%) | 0 (0.0%) |
| $7,500 to $9,999 | 0 (0.0%) | 0 (0.0%) |
| $10,000 to $12,499 | 3 (2.5%) | 0 (0.0%) |
| $12,500 to $14,999 | 0 (0.0%) | 0 (0.0%) |
| $15,000 to $17,499 | 2 (1.7%) | 7 (6.9%) |
| $17,500 to $19,999 | 0 (0.0%) | 0 (0.0%) |
| $20,000 to $22,499 | 17 (14.1%) | 0 (0.0%) |
| $22,500 to $24,999 | 0 (0.0%) | 4 (3.9%) |
| $25,000 to $29,999 | 2 (1.7%) | 9 (8.8%) |
| $30,000 to $34,999 | 23 (19.0%) | 19 (18.6%) |
| $35,000 to $39,999 | 3 (2.5%) | 15 (14.7%) |
| $40,000 to $44,999 | 5 (4.1%) | 2 (2.0%) |
| $45,000 to $49,999 | 9 (7.4%) | 11 (10.8%) |
| $50,000 to $54,999 | 7 (5.8%) | 14 (13.7%) |
| $55,000 to $64,999 | 7 (5.8%) | 2 (2.0%) |
| $65,000 to $74,999 | 7 (5.8%) | 2 (2.0%) |
| $75,000 to $99,999 | 13 (10.7%) | 9 (8.8%) |
| $100,000+ | 2 (1.7%) | 4 (3.9%) |
| Total | 121 (100.0%) | 102 (100.0%) |
Earnings by Sex by Educational Attainment in Rushville
Average earnings in Rushville are $39,583 for men and $36,667 for women, a difference of 7.4%. Men with an educational attainment of graduate degree enjoy the highest average annual earnings of $76,250, while those with less than high school education earn the least with $2,499. Women with an educational attainment of graduate degree earn the most with the average annual earnings of $76,250, while those with high school diploma education have the smallest earnings of $30,750.
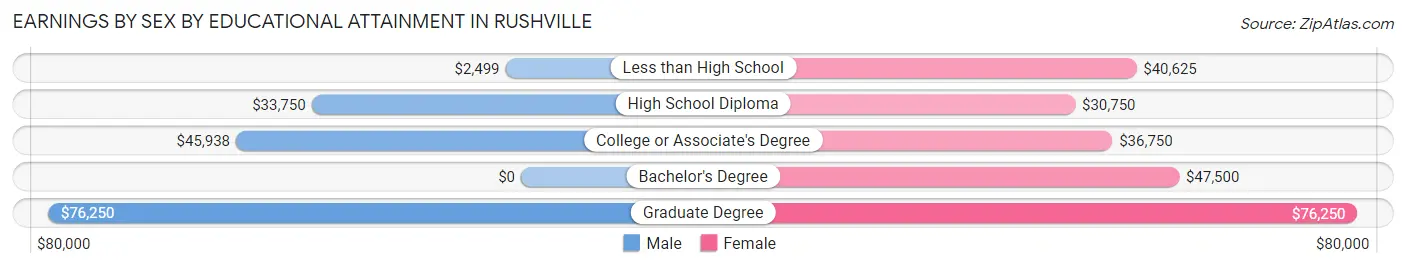
| Educational Attainment | Male Income | Female Income |
| Less than High School | $2,499 | $40,625 |
| High School Diploma | $33,750 | $30,750 |
| College or Associate's Degree | $45,938 | $36,750 |
| Bachelor's Degree | - | - |
| Graduate Degree | $76,250 | $76,250 |
| Total | $39,583 | $36,667 |
Family Income in Rushville
Family Income Brackets in Rushville
According to the Rushville family income data, there are 38 families falling into the $35,000 to $49,999 income range, which is the most common income bracket and makes up 29.9% of all families. Conversely, the less than $10,000 income bracket is the least frequent group with only 1 families (0.8%) belonging to this category.
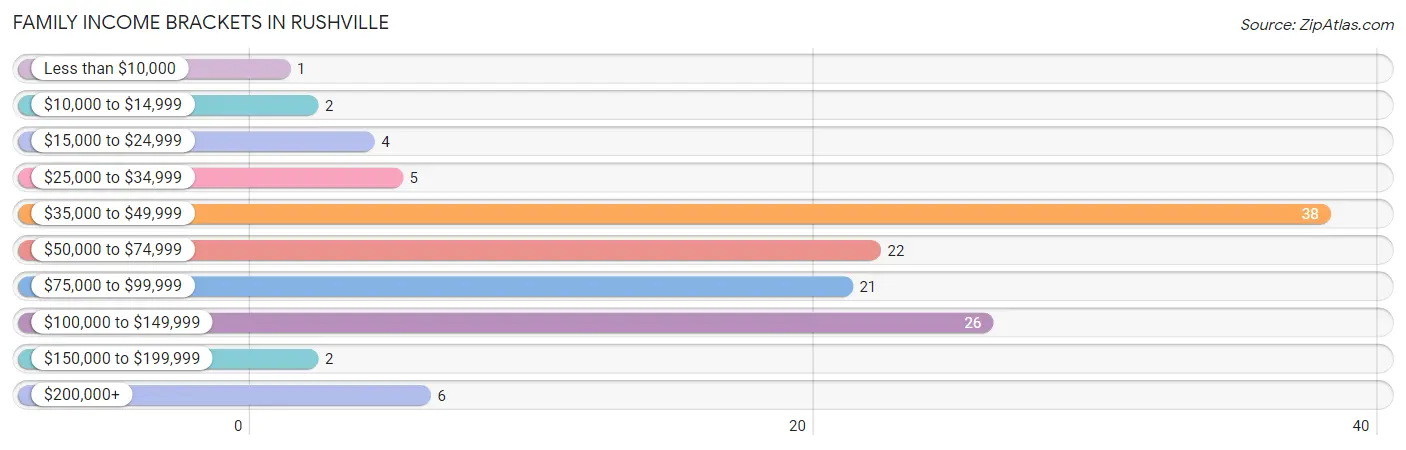
| Income Bracket | # Families | % Families |
| Less than $10,000 | 1 | 0.8% |
| $10,000 to $14,999 | 2 | 1.6% |
| $15,000 to $24,999 | 4 | 3.1% |
| $25,000 to $34,999 | 5 | 3.9% |
| $35,000 to $49,999 | 38 | 29.9% |
| $50,000 to $74,999 | 22 | 17.3% |
| $75,000 to $99,999 | 21 | 16.5% |
| $100,000 to $149,999 | 26 | 20.5% |
| $150,000 to $199,999 | 2 | 1.6% |
| $200,000+ | 6 | 4.7% |
Family Income by Famaliy Size in Rushville
4-person families (22 | 17.3%) account for the highest median family income in Rushville with $97,500 per family, while 3-person families (24 | 18.9%) have the highest median income of $26,250 per family member.
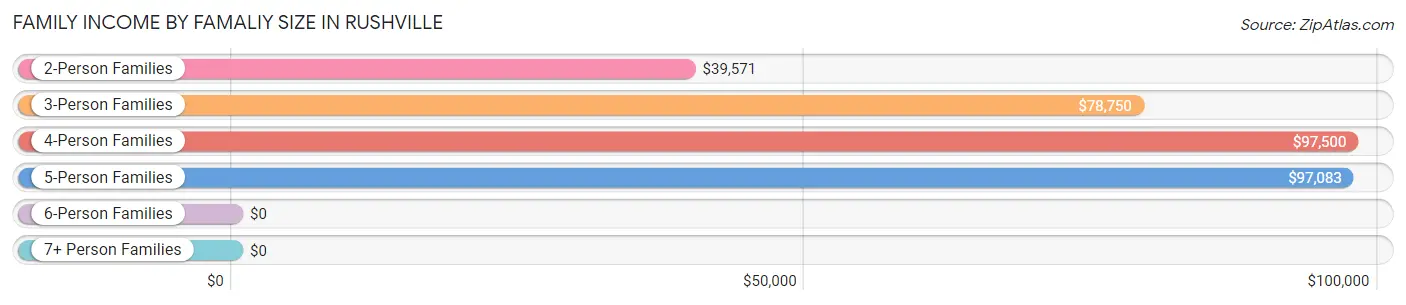
| Income Bracket | # Families | Median Income |
| 2-Person Families | 68 (53.5%) | $39,571 |
| 3-Person Families | 24 (18.9%) | $78,750 |
| 4-Person Families | 22 (17.3%) | $97,500 |
| 5-Person Families | 9 (7.1%) | $97,083 |
| 6-Person Families | 4 (3.2%) | $0 |
| 7+ Person Families | 0 (0.0%) | $0 |
| Total | 127 (100.0%) | $65,250 |
Family Income by Number of Earners in Rushville
The median family income in Rushville is $65,250, with families comprising 2 earners (33) having the highest median family income of $112,656, while families with no earners (53) have the lowest median family income of $38,893, accounting for 26.0% and 41.7% of families, respectively.
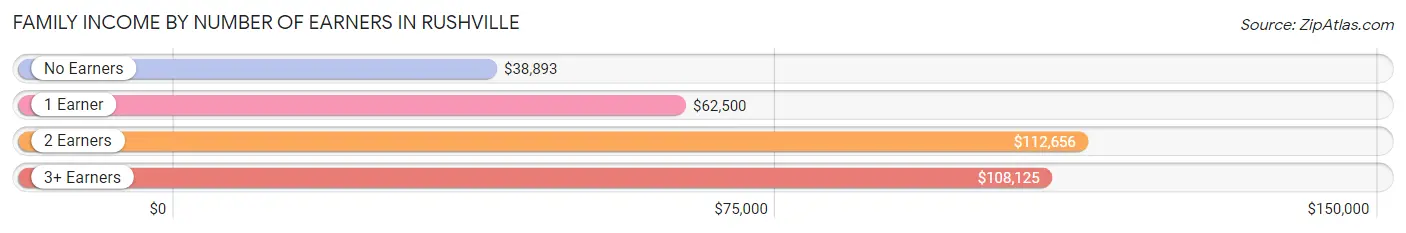
| Number of Earners | # Families | Median Income |
| No Earners | 53 (41.7%) | $38,893 |
| 1 Earner | 24 (18.9%) | $62,500 |
| 2 Earners | 33 (26.0%) | $112,656 |
| 3+ Earners | 17 (13.4%) | $108,125 |
| Total | 127 (100.0%) | $65,250 |
Household Income in Rushville
Household Income Brackets in Rushville
With 43 households falling in the category, the $35,000 to $49,999 income range is the most frequent in Rushville, accounting for 21.3% of all households. In contrast, only 4 households (2.0%) fall into the less than $10,000 income bracket, making it the least populous group.
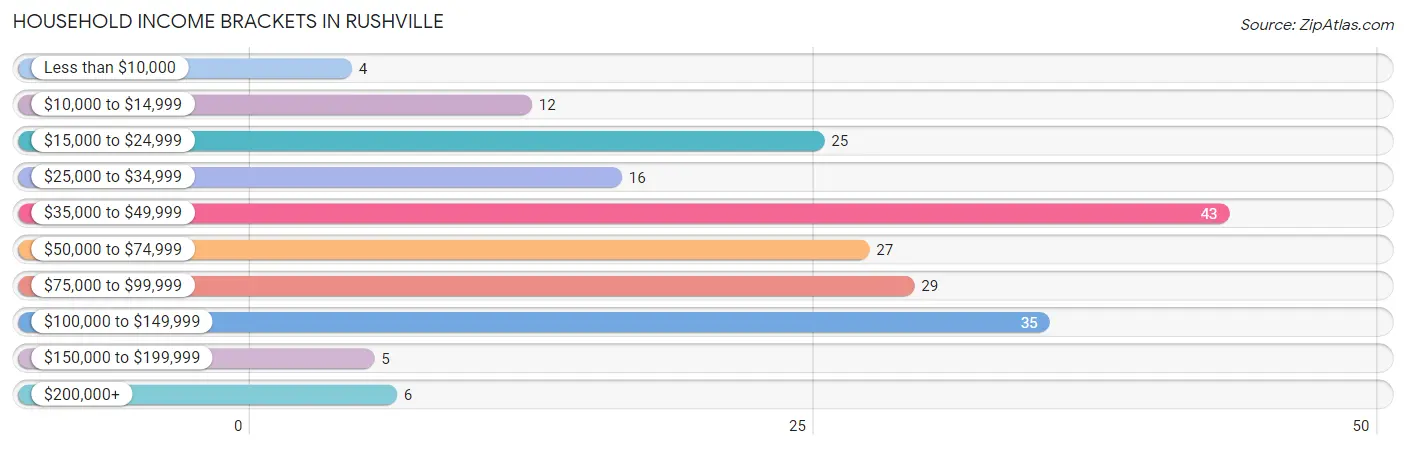
| Income Bracket | # Households | % Households |
| Less than $10,000 | 4 | 2.0% |
| $10,000 to $14,999 | 12 | 5.9% |
| $15,000 to $24,999 | 25 | 12.4% |
| $25,000 to $34,999 | 16 | 7.9% |
| $35,000 to $49,999 | 43 | 21.3% |
| $50,000 to $74,999 | 27 | 13.4% |
| $75,000 to $99,999 | 29 | 14.4% |
| $100,000 to $149,999 | 35 | 17.3% |
| $150,000 to $199,999 | 5 | 2.5% |
| $200,000+ | 6 | 3.0% |
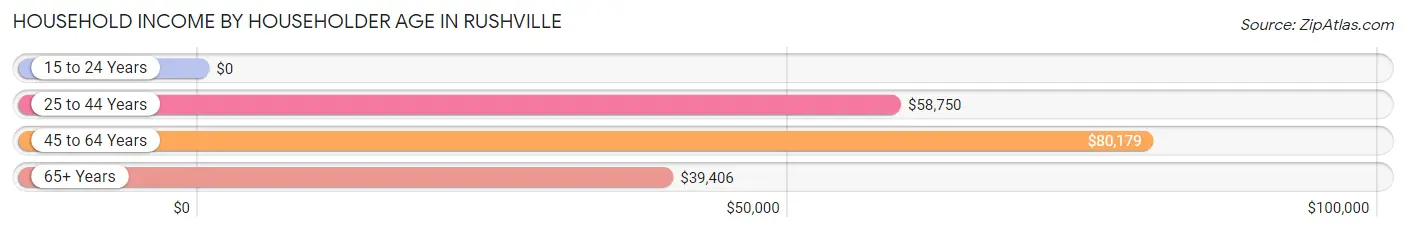
Household Income by Householder Age in Rushville
The median household income in Rushville is $50,833, with the highest median household income of $80,179 found in the 45 to 64 years age bracket for the primary householder. A total of 65 households (32.2%) fall into this category.
| Income Bracket | # Households | Median Income |
| 15 to 24 Years | 0 (0.0%) | $0 |
| 25 to 44 Years | 58 (28.7%) | $58,750 |
| 45 to 64 Years | 65 (32.2%) | $80,179 |
| 65+ Years | 79 (39.1%) | $39,406 |
| Total | 202 (100.0%) | $50,833 |
Poverty in Rushville
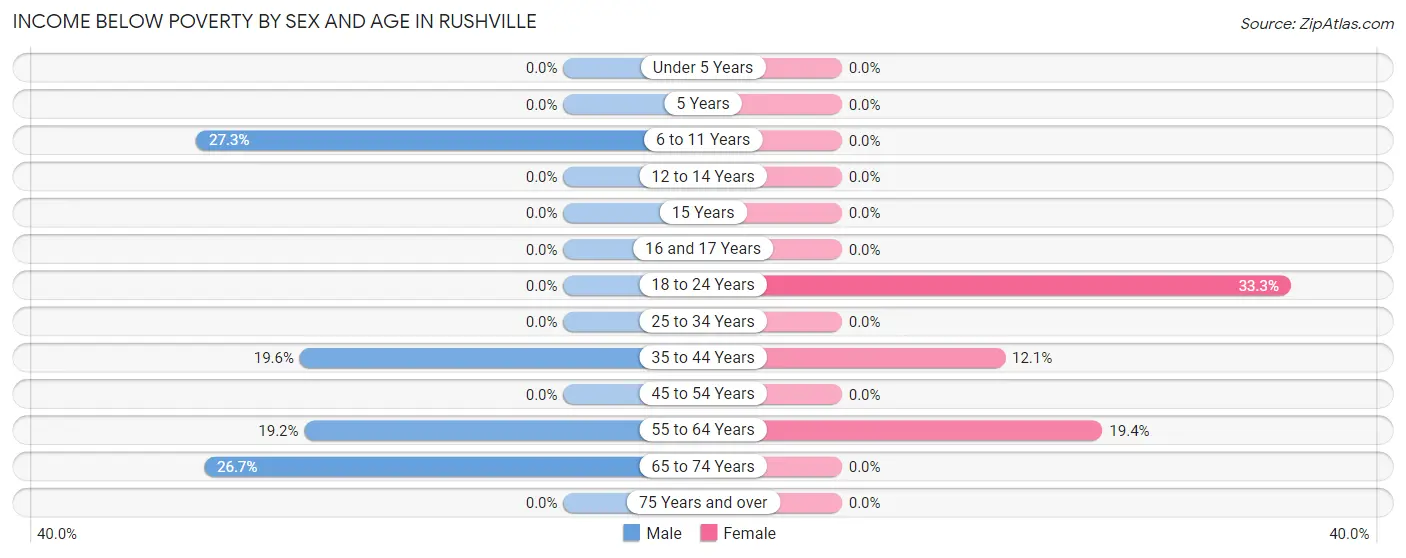
Income Below Poverty by Sex and Age in Rushville
With 12.9% poverty level for males and 4.0% for females among the residents of Rushville, 6 to 11 year old males and 18 to 24 year old females are the most vulnerable to poverty, with 9 males (27.3%) and 2 females (33.3%) in their respective age groups living below the poverty level.
| Age Bracket | Male | Female |
| Under 5 Years | 0 (0.0%) | 0 (0.0%) |
| 5 Years | 0 (0.0%) | 0 (0.0%) |
| 6 to 11 Years | 9 (27.3%) | 0 (0.0%) |
| 12 to 14 Years | 0 (0.0%) | 0 (0.0%) |
| 15 Years | 0 (0.0%) | 0 (0.0%) |
| 16 and 17 Years | 0 (0.0%) | 0 (0.0%) |
| 18 to 24 Years | 0 (0.0%) | 2 (33.3%) |
| 25 to 34 Years | 0 (0.0%) | 0 (0.0%) |
| 35 to 44 Years | 9 (19.6%) | 4 (12.1%) |
| 45 to 54 Years | 0 (0.0%) | 0 (0.0%) |
| 55 to 64 Years | 10 (19.2%) | 6 (19.4%) |
| 65 to 74 Years | 4 (26.7%) | 0 (0.0%) |
| 75 Years and over | 0 (0.0%) | 0 (0.0%) |
| Total | 32 (12.9%) | 12 (4.0%) |
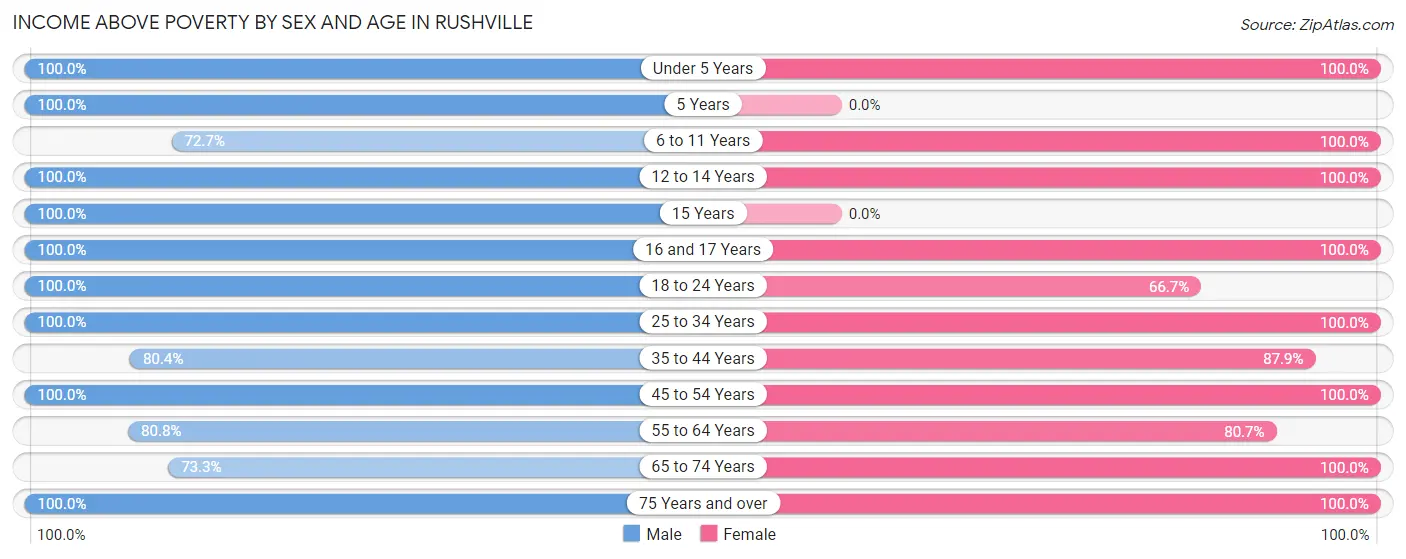
Income Above Poverty by Sex and Age in Rushville
According to the poverty statistics in Rushville, males aged under 5 years and females aged under 5 years are the age groups that are most secure financially, with 100.0% of males and 100.0% of females in these age groups living above the poverty line.
| Age Bracket | Male | Female |
| Under 5 Years | 11 (100.0%) | 2 (100.0%) |
| 5 Years | 4 (100.0%) | 0 (0.0%) |
| 6 to 11 Years | 24 (72.7%) | 90 (100.0%) |
| 12 to 14 Years | 9 (100.0%) | 8 (100.0%) |
| 15 Years | 2 (100.0%) | 0 (0.0%) |
| 16 and 17 Years | 6 (100.0%) | 2 (100.0%) |
| 18 to 24 Years | 25 (100.0%) | 4 (66.7%) |
| 25 to 34 Years | 14 (100.0%) | 17 (100.0%) |
| 35 to 44 Years | 37 (80.4%) | 29 (87.9%) |
| 45 to 54 Years | 17 (100.0%) | 23 (100.0%) |
| 55 to 64 Years | 42 (80.8%) | 25 (80.6%) |
| 65 to 74 Years | 11 (73.3%) | 66 (100.0%) |
| 75 Years and over | 15 (100.0%) | 20 (100.0%) |
| Total | 217 (87.2%) | 286 (96.0%) |
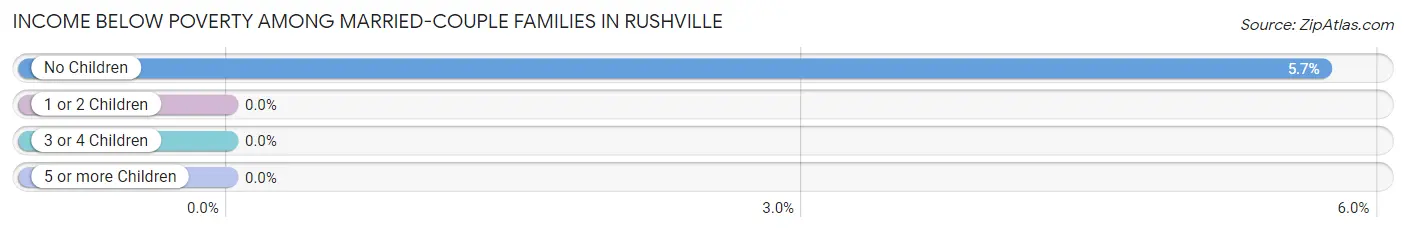
Income Below Poverty Among Married-Couple Families in Rushville
The poverty statistics for married-couple families in Rushville show that 3.2% or 2 of the total 62 families live below the poverty line. Families with no children have the highest poverty rate of 5.7%, comprising of 2 families. On the other hand, families with 1 or 2 children have the lowest poverty rate of 0.0%, which includes 0 families.
| Children | Above Poverty | Below Poverty |
| No Children | 33 (94.3%) | 2 (5.7%) |
| 1 or 2 Children | 23 (100.0%) | 0 (0.0%) |
| 3 or 4 Children | 4 (100.0%) | 0 (0.0%) |
| 5 or more Children | 0 (0.0%) | 0 (0.0%) |
| Total | 60 (96.8%) | 2 (3.2%) |
Income Below Poverty Among Single-Parent Households in Rushville
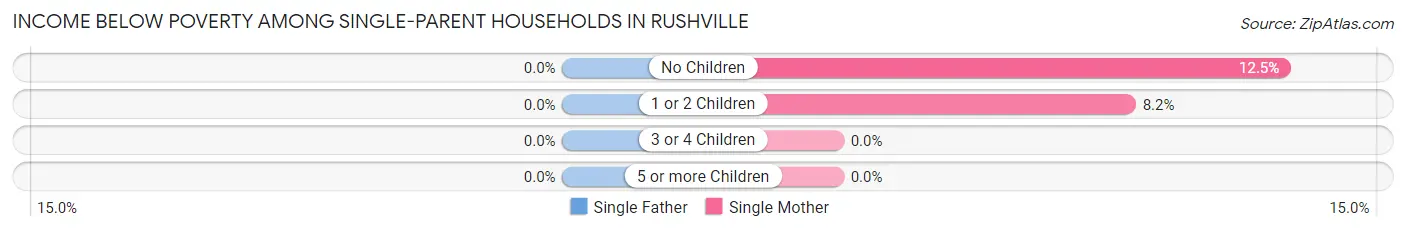
| Children | Single Father | Single Mother |
| No Children | 0 (0.0%) | 1 (12.5%) |
| 1 or 2 Children | 0 (0.0%) | 4 (8.2%) |
| 3 or 4 Children | 0 (0.0%) | 0 (0.0%) |
| 5 or more Children | 0 (0.0%) | 0 (0.0%) |
| Total | 0 (0.0%) | 5 (8.8%) |
Income Below Poverty Among Married-Couple vs Single-Parent Households in Rushville
The poverty data for Rushville shows that 2 of the married-couple family households (3.2%) and 5 of the single-parent households (7.7%) are living below the poverty level. Within the married-couple family households, those with no children have the highest poverty rate, with 2 households (5.7%) falling below the poverty line. Among the single-parent households, those with no children have the highest poverty rate, with 1 household (10.0%) living below poverty.
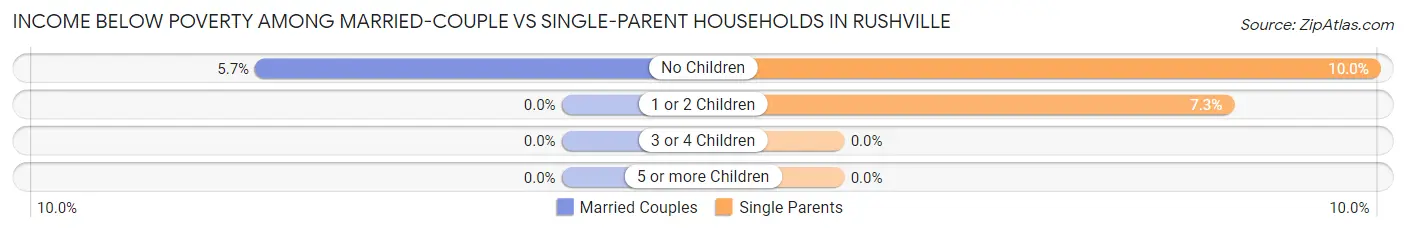
| Children | Married-Couple Families | Single-Parent Households |
| No Children | 2 (5.7%) | 1 (10.0%) |
| 1 or 2 Children | 0 (0.0%) | 4 (7.3%) |
| 3 or 4 Children | 0 (0.0%) | 0 (0.0%) |
| 5 or more Children | 0 (0.0%) | 0 (0.0%) |
| Total | 2 (3.2%) | 5 (7.7%) |
Race in Rushville
The most populous races in Rushville are White / Caucasian (529 | 96.7%), Hispanic or Latino (17 | 3.1%), and Two or more Races (15 | 2.7%).
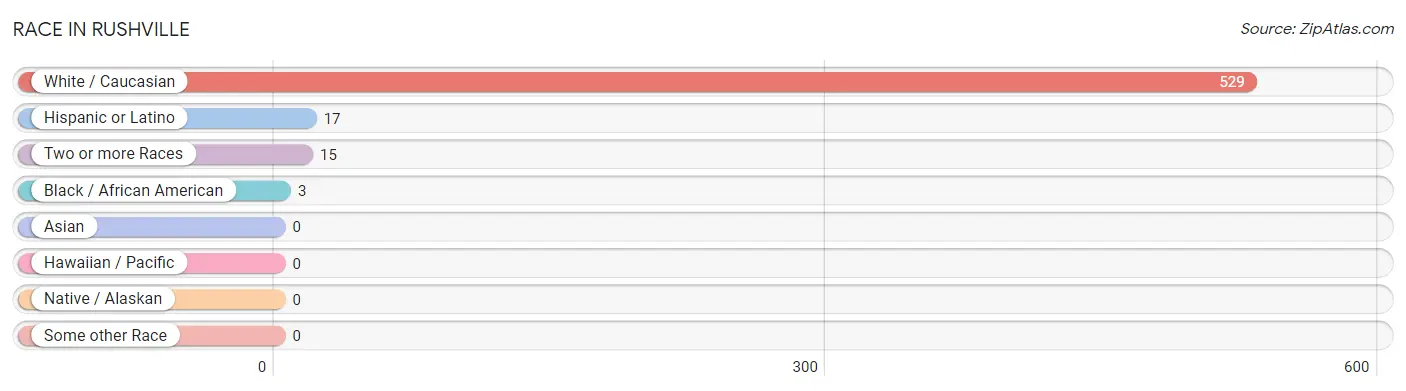
| Race | # Population | % Population |
| Asian | 0 | 0.0% |
| Black / African American | 3 | 0.5% |
| Hawaiian / Pacific | 0 | 0.0% |
| Hispanic or Latino | 17 | 3.1% |
| Native / Alaskan | 0 | 0.0% |
| White / Caucasian | 529 | 96.7% |
| Two or more Races | 15 | 2.7% |
| Some other Race | 0 | 0.0% |
| Total | 547 | 100.0% |
Ancestry in Rushville
The most populous ancestries reported in Rushville are German (99 | 18.1%), English (90 | 16.5%), American (85 | 15.5%), Irish (85 | 15.5%), and European (35 | 6.4%), together accounting for 72.0% of all Rushville residents.
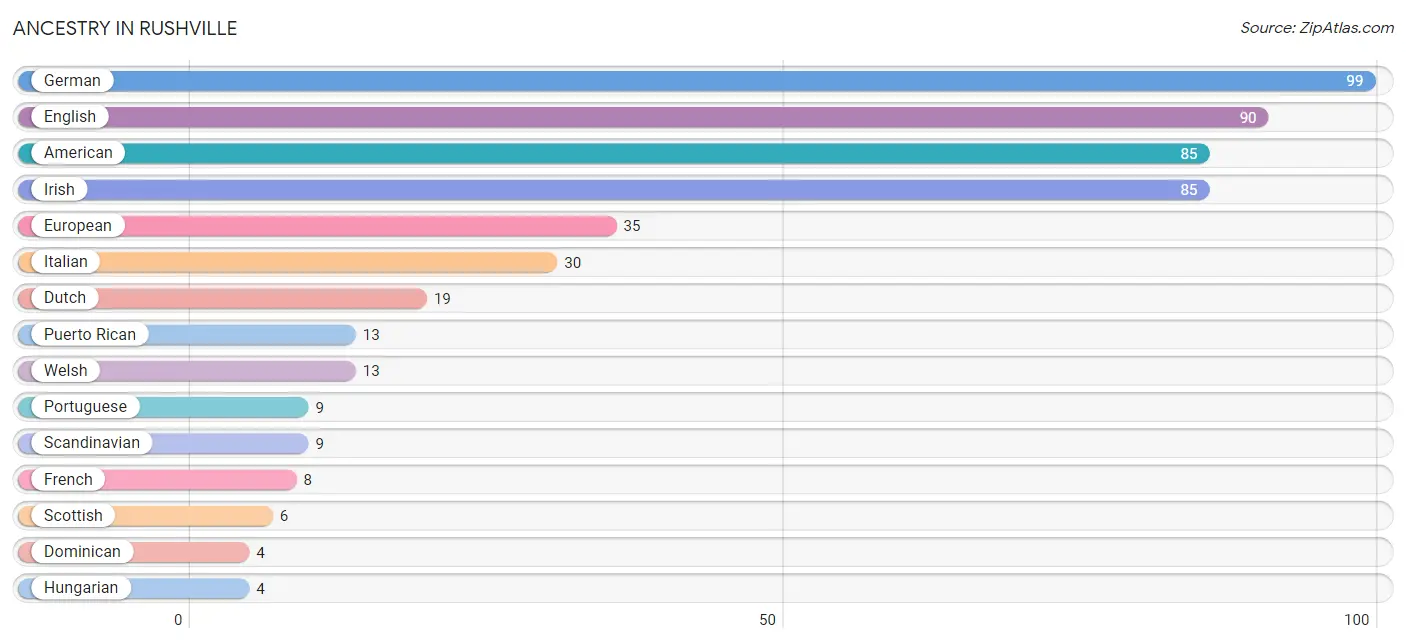
| Ancestry | # Population | % Population |
| American | 85 | 15.5% |
| Dominican | 4 | 0.7% |
| Dutch | 19 | 3.5% |
| English | 90 | 16.5% |
| European | 35 | 6.4% |
| French | 8 | 1.5% |
| German | 99 | 18.1% |
| Hungarian | 4 | 0.7% |
| Irish | 85 | 15.5% |
| Italian | 30 | 5.5% |
| Maltese | 2 | 0.4% |
| Northern European | 2 | 0.4% |
| Polish | 3 | 0.5% |
| Portuguese | 9 | 1.7% |
| Puerto Rican | 13 | 2.4% |
| Scandinavian | 9 | 1.7% |
| Scotch-Irish | 4 | 0.7% |
| Scottish | 6 | 1.1% |
| Slovak | 2 | 0.4% |
| Swedish | 3 | 0.5% |
| Welsh | 13 | 2.4% | View All 21 Rows |
Immigrants in Rushville
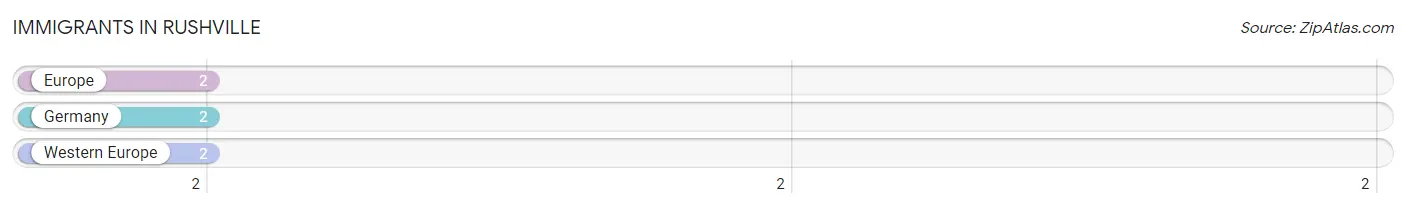
The most numerous immigrant groups reported in Rushville came from Europe (2 | 0.4%), Germany (2 | 0.4%), and Western Europe (2 | 0.4%), together accounting for 1.1% of all Rushville residents.
| Immigration Origin | # Population | % Population |
| Europe | 2 | 0.4% |
| Germany | 2 | 0.4% |
| Western Europe | 2 | 0.4% | View All 3 Rows |
Sex and Age in Rushville
Sex and Age in Rushville
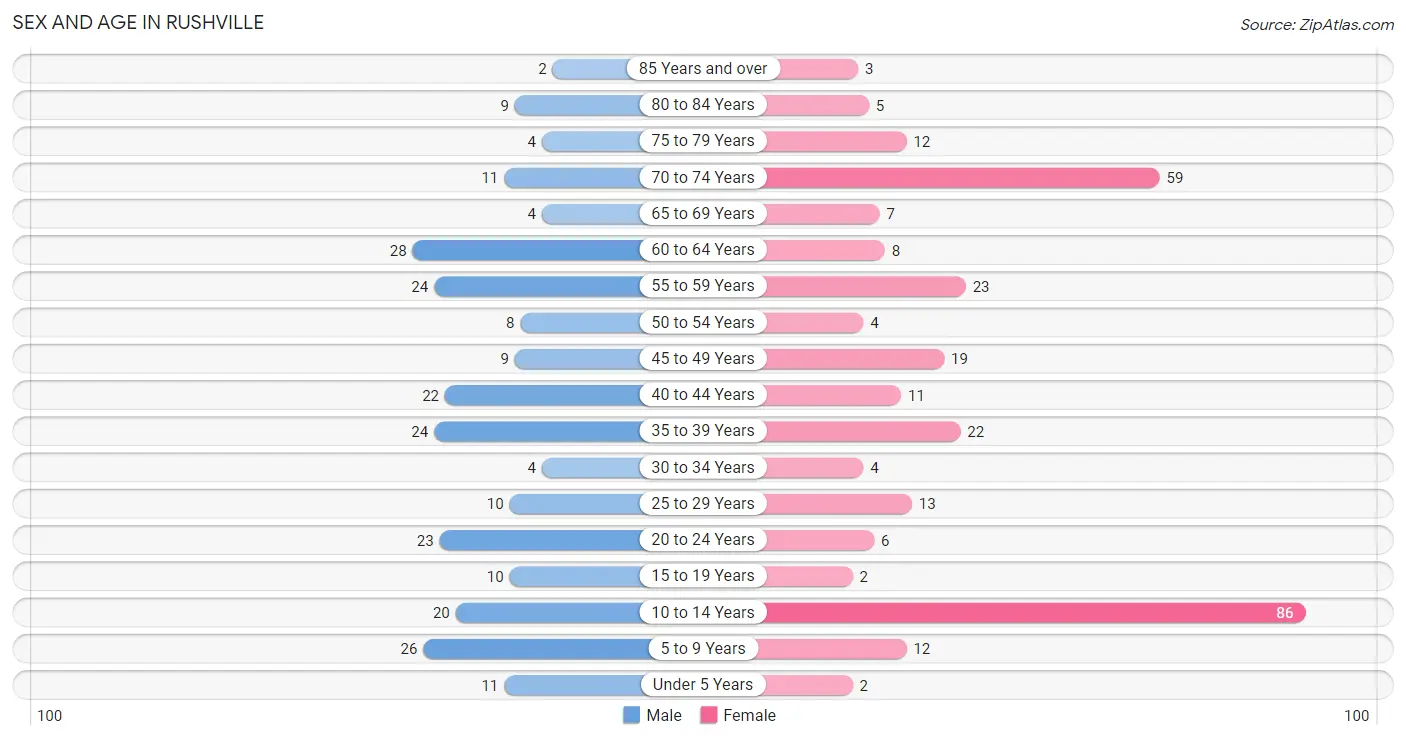
The most populous age groups in Rushville are 60 to 64 Years (28 | 11.2%) for men and 10 to 14 Years (86 | 28.9%) for women.
| Age Bracket | Male | Female |
| Under 5 Years | 11 (4.4%) | 2 (0.7%) |
| 5 to 9 Years | 26 (10.4%) | 12 (4.0%) |
| 10 to 14 Years | 20 (8.0%) | 86 (28.9%) |
| 15 to 19 Years | 10 (4.0%) | 2 (0.7%) |
| 20 to 24 Years | 23 (9.2%) | 6 (2.0%) |
| 25 to 29 Years | 10 (4.0%) | 13 (4.4%) |
| 30 to 34 Years | 4 (1.6%) | 4 (1.3%) |
| 35 to 39 Years | 24 (9.6%) | 22 (7.4%) |
| 40 to 44 Years | 22 (8.8%) | 11 (3.7%) |
| 45 to 49 Years | 9 (3.6%) | 19 (6.4%) |
| 50 to 54 Years | 8 (3.2%) | 4 (1.3%) |
| 55 to 59 Years | 24 (9.6%) | 23 (7.7%) |
| 60 to 64 Years | 28 (11.2%) | 8 (2.7%) |
| 65 to 69 Years | 4 (1.6%) | 7 (2.4%) |
| 70 to 74 Years | 11 (4.4%) | 59 (19.8%) |
| 75 to 79 Years | 4 (1.6%) | 12 (4.0%) |
| 80 to 84 Years | 9 (3.6%) | 5 (1.7%) |
| 85 Years and over | 2 (0.8%) | 3 (1.0%) |
| Total | 249 (100.0%) | 298 (100.0%) |
Families and Households in Rushville
Median Family Size in Rushville
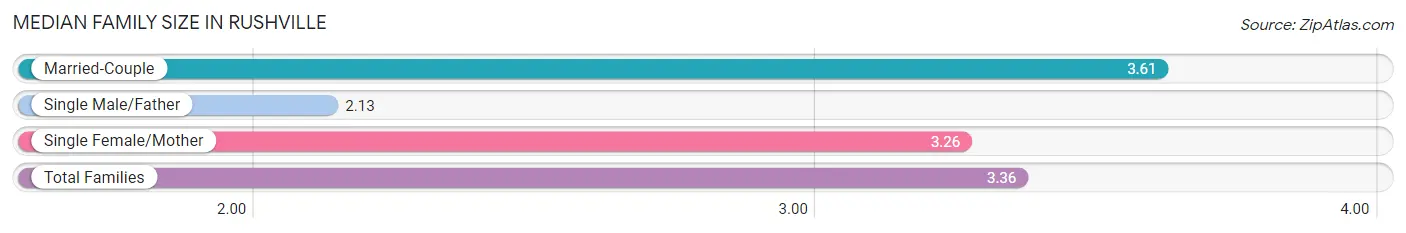
The median family size in Rushville is 3.36 persons per family, with married-couple families (62 | 48.8%) accounting for the largest median family size of 3.61 persons per family. On the other hand, single male/father families (8 | 6.3%) represent the smallest median family size with 2.13 persons per family.
| Family Type | # Families | Family Size |
| Married-Couple | 62 (48.8%) | 3.61 |
| Single Male/Father | 8 (6.3%) | 2.13 |
| Single Female/Mother | 57 (44.9%) | 3.26 |
| Total Families | 127 (100.0%) | 3.36 |
Median Household Size in Rushville
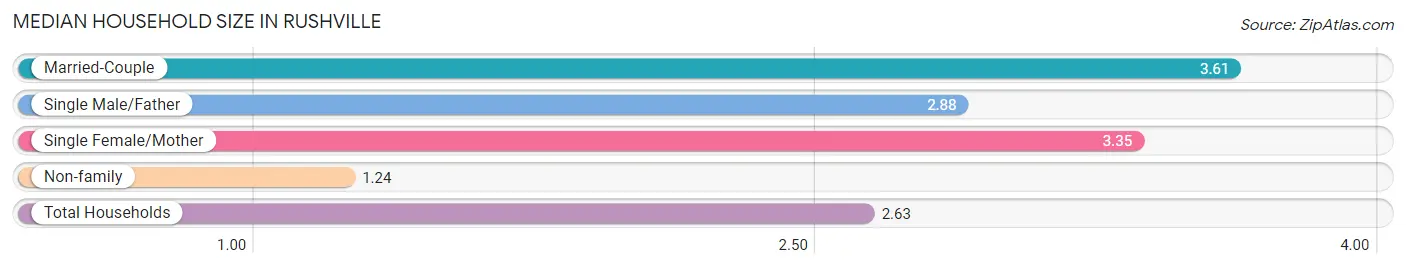
The median household size in Rushville is 2.63 persons per household, with married-couple households (62 | 30.7%) accounting for the largest median household size of 3.61 persons per household. non-family households (75 | 37.1%) represent the smallest median household size with 1.24 persons per household.
| Household Type | # Households | Household Size |
| Married-Couple | 62 (30.7%) | 3.61 |
| Single Male/Father | 8 (4.0%) | 2.88 |
| Single Female/Mother | 57 (28.2%) | 3.35 |
| Non-family | 75 (37.1%) | 1.24 |
| Total Households | 202 (100.0%) | 2.63 |
Household Size by Marriage Status in Rushville
Out of a total of 202 households in Rushville, 127 (62.9%) are family households, while 75 (37.1%) are nonfamily households. The most numerous type of family households are 2-person households, comprising 65, and the most common type of nonfamily households are 1-person households, comprising 64.
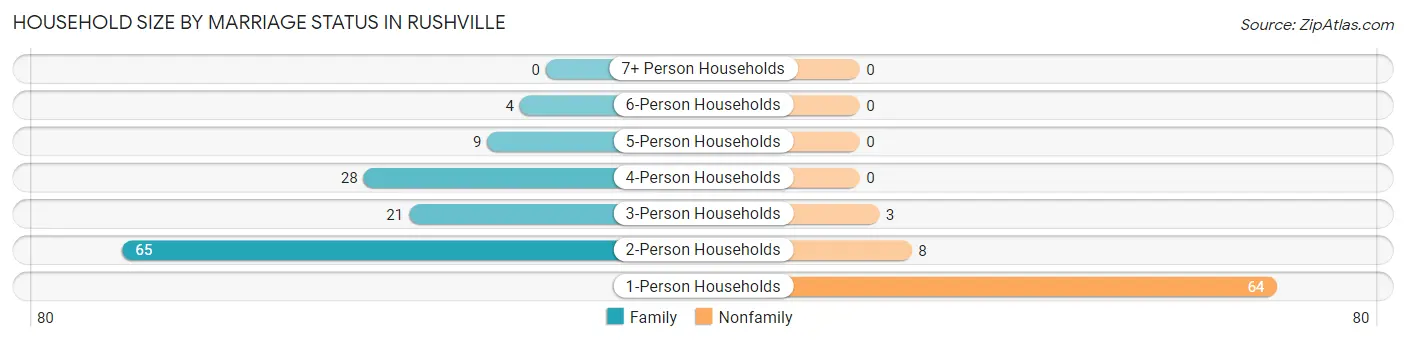
| Household Size | Family Households | Nonfamily Households |
| 1-Person Households | - | 64 (31.7%) |
| 2-Person Households | 65 (32.2%) | 8 (4.0%) |
| 3-Person Households | 21 (10.4%) | 3 (1.5%) |
| 4-Person Households | 28 (13.9%) | 0 (0.0%) |
| 5-Person Households | 9 (4.5%) | 0 (0.0%) |
| 6-Person Households | 4 (2.0%) | 0 (0.0%) |
| 7+ Person Households | 0 (0.0%) | 0 (0.0%) |
| Total | 127 (62.9%) | 75 (37.1%) |
Female Fertility in Rushville
Fertility by Age in Rushville
| Age Bracket | Women with Births | Births / 1,000 Women |
| 15 to 19 years | 0 (0.0%) | 0.0 |
| 20 to 34 years | 0 (0.0%) | 0.0 |
| 35 to 50 years | 0 (0.0%) | 0.0 |
| Total | 0 (0.0%) | 0.0 |
Fertility by Age by Marriage Status in Rushville
| Age Bracket | Married | Unmarried |
| 15 to 19 years | 0 (0.0%) | 0 (0.0%) |
| 20 to 34 years | 0 (0.0%) | 0 (0.0%) |
| 35 to 50 years | 0 (0.0%) | 0 (0.0%) |
| Total | 0 (0.0%) | 0 (0.0%) |
Fertility by Education in Rushville
| Educational Attainment | Women with Births | Births / 1,000 Women |
| Less than High School | 0 (0.0%) | 0.0 |
| High School Diploma | 0 (0.0%) | 0.0 |
| College or Associate's Degree | 0 (0.0%) | 0.0 |
| Bachelor's Degree | 0 (0.0%) | 0.0 |
| Graduate Degree | 0 (0.0%) | 0.0 |
| Total | 0 (0.0%) | 0.0 |
Fertility by Education by Marriage Status in Rushville
| Educational Attainment | Married | Unmarried |
| Less than High School | 0 (0.0%) | 0 (0.0%) |
| High School Diploma | 0 (0.0%) | 0 (0.0%) |
| College or Associate's Degree | 0 (0.0%) | 0 (0.0%) |
| Bachelor's Degree | 0 (0.0%) | 0 (0.0%) |
| Graduate Degree | 0 (0.0%) | 0 (0.0%) |
| Total | 0 (0.0%) | 0 (0.0%) |
Employment Characteristics in Rushville
Employment by Class of Employer in Rushville
Among the 201 employed individuals in Rushville, private company employees (103 | 51.2%), local government employees (36 | 17.9%), and not-for-profit organizations (21 | 10.4%) make up the most common classes of employment.
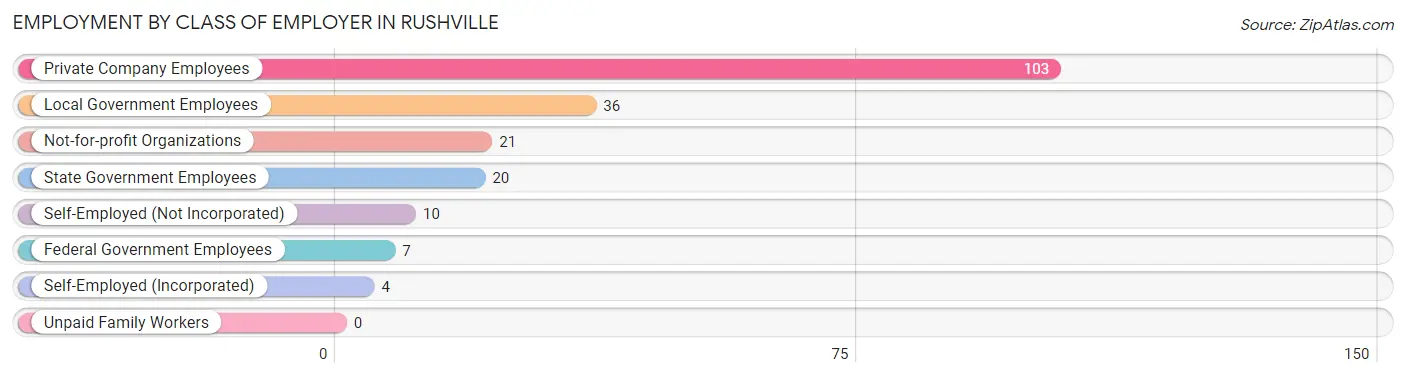
| Employer Class | # Employees | % Employees |
| Private Company Employees | 103 | 51.2% |
| Self-Employed (Incorporated) | 4 | 2.0% |
| Self-Employed (Not Incorporated) | 10 | 5.0% |
| Not-for-profit Organizations | 21 | 10.4% |
| Local Government Employees | 36 | 17.9% |
| State Government Employees | 20 | 10.0% |
| Federal Government Employees | 7 | 3.5% |
| Unpaid Family Workers | 0 | 0.0% |
| Total | 201 | 100.0% |
Employment Status by Age in Rushville
According to the labor force statistics for Rushville, out of the total population over 16 years of age (388), 55.7% or 216 individuals are in the labor force, with 6.0% or 13 of them unemployed. The age group with the highest labor force participation rate is 25 to 29 years, with 100.0% or 23 individuals in the labor force. Within the labor force, the 16 to 19 years age range has the highest percentage of unemployed individuals, with 57.1% or 4 of them being unemployed.
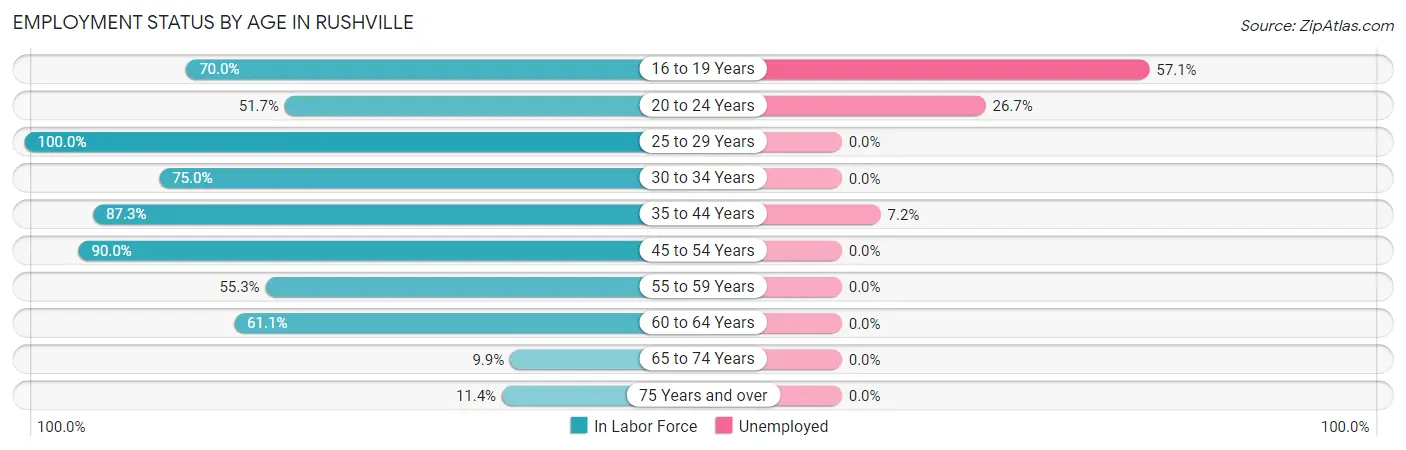
| Age Bracket | In Labor Force | Unemployed |
| 16 to 19 Years | 7 (70.0%) | 4 (57.1%) |
| 20 to 24 Years | 15 (51.7%) | 4 (26.7%) |
| 25 to 29 Years | 23 (100.0%) | 0 (0.0%) |
| 30 to 34 Years | 6 (75.0%) | 0 (0.0%) |
| 35 to 44 Years | 69 (87.3%) | 5 (7.2%) |
| 45 to 54 Years | 36 (90.0%) | 0 (0.0%) |
| 55 to 59 Years | 26 (55.3%) | 0 (0.0%) |
| 60 to 64 Years | 22 (61.1%) | 0 (0.0%) |
| 65 to 74 Years | 8 (9.9%) | 0 (0.0%) |
| 75 Years and over | 4 (11.4%) | 0 (0.0%) |
| Total | 216 (55.7%) | 13 (6.0%) |
Employment Status by Educational Attainment in Rushville
According to labor force statistics for Rushville, 78.1% of individuals (182) out of the total population between 25 and 64 years of age (233) are in the labor force, with 2.7% or 5 of them being unemployed. The group with the highest labor force participation rate are those with the educational attainment of bachelor's degree or higher, with 100.0% or 40 individuals in the labor force. Within the labor force, individuals with high school diploma education have the highest percentage of unemployment, with 7.7% or 5 of them being unemployed.
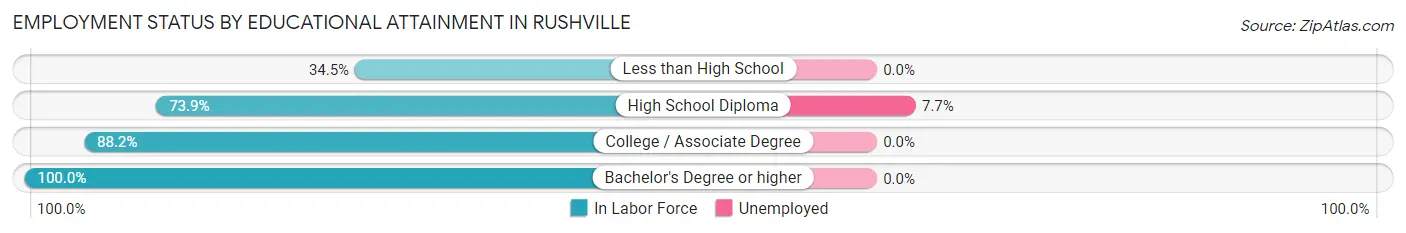
| Educational Attainment | In Labor Force | Unemployed |
| Less than High School | 10 (34.5%) | 0 (0.0%) |
| High School Diploma | 65 (73.9%) | 7 (7.7%) |
| College / Associate Degree | 67 (88.2%) | 0 (0.0%) |
| Bachelor's Degree or higher | 40 (100.0%) | 0 (0.0%) |
| Total | 182 (78.1%) | 6 (2.7%) |
Employment Occupations by Sex in Rushville
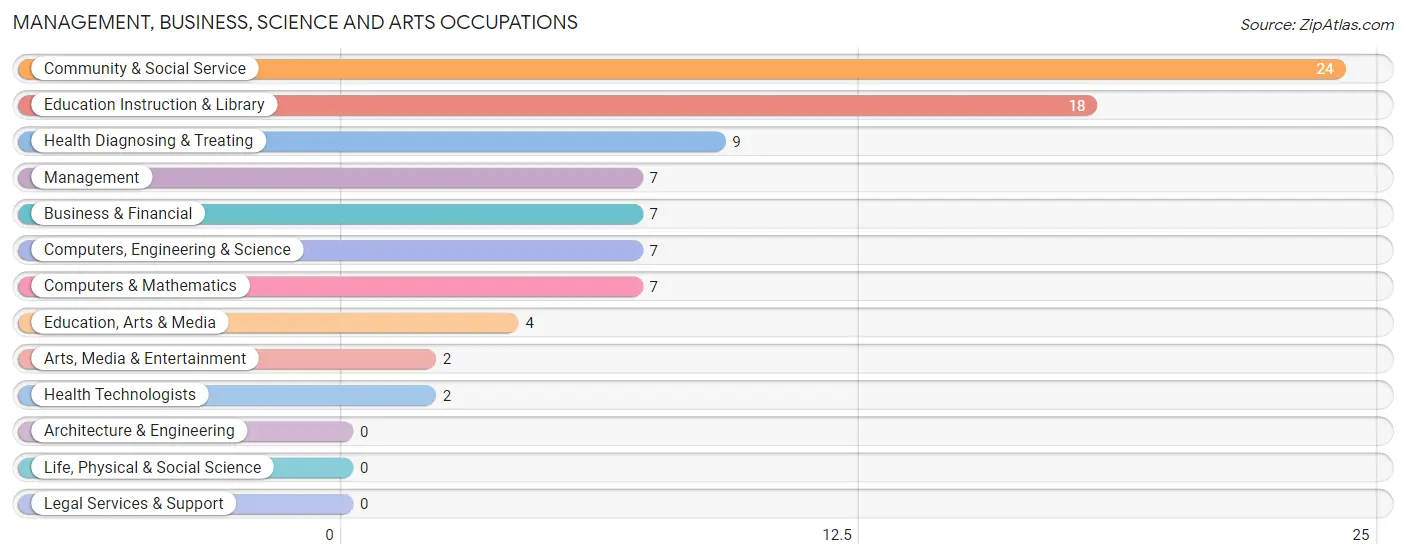
Management, Business, Science and Arts Occupations
The most common Management, Business, Science and Arts occupations in Rushville are Community & Social Service (24 | 11.8%), Education Instruction & Library (18 | 8.9%), Health Diagnosing & Treating (9 | 4.4%), Management (7 | 3.5%), and Business & Financial (7 | 3.5%).
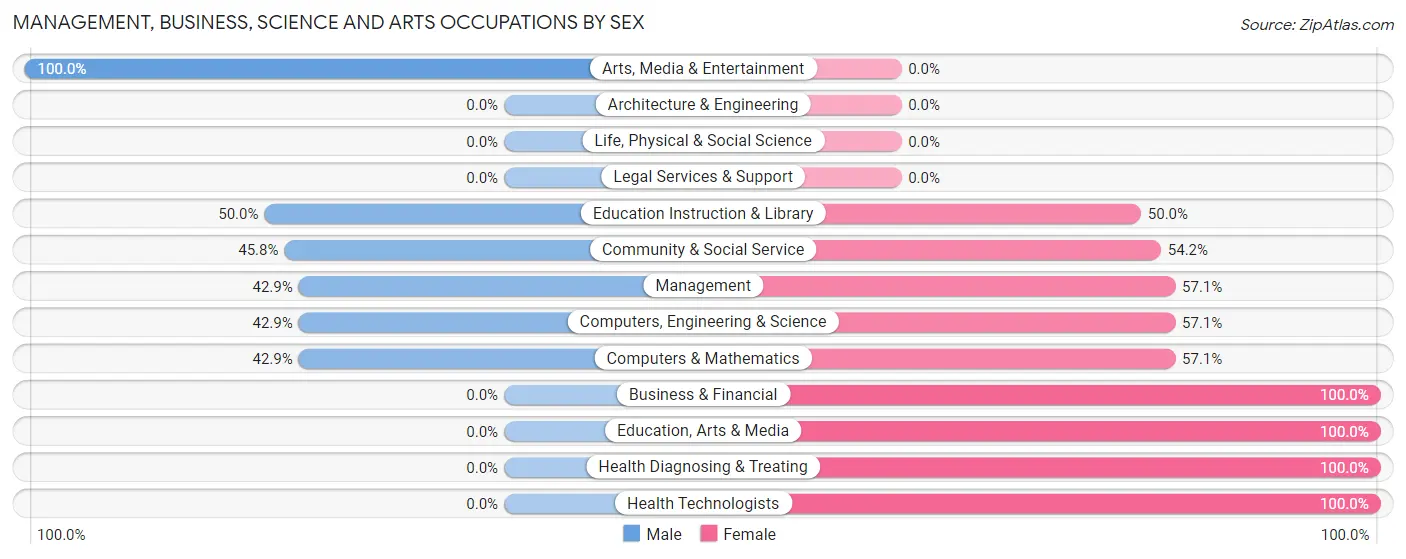
Management, Business, Science and Arts Occupations by Sex
Within the Management, Business, Science and Arts occupations in Rushville, the most male-oriented occupations are Arts, Media & Entertainment (100.0%), Education Instruction & Library (50.0%), and Community & Social Service (45.8%), while the most female-oriented occupations are Business & Financial (100.0%), Education, Arts & Media (100.0%), and Health Diagnosing & Treating (100.0%).
| Occupation | Male | Female |
| Management | 3 (42.9%) | 4 (57.1%) |
| Business & Financial | 0 (0.0%) | 7 (100.0%) |
| Computers, Engineering & Science | 3 (42.9%) | 4 (57.1%) |
| Computers & Mathematics | 3 (42.9%) | 4 (57.1%) |
| Architecture & Engineering | 0 (0.0%) | 0 (0.0%) |
| Life, Physical & Social Science | 0 (0.0%) | 0 (0.0%) |
| Community & Social Service | 11 (45.8%) | 13 (54.2%) |
| Education, Arts & Media | 0 (0.0%) | 4 (100.0%) |
| Legal Services & Support | 0 (0.0%) | 0 (0.0%) |
| Education Instruction & Library | 9 (50.0%) | 9 (50.0%) |
| Arts, Media & Entertainment | 2 (100.0%) | 0 (0.0%) |
| Health Diagnosing & Treating | 0 (0.0%) | 9 (100.0%) |
| Health Technologists | 0 (0.0%) | 2 (100.0%) |
| Total (Category) | 17 (31.5%) | 37 (68.5%) |
| Total (Overall) | 107 (52.7%) | 96 (47.3%) |
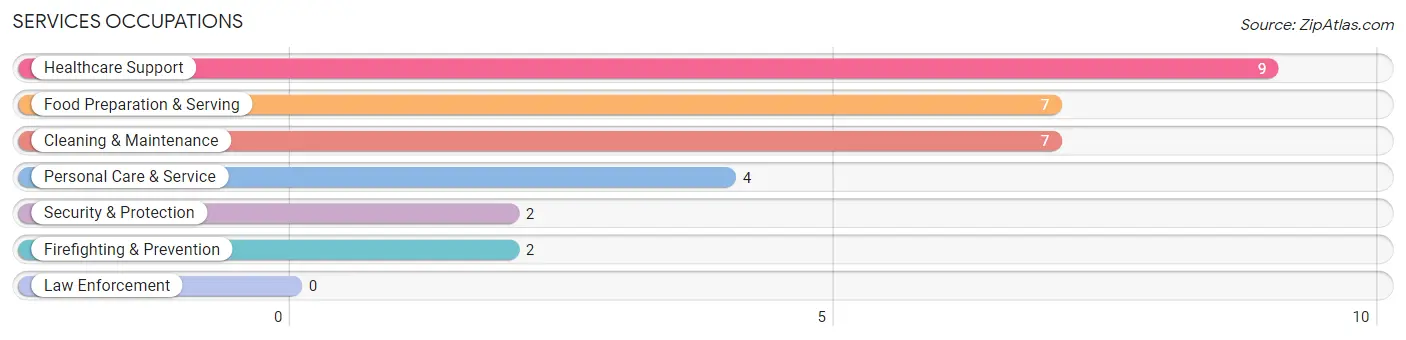
Services Occupations
The most common Services occupations in Rushville are Healthcare Support (9 | 4.4%), Food Preparation & Serving (7 | 3.5%), Cleaning & Maintenance (7 | 3.5%), Personal Care & Service (4 | 2.0%), and Security & Protection (2 | 1.0%).
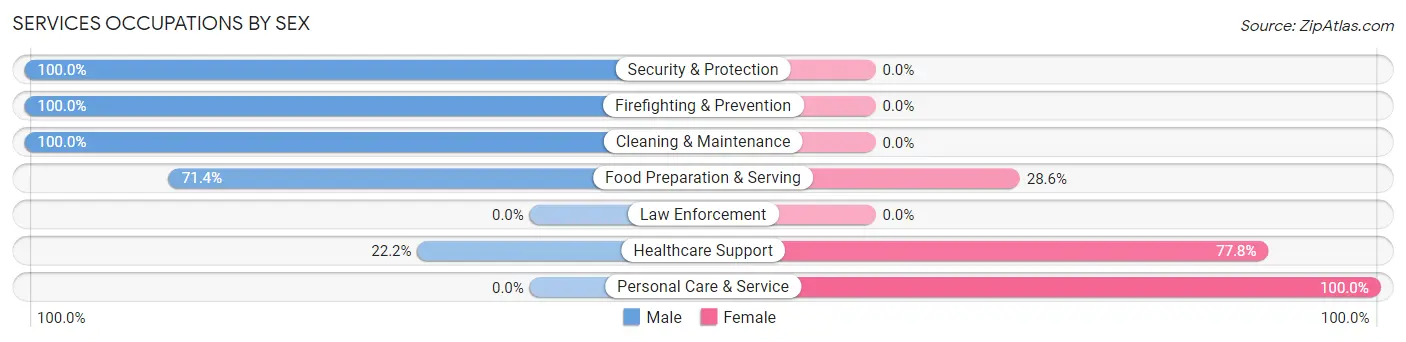
Services Occupations by Sex
Within the Services occupations in Rushville, the most male-oriented occupations are Security & Protection (100.0%), Firefighting & Prevention (100.0%), and Cleaning & Maintenance (100.0%), while the most female-oriented occupations are Personal Care & Service (100.0%), Healthcare Support (77.8%), and Food Preparation & Serving (28.6%).
| Occupation | Male | Female |
| Healthcare Support | 2 (22.2%) | 7 (77.8%) |
| Security & Protection | 2 (100.0%) | 0 (0.0%) |
| Firefighting & Prevention | 2 (100.0%) | 0 (0.0%) |
| Law Enforcement | 0 (0.0%) | 0 (0.0%) |
| Food Preparation & Serving | 5 (71.4%) | 2 (28.6%) |
| Cleaning & Maintenance | 7 (100.0%) | 0 (0.0%) |
| Personal Care & Service | 0 (0.0%) | 4 (100.0%) |
| Total (Category) | 16 (55.2%) | 13 (44.8%) |
| Total (Overall) | 107 (52.7%) | 96 (47.3%) |
Sales and Office Occupations
The most common Sales and Office occupations in Rushville are Office & Administration (29 | 14.3%), and Sales & Related (20 | 9.9%).
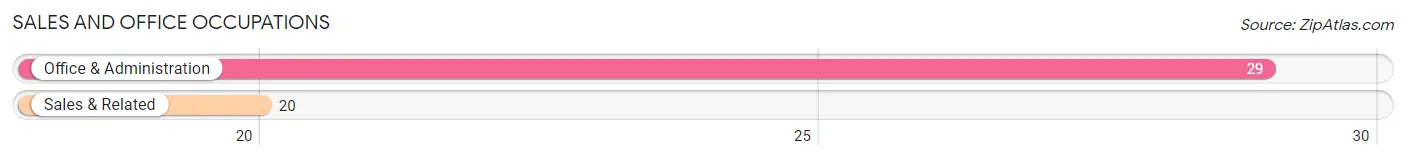
Sales and Office Occupations by Sex

| Occupation | Male | Female |
| Sales & Related | 13 (65.0%) | 7 (35.0%) |
| Office & Administration | 2 (6.9%) | 27 (93.1%) |
| Total (Category) | 15 (30.6%) | 34 (69.4%) |
| Total (Overall) | 107 (52.7%) | 96 (47.3%) |
Natural Resources, Construction and Maintenance Occupations
The most common Natural Resources, Construction and Maintenance occupations in Rushville are Construction & Extraction (8 | 3.9%), and Installation, Maintenance & Repair (5 | 2.5%).
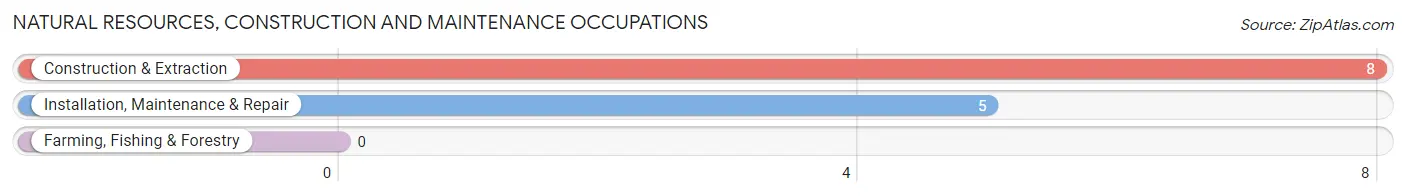
Natural Resources, Construction and Maintenance Occupations by Sex
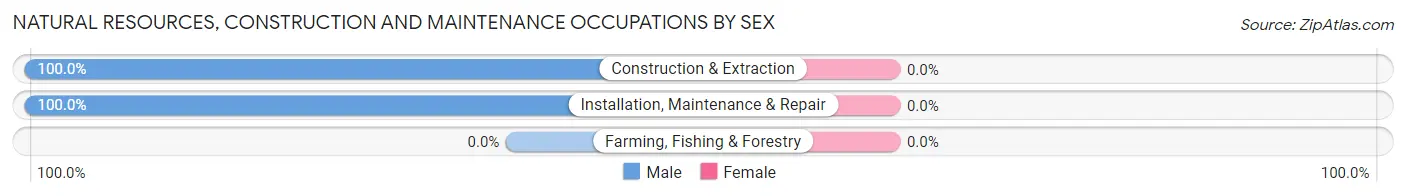
| Occupation | Male | Female |
| Farming, Fishing & Forestry | 0 (0.0%) | 0 (0.0%) |
| Construction & Extraction | 8 (100.0%) | 0 (0.0%) |
| Installation, Maintenance & Repair | 5 (100.0%) | 0 (0.0%) |
| Total (Category) | 13 (100.0%) | 0 (0.0%) |
| Total (Overall) | 107 (52.7%) | 96 (47.3%) |
Production, Transportation and Moving Occupations
The most common Production, Transportation and Moving occupations in Rushville are Material Moving (30 | 14.8%), Production (18 | 8.9%), and Transportation (10 | 4.9%).
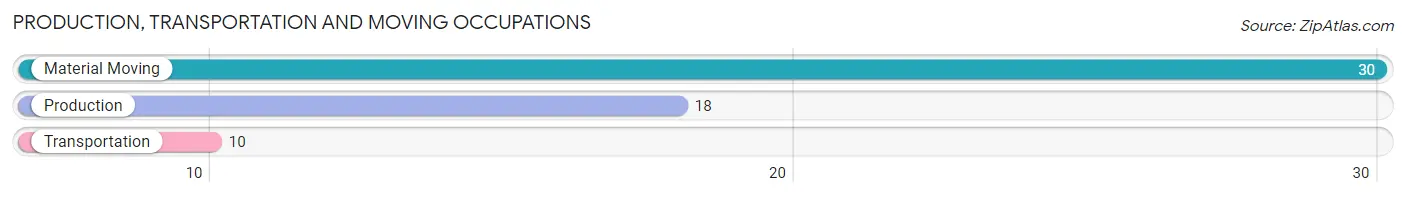
Production, Transportation and Moving Occupations by Sex
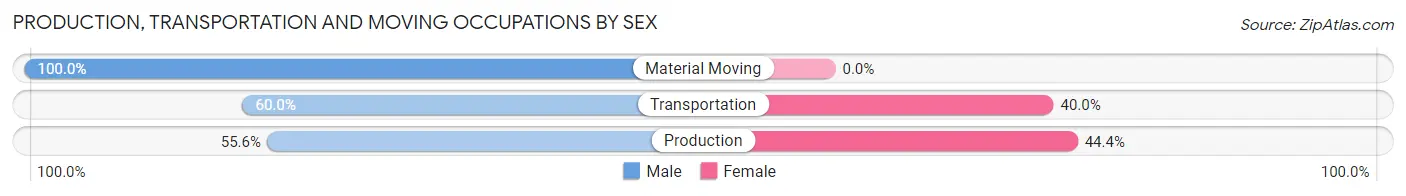
| Occupation | Male | Female |
| Production | 10 (55.6%) | 8 (44.4%) |
| Transportation | 6 (60.0%) | 4 (40.0%) |
| Material Moving | 30 (100.0%) | 0 (0.0%) |
| Total (Category) | 46 (79.3%) | 12 (20.7%) |
| Total (Overall) | 107 (52.7%) | 96 (47.3%) |
Employment Industries by Sex in Rushville
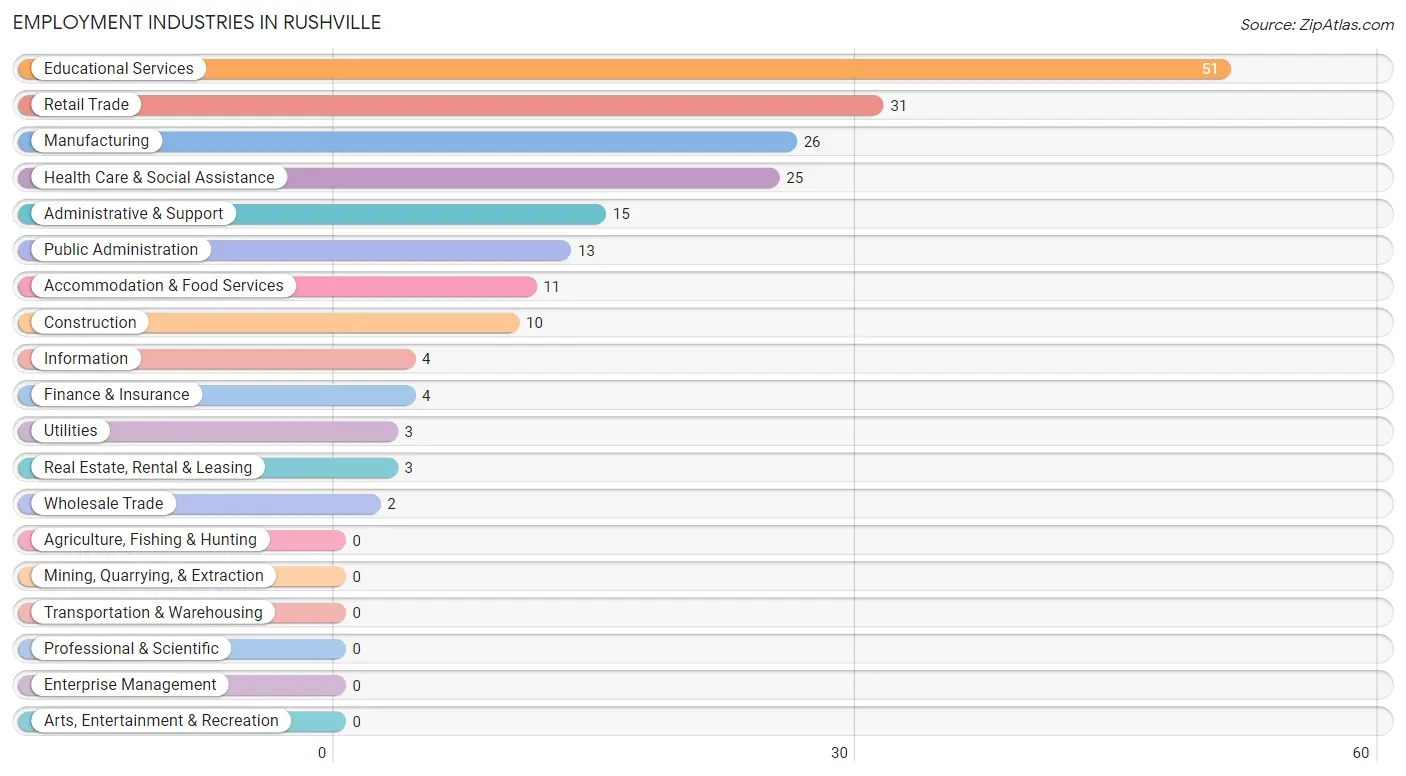
Employment Industries in Rushville
The major employment industries in Rushville include Educational Services (51 | 25.1%), Retail Trade (31 | 15.3%), Manufacturing (26 | 12.8%), Health Care & Social Assistance (25 | 12.3%), and Administrative & Support (15 | 7.4%).
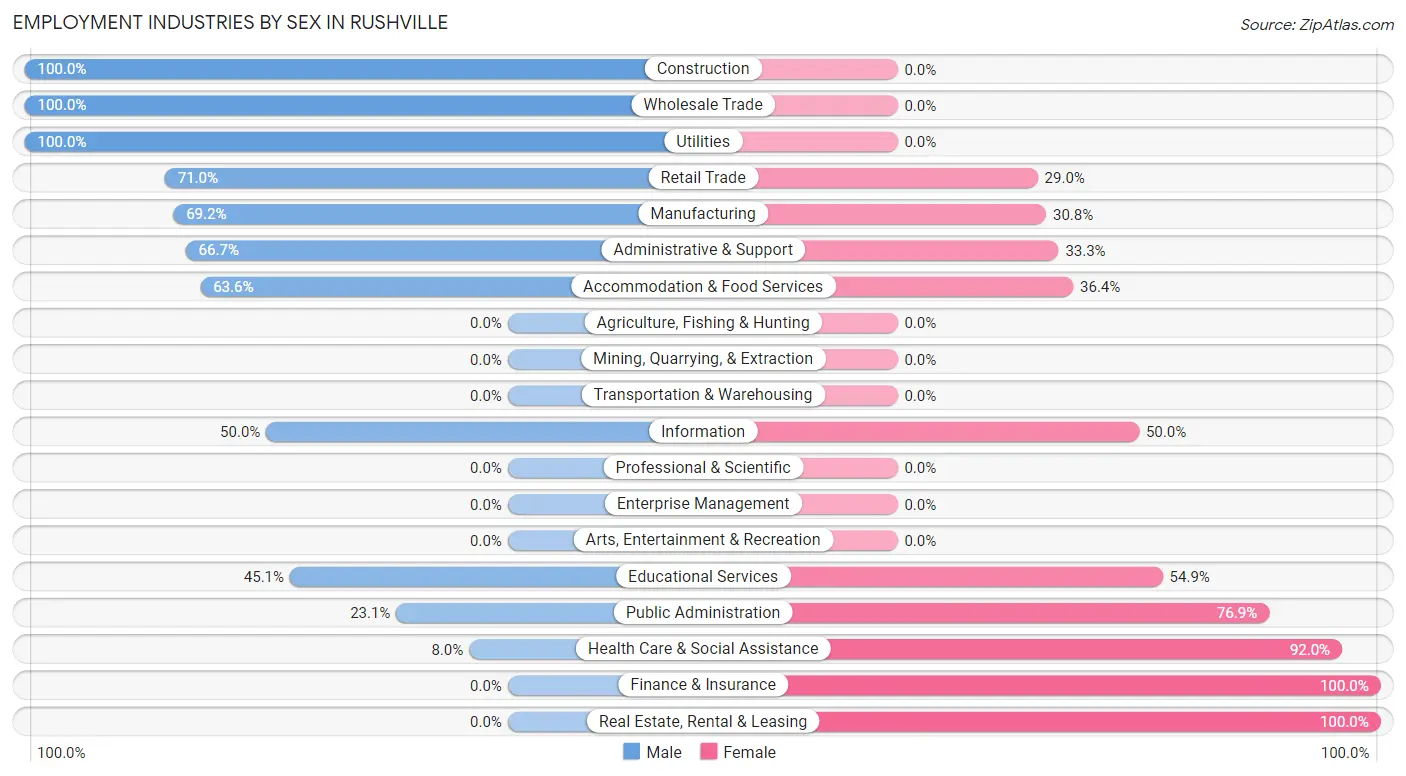
Employment Industries by Sex in Rushville
The Rushville industries that see more men than women are Construction (100.0%), Wholesale Trade (100.0%), and Utilities (100.0%), whereas the industries that tend to have a higher number of women are Finance & Insurance (100.0%), Real Estate, Rental & Leasing (100.0%), and Health Care & Social Assistance (92.0%).
| Industry | Male | Female |
| Agriculture, Fishing & Hunting | 0 (0.0%) | 0 (0.0%) |
| Mining, Quarrying, & Extraction | 0 (0.0%) | 0 (0.0%) |
| Construction | 10 (100.0%) | 0 (0.0%) |
| Manufacturing | 18 (69.2%) | 8 (30.8%) |
| Wholesale Trade | 2 (100.0%) | 0 (0.0%) |
| Retail Trade | 22 (71.0%) | 9 (29.0%) |
| Transportation & Warehousing | 0 (0.0%) | 0 (0.0%) |
| Utilities | 3 (100.0%) | 0 (0.0%) |
| Information | 2 (50.0%) | 2 (50.0%) |
| Finance & Insurance | 0 (0.0%) | 4 (100.0%) |
| Real Estate, Rental & Leasing | 0 (0.0%) | 3 (100.0%) |
| Professional & Scientific | 0 (0.0%) | 0 (0.0%) |
| Enterprise Management | 0 (0.0%) | 0 (0.0%) |
| Administrative & Support | 10 (66.7%) | 5 (33.3%) |
| Educational Services | 23 (45.1%) | 28 (54.9%) |
| Health Care & Social Assistance | 2 (8.0%) | 23 (92.0%) |
| Arts, Entertainment & Recreation | 0 (0.0%) | 0 (0.0%) |
| Accommodation & Food Services | 7 (63.6%) | 4 (36.4%) |
| Public Administration | 3 (23.1%) | 10 (76.9%) |
| Total | 107 (52.7%) | 96 (47.3%) |
Education in Rushville
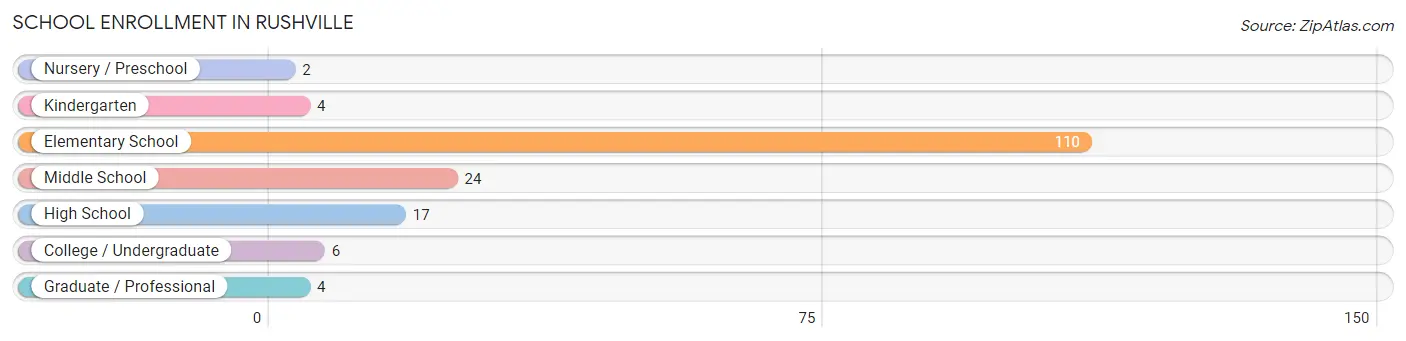
School Enrollment in Rushville
The most common levels of schooling among the 167 students in Rushville are elementary school (110 | 65.9%), middle school (24 | 14.4%), and high school (17 | 10.2%).
| School Level | # Students | % Students |
| Nursery / Preschool | 2 | 1.2% |
| Kindergarten | 4 | 2.4% |
| Elementary School | 110 | 65.9% |
| Middle School | 24 | 14.4% |
| High School | 17 | 10.2% |
| College / Undergraduate | 6 | 3.6% |
| Graduate / Professional | 4 | 2.4% |
| Total | 167 | 100.0% |
School Enrollment by Age by Funding Source in Rushville
Out of a total of 167 students who are enrolled in schools in Rushville, 10 (6.0%) attend a private institution, while the remaining 157 (94.0%) are enrolled in public schools. The age group of 20 to 24 year olds has the highest likelihood of being enrolled in private schools, with 2 (100.0% in the age bracket) enrolled. Conversely, the age group of 3 to 4 year olds has the lowest likelihood of being enrolled in a private school, with 2 (100.0% in the age bracket) attending a public institution.
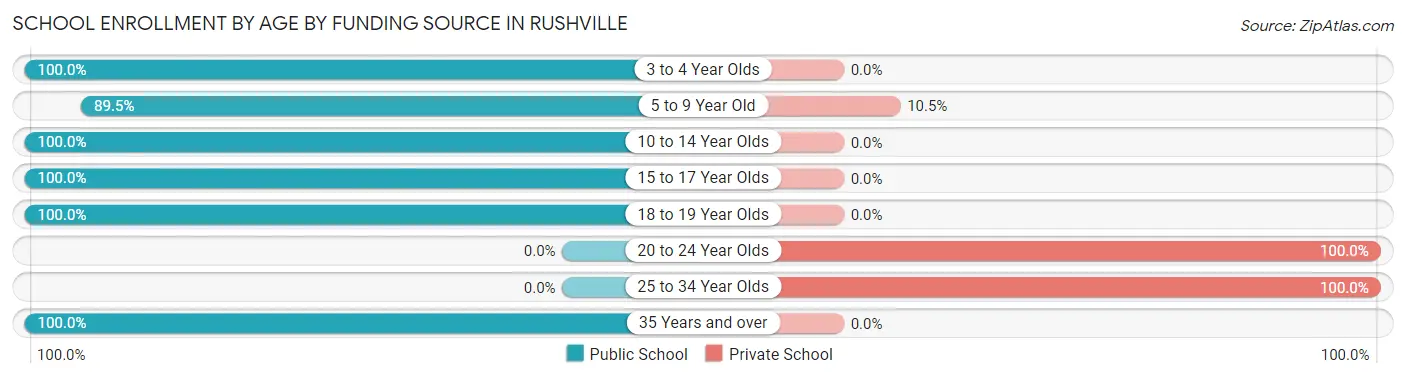
| Age Bracket | Public School | Private School |
| 3 to 4 Year Olds | 2 (100.0%) | 0 (0.0%) |
| 5 to 9 Year Old | 34 (89.5%) | 4 (10.5%) |
| 10 to 14 Year Olds | 106 (100.0%) | 0 (0.0%) |
| 15 to 17 Year Olds | 10 (100.0%) | 0 (0.0%) |
| 18 to 19 Year Olds | 1 (100.0%) | 0 (0.0%) |
| 20 to 24 Year Olds | 0 (0.0%) | 2 (100.0%) |
| 25 to 34 Year Olds | 0 (0.0%) | 4 (100.0%) |
| 35 Years and over | 4 (100.0%) | 0 (0.0%) |
| Total | 157 (94.0%) | 10 (6.0%) |
Educational Attainment by Field of Study in Rushville
Education (25 | 37.9%), business (9 | 13.6%), bio, nature & agricultural (7 | 10.6%), psychology (6 | 9.1%), and arts & humanities (6 | 9.1%) are the most common fields of study among 66 individuals in Rushville who have obtained a bachelor's degree or higher.
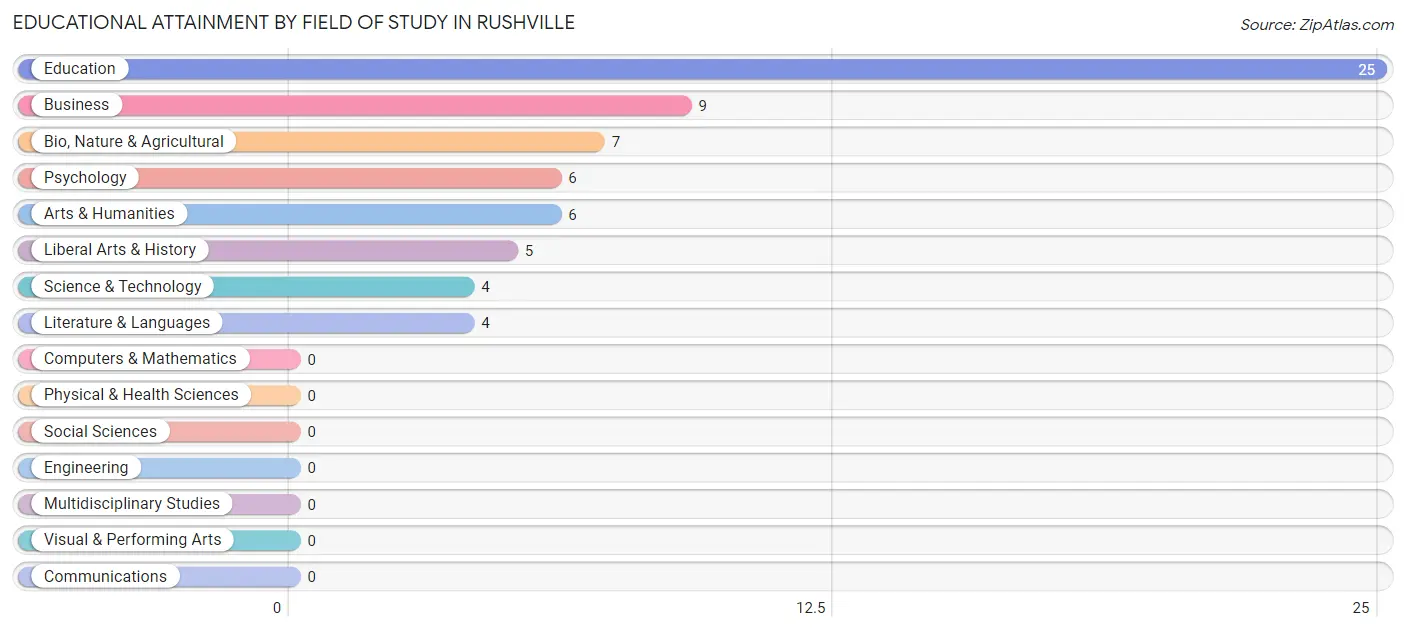
| Field of Study | # Graduates | % Graduates |
| Computers & Mathematics | 0 | 0.0% |
| Bio, Nature & Agricultural | 7 | 10.6% |
| Physical & Health Sciences | 0 | 0.0% |
| Psychology | 6 | 9.1% |
| Social Sciences | 0 | 0.0% |
| Engineering | 0 | 0.0% |
| Multidisciplinary Studies | 0 | 0.0% |
| Science & Technology | 4 | 6.1% |
| Business | 9 | 13.6% |
| Education | 25 | 37.9% |
| Literature & Languages | 4 | 6.1% |
| Liberal Arts & History | 5 | 7.6% |
| Visual & Performing Arts | 0 | 0.0% |
| Communications | 0 | 0.0% |
| Arts & Humanities | 6 | 9.1% |
| Total | 66 | 100.0% |
Transportation & Commute in Rushville
Vehicle Availability by Sex in Rushville
The most prevalent vehicle ownership categories in Rushville are males with 2 vehicles (42, accounting for 40.0%) and females with 2 vehicles (53, making up 43.8%).
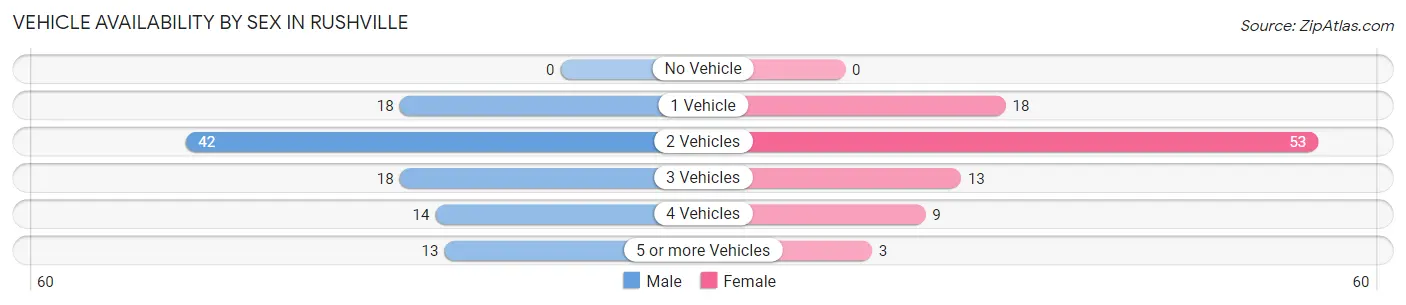
| Vehicles Available | Male | Female |
| No Vehicle | 0 (0.0%) | 0 (0.0%) |
| 1 Vehicle | 18 (17.1%) | 18 (18.8%) |
| 2 Vehicles | 42 (40.0%) | 53 (55.2%) |
| 3 Vehicles | 18 (17.1%) | 13 (13.5%) |
| 4 Vehicles | 14 (13.3%) | 9 (9.4%) |
| 5 or more Vehicles | 13 (12.4%) | 3 (3.1%) |
| Total | 105 (100.0%) | 96 (100.0%) |
Commute Time in Rushville
The most frequently occuring commute durations in Rushville are 20 to 24 minutes (57 commuters, 28.4%), 30 to 34 minutes (31 commuters, 15.4%), and 35 to 39 minutes (20 commuters, 10.0%).
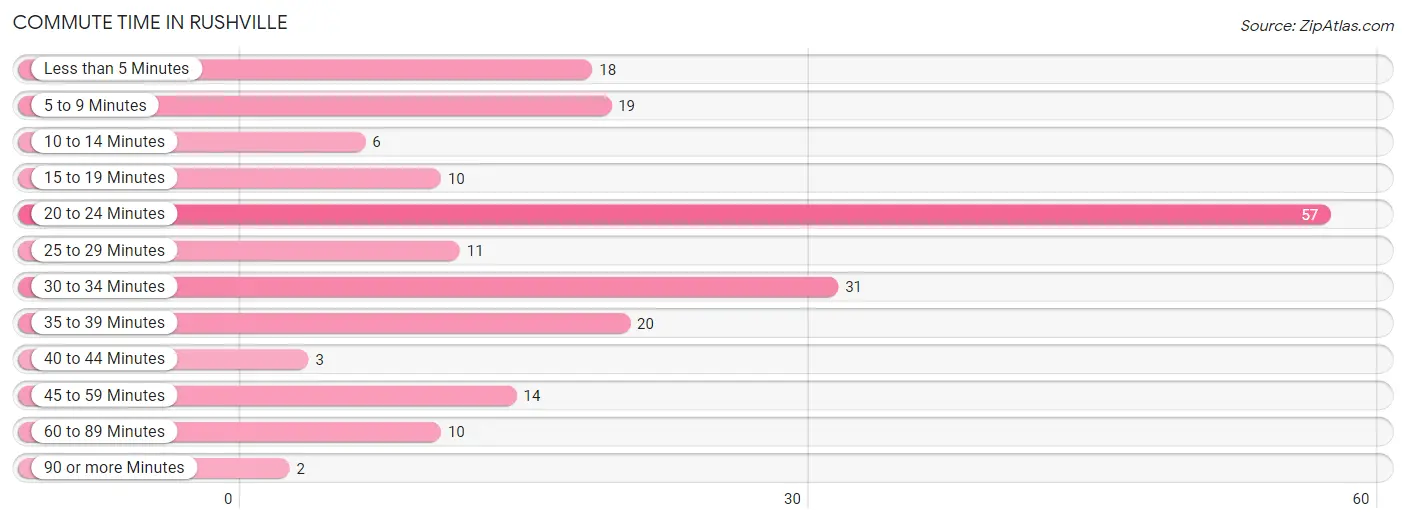
| Commute Time | # Commuters | % Commuters |
| Less than 5 Minutes | 18 | 9.0% |
| 5 to 9 Minutes | 19 | 9.5% |
| 10 to 14 Minutes | 6 | 3.0% |
| 15 to 19 Minutes | 10 | 5.0% |
| 20 to 24 Minutes | 57 | 28.4% |
| 25 to 29 Minutes | 11 | 5.5% |
| 30 to 34 Minutes | 31 | 15.4% |
| 35 to 39 Minutes | 20 | 10.0% |
| 40 to 44 Minutes | 3 | 1.5% |
| 45 to 59 Minutes | 14 | 7.0% |
| 60 to 89 Minutes | 10 | 5.0% |
| 90 or more Minutes | 2 | 1.0% |
Commute Time by Sex in Rushville
The most common commute times in Rushville are 30 to 34 minutes (22 commuters, 20.9%) for males and 20 to 24 minutes (37 commuters, 38.5%) for females.
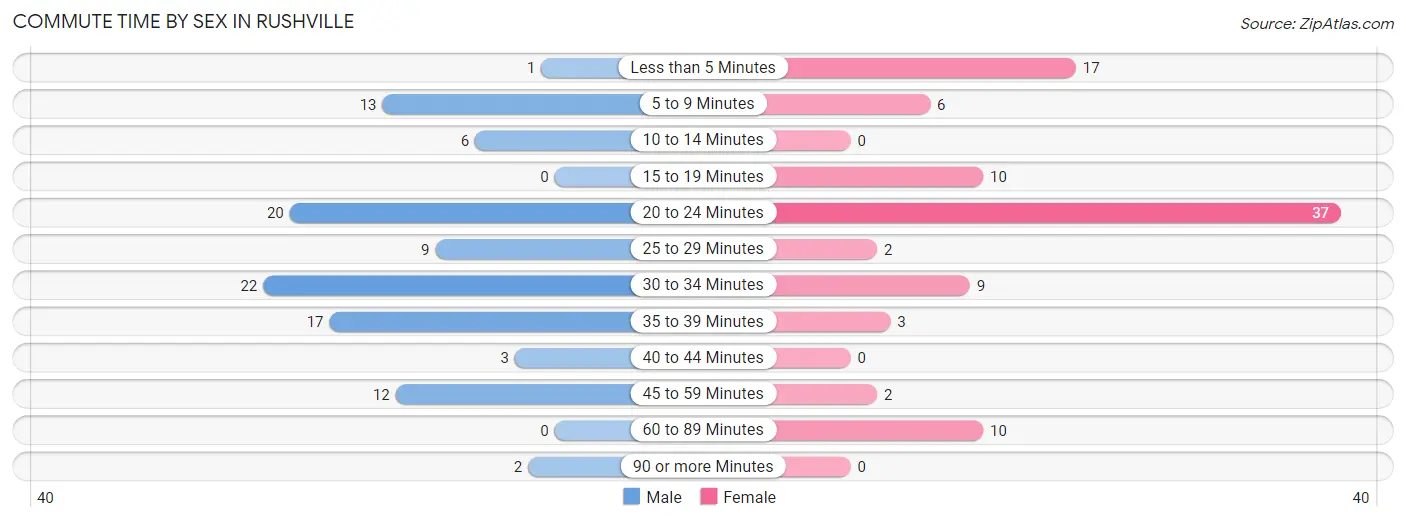
| Commute Time | Male | Female |
| Less than 5 Minutes | 1 (0.9%) | 17 (17.7%) |
| 5 to 9 Minutes | 13 (12.4%) | 6 (6.2%) |
| 10 to 14 Minutes | 6 (5.7%) | 0 (0.0%) |
| 15 to 19 Minutes | 0 (0.0%) | 10 (10.4%) |
| 20 to 24 Minutes | 20 (19.1%) | 37 (38.5%) |
| 25 to 29 Minutes | 9 (8.6%) | 2 (2.1%) |
| 30 to 34 Minutes | 22 (20.9%) | 9 (9.4%) |
| 35 to 39 Minutes | 17 (16.2%) | 3 (3.1%) |
| 40 to 44 Minutes | 3 (2.9%) | 0 (0.0%) |
| 45 to 59 Minutes | 12 (11.4%) | 2 (2.1%) |
| 60 to 89 Minutes | 0 (0.0%) | 10 (10.4%) |
| 90 or more Minutes | 2 (1.9%) | 0 (0.0%) |
Time of Departure to Work by Sex in Rushville
The most frequent times of departure to work in Rushville are 7:30 AM to 7:59 AM (21, 20.0%) for males and 7:00 AM to 7:29 AM (21, 21.9%) for females.
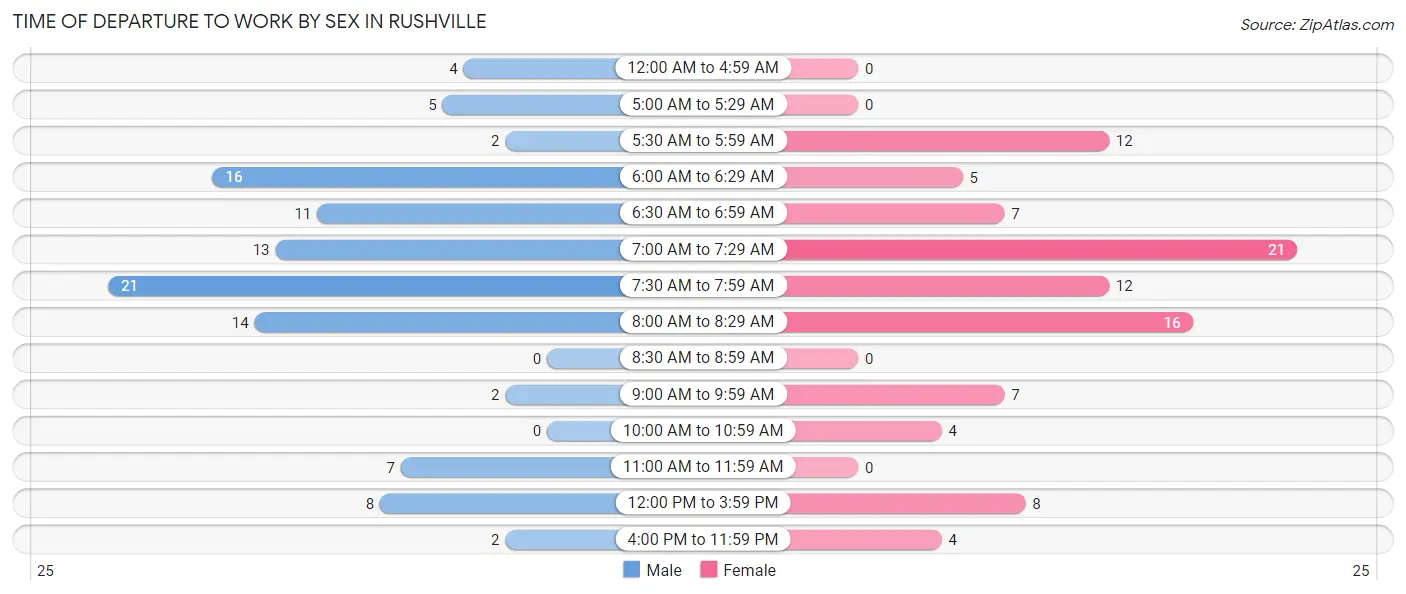
| Time of Departure | Male | Female |
| 12:00 AM to 4:59 AM | 4 (3.8%) | 0 (0.0%) |
| 5:00 AM to 5:29 AM | 5 (4.8%) | 0 (0.0%) |
| 5:30 AM to 5:59 AM | 2 (1.9%) | 12 (12.5%) |
| 6:00 AM to 6:29 AM | 16 (15.2%) | 5 (5.2%) |
| 6:30 AM to 6:59 AM | 11 (10.5%) | 7 (7.3%) |
| 7:00 AM to 7:29 AM | 13 (12.4%) | 21 (21.9%) |
| 7:30 AM to 7:59 AM | 21 (20.0%) | 12 (12.5%) |
| 8:00 AM to 8:29 AM | 14 (13.3%) | 16 (16.7%) |
| 8:30 AM to 8:59 AM | 0 (0.0%) | 0 (0.0%) |
| 9:00 AM to 9:59 AM | 2 (1.9%) | 7 (7.3%) |
| 10:00 AM to 10:59 AM | 0 (0.0%) | 4 (4.2%) |
| 11:00 AM to 11:59 AM | 7 (6.7%) | 0 (0.0%) |
| 12:00 PM to 3:59 PM | 8 (7.6%) | 8 (8.3%) |
| 4:00 PM to 11:59 PM | 2 (1.9%) | 4 (4.2%) |
| Total | 105 (100.0%) | 96 (100.0%) |
Housing Occupancy in Rushville
Occupancy by Ownership in Rushville
Of the total 202 dwellings in Rushville, owner-occupied units account for 155 (76.7%), while renter-occupied units make up 47 (23.3%).
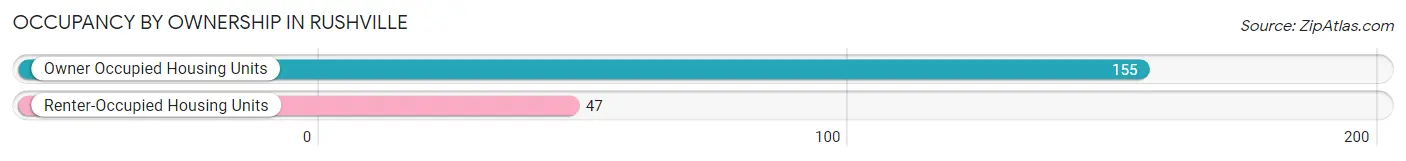
| Occupancy | # Housing Units | % Housing Units |
| Owner Occupied Housing Units | 155 | 76.7% |
| Renter-Occupied Housing Units | 47 | 23.3% |
| Total Occupied Housing Units | 202 | 100.0% |
Occupancy by Household Size in Rushville
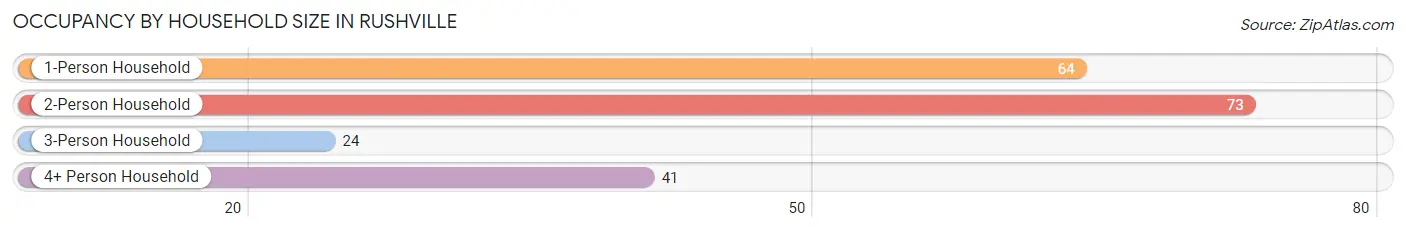
| Household Size | # Housing Units | % Housing Units |
| 1-Person Household | 64 | 31.7% |
| 2-Person Household | 73 | 36.1% |
| 3-Person Household | 24 | 11.9% |
| 4+ Person Household | 41 | 20.3% |
| Total Housing Units | 202 | 100.0% |
Occupancy by Ownership by Household Size in Rushville
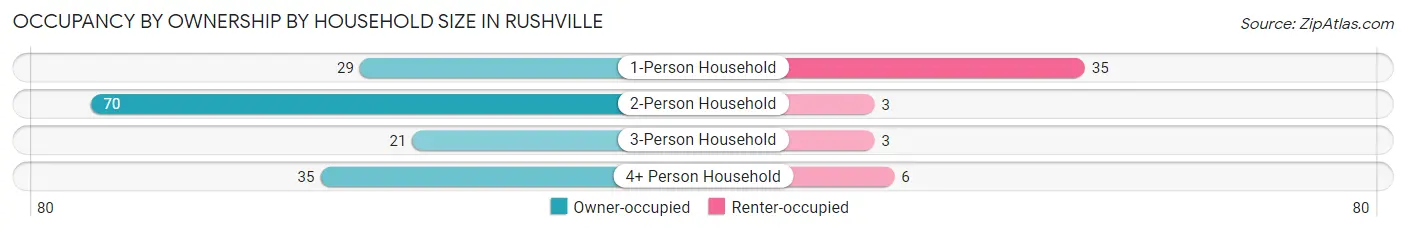
| Household Size | Owner-occupied | Renter-occupied |
| 1-Person Household | 29 (45.3%) | 35 (54.7%) |
| 2-Person Household | 70 (95.9%) | 3 (4.1%) |
| 3-Person Household | 21 (87.5%) | 3 (12.5%) |
| 4+ Person Household | 35 (85.4%) | 6 (14.6%) |
| Total Housing Units | 155 (76.7%) | 47 (23.3%) |
Occupancy by Educational Attainment in Rushville
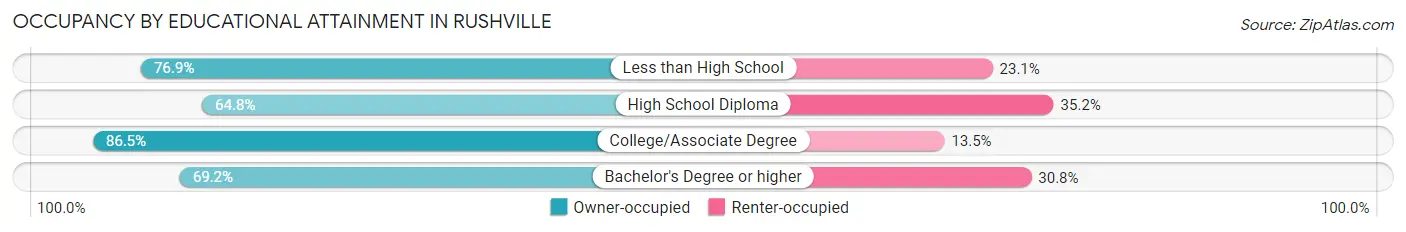
| Household Size | Owner-occupied | Renter-occupied |
| Less than High School | 10 (76.9%) | 3 (23.1%) |
| High School Diploma | 35 (64.8%) | 19 (35.2%) |
| College/Associate Degree | 83 (86.5%) | 13 (13.5%) |
| Bachelor's Degree or higher | 27 (69.2%) | 12 (30.8%) |
Occupancy by Age of Householder in Rushville
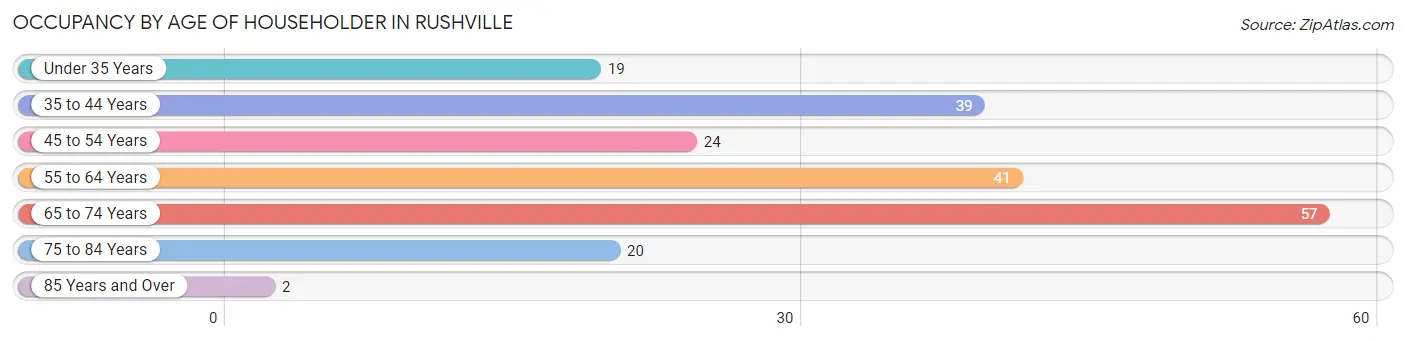
| Age Bracket | # Households | % Households |
| Under 35 Years | 19 | 9.4% |
| 35 to 44 Years | 39 | 19.3% |
| 45 to 54 Years | 24 | 11.9% |
| 55 to 64 Years | 41 | 20.3% |
| 65 to 74 Years | 57 | 28.2% |
| 75 to 84 Years | 20 | 9.9% |
| 85 Years and Over | 2 | 1.0% |
| Total | 202 | 100.0% |
Housing Finances in Rushville
Median Income by Occupancy in Rushville
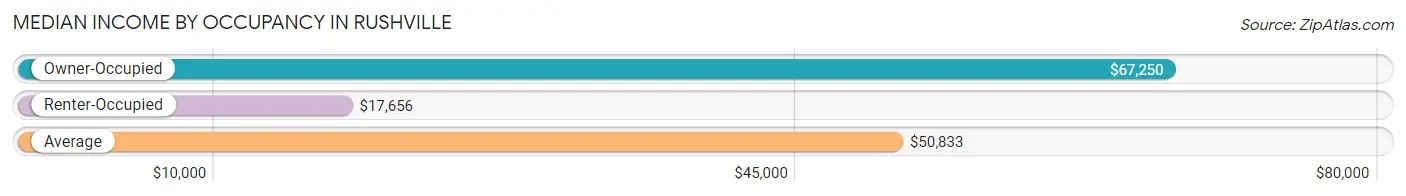
| Occupancy Type | # Households | Median Income |
| Owner-Occupied | 155 (76.7%) | $67,250 |
| Renter-Occupied | 47 (23.3%) | $17,656 |
| Average | 202 (100.0%) | $50,833 |
Occupancy by Householder Income Bracket in Rushville
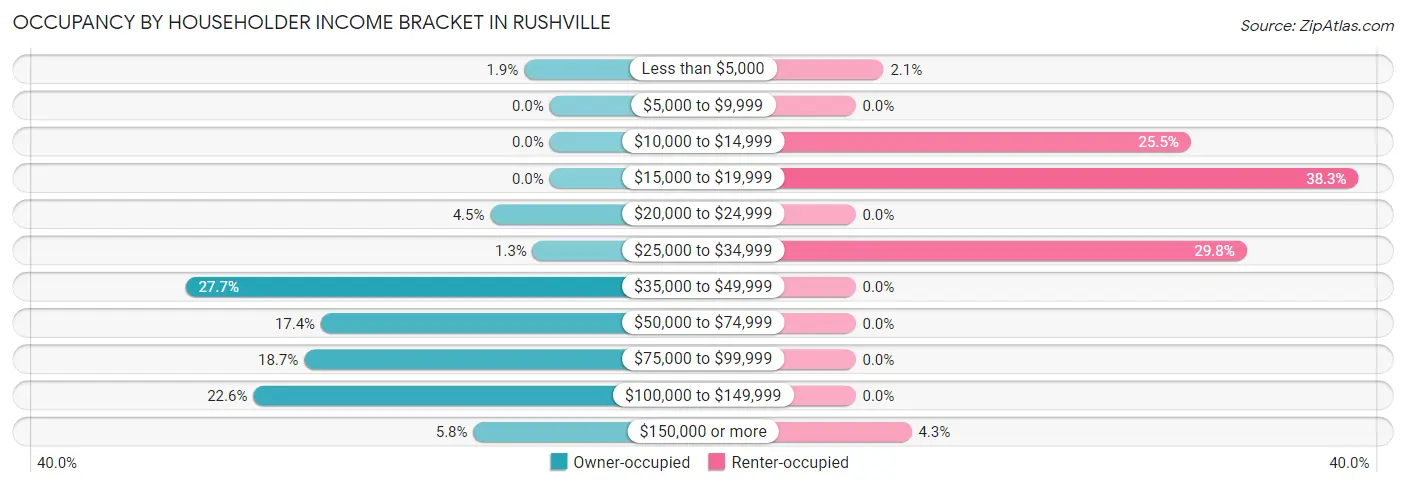
| Income Bracket | Owner-occupied | Renter-occupied |
| Less than $5,000 | 3 (1.9%) | 1 (2.1%) |
| $5,000 to $9,999 | 0 (0.0%) | 0 (0.0%) |
| $10,000 to $14,999 | 0 (0.0%) | 12 (25.5%) |
| $15,000 to $19,999 | 0 (0.0%) | 18 (38.3%) |
| $20,000 to $24,999 | 7 (4.5%) | 0 (0.0%) |
| $25,000 to $34,999 | 2 (1.3%) | 14 (29.8%) |
| $35,000 to $49,999 | 43 (27.7%) | 0 (0.0%) |
| $50,000 to $74,999 | 27 (17.4%) | 0 (0.0%) |
| $75,000 to $99,999 | 29 (18.7%) | 0 (0.0%) |
| $100,000 to $149,999 | 35 (22.6%) | 0 (0.0%) |
| $150,000 or more | 9 (5.8%) | 2 (4.3%) |
| Total | 155 (100.0%) | 47 (100.0%) |
Monthly Housing Cost Tiers in Rushville
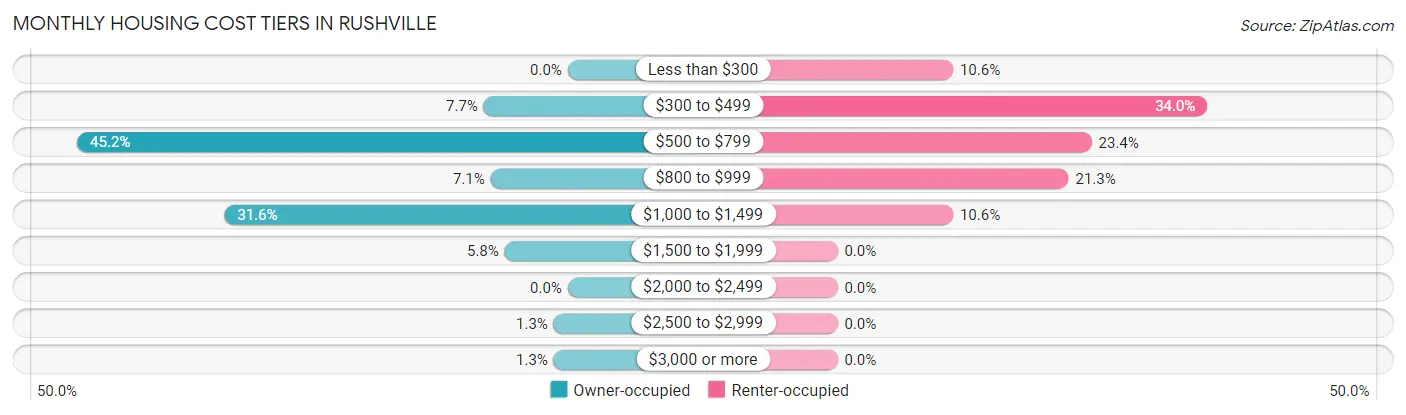
| Monthly Cost | Owner-occupied | Renter-occupied |
| Less than $300 | 0 (0.0%) | 5 (10.6%) |
| $300 to $499 | 12 (7.7%) | 16 (34.0%) |
| $500 to $799 | 70 (45.2%) | 11 (23.4%) |
| $800 to $999 | 11 (7.1%) | 10 (21.3%) |
| $1,000 to $1,499 | 49 (31.6%) | 5 (10.6%) |
| $1,500 to $1,999 | 9 (5.8%) | 0 (0.0%) |
| $2,000 to $2,499 | 0 (0.0%) | 0 (0.0%) |
| $2,500 to $2,999 | 2 (1.3%) | 0 (0.0%) |
| $3,000 or more | 2 (1.3%) | 0 (0.0%) |
| Total | 155 (100.0%) | 47 (100.0%) |
Physical Housing Characteristics in Rushville
Housing Structures in Rushville
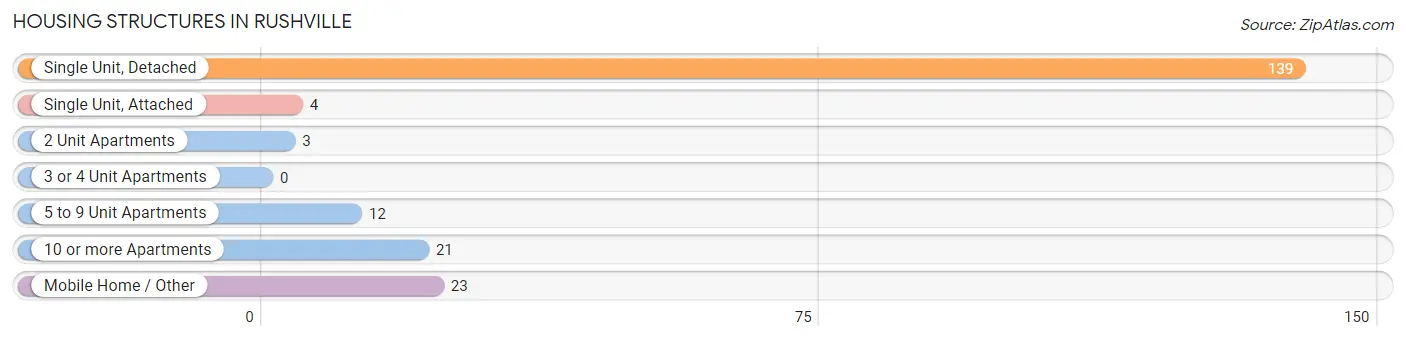
| Structure Type | # Housing Units | % Housing Units |
| Single Unit, Detached | 139 | 68.8% |
| Single Unit, Attached | 4 | 2.0% |
| 2 Unit Apartments | 3 | 1.5% |
| 3 or 4 Unit Apartments | 0 | 0.0% |
| 5 to 9 Unit Apartments | 12 | 5.9% |
| 10 or more Apartments | 21 | 10.4% |
| Mobile Home / Other | 23 | 11.4% |
| Total | 202 | 100.0% |
Housing Structures by Occupancy in Rushville
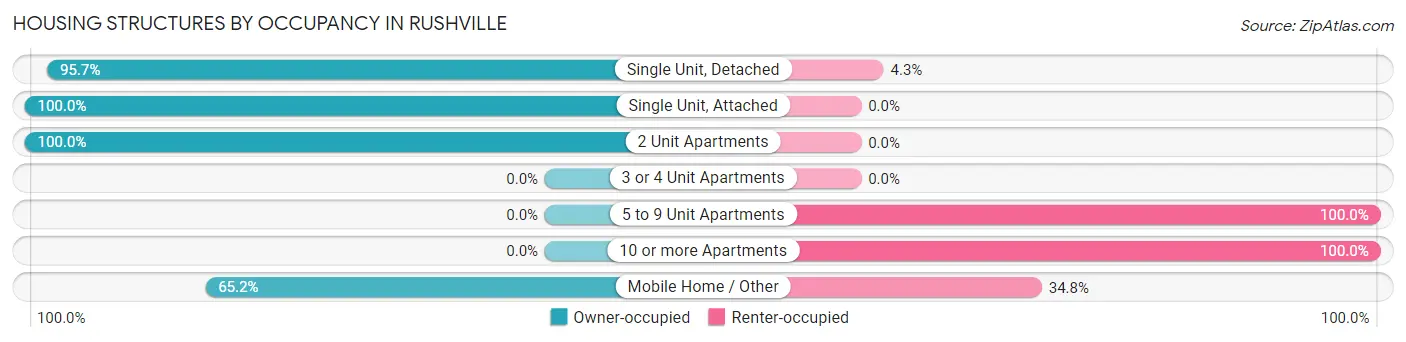
| Structure Type | Owner-occupied | Renter-occupied |
| Single Unit, Detached | 133 (95.7%) | 6 (4.3%) |
| Single Unit, Attached | 4 (100.0%) | 0 (0.0%) |
| 2 Unit Apartments | 3 (100.0%) | 0 (0.0%) |
| 3 or 4 Unit Apartments | 0 (0.0%) | 0 (0.0%) |
| 5 to 9 Unit Apartments | 0 (0.0%) | 12 (100.0%) |
| 10 or more Apartments | 0 (0.0%) | 21 (100.0%) |
| Mobile Home / Other | 15 (65.2%) | 8 (34.8%) |
| Total | 155 (76.7%) | 47 (23.3%) |
Housing Structures by Number of Rooms in Rushville
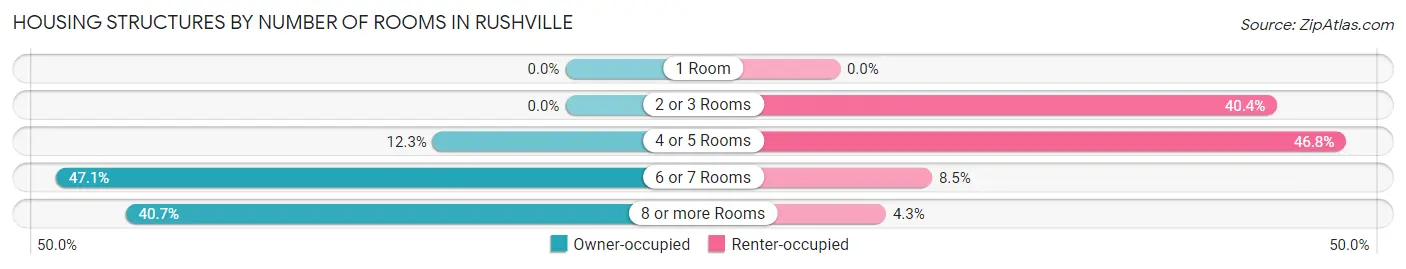
| Number of Rooms | Owner-occupied | Renter-occupied |
| 1 Room | 0 (0.0%) | 0 (0.0%) |
| 2 or 3 Rooms | 0 (0.0%) | 19 (40.4%) |
| 4 or 5 Rooms | 19 (12.3%) | 22 (46.8%) |
| 6 or 7 Rooms | 73 (47.1%) | 4 (8.5%) |
| 8 or more Rooms | 63 (40.6%) | 2 (4.3%) |
| Total | 155 (100.0%) | 47 (100.0%) |
Housing Structure by Heating Type in Rushville
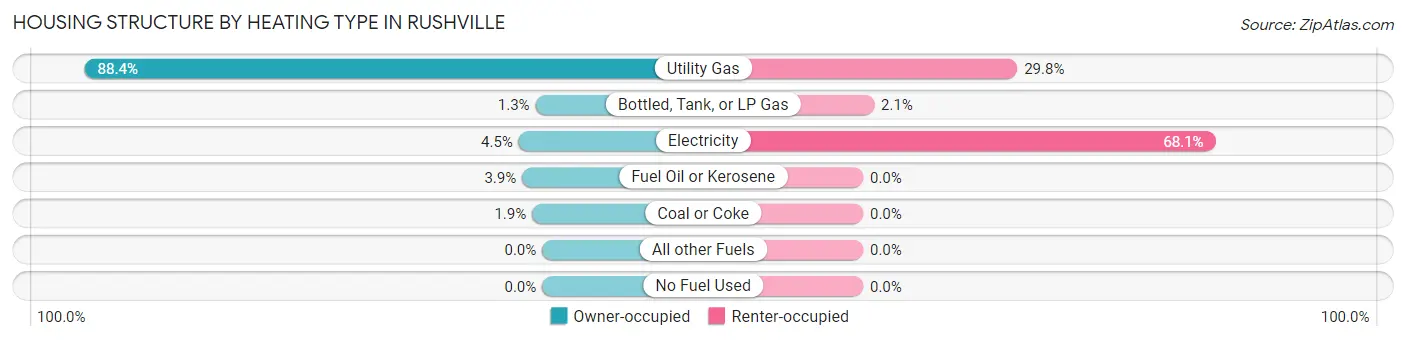
| Heating Type | Owner-occupied | Renter-occupied |
| Utility Gas | 137 (88.4%) | 14 (29.8%) |
| Bottled, Tank, or LP Gas | 2 (1.3%) | 1 (2.1%) |
| Electricity | 7 (4.5%) | 32 (68.1%) |
| Fuel Oil or Kerosene | 6 (3.9%) | 0 (0.0%) |
| Coal or Coke | 3 (1.9%) | 0 (0.0%) |
| All other Fuels | 0 (0.0%) | 0 (0.0%) |
| No Fuel Used | 0 (0.0%) | 0 (0.0%) |
| Total | 155 (100.0%) | 47 (100.0%) |
Household Vehicle Usage in Rushville
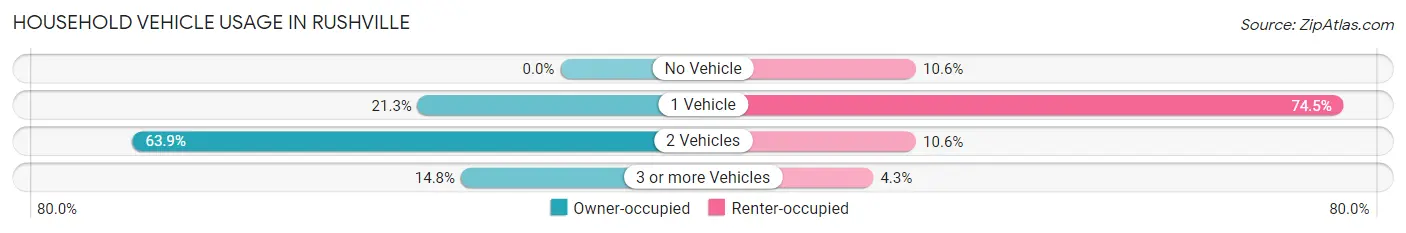
| Vehicles per Household | Owner-occupied | Renter-occupied |
| No Vehicle | 0 (0.0%) | 5 (10.6%) |
| 1 Vehicle | 33 (21.3%) | 35 (74.5%) |
| 2 Vehicles | 99 (63.9%) | 5 (10.6%) |
| 3 or more Vehicles | 23 (14.8%) | 2 (4.3%) |
| Total | 155 (100.0%) | 47 (100.0%) |
Real Estate & Mortgages in Rushville
Real Estate and Mortgage Overview in Rushville
| Characteristic | Without Mortgage | With Mortgage |
| Housing Units | 43 | 112 |
| Median Property Value | $160,200 | $109,400 |
| Median Household Income | $78,750 | $3 |
| Monthly Housing Costs | $596 | $2 |
| Real Estate Taxes | $3,344 | $3 |
Property Value by Mortgage Status in Rushville
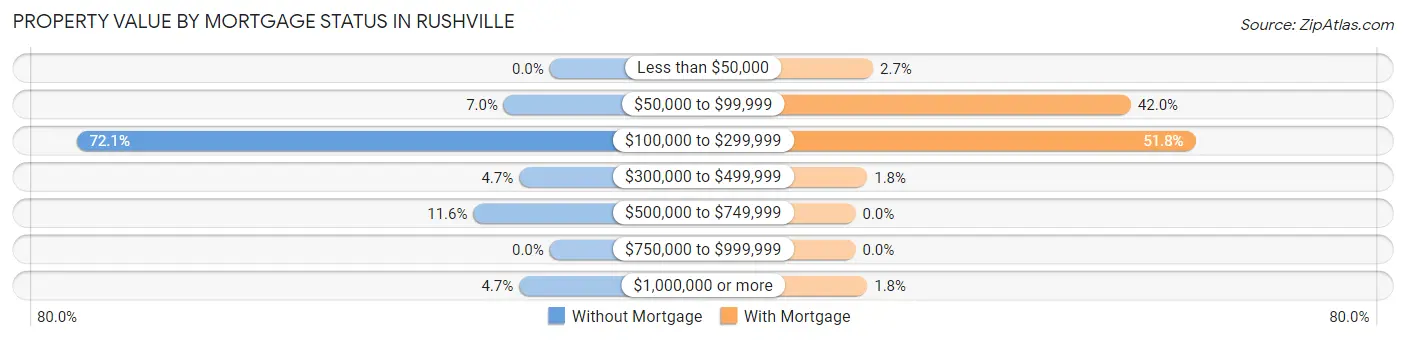
| Property Value | Without Mortgage | With Mortgage |
| Less than $50,000 | 0 (0.0%) | 3 (2.7%) |
| $50,000 to $99,999 | 3 (7.0%) | 47 (42.0%) |
| $100,000 to $299,999 | 31 (72.1%) | 58 (51.8%) |
| $300,000 to $499,999 | 2 (4.6%) | 2 (1.8%) |
| $500,000 to $749,999 | 5 (11.6%) | 0 (0.0%) |
| $750,000 to $999,999 | 0 (0.0%) | 0 (0.0%) |
| $1,000,000 or more | 2 (4.6%) | 2 (1.8%) |
| Total | 43 (100.0%) | 112 (100.0%) |
Household Income by Mortgage Status in Rushville
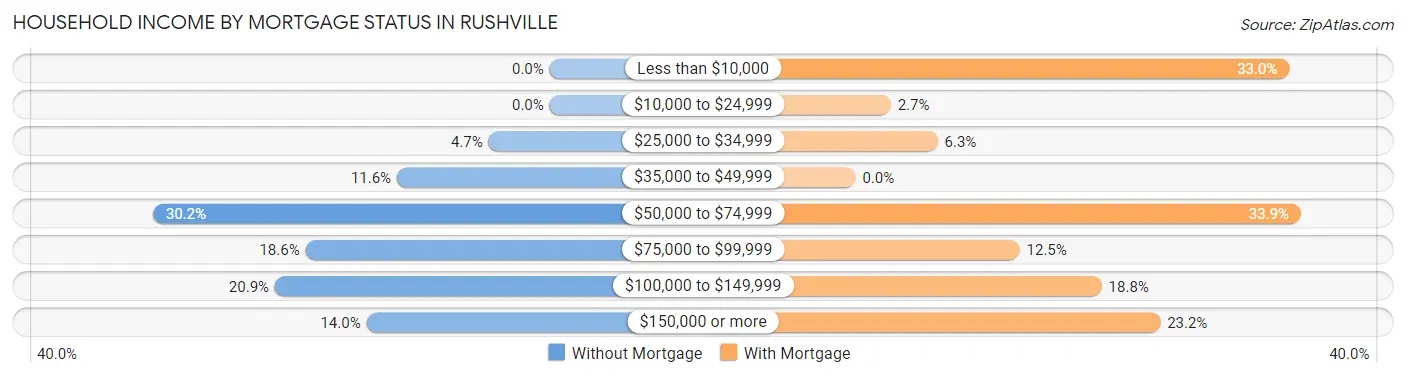
| Household Income | Without Mortgage | With Mortgage |
| Less than $10,000 | 0 (0.0%) | 37 (33.0%) |
| $10,000 to $24,999 | 0 (0.0%) | 3 (2.7%) |
| $25,000 to $34,999 | 2 (4.6%) | 7 (6.2%) |
| $35,000 to $49,999 | 5 (11.6%) | 0 (0.0%) |
| $50,000 to $74,999 | 13 (30.2%) | 38 (33.9%) |
| $75,000 to $99,999 | 8 (18.6%) | 14 (12.5%) |
| $100,000 to $149,999 | 9 (20.9%) | 21 (18.8%) |
| $150,000 or more | 6 (14.0%) | 26 (23.2%) |
| Total | 43 (100.0%) | 112 (100.0%) |
Property Value to Household Income Ratio in Rushville
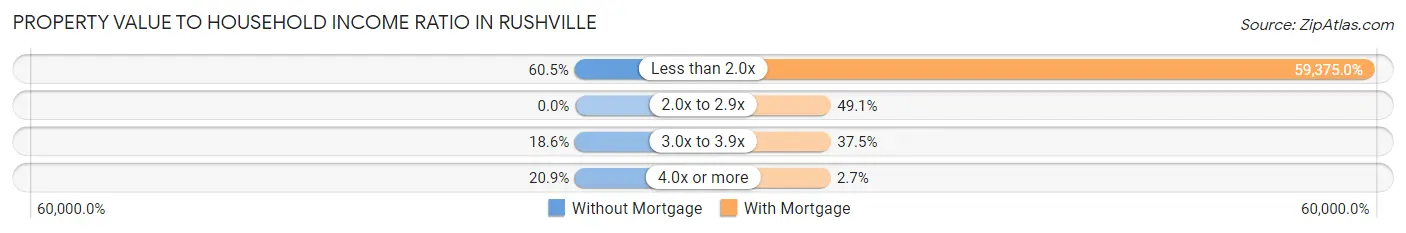
| Value-to-Income Ratio | Without Mortgage | With Mortgage |
| Less than 2.0x | 26 (60.5%) | 66,500 (59,375.0%) |
| 2.0x to 2.9x | 0 (0.0%) | 55 (49.1%) |
| 3.0x to 3.9x | 8 (18.6%) | 42 (37.5%) |
| 4.0x or more | 9 (20.9%) | 3 (2.7%) |
| Total | 43 (100.0%) | 112 (100.0%) |
Real Estate Taxes by Mortgage Status in Rushville
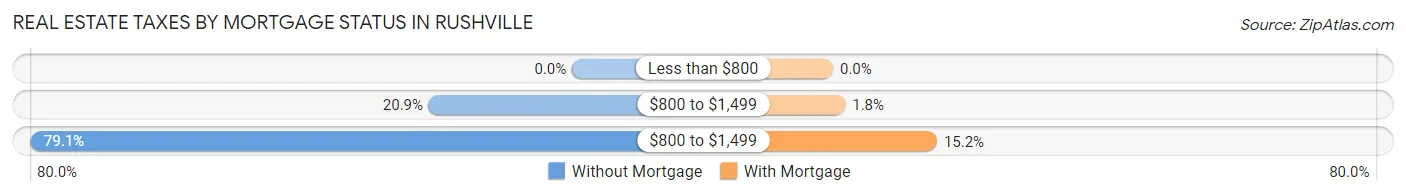
| Property Taxes | Without Mortgage | With Mortgage |
| Less than $800 | 0 (0.0%) | 0 (0.0%) |
| $800 to $1,499 | 9 (20.9%) | 2 (1.8%) |
| $800 to $1,499 | 34 (79.1%) | 17 (15.2%) |
| Total | 43 (100.0%) | 112 (100.0%) |
Health & Disability in Rushville
Health Insurance Coverage by Age in Rushville
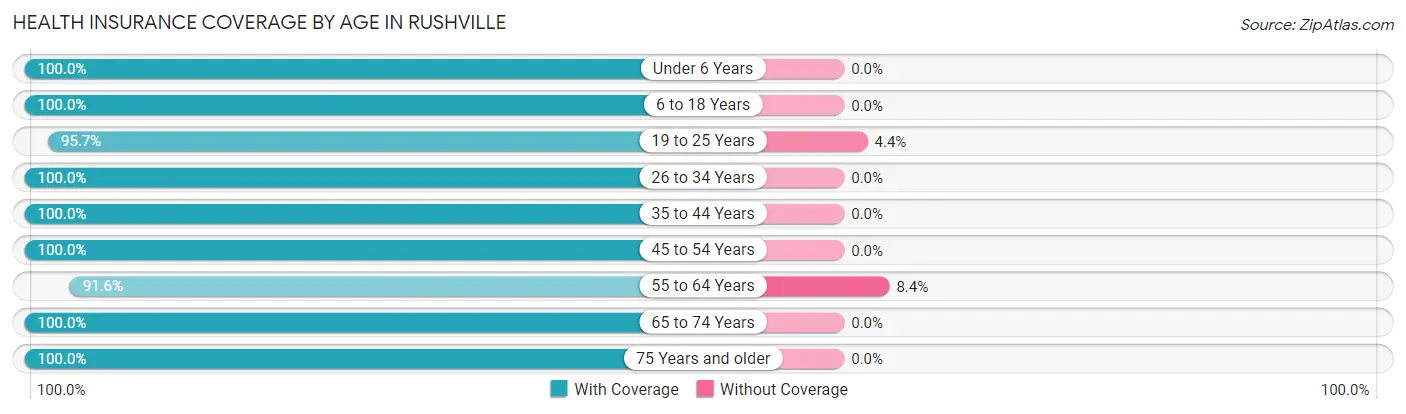
| Age Bracket | With Coverage | Without Coverage |
| Under 6 Years | 17 (100.0%) | 0 (0.0%) |
| 6 to 18 Years | 151 (100.0%) | 0 (0.0%) |
| 19 to 25 Years | 44 (95.7%) | 2 (4.3%) |
| 26 to 34 Years | 15 (100.0%) | 0 (0.0%) |
| 35 to 44 Years | 79 (100.0%) | 0 (0.0%) |
| 45 to 54 Years | 40 (100.0%) | 0 (0.0%) |
| 55 to 64 Years | 76 (91.6%) | 7 (8.4%) |
| 65 to 74 Years | 81 (100.0%) | 0 (0.0%) |
| 75 Years and older | 35 (100.0%) | 0 (0.0%) |
| Total | 538 (98.4%) | 9 (1.7%) |
Health Insurance Coverage by Citizenship Status in Rushville
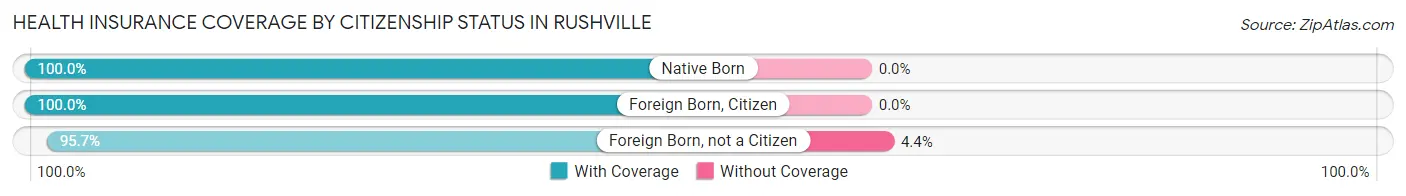
| Citizenship Status | With Coverage | Without Coverage |
| Native Born | 17 (100.0%) | 0 (0.0%) |
| Foreign Born, Citizen | 151 (100.0%) | 0 (0.0%) |
| Foreign Born, not a Citizen | 44 (95.7%) | 2 (4.3%) |
Health Insurance Coverage by Household Income in Rushville
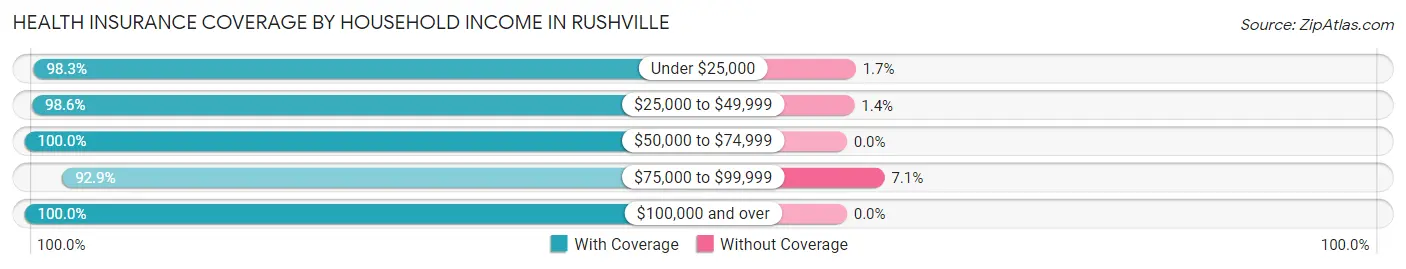
| Household Income | With Coverage | Without Coverage |
| Under $25,000 | 59 (98.3%) | 1 (1.7%) |
| $25,000 to $49,999 | 140 (98.6%) | 2 (1.4%) |
| $50,000 to $74,999 | 79 (100.0%) | 0 (0.0%) |
| $75,000 to $99,999 | 79 (92.9%) | 6 (7.1%) |
| $100,000 and over | 165 (100.0%) | 0 (0.0%) |
Public vs Private Health Insurance Coverage by Age in Rushville
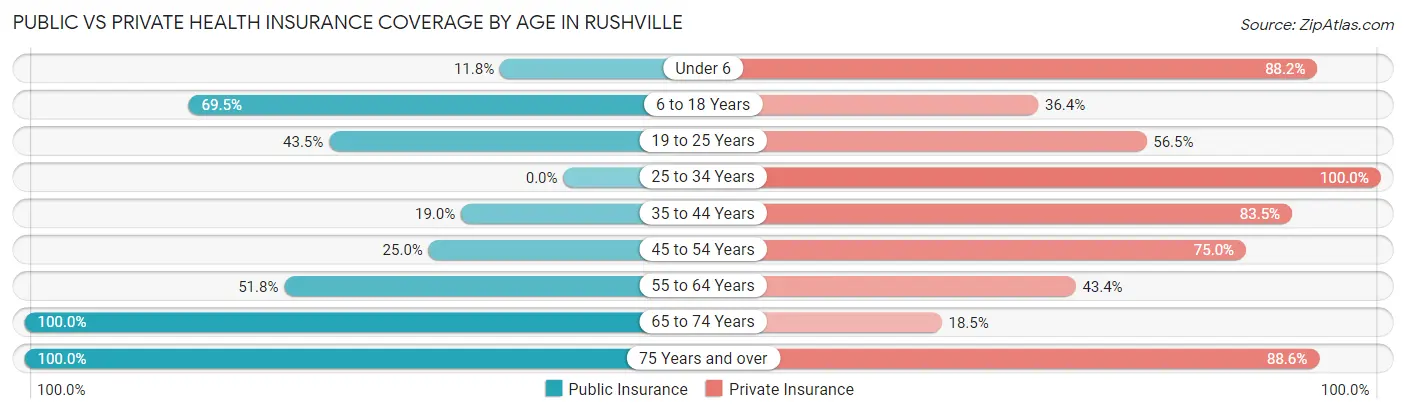
| Age Bracket | Public Insurance | Private Insurance |
| Under 6 | 2 (11.8%) | 15 (88.2%) |
| 6 to 18 Years | 105 (69.5%) | 55 (36.4%) |
| 19 to 25 Years | 20 (43.5%) | 26 (56.5%) |
| 25 to 34 Years | 0 (0.0%) | 15 (100.0%) |
| 35 to 44 Years | 15 (19.0%) | 66 (83.5%) |
| 45 to 54 Years | 10 (25.0%) | 30 (75.0%) |
| 55 to 64 Years | 43 (51.8%) | 36 (43.4%) |
| 65 to 74 Years | 81 (100.0%) | 15 (18.5%) |
| 75 Years and over | 35 (100.0%) | 31 (88.6%) |
| Total | 311 (56.9%) | 289 (52.8%) |
Disability Status by Sex by Age in Rushville
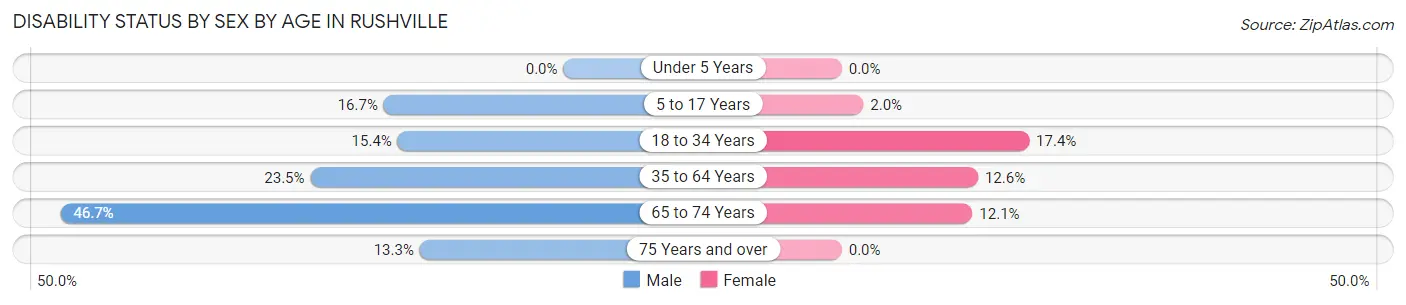
| Age Bracket | Male | Female |
| Under 5 Years | 0 (0.0%) | 0 (0.0%) |
| 5 to 17 Years | 9 (16.7%) | 2 (2.0%) |
| 18 to 34 Years | 6 (15.4%) | 4 (17.4%) |
| 35 to 64 Years | 27 (23.5%) | 11 (12.6%) |
| 65 to 74 Years | 7 (46.7%) | 8 (12.1%) |
| 75 Years and over | 2 (13.3%) | 0 (0.0%) |
Disability Class by Sex by Age in Rushville
Disability Class: Hearing Difficulty
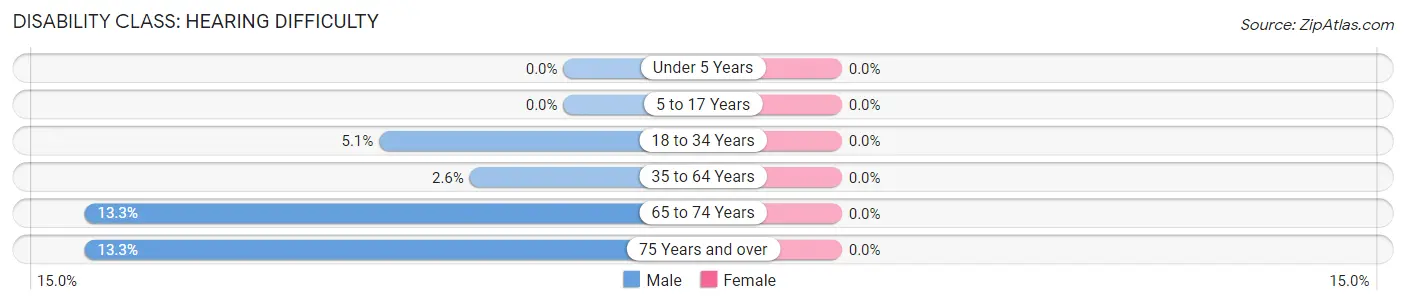
| Age Bracket | Male | Female |
| Under 5 Years | 0 (0.0%) | 0 (0.0%) |
| 5 to 17 Years | 0 (0.0%) | 0 (0.0%) |
| 18 to 34 Years | 2 (5.1%) | 0 (0.0%) |
| 35 to 64 Years | 3 (2.6%) | 0 (0.0%) |
| 65 to 74 Years | 2 (13.3%) | 0 (0.0%) |
| 75 Years and over | 2 (13.3%) | 0 (0.0%) |
Disability Class: Vision Difficulty
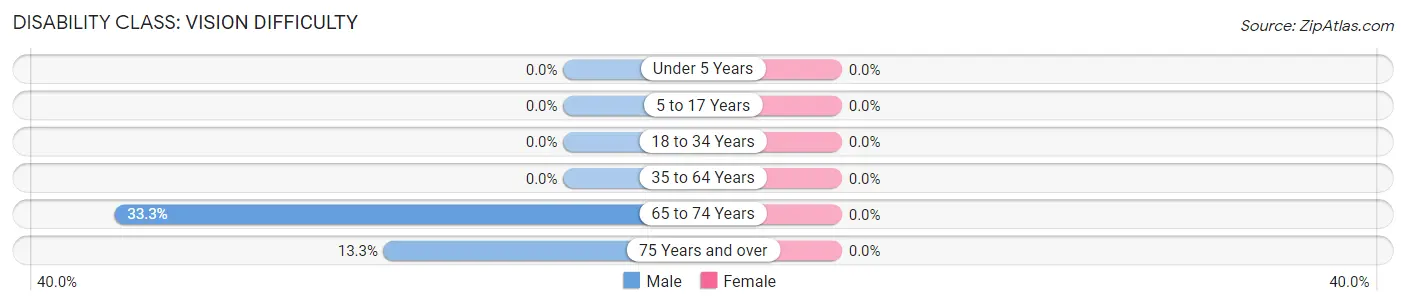
| Age Bracket | Male | Female |
| Under 5 Years | 0 (0.0%) | 0 (0.0%) |
| 5 to 17 Years | 0 (0.0%) | 0 (0.0%) |
| 18 to 34 Years | 0 (0.0%) | 0 (0.0%) |
| 35 to 64 Years | 0 (0.0%) | 0 (0.0%) |
| 65 to 74 Years | 5 (33.3%) | 0 (0.0%) |
| 75 Years and over | 2 (13.3%) | 0 (0.0%) |
Disability Class: Cognitive Difficulty
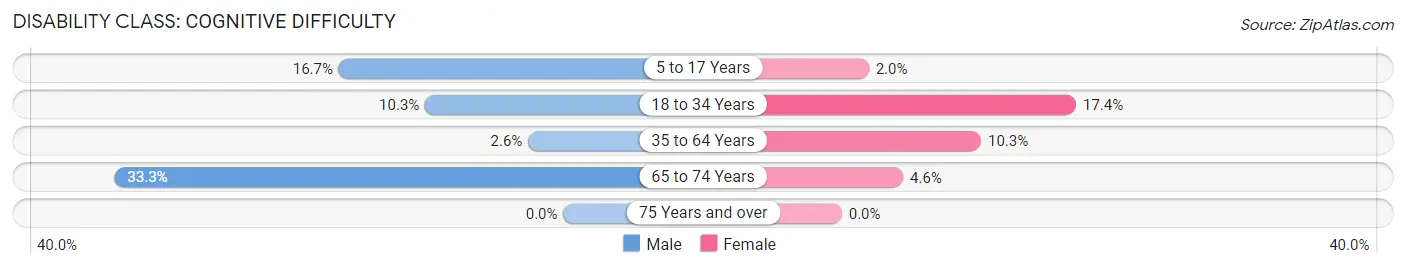
| Age Bracket | Male | Female |
| 5 to 17 Years | 9 (16.7%) | 2 (2.0%) |
| 18 to 34 Years | 4 (10.3%) | 4 (17.4%) |
| 35 to 64 Years | 3 (2.6%) | 9 (10.3%) |
| 65 to 74 Years | 5 (33.3%) | 3 (4.5%) |
| 75 Years and over | 0 (0.0%) | 0 (0.0%) |
Disability Class: Ambulatory Difficulty
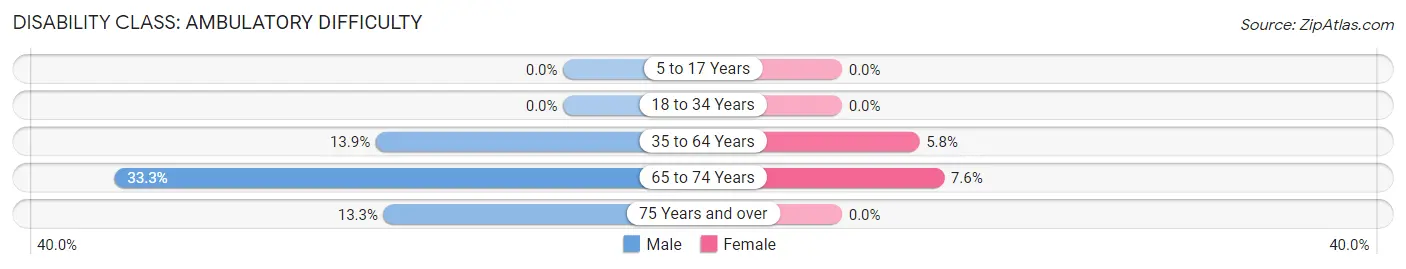
| Age Bracket | Male | Female |
| 5 to 17 Years | 0 (0.0%) | 0 (0.0%) |
| 18 to 34 Years | 0 (0.0%) | 0 (0.0%) |
| 35 to 64 Years | 16 (13.9%) | 5 (5.8%) |
| 65 to 74 Years | 5 (33.3%) | 5 (7.6%) |
| 75 Years and over | 2 (13.3%) | 0 (0.0%) |
Disability Class: Self-Care Difficulty
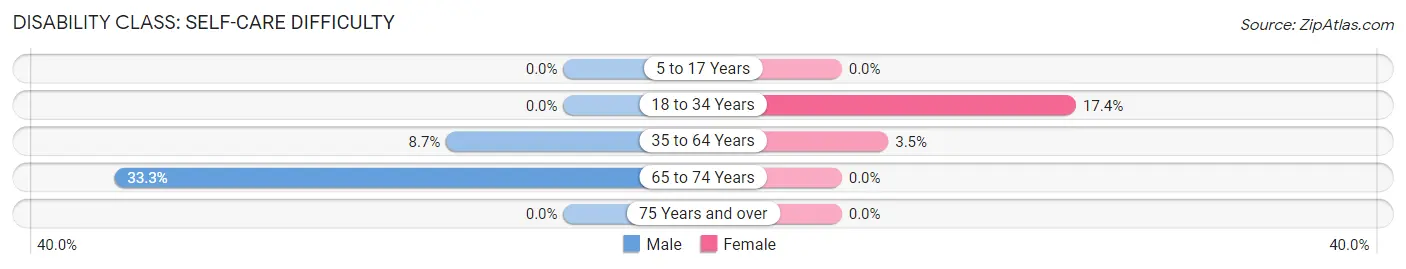
| Age Bracket | Male | Female |
| 5 to 17 Years | 0 (0.0%) | 0 (0.0%) |
| 18 to 34 Years | 0 (0.0%) | 4 (17.4%) |
| 35 to 64 Years | 10 (8.7%) | 3 (3.5%) |
| 65 to 74 Years | 5 (33.3%) | 0 (0.0%) |
| 75 Years and over | 0 (0.0%) | 0 (0.0%) |
Technology Access in Rushville
Computing Device Access in Rushville
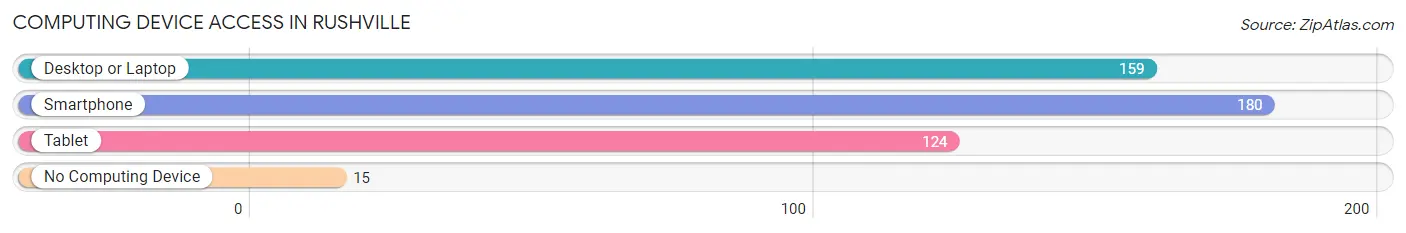
| Device Type | # Households | % Households |
| Desktop or Laptop | 159 | 78.7% |
| Smartphone | 180 | 89.1% |
| Tablet | 124 | 61.4% |
| No Computing Device | 15 | 7.4% |
| Total | 202 | 100.0% |
Internet Access in Rushville
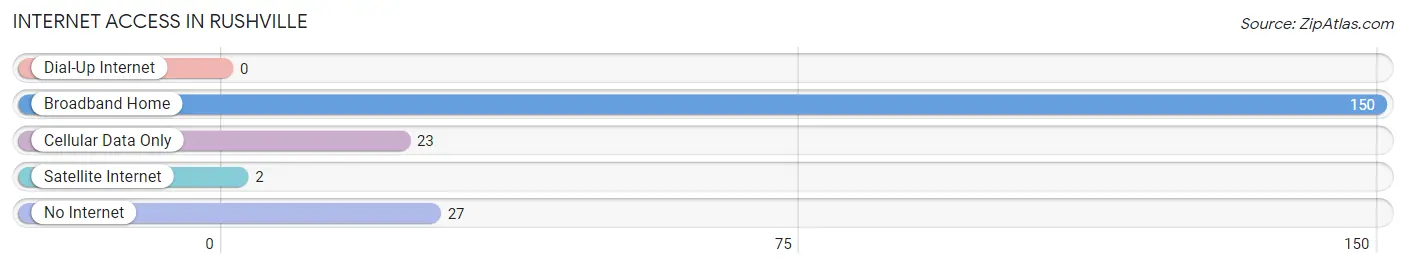
| Internet Type | # Households | % Households |
| Dial-Up Internet | 0 | 0.0% |
| Broadband Home | 150 | 74.3% |
| Cellular Data Only | 23 | 11.4% |
| Satellite Internet | 2 | 1.0% |
| No Internet | 27 | 13.4% |
| Total | 202 | 100.0% |
Rushville Summary
History
The town of Rushville, New York is located in the Finger Lakes region of New York State. It is part of the larger Yates County, which was established in 1823. The town of Rushville was established in 1825, and was named after the nearby Rush Creek. The town was originally settled by Quakers, who were attracted to the area due to its fertile soil and abundant natural resources.
The town of Rushville was an important stop on the Underground Railroad, as it was located near the border of Canada. Many escaped slaves used the town as a safe haven on their journey to freedom. The town was also home to a number of abolitionists, including the prominent Quaker, William Lloyd Garrison.
The town of Rushville was also an important center of industry in the 19th century. The Rushville Woolen Mill was established in 1837, and was one of the first woolen mills in the United States. The mill was a major employer in the town, and provided jobs for many of the town’s residents.
Geography
The town of Rushville is located in the Finger Lakes region of New York State. It is situated in the northwest corner of Yates County, and is bordered by the towns of Potter, Benton, and Jerusalem. The town is located on the western edge of the Finger Lakes, and is surrounded by rolling hills and farmland. The town is located approximately 25 miles south of Rochester, and is approximately 50 miles east of Buffalo.
The town of Rushville is located in a rural area, and is home to a number of small villages and hamlets. The largest of these is the village of Rushville, which is the county seat of Yates County. Other villages and hamlets in the town include Rushville Center, Rushville Station, and Rushville Corners.
Economy
The economy of Rushville is largely based on agriculture and tourism. The town is home to a number of farms, which produce a variety of crops, including corn, soybeans, and hay. The town is also home to a number of wineries, which produce a variety of wines from the local grapes.
The town of Rushville is also home to a number of small businesses, including restaurants, shops, and other services. The town is also home to a number of bed and breakfasts, which attract tourists from all over the world.
Demographics
The town of Rushville has a population of approximately 2,500 people. The town is predominantly white, with approximately 95% of the population being Caucasian. The town also has a small African American population, as well as a small Hispanic population. The median household income in the town is approximately $45,000, and the median home value is approximately $150,000. The town has a low unemployment rate, and a high rate of homeownership.
Common Questions
What is Per Capita Income in Rushville?
Per Capita income in Rushville is $28,019.
What is the Median Family Income in Rushville?
Median Family Income in Rushville is $65,250.
What is the Median Household income in Rushville?
Median Household Income in Rushville is $50,833.
What is Income or Wage Gap in Rushville?
Income or Wage Gap in Rushville is 7.1%.
Women in Rushville earn 92.9 cents for every dollar earned by a man.
What is Inequality or Gini Index in Rushville?
Inequality or Gini Index in Rushville is 0.43.
What is the Total Population of Rushville?
Total Population of Rushville is 547.
What is the Total Male Population of Rushville?
Total Male Population of Rushville is 249.
What is the Total Female Population of Rushville?
Total Female Population of Rushville is 298.
What is the Ratio of Males per 100 Females in Rushville?
There are 83.56 Males per 100 Females in Rushville.
What is the Ratio of Females per 100 Males in Rushville?
There are 119.68 Females per 100 Males in Rushville.
What is the Median Population Age in Rushville?
Median Population Age in Rushville is 39.8 Years.
What is the Average Family Size in Rushville
Average Family Size in Rushville is 3.4 People.
What is the Average Household Size in Rushville
Average Household Size in Rushville is 2.6 People.
How Large is the Labor Force in Rushville?
There are 216 People in the Labor Forcein in Rushville.
What is the Percentage of People in the Labor Force in Rushville?
55.7% of People are in the Labor Force in Rushville.
What is the Unemployment Rate in Rushville?
Unemployment Rate in Rushville is 6.0%.