Chautauqua, NY Map & Demographics
Chautauqua Map
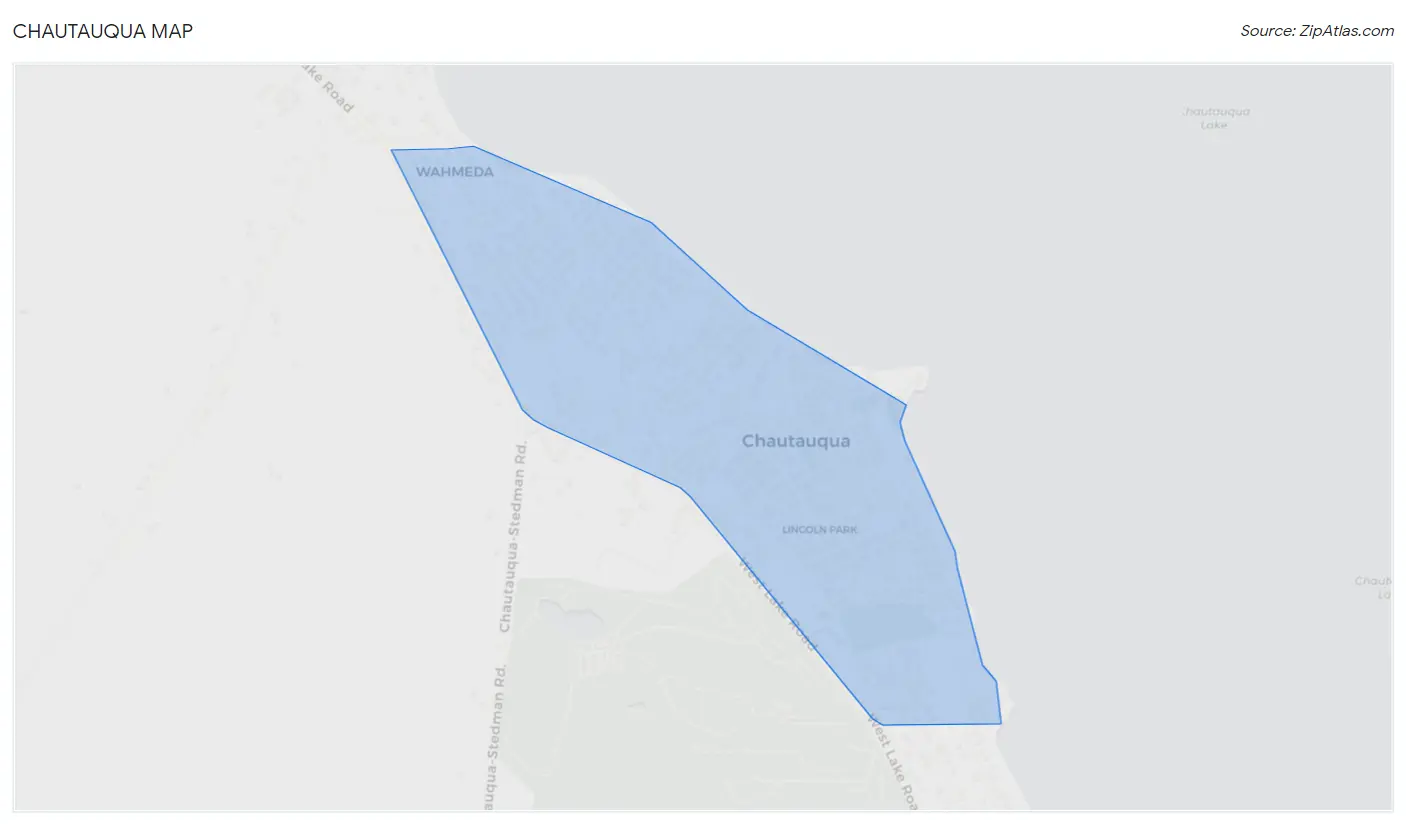
Chautauqua Overview
$10,804
PER CAPITA INCOME
0.63
INEQUALITY / GINI INDEX
271
TOTAL POPULATION
164
MALE POPULATION
107
FEMALE POPULATION
153.27
MALES / 100 FEMALES
65.24
FEMALES / 100 MALES
20.4
MEDIAN AGE
2.1
AVG FAMILY SIZE
1.3
AVG HOUSEHOLD SIZE
64
LABOR FORCE [ PEOPLE ]
23.6%
PERCENT IN LABOR FORCE
18.8%
UNEMPLOYMENT RATE
Chautauqua Zip Codes
Chautauqua Area Codes
Income in Chautauqua
Income Overview in Chautauqua
| Characteristic | Number | Measure |
| Per Capita Income | 271 | $10,804 |
| Median Family Income | 16 | $0 |
| Mean Family Income | 16 | $0 |
| Median Household Income | 66 | $0 |
| Mean Household Income | 66 | $32,606 |
| Income Deficit | 16 | $0 |
| Wage / Income Gap (%) | 271 | 0.00% |
| Wage / Income Gap ($) | 271 | 100.00¢ per $1 |
| Gini / Inequality Index | 271 | 0.63 |
Earnings by Sex in Chautauqua
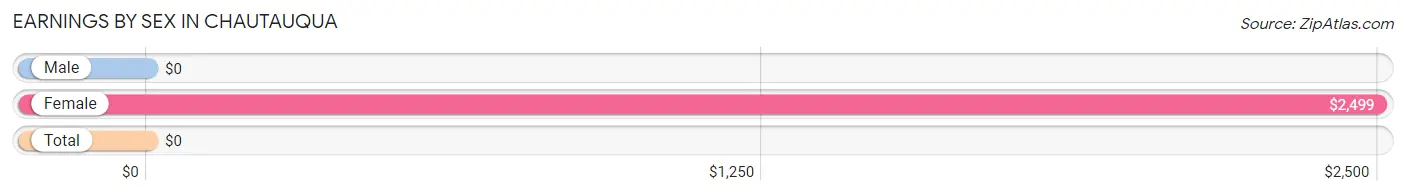
| Sex | Number | Average Earnings |
| Male | 69 (59.5%) | $0 |
| Female | 47 (40.5%) | $2,499 |
| Total | 116 (100.0%) | $0 |
Earnings by Sex by Income Bracket in Chautauqua
The most common earnings brackets in Chautauqua are $2,500 to $4,999 for men (30 | 43.5%) and $2,499 or less for women (36 | 76.6%).
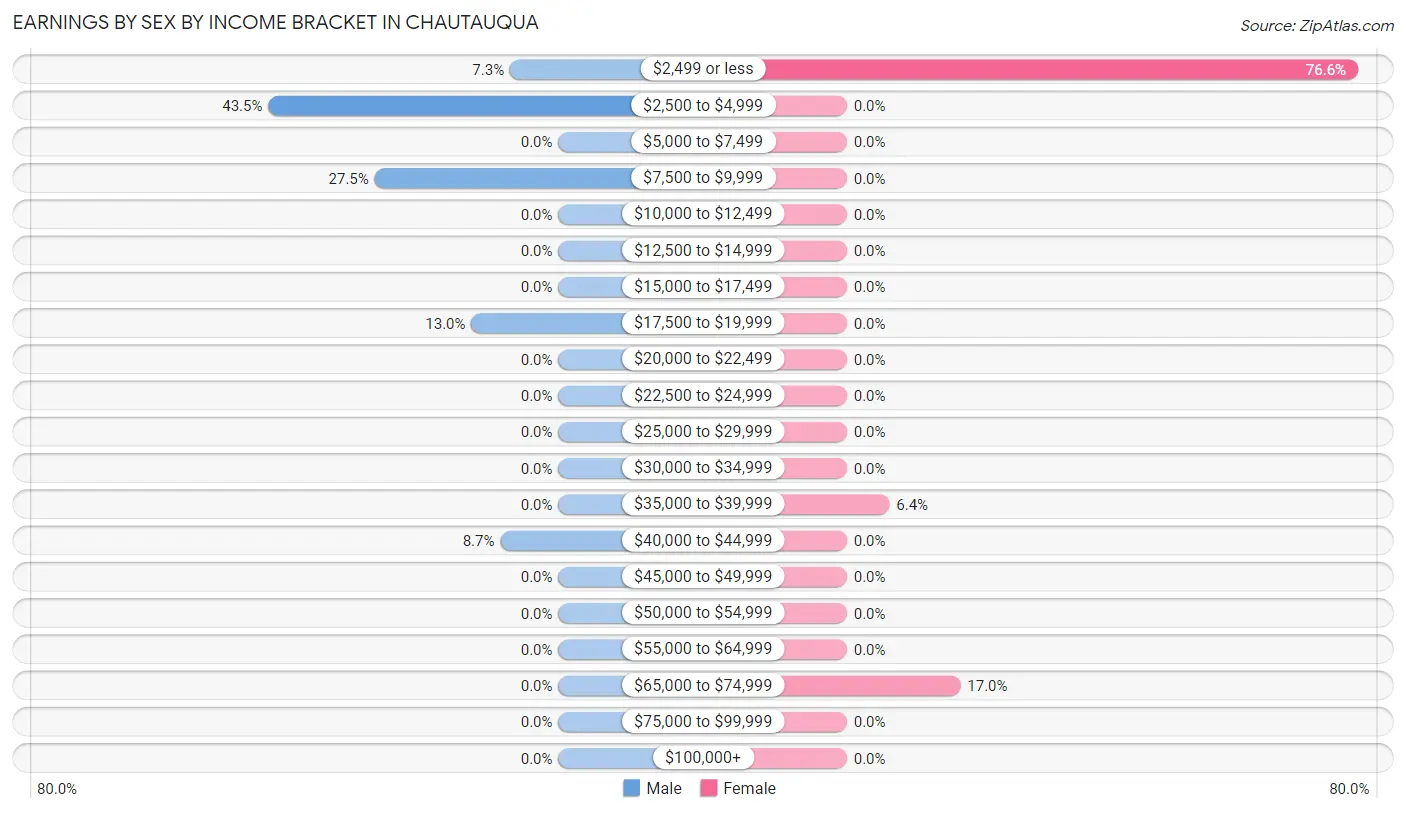
| Income | Male | Female |
| $2,499 or less | 5 (7.2%) | 36 (76.6%) |
| $2,500 to $4,999 | 30 (43.5%) | 0 (0.0%) |
| $5,000 to $7,499 | 0 (0.0%) | 0 (0.0%) |
| $7,500 to $9,999 | 19 (27.5%) | 0 (0.0%) |
| $10,000 to $12,499 | 0 (0.0%) | 0 (0.0%) |
| $12,500 to $14,999 | 0 (0.0%) | 0 (0.0%) |
| $15,000 to $17,499 | 0 (0.0%) | 0 (0.0%) |
| $17,500 to $19,999 | 9 (13.0%) | 0 (0.0%) |
| $20,000 to $22,499 | 0 (0.0%) | 0 (0.0%) |
| $22,500 to $24,999 | 0 (0.0%) | 0 (0.0%) |
| $25,000 to $29,999 | 0 (0.0%) | 0 (0.0%) |
| $30,000 to $34,999 | 0 (0.0%) | 0 (0.0%) |
| $35,000 to $39,999 | 0 (0.0%) | 3 (6.4%) |
| $40,000 to $44,999 | 6 (8.7%) | 0 (0.0%) |
| $45,000 to $49,999 | 0 (0.0%) | 0 (0.0%) |
| $50,000 to $54,999 | 0 (0.0%) | 0 (0.0%) |
| $55,000 to $64,999 | 0 (0.0%) | 0 (0.0%) |
| $65,000 to $74,999 | 0 (0.0%) | 8 (17.0%) |
| $75,000 to $99,999 | 0 (0.0%) | 0 (0.0%) |
| $100,000+ | 0 (0.0%) | 0 (0.0%) |
| Total | 69 (100.0%) | 47 (100.0%) |
Earnings by Sex by Educational Attainment in Chautauqua
| Educational Attainment | Male Income | Female Income |
| Less than High School | - | - |
| High School Diploma | - | - |
| College or Associate's Degree | - | - |
| Bachelor's Degree | - | - |
| Graduate Degree | - | - |
| Total | - | - |
Family Income in Chautauqua
Family Income Brackets in Chautauqua
According to the Chautauqua family income data, there are 8 families falling into the $75,000 to $99,999 income range, which is the most common income bracket and makes up 50.0% of all families.
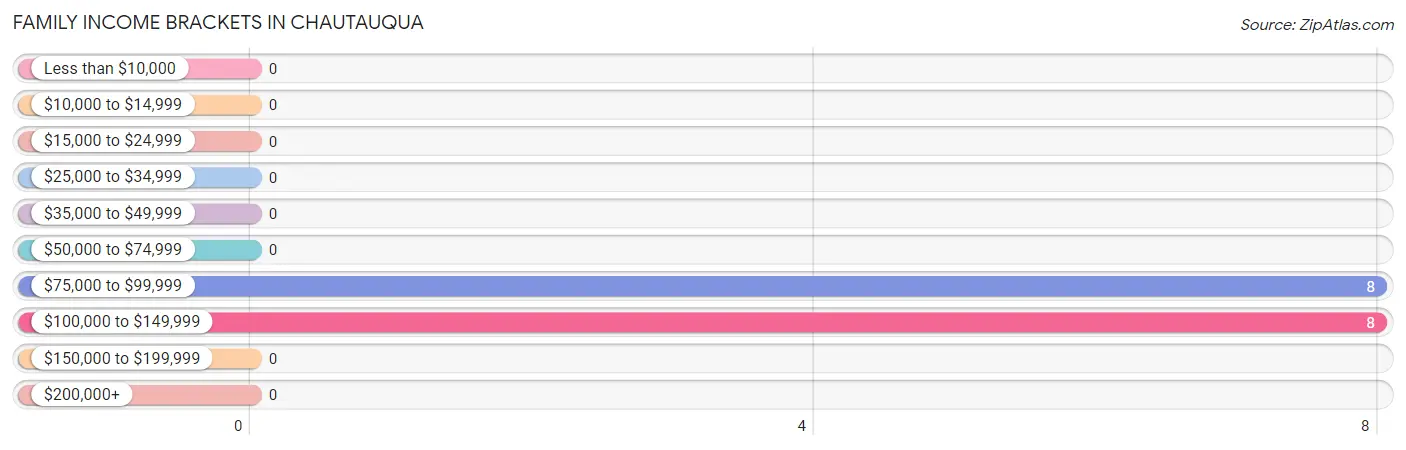
| Income Bracket | # Families | % Families |
| Less than $10,000 | 0 | 0.0% |
| $10,000 to $14,999 | 0 | 0.0% |
| $15,000 to $24,999 | 0 | 0.0% |
| $25,000 to $34,999 | 0 | 0.0% |
| $35,000 to $49,999 | 0 | 0.0% |
| $50,000 to $74,999 | 0 | 0.0% |
| $75,000 to $99,999 | 8 | 50.0% |
| $100,000 to $149,999 | 8 | 50.0% |
| $150,000 to $199,999 | 0 | 0.0% |
| $200,000+ | 0 | 0.0% |
Family Income by Famaliy Size in Chautauqua
| Income Bracket | # Families | Median Income |
| 2-Person Families | 16 (100.0%) | $0 |
| 3-Person Families | 0 (0.0%) | $0 |
| 4-Person Families | 0 (0.0%) | $0 |
| 5-Person Families | 0 (0.0%) | $0 |
| 6-Person Families | 0 (0.0%) | $0 |
| 7+ Person Families | 0 (0.0%) | $0 |
| Total | 16 (100.0%) | $0 |
Family Income by Number of Earners in Chautauqua
| Number of Earners | # Families | Median Income |
| No Earners | 8 (50.0%) | $0 |
| 1 Earner | 0 (0.0%) | $0 |
| 2 Earners | 8 (50.0%) | $0 |
| 3+ Earners | 0 (0.0%) | $0 |
| Total | 16 (100.0%) | $0 |
Household Income in Chautauqua
Household Income Brackets in Chautauqua
With 50 households falling in the category, the less than $10,000 income range is the most frequent in Chautauqua, accounting for 75.8% of all households.
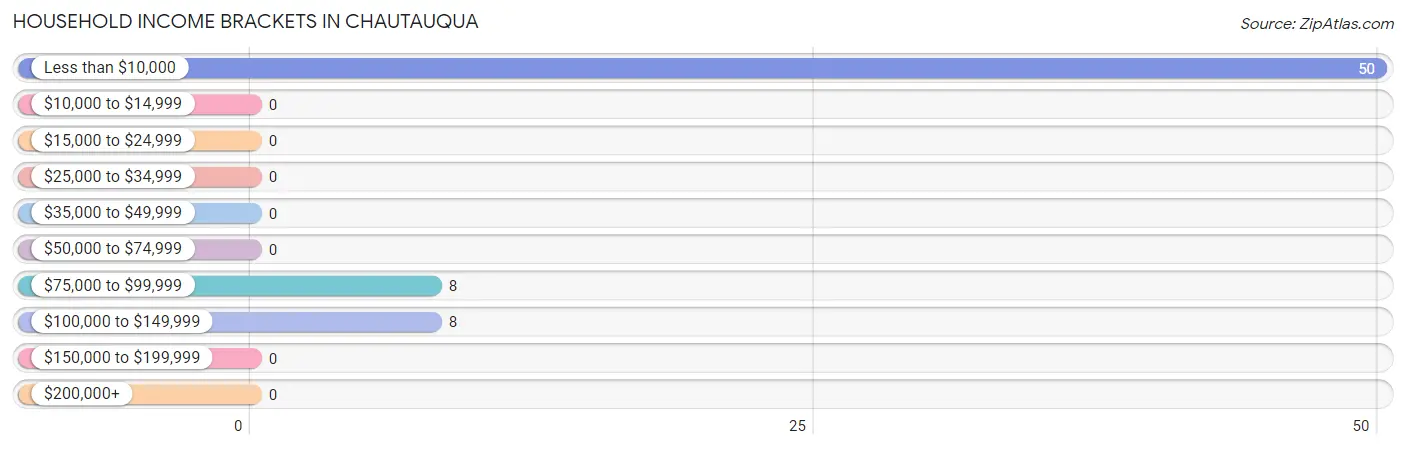
| Income Bracket | # Households | % Households |
| Less than $10,000 | 50 | 75.8% |
| $10,000 to $14,999 | 0 | 0.0% |
| $15,000 to $24,999 | 0 | 0.0% |
| $25,000 to $34,999 | 0 | 0.0% |
| $35,000 to $49,999 | 0 | 0.0% |
| $50,000 to $74,999 | 0 | 0.0% |
| $75,000 to $99,999 | 8 | 12.1% |
| $100,000 to $149,999 | 8 | 12.1% |
| $150,000 to $199,999 | 0 | 0.0% |
| $200,000+ | 0 | 0.0% |
Household Income by Householder Age in Chautauqua
| Income Bracket | # Households | Median Income |
| 15 to 24 Years | 0 (0.0%) | $0 |
| 25 to 44 Years | 0 (0.0%) | $0 |
| 45 to 64 Years | 0 (0.0%) | $0 |
| 65+ Years | 66 (100.0%) | $0 |
| Total | 66 (100.0%) | $0 |
Poverty in Chautauqua
Income Below Poverty by Sex and Age in Chautauqua
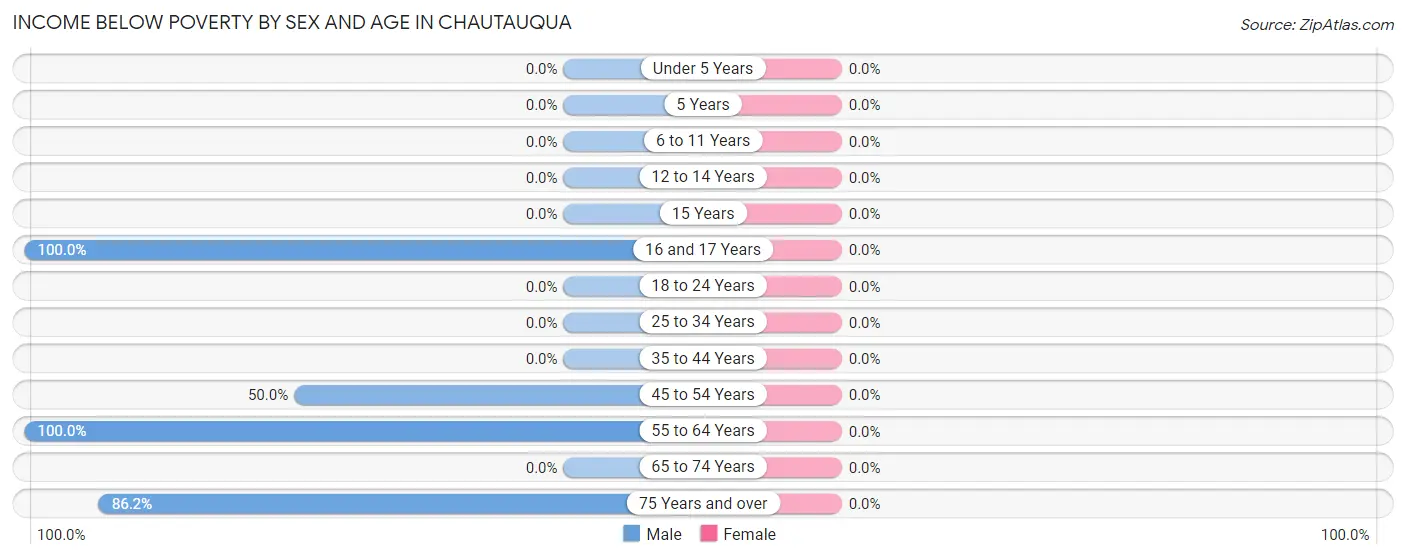
| Age Bracket | Male | Female |
| Under 5 Years | 0 (0.0%) | 0 (0.0%) |
| 5 Years | 0 (0.0%) | 0 (0.0%) |
| 6 to 11 Years | 0 (0.0%) | 0 (0.0%) |
| 12 to 14 Years | 0 (0.0%) | 0 (0.0%) |
| 15 Years | 0 (0.0%) | 0 (0.0%) |
| 16 and 17 Years | 2 (100.0%) | 0 (0.0%) |
| 18 to 24 Years | 0 (0.0%) | 0 (0.0%) |
| 25 to 34 Years | 0 (0.0%) | 0 (0.0%) |
| 35 to 44 Years | 0 (0.0%) | 0 (0.0%) |
| 45 to 54 Years | 3 (50.0%) | 0 (0.0%) |
| 55 to 64 Years | 2 (100.0%) | 0 (0.0%) |
| 65 to 74 Years | 0 (0.0%) | 0 (0.0%) |
| 75 Years and over | 50 (86.2%) | 0 (0.0%) |
| Total | 57 (71.3%) | 0 (0.0%) |
Income Above Poverty by Sex and Age in Chautauqua
According to the poverty statistics in Chautauqua, males aged 35 to 44 years and females aged 25 to 34 years are the age groups that are most secure financially, with 100.0% of males and 100.0% of females in these age groups living above the poverty line.
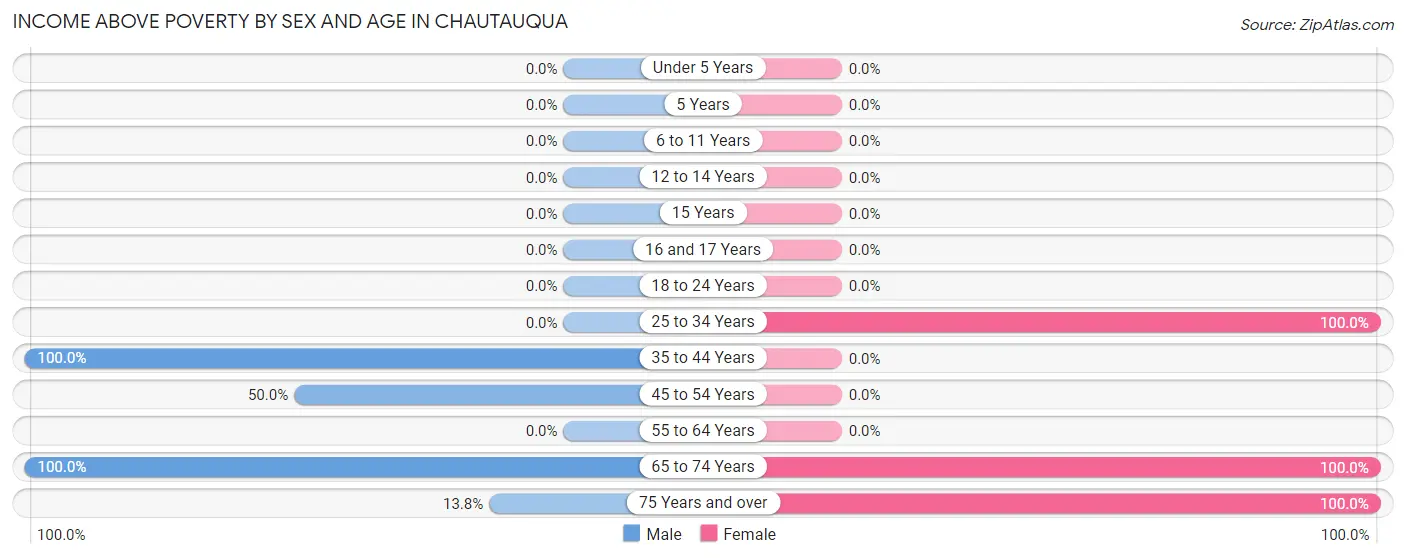
| Age Bracket | Male | Female |
| Under 5 Years | 0 (0.0%) | 0 (0.0%) |
| 5 Years | 0 (0.0%) | 0 (0.0%) |
| 6 to 11 Years | 0 (0.0%) | 0 (0.0%) |
| 12 to 14 Years | 0 (0.0%) | 0 (0.0%) |
| 15 Years | 0 (0.0%) | 0 (0.0%) |
| 16 and 17 Years | 0 (0.0%) | 0 (0.0%) |
| 18 to 24 Years | 0 (0.0%) | 0 (0.0%) |
| 25 to 34 Years | 0 (0.0%) | 3 (100.0%) |
| 35 to 44 Years | 3 (100.0%) | 0 (0.0%) |
| 45 to 54 Years | 3 (50.0%) | 0 (0.0%) |
| 55 to 64 Years | 0 (0.0%) | 0 (0.0%) |
| 65 to 74 Years | 9 (100.0%) | 8 (100.0%) |
| 75 Years and over | 8 (13.8%) | 8 (100.0%) |
| Total | 23 (28.7%) | 19 (100.0%) |
Income Below Poverty Among Married-Couple Families in Chautauqua
| Children | Above Poverty | Below Poverty |
| No Children | 16 (100.0%) | 0 (0.0%) |
| 1 or 2 Children | 0 (0.0%) | 0 (0.0%) |
| 3 or 4 Children | 0 (0.0%) | 0 (0.0%) |
| 5 or more Children | 0 (0.0%) | 0 (0.0%) |
| Total | 16 (100.0%) | 0 (0.0%) |
Income Below Poverty Among Single-Parent Households in Chautauqua
| Children | Single Father | Single Mother |
| No Children | 0 (0.0%) | 0 (0.0%) |
| 1 or 2 Children | 0 (0.0%) | 0 (0.0%) |
| 3 or 4 Children | 0 (0.0%) | 0 (0.0%) |
| 5 or more Children | 0 (0.0%) | 0 (0.0%) |
| Total | 0 (0.0%) | 0 (0.0%) |
Income Below Poverty Among Married-Couple vs Single-Parent Households in Chautauqua
| Children | Married-Couple Families | Single-Parent Households |
| No Children | 0 (0.0%) | 0 (0.0%) |
| 1 or 2 Children | 0 (0.0%) | 0 (0.0%) |
| 3 or 4 Children | 0 (0.0%) | 0 (0.0%) |
| 5 or more Children | 0 (0.0%) | 0 (0.0%) |
| Total | 0 (0.0%) | 0 (0.0%) |
Race in Chautauqua
The most populous races in Chautauqua are White / Caucasian (216 | 79.7%), Black / African American (40 | 14.8%), and Some other Race (13 | 4.8%).
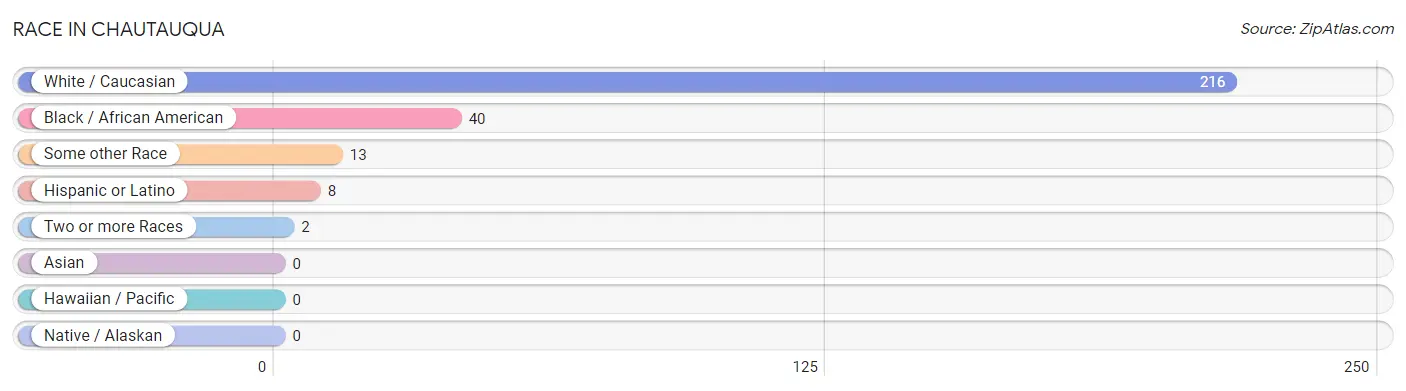
| Race | # Population | % Population |
| Asian | 0 | 0.0% |
| Black / African American | 40 | 14.8% |
| Hawaiian / Pacific | 0 | 0.0% |
| Hispanic or Latino | 8 | 2.9% |
| Native / Alaskan | 0 | 0.0% |
| White / Caucasian | 216 | 79.7% |
| Two or more Races | 2 | 0.7% |
| Some other Race | 13 | 4.8% |
| Total | 271 | 100.0% |
Ancestry in Chautauqua
The most populous ancestries reported in Chautauqua are German (72 | 26.6%), Irish (40 | 14.8%), European (16 | 5.9%), Czech (13 | 4.8%), and Haitian (12 | 4.4%), together accounting for 56.5% of all Chautauqua residents.
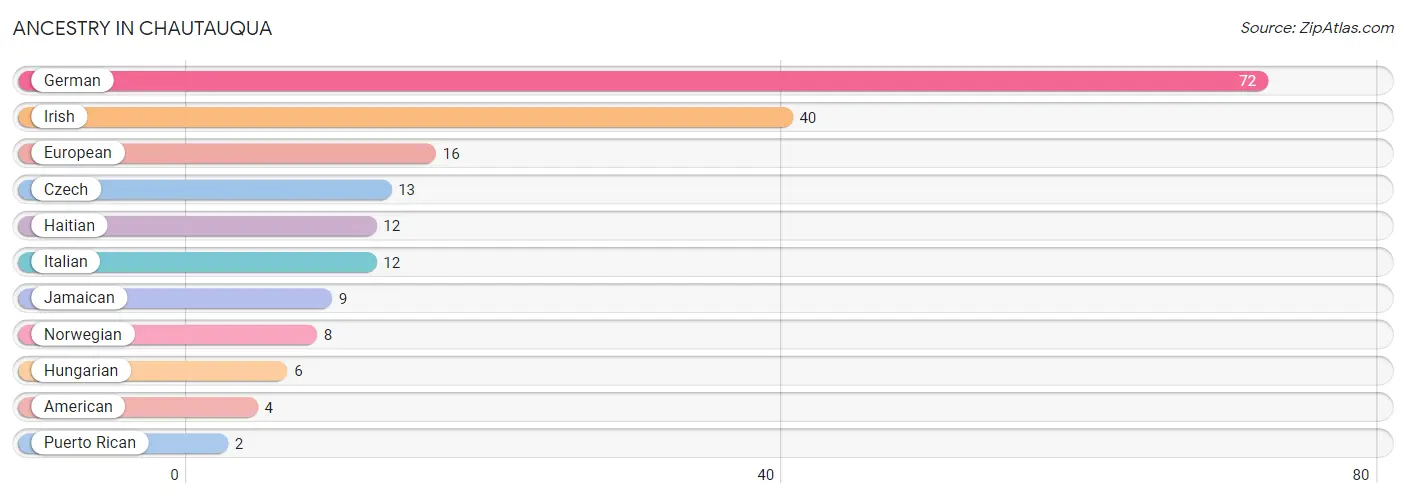
| Ancestry | # Population | % Population |
| American | 4 | 1.5% |
| Czech | 13 | 4.8% |
| European | 16 | 5.9% |
| German | 72 | 26.6% |
| Haitian | 12 | 4.4% |
| Hungarian | 6 | 2.2% |
| Irish | 40 | 14.8% |
| Italian | 12 | 4.4% |
| Jamaican | 9 | 3.3% |
| Norwegian | 8 | 2.9% |
| Puerto Rican | 2 | 0.7% | View All 11 Rows |
Immigrants in Chautauqua
The most numerous immigrant groups reported in Chautauqua came from Latin America (18 | 6.6%), Caribbean (12 | 4.4%), Haiti (12 | 4.4%), Central America (6 | 2.2%), and El Salvador (3 | 1.1%), together accounting for 18.8% of all Chautauqua residents.
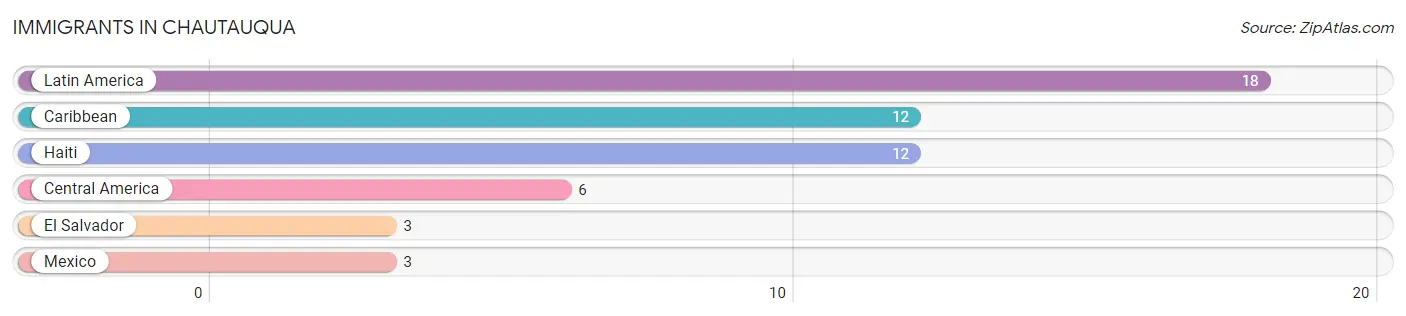
| Immigration Origin | # Population | % Population |
| Caribbean | 12 | 4.4% |
| Central America | 6 | 2.2% |
| El Salvador | 3 | 1.1% |
| Haiti | 12 | 4.4% |
| Latin America | 18 | 6.6% |
| Mexico | 3 | 1.1% | View All 6 Rows |
Sex and Age in Chautauqua
Sex and Age in Chautauqua
The most populous age groups in Chautauqua are 15 to 19 Years (81 | 49.4%) for men and 15 to 19 Years (46 | 43.0%) for women.
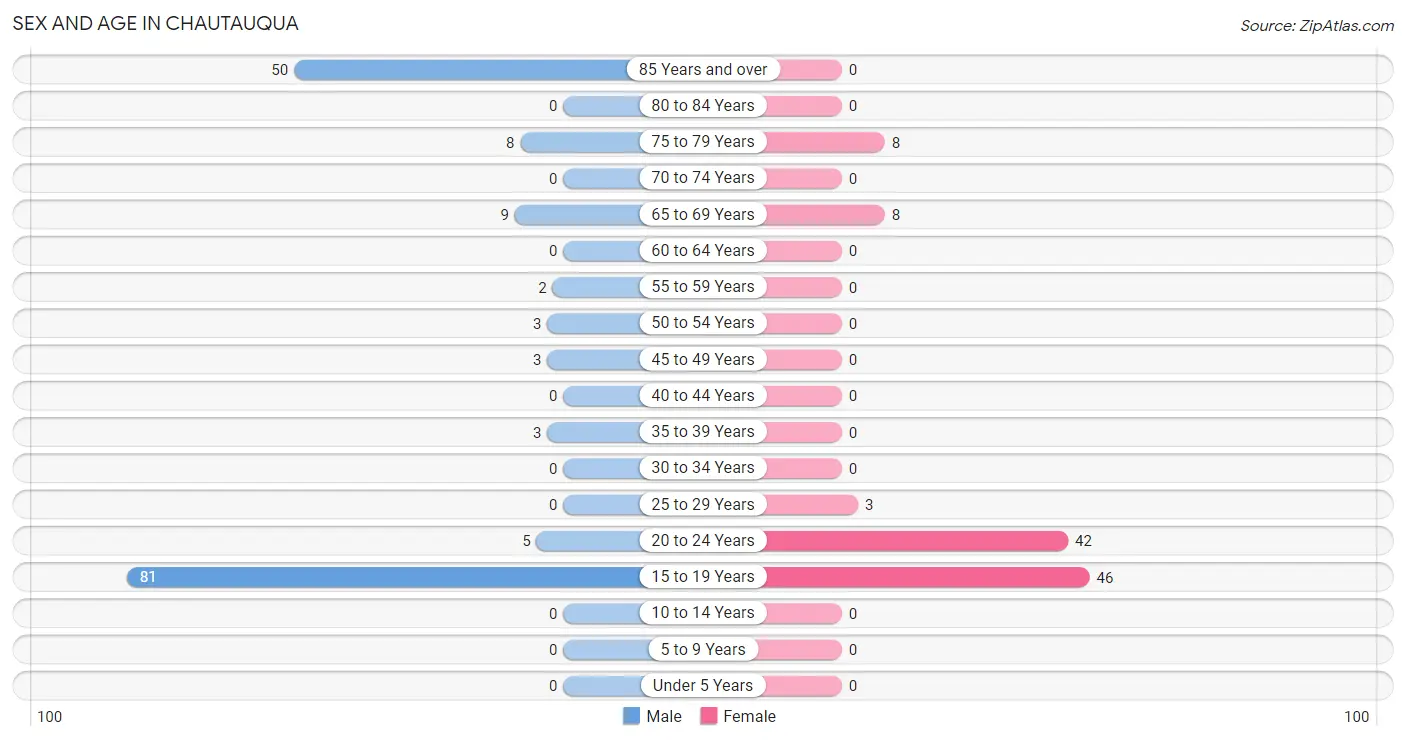
| Age Bracket | Male | Female |
| Under 5 Years | 0 (0.0%) | 0 (0.0%) |
| 5 to 9 Years | 0 (0.0%) | 0 (0.0%) |
| 10 to 14 Years | 0 (0.0%) | 0 (0.0%) |
| 15 to 19 Years | 81 (49.4%) | 46 (43.0%) |
| 20 to 24 Years | 5 (3.0%) | 42 (39.3%) |
| 25 to 29 Years | 0 (0.0%) | 3 (2.8%) |
| 30 to 34 Years | 0 (0.0%) | 0 (0.0%) |
| 35 to 39 Years | 3 (1.8%) | 0 (0.0%) |
| 40 to 44 Years | 0 (0.0%) | 0 (0.0%) |
| 45 to 49 Years | 3 (1.8%) | 0 (0.0%) |
| 50 to 54 Years | 3 (1.8%) | 0 (0.0%) |
| 55 to 59 Years | 2 (1.2%) | 0 (0.0%) |
| 60 to 64 Years | 0 (0.0%) | 0 (0.0%) |
| 65 to 69 Years | 9 (5.5%) | 8 (7.5%) |
| 70 to 74 Years | 0 (0.0%) | 0 (0.0%) |
| 75 to 79 Years | 8 (4.9%) | 8 (7.5%) |
| 80 to 84 Years | 0 (0.0%) | 0 (0.0%) |
| 85 Years and over | 50 (30.5%) | 0 (0.0%) |
| Total | 164 (100.0%) | 107 (100.0%) |
Families and Households in Chautauqua
Median Family Size in Chautauqua
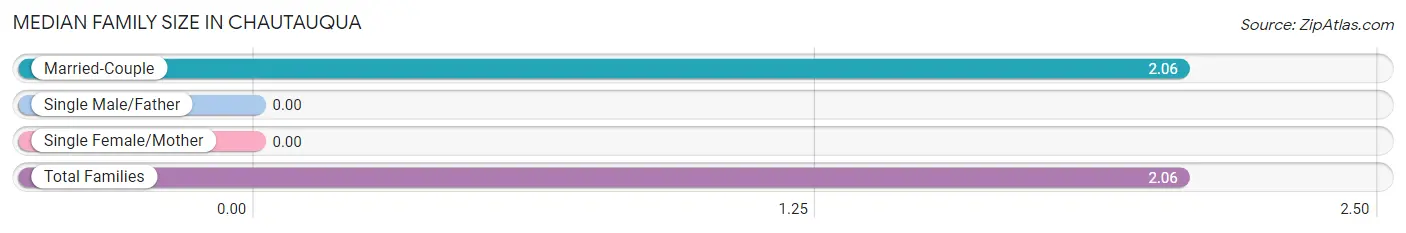
| Family Type | # Families | Family Size |
| Married-Couple | 16 (100.0%) | 2.06 |
| Single Male/Father | 0 (0.0%) | - |
| Single Female/Mother | 0 (0.0%) | - |
| Total Families | 16 (100.0%) | 2.06 |
Median Household Size in Chautauqua
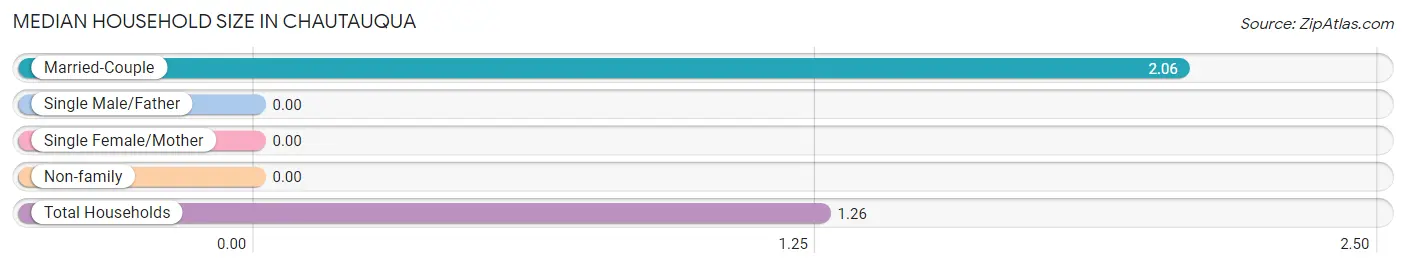
| Household Type | # Households | Household Size |
| Married-Couple | 16 (24.2%) | 2.06 |
| Single Male/Father | 0 (0.0%) | - |
| Single Female/Mother | 0 (0.0%) | - |
| Non-family | 50 (75.8%) | - |
| Total Households | 66 (100.0%) | 1.26 |
Household Size by Marriage Status in Chautauqua
Out of a total of 66 households in Chautauqua, 16 (24.2%) are family households, while 50 (75.8%) are nonfamily households. The most numerous type of family households are 2-person households, comprising 16, and the most common type of nonfamily households are 1-person households, comprising 50.
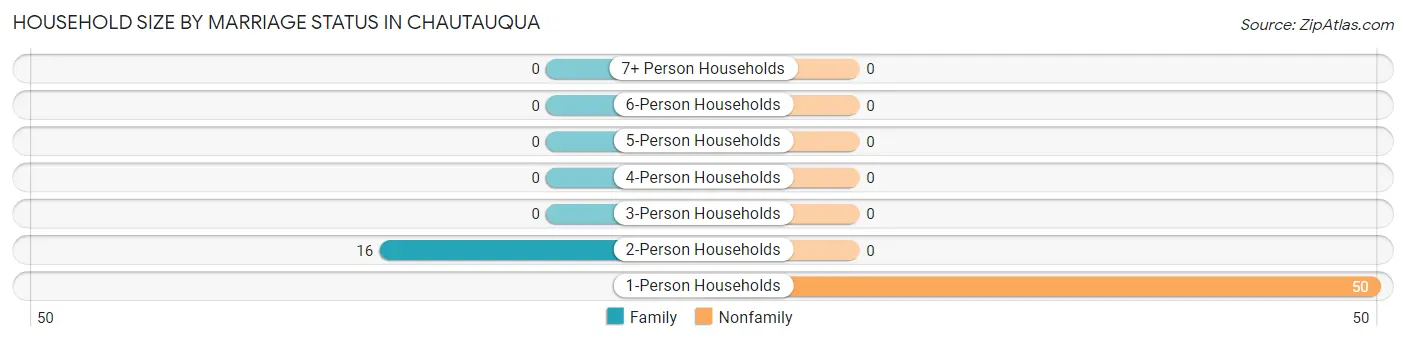
| Household Size | Family Households | Nonfamily Households |
| 1-Person Households | - | 50 (75.8%) |
| 2-Person Households | 16 (24.2%) | 0 (0.0%) |
| 3-Person Households | 0 (0.0%) | 0 (0.0%) |
| 4-Person Households | 0 (0.0%) | 0 (0.0%) |
| 5-Person Households | 0 (0.0%) | 0 (0.0%) |
| 6-Person Households | 0 (0.0%) | 0 (0.0%) |
| 7+ Person Households | 0 (0.0%) | 0 (0.0%) |
| Total | 16 (24.2%) | 50 (75.8%) |
Female Fertility in Chautauqua
Fertility by Age in Chautauqua
| Age Bracket | Women with Births | Births / 1,000 Women |
| 15 to 19 years | 0 (0.0%) | 0.0 |
| 20 to 34 years | 0 (0.0%) | 0.0 |
| 35 to 50 years | 0 (0.0%) | 0.0 |
| Total | 0 (0.0%) | 0.0 |
Fertility by Age by Marriage Status in Chautauqua
| Age Bracket | Married | Unmarried |
| 15 to 19 years | 0 (0.0%) | 0 (0.0%) |
| 20 to 34 years | 0 (0.0%) | 0 (0.0%) |
| 35 to 50 years | 0 (0.0%) | 0 (0.0%) |
| Total | 0 (0.0%) | 0 (0.0%) |
Fertility by Education in Chautauqua
| Educational Attainment | Women with Births | Births / 1,000 Women |
| Less than High School | 0 (0.0%) | 0.0 |
| High School Diploma | 0 (0.0%) | 0.0 |
| College or Associate's Degree | 0 (0.0%) | 0.0 |
| Bachelor's Degree | 0 (0.0%) | 0.0 |
| Graduate Degree | 0 (0.0%) | 0.0 |
| Total | 0 (0.0%) | 0.0 |
Fertility by Education by Marriage Status in Chautauqua
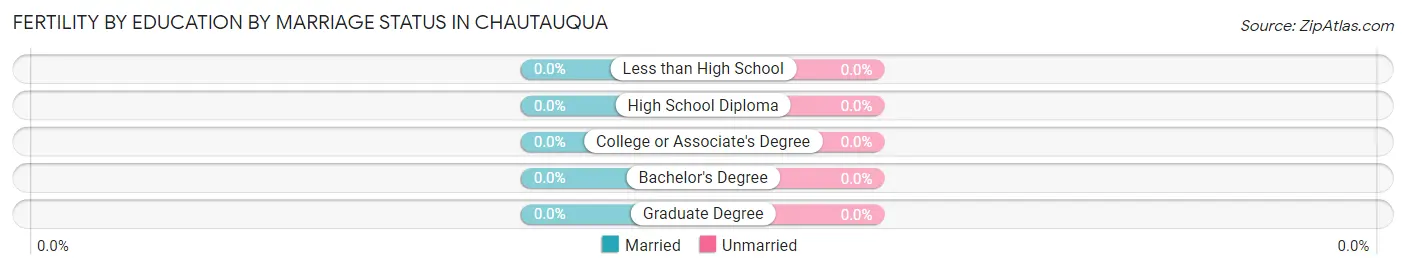
| Educational Attainment | Married | Unmarried |
| Less than High School | 0 (0.0%) | 0 (0.0%) |
| High School Diploma | 0 (0.0%) | 0 (0.0%) |
| College or Associate's Degree | 0 (0.0%) | 0 (0.0%) |
| Bachelor's Degree | 0 (0.0%) | 0 (0.0%) |
| Graduate Degree | 0 (0.0%) | 0 (0.0%) |
| Total | 0 (0.0%) | 0 (0.0%) |
Employment Characteristics in Chautauqua
Employment by Class of Employer in Chautauqua
Among the 52 employed individuals in Chautauqua, not-for-profit organizations (23 | 44.2%), private company employees (15 | 28.8%), and state government employees (14 | 26.9%) make up the most common classes of employment.
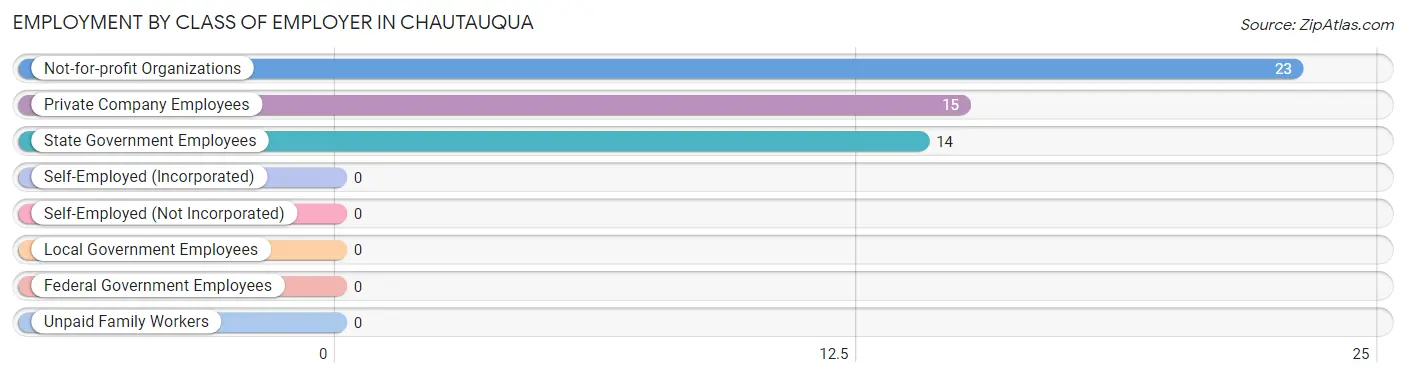
| Employer Class | # Employees | % Employees |
| Private Company Employees | 15 | 28.8% |
| Self-Employed (Incorporated) | 0 | 0.0% |
| Self-Employed (Not Incorporated) | 0 | 0.0% |
| Not-for-profit Organizations | 23 | 44.2% |
| Local Government Employees | 0 | 0.0% |
| State Government Employees | 14 | 26.9% |
| Federal Government Employees | 0 | 0.0% |
| Unpaid Family Workers | 0 | 0.0% |
| Total | 52 | 100.0% |
Employment Status by Age in Chautauqua
According to the labor force statistics for Chautauqua, out of the total population over 16 years of age (271), 23.6% or 64 individuals are in the labor force, with 18.8% or 12 of them unemployed. The age group with the highest labor force participation rate is 25 to 29 years, with 100.0% or 3 individuals in the labor force. Within the labor force, the 20 to 24 years age range has the highest percentage of unemployed individuals, with 34.3% or 12 of them being unemployed.
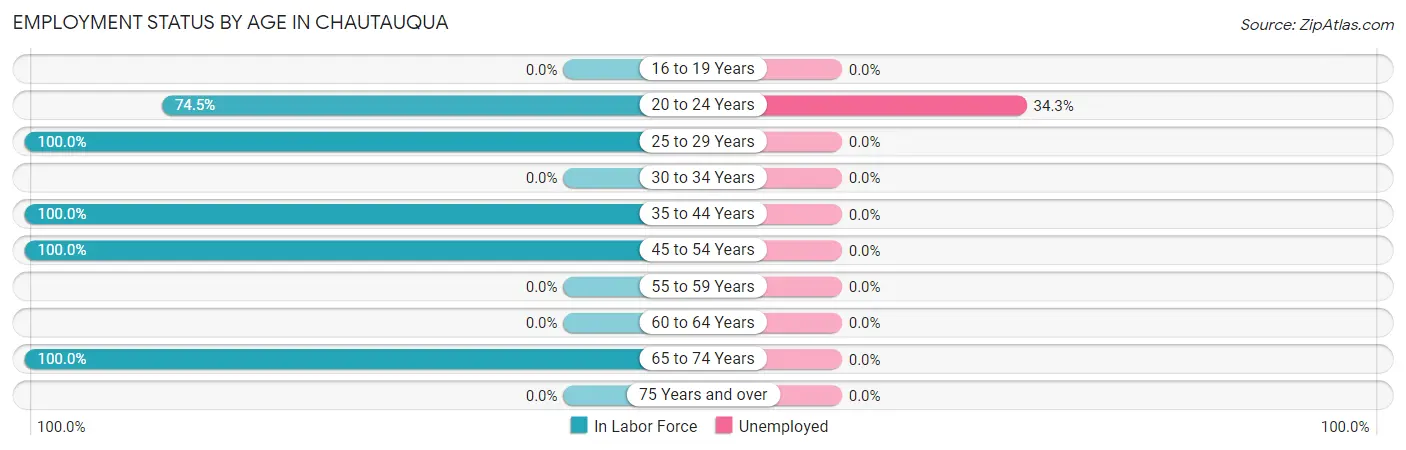
| Age Bracket | In Labor Force | Unemployed |
| 16 to 19 Years | 0 (0.0%) | 0 (0.0%) |
| 20 to 24 Years | 35 (74.5%) | 12 (34.3%) |
| 25 to 29 Years | 3 (100.0%) | 0 (0.0%) |
| 30 to 34 Years | 0 (0.0%) | 0 (0.0%) |
| 35 to 44 Years | 3 (100.0%) | 0 (0.0%) |
| 45 to 54 Years | 6 (100.0%) | 0 (0.0%) |
| 55 to 59 Years | 0 (0.0%) | 0 (0.0%) |
| 60 to 64 Years | 0 (0.0%) | 0 (0.0%) |
| 65 to 74 Years | 17 (100.0%) | 0 (0.0%) |
| 75 Years and over | 0 (0.0%) | 0 (0.0%) |
| Total | 64 (23.6%) | 12 (18.8%) |
Employment Status by Educational Attainment in Chautauqua
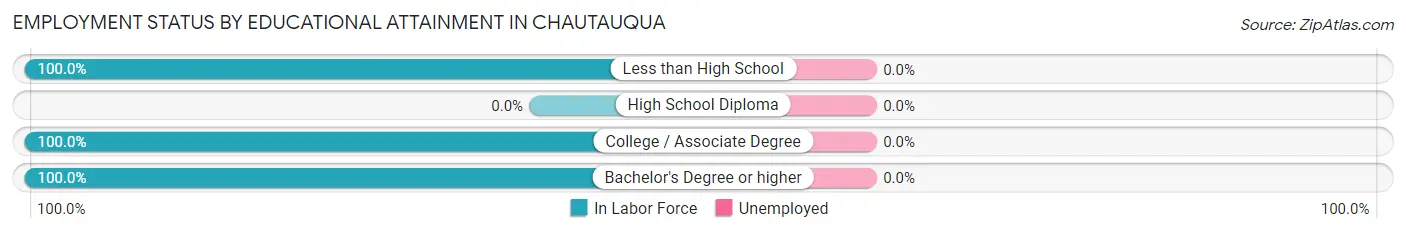
| Educational Attainment | In Labor Force | Unemployed |
| Less than High School | 3 (100.0%) | 0 (0.0%) |
| High School Diploma | 0 (0.0%) | 0 (0.0%) |
| College / Associate Degree | 3 (100.0%) | 0 (0.0%) |
| Bachelor's Degree or higher | 6 (100.0%) | 0 (0.0%) |
| Total | 12 (85.7%) | 0 (0.0%) |
Employment Occupations by Sex in Chautauqua
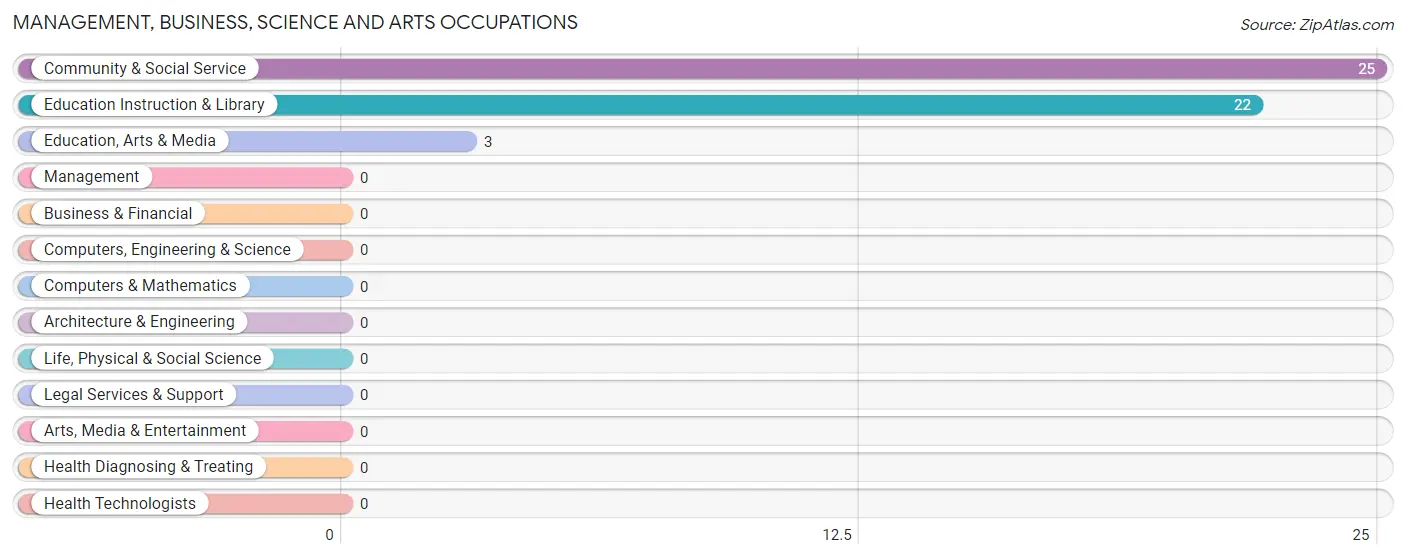
Management, Business, Science and Arts Occupations
The most common Management, Business, Science and Arts occupations in Chautauqua are Community & Social Service (25 | 48.1%), Education Instruction & Library (22 | 42.3%), and Education, Arts & Media (3 | 5.8%).
Management, Business, Science and Arts Occupations by Sex
Within the Management, Business, Science and Arts occupations in Chautauqua, the most male-oriented occupations are Education, Arts & Media (100.0%), and Community & Social Service (12.0%), while the most female-oriented occupations are Education Instruction & Library (100.0%), and Community & Social Service (88.0%).
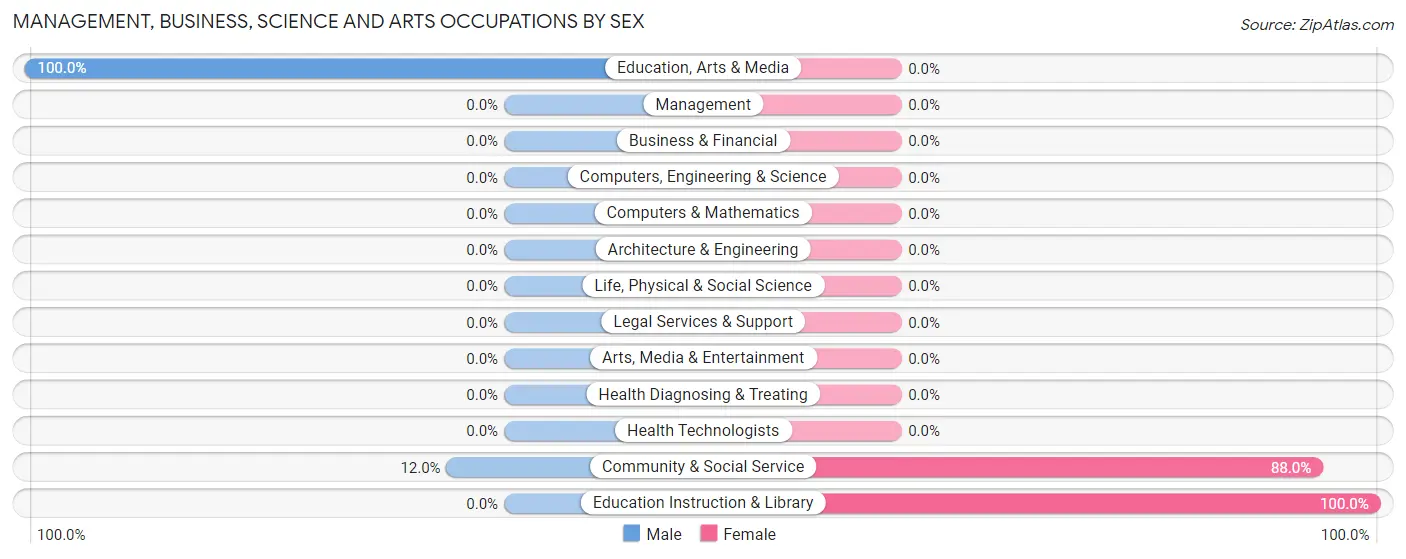
| Occupation | Male | Female |
| Management | 0 (0.0%) | 0 (0.0%) |
| Business & Financial | 0 (0.0%) | 0 (0.0%) |
| Computers, Engineering & Science | 0 (0.0%) | 0 (0.0%) |
| Computers & Mathematics | 0 (0.0%) | 0 (0.0%) |
| Architecture & Engineering | 0 (0.0%) | 0 (0.0%) |
| Life, Physical & Social Science | 0 (0.0%) | 0 (0.0%) |
| Community & Social Service | 3 (12.0%) | 22 (88.0%) |
| Education, Arts & Media | 3 (100.0%) | 0 (0.0%) |
| Legal Services & Support | 0 (0.0%) | 0 (0.0%) |
| Education Instruction & Library | 0 (0.0%) | 22 (100.0%) |
| Arts, Media & Entertainment | 0 (0.0%) | 0 (0.0%) |
| Health Diagnosing & Treating | 0 (0.0%) | 0 (0.0%) |
| Health Technologists | 0 (0.0%) | 0 (0.0%) |
| Total (Category) | 3 (12.0%) | 22 (88.0%) |
| Total (Overall) | 18 (34.6%) | 34 (65.4%) |
Services Occupations
Services Occupations by Sex
| Occupation | Male | Female |
| Healthcare Support | 0 (0.0%) | 0 (0.0%) |
| Security & Protection | 0 (0.0%) | 0 (0.0%) |
| Firefighting & Prevention | 0 (0.0%) | 0 (0.0%) |
| Law Enforcement | 0 (0.0%) | 0 (0.0%) |
| Food Preparation & Serving | 0 (0.0%) | 0 (0.0%) |
| Cleaning & Maintenance | 0 (0.0%) | 0 (0.0%) |
| Personal Care & Service | 0 (0.0%) | 0 (0.0%) |
| Total (Category) | 0 (0.0%) | 0 (0.0%) |
| Total (Overall) | 18 (34.6%) | 34 (65.4%) |
Sales and Office Occupations
The most common Sales and Office occupations in Chautauqua are , and Office & Administration (21 | 40.4%).
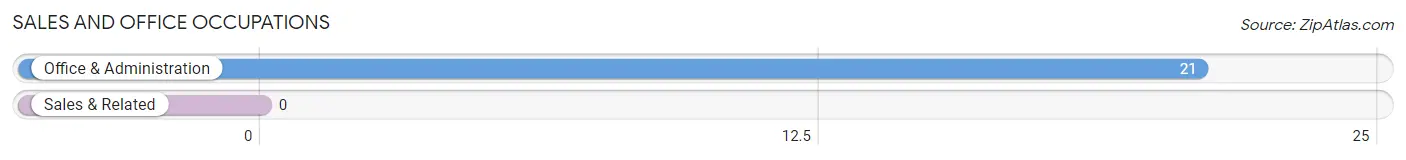
Sales and Office Occupations by Sex
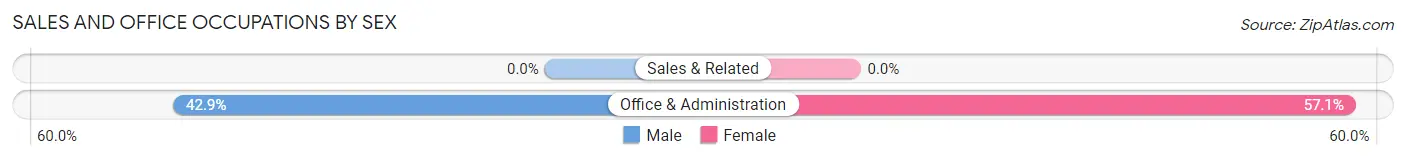
| Occupation | Male | Female |
| Sales & Related | 0 (0.0%) | 0 (0.0%) |
| Office & Administration | 9 (42.9%) | 12 (57.1%) |
| Total (Category) | 9 (42.9%) | 12 (57.1%) |
| Total (Overall) | 18 (34.6%) | 34 (65.4%) |
Natural Resources, Construction and Maintenance Occupations
The most common Natural Resources, Construction and Maintenance occupations in Chautauqua are , and Farming, Fishing & Forestry (6 | 11.5%).
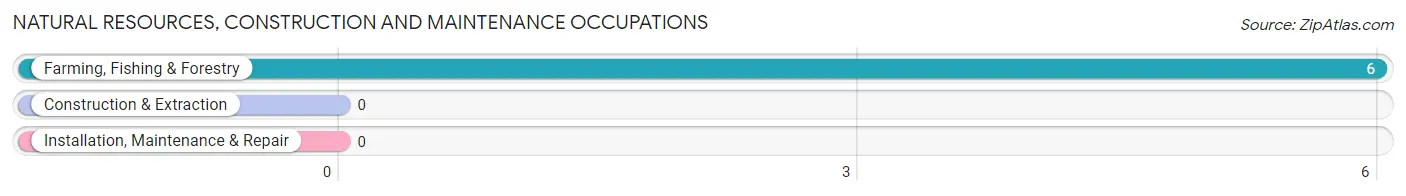
Natural Resources, Construction and Maintenance Occupations by Sex
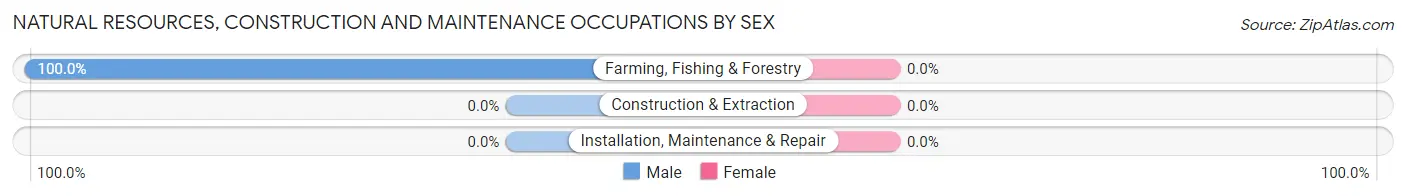
| Occupation | Male | Female |
| Farming, Fishing & Forestry | 6 (100.0%) | 0 (0.0%) |
| Construction & Extraction | 0 (0.0%) | 0 (0.0%) |
| Installation, Maintenance & Repair | 0 (0.0%) | 0 (0.0%) |
| Total (Category) | 6 (100.0%) | 0 (0.0%) |
| Total (Overall) | 18 (34.6%) | 34 (65.4%) |
Production, Transportation and Moving Occupations
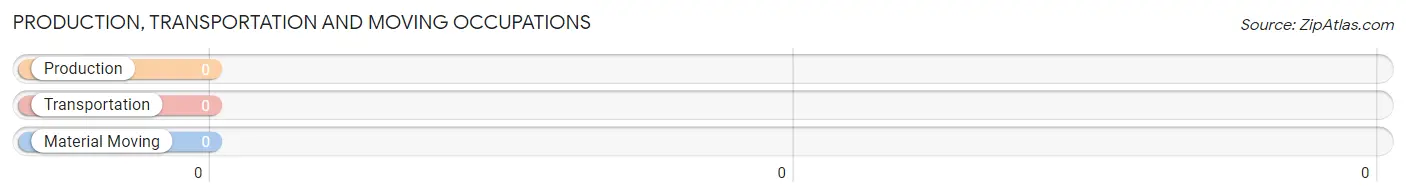
Production, Transportation and Moving Occupations by Sex
| Occupation | Male | Female |
| Production | 0 (0.0%) | 0 (0.0%) |
| Transportation | 0 (0.0%) | 0 (0.0%) |
| Material Moving | 0 (0.0%) | 0 (0.0%) |
| Total (Category) | 0 (0.0%) | 0 (0.0%) |
| Total (Overall) | 18 (34.6%) | 34 (65.4%) |
Employment Industries by Sex in Chautauqua
Employment Industries in Chautauqua
The major employment industries in Chautauqua include Educational Services (25 | 48.1%), Information (9 | 17.3%), Accommodation & Food Services (9 | 17.3%), and Agriculture, Fishing & Hunting (6 | 11.5%).
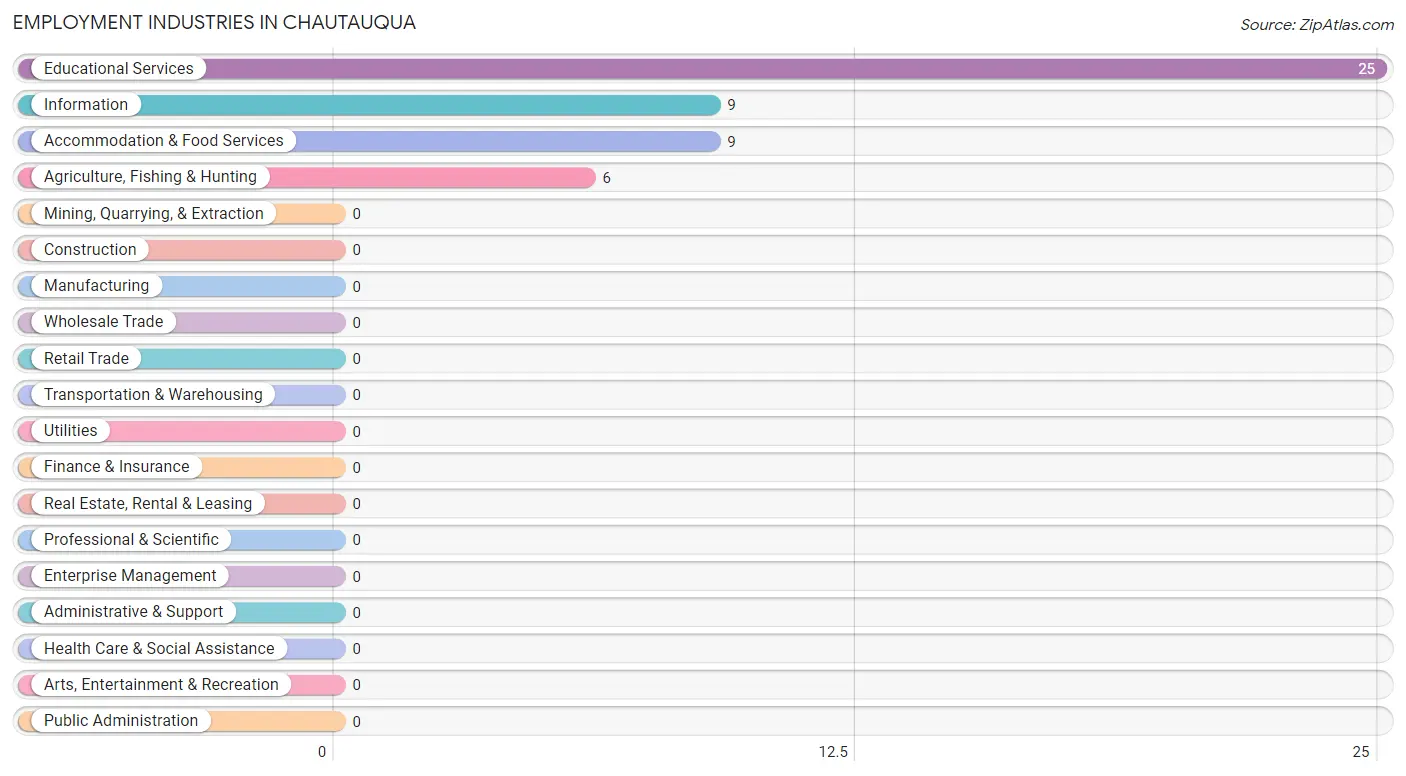
Employment Industries by Sex in Chautauqua
The Chautauqua industries that see more men than women are Agriculture, Fishing & Hunting (100.0%), and Accommodation & Food Services (100.0%), whereas the industries that tend to have a higher number of women are Information (100.0%), and Educational Services (100.0%).
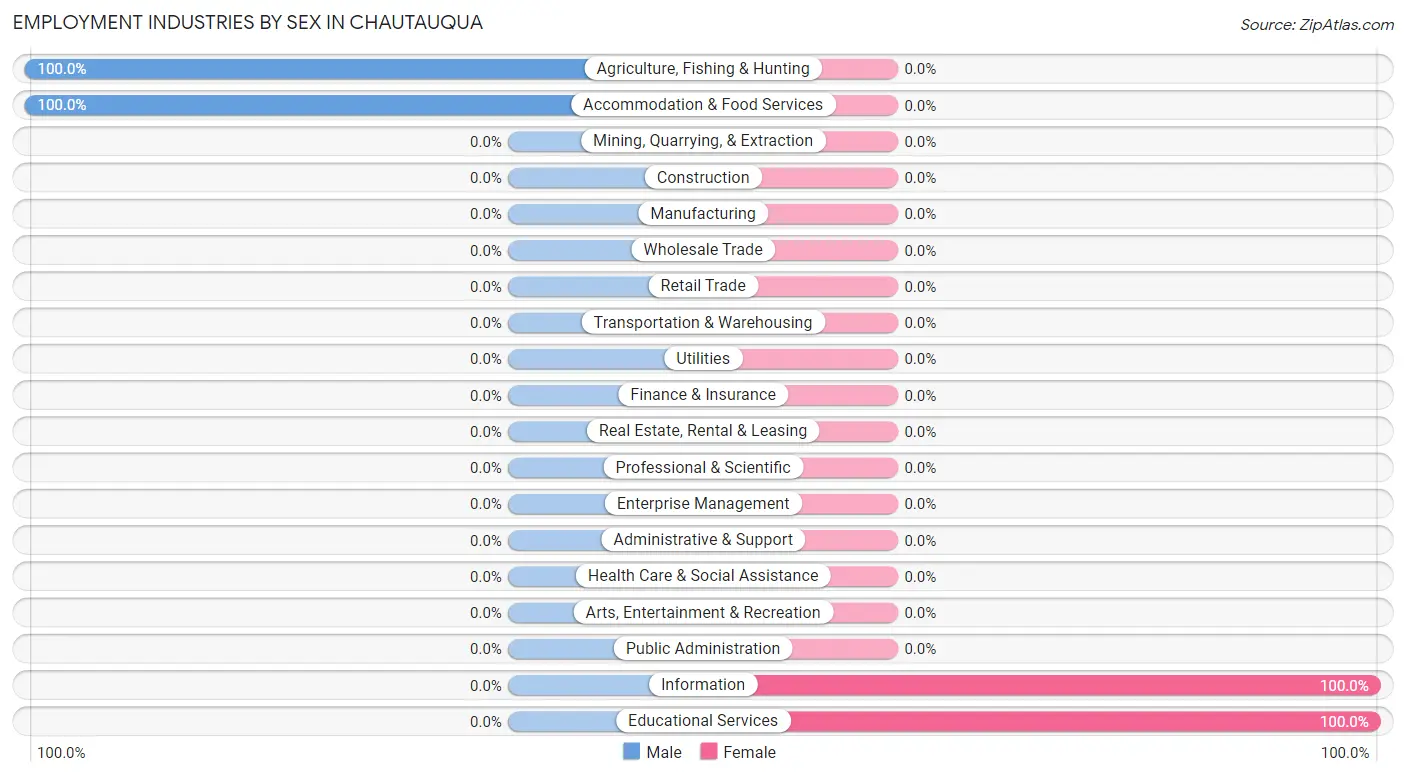
| Industry | Male | Female |
| Agriculture, Fishing & Hunting | 6 (100.0%) | 0 (0.0%) |
| Mining, Quarrying, & Extraction | 0 (0.0%) | 0 (0.0%) |
| Construction | 0 (0.0%) | 0 (0.0%) |
| Manufacturing | 0 (0.0%) | 0 (0.0%) |
| Wholesale Trade | 0 (0.0%) | 0 (0.0%) |
| Retail Trade | 0 (0.0%) | 0 (0.0%) |
| Transportation & Warehousing | 0 (0.0%) | 0 (0.0%) |
| Utilities | 0 (0.0%) | 0 (0.0%) |
| Information | 0 (0.0%) | 9 (100.0%) |
| Finance & Insurance | 0 (0.0%) | 0 (0.0%) |
| Real Estate, Rental & Leasing | 0 (0.0%) | 0 (0.0%) |
| Professional & Scientific | 0 (0.0%) | 0 (0.0%) |
| Enterprise Management | 0 (0.0%) | 0 (0.0%) |
| Administrative & Support | 0 (0.0%) | 0 (0.0%) |
| Educational Services | 0 (0.0%) | 25 (100.0%) |
| Health Care & Social Assistance | 0 (0.0%) | 0 (0.0%) |
| Arts, Entertainment & Recreation | 0 (0.0%) | 0 (0.0%) |
| Accommodation & Food Services | 9 (100.0%) | 0 (0.0%) |
| Public Administration | 0 (0.0%) | 0 (0.0%) |
| Total | 18 (34.6%) | 34 (65.4%) |
Education in Chautauqua
School Enrollment in Chautauqua
The most common levels of schooling among the 177 students in Chautauqua are college / undergraduate (171 | 96.6%), high school (3 | 1.7%), and graduate / professional (3 | 1.7%).
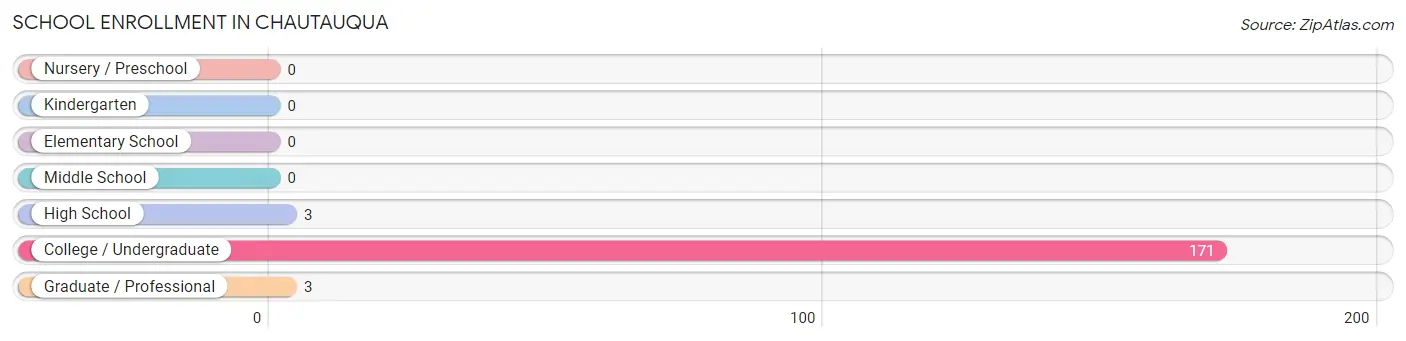
| School Level | # Students | % Students |
| Nursery / Preschool | 0 | 0.0% |
| Kindergarten | 0 | 0.0% |
| Elementary School | 0 | 0.0% |
| Middle School | 0 | 0.0% |
| High School | 3 | 1.7% |
| College / Undergraduate | 171 | 96.6% |
| Graduate / Professional | 3 | 1.7% |
| Total | 177 | 100.0% |
School Enrollment by Age by Funding Source in Chautauqua
Out of a total of 177 students who are enrolled in schools in Chautauqua, 21 (11.9%) attend a private institution, while the remaining 156 (88.1%) are enrolled in public schools. The age group of 35 years and over has the highest likelihood of being enrolled in private schools, with 3 (100.0% in the age bracket) enrolled. Conversely, the age group of 15 to 17 year olds has the lowest likelihood of being enrolled in a private school, with 14 (100.0% in the age bracket) attending a public institution.
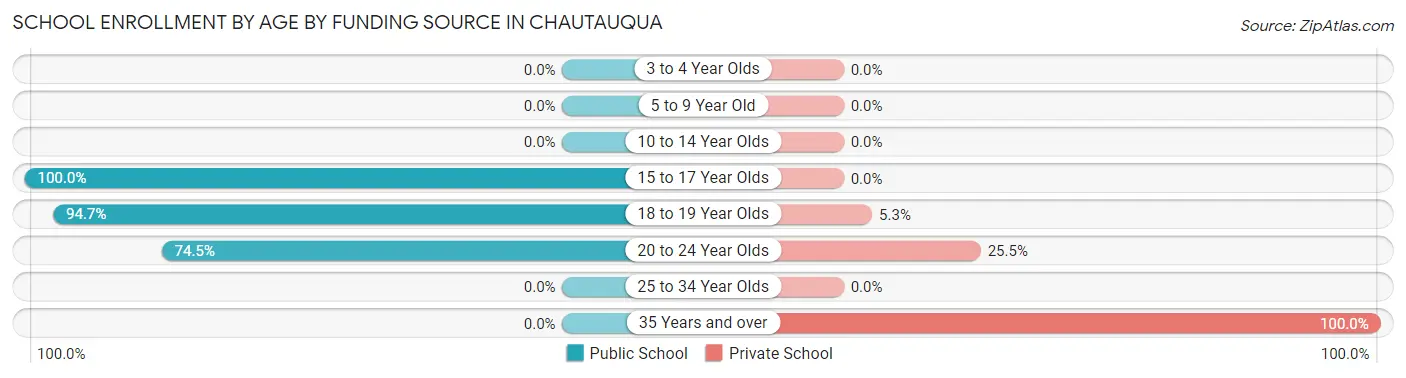
| Age Bracket | Public School | Private School |
| 3 to 4 Year Olds | 0 (0.0%) | 0 (0.0%) |
| 5 to 9 Year Old | 0 (0.0%) | 0 (0.0%) |
| 10 to 14 Year Olds | 0 (0.0%) | 0 (0.0%) |
| 15 to 17 Year Olds | 14 (100.0%) | 0 (0.0%) |
| 18 to 19 Year Olds | 107 (94.7%) | 6 (5.3%) |
| 20 to 24 Year Olds | 35 (74.5%) | 12 (25.5%) |
| 25 to 34 Year Olds | 0 (0.0%) | 0 (0.0%) |
| 35 Years and over | 0 (0.0%) | 3 (100.0%) |
| Total | 156 (88.1%) | 21 (11.9%) |
Educational Attainment by Field of Study in Chautauqua
Liberal arts & history (53 | 59.6%), visual & performing arts (20 | 22.5%), engineering (8 | 9.0%), and education (8 | 9.0%) are the most common fields of study among 89 individuals in Chautauqua who have obtained a bachelor's degree or higher.
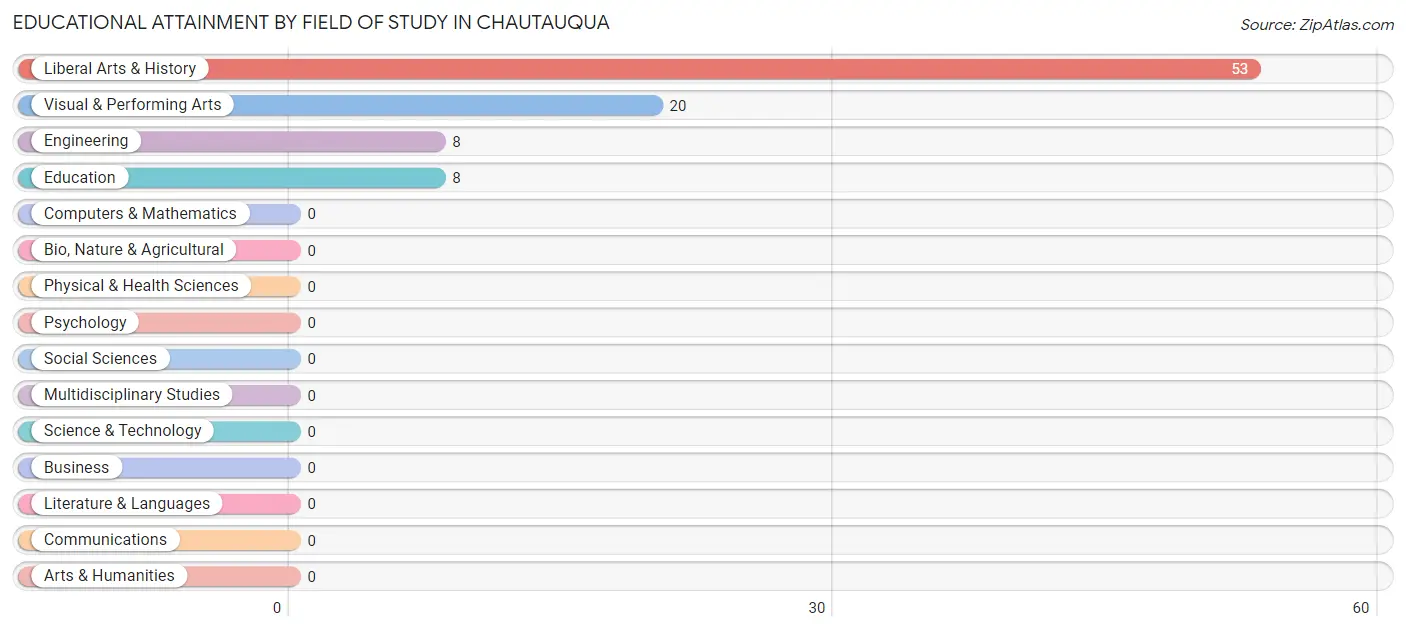
| Field of Study | # Graduates | % Graduates |
| Computers & Mathematics | 0 | 0.0% |
| Bio, Nature & Agricultural | 0 | 0.0% |
| Physical & Health Sciences | 0 | 0.0% |
| Psychology | 0 | 0.0% |
| Social Sciences | 0 | 0.0% |
| Engineering | 8 | 9.0% |
| Multidisciplinary Studies | 0 | 0.0% |
| Science & Technology | 0 | 0.0% |
| Business | 0 | 0.0% |
| Education | 8 | 9.0% |
| Literature & Languages | 0 | 0.0% |
| Liberal Arts & History | 53 | 59.6% |
| Visual & Performing Arts | 20 | 22.5% |
| Communications | 0 | 0.0% |
| Arts & Humanities | 0 | 0.0% |
| Total | 89 | 100.0% |
Transportation & Commute in Chautauqua
Vehicle Availability by Sex in Chautauqua
The most prevalent vehicle ownership categories in Chautauqua are males with 1 vehicle (9, accounting for 100.0%) and females with 1 vehicle (8, making up 112.5%).
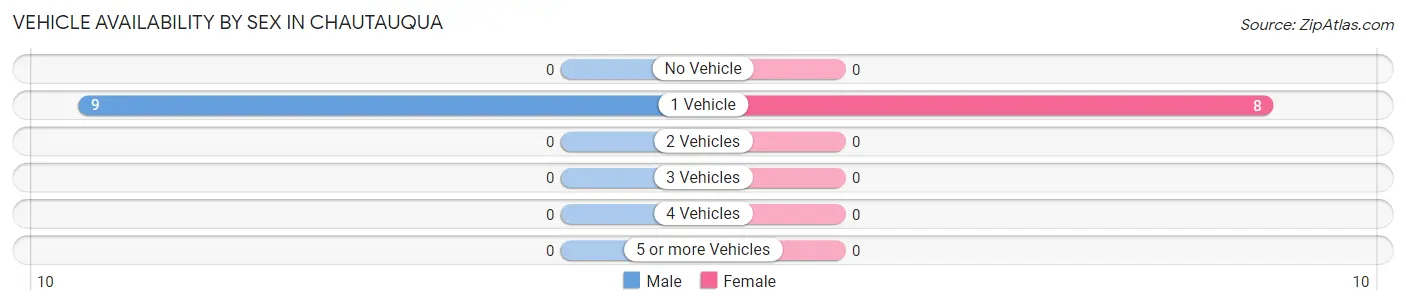
| Vehicles Available | Male | Female |
| No Vehicle | 0 (0.0%) | 0 (0.0%) |
| 1 Vehicle | 9 (100.0%) | 8 (100.0%) |
| 2 Vehicles | 0 (0.0%) | 0 (0.0%) |
| 3 Vehicles | 0 (0.0%) | 0 (0.0%) |
| 4 Vehicles | 0 (0.0%) | 0 (0.0%) |
| 5 or more Vehicles | 0 (0.0%) | 0 (0.0%) |
| Total | 9 (100.0%) | 8 (100.0%) |
Commute Time in Chautauqua
The most frequently occuring commute durations in Chautauqua are 5 to 9 minutes (14 commuters, 35.0%), 10 to 14 minutes (9 commuters, 22.5%), and 20 to 24 minutes (9 commuters, 22.5%).
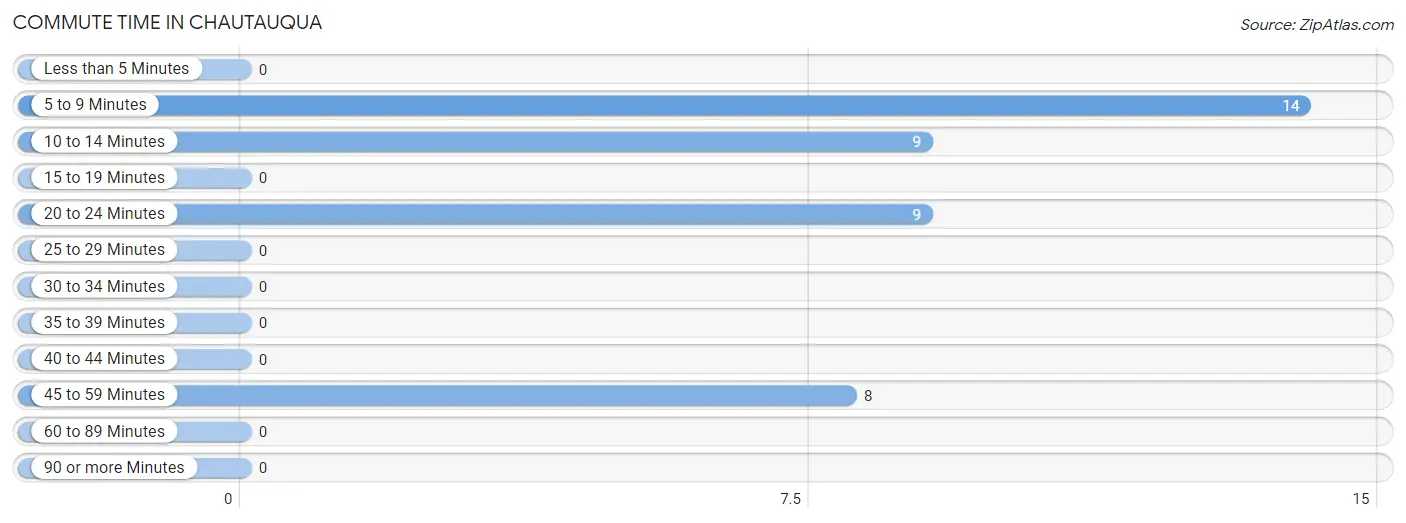
| Commute Time | # Commuters | % Commuters |
| Less than 5 Minutes | 0 | 0.0% |
| 5 to 9 Minutes | 14 | 35.0% |
| 10 to 14 Minutes | 9 | 22.5% |
| 15 to 19 Minutes | 0 | 0.0% |
| 20 to 24 Minutes | 9 | 22.5% |
| 25 to 29 Minutes | 0 | 0.0% |
| 30 to 34 Minutes | 0 | 0.0% |
| 35 to 39 Minutes | 0 | 0.0% |
| 40 to 44 Minutes | 0 | 0.0% |
| 45 to 59 Minutes | 8 | 20.0% |
| 60 to 89 Minutes | 0 | 0.0% |
| 90 or more Minutes | 0 | 0.0% |
Commute Time by Sex in Chautauqua
The most common commute times in Chautauqua are 20 to 24 minutes (9 commuters, 100.0%) for males and 5 to 9 minutes (14 commuters, 45.2%) for females.
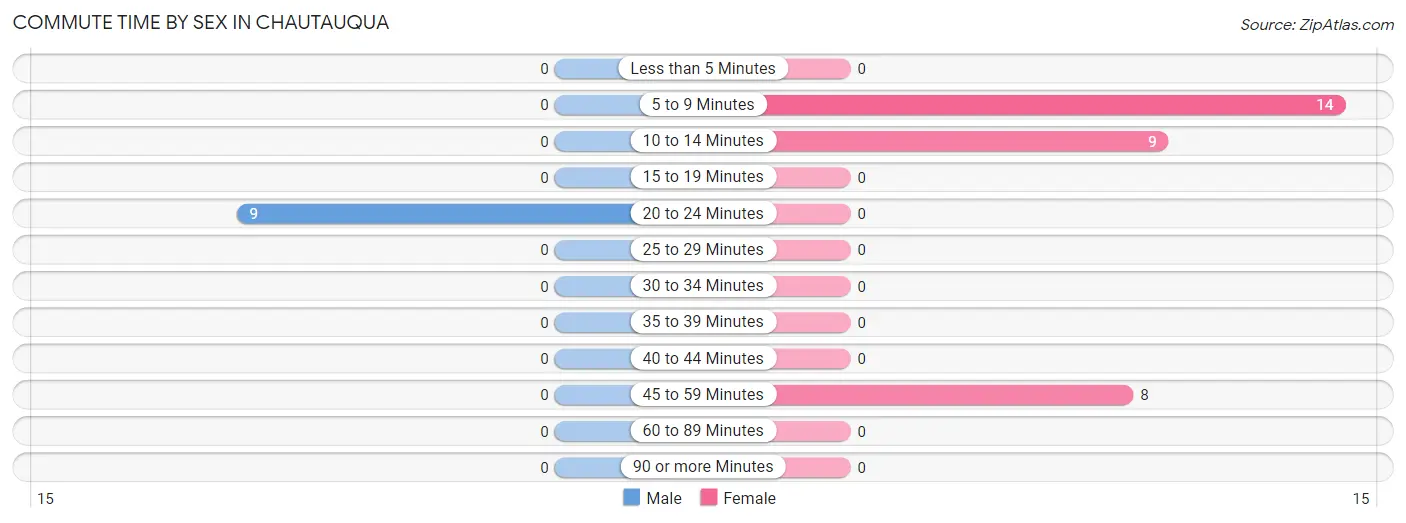
| Commute Time | Male | Female |
| Less than 5 Minutes | 0 (0.0%) | 0 (0.0%) |
| 5 to 9 Minutes | 0 (0.0%) | 14 (45.2%) |
| 10 to 14 Minutes | 0 (0.0%) | 9 (29.0%) |
| 15 to 19 Minutes | 0 (0.0%) | 0 (0.0%) |
| 20 to 24 Minutes | 9 (100.0%) | 0 (0.0%) |
| 25 to 29 Minutes | 0 (0.0%) | 0 (0.0%) |
| 30 to 34 Minutes | 0 (0.0%) | 0 (0.0%) |
| 35 to 39 Minutes | 0 (0.0%) | 0 (0.0%) |
| 40 to 44 Minutes | 0 (0.0%) | 0 (0.0%) |
| 45 to 59 Minutes | 0 (0.0%) | 8 (25.8%) |
| 60 to 89 Minutes | 0 (0.0%) | 0 (0.0%) |
| 90 or more Minutes | 0 (0.0%) | 0 (0.0%) |
Time of Departure to Work by Sex in Chautauqua
The most frequent times of departure to work in Chautauqua are 8:30 AM to 8:59 AM (9, 100.0%) for males and 12:00 PM to 3:59 PM (14, 45.2%) for females.
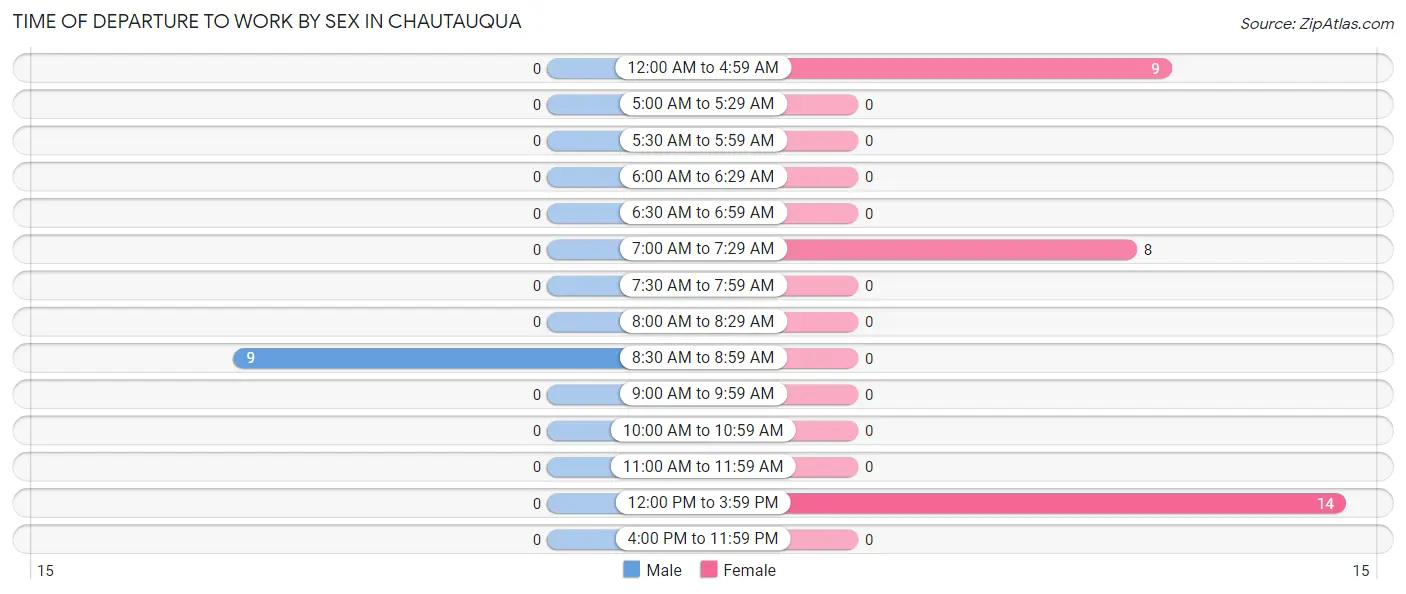
| Time of Departure | Male | Female |
| 12:00 AM to 4:59 AM | 0 (0.0%) | 9 (29.0%) |
| 5:00 AM to 5:29 AM | 0 (0.0%) | 0 (0.0%) |
| 5:30 AM to 5:59 AM | 0 (0.0%) | 0 (0.0%) |
| 6:00 AM to 6:29 AM | 0 (0.0%) | 0 (0.0%) |
| 6:30 AM to 6:59 AM | 0 (0.0%) | 0 (0.0%) |
| 7:00 AM to 7:29 AM | 0 (0.0%) | 8 (25.8%) |
| 7:30 AM to 7:59 AM | 0 (0.0%) | 0 (0.0%) |
| 8:00 AM to 8:29 AM | 0 (0.0%) | 0 (0.0%) |
| 8:30 AM to 8:59 AM | 9 (100.0%) | 0 (0.0%) |
| 9:00 AM to 9:59 AM | 0 (0.0%) | 0 (0.0%) |
| 10:00 AM to 10:59 AM | 0 (0.0%) | 0 (0.0%) |
| 11:00 AM to 11:59 AM | 0 (0.0%) | 0 (0.0%) |
| 12:00 PM to 3:59 PM | 0 (0.0%) | 14 (45.2%) |
| 4:00 PM to 11:59 PM | 0 (0.0%) | 0 (0.0%) |
| Total | 9 (100.0%) | 31 (100.0%) |
Housing Occupancy in Chautauqua
Occupancy by Ownership in Chautauqua
Of the total 66 dwellings in Chautauqua, owner-occupied units account for 66 (100.0%), while renter-occupied units make up 0 (0.0%).
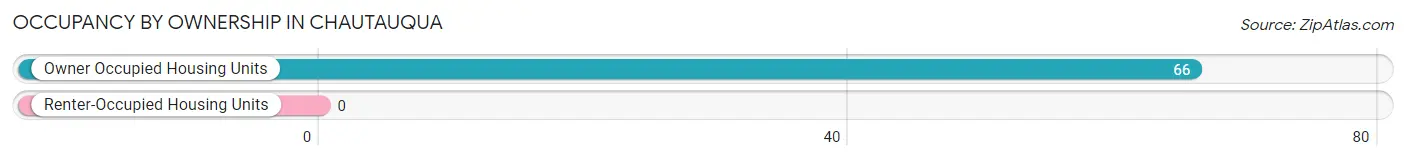
| Occupancy | # Housing Units | % Housing Units |
| Owner Occupied Housing Units | 66 | 100.0% |
| Renter-Occupied Housing Units | 0 | 0.0% |
| Total Occupied Housing Units | 66 | 100.0% |
Occupancy by Household Size in Chautauqua
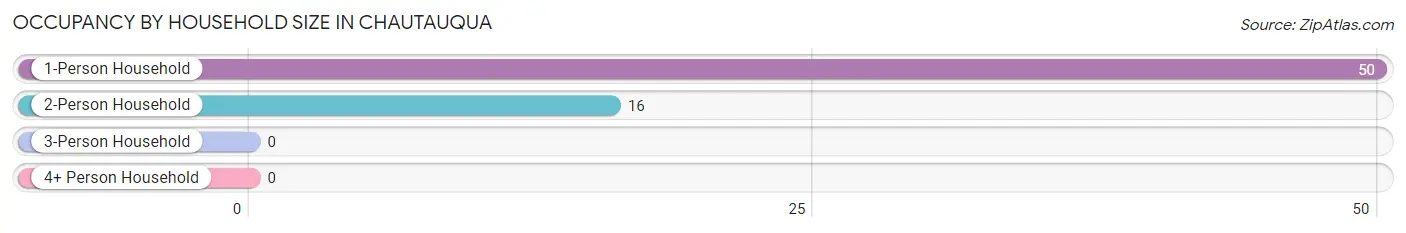
| Household Size | # Housing Units | % Housing Units |
| 1-Person Household | 50 | 75.8% |
| 2-Person Household | 16 | 24.2% |
| 3-Person Household | 0 | 0.0% |
| 4+ Person Household | 0 | 0.0% |
| Total Housing Units | 66 | 100.0% |
Occupancy by Ownership by Household Size in Chautauqua
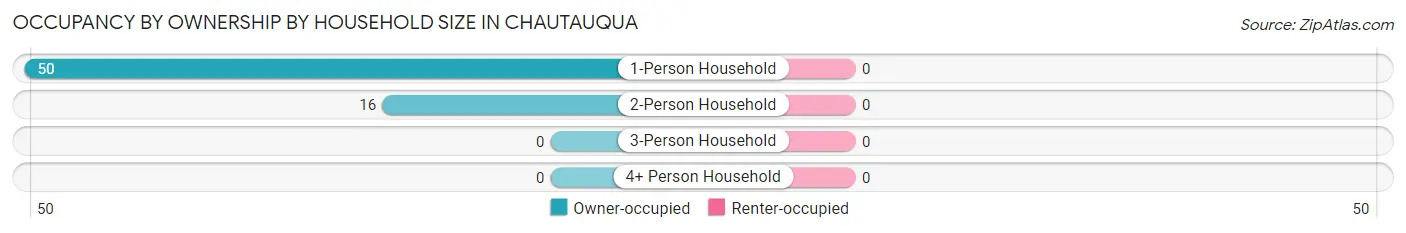
| Household Size | Owner-occupied | Renter-occupied |
| 1-Person Household | 50 (100.0%) | 0 (0.0%) |
| 2-Person Household | 16 (100.0%) | 0 (0.0%) |
| 3-Person Household | 0 (0.0%) | 0 (0.0%) |
| 4+ Person Household | 0 (0.0%) | 0 (0.0%) |
| Total Housing Units | 66 (100.0%) | 0 (0.0%) |
Occupancy by Educational Attainment in Chautauqua
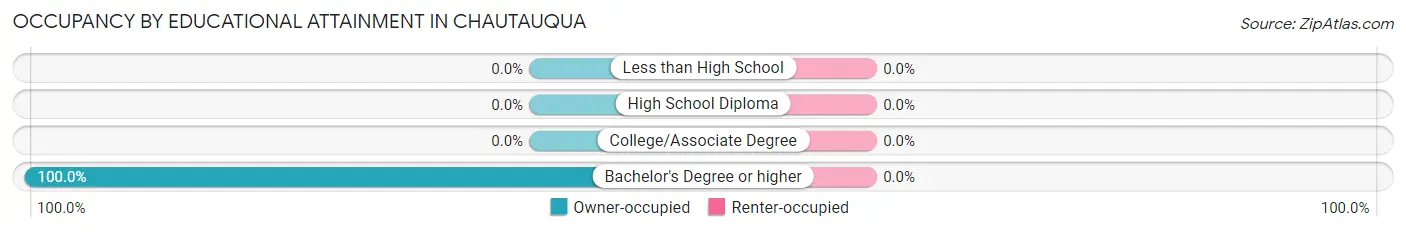
| Household Size | Owner-occupied | Renter-occupied |
| Less than High School | 0 (0.0%) | 0 (0.0%) |
| High School Diploma | 0 (0.0%) | 0 (0.0%) |
| College/Associate Degree | 0 (0.0%) | 0 (0.0%) |
| Bachelor's Degree or higher | 66 (100.0%) | 0 (0.0%) |
Occupancy by Age of Householder in Chautauqua
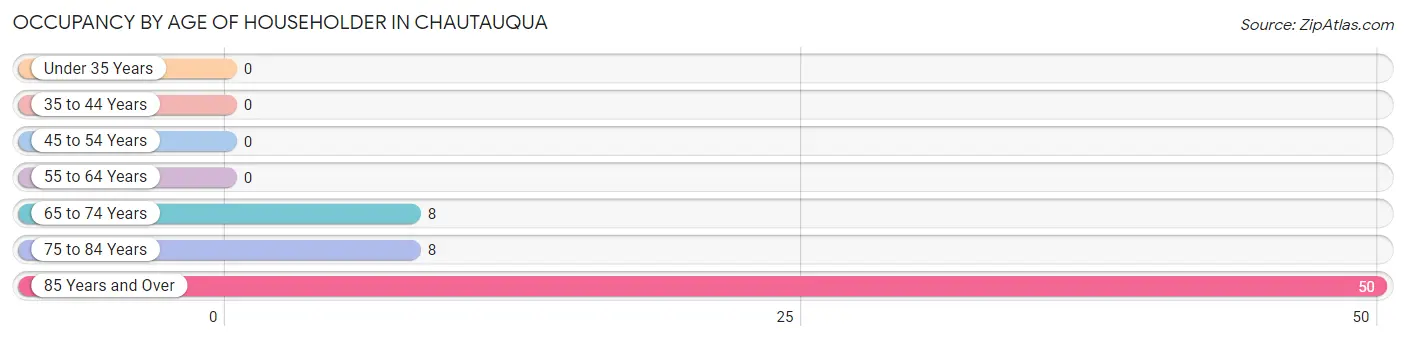
| Age Bracket | # Households | % Households |
| Under 35 Years | 0 | 0.0% |
| 35 to 44 Years | 0 | 0.0% |
| 45 to 54 Years | 0 | 0.0% |
| 55 to 64 Years | 0 | 0.0% |
| 65 to 74 Years | 8 | 12.1% |
| 75 to 84 Years | 8 | 12.1% |
| 85 Years and Over | 50 | 75.8% |
| Total | 66 | 100.0% |
Housing Finances in Chautauqua
Median Income by Occupancy in Chautauqua
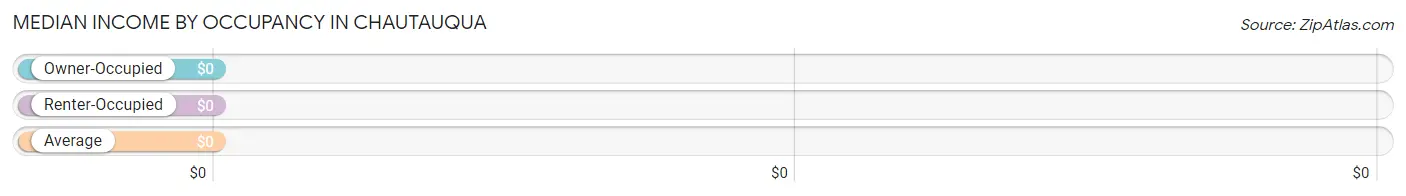
| Occupancy Type | # Households | Median Income |
| Owner-Occupied | 66 (100.0%) | $0 |
| Renter-Occupied | 0 (0.0%) | $0 |
| Average | 66 (100.0%) | $0 |
Occupancy by Householder Income Bracket in Chautauqua
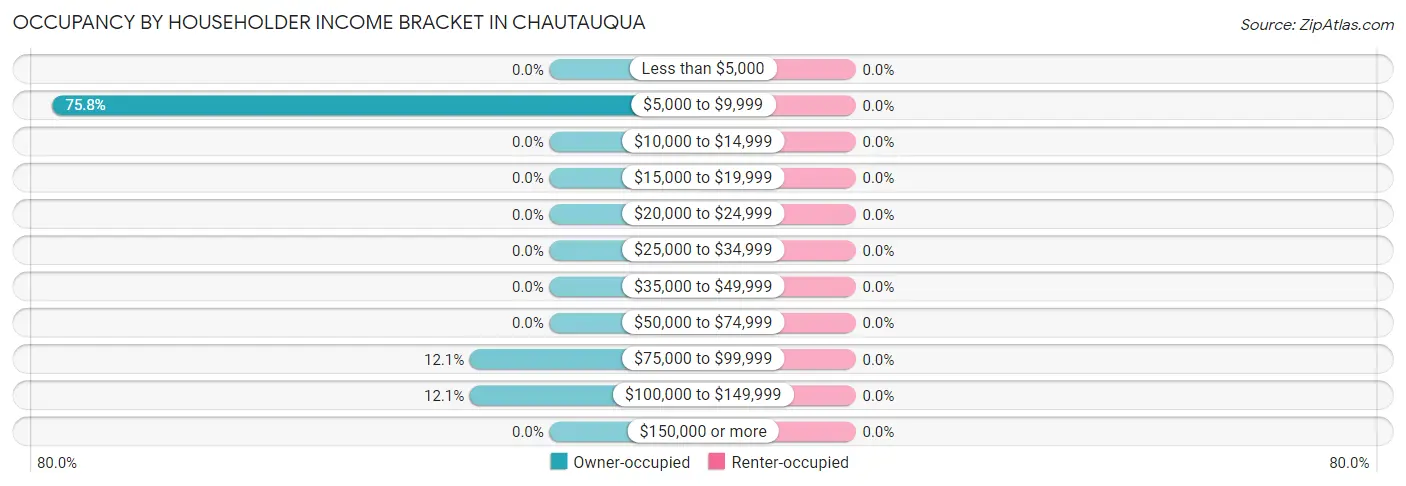
| Income Bracket | Owner-occupied | Renter-occupied |
| Less than $5,000 | 0 (0.0%) | 0 (0.0%) |
| $5,000 to $9,999 | 50 (75.8%) | 0 (0.0%) |
| $10,000 to $14,999 | 0 (0.0%) | 0 (0.0%) |
| $15,000 to $19,999 | 0 (0.0%) | 0 (0.0%) |
| $20,000 to $24,999 | 0 (0.0%) | 0 (0.0%) |
| $25,000 to $34,999 | 0 (0.0%) | 0 (0.0%) |
| $35,000 to $49,999 | 0 (0.0%) | 0 (0.0%) |
| $50,000 to $74,999 | 0 (0.0%) | 0 (0.0%) |
| $75,000 to $99,999 | 8 (12.1%) | 0 (0.0%) |
| $100,000 to $149,999 | 8 (12.1%) | 0 (0.0%) |
| $150,000 or more | 0 (0.0%) | 0 (0.0%) |
| Total | 66 (100.0%) | 0 (0.0%) |
Monthly Housing Cost Tiers in Chautauqua
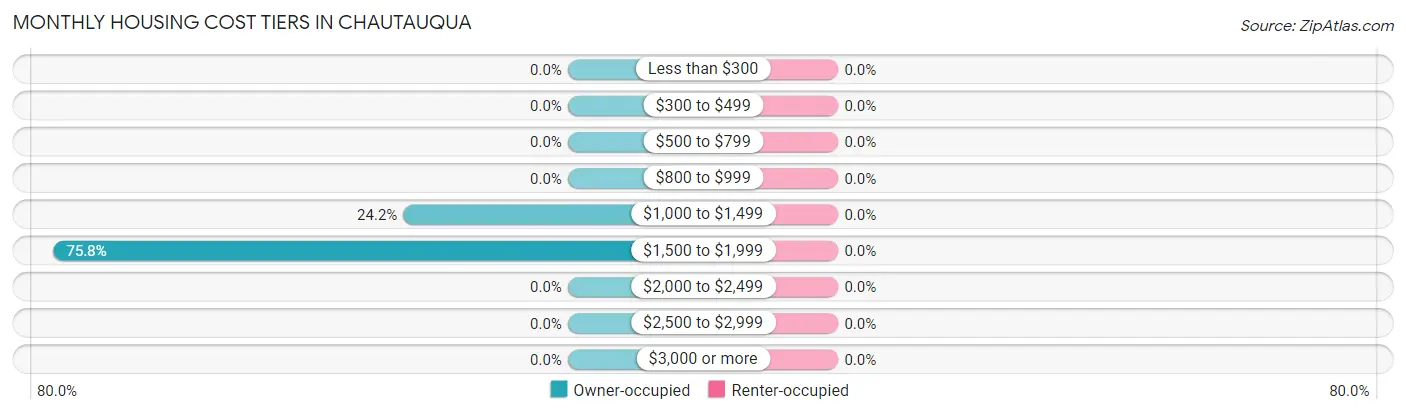
| Monthly Cost | Owner-occupied | Renter-occupied |
| Less than $300 | 0 (0.0%) | 0 (0.0%) |
| $300 to $499 | 0 (0.0%) | 0 (0.0%) |
| $500 to $799 | 0 (0.0%) | 0 (0.0%) |
| $800 to $999 | 0 (0.0%) | 0 (0.0%) |
| $1,000 to $1,499 | 16 (24.2%) | 0 (0.0%) |
| $1,500 to $1,999 | 50 (75.8%) | 0 (0.0%) |
| $2,000 to $2,499 | 0 (0.0%) | 0 (0.0%) |
| $2,500 to $2,999 | 0 (0.0%) | 0 (0.0%) |
| $3,000 or more | 0 (0.0%) | 0 (0.0%) |
| Total | 66 (100.0%) | 0 (0.0%) |
Physical Housing Characteristics in Chautauqua
Housing Structures in Chautauqua
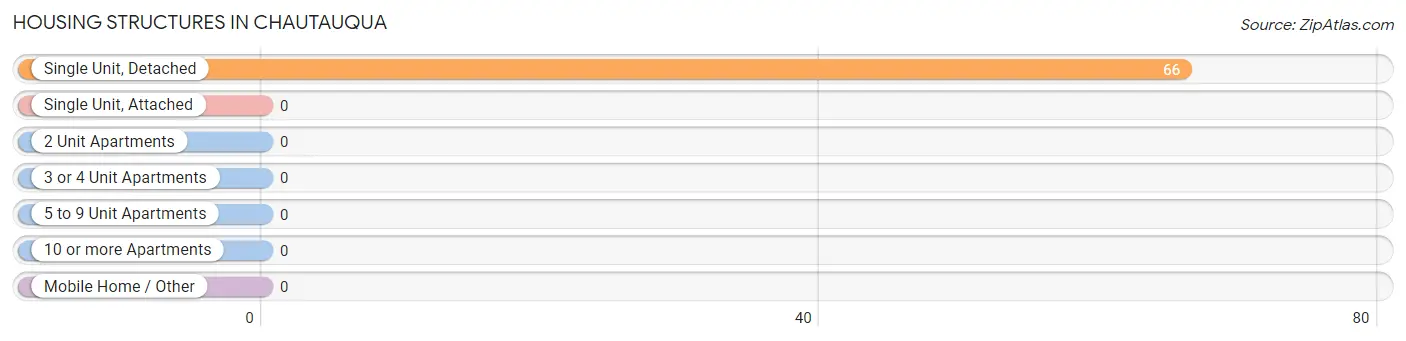
| Structure Type | # Housing Units | % Housing Units |
| Single Unit, Detached | 66 | 100.0% |
| Single Unit, Attached | 0 | 0.0% |
| 2 Unit Apartments | 0 | 0.0% |
| 3 or 4 Unit Apartments | 0 | 0.0% |
| 5 to 9 Unit Apartments | 0 | 0.0% |
| 10 or more Apartments | 0 | 0.0% |
| Mobile Home / Other | 0 | 0.0% |
| Total | 66 | 100.0% |
Housing Structures by Occupancy in Chautauqua
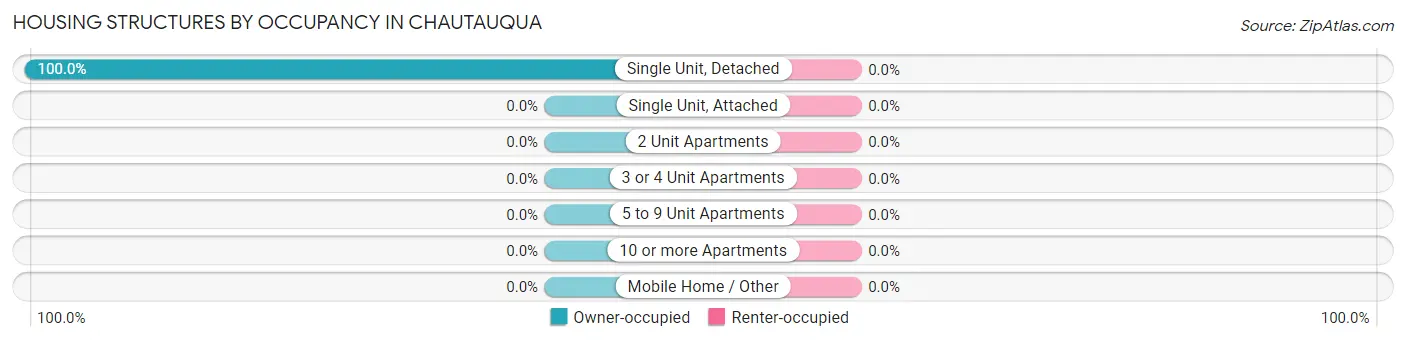
| Structure Type | Owner-occupied | Renter-occupied |
| Single Unit, Detached | 66 (100.0%) | 0 (0.0%) |
| Single Unit, Attached | 0 (0.0%) | 0 (0.0%) |
| 2 Unit Apartments | 0 (0.0%) | 0 (0.0%) |
| 3 or 4 Unit Apartments | 0 (0.0%) | 0 (0.0%) |
| 5 to 9 Unit Apartments | 0 (0.0%) | 0 (0.0%) |
| 10 or more Apartments | 0 (0.0%) | 0 (0.0%) |
| Mobile Home / Other | 0 (0.0%) | 0 (0.0%) |
| Total | 66 (100.0%) | 0 (0.0%) |
Housing Structures by Number of Rooms in Chautauqua
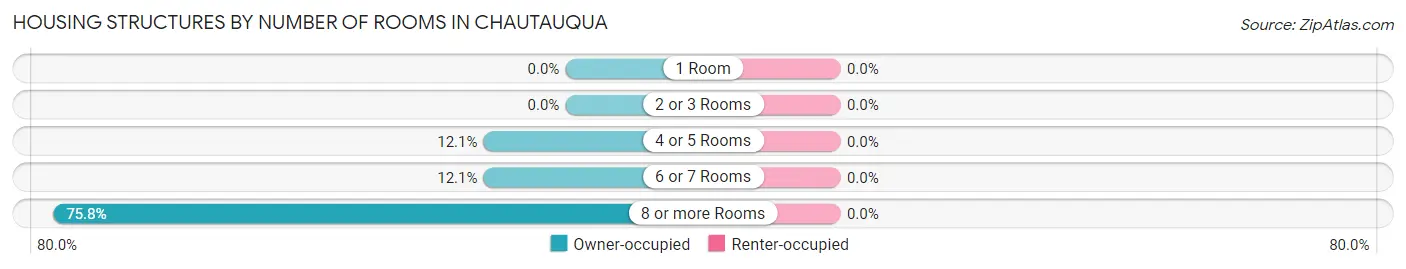
| Number of Rooms | Owner-occupied | Renter-occupied |
| 1 Room | 0 (0.0%) | 0 (0.0%) |
| 2 or 3 Rooms | 0 (0.0%) | 0 (0.0%) |
| 4 or 5 Rooms | 8 (12.1%) | 0 (0.0%) |
| 6 or 7 Rooms | 8 (12.1%) | 0 (0.0%) |
| 8 or more Rooms | 50 (75.8%) | 0 (0.0%) |
| Total | 66 (100.0%) | 0 (0.0%) |
Housing Structure by Heating Type in Chautauqua
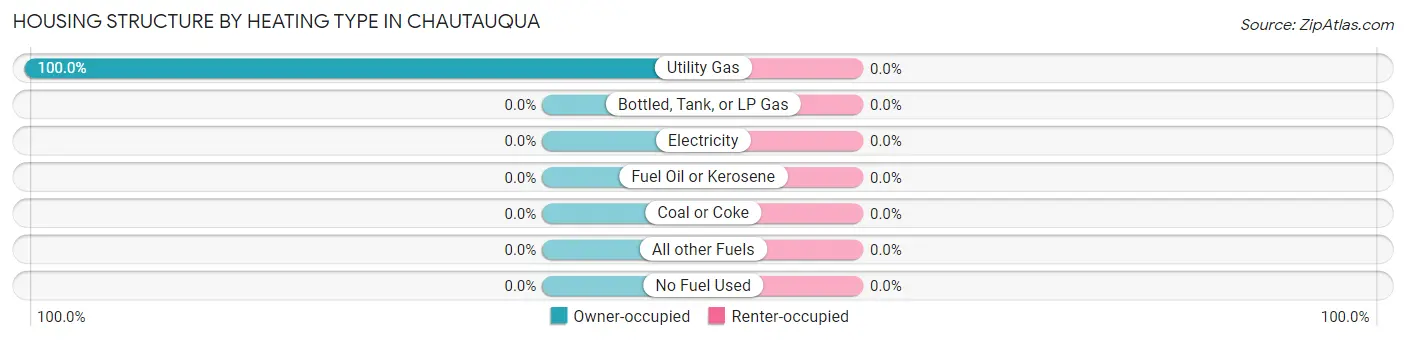
| Heating Type | Owner-occupied | Renter-occupied |
| Utility Gas | 66 (100.0%) | 0 (0.0%) |
| Bottled, Tank, or LP Gas | 0 (0.0%) | 0 (0.0%) |
| Electricity | 0 (0.0%) | 0 (0.0%) |
| Fuel Oil or Kerosene | 0 (0.0%) | 0 (0.0%) |
| Coal or Coke | 0 (0.0%) | 0 (0.0%) |
| All other Fuels | 0 (0.0%) | 0 (0.0%) |
| No Fuel Used | 0 (0.0%) | 0 (0.0%) |
| Total | 66 (100.0%) | 0 (0.0%) |
Household Vehicle Usage in Chautauqua
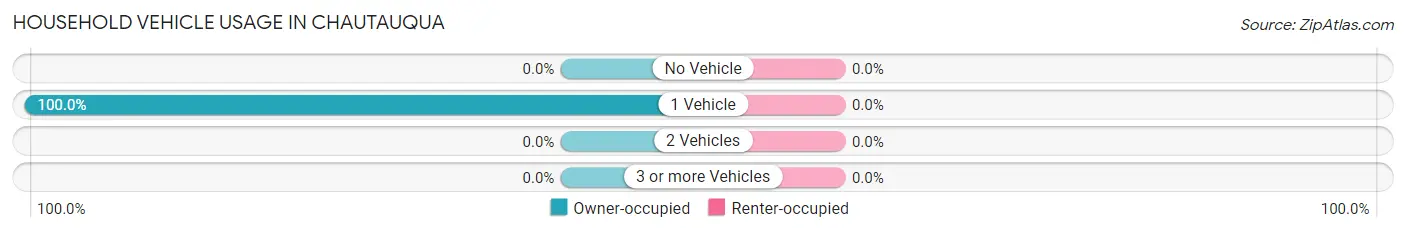
| Vehicles per Household | Owner-occupied | Renter-occupied |
| No Vehicle | 0 (0.0%) | 0 (0.0%) |
| 1 Vehicle | 66 (100.0%) | 0 (0.0%) |
| 2 Vehicles | 0 (0.0%) | 0 (0.0%) |
| 3 or more Vehicles | 0 (0.0%) | 0 (0.0%) |
| Total | 66 (100.0%) | 0 (0.0%) |
Real Estate & Mortgages in Chautauqua
Real Estate and Mortgage Overview in Chautauqua
| Characteristic | Without Mortgage | With Mortgage |
| Housing Units | 58 | 8 |
| Median Property Value | - | - |
| Median Household Income | - | - |
| Monthly Housing Costs | - | - |
| Real Estate Taxes | - | - |
Property Value by Mortgage Status in Chautauqua
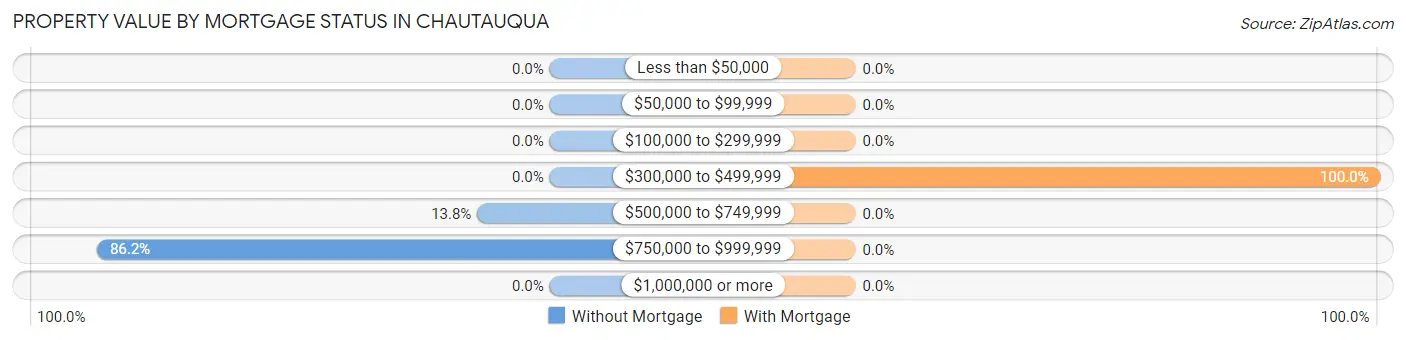
| Property Value | Without Mortgage | With Mortgage |
| Less than $50,000 | 0 (0.0%) | 0 (0.0%) |
| $50,000 to $99,999 | 0 (0.0%) | 0 (0.0%) |
| $100,000 to $299,999 | 0 (0.0%) | 0 (0.0%) |
| $300,000 to $499,999 | 0 (0.0%) | 8 (100.0%) |
| $500,000 to $749,999 | 8 (13.8%) | 0 (0.0%) |
| $750,000 to $999,999 | 50 (86.2%) | 0 (0.0%) |
| $1,000,000 or more | 0 (0.0%) | 0 (0.0%) |
| Total | 58 (100.0%) | 8 (100.0%) |
Household Income by Mortgage Status in Chautauqua
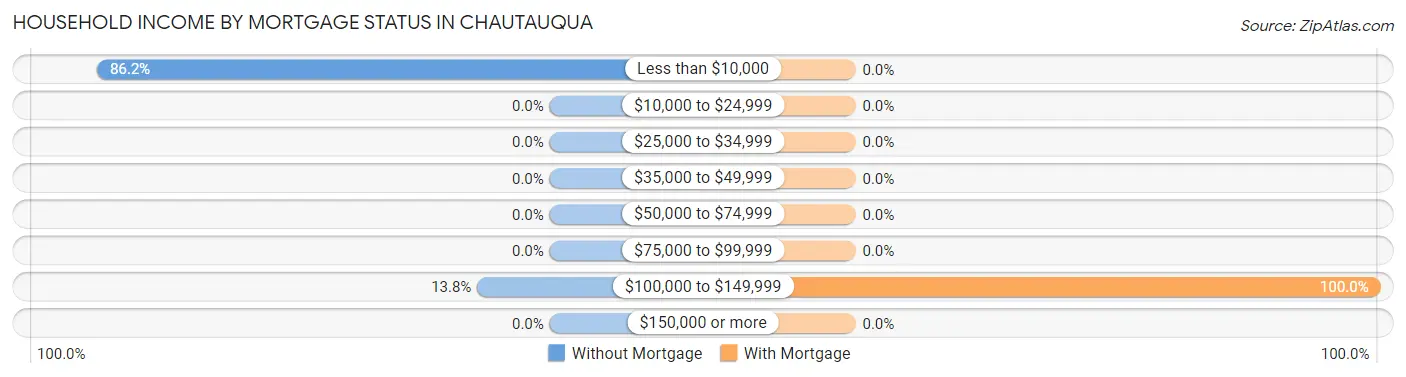
| Household Income | Without Mortgage | With Mortgage |
| Less than $10,000 | 50 (86.2%) | 0 (0.0%) |
| $10,000 to $24,999 | 0 (0.0%) | 0 (0.0%) |
| $25,000 to $34,999 | 0 (0.0%) | 0 (0.0%) |
| $35,000 to $49,999 | 0 (0.0%) | 0 (0.0%) |
| $50,000 to $74,999 | 0 (0.0%) | 0 (0.0%) |
| $75,000 to $99,999 | 0 (0.0%) | 0 (0.0%) |
| $100,000 to $149,999 | 8 (13.8%) | 8 (100.0%) |
| $150,000 or more | 0 (0.0%) | 0 (0.0%) |
| Total | 58 (100.0%) | 8 (100.0%) |
Property Value to Household Income Ratio in Chautauqua
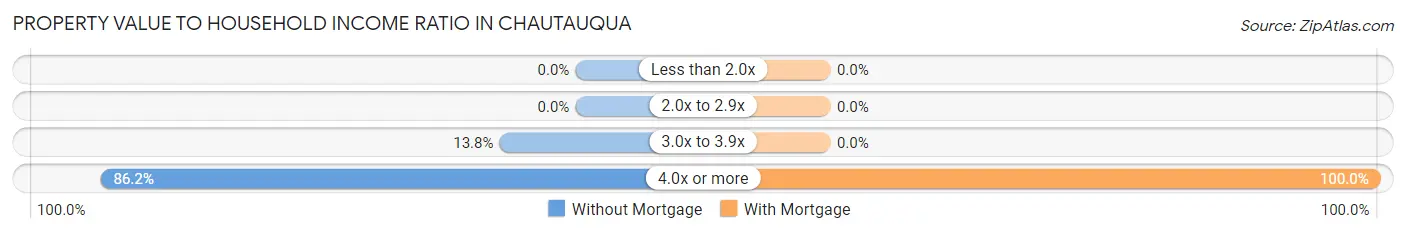
| Value-to-Income Ratio | Without Mortgage | With Mortgage |
| Less than 2.0x | 0 (0.0%) | 0 (0.0%) |
| 2.0x to 2.9x | 0 (0.0%) | 0 (0.0%) |
| 3.0x to 3.9x | 8 (13.8%) | 0 (0.0%) |
| 4.0x or more | 50 (86.2%) | 8 (100.0%) |
| Total | 58 (100.0%) | 8 (100.0%) |
Real Estate Taxes by Mortgage Status in Chautauqua
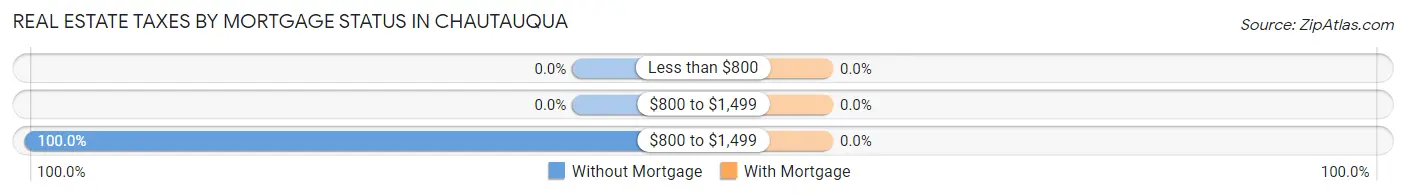
| Property Taxes | Without Mortgage | With Mortgage |
| Less than $800 | 0 (0.0%) | 0 (0.0%) |
| $800 to $1,499 | 0 (0.0%) | 0 (0.0%) |
| $800 to $1,499 | 58 (100.0%) | 0 (0.0%) |
| Total | 58 (100.0%) | 8 (100.0%) |
Health & Disability in Chautauqua
Health Insurance Coverage by Age in Chautauqua
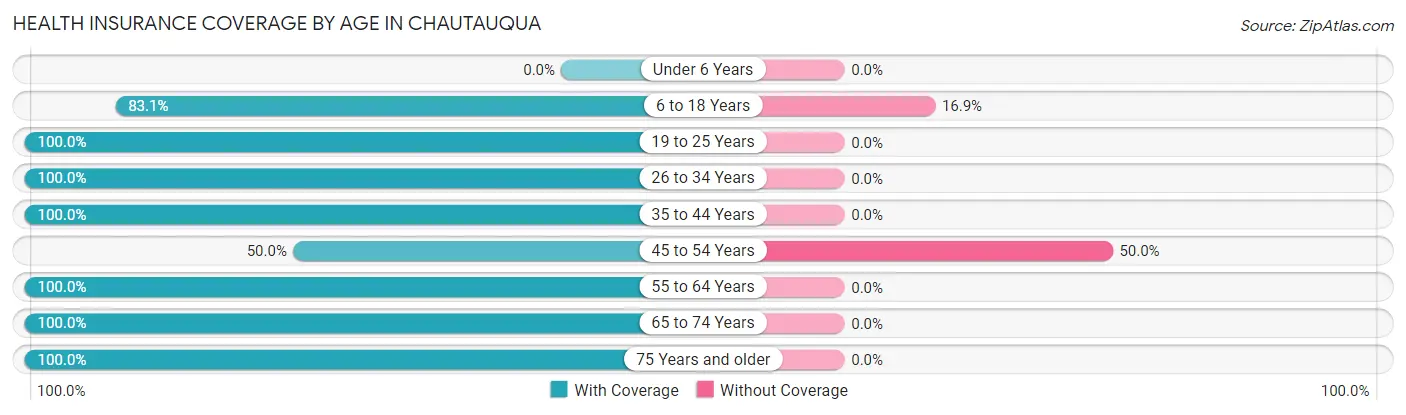
| Age Bracket | With Coverage | Without Coverage |
| Under 6 Years | 0 (0.0%) | 0 (0.0%) |
| 6 to 18 Years | 59 (83.1%) | 12 (16.9%) |
| 19 to 25 Years | 102 (100.0%) | 0 (0.0%) |
| 26 to 34 Years | 3 (100.0%) | 0 (0.0%) |
| 35 to 44 Years | 3 (100.0%) | 0 (0.0%) |
| 45 to 54 Years | 3 (50.0%) | 3 (50.0%) |
| 55 to 64 Years | 2 (100.0%) | 0 (0.0%) |
| 65 to 74 Years | 17 (100.0%) | 0 (0.0%) |
| 75 Years and older | 66 (100.0%) | 0 (0.0%) |
| Total | 255 (94.4%) | 15 (5.6%) |
Health Insurance Coverage by Citizenship Status in Chautauqua
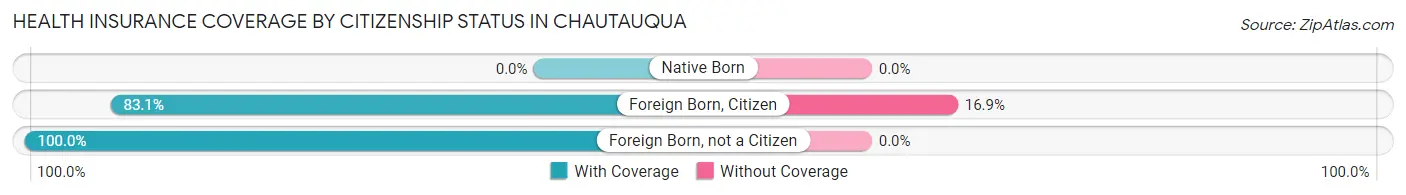
| Citizenship Status | With Coverage | Without Coverage |
| Native Born | 0 (0.0%) | 0 (0.0%) |
| Foreign Born, Citizen | 59 (83.1%) | 12 (16.9%) |
| Foreign Born, not a Citizen | 102 (100.0%) | 0 (0.0%) |
Health Insurance Coverage by Household Income in Chautauqua
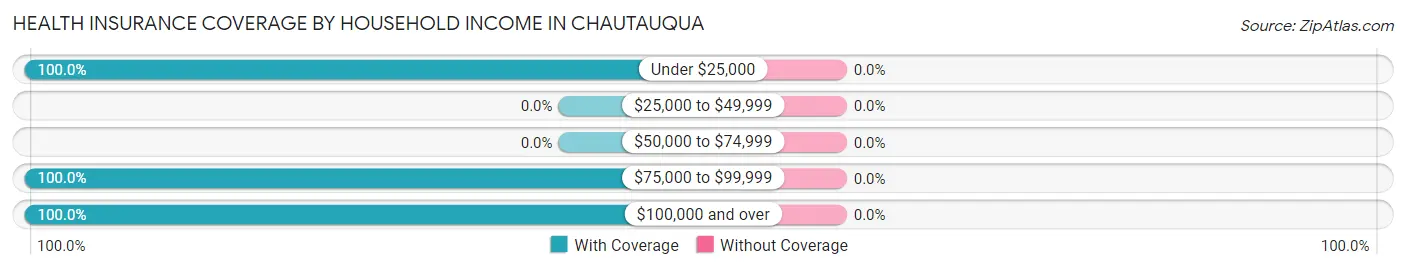
| Household Income | With Coverage | Without Coverage |
| Under $25,000 | 50 (100.0%) | 0 (0.0%) |
| $25,000 to $49,999 | 0 (0.0%) | 0 (0.0%) |
| $50,000 to $74,999 | 0 (0.0%) | 0 (0.0%) |
| $75,000 to $99,999 | 17 (100.0%) | 0 (0.0%) |
| $100,000 and over | 16 (100.0%) | 0 (0.0%) |
Public vs Private Health Insurance Coverage by Age in Chautauqua
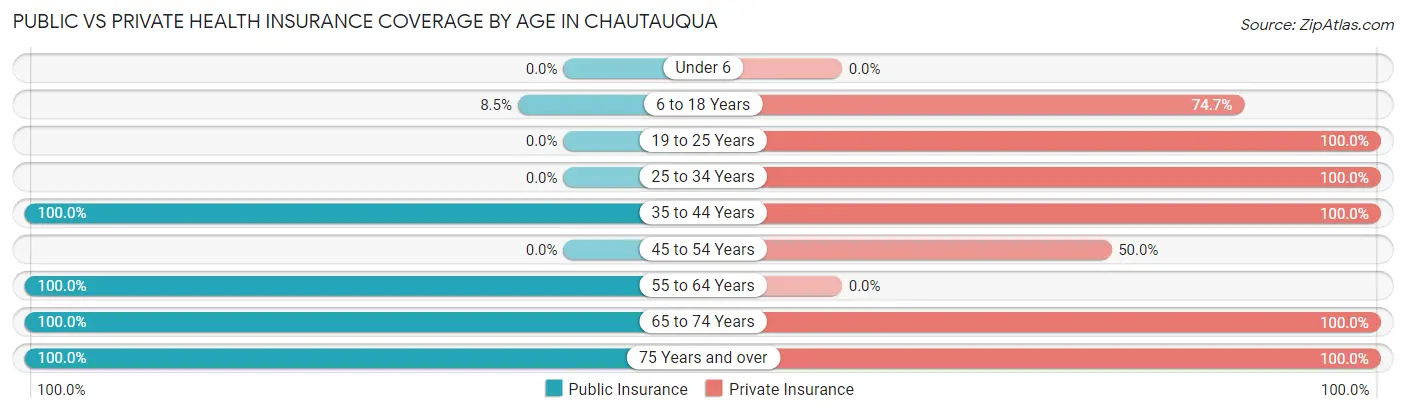
| Age Bracket | Public Insurance | Private Insurance |
| Under 6 | 0 (0.0%) | 0 (0.0%) |
| 6 to 18 Years | 6 (8.5%) | 53 (74.7%) |
| 19 to 25 Years | 0 (0.0%) | 102 (100.0%) |
| 25 to 34 Years | 0 (0.0%) | 3 (100.0%) |
| 35 to 44 Years | 3 (100.0%) | 3 (100.0%) |
| 45 to 54 Years | 0 (0.0%) | 3 (50.0%) |
| 55 to 64 Years | 2 (100.0%) | 0 (0.0%) |
| 65 to 74 Years | 17 (100.0%) | 17 (100.0%) |
| 75 Years and over | 66 (100.0%) | 66 (100.0%) |
| Total | 94 (34.8%) | 247 (91.5%) |
Disability Status by Sex by Age in Chautauqua
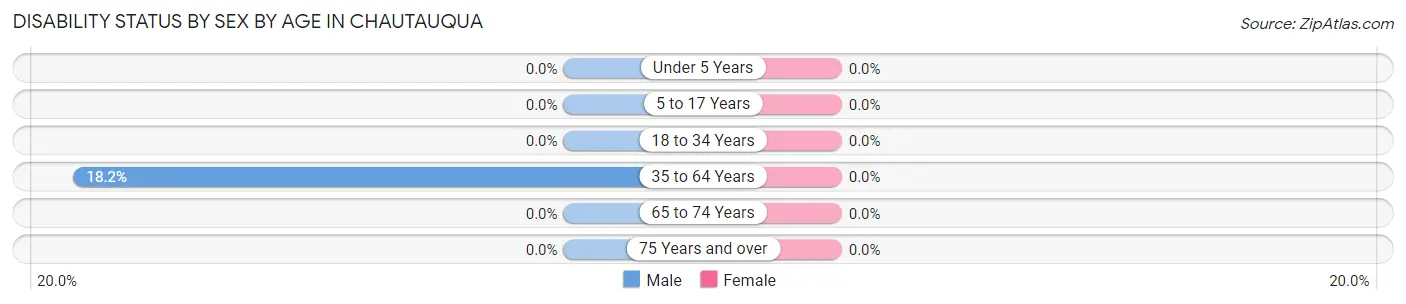
| Age Bracket | Male | Female |
| Under 5 Years | 0 (0.0%) | 0 (0.0%) |
| 5 to 17 Years | 0 (0.0%) | 0 (0.0%) |
| 18 to 34 Years | 0 (0.0%) | 0 (0.0%) |
| 35 to 64 Years | 2 (18.2%) | 0 (0.0%) |
| 65 to 74 Years | 0 (0.0%) | 0 (0.0%) |
| 75 Years and over | 0 (0.0%) | 0 (0.0%) |
Disability Class by Sex by Age in Chautauqua
Disability Class: Hearing Difficulty
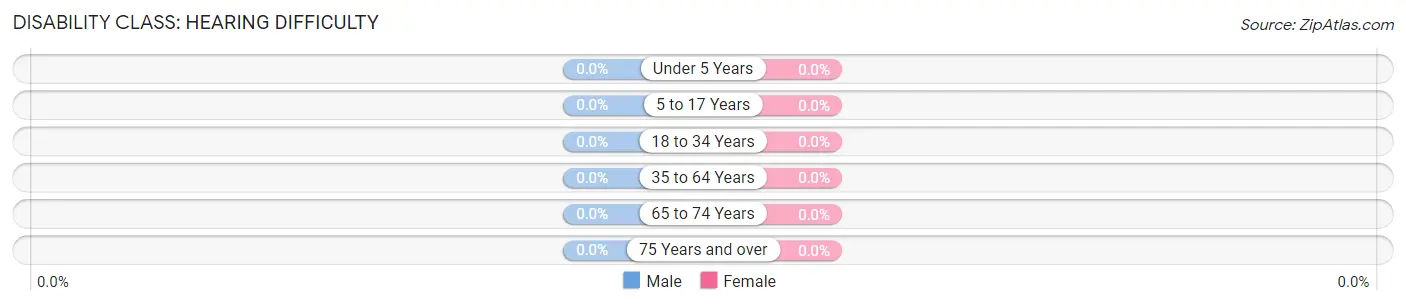
| Age Bracket | Male | Female |
| Under 5 Years | 0 (0.0%) | 0 (0.0%) |
| 5 to 17 Years | 0 (0.0%) | 0 (0.0%) |
| 18 to 34 Years | 0 (0.0%) | 0 (0.0%) |
| 35 to 64 Years | 0 (0.0%) | 0 (0.0%) |
| 65 to 74 Years | 0 (0.0%) | 0 (0.0%) |
| 75 Years and over | 0 (0.0%) | 0 (0.0%) |
Disability Class: Vision Difficulty
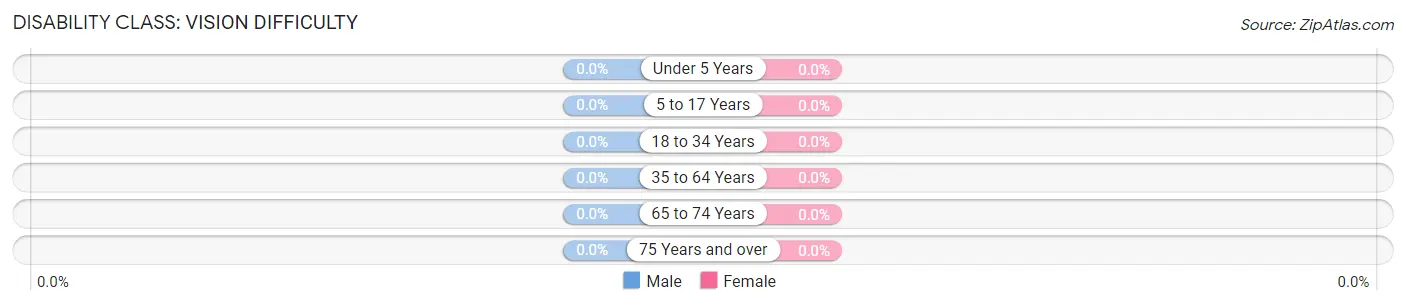
| Age Bracket | Male | Female |
| Under 5 Years | 0 (0.0%) | 0 (0.0%) |
| 5 to 17 Years | 0 (0.0%) | 0 (0.0%) |
| 18 to 34 Years | 0 (0.0%) | 0 (0.0%) |
| 35 to 64 Years | 0 (0.0%) | 0 (0.0%) |
| 65 to 74 Years | 0 (0.0%) | 0 (0.0%) |
| 75 Years and over | 0 (0.0%) | 0 (0.0%) |
Disability Class: Cognitive Difficulty
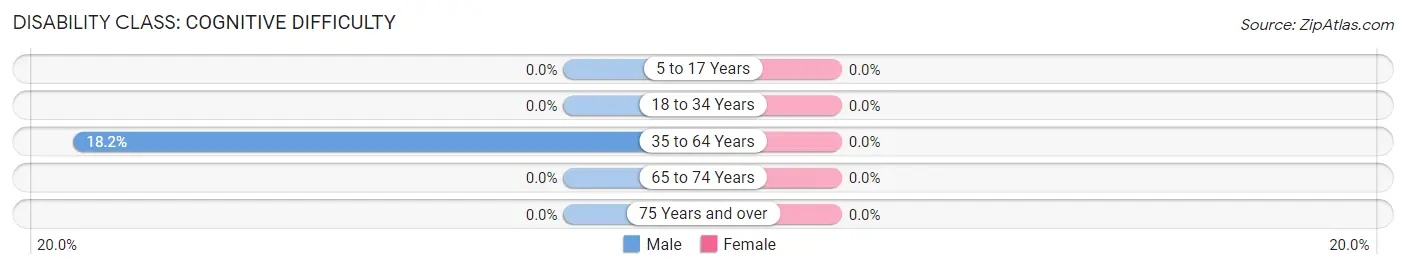
| Age Bracket | Male | Female |
| 5 to 17 Years | 0 (0.0%) | 0 (0.0%) |
| 18 to 34 Years | 0 (0.0%) | 0 (0.0%) |
| 35 to 64 Years | 2 (18.2%) | 0 (0.0%) |
| 65 to 74 Years | 0 (0.0%) | 0 (0.0%) |
| 75 Years and over | 0 (0.0%) | 0 (0.0%) |
Disability Class: Ambulatory Difficulty
| Age Bracket | Male | Female |
| 5 to 17 Years | 0 (0.0%) | 0 (0.0%) |
| 18 to 34 Years | 0 (0.0%) | 0 (0.0%) |
| 35 to 64 Years | 0 (0.0%) | 0 (0.0%) |
| 65 to 74 Years | 0 (0.0%) | 0 (0.0%) |
| 75 Years and over | 0 (0.0%) | 0 (0.0%) |
Disability Class: Self-Care Difficulty
| Age Bracket | Male | Female |
| 5 to 17 Years | 0 (0.0%) | 0 (0.0%) |
| 18 to 34 Years | 0 (0.0%) | 0 (0.0%) |
| 35 to 64 Years | 0 (0.0%) | 0 (0.0%) |
| 65 to 74 Years | 0 (0.0%) | 0 (0.0%) |
| 75 Years and over | 0 (0.0%) | 0 (0.0%) |
Technology Access in Chautauqua
Computing Device Access in Chautauqua
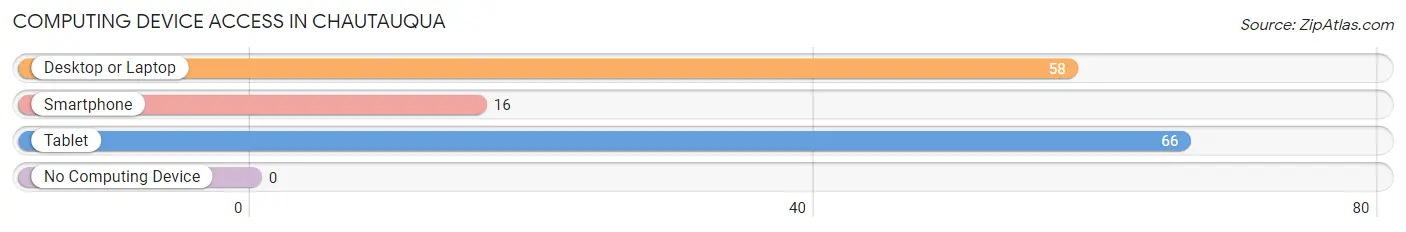
| Device Type | # Households | % Households |
| Desktop or Laptop | 58 | 87.9% |
| Smartphone | 16 | 24.2% |
| Tablet | 66 | 100.0% |
| No Computing Device | 0 | 0.0% |
| Total | 66 | 100.0% |
Internet Access in Chautauqua
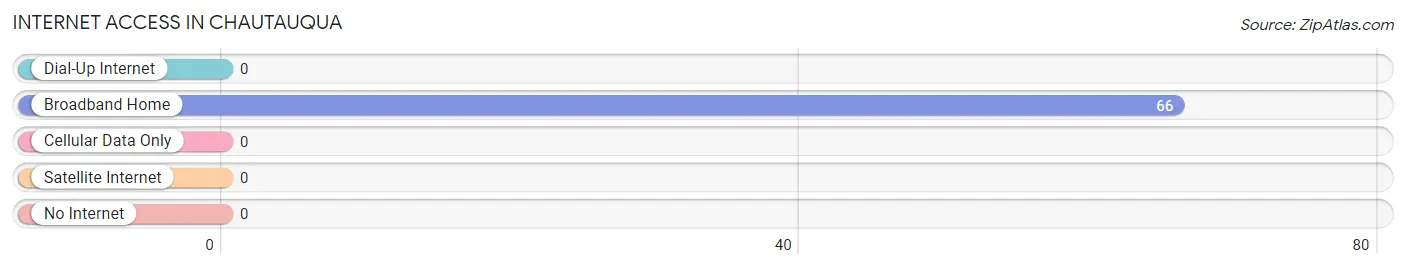
| Internet Type | # Households | % Households |
| Dial-Up Internet | 0 | 0.0% |
| Broadband Home | 66 | 100.0% |
| Cellular Data Only | 0 | 0.0% |
| Satellite Internet | 0 | 0.0% |
| No Internet | 0 | 0.0% |
| Total | 66 | 100.0% |
Chautauqua Summary
Chautauqua is a small town located in the western part of New York State, in Chautauqua County. It is situated on the shore of Lake Chautauqua, a large natural lake that is part of the Allegheny River system. The town is known for its picturesque scenery, its historic buildings, and its vibrant cultural life.
History
The area that is now Chautauqua was first settled by Native Americans, who used the lake for fishing and hunting. The first European settlers arrived in the late 1700s, and the town was officially founded in 1804. The town was named after the Chautauqua Institution, a religious and educational center that was established in 1874. The Institution was a major influence in the development of the town, and it continues to be a major cultural and educational center today.
Geography
Chautauqua is located in the western part of New York State, in Chautauqua County. It is situated on the shore of Lake Chautauqua, a large natural lake that is part of the Allegheny River system. The town is surrounded by rolling hills and forests, and is known for its picturesque scenery. The town is located about 50 miles south of Buffalo, and about 100 miles east of Cleveland.
Economy
The economy of Chautauqua is largely based on tourism and education. The town is home to the Chautauqua Institution, a major cultural and educational center that attracts thousands of visitors each year. The Institution also provides educational opportunities for local residents, and is a major employer in the area. Other major employers in the town include the Chautauqua County government, the Chautauqua County Hospital, and several local businesses.
Demographics
As of the 2010 census, the population of Chautauqua was 4,464. The racial makeup of the town was 95.3% White, 1.2% African American, 0.3% Native American, 0.7% Asian, 0.1% Pacific Islander, and 2.4% from other races. The median household income was $37,917, and the median family income was $45,938. The per capita income was $20,945. About 11.3% of the population was below the poverty line.
Conclusion
Chautauqua is a small town located in the western part of New York State, in Chautauqua County. It is situated on the shore of Lake Chautauqua, a large natural lake that is part of the Allegheny River system. The town is known for its picturesque scenery, its historic buildings, and its vibrant cultural life. The economy of Chautauqua is largely based on tourism and education, and the town is home to the Chautauqua Institution, a major cultural and educational center. As of the 2010 census, the population of Chautauqua was 4,464, and the median household income was $37,917.
Common Questions
What is Per Capita Income in Chautauqua?
Per Capita income in Chautauqua is $10,804.
What is Inequality or Gini Index in Chautauqua?
Inequality or Gini Index in Chautauqua is 0.63.
What is the Total Population of Chautauqua?
Total Population of Chautauqua is 271.
What is the Total Male Population of Chautauqua?
Total Male Population of Chautauqua is 164.
What is the Total Female Population of Chautauqua?
Total Female Population of Chautauqua is 107.
What is the Ratio of Males per 100 Females in Chautauqua?
There are 153.27 Males per 100 Females in Chautauqua.
What is the Ratio of Females per 100 Males in Chautauqua?
There are 65.24 Females per 100 Males in Chautauqua.
What is the Median Population Age in Chautauqua?
Median Population Age in Chautauqua is 20.4 Years.
What is the Average Family Size in Chautauqua
Average Family Size in Chautauqua is 2.1 People.
What is the Average Household Size in Chautauqua
Average Household Size in Chautauqua is 1.3 People.
How Large is the Labor Force in Chautauqua?
There are 64 People in the Labor Forcein in Chautauqua.
What is the Percentage of People in the Labor Force in Chautauqua?
23.6% of People are in the Labor Force in Chautauqua.
What is the Unemployment Rate in Chautauqua?
Unemployment Rate in Chautauqua is 18.8%.