Ellisburg, NY Map & Demographics
Ellisburg Map
Ellisburg Overview
$24,010
PER CAPITA INCOME
$85,833
AVG FAMILY INCOME
$62,083
AVG HOUSEHOLD INCOME
0.38
INEQUALITY / GINI INDEX
188
TOTAL POPULATION
87
MALE POPULATION
101
FEMALE POPULATION
86.14
MALES / 100 FEMALES
116.09
FEMALES / 100 MALES
34.9
MEDIAN AGE
4.1
AVG FAMILY SIZE
3.3
AVG HOUSEHOLD SIZE
52
LABOR FORCE [ PEOPLE ]
44.8%
PERCENT IN LABOR FORCE
13.5%
UNEMPLOYMENT RATE
Ellisburg Zip Codes
Ellisburg Area Codes
Income in Ellisburg
Income Overview in Ellisburg
Per Capita Income in Ellisburg is $24,010, while median incomes of families and households are $85,833 and $62,083 respectively.
| Characteristic | Number | Measure |
| Per Capita Income | 188 | $24,010 |
| Median Family Income | 38 | $85,833 |
| Mean Family Income | 38 | $88,958 |
| Median Household Income | 57 | $62,083 |
| Mean Household Income | 57 | $73,977 |
| Income Deficit | 38 | $0 |
| Wage / Income Gap (%) | 188 | 0.00% |
| Wage / Income Gap ($) | 188 | 100.00¢ per $1 |
| Gini / Inequality Index | 188 | 0.38 |
Earnings by Sex in Ellisburg
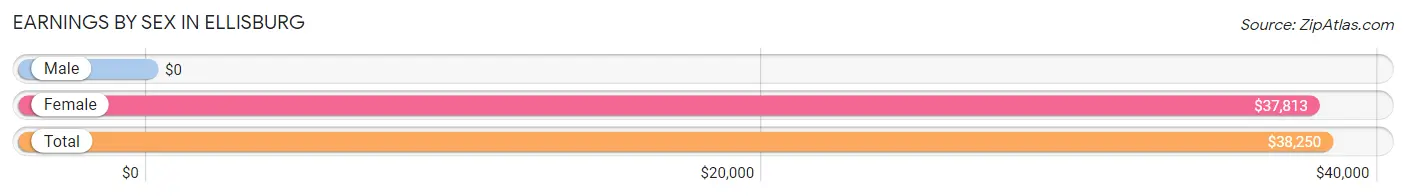
| Sex | Number | Average Earnings |
| Male | 28 (47.5%) | $0 |
| Female | 31 (52.5%) | $37,813 |
| Total | 59 (100.0%) | $38,250 |
Earnings by Sex by Income Bracket in Ellisburg
The most common earnings brackets in Ellisburg are $5,000 to $7,499 for men (6 | 21.4%) and $75,000 to $99,999 for women (8 | 25.8%).
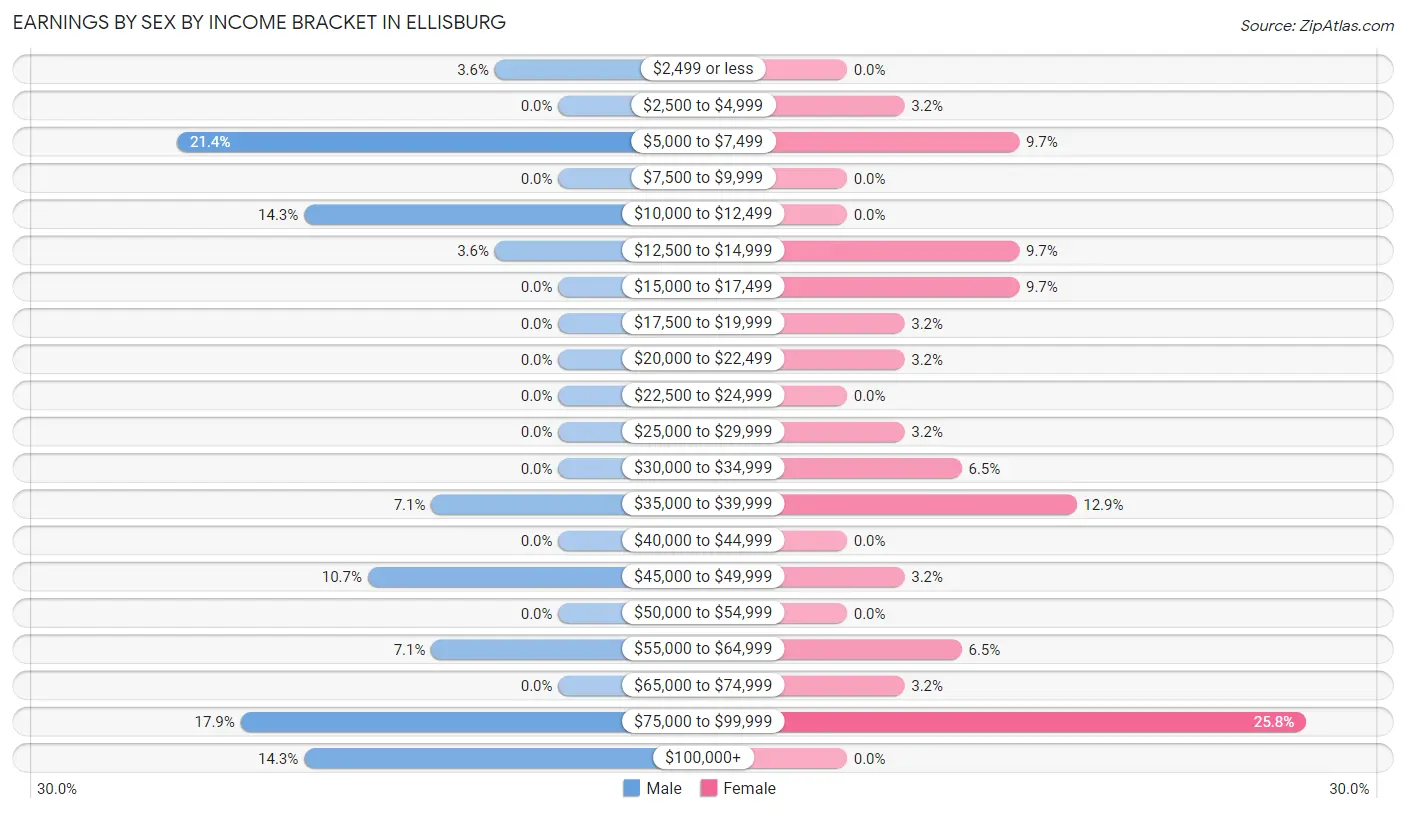
| Income | Male | Female |
| $2,499 or less | 1 (3.6%) | 0 (0.0%) |
| $2,500 to $4,999 | 0 (0.0%) | 1 (3.2%) |
| $5,000 to $7,499 | 6 (21.4%) | 3 (9.7%) |
| $7,500 to $9,999 | 0 (0.0%) | 0 (0.0%) |
| $10,000 to $12,499 | 4 (14.3%) | 0 (0.0%) |
| $12,500 to $14,999 | 1 (3.6%) | 3 (9.7%) |
| $15,000 to $17,499 | 0 (0.0%) | 3 (9.7%) |
| $17,500 to $19,999 | 0 (0.0%) | 1 (3.2%) |
| $20,000 to $22,499 | 0 (0.0%) | 1 (3.2%) |
| $22,500 to $24,999 | 0 (0.0%) | 0 (0.0%) |
| $25,000 to $29,999 | 0 (0.0%) | 1 (3.2%) |
| $30,000 to $34,999 | 0 (0.0%) | 2 (6.5%) |
| $35,000 to $39,999 | 2 (7.1%) | 4 (12.9%) |
| $40,000 to $44,999 | 0 (0.0%) | 0 (0.0%) |
| $45,000 to $49,999 | 3 (10.7%) | 1 (3.2%) |
| $50,000 to $54,999 | 0 (0.0%) | 0 (0.0%) |
| $55,000 to $64,999 | 2 (7.1%) | 2 (6.5%) |
| $65,000 to $74,999 | 0 (0.0%) | 1 (3.2%) |
| $75,000 to $99,999 | 5 (17.9%) | 8 (25.8%) |
| $100,000+ | 4 (14.3%) | 0 (0.0%) |
| Total | 28 (100.0%) | 31 (100.0%) |
Earnings by Sex by Educational Attainment in Ellisburg
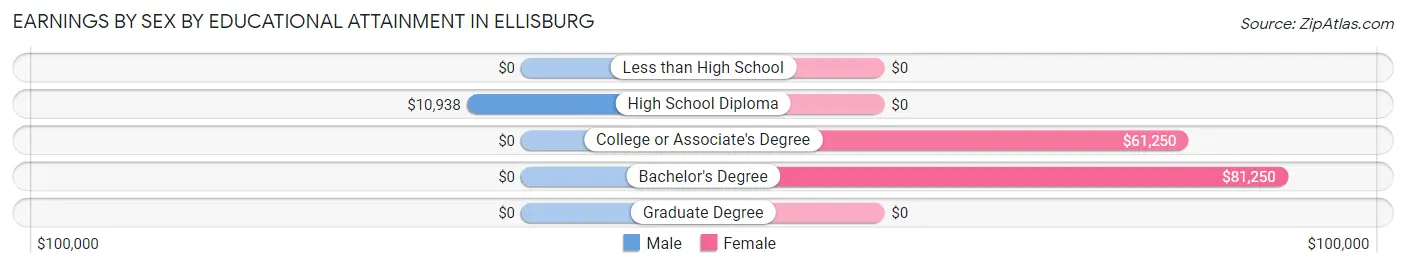
| Educational Attainment | Male Income | Female Income |
| Less than High School | - | - |
| High School Diploma | $10,938 | $0 |
| College or Associate's Degree | - | - |
| Bachelor's Degree | - | - |
| Graduate Degree | - | - |
| Total | - | - |
Family Income in Ellisburg
Family Income Brackets in Ellisburg
According to the Ellisburg family income data, there are 13 families falling into the $100,000 to $149,999 income range, which is the most common income bracket and makes up 34.2% of all families.
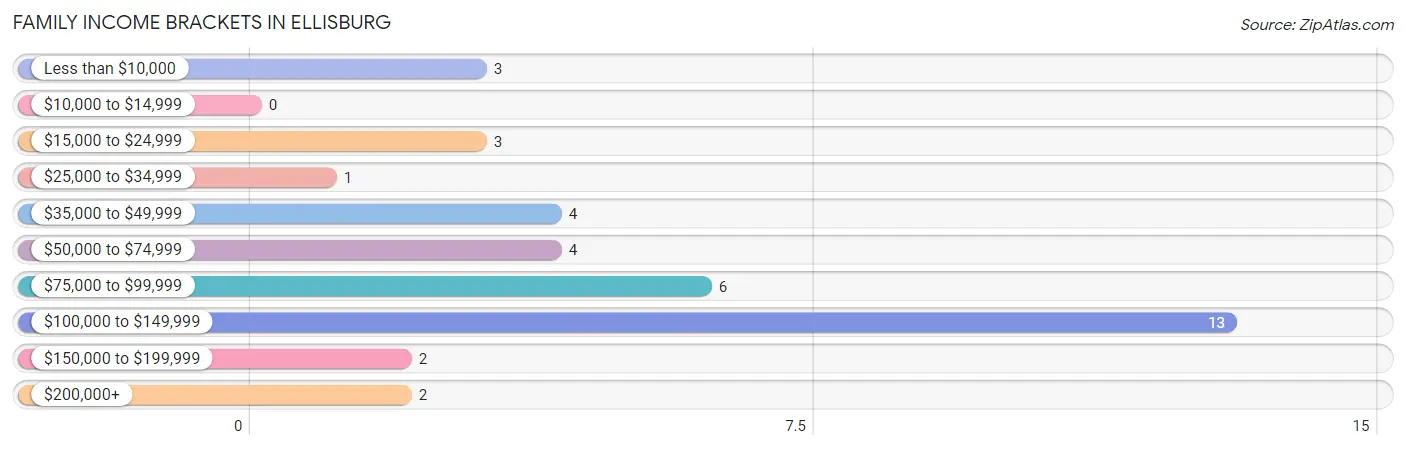
| Income Bracket | # Families | % Families |
| Less than $10,000 | 3 | 7.9% |
| $10,000 to $14,999 | 0 | 0.0% |
| $15,000 to $24,999 | 3 | 7.9% |
| $25,000 to $34,999 | 1 | 2.6% |
| $35,000 to $49,999 | 4 | 10.5% |
| $50,000 to $74,999 | 4 | 10.5% |
| $75,000 to $99,999 | 6 | 15.8% |
| $100,000 to $149,999 | 13 | 34.2% |
| $150,000 to $199,999 | 2 | 5.3% |
| $200,000+ | 2 | 5.3% |
Family Income by Famaliy Size in Ellisburg
6-person families (6 | 15.8%) account for the highest median family income in Ellisburg with $118,125 per family, while 2-person families (14 | 36.8%) have the highest median income of $40,000 per family member.
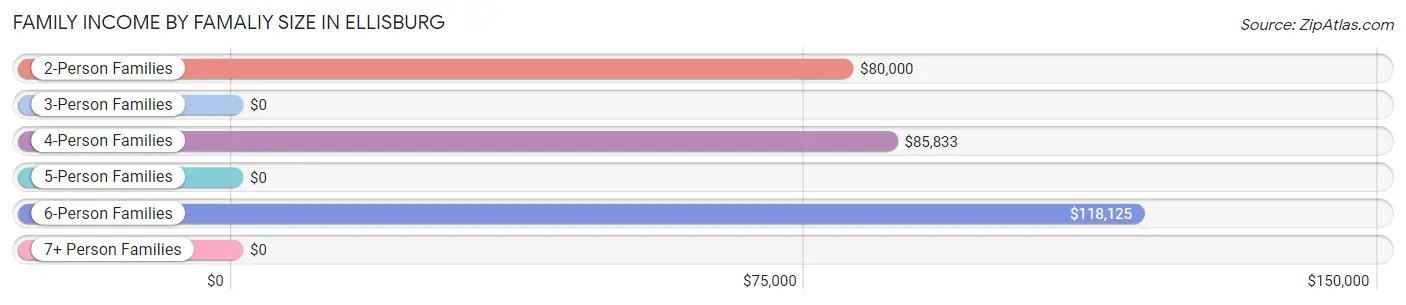
| Income Bracket | # Families | Median Income |
| 2-Person Families | 14 (36.8%) | $80,000 |
| 3-Person Families | 4 (10.5%) | $0 |
| 4-Person Families | 6 (15.8%) | $85,833 |
| 5-Person Families | 8 (21.0%) | $0 |
| 6-Person Families | 6 (15.8%) | $118,125 |
| 7+ Person Families | 0 (0.0%) | $0 |
| Total | 38 (100.0%) | $85,833 |
Family Income by Number of Earners in Ellisburg
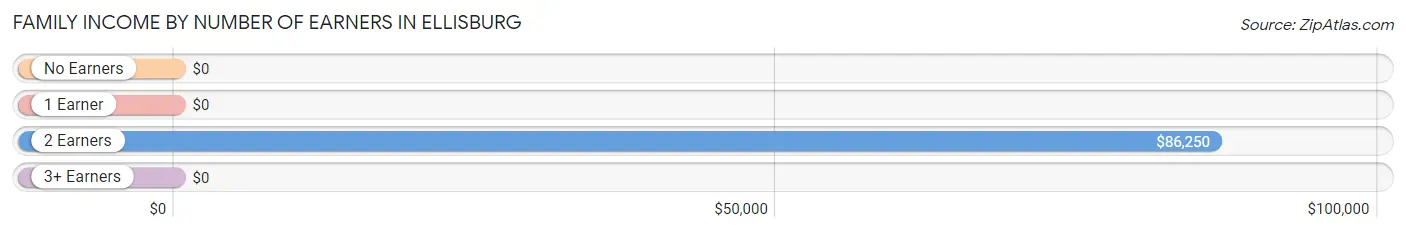
| Number of Earners | # Families | Median Income |
| No Earners | 11 (28.9%) | $0 |
| 1 Earner | 13 (34.2%) | $0 |
| 2 Earners | 13 (34.2%) | $86,250 |
| 3+ Earners | 1 (2.6%) | $0 |
| Total | 38 (100.0%) | $85,833 |
Household Income in Ellisburg
Household Income Brackets in Ellisburg
With 14 households falling in the category, the $100,000 to $149,999 income range is the most frequent in Ellisburg, accounting for 24.6% of all households.
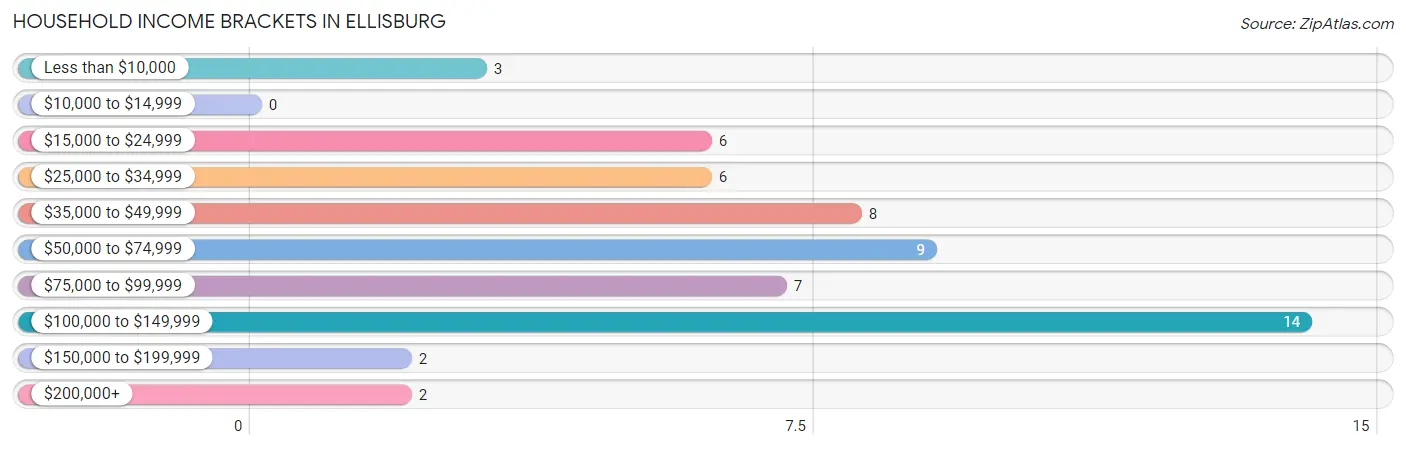
| Income Bracket | # Households | % Households |
| Less than $10,000 | 3 | 5.3% |
| $10,000 to $14,999 | 0 | 0.0% |
| $15,000 to $24,999 | 6 | 10.5% |
| $25,000 to $34,999 | 6 | 10.5% |
| $35,000 to $49,999 | 8 | 14.0% |
| $50,000 to $74,999 | 9 | 15.8% |
| $75,000 to $99,999 | 7 | 12.3% |
| $100,000 to $149,999 | 14 | 24.6% |
| $150,000 to $199,999 | 2 | 3.5% |
| $200,000+ | 2 | 3.5% |
Household Income by Householder Age in Ellisburg
The median household income in Ellisburg is $62,083, with the highest median household income of $87,083 found in the 25 to 44 years age bracket for the primary householder. A total of 13 households (22.8%) fall into this category.
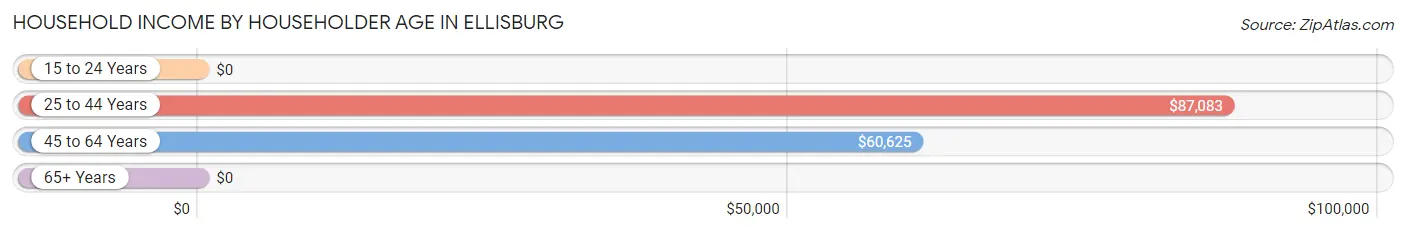
| Income Bracket | # Households | Median Income |
| 15 to 24 Years | 0 (0.0%) | $0 |
| 25 to 44 Years | 13 (22.8%) | $87,083 |
| 45 to 64 Years | 21 (36.8%) | $60,625 |
| 65+ Years | 23 (40.4%) | $0 |
| Total | 57 (100.0%) | $62,083 |
Poverty in Ellisburg
Income Below Poverty by Sex and Age in Ellisburg
With 21.8% poverty level for males and 18.8% for females among the residents of Ellisburg, 15 year old males and 15 year old females are the most vulnerable to poverty, with 6 males (75.0%) and 4 females (100.0%) in their respective age groups living below the poverty level.
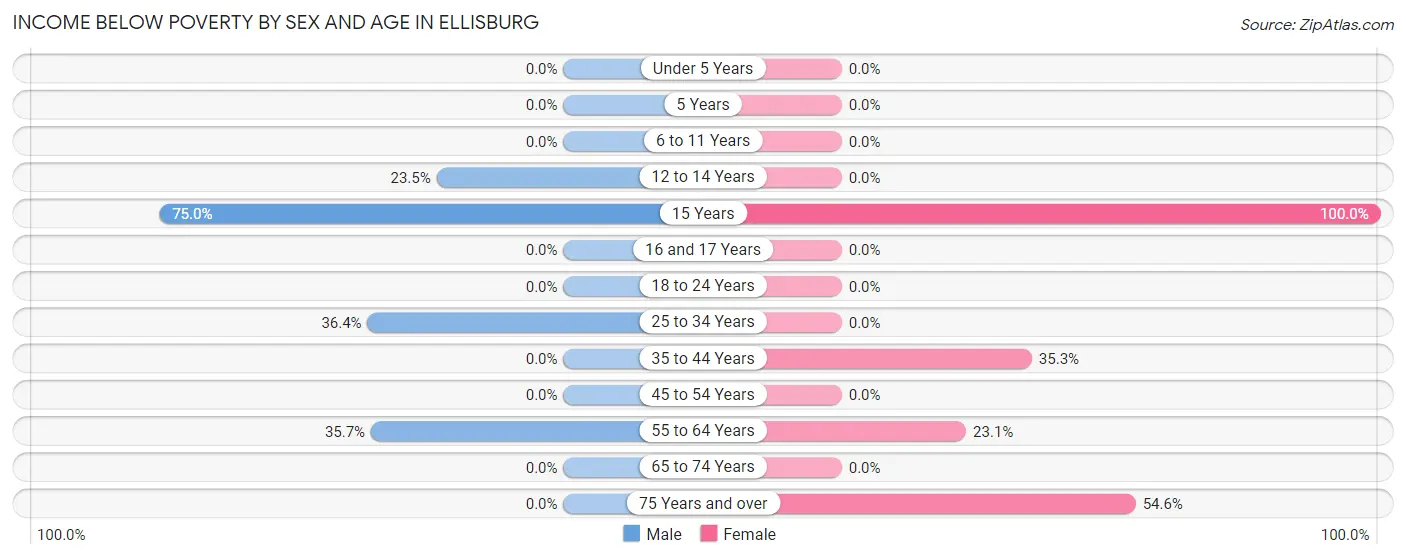
| Age Bracket | Male | Female |
| Under 5 Years | 0 (0.0%) | 0 (0.0%) |
| 5 Years | 0 (0.0%) | 0 (0.0%) |
| 6 to 11 Years | 0 (0.0%) | 0 (0.0%) |
| 12 to 14 Years | 4 (23.5%) | 0 (0.0%) |
| 15 Years | 6 (75.0%) | 4 (100.0%) |
| 16 and 17 Years | 0 (0.0%) | 0 (0.0%) |
| 18 to 24 Years | 0 (0.0%) | 0 (0.0%) |
| 25 to 34 Years | 4 (36.4%) | 0 (0.0%) |
| 35 to 44 Years | 0 (0.0%) | 6 (35.3%) |
| 45 to 54 Years | 0 (0.0%) | 0 (0.0%) |
| 55 to 64 Years | 5 (35.7%) | 3 (23.1%) |
| 65 to 74 Years | 0 (0.0%) | 0 (0.0%) |
| 75 Years and over | 0 (0.0%) | 6 (54.5%) |
| Total | 19 (21.8%) | 19 (18.8%) |
Income Above Poverty by Sex and Age in Ellisburg
According to the poverty statistics in Ellisburg, males aged under 5 years and females aged under 5 years are the age groups that are most secure financially, with 100.0% of males and 100.0% of females in these age groups living above the poverty line.
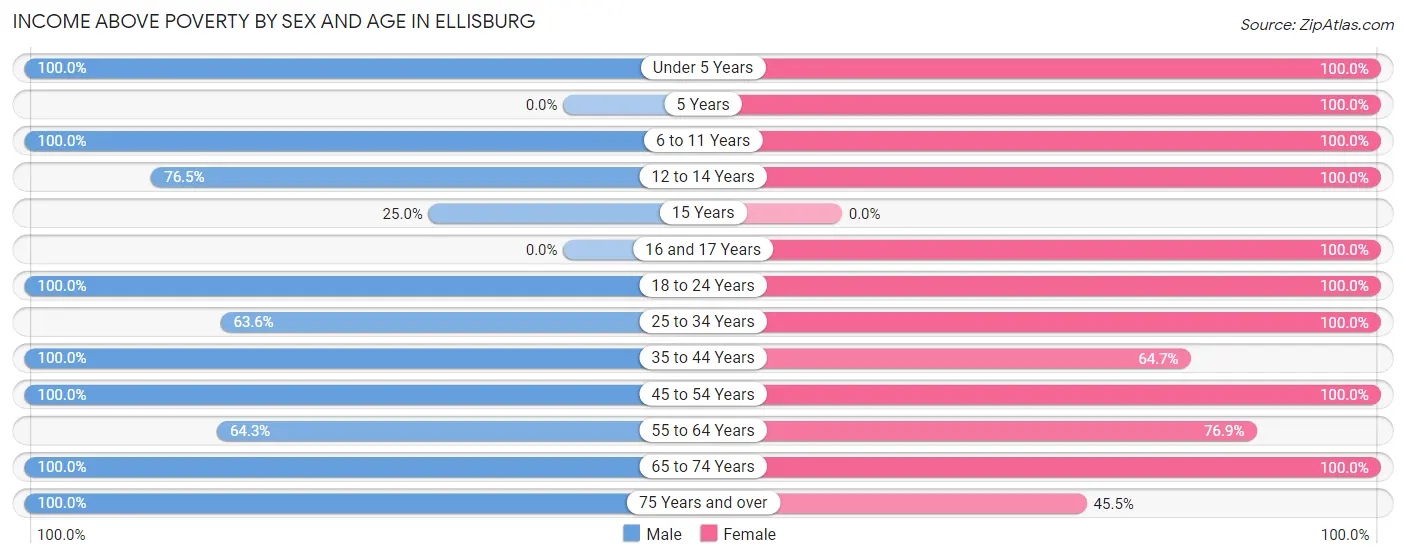
| Age Bracket | Male | Female |
| Under 5 Years | 6 (100.0%) | 11 (100.0%) |
| 5 Years | 0 (0.0%) | 1 (100.0%) |
| 6 to 11 Years | 6 (100.0%) | 14 (100.0%) |
| 12 to 14 Years | 13 (76.5%) | 5 (100.0%) |
| 15 Years | 2 (25.0%) | 0 (0.0%) |
| 16 and 17 Years | 0 (0.0%) | 4 (100.0%) |
| 18 to 24 Years | 1 (100.0%) | 2 (100.0%) |
| 25 to 34 Years | 7 (63.6%) | 5 (100.0%) |
| 35 to 44 Years | 7 (100.0%) | 11 (64.7%) |
| 45 to 54 Years | 2 (100.0%) | 4 (100.0%) |
| 55 to 64 Years | 9 (64.3%) | 10 (76.9%) |
| 65 to 74 Years | 12 (100.0%) | 10 (100.0%) |
| 75 Years and over | 3 (100.0%) | 5 (45.5%) |
| Total | 68 (78.2%) | 82 (81.2%) |
Income Below Poverty Among Married-Couple Families in Ellisburg
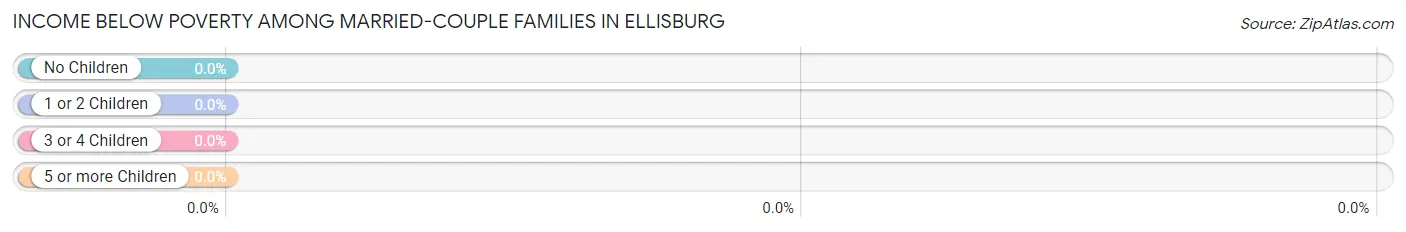
| Children | Above Poverty | Below Poverty |
| No Children | 14 (100.0%) | 0 (0.0%) |
| 1 or 2 Children | 8 (100.0%) | 0 (0.0%) |
| 3 or 4 Children | 7 (100.0%) | 0 (0.0%) |
| 5 or more Children | 0 (0.0%) | 0 (0.0%) |
| Total | 29 (100.0%) | 0 (0.0%) |
Income Below Poverty Among Single-Parent Households in Ellisburg
| Children | Single Father | Single Mother |
| No Children | 0 (0.0%) | 3 (75.0%) |
| 1 or 2 Children | 0 (0.0%) | 3 (100.0%) |
| 3 or 4 Children | 0 (0.0%) | 0 (0.0%) |
| 5 or more Children | 0 (0.0%) | 0 (0.0%) |
| Total | 0 (0.0%) | 6 (66.7%) |
Income Below Poverty Among Married-Couple vs Single-Parent Households in Ellisburg
| Children | Married-Couple Families | Single-Parent Households |
| No Children | 0 (0.0%) | 3 (75.0%) |
| 1 or 2 Children | 0 (0.0%) | 3 (100.0%) |
| 3 or 4 Children | 0 (0.0%) | 0 (0.0%) |
| 5 or more Children | 0 (0.0%) | 0 (0.0%) |
| Total | 0 (0.0%) | 6 (66.7%) |
Race in Ellisburg
The most populous races in Ellisburg are White / Caucasian (176 | 93.6%), Two or more Races (8 | 4.3%), and Asian (3 | 1.6%).
| Race | # Population | % Population |
| Asian | 3 | 1.6% |
| Black / African American | 1 | 0.5% |
| Hawaiian / Pacific | 0 | 0.0% |
| Hispanic or Latino | 0 | 0.0% |
| Native / Alaskan | 0 | 0.0% |
| White / Caucasian | 176 | 93.6% |
| Two or more Races | 8 | 4.3% |
| Some other Race | 0 | 0.0% |
| Total | 188 | 100.0% |
Ancestry in Ellisburg
The most populous ancestries reported in Ellisburg are French (27 | 14.4%), German (24 | 12.8%), Dutch (23 | 12.2%), French Canadian (22 | 11.7%), and Italian (21 | 11.2%), together accounting for 62.2% of all Ellisburg residents.
| Ancestry | # Population | % Population |
| American | 6 | 3.2% |
| Cherokee | 2 | 1.1% |
| Dutch | 23 | 12.2% |
| English | 17 | 9.0% |
| Ethiopian | 1 | 0.5% |
| European | 2 | 1.1% |
| French | 27 | 14.4% |
| French Canadian | 22 | 11.7% |
| German | 24 | 12.8% |
| Indian (Asian) | 3 | 1.6% |
| Irish | 17 | 9.0% |
| Italian | 21 | 11.2% |
| Norwegian | 4 | 2.1% |
| Polish | 3 | 1.6% |
| Scotch-Irish | 5 | 2.7% |
| Scottish | 2 | 1.1% |
| Subsaharan African | 1 | 0.5% |
| Ukrainian | 5 | 2.7% | View All 18 Rows |
Immigrants in Ellisburg
The most numerous immigrant groups reported in Ellisburg came from Asia (3 | 1.6%), China (3 | 1.6%), Eastern Asia (3 | 1.6%), Africa (1 | 0.5%), and Eastern Africa (1 | 0.5%), together accounting for 5.9% of all Ellisburg residents.
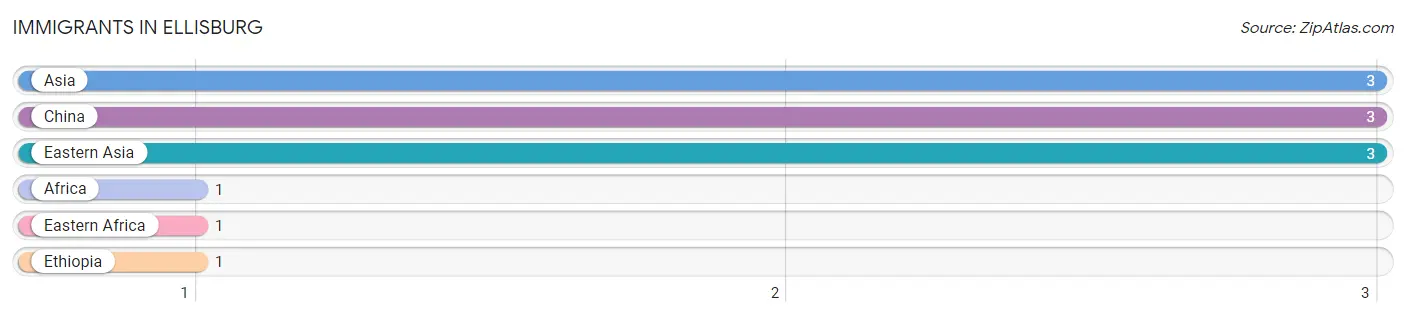
| Immigration Origin | # Population | % Population |
| Africa | 1 | 0.5% |
| Asia | 3 | 1.6% |
| China | 3 | 1.6% |
| Eastern Africa | 1 | 0.5% |
| Eastern Asia | 3 | 1.6% |
| Ethiopia | 1 | 0.5% | View All 6 Rows |
Sex and Age in Ellisburg
Sex and Age in Ellisburg
The most populous age groups in Ellisburg are 10 to 14 Years (19 | 21.8%) for men and 5 to 9 Years (14 | 13.9%) for women.
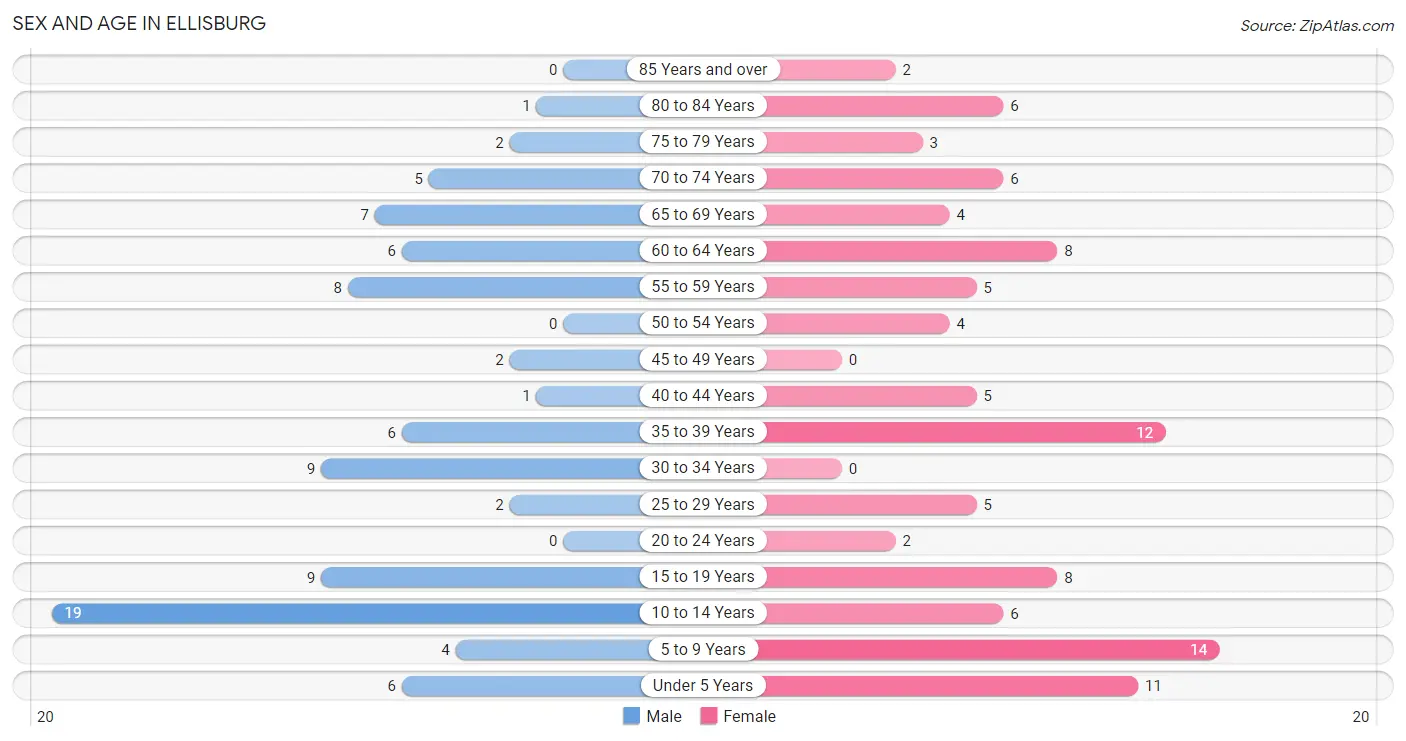
| Age Bracket | Male | Female |
| Under 5 Years | 6 (6.9%) | 11 (10.9%) |
| 5 to 9 Years | 4 (4.6%) | 14 (13.9%) |
| 10 to 14 Years | 19 (21.8%) | 6 (5.9%) |
| 15 to 19 Years | 9 (10.3%) | 8 (7.9%) |
| 20 to 24 Years | 0 (0.0%) | 2 (2.0%) |
| 25 to 29 Years | 2 (2.3%) | 5 (5.0%) |
| 30 to 34 Years | 9 (10.3%) | 0 (0.0%) |
| 35 to 39 Years | 6 (6.9%) | 12 (11.9%) |
| 40 to 44 Years | 1 (1.1%) | 5 (5.0%) |
| 45 to 49 Years | 2 (2.3%) | 0 (0.0%) |
| 50 to 54 Years | 0 (0.0%) | 4 (4.0%) |
| 55 to 59 Years | 8 (9.2%) | 5 (5.0%) |
| 60 to 64 Years | 6 (6.9%) | 8 (7.9%) |
| 65 to 69 Years | 7 (8.1%) | 4 (4.0%) |
| 70 to 74 Years | 5 (5.8%) | 6 (5.9%) |
| 75 to 79 Years | 2 (2.3%) | 3 (3.0%) |
| 80 to 84 Years | 1 (1.1%) | 6 (5.9%) |
| 85 Years and over | 0 (0.0%) | 2 (2.0%) |
| Total | 87 (100.0%) | 101 (100.0%) |
Families and Households in Ellisburg
Median Family Size in Ellisburg
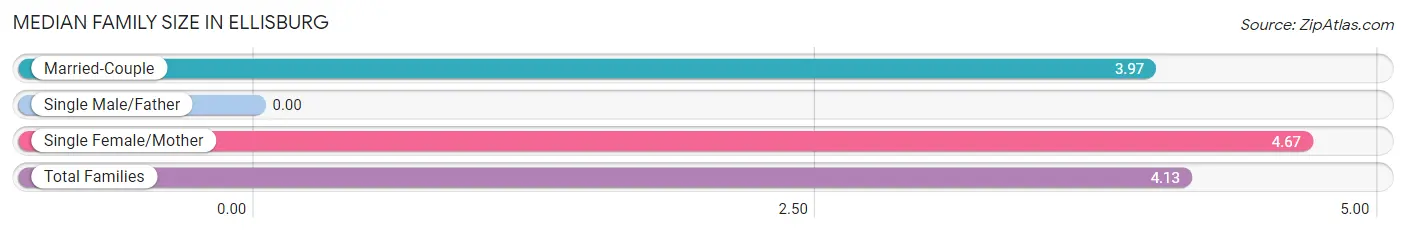
| Family Type | # Families | Family Size |
| Married-Couple | 29 (76.3%) | 3.97 |
| Single Male/Father | 0 (0.0%) | - |
| Single Female/Mother | 9 (23.7%) | 4.67 |
| Total Families | 38 (100.0%) | 4.13 |
Median Household Size in Ellisburg
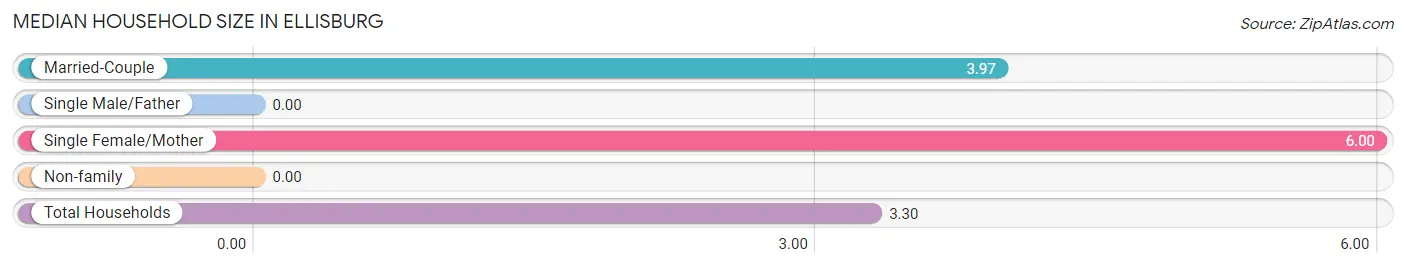
| Household Type | # Households | Household Size |
| Married-Couple | 29 (50.9%) | 3.97 |
| Single Male/Father | 0 (0.0%) | - |
| Single Female/Mother | 9 (15.8%) | 6.00 |
| Non-family | 19 (33.3%) | - |
| Total Households | 57 (100.0%) | 3.30 |
Household Size by Marriage Status in Ellisburg
Out of a total of 57 households in Ellisburg, 38 (66.7%) are family households, while 19 (33.3%) are nonfamily households. The most numerous type of family households are 2-person households, comprising 14, and the most common type of nonfamily households are 1-person households, comprising 19.
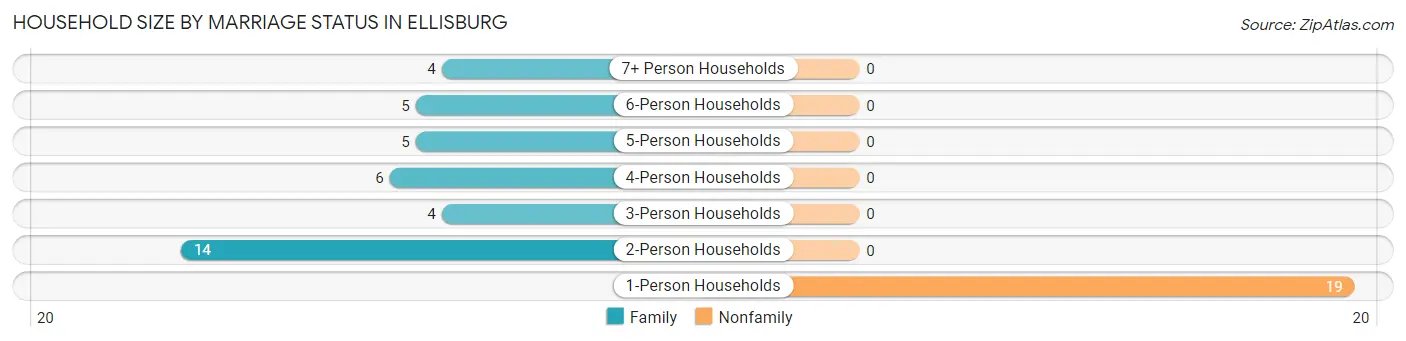
| Household Size | Family Households | Nonfamily Households |
| 1-Person Households | - | 19 (33.3%) |
| 2-Person Households | 14 (24.6%) | 0 (0.0%) |
| 3-Person Households | 4 (7.0%) | 0 (0.0%) |
| 4-Person Households | 6 (10.5%) | 0 (0.0%) |
| 5-Person Households | 5 (8.8%) | 0 (0.0%) |
| 6-Person Households | 5 (8.8%) | 0 (0.0%) |
| 7+ Person Households | 4 (7.0%) | 0 (0.0%) |
| Total | 38 (66.7%) | 19 (33.3%) |
Female Fertility in Ellisburg
Fertility by Age in Ellisburg
Average fertility rate in Ellisburg is 63.0 births per 1,000 women. Women in the age bracket of 20 to 34 years have the highest fertility rate with 143.0 births per 1,000 women. Women in the age bracket of 20 to 34 years acount for 50.0% of all women with births.
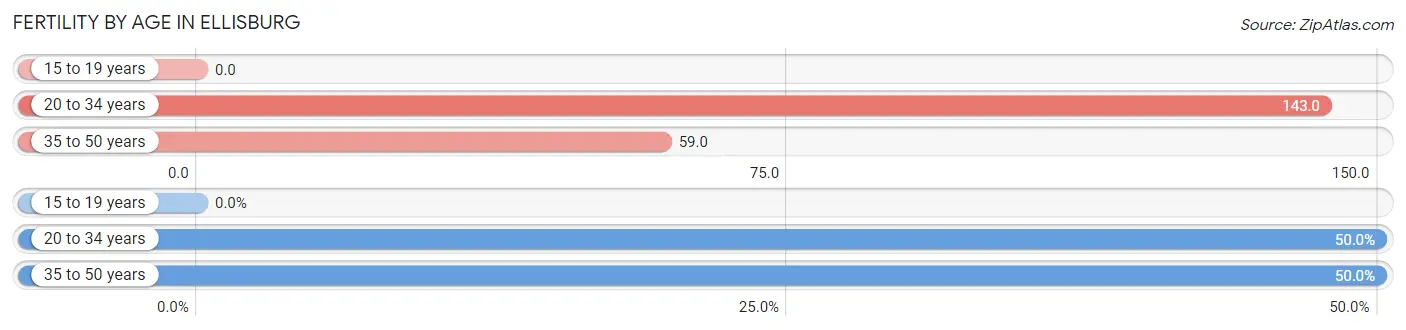
| Age Bracket | Women with Births | Births / 1,000 Women |
| 15 to 19 years | 0 (0.0%) | 0.0 |
| 20 to 34 years | 1 (50.0%) | 143.0 |
| 35 to 50 years | 1 (50.0%) | 59.0 |
| Total | 2 (100.0%) | 63.0 |
Fertility by Age by Marriage Status in Ellisburg
50.0% of women with births (2) in Ellisburg are married. The highest percentage of unmarried women with births falls into 35 to 50 years age bracket with 100.0% of them unmarried at the time of birth, while the lowest percentage of unmarried women with births belong to 20 to 34 years age bracket with 0.0% of them unmarried.
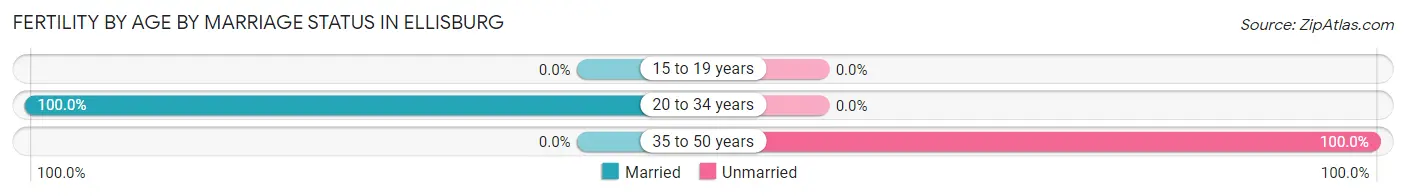
| Age Bracket | Married | Unmarried |
| 15 to 19 years | 0 (0.0%) | 0 (0.0%) |
| 20 to 34 years | 1 (100.0%) | 0 (0.0%) |
| 35 to 50 years | 0 (0.0%) | 1 (100.0%) |
| Total | 1 (50.0%) | 1 (50.0%) |
Fertility by Education in Ellisburg
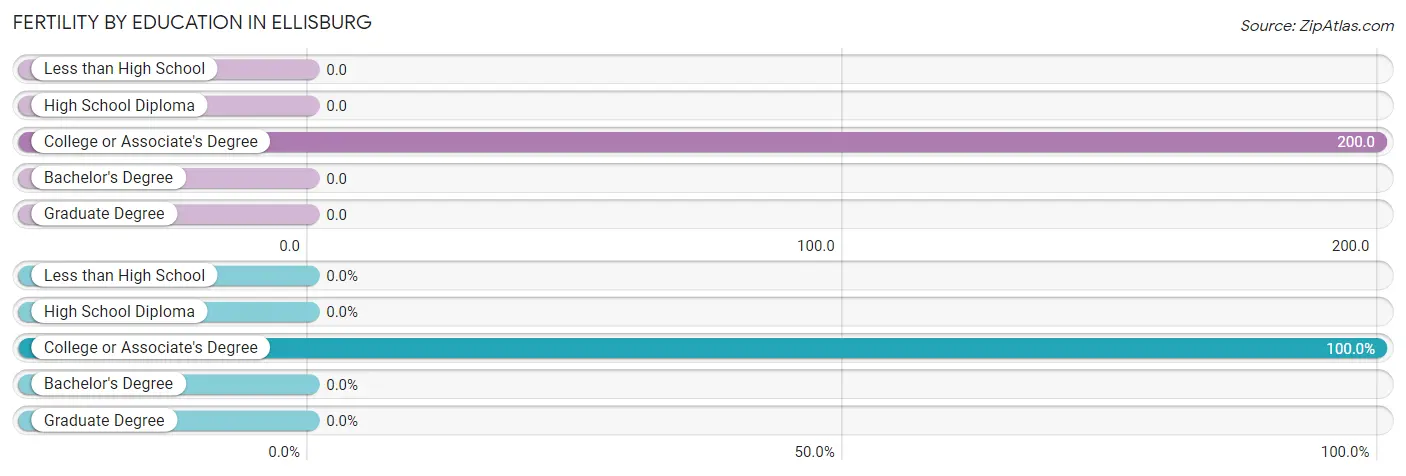
| Educational Attainment | Women with Births | Births / 1,000 Women |
| Less than High School | 0 (0.0%) | 0.0 |
| High School Diploma | 0 (0.0%) | 0.0 |
| College or Associate's Degree | 2 (100.0%) | 200.0 |
| Bachelor's Degree | 0 (0.0%) | 0.0 |
| Graduate Degree | 0 (0.0%) | 0.0 |
| Total | 2 (100.0%) | 63.0 |
Fertility by Education by Marriage Status in Ellisburg
50.0% of women with births in Ellisburg are unmarried. Women with the educational attainment of college or associate's degree are most likely to be married with 50.0% of them married at childbirth, while women with the educational attainment of college or associate's degree are least likely to be married with 50.0% of them unmarried at childbirth.
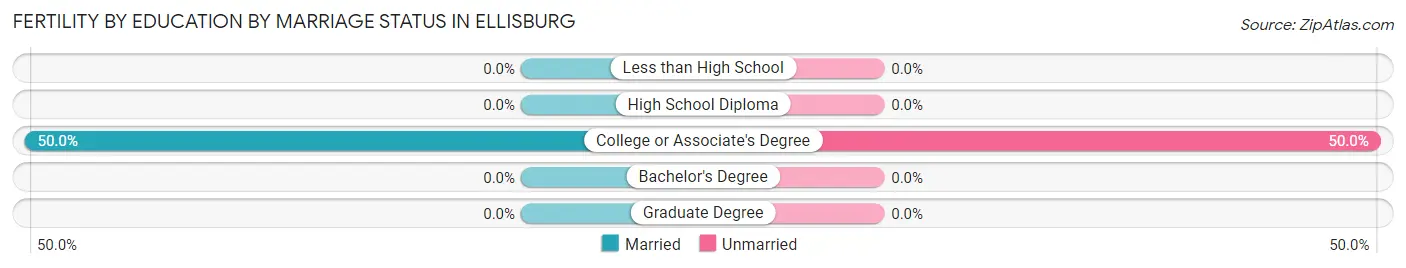
| Educational Attainment | Married | Unmarried |
| Less than High School | 0 (0.0%) | 0 (0.0%) |
| High School Diploma | 0 (0.0%) | 0 (0.0%) |
| College or Associate's Degree | 1 (50.0%) | 1 (50.0%) |
| Bachelor's Degree | 0 (0.0%) | 0 (0.0%) |
| Graduate Degree | 0 (0.0%) | 0 (0.0%) |
| Total | 1 (50.0%) | 1 (50.0%) |
Employment Characteristics in Ellisburg
Employment by Class of Employer in Ellisburg
Among the 45 employed individuals in Ellisburg, private company employees (23 | 51.1%), state government employees (7 | 15.6%), and not-for-profit organizations (5 | 11.1%) make up the most common classes of employment.
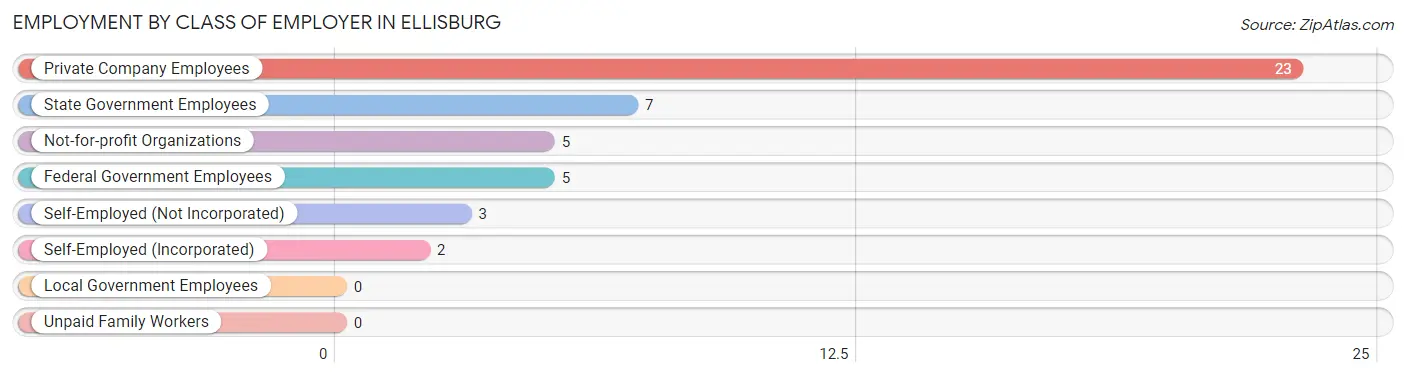
| Employer Class | # Employees | % Employees |
| Private Company Employees | 23 | 51.1% |
| Self-Employed (Incorporated) | 2 | 4.4% |
| Self-Employed (Not Incorporated) | 3 | 6.7% |
| Not-for-profit Organizations | 5 | 11.1% |
| Local Government Employees | 0 | 0.0% |
| State Government Employees | 7 | 15.6% |
| Federal Government Employees | 5 | 11.1% |
| Unpaid Family Workers | 0 | 0.0% |
| Total | 45 | 100.0% |
Employment Status by Age in Ellisburg
According to the labor force statistics for Ellisburg, out of the total population over 16 years of age (116), 44.8% or 52 individuals are in the labor force, with 13.5% or 7 of them unemployed. The age group with the highest labor force participation rate is 30 to 34 years, with 100.0% or 9 individuals in the labor force. Within the labor force, the 16 to 19 years age range has the highest percentage of unemployed individuals, with 50.0% or 1 of them being unemployed.
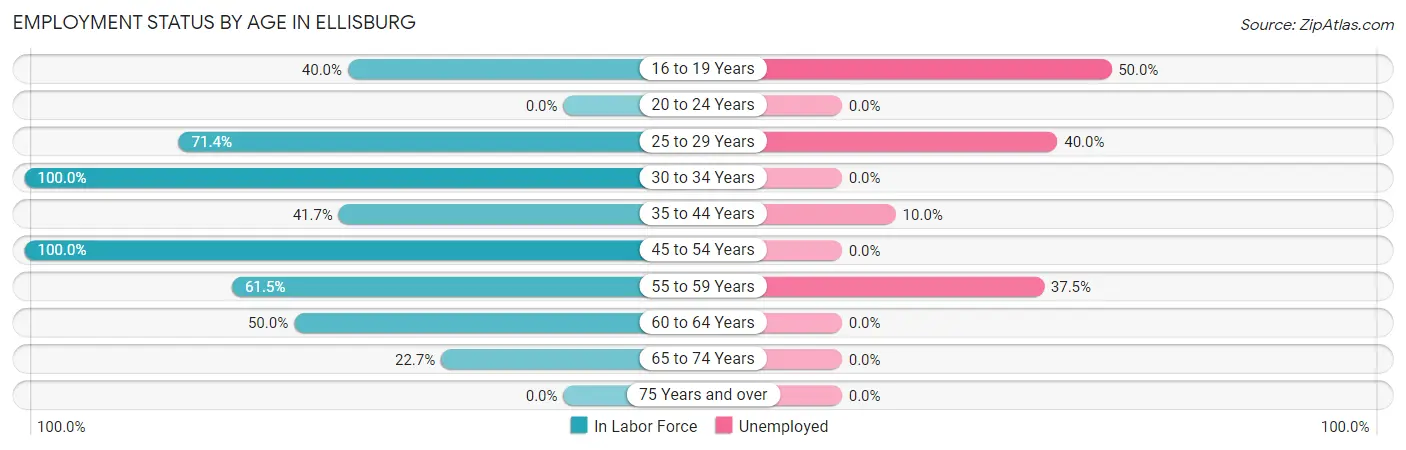
| Age Bracket | In Labor Force | Unemployed |
| 16 to 19 Years | 2 (40.0%) | 1 (50.0%) |
| 20 to 24 Years | 0 (0.0%) | 0 (0.0%) |
| 25 to 29 Years | 5 (71.4%) | 2 (40.0%) |
| 30 to 34 Years | 9 (100.0%) | 0 (0.0%) |
| 35 to 44 Years | 10 (41.7%) | 1 (10.0%) |
| 45 to 54 Years | 6 (100.0%) | 0 (0.0%) |
| 55 to 59 Years | 8 (61.5%) | 3 (37.5%) |
| 60 to 64 Years | 7 (50.0%) | 0 (0.0%) |
| 65 to 74 Years | 5 (22.7%) | 0 (0.0%) |
| 75 Years and over | 0 (0.0%) | 0 (0.0%) |
| Total | 52 (44.8%) | 7 (13.5%) |
Employment Status by Educational Attainment in Ellisburg
According to labor force statistics for Ellisburg, 61.6% of individuals (45) out of the total population between 25 and 64 years of age (73) are in the labor force, with 13.3% or 6 of them being unemployed. The group with the highest labor force participation rate are those with the educational attainment of less than high school, with 100.0% or 7 individuals in the labor force. Within the labor force, individuals with less than high school education have the highest percentage of unemployment, with 42.9% or 3 of them being unemployed.
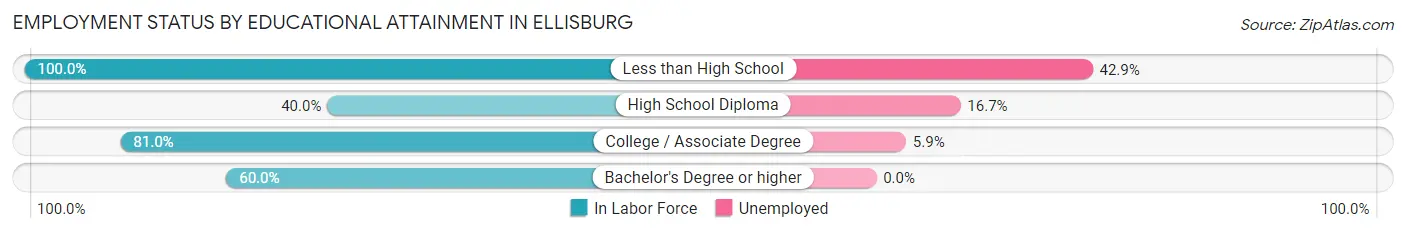
| Educational Attainment | In Labor Force | Unemployed |
| Less than High School | 7 (100.0%) | 3 (42.9%) |
| High School Diploma | 12 (40.0%) | 5 (16.7%) |
| College / Associate Degree | 17 (81.0%) | 1 (5.9%) |
| Bachelor's Degree or higher | 9 (60.0%) | 0 (0.0%) |
| Total | 45 (61.6%) | 10 (13.3%) |
Employment Occupations by Sex in Ellisburg
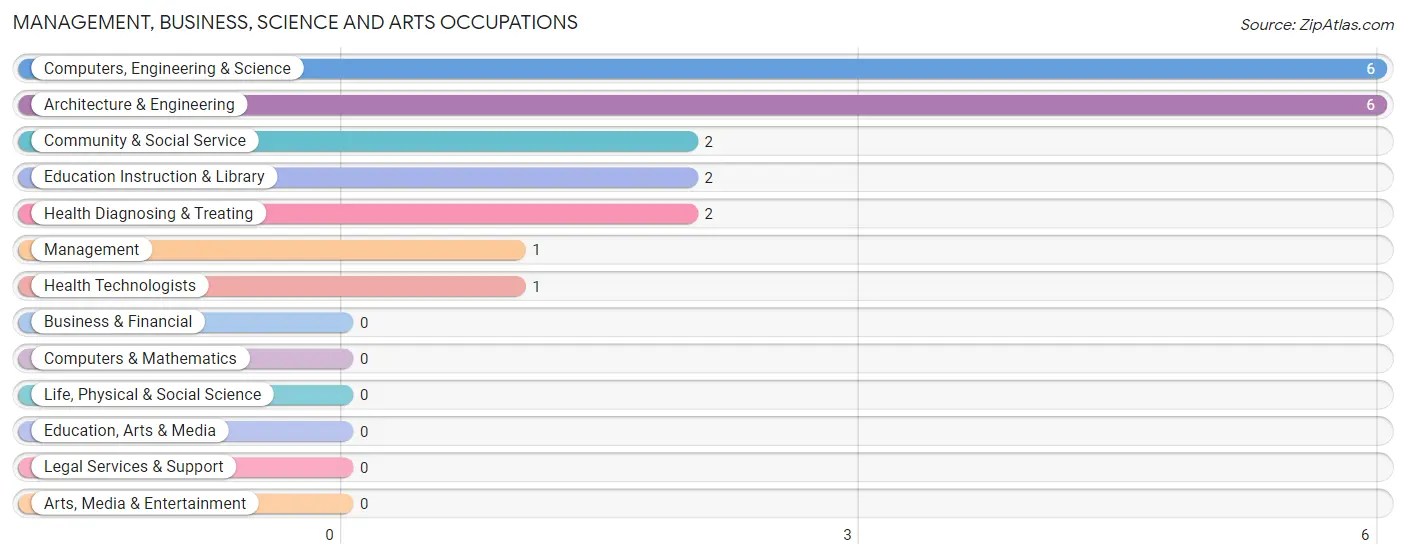
Management, Business, Science and Arts Occupations
The most common Management, Business, Science and Arts occupations in Ellisburg are Computers, Engineering & Science (6 | 13.3%), Architecture & Engineering (6 | 13.3%), Community & Social Service (2 | 4.4%), Education Instruction & Library (2 | 4.4%), and Health Diagnosing & Treating (2 | 4.4%).
Management, Business, Science and Arts Occupations by Sex
Within the Management, Business, Science and Arts occupations in Ellisburg, the most male-oriented occupations are Computers, Engineering & Science (83.3%), and Architecture & Engineering (83.3%), while the most female-oriented occupations are Management (100.0%), Community & Social Service (100.0%), and Education Instruction & Library (100.0%).
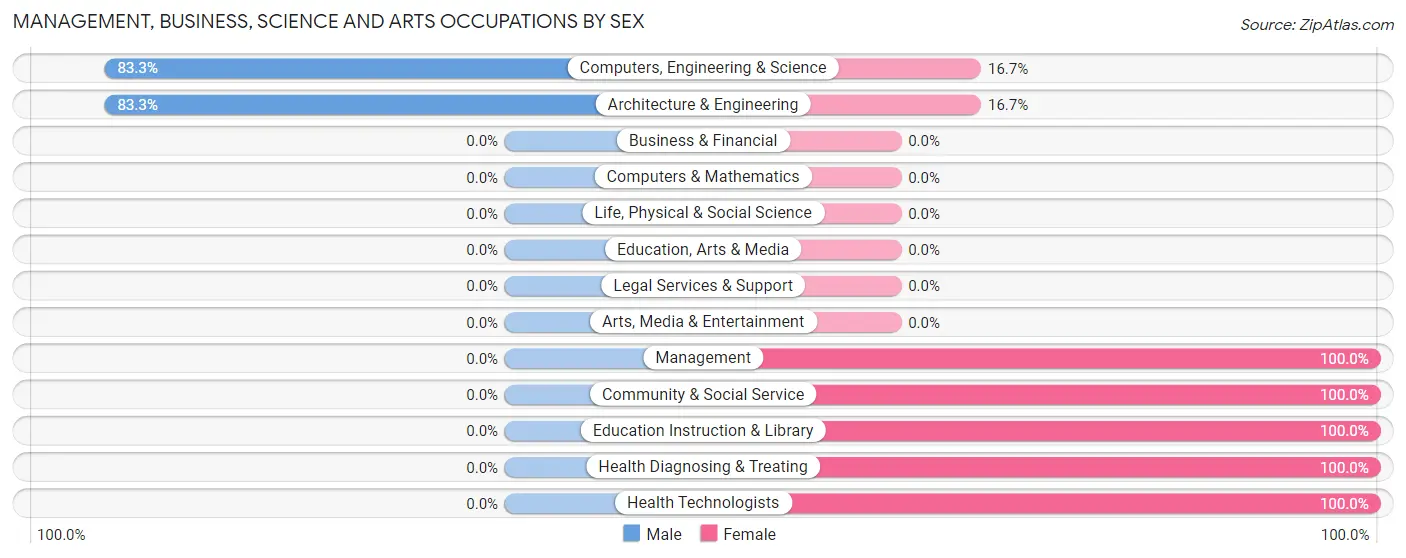
| Occupation | Male | Female |
| Management | 0 (0.0%) | 1 (100.0%) |
| Business & Financial | 0 (0.0%) | 0 (0.0%) |
| Computers, Engineering & Science | 5 (83.3%) | 1 (16.7%) |
| Computers & Mathematics | 0 (0.0%) | 0 (0.0%) |
| Architecture & Engineering | 5 (83.3%) | 1 (16.7%) |
| Life, Physical & Social Science | 0 (0.0%) | 0 (0.0%) |
| Community & Social Service | 0 (0.0%) | 2 (100.0%) |
| Education, Arts & Media | 0 (0.0%) | 0 (0.0%) |
| Legal Services & Support | 0 (0.0%) | 0 (0.0%) |
| Education Instruction & Library | 0 (0.0%) | 2 (100.0%) |
| Arts, Media & Entertainment | 0 (0.0%) | 0 (0.0%) |
| Health Diagnosing & Treating | 0 (0.0%) | 2 (100.0%) |
| Health Technologists | 0 (0.0%) | 1 (100.0%) |
| Total (Category) | 5 (45.5%) | 6 (54.5%) |
| Total (Overall) | 20 (44.4%) | 25 (55.6%) |
Services Occupations
The most common Services occupations in Ellisburg are Security & Protection (5 | 11.1%), Firefighting & Prevention (5 | 11.1%), Personal Care & Service (3 | 6.7%), Healthcare Support (1 | 2.2%), and Food Preparation & Serving (1 | 2.2%).
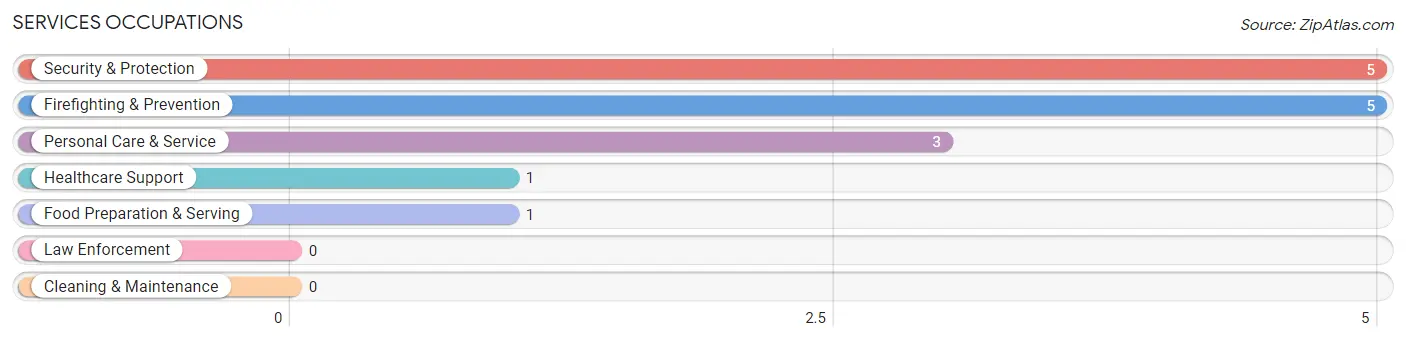
Services Occupations by Sex
Within the Services occupations in Ellisburg, the most male-oriented occupations are Security & Protection (100.0%), and Firefighting & Prevention (100.0%), while the most female-oriented occupations are Healthcare Support (100.0%), Food Preparation & Serving (100.0%), and Personal Care & Service (100.0%).
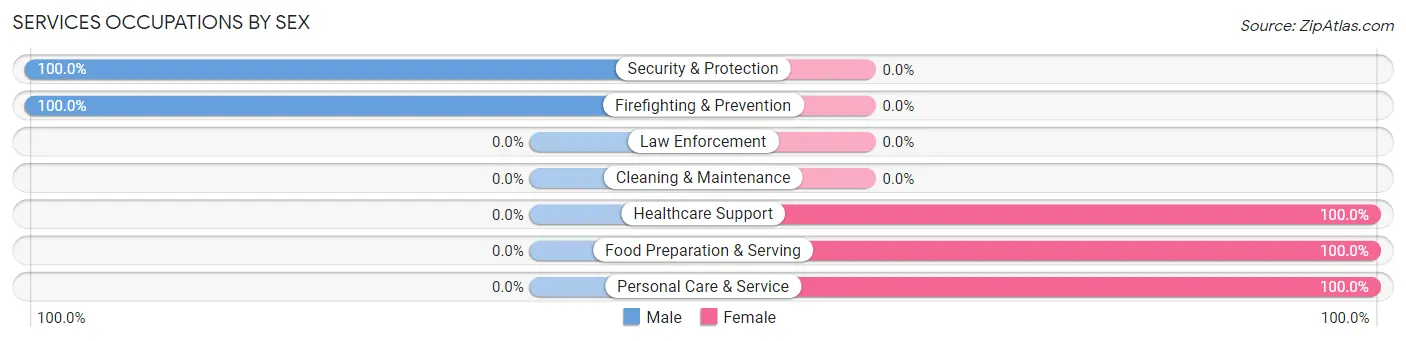
| Occupation | Male | Female |
| Healthcare Support | 0 (0.0%) | 1 (100.0%) |
| Security & Protection | 5 (100.0%) | 0 (0.0%) |
| Firefighting & Prevention | 5 (100.0%) | 0 (0.0%) |
| Law Enforcement | 0 (0.0%) | 0 (0.0%) |
| Food Preparation & Serving | 0 (0.0%) | 1 (100.0%) |
| Cleaning & Maintenance | 0 (0.0%) | 0 (0.0%) |
| Personal Care & Service | 0 (0.0%) | 3 (100.0%) |
| Total (Category) | 5 (50.0%) | 5 (50.0%) |
| Total (Overall) | 20 (44.4%) | 25 (55.6%) |
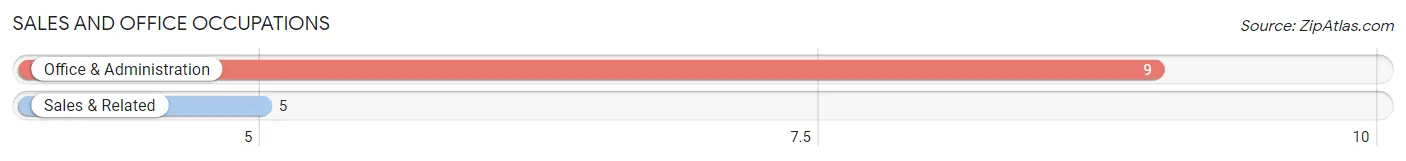
Sales and Office Occupations
The most common Sales and Office occupations in Ellisburg are Office & Administration (9 | 20.0%), and Sales & Related (5 | 11.1%).
Sales and Office Occupations by Sex

| Occupation | Male | Female |
| Sales & Related | 0 (0.0%) | 5 (100.0%) |
| Office & Administration | 2 (22.2%) | 7 (77.8%) |
| Total (Category) | 2 (14.3%) | 12 (85.7%) |
| Total (Overall) | 20 (44.4%) | 25 (55.6%) |
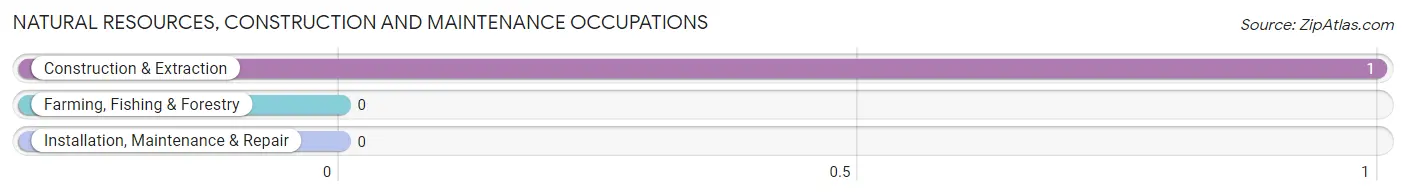
Natural Resources, Construction and Maintenance Occupations
The most common Natural Resources, Construction and Maintenance occupations in Ellisburg are , and Construction & Extraction (1 | 2.2%).
Natural Resources, Construction and Maintenance Occupations by Sex
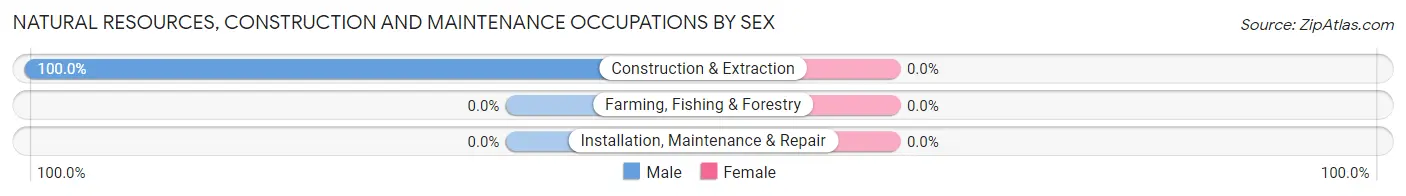
| Occupation | Male | Female |
| Farming, Fishing & Forestry | 0 (0.0%) | 0 (0.0%) |
| Construction & Extraction | 1 (100.0%) | 0 (0.0%) |
| Installation, Maintenance & Repair | 0 (0.0%) | 0 (0.0%) |
| Total (Category) | 1 (100.0%) | 0 (0.0%) |
| Total (Overall) | 20 (44.4%) | 25 (55.6%) |
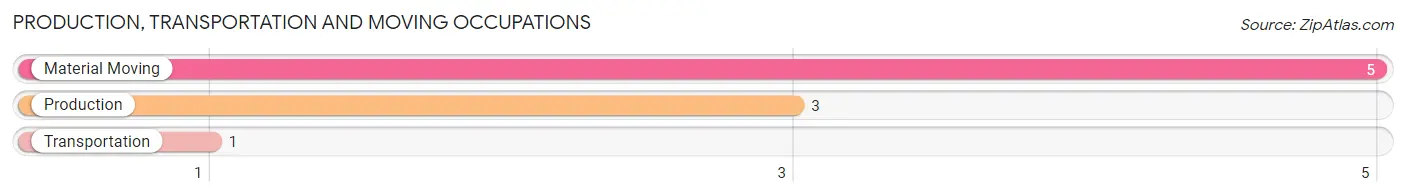
Production, Transportation and Moving Occupations
The most common Production, Transportation and Moving occupations in Ellisburg are Material Moving (5 | 11.1%), Production (3 | 6.7%), and Transportation (1 | 2.2%).
Production, Transportation and Moving Occupations by Sex
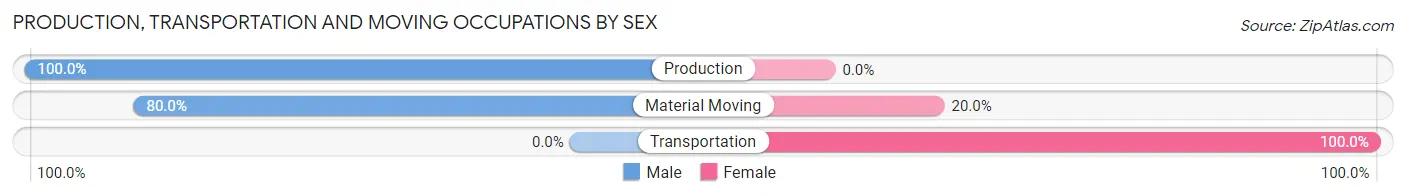
| Occupation | Male | Female |
| Production | 3 (100.0%) | 0 (0.0%) |
| Transportation | 0 (0.0%) | 1 (100.0%) |
| Material Moving | 4 (80.0%) | 1 (20.0%) |
| Total (Category) | 7 (77.8%) | 2 (22.2%) |
| Total (Overall) | 20 (44.4%) | 25 (55.6%) |
Employment Industries by Sex in Ellisburg
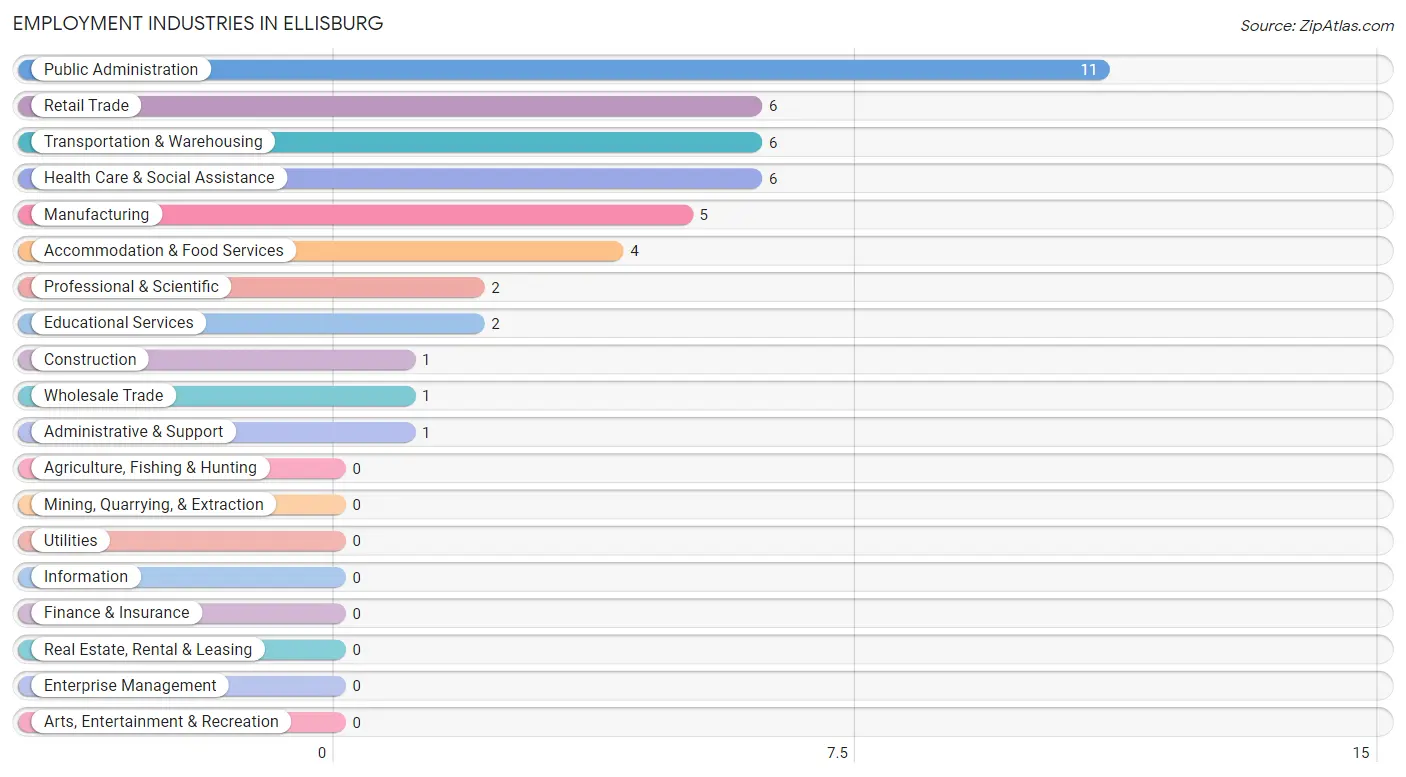
Employment Industries in Ellisburg
The major employment industries in Ellisburg include Public Administration (11 | 24.4%), Retail Trade (6 | 13.3%), Transportation & Warehousing (6 | 13.3%), Health Care & Social Assistance (6 | 13.3%), and Manufacturing (5 | 11.1%).
Employment Industries by Sex in Ellisburg
The Ellisburg industries that see more men than women are Construction (100.0%), Wholesale Trade (100.0%), and Transportation & Warehousing (100.0%), whereas the industries that tend to have a higher number of women are Retail Trade (100.0%), Administrative & Support (100.0%), and Educational Services (100.0%).
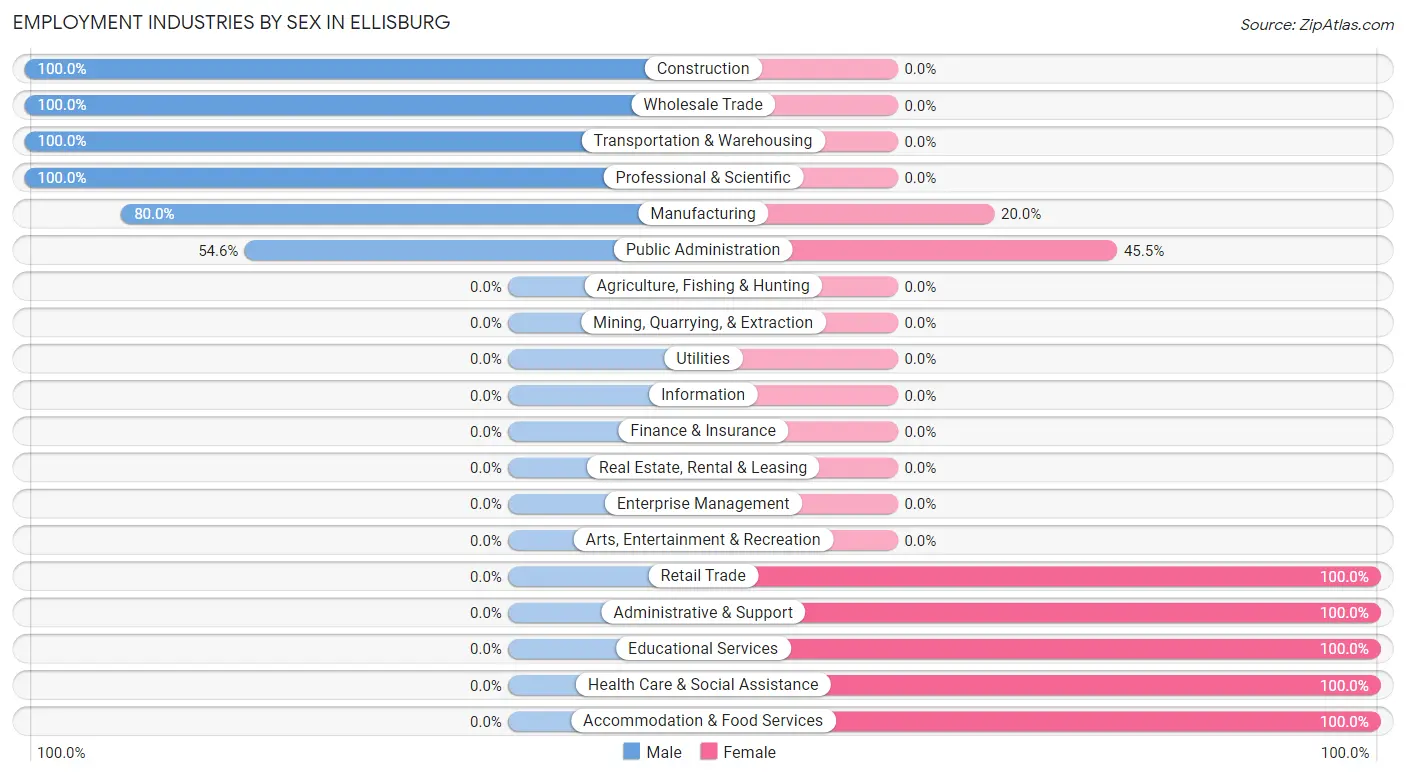
| Industry | Male | Female |
| Agriculture, Fishing & Hunting | 0 (0.0%) | 0 (0.0%) |
| Mining, Quarrying, & Extraction | 0 (0.0%) | 0 (0.0%) |
| Construction | 1 (100.0%) | 0 (0.0%) |
| Manufacturing | 4 (80.0%) | 1 (20.0%) |
| Wholesale Trade | 1 (100.0%) | 0 (0.0%) |
| Retail Trade | 0 (0.0%) | 6 (100.0%) |
| Transportation & Warehousing | 6 (100.0%) | 0 (0.0%) |
| Utilities | 0 (0.0%) | 0 (0.0%) |
| Information | 0 (0.0%) | 0 (0.0%) |
| Finance & Insurance | 0 (0.0%) | 0 (0.0%) |
| Real Estate, Rental & Leasing | 0 (0.0%) | 0 (0.0%) |
| Professional & Scientific | 2 (100.0%) | 0 (0.0%) |
| Enterprise Management | 0 (0.0%) | 0 (0.0%) |
| Administrative & Support | 0 (0.0%) | 1 (100.0%) |
| Educational Services | 0 (0.0%) | 2 (100.0%) |
| Health Care & Social Assistance | 0 (0.0%) | 6 (100.0%) |
| Arts, Entertainment & Recreation | 0 (0.0%) | 0 (0.0%) |
| Accommodation & Food Services | 0 (0.0%) | 4 (100.0%) |
| Public Administration | 6 (54.5%) | 5 (45.5%) |
| Total | 20 (44.4%) | 25 (55.6%) |
Education in Ellisburg
School Enrollment in Ellisburg
The most common levels of schooling among the 65 students in Ellisburg are middle school (20 | 30.8%), high school (20 | 30.8%), and elementary school (16 | 24.6%).
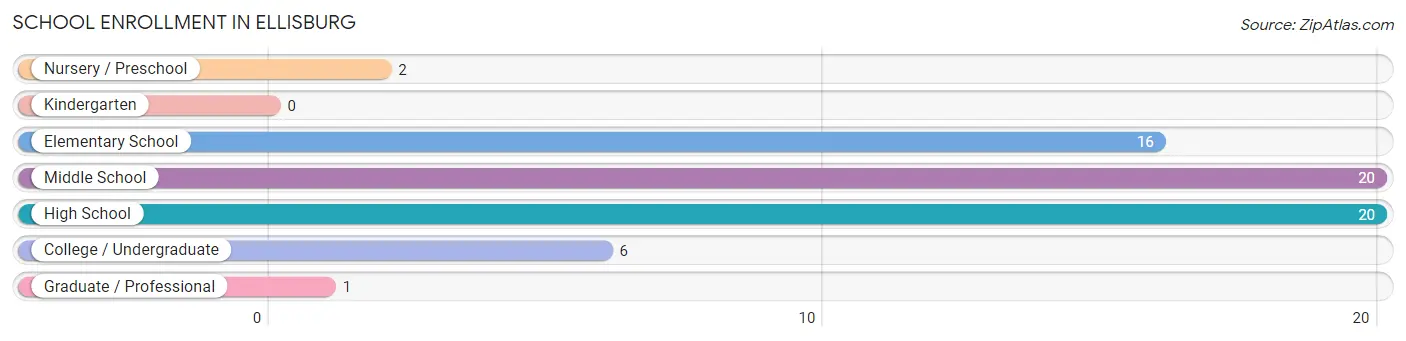
| School Level | # Students | % Students |
| Nursery / Preschool | 2 | 3.1% |
| Kindergarten | 0 | 0.0% |
| Elementary School | 16 | 24.6% |
| Middle School | 20 | 30.8% |
| High School | 20 | 30.8% |
| College / Undergraduate | 6 | 9.2% |
| Graduate / Professional | 1 | 1.5% |
| Total | 65 | 100.0% |
School Enrollment by Age by Funding Source in Ellisburg
Out of a total of 65 students who are enrolled in schools in Ellisburg, 1 (1.5%) attend a private institution, while the remaining 64 (98.5%) are enrolled in public schools. The age group of 3 to 4 year olds has the highest likelihood of being enrolled in private schools, with 1 (100.0% in the age bracket) enrolled. Conversely, the age group of 5 to 9 year old has the lowest likelihood of being enrolled in a private school, with 16 (100.0% in the age bracket) attending a public institution.
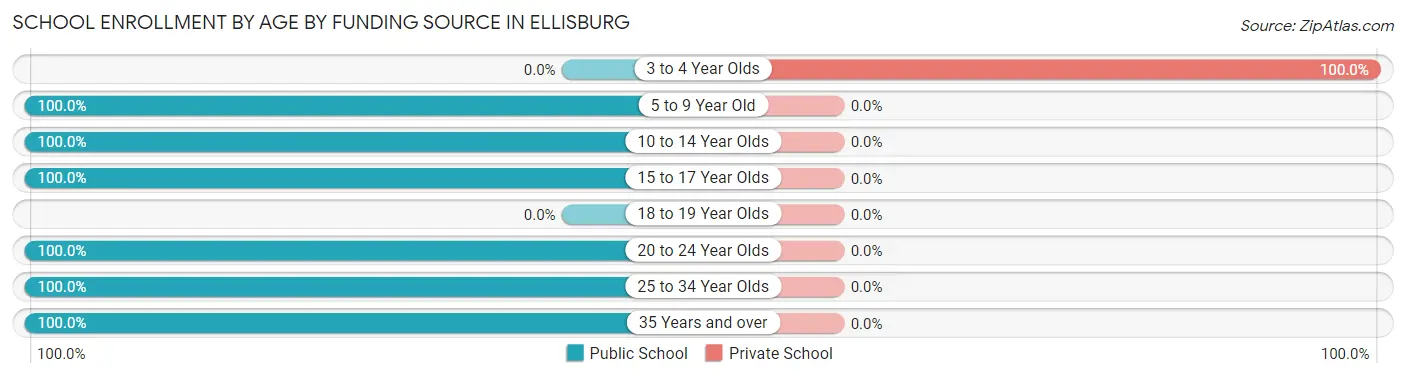
| Age Bracket | Public School | Private School |
| 3 to 4 Year Olds | 0 (0.0%) | 1 (100.0%) |
| 5 to 9 Year Old | 16 (100.0%) | 0 (0.0%) |
| 10 to 14 Year Olds | 25 (100.0%) | 0 (0.0%) |
| 15 to 17 Year Olds | 16 (100.0%) | 0 (0.0%) |
| 18 to 19 Year Olds | 0 (0.0%) | 0 (0.0%) |
| 20 to 24 Year Olds | 2 (100.0%) | 0 (0.0%) |
| 25 to 34 Year Olds | 1 (100.0%) | 0 (0.0%) |
| 35 Years and over | 4 (100.0%) | 0 (0.0%) |
| Total | 64 (98.5%) | 1 (1.5%) |
Educational Attainment by Field of Study in Ellisburg
Education (8 | 34.8%), engineering (6 | 26.1%), bio, nature & agricultural (3 | 13.0%), psychology (3 | 13.0%), and science & technology (1 | 4.3%) are the most common fields of study among 23 individuals in Ellisburg who have obtained a bachelor's degree or higher.
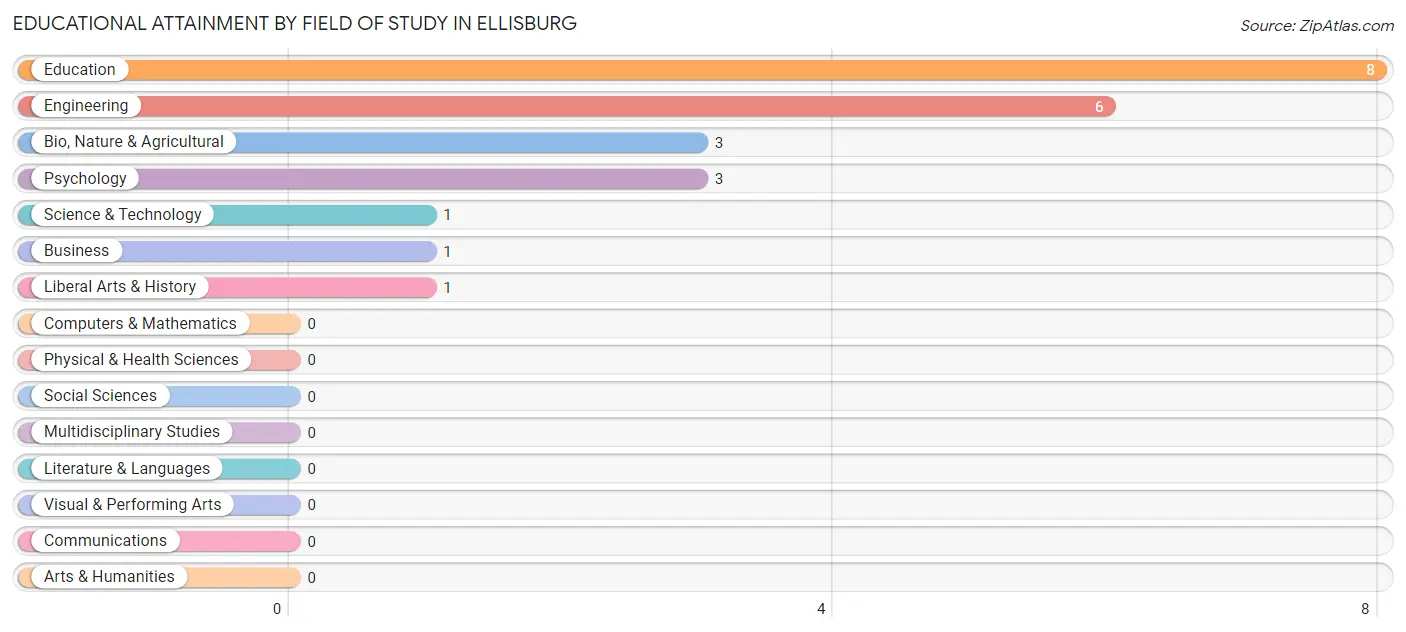
| Field of Study | # Graduates | % Graduates |
| Computers & Mathematics | 0 | 0.0% |
| Bio, Nature & Agricultural | 3 | 13.0% |
| Physical & Health Sciences | 0 | 0.0% |
| Psychology | 3 | 13.0% |
| Social Sciences | 0 | 0.0% |
| Engineering | 6 | 26.1% |
| Multidisciplinary Studies | 0 | 0.0% |
| Science & Technology | 1 | 4.3% |
| Business | 1 | 4.3% |
| Education | 8 | 34.8% |
| Literature & Languages | 0 | 0.0% |
| Liberal Arts & History | 1 | 4.3% |
| Visual & Performing Arts | 0 | 0.0% |
| Communications | 0 | 0.0% |
| Arts & Humanities | 0 | 0.0% |
| Total | 23 | 100.0% |
Transportation & Commute in Ellisburg
Vehicle Availability by Sex in Ellisburg
The most prevalent vehicle ownership categories in Ellisburg are males with 2 vehicles (10, accounting for 50.0%) and females with 2 vehicles (7, making up 40.0%).
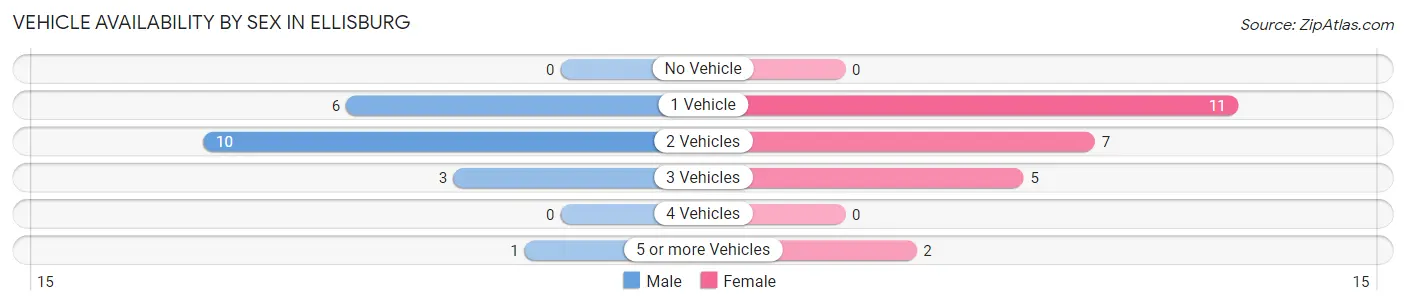
| Vehicles Available | Male | Female |
| No Vehicle | 0 (0.0%) | 0 (0.0%) |
| 1 Vehicle | 6 (30.0%) | 11 (44.0%) |
| 2 Vehicles | 10 (50.0%) | 7 (28.0%) |
| 3 Vehicles | 3 (15.0%) | 5 (20.0%) |
| 4 Vehicles | 0 (0.0%) | 0 (0.0%) |
| 5 or more Vehicles | 1 (5.0%) | 2 (8.0%) |
| Total | 20 (100.0%) | 25 (100.0%) |
Commute Time in Ellisburg
The most frequently occuring commute durations in Ellisburg are 30 to 34 minutes (15 commuters, 38.5%), 5 to 9 minutes (6 commuters, 15.4%), and 45 to 59 minutes (6 commuters, 15.4%).
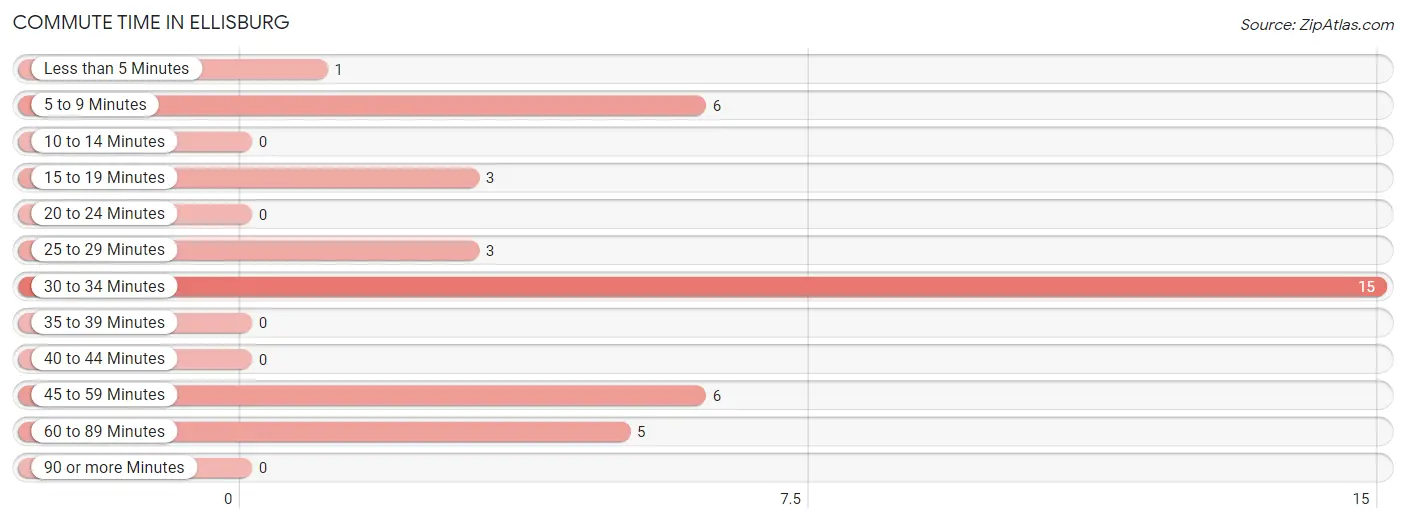
| Commute Time | # Commuters | % Commuters |
| Less than 5 Minutes | 1 | 2.6% |
| 5 to 9 Minutes | 6 | 15.4% |
| 10 to 14 Minutes | 0 | 0.0% |
| 15 to 19 Minutes | 3 | 7.7% |
| 20 to 24 Minutes | 0 | 0.0% |
| 25 to 29 Minutes | 3 | 7.7% |
| 30 to 34 Minutes | 15 | 38.5% |
| 35 to 39 Minutes | 0 | 0.0% |
| 40 to 44 Minutes | 0 | 0.0% |
| 45 to 59 Minutes | 6 | 15.4% |
| 60 to 89 Minutes | 5 | 12.8% |
| 90 or more Minutes | 0 | 0.0% |
Commute Time by Sex in Ellisburg
The most common commute times in Ellisburg are 30 to 34 minutes (6 commuters, 42.9%) for males and 30 to 34 minutes (9 commuters, 36.0%) for females.
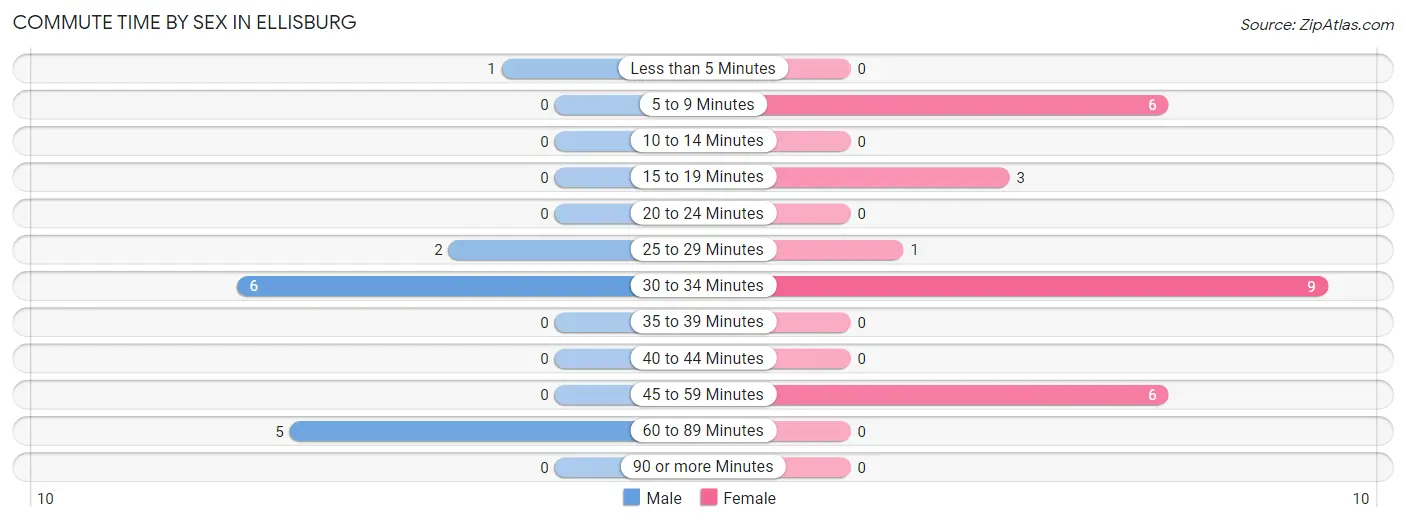
| Commute Time | Male | Female |
| Less than 5 Minutes | 1 (7.1%) | 0 (0.0%) |
| 5 to 9 Minutes | 0 (0.0%) | 6 (24.0%) |
| 10 to 14 Minutes | 0 (0.0%) | 0 (0.0%) |
| 15 to 19 Minutes | 0 (0.0%) | 3 (12.0%) |
| 20 to 24 Minutes | 0 (0.0%) | 0 (0.0%) |
| 25 to 29 Minutes | 2 (14.3%) | 1 (4.0%) |
| 30 to 34 Minutes | 6 (42.9%) | 9 (36.0%) |
| 35 to 39 Minutes | 0 (0.0%) | 0 (0.0%) |
| 40 to 44 Minutes | 0 (0.0%) | 0 (0.0%) |
| 45 to 59 Minutes | 0 (0.0%) | 6 (24.0%) |
| 60 to 89 Minutes | 5 (35.7%) | 0 (0.0%) |
| 90 or more Minutes | 0 (0.0%) | 0 (0.0%) |
Time of Departure to Work by Sex in Ellisburg
The most frequent times of departure to work in Ellisburg are 12:00 AM to 4:59 AM (5, 35.7%) for males and 7:30 AM to 7:59 AM (9, 36.0%) for females.
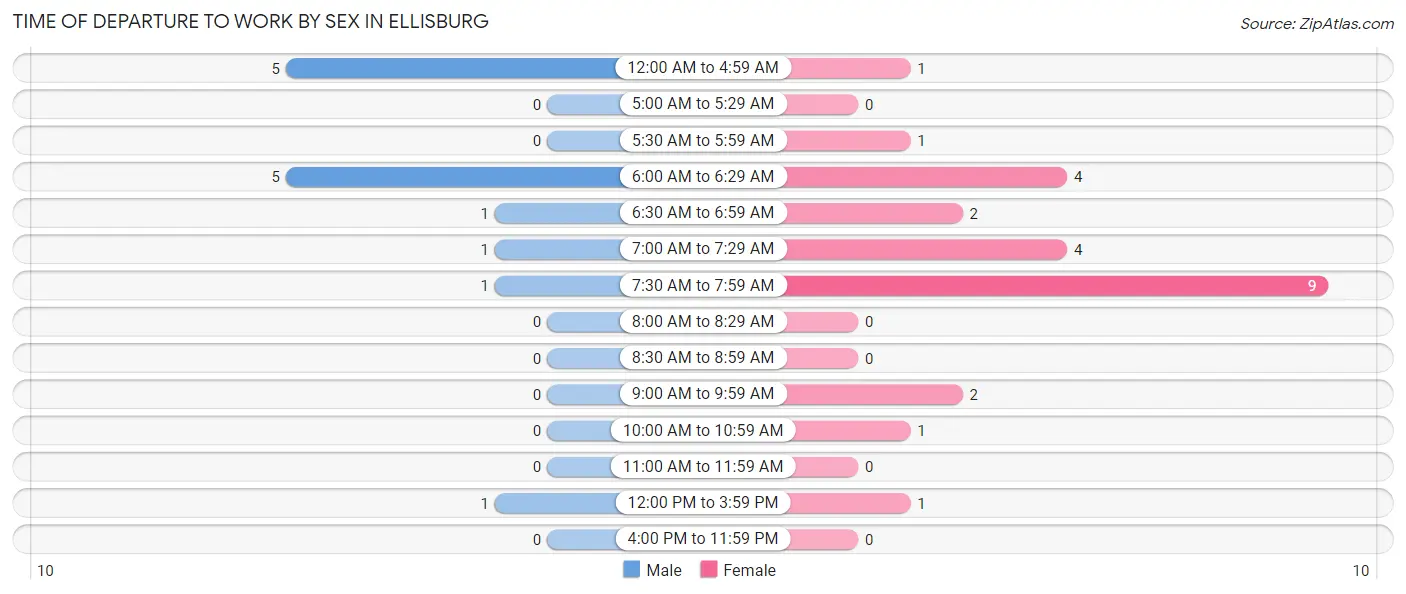
| Time of Departure | Male | Female |
| 12:00 AM to 4:59 AM | 5 (35.7%) | 1 (4.0%) |
| 5:00 AM to 5:29 AM | 0 (0.0%) | 0 (0.0%) |
| 5:30 AM to 5:59 AM | 0 (0.0%) | 1 (4.0%) |
| 6:00 AM to 6:29 AM | 5 (35.7%) | 4 (16.0%) |
| 6:30 AM to 6:59 AM | 1 (7.1%) | 2 (8.0%) |
| 7:00 AM to 7:29 AM | 1 (7.1%) | 4 (16.0%) |
| 7:30 AM to 7:59 AM | 1 (7.1%) | 9 (36.0%) |
| 8:00 AM to 8:29 AM | 0 (0.0%) | 0 (0.0%) |
| 8:30 AM to 8:59 AM | 0 (0.0%) | 0 (0.0%) |
| 9:00 AM to 9:59 AM | 0 (0.0%) | 2 (8.0%) |
| 10:00 AM to 10:59 AM | 0 (0.0%) | 1 (4.0%) |
| 11:00 AM to 11:59 AM | 0 (0.0%) | 0 (0.0%) |
| 12:00 PM to 3:59 PM | 1 (7.1%) | 1 (4.0%) |
| 4:00 PM to 11:59 PM | 0 (0.0%) | 0 (0.0%) |
| Total | 14 (100.0%) | 25 (100.0%) |
Housing Occupancy in Ellisburg
Occupancy by Ownership in Ellisburg
Of the total 57 dwellings in Ellisburg, owner-occupied units account for 46 (80.7%), while renter-occupied units make up 11 (19.3%).
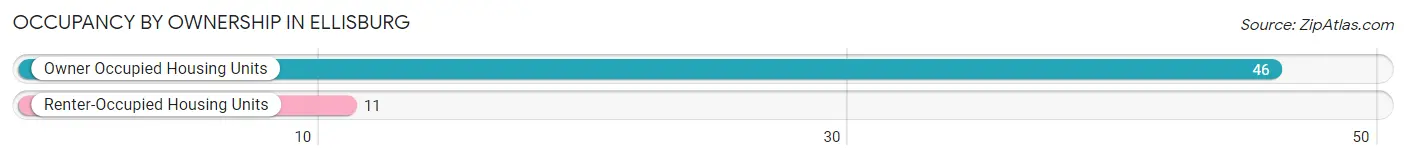
| Occupancy | # Housing Units | % Housing Units |
| Owner Occupied Housing Units | 46 | 80.7% |
| Renter-Occupied Housing Units | 11 | 19.3% |
| Total Occupied Housing Units | 57 | 100.0% |
Occupancy by Household Size in Ellisburg
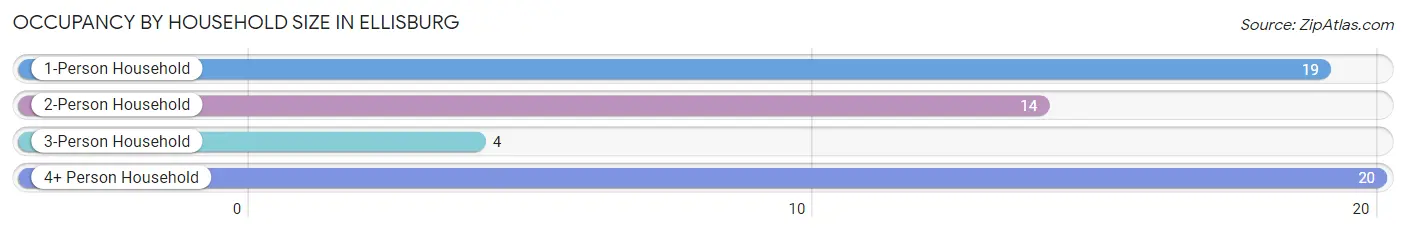
| Household Size | # Housing Units | % Housing Units |
| 1-Person Household | 19 | 33.3% |
| 2-Person Household | 14 | 24.6% |
| 3-Person Household | 4 | 7.0% |
| 4+ Person Household | 20 | 35.1% |
| Total Housing Units | 57 | 100.0% |
Occupancy by Ownership by Household Size in Ellisburg
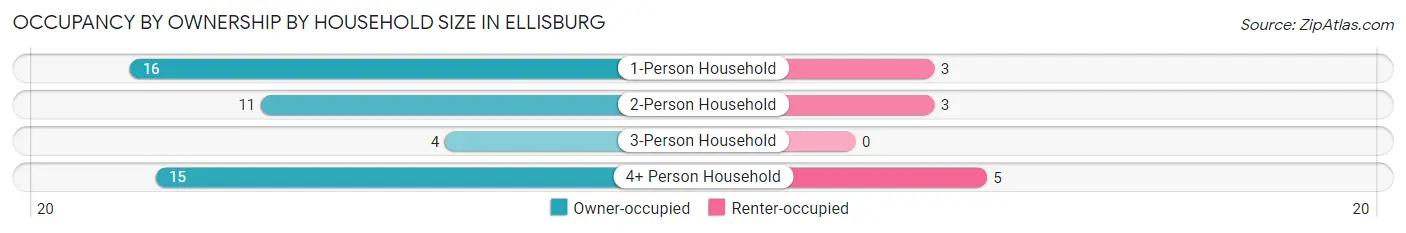
| Household Size | Owner-occupied | Renter-occupied |
| 1-Person Household | 16 (84.2%) | 3 (15.8%) |
| 2-Person Household | 11 (78.6%) | 3 (21.4%) |
| 3-Person Household | 4 (100.0%) | 0 (0.0%) |
| 4+ Person Household | 15 (75.0%) | 5 (25.0%) |
| Total Housing Units | 46 (80.7%) | 11 (19.3%) |
Occupancy by Educational Attainment in Ellisburg
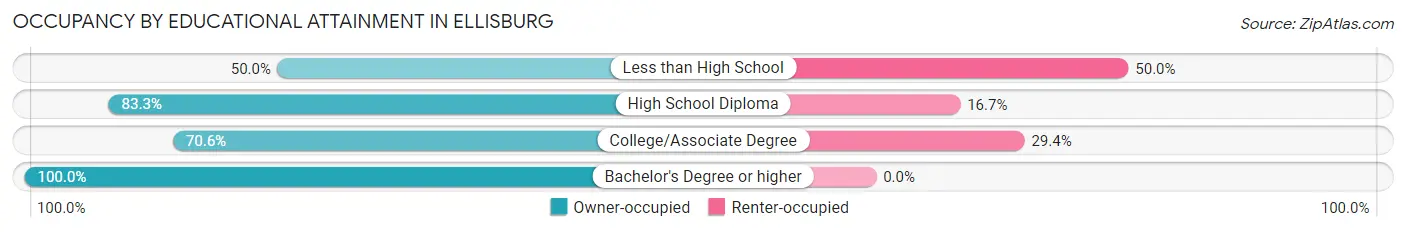
| Household Size | Owner-occupied | Renter-occupied |
| Less than High School | 3 (50.0%) | 3 (50.0%) |
| High School Diploma | 15 (83.3%) | 3 (16.7%) |
| College/Associate Degree | 12 (70.6%) | 5 (29.4%) |
| Bachelor's Degree or higher | 16 (100.0%) | 0 (0.0%) |
Occupancy by Age of Householder in Ellisburg
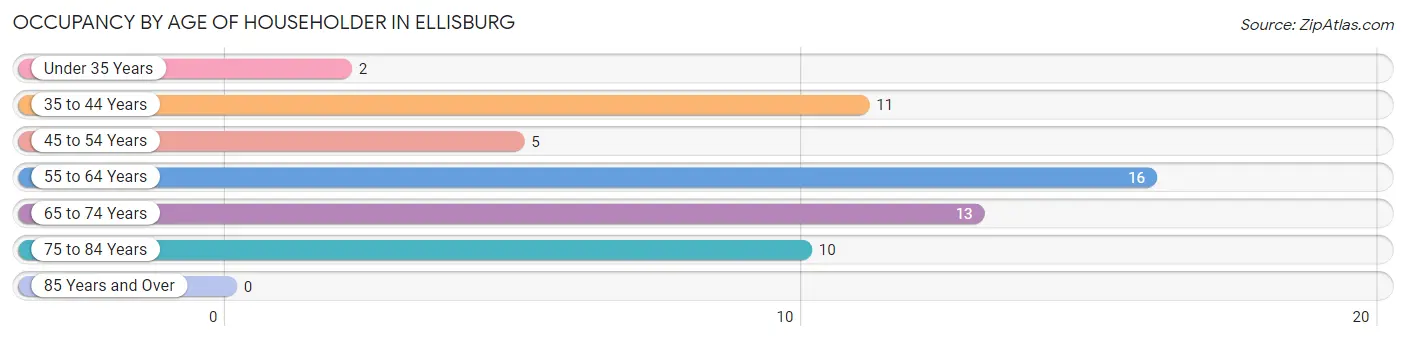
| Age Bracket | # Households | % Households |
| Under 35 Years | 2 | 3.5% |
| 35 to 44 Years | 11 | 19.3% |
| 45 to 54 Years | 5 | 8.8% |
| 55 to 64 Years | 16 | 28.1% |
| 65 to 74 Years | 13 | 22.8% |
| 75 to 84 Years | 10 | 17.5% |
| 85 Years and Over | 0 | 0.0% |
| Total | 57 | 100.0% |
Housing Finances in Ellisburg
Median Income by Occupancy in Ellisburg
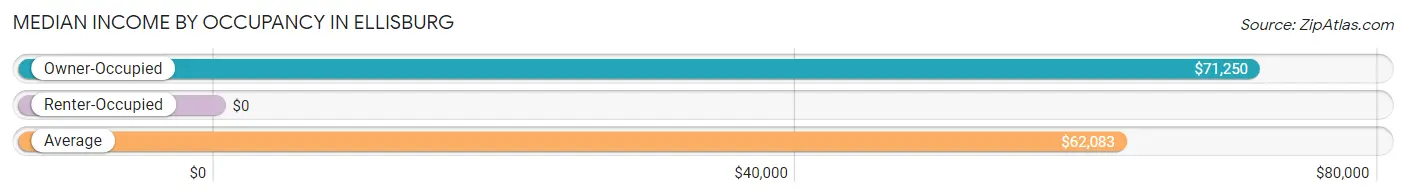
| Occupancy Type | # Households | Median Income |
| Owner-Occupied | 46 (80.7%) | $71,250 |
| Renter-Occupied | 11 (19.3%) | $0 |
| Average | 57 (100.0%) | $62,083 |
Occupancy by Householder Income Bracket in Ellisburg
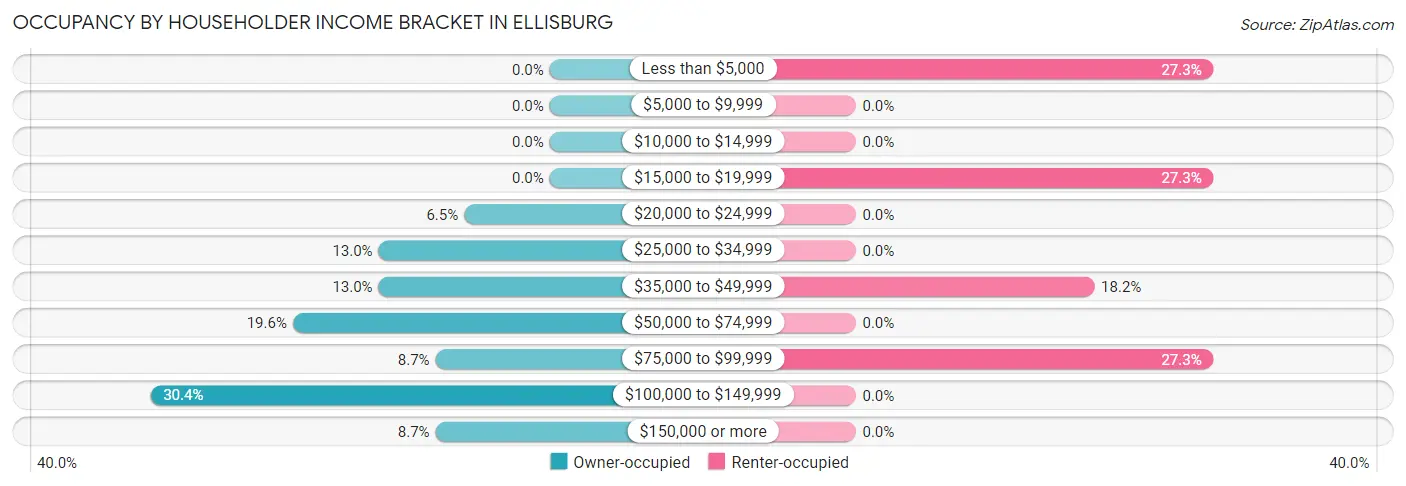
| Income Bracket | Owner-occupied | Renter-occupied |
| Less than $5,000 | 0 (0.0%) | 3 (27.3%) |
| $5,000 to $9,999 | 0 (0.0%) | 0 (0.0%) |
| $10,000 to $14,999 | 0 (0.0%) | 0 (0.0%) |
| $15,000 to $19,999 | 0 (0.0%) | 3 (27.3%) |
| $20,000 to $24,999 | 3 (6.5%) | 0 (0.0%) |
| $25,000 to $34,999 | 6 (13.0%) | 0 (0.0%) |
| $35,000 to $49,999 | 6 (13.0%) | 2 (18.2%) |
| $50,000 to $74,999 | 9 (19.6%) | 0 (0.0%) |
| $75,000 to $99,999 | 4 (8.7%) | 3 (27.3%) |
| $100,000 to $149,999 | 14 (30.4%) | 0 (0.0%) |
| $150,000 or more | 4 (8.7%) | 0 (0.0%) |
| Total | 46 (100.0%) | 11 (100.0%) |
Monthly Housing Cost Tiers in Ellisburg
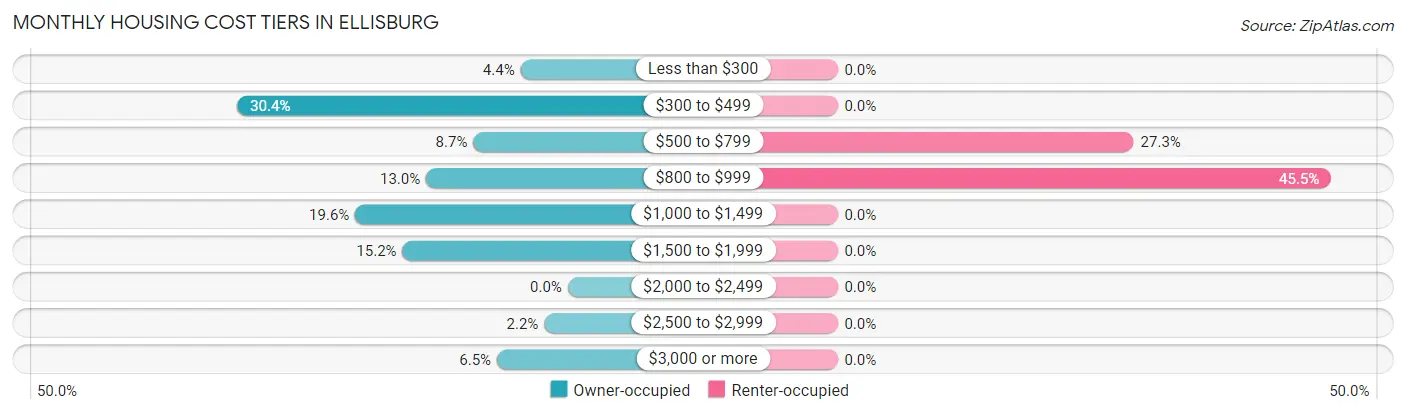
| Monthly Cost | Owner-occupied | Renter-occupied |
| Less than $300 | 2 (4.3%) | 0 (0.0%) |
| $300 to $499 | 14 (30.4%) | 0 (0.0%) |
| $500 to $799 | 4 (8.7%) | 3 (27.3%) |
| $800 to $999 | 6 (13.0%) | 5 (45.5%) |
| $1,000 to $1,499 | 9 (19.6%) | 0 (0.0%) |
| $1,500 to $1,999 | 7 (15.2%) | 0 (0.0%) |
| $2,000 to $2,499 | 0 (0.0%) | 0 (0.0%) |
| $2,500 to $2,999 | 1 (2.2%) | 0 (0.0%) |
| $3,000 or more | 3 (6.5%) | 0 (0.0%) |
| Total | 46 (100.0%) | 11 (100.0%) |
Physical Housing Characteristics in Ellisburg
Housing Structures in Ellisburg
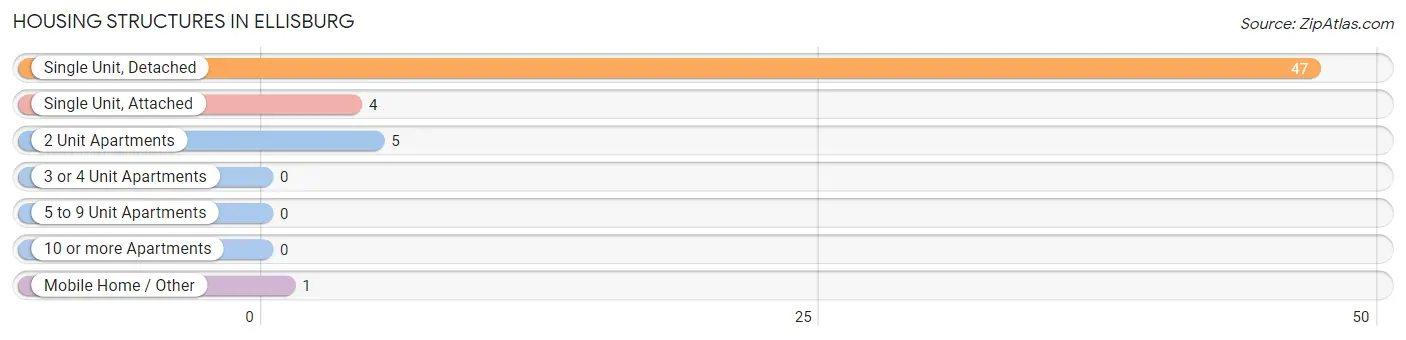
| Structure Type | # Housing Units | % Housing Units |
| Single Unit, Detached | 47 | 82.5% |
| Single Unit, Attached | 4 | 7.0% |
| 2 Unit Apartments | 5 | 8.8% |
| 3 or 4 Unit Apartments | 0 | 0.0% |
| 5 to 9 Unit Apartments | 0 | 0.0% |
| 10 or more Apartments | 0 | 0.0% |
| Mobile Home / Other | 1 | 1.8% |
| Total | 57 | 100.0% |
Housing Structures by Occupancy in Ellisburg
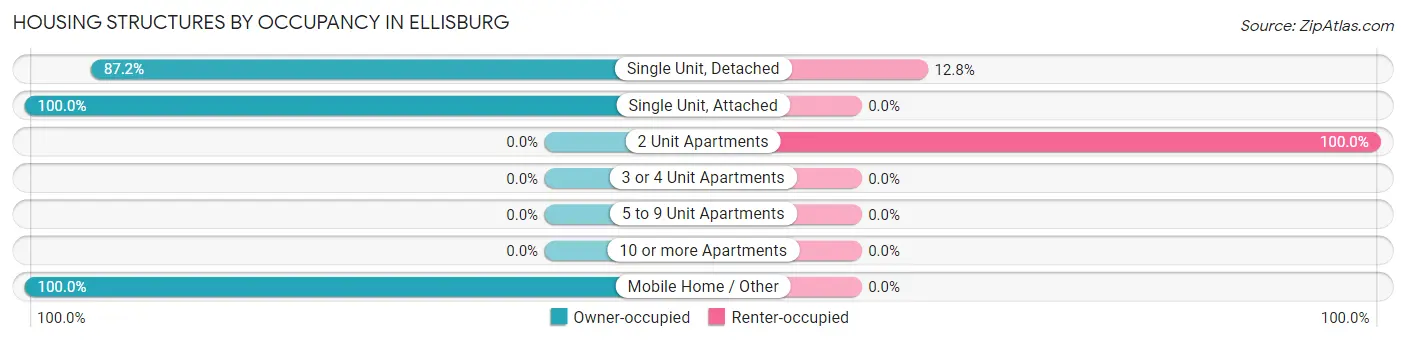
| Structure Type | Owner-occupied | Renter-occupied |
| Single Unit, Detached | 41 (87.2%) | 6 (12.8%) |
| Single Unit, Attached | 4 (100.0%) | 0 (0.0%) |
| 2 Unit Apartments | 0 (0.0%) | 5 (100.0%) |
| 3 or 4 Unit Apartments | 0 (0.0%) | 0 (0.0%) |
| 5 to 9 Unit Apartments | 0 (0.0%) | 0 (0.0%) |
| 10 or more Apartments | 0 (0.0%) | 0 (0.0%) |
| Mobile Home / Other | 1 (100.0%) | 0 (0.0%) |
| Total | 46 (80.7%) | 11 (19.3%) |
Housing Structures by Number of Rooms in Ellisburg
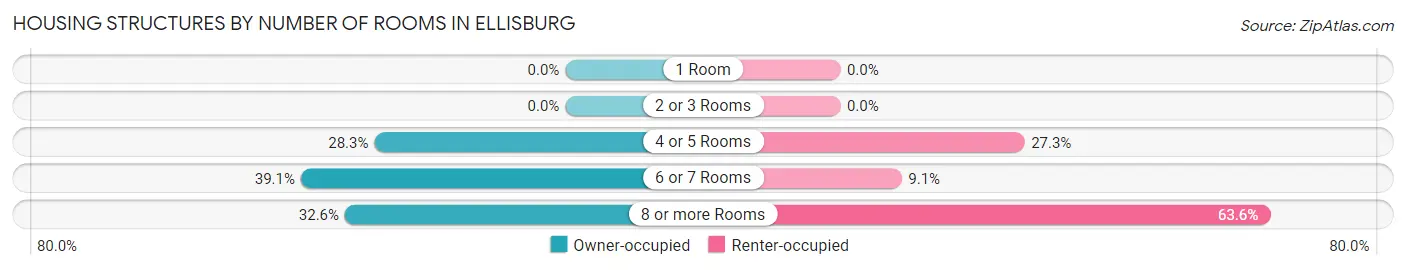
| Number of Rooms | Owner-occupied | Renter-occupied |
| 1 Room | 0 (0.0%) | 0 (0.0%) |
| 2 or 3 Rooms | 0 (0.0%) | 0 (0.0%) |
| 4 or 5 Rooms | 13 (28.3%) | 3 (27.3%) |
| 6 or 7 Rooms | 18 (39.1%) | 1 (9.1%) |
| 8 or more Rooms | 15 (32.6%) | 7 (63.6%) |
| Total | 46 (100.0%) | 11 (100.0%) |
Housing Structure by Heating Type in Ellisburg
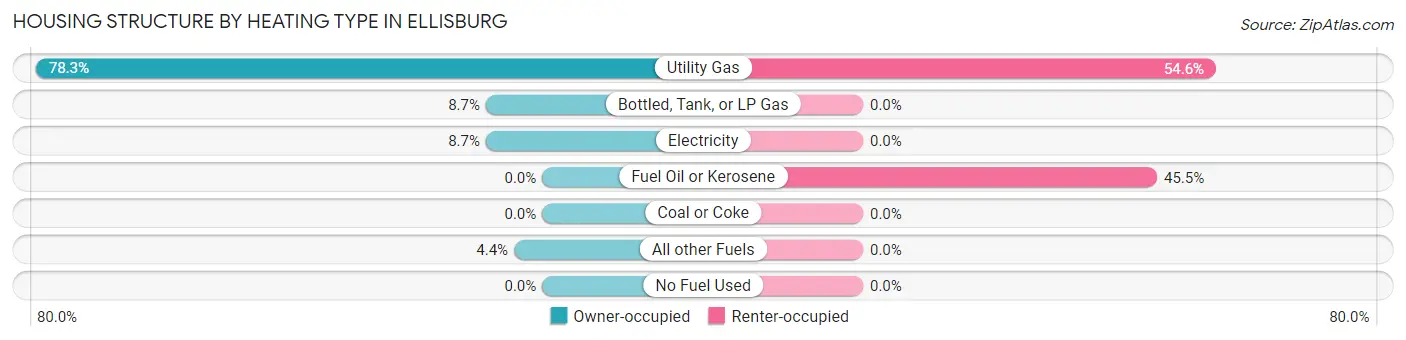
| Heating Type | Owner-occupied | Renter-occupied |
| Utility Gas | 36 (78.3%) | 6 (54.5%) |
| Bottled, Tank, or LP Gas | 4 (8.7%) | 0 (0.0%) |
| Electricity | 4 (8.7%) | 0 (0.0%) |
| Fuel Oil or Kerosene | 0 (0.0%) | 5 (45.5%) |
| Coal or Coke | 0 (0.0%) | 0 (0.0%) |
| All other Fuels | 2 (4.3%) | 0 (0.0%) |
| No Fuel Used | 0 (0.0%) | 0 (0.0%) |
| Total | 46 (100.0%) | 11 (100.0%) |
Household Vehicle Usage in Ellisburg
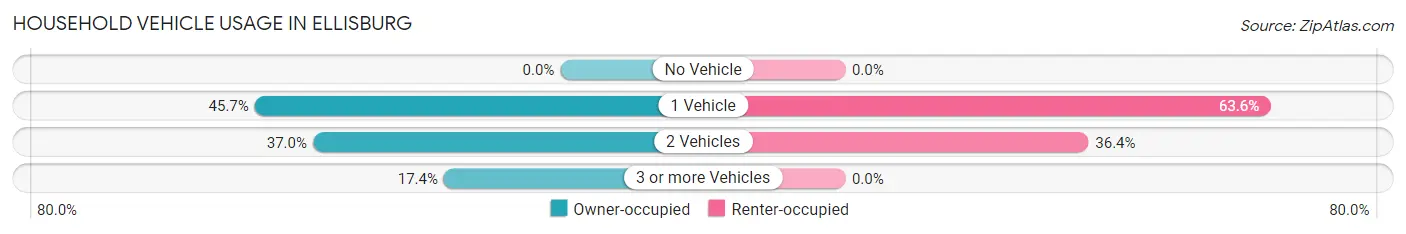
| Vehicles per Household | Owner-occupied | Renter-occupied |
| No Vehicle | 0 (0.0%) | 0 (0.0%) |
| 1 Vehicle | 21 (45.7%) | 7 (63.6%) |
| 2 Vehicles | 17 (37.0%) | 4 (36.4%) |
| 3 or more Vehicles | 8 (17.4%) | 0 (0.0%) |
| Total | 46 (100.0%) | 11 (100.0%) |
Real Estate & Mortgages in Ellisburg
Real Estate and Mortgage Overview in Ellisburg
| Characteristic | Without Mortgage | With Mortgage |
| Housing Units | 24 | 22 |
| Median Property Value | $98,000 | $212,500 |
| Median Household Income | $39,375 | $3 |
| Monthly Housing Costs | $450 | $3 |
| Real Estate Taxes | $1,875 | $0 |
Property Value by Mortgage Status in Ellisburg
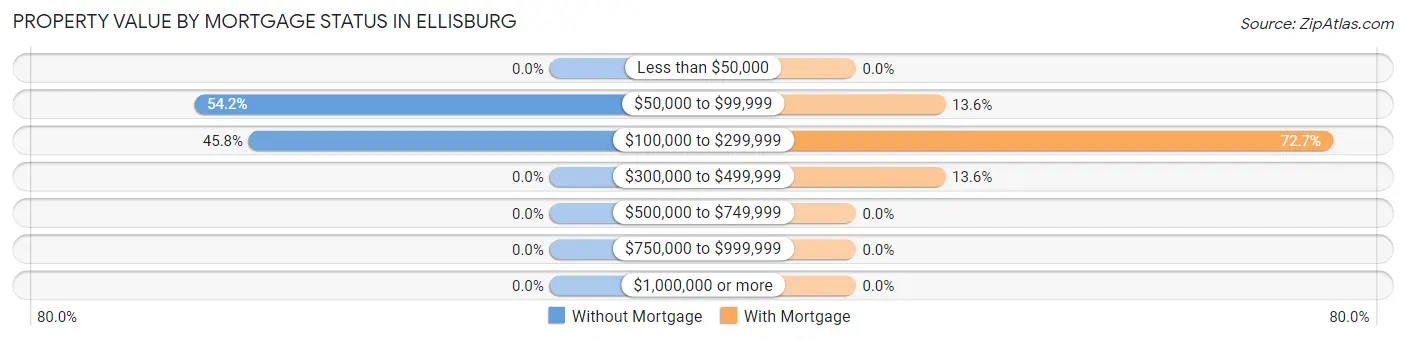
| Property Value | Without Mortgage | With Mortgage |
| Less than $50,000 | 0 (0.0%) | 0 (0.0%) |
| $50,000 to $99,999 | 13 (54.2%) | 3 (13.6%) |
| $100,000 to $299,999 | 11 (45.8%) | 16 (72.7%) |
| $300,000 to $499,999 | 0 (0.0%) | 3 (13.6%) |
| $500,000 to $749,999 | 0 (0.0%) | 0 (0.0%) |
| $750,000 to $999,999 | 0 (0.0%) | 0 (0.0%) |
| $1,000,000 or more | 0 (0.0%) | 0 (0.0%) |
| Total | 24 (100.0%) | 22 (100.0%) |
Household Income by Mortgage Status in Ellisburg
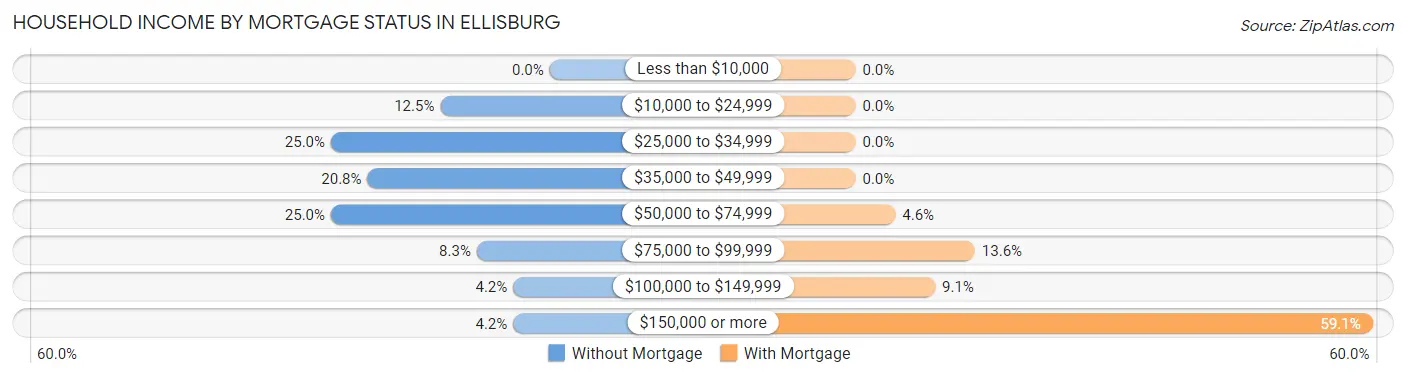
| Household Income | Without Mortgage | With Mortgage |
| Less than $10,000 | 0 (0.0%) | 0 (0.0%) |
| $10,000 to $24,999 | 3 (12.5%) | 0 (0.0%) |
| $25,000 to $34,999 | 6 (25.0%) | 0 (0.0%) |
| $35,000 to $49,999 | 5 (20.8%) | 0 (0.0%) |
| $50,000 to $74,999 | 6 (25.0%) | 1 (4.5%) |
| $75,000 to $99,999 | 2 (8.3%) | 3 (13.6%) |
| $100,000 to $149,999 | 1 (4.2%) | 2 (9.1%) |
| $150,000 or more | 1 (4.2%) | 13 (59.1%) |
| Total | 24 (100.0%) | 22 (100.0%) |
Property Value to Household Income Ratio in Ellisburg
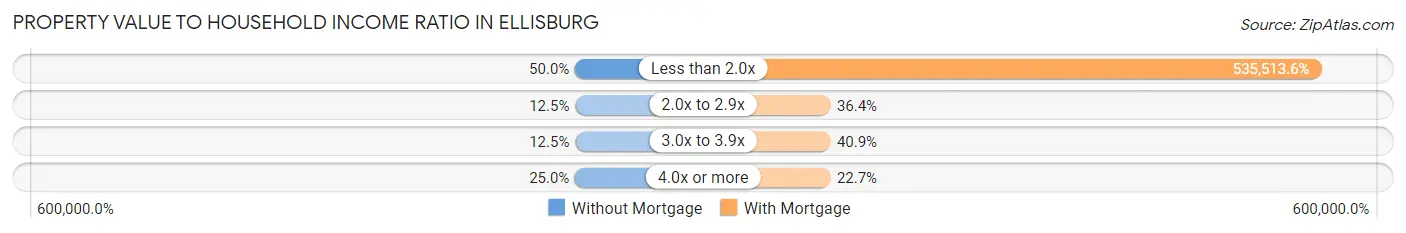
| Value-to-Income Ratio | Without Mortgage | With Mortgage |
| Less than 2.0x | 12 (50.0%) | 117,813 (535,513.6%) |
| 2.0x to 2.9x | 3 (12.5%) | 8 (36.4%) |
| 3.0x to 3.9x | 3 (12.5%) | 9 (40.9%) |
| 4.0x or more | 6 (25.0%) | 5 (22.7%) |
| Total | 24 (100.0%) | 22 (100.0%) |
Real Estate Taxes by Mortgage Status in Ellisburg
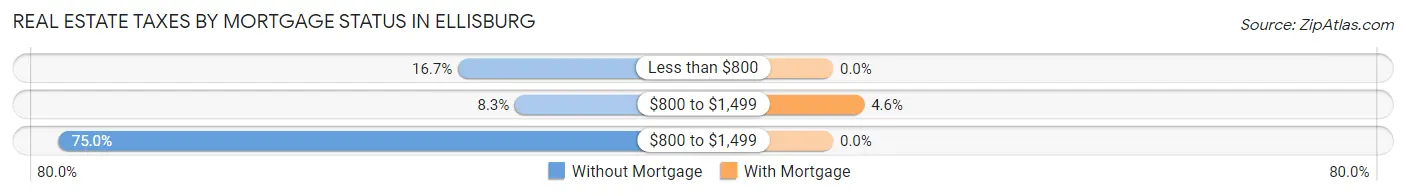
| Property Taxes | Without Mortgage | With Mortgage |
| Less than $800 | 4 (16.7%) | 0 (0.0%) |
| $800 to $1,499 | 2 (8.3%) | 1 (4.5%) |
| $800 to $1,499 | 18 (75.0%) | 0 (0.0%) |
| Total | 24 (100.0%) | 22 (100.0%) |
Health & Disability in Ellisburg
Health Insurance Coverage by Age in Ellisburg
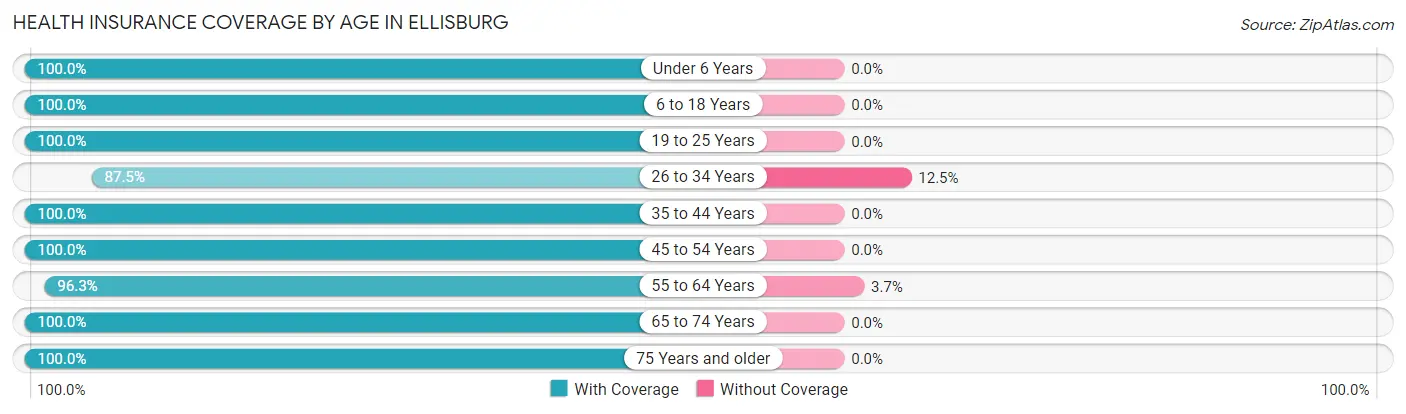
| Age Bracket | With Coverage | Without Coverage |
| Under 6 Years | 18 (100.0%) | 0 (0.0%) |
| 6 to 18 Years | 59 (100.0%) | 0 (0.0%) |
| 19 to 25 Years | 2 (100.0%) | 0 (0.0%) |
| 26 to 34 Years | 14 (87.5%) | 2 (12.5%) |
| 35 to 44 Years | 24 (100.0%) | 0 (0.0%) |
| 45 to 54 Years | 6 (100.0%) | 0 (0.0%) |
| 55 to 64 Years | 26 (96.3%) | 1 (3.7%) |
| 65 to 74 Years | 22 (100.0%) | 0 (0.0%) |
| 75 Years and older | 14 (100.0%) | 0 (0.0%) |
| Total | 185 (98.4%) | 3 (1.6%) |
Health Insurance Coverage by Citizenship Status in Ellisburg
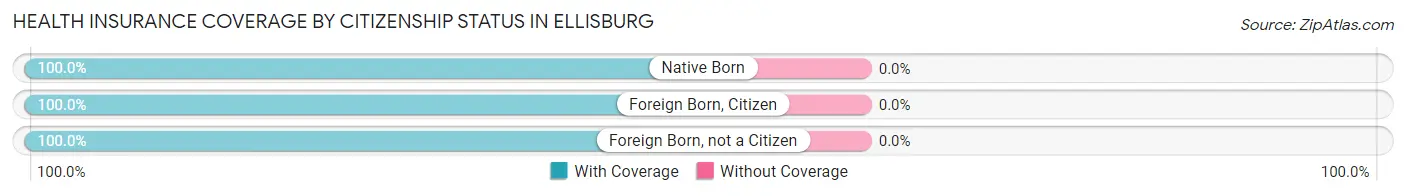
| Citizenship Status | With Coverage | Without Coverage |
| Native Born | 18 (100.0%) | 0 (0.0%) |
| Foreign Born, Citizen | 59 (100.0%) | 0 (0.0%) |
| Foreign Born, not a Citizen | 2 (100.0%) | 0 (0.0%) |
Health Insurance Coverage by Household Income in Ellisburg
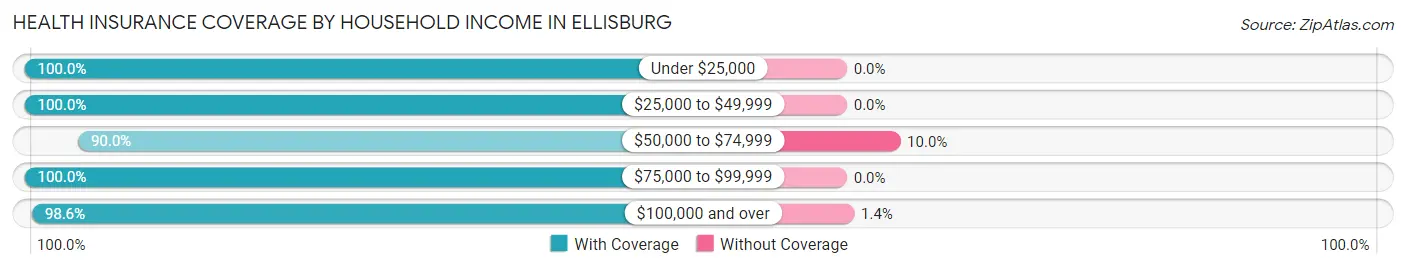
| Household Income | With Coverage | Without Coverage |
| Under $25,000 | 36 (100.0%) | 0 (0.0%) |
| $25,000 to $49,999 | 38 (100.0%) | 0 (0.0%) |
| $50,000 to $74,999 | 18 (90.0%) | 2 (10.0%) |
| $75,000 to $99,999 | 21 (100.0%) | 0 (0.0%) |
| $100,000 and over | 72 (98.6%) | 1 (1.4%) |
Public vs Private Health Insurance Coverage by Age in Ellisburg
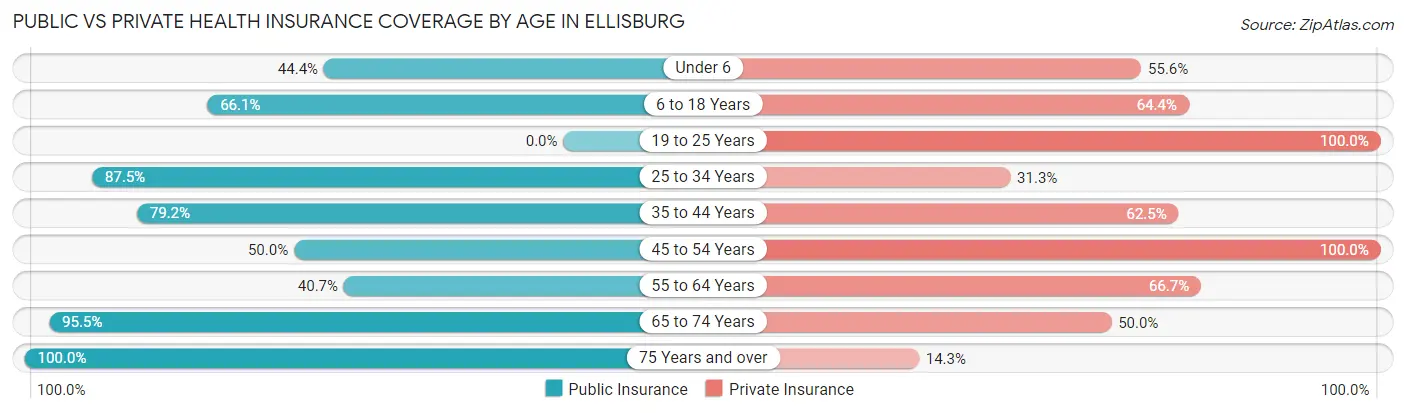
| Age Bracket | Public Insurance | Private Insurance |
| Under 6 | 8 (44.4%) | 10 (55.6%) |
| 6 to 18 Years | 39 (66.1%) | 38 (64.4%) |
| 19 to 25 Years | 0 (0.0%) | 2 (100.0%) |
| 25 to 34 Years | 14 (87.5%) | 5 (31.2%) |
| 35 to 44 Years | 19 (79.2%) | 15 (62.5%) |
| 45 to 54 Years | 3 (50.0%) | 6 (100.0%) |
| 55 to 64 Years | 11 (40.7%) | 18 (66.7%) |
| 65 to 74 Years | 21 (95.5%) | 11 (50.0%) |
| 75 Years and over | 14 (100.0%) | 2 (14.3%) |
| Total | 129 (68.6%) | 107 (56.9%) |
Disability Status by Sex by Age in Ellisburg
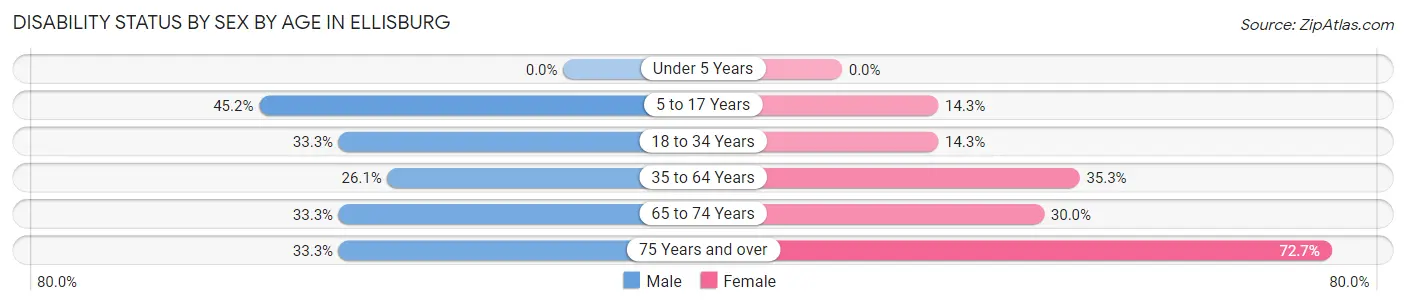
| Age Bracket | Male | Female |
| Under 5 Years | 0 (0.0%) | 0 (0.0%) |
| 5 to 17 Years | 14 (45.2%) | 4 (14.3%) |
| 18 to 34 Years | 4 (33.3%) | 1 (14.3%) |
| 35 to 64 Years | 6 (26.1%) | 12 (35.3%) |
| 65 to 74 Years | 4 (33.3%) | 3 (30.0%) |
| 75 Years and over | 1 (33.3%) | 8 (72.7%) |
Disability Class by Sex by Age in Ellisburg
Disability Class: Hearing Difficulty
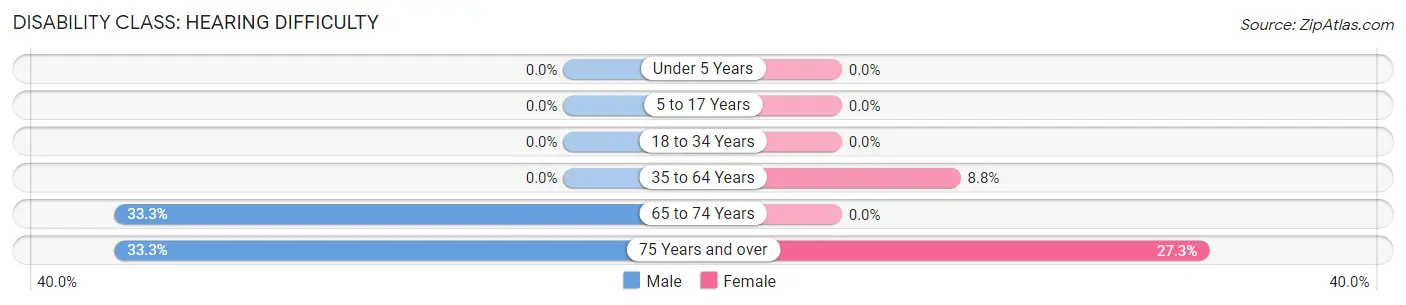
| Age Bracket | Male | Female |
| Under 5 Years | 0 (0.0%) | 0 (0.0%) |
| 5 to 17 Years | 0 (0.0%) | 0 (0.0%) |
| 18 to 34 Years | 0 (0.0%) | 0 (0.0%) |
| 35 to 64 Years | 0 (0.0%) | 3 (8.8%) |
| 65 to 74 Years | 4 (33.3%) | 0 (0.0%) |
| 75 Years and over | 1 (33.3%) | 3 (27.3%) |
Disability Class: Vision Difficulty
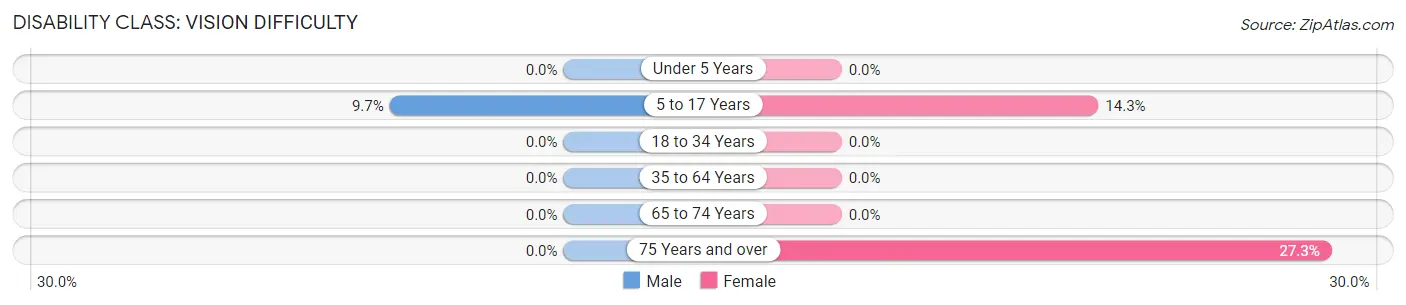
| Age Bracket | Male | Female |
| Under 5 Years | 0 (0.0%) | 0 (0.0%) |
| 5 to 17 Years | 3 (9.7%) | 4 (14.3%) |
| 18 to 34 Years | 0 (0.0%) | 0 (0.0%) |
| 35 to 64 Years | 0 (0.0%) | 0 (0.0%) |
| 65 to 74 Years | 0 (0.0%) | 0 (0.0%) |
| 75 Years and over | 0 (0.0%) | 3 (27.3%) |
Disability Class: Cognitive Difficulty
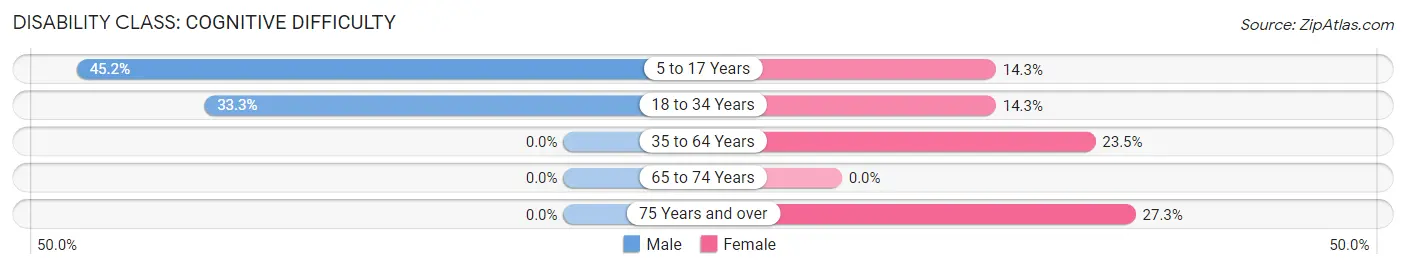
| Age Bracket | Male | Female |
| 5 to 17 Years | 14 (45.2%) | 4 (14.3%) |
| 18 to 34 Years | 4 (33.3%) | 1 (14.3%) |
| 35 to 64 Years | 0 (0.0%) | 8 (23.5%) |
| 65 to 74 Years | 0 (0.0%) | 0 (0.0%) |
| 75 Years and over | 0 (0.0%) | 3 (27.3%) |
Disability Class: Ambulatory Difficulty
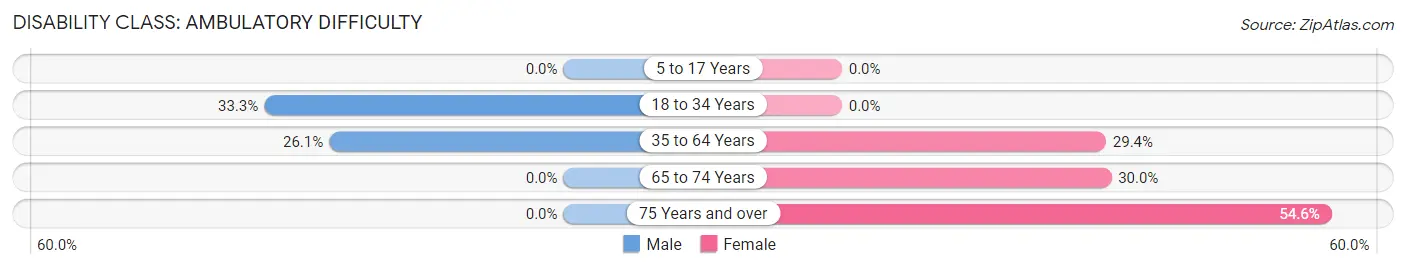
| Age Bracket | Male | Female |
| 5 to 17 Years | 0 (0.0%) | 0 (0.0%) |
| 18 to 34 Years | 4 (33.3%) | 0 (0.0%) |
| 35 to 64 Years | 6 (26.1%) | 10 (29.4%) |
| 65 to 74 Years | 0 (0.0%) | 3 (30.0%) |
| 75 Years and over | 0 (0.0%) | 6 (54.5%) |
Disability Class: Self-Care Difficulty
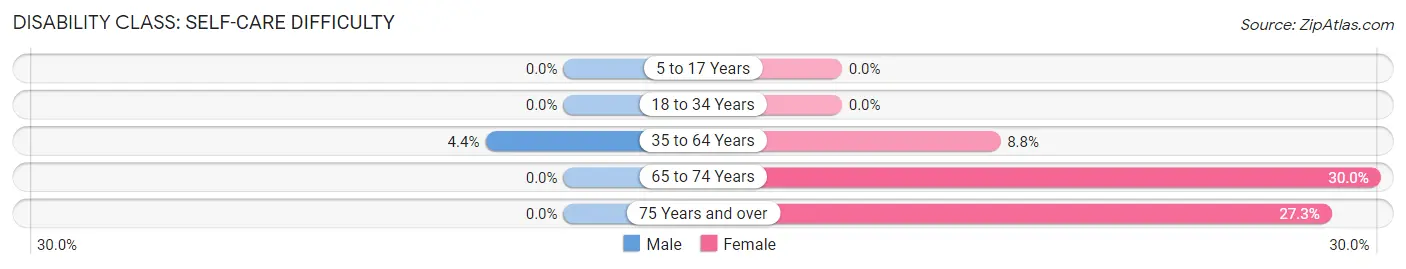
| Age Bracket | Male | Female |
| 5 to 17 Years | 0 (0.0%) | 0 (0.0%) |
| 18 to 34 Years | 0 (0.0%) | 0 (0.0%) |
| 35 to 64 Years | 1 (4.3%) | 3 (8.8%) |
| 65 to 74 Years | 0 (0.0%) | 3 (30.0%) |
| 75 Years and over | 0 (0.0%) | 3 (27.3%) |
Technology Access in Ellisburg
Computing Device Access in Ellisburg
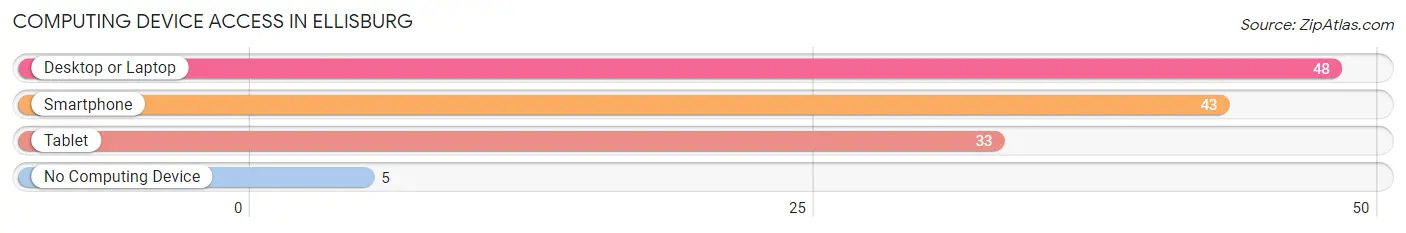
| Device Type | # Households | % Households |
| Desktop or Laptop | 48 | 84.2% |
| Smartphone | 43 | 75.4% |
| Tablet | 33 | 57.9% |
| No Computing Device | 5 | 8.8% |
| Total | 57 | 100.0% |
Internet Access in Ellisburg
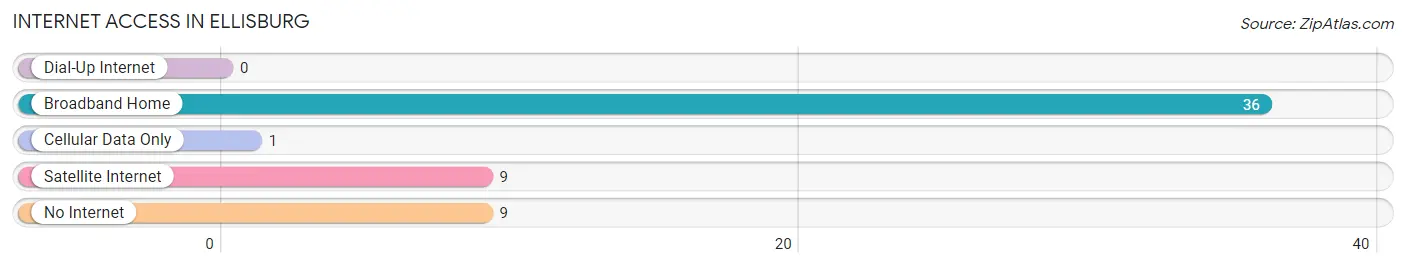
| Internet Type | # Households | % Households |
| Dial-Up Internet | 0 | 0.0% |
| Broadband Home | 36 | 63.2% |
| Cellular Data Only | 1 | 1.8% |
| Satellite Internet | 9 | 15.8% |
| No Internet | 9 | 15.8% |
| Total | 57 | 100.0% |
Ellisburg Summary
Ellisburg is a town located in the northern part of Jefferson County, New York, United States. The population was 1,845 at the 2010 census. The town is named after Richard Ellis, an early settler.
History
The town of Ellisburg was formed in 1802 from the town of Champion. The town was named after Richard Ellis, an early settler. The first settlers arrived in the area in 1797. The first school was built in 1803 and the first church was built in 1805.
In 1810, the town had a population of 1,845. The town was a major agricultural center in the 19th century, with many farms producing wheat, corn, and other crops.
In the late 19th century, the town was home to several industries, including a sawmill, a gristmill, a tannery, and a cheese factory. The town also had a railroad station, which was used to transport goods to and from the town.
Geography
Ellisburg is located in the northern part of Jefferson County, New York. The town is bordered by the towns of Champion to the north, Lyme to the east, Henderson to the south, and Adams to the west.
The town is located on the eastern shore of Lake Ontario. The eastern part of the town is hilly, while the western part is flat. The highest point in the town is an unnamed hill, which has an elevation of 890 feet (271 m).
The town has several small streams, including the Black River, which flows through the town from north to south.
Economy
The economy of Ellisburg is largely based on agriculture. The town is home to several farms, which produce a variety of crops, including wheat, corn, and hay.
The town also has several small businesses, including a grocery store, a hardware store, and a gas station.
Demographics
As of the 2010 census, there were 1,845 people, 717 households, and 517 families living in the town. The population density was 44.3 people per square mile (17.1/km2). There were 817 housing units at an average density of 19.6 per square mile (7.6/km2).
The racial makeup of the town was 97.3% White, 0.3% African American, 0.2% Native American, 0.2% Asian, 0.1% Pacific Islander, 0.6% from other races, and 1.3% from two or more races. Hispanic or Latino of any race were 1.7% of the population.
There were 717 households, out of which 32.2% had children under the age of 18 living with them, 54.2% were married couples living together, 10.7% had a female householder with no husband present, and 29.7% were non-families. 24.2% of all households were made up of individuals, and 10.2% had someone living alone who was 65 years of age or older. The average household size was 2.56 and the average family size was 3.03.
In the town, the population was spread out, with 25.7% under the age of 18, 6.7% from 18 to 24, 28.2% from 25 to 44, 25.2% from 45 to 64, and 14.2% who were 65 years of age or older. The median age was 38 years. For every 100 females, there were 97.2 males. For every 100 females age 18 and over, there were 94.2 males.
The median income for a household in the town was $37,500, and the median income for a family was $45,000. Males had a median income of $31,250 versus $25,000 for females. The per capita income for the town was $17,945. About 8.2% of families and 11.2% of the population were below the poverty line, including 14.2% of those under age 18 and 8.2% of those age 65 or over.
Common Questions
What is Per Capita Income in Ellisburg?
Per Capita income in Ellisburg is $24,010.
What is the Median Family Income in Ellisburg?
Median Family Income in Ellisburg is $85,833.
What is the Median Household income in Ellisburg?
Median Household Income in Ellisburg is $62,083.
What is Inequality or Gini Index in Ellisburg?
Inequality or Gini Index in Ellisburg is 0.38.
What is the Total Population of Ellisburg?
Total Population of Ellisburg is 188.
What is the Total Male Population of Ellisburg?
Total Male Population of Ellisburg is 87.
What is the Total Female Population of Ellisburg?
Total Female Population of Ellisburg is 101.
What is the Ratio of Males per 100 Females in Ellisburg?
There are 86.14 Males per 100 Females in Ellisburg.
What is the Ratio of Females per 100 Males in Ellisburg?
There are 116.09 Females per 100 Males in Ellisburg.
What is the Median Population Age in Ellisburg?
Median Population Age in Ellisburg is 34.9 Years.
What is the Average Family Size in Ellisburg
Average Family Size in Ellisburg is 4.1 People.
What is the Average Household Size in Ellisburg
Average Household Size in Ellisburg is 3.3 People.
How Large is the Labor Force in Ellisburg?
There are 52 People in the Labor Forcein in Ellisburg.
What is the Percentage of People in the Labor Force in Ellisburg?
44.8% of People are in the Labor Force in Ellisburg.
What is the Unemployment Rate in Ellisburg?
Unemployment Rate in Ellisburg is 13.5%.