Blue Point, NY Map & Demographics
Blue Point Map
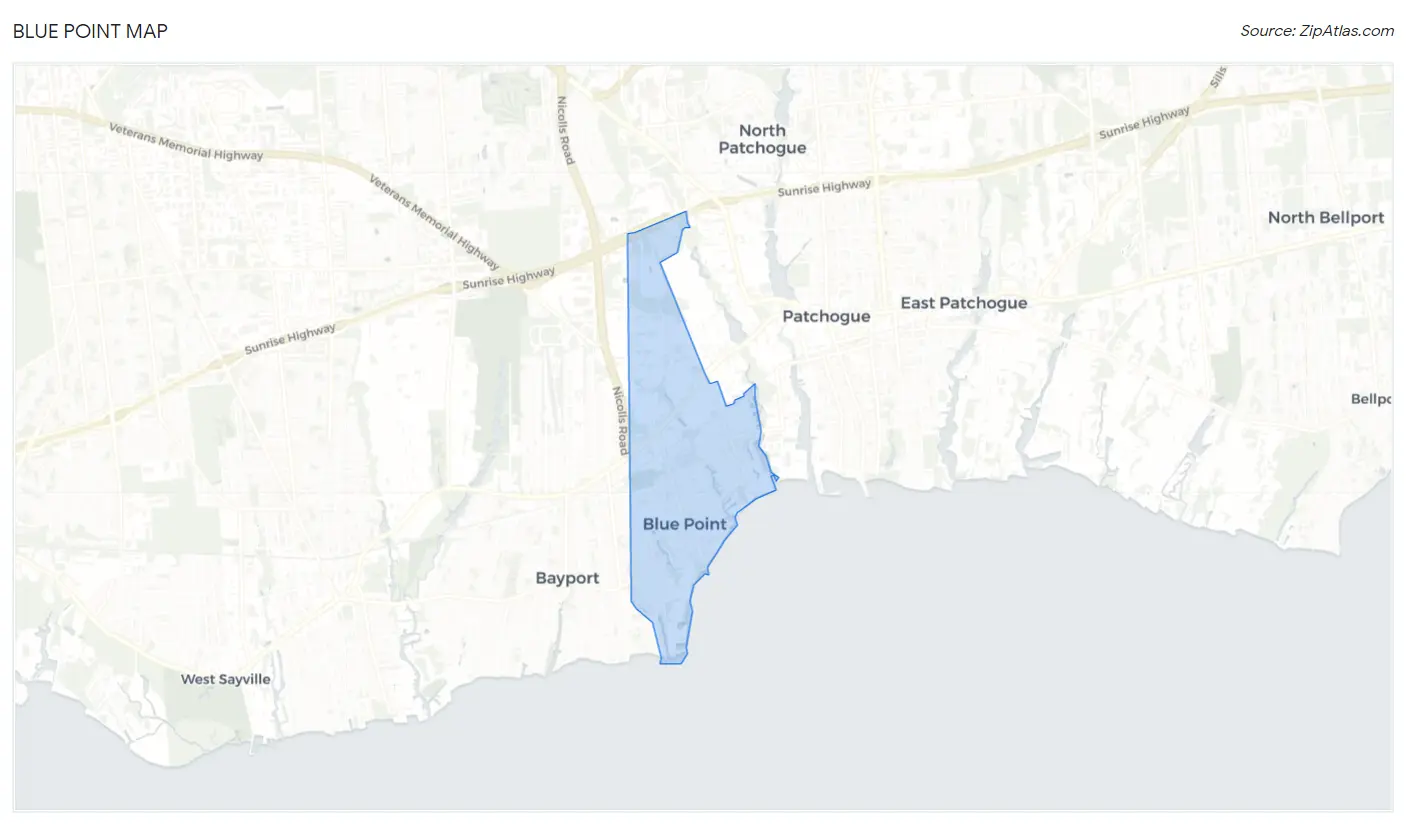
Blue Point Overview
$58,968
PER CAPITA INCOME
$159,068
AVG FAMILY INCOME
$126,818
AVG HOUSEHOLD INCOME
31.2%
WAGE / INCOME GAP [ % ]
68.8¢/ $1
WAGE / INCOME GAP [ $ ]
0.39
INEQUALITY / GINI INDEX
4,616
TOTAL POPULATION
2,109
MALE POPULATION
2,507
FEMALE POPULATION
84.12
MALES / 100 FEMALES
118.87
FEMALES / 100 MALES
46.8
MEDIAN AGE
2.9
AVG FAMILY SIZE
2.3
AVG HOUSEHOLD SIZE
2,586
LABOR FORCE [ PEOPLE ]
66.8%
PERCENT IN LABOR FORCE
8.4%
UNEMPLOYMENT RATE
Blue Point Zip Codes
Blue Point Area Codes
Income in Blue Point
Income Overview in Blue Point
Per Capita Income in Blue Point is $58,968, while median incomes of families and households are $159,068 and $126,818 respectively.
| Characteristic | Number | Measure |
| Per Capita Income | 4,616 | $58,968 |
| Median Family Income | 1,329 | $159,068 |
| Mean Family Income | 1,329 | $164,197 |
| Median Household Income | 1,958 | $126,818 |
| Mean Household Income | 1,958 | $137,294 |
| Income Deficit | 1,329 | $0 |
| Wage / Income Gap (%) | 4,616 | 31.19% |
| Wage / Income Gap ($) | 4,616 | 68.81¢ per $1 |
| Gini / Inequality Index | 4,616 | 0.39 |
Earnings by Sex in Blue Point
Average Earnings in Blue Point are $62,986, $85,135 for men and $58,582 for women, a difference of 31.2%.
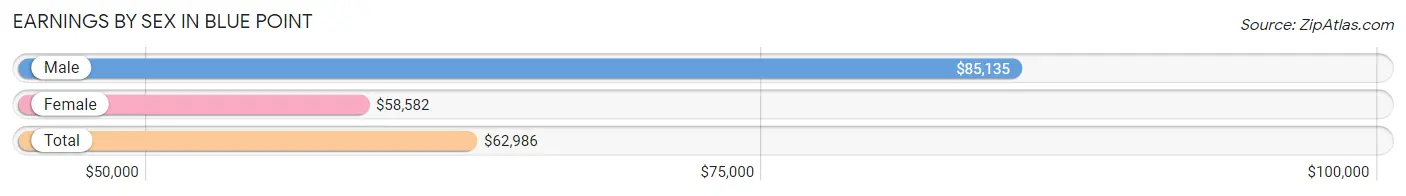
| Sex | Number | Average Earnings |
| Male | 1,360 (51.8%) | $85,135 |
| Female | 1,267 (48.2%) | $58,582 |
| Total | 2,627 (100.0%) | $62,986 |
Earnings by Sex by Income Bracket in Blue Point
The most common earnings brackets in Blue Point are $100,000+ for men (555 | 40.8%) and $100,000+ for women (446 | 35.2%).
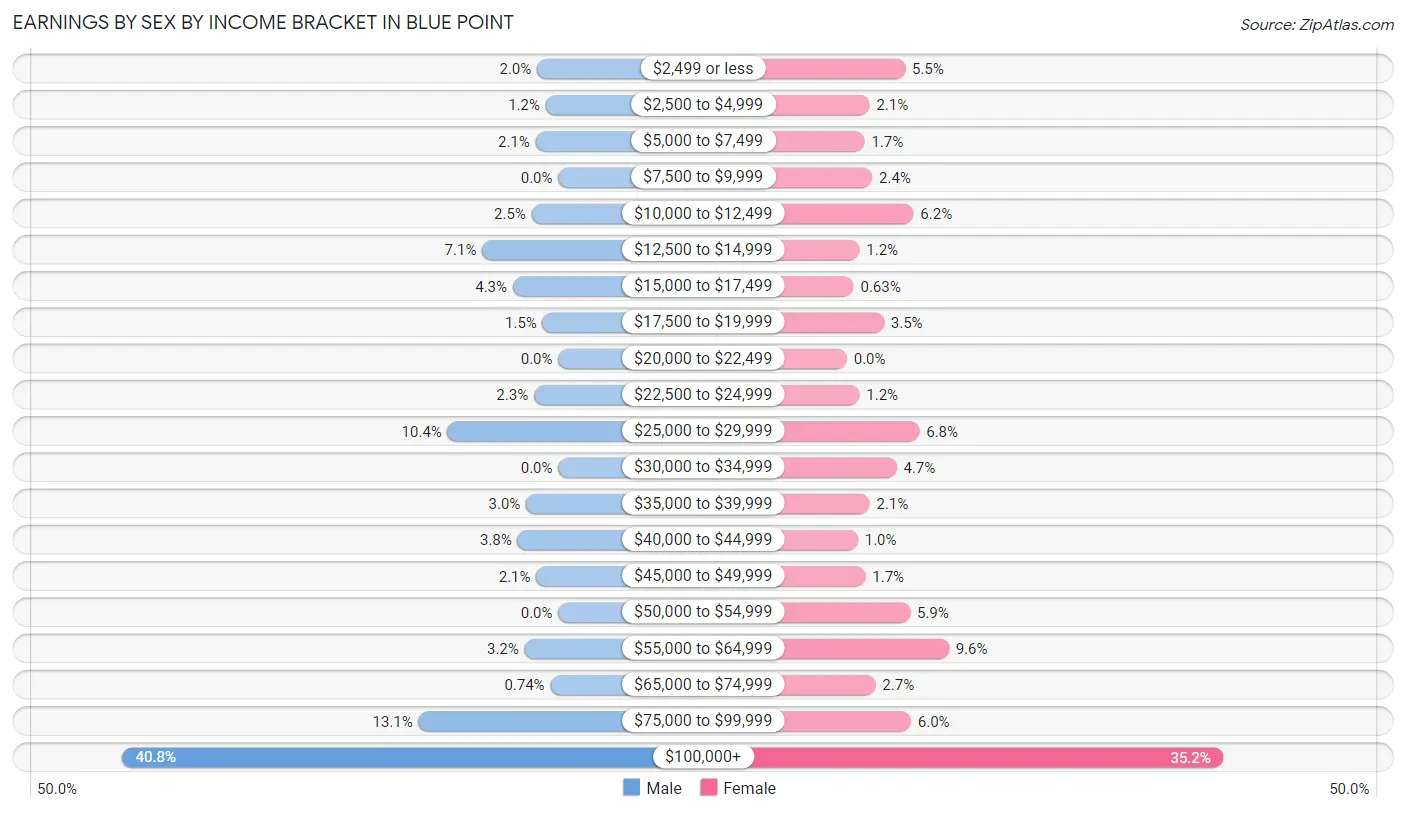
| Income | Male | Female |
| $2,499 or less | 27 (2.0%) | 69 (5.4%) |
| $2,500 to $4,999 | 16 (1.2%) | 27 (2.1%) |
| $5,000 to $7,499 | 29 (2.1%) | 21 (1.7%) |
| $7,500 to $9,999 | 0 (0.0%) | 30 (2.4%) |
| $10,000 to $12,499 | 34 (2.5%) | 79 (6.2%) |
| $12,500 to $14,999 | 97 (7.1%) | 15 (1.2%) |
| $15,000 to $17,499 | 58 (4.3%) | 8 (0.6%) |
| $17,500 to $19,999 | 20 (1.5%) | 44 (3.5%) |
| $20,000 to $22,499 | 0 (0.0%) | 0 (0.0%) |
| $22,500 to $24,999 | 31 (2.3%) | 15 (1.2%) |
| $25,000 to $29,999 | 141 (10.4%) | 86 (6.8%) |
| $30,000 to $34,999 | 0 (0.0%) | 59 (4.7%) |
| $35,000 to $39,999 | 41 (3.0%) | 27 (2.1%) |
| $40,000 to $44,999 | 52 (3.8%) | 13 (1.0%) |
| $45,000 to $49,999 | 28 (2.1%) | 22 (1.7%) |
| $50,000 to $54,999 | 0 (0.0%) | 75 (5.9%) |
| $55,000 to $64,999 | 43 (3.2%) | 121 (9.6%) |
| $65,000 to $74,999 | 10 (0.7%) | 34 (2.7%) |
| $75,000 to $99,999 | 178 (13.1%) | 76 (6.0%) |
| $100,000+ | 555 (40.8%) | 446 (35.2%) |
| Total | 1,360 (100.0%) | 1,267 (100.0%) |
Earnings by Sex by Educational Attainment in Blue Point
Average earnings in Blue Point are $90,403 for men and $59,345 for women, a difference of 34.4%. Men with an educational attainment of graduate degree enjoy the highest average annual earnings of $155,375, while those with high school diploma education earn the least with $41,845. Women with an educational attainment of graduate degree earn the most with the average annual earnings of $104,028, while those with high school diploma education have the smallest earnings of $48,409.
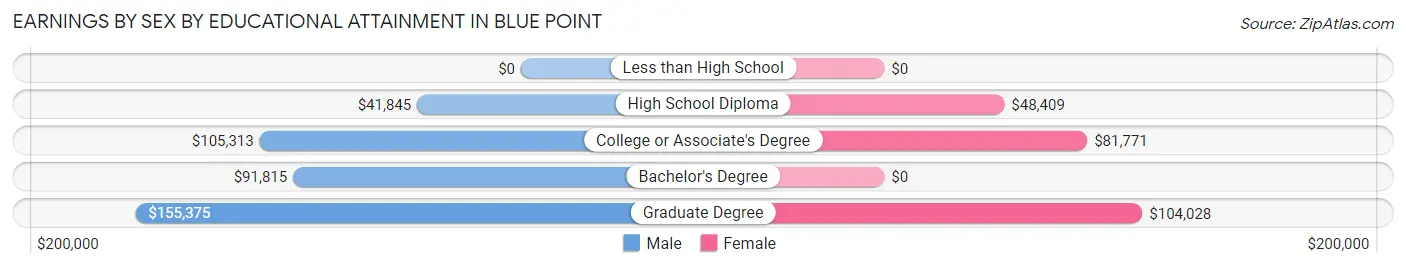
| Educational Attainment | Male Income | Female Income |
| Less than High School | - | - |
| High School Diploma | $41,845 | $48,409 |
| College or Associate's Degree | $105,313 | $81,771 |
| Bachelor's Degree | $91,815 | $0 |
| Graduate Degree | $155,375 | $104,028 |
| Total | $90,403 | $59,345 |
Family Income in Blue Point
Family Income Brackets in Blue Point
According to the Blue Point family income data, there are 415 families falling into the $150,000 to $199,999 income range, which is the most common income bracket and makes up 31.2% of all families.
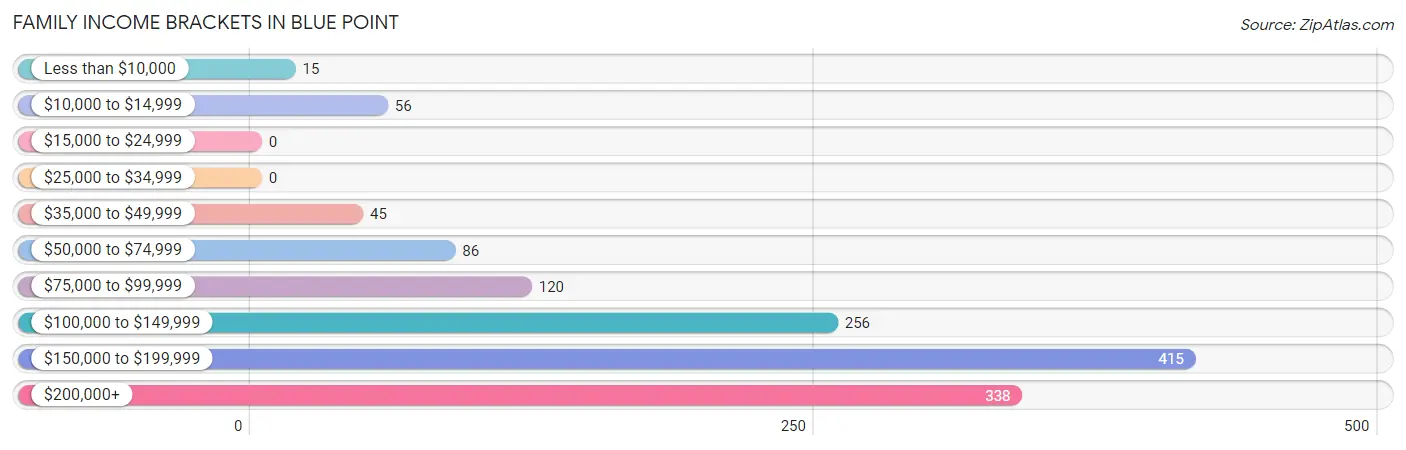
| Income Bracket | # Families | % Families |
| Less than $10,000 | 15 | 1.1% |
| $10,000 to $14,999 | 56 | 4.2% |
| $15,000 to $24,999 | 0 | 0.0% |
| $25,000 to $34,999 | 0 | 0.0% |
| $35,000 to $49,999 | 45 | 3.4% |
| $50,000 to $74,999 | 86 | 6.5% |
| $75,000 to $99,999 | 120 | 9.0% |
| $100,000 to $149,999 | 256 | 19.3% |
| $150,000 to $199,999 | 415 | 31.2% |
| $200,000+ | 338 | 25.4% |
Family Income by Famaliy Size in Blue Point
4-person families (272 | 20.5%) account for the highest median family income in Blue Point with $179,615 per family, while 2-person families (733 | 55.1%) have the highest median income of $79,341 per family member.
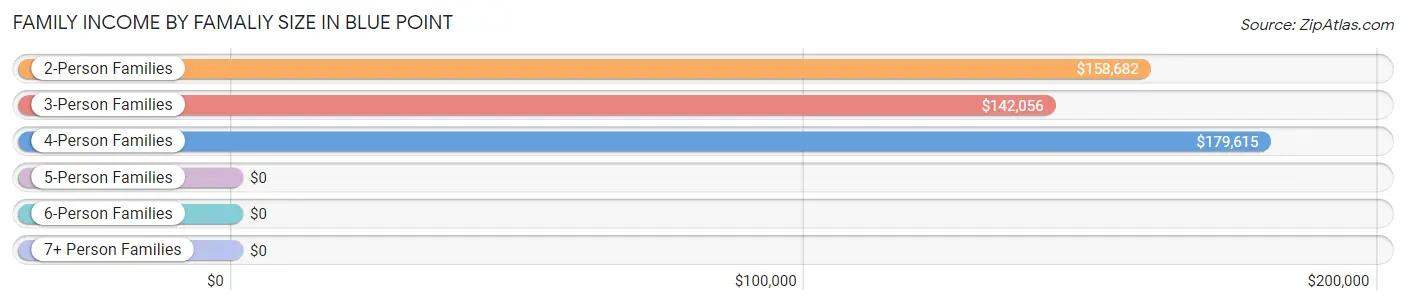
| Income Bracket | # Families | Median Income |
| 2-Person Families | 733 (55.1%) | $158,682 |
| 3-Person Families | 225 (16.9%) | $142,056 |
| 4-Person Families | 272 (20.5%) | $179,615 |
| 5-Person Families | 88 (6.6%) | $0 |
| 6-Person Families | 11 (0.8%) | $0 |
| 7+ Person Families | 0 (0.0%) | $0 |
| Total | 1,329 (100.0%) | $159,068 |
Family Income by Number of Earners in Blue Point
The median family income in Blue Point is $159,068, with families comprising 3+ earners (102) having the highest median family income of $199,545, while families with no earners (215) have the lowest median family income of $125,179, accounting for 7.7% and 16.2% of families, respectively.

| Number of Earners | # Families | Median Income |
| No Earners | 215 (16.2%) | $125,179 |
| 1 Earner | 321 (24.1%) | $155,795 |
| 2 Earners | 691 (52.0%) | $172,212 |
| 3+ Earners | 102 (7.7%) | $199,545 |
| Total | 1,329 (100.0%) | $159,068 |
Household Income in Blue Point
Household Income Brackets in Blue Point
With 444 households falling in the category, the $150,000 to $199,999 income range is the most frequent in Blue Point, accounting for 22.7% of all households. In contrast, only 22 households (1.1%) fall into the less than $10,000 income bracket, making it the least populous group.
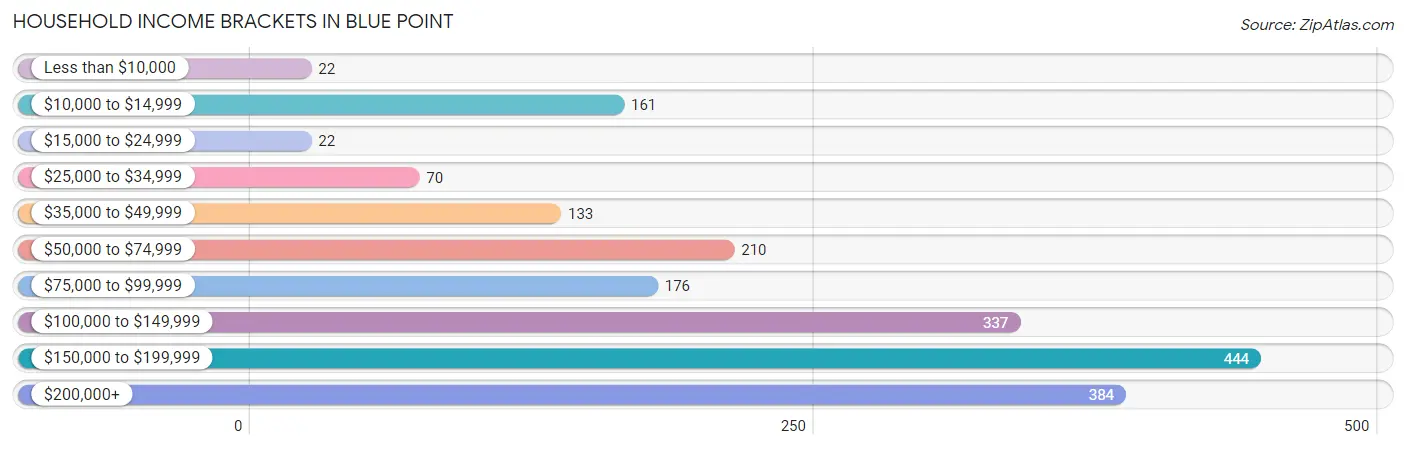
| Income Bracket | # Households | % Households |
| Less than $10,000 | 22 | 1.1% |
| $10,000 to $14,999 | 161 | 8.2% |
| $15,000 to $24,999 | 22 | 1.1% |
| $25,000 to $34,999 | 70 | 3.6% |
| $35,000 to $49,999 | 133 | 6.8% |
| $50,000 to $74,999 | 210 | 10.7% |
| $75,000 to $99,999 | 176 | 9.0% |
| $100,000 to $149,999 | 337 | 17.2% |
| $150,000 to $199,999 | 444 | 22.7% |
| $200,000+ | 384 | 19.6% |
Household Income by Householder Age in Blue Point
The median household income in Blue Point is $126,818, with the highest median household income of $157,056 found in the 45 to 64 years age bracket for the primary householder. A total of 832 households (42.5%) fall into this category.
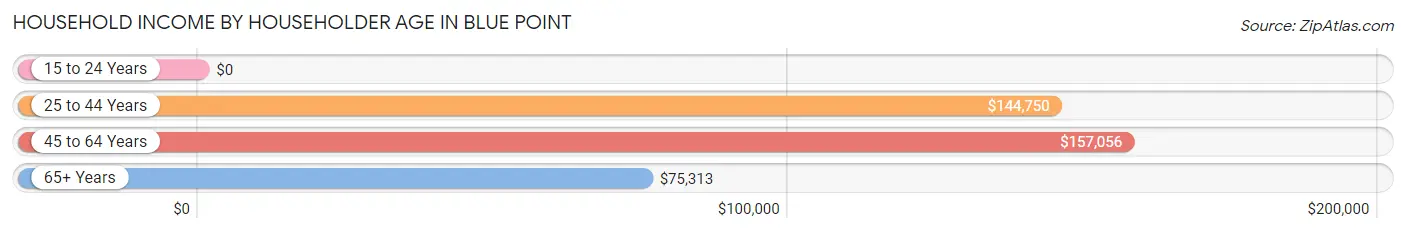
| Income Bracket | # Households | Median Income |
| 15 to 24 Years | 0 (0.0%) | $0 |
| 25 to 44 Years | 494 (25.2%) | $144,750 |
| 45 to 64 Years | 832 (42.5%) | $157,056 |
| 65+ Years | 632 (32.3%) | $75,313 |
| Total | 1,958 (100.0%) | $126,818 |
Poverty in Blue Point
Income Below Poverty by Sex and Age in Blue Point
With 4.2% poverty level for males and 8.7% for females among the residents of Blue Point, 65 to 74 year old males and 75 year old and over females are the most vulnerable to poverty, with 88 males (33.2%) and 77 females (28.4%) in their respective age groups living below the poverty level.
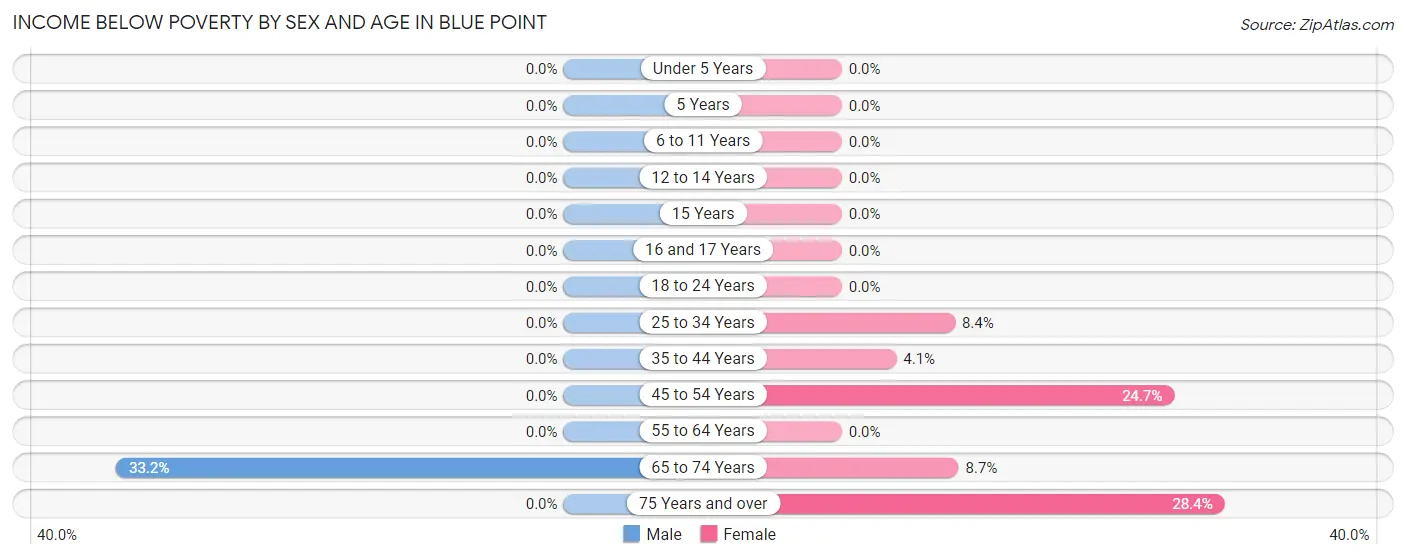
| Age Bracket | Male | Female |
| Under 5 Years | 0 (0.0%) | 0 (0.0%) |
| 5 Years | 0 (0.0%) | 0 (0.0%) |
| 6 to 11 Years | 0 (0.0%) | 0 (0.0%) |
| 12 to 14 Years | 0 (0.0%) | 0 (0.0%) |
| 15 Years | 0 (0.0%) | 0 (0.0%) |
| 16 and 17 Years | 0 (0.0%) | 0 (0.0%) |
| 18 to 24 Years | 0 (0.0%) | 0 (0.0%) |
| 25 to 34 Years | 0 (0.0%) | 21 (8.4%) |
| 35 to 44 Years | 0 (0.0%) | 13 (4.1%) |
| 45 to 54 Years | 0 (0.0%) | 78 (24.7%) |
| 55 to 64 Years | 0 (0.0%) | 0 (0.0%) |
| 65 to 74 Years | 88 (33.2%) | 28 (8.7%) |
| 75 Years and over | 0 (0.0%) | 77 (28.4%) |
| Total | 88 (4.2%) | 217 (8.7%) |
Income Above Poverty by Sex and Age in Blue Point
According to the poverty statistics in Blue Point, males aged under 5 years and females aged under 5 years are the age groups that are most secure financially, with 100.0% of males and 100.0% of females in these age groups living above the poverty line.
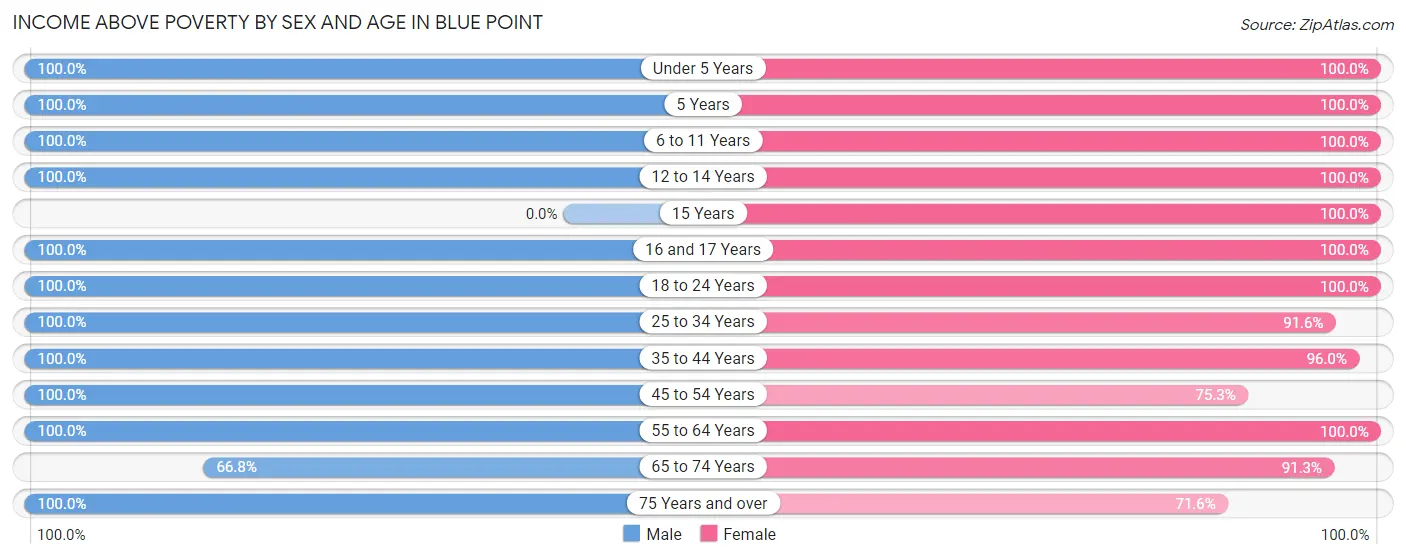
| Age Bracket | Male | Female |
| Under 5 Years | 24 (100.0%) | 98 (100.0%) |
| 5 Years | 31 (100.0%) | 20 (100.0%) |
| 6 to 11 Years | 154 (100.0%) | 207 (100.0%) |
| 12 to 14 Years | 60 (100.0%) | 136 (100.0%) |
| 15 Years | 0 (0.0%) | 15 (100.0%) |
| 16 and 17 Years | 90 (100.0%) | 37 (100.0%) |
| 18 to 24 Years | 181 (100.0%) | 57 (100.0%) |
| 25 to 34 Years | 196 (100.0%) | 229 (91.6%) |
| 35 to 44 Years | 275 (100.0%) | 308 (96.0%) |
| 45 to 54 Years | 253 (100.0%) | 238 (75.3%) |
| 55 to 64 Years | 392 (100.0%) | 456 (100.0%) |
| 65 to 74 Years | 177 (66.8%) | 295 (91.3%) |
| 75 Years and over | 188 (100.0%) | 194 (71.6%) |
| Total | 2,021 (95.8%) | 2,290 (91.3%) |
Income Below Poverty Among Married-Couple Families in Blue Point
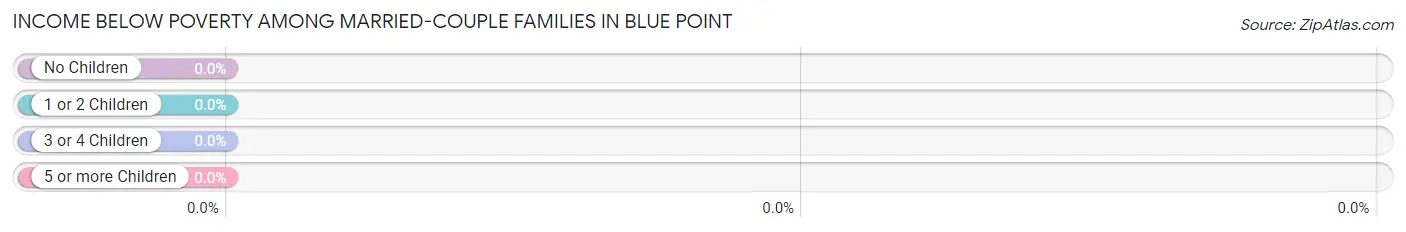
| Children | Above Poverty | Below Poverty |
| No Children | 674 (100.0%) | 0 (0.0%) |
| 1 or 2 Children | 387 (100.0%) | 0 (0.0%) |
| 3 or 4 Children | 57 (100.0%) | 0 (0.0%) |
| 5 or more Children | 0 (0.0%) | 0 (0.0%) |
| Total | 1,118 (100.0%) | 0 (0.0%) |
Income Below Poverty Among Single-Parent Households in Blue Point
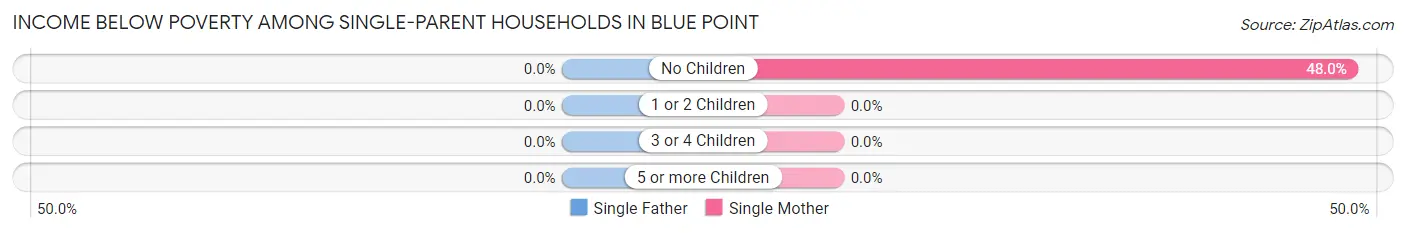
| Children | Single Father | Single Mother |
| No Children | 0 (0.0%) | 70 (47.9%) |
| 1 or 2 Children | 0 (0.0%) | 0 (0.0%) |
| 3 or 4 Children | 0 (0.0%) | 0 (0.0%) |
| 5 or more Children | 0 (0.0%) | 0 (0.0%) |
| Total | 0 (0.0%) | 70 (47.9%) |
Income Below Poverty Among Married-Couple vs Single-Parent Households in Blue Point
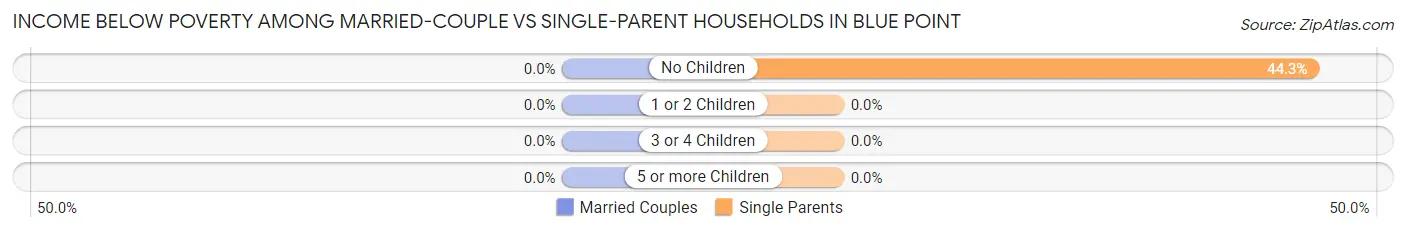
| Children | Married-Couple Families | Single-Parent Households |
| No Children | 0 (0.0%) | 70 (44.3%) |
| 1 or 2 Children | 0 (0.0%) | 0 (0.0%) |
| 3 or 4 Children | 0 (0.0%) | 0 (0.0%) |
| 5 or more Children | 0 (0.0%) | 0 (0.0%) |
| Total | 0 (0.0%) | 70 (33.2%) |
Race in Blue Point
The most populous races in Blue Point are White / Caucasian (4,450 | 96.4%), Hispanic or Latino (211 | 4.6%), and Some other Race (56 | 1.2%).
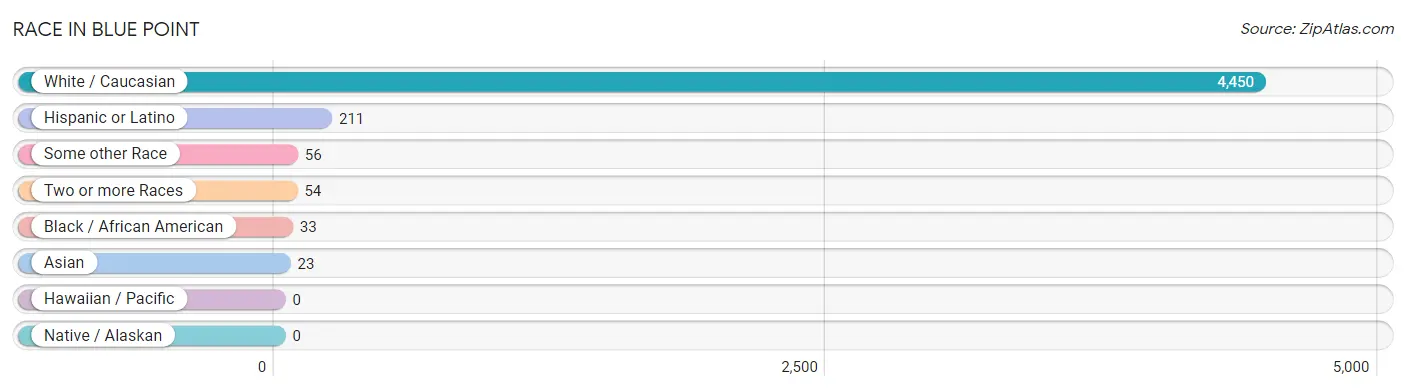
| Race | # Population | % Population |
| Asian | 23 | 0.5% |
| Black / African American | 33 | 0.7% |
| Hawaiian / Pacific | 0 | 0.0% |
| Hispanic or Latino | 211 | 4.6% |
| Native / Alaskan | 0 | 0.0% |
| White / Caucasian | 4,450 | 96.4% |
| Two or more Races | 54 | 1.2% |
| Some other Race | 56 | 1.2% |
| Total | 4,616 | 100.0% |
Ancestry in Blue Point
The most populous ancestries reported in Blue Point are Italian (1,289 | 27.9%), Irish (1,176 | 25.5%), German (961 | 20.8%), English (390 | 8.5%), and Polish (265 | 5.7%), together accounting for 88.4% of all Blue Point residents.
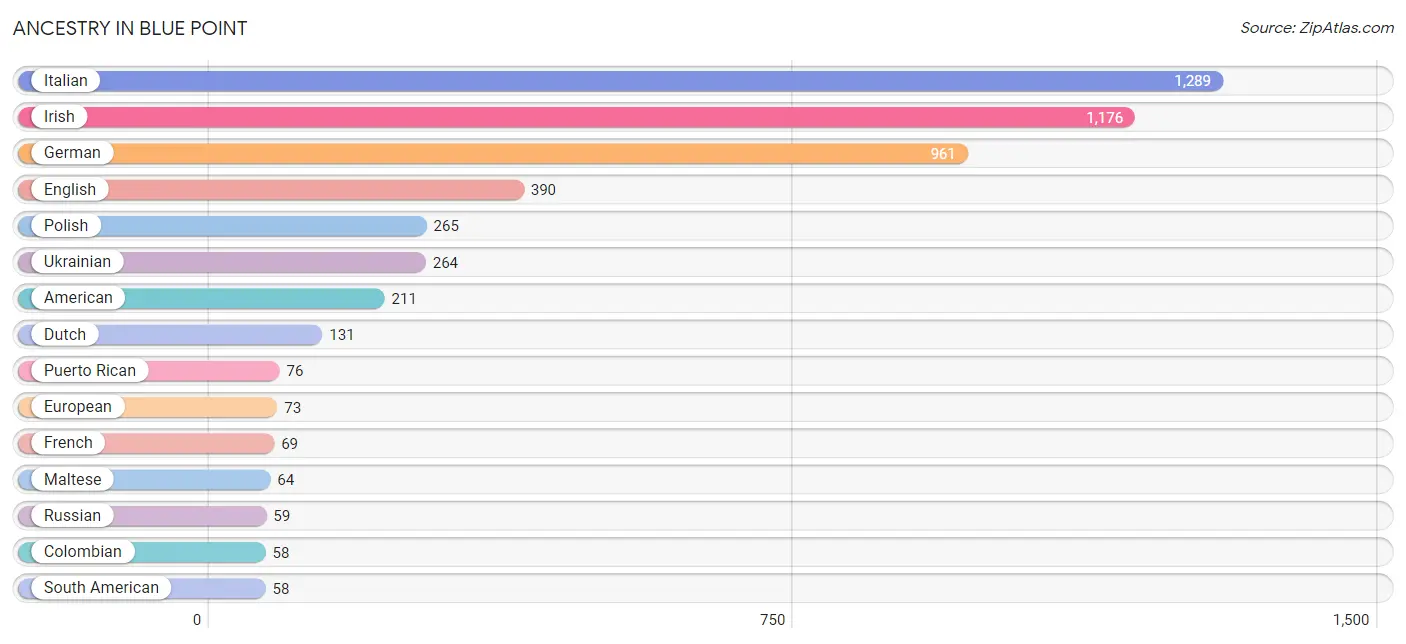
| Ancestry | # Population | % Population |
| Albanian | 8 | 0.2% |
| American | 211 | 4.6% |
| Canadian | 9 | 0.2% |
| Colombian | 58 | 1.3% |
| Czechoslovakian | 11 | 0.2% |
| Danish | 7 | 0.2% |
| Dominican | 26 | 0.6% |
| Dutch | 131 | 2.8% |
| English | 390 | 8.5% |
| European | 73 | 1.6% |
| French | 69 | 1.5% |
| German | 961 | 20.8% |
| Greek | 40 | 0.9% |
| Indian (Asian) | 23 | 0.5% |
| Irish | 1,176 | 25.5% |
| Italian | 1,289 | 27.9% |
| Latvian | 7 | 0.2% |
| Lithuanian | 17 | 0.4% |
| Maltese | 64 | 1.4% |
| Mexican | 16 | 0.4% |
| Northern European | 37 | 0.8% |
| Norwegian | 8 | 0.2% |
| Polish | 265 | 5.7% |
| Puerto Rican | 76 | 1.7% |
| Russian | 59 | 1.3% |
| Scotch-Irish | 43 | 0.9% |
| Scottish | 47 | 1.0% |
| South American | 58 | 1.3% |
| Spaniard | 16 | 0.4% |
| Ukrainian | 264 | 5.7% |
| West Indian | 7 | 0.2% | View All 31 Rows |
Immigrants in Blue Point
The most numerous immigrant groups reported in Blue Point came from Europe (147 | 3.2%), Eastern Europe (96 | 2.1%), Colombia (56 | 1.2%), Latin America (56 | 1.2%), and South America (56 | 1.2%), together accounting for 8.9% of all Blue Point residents.
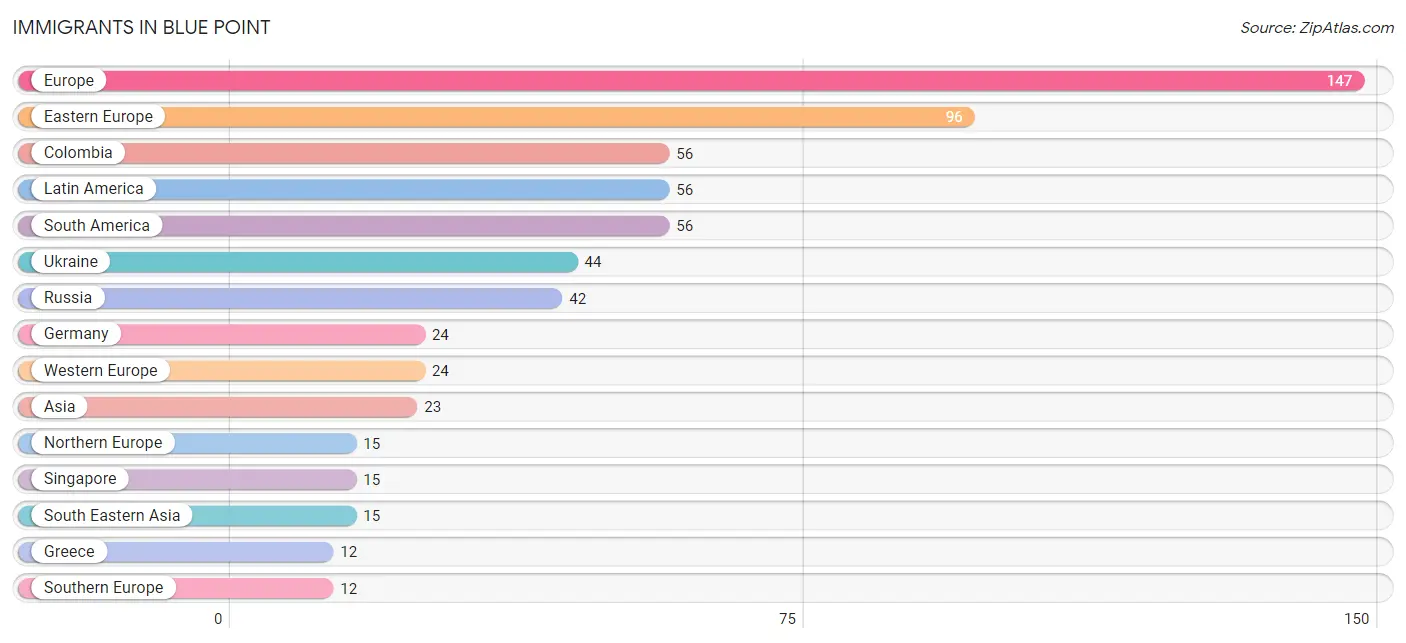
| Immigration Origin | # Population | % Population |
| Asia | 23 | 0.5% |
| China | 8 | 0.2% |
| Colombia | 56 | 1.2% |
| Eastern Asia | 8 | 0.2% |
| Eastern Europe | 96 | 2.1% |
| Europe | 147 | 3.2% |
| Germany | 24 | 0.5% |
| Greece | 12 | 0.3% |
| Latin America | 56 | 1.2% |
| Northern Europe | 15 | 0.3% |
| Russia | 42 | 0.9% |
| Singapore | 15 | 0.3% |
| South America | 56 | 1.2% |
| South Eastern Asia | 15 | 0.3% |
| Southern Europe | 12 | 0.3% |
| Ukraine | 44 | 0.9% |
| Western Europe | 24 | 0.5% | View All 17 Rows |
Sex and Age in Blue Point
Sex and Age in Blue Point
The most populous age groups in Blue Point are 60 to 64 Years (259 | 12.3%) for men and 60 to 64 Years (325 | 13.0%) for women.
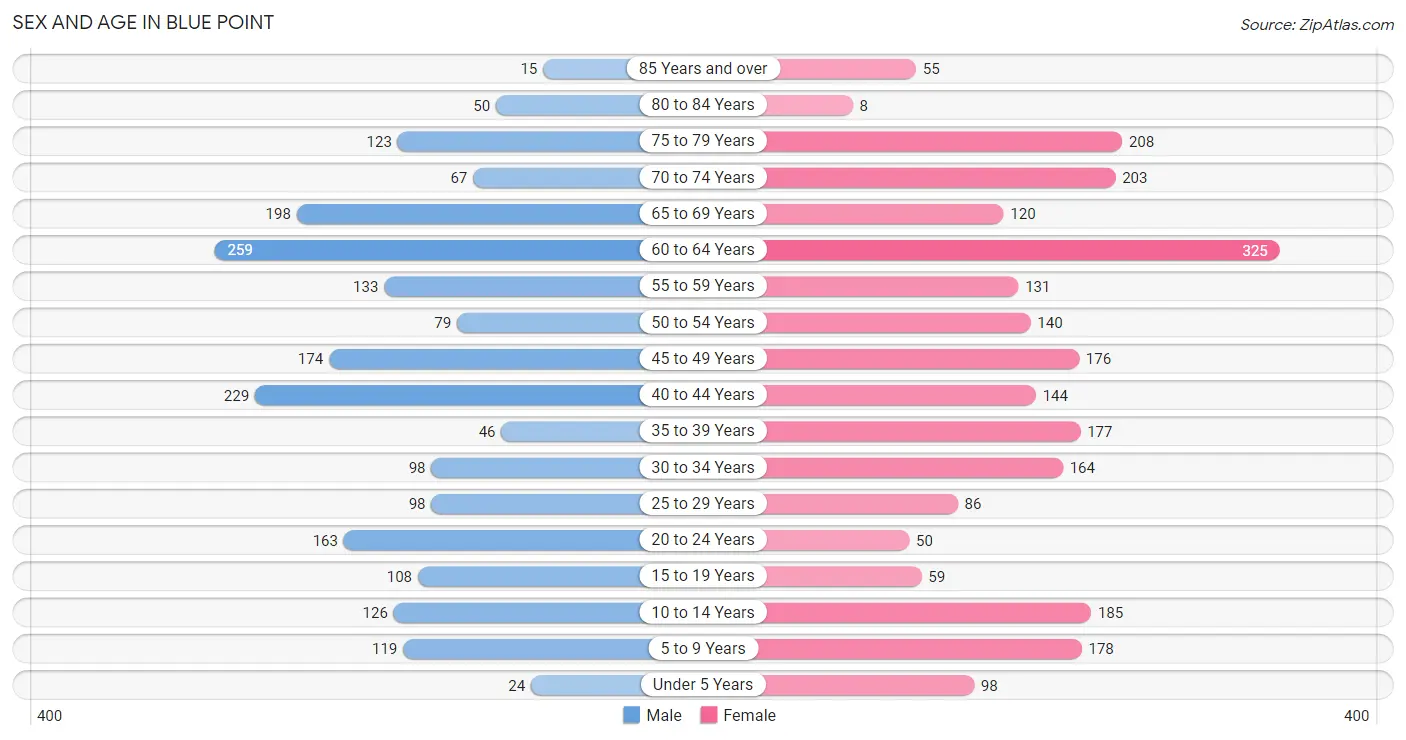
| Age Bracket | Male | Female |
| Under 5 Years | 24 (1.1%) | 98 (3.9%) |
| 5 to 9 Years | 119 (5.6%) | 178 (7.1%) |
| 10 to 14 Years | 126 (6.0%) | 185 (7.4%) |
| 15 to 19 Years | 108 (5.1%) | 59 (2.4%) |
| 20 to 24 Years | 163 (7.7%) | 50 (2.0%) |
| 25 to 29 Years | 98 (4.6%) | 86 (3.4%) |
| 30 to 34 Years | 98 (4.6%) | 164 (6.5%) |
| 35 to 39 Years | 46 (2.2%) | 177 (7.1%) |
| 40 to 44 Years | 229 (10.9%) | 144 (5.7%) |
| 45 to 49 Years | 174 (8.3%) | 176 (7.0%) |
| 50 to 54 Years | 79 (3.7%) | 140 (5.6%) |
| 55 to 59 Years | 133 (6.3%) | 131 (5.2%) |
| 60 to 64 Years | 259 (12.3%) | 325 (13.0%) |
| 65 to 69 Years | 198 (9.4%) | 120 (4.8%) |
| 70 to 74 Years | 67 (3.2%) | 203 (8.1%) |
| 75 to 79 Years | 123 (5.8%) | 208 (8.3%) |
| 80 to 84 Years | 50 (2.4%) | 8 (0.3%) |
| 85 Years and over | 15 (0.7%) | 55 (2.2%) |
| Total | 2,109 (100.0%) | 2,507 (100.0%) |
Families and Households in Blue Point
Median Family Size in Blue Point
The median family size in Blue Point is 2.91 persons per family, with married-couple families (1,118 | 84.1%) accounting for the largest median family size of 3.01 persons per family. On the other hand, single female/mother families (146 | 11.0%) represent the smallest median family size with 2.23 persons per family.
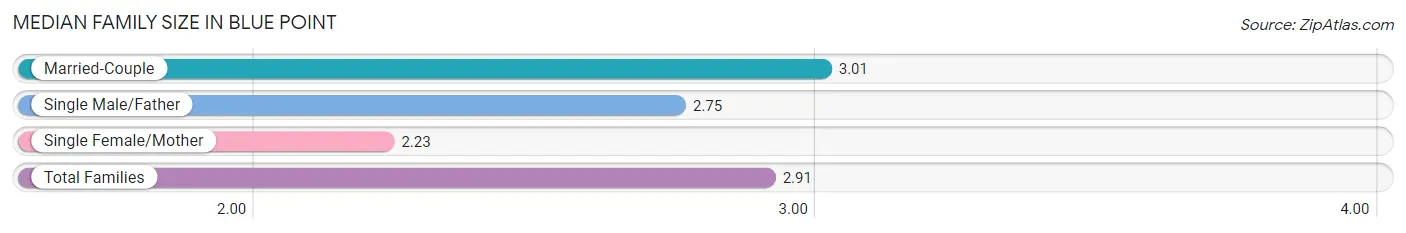
| Family Type | # Families | Family Size |
| Married-Couple | 1,118 (84.1%) | 3.01 |
| Single Male/Father | 65 (4.9%) | 2.75 |
| Single Female/Mother | 146 (11.0%) | 2.23 |
| Total Families | 1,329 (100.0%) | 2.91 |
Median Household Size in Blue Point
The median household size in Blue Point is 2.33 persons per household, with married-couple households (1,118 | 57.1%) accounting for the largest median household size of 3.01 persons per household. non-family households (629 | 32.1%) represent the smallest median household size with 1.12 persons per household.
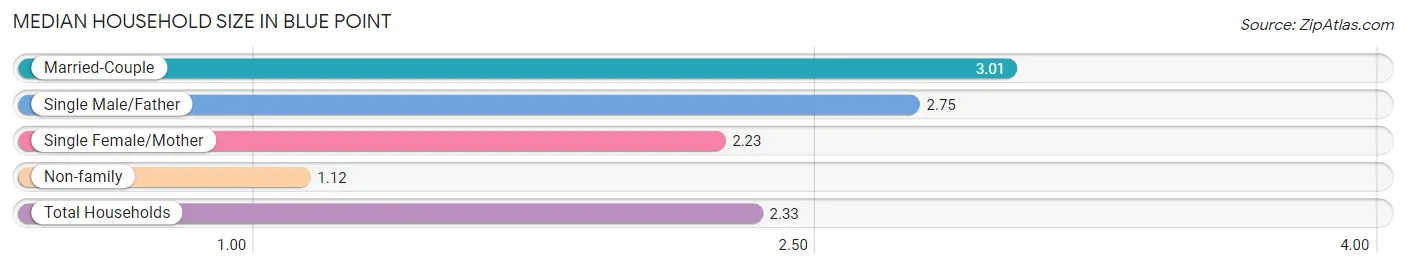
| Household Type | # Households | Household Size |
| Married-Couple | 1,118 (57.1%) | 3.01 |
| Single Male/Father | 65 (3.3%) | 2.75 |
| Single Female/Mother | 146 (7.5%) | 2.23 |
| Non-family | 629 (32.1%) | 1.12 |
| Total Households | 1,958 (100.0%) | 2.33 |
Household Size by Marriage Status in Blue Point
Out of a total of 1,958 households in Blue Point, 1,329 (67.9%) are family households, while 629 (32.1%) are nonfamily households. The most numerous type of family households are 2-person households, comprising 733, and the most common type of nonfamily households are 1-person households, comprising 555.
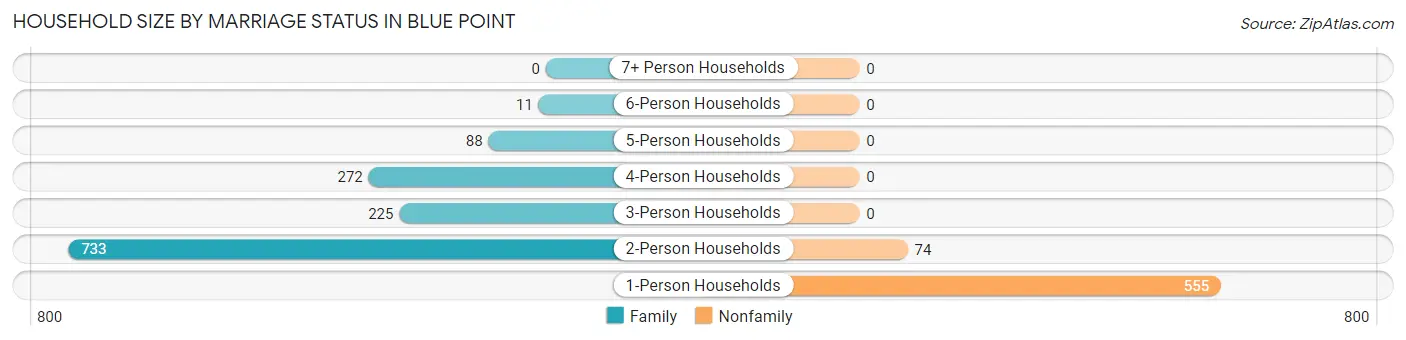
| Household Size | Family Households | Nonfamily Households |
| 1-Person Households | - | 555 (28.3%) |
| 2-Person Households | 733 (37.4%) | 74 (3.8%) |
| 3-Person Households | 225 (11.5%) | 0 (0.0%) |
| 4-Person Households | 272 (13.9%) | 0 (0.0%) |
| 5-Person Households | 88 (4.5%) | 0 (0.0%) |
| 6-Person Households | 11 (0.6%) | 0 (0.0%) |
| 7+ Person Households | 0 (0.0%) | 0 (0.0%) |
| Total | 1,329 (67.9%) | 629 (32.1%) |
Female Fertility in Blue Point
Fertility by Age in Blue Point
Average fertility rate in Blue Point is 53.0 births per 1,000 women. Women in the age bracket of 20 to 34 years have the highest fertility rate with 60.0 births per 1,000 women. Women in the age bracket of 35 to 50 years acount for 61.7% of all women with births.
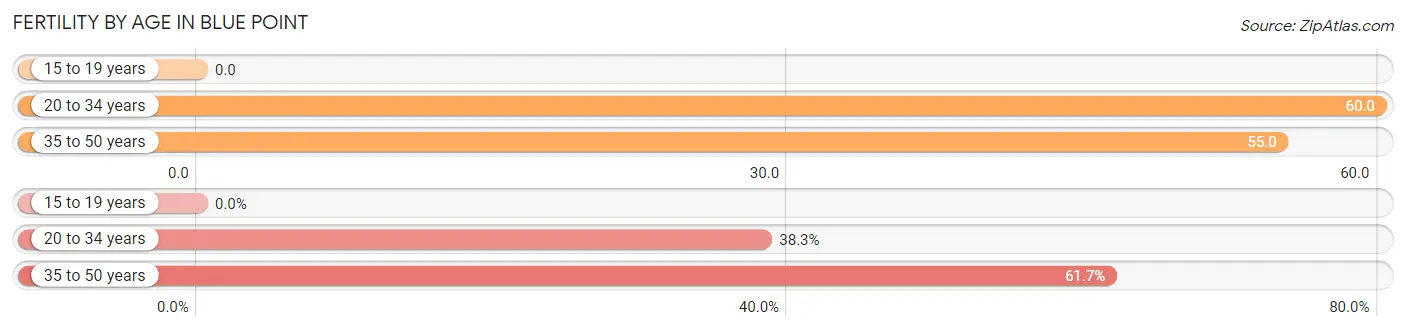
| Age Bracket | Women with Births | Births / 1,000 Women |
| 15 to 19 years | 0 (0.0%) | 0.0 |
| 20 to 34 years | 18 (38.3%) | 60.0 |
| 35 to 50 years | 29 (61.7%) | 55.0 |
| Total | 47 (100.0%) | 53.0 |
Fertility by Age by Marriage Status in Blue Point
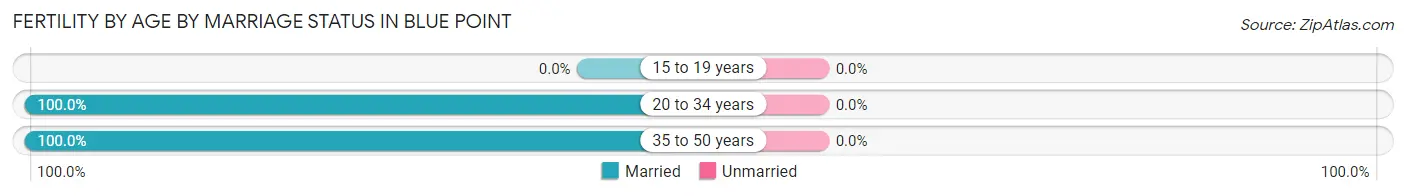
| Age Bracket | Married | Unmarried |
| 15 to 19 years | 0 (0.0%) | 0 (0.0%) |
| 20 to 34 years | 18 (100.0%) | 0 (0.0%) |
| 35 to 50 years | 29 (100.0%) | 0 (0.0%) |
| Total | 47 (100.0%) | 0 (0.0%) |
Fertility by Education in Blue Point
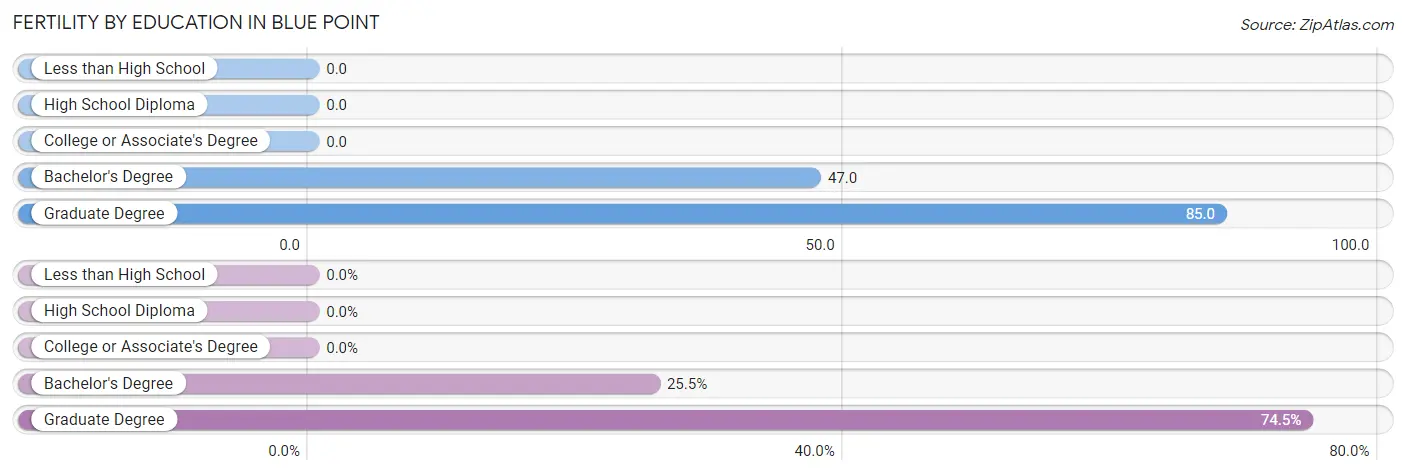
| Educational Attainment | Women with Births | Births / 1,000 Women |
| Less than High School | 0 (0.0%) | 0.0 |
| High School Diploma | 0 (0.0%) | 0.0 |
| College or Associate's Degree | 0 (0.0%) | 0.0 |
| Bachelor's Degree | 12 (25.5%) | 47.0 |
| Graduate Degree | 35 (74.5%) | 85.0 |
| Total | 47 (100.0%) | 53.0 |
Fertility by Education by Marriage Status in Blue Point
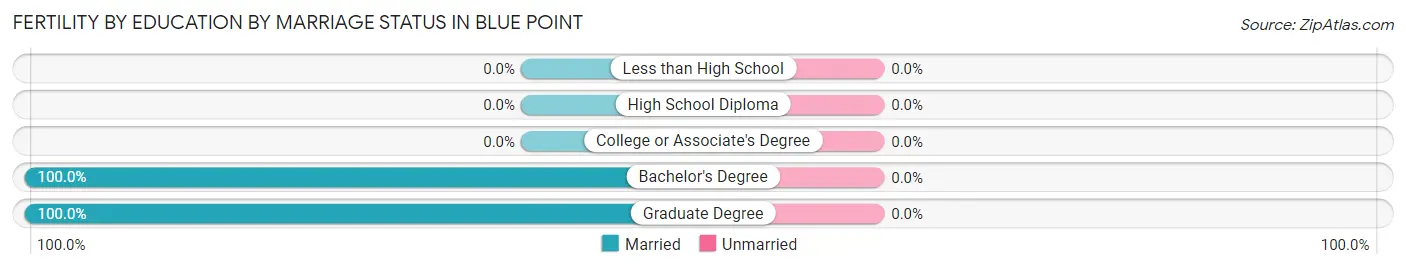
| Educational Attainment | Married | Unmarried |
| Less than High School | 0 (0.0%) | 0 (0.0%) |
| High School Diploma | 0 (0.0%) | 0 (0.0%) |
| College or Associate's Degree | 0 (0.0%) | 0 (0.0%) |
| Bachelor's Degree | 12 (100.0%) | 0 (0.0%) |
| Graduate Degree | 35 (100.0%) | 0 (0.0%) |
| Total | 47 (100.0%) | 0 (0.0%) |
Employment Characteristics in Blue Point
Employment by Class of Employer in Blue Point
Among the 2,340 employed individuals in Blue Point, private company employees (1,157 | 49.4%), local government employees (491 | 21.0%), and state government employees (223 | 9.5%) make up the most common classes of employment.
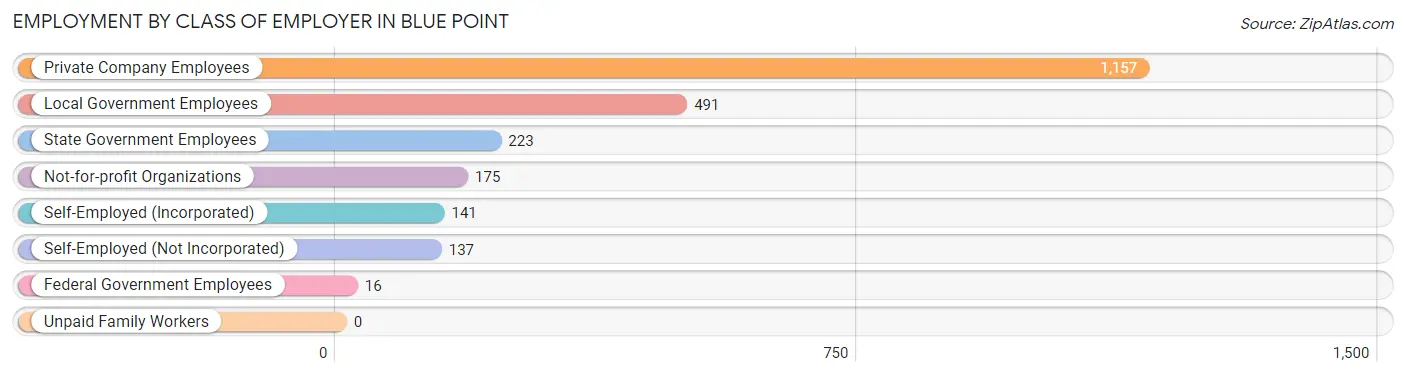
| Employer Class | # Employees | % Employees |
| Private Company Employees | 1,157 | 49.4% |
| Self-Employed (Incorporated) | 141 | 6.0% |
| Self-Employed (Not Incorporated) | 137 | 5.9% |
| Not-for-profit Organizations | 175 | 7.5% |
| Local Government Employees | 491 | 21.0% |
| State Government Employees | 223 | 9.5% |
| Federal Government Employees | 16 | 0.7% |
| Unpaid Family Workers | 0 | 0.0% |
| Total | 2,340 | 100.0% |
Employment Status by Age in Blue Point
According to the labor force statistics for Blue Point, out of the total population over 16 years of age (3,871), 66.8% or 2,586 individuals are in the labor force, with 8.4% or 217 of them unemployed. The age group with the highest labor force participation rate is 25 to 29 years, with 100.0% or 184 individuals in the labor force. Within the labor force, the 16 to 19 years age range has the highest percentage of unemployed individuals, with 79.5% or 35 of them being unemployed.
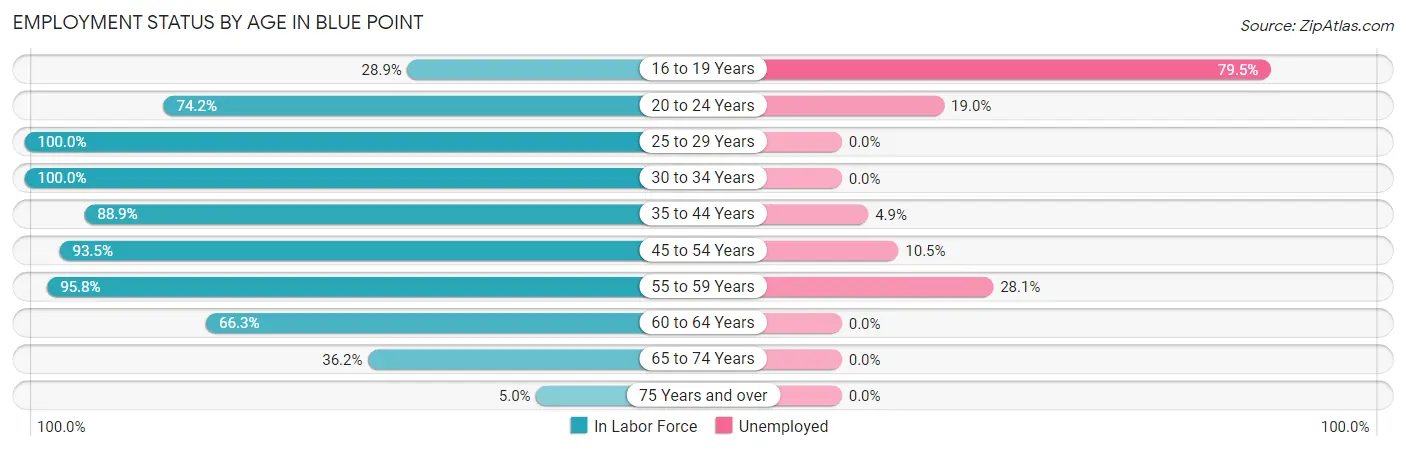
| Age Bracket | In Labor Force | Unemployed |
| 16 to 19 Years | 44 (28.9%) | 35 (79.5%) |
| 20 to 24 Years | 158 (74.2%) | 30 (19.0%) |
| 25 to 29 Years | 184 (100.0%) | 0 (0.0%) |
| 30 to 34 Years | 262 (100.0%) | 0 (0.0%) |
| 35 to 44 Years | 530 (88.9%) | 26 (4.9%) |
| 45 to 54 Years | 532 (93.5%) | 56 (10.5%) |
| 55 to 59 Years | 253 (95.8%) | 71 (28.1%) |
| 60 to 64 Years | 387 (66.3%) | 0 (0.0%) |
| 65 to 74 Years | 213 (36.2%) | 0 (0.0%) |
| 75 Years and over | 23 (5.0%) | 0 (0.0%) |
| Total | 2,586 (66.8%) | 217 (8.4%) |
Employment Status by Educational Attainment in Blue Point
According to labor force statistics for Blue Point, 87.4% of individuals (2,149) out of the total population between 25 and 64 years of age (2,459) are in the labor force, with 7.1% or 153 of them being unemployed. The group with the highest labor force participation rate are those with the educational attainment of bachelor's degree or higher, with 96.8% or 1,252 individuals in the labor force. Within the labor force, individuals with high school diploma education have the highest percentage of unemployment, with 8.4% or 37 of them being unemployed.
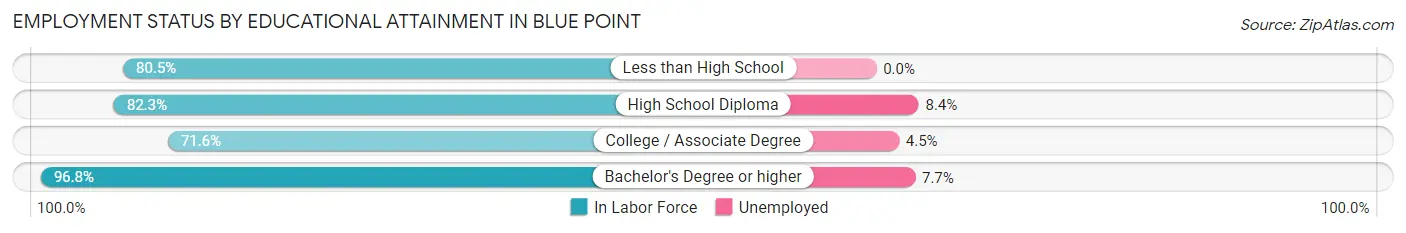
| Educational Attainment | In Labor Force | Unemployed |
| Less than High School | 33 (80.5%) | 0 (0.0%) |
| High School Diploma | 441 (82.3%) | 45 (8.4%) |
| College / Associate Degree | 422 (71.6%) | 27 (4.5%) |
| Bachelor's Degree or higher | 1,252 (96.8%) | 100 (7.7%) |
| Total | 2,149 (87.4%) | 175 (7.1%) |
Employment Occupations by Sex in Blue Point
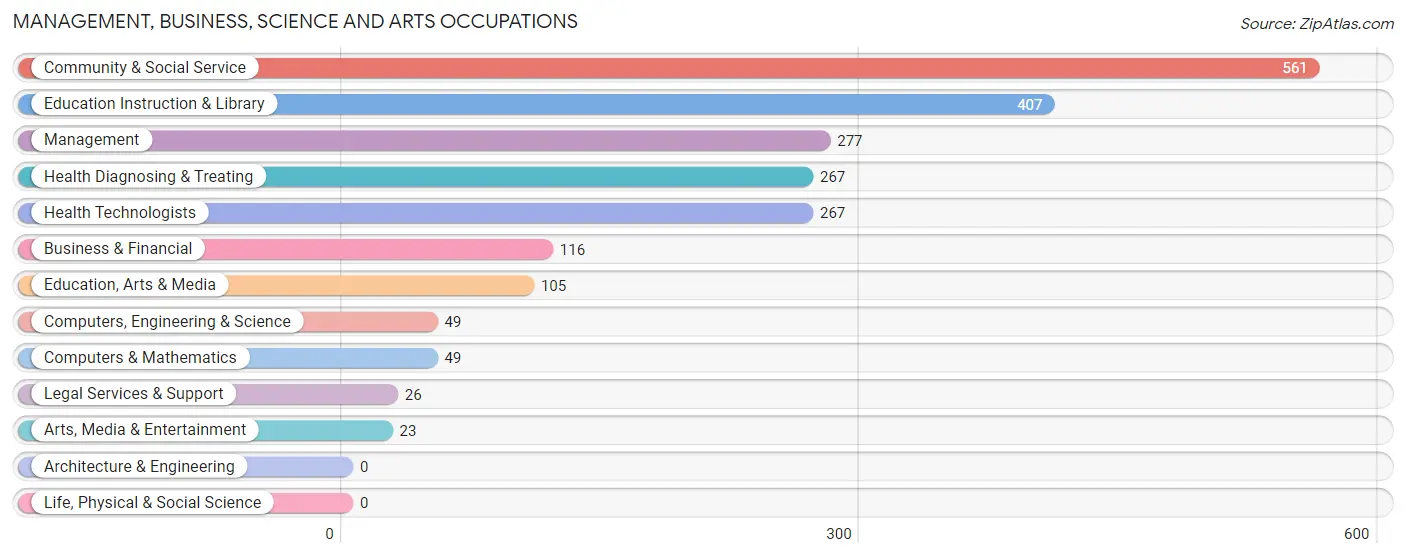
Management, Business, Science and Arts Occupations
The most common Management, Business, Science and Arts occupations in Blue Point are Community & Social Service (561 | 23.7%), Education Instruction & Library (407 | 17.2%), Management (277 | 11.7%), Health Diagnosing & Treating (267 | 11.3%), and Health Technologists (267 | 11.3%).
Management, Business, Science and Arts Occupations by Sex
Within the Management, Business, Science and Arts occupations in Blue Point, the most male-oriented occupations are Legal Services & Support (100.0%), Computers, Engineering & Science (79.6%), and Computers & Mathematics (79.6%), while the most female-oriented occupations are Arts, Media & Entertainment (100.0%), Education Instruction & Library (93.6%), and Health Diagnosing & Treating (90.6%).
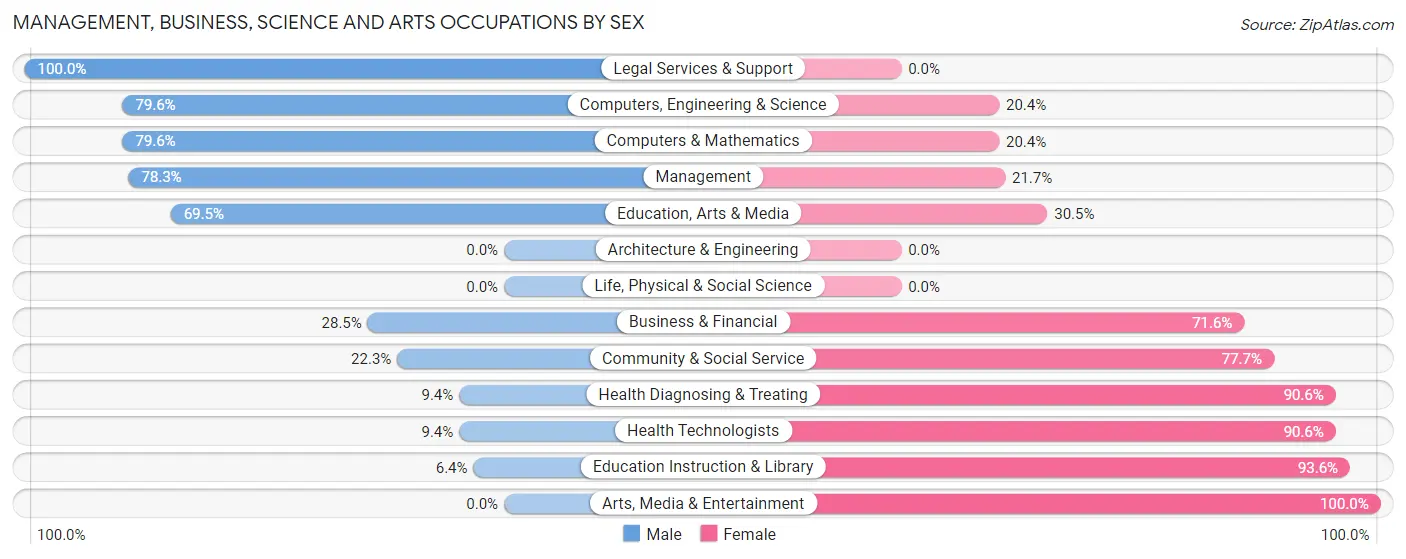
| Occupation | Male | Female |
| Management | 217 (78.3%) | 60 (21.7%) |
| Business & Financial | 33 (28.4%) | 83 (71.6%) |
| Computers, Engineering & Science | 39 (79.6%) | 10 (20.4%) |
| Computers & Mathematics | 39 (79.6%) | 10 (20.4%) |
| Architecture & Engineering | 0 (0.0%) | 0 (0.0%) |
| Life, Physical & Social Science | 0 (0.0%) | 0 (0.0%) |
| Community & Social Service | 125 (22.3%) | 436 (77.7%) |
| Education, Arts & Media | 73 (69.5%) | 32 (30.5%) |
| Legal Services & Support | 26 (100.0%) | 0 (0.0%) |
| Education Instruction & Library | 26 (6.4%) | 381 (93.6%) |
| Arts, Media & Entertainment | 0 (0.0%) | 23 (100.0%) |
| Health Diagnosing & Treating | 25 (9.4%) | 242 (90.6%) |
| Health Technologists | 25 (9.4%) | 242 (90.6%) |
| Total (Category) | 439 (34.6%) | 831 (65.4%) |
| Total (Overall) | 1,256 (53.0%) | 1,112 (47.0%) |
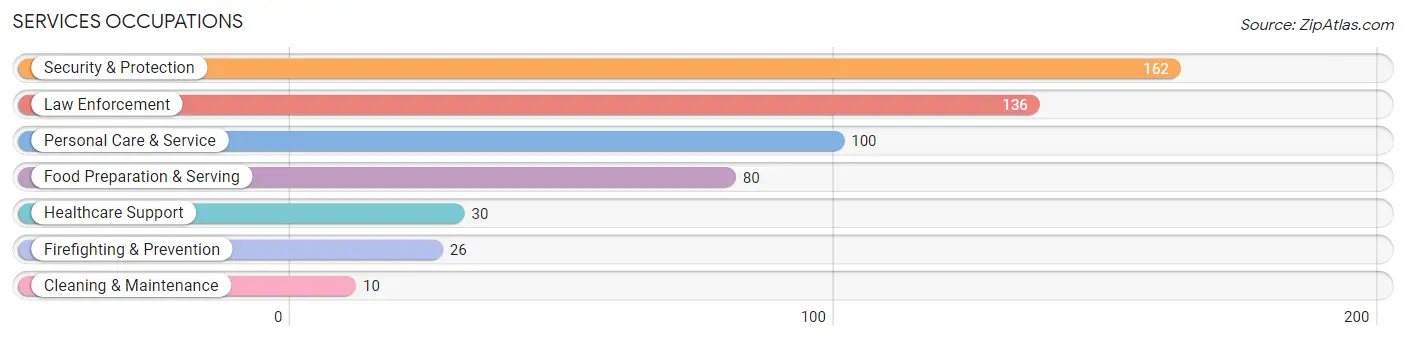
Services Occupations
The most common Services occupations in Blue Point are Security & Protection (162 | 6.8%), Law Enforcement (136 | 5.7%), Personal Care & Service (100 | 4.2%), Food Preparation & Serving (80 | 3.4%), and Healthcare Support (30 | 1.3%).
Services Occupations by Sex
Within the Services occupations in Blue Point, the most male-oriented occupations are Firefighting & Prevention (100.0%), Cleaning & Maintenance (100.0%), and Personal Care & Service (100.0%), while the most female-oriented occupations are Healthcare Support (100.0%), Food Preparation & Serving (52.5%), and Law Enforcement (10.3%).
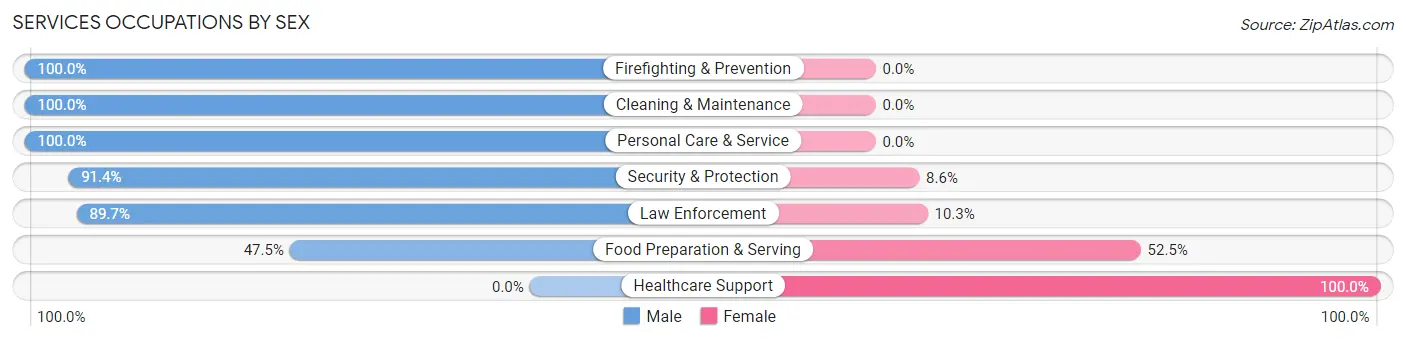
| Occupation | Male | Female |
| Healthcare Support | 0 (0.0%) | 30 (100.0%) |
| Security & Protection | 148 (91.4%) | 14 (8.6%) |
| Firefighting & Prevention | 26 (100.0%) | 0 (0.0%) |
| Law Enforcement | 122 (89.7%) | 14 (10.3%) |
| Food Preparation & Serving | 38 (47.5%) | 42 (52.5%) |
| Cleaning & Maintenance | 10 (100.0%) | 0 (0.0%) |
| Personal Care & Service | 100 (100.0%) | 0 (0.0%) |
| Total (Category) | 296 (77.5%) | 86 (22.5%) |
| Total (Overall) | 1,256 (53.0%) | 1,112 (47.0%) |
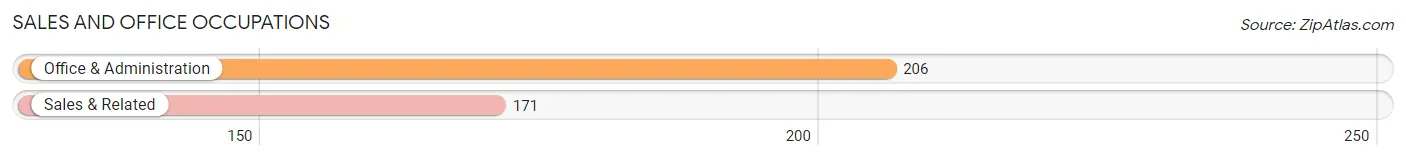
Sales and Office Occupations
The most common Sales and Office occupations in Blue Point are Office & Administration (206 | 8.7%), and Sales & Related (171 | 7.2%).
Sales and Office Occupations by Sex
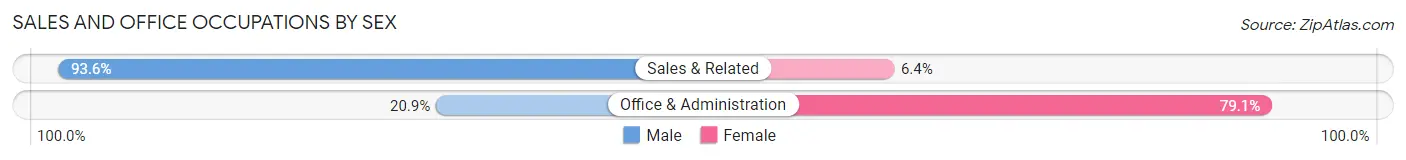
| Occupation | Male | Female |
| Sales & Related | 160 (93.6%) | 11 (6.4%) |
| Office & Administration | 43 (20.9%) | 163 (79.1%) |
| Total (Category) | 203 (53.8%) | 174 (46.2%) |
| Total (Overall) | 1,256 (53.0%) | 1,112 (47.0%) |
Natural Resources, Construction and Maintenance Occupations
The most common Natural Resources, Construction and Maintenance occupations in Blue Point are Construction & Extraction (135 | 5.7%), Installation, Maintenance & Repair (22 | 0.9%), and Farming, Fishing & Forestry (12 | 0.5%).

Natural Resources, Construction and Maintenance Occupations by Sex
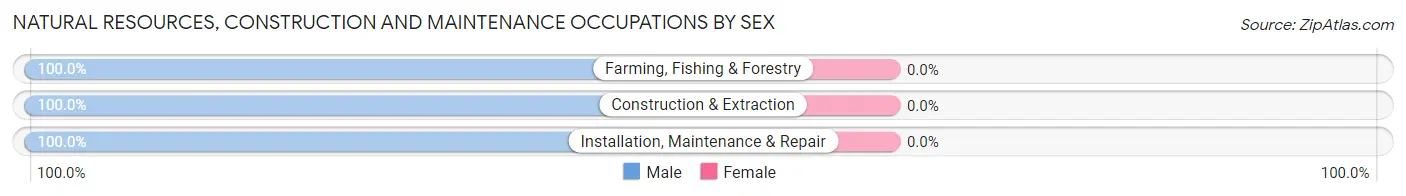
| Occupation | Male | Female |
| Farming, Fishing & Forestry | 12 (100.0%) | 0 (0.0%) |
| Construction & Extraction | 135 (100.0%) | 0 (0.0%) |
| Installation, Maintenance & Repair | 22 (100.0%) | 0 (0.0%) |
| Total (Category) | 169 (100.0%) | 0 (0.0%) |
| Total (Overall) | 1,256 (53.0%) | 1,112 (47.0%) |
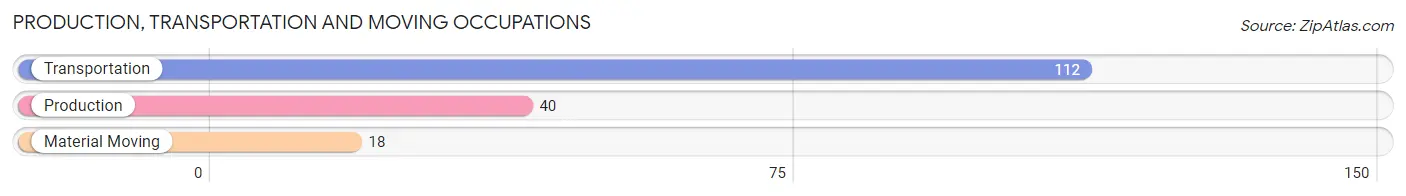
Production, Transportation and Moving Occupations
The most common Production, Transportation and Moving occupations in Blue Point are Transportation (112 | 4.7%), Production (40 | 1.7%), and Material Moving (18 | 0.8%).
Production, Transportation and Moving Occupations by Sex
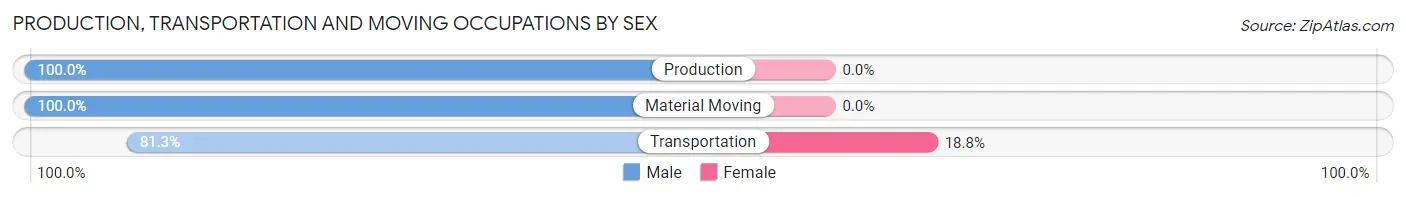
| Occupation | Male | Female |
| Production | 40 (100.0%) | 0 (0.0%) |
| Transportation | 91 (81.2%) | 21 (18.8%) |
| Material Moving | 18 (100.0%) | 0 (0.0%) |
| Total (Category) | 149 (87.6%) | 21 (12.3%) |
| Total (Overall) | 1,256 (53.0%) | 1,112 (47.0%) |
Employment Industries by Sex in Blue Point
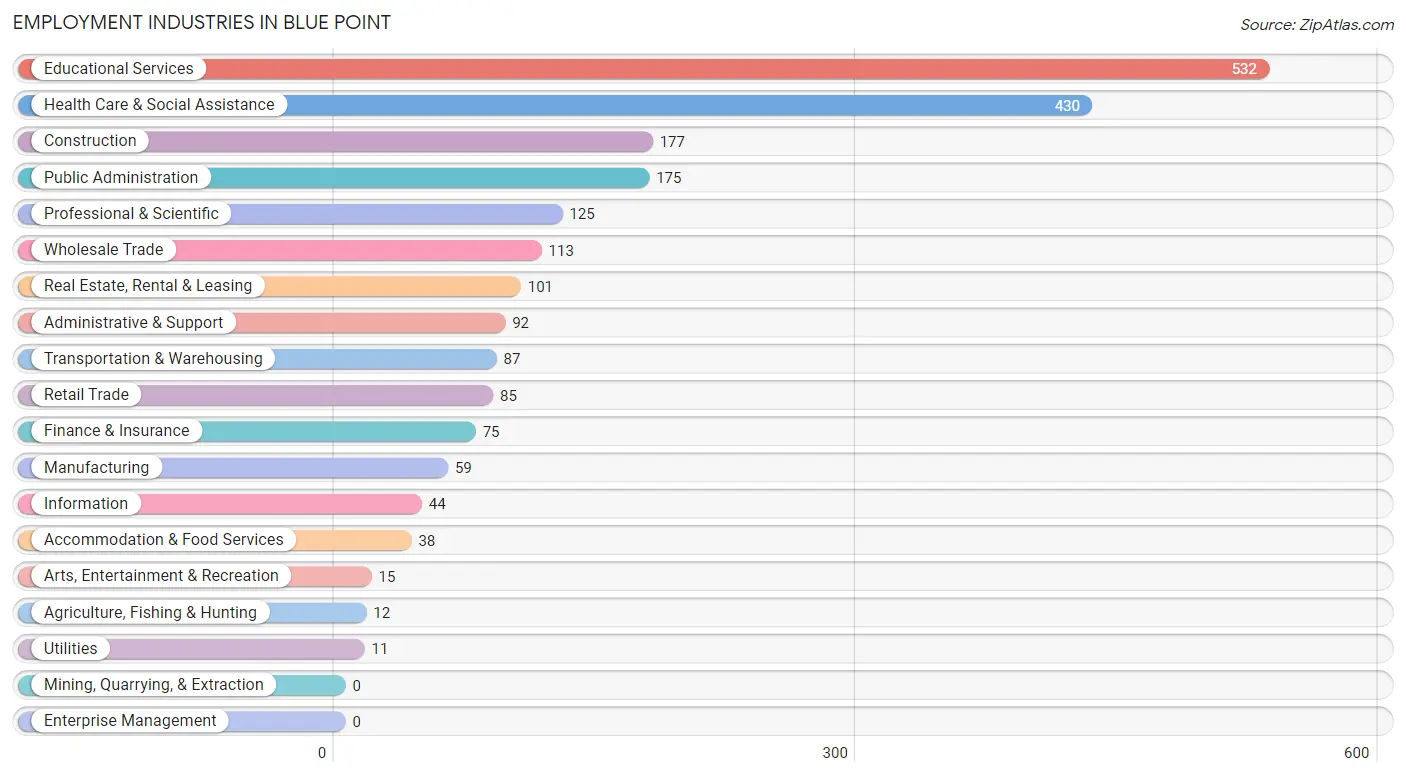
Employment Industries in Blue Point
The major employment industries in Blue Point include Educational Services (532 | 22.5%), Health Care & Social Assistance (430 | 18.2%), Construction (177 | 7.5%), Public Administration (175 | 7.4%), and Professional & Scientific (125 | 5.3%).
Employment Industries by Sex in Blue Point
The Blue Point industries that see more men than women are Agriculture, Fishing & Hunting (100.0%), Retail Trade (100.0%), and Accommodation & Food Services (100.0%), whereas the industries that tend to have a higher number of women are Utilities (100.0%), Arts, Entertainment & Recreation (100.0%), and Educational Services (85.9%).
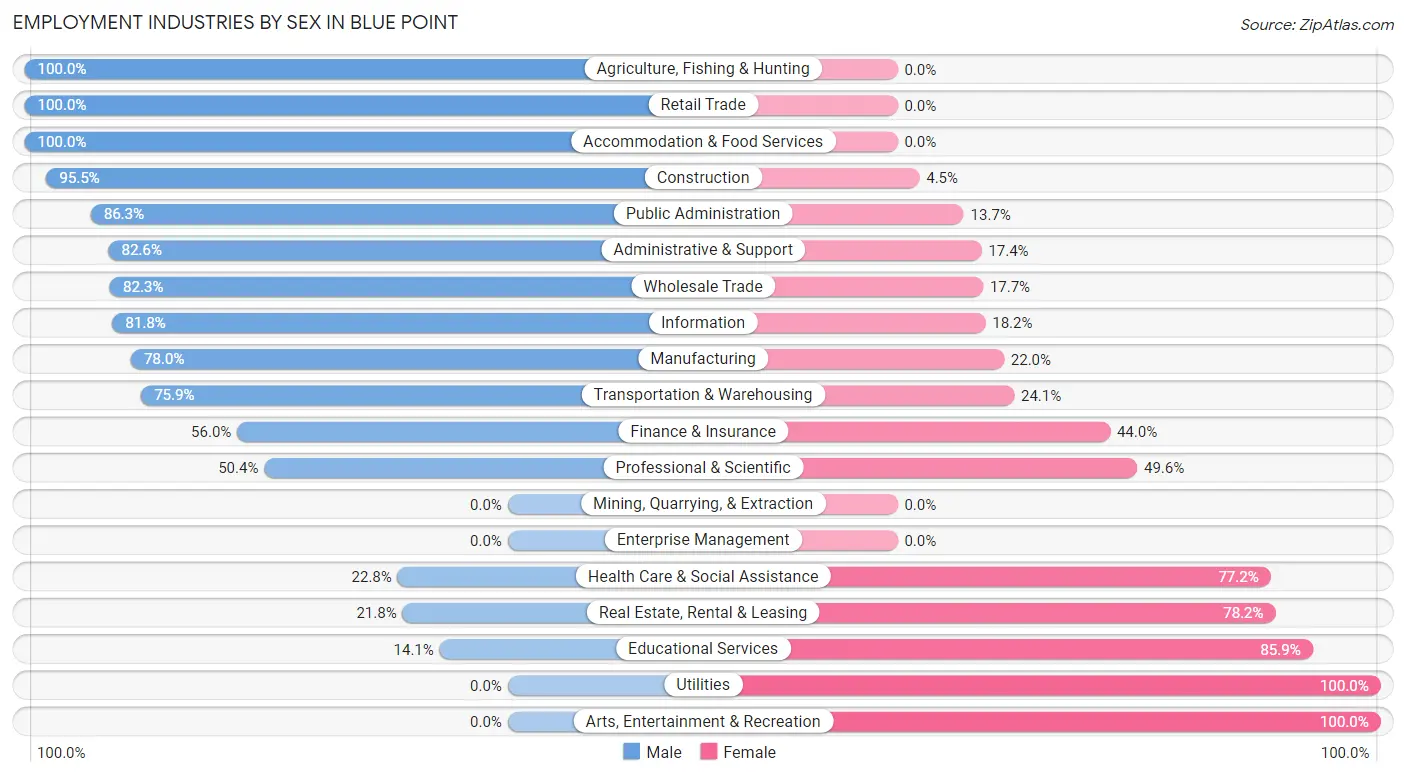
| Industry | Male | Female |
| Agriculture, Fishing & Hunting | 12 (100.0%) | 0 (0.0%) |
| Mining, Quarrying, & Extraction | 0 (0.0%) | 0 (0.0%) |
| Construction | 169 (95.5%) | 8 (4.5%) |
| Manufacturing | 46 (78.0%) | 13 (22.0%) |
| Wholesale Trade | 93 (82.3%) | 20 (17.7%) |
| Retail Trade | 85 (100.0%) | 0 (0.0%) |
| Transportation & Warehousing | 66 (75.9%) | 21 (24.1%) |
| Utilities | 0 (0.0%) | 11 (100.0%) |
| Information | 36 (81.8%) | 8 (18.2%) |
| Finance & Insurance | 42 (56.0%) | 33 (44.0%) |
| Real Estate, Rental & Leasing | 22 (21.8%) | 79 (78.2%) |
| Professional & Scientific | 63 (50.4%) | 62 (49.6%) |
| Enterprise Management | 0 (0.0%) | 0 (0.0%) |
| Administrative & Support | 76 (82.6%) | 16 (17.4%) |
| Educational Services | 75 (14.1%) | 457 (85.9%) |
| Health Care & Social Assistance | 98 (22.8%) | 332 (77.2%) |
| Arts, Entertainment & Recreation | 0 (0.0%) | 15 (100.0%) |
| Accommodation & Food Services | 38 (100.0%) | 0 (0.0%) |
| Public Administration | 151 (86.3%) | 24 (13.7%) |
| Total | 1,256 (53.0%) | 1,112 (47.0%) |
Education in Blue Point
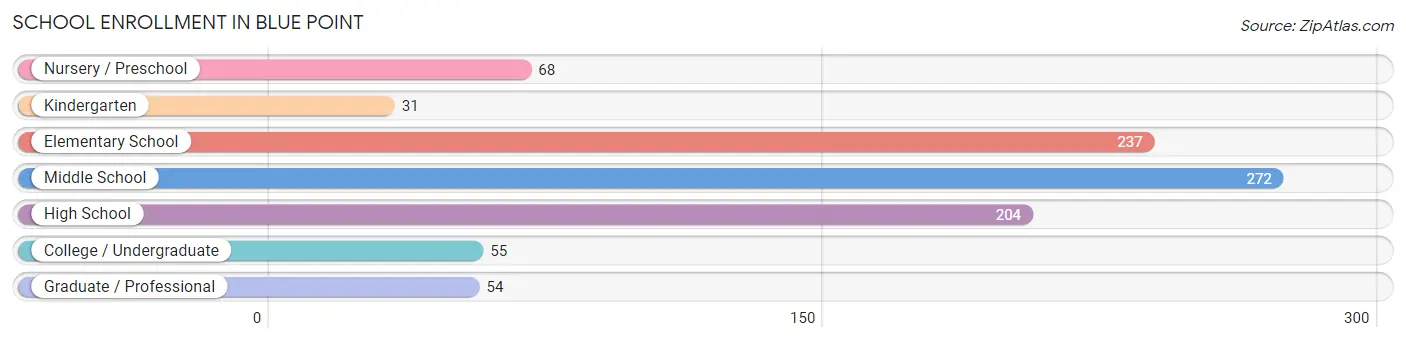
School Enrollment in Blue Point
The most common levels of schooling among the 921 students in Blue Point are middle school (272 | 29.5%), elementary school (237 | 25.7%), and high school (204 | 22.2%).
| School Level | # Students | % Students |
| Nursery / Preschool | 68 | 7.4% |
| Kindergarten | 31 | 3.4% |
| Elementary School | 237 | 25.7% |
| Middle School | 272 | 29.5% |
| High School | 204 | 22.2% |
| College / Undergraduate | 55 | 6.0% |
| Graduate / Professional | 54 | 5.9% |
| Total | 921 | 100.0% |
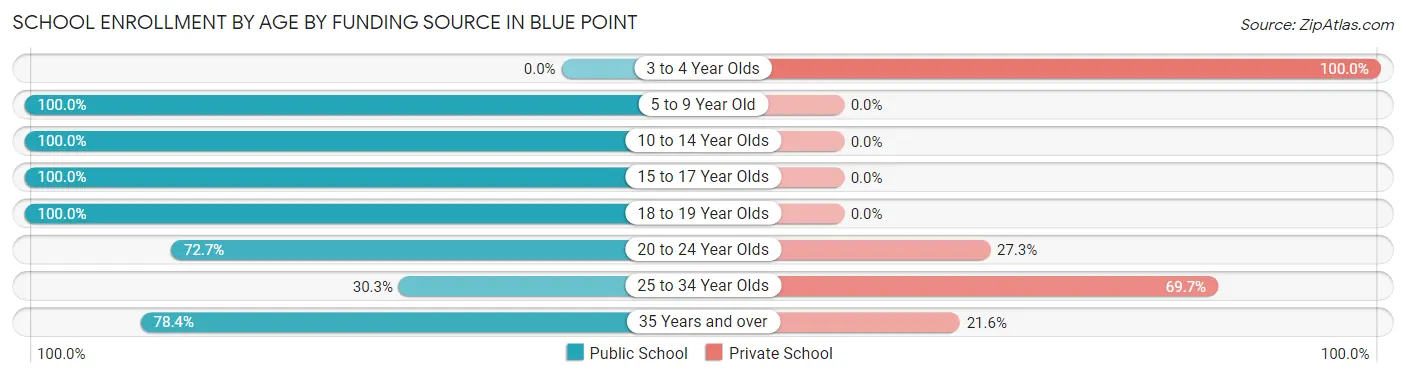
School Enrollment by Age by Funding Source in Blue Point
Out of a total of 921 students who are enrolled in schools in Blue Point, 93 (10.1%) attend a private institution, while the remaining 828 (89.9%) are enrolled in public schools. The age group of 3 to 4 year olds has the highest likelihood of being enrolled in private schools, with 47 (100.0% in the age bracket) enrolled. Conversely, the age group of 5 to 9 year old has the lowest likelihood of being enrolled in a private school, with 289 (100.0% in the age bracket) attending a public institution.
| Age Bracket | Public School | Private School |
| 3 to 4 Year Olds | 0 (0.0%) | 47 (100.0%) |
| 5 to 9 Year Old | 289 (100.0%) | 0 (0.0%) |
| 10 to 14 Year Olds | 311 (100.0%) | 0 (0.0%) |
| 15 to 17 Year Olds | 142 (100.0%) | 0 (0.0%) |
| 18 to 19 Year Olds | 7 (100.0%) | 0 (0.0%) |
| 20 to 24 Year Olds | 40 (72.7%) | 15 (27.3%) |
| 25 to 34 Year Olds | 10 (30.3%) | 23 (69.7%) |
| 35 Years and over | 29 (78.4%) | 8 (21.6%) |
| Total | 828 (89.9%) | 93 (10.1%) |
Educational Attainment by Field of Study in Blue Point
Business (348 | 20.0%), science & technology (333 | 19.2%), education (284 | 16.4%), psychology (162 | 9.3%), and arts & humanities (133 | 7.7%) are the most common fields of study among 1,737 individuals in Blue Point who have obtained a bachelor's degree or higher.
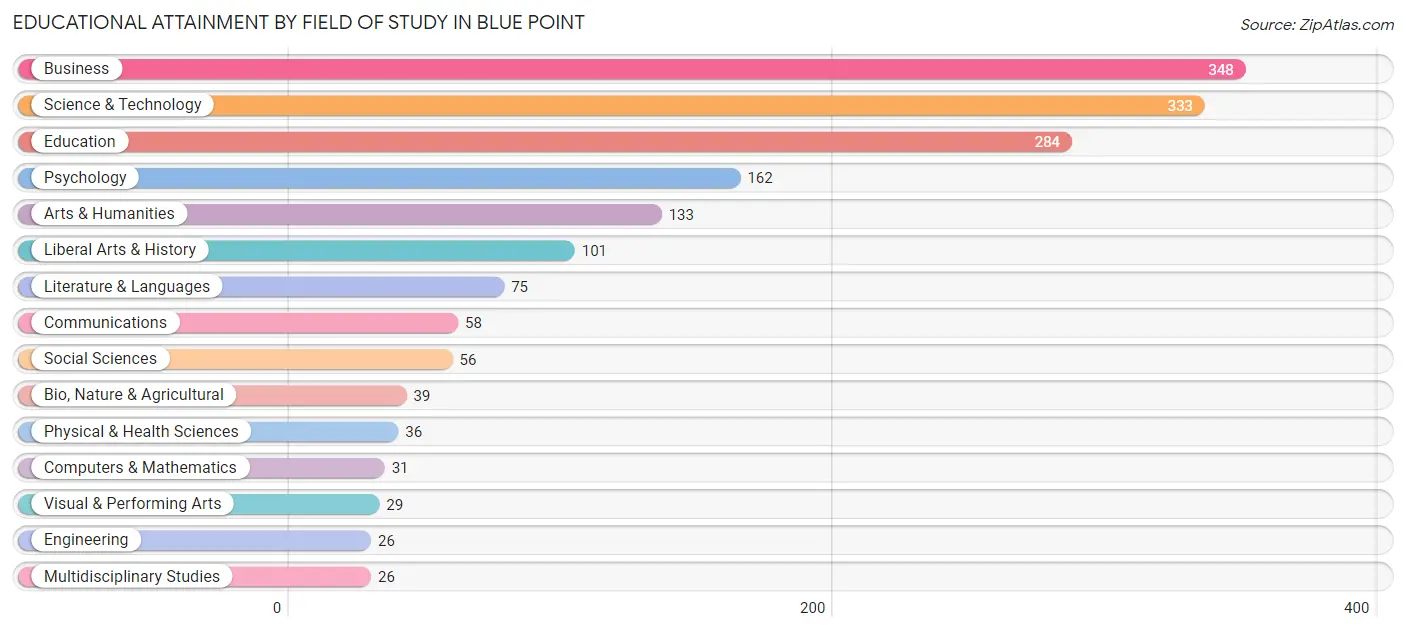
| Field of Study | # Graduates | % Graduates |
| Computers & Mathematics | 31 | 1.8% |
| Bio, Nature & Agricultural | 39 | 2.2% |
| Physical & Health Sciences | 36 | 2.1% |
| Psychology | 162 | 9.3% |
| Social Sciences | 56 | 3.2% |
| Engineering | 26 | 1.5% |
| Multidisciplinary Studies | 26 | 1.5% |
| Science & Technology | 333 | 19.2% |
| Business | 348 | 20.0% |
| Education | 284 | 16.4% |
| Literature & Languages | 75 | 4.3% |
| Liberal Arts & History | 101 | 5.8% |
| Visual & Performing Arts | 29 | 1.7% |
| Communications | 58 | 3.3% |
| Arts & Humanities | 133 | 7.7% |
| Total | 1,737 | 100.0% |
Transportation & Commute in Blue Point
Vehicle Availability by Sex in Blue Point
The most prevalent vehicle ownership categories in Blue Point are males with 2 vehicles (583, accounting for 47.2%) and females with 2 vehicles (473, making up 52.8%).
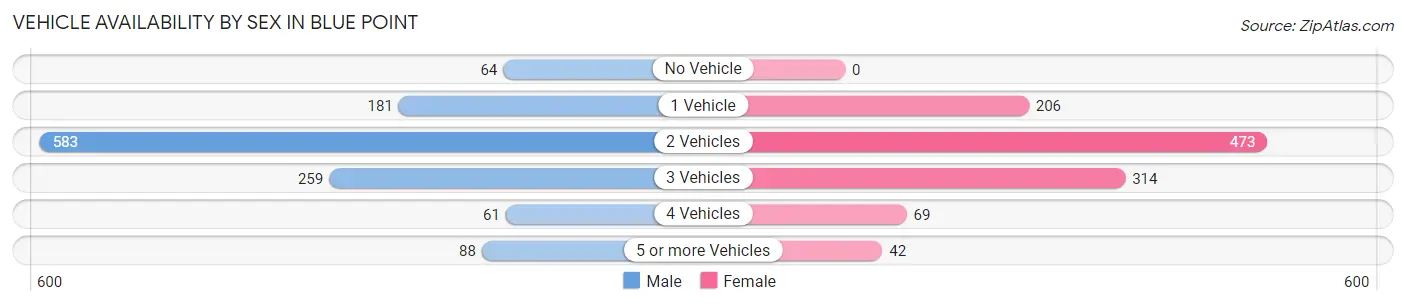
| Vehicles Available | Male | Female |
| No Vehicle | 64 (5.2%) | 0 (0.0%) |
| 1 Vehicle | 181 (14.6%) | 206 (18.7%) |
| 2 Vehicles | 583 (47.2%) | 473 (42.8%) |
| 3 Vehicles | 259 (20.9%) | 314 (28.4%) |
| 4 Vehicles | 61 (4.9%) | 69 (6.2%) |
| 5 or more Vehicles | 88 (7.1%) | 42 (3.8%) |
| Total | 1,236 (100.0%) | 1,104 (100.0%) |
Commute Time in Blue Point
The most frequently occuring commute durations in Blue Point are 30 to 34 minutes (329 commuters, 16.7%), 90 or more minutes (272 commuters, 13.8%), and 25 to 29 minutes (261 commuters, 13.2%).
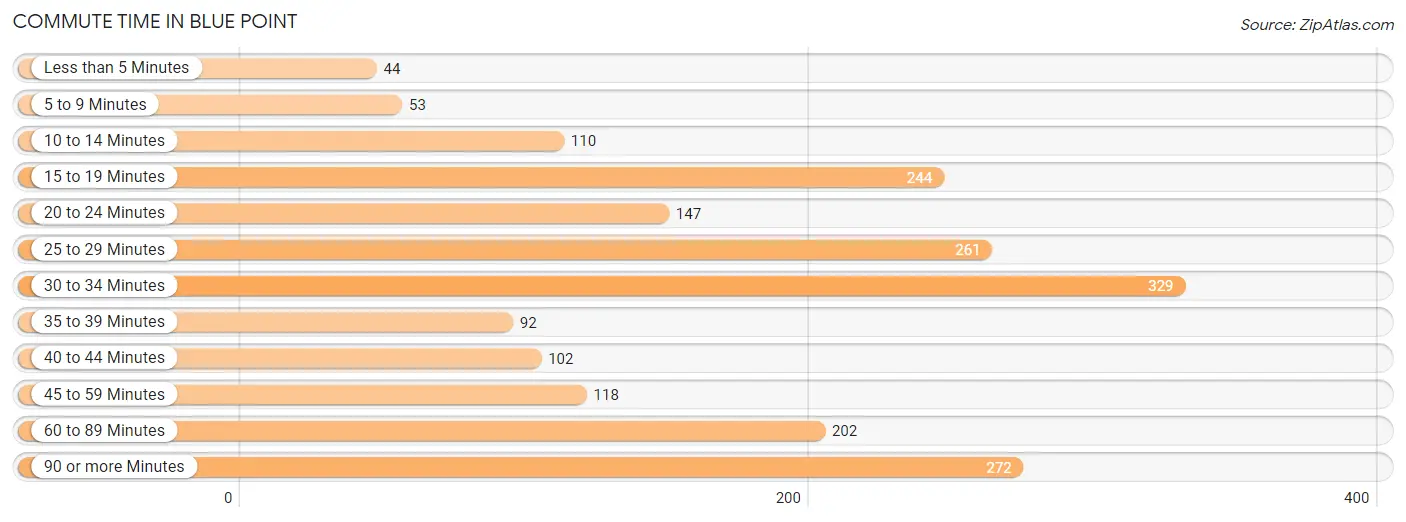
| Commute Time | # Commuters | % Commuters |
| Less than 5 Minutes | 44 | 2.2% |
| 5 to 9 Minutes | 53 | 2.7% |
| 10 to 14 Minutes | 110 | 5.6% |
| 15 to 19 Minutes | 244 | 12.4% |
| 20 to 24 Minutes | 147 | 7.4% |
| 25 to 29 Minutes | 261 | 13.2% |
| 30 to 34 Minutes | 329 | 16.7% |
| 35 to 39 Minutes | 92 | 4.7% |
| 40 to 44 Minutes | 102 | 5.2% |
| 45 to 59 Minutes | 118 | 6.0% |
| 60 to 89 Minutes | 202 | 10.2% |
| 90 or more Minutes | 272 | 13.8% |
Commute Time by Sex in Blue Point
The most common commute times in Blue Point are 25 to 29 minutes (183 commuters, 18.3%) for males and 30 to 34 minutes (162 commuters, 16.7%) for females.
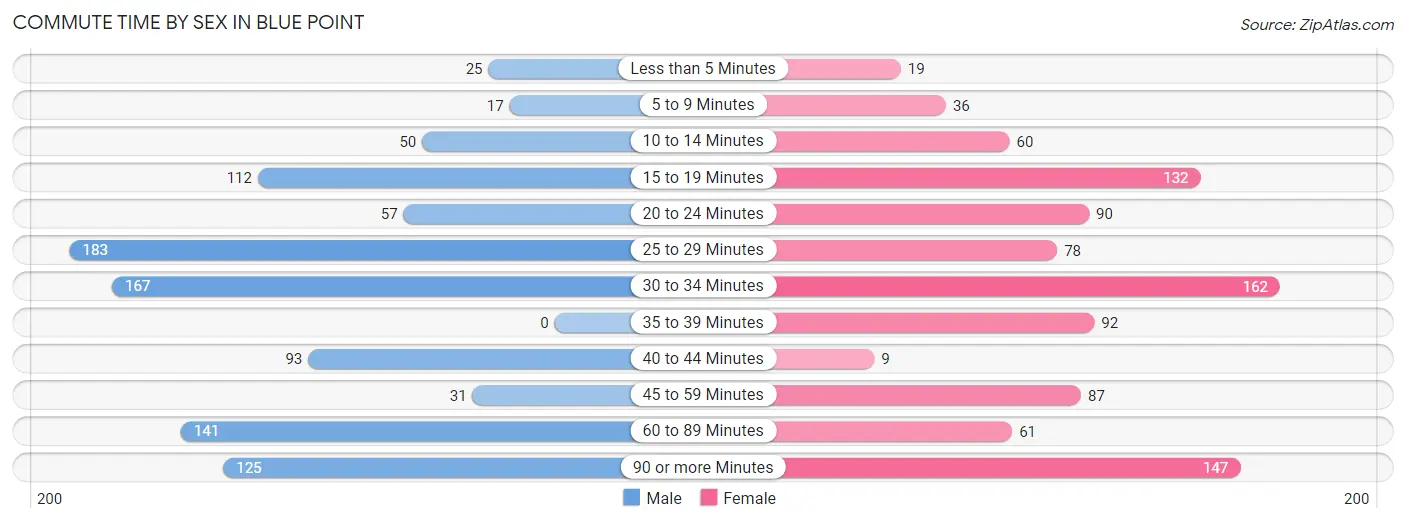
| Commute Time | Male | Female |
| Less than 5 Minutes | 25 (2.5%) | 19 (1.9%) |
| 5 to 9 Minutes | 17 (1.7%) | 36 (3.7%) |
| 10 to 14 Minutes | 50 (5.0%) | 60 (6.2%) |
| 15 to 19 Minutes | 112 (11.2%) | 132 (13.6%) |
| 20 to 24 Minutes | 57 (5.7%) | 90 (9.2%) |
| 25 to 29 Minutes | 183 (18.3%) | 78 (8.0%) |
| 30 to 34 Minutes | 167 (16.7%) | 162 (16.7%) |
| 35 to 39 Minutes | 0 (0.0%) | 92 (9.5%) |
| 40 to 44 Minutes | 93 (9.3%) | 9 (0.9%) |
| 45 to 59 Minutes | 31 (3.1%) | 87 (8.9%) |
| 60 to 89 Minutes | 141 (14.1%) | 61 (6.3%) |
| 90 or more Minutes | 125 (12.5%) | 147 (15.1%) |
Time of Departure to Work by Sex in Blue Point
The most frequent times of departure to work in Blue Point are 7:30 AM to 7:59 AM (148, 14.8%) for males and 8:00 AM to 8:29 AM (233, 23.9%) for females.
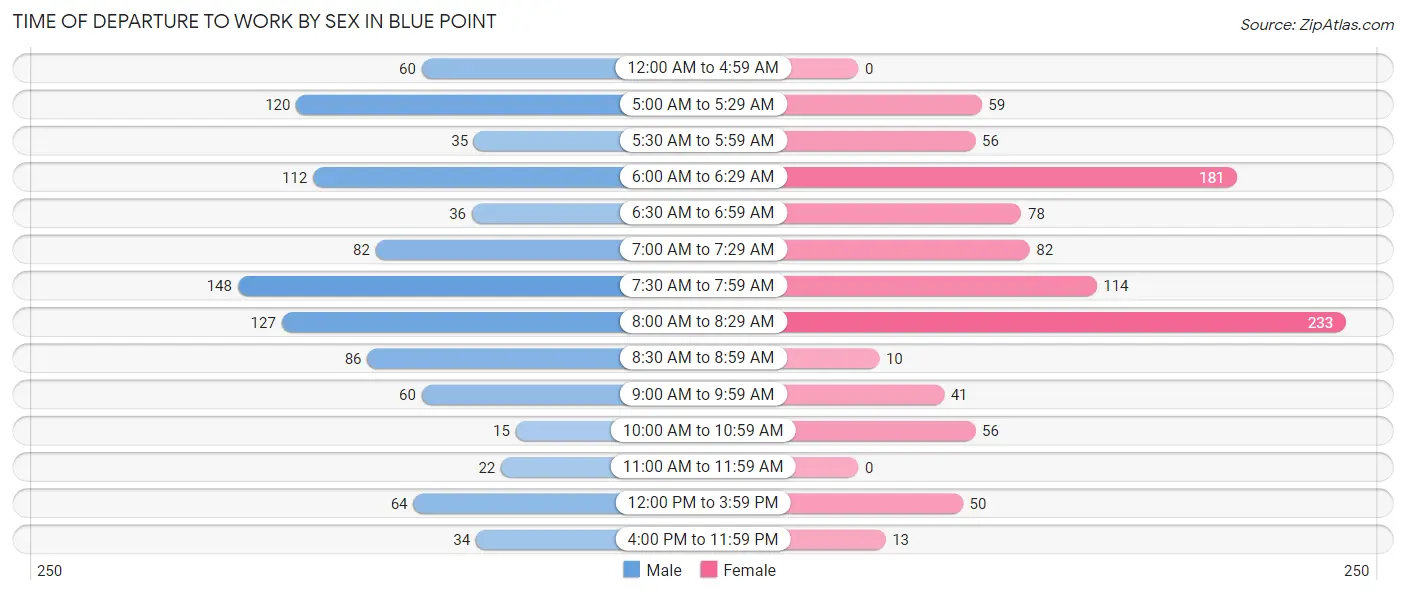
| Time of Departure | Male | Female |
| 12:00 AM to 4:59 AM | 60 (6.0%) | 0 (0.0%) |
| 5:00 AM to 5:29 AM | 120 (12.0%) | 59 (6.1%) |
| 5:30 AM to 5:59 AM | 35 (3.5%) | 56 (5.8%) |
| 6:00 AM to 6:29 AM | 112 (11.2%) | 181 (18.6%) |
| 6:30 AM to 6:59 AM | 36 (3.6%) | 78 (8.0%) |
| 7:00 AM to 7:29 AM | 82 (8.2%) | 82 (8.4%) |
| 7:30 AM to 7:59 AM | 148 (14.8%) | 114 (11.7%) |
| 8:00 AM to 8:29 AM | 127 (12.7%) | 233 (23.9%) |
| 8:30 AM to 8:59 AM | 86 (8.6%) | 10 (1.0%) |
| 9:00 AM to 9:59 AM | 60 (6.0%) | 41 (4.2%) |
| 10:00 AM to 10:59 AM | 15 (1.5%) | 56 (5.8%) |
| 11:00 AM to 11:59 AM | 22 (2.2%) | 0 (0.0%) |
| 12:00 PM to 3:59 PM | 64 (6.4%) | 50 (5.1%) |
| 4:00 PM to 11:59 PM | 34 (3.4%) | 13 (1.3%) |
| Total | 1,001 (100.0%) | 973 (100.0%) |
Housing Occupancy in Blue Point
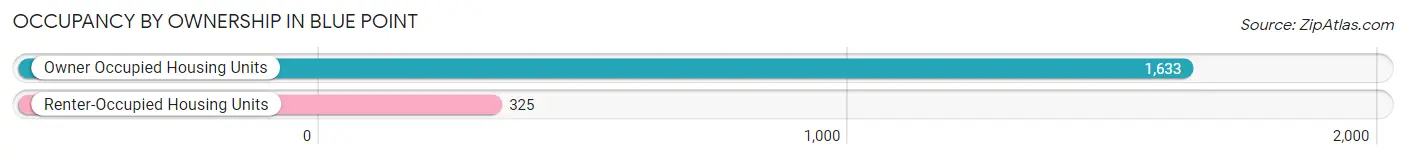
Occupancy by Ownership in Blue Point
Of the total 1,958 dwellings in Blue Point, owner-occupied units account for 1,633 (83.4%), while renter-occupied units make up 325 (16.6%).
| Occupancy | # Housing Units | % Housing Units |
| Owner Occupied Housing Units | 1,633 | 83.4% |
| Renter-Occupied Housing Units | 325 | 16.6% |
| Total Occupied Housing Units | 1,958 | 100.0% |
Occupancy by Household Size in Blue Point
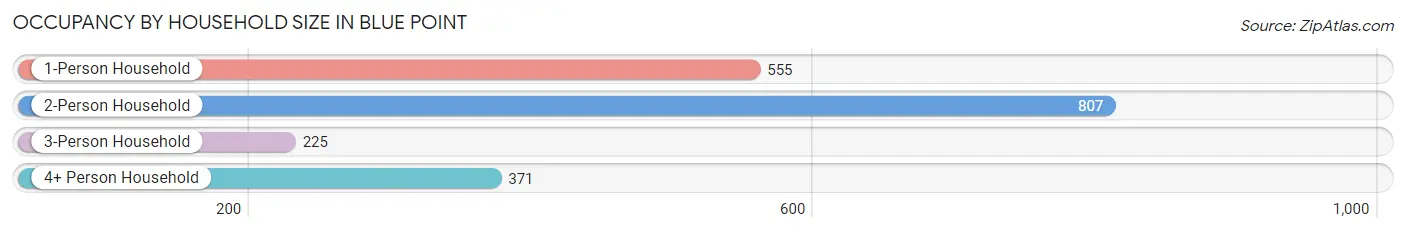
| Household Size | # Housing Units | % Housing Units |
| 1-Person Household | 555 | 28.3% |
| 2-Person Household | 807 | 41.2% |
| 3-Person Household | 225 | 11.5% |
| 4+ Person Household | 371 | 19.0% |
| Total Housing Units | 1,958 | 100.0% |
Occupancy by Ownership by Household Size in Blue Point
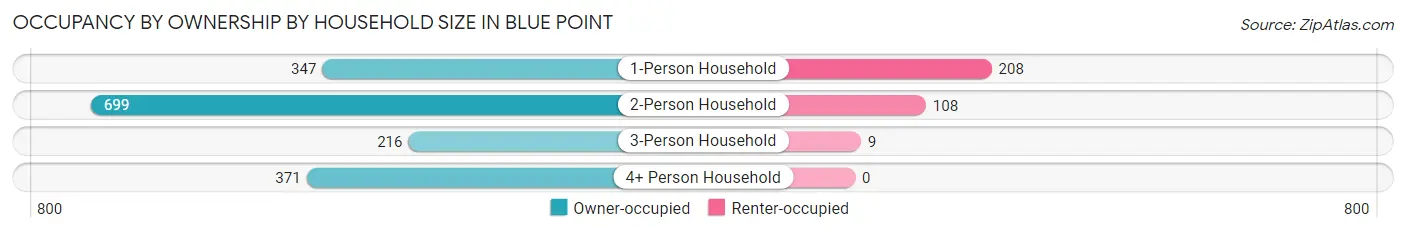
| Household Size | Owner-occupied | Renter-occupied |
| 1-Person Household | 347 (62.5%) | 208 (37.5%) |
| 2-Person Household | 699 (86.6%) | 108 (13.4%) |
| 3-Person Household | 216 (96.0%) | 9 (4.0%) |
| 4+ Person Household | 371 (100.0%) | 0 (0.0%) |
| Total Housing Units | 1,633 (83.4%) | 325 (16.6%) |
Occupancy by Educational Attainment in Blue Point
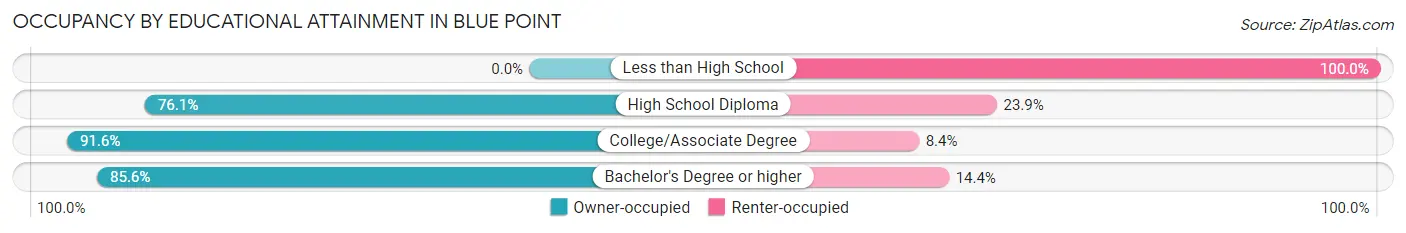
| Household Size | Owner-occupied | Renter-occupied |
| Less than High School | 0 (0.0%) | 42 (100.0%) |
| High School Diploma | 303 (76.1%) | 95 (23.9%) |
| College/Associate Degree | 467 (91.6%) | 43 (8.4%) |
| Bachelor's Degree or higher | 863 (85.6%) | 145 (14.4%) |
Occupancy by Age of Householder in Blue Point
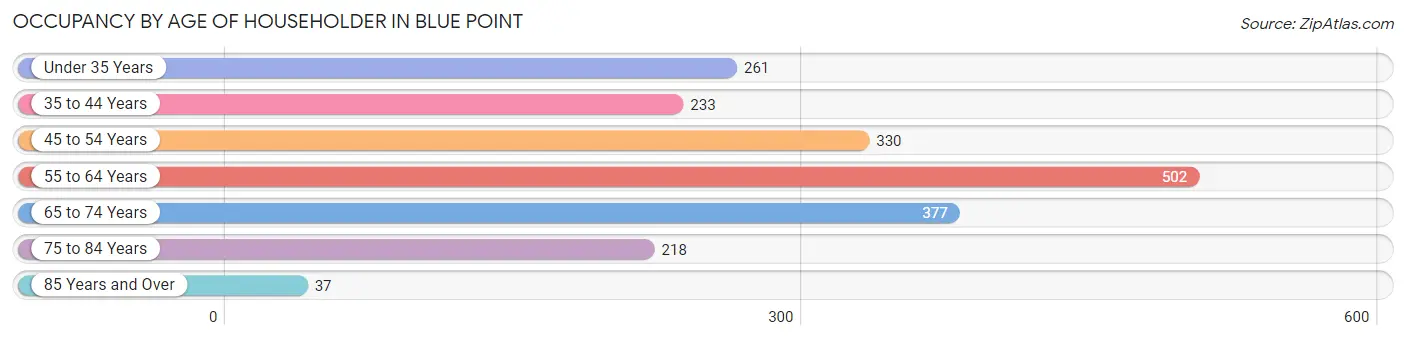
| Age Bracket | # Households | % Households |
| Under 35 Years | 261 | 13.3% |
| 35 to 44 Years | 233 | 11.9% |
| 45 to 54 Years | 330 | 16.9% |
| 55 to 64 Years | 502 | 25.6% |
| 65 to 74 Years | 377 | 19.3% |
| 75 to 84 Years | 218 | 11.1% |
| 85 Years and Over | 37 | 1.9% |
| Total | 1,958 | 100.0% |
Housing Finances in Blue Point
Median Income by Occupancy in Blue Point
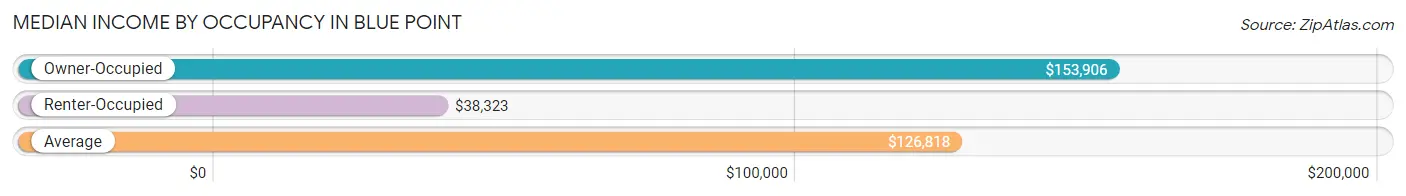
| Occupancy Type | # Households | Median Income |
| Owner-Occupied | 1,633 (83.4%) | $153,906 |
| Renter-Occupied | 325 (16.6%) | $38,323 |
| Average | 1,958 (100.0%) | $126,818 |
Occupancy by Householder Income Bracket in Blue Point
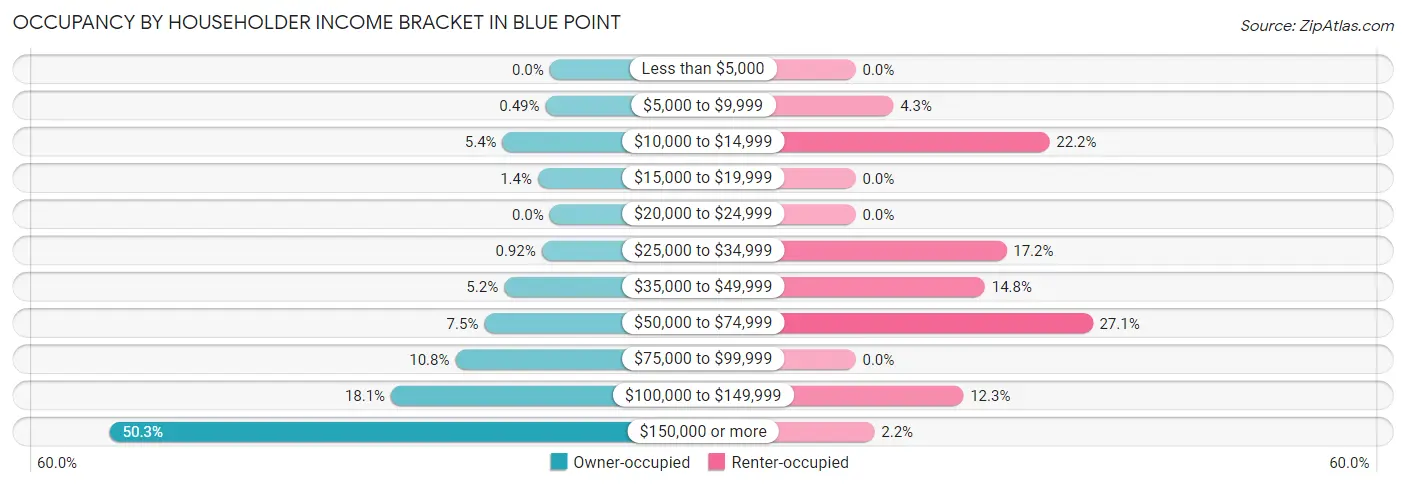
| Income Bracket | Owner-occupied | Renter-occupied |
| Less than $5,000 | 0 (0.0%) | 0 (0.0%) |
| $5,000 to $9,999 | 8 (0.5%) | 14 (4.3%) |
| $10,000 to $14,999 | 88 (5.4%) | 72 (22.2%) |
| $15,000 to $19,999 | 22 (1.3%) | 0 (0.0%) |
| $20,000 to $24,999 | 0 (0.0%) | 0 (0.0%) |
| $25,000 to $34,999 | 15 (0.9%) | 56 (17.2%) |
| $35,000 to $49,999 | 85 (5.2%) | 48 (14.8%) |
| $50,000 to $74,999 | 122 (7.5%) | 88 (27.1%) |
| $75,000 to $99,999 | 176 (10.8%) | 0 (0.0%) |
| $100,000 to $149,999 | 296 (18.1%) | 40 (12.3%) |
| $150,000 or more | 821 (50.3%) | 7 (2.1%) |
| Total | 1,633 (100.0%) | 325 (100.0%) |
Monthly Housing Cost Tiers in Blue Point
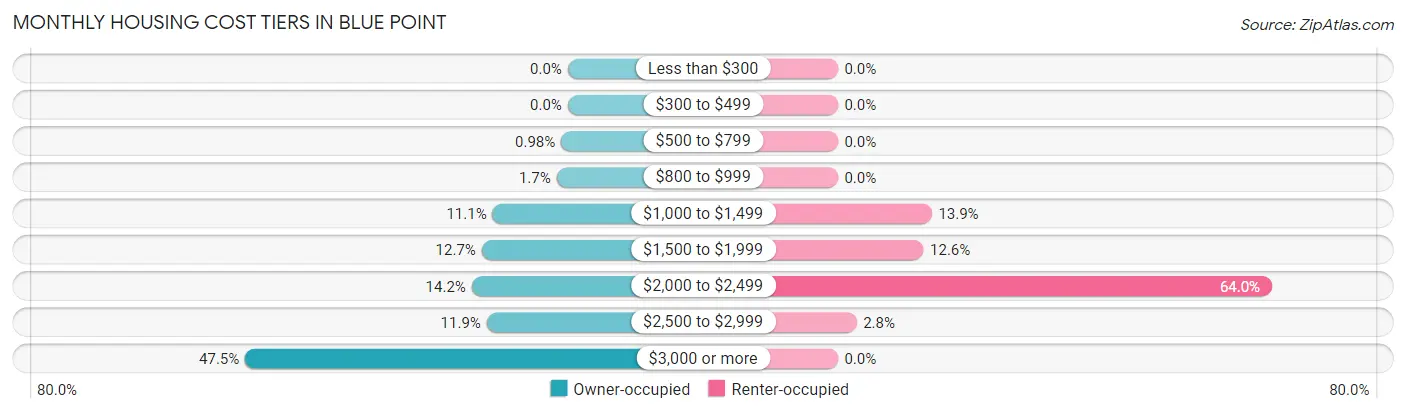
| Monthly Cost | Owner-occupied | Renter-occupied |
| Less than $300 | 0 (0.0%) | 0 (0.0%) |
| $300 to $499 | 0 (0.0%) | 0 (0.0%) |
| $500 to $799 | 16 (1.0%) | 0 (0.0%) |
| $800 to $999 | 27 (1.7%) | 0 (0.0%) |
| $1,000 to $1,499 | 181 (11.1%) | 45 (13.9%) |
| $1,500 to $1,999 | 207 (12.7%) | 41 (12.6%) |
| $2,000 to $2,499 | 231 (14.1%) | 208 (64.0%) |
| $2,500 to $2,999 | 195 (11.9%) | 9 (2.8%) |
| $3,000 or more | 776 (47.5%) | 0 (0.0%) |
| Total | 1,633 (100.0%) | 325 (100.0%) |
Physical Housing Characteristics in Blue Point
Housing Structures in Blue Point
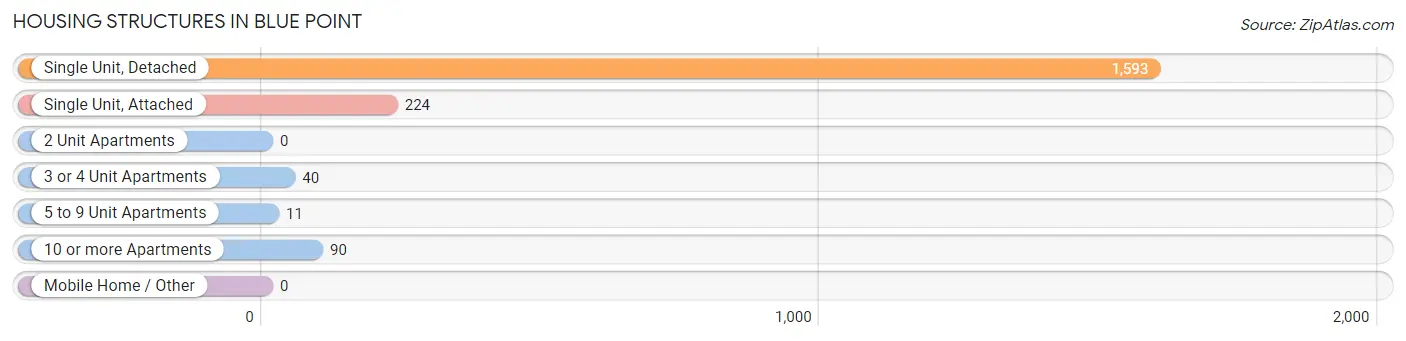
| Structure Type | # Housing Units | % Housing Units |
| Single Unit, Detached | 1,593 | 81.4% |
| Single Unit, Attached | 224 | 11.4% |
| 2 Unit Apartments | 0 | 0.0% |
| 3 or 4 Unit Apartments | 40 | 2.0% |
| 5 to 9 Unit Apartments | 11 | 0.6% |
| 10 or more Apartments | 90 | 4.6% |
| Mobile Home / Other | 0 | 0.0% |
| Total | 1,958 | 100.0% |
Housing Structures by Occupancy in Blue Point
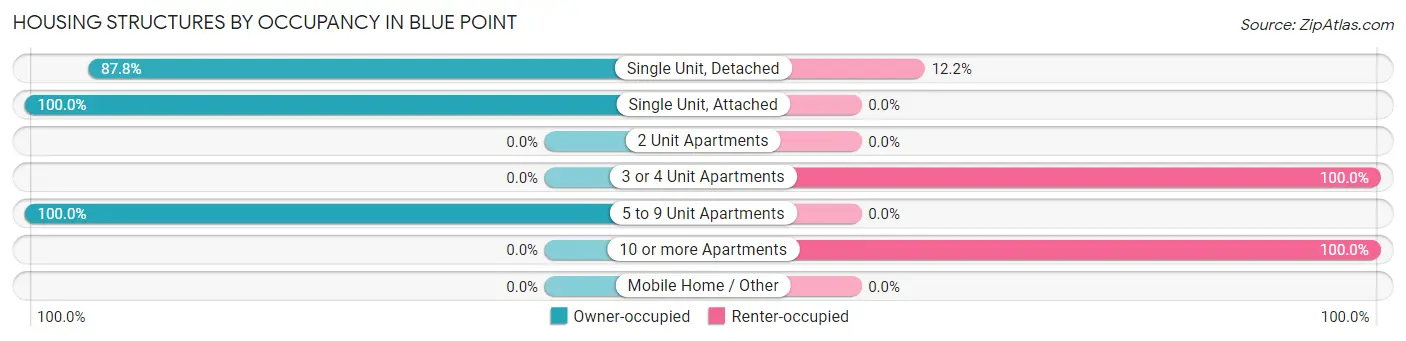
| Structure Type | Owner-occupied | Renter-occupied |
| Single Unit, Detached | 1,398 (87.8%) | 195 (12.2%) |
| Single Unit, Attached | 224 (100.0%) | 0 (0.0%) |
| 2 Unit Apartments | 0 (0.0%) | 0 (0.0%) |
| 3 or 4 Unit Apartments | 0 (0.0%) | 40 (100.0%) |
| 5 to 9 Unit Apartments | 11 (100.0%) | 0 (0.0%) |
| 10 or more Apartments | 0 (0.0%) | 90 (100.0%) |
| Mobile Home / Other | 0 (0.0%) | 0 (0.0%) |
| Total | 1,633 (83.4%) | 325 (16.6%) |
Housing Structures by Number of Rooms in Blue Point
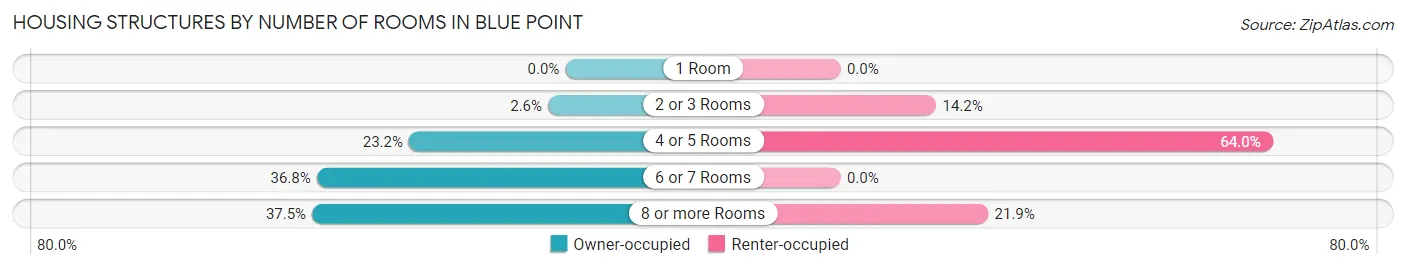
| Number of Rooms | Owner-occupied | Renter-occupied |
| 1 Room | 0 (0.0%) | 0 (0.0%) |
| 2 or 3 Rooms | 42 (2.6%) | 46 (14.1%) |
| 4 or 5 Rooms | 378 (23.2%) | 208 (64.0%) |
| 6 or 7 Rooms | 601 (36.8%) | 0 (0.0%) |
| 8 or more Rooms | 612 (37.5%) | 71 (21.8%) |
| Total | 1,633 (100.0%) | 325 (100.0%) |
Housing Structure by Heating Type in Blue Point
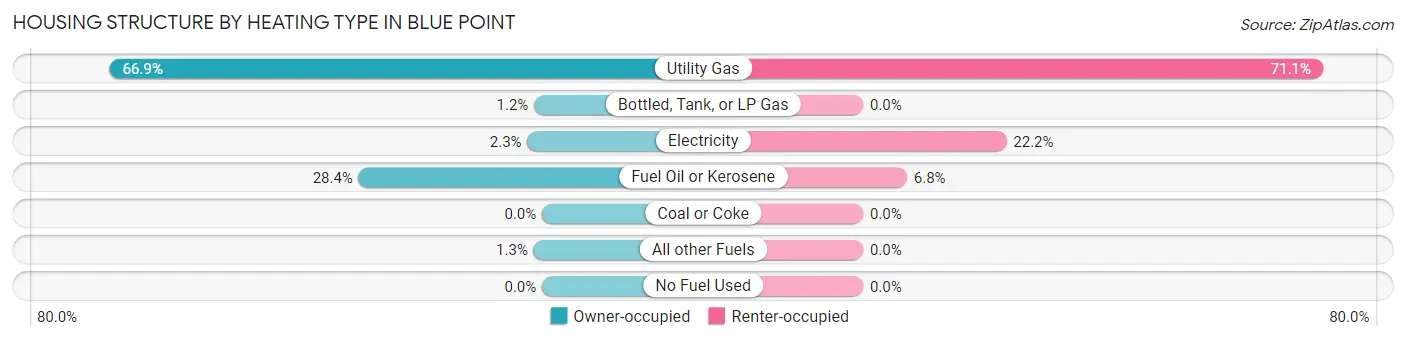
| Heating Type | Owner-occupied | Renter-occupied |
| Utility Gas | 1,092 (66.9%) | 231 (71.1%) |
| Bottled, Tank, or LP Gas | 20 (1.2%) | 0 (0.0%) |
| Electricity | 37 (2.3%) | 72 (22.2%) |
| Fuel Oil or Kerosene | 463 (28.3%) | 22 (6.8%) |
| Coal or Coke | 0 (0.0%) | 0 (0.0%) |
| All other Fuels | 21 (1.3%) | 0 (0.0%) |
| No Fuel Used | 0 (0.0%) | 0 (0.0%) |
| Total | 1,633 (100.0%) | 325 (100.0%) |
Household Vehicle Usage in Blue Point
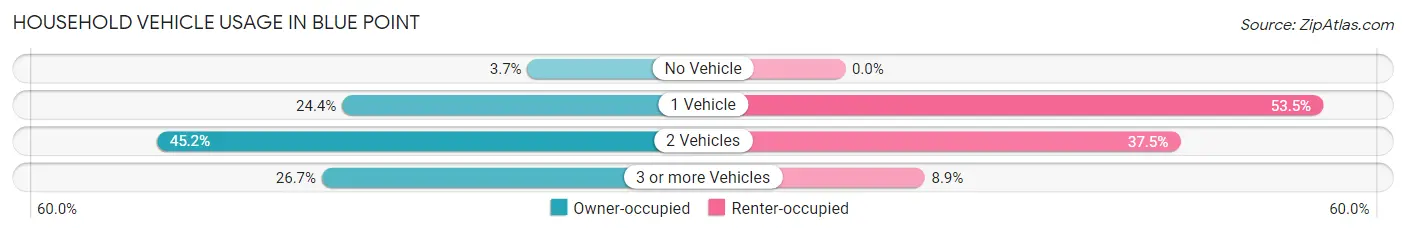
| Vehicles per Household | Owner-occupied | Renter-occupied |
| No Vehicle | 60 (3.7%) | 0 (0.0%) |
| 1 Vehicle | 399 (24.4%) | 174 (53.5%) |
| 2 Vehicles | 738 (45.2%) | 122 (37.5%) |
| 3 or more Vehicles | 436 (26.7%) | 29 (8.9%) |
| Total | 1,633 (100.0%) | 325 (100.0%) |
Real Estate & Mortgages in Blue Point
Real Estate and Mortgage Overview in Blue Point
| Characteristic | Without Mortgage | With Mortgage |
| Housing Units | 447 | 1,186 |
| Median Property Value | $562,300 | $570,700 |
| Median Household Income | $104,107 | $696 |
| Monthly Housing Costs | $1,501 | $757 |
| Real Estate Taxes | $10,001 | $28 |
Property Value by Mortgage Status in Blue Point
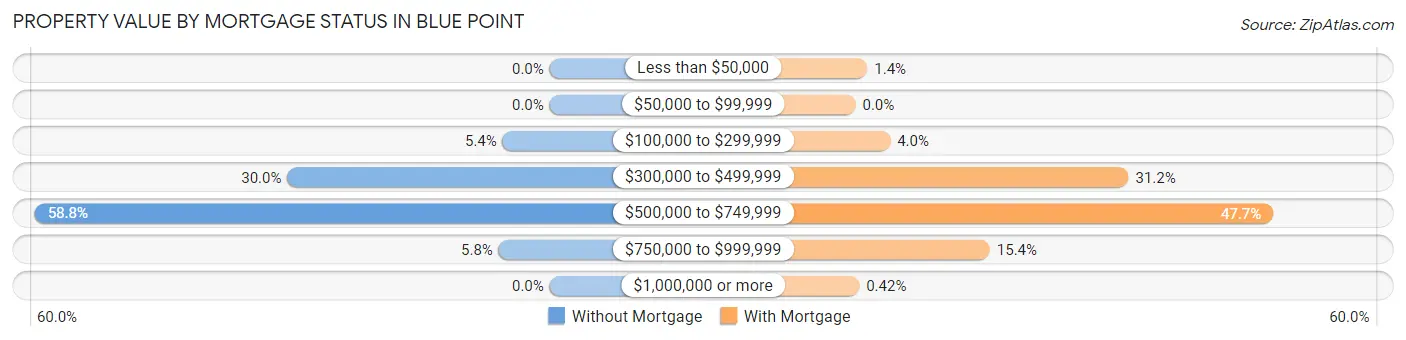
| Property Value | Without Mortgage | With Mortgage |
| Less than $50,000 | 0 (0.0%) | 16 (1.3%) |
| $50,000 to $99,999 | 0 (0.0%) | 0 (0.0%) |
| $100,000 to $299,999 | 24 (5.4%) | 47 (4.0%) |
| $300,000 to $499,999 | 134 (30.0%) | 370 (31.2%) |
| $500,000 to $749,999 | 263 (58.8%) | 566 (47.7%) |
| $750,000 to $999,999 | 26 (5.8%) | 182 (15.3%) |
| $1,000,000 or more | 0 (0.0%) | 5 (0.4%) |
| Total | 447 (100.0%) | 1,186 (100.0%) |
Household Income by Mortgage Status in Blue Point
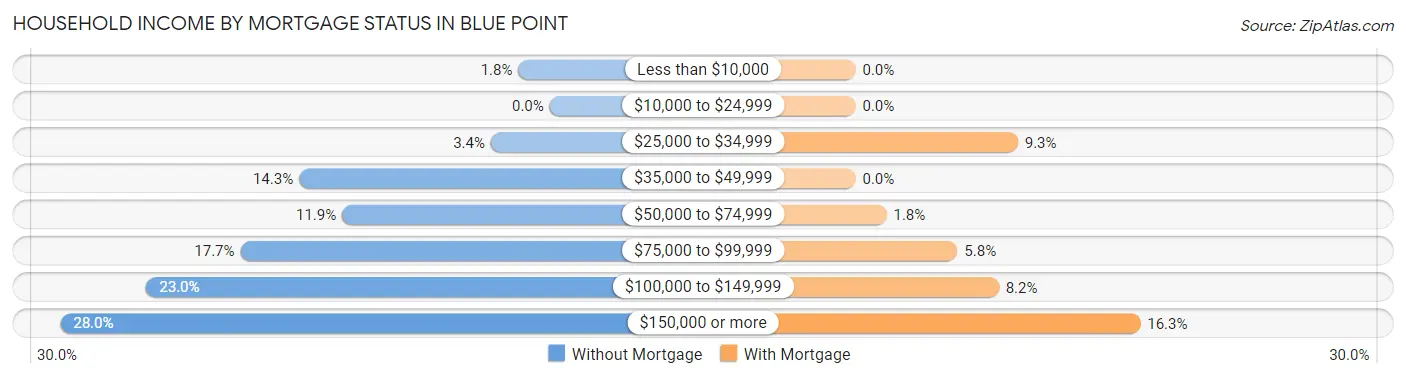
| Household Income | Without Mortgage | With Mortgage |
| Less than $10,000 | 8 (1.8%) | 0 (0.0%) |
| $10,000 to $24,999 | 0 (0.0%) | 0 (0.0%) |
| $25,000 to $34,999 | 15 (3.4%) | 110 (9.3%) |
| $35,000 to $49,999 | 64 (14.3%) | 0 (0.0%) |
| $50,000 to $74,999 | 53 (11.9%) | 21 (1.8%) |
| $75,000 to $99,999 | 79 (17.7%) | 69 (5.8%) |
| $100,000 to $149,999 | 103 (23.0%) | 97 (8.2%) |
| $150,000 or more | 125 (28.0%) | 193 (16.3%) |
| Total | 447 (100.0%) | 1,186 (100.0%) |
Property Value to Household Income Ratio in Blue Point
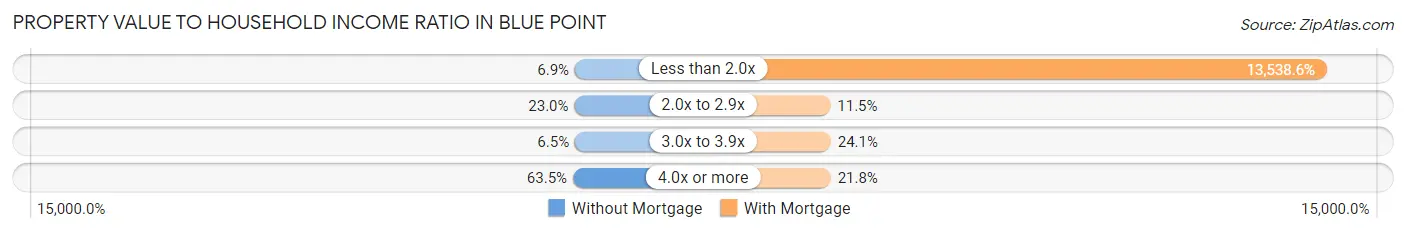
| Value-to-Income Ratio | Without Mortgage | With Mortgage |
| Less than 2.0x | 31 (6.9%) | 160,568 (13,538.6%) |
| 2.0x to 2.9x | 103 (23.0%) | 136 (11.5%) |
| 3.0x to 3.9x | 29 (6.5%) | 286 (24.1%) |
| 4.0x or more | 284 (63.5%) | 258 (21.7%) |
| Total | 447 (100.0%) | 1,186 (100.0%) |
Real Estate Taxes by Mortgage Status in Blue Point
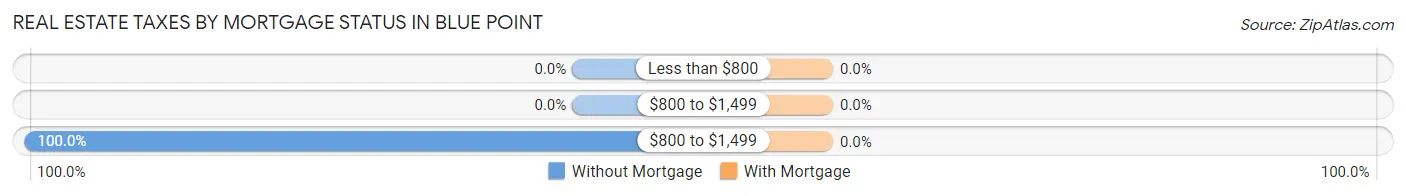
| Property Taxes | Without Mortgage | With Mortgage |
| Less than $800 | 0 (0.0%) | 0 (0.0%) |
| $800 to $1,499 | 0 (0.0%) | 0 (0.0%) |
| $800 to $1,499 | 447 (100.0%) | 0 (0.0%) |
| Total | 447 (100.0%) | 1,186 (100.0%) |
Health & Disability in Blue Point
Health Insurance Coverage by Age in Blue Point
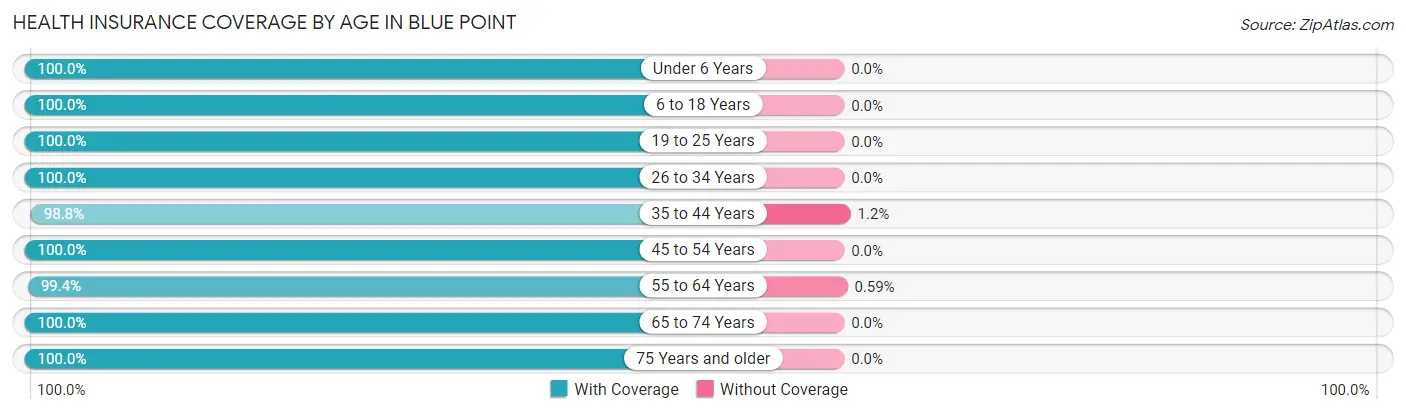
| Age Bracket | With Coverage | Without Coverage |
| Under 6 Years | 173 (100.0%) | 0 (0.0%) |
| 6 to 18 Years | 724 (100.0%) | 0 (0.0%) |
| 19 to 25 Years | 268 (100.0%) | 0 (0.0%) |
| 26 to 34 Years | 391 (100.0%) | 0 (0.0%) |
| 35 to 44 Years | 589 (98.8%) | 7 (1.2%) |
| 45 to 54 Years | 569 (100.0%) | 0 (0.0%) |
| 55 to 64 Years | 843 (99.4%) | 5 (0.6%) |
| 65 to 74 Years | 588 (100.0%) | 0 (0.0%) |
| 75 Years and older | 459 (100.0%) | 0 (0.0%) |
| Total | 4,604 (99.7%) | 12 (0.3%) |
Health Insurance Coverage by Citizenship Status in Blue Point
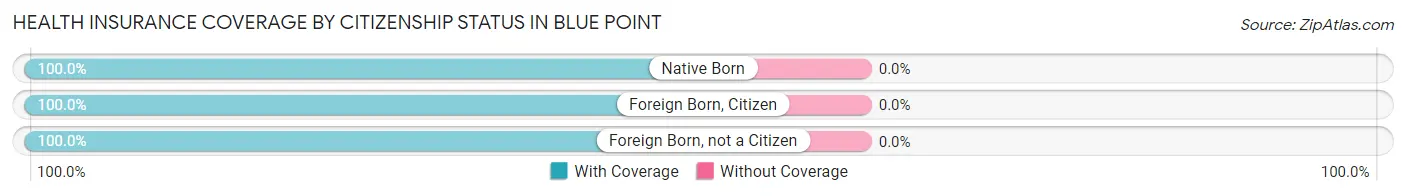
| Citizenship Status | With Coverage | Without Coverage |
| Native Born | 173 (100.0%) | 0 (0.0%) |
| Foreign Born, Citizen | 724 (100.0%) | 0 (0.0%) |
| Foreign Born, not a Citizen | 268 (100.0%) | 0 (0.0%) |
Health Insurance Coverage by Household Income in Blue Point
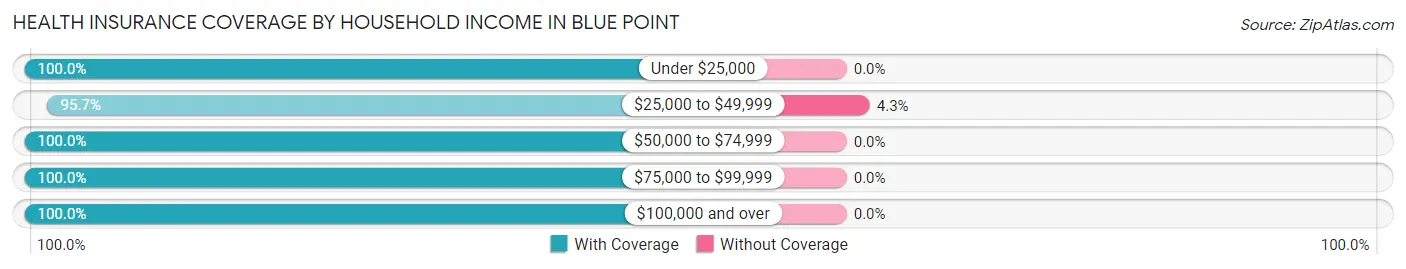
| Household Income | With Coverage | Without Coverage |
| Under $25,000 | 286 (100.0%) | 0 (0.0%) |
| $25,000 to $49,999 | 266 (95.7%) | 12 (4.3%) |
| $50,000 to $74,999 | 360 (100.0%) | 0 (0.0%) |
| $75,000 to $99,999 | 432 (100.0%) | 0 (0.0%) |
| $100,000 and over | 3,212 (100.0%) | 0 (0.0%) |
Public vs Private Health Insurance Coverage by Age in Blue Point
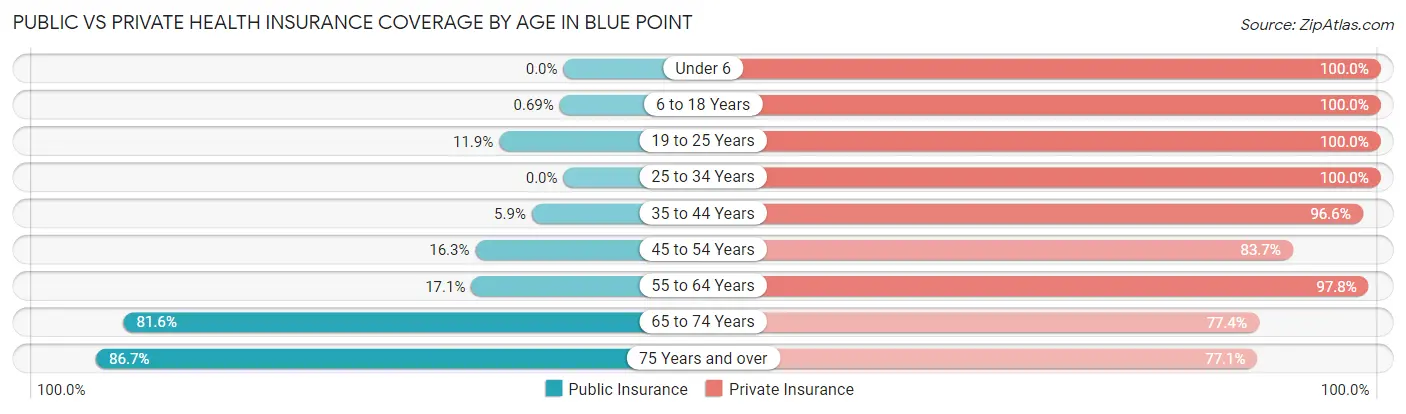
| Age Bracket | Public Insurance | Private Insurance |
| Under 6 | 0 (0.0%) | 173 (100.0%) |
| 6 to 18 Years | 5 (0.7%) | 724 (100.0%) |
| 19 to 25 Years | 32 (11.9%) | 268 (100.0%) |
| 25 to 34 Years | 0 (0.0%) | 391 (100.0%) |
| 35 to 44 Years | 35 (5.9%) | 576 (96.6%) |
| 45 to 54 Years | 93 (16.3%) | 476 (83.7%) |
| 55 to 64 Years | 145 (17.1%) | 829 (97.8%) |
| 65 to 74 Years | 480 (81.6%) | 455 (77.4%) |
| 75 Years and over | 398 (86.7%) | 354 (77.1%) |
| Total | 1,188 (25.7%) | 4,246 (92.0%) |
Disability Status by Sex by Age in Blue Point
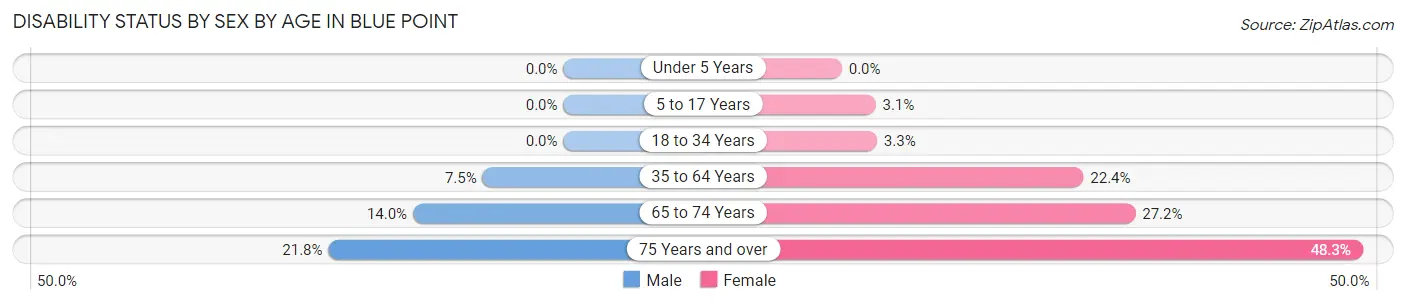
| Age Bracket | Male | Female |
| Under 5 Years | 0 (0.0%) | 0 (0.0%) |
| 5 to 17 Years | 0 (0.0%) | 13 (3.1%) |
| 18 to 34 Years | 0 (0.0%) | 10 (3.3%) |
| 35 to 64 Years | 69 (7.5%) | 245 (22.4%) |
| 65 to 74 Years | 37 (14.0%) | 88 (27.2%) |
| 75 Years and over | 41 (21.8%) | 131 (48.3%) |
Disability Class by Sex by Age in Blue Point
Disability Class: Hearing Difficulty
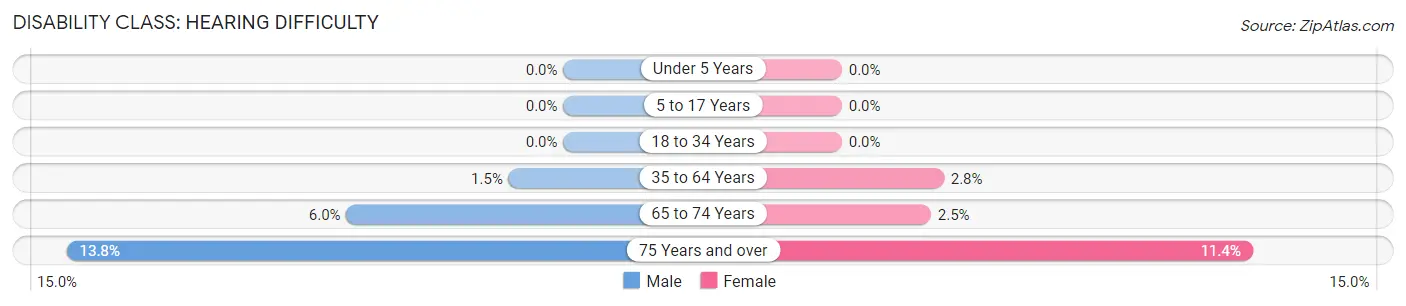
| Age Bracket | Male | Female |
| Under 5 Years | 0 (0.0%) | 0 (0.0%) |
| 5 to 17 Years | 0 (0.0%) | 0 (0.0%) |
| 18 to 34 Years | 0 (0.0%) | 0 (0.0%) |
| 35 to 64 Years | 14 (1.5%) | 31 (2.8%) |
| 65 to 74 Years | 16 (6.0%) | 8 (2.5%) |
| 75 Years and over | 26 (13.8%) | 31 (11.4%) |
Disability Class: Vision Difficulty
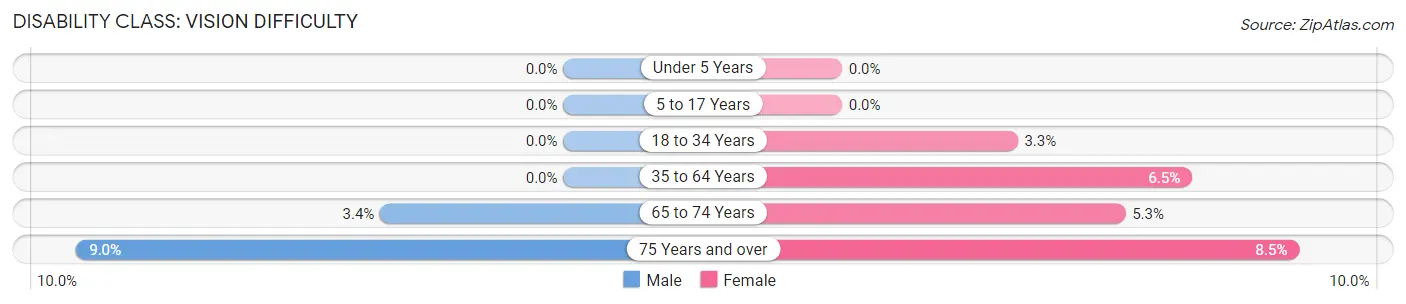
| Age Bracket | Male | Female |
| Under 5 Years | 0 (0.0%) | 0 (0.0%) |
| 5 to 17 Years | 0 (0.0%) | 0 (0.0%) |
| 18 to 34 Years | 0 (0.0%) | 10 (3.3%) |
| 35 to 64 Years | 0 (0.0%) | 71 (6.5%) |
| 65 to 74 Years | 9 (3.4%) | 17 (5.3%) |
| 75 Years and over | 17 (9.0%) | 23 (8.5%) |
Disability Class: Cognitive Difficulty

| Age Bracket | Male | Female |
| 5 to 17 Years | 0 (0.0%) | 13 (3.1%) |
| 18 to 34 Years | 0 (0.0%) | 0 (0.0%) |
| 35 to 64 Years | 8 (0.9%) | 84 (7.7%) |
| 65 to 74 Years | 0 (0.0%) | 34 (10.5%) |
| 75 Years and over | 17 (9.0%) | 77 (28.4%) |
Disability Class: Ambulatory Difficulty
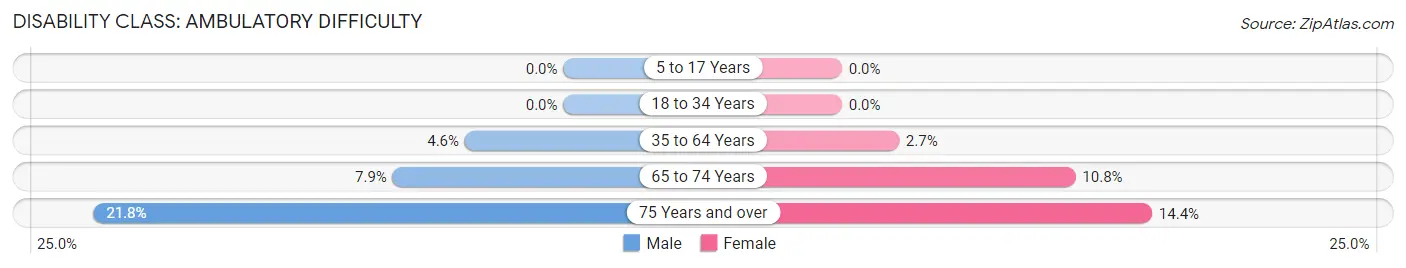
| Age Bracket | Male | Female |
| 5 to 17 Years | 0 (0.0%) | 0 (0.0%) |
| 18 to 34 Years | 0 (0.0%) | 0 (0.0%) |
| 35 to 64 Years | 42 (4.6%) | 29 (2.6%) |
| 65 to 74 Years | 21 (7.9%) | 35 (10.8%) |
| 75 Years and over | 41 (21.8%) | 39 (14.4%) |
Disability Class: Self-Care Difficulty
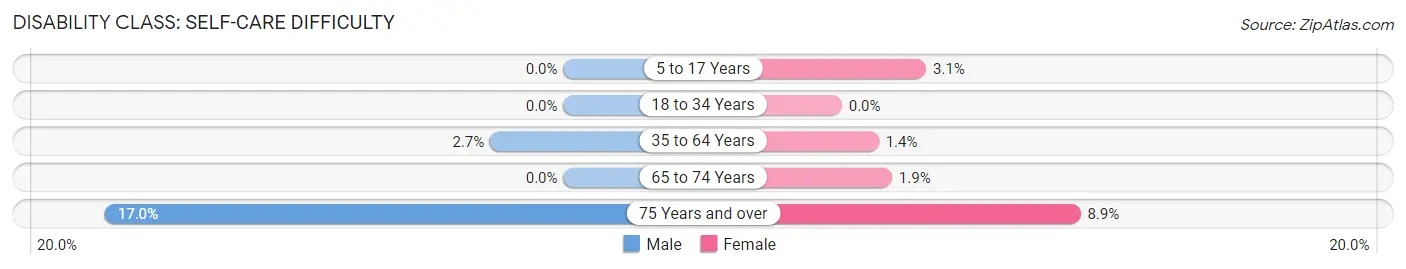
| Age Bracket | Male | Female |
| 5 to 17 Years | 0 (0.0%) | 13 (3.1%) |
| 18 to 34 Years | 0 (0.0%) | 0 (0.0%) |
| 35 to 64 Years | 25 (2.7%) | 15 (1.4%) |
| 65 to 74 Years | 0 (0.0%) | 6 (1.9%) |
| 75 Years and over | 32 (17.0%) | 24 (8.9%) |
Technology Access in Blue Point
Computing Device Access in Blue Point
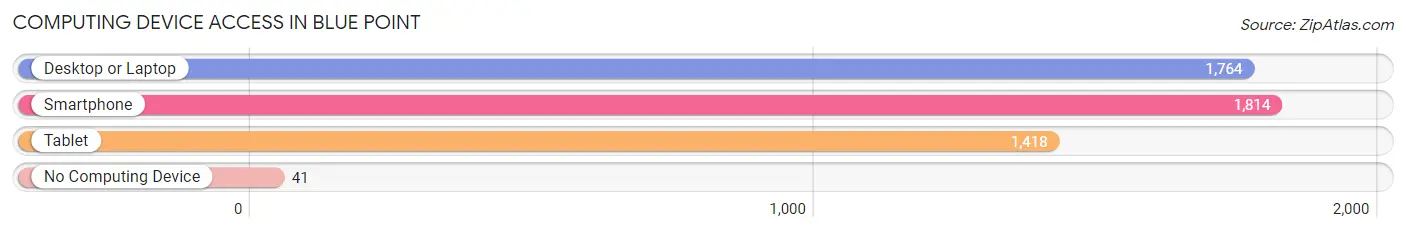
| Device Type | # Households | % Households |
| Desktop or Laptop | 1,764 | 90.1% |
| Smartphone | 1,814 | 92.6% |
| Tablet | 1,418 | 72.4% |
| No Computing Device | 41 | 2.1% |
| Total | 1,958 | 100.0% |
Internet Access in Blue Point
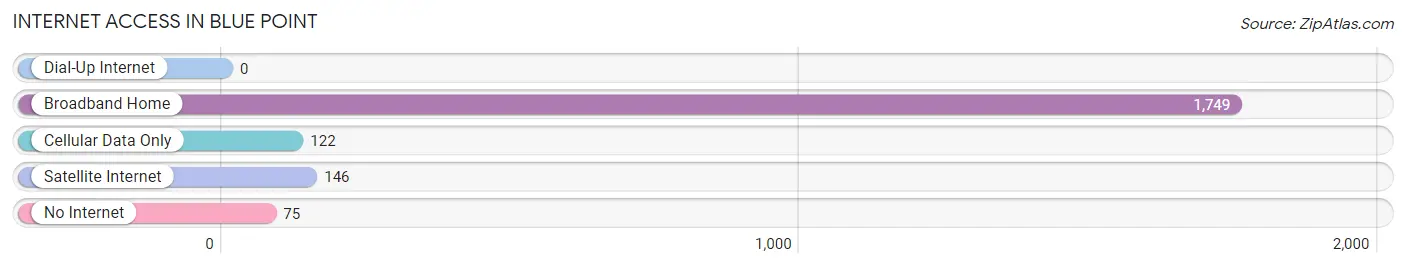
| Internet Type | # Households | % Households |
| Dial-Up Internet | 0 | 0.0% |
| Broadband Home | 1,749 | 89.3% |
| Cellular Data Only | 122 | 6.2% |
| Satellite Internet | 146 | 7.5% |
| No Internet | 75 | 3.8% |
| Total | 1,958 | 100.0% |
Blue Point Summary
Point Blue is a hamlet located in the Town of Islip in Suffolk County, New York. It is situated on the south shore of Long Island, approximately 50 miles east of New York City. The hamlet is bordered by the Great South Bay to the north, the Atlantic Ocean to the south, and the Fire Island National Seashore to the east.
History
The area that is now known as Blue Point was originally inhabited by the Secatogue Indians, a sub-tribe of the Algonquin Nation. The Secatogue Indians were a peaceful people who lived off the land and the waters of the Great South Bay. The first European settlers arrived in the area in the late 1600s, and the hamlet was officially established in 1790.
The hamlet was originally known as “Blue Point” due to the abundance of blue mussels that were found in the area. The mussels were harvested and used for food, bait, and fertilizer. The hamlet was also known for its oyster beds, which were harvested for food and for the production of pearls.
In the late 1800s, Blue Point became a popular summer destination for wealthy New Yorkers. The area was known for its beautiful beaches, fishing, and boating. The hamlet also became a popular spot for artists, writers, and musicians.
Geography
Blue Point is located on the south shore of Long Island, approximately 50 miles east of New York City. The hamlet is bordered by the Great South Bay to the north, the Atlantic Ocean to the south, and the Fire Island National Seashore to the east.
The hamlet is situated on a peninsula, with the Great South Bay to the north and the Atlantic Ocean to the south. The hamlet is home to several beaches, including Blue Point Beach, which is located on the Great South Bay.
The hamlet is also home to several parks, including the Blue Point Nature Preserve, which is located on the Great South Bay. The preserve is home to a variety of wildlife, including ospreys, herons, and egrets.
Economy
The economy of Blue Point is largely based on tourism and recreation. The hamlet is home to several beaches, parks, and marinas, which attract visitors from all over the world. The hamlet is also home to several restaurants, bars, and shops, which cater to both locals and visitors.
The hamlet is also home to several businesses, including boat builders, marinas, and seafood processors. The hamlet is also home to several commercial fishing operations, which harvest a variety of seafood, including clams, oysters, and blue mussels.
Demographics
As of the 2010 census, the population of Blue Point was 5,764. The population is largely white (94.3%), with small percentages of African American (2.2%), Asian (1.7%), and Hispanic (1.6%) residents. The median household income is $87,917, and the median home value is $521,400.
Conclusion
Blue Point is a hamlet located in the Town of Islip in Suffolk County, New York. It is situated on the south shore of Long Island, approximately 50 miles east of New York City. The hamlet is bordered by the Great South Bay to the north, the Atlantic Ocean to the south, and the Fire Island National Seashore to the east. The economy of Blue Point is largely based on tourism and recreation, and the population is largely white. The hamlet is home to several beaches, parks, and marinas, which attract visitors from all over the world.
Common Questions
What is Per Capita Income in Blue Point?
Per Capita income in Blue Point is $58,968.
What is the Median Family Income in Blue Point?
Median Family Income in Blue Point is $159,068.
What is the Median Household income in Blue Point?
Median Household Income in Blue Point is $126,818.
What is Income or Wage Gap in Blue Point?
Income or Wage Gap in Blue Point is 31.2%.
Women in Blue Point earn 68.8 cents for every dollar earned by a man.
What is Inequality or Gini Index in Blue Point?
Inequality or Gini Index in Blue Point is 0.39.
What is the Total Population of Blue Point?
Total Population of Blue Point is 4,616.
What is the Total Male Population of Blue Point?
Total Male Population of Blue Point is 2,109.
What is the Total Female Population of Blue Point?
Total Female Population of Blue Point is 2,507.
What is the Ratio of Males per 100 Females in Blue Point?
There are 84.12 Males per 100 Females in Blue Point.
What is the Ratio of Females per 100 Males in Blue Point?
There are 118.87 Females per 100 Males in Blue Point.
What is the Median Population Age in Blue Point?
Median Population Age in Blue Point is 46.8 Years.
What is the Average Family Size in Blue Point
Average Family Size in Blue Point is 2.9 People.
What is the Average Household Size in Blue Point
Average Household Size in Blue Point is 2.3 People.
How Large is the Labor Force in Blue Point?
There are 2,586 People in the Labor Forcein in Blue Point.
What is the Percentage of People in the Labor Force in Blue Point?
66.8% of People are in the Labor Force in Blue Point.
What is the Unemployment Rate in Blue Point?
Unemployment Rate in Blue Point is 8.4%.