Silver Creek, NY Map & Demographics
Silver Creek Map
Silver Creek Overview
$31,198
PER CAPITA INCOME
$85,938
AVG FAMILY INCOME
$67,396
AVG HOUSEHOLD INCOME
34.8%
WAGE / INCOME GAP [ % ]
65.2¢/ $1
WAGE / INCOME GAP [ $ ]
0.40
INEQUALITY / GINI INDEX
2,623
TOTAL POPULATION
1,300
MALE POPULATION
1,323
FEMALE POPULATION
98.26
MALES / 100 FEMALES
101.77
FEMALES / 100 MALES
38.4
MEDIAN AGE
2.9
AVG FAMILY SIZE
2.4
AVG HOUSEHOLD SIZE
1,314
LABOR FORCE [ PEOPLE ]
62.7%
PERCENT IN LABOR FORCE
6.4%
UNEMPLOYMENT RATE
Silver Creek Zip Codes
Silver Creek Area Codes
Income in Silver Creek
Income Overview in Silver Creek
Per Capita Income in Silver Creek is $31,198, while median incomes of families and households are $85,938 and $67,396 respectively.
| Characteristic | Number | Measure |
| Per Capita Income | 2,623 | $31,198 |
| Median Family Income | 693 | $85,938 |
| Mean Family Income | 693 | $89,791 |
| Median Household Income | 1,082 | $67,396 |
| Mean Household Income | 1,082 | $74,695 |
| Income Deficit | 693 | $0 |
| Wage / Income Gap (%) | 2,623 | 34.77% |
| Wage / Income Gap ($) | 2,623 | 65.23¢ per $1 |
| Gini / Inequality Index | 2,623 | 0.40 |
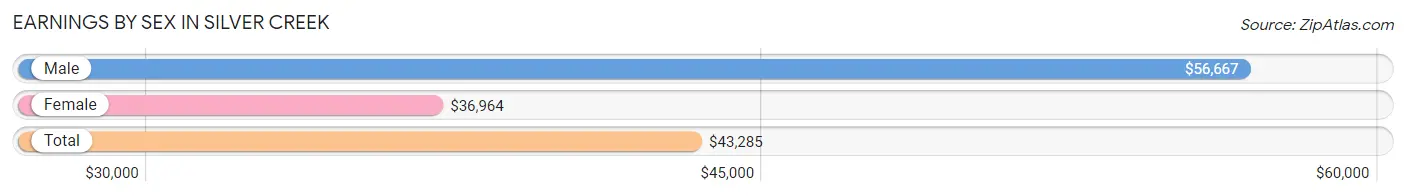
Earnings by Sex in Silver Creek
Average Earnings in Silver Creek are $43,285, $56,667 for men and $36,964 for women, a difference of 34.8%.
| Sex | Number | Average Earnings |
| Male | 696 (52.8%) | $56,667 |
| Female | 623 (47.2%) | $36,964 |
| Total | 1,319 (100.0%) | $43,285 |
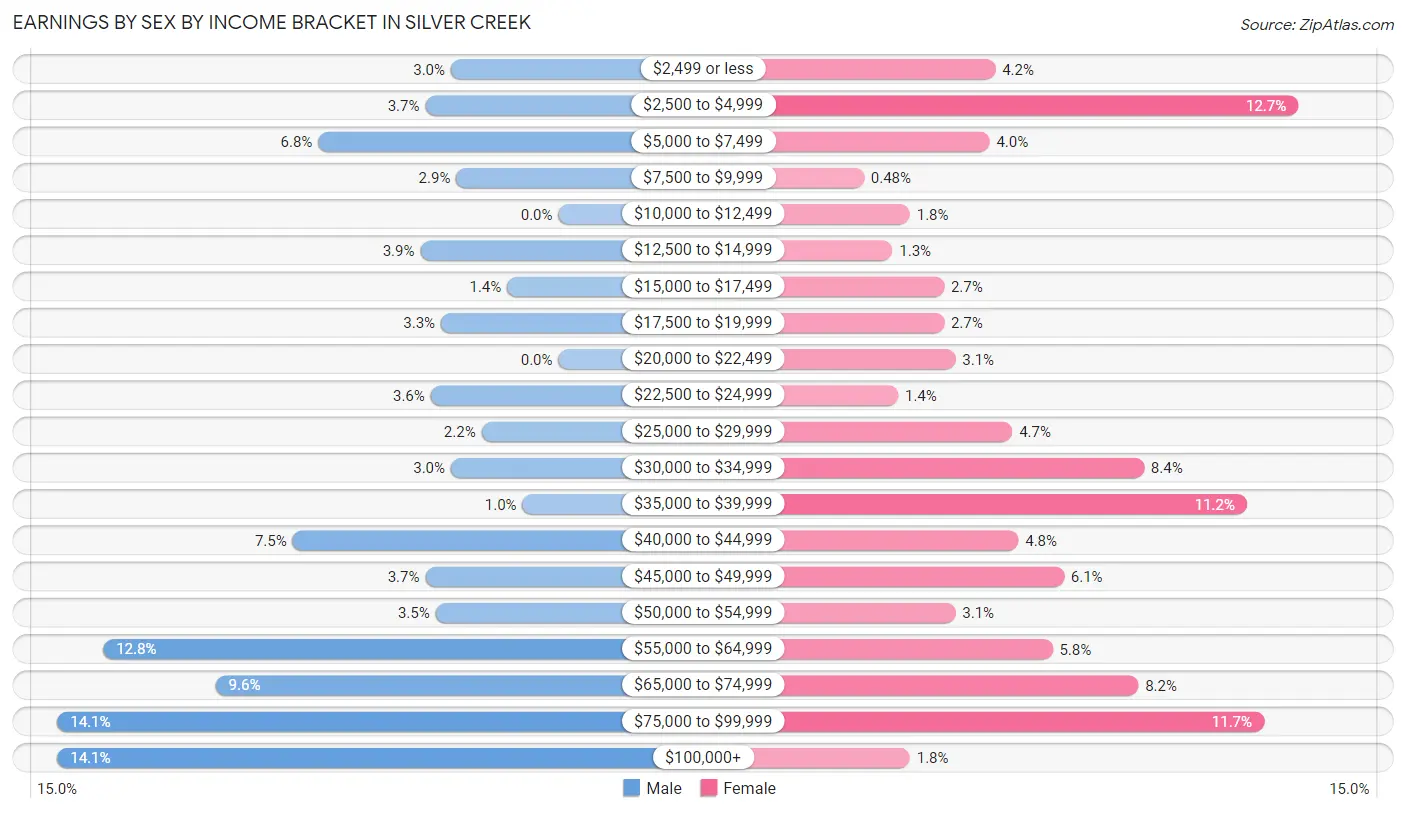
Earnings by Sex by Income Bracket in Silver Creek
The most common earnings brackets in Silver Creek are $75,000 to $99,999 for men (98 | 14.1%) and $2,500 to $4,999 for women (79 | 12.7%).
| Income | Male | Female |
| $2,499 or less | 21 (3.0%) | 26 (4.2%) |
| $2,500 to $4,999 | 26 (3.7%) | 79 (12.7%) |
| $5,000 to $7,499 | 47 (6.8%) | 25 (4.0%) |
| $7,500 to $9,999 | 20 (2.9%) | 3 (0.5%) |
| $10,000 to $12,499 | 0 (0.0%) | 11 (1.8%) |
| $12,500 to $14,999 | 27 (3.9%) | 8 (1.3%) |
| $15,000 to $17,499 | 10 (1.4%) | 17 (2.7%) |
| $17,500 to $19,999 | 23 (3.3%) | 17 (2.7%) |
| $20,000 to $22,499 | 0 (0.0%) | 19 (3.0%) |
| $22,500 to $24,999 | 25 (3.6%) | 9 (1.4%) |
| $25,000 to $29,999 | 15 (2.2%) | 29 (4.6%) |
| $30,000 to $34,999 | 21 (3.0%) | 52 (8.4%) |
| $35,000 to $39,999 | 7 (1.0%) | 70 (11.2%) |
| $40,000 to $44,999 | 52 (7.5%) | 30 (4.8%) |
| $45,000 to $49,999 | 26 (3.7%) | 38 (6.1%) |
| $50,000 to $54,999 | 24 (3.5%) | 19 (3.0%) |
| $55,000 to $64,999 | 89 (12.8%) | 36 (5.8%) |
| $65,000 to $74,999 | 67 (9.6%) | 51 (8.2%) |
| $75,000 to $99,999 | 98 (14.1%) | 73 (11.7%) |
| $100,000+ | 98 (14.1%) | 11 (1.8%) |
| Total | 696 (100.0%) | 623 (100.0%) |
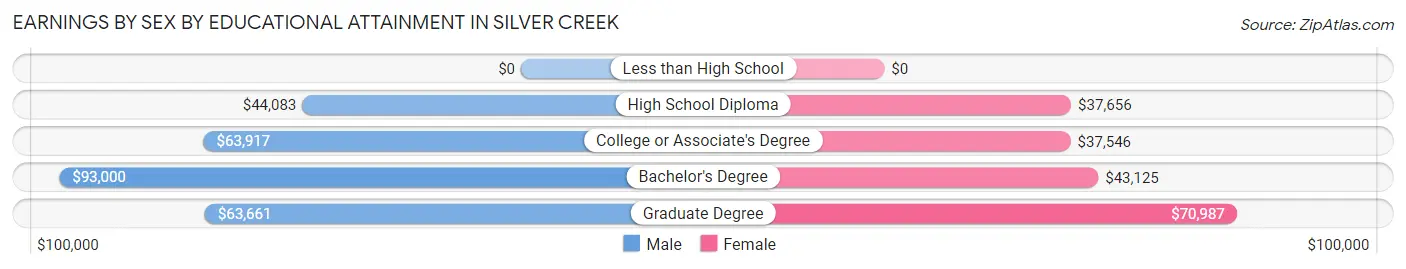
Earnings by Sex by Educational Attainment in Silver Creek
Average earnings in Silver Creek are $58,821 for men and $38,571 for women, a difference of 34.4%. Men with an educational attainment of bachelor's degree enjoy the highest average annual earnings of $93,000, while those with high school diploma education earn the least with $44,083. Women with an educational attainment of graduate degree earn the most with the average annual earnings of $70,987, while those with college or associate's degree education have the smallest earnings of $37,546.
| Educational Attainment | Male Income | Female Income |
| Less than High School | - | - |
| High School Diploma | $44,083 | $37,656 |
| College or Associate's Degree | $63,917 | $37,546 |
| Bachelor's Degree | $93,000 | $43,125 |
| Graduate Degree | $63,661 | $70,987 |
| Total | $58,821 | $38,571 |
Family Income in Silver Creek
Family Income Brackets in Silver Creek
According to the Silver Creek family income data, there are 221 families falling into the $100,000 to $149,999 income range, which is the most common income bracket and makes up 31.9% of all families. Conversely, the $10,000 to $14,999 income bracket is the least frequent group with only 6 families (0.9%) belonging to this category.
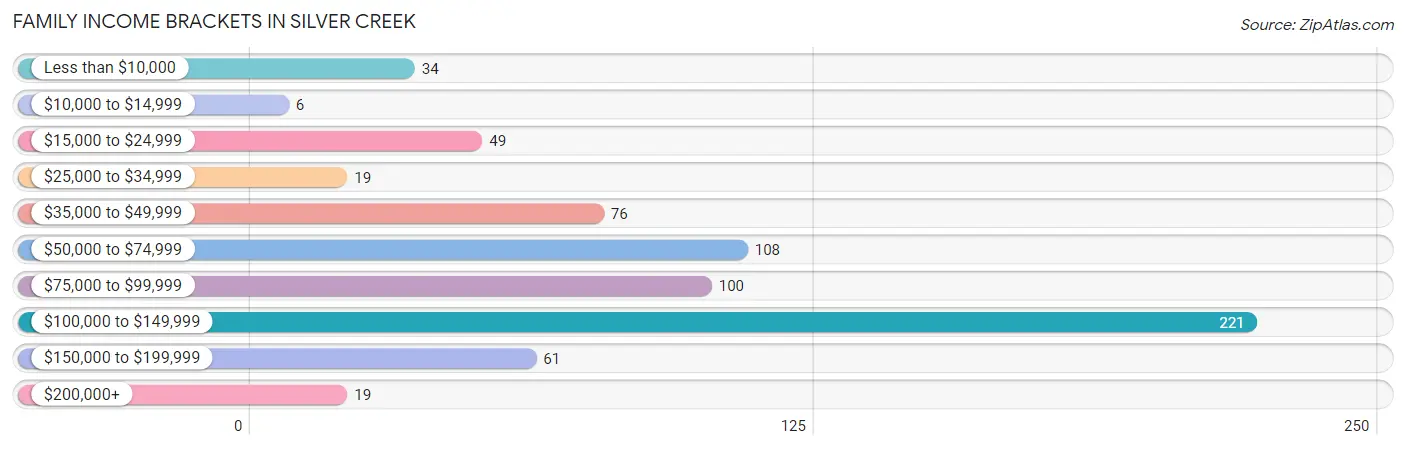
| Income Bracket | # Families | % Families |
| Less than $10,000 | 34 | 4.9% |
| $10,000 to $14,999 | 6 | 0.9% |
| $15,000 to $24,999 | 49 | 7.1% |
| $25,000 to $34,999 | 19 | 2.7% |
| $35,000 to $49,999 | 76 | 11.0% |
| $50,000 to $74,999 | 108 | 15.6% |
| $75,000 to $99,999 | 100 | 14.4% |
| $100,000 to $149,999 | 221 | 31.9% |
| $150,000 to $199,999 | 61 | 8.8% |
| $200,000+ | 19 | 2.7% |
Family Income by Famaliy Size in Silver Creek
3-person families (231 | 33.3%) account for the highest median family income in Silver Creek with $117,572 per family, while 3-person families (231 | 33.3%) have the highest median income of $39,191 per family member.
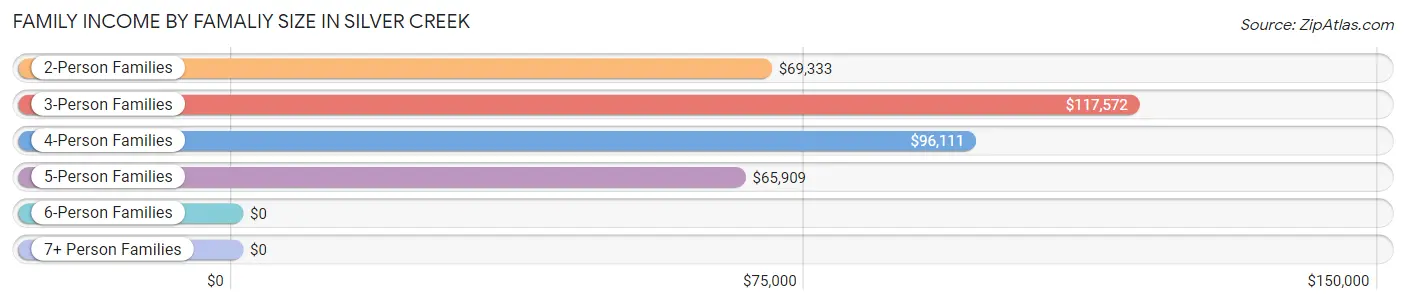
| Income Bracket | # Families | Median Income |
| 2-Person Families | 282 (40.7%) | $69,333 |
| 3-Person Families | 231 (33.3%) | $117,572 |
| 4-Person Families | 144 (20.8%) | $96,111 |
| 5-Person Families | 26 (3.7%) | $65,909 |
| 6-Person Families | 10 (1.4%) | $0 |
| 7+ Person Families | 0 (0.0%) | $0 |
| Total | 693 (100.0%) | $85,938 |
Family Income by Number of Earners in Silver Creek
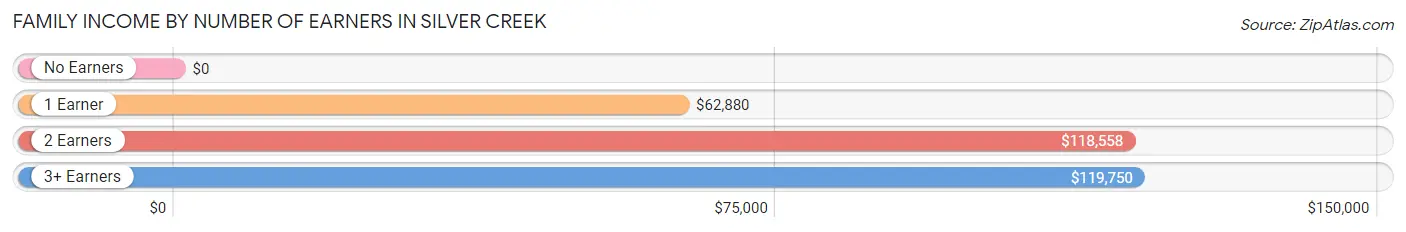
| Number of Earners | # Families | Median Income |
| No Earners | 103 (14.9%) | $0 |
| 1 Earner | 261 (37.7%) | $62,880 |
| 2 Earners | 300 (43.3%) | $118,558 |
| 3+ Earners | 29 (4.2%) | $119,750 |
| Total | 693 (100.0%) | $85,938 |
Household Income in Silver Creek
Household Income Brackets in Silver Creek
With 296 households falling in the category, the $100,000 to $149,999 income range is the most frequent in Silver Creek, accounting for 27.4% of all households. In contrast, only 19 households (1.8%) fall into the $25,000 to $34,999 income bracket, making it the least populous group.
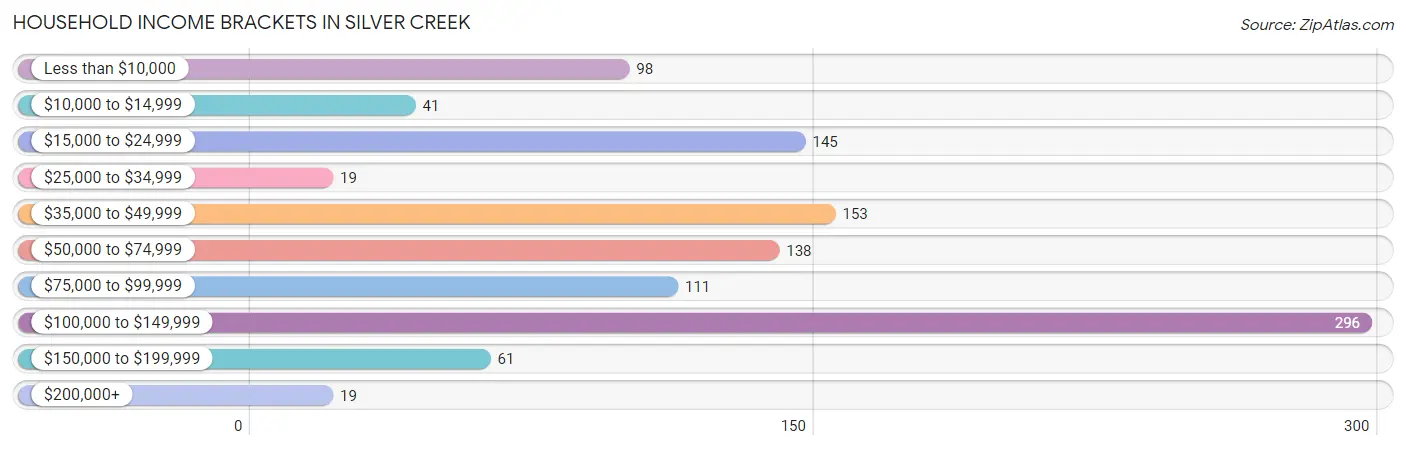
| Income Bracket | # Households | % Households |
| Less than $10,000 | 98 | 9.1% |
| $10,000 to $14,999 | 41 | 3.8% |
| $15,000 to $24,999 | 145 | 13.4% |
| $25,000 to $34,999 | 19 | 1.8% |
| $35,000 to $49,999 | 153 | 14.1% |
| $50,000 to $74,999 | 138 | 12.8% |
| $75,000 to $99,999 | 111 | 10.3% |
| $100,000 to $149,999 | 296 | 27.4% |
| $150,000 to $199,999 | 61 | 5.6% |
| $200,000+ | 19 | 1.8% |
Household Income by Householder Age in Silver Creek
The median household income in Silver Creek is $67,396, with the highest median household income of $84,018 found in the 25 to 44 years age bracket for the primary householder. A total of 437 households (40.4%) fall into this category. Meanwhile, the 15 to 24 years age bracket for the primary householder has the lowest median household income of $0, with 50 households (4.6%) in this group.
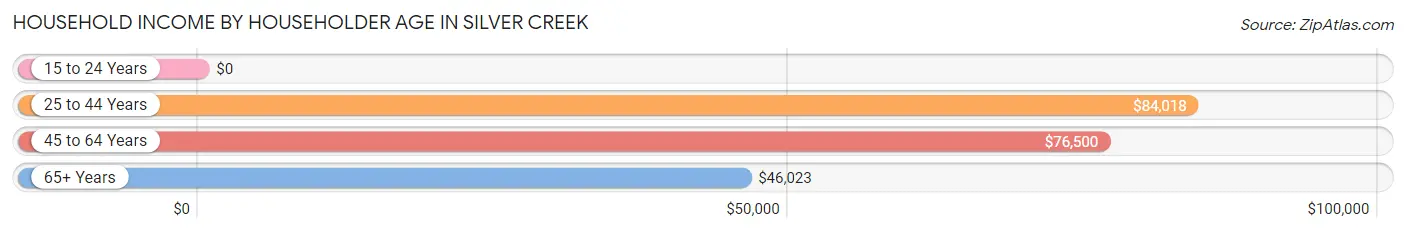
| Income Bracket | # Households | Median Income |
| 15 to 24 Years | 50 (4.6%) | $0 |
| 25 to 44 Years | 437 (40.4%) | $84,018 |
| 45 to 64 Years | 348 (32.2%) | $76,500 |
| 65+ Years | 247 (22.8%) | $46,023 |
| Total | 1,082 (100.0%) | $67,396 |
Poverty in Silver Creek
Income Below Poverty by Sex and Age in Silver Creek
With 17.0% poverty level for males and 13.7% for females among the residents of Silver Creek, under 5 year old males and under 5 year old females are the most vulnerable to poverty, with 22 males (36.7%) and 47 females (35.6%) in their respective age groups living below the poverty level.
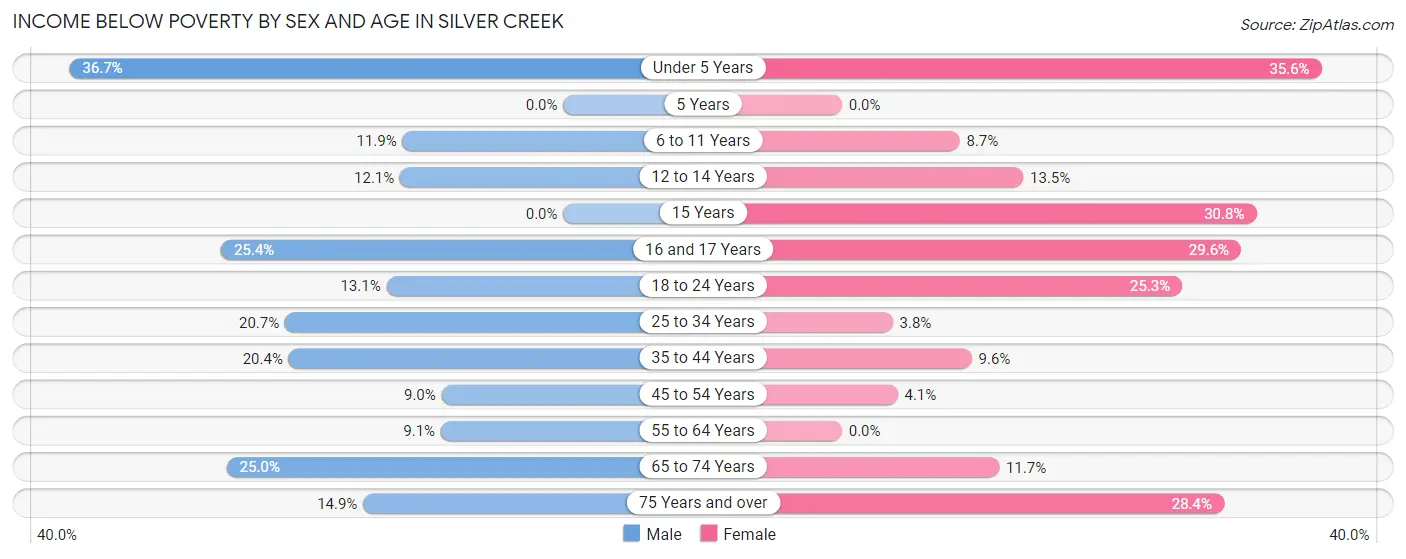
| Age Bracket | Male | Female |
| Under 5 Years | 22 (36.7%) | 47 (35.6%) |
| 5 Years | 0 (0.0%) | 0 (0.0%) |
| 6 to 11 Years | 8 (11.9%) | 9 (8.7%) |
| 12 to 14 Years | 4 (12.1%) | 7 (13.5%) |
| 15 Years | 0 (0.0%) | 8 (30.8%) |
| 16 and 17 Years | 15 (25.4%) | 16 (29.6%) |
| 18 to 24 Years | 13 (13.1%) | 24 (25.3%) |
| 25 to 34 Years | 25 (20.7%) | 4 (3.8%) |
| 35 to 44 Years | 63 (20.4%) | 27 (9.6%) |
| 45 to 54 Years | 16 (9.0%) | 6 (4.1%) |
| 55 to 64 Years | 13 (9.1%) | 0 (0.0%) |
| 65 to 74 Years | 31 (25.0%) | 14 (11.7%) |
| 75 Years and over | 11 (14.9%) | 19 (28.4%) |
| Total | 221 (17.0%) | 181 (13.7%) |
Income Above Poverty by Sex and Age in Silver Creek
According to the poverty statistics in Silver Creek, males aged 5 years and females aged 5 years are the age groups that are most secure financially, with 100.0% of males and 100.0% of females in these age groups living above the poverty line.
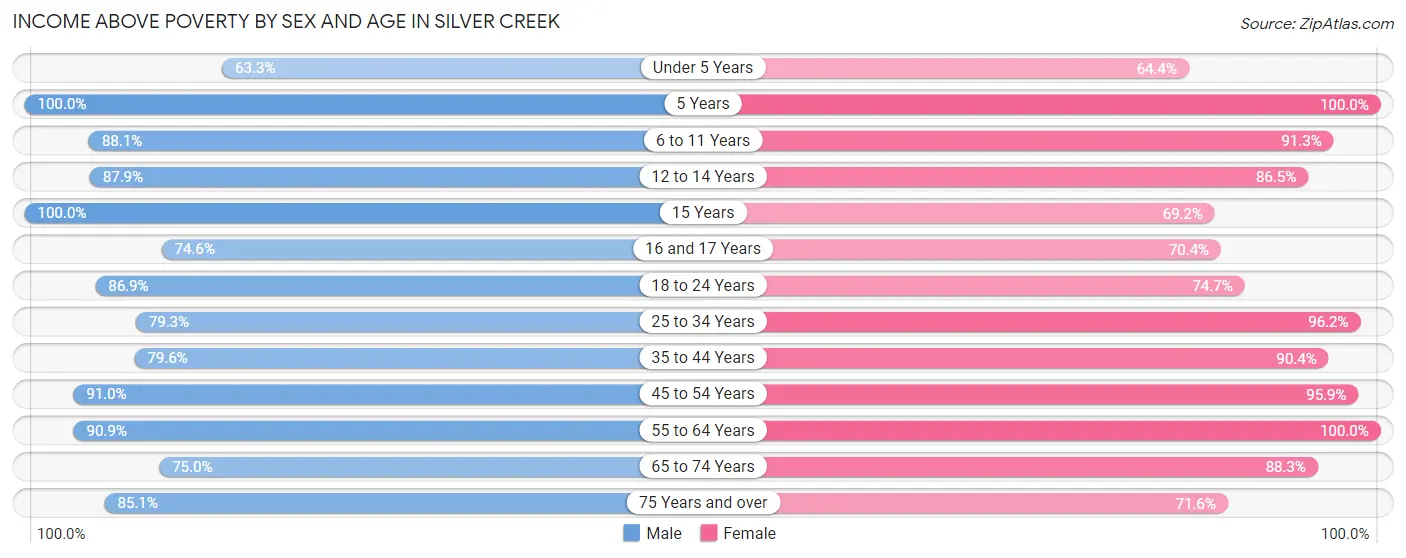
| Age Bracket | Male | Female |
| Under 5 Years | 38 (63.3%) | 85 (64.4%) |
| 5 Years | 10 (100.0%) | 21 (100.0%) |
| 6 to 11 Years | 59 (88.1%) | 94 (91.3%) |
| 12 to 14 Years | 29 (87.9%) | 45 (86.5%) |
| 15 Years | 24 (100.0%) | 18 (69.2%) |
| 16 and 17 Years | 44 (74.6%) | 38 (70.4%) |
| 18 to 24 Years | 86 (86.9%) | 71 (74.7%) |
| 25 to 34 Years | 96 (79.3%) | 102 (96.2%) |
| 35 to 44 Years | 246 (79.6%) | 253 (90.4%) |
| 45 to 54 Years | 161 (91.0%) | 139 (95.9%) |
| 55 to 64 Years | 130 (90.9%) | 122 (100.0%) |
| 65 to 74 Years | 93 (75.0%) | 106 (88.3%) |
| 75 Years and over | 63 (85.1%) | 48 (71.6%) |
| Total | 1,079 (83.0%) | 1,142 (86.3%) |
Income Below Poverty Among Married-Couple Families in Silver Creek
The poverty statistics for married-couple families in Silver Creek show that 1.7% or 9 of the total 523 families live below the poverty line. Families with 3 or 4 children have the highest poverty rate of 36.0%, comprising of 9 families. On the other hand, families with no children have the lowest poverty rate of 0.0%, which includes 0 families.
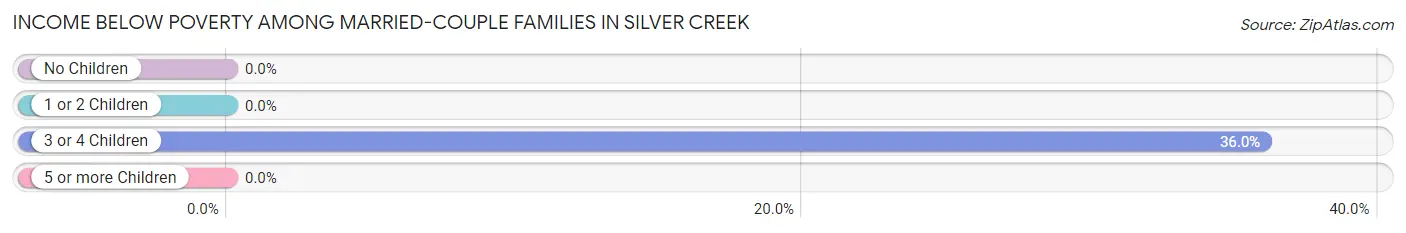
| Children | Above Poverty | Below Poverty |
| No Children | 263 (100.0%) | 0 (0.0%) |
| 1 or 2 Children | 235 (100.0%) | 0 (0.0%) |
| 3 or 4 Children | 16 (64.0%) | 9 (36.0%) |
| 5 or more Children | 0 (0.0%) | 0 (0.0%) |
| Total | 514 (98.3%) | 9 (1.7%) |
Income Below Poverty Among Single-Parent Households in Silver Creek
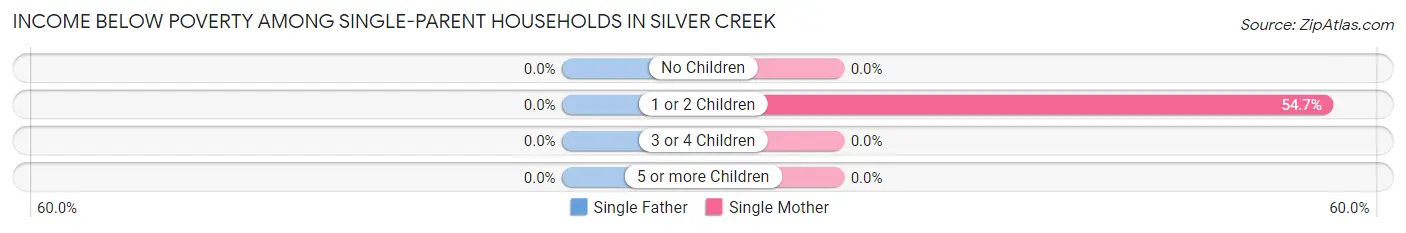
| Children | Single Father | Single Mother |
| No Children | 0 (0.0%) | 0 (0.0%) |
| 1 or 2 Children | 0 (0.0%) | 52 (54.7%) |
| 3 or 4 Children | 0 (0.0%) | 0 (0.0%) |
| 5 or more Children | 0 (0.0%) | 0 (0.0%) |
| Total | 0 (0.0%) | 52 (42.3%) |
Income Below Poverty Among Married-Couple vs Single-Parent Households in Silver Creek
The poverty data for Silver Creek shows that 9 of the married-couple family households (1.7%) and 52 of the single-parent households (30.6%) are living below the poverty level. Within the married-couple family households, those with 3 or 4 children have the highest poverty rate, with 9 households (36.0%) falling below the poverty line. Among the single-parent households, those with 1 or 2 children have the highest poverty rate, with 52 household (38.5%) living below poverty.
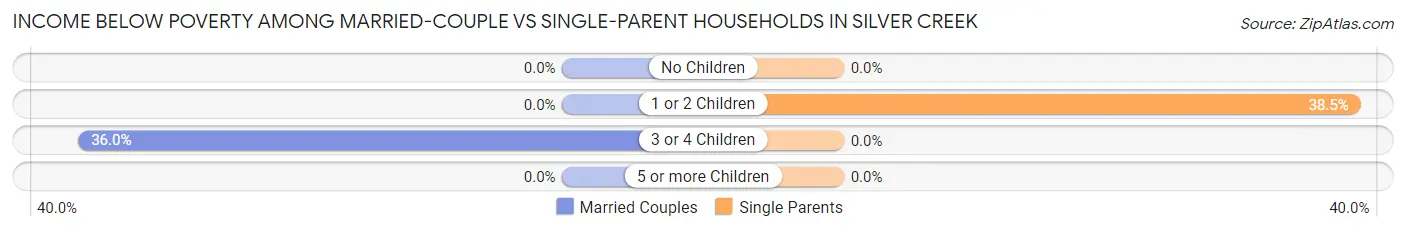
| Children | Married-Couple Families | Single-Parent Households |
| No Children | 0 (0.0%) | 0 (0.0%) |
| 1 or 2 Children | 0 (0.0%) | 52 (38.5%) |
| 3 or 4 Children | 9 (36.0%) | 0 (0.0%) |
| 5 or more Children | 0 (0.0%) | 0 (0.0%) |
| Total | 9 (1.7%) | 52 (30.6%) |
Race in Silver Creek
The most populous races in Silver Creek are White / Caucasian (2,518 | 96.0%), Hispanic or Latino (140 | 5.3%), and Two or more Races (80 | 3.0%).
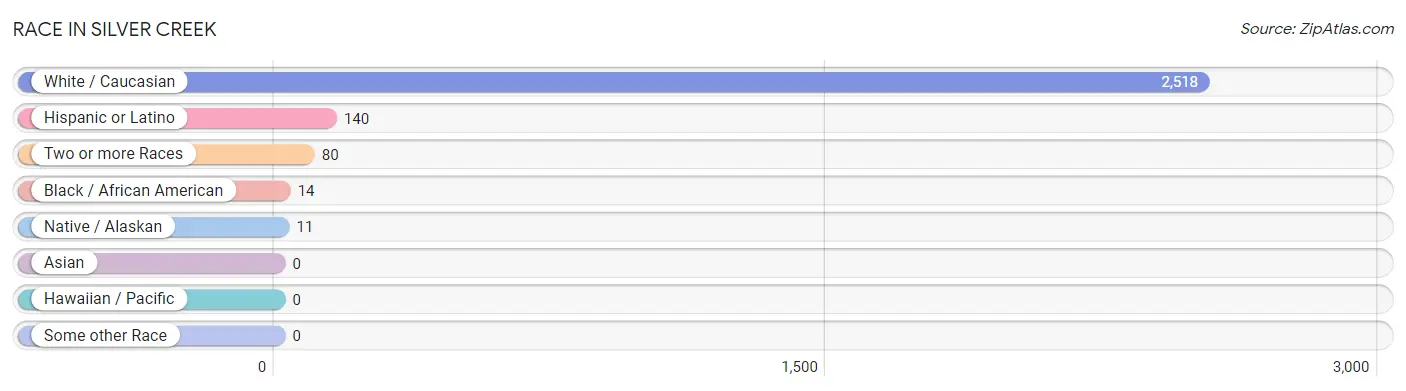
| Race | # Population | % Population |
| Asian | 0 | 0.0% |
| Black / African American | 14 | 0.5% |
| Hawaiian / Pacific | 0 | 0.0% |
| Hispanic or Latino | 140 | 5.3% |
| Native / Alaskan | 11 | 0.4% |
| White / Caucasian | 2,518 | 96.0% |
| Two or more Races | 80 | 3.0% |
| Some other Race | 0 | 0.0% |
| Total | 2,623 | 100.0% |
Ancestry in Silver Creek
The most populous ancestries reported in Silver Creek are German (781 | 29.8%), Italian (500 | 19.1%), Irish (403 | 15.4%), Polish (316 | 12.0%), and English (241 | 9.2%), together accounting for 85.4% of all Silver Creek residents.
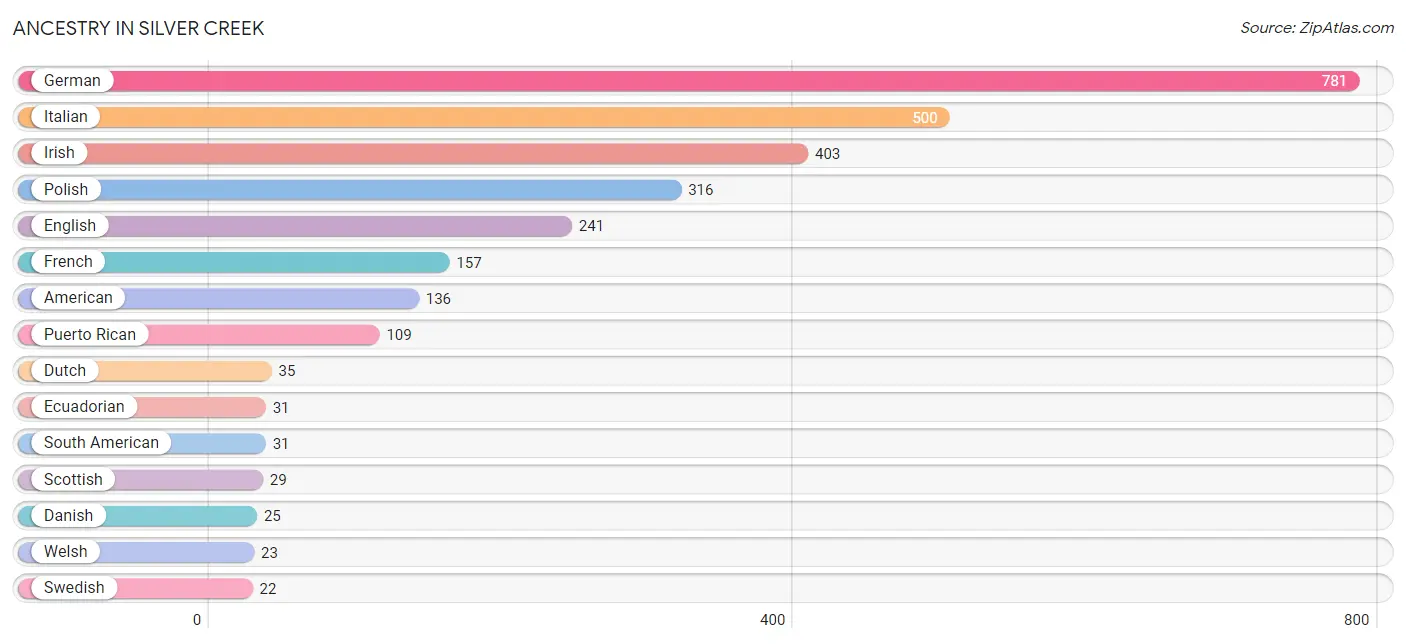
| Ancestry | # Population | % Population |
| Aleut | 11 | 0.4% |
| American | 136 | 5.2% |
| British | 10 | 0.4% |
| Danish | 25 | 0.9% |
| Dutch | 35 | 1.3% |
| Ecuadorian | 31 | 1.2% |
| English | 241 | 9.2% |
| European | 7 | 0.3% |
| French | 157 | 6.0% |
| French Canadian | 10 | 0.4% |
| German | 781 | 29.8% |
| Hungarian | 5 | 0.2% |
| Irish | 403 | 15.4% |
| Italian | 500 | 19.1% |
| Norwegian | 10 | 0.4% |
| Polish | 316 | 12.0% |
| Portuguese | 5 | 0.2% |
| Puerto Rican | 109 | 4.2% |
| Scotch-Irish | 11 | 0.4% |
| Scottish | 29 | 1.1% |
| South American | 31 | 1.2% |
| Swedish | 22 | 0.8% |
| Swiss | 9 | 0.3% |
| Ukrainian | 13 | 0.5% |
| Welsh | 23 | 0.9% |
| Yugoslavian | 10 | 0.4% | View All 26 Rows |
Immigrants in Silver Creek

| Immigration Origin | # Population | % Population | View All 0 Rows |
Sex and Age in Silver Creek
Sex and Age in Silver Creek
The most populous age groups in Silver Creek are 35 to 39 Years (166 | 12.8%) for men and 35 to 39 Years (194 | 14.7%) for women.
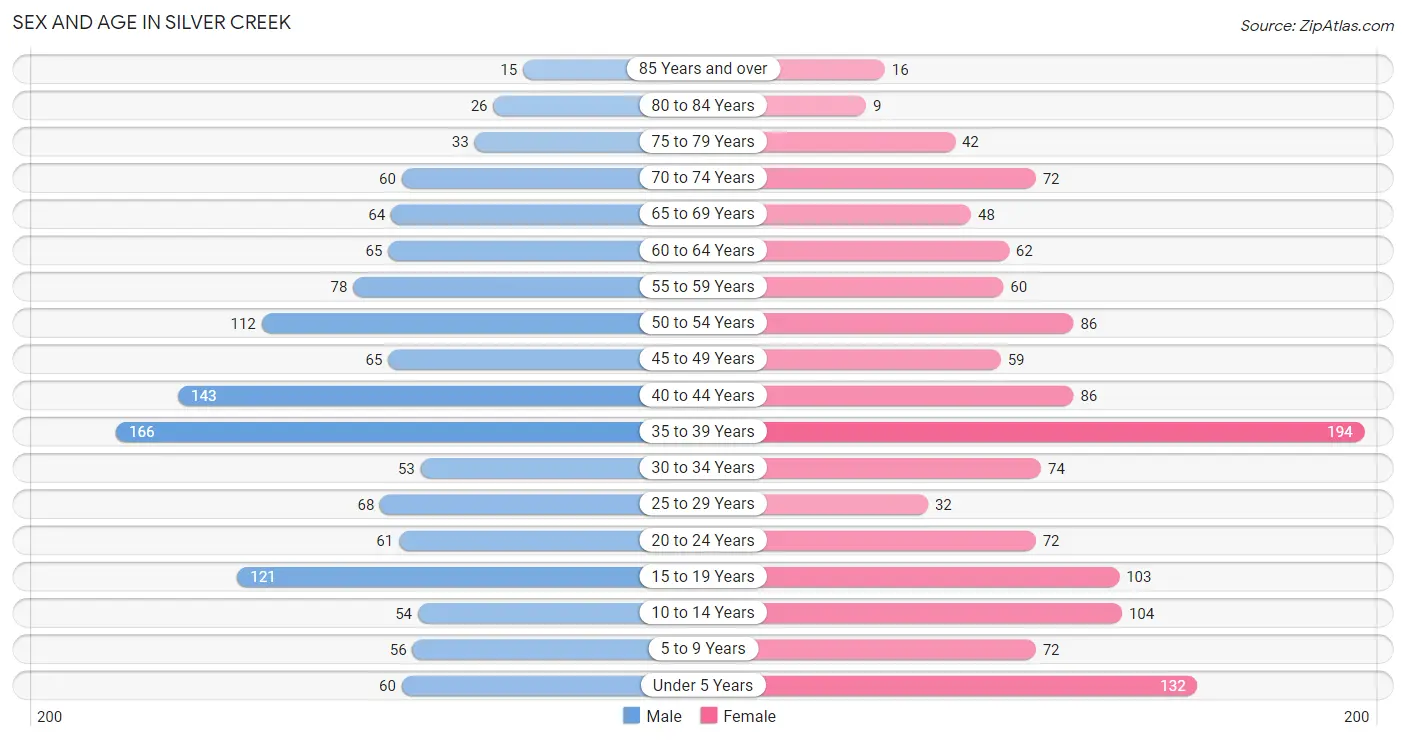
| Age Bracket | Male | Female |
| Under 5 Years | 60 (4.6%) | 132 (10.0%) |
| 5 to 9 Years | 56 (4.3%) | 72 (5.4%) |
| 10 to 14 Years | 54 (4.2%) | 104 (7.9%) |
| 15 to 19 Years | 121 (9.3%) | 103 (7.8%) |
| 20 to 24 Years | 61 (4.7%) | 72 (5.4%) |
| 25 to 29 Years | 68 (5.2%) | 32 (2.4%) |
| 30 to 34 Years | 53 (4.1%) | 74 (5.6%) |
| 35 to 39 Years | 166 (12.8%) | 194 (14.7%) |
| 40 to 44 Years | 143 (11.0%) | 86 (6.5%) |
| 45 to 49 Years | 65 (5.0%) | 59 (4.5%) |
| 50 to 54 Years | 112 (8.6%) | 86 (6.5%) |
| 55 to 59 Years | 78 (6.0%) | 60 (4.5%) |
| 60 to 64 Years | 65 (5.0%) | 62 (4.7%) |
| 65 to 69 Years | 64 (4.9%) | 48 (3.6%) |
| 70 to 74 Years | 60 (4.6%) | 72 (5.4%) |
| 75 to 79 Years | 33 (2.5%) | 42 (3.2%) |
| 80 to 84 Years | 26 (2.0%) | 9 (0.7%) |
| 85 Years and over | 15 (1.1%) | 16 (1.2%) |
| Total | 1,300 (100.0%) | 1,323 (100.0%) |
Families and Households in Silver Creek
Median Family Size in Silver Creek
The median family size in Silver Creek is 2.90 persons per family, with married-couple families (523 | 75.5%) accounting for the largest median family size of 2.99 persons per family. On the other hand, single female/mother families (123 | 17.7%) represent the smallest median family size with 2.61 persons per family.
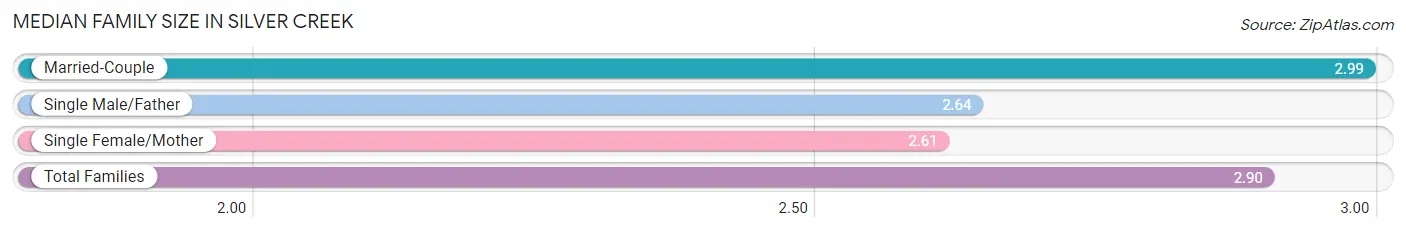
| Family Type | # Families | Family Size |
| Married-Couple | 523 (75.5%) | 2.99 |
| Single Male/Father | 47 (6.8%) | 2.64 |
| Single Female/Mother | 123 (17.7%) | 2.61 |
| Total Families | 693 (100.0%) | 2.90 |
Median Household Size in Silver Creek
The median household size in Silver Creek is 2.39 persons per household, with single female/mother households (123 | 11.4%) accounting for the largest median household size of 3.29 persons per household. non-family households (389 | 35.9%) represent the smallest median household size with 1.22 persons per household.
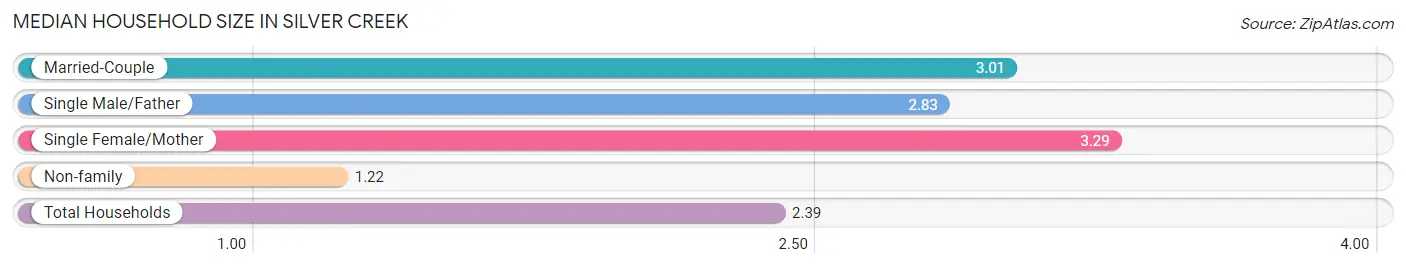
| Household Type | # Households | Household Size |
| Married-Couple | 523 (48.3%) | 3.01 |
| Single Male/Father | 47 (4.3%) | 2.83 |
| Single Female/Mother | 123 (11.4%) | 3.29 |
| Non-family | 389 (35.9%) | 1.22 |
| Total Households | 1,082 (100.0%) | 2.39 |
Household Size by Marriage Status in Silver Creek
Out of a total of 1,082 households in Silver Creek, 693 (64.0%) are family households, while 389 (35.9%) are nonfamily households. The most numerous type of family households are 2-person households, comprising 264, and the most common type of nonfamily households are 1-person households, comprising 325.
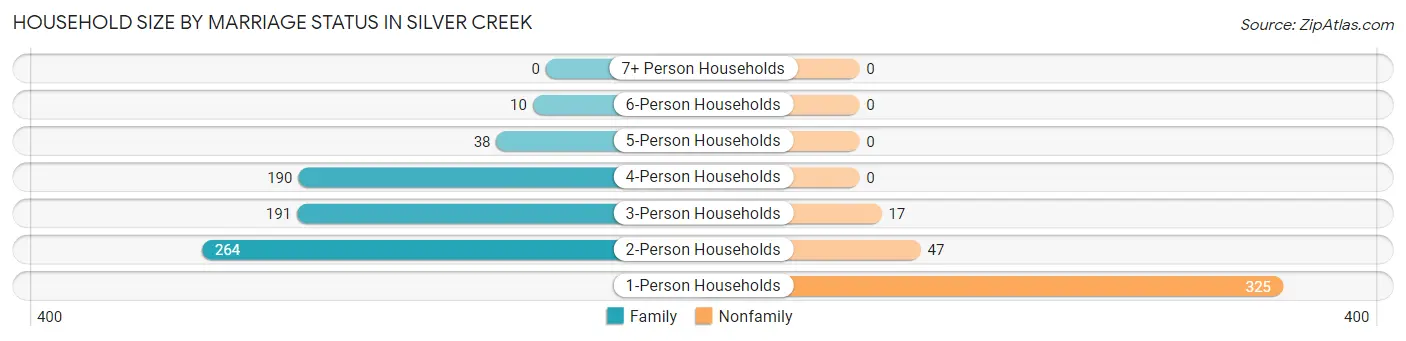
| Household Size | Family Households | Nonfamily Households |
| 1-Person Households | - | 325 (30.0%) |
| 2-Person Households | 264 (24.4%) | 47 (4.3%) |
| 3-Person Households | 191 (17.6%) | 17 (1.6%) |
| 4-Person Households | 190 (17.6%) | 0 (0.0%) |
| 5-Person Households | 38 (3.5%) | 0 (0.0%) |
| 6-Person Households | 10 (0.9%) | 0 (0.0%) |
| 7+ Person Households | 0 (0.0%) | 0 (0.0%) |
| Total | 693 (64.0%) | 389 (35.9%) |
Female Fertility in Silver Creek
Fertility by Age in Silver Creek
Average fertility rate in Silver Creek is 47.0 births per 1,000 women. Women in the age bracket of 20 to 34 years have the highest fertility rate with 135.0 births per 1,000 women. Women in the age bracket of 20 to 34 years acount for 80.0% of all women with births.
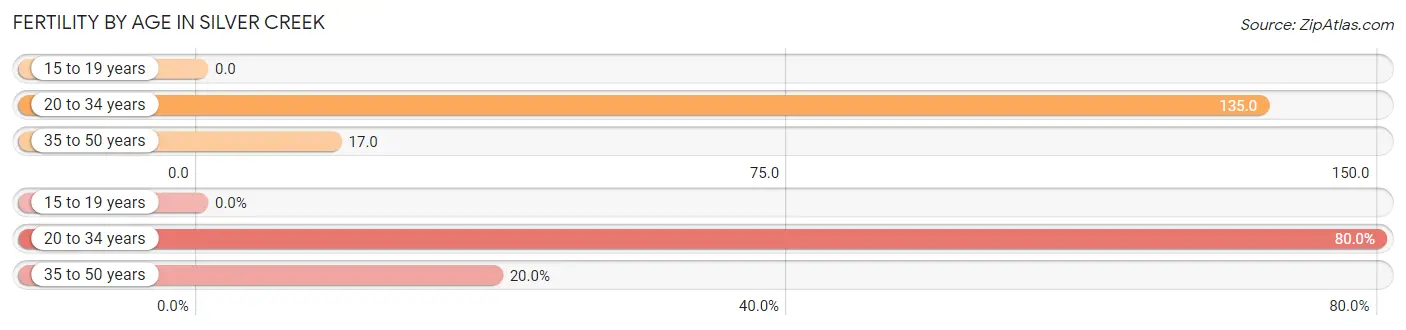
| Age Bracket | Women with Births | Births / 1,000 Women |
| 15 to 19 years | 0 (0.0%) | 0.0 |
| 20 to 34 years | 24 (80.0%) | 135.0 |
| 35 to 50 years | 6 (20.0%) | 17.0 |
| Total | 30 (100.0%) | 47.0 |
Fertility by Age by Marriage Status in Silver Creek
20.0% of women with births (30) in Silver Creek are married. The highest percentage of unmarried women with births falls into 20 to 34 years age bracket with 100.0% of them unmarried at the time of birth, while the lowest percentage of unmarried women with births belong to 35 to 50 years age bracket with 0.0% of them unmarried.
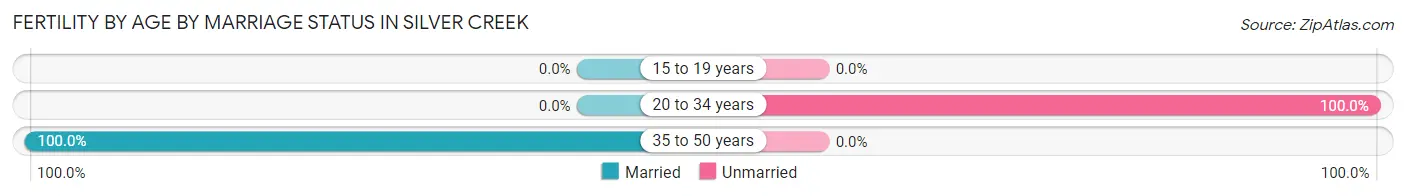
| Age Bracket | Married | Unmarried |
| 15 to 19 years | 0 (0.0%) | 0 (0.0%) |
| 20 to 34 years | 0 (0.0%) | 24 (100.0%) |
| 35 to 50 years | 6 (100.0%) | 0 (0.0%) |
| Total | 6 (20.0%) | 24 (80.0%) |
Fertility by Education in Silver Creek
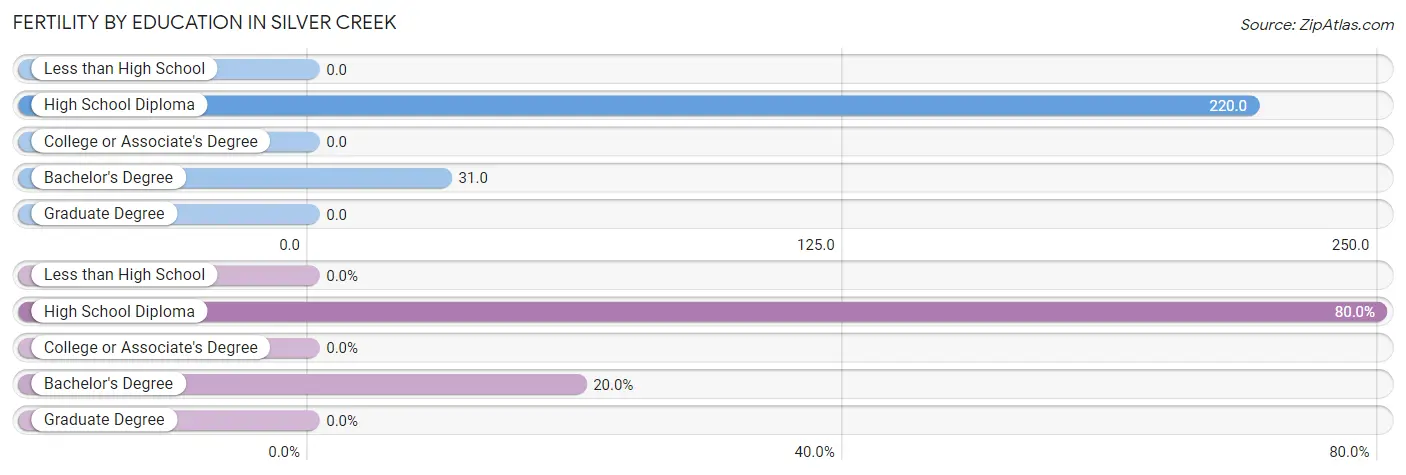
| Educational Attainment | Women with Births | Births / 1,000 Women |
| Less than High School | 0 (0.0%) | 0.0 |
| High School Diploma | 24 (80.0%) | 220.0 |
| College or Associate's Degree | 0 (0.0%) | 0.0 |
| Bachelor's Degree | 6 (20.0%) | 31.0 |
| Graduate Degree | 0 (0.0%) | 0.0 |
| Total | 30 (100.0%) | 47.0 |
Fertility by Education by Marriage Status in Silver Creek
80.0% of women with births in Silver Creek are unmarried. Women with the educational attainment of bachelor's degree are most likely to be married with 100.0% of them married at childbirth, while women with the educational attainment of high school diploma are least likely to be married with 100.0% of them unmarried at childbirth.
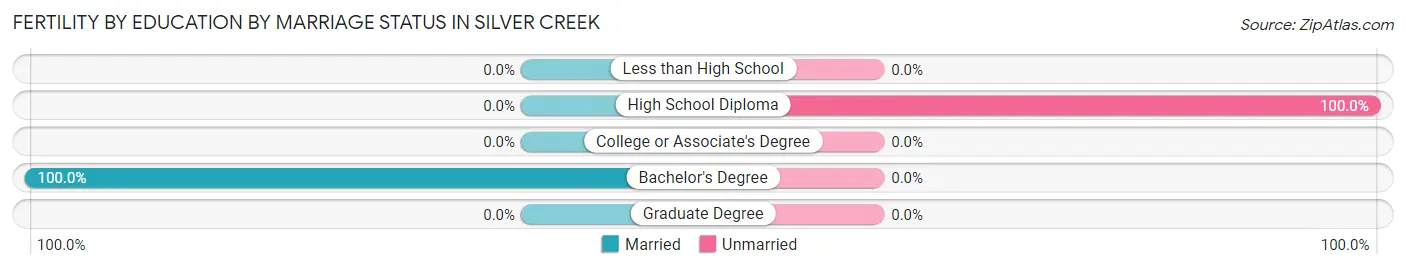
| Educational Attainment | Married | Unmarried |
| Less than High School | 0 (0.0%) | 0 (0.0%) |
| High School Diploma | 0 (0.0%) | 24 (100.0%) |
| College or Associate's Degree | 0 (0.0%) | 0 (0.0%) |
| Bachelor's Degree | 6 (100.0%) | 0 (0.0%) |
| Graduate Degree | 0 (0.0%) | 0 (0.0%) |
| Total | 6 (20.0%) | 24 (80.0%) |
Employment Characteristics in Silver Creek
Employment by Class of Employer in Silver Creek
Among the 1,206 employed individuals in Silver Creek, private company employees (755 | 62.6%), state government employees (151 | 12.5%), and local government employees (105 | 8.7%) make up the most common classes of employment.
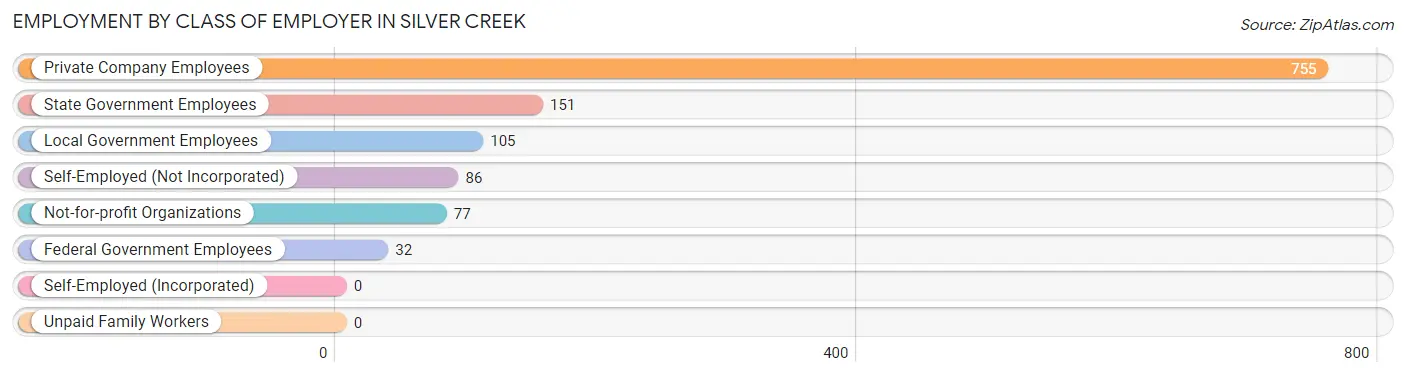
| Employer Class | # Employees | % Employees |
| Private Company Employees | 755 | 62.6% |
| Self-Employed (Incorporated) | 0 | 0.0% |
| Self-Employed (Not Incorporated) | 86 | 7.1% |
| Not-for-profit Organizations | 77 | 6.4% |
| Local Government Employees | 105 | 8.7% |
| State Government Employees | 151 | 12.5% |
| Federal Government Employees | 32 | 2.6% |
| Unpaid Family Workers | 0 | 0.0% |
| Total | 1,206 | 100.0% |
Employment Status by Age in Silver Creek
According to the labor force statistics for Silver Creek, out of the total population over 16 years of age (2,095), 62.7% or 1,314 individuals are in the labor force, with 6.4% or 84 of them unemployed. The age group with the highest labor force participation rate is 30 to 34 years, with 94.5% or 120 individuals in the labor force. Within the labor force, the 16 to 19 years age range has the highest percentage of unemployed individuals, with 39.7% or 31 of them being unemployed.
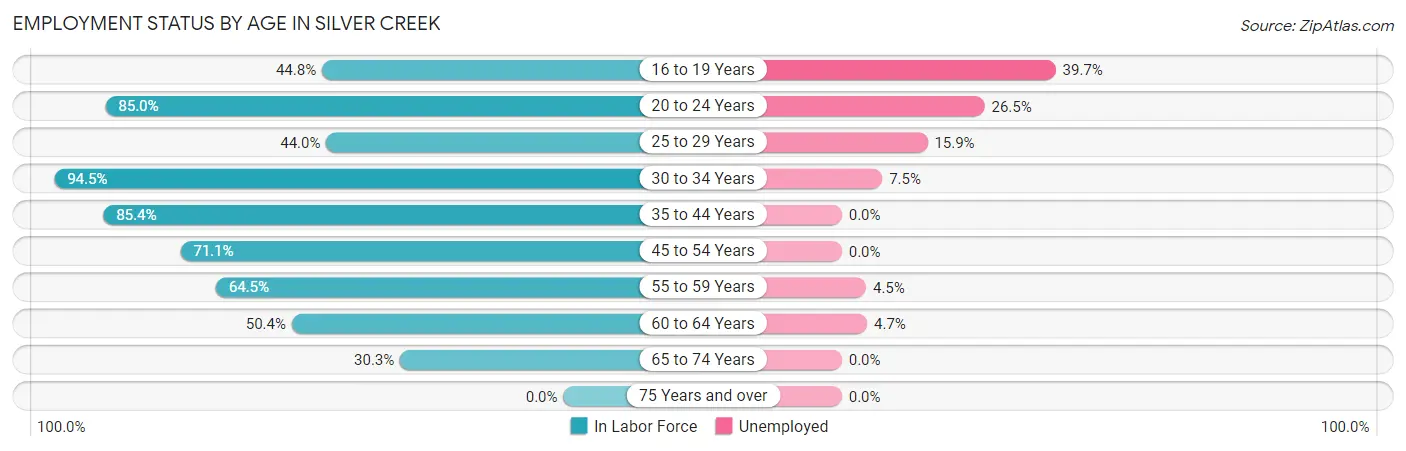
| Age Bracket | In Labor Force | Unemployed |
| 16 to 19 Years | 78 (44.8%) | 31 (39.7%) |
| 20 to 24 Years | 113 (85.0%) | 30 (26.5%) |
| 25 to 29 Years | 44 (44.0%) | 7 (15.9%) |
| 30 to 34 Years | 120 (94.5%) | 9 (7.5%) |
| 35 to 44 Years | 503 (85.4%) | 0 (0.0%) |
| 45 to 54 Years | 229 (71.1%) | 0 (0.0%) |
| 55 to 59 Years | 89 (64.5%) | 4 (4.5%) |
| 60 to 64 Years | 64 (50.4%) | 3 (4.7%) |
| 65 to 74 Years | 74 (30.3%) | 0 (0.0%) |
| 75 Years and over | 0 (0.0%) | 0 (0.0%) |
| Total | 1,314 (62.7%) | 84 (6.4%) |
Employment Status by Educational Attainment in Silver Creek
According to labor force statistics for Silver Creek, 74.8% of individuals (1,049) out of the total population between 25 and 64 years of age (1,403) are in the labor force, with 2.2% or 23 of them being unemployed. The group with the highest labor force participation rate are those with the educational attainment of bachelor's degree or higher, with 85.1% or 446 individuals in the labor force. Within the labor force, individuals with high school diploma education have the highest percentage of unemployment, with 4.8% or 10 of them being unemployed.
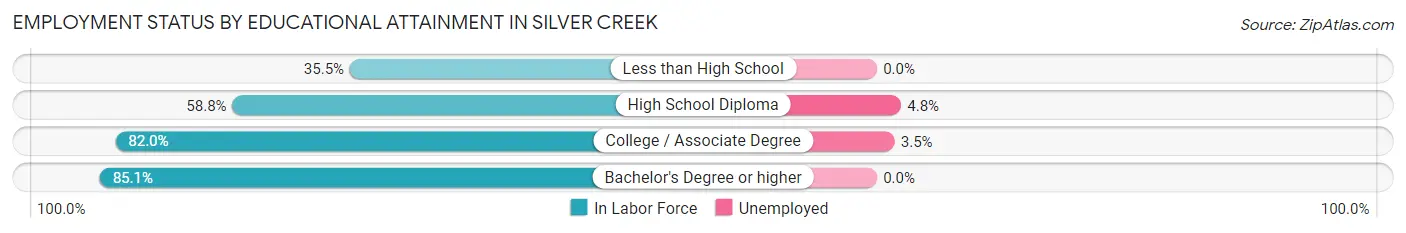
| Educational Attainment | In Labor Force | Unemployed |
| Less than High School | 27 (35.5%) | 0 (0.0%) |
| High School Diploma | 208 (58.8%) | 17 (4.8%) |
| College / Associate Degree | 368 (82.0%) | 16 (3.5%) |
| Bachelor's Degree or higher | 446 (85.1%) | 0 (0.0%) |
| Total | 1,049 (74.8%) | 31 (2.2%) |
Employment Occupations by Sex in Silver Creek
Management, Business, Science and Arts Occupations
The most common Management, Business, Science and Arts occupations in Silver Creek are Community & Social Service (133 | 10.8%), Health Diagnosing & Treating (68 | 5.5%), Computers, Engineering & Science (61 | 5.0%), Education, Arts & Media (61 | 5.0%), and Business & Financial (60 | 4.9%).
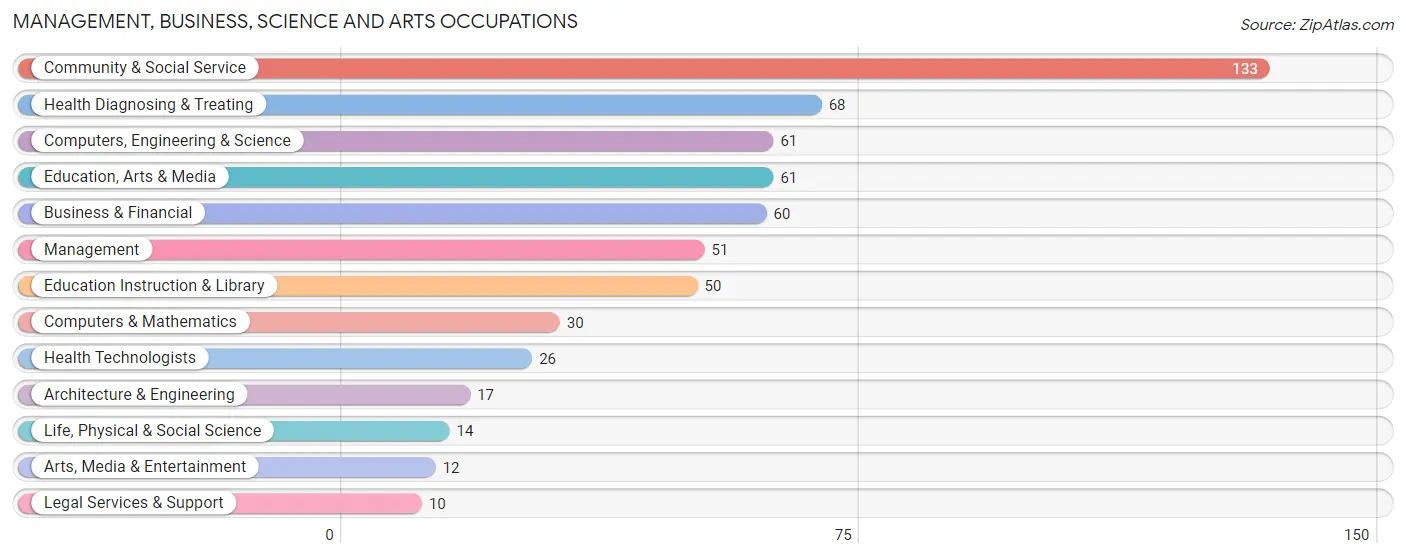
Management, Business, Science and Arts Occupations by Sex
Within the Management, Business, Science and Arts occupations in Silver Creek, the most male-oriented occupations are Computers & Mathematics (100.0%), Life, Physical & Social Science (100.0%), and Computers, Engineering & Science (96.7%), while the most female-oriented occupations are Health Technologists (100.0%), Health Diagnosing & Treating (85.3%), and Education, Arts & Media (77.0%).
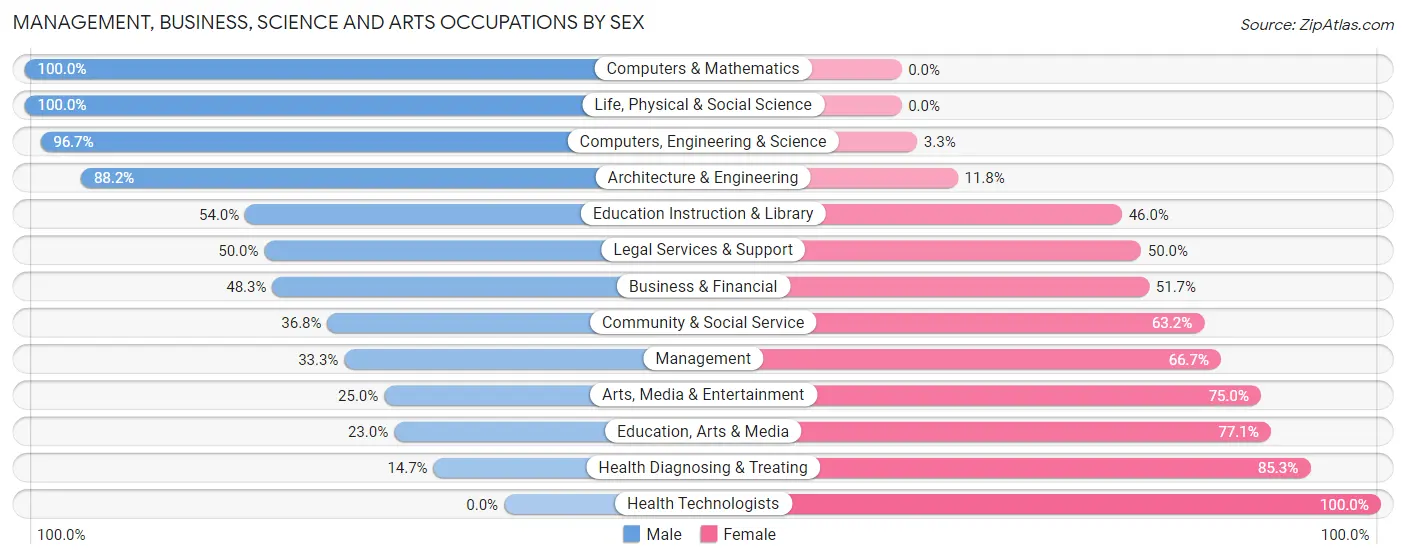
| Occupation | Male | Female |
| Management | 17 (33.3%) | 34 (66.7%) |
| Business & Financial | 29 (48.3%) | 31 (51.7%) |
| Computers, Engineering & Science | 59 (96.7%) | 2 (3.3%) |
| Computers & Mathematics | 30 (100.0%) | 0 (0.0%) |
| Architecture & Engineering | 15 (88.2%) | 2 (11.8%) |
| Life, Physical & Social Science | 14 (100.0%) | 0 (0.0%) |
| Community & Social Service | 49 (36.8%) | 84 (63.2%) |
| Education, Arts & Media | 14 (23.0%) | 47 (77.0%) |
| Legal Services & Support | 5 (50.0%) | 5 (50.0%) |
| Education Instruction & Library | 27 (54.0%) | 23 (46.0%) |
| Arts, Media & Entertainment | 3 (25.0%) | 9 (75.0%) |
| Health Diagnosing & Treating | 10 (14.7%) | 58 (85.3%) |
| Health Technologists | 0 (0.0%) | 26 (100.0%) |
| Total (Category) | 164 (44.0%) | 209 (56.0%) |
| Total (Overall) | 643 (52.3%) | 587 (47.7%) |
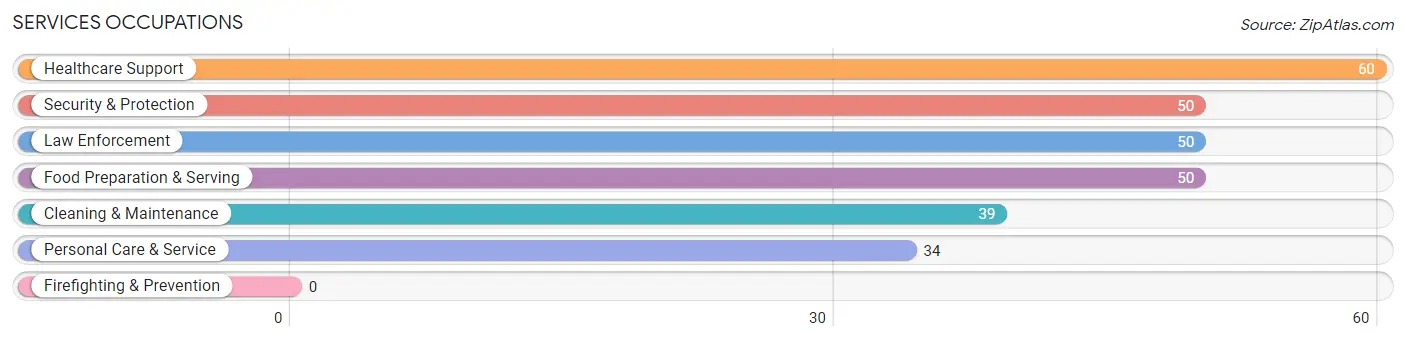
Services Occupations
The most common Services occupations in Silver Creek are Healthcare Support (60 | 4.9%), Security & Protection (50 | 4.1%), Law Enforcement (50 | 4.1%), Food Preparation & Serving (50 | 4.1%), and Cleaning & Maintenance (39 | 3.2%).
Services Occupations by Sex
Within the Services occupations in Silver Creek, the most male-oriented occupations are Security & Protection (100.0%), Law Enforcement (100.0%), and Cleaning & Maintenance (82.1%), while the most female-oriented occupations are Healthcare Support (100.0%), Personal Care & Service (100.0%), and Food Preparation & Serving (52.0%).
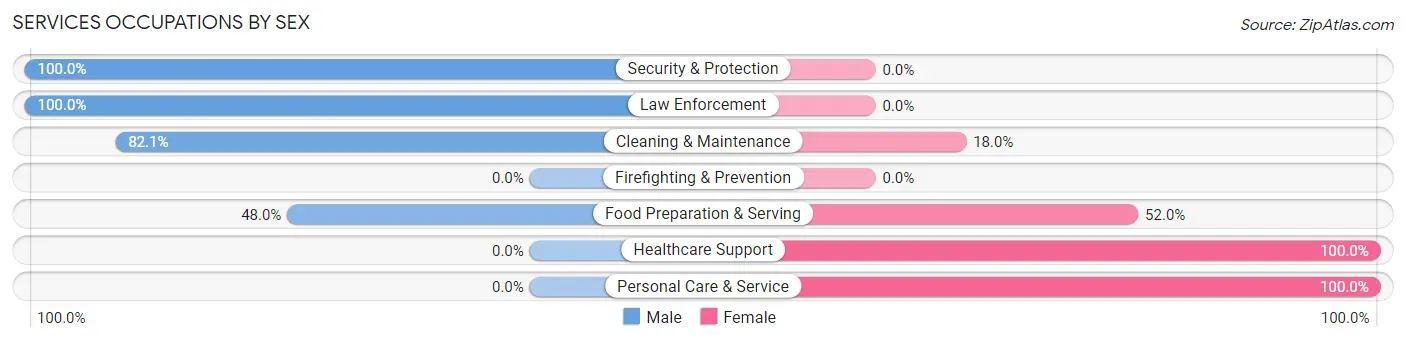
| Occupation | Male | Female |
| Healthcare Support | 0 (0.0%) | 60 (100.0%) |
| Security & Protection | 50 (100.0%) | 0 (0.0%) |
| Firefighting & Prevention | 0 (0.0%) | 0 (0.0%) |
| Law Enforcement | 50 (100.0%) | 0 (0.0%) |
| Food Preparation & Serving | 24 (48.0%) | 26 (52.0%) |
| Cleaning & Maintenance | 32 (82.1%) | 7 (17.9%) |
| Personal Care & Service | 0 (0.0%) | 34 (100.0%) |
| Total (Category) | 106 (45.5%) | 127 (54.5%) |
| Total (Overall) | 643 (52.3%) | 587 (47.7%) |
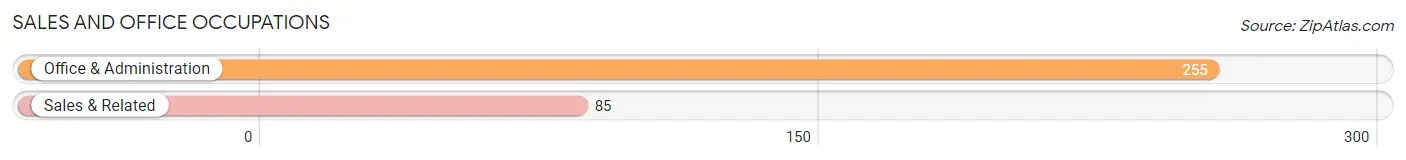
Sales and Office Occupations
The most common Sales and Office occupations in Silver Creek are Office & Administration (255 | 20.7%), and Sales & Related (85 | 6.9%).
Sales and Office Occupations by Sex
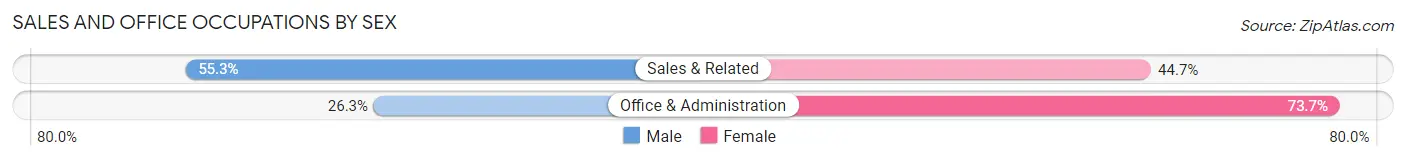
| Occupation | Male | Female |
| Sales & Related | 47 (55.3%) | 38 (44.7%) |
| Office & Administration | 67 (26.3%) | 188 (73.7%) |
| Total (Category) | 114 (33.5%) | 226 (66.5%) |
| Total (Overall) | 643 (52.3%) | 587 (47.7%) |
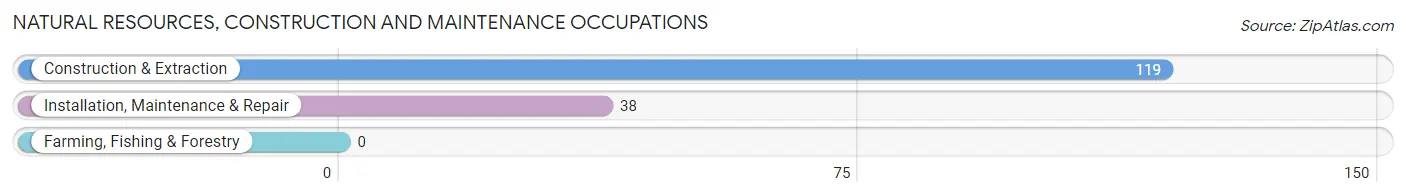
Natural Resources, Construction and Maintenance Occupations
The most common Natural Resources, Construction and Maintenance occupations in Silver Creek are Construction & Extraction (119 | 9.7%), and Installation, Maintenance & Repair (38 | 3.1%).
Natural Resources, Construction and Maintenance Occupations by Sex
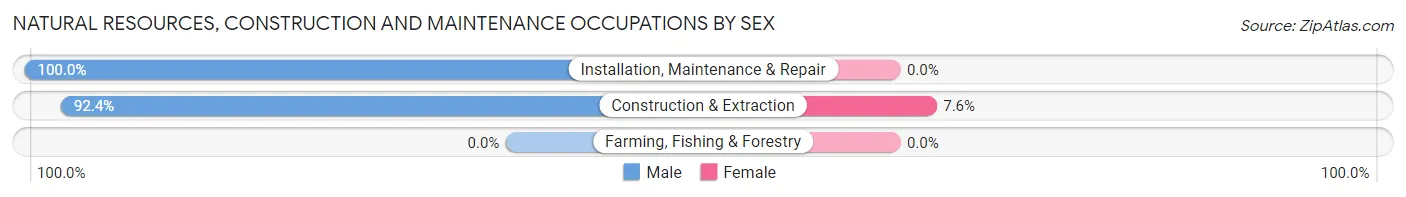
| Occupation | Male | Female |
| Farming, Fishing & Forestry | 0 (0.0%) | 0 (0.0%) |
| Construction & Extraction | 110 (92.4%) | 9 (7.6%) |
| Installation, Maintenance & Repair | 38 (100.0%) | 0 (0.0%) |
| Total (Category) | 148 (94.3%) | 9 (5.7%) |
| Total (Overall) | 643 (52.3%) | 587 (47.7%) |
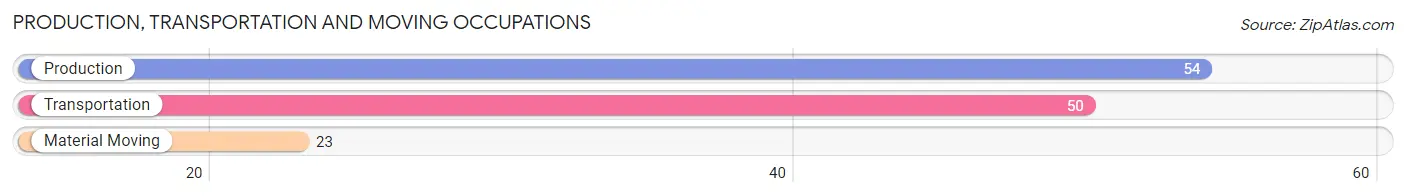
Production, Transportation and Moving Occupations
The most common Production, Transportation and Moving occupations in Silver Creek are Production (54 | 4.4%), Transportation (50 | 4.1%), and Material Moving (23 | 1.9%).
Production, Transportation and Moving Occupations by Sex
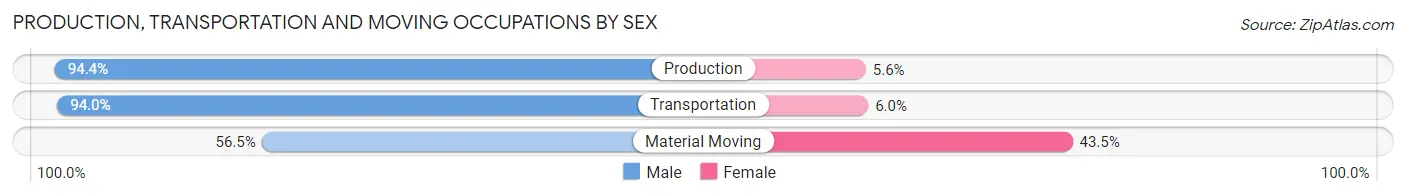
| Occupation | Male | Female |
| Production | 51 (94.4%) | 3 (5.6%) |
| Transportation | 47 (94.0%) | 3 (6.0%) |
| Material Moving | 13 (56.5%) | 10 (43.5%) |
| Total (Category) | 111 (87.4%) | 16 (12.6%) |
| Total (Overall) | 643 (52.3%) | 587 (47.7%) |
Employment Industries by Sex in Silver Creek
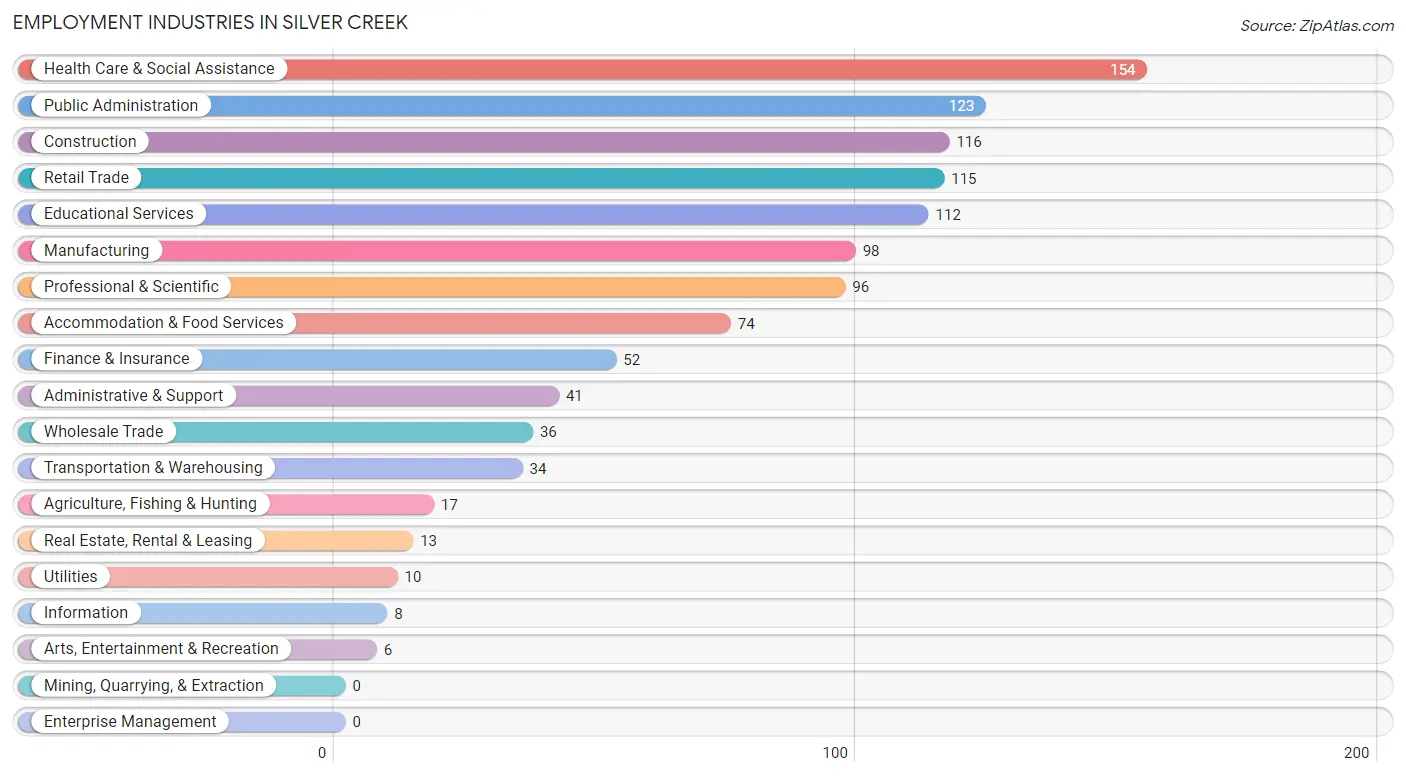
Employment Industries in Silver Creek
The major employment industries in Silver Creek include Health Care & Social Assistance (154 | 12.5%), Public Administration (123 | 10.0%), Construction (116 | 9.4%), Retail Trade (115 | 9.3%), and Educational Services (112 | 9.1%).
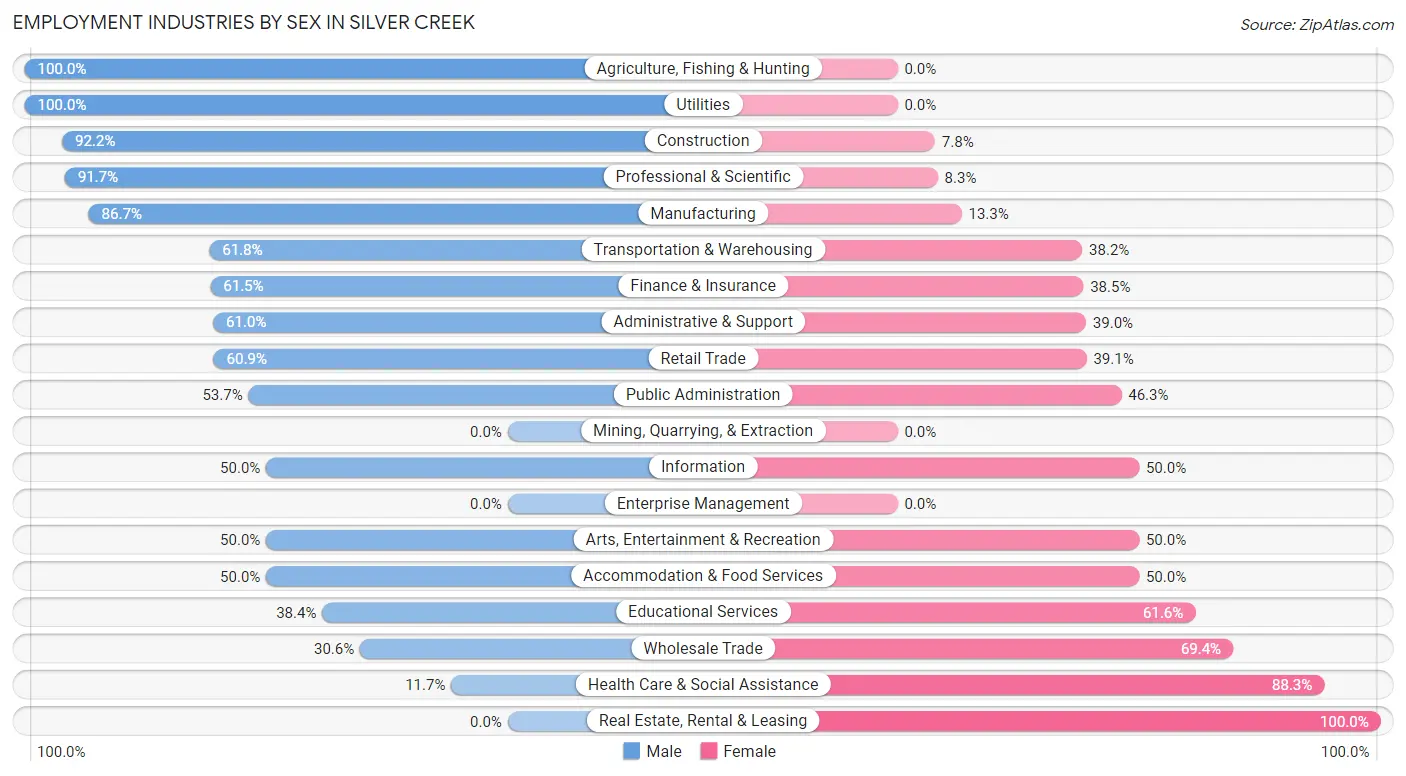
Employment Industries by Sex in Silver Creek
The Silver Creek industries that see more men than women are Agriculture, Fishing & Hunting (100.0%), Utilities (100.0%), and Construction (92.2%), whereas the industries that tend to have a higher number of women are Real Estate, Rental & Leasing (100.0%), Health Care & Social Assistance (88.3%), and Wholesale Trade (69.4%).
| Industry | Male | Female |
| Agriculture, Fishing & Hunting | 17 (100.0%) | 0 (0.0%) |
| Mining, Quarrying, & Extraction | 0 (0.0%) | 0 (0.0%) |
| Construction | 107 (92.2%) | 9 (7.8%) |
| Manufacturing | 85 (86.7%) | 13 (13.3%) |
| Wholesale Trade | 11 (30.6%) | 25 (69.4%) |
| Retail Trade | 70 (60.9%) | 45 (39.1%) |
| Transportation & Warehousing | 21 (61.8%) | 13 (38.2%) |
| Utilities | 10 (100.0%) | 0 (0.0%) |
| Information | 4 (50.0%) | 4 (50.0%) |
| Finance & Insurance | 32 (61.5%) | 20 (38.5%) |
| Real Estate, Rental & Leasing | 0 (0.0%) | 13 (100.0%) |
| Professional & Scientific | 88 (91.7%) | 8 (8.3%) |
| Enterprise Management | 0 (0.0%) | 0 (0.0%) |
| Administrative & Support | 25 (61.0%) | 16 (39.0%) |
| Educational Services | 43 (38.4%) | 69 (61.6%) |
| Health Care & Social Assistance | 18 (11.7%) | 136 (88.3%) |
| Arts, Entertainment & Recreation | 3 (50.0%) | 3 (50.0%) |
| Accommodation & Food Services | 37 (50.0%) | 37 (50.0%) |
| Public Administration | 66 (53.7%) | 57 (46.3%) |
| Total | 643 (52.3%) | 587 (47.7%) |
Education in Silver Creek
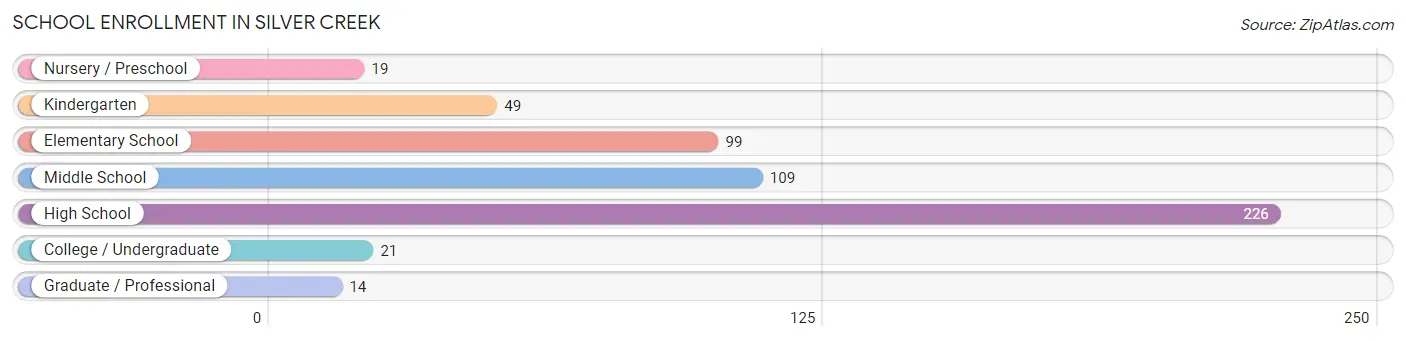
School Enrollment in Silver Creek
The most common levels of schooling among the 537 students in Silver Creek are high school (226 | 42.1%), middle school (109 | 20.3%), and elementary school (99 | 18.4%).
| School Level | # Students | % Students |
| Nursery / Preschool | 19 | 3.5% |
| Kindergarten | 49 | 9.1% |
| Elementary School | 99 | 18.4% |
| Middle School | 109 | 20.3% |
| High School | 226 | 42.1% |
| College / Undergraduate | 21 | 3.9% |
| Graduate / Professional | 14 | 2.6% |
| Total | 537 | 100.0% |
School Enrollment by Age by Funding Source in Silver Creek
Out of a total of 537 students who are enrolled in schools in Silver Creek, 15 (2.8%) attend a private institution, while the remaining 522 (97.2%) are enrolled in public schools. The age group of 35 years and over has the highest likelihood of being enrolled in private schools, with 4 (50.0% in the age bracket) enrolled. Conversely, the age group of 3 to 4 year olds has the lowest likelihood of being enrolled in a private school, with 22 (100.0% in the age bracket) attending a public institution.
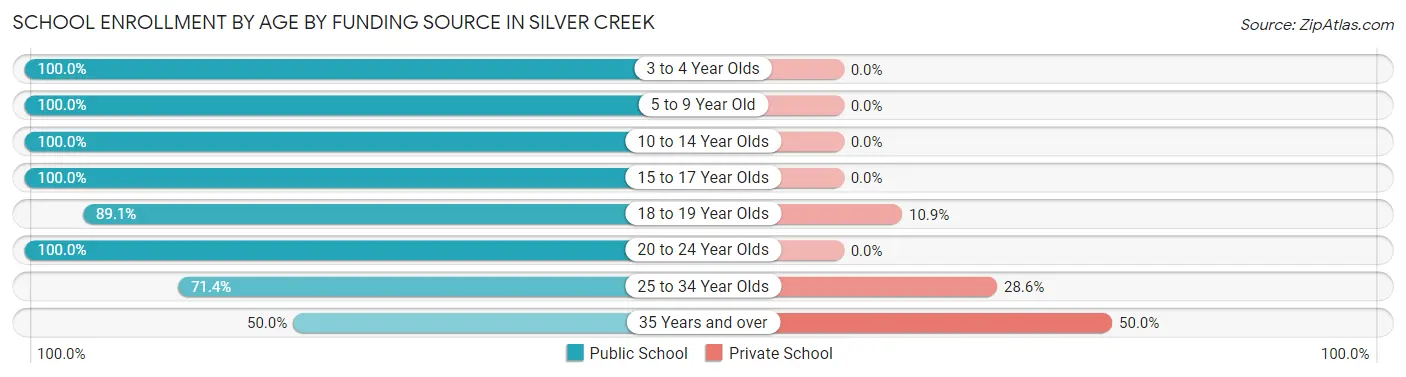
| Age Bracket | Public School | Private School |
| 3 to 4 Year Olds | 22 (100.0%) | 0 (0.0%) |
| 5 to 9 Year Old | 123 (100.0%) | 0 (0.0%) |
| 10 to 14 Year Olds | 152 (100.0%) | 0 (0.0%) |
| 15 to 17 Year Olds | 163 (100.0%) | 0 (0.0%) |
| 18 to 19 Year Olds | 41 (89.1%) | 5 (10.9%) |
| 20 to 24 Year Olds | 2 (100.0%) | 0 (0.0%) |
| 25 to 34 Year Olds | 15 (71.4%) | 6 (28.6%) |
| 35 Years and over | 4 (50.0%) | 4 (50.0%) |
| Total | 522 (97.2%) | 15 (2.8%) |
Educational Attainment by Field of Study in Silver Creek
Education (152 | 26.0%), arts & humanities (127 | 21.7%), social sciences (75 | 12.8%), psychology (57 | 9.8%), and business (48 | 8.2%) are the most common fields of study among 584 individuals in Silver Creek who have obtained a bachelor's degree or higher.
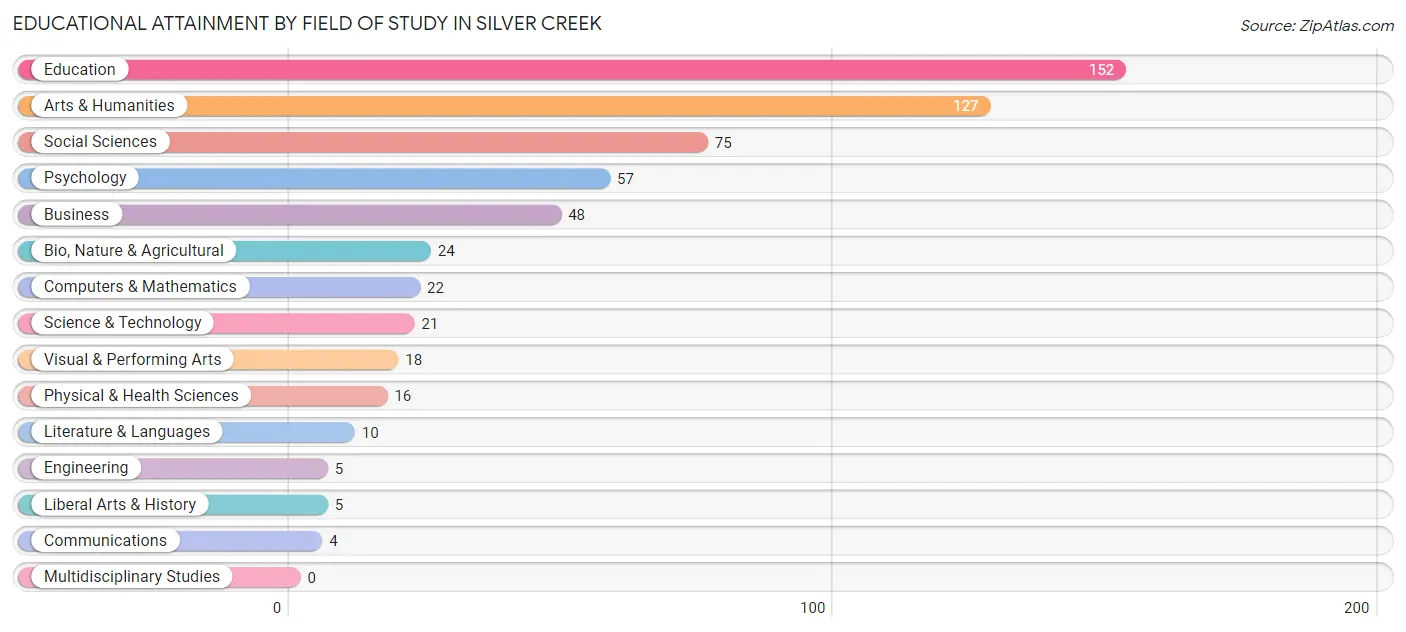
| Field of Study | # Graduates | % Graduates |
| Computers & Mathematics | 22 | 3.8% |
| Bio, Nature & Agricultural | 24 | 4.1% |
| Physical & Health Sciences | 16 | 2.7% |
| Psychology | 57 | 9.8% |
| Social Sciences | 75 | 12.8% |
| Engineering | 5 | 0.9% |
| Multidisciplinary Studies | 0 | 0.0% |
| Science & Technology | 21 | 3.6% |
| Business | 48 | 8.2% |
| Education | 152 | 26.0% |
| Literature & Languages | 10 | 1.7% |
| Liberal Arts & History | 5 | 0.9% |
| Visual & Performing Arts | 18 | 3.1% |
| Communications | 4 | 0.7% |
| Arts & Humanities | 127 | 21.7% |
| Total | 584 | 100.0% |
Transportation & Commute in Silver Creek
Vehicle Availability by Sex in Silver Creek
The most prevalent vehicle ownership categories in Silver Creek are males with 2 vehicles (400, accounting for 62.9%) and females with 2 vehicles (337, making up 70.2%).
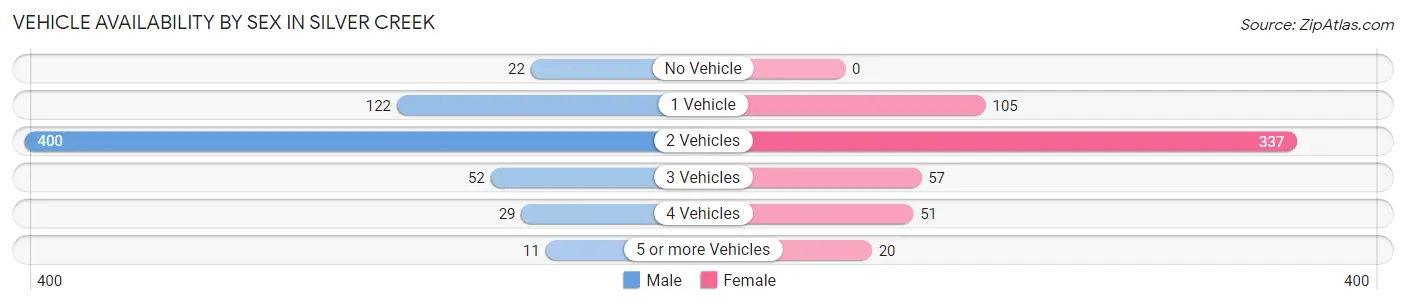
| Vehicles Available | Male | Female |
| No Vehicle | 22 (3.5%) | 0 (0.0%) |
| 1 Vehicle | 122 (19.2%) | 105 (18.4%) |
| 2 Vehicles | 400 (62.9%) | 337 (59.1%) |
| 3 Vehicles | 52 (8.2%) | 57 (10.0%) |
| 4 Vehicles | 29 (4.6%) | 51 (8.9%) |
| 5 or more Vehicles | 11 (1.7%) | 20 (3.5%) |
| Total | 636 (100.0%) | 570 (100.0%) |
Commute Time in Silver Creek
The most frequently occuring commute durations in Silver Creek are 20 to 24 minutes (168 commuters, 16.4%), 45 to 59 minutes (143 commuters, 14.0%), and 15 to 19 minutes (142 commuters, 13.9%).
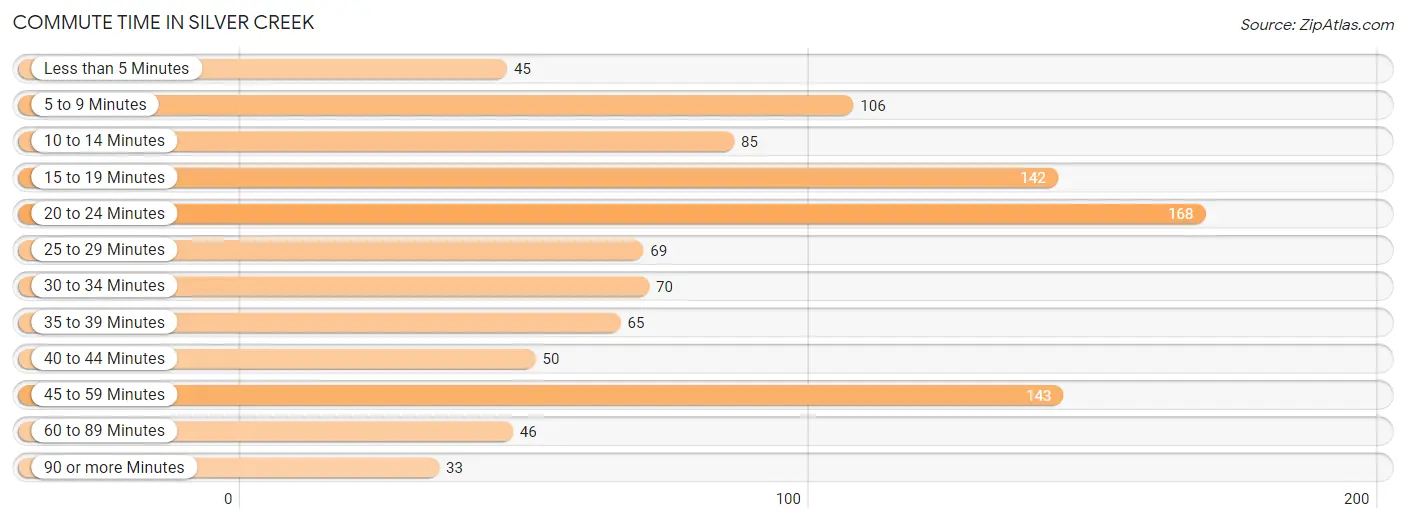
| Commute Time | # Commuters | % Commuters |
| Less than 5 Minutes | 45 | 4.4% |
| 5 to 9 Minutes | 106 | 10.4% |
| 10 to 14 Minutes | 85 | 8.3% |
| 15 to 19 Minutes | 142 | 13.9% |
| 20 to 24 Minutes | 168 | 16.4% |
| 25 to 29 Minutes | 69 | 6.8% |
| 30 to 34 Minutes | 70 | 6.9% |
| 35 to 39 Minutes | 65 | 6.4% |
| 40 to 44 Minutes | 50 | 4.9% |
| 45 to 59 Minutes | 143 | 14.0% |
| 60 to 89 Minutes | 46 | 4.5% |
| 90 or more Minutes | 33 | 3.2% |
Commute Time by Sex in Silver Creek
The most common commute times in Silver Creek are 15 to 19 minutes (103 commuters, 18.7%) for males and 20 to 24 minutes (95 commuters, 20.2%) for females.
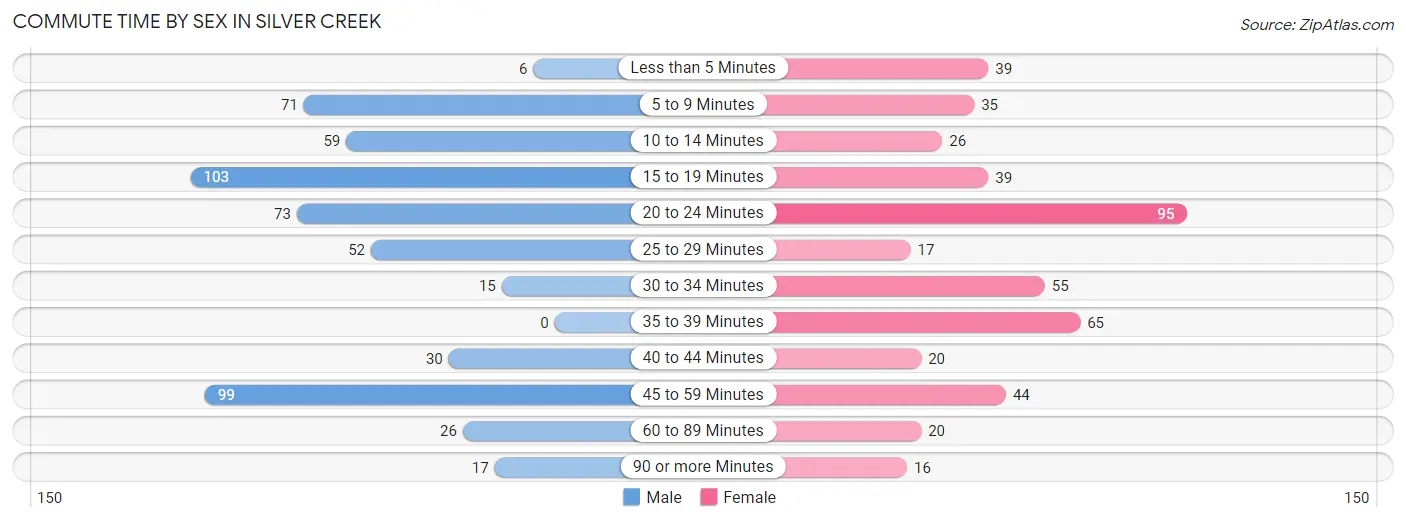
| Commute Time | Male | Female |
| Less than 5 Minutes | 6 (1.1%) | 39 (8.3%) |
| 5 to 9 Minutes | 71 (12.9%) | 35 (7.4%) |
| 10 to 14 Minutes | 59 (10.7%) | 26 (5.5%) |
| 15 to 19 Minutes | 103 (18.7%) | 39 (8.3%) |
| 20 to 24 Minutes | 73 (13.3%) | 95 (20.2%) |
| 25 to 29 Minutes | 52 (9.4%) | 17 (3.6%) |
| 30 to 34 Minutes | 15 (2.7%) | 55 (11.7%) |
| 35 to 39 Minutes | 0 (0.0%) | 65 (13.8%) |
| 40 to 44 Minutes | 30 (5.4%) | 20 (4.3%) |
| 45 to 59 Minutes | 99 (18.0%) | 44 (9.3%) |
| 60 to 89 Minutes | 26 (4.7%) | 20 (4.3%) |
| 90 or more Minutes | 17 (3.1%) | 16 (3.4%) |
Time of Departure to Work by Sex in Silver Creek
The most frequent times of departure to work in Silver Creek are 6:30 AM to 6:59 AM (102, 18.5%) for males and 8:30 AM to 8:59 AM (103, 21.9%) for females.
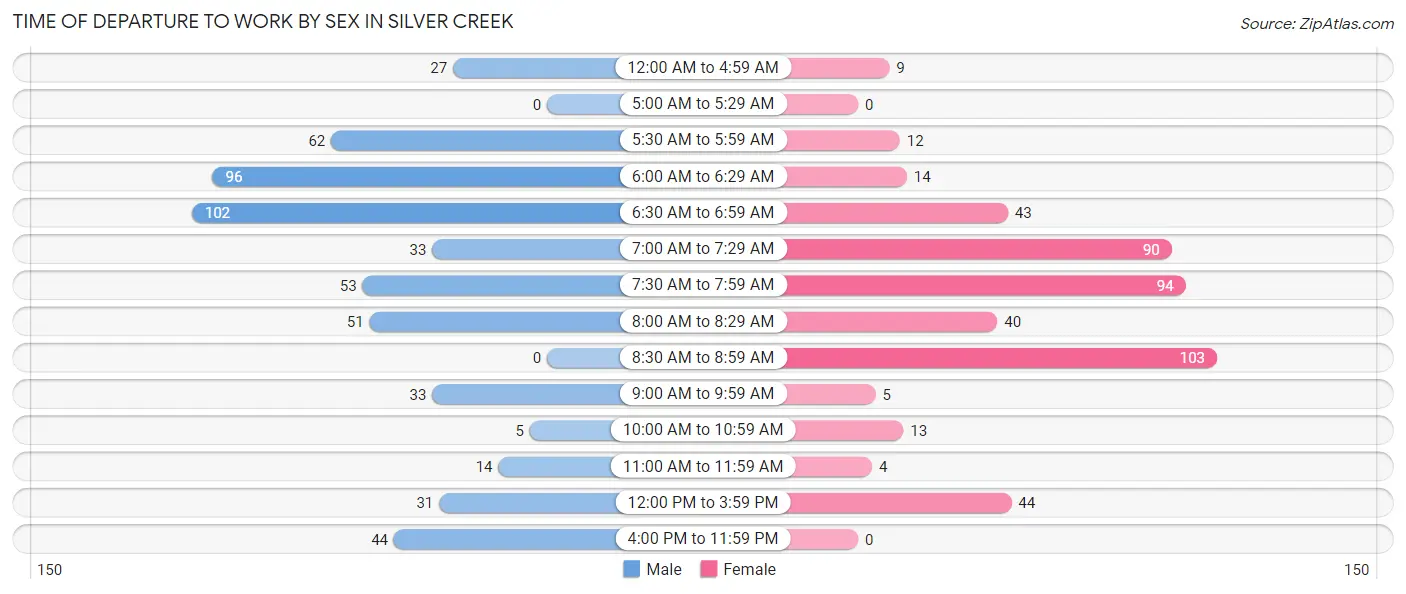
| Time of Departure | Male | Female |
| 12:00 AM to 4:59 AM | 27 (4.9%) | 9 (1.9%) |
| 5:00 AM to 5:29 AM | 0 (0.0%) | 0 (0.0%) |
| 5:30 AM to 5:59 AM | 62 (11.3%) | 12 (2.5%) |
| 6:00 AM to 6:29 AM | 96 (17.4%) | 14 (3.0%) |
| 6:30 AM to 6:59 AM | 102 (18.5%) | 43 (9.1%) |
| 7:00 AM to 7:29 AM | 33 (6.0%) | 90 (19.1%) |
| 7:30 AM to 7:59 AM | 53 (9.6%) | 94 (20.0%) |
| 8:00 AM to 8:29 AM | 51 (9.3%) | 40 (8.5%) |
| 8:30 AM to 8:59 AM | 0 (0.0%) | 103 (21.9%) |
| 9:00 AM to 9:59 AM | 33 (6.0%) | 5 (1.1%) |
| 10:00 AM to 10:59 AM | 5 (0.9%) | 13 (2.8%) |
| 11:00 AM to 11:59 AM | 14 (2.5%) | 4 (0.9%) |
| 12:00 PM to 3:59 PM | 31 (5.6%) | 44 (9.3%) |
| 4:00 PM to 11:59 PM | 44 (8.0%) | 0 (0.0%) |
| Total | 551 (100.0%) | 471 (100.0%) |
Housing Occupancy in Silver Creek
Occupancy by Ownership in Silver Creek
Of the total 1,082 dwellings in Silver Creek, owner-occupied units account for 795 (73.5%), while renter-occupied units make up 287 (26.5%).
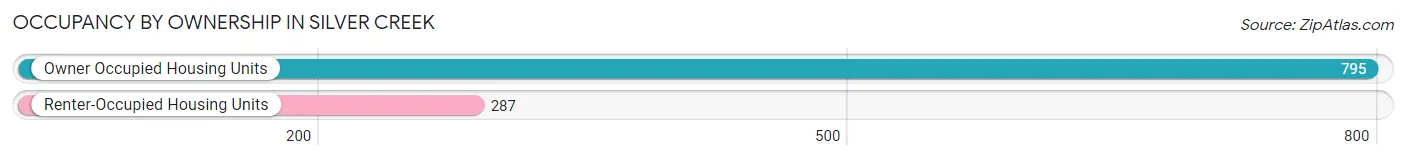
| Occupancy | # Housing Units | % Housing Units |
| Owner Occupied Housing Units | 795 | 73.5% |
| Renter-Occupied Housing Units | 287 | 26.5% |
| Total Occupied Housing Units | 1,082 | 100.0% |
Occupancy by Household Size in Silver Creek
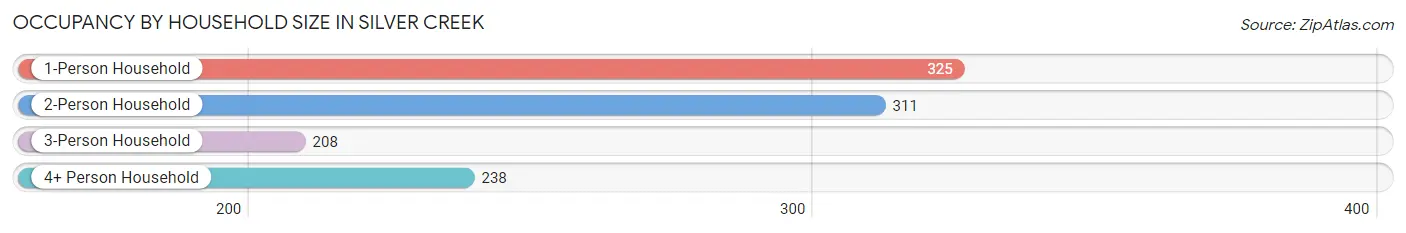
| Household Size | # Housing Units | % Housing Units |
| 1-Person Household | 325 | 30.0% |
| 2-Person Household | 311 | 28.7% |
| 3-Person Household | 208 | 19.2% |
| 4+ Person Household | 238 | 22.0% |
| Total Housing Units | 1,082 | 100.0% |
Occupancy by Ownership by Household Size in Silver Creek
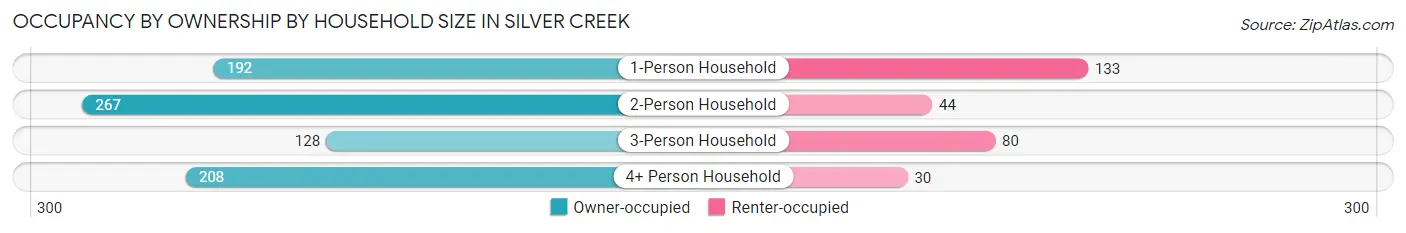
| Household Size | Owner-occupied | Renter-occupied |
| 1-Person Household | 192 (59.1%) | 133 (40.9%) |
| 2-Person Household | 267 (85.9%) | 44 (14.1%) |
| 3-Person Household | 128 (61.5%) | 80 (38.5%) |
| 4+ Person Household | 208 (87.4%) | 30 (12.6%) |
| Total Housing Units | 795 (73.5%) | 287 (26.5%) |
Occupancy by Educational Attainment in Silver Creek
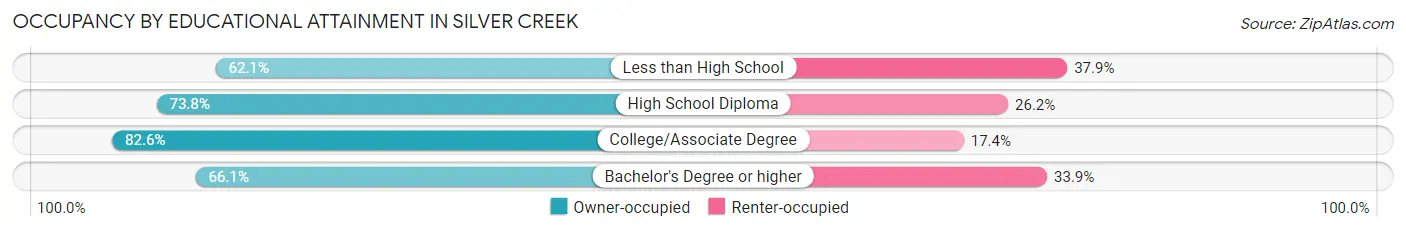
| Household Size | Owner-occupied | Renter-occupied |
| Less than High School | 41 (62.1%) | 25 (37.9%) |
| High School Diploma | 223 (73.8%) | 79 (26.2%) |
| College/Associate Degree | 295 (82.6%) | 62 (17.4%) |
| Bachelor's Degree or higher | 236 (66.1%) | 121 (33.9%) |
Occupancy by Age of Householder in Silver Creek
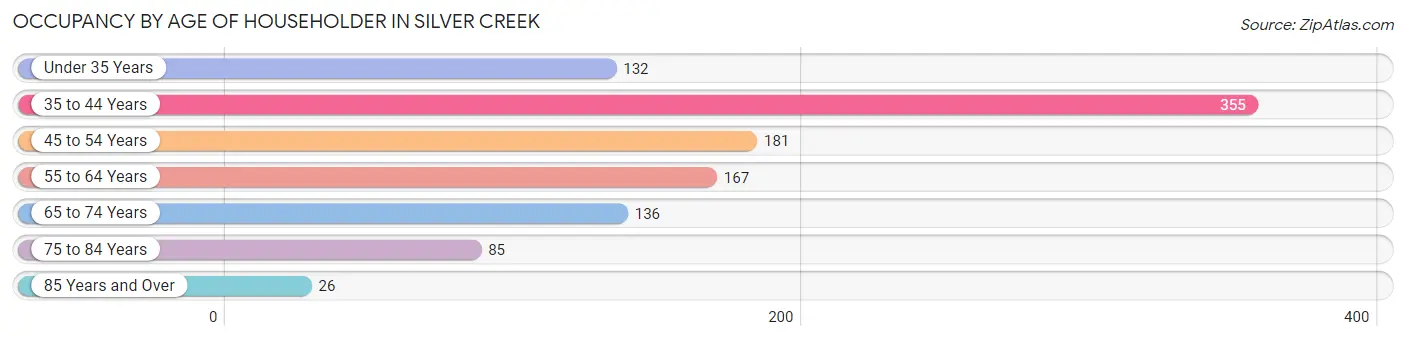
| Age Bracket | # Households | % Households |
| Under 35 Years | 132 | 12.2% |
| 35 to 44 Years | 355 | 32.8% |
| 45 to 54 Years | 181 | 16.7% |
| 55 to 64 Years | 167 | 15.4% |
| 65 to 74 Years | 136 | 12.6% |
| 75 to 84 Years | 85 | 7.9% |
| 85 Years and Over | 26 | 2.4% |
| Total | 1,082 | 100.0% |
Housing Finances in Silver Creek
Median Income by Occupancy in Silver Creek
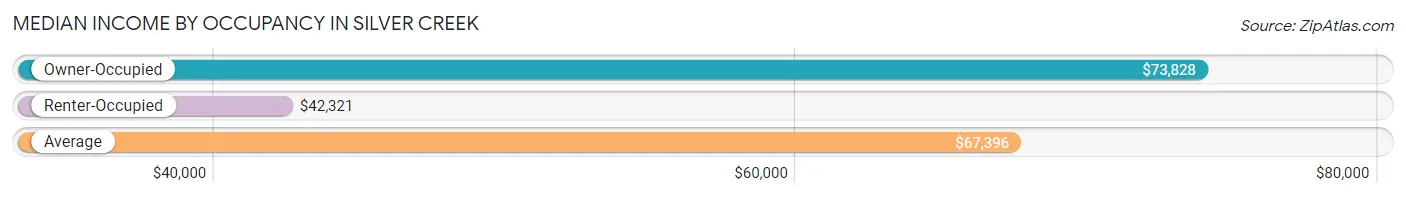
| Occupancy Type | # Households | Median Income |
| Owner-Occupied | 795 (73.5%) | $73,828 |
| Renter-Occupied | 287 (26.5%) | $42,321 |
| Average | 1,082 (100.0%) | $67,396 |
Occupancy by Householder Income Bracket in Silver Creek
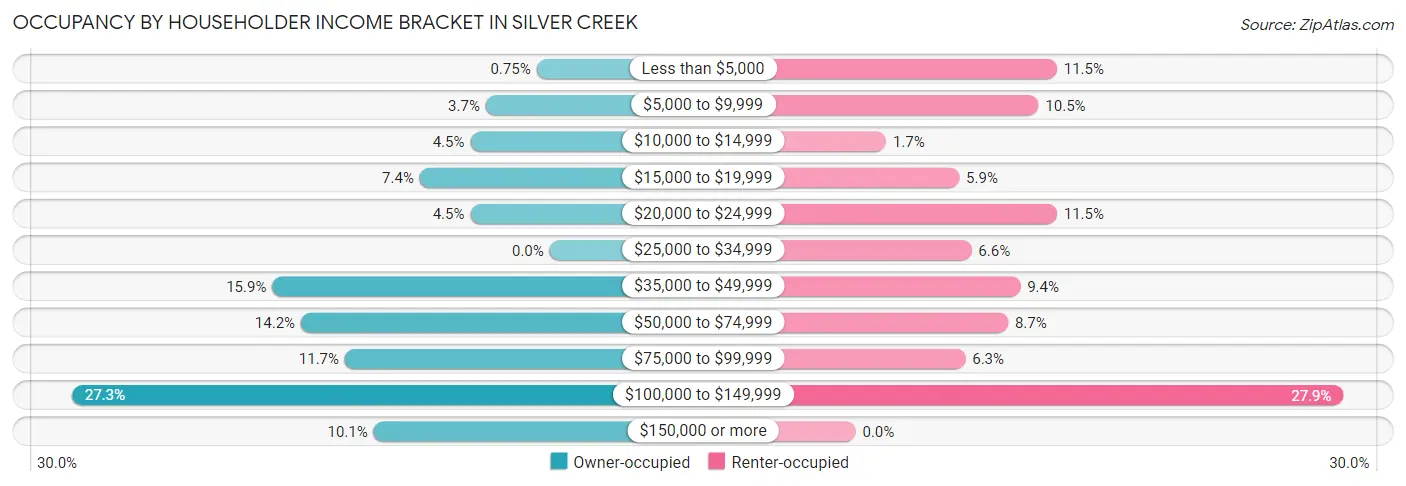
| Income Bracket | Owner-occupied | Renter-occupied |
| Less than $5,000 | 6 (0.7%) | 33 (11.5%) |
| $5,000 to $9,999 | 29 (3.6%) | 30 (10.4%) |
| $10,000 to $14,999 | 36 (4.5%) | 5 (1.7%) |
| $15,000 to $19,999 | 59 (7.4%) | 17 (5.9%) |
| $20,000 to $24,999 | 36 (4.5%) | 33 (11.5%) |
| $25,000 to $34,999 | 0 (0.0%) | 19 (6.6%) |
| $35,000 to $49,999 | 126 (15.9%) | 27 (9.4%) |
| $50,000 to $74,999 | 113 (14.2%) | 25 (8.7%) |
| $75,000 to $99,999 | 93 (11.7%) | 18 (6.3%) |
| $100,000 to $149,999 | 217 (27.3%) | 80 (27.9%) |
| $150,000 or more | 80 (10.1%) | 0 (0.0%) |
| Total | 795 (100.0%) | 287 (100.0%) |
Monthly Housing Cost Tiers in Silver Creek
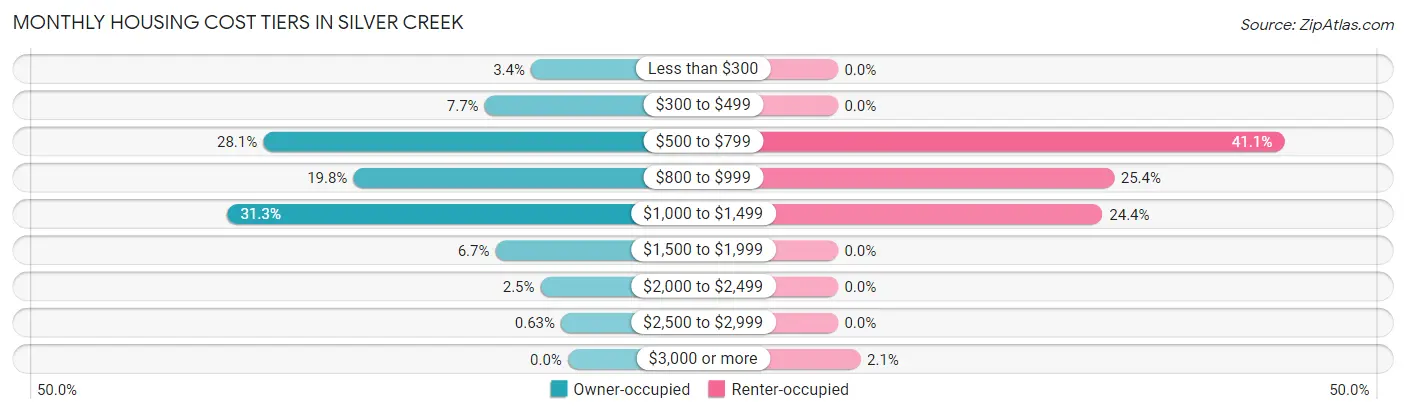
| Monthly Cost | Owner-occupied | Renter-occupied |
| Less than $300 | 27 (3.4%) | 0 (0.0%) |
| $300 to $499 | 61 (7.7%) | 0 (0.0%) |
| $500 to $799 | 223 (28.1%) | 118 (41.1%) |
| $800 to $999 | 157 (19.8%) | 73 (25.4%) |
| $1,000 to $1,499 | 249 (31.3%) | 70 (24.4%) |
| $1,500 to $1,999 | 53 (6.7%) | 0 (0.0%) |
| $2,000 to $2,499 | 20 (2.5%) | 0 (0.0%) |
| $2,500 to $2,999 | 5 (0.6%) | 0 (0.0%) |
| $3,000 or more | 0 (0.0%) | 6 (2.1%) |
| Total | 795 (100.0%) | 287 (100.0%) |
Physical Housing Characteristics in Silver Creek
Housing Structures in Silver Creek
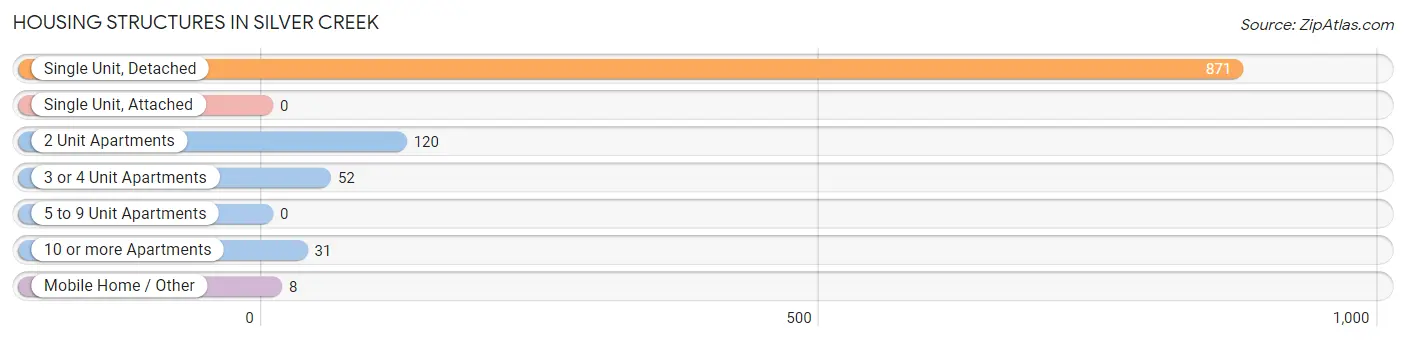
| Structure Type | # Housing Units | % Housing Units |
| Single Unit, Detached | 871 | 80.5% |
| Single Unit, Attached | 0 | 0.0% |
| 2 Unit Apartments | 120 | 11.1% |
| 3 or 4 Unit Apartments | 52 | 4.8% |
| 5 to 9 Unit Apartments | 0 | 0.0% |
| 10 or more Apartments | 31 | 2.9% |
| Mobile Home / Other | 8 | 0.7% |
| Total | 1,082 | 100.0% |
Housing Structures by Occupancy in Silver Creek
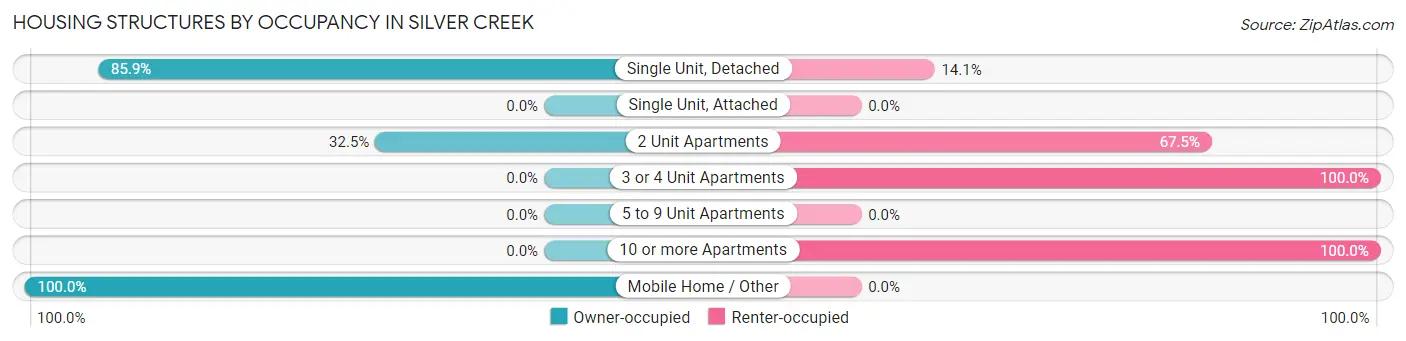
| Structure Type | Owner-occupied | Renter-occupied |
| Single Unit, Detached | 748 (85.9%) | 123 (14.1%) |
| Single Unit, Attached | 0 (0.0%) | 0 (0.0%) |
| 2 Unit Apartments | 39 (32.5%) | 81 (67.5%) |
| 3 or 4 Unit Apartments | 0 (0.0%) | 52 (100.0%) |
| 5 to 9 Unit Apartments | 0 (0.0%) | 0 (0.0%) |
| 10 or more Apartments | 0 (0.0%) | 31 (100.0%) |
| Mobile Home / Other | 8 (100.0%) | 0 (0.0%) |
| Total | 795 (73.5%) | 287 (26.5%) |
Housing Structures by Number of Rooms in Silver Creek
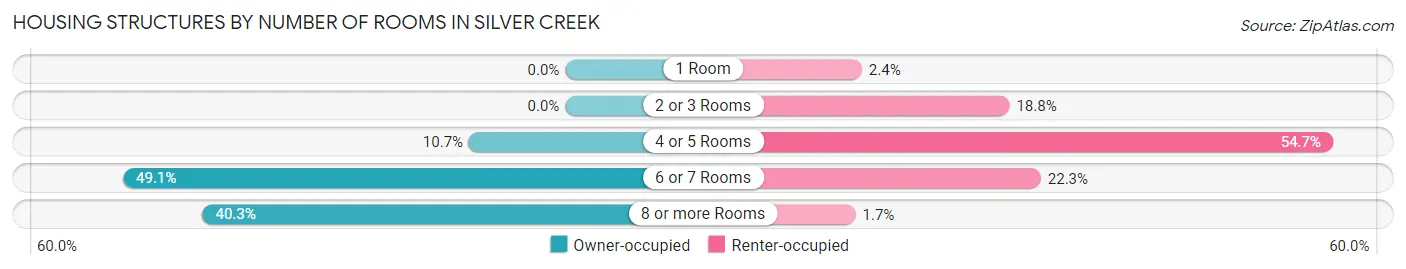
| Number of Rooms | Owner-occupied | Renter-occupied |
| 1 Room | 0 (0.0%) | 7 (2.4%) |
| 2 or 3 Rooms | 0 (0.0%) | 54 (18.8%) |
| 4 or 5 Rooms | 85 (10.7%) | 157 (54.7%) |
| 6 or 7 Rooms | 390 (49.1%) | 64 (22.3%) |
| 8 or more Rooms | 320 (40.3%) | 5 (1.7%) |
| Total | 795 (100.0%) | 287 (100.0%) |
Housing Structure by Heating Type in Silver Creek
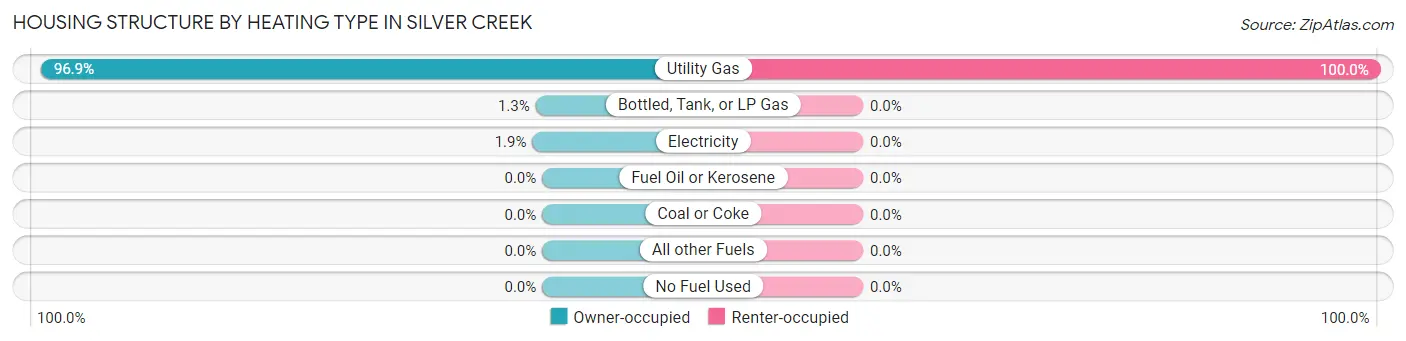
| Heating Type | Owner-occupied | Renter-occupied |
| Utility Gas | 770 (96.9%) | 287 (100.0%) |
| Bottled, Tank, or LP Gas | 10 (1.3%) | 0 (0.0%) |
| Electricity | 15 (1.9%) | 0 (0.0%) |
| Fuel Oil or Kerosene | 0 (0.0%) | 0 (0.0%) |
| Coal or Coke | 0 (0.0%) | 0 (0.0%) |
| All other Fuels | 0 (0.0%) | 0 (0.0%) |
| No Fuel Used | 0 (0.0%) | 0 (0.0%) |
| Total | 795 (100.0%) | 287 (100.0%) |
Household Vehicle Usage in Silver Creek
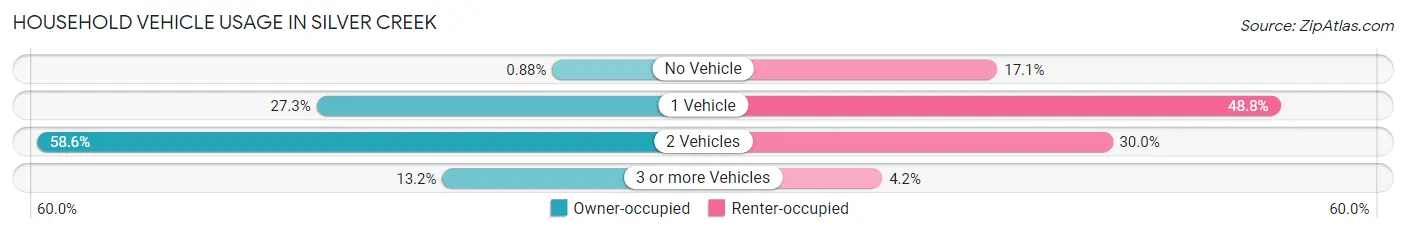
| Vehicles per Household | Owner-occupied | Renter-occupied |
| No Vehicle | 7 (0.9%) | 49 (17.1%) |
| 1 Vehicle | 217 (27.3%) | 140 (48.8%) |
| 2 Vehicles | 466 (58.6%) | 86 (30.0%) |
| 3 or more Vehicles | 105 (13.2%) | 12 (4.2%) |
| Total | 795 (100.0%) | 287 (100.0%) |
Real Estate & Mortgages in Silver Creek
Real Estate and Mortgage Overview in Silver Creek
| Characteristic | Without Mortgage | With Mortgage |
| Housing Units | 331 | 464 |
| Median Property Value | $98,400 | $114,900 |
| Median Household Income | $48,375 | $60 |
| Monthly Housing Costs | $587 | $0 |
| Real Estate Taxes | $2,638 | $12 |
Property Value by Mortgage Status in Silver Creek
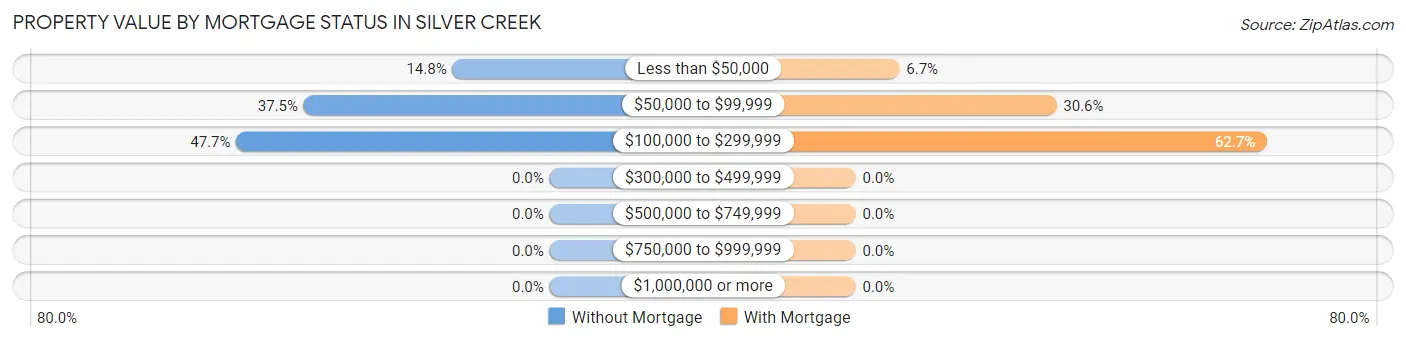
| Property Value | Without Mortgage | With Mortgage |
| Less than $50,000 | 49 (14.8%) | 31 (6.7%) |
| $50,000 to $99,999 | 124 (37.5%) | 142 (30.6%) |
| $100,000 to $299,999 | 158 (47.7%) | 291 (62.7%) |
| $300,000 to $499,999 | 0 (0.0%) | 0 (0.0%) |
| $500,000 to $749,999 | 0 (0.0%) | 0 (0.0%) |
| $750,000 to $999,999 | 0 (0.0%) | 0 (0.0%) |
| $1,000,000 or more | 0 (0.0%) | 0 (0.0%) |
| Total | 331 (100.0%) | 464 (100.0%) |
Household Income by Mortgage Status in Silver Creek
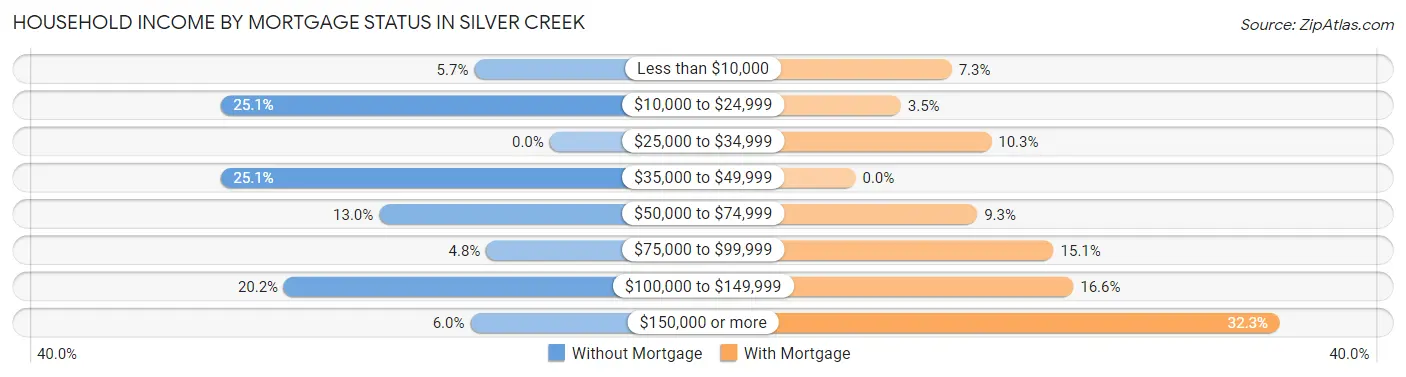
| Household Income | Without Mortgage | With Mortgage |
| Less than $10,000 | 19 (5.7%) | 34 (7.3%) |
| $10,000 to $24,999 | 83 (25.1%) | 16 (3.5%) |
| $25,000 to $34,999 | 0 (0.0%) | 48 (10.3%) |
| $35,000 to $49,999 | 83 (25.1%) | 0 (0.0%) |
| $50,000 to $74,999 | 43 (13.0%) | 43 (9.3%) |
| $75,000 to $99,999 | 16 (4.8%) | 70 (15.1%) |
| $100,000 to $149,999 | 67 (20.2%) | 77 (16.6%) |
| $150,000 or more | 20 (6.0%) | 150 (32.3%) |
| Total | 331 (100.0%) | 464 (100.0%) |
Property Value to Household Income Ratio in Silver Creek
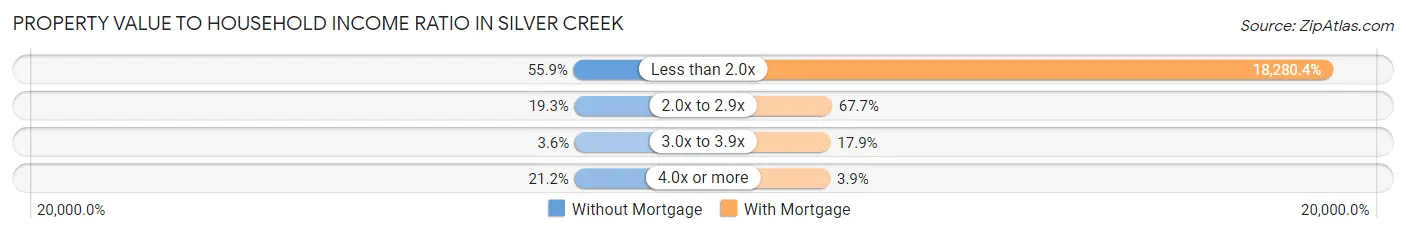
| Value-to-Income Ratio | Without Mortgage | With Mortgage |
| Less than 2.0x | 185 (55.9%) | 84,821 (18,280.4%) |
| 2.0x to 2.9x | 64 (19.3%) | 314 (67.7%) |
| 3.0x to 3.9x | 12 (3.6%) | 83 (17.9%) |
| 4.0x or more | 70 (21.1%) | 18 (3.9%) |
| Total | 331 (100.0%) | 464 (100.0%) |
Real Estate Taxes by Mortgage Status in Silver Creek
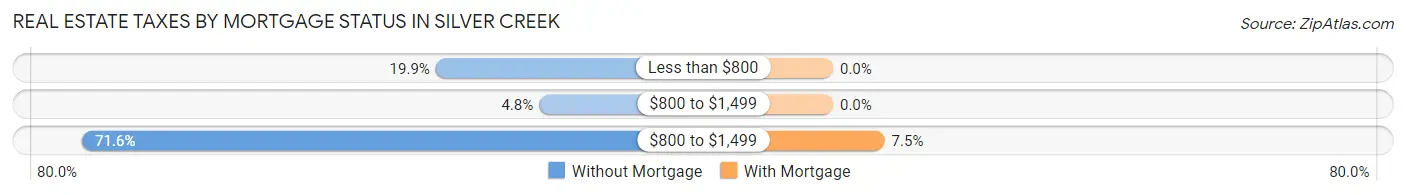
| Property Taxes | Without Mortgage | With Mortgage |
| Less than $800 | 66 (19.9%) | 0 (0.0%) |
| $800 to $1,499 | 16 (4.8%) | 0 (0.0%) |
| $800 to $1,499 | 237 (71.6%) | 35 (7.5%) |
| Total | 331 (100.0%) | 464 (100.0%) |
Health & Disability in Silver Creek
Health Insurance Coverage by Age in Silver Creek
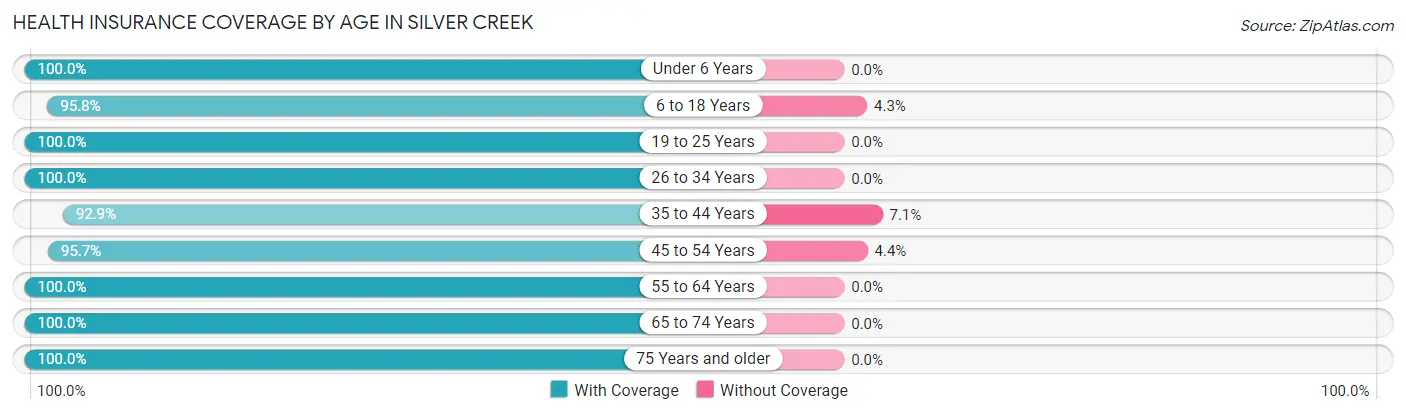
| Age Bracket | With Coverage | Without Coverage |
| Under 6 Years | 223 (100.0%) | 0 (0.0%) |
| 6 to 18 Years | 451 (95.8%) | 20 (4.3%) |
| 19 to 25 Years | 192 (100.0%) | 0 (0.0%) |
| 26 to 34 Years | 176 (100.0%) | 0 (0.0%) |
| 35 to 44 Years | 547 (92.9%) | 42 (7.1%) |
| 45 to 54 Years | 308 (95.7%) | 14 (4.3%) |
| 55 to 64 Years | 265 (100.0%) | 0 (0.0%) |
| 65 to 74 Years | 244 (100.0%) | 0 (0.0%) |
| 75 Years and older | 141 (100.0%) | 0 (0.0%) |
| Total | 2,547 (97.1%) | 76 (2.9%) |
Health Insurance Coverage by Citizenship Status in Silver Creek
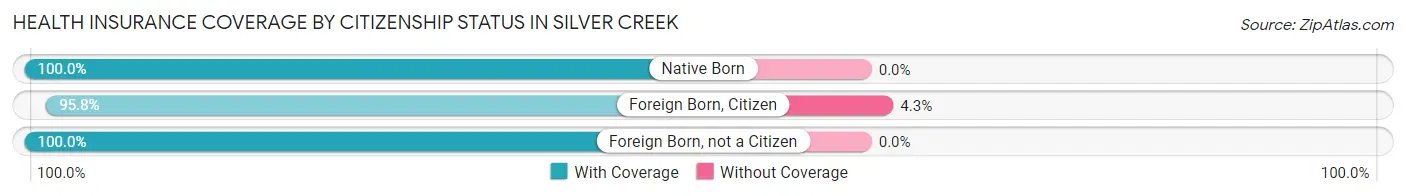
| Citizenship Status | With Coverage | Without Coverage |
| Native Born | 223 (100.0%) | 0 (0.0%) |
| Foreign Born, Citizen | 451 (95.8%) | 20 (4.3%) |
| Foreign Born, not a Citizen | 192 (100.0%) | 0 (0.0%) |
Health Insurance Coverage by Household Income in Silver Creek
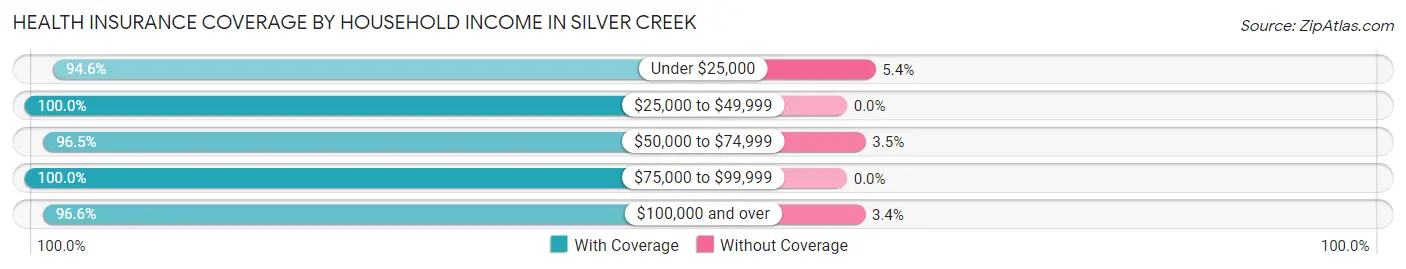
| Household Income | With Coverage | Without Coverage |
| Under $25,000 | 441 (94.6%) | 25 (5.4%) |
| $25,000 to $49,999 | 345 (100.0%) | 0 (0.0%) |
| $50,000 to $74,999 | 332 (96.5%) | 12 (3.5%) |
| $75,000 to $99,999 | 283 (100.0%) | 0 (0.0%) |
| $100,000 and over | 1,107 (96.6%) | 39 (3.4%) |
Public vs Private Health Insurance Coverage by Age in Silver Creek
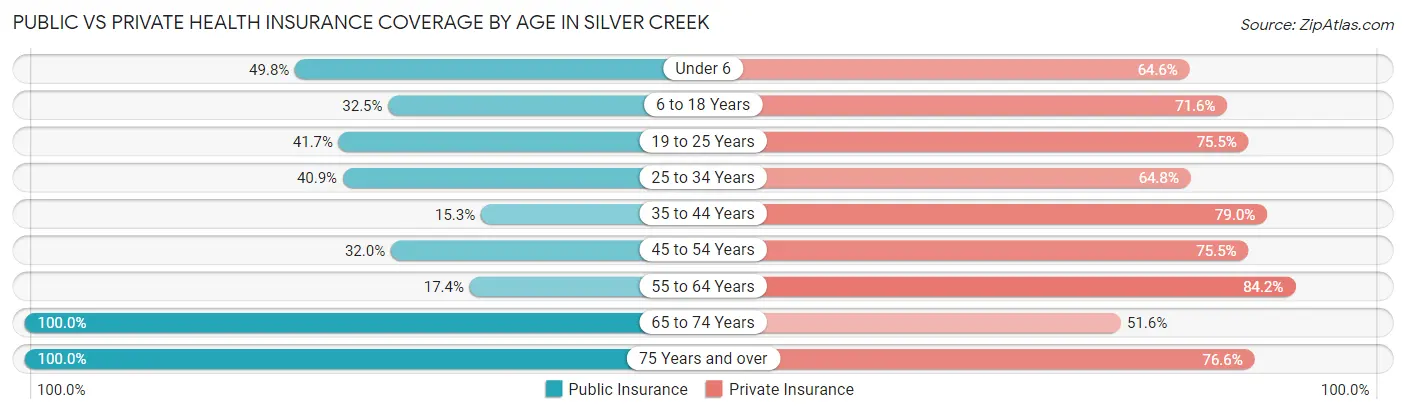
| Age Bracket | Public Insurance | Private Insurance |
| Under 6 | 111 (49.8%) | 144 (64.6%) |
| 6 to 18 Years | 153 (32.5%) | 337 (71.6%) |
| 19 to 25 Years | 80 (41.7%) | 145 (75.5%) |
| 25 to 34 Years | 72 (40.9%) | 114 (64.8%) |
| 35 to 44 Years | 90 (15.3%) | 465 (78.9%) |
| 45 to 54 Years | 103 (32.0%) | 243 (75.5%) |
| 55 to 64 Years | 46 (17.4%) | 223 (84.2%) |
| 65 to 74 Years | 244 (100.0%) | 126 (51.6%) |
| 75 Years and over | 141 (100.0%) | 108 (76.6%) |
| Total | 1,040 (39.7%) | 1,905 (72.6%) |
Disability Status by Sex by Age in Silver Creek
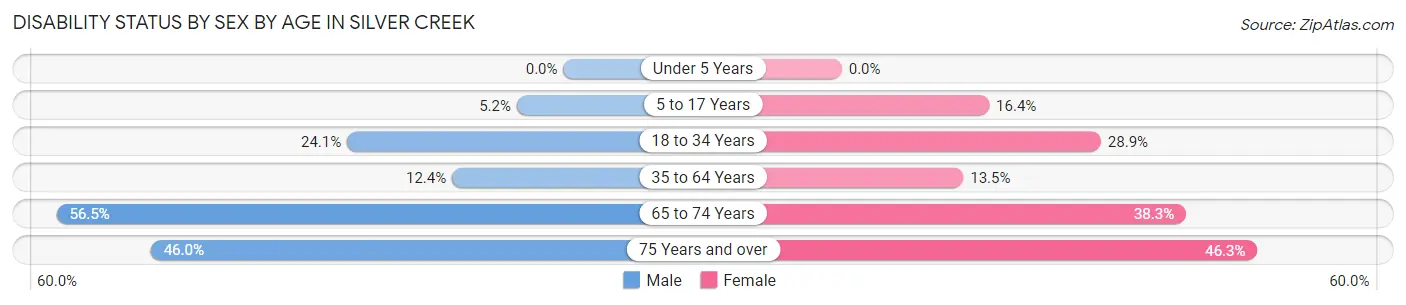
| Age Bracket | Male | Female |
| Under 5 Years | 0 (0.0%) | 0 (0.0%) |
| 5 to 17 Years | 10 (5.2%) | 42 (16.4%) |
| 18 to 34 Years | 53 (24.1%) | 58 (28.9%) |
| 35 to 64 Years | 78 (12.4%) | 74 (13.5%) |
| 65 to 74 Years | 70 (56.5%) | 46 (38.3%) |
| 75 Years and over | 34 (46.0%) | 31 (46.3%) |
Disability Class by Sex by Age in Silver Creek
Disability Class: Hearing Difficulty
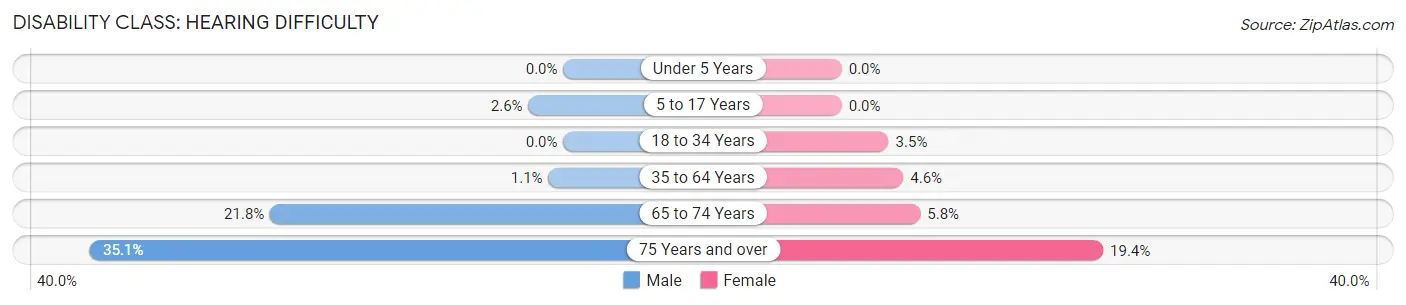
| Age Bracket | Male | Female |
| Under 5 Years | 0 (0.0%) | 0 (0.0%) |
| 5 to 17 Years | 5 (2.6%) | 0 (0.0%) |
| 18 to 34 Years | 0 (0.0%) | 7 (3.5%) |
| 35 to 64 Years | 7 (1.1%) | 25 (4.6%) |
| 65 to 74 Years | 27 (21.8%) | 7 (5.8%) |
| 75 Years and over | 26 (35.1%) | 13 (19.4%) |
Disability Class: Vision Difficulty
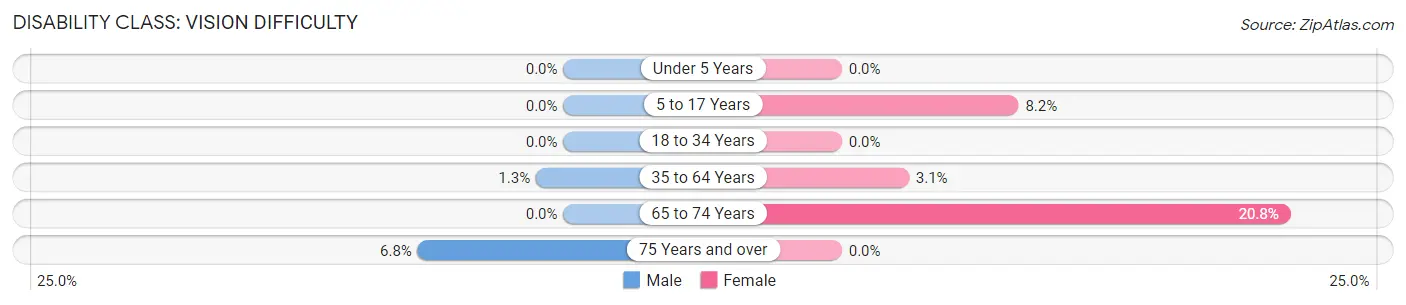
| Age Bracket | Male | Female |
| Under 5 Years | 0 (0.0%) | 0 (0.0%) |
| 5 to 17 Years | 0 (0.0%) | 21 (8.2%) |
| 18 to 34 Years | 0 (0.0%) | 0 (0.0%) |
| 35 to 64 Years | 8 (1.3%) | 17 (3.1%) |
| 65 to 74 Years | 0 (0.0%) | 25 (20.8%) |
| 75 Years and over | 5 (6.8%) | 0 (0.0%) |
Disability Class: Cognitive Difficulty
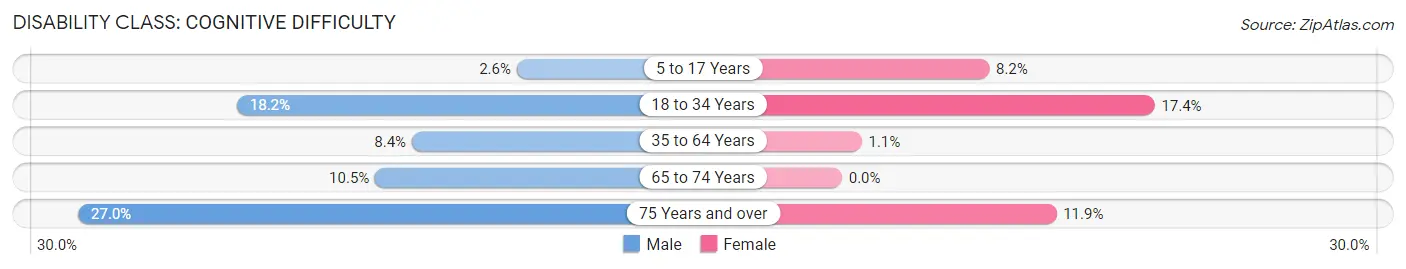
| Age Bracket | Male | Female |
| 5 to 17 Years | 5 (2.6%) | 21 (8.2%) |
| 18 to 34 Years | 40 (18.2%) | 35 (17.4%) |
| 35 to 64 Years | 53 (8.4%) | 6 (1.1%) |
| 65 to 74 Years | 13 (10.5%) | 0 (0.0%) |
| 75 Years and over | 20 (27.0%) | 8 (11.9%) |
Disability Class: Ambulatory Difficulty
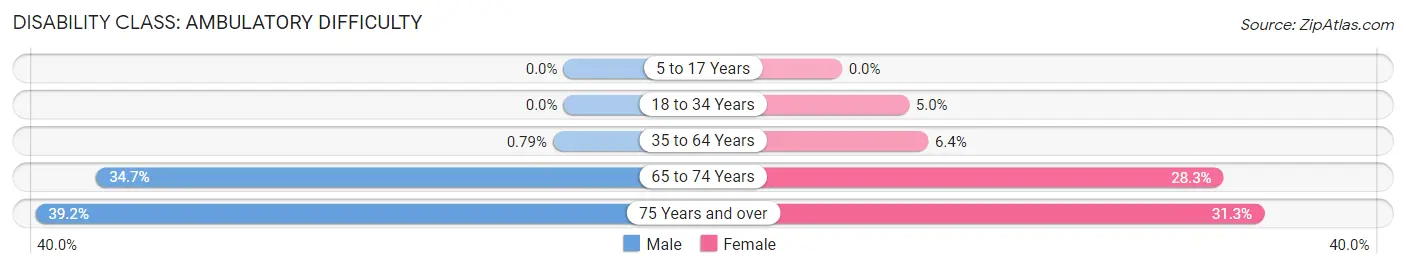
| Age Bracket | Male | Female |
| 5 to 17 Years | 0 (0.0%) | 0 (0.0%) |
| 18 to 34 Years | 0 (0.0%) | 10 (5.0%) |
| 35 to 64 Years | 5 (0.8%) | 35 (6.4%) |
| 65 to 74 Years | 43 (34.7%) | 34 (28.3%) |
| 75 Years and over | 29 (39.2%) | 21 (31.3%) |
Disability Class: Self-Care Difficulty
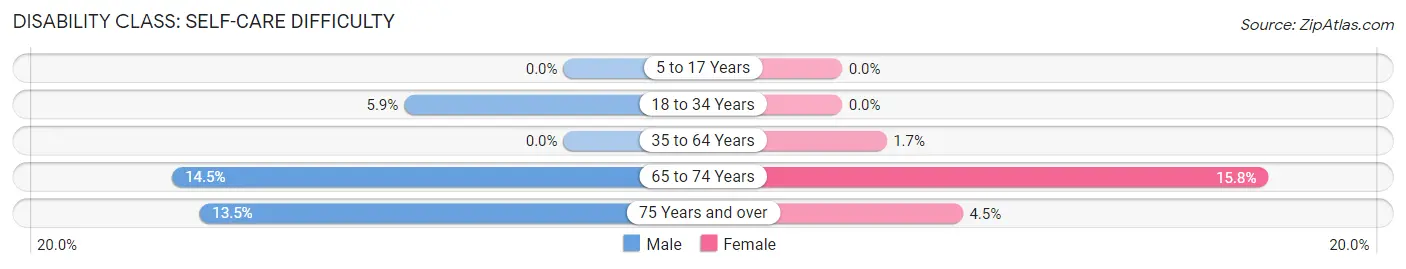
| Age Bracket | Male | Female |
| 5 to 17 Years | 0 (0.0%) | 0 (0.0%) |
| 18 to 34 Years | 13 (5.9%) | 0 (0.0%) |
| 35 to 64 Years | 0 (0.0%) | 9 (1.7%) |
| 65 to 74 Years | 18 (14.5%) | 19 (15.8%) |
| 75 Years and over | 10 (13.5%) | 3 (4.5%) |
Technology Access in Silver Creek
Computing Device Access in Silver Creek
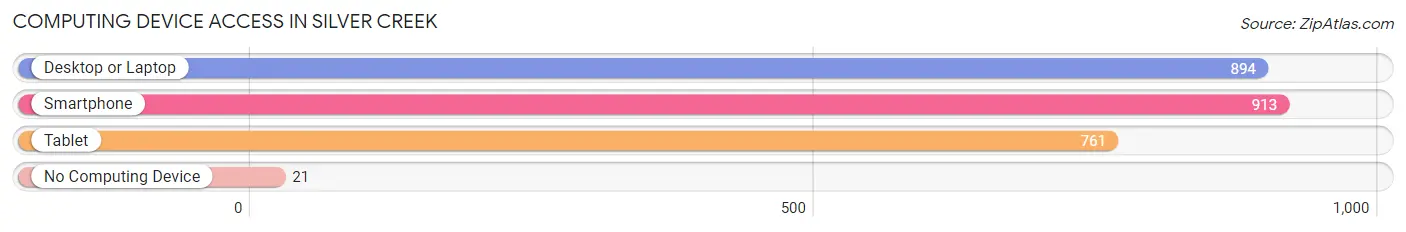
| Device Type | # Households | % Households |
| Desktop or Laptop | 894 | 82.6% |
| Smartphone | 913 | 84.4% |
| Tablet | 761 | 70.3% |
| No Computing Device | 21 | 1.9% |
| Total | 1,082 | 100.0% |
Internet Access in Silver Creek
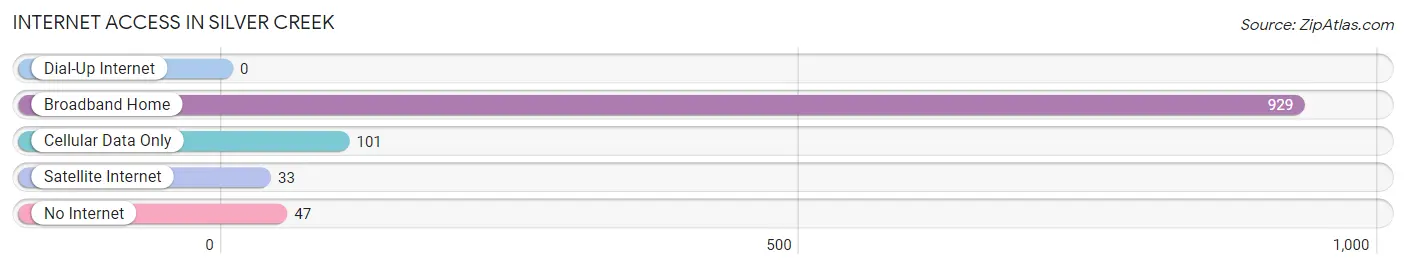
| Internet Type | # Households | % Households |
| Dial-Up Internet | 0 | 0.0% |
| Broadband Home | 929 | 85.9% |
| Cellular Data Only | 101 | 9.3% |
| Satellite Internet | 33 | 3.0% |
| No Internet | 47 | 4.3% |
| Total | 1,082 | 100.0% |
Silver Creek Summary
Introduction
Silver Creek is a village located in the town of Hanover in Chautauqua County, New York. It is situated on the banks of the Cattaraugus Creek, which is a tributary of Lake Erie. The village is located in the southwestern corner of the county, approximately 25 miles south of Buffalo and 30 miles north of Jamestown. The village has a population of approximately 2,500 people and is part of the Buffalo-Niagara Falls metropolitan area.
History
The area that is now Silver Creek was originally inhabited by the Seneca Nation of the Iroquois Confederacy. The first European settlers arrived in the area in the early 19th century. The village was founded in 1825 by a group of settlers from Connecticut. The village was originally known as "New Connecticut" and was later renamed Silver Creek after the creek that runs through it.
The village was an important stop on the Underground Railroad, with many escaped slaves passing through on their way to freedom in Canada. The village was also an important stop on the Erie Canal, which was completed in 1825. The canal brought increased trade and commerce to the area, and the village grew rapidly.
In the late 19th century, the village was home to several industries, including a flour mill, a sawmill, a tannery, and a furniture factory. The village also had a thriving agricultural industry, with many farmers growing wheat, corn, and other crops.
Geography
Silver Creek is located in the southwestern corner of Chautauqua County, approximately 25 miles south of Buffalo and 30 miles north of Jamestown. The village is situated on the banks of the Cattaraugus Creek, which is a tributary of Lake Erie. The village is surrounded by rolling hills and farmland. The village is located in the Great Lakes region of the United States and has a humid continental climate.
Economy
The economy of Silver Creek is largely based on agriculture and tourism. The village is home to several wineries and vineyards, as well as several fruit and vegetable farms. The village is also home to several small businesses, including restaurants, shops, and other services. The village is also home to a large manufacturing plant, which produces automotive parts.
Demographics
As of the 2010 census, the population of Silver Creek was 2,500. The racial makeup of the village was 95.2% White, 0.8% African American, 0.4% Native American, 0.8% Asian, 0.2% Pacific Islander, and 2.4% from other races. The median household income was $37,500 and the median family income was $45,000. The per capita income was $19,000.
Conclusion
Silver Creek is a small village located in the southwestern corner of Chautauqua County, New York. The village has a population of approximately 2,500 people and is part of the Buffalo-Niagara Falls metropolitan area. The village has a long history, dating back to the early 19th century. The economy of Silver Creek is largely based on agriculture and tourism, and the village is home to several wineries and vineyards, as well as several small businesses. The racial makeup of the village is predominantly White, with a small percentage of African American, Native American, Asian, and Pacific Islander residents.
Common Questions
What is Per Capita Income in Silver Creek?
Per Capita income in Silver Creek is $31,198.
What is the Median Family Income in Silver Creek?
Median Family Income in Silver Creek is $85,938.
What is the Median Household income in Silver Creek?
Median Household Income in Silver Creek is $67,396.
What is Income or Wage Gap in Silver Creek?
Income or Wage Gap in Silver Creek is 34.8%.
Women in Silver Creek earn 65.2 cents for every dollar earned by a man.
What is Inequality or Gini Index in Silver Creek?
Inequality or Gini Index in Silver Creek is 0.40.
What is the Total Population of Silver Creek?
Total Population of Silver Creek is 2,623.
What is the Total Male Population of Silver Creek?
Total Male Population of Silver Creek is 1,300.
What is the Total Female Population of Silver Creek?
Total Female Population of Silver Creek is 1,323.
What is the Ratio of Males per 100 Females in Silver Creek?
There are 98.26 Males per 100 Females in Silver Creek.
What is the Ratio of Females per 100 Males in Silver Creek?
There are 101.77 Females per 100 Males in Silver Creek.
What is the Median Population Age in Silver Creek?
Median Population Age in Silver Creek is 38.4 Years.
What is the Average Family Size in Silver Creek
Average Family Size in Silver Creek is 2.9 People.
What is the Average Household Size in Silver Creek
Average Household Size in Silver Creek is 2.4 People.
How Large is the Labor Force in Silver Creek?
There are 1,314 People in the Labor Forcein in Silver Creek.
What is the Percentage of People in the Labor Force in Silver Creek?
62.7% of People are in the Labor Force in Silver Creek.
What is the Unemployment Rate in Silver Creek?
Unemployment Rate in Silver Creek is 6.4%.