Byersville, NY Map & Demographics
Byersville Map
Byersville Overview
$44,950
PER CAPITA INCOME
$44,821
AVG FAMILY INCOME
$78,125
AVG HOUSEHOLD INCOME
0.24
INEQUALITY / GINI INDEX
46
TOTAL POPULATION
24
MALE POPULATION
22
FEMALE POPULATION
109.09
MALES / 100 FEMALES
91.67
FEMALES / 100 MALES
49.3
MEDIAN AGE
1.7
AVG FAMILY SIZE
1.4
AVG HOUSEHOLD SIZE
37
LABOR FORCE [ PEOPLE ]
86.0%
PERCENT IN LABOR FORCE
10.8%
UNEMPLOYMENT RATE
Income in Byersville
Income Overview in Byersville
Per Capita Income in Byersville is $44,950, while median incomes of families and households are $44,821 and $78,125 respectively.
| Characteristic | Number | Measure |
| Per Capita Income | 46 | $44,950 |
| Median Family Income | 13 | $44,821 |
| Mean Family Income | 13 | $60,231 |
| Median Household Income | 33 | $78,125 |
| Mean Household Income | 33 | $63,512 |
| Income Deficit | 13 | $0 |
| Wage / Income Gap (%) | 46 | 0.00% |
| Wage / Income Gap ($) | 46 | 100.00¢ per $1 |
| Gini / Inequality Index | 46 | 0.24 |
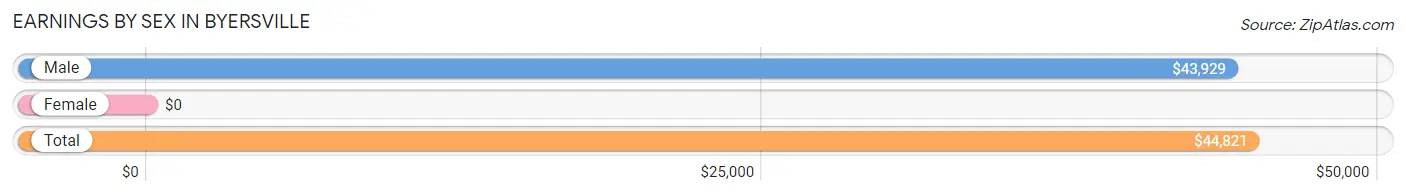
Earnings by Sex in Byersville
| Sex | Number | Average Earnings |
| Male | 18 (48.6%) | $43,929 |
| Female | 19 (51.3%) | $0 |
| Total | 37 (100.0%) | $44,821 |
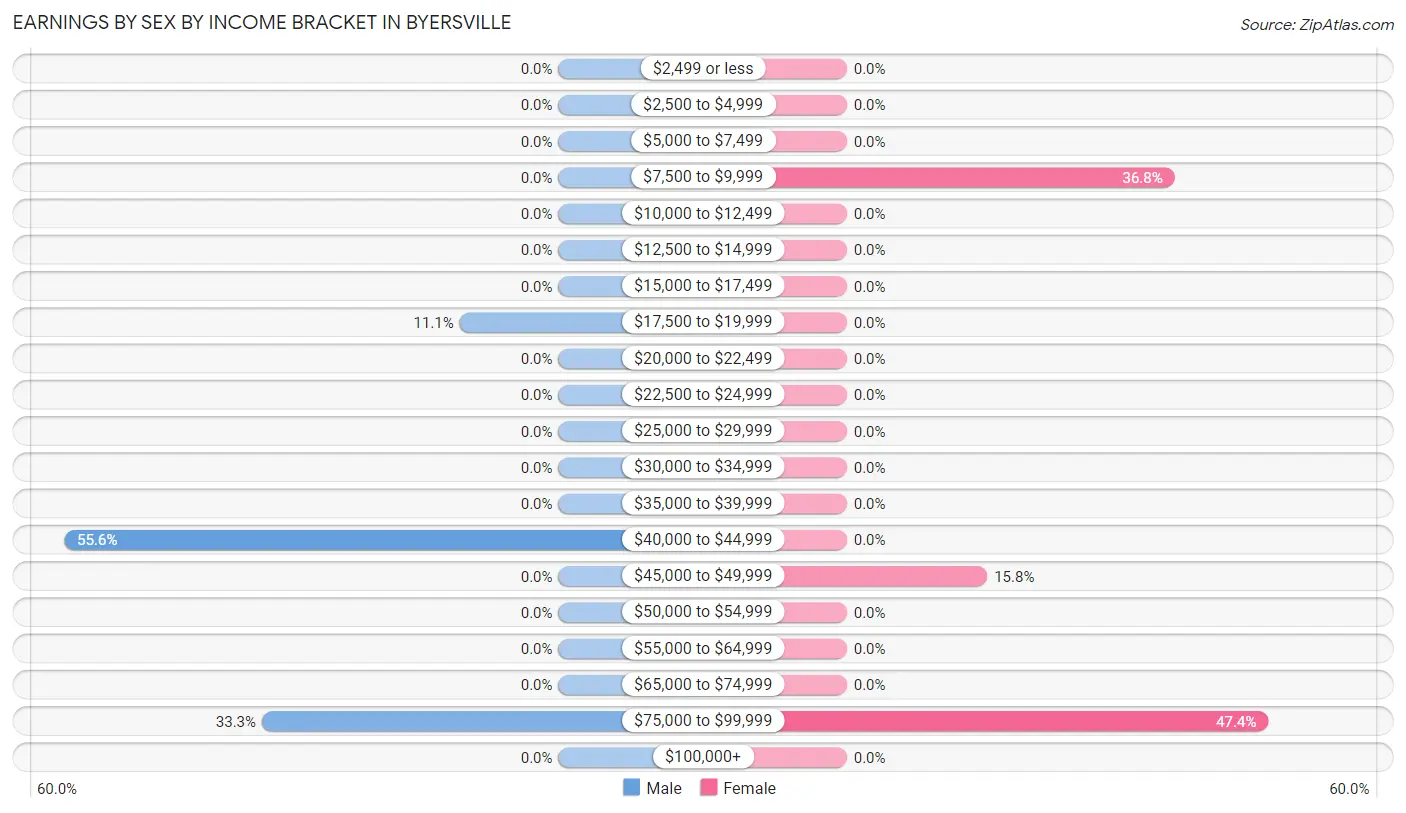
Earnings by Sex by Income Bracket in Byersville
The most common earnings brackets in Byersville are $40,000 to $44,999 for men (10 | 55.6%) and $75,000 to $99,999 for women (9 | 47.4%).
| Income | Male | Female |
| $2,499 or less | 0 (0.0%) | 0 (0.0%) |
| $2,500 to $4,999 | 0 (0.0%) | 0 (0.0%) |
| $5,000 to $7,499 | 0 (0.0%) | 0 (0.0%) |
| $7,500 to $9,999 | 0 (0.0%) | 7 (36.8%) |
| $10,000 to $12,499 | 0 (0.0%) | 0 (0.0%) |
| $12,500 to $14,999 | 0 (0.0%) | 0 (0.0%) |
| $15,000 to $17,499 | 0 (0.0%) | 0 (0.0%) |
| $17,500 to $19,999 | 2 (11.1%) | 0 (0.0%) |
| $20,000 to $22,499 | 0 (0.0%) | 0 (0.0%) |
| $22,500 to $24,999 | 0 (0.0%) | 0 (0.0%) |
| $25,000 to $29,999 | 0 (0.0%) | 0 (0.0%) |
| $30,000 to $34,999 | 0 (0.0%) | 0 (0.0%) |
| $35,000 to $39,999 | 0 (0.0%) | 0 (0.0%) |
| $40,000 to $44,999 | 10 (55.6%) | 0 (0.0%) |
| $45,000 to $49,999 | 0 (0.0%) | 3 (15.8%) |
| $50,000 to $54,999 | 0 (0.0%) | 0 (0.0%) |
| $55,000 to $64,999 | 0 (0.0%) | 0 (0.0%) |
| $65,000 to $74,999 | 0 (0.0%) | 0 (0.0%) |
| $75,000 to $99,999 | 6 (33.3%) | 9 (47.4%) |
| $100,000+ | 0 (0.0%) | 0 (0.0%) |
| Total | 18 (100.0%) | 19 (100.0%) |
Earnings by Sex by Educational Attainment in Byersville
| Educational Attainment | Male Income | Female Income |
| Less than High School | - | - |
| High School Diploma | - | - |
| College or Associate's Degree | - | - |
| Bachelor's Degree | - | - |
| Graduate Degree | - | - |
| Total | $77,708 | $80,417 |
Family Income in Byersville
Family Income Brackets in Byersville
According to the Byersville family income data, there are 10 families falling into the $35,000 to $49,999 income range, which is the most common income bracket and makes up 76.9% of all families.
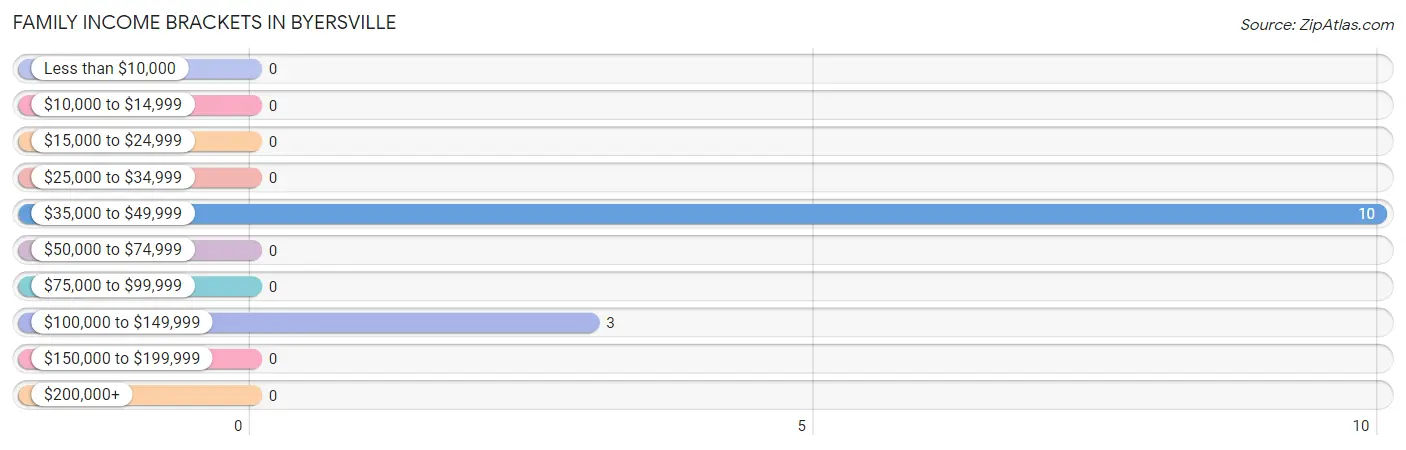
| Income Bracket | # Families | % Families |
| Less than $10,000 | 0 | 0.0% |
| $10,000 to $14,999 | 0 | 0.0% |
| $15,000 to $24,999 | 0 | 0.0% |
| $25,000 to $34,999 | 0 | 0.0% |
| $35,000 to $49,999 | 10 | 76.9% |
| $50,000 to $74,999 | 0 | 0.0% |
| $75,000 to $99,999 | 0 | 0.0% |
| $100,000 to $149,999 | 3 | 23.1% |
| $150,000 to $199,999 | 0 | 0.0% |
| $200,000+ | 0 | 0.0% |
Family Income by Famaliy Size in Byersville
2-person families (13 | 100.0%) account for the highest median family income in Byersville with $44,821 per family, while 2-person families (13 | 100.0%) have the highest median income of $22,410 per family member.
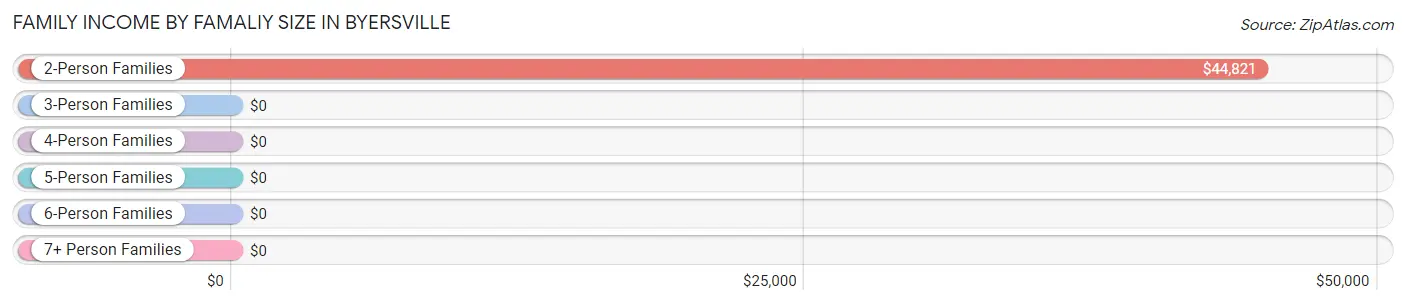
| Income Bracket | # Families | Median Income |
| 2-Person Families | 13 (100.0%) | $44,821 |
| 3-Person Families | 0 (0.0%) | $0 |
| 4-Person Families | 0 (0.0%) | $0 |
| 5-Person Families | 0 (0.0%) | $0 |
| 6-Person Families | 0 (0.0%) | $0 |
| 7+ Person Families | 0 (0.0%) | $0 |
| Total | 13 (100.0%) | $44,821 |
Family Income by Number of Earners in Byersville
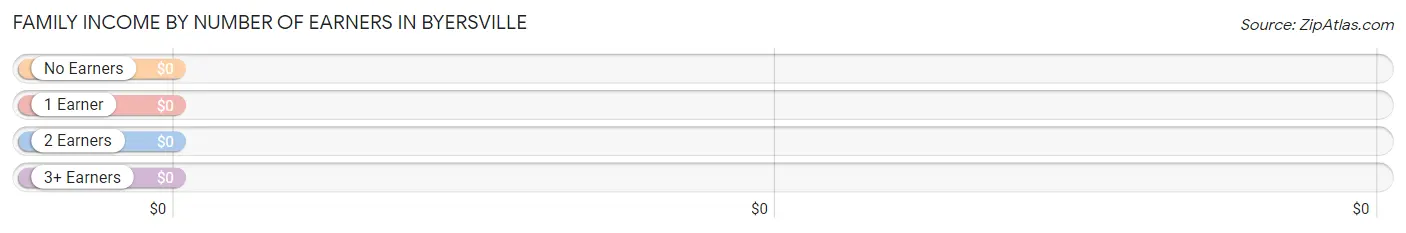
| Number of Earners | # Families | Median Income |
| No Earners | 0 (0.0%) | $0 |
| 1 Earner | 10 (76.9%) | $0 |
| 2 Earners | 3 (23.1%) | $0 |
| 3+ Earners | 0 (0.0%) | $0 |
| Total | 13 (100.0%) | $44,821 |
Household Income in Byersville
Household Income Brackets in Byersville
With 15 households falling in the category, the $75,000 to $99,999 income range is the most frequent in Byersville, accounting for 45.5% of all households.
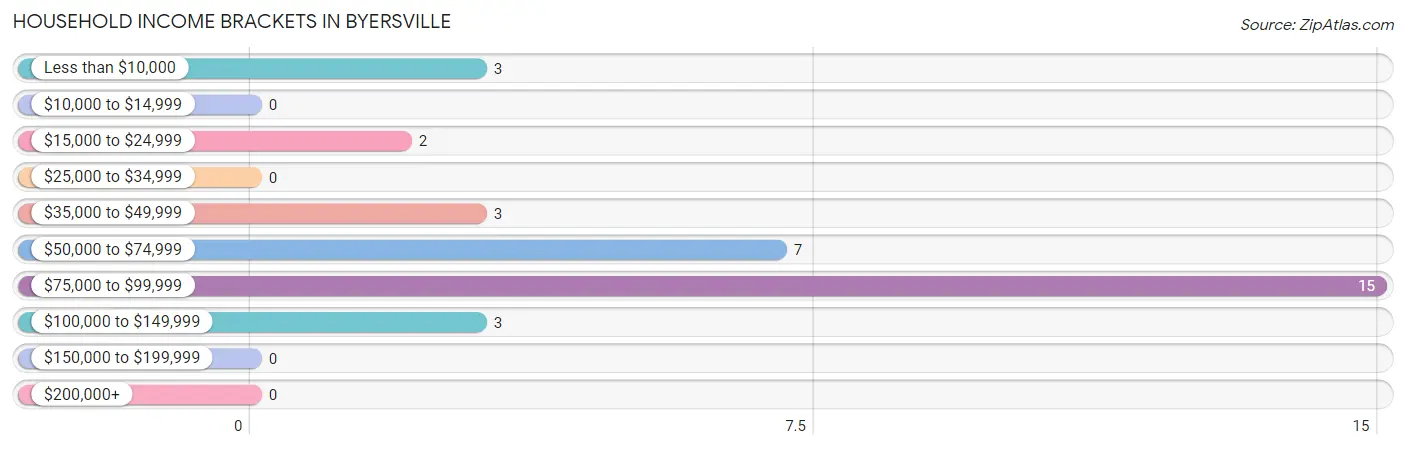
| Income Bracket | # Households | % Households |
| Less than $10,000 | 3 | 9.1% |
| $10,000 to $14,999 | 0 | 0.0% |
| $15,000 to $24,999 | 2 | 6.1% |
| $25,000 to $34,999 | 0 | 0.0% |
| $35,000 to $49,999 | 3 | 9.1% |
| $50,000 to $74,999 | 7 | 21.2% |
| $75,000 to $99,999 | 15 | 45.5% |
| $100,000 to $149,999 | 3 | 9.1% |
| $150,000 to $199,999 | 0 | 0.0% |
| $200,000+ | 0 | 0.0% |
Household Income by Householder Age in Byersville
The median household income in Byersville is $78,125, with the highest median household income of $80,972 found in the 45 to 64 years age bracket for the primary householder. A total of 17 households (51.5%) fall into this category. Meanwhile, the 15 to 24 years age bracket for the primary householder has the lowest median household income of $0, with 7 households (21.2%) in this group.
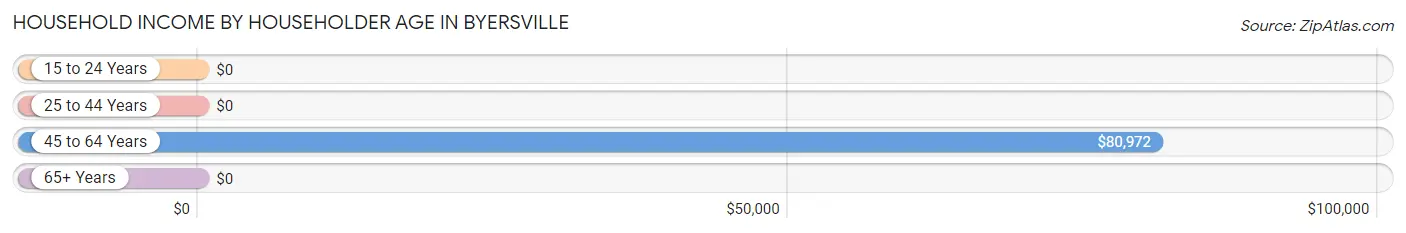
| Income Bracket | # Households | Median Income |
| 15 to 24 Years | 7 (21.2%) | $0 |
| 25 to 44 Years | 6 (18.2%) | $0 |
| 45 to 64 Years | 17 (51.5%) | $80,972 |
| 65+ Years | 3 (9.1%) | $0 |
| Total | 33 (100.0%) | $78,125 |
Poverty in Byersville
Income Below Poverty by Sex and Age in Byersville
With 12.5% poverty level for males and 18.2% for females among the residents of Byersville, 55 to 64 year old males and 18 to 24 year old females are the most vulnerable to poverty, with 3 males (100.0%) and 4 females (100.0%) in their respective age groups living below the poverty level.
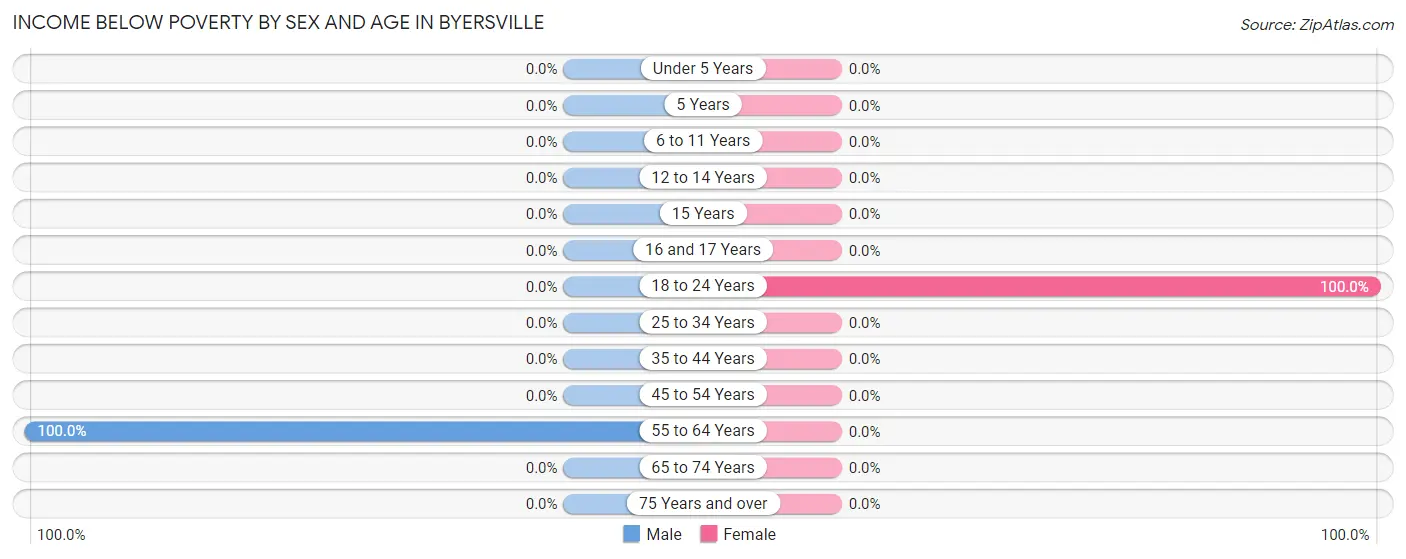
| Age Bracket | Male | Female |
| Under 5 Years | 0 (0.0%) | 0 (0.0%) |
| 5 Years | 0 (0.0%) | 0 (0.0%) |
| 6 to 11 Years | 0 (0.0%) | 0 (0.0%) |
| 12 to 14 Years | 0 (0.0%) | 0 (0.0%) |
| 15 Years | 0 (0.0%) | 0 (0.0%) |
| 16 and 17 Years | 0 (0.0%) | 0 (0.0%) |
| 18 to 24 Years | 0 (0.0%) | 4 (100.0%) |
| 25 to 34 Years | 0 (0.0%) | 0 (0.0%) |
| 35 to 44 Years | 0 (0.0%) | 0 (0.0%) |
| 45 to 54 Years | 0 (0.0%) | 0 (0.0%) |
| 55 to 64 Years | 3 (100.0%) | 0 (0.0%) |
| 65 to 74 Years | 0 (0.0%) | 0 (0.0%) |
| 75 Years and over | 0 (0.0%) | 0 (0.0%) |
| Total | 3 (12.5%) | 4 (18.2%) |
Income Above Poverty by Sex and Age in Byersville
According to the poverty statistics in Byersville, males aged 18 to 24 years and females aged under 5 years are the age groups that are most secure financially, with 100.0% of males and 100.0% of females in these age groups living above the poverty line.
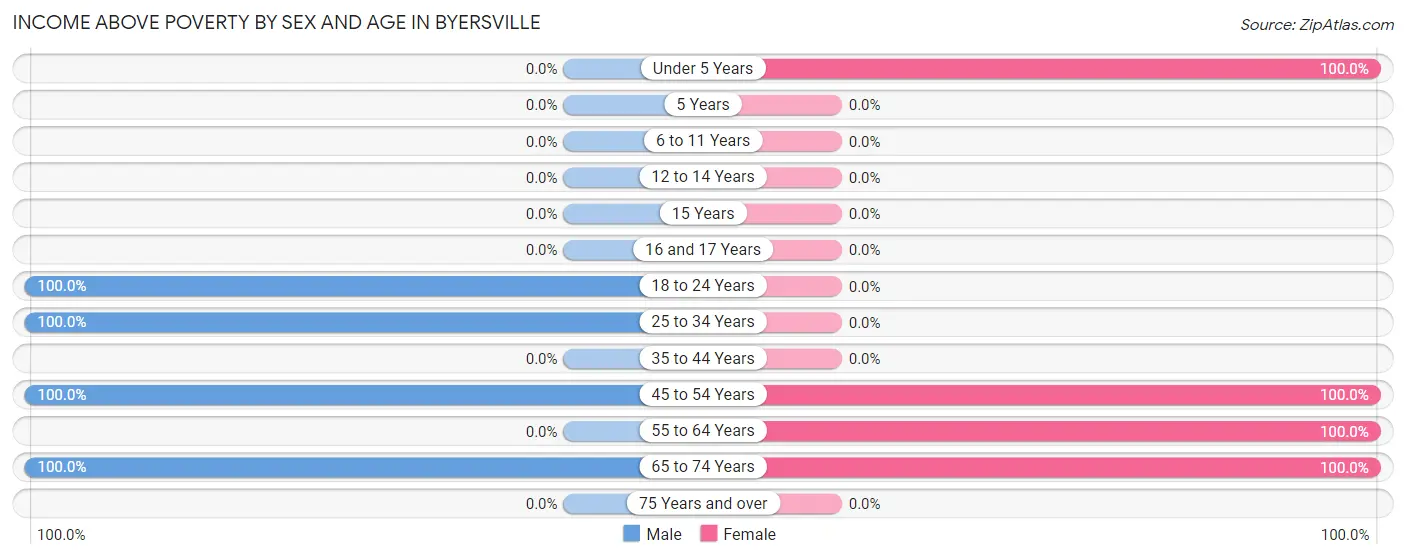
| Age Bracket | Male | Female |
| Under 5 Years | 0 (0.0%) | 3 (100.0%) |
| 5 Years | 0 (0.0%) | 0 (0.0%) |
| 6 to 11 Years | 0 (0.0%) | 0 (0.0%) |
| 12 to 14 Years | 0 (0.0%) | 0 (0.0%) |
| 15 Years | 0 (0.0%) | 0 (0.0%) |
| 16 and 17 Years | 0 (0.0%) | 0 (0.0%) |
| 18 to 24 Years | 7 (100.0%) | 0 (0.0%) |
| 25 to 34 Years | 6 (100.0%) | 0 (0.0%) |
| 35 to 44 Years | 0 (0.0%) | 0 (0.0%) |
| 45 to 54 Years | 2 (100.0%) | 9 (100.0%) |
| 55 to 64 Years | 0 (0.0%) | 3 (100.0%) |
| 65 to 74 Years | 6 (100.0%) | 3 (100.0%) |
| 75 Years and over | 0 (0.0%) | 0 (0.0%) |
| Total | 21 (87.5%) | 18 (81.8%) |
Income Below Poverty Among Married-Couple Families in Byersville
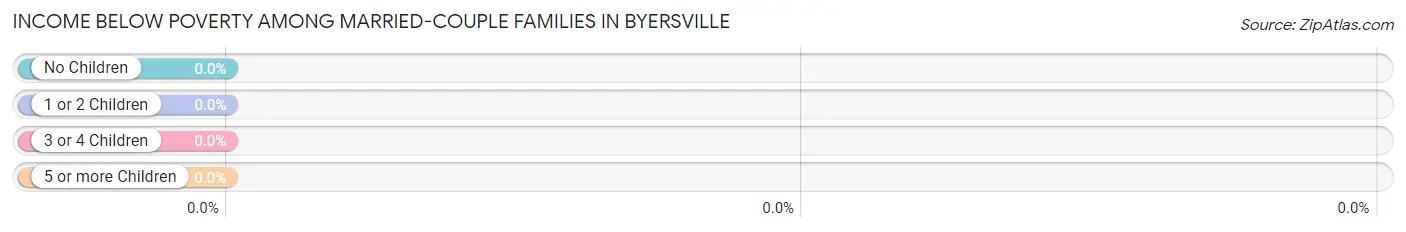
| Children | Above Poverty | Below Poverty |
| No Children | 6 (100.0%) | 0 (0.0%) |
| 1 or 2 Children | 0 (0.0%) | 0 (0.0%) |
| 3 or 4 Children | 0 (0.0%) | 0 (0.0%) |
| 5 or more Children | 0 (0.0%) | 0 (0.0%) |
| Total | 6 (100.0%) | 0 (0.0%) |
Income Below Poverty Among Single-Parent Households in Byersville
| Children | Single Father | Single Mother |
| No Children | 0 (0.0%) | 0 (0.0%) |
| 1 or 2 Children | 0 (0.0%) | 0 (0.0%) |
| 3 or 4 Children | 0 (0.0%) | 0 (0.0%) |
| 5 or more Children | 0 (0.0%) | 0 (0.0%) |
| Total | 0 (0.0%) | 0 (0.0%) |
Income Below Poverty Among Married-Couple vs Single-Parent Households in Byersville
| Children | Married-Couple Families | Single-Parent Households |
| No Children | 0 (0.0%) | 0 (0.0%) |
| 1 or 2 Children | 0 (0.0%) | 0 (0.0%) |
| 3 or 4 Children | 0 (0.0%) | 0 (0.0%) |
| 5 or more Children | 0 (0.0%) | 0 (0.0%) |
| Total | 0 (0.0%) | 0 (0.0%) |
Race in Byersville
The most populous races in Byersville are , and White / Caucasian (46 | 100.0%).
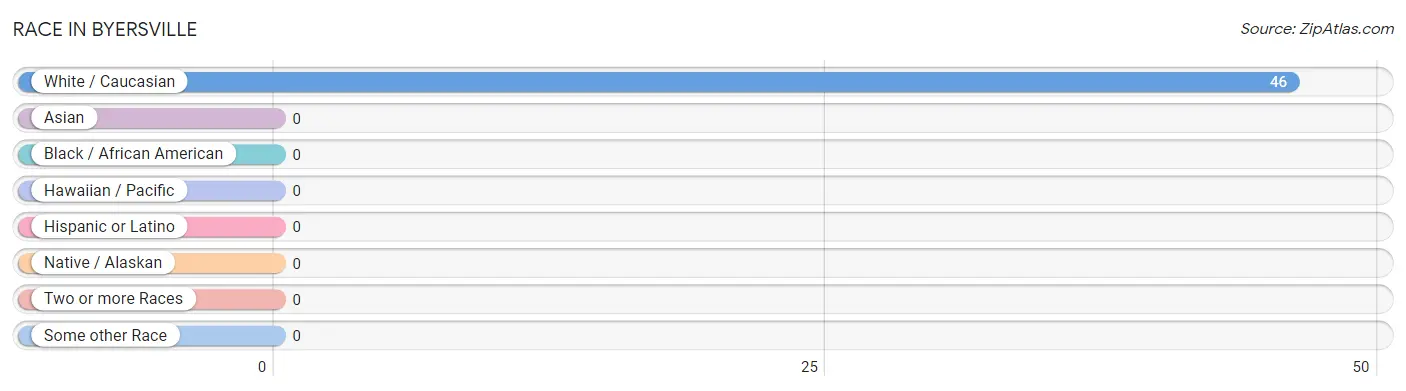
| Race | # Population | % Population |
| Asian | 0 | 0.0% |
| Black / African American | 0 | 0.0% |
| Hawaiian / Pacific | 0 | 0.0% |
| Hispanic or Latino | 0 | 0.0% |
| Native / Alaskan | 0 | 0.0% |
| White / Caucasian | 46 | 100.0% |
| Two or more Races | 0 | 0.0% |
| Some other Race | 0 | 0.0% |
| Total | 46 | 100.0% |
Ancestry in Byersville
The most populous ancestries reported in Byersville are German (15 | 32.6%), American (6 | 13.0%), English (3 | 6.5%), Irish (3 | 6.5%), and Scottish (2 | 4.3%), together accounting for 63.0% of all Byersville residents.
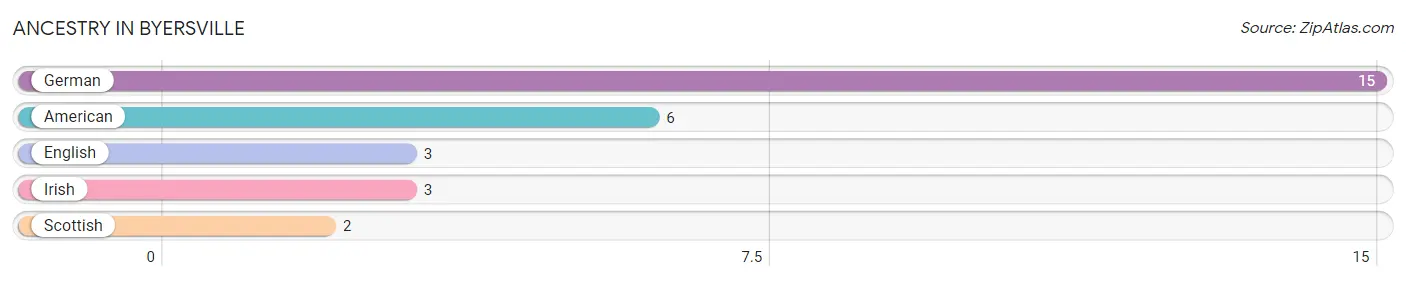
| Ancestry | # Population | % Population |
| American | 6 | 13.0% |
| English | 3 | 6.5% |
| German | 15 | 32.6% |
| Irish | 3 | 6.5% |
| Scottish | 2 | 4.3% | View All 5 Rows |
Immigrants in Byersville

| Immigration Origin | # Population | % Population | View All 0 Rows |
Sex and Age in Byersville
Sex and Age in Byersville
The most populous age groups in Byersville are 20 to 24 Years (7 | 29.2%) for men and 45 to 49 Years (9 | 40.9%) for women.
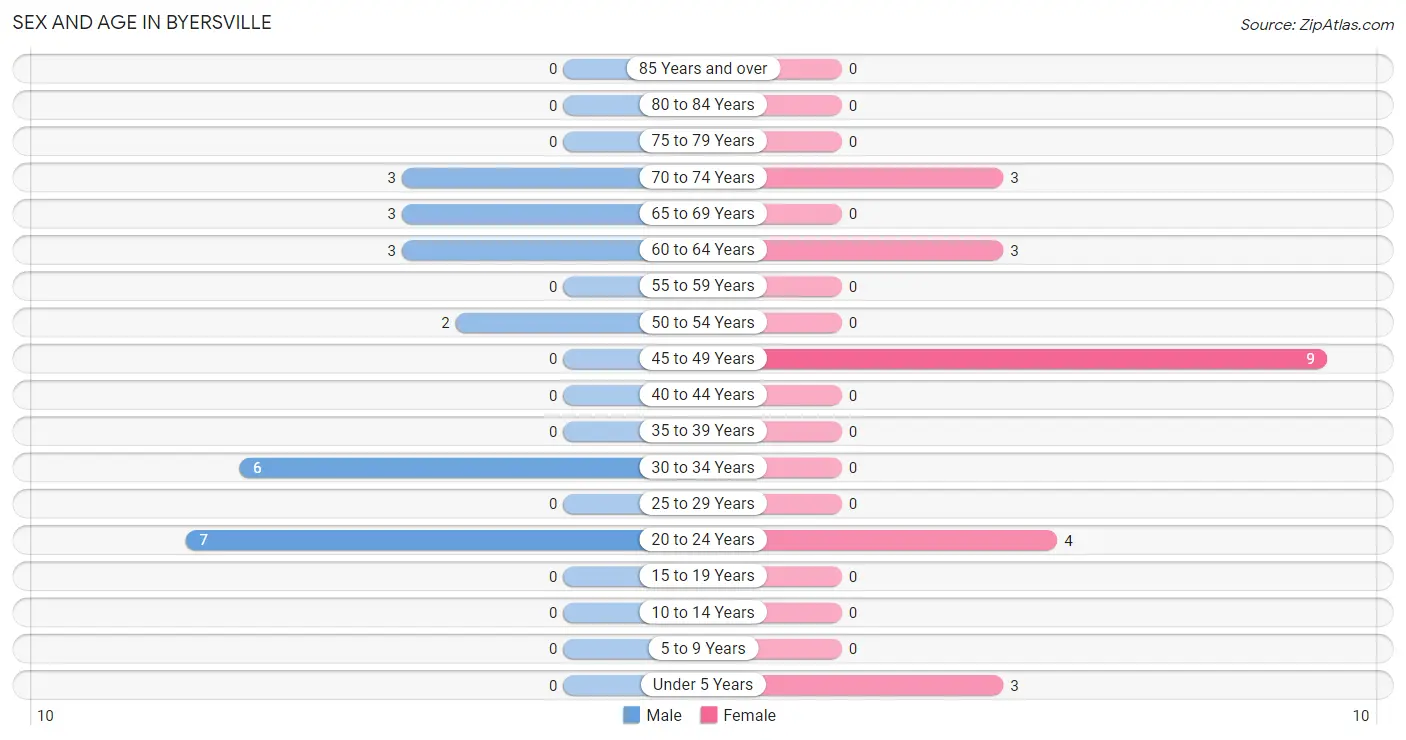
| Age Bracket | Male | Female |
| Under 5 Years | 0 (0.0%) | 3 (13.6%) |
| 5 to 9 Years | 0 (0.0%) | 0 (0.0%) |
| 10 to 14 Years | 0 (0.0%) | 0 (0.0%) |
| 15 to 19 Years | 0 (0.0%) | 0 (0.0%) |
| 20 to 24 Years | 7 (29.2%) | 4 (18.2%) |
| 25 to 29 Years | 0 (0.0%) | 0 (0.0%) |
| 30 to 34 Years | 6 (25.0%) | 0 (0.0%) |
| 35 to 39 Years | 0 (0.0%) | 0 (0.0%) |
| 40 to 44 Years | 0 (0.0%) | 0 (0.0%) |
| 45 to 49 Years | 0 (0.0%) | 9 (40.9%) |
| 50 to 54 Years | 2 (8.3%) | 0 (0.0%) |
| 55 to 59 Years | 0 (0.0%) | 0 (0.0%) |
| 60 to 64 Years | 3 (12.5%) | 3 (13.6%) |
| 65 to 69 Years | 3 (12.5%) | 0 (0.0%) |
| 70 to 74 Years | 3 (12.5%) | 3 (13.6%) |
| 75 to 79 Years | 0 (0.0%) | 0 (0.0%) |
| 80 to 84 Years | 0 (0.0%) | 0 (0.0%) |
| 85 Years and over | 0 (0.0%) | 0 (0.0%) |
| Total | 24 (100.0%) | 22 (100.0%) |
Families and Households in Byersville
Median Family Size in Byersville
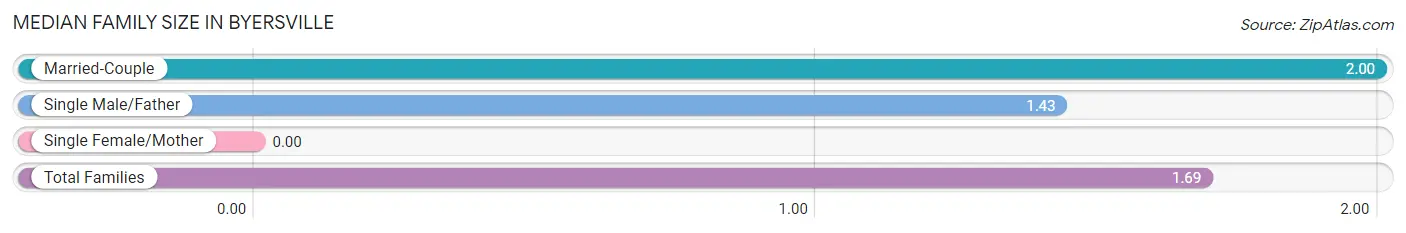
| Family Type | # Families | Family Size |
| Married-Couple | 6 (46.2%) | 2.00 |
| Single Male/Father | 7 (53.8%) | 1.43 |
| Single Female/Mother | 0 (0.0%) | - |
| Total Families | 13 (100.0%) | 1.69 |
Median Household Size in Byersville
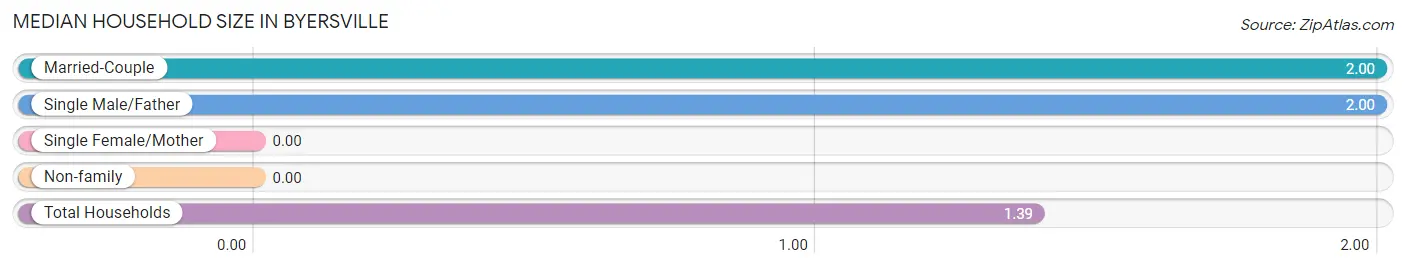
| Household Type | # Households | Household Size |
| Married-Couple | 6 (18.2%) | 2.00 |
| Single Male/Father | 7 (21.2%) | 2.00 |
| Single Female/Mother | 0 (0.0%) | - |
| Non-family | 20 (60.6%) | - |
| Total Households | 33 (100.0%) | 1.39 |
Household Size by Marriage Status in Byersville
Out of a total of 33 households in Byersville, 13 (39.4%) are family households, while 20 (60.6%) are nonfamily households. The most numerous type of family households are 3-person households, comprising 7, and the most common type of nonfamily households are 1-person households, comprising 20.
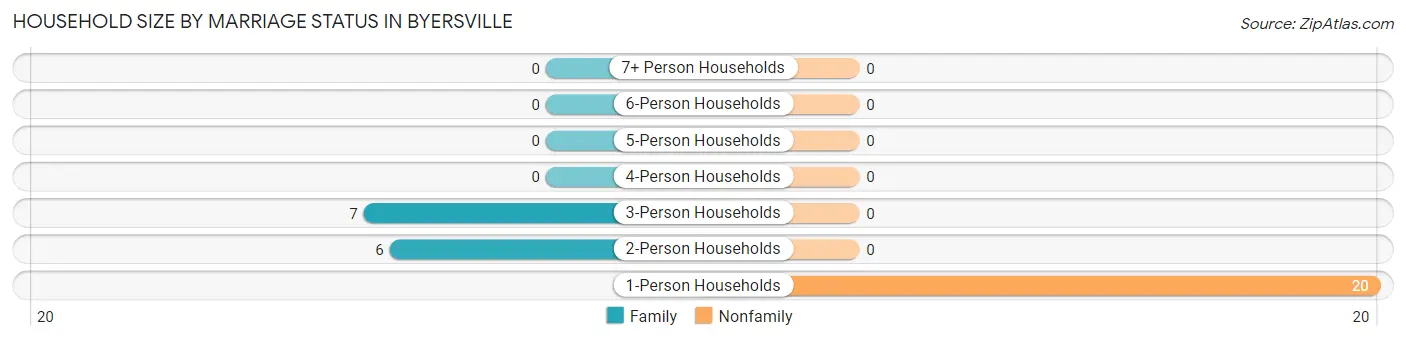
| Household Size | Family Households | Nonfamily Households |
| 1-Person Households | - | 20 (60.6%) |
| 2-Person Households | 6 (18.2%) | 0 (0.0%) |
| 3-Person Households | 7 (21.2%) | 0 (0.0%) |
| 4-Person Households | 0 (0.0%) | 0 (0.0%) |
| 5-Person Households | 0 (0.0%) | 0 (0.0%) |
| 6-Person Households | 0 (0.0%) | 0 (0.0%) |
| 7+ Person Households | 0 (0.0%) | 0 (0.0%) |
| Total | 13 (39.4%) | 20 (60.6%) |
Female Fertility in Byersville
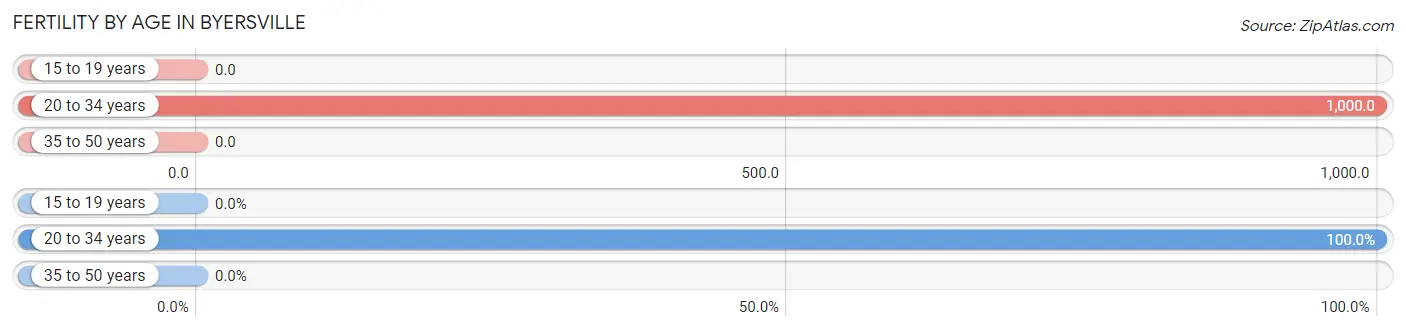
Fertility by Age in Byersville
Average fertility rate in Byersville is 308.0 births per 1,000 women. Women in the age bracket of 20 to 34 years have the highest fertility rate with 1,000.0 births per 1,000 women. Women in the age bracket of 20 to 34 years acount for 100.0% of all women with births.
| Age Bracket | Women with Births | Births / 1,000 Women |
| 15 to 19 years | 0 (0.0%) | 0.0 |
| 20 to 34 years | 4 (100.0%) | 1,000.0 |
| 35 to 50 years | 0 (0.0%) | 0.0 |
| Total | 4 (100.0%) | 308.0 |
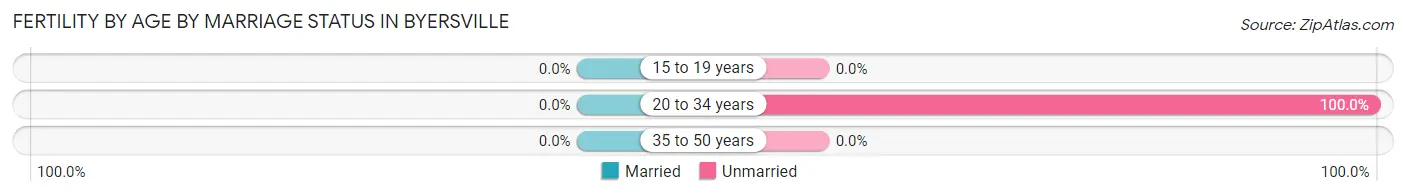
Fertility by Age by Marriage Status in Byersville
| Age Bracket | Married | Unmarried |
| 15 to 19 years | 0 (0.0%) | 0 (0.0%) |
| 20 to 34 years | 0 (0.0%) | 4 (100.0%) |
| 35 to 50 years | 0 (0.0%) | 0 (0.0%) |
| Total | 0 (0.0%) | 4 (100.0%) |
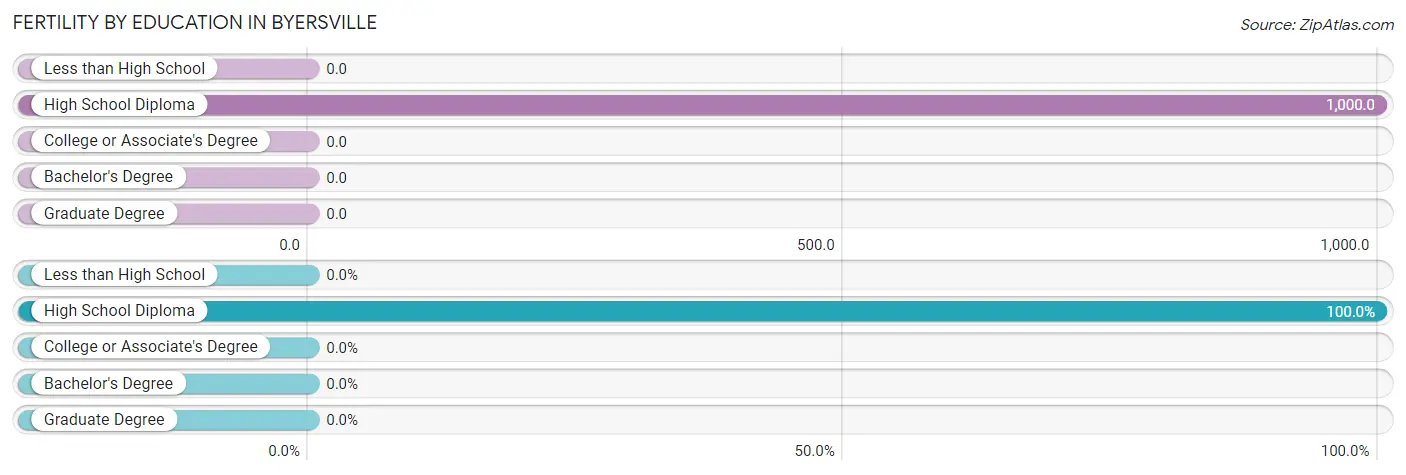
Fertility by Education in Byersville
| Educational Attainment | Women with Births | Births / 1,000 Women |
| Less than High School | 0 (0.0%) | 0.0 |
| High School Diploma | 4 (100.0%) | 1,000.0 |
| College or Associate's Degree | 0 (0.0%) | 0.0 |
| Bachelor's Degree | 0 (0.0%) | 0.0 |
| Graduate Degree | 0 (0.0%) | 0.0 |
| Total | 4 (100.0%) | 308.0 |
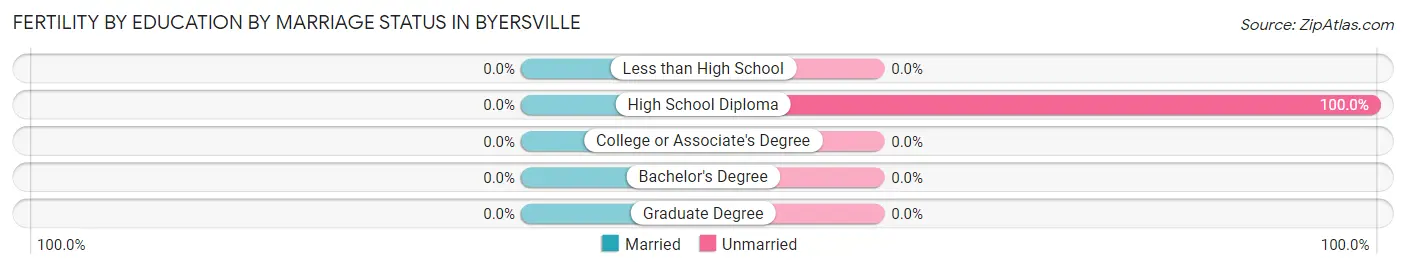
Fertility by Education by Marriage Status in Byersville
| Educational Attainment | Married | Unmarried |
| Less than High School | 0 (0.0%) | 0 (0.0%) |
| High School Diploma | 0 (0.0%) | 4 (100.0%) |
| College or Associate's Degree | 0 (0.0%) | 0 (0.0%) |
| Bachelor's Degree | 0 (0.0%) | 0 (0.0%) |
| Graduate Degree | 0 (0.0%) | 0 (0.0%) |
| Total | 0 (0.0%) | 4 (100.0%) |
Employment Characteristics in Byersville
Employment by Class of Employer in Byersville
Among the 33 employed individuals in Byersville, private company employees (19 | 57.6%), state government employees (9 | 27.3%), and not-for-profit organizations (3 | 9.1%) make up the most common classes of employment.
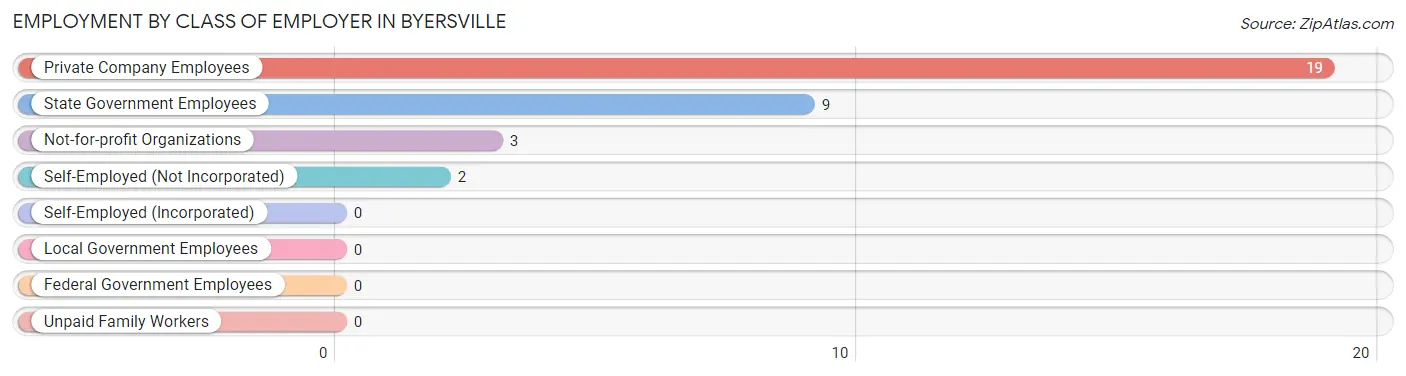
| Employer Class | # Employees | % Employees |
| Private Company Employees | 19 | 57.6% |
| Self-Employed (Incorporated) | 0 | 0.0% |
| Self-Employed (Not Incorporated) | 2 | 6.1% |
| Not-for-profit Organizations | 3 | 9.1% |
| Local Government Employees | 0 | 0.0% |
| State Government Employees | 9 | 27.3% |
| Federal Government Employees | 0 | 0.0% |
| Unpaid Family Workers | 0 | 0.0% |
| Total | 33 | 100.0% |
Employment Status by Age in Byersville
According to the labor force statistics for Byersville, out of the total population over 16 years of age (43), 86.0% or 37 individuals are in the labor force, with 10.8% or 4 of them unemployed. The age group with the highest labor force participation rate is 20 to 24 years, with 100.0% or 11 individuals in the labor force. Within the labor force, the 20 to 24 years age range has the highest percentage of unemployed individuals, with 36.4% or 4 of them being unemployed.
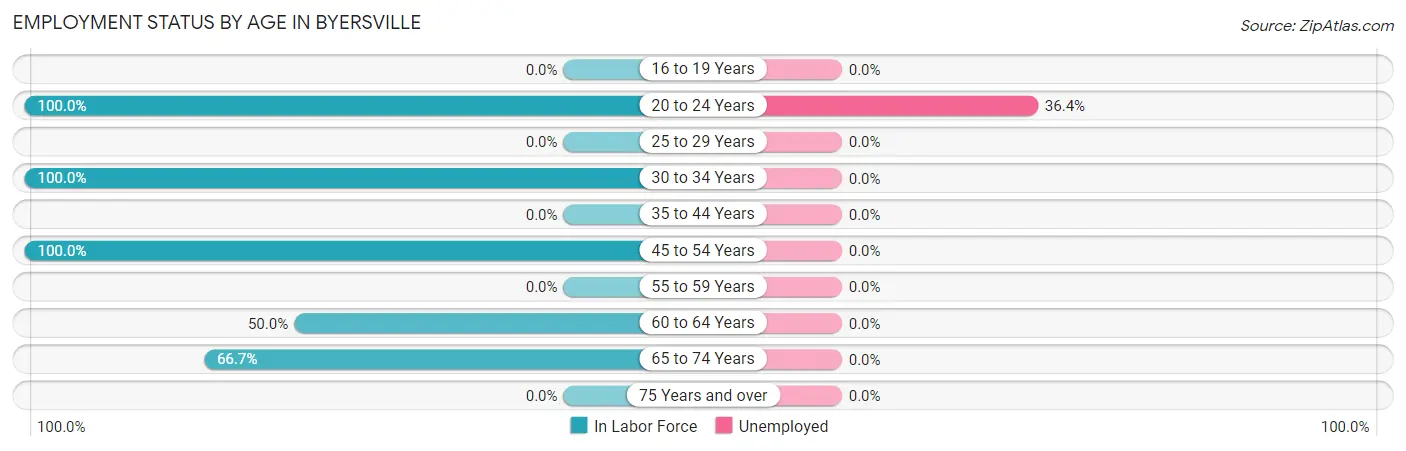
| Age Bracket | In Labor Force | Unemployed |
| 16 to 19 Years | 0 (0.0%) | 0 (0.0%) |
| 20 to 24 Years | 11 (100.0%) | 4 (36.4%) |
| 25 to 29 Years | 0 (0.0%) | 0 (0.0%) |
| 30 to 34 Years | 6 (100.0%) | 0 (0.0%) |
| 35 to 44 Years | 0 (0.0%) | 0 (0.0%) |
| 45 to 54 Years | 11 (100.0%) | 0 (0.0%) |
| 55 to 59 Years | 0 (0.0%) | 0 (0.0%) |
| 60 to 64 Years | 3 (50.0%) | 0 (0.0%) |
| 65 to 74 Years | 6 (66.7%) | 0 (0.0%) |
| 75 Years and over | 0 (0.0%) | 0 (0.0%) |
| Total | 37 (86.0%) | 4 (10.8%) |
Employment Status by Educational Attainment in Byersville
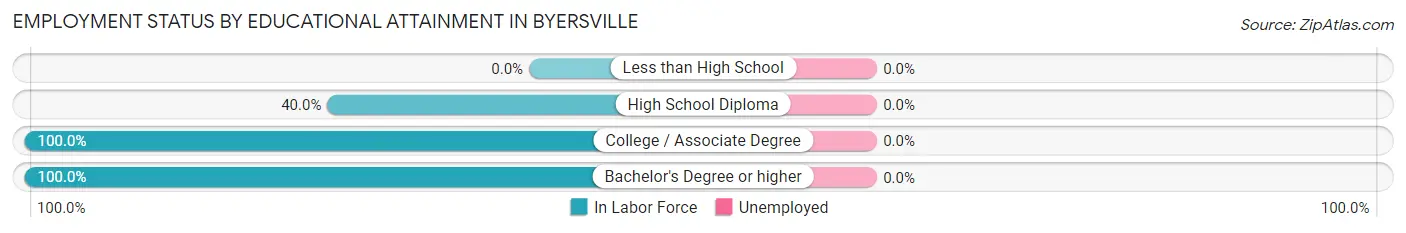
| Educational Attainment | In Labor Force | Unemployed |
| Less than High School | 0 (0.0%) | 0 (0.0%) |
| High School Diploma | 2 (40.0%) | 0 (0.0%) |
| College / Associate Degree | 9 (100.0%) | 0 (0.0%) |
| Bachelor's Degree or higher | 9 (100.0%) | 0 (0.0%) |
| Total | 20 (87.0%) | 0 (0.0%) |
Employment Occupations by Sex in Byersville
Management, Business, Science and Arts Occupations
The most common Management, Business, Science and Arts occupations in Byersville are Business & Financial (9 | 27.3%), Management (7 | 21.2%), Community & Social Service (3 | 9.1%), Arts, Media & Entertainment (3 | 9.1%), and Health Diagnosing & Treating (3 | 9.1%).
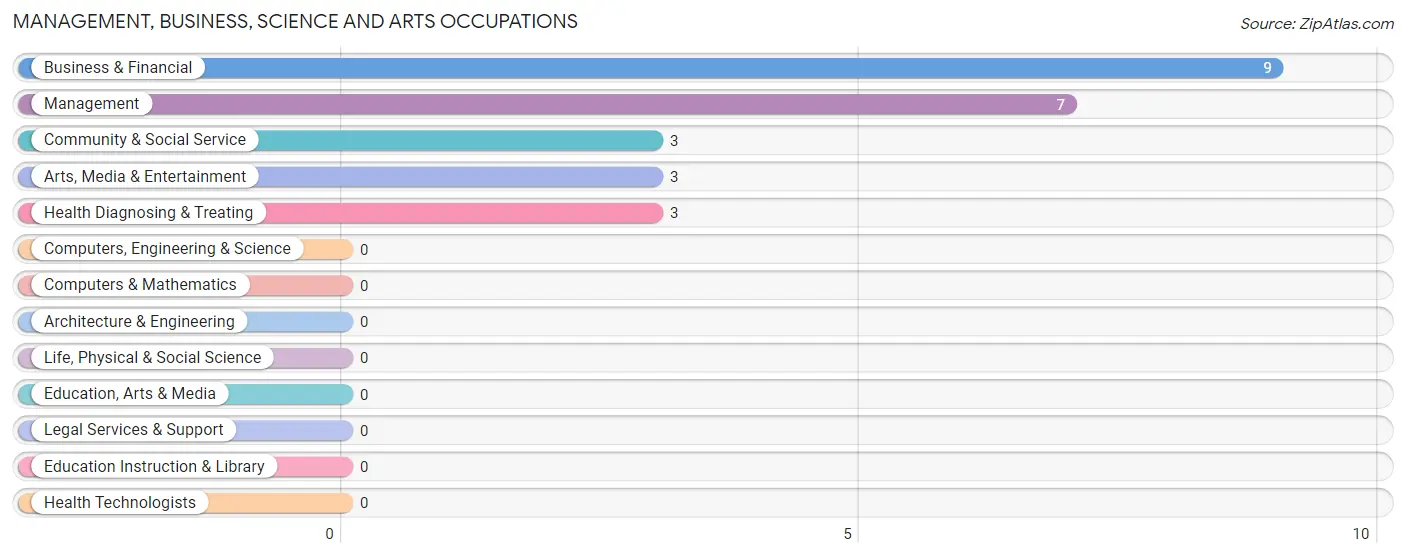
Management, Business, Science and Arts Occupations by Sex
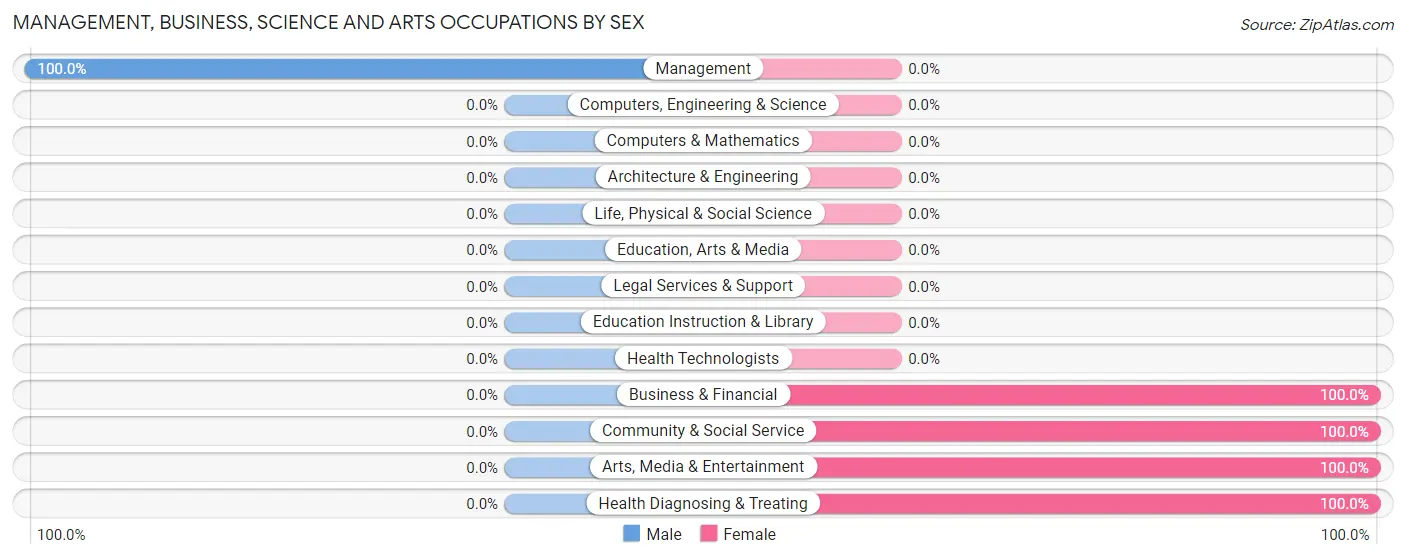
| Occupation | Male | Female |
| Management | 7 (100.0%) | 0 (0.0%) |
| Business & Financial | 0 (0.0%) | 9 (100.0%) |
| Computers, Engineering & Science | 0 (0.0%) | 0 (0.0%) |
| Computers & Mathematics | 0 (0.0%) | 0 (0.0%) |
| Architecture & Engineering | 0 (0.0%) | 0 (0.0%) |
| Life, Physical & Social Science | 0 (0.0%) | 0 (0.0%) |
| Community & Social Service | 0 (0.0%) | 3 (100.0%) |
| Education, Arts & Media | 0 (0.0%) | 0 (0.0%) |
| Legal Services & Support | 0 (0.0%) | 0 (0.0%) |
| Education Instruction & Library | 0 (0.0%) | 0 (0.0%) |
| Arts, Media & Entertainment | 0 (0.0%) | 3 (100.0%) |
| Health Diagnosing & Treating | 0 (0.0%) | 3 (100.0%) |
| Health Technologists | 0 (0.0%) | 0 (0.0%) |
| Total (Category) | 7 (31.8%) | 15 (68.2%) |
| Total (Overall) | 18 (54.5%) | 15 (45.5%) |
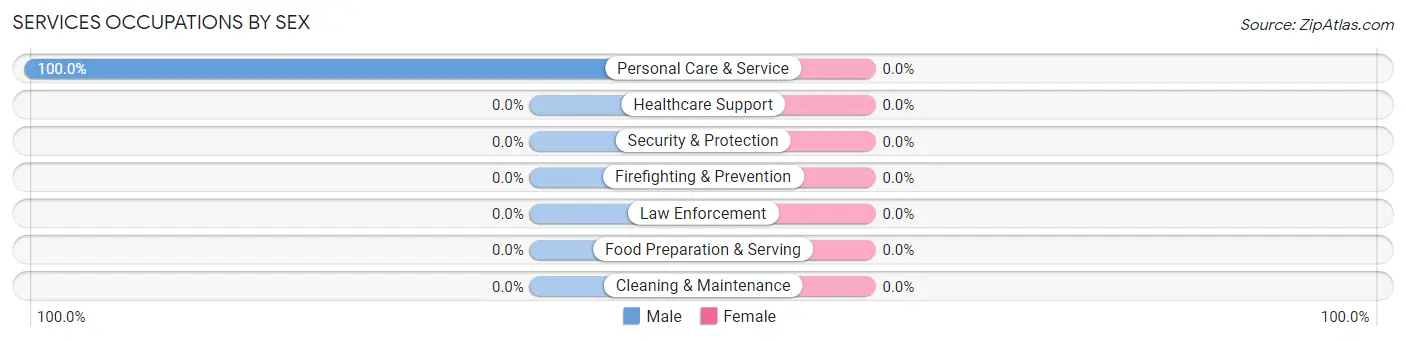
Services Occupations
The most common Services occupations in Byersville are , and Personal Care & Service (2 | 6.1%).
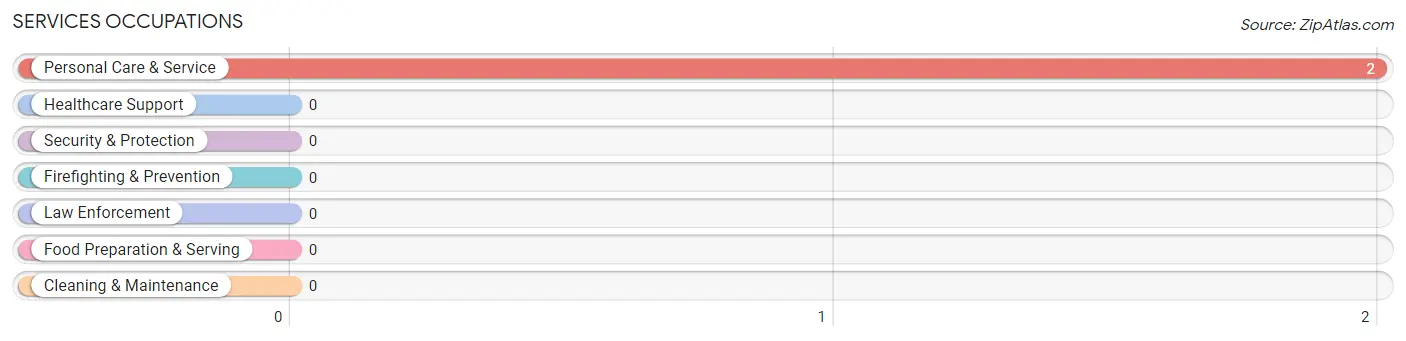
Services Occupations by Sex
| Occupation | Male | Female |
| Healthcare Support | 0 (0.0%) | 0 (0.0%) |
| Security & Protection | 0 (0.0%) | 0 (0.0%) |
| Firefighting & Prevention | 0 (0.0%) | 0 (0.0%) |
| Law Enforcement | 0 (0.0%) | 0 (0.0%) |
| Food Preparation & Serving | 0 (0.0%) | 0 (0.0%) |
| Cleaning & Maintenance | 0 (0.0%) | 0 (0.0%) |
| Personal Care & Service | 2 (100.0%) | 0 (0.0%) |
| Total (Category) | 2 (100.0%) | 0 (0.0%) |
| Total (Overall) | 18 (54.5%) | 15 (45.5%) |
Sales and Office Occupations
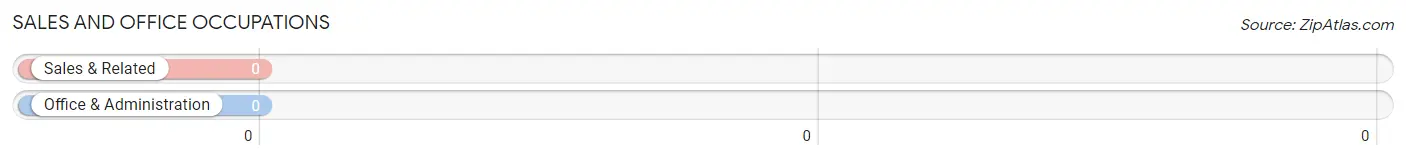
Sales and Office Occupations by Sex
| Occupation | Male | Female |
| Sales & Related | 0 (0.0%) | 0 (0.0%) |
| Office & Administration | 0 (0.0%) | 0 (0.0%) |
| Total (Category) | 0 (0.0%) | 0 (0.0%) |
| Total (Overall) | 18 (54.5%) | 15 (45.5%) |
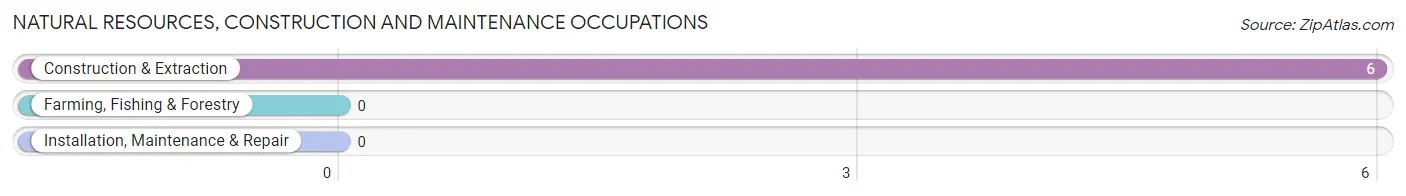
Natural Resources, Construction and Maintenance Occupations
The most common Natural Resources, Construction and Maintenance occupations in Byersville are , and Construction & Extraction (6 | 18.2%).
Natural Resources, Construction and Maintenance Occupations by Sex
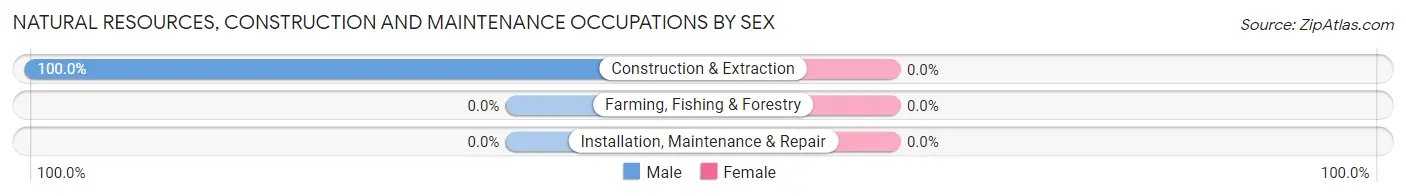
| Occupation | Male | Female |
| Farming, Fishing & Forestry | 0 (0.0%) | 0 (0.0%) |
| Construction & Extraction | 6 (100.0%) | 0 (0.0%) |
| Installation, Maintenance & Repair | 0 (0.0%) | 0 (0.0%) |
| Total (Category) | 6 (100.0%) | 0 (0.0%) |
| Total (Overall) | 18 (54.5%) | 15 (45.5%) |
Production, Transportation and Moving Occupations
The most common Production, Transportation and Moving occupations in Byersville are , and Transportation (3 | 9.1%).
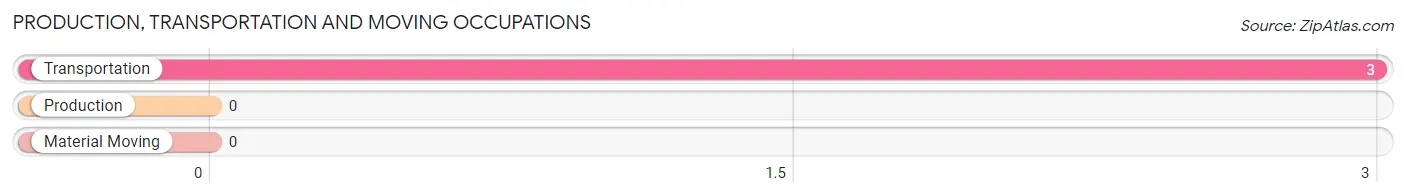
Production, Transportation and Moving Occupations by Sex
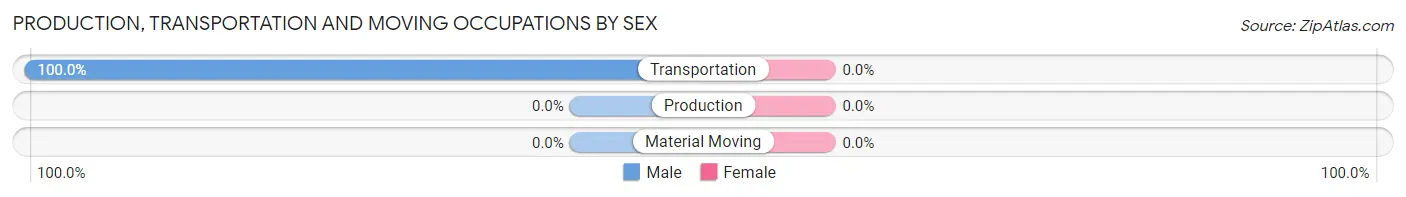
| Occupation | Male | Female |
| Production | 0 (0.0%) | 0 (0.0%) |
| Transportation | 3 (100.0%) | 0 (0.0%) |
| Material Moving | 0 (0.0%) | 0 (0.0%) |
| Total (Category) | 3 (100.0%) | 0 (0.0%) |
| Total (Overall) | 18 (54.5%) | 15 (45.5%) |
Employment Industries by Sex in Byersville
Employment Industries in Byersville
The major employment industries in Byersville include Public Administration (9 | 27.3%), Accommodation & Food Services (7 | 21.2%), Construction (6 | 18.2%), Wholesale Trade (3 | 9.1%), and Professional & Scientific (3 | 9.1%).
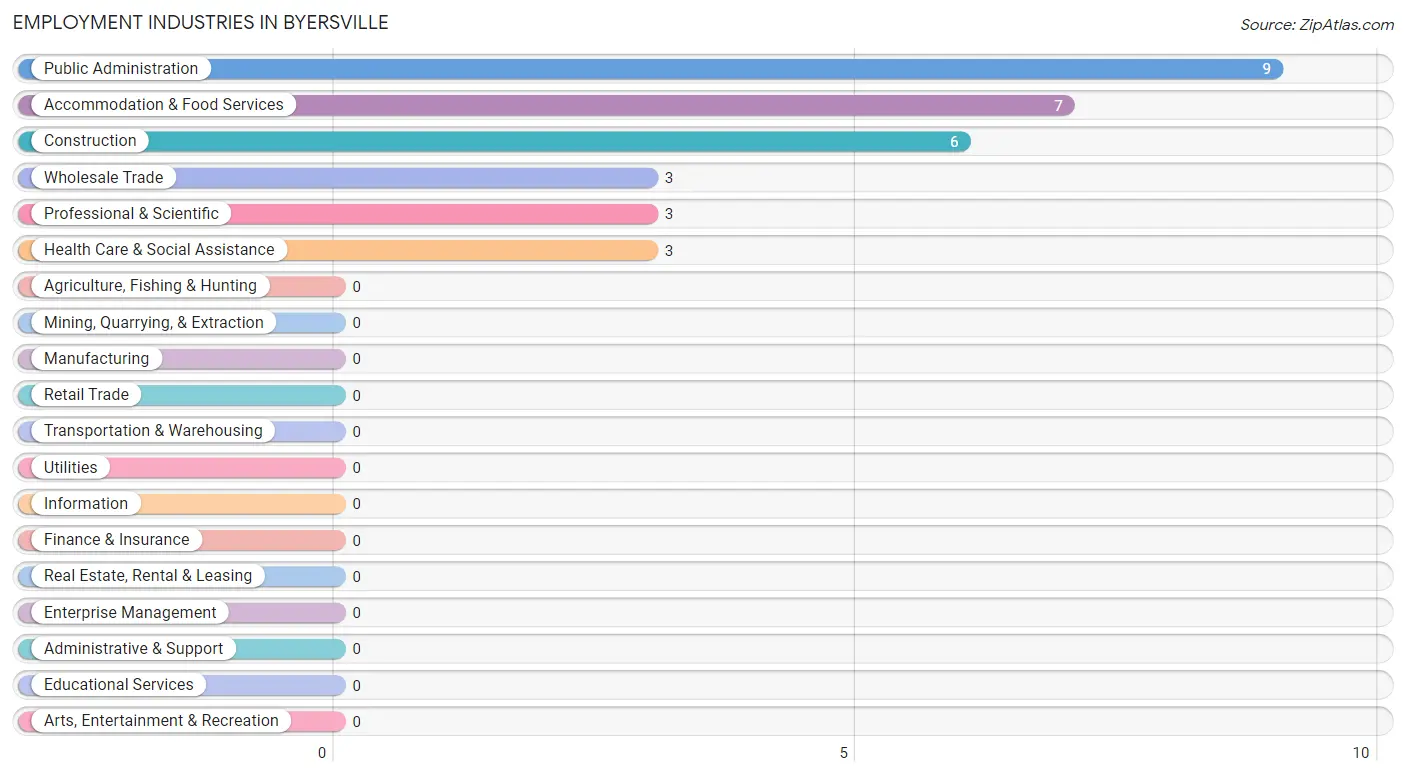
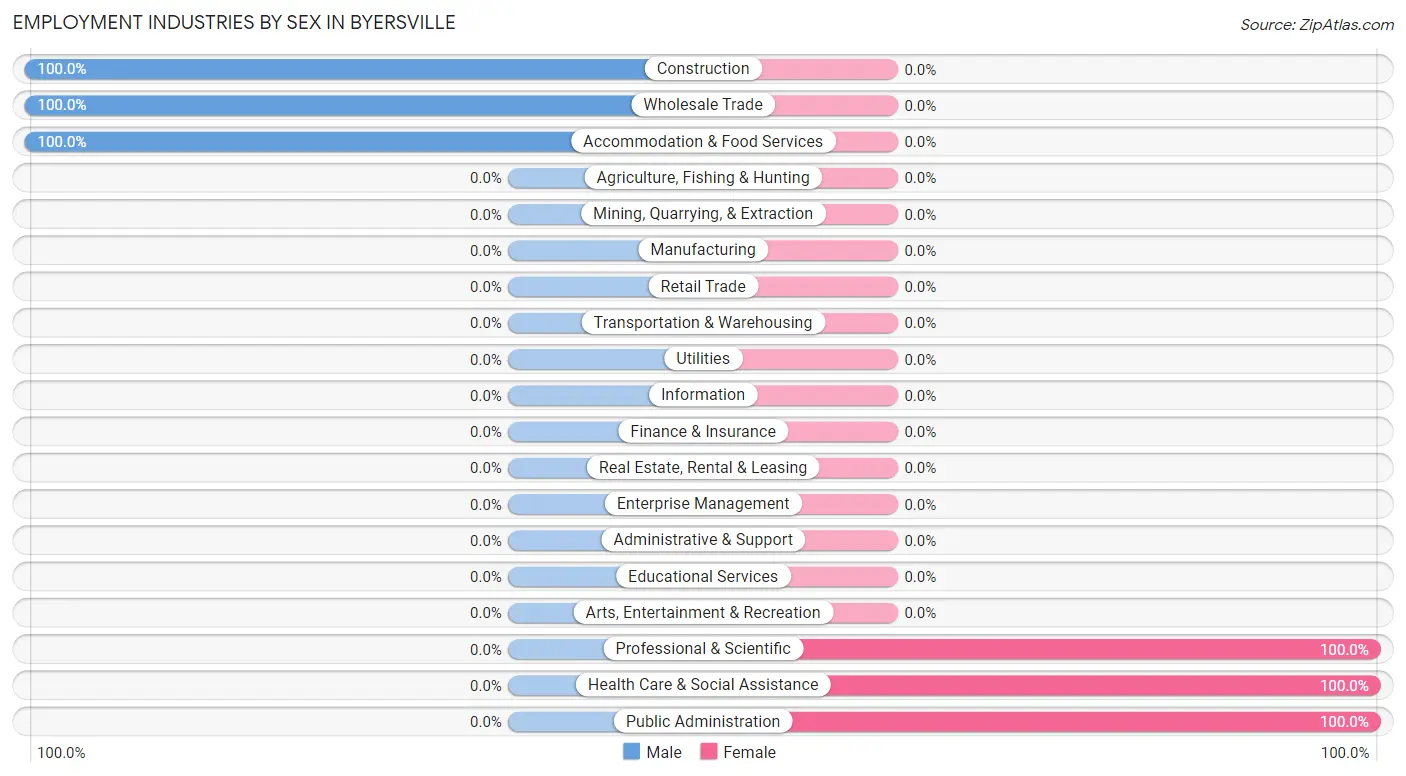
Employment Industries by Sex in Byersville
The Byersville industries that see more men than women are Construction (100.0%), Wholesale Trade (100.0%), and Accommodation & Food Services (100.0%), whereas the industries that tend to have a higher number of women are Professional & Scientific (100.0%), Health Care & Social Assistance (100.0%), and Public Administration (100.0%).
| Industry | Male | Female |
| Agriculture, Fishing & Hunting | 0 (0.0%) | 0 (0.0%) |
| Mining, Quarrying, & Extraction | 0 (0.0%) | 0 (0.0%) |
| Construction | 6 (100.0%) | 0 (0.0%) |
| Manufacturing | 0 (0.0%) | 0 (0.0%) |
| Wholesale Trade | 3 (100.0%) | 0 (0.0%) |
| Retail Trade | 0 (0.0%) | 0 (0.0%) |
| Transportation & Warehousing | 0 (0.0%) | 0 (0.0%) |
| Utilities | 0 (0.0%) | 0 (0.0%) |
| Information | 0 (0.0%) | 0 (0.0%) |
| Finance & Insurance | 0 (0.0%) | 0 (0.0%) |
| Real Estate, Rental & Leasing | 0 (0.0%) | 0 (0.0%) |
| Professional & Scientific | 0 (0.0%) | 3 (100.0%) |
| Enterprise Management | 0 (0.0%) | 0 (0.0%) |
| Administrative & Support | 0 (0.0%) | 0 (0.0%) |
| Educational Services | 0 (0.0%) | 0 (0.0%) |
| Health Care & Social Assistance | 0 (0.0%) | 3 (100.0%) |
| Arts, Entertainment & Recreation | 0 (0.0%) | 0 (0.0%) |
| Accommodation & Food Services | 7 (100.0%) | 0 (0.0%) |
| Public Administration | 0 (0.0%) | 9 (100.0%) |
| Total | 18 (54.5%) | 15 (45.5%) |
Education in Byersville
School Enrollment in Byersville
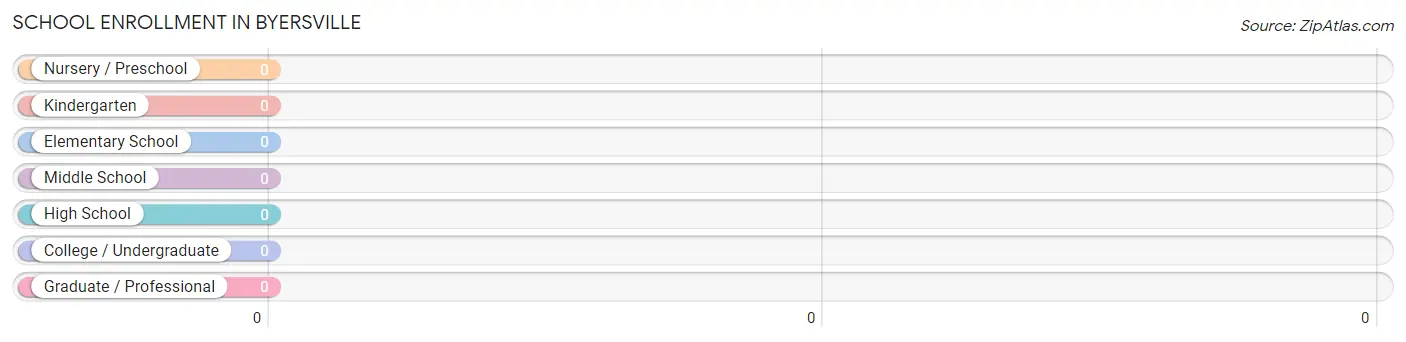
| School Level | # Students | % Students |
| Nursery / Preschool | 0 | 0.0% |
| Kindergarten | 0 | 0.0% |
| Elementary School | 0 | 0.0% |
| Middle School | 0 | 0.0% |
| High School | 0 | 0.0% |
| College / Undergraduate | 0 | 0.0% |
| Graduate / Professional | 0 | 0.0% |
| Total | 0 | 0.0% |
School Enrollment by Age by Funding Source in Byersville
| Age Bracket | Public School | Private School |
| 3 to 4 Year Olds | 0 (0.0%) | 0 (0.0%) |
| 5 to 9 Year Old | 0 (0.0%) | 0 (0.0%) |
| 10 to 14 Year Olds | 0 (0.0%) | 0 (0.0%) |
| 15 to 17 Year Olds | 0 (0.0%) | 0 (0.0%) |
| 18 to 19 Year Olds | 0 (0.0%) | 0 (0.0%) |
| 20 to 24 Year Olds | 0 (0.0%) | 0 (0.0%) |
| 25 to 34 Year Olds | 0 (0.0%) | 0 (0.0%) |
| 35 Years and over | 0 (0.0%) | 0 (0.0%) |
| Total | 0 (0.0%) | 0 (0.0%) |
Educational Attainment by Field of Study in Byersville
, and arts & humanities (9 | 100.0%) are the most common fields of study among 9 individuals in Byersville who have obtained a bachelor's degree or higher.
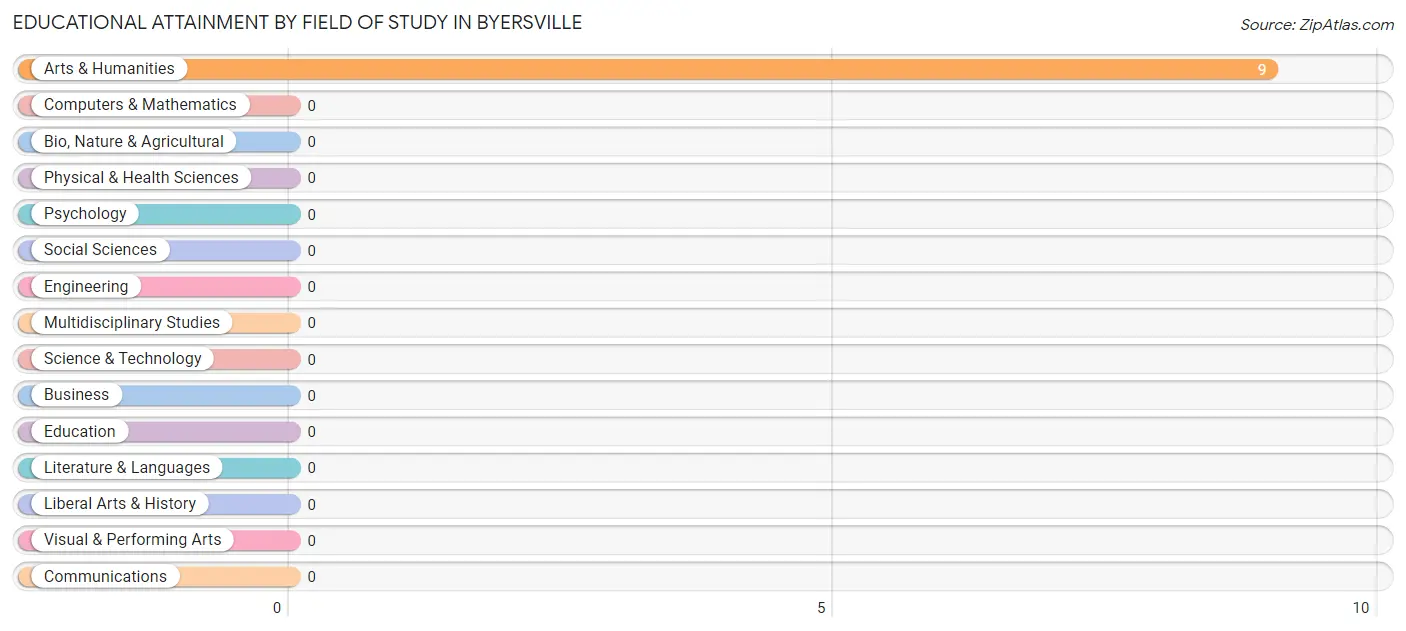
| Field of Study | # Graduates | % Graduates |
| Computers & Mathematics | 0 | 0.0% |
| Bio, Nature & Agricultural | 0 | 0.0% |
| Physical & Health Sciences | 0 | 0.0% |
| Psychology | 0 | 0.0% |
| Social Sciences | 0 | 0.0% |
| Engineering | 0 | 0.0% |
| Multidisciplinary Studies | 0 | 0.0% |
| Science & Technology | 0 | 0.0% |
| Business | 0 | 0.0% |
| Education | 0 | 0.0% |
| Literature & Languages | 0 | 0.0% |
| Liberal Arts & History | 0 | 0.0% |
| Visual & Performing Arts | 0 | 0.0% |
| Communications | 0 | 0.0% |
| Arts & Humanities | 9 | 100.0% |
| Total | 9 | 100.0% |
Transportation & Commute in Byersville
Vehicle Availability by Sex in Byersville
The most prevalent vehicle ownership categories in Byersville are males with 3 vehicles (7, accounting for 38.9%) and females with 3 vehicles (0, making up 46.7%).
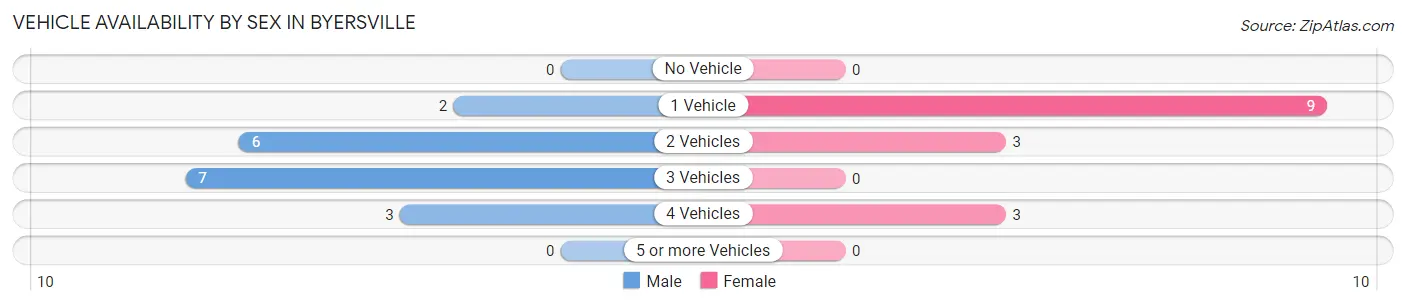
| Vehicles Available | Male | Female |
| No Vehicle | 0 (0.0%) | 0 (0.0%) |
| 1 Vehicle | 2 (11.1%) | 9 (60.0%) |
| 2 Vehicles | 6 (33.3%) | 3 (20.0%) |
| 3 Vehicles | 7 (38.9%) | 0 (0.0%) |
| 4 Vehicles | 3 (16.7%) | 3 (20.0%) |
| 5 or more Vehicles | 0 (0.0%) | 0 (0.0%) |
| Total | 18 (100.0%) | 15 (100.0%) |
Commute Time in Byersville
The most frequently occuring commute durations in Byersville are 60 to 89 minutes (15 commuters, 57.7%), 15 to 19 minutes (6 commuters, 23.1%), and 45 to 59 minutes (3 commuters, 11.5%).
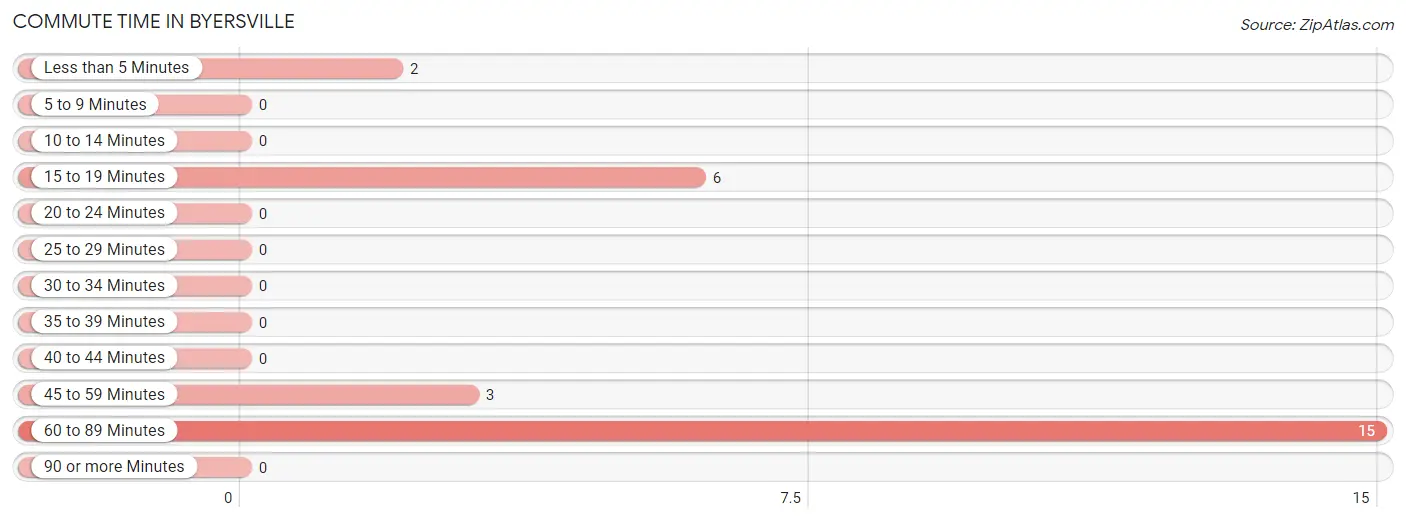
| Commute Time | # Commuters | % Commuters |
| Less than 5 Minutes | 2 | 7.7% |
| 5 to 9 Minutes | 0 | 0.0% |
| 10 to 14 Minutes | 0 | 0.0% |
| 15 to 19 Minutes | 6 | 23.1% |
| 20 to 24 Minutes | 0 | 0.0% |
| 25 to 29 Minutes | 0 | 0.0% |
| 30 to 34 Minutes | 0 | 0.0% |
| 35 to 39 Minutes | 0 | 0.0% |
| 40 to 44 Minutes | 0 | 0.0% |
| 45 to 59 Minutes | 3 | 11.5% |
| 60 to 89 Minutes | 15 | 57.7% |
| 90 or more Minutes | 0 | 0.0% |
Commute Time by Sex in Byersville
The most common commute times in Byersville are 60 to 89 minutes (6 commuters, 54.5%) for males and 60 to 89 minutes (9 commuters, 60.0%) for females.
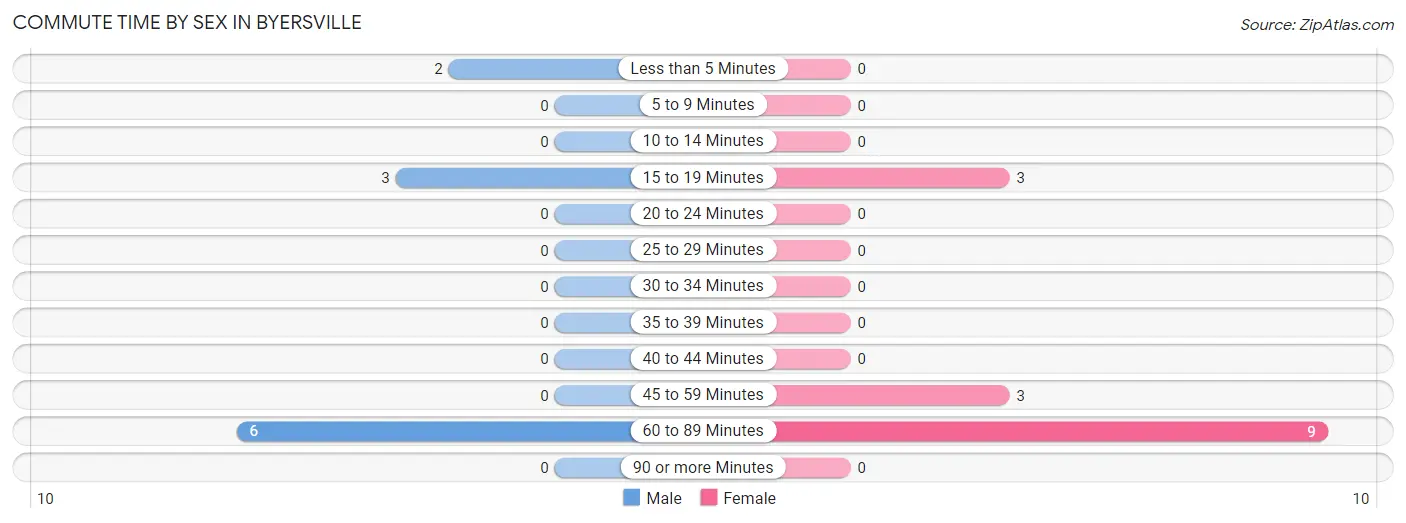
| Commute Time | Male | Female |
| Less than 5 Minutes | 2 (18.2%) | 0 (0.0%) |
| 5 to 9 Minutes | 0 (0.0%) | 0 (0.0%) |
| 10 to 14 Minutes | 0 (0.0%) | 0 (0.0%) |
| 15 to 19 Minutes | 3 (27.3%) | 3 (20.0%) |
| 20 to 24 Minutes | 0 (0.0%) | 0 (0.0%) |
| 25 to 29 Minutes | 0 (0.0%) | 0 (0.0%) |
| 30 to 34 Minutes | 0 (0.0%) | 0 (0.0%) |
| 35 to 39 Minutes | 0 (0.0%) | 0 (0.0%) |
| 40 to 44 Minutes | 0 (0.0%) | 0 (0.0%) |
| 45 to 59 Minutes | 0 (0.0%) | 3 (20.0%) |
| 60 to 89 Minutes | 6 (54.5%) | 9 (60.0%) |
| 90 or more Minutes | 0 (0.0%) | 0 (0.0%) |
Time of Departure to Work by Sex in Byersville
The most frequent times of departure to work in Byersville are 5:00 AM to 5:29 AM (6, 54.5%) for males and 7:30 AM to 7:59 AM (9, 60.0%) for females.
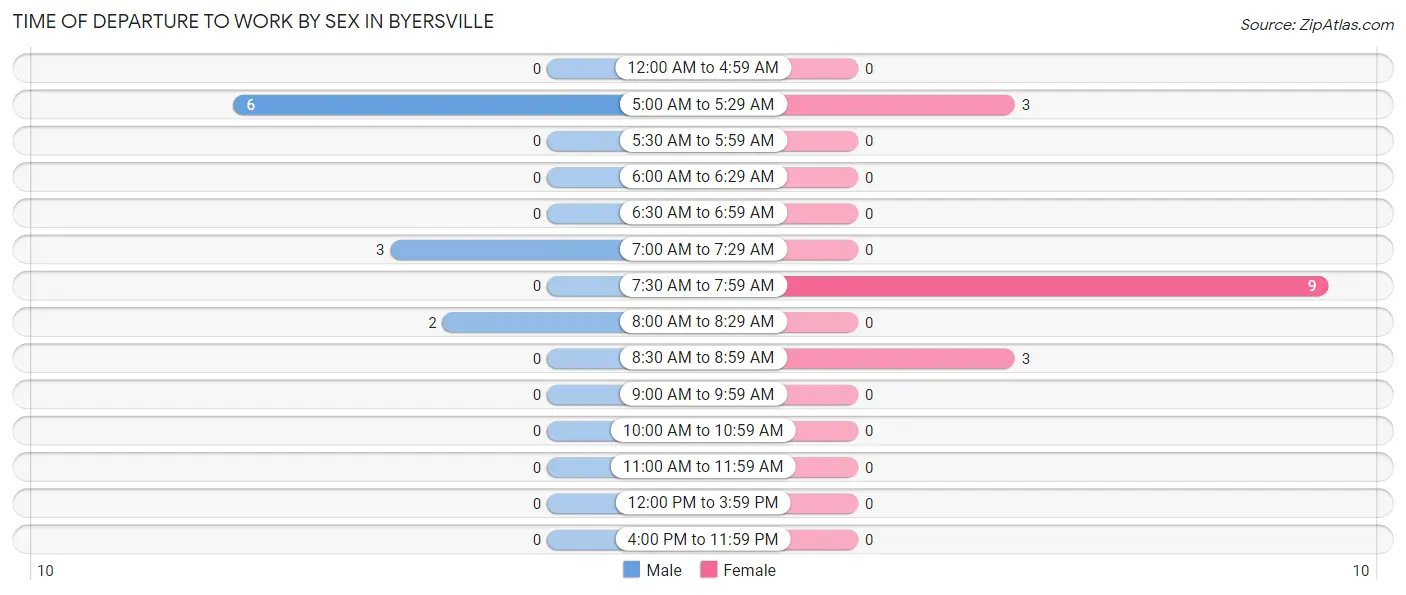
| Time of Departure | Male | Female |
| 12:00 AM to 4:59 AM | 0 (0.0%) | 0 (0.0%) |
| 5:00 AM to 5:29 AM | 6 (54.5%) | 3 (20.0%) |
| 5:30 AM to 5:59 AM | 0 (0.0%) | 0 (0.0%) |
| 6:00 AM to 6:29 AM | 0 (0.0%) | 0 (0.0%) |
| 6:30 AM to 6:59 AM | 0 (0.0%) | 0 (0.0%) |
| 7:00 AM to 7:29 AM | 3 (27.3%) | 0 (0.0%) |
| 7:30 AM to 7:59 AM | 0 (0.0%) | 9 (60.0%) |
| 8:00 AM to 8:29 AM | 2 (18.2%) | 0 (0.0%) |
| 8:30 AM to 8:59 AM | 0 (0.0%) | 3 (20.0%) |
| 9:00 AM to 9:59 AM | 0 (0.0%) | 0 (0.0%) |
| 10:00 AM to 10:59 AM | 0 (0.0%) | 0 (0.0%) |
| 11:00 AM to 11:59 AM | 0 (0.0%) | 0 (0.0%) |
| 12:00 PM to 3:59 PM | 0 (0.0%) | 0 (0.0%) |
| 4:00 PM to 11:59 PM | 0 (0.0%) | 0 (0.0%) |
| Total | 11 (100.0%) | 15 (100.0%) |
Housing Occupancy in Byersville
Occupancy by Ownership in Byersville
Of the total 33 dwellings in Byersville, owner-occupied units account for 33 (100.0%), while renter-occupied units make up 0 (0.0%).
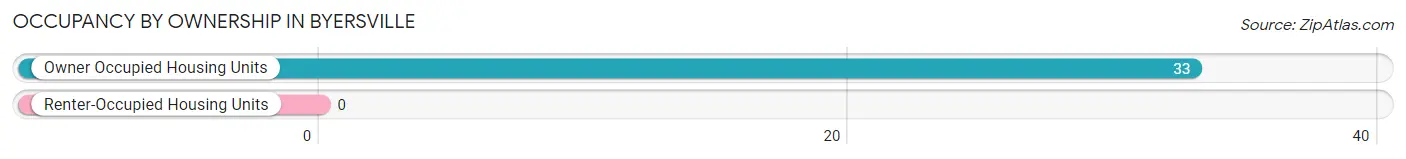
| Occupancy | # Housing Units | % Housing Units |
| Owner Occupied Housing Units | 33 | 100.0% |
| Renter-Occupied Housing Units | 0 | 0.0% |
| Total Occupied Housing Units | 33 | 100.0% |
Occupancy by Household Size in Byersville
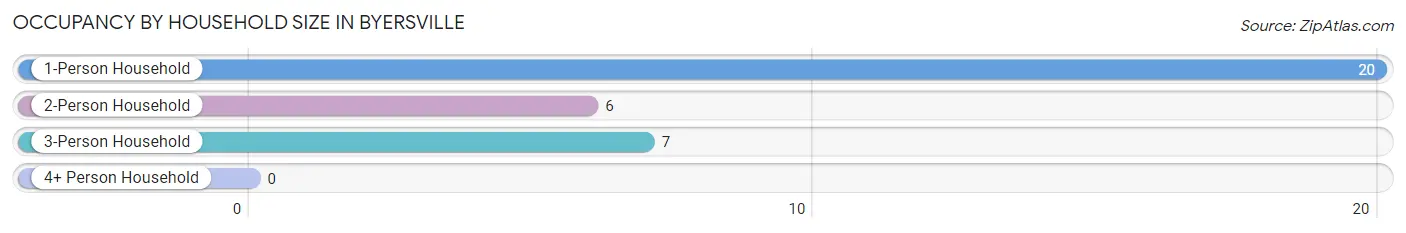
| Household Size | # Housing Units | % Housing Units |
| 1-Person Household | 20 | 60.6% |
| 2-Person Household | 6 | 18.2% |
| 3-Person Household | 7 | 21.2% |
| 4+ Person Household | 0 | 0.0% |
| Total Housing Units | 33 | 100.0% |
Occupancy by Ownership by Household Size in Byersville
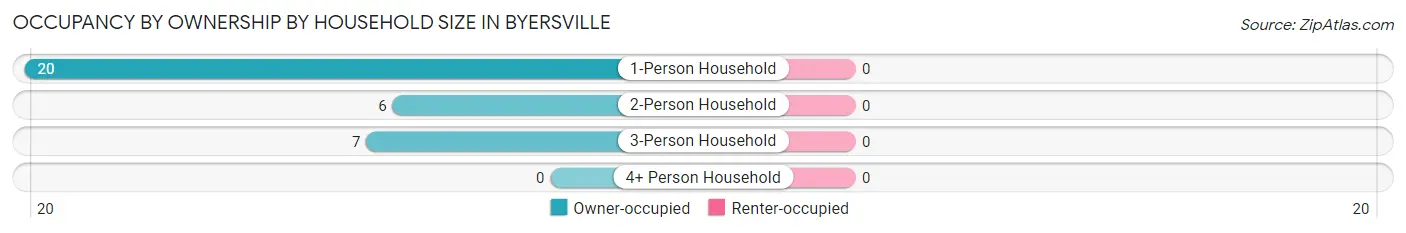
| Household Size | Owner-occupied | Renter-occupied |
| 1-Person Household | 20 (100.0%) | 0 (0.0%) |
| 2-Person Household | 6 (100.0%) | 0 (0.0%) |
| 3-Person Household | 7 (100.0%) | 0 (0.0%) |
| 4+ Person Household | 0 (0.0%) | 0 (0.0%) |
| Total Housing Units | 33 (100.0%) | 0 (0.0%) |
Occupancy by Educational Attainment in Byersville
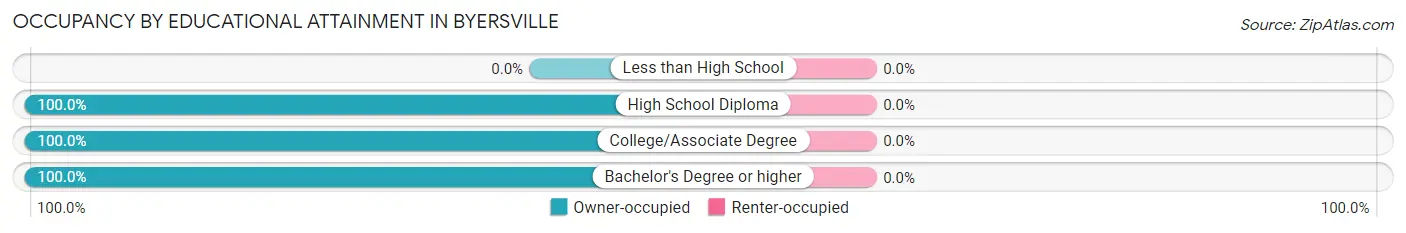
| Household Size | Owner-occupied | Renter-occupied |
| Less than High School | 0 (0.0%) | 0 (0.0%) |
| High School Diploma | 8 (100.0%) | 0 (0.0%) |
| College/Associate Degree | 16 (100.0%) | 0 (0.0%) |
| Bachelor's Degree or higher | 9 (100.0%) | 0 (0.0%) |
Occupancy by Age of Householder in Byersville
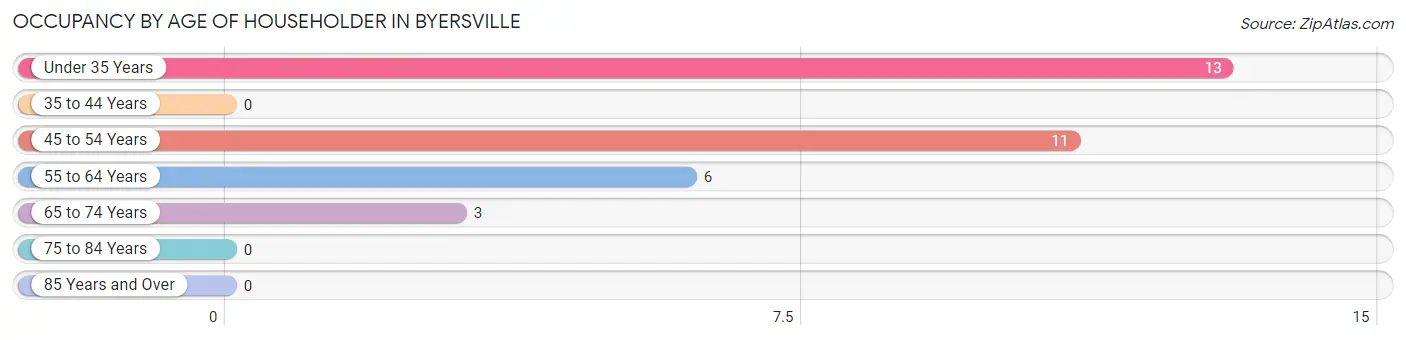
| Age Bracket | # Households | % Households |
| Under 35 Years | 13 | 39.4% |
| 35 to 44 Years | 0 | 0.0% |
| 45 to 54 Years | 11 | 33.3% |
| 55 to 64 Years | 6 | 18.2% |
| 65 to 74 Years | 3 | 9.1% |
| 75 to 84 Years | 0 | 0.0% |
| 85 Years and Over | 0 | 0.0% |
| Total | 33 | 100.0% |
Housing Finances in Byersville
Median Income by Occupancy in Byersville
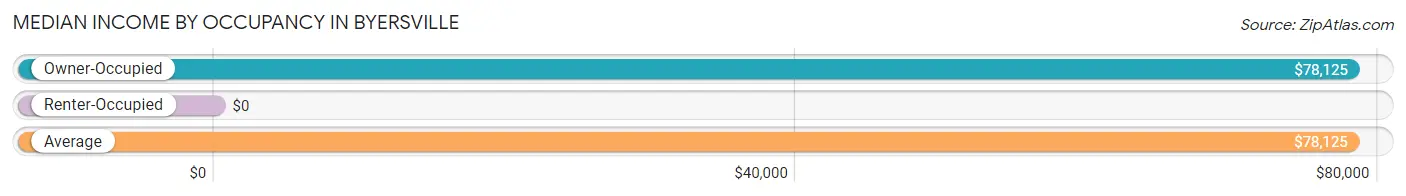
| Occupancy Type | # Households | Median Income |
| Owner-Occupied | 33 (100.0%) | $78,125 |
| Renter-Occupied | 0 (0.0%) | $0 |
| Average | 33 (100.0%) | $78,125 |
Occupancy by Householder Income Bracket in Byersville
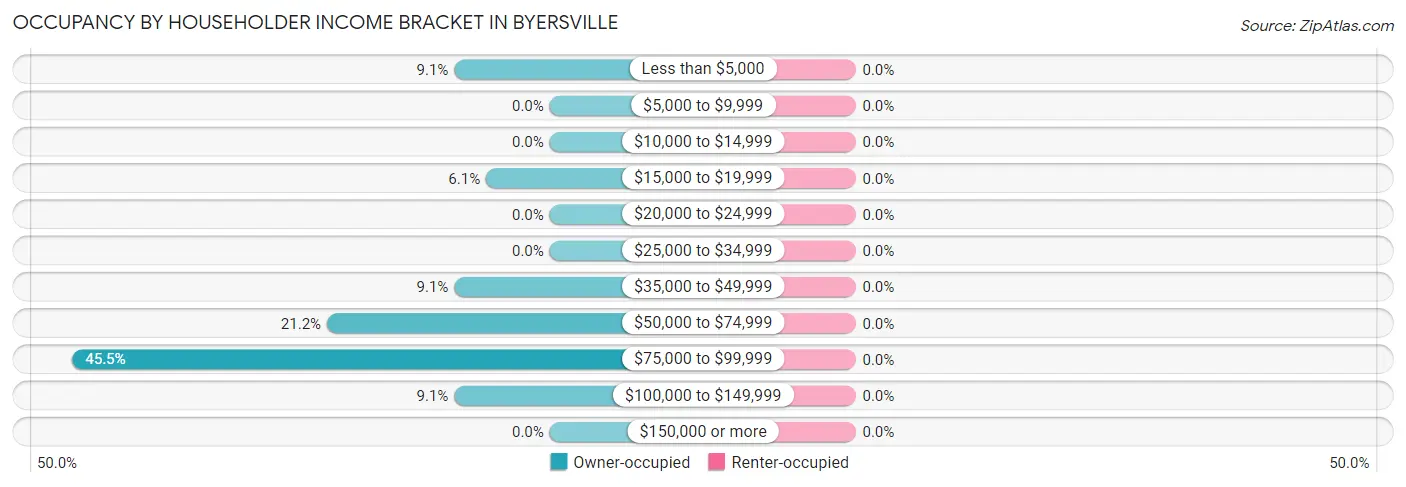
| Income Bracket | Owner-occupied | Renter-occupied |
| Less than $5,000 | 3 (9.1%) | 0 (0.0%) |
| $5,000 to $9,999 | 0 (0.0%) | 0 (0.0%) |
| $10,000 to $14,999 | 0 (0.0%) | 0 (0.0%) |
| $15,000 to $19,999 | 2 (6.1%) | 0 (0.0%) |
| $20,000 to $24,999 | 0 (0.0%) | 0 (0.0%) |
| $25,000 to $34,999 | 0 (0.0%) | 0 (0.0%) |
| $35,000 to $49,999 | 3 (9.1%) | 0 (0.0%) |
| $50,000 to $74,999 | 7 (21.2%) | 0 (0.0%) |
| $75,000 to $99,999 | 15 (45.5%) | 0 (0.0%) |
| $100,000 to $149,999 | 3 (9.1%) | 0 (0.0%) |
| $150,000 or more | 0 (0.0%) | 0 (0.0%) |
| Total | 33 (100.0%) | 0 (0.0%) |
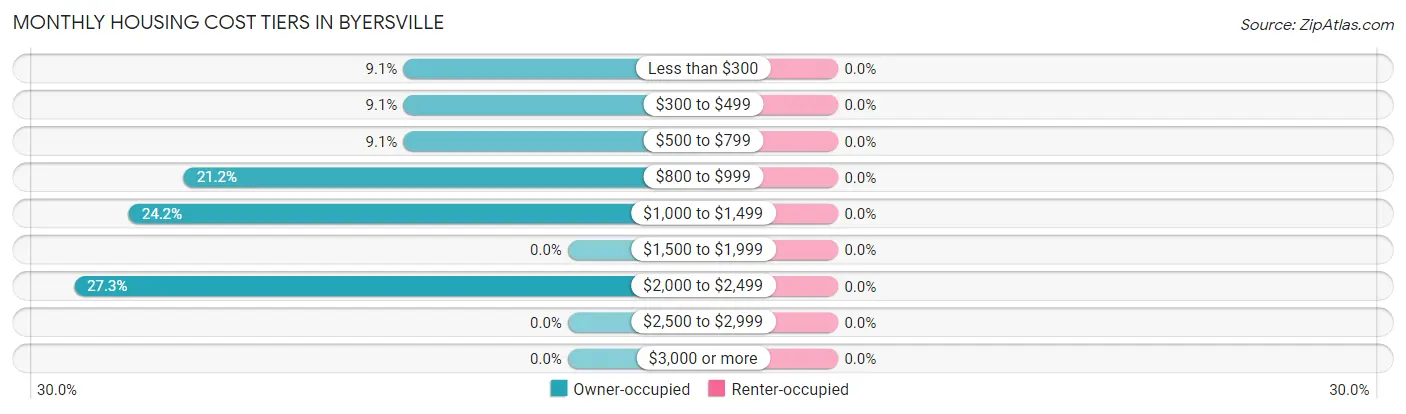
Monthly Housing Cost Tiers in Byersville
| Monthly Cost | Owner-occupied | Renter-occupied |
| Less than $300 | 3 (9.1%) | 0 (0.0%) |
| $300 to $499 | 3 (9.1%) | 0 (0.0%) |
| $500 to $799 | 3 (9.1%) | 0 (0.0%) |
| $800 to $999 | 7 (21.2%) | 0 (0.0%) |
| $1,000 to $1,499 | 8 (24.2%) | 0 (0.0%) |
| $1,500 to $1,999 | 0 (0.0%) | 0 (0.0%) |
| $2,000 to $2,499 | 9 (27.3%) | 0 (0.0%) |
| $2,500 to $2,999 | 0 (0.0%) | 0 (0.0%) |
| $3,000 or more | 0 (0.0%) | 0 (0.0%) |
| Total | 33 (100.0%) | 0 (0.0%) |
Physical Housing Characteristics in Byersville
Housing Structures in Byersville
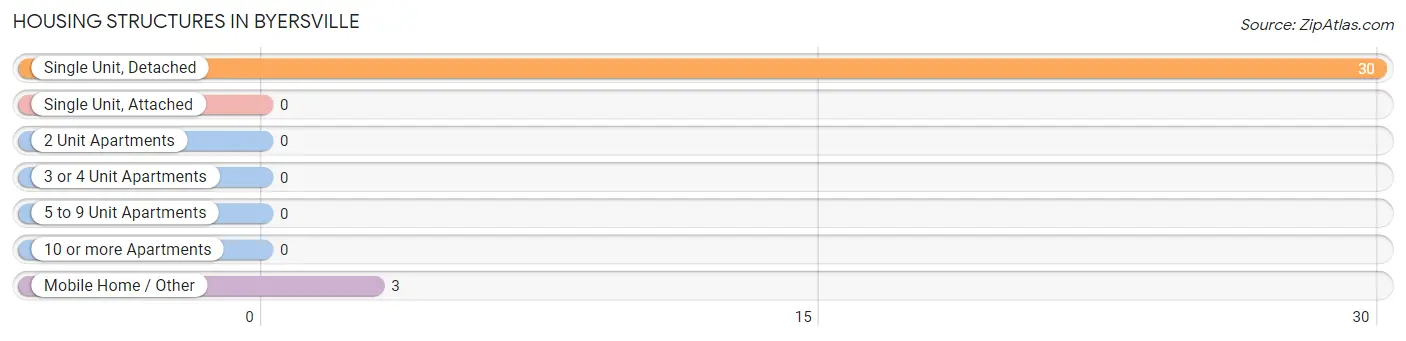
| Structure Type | # Housing Units | % Housing Units |
| Single Unit, Detached | 30 | 90.9% |
| Single Unit, Attached | 0 | 0.0% |
| 2 Unit Apartments | 0 | 0.0% |
| 3 or 4 Unit Apartments | 0 | 0.0% |
| 5 to 9 Unit Apartments | 0 | 0.0% |
| 10 or more Apartments | 0 | 0.0% |
| Mobile Home / Other | 3 | 9.1% |
| Total | 33 | 100.0% |
Housing Structures by Occupancy in Byersville
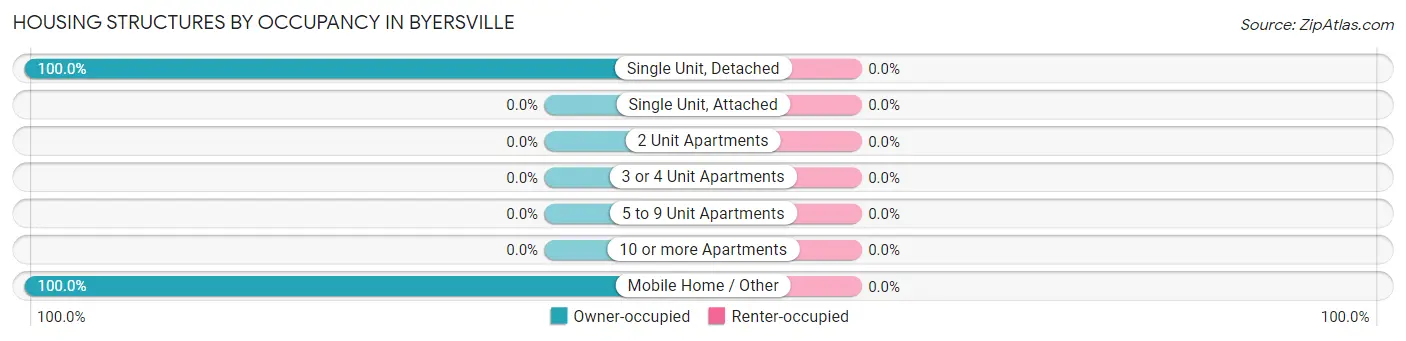
| Structure Type | Owner-occupied | Renter-occupied |
| Single Unit, Detached | 30 (100.0%) | 0 (0.0%) |
| Single Unit, Attached | 0 (0.0%) | 0 (0.0%) |
| 2 Unit Apartments | 0 (0.0%) | 0 (0.0%) |
| 3 or 4 Unit Apartments | 0 (0.0%) | 0 (0.0%) |
| 5 to 9 Unit Apartments | 0 (0.0%) | 0 (0.0%) |
| 10 or more Apartments | 0 (0.0%) | 0 (0.0%) |
| Mobile Home / Other | 3 (100.0%) | 0 (0.0%) |
| Total | 33 (100.0%) | 0 (0.0%) |
Housing Structures by Number of Rooms in Byersville
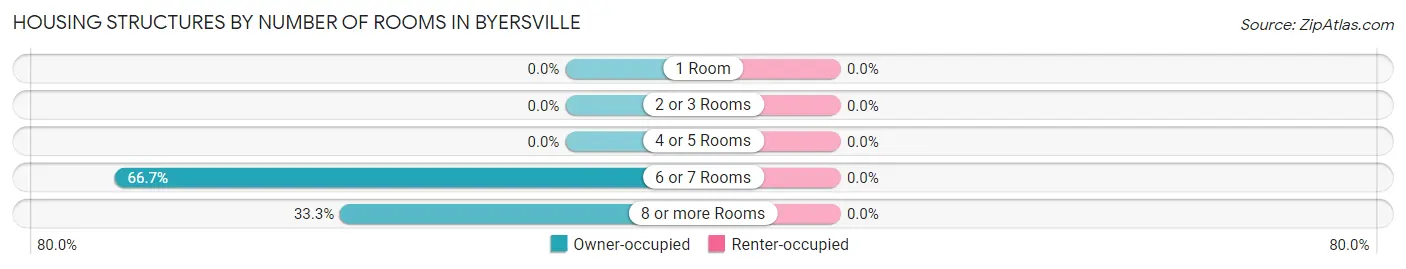
| Number of Rooms | Owner-occupied | Renter-occupied |
| 1 Room | 0 (0.0%) | 0 (0.0%) |
| 2 or 3 Rooms | 0 (0.0%) | 0 (0.0%) |
| 4 or 5 Rooms | 0 (0.0%) | 0 (0.0%) |
| 6 or 7 Rooms | 22 (66.7%) | 0 (0.0%) |
| 8 or more Rooms | 11 (33.3%) | 0 (0.0%) |
| Total | 33 (100.0%) | 0 (0.0%) |
Housing Structure by Heating Type in Byersville
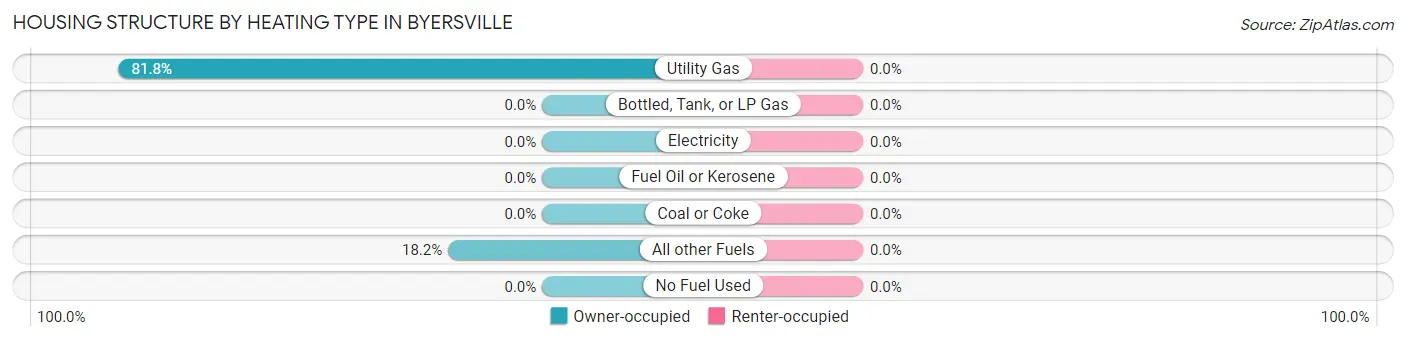
| Heating Type | Owner-occupied | Renter-occupied |
| Utility Gas | 27 (81.8%) | 0 (0.0%) |
| Bottled, Tank, or LP Gas | 0 (0.0%) | 0 (0.0%) |
| Electricity | 0 (0.0%) | 0 (0.0%) |
| Fuel Oil or Kerosene | 0 (0.0%) | 0 (0.0%) |
| Coal or Coke | 0 (0.0%) | 0 (0.0%) |
| All other Fuels | 6 (18.2%) | 0 (0.0%) |
| No Fuel Used | 0 (0.0%) | 0 (0.0%) |
| Total | 33 (100.0%) | 0 (0.0%) |
Household Vehicle Usage in Byersville
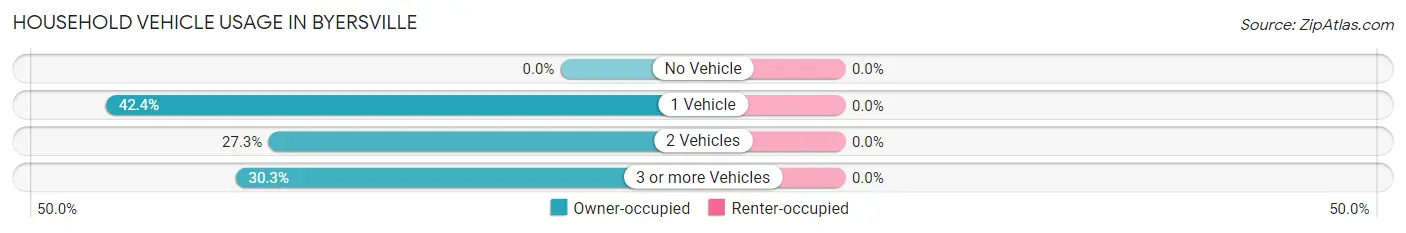
| Vehicles per Household | Owner-occupied | Renter-occupied |
| No Vehicle | 0 (0.0%) | 0 (0.0%) |
| 1 Vehicle | 14 (42.4%) | 0 (0.0%) |
| 2 Vehicles | 9 (27.3%) | 0 (0.0%) |
| 3 or more Vehicles | 10 (30.3%) | 0 (0.0%) |
| Total | 33 (100.0%) | 0 (0.0%) |
Real Estate & Mortgages in Byersville
Real Estate and Mortgage Overview in Byersville
| Characteristic | Without Mortgage | With Mortgage |
| Housing Units | 9 | 24 |
| Median Property Value | $85,000 | $140,600 |
| Median Household Income | - | - |
| Monthly Housing Costs | $450 | $0 |
| Real Estate Taxes | $3,250 | $9 |
Property Value by Mortgage Status in Byersville
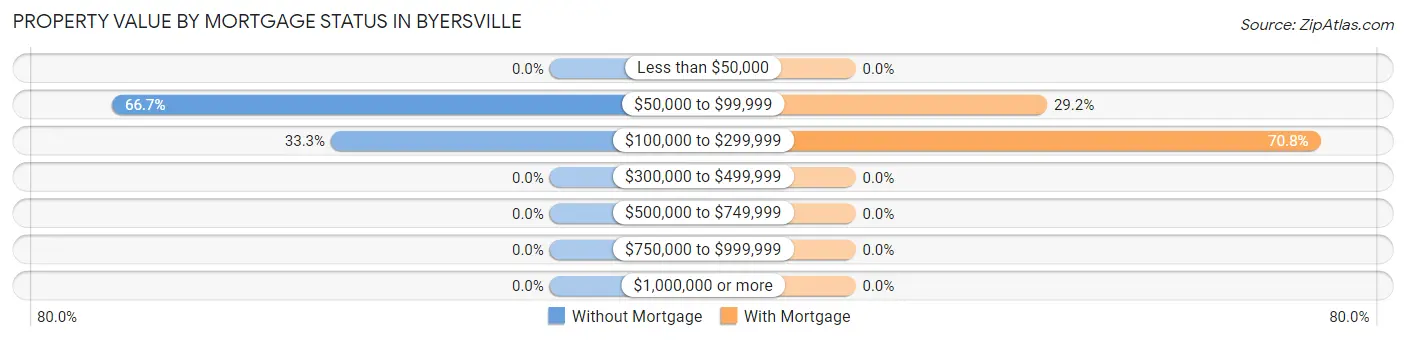
| Property Value | Without Mortgage | With Mortgage |
| Less than $50,000 | 0 (0.0%) | 0 (0.0%) |
| $50,000 to $99,999 | 6 (66.7%) | 7 (29.2%) |
| $100,000 to $299,999 | 3 (33.3%) | 17 (70.8%) |
| $300,000 to $499,999 | 0 (0.0%) | 0 (0.0%) |
| $500,000 to $749,999 | 0 (0.0%) | 0 (0.0%) |
| $750,000 to $999,999 | 0 (0.0%) | 0 (0.0%) |
| $1,000,000 or more | 0 (0.0%) | 0 (0.0%) |
| Total | 9 (100.0%) | 24 (100.0%) |
Household Income by Mortgage Status in Byersville
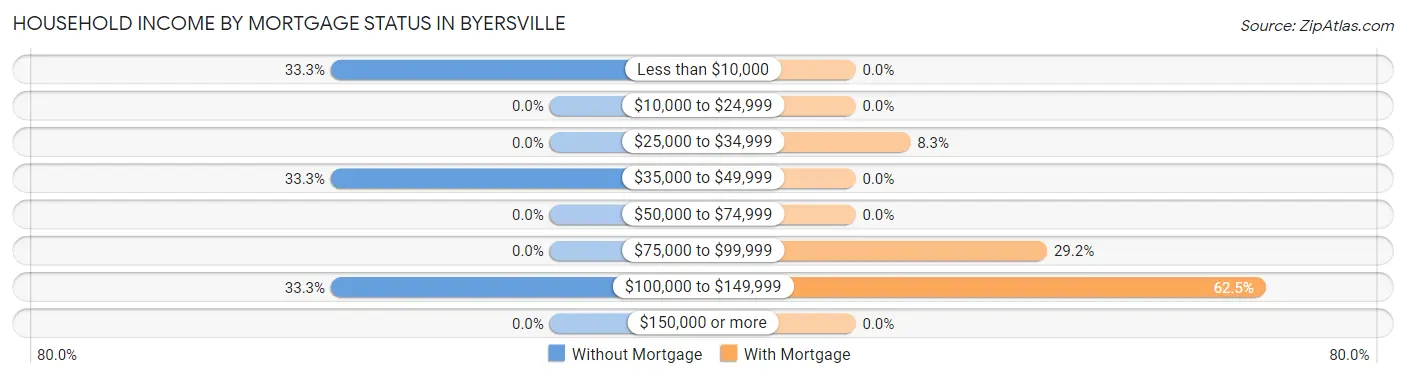
| Household Income | Without Mortgage | With Mortgage |
| Less than $10,000 | 3 (33.3%) | 0 (0.0%) |
| $10,000 to $24,999 | 0 (0.0%) | 0 (0.0%) |
| $25,000 to $34,999 | 0 (0.0%) | 2 (8.3%) |
| $35,000 to $49,999 | 3 (33.3%) | 0 (0.0%) |
| $50,000 to $74,999 | 0 (0.0%) | 0 (0.0%) |
| $75,000 to $99,999 | 0 (0.0%) | 7 (29.2%) |
| $100,000 to $149,999 | 3 (33.3%) | 15 (62.5%) |
| $150,000 or more | 0 (0.0%) | 0 (0.0%) |
| Total | 9 (100.0%) | 24 (100.0%) |
Property Value to Household Income Ratio in Byersville
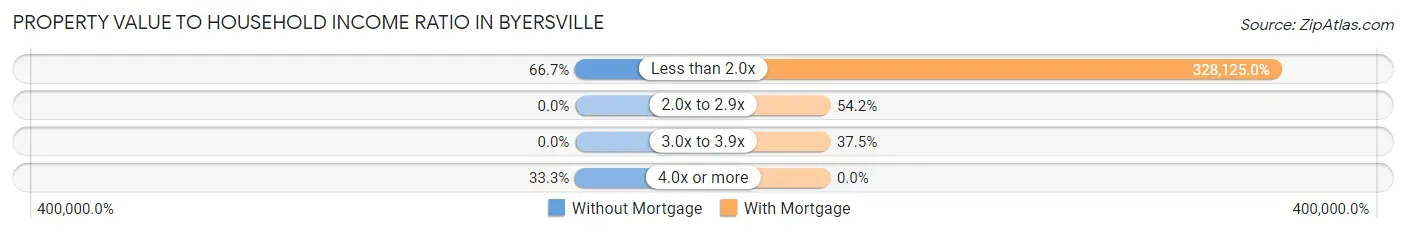
| Value-to-Income Ratio | Without Mortgage | With Mortgage |
| Less than 2.0x | 6 (66.7%) | 78,750 (328,125.0%) |
| 2.0x to 2.9x | 0 (0.0%) | 13 (54.2%) |
| 3.0x to 3.9x | 0 (0.0%) | 9 (37.5%) |
| 4.0x or more | 3 (33.3%) | 0 (0.0%) |
| Total | 9 (100.0%) | 24 (100.0%) |
Real Estate Taxes by Mortgage Status in Byersville
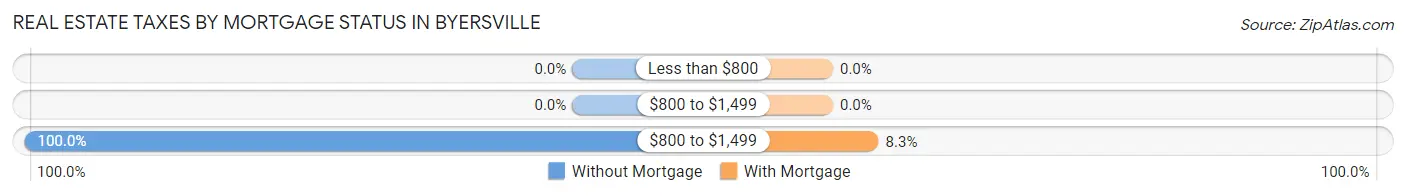
| Property Taxes | Without Mortgage | With Mortgage |
| Less than $800 | 0 (0.0%) | 0 (0.0%) |
| $800 to $1,499 | 0 (0.0%) | 0 (0.0%) |
| $800 to $1,499 | 9 (100.0%) | 2 (8.3%) |
| Total | 9 (100.0%) | 24 (100.0%) |
Health & Disability in Byersville
Health Insurance Coverage by Age in Byersville
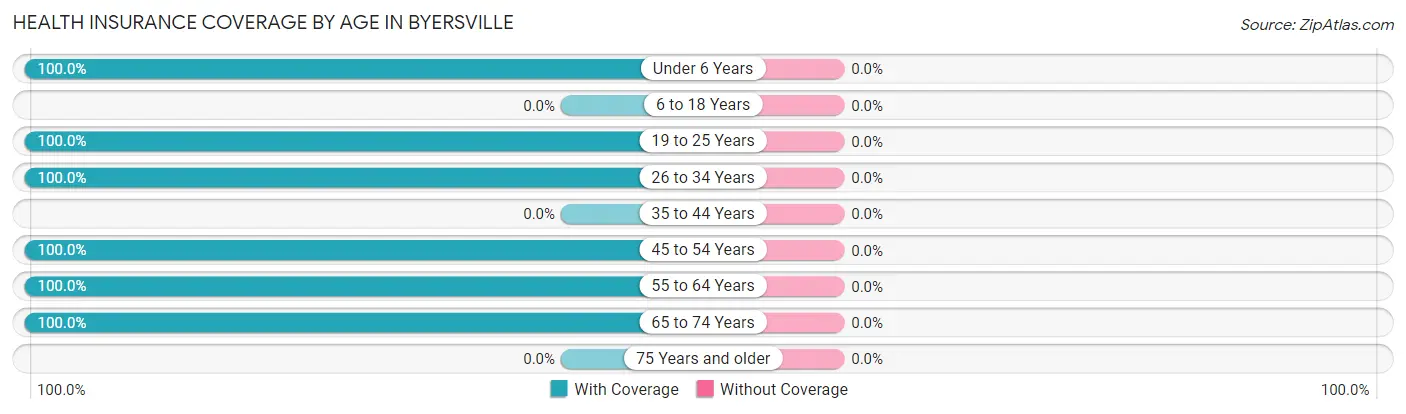
| Age Bracket | With Coverage | Without Coverage |
| Under 6 Years | 3 (100.0%) | 0 (0.0%) |
| 6 to 18 Years | 0 (0.0%) | 0 (0.0%) |
| 19 to 25 Years | 11 (100.0%) | 0 (0.0%) |
| 26 to 34 Years | 6 (100.0%) | 0 (0.0%) |
| 35 to 44 Years | 0 (0.0%) | 0 (0.0%) |
| 45 to 54 Years | 11 (100.0%) | 0 (0.0%) |
| 55 to 64 Years | 6 (100.0%) | 0 (0.0%) |
| 65 to 74 Years | 9 (100.0%) | 0 (0.0%) |
| 75 Years and older | 0 (0.0%) | 0 (0.0%) |
| Total | 46 (100.0%) | 0 (0.0%) |
Health Insurance Coverage by Citizenship Status in Byersville
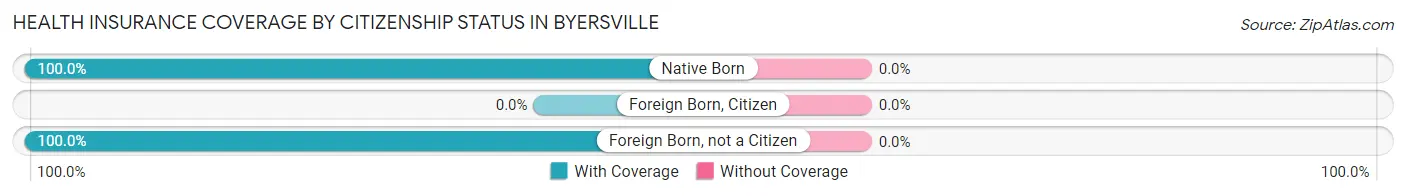
| Citizenship Status | With Coverage | Without Coverage |
| Native Born | 3 (100.0%) | 0 (0.0%) |
| Foreign Born, Citizen | 0 (0.0%) | 0 (0.0%) |
| Foreign Born, not a Citizen | 11 (100.0%) | 0 (0.0%) |
Health Insurance Coverage by Household Income in Byersville
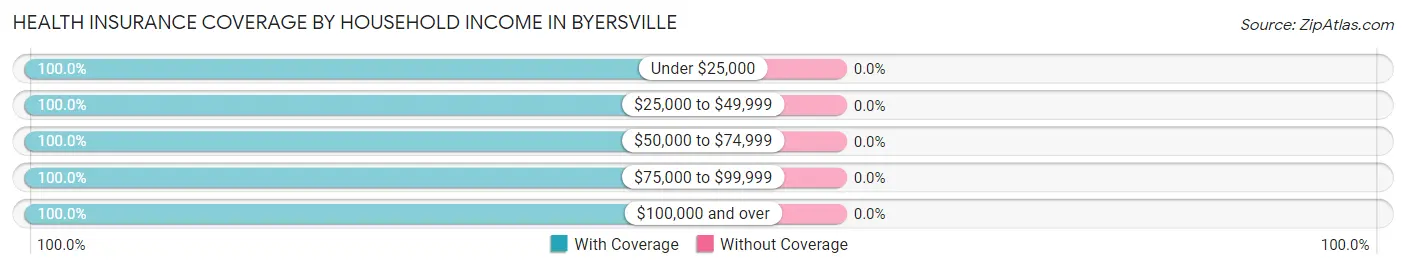
| Household Income | With Coverage | Without Coverage |
| Under $25,000 | 5 (100.0%) | 0 (0.0%) |
| $25,000 to $49,999 | 6 (100.0%) | 0 (0.0%) |
| $50,000 to $74,999 | 14 (100.0%) | 0 (0.0%) |
| $75,000 to $99,999 | 15 (100.0%) | 0 (0.0%) |
| $100,000 and over | 6 (100.0%) | 0 (0.0%) |
Public vs Private Health Insurance Coverage by Age in Byersville
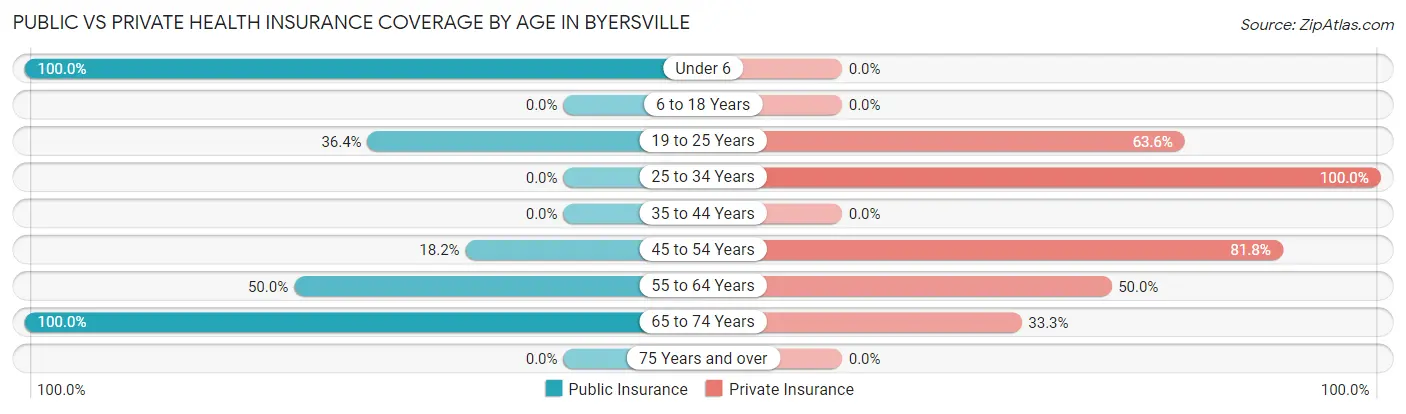
| Age Bracket | Public Insurance | Private Insurance |
| Under 6 | 3 (100.0%) | 0 (0.0%) |
| 6 to 18 Years | 0 (0.0%) | 0 (0.0%) |
| 19 to 25 Years | 4 (36.4%) | 7 (63.6%) |
| 25 to 34 Years | 0 (0.0%) | 6 (100.0%) |
| 35 to 44 Years | 0 (0.0%) | 0 (0.0%) |
| 45 to 54 Years | 2 (18.2%) | 9 (81.8%) |
| 55 to 64 Years | 3 (50.0%) | 3 (50.0%) |
| 65 to 74 Years | 9 (100.0%) | 3 (33.3%) |
| 75 Years and over | 0 (0.0%) | 0 (0.0%) |
| Total | 21 (45.7%) | 28 (60.9%) |
Disability Status by Sex by Age in Byersville
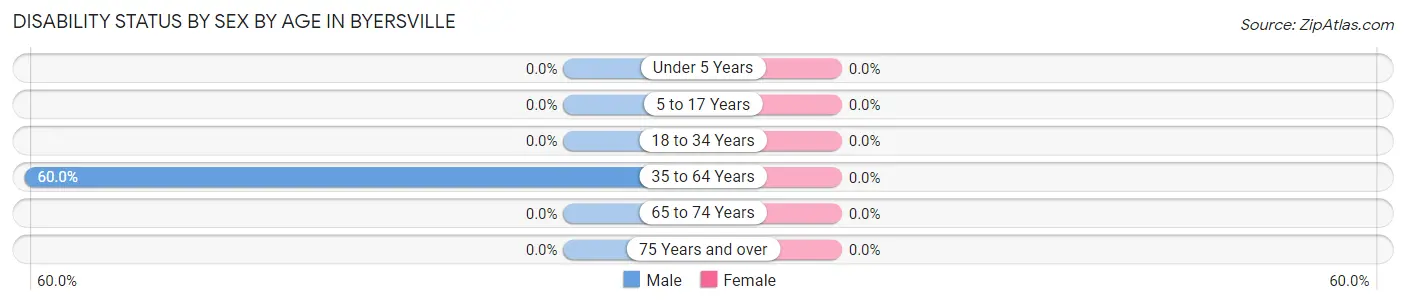
| Age Bracket | Male | Female |
| Under 5 Years | 0 (0.0%) | 0 (0.0%) |
| 5 to 17 Years | 0 (0.0%) | 0 (0.0%) |
| 18 to 34 Years | 0 (0.0%) | 0 (0.0%) |
| 35 to 64 Years | 3 (60.0%) | 0 (0.0%) |
| 65 to 74 Years | 0 (0.0%) | 0 (0.0%) |
| 75 Years and over | 0 (0.0%) | 0 (0.0%) |
Disability Class by Sex by Age in Byersville
Disability Class: Hearing Difficulty
| Age Bracket | Male | Female |
| Under 5 Years | 0 (0.0%) | 0 (0.0%) |
| 5 to 17 Years | 0 (0.0%) | 0 (0.0%) |
| 18 to 34 Years | 0 (0.0%) | 0 (0.0%) |
| 35 to 64 Years | 0 (0.0%) | 0 (0.0%) |
| 65 to 74 Years | 0 (0.0%) | 0 (0.0%) |
| 75 Years and over | 0 (0.0%) | 0 (0.0%) |
Disability Class: Vision Difficulty
| Age Bracket | Male | Female |
| Under 5 Years | 0 (0.0%) | 0 (0.0%) |
| 5 to 17 Years | 0 (0.0%) | 0 (0.0%) |
| 18 to 34 Years | 0 (0.0%) | 0 (0.0%) |
| 35 to 64 Years | 0 (0.0%) | 0 (0.0%) |
| 65 to 74 Years | 0 (0.0%) | 0 (0.0%) |
| 75 Years and over | 0 (0.0%) | 0 (0.0%) |
Disability Class: Cognitive Difficulty
| Age Bracket | Male | Female |
| 5 to 17 Years | 0 (0.0%) | 0 (0.0%) |
| 18 to 34 Years | 0 (0.0%) | 0 (0.0%) |
| 35 to 64 Years | 0 (0.0%) | 0 (0.0%) |
| 65 to 74 Years | 0 (0.0%) | 0 (0.0%) |
| 75 Years and over | 0 (0.0%) | 0 (0.0%) |
Disability Class: Ambulatory Difficulty
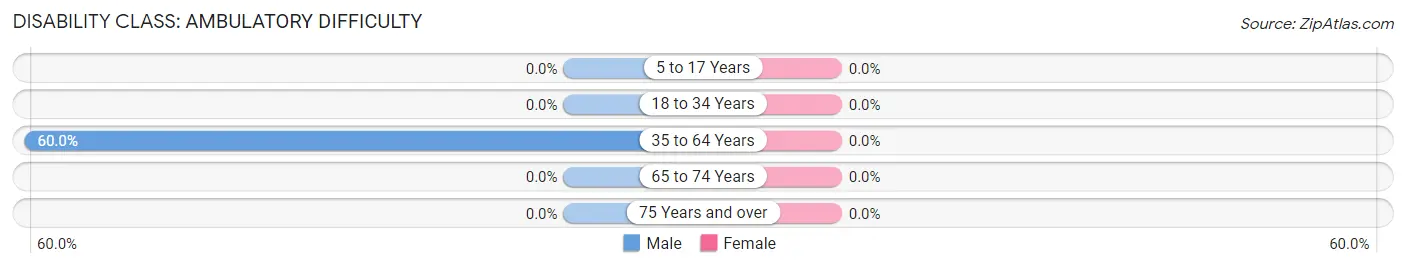
| Age Bracket | Male | Female |
| 5 to 17 Years | 0 (0.0%) | 0 (0.0%) |
| 18 to 34 Years | 0 (0.0%) | 0 (0.0%) |
| 35 to 64 Years | 3 (60.0%) | 0 (0.0%) |
| 65 to 74 Years | 0 (0.0%) | 0 (0.0%) |
| 75 Years and over | 0 (0.0%) | 0 (0.0%) |
Disability Class: Self-Care Difficulty
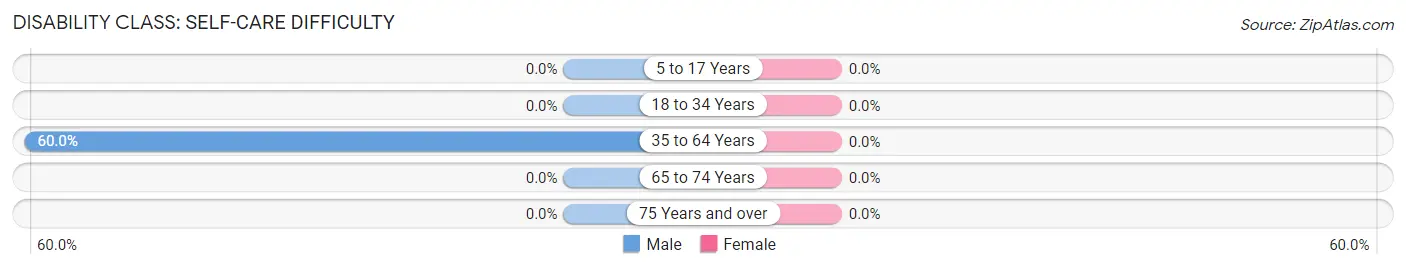
| Age Bracket | Male | Female |
| 5 to 17 Years | 0 (0.0%) | 0 (0.0%) |
| 18 to 34 Years | 0 (0.0%) | 0 (0.0%) |
| 35 to 64 Years | 3 (60.0%) | 0 (0.0%) |
| 65 to 74 Years | 0 (0.0%) | 0 (0.0%) |
| 75 Years and over | 0 (0.0%) | 0 (0.0%) |
Technology Access in Byersville
Computing Device Access in Byersville
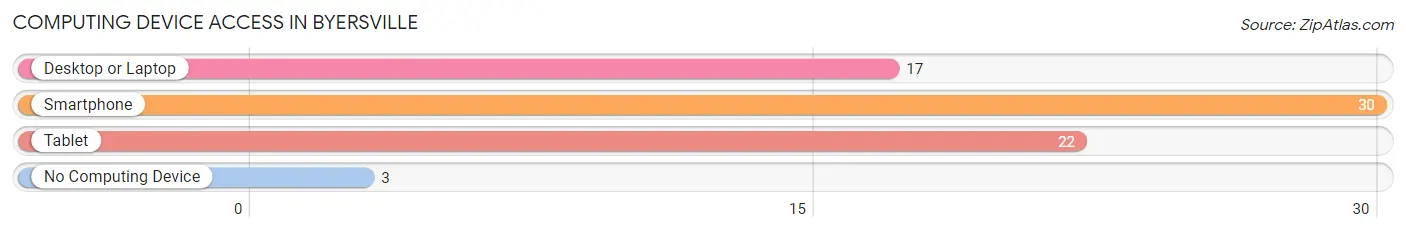
| Device Type | # Households | % Households |
| Desktop or Laptop | 17 | 51.5% |
| Smartphone | 30 | 90.9% |
| Tablet | 22 | 66.7% |
| No Computing Device | 3 | 9.1% |
| Total | 33 | 100.0% |
Internet Access in Byersville
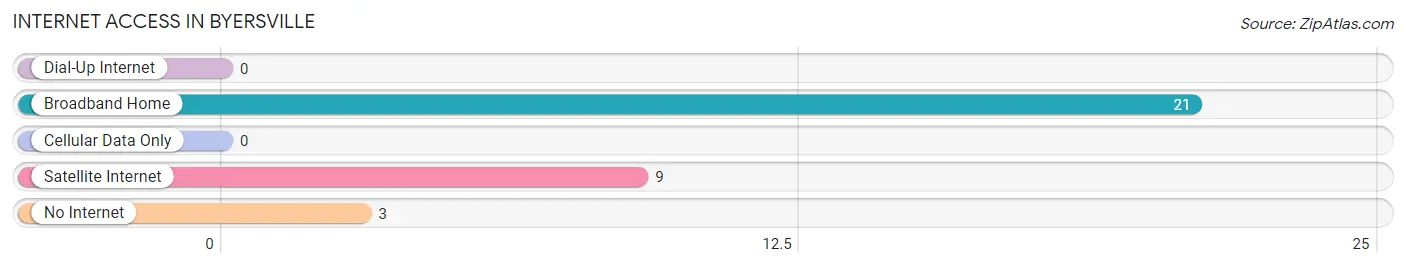
| Internet Type | # Households | % Households |
| Dial-Up Internet | 0 | 0.0% |
| Broadband Home | 21 | 63.6% |
| Cellular Data Only | 0 | 0.0% |
| Satellite Internet | 9 | 27.3% |
| No Internet | 3 | 9.1% |
| Total | 33 | 100.0% |
Byersville Summary
Byersville is a small hamlet located in the town of Schuyler in Herkimer County, New York. It is situated on the banks of the Mohawk River, about 10 miles south of the city of Utica. The hamlet was named after the Byers family, who were among the first settlers in the area.
History
The first settlers in the area of Byersville were the Byers family, who arrived in the late 1700s. The Byers family was originally from Scotland and had come to the United States in search of a better life. They settled in the area of Byersville and established a small farm.
The hamlet of Byersville was officially established in 1820. At the time, the hamlet was a small farming community with a population of about 200 people. The main industry in the area was agriculture, with the majority of the population working on the farms.
In the late 1800s, the hamlet began to grow and develop. The population increased to about 500 people and the economy began to diversify. The hamlet became a center for manufacturing, with several factories being established in the area. The factories produced a variety of products, including furniture, clothing, and tools.
The hamlet continued to grow and develop throughout the 20th century. By the year 2000, the population had grown to about 1,000 people. The economy was still largely based on manufacturing, but the hamlet had also become a popular tourist destination.
Geography
Byersville is located in the town of Schuyler in Herkimer County, New York. It is situated on the banks of the Mohawk River, about 10 miles south of the city of Utica. The hamlet is surrounded by rolling hills and farmland.
The climate in Byersville is typical of the Northeastern United States. Summers are warm and humid, while winters are cold and snowy. The average annual temperature is around 50 degrees Fahrenheit.
Economy
The economy of Byersville is largely based on manufacturing. The hamlet is home to several factories that produce a variety of products, including furniture, clothing, and tools. The hamlet is also a popular tourist destination, with many visitors coming to enjoy the scenic views of the Mohawk River.
In addition to manufacturing and tourism, the hamlet also has a small agricultural sector. The majority of the farms in the area produce dairy products, such as milk and cheese.
Demographics
As of the 2010 census, the population of Byersville was 1,072. The population is largely white (97.2%), with a small percentage of African Americans (1.2%) and Hispanics (1.6%). The median household income is $45,000, and the median age is 43.
Conclusion
Byersville is a small hamlet located in the town of Schuyler in Herkimer County, New York. It is situated on the banks of the Mohawk River, about 10 miles south of the city of Utica. The hamlet was named after the Byers family, who were among the first settlers in the area. The economy of Byersville is largely based on manufacturing, with several factories producing a variety of products. The hamlet is also a popular tourist destination, with many visitors coming to enjoy the scenic views of the Mohawk River. As of the 2010 census, the population of Byersville was 1,072. The population is largely white, with a small percentage of African Americans and Hispanics.
Common Questions
What is Per Capita Income in Byersville?
Per Capita income in Byersville is $44,950.
What is the Median Family Income in Byersville?
Median Family Income in Byersville is $44,821.
What is the Median Household income in Byersville?
Median Household Income in Byersville is $78,125.
What is Inequality or Gini Index in Byersville?
Inequality or Gini Index in Byersville is 0.24.
What is the Total Population of Byersville?
Total Population of Byersville is 46.
What is the Total Male Population of Byersville?
Total Male Population of Byersville is 24.
What is the Total Female Population of Byersville?
Total Female Population of Byersville is 22.
What is the Ratio of Males per 100 Females in Byersville?
There are 109.09 Males per 100 Females in Byersville.
What is the Ratio of Females per 100 Males in Byersville?
There are 91.67 Females per 100 Males in Byersville.
What is the Median Population Age in Byersville?
Median Population Age in Byersville is 49.3 Years.
What is the Average Family Size in Byersville
Average Family Size in Byersville is 1.7 People.
What is the Average Household Size in Byersville
Average Household Size in Byersville is 1.4 People.
How Large is the Labor Force in Byersville?
There are 37 People in the Labor Forcein in Byersville.
What is the Percentage of People in the Labor Force in Byersville?
86.0% of People are in the Labor Force in Byersville.
What is the Unemployment Rate in Byersville?
Unemployment Rate in Byersville is 10.8%.