Northampton, NY Map & Demographics
Northampton Map
Northampton Overview
$27,820
PER CAPITA INCOME
$73,057
AVG FAMILY INCOME
$74,856
AVG HOUSEHOLD INCOME
0.26
INEQUALITY / GINI INDEX
1,405
TOTAL POPULATION
654
MALE POPULATION
751
FEMALE POPULATION
87.08
MALES / 100 FEMALES
114.83
FEMALES / 100 MALES
32.4
MEDIAN AGE
3.5
AVG FAMILY SIZE
3.6
AVG HOUSEHOLD SIZE
520
LABOR FORCE [ PEOPLE ]
48.4%
PERCENT IN LABOR FORCE
6.9%
UNEMPLOYMENT RATE
Income in Northampton
Income Overview in Northampton
Per Capita Income in Northampton is $27,820, while median incomes of families and households are $73,057 and $74,856 respectively.
| Characteristic | Number | Measure |
| Per Capita Income | 1,405 | $27,820 |
| Median Family Income | 352 | $73,057 |
| Mean Family Income | 352 | $64,403 |
| Median Household Income | 391 | $74,856 |
| Mean Household Income | 391 | $97,846 |
| Income Deficit | 352 | $0 |
| Wage / Income Gap (%) | 1,405 | 0.00% |
| Wage / Income Gap ($) | 1,405 | 100.00¢ per $1 |
| Gini / Inequality Index | 1,405 | 0.26 |
Earnings by Sex in Northampton
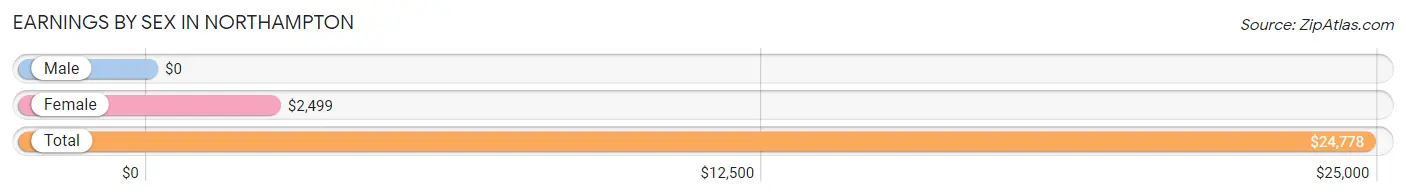
| Sex | Number | Average Earnings |
| Male | 356 (51.5%) | $0 |
| Female | 335 (48.5%) | $2,499 |
| Total | 691 (100.0%) | $24,778 |
Earnings by Sex by Income Bracket in Northampton
The most common earnings brackets in Northampton are $22,500 to $24,999 for men (152 | 42.7%) and $2,499 or less for women (170 | 50.7%).
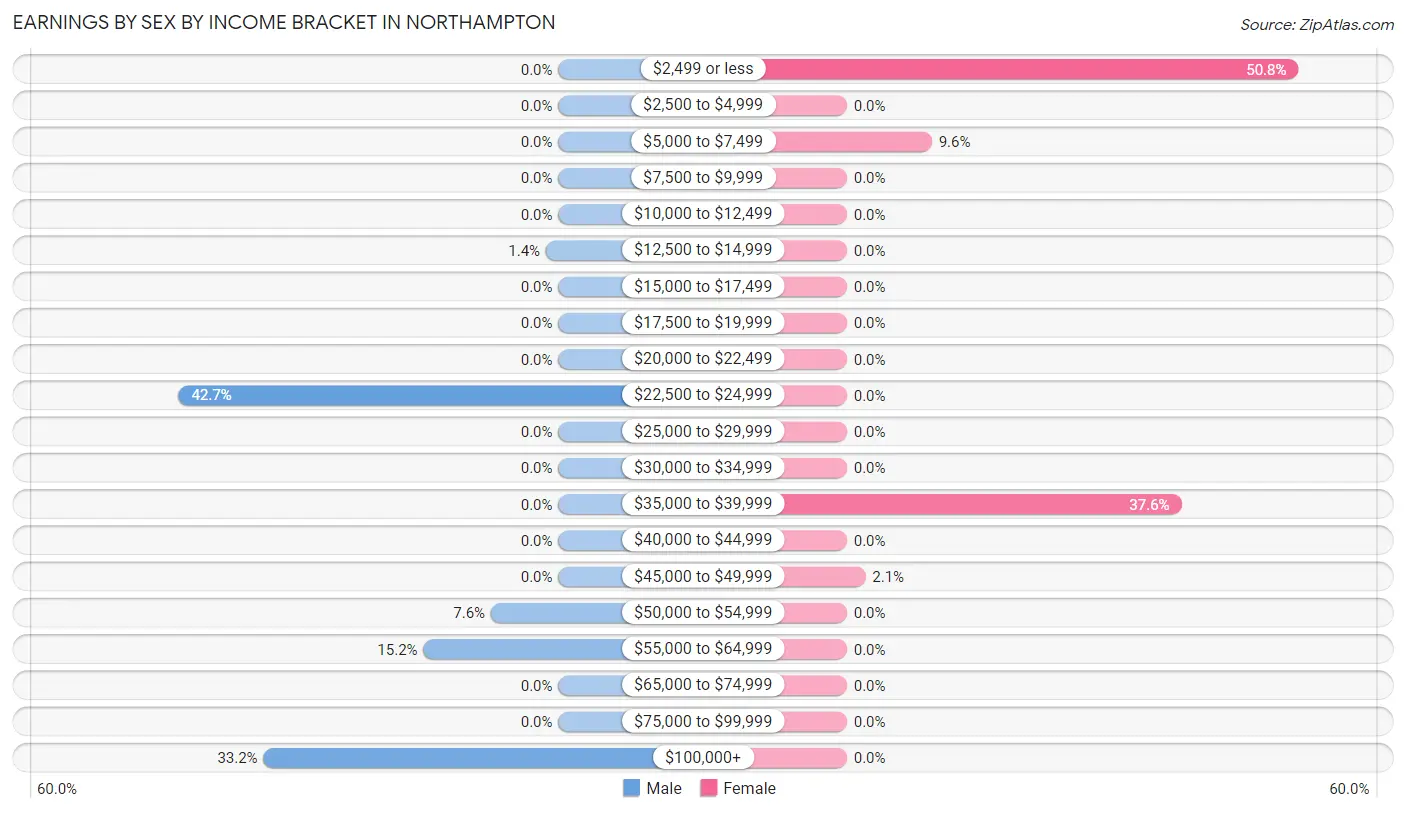
| Income | Male | Female |
| $2,499 or less | 0 (0.0%) | 170 (50.7%) |
| $2,500 to $4,999 | 0 (0.0%) | 0 (0.0%) |
| $5,000 to $7,499 | 0 (0.0%) | 32 (9.6%) |
| $7,500 to $9,999 | 0 (0.0%) | 0 (0.0%) |
| $10,000 to $12,499 | 0 (0.0%) | 0 (0.0%) |
| $12,500 to $14,999 | 5 (1.4%) | 0 (0.0%) |
| $15,000 to $17,499 | 0 (0.0%) | 0 (0.0%) |
| $17,500 to $19,999 | 0 (0.0%) | 0 (0.0%) |
| $20,000 to $22,499 | 0 (0.0%) | 0 (0.0%) |
| $22,500 to $24,999 | 152 (42.7%) | 0 (0.0%) |
| $25,000 to $29,999 | 0 (0.0%) | 0 (0.0%) |
| $30,000 to $34,999 | 0 (0.0%) | 0 (0.0%) |
| $35,000 to $39,999 | 0 (0.0%) | 126 (37.6%) |
| $40,000 to $44,999 | 0 (0.0%) | 0 (0.0%) |
| $45,000 to $49,999 | 0 (0.0%) | 7 (2.1%) |
| $50,000 to $54,999 | 27 (7.6%) | 0 (0.0%) |
| $55,000 to $64,999 | 54 (15.2%) | 0 (0.0%) |
| $65,000 to $74,999 | 0 (0.0%) | 0 (0.0%) |
| $75,000 to $99,999 | 0 (0.0%) | 0 (0.0%) |
| $100,000+ | 118 (33.2%) | 0 (0.0%) |
| Total | 356 (100.0%) | 335 (100.0%) |
Earnings by Sex by Educational Attainment in Northampton
| Educational Attainment | Male Income | Female Income |
| Less than High School | - | - |
| High School Diploma | - | - |
| College or Associate's Degree | - | - |
| Bachelor's Degree | - | - |
| Graduate Degree | - | - |
| Total | - | - |
Family Income in Northampton
Family Income Brackets in Northampton
According to the Northampton family income data, there are 148 families falling into the $50,000 to $74,999 income range, which is the most common income bracket and makes up 42.0% of all families.
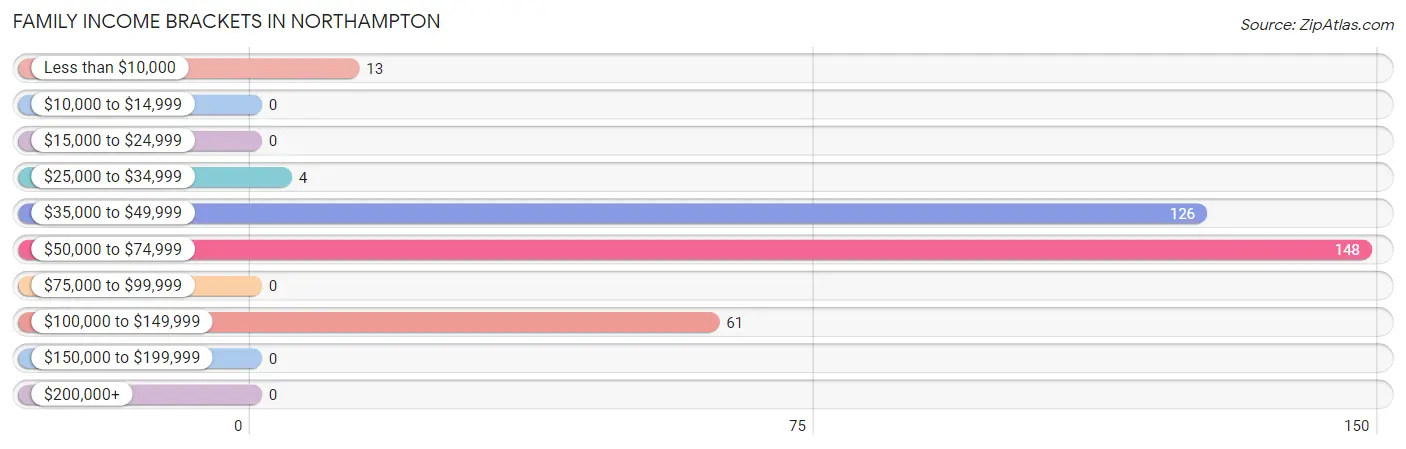
| Income Bracket | # Families | % Families |
| Less than $10,000 | 13 | 3.7% |
| $10,000 to $14,999 | 0 | 0.0% |
| $15,000 to $24,999 | 0 | 0.0% |
| $25,000 to $34,999 | 4 | 1.1% |
| $35,000 to $49,999 | 126 | 35.8% |
| $50,000 to $74,999 | 148 | 42.0% |
| $75,000 to $99,999 | 0 | 0.0% |
| $100,000 to $149,999 | 61 | 17.3% |
| $150,000 to $199,999 | 0 | 0.0% |
| $200,000+ | 0 | 0.0% |
Family Income by Famaliy Size in Northampton
2-person families (65 | 18.5%) account for the highest median family income in Northampton with $109,016 per family, while 2-person families (65 | 18.5%) have the highest median income of $54,508 per family member.
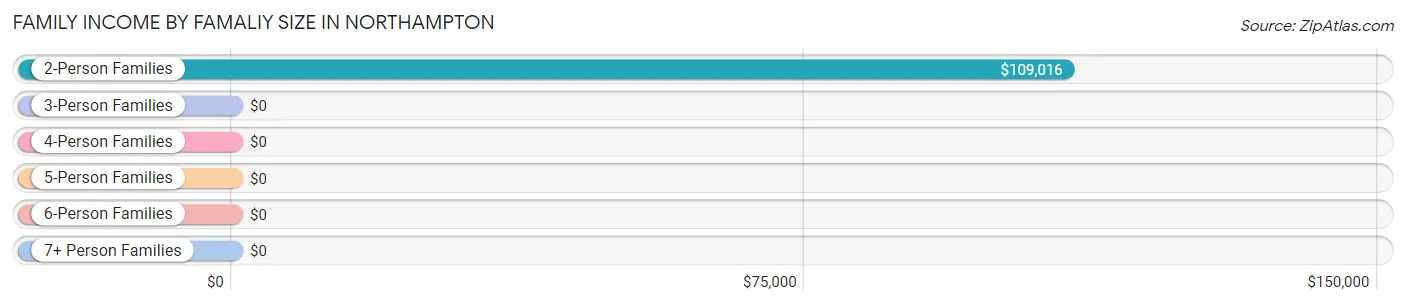
| Income Bracket | # Families | Median Income |
| 2-Person Families | 65 (18.5%) | $109,016 |
| 3-Person Families | 233 (66.2%) | $0 |
| 4-Person Families | 0 (0.0%) | $0 |
| 5-Person Families | 0 (0.0%) | $0 |
| 6-Person Families | 54 (15.3%) | $0 |
| 7+ Person Families | 0 (0.0%) | $0 |
| Total | 352 (100.0%) | $73,057 |
Family Income by Number of Earners in Northampton
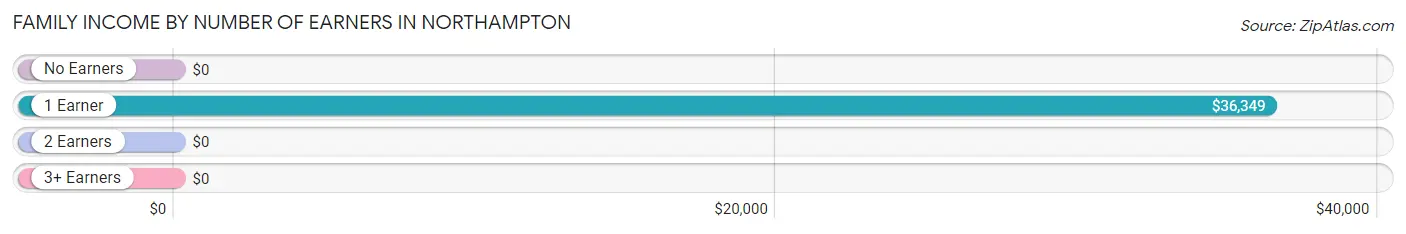
| Number of Earners | # Families | Median Income |
| No Earners | 60 (17.1%) | $0 |
| 1 Earner | 144 (40.9%) | $36,349 |
| 2 Earners | 148 (42.0%) | $0 |
| 3+ Earners | 0 (0.0%) | $0 |
| Total | 352 (100.0%) | $73,057 |
Household Income in Northampton
Household Income Brackets in Northampton
With 148 households falling in the category, the $50,000 to $74,999 income range is the most frequent in Northampton, accounting for 37.9% of all households.
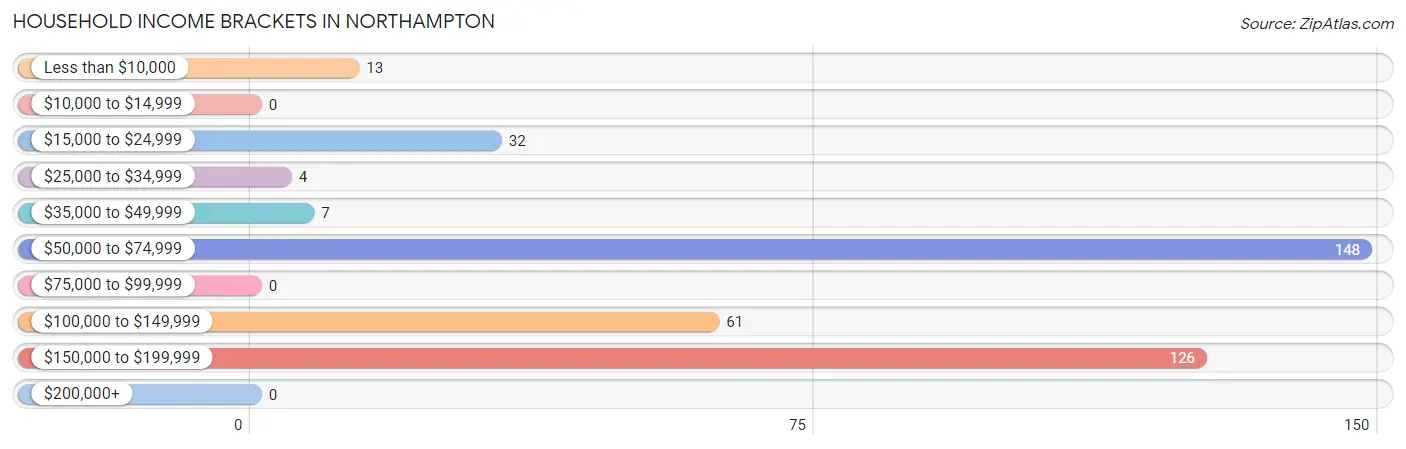
| Income Bracket | # Households | % Households |
| Less than $10,000 | 13 | 3.3% |
| $10,000 to $14,999 | 0 | 0.0% |
| $15,000 to $24,999 | 32 | 8.2% |
| $25,000 to $34,999 | 4 | 1.0% |
| $35,000 to $49,999 | 7 | 1.8% |
| $50,000 to $74,999 | 148 | 37.9% |
| $75,000 to $99,999 | 0 | 0.0% |
| $100,000 to $149,999 | 61 | 15.6% |
| $150,000 to $199,999 | 126 | 32.2% |
| $200,000+ | 0 | 0.0% |
Household Income by Householder Age in Northampton
The median household income in Northampton is $74,856, with the highest median household income of $153,085 found in the 25 to 44 years age bracket for the primary householder. A total of 193 households (49.4%) fall into this category.
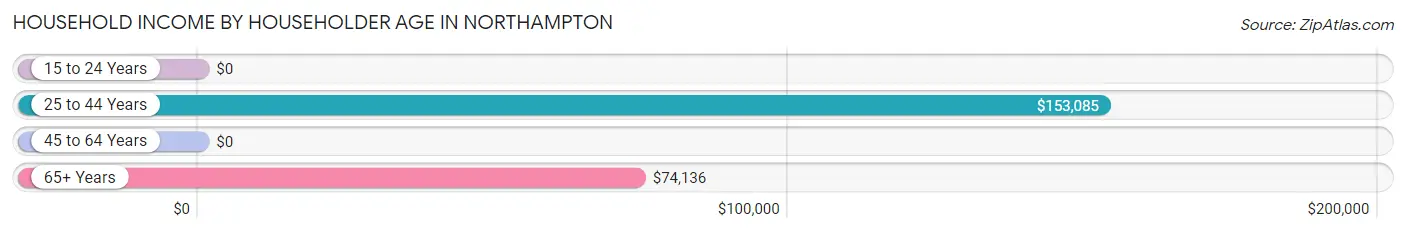
| Income Bracket | # Households | Median Income |
| 15 to 24 Years | 0 (0.0%) | $0 |
| 25 to 44 Years | 193 (49.4%) | $153,085 |
| 45 to 64 Years | 11 (2.8%) | $0 |
| 65+ Years | 187 (47.8%) | $74,136 |
| Total | 391 (100.0%) | $74,856 |
Poverty in Northampton
Income Below Poverty by Sex and Age in Northampton
With 4.6% poverty level for males and 2.1% for females among the residents of Northampton, 35 to 44 year old males and 25 to 34 year old females are the most vulnerable to poverty, with 17 males (9.0%) and 12 females (8.6%) in their respective age groups living below the poverty level.
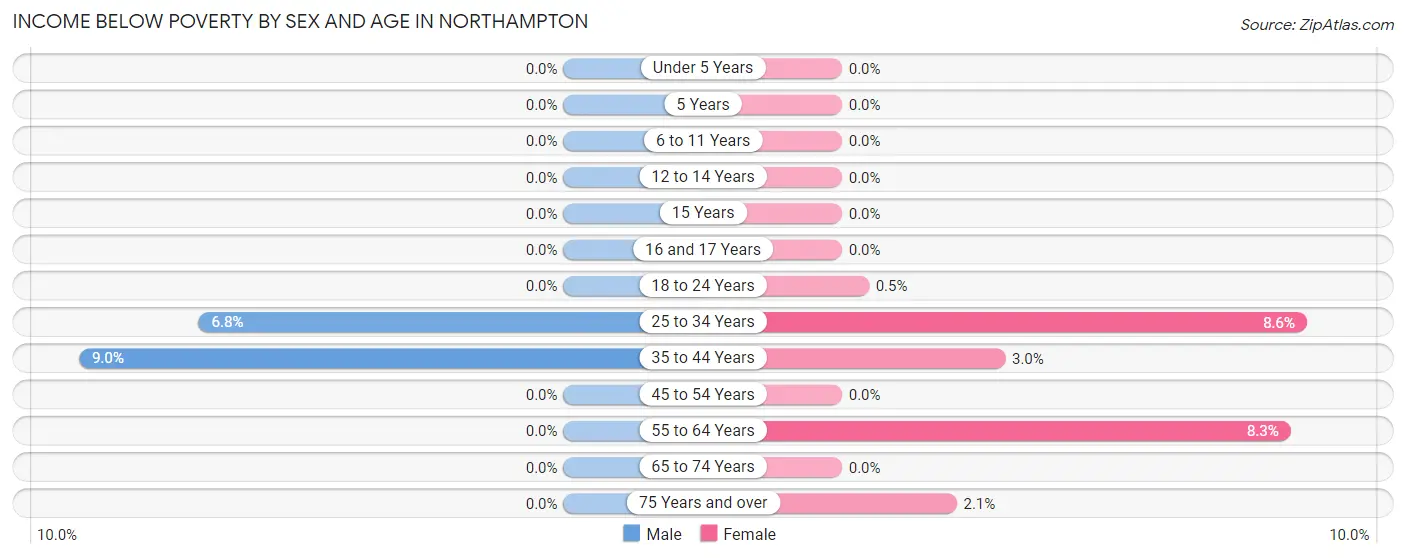
| Age Bracket | Male | Female |
| Under 5 Years | 0 (0.0%) | 0 (0.0%) |
| 5 Years | 0 (0.0%) | 0 (0.0%) |
| 6 to 11 Years | 0 (0.0%) | 0 (0.0%) |
| 12 to 14 Years | 0 (0.0%) | 0 (0.0%) |
| 15 Years | 0 (0.0%) | 0 (0.0%) |
| 16 and 17 Years | 0 (0.0%) | 0 (0.0%) |
| 18 to 24 Years | 0 (0.0%) | 1 (0.5%) |
| 25 to 34 Years | 13 (6.8%) | 12 (8.6%) |
| 35 to 44 Years | 17 (9.0%) | 1 (3.0%) |
| 45 to 54 Years | 0 (0.0%) | 0 (0.0%) |
| 55 to 64 Years | 0 (0.0%) | 1 (8.3%) |
| 65 to 74 Years | 0 (0.0%) | 0 (0.0%) |
| 75 Years and over | 0 (0.0%) | 1 (2.1%) |
| Total | 30 (4.6%) | 16 (2.1%) |
Income Above Poverty by Sex and Age in Northampton
According to the poverty statistics in Northampton, males aged under 5 years and females aged under 5 years are the age groups that are most secure financially, with 100.0% of males and 100.0% of females in these age groups living above the poverty line.
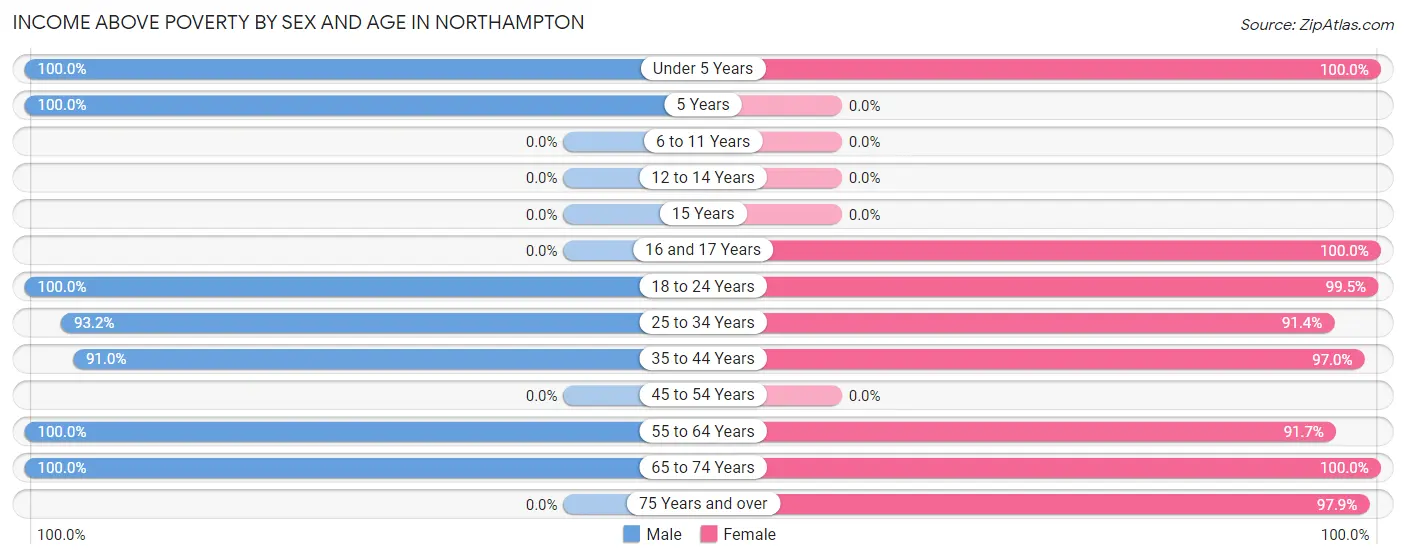
| Age Bracket | Male | Female |
| Under 5 Years | 124 (100.0%) | 140 (100.0%) |
| 5 Years | 66 (100.0%) | 0 (0.0%) |
| 6 to 11 Years | 0 (0.0%) | 0 (0.0%) |
| 12 to 14 Years | 0 (0.0%) | 0 (0.0%) |
| 15 Years | 0 (0.0%) | 0 (0.0%) |
| 16 and 17 Years | 0 (0.0%) | 40 (100.0%) |
| 18 to 24 Years | 31 (100.0%) | 201 (99.5%) |
| 25 to 34 Years | 179 (93.2%) | 127 (91.4%) |
| 35 to 44 Years | 172 (91.0%) | 32 (97.0%) |
| 45 to 54 Years | 0 (0.0%) | 0 (0.0%) |
| 55 to 64 Years | 5 (100.0%) | 11 (91.7%) |
| 65 to 74 Years | 47 (100.0%) | 138 (100.0%) |
| 75 Years and over | 0 (0.0%) | 46 (97.9%) |
| Total | 624 (95.4%) | 735 (97.9%) |
Income Below Poverty Among Married-Couple Families in Northampton
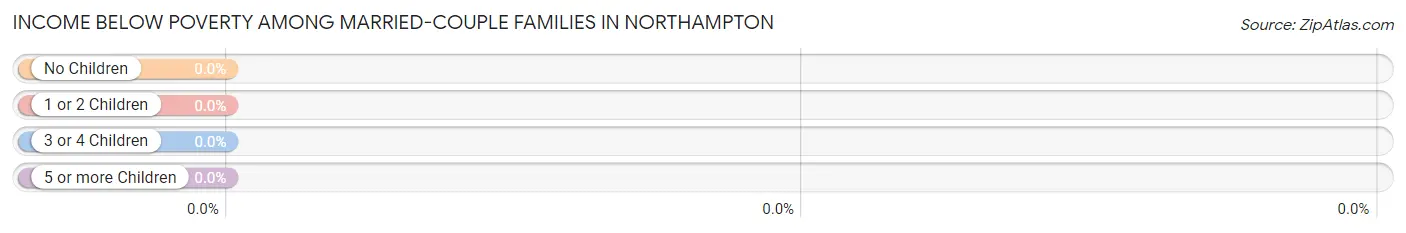
| Children | Above Poverty | Below Poverty |
| No Children | 51 (100.0%) | 0 (0.0%) |
| 1 or 2 Children | 54 (100.0%) | 0 (0.0%) |
| 3 or 4 Children | 0 (0.0%) | 0 (0.0%) |
| 5 or more Children | 0 (0.0%) | 0 (0.0%) |
| Total | 105 (100.0%) | 0 (0.0%) |
Income Below Poverty Among Single-Parent Households in Northampton
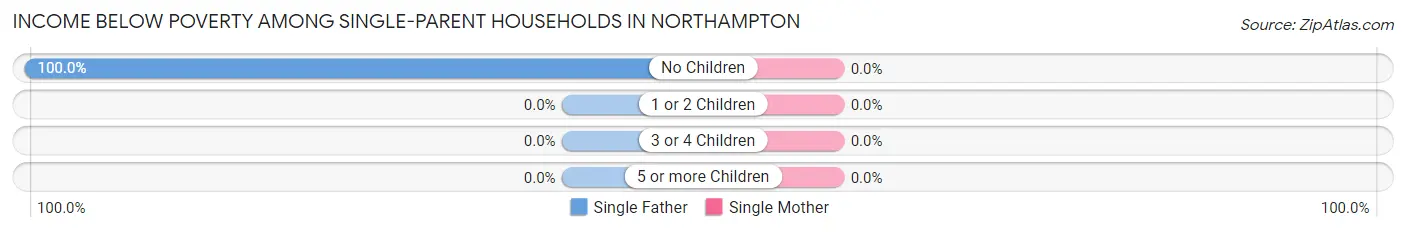
| Children | Single Father | Single Mother |
| No Children | 13 (100.0%) | 0 (0.0%) |
| 1 or 2 Children | 0 (0.0%) | 0 (0.0%) |
| 3 or 4 Children | 0 (0.0%) | 0 (0.0%) |
| 5 or more Children | 0 (0.0%) | 0 (0.0%) |
| Total | 13 (100.0%) | 0 (0.0%) |
Income Below Poverty Among Married-Couple vs Single-Parent Households in Northampton
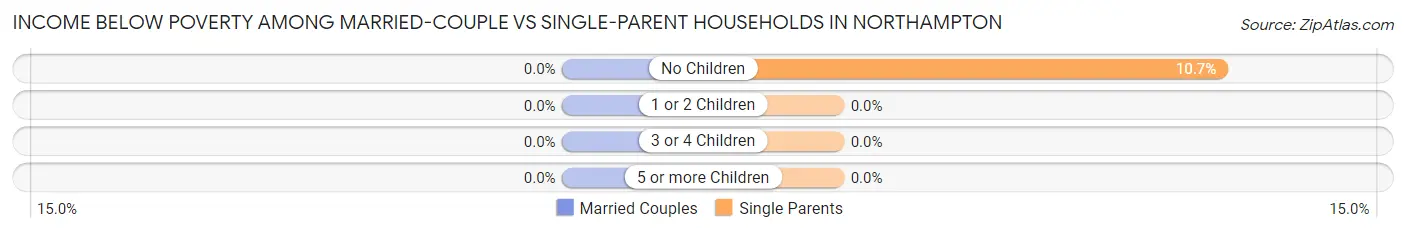
| Children | Married-Couple Families | Single-Parent Households |
| No Children | 0 (0.0%) | 13 (10.7%) |
| 1 or 2 Children | 0 (0.0%) | 0 (0.0%) |
| 3 or 4 Children | 0 (0.0%) | 0 (0.0%) |
| 5 or more Children | 0 (0.0%) | 0 (0.0%) |
| Total | 0 (0.0%) | 13 (5.3%) |
Race in Northampton
The most populous races in Northampton are Black / African American (971 | 69.1%), Hispanic or Latino (297 | 21.1%), and Some other Race (284 | 20.2%).
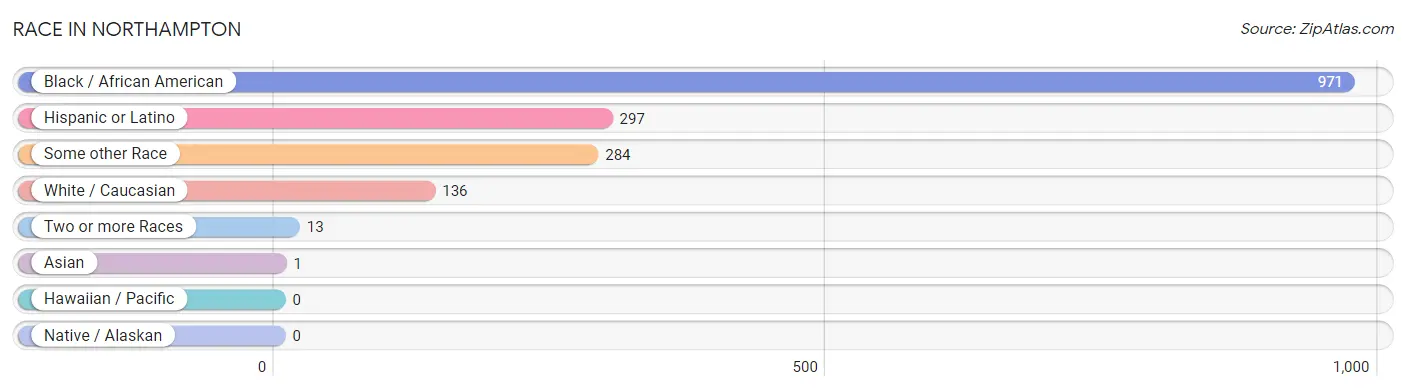
| Race | # Population | % Population |
| Asian | 1 | 0.1% |
| Black / African American | 971 | 69.1% |
| Hawaiian / Pacific | 0 | 0.0% |
| Hispanic or Latino | 297 | 21.1% |
| Native / Alaskan | 0 | 0.0% |
| White / Caucasian | 136 | 9.7% |
| Two or more Races | 13 | 0.9% |
| Some other Race | 284 | 20.2% |
| Total | 1,405 | 100.0% |
Ancestry in Northampton
The most populous ancestries reported in Northampton are Central American (297 | 21.1%), Honduran (170 | 12.1%), Guatemalan (85 | 6.0%), Irish (67 | 4.8%), and German (56 | 4.0%), together accounting for 48.1% of all Northampton residents.
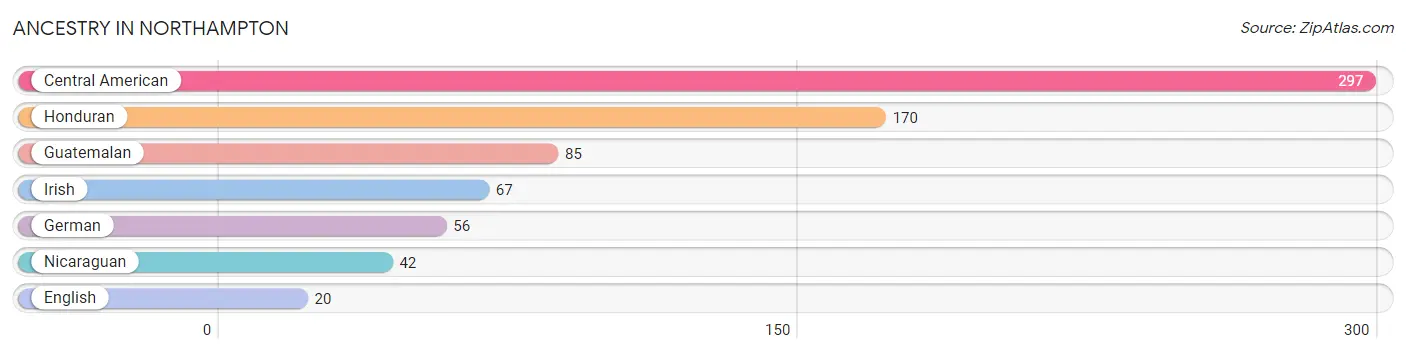
| Ancestry | # Population | % Population |
| Central American | 297 | 21.1% |
| English | 20 | 1.4% |
| German | 56 | 4.0% |
| Guatemalan | 85 | 6.0% |
| Honduran | 170 | 12.1% |
| Irish | 67 | 4.8% |
| Nicaraguan | 42 | 3.0% | View All 7 Rows |
Immigrants in Northampton
The most numerous immigrant groups reported in Northampton came from Central America (297 | 21.1%), Latin America (297 | 21.1%), Honduras (170 | 12.1%), Guatemala (85 | 6.0%), and Nicaragua (42 | 3.0%), together accounting for 63.4% of all Northampton residents.
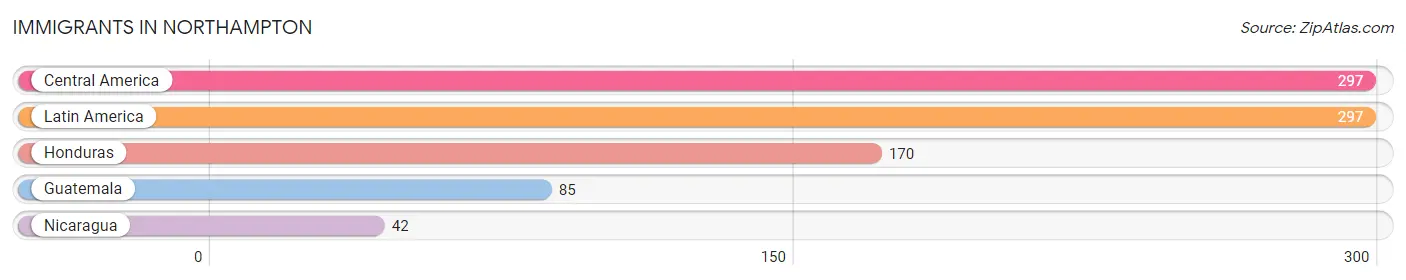
| Immigration Origin | # Population | % Population |
| Central America | 297 | 21.1% |
| Guatemala | 85 | 6.0% |
| Honduras | 170 | 12.1% |
| Latin America | 297 | 21.1% |
| Nicaragua | 42 | 3.0% | View All 5 Rows |
Sex and Age in Northampton
Sex and Age in Northampton
The most populous age groups in Northampton are 30 to 34 Years (179 | 27.4%) for men and 20 to 24 Years (202 | 26.9%) for women.
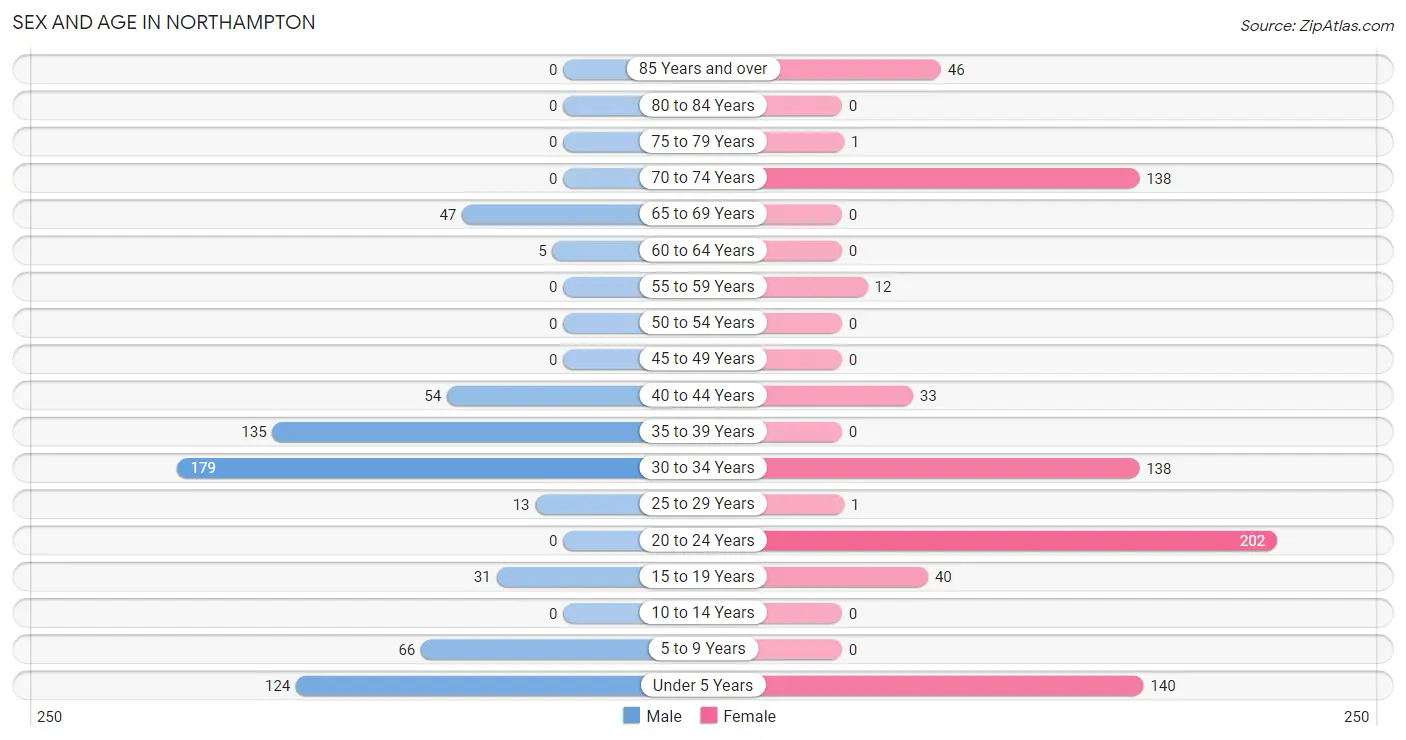
| Age Bracket | Male | Female |
| Under 5 Years | 124 (19.0%) | 140 (18.6%) |
| 5 to 9 Years | 66 (10.1%) | 0 (0.0%) |
| 10 to 14 Years | 0 (0.0%) | 0 (0.0%) |
| 15 to 19 Years | 31 (4.7%) | 40 (5.3%) |
| 20 to 24 Years | 0 (0.0%) | 202 (26.9%) |
| 25 to 29 Years | 13 (2.0%) | 1 (0.1%) |
| 30 to 34 Years | 179 (27.4%) | 138 (18.4%) |
| 35 to 39 Years | 135 (20.6%) | 0 (0.0%) |
| 40 to 44 Years | 54 (8.3%) | 33 (4.4%) |
| 45 to 49 Years | 0 (0.0%) | 0 (0.0%) |
| 50 to 54 Years | 0 (0.0%) | 0 (0.0%) |
| 55 to 59 Years | 0 (0.0%) | 12 (1.6%) |
| 60 to 64 Years | 5 (0.8%) | 0 (0.0%) |
| 65 to 69 Years | 47 (7.2%) | 0 (0.0%) |
| 70 to 74 Years | 0 (0.0%) | 138 (18.4%) |
| 75 to 79 Years | 0 (0.0%) | 1 (0.1%) |
| 80 to 84 Years | 0 (0.0%) | 0 (0.0%) |
| 85 Years and over | 0 (0.0%) | 46 (6.1%) |
| Total | 654 (100.0%) | 751 (100.0%) |
Families and Households in Northampton
Median Family Size in Northampton
The median family size in Northampton is 3.53 persons per family, with single female/mother families (234 | 66.5%) accounting for the largest median family size of 3.62 persons per family. On the other hand, single male/father families (13 | 3.7%) represent the smallest median family size with 3.23 persons per family.
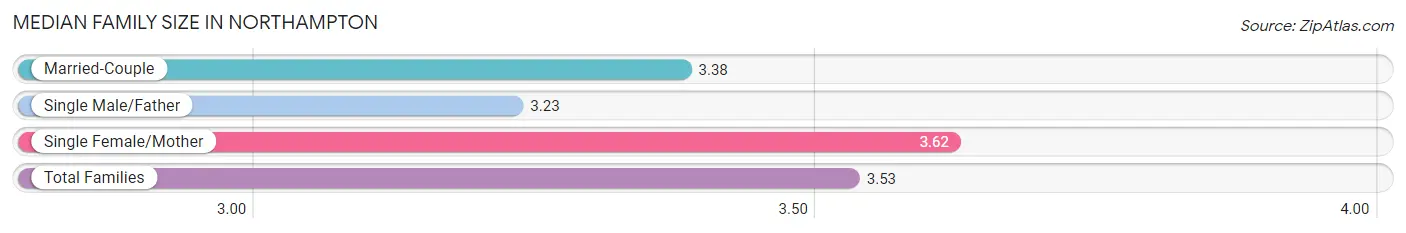
| Family Type | # Families | Family Size |
| Married-Couple | 105 (29.8%) | 3.38 |
| Single Male/Father | 13 (3.7%) | 3.23 |
| Single Female/Mother | 234 (66.5%) | 3.62 |
| Total Families | 352 (100.0%) | 3.53 |
Median Household Size in Northampton
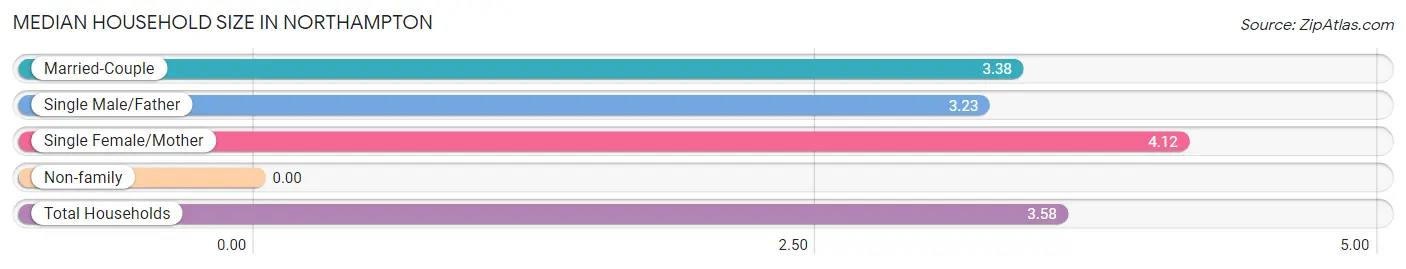
| Household Type | # Households | Household Size |
| Married-Couple | 105 (26.9%) | 3.38 |
| Single Male/Father | 13 (3.3%) | 3.23 |
| Single Female/Mother | 234 (59.9%) | 4.12 |
| Non-family | 39 (10.0%) | - |
| Total Households | 391 (100.0%) | 3.58 |
Household Size by Marriage Status in Northampton
Out of a total of 391 households in Northampton, 352 (90.0%) are family households, while 39 (10.0%) are nonfamily households. The most numerous type of family households are 4-person households, comprising 126, and the most common type of nonfamily households are 1-person households, comprising 39.
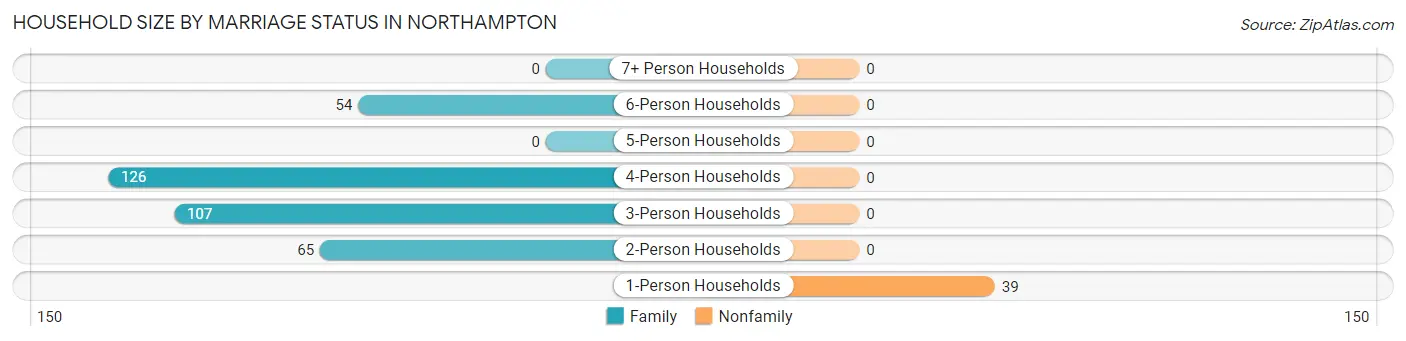
| Household Size | Family Households | Nonfamily Households |
| 1-Person Households | - | 39 (10.0%) |
| 2-Person Households | 65 (16.6%) | 0 (0.0%) |
| 3-Person Households | 107 (27.4%) | 0 (0.0%) |
| 4-Person Households | 126 (32.2%) | 0 (0.0%) |
| 5-Person Households | 0 (0.0%) | 0 (0.0%) |
| 6-Person Households | 54 (13.8%) | 0 (0.0%) |
| 7+ Person Households | 0 (0.0%) | 0 (0.0%) |
| Total | 352 (90.0%) | 39 (10.0%) |
Female Fertility in Northampton
Fertility by Age in Northampton
Average fertility rate in Northampton is 304.0 births per 1,000 women. Women in the age bracket of 20 to 34 years have the highest fertility rate with 370.0 births per 1,000 women. Women in the age bracket of 20 to 34 years acount for 100.0% of all women with births.
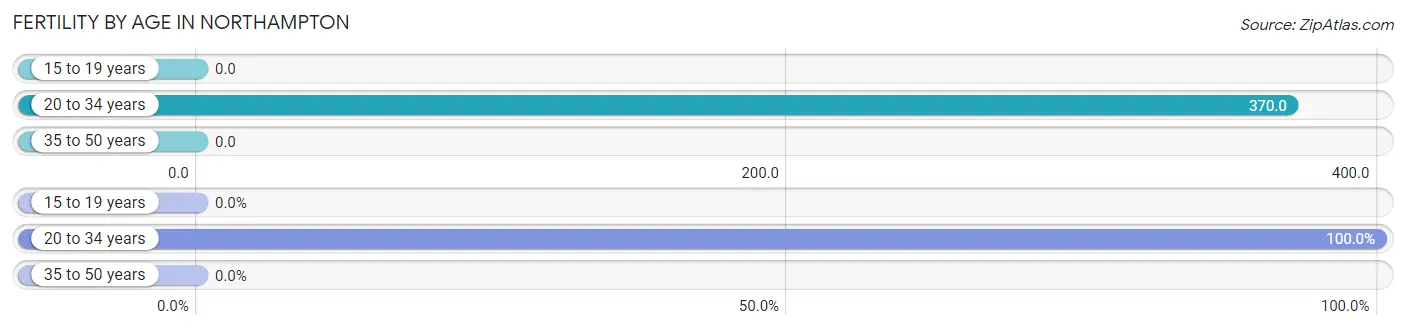
| Age Bracket | Women with Births | Births / 1,000 Women |
| 15 to 19 years | 0 (0.0%) | 0.0 |
| 20 to 34 years | 126 (100.0%) | 370.0 |
| 35 to 50 years | 0 (0.0%) | 0.0 |
| Total | 126 (100.0%) | 304.0 |
Fertility by Age by Marriage Status in Northampton
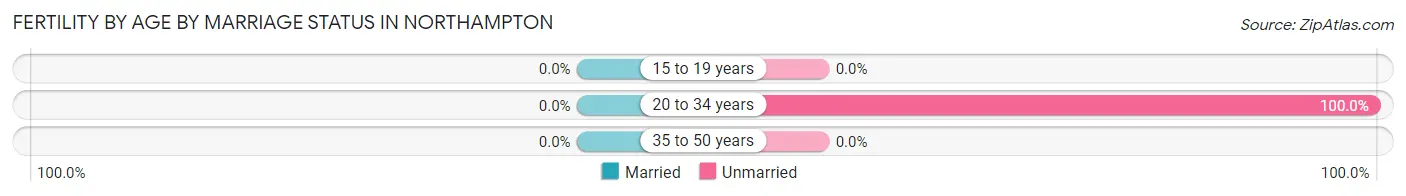
| Age Bracket | Married | Unmarried |
| 15 to 19 years | 0 (0.0%) | 0 (0.0%) |
| 20 to 34 years | 0 (0.0%) | 126 (100.0%) |
| 35 to 50 years | 0 (0.0%) | 0 (0.0%) |
| Total | 0 (0.0%) | 126 (100.0%) |
Fertility by Education in Northampton
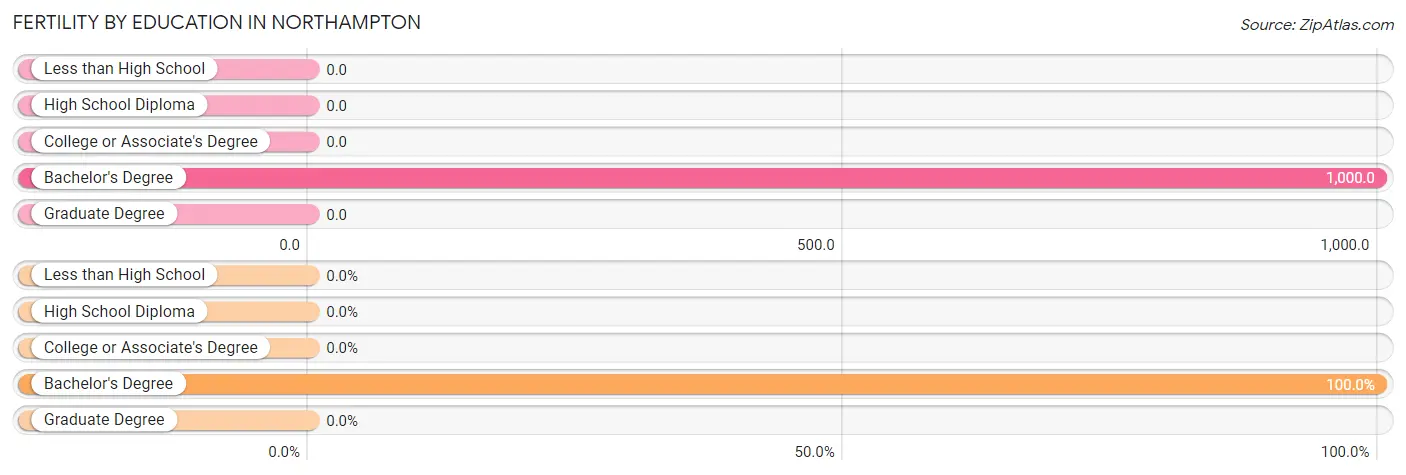
| Educational Attainment | Women with Births | Births / 1,000 Women |
| Less than High School | 0 (0.0%) | 0.0 |
| High School Diploma | 0 (0.0%) | 0.0 |
| College or Associate's Degree | 0 (0.0%) | 0.0 |
| Bachelor's Degree | 126 (100.0%) | 1,000.0 |
| Graduate Degree | 0 (0.0%) | 0.0 |
| Total | 126 (100.0%) | 304.0 |
Fertility by Education by Marriage Status in Northampton
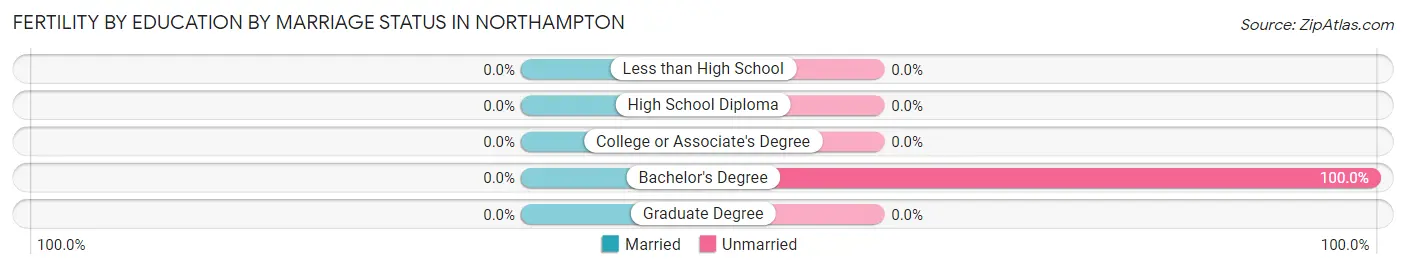
| Educational Attainment | Married | Unmarried |
| Less than High School | 0 (0.0%) | 0 (0.0%) |
| High School Diploma | 0 (0.0%) | 0 (0.0%) |
| College or Associate's Degree | 0 (0.0%) | 0 (0.0%) |
| Bachelor's Degree | 0 (0.0%) | 126 (100.0%) |
| Graduate Degree | 0 (0.0%) | 0 (0.0%) |
| Total | 0 (0.0%) | 126 (100.0%) |
Employment Characteristics in Northampton
Employment by Class of Employer in Northampton
Among the 484 employed individuals in Northampton, not-for-profit organizations (152 | 31.4%), state government employees (133 | 27.5%), and self-employed (not incorporated) (118 | 24.4%) make up the most common classes of employment.
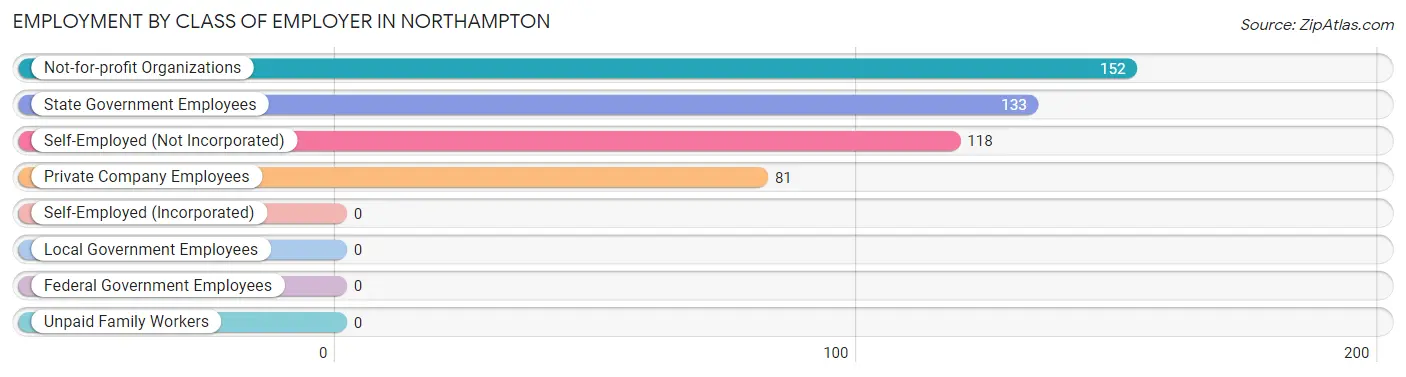
| Employer Class | # Employees | % Employees |
| Private Company Employees | 81 | 16.7% |
| Self-Employed (Incorporated) | 0 | 0.0% |
| Self-Employed (Not Incorporated) | 118 | 24.4% |
| Not-for-profit Organizations | 152 | 31.4% |
| Local Government Employees | 0 | 0.0% |
| State Government Employees | 133 | 27.5% |
| Federal Government Employees | 0 | 0.0% |
| Unpaid Family Workers | 0 | 0.0% |
| Total | 484 | 100.0% |
Employment Status by Age in Northampton
According to the labor force statistics for Northampton, out of the total population over 16 years of age (1,075), 48.4% or 520 individuals are in the labor force, with 6.9% or 36 of them unemployed. The age group with the highest labor force participation rate is 60 to 64 years, with 100.0% or 5 individuals in the labor force. Within the labor force, the 16 to 19 years age range has the highest percentage of unemployed individuals, with 100.0% or 31 of them being unemployed.
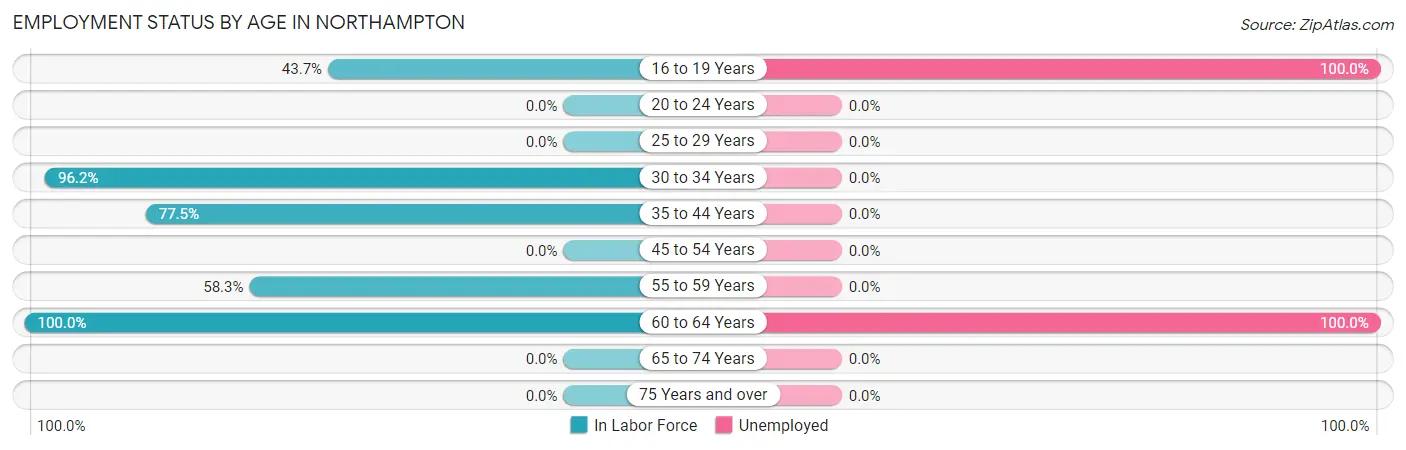
| Age Bracket | In Labor Force | Unemployed |
| 16 to 19 Years | 31 (43.7%) | 31 (100.0%) |
| 20 to 24 Years | 0 (0.0%) | 0 (0.0%) |
| 25 to 29 Years | 0 (0.0%) | 0 (0.0%) |
| 30 to 34 Years | 305 (96.2%) | 0 (0.0%) |
| 35 to 44 Years | 172 (77.5%) | 0 (0.0%) |
| 45 to 54 Years | 0 (0.0%) | 0 (0.0%) |
| 55 to 59 Years | 7 (58.3%) | 0 (0.0%) |
| 60 to 64 Years | 5 (100.0%) | 5 (100.0%) |
| 65 to 74 Years | 0 (0.0%) | 0 (0.0%) |
| 75 Years and over | 0 (0.0%) | 0 (0.0%) |
| Total | 520 (48.4%) | 36 (6.9%) |
Employment Status by Educational Attainment in Northampton
According to labor force statistics for Northampton, 85.8% of individuals (489) out of the total population between 25 and 64 years of age (570) are in the labor force, with 1.0% or 5 of them being unemployed. The group with the highest labor force participation rate are those with the educational attainment of bachelor's degree or higher, with 100.0% or 153 individuals in the labor force. Within the labor force, individuals with less than high school education have the highest percentage of unemployment, with 8.5% or 5 of them being unemployed.
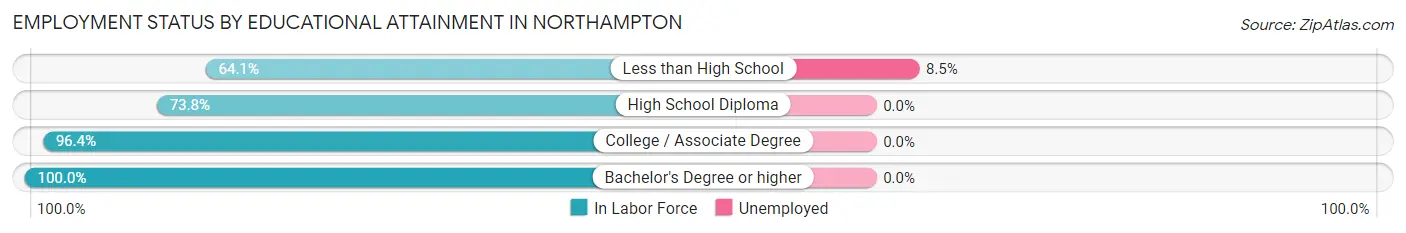
| Educational Attainment | In Labor Force | Unemployed |
| Less than High School | 59 (64.1%) | 8 (8.5%) |
| High School Diploma | 118 (73.8%) | 0 (0.0%) |
| College / Associate Degree | 159 (96.4%) | 0 (0.0%) |
| Bachelor's Degree or higher | 153 (100.0%) | 0 (0.0%) |
| Total | 489 (85.8%) | 6 (1.0%) |
Employment Occupations by Sex in Northampton
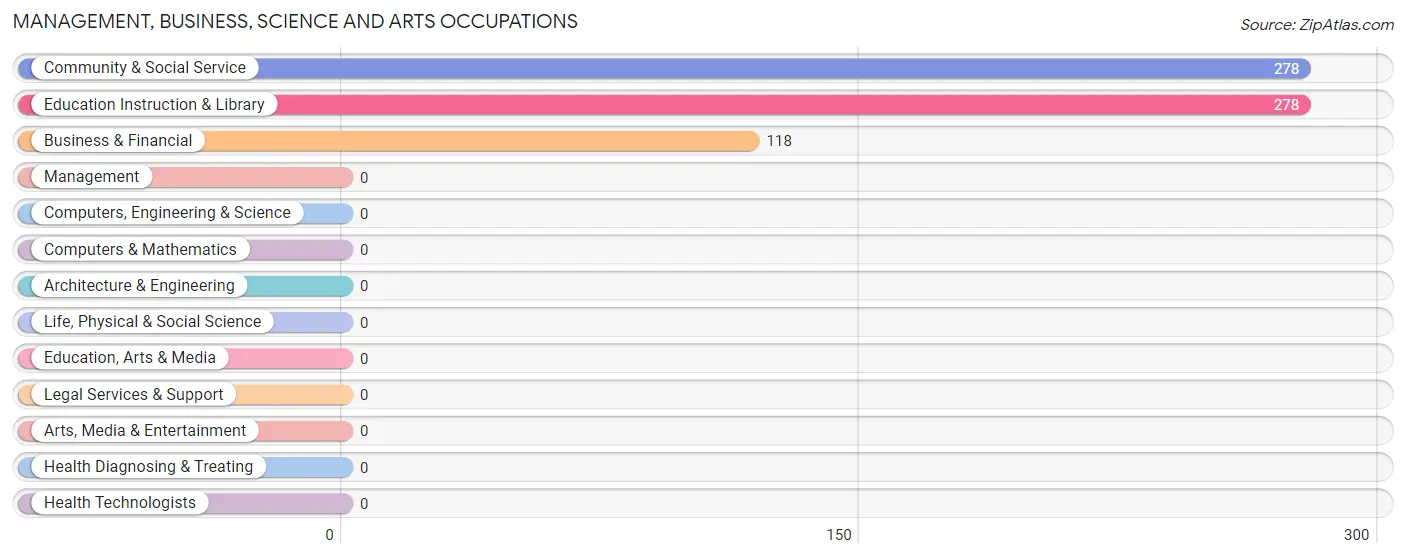
Management, Business, Science and Arts Occupations
The most common Management, Business, Science and Arts occupations in Northampton are Community & Social Service (278 | 57.4%), Education Instruction & Library (278 | 57.4%), and Business & Financial (118 | 24.4%).
Management, Business, Science and Arts Occupations by Sex
Within the Management, Business, Science and Arts occupations in Northampton, the most male-oriented occupations are Business & Financial (100.0%), Community & Social Service (54.7%), and Education Instruction & Library (54.7%), while the most female-oriented occupations are Community & Social Service (45.3%), and Education Instruction & Library (45.3%).
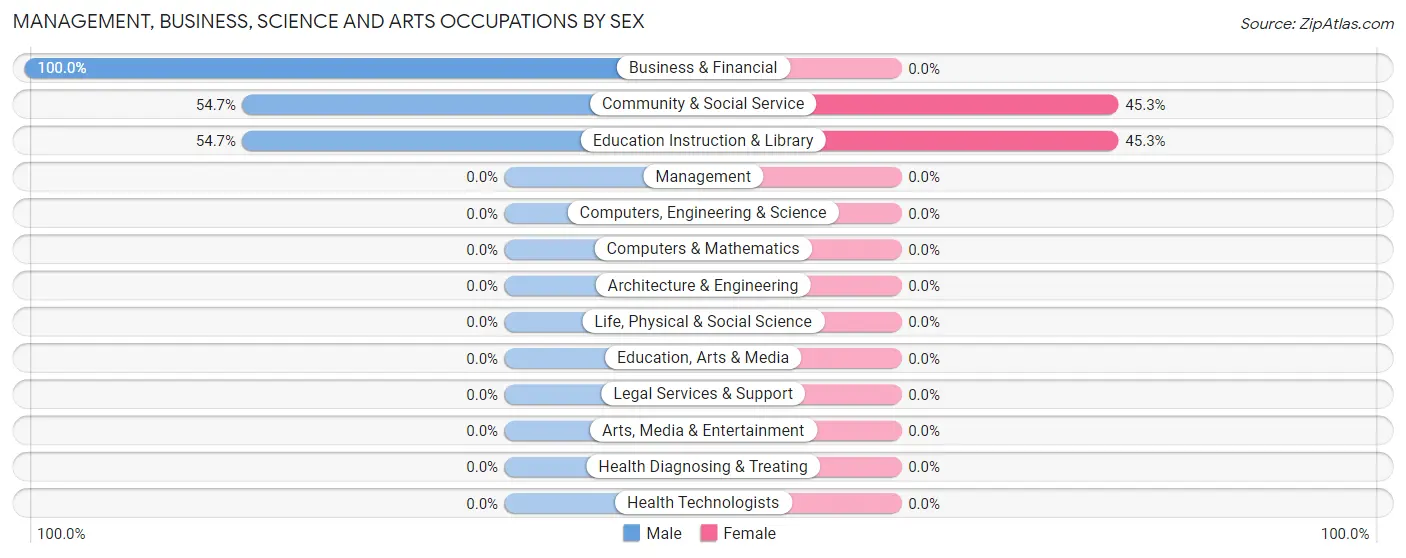
| Occupation | Male | Female |
| Management | 0 (0.0%) | 0 (0.0%) |
| Business & Financial | 118 (100.0%) | 0 (0.0%) |
| Computers, Engineering & Science | 0 (0.0%) | 0 (0.0%) |
| Computers & Mathematics | 0 (0.0%) | 0 (0.0%) |
| Architecture & Engineering | 0 (0.0%) | 0 (0.0%) |
| Life, Physical & Social Science | 0 (0.0%) | 0 (0.0%) |
| Community & Social Service | 152 (54.7%) | 126 (45.3%) |
| Education, Arts & Media | 0 (0.0%) | 0 (0.0%) |
| Legal Services & Support | 0 (0.0%) | 0 (0.0%) |
| Education Instruction & Library | 152 (54.7%) | 126 (45.3%) |
| Arts, Media & Entertainment | 0 (0.0%) | 0 (0.0%) |
| Health Diagnosing & Treating | 0 (0.0%) | 0 (0.0%) |
| Health Technologists | 0 (0.0%) | 0 (0.0%) |
| Total (Category) | 270 (68.2%) | 126 (31.8%) |
| Total (Overall) | 351 (72.5%) | 133 (27.5%) |
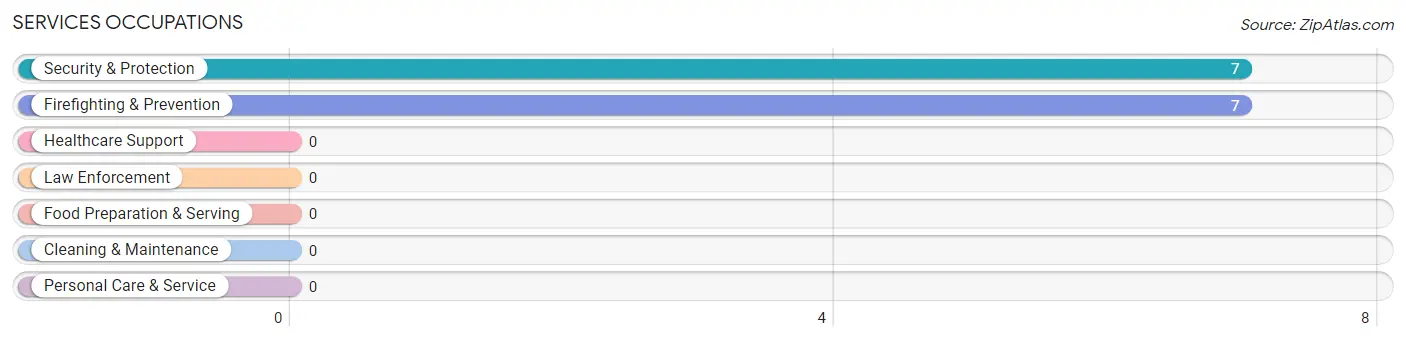
Services Occupations
The most common Services occupations in Northampton are Security & Protection (7 | 1.5%), and Firefighting & Prevention (7 | 1.5%).
Services Occupations by Sex
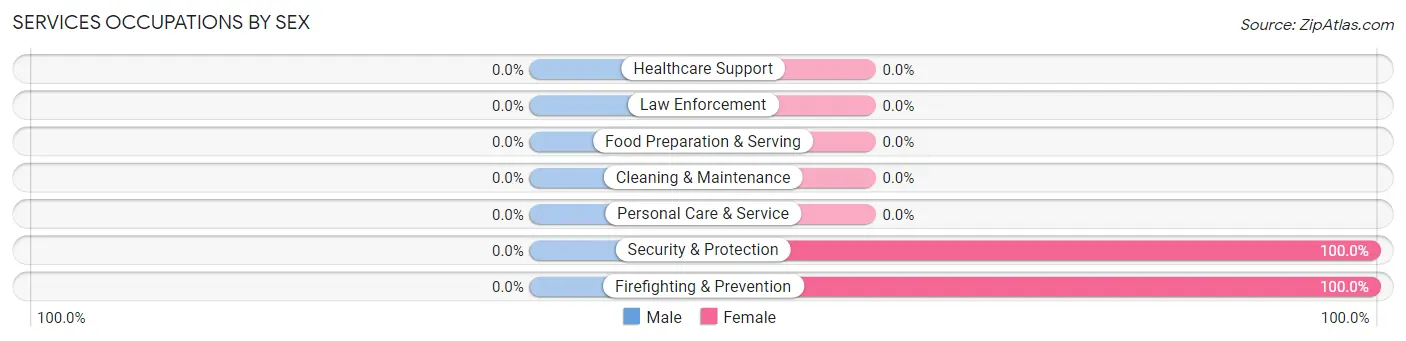
| Occupation | Male | Female |
| Healthcare Support | 0 (0.0%) | 0 (0.0%) |
| Security & Protection | 0 (0.0%) | 7 (100.0%) |
| Firefighting & Prevention | 0 (0.0%) | 7 (100.0%) |
| Law Enforcement | 0 (0.0%) | 0 (0.0%) |
| Food Preparation & Serving | 0 (0.0%) | 0 (0.0%) |
| Cleaning & Maintenance | 0 (0.0%) | 0 (0.0%) |
| Personal Care & Service | 0 (0.0%) | 0 (0.0%) |
| Total (Category) | 0 (0.0%) | 7 (100.0%) |
| Total (Overall) | 351 (72.5%) | 133 (27.5%) |
Sales and Office Occupations
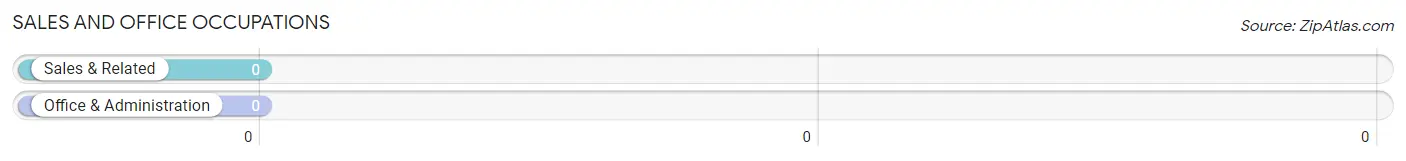
Sales and Office Occupations by Sex
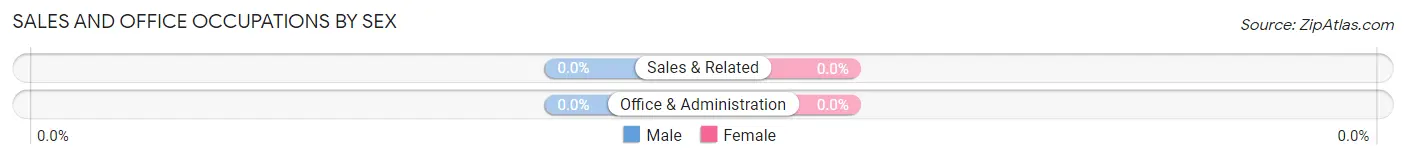
| Occupation | Male | Female |
| Sales & Related | 0 (0.0%) | 0 (0.0%) |
| Office & Administration | 0 (0.0%) | 0 (0.0%) |
| Total (Category) | 0 (0.0%) | 0 (0.0%) |
| Total (Overall) | 351 (72.5%) | 133 (27.5%) |
Natural Resources, Construction and Maintenance Occupations
The most common Natural Resources, Construction and Maintenance occupations in Northampton are , and Construction & Extraction (54 | 11.2%).
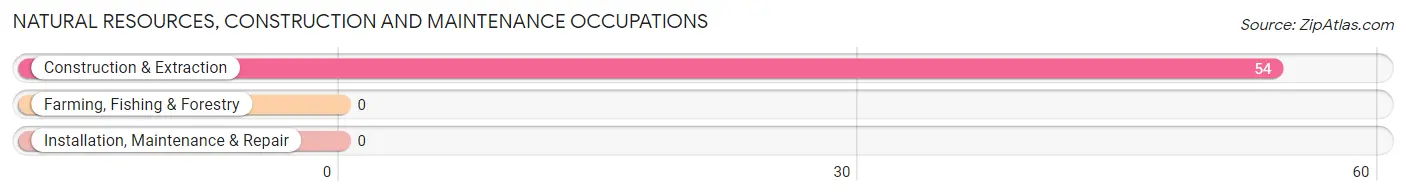
Natural Resources, Construction and Maintenance Occupations by Sex
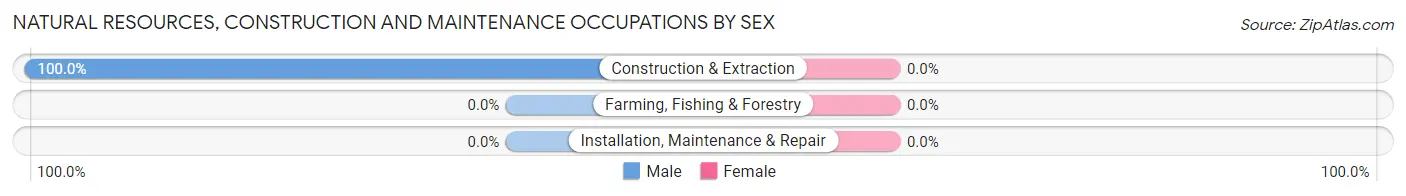
| Occupation | Male | Female |
| Farming, Fishing & Forestry | 0 (0.0%) | 0 (0.0%) |
| Construction & Extraction | 54 (100.0%) | 0 (0.0%) |
| Installation, Maintenance & Repair | 0 (0.0%) | 0 (0.0%) |
| Total (Category) | 54 (100.0%) | 0 (0.0%) |
| Total (Overall) | 351 (72.5%) | 133 (27.5%) |
Production, Transportation and Moving Occupations
The most common Production, Transportation and Moving occupations in Northampton are , and Material Moving (27 | 5.6%).
Production, Transportation and Moving Occupations by Sex
| Occupation | Male | Female |
| Production | 0 (0.0%) | 0 (0.0%) |
| Transportation | 0 (0.0%) | 0 (0.0%) |
| Material Moving | 27 (100.0%) | 0 (0.0%) |
| Total (Category) | 27 (100.0%) | 0 (0.0%) |
| Total (Overall) | 351 (72.5%) | 133 (27.5%) |
Employment Industries by Sex in Northampton
Employment Industries in Northampton
The major employment industries in Northampton include Educational Services (285 | 58.9%), Arts, Entertainment & Recreation (118 | 24.4%), Construction (54 | 11.2%), and Transportation & Warehousing (27 | 5.6%).
Employment Industries by Sex in Northampton
| Industry | Male | Female |
| Agriculture, Fishing & Hunting | 0 (0.0%) | 0 (0.0%) |
| Mining, Quarrying, & Extraction | 0 (0.0%) | 0 (0.0%) |
| Construction | 54 (100.0%) | 0 (0.0%) |
| Manufacturing | 0 (0.0%) | 0 (0.0%) |
| Wholesale Trade | 0 (0.0%) | 0 (0.0%) |
| Retail Trade | 0 (0.0%) | 0 (0.0%) |
| Transportation & Warehousing | 27 (100.0%) | 0 (0.0%) |
| Utilities | 0 (0.0%) | 0 (0.0%) |
| Information | 0 (0.0%) | 0 (0.0%) |
| Finance & Insurance | 0 (0.0%) | 0 (0.0%) |
| Real Estate, Rental & Leasing | 0 (0.0%) | 0 (0.0%) |
| Professional & Scientific | 0 (0.0%) | 0 (0.0%) |
| Enterprise Management | 0 (0.0%) | 0 (0.0%) |
| Administrative & Support | 0 (0.0%) | 0 (0.0%) |
| Educational Services | 152 (53.3%) | 133 (46.7%) |
| Health Care & Social Assistance | 0 (0.0%) | 0 (0.0%) |
| Arts, Entertainment & Recreation | 118 (100.0%) | 0 (0.0%) |
| Accommodation & Food Services | 0 (0.0%) | 0 (0.0%) |
| Public Administration | 0 (0.0%) | 0 (0.0%) |
| Total | 351 (72.5%) | 133 (27.5%) |
Education in Northampton
School Enrollment in Northampton
The most common levels of schooling among the 422 students in Northampton are college / undergraduate (176 | 41.7%), nursery / preschool (140 | 33.2%), and kindergarten (66 | 15.6%).
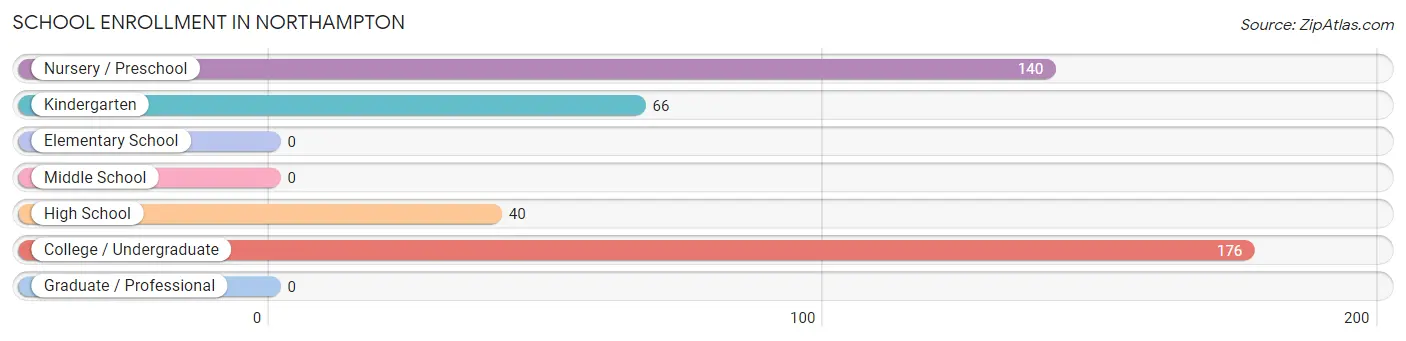
| School Level | # Students | % Students |
| Nursery / Preschool | 140 | 33.2% |
| Kindergarten | 66 | 15.6% |
| Elementary School | 0 | 0.0% |
| Middle School | 0 | 0.0% |
| High School | 40 | 9.5% |
| College / Undergraduate | 176 | 41.7% |
| Graduate / Professional | 0 | 0.0% |
| Total | 422 | 100.0% |
School Enrollment by Age by Funding Source in Northampton
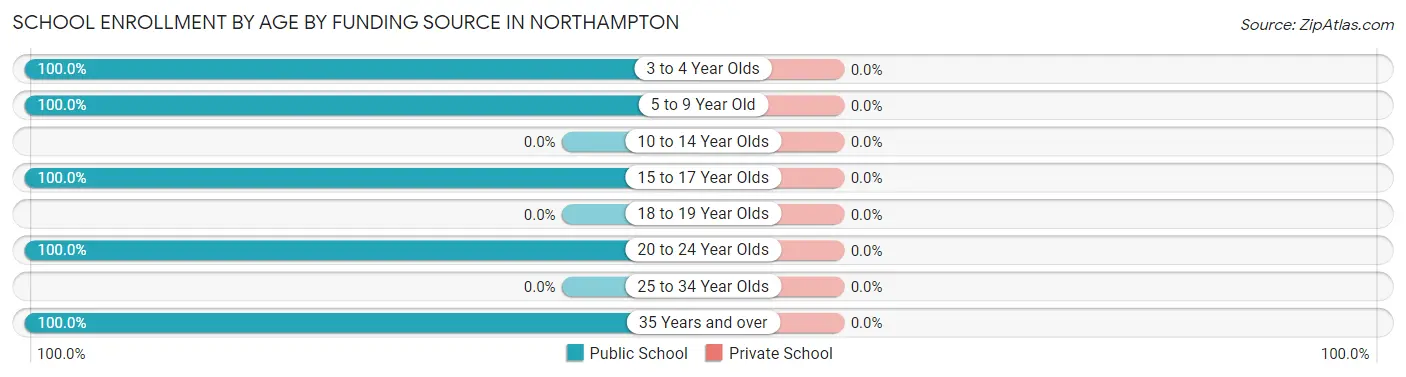
| Age Bracket | Public School | Private School |
| 3 to 4 Year Olds | 140 (100.0%) | 0 (0.0%) |
| 5 to 9 Year Old | 66 (100.0%) | 0 (0.0%) |
| 10 to 14 Year Olds | 0 (0.0%) | 0 (0.0%) |
| 15 to 17 Year Olds | 40 (100.0%) | 0 (0.0%) |
| 18 to 19 Year Olds | 0 (0.0%) | 0 (0.0%) |
| 20 to 24 Year Olds | 169 (100.0%) | 0 (0.0%) |
| 25 to 34 Year Olds | 0 (0.0%) | 0 (0.0%) |
| 35 Years and over | 7 (100.0%) | 0 (0.0%) |
| Total | 422 (100.0%) | 0 (0.0%) |
Educational Attainment by Field of Study in Northampton
Education (126 | 51.6%), visual & performing arts (47 | 19.3%), multidisciplinary studies (44 | 18.0%), and social sciences (27 | 11.1%) are the most common fields of study among 244 individuals in Northampton who have obtained a bachelor's degree or higher.
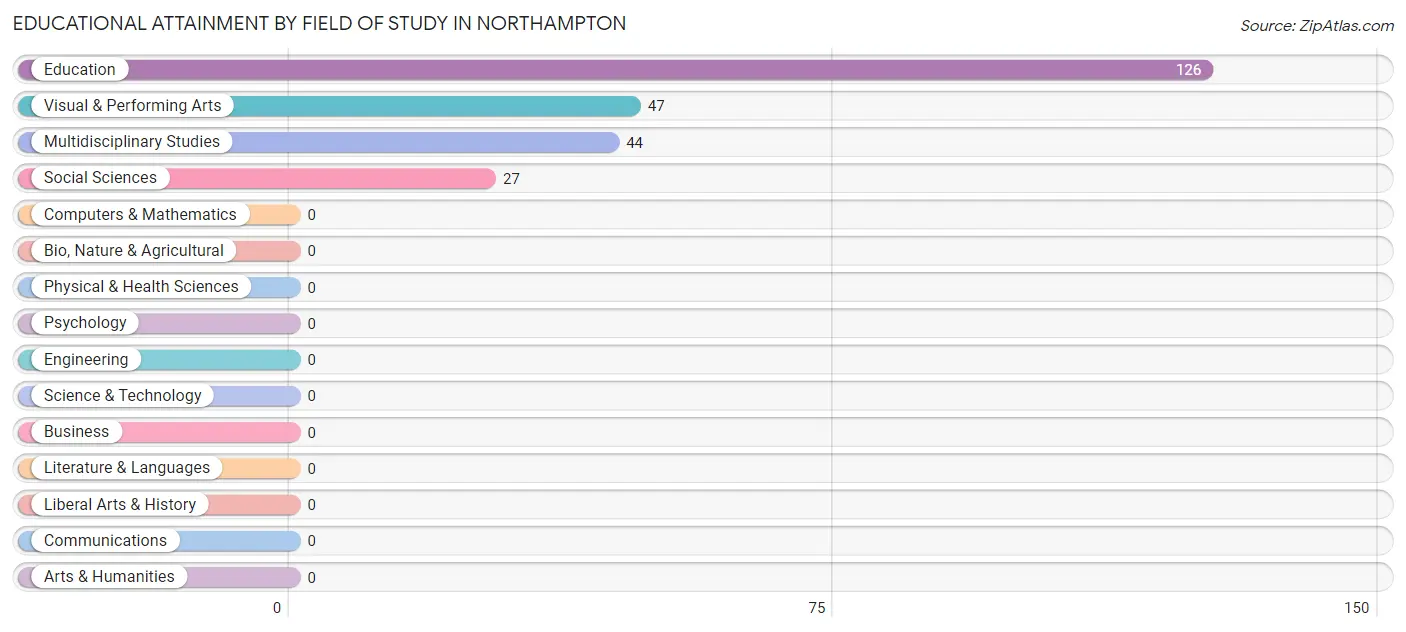
| Field of Study | # Graduates | % Graduates |
| Computers & Mathematics | 0 | 0.0% |
| Bio, Nature & Agricultural | 0 | 0.0% |
| Physical & Health Sciences | 0 | 0.0% |
| Psychology | 0 | 0.0% |
| Social Sciences | 27 | 11.1% |
| Engineering | 0 | 0.0% |
| Multidisciplinary Studies | 44 | 18.0% |
| Science & Technology | 0 | 0.0% |
| Business | 0 | 0.0% |
| Education | 126 | 51.6% |
| Literature & Languages | 0 | 0.0% |
| Liberal Arts & History | 0 | 0.0% |
| Visual & Performing Arts | 47 | 19.3% |
| Communications | 0 | 0.0% |
| Arts & Humanities | 0 | 0.0% |
| Total | 244 | 100.0% |
Transportation & Commute in Northampton
Vehicle Availability by Sex in Northampton
The most prevalent vehicle ownership categories in Northampton are males with 2 vehicles (233, accounting for 66.4%) and females with 2 vehicles (0, making up 175.2%).
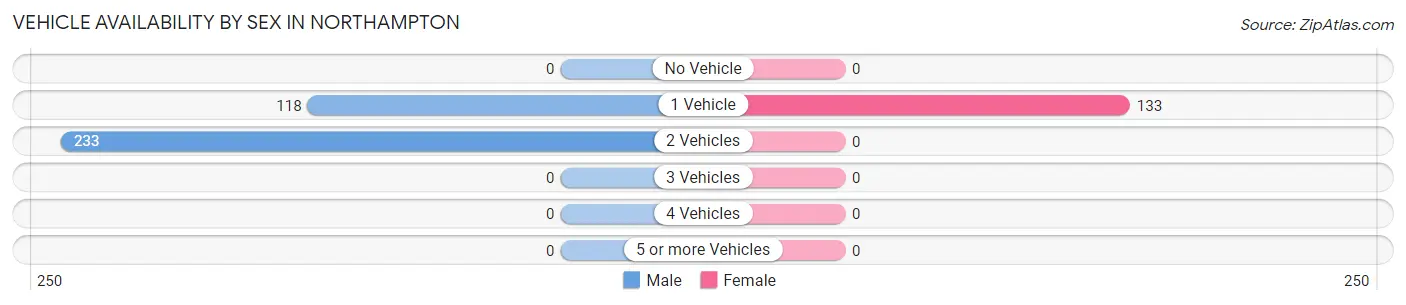
| Vehicles Available | Male | Female |
| No Vehicle | 0 (0.0%) | 0 (0.0%) |
| 1 Vehicle | 118 (33.6%) | 133 (100.0%) |
| 2 Vehicles | 233 (66.4%) | 0 (0.0%) |
| 3 Vehicles | 0 (0.0%) | 0 (0.0%) |
| 4 Vehicles | 0 (0.0%) | 0 (0.0%) |
| 5 or more Vehicles | 0 (0.0%) | 0 (0.0%) |
| Total | 351 (100.0%) | 133 (100.0%) |
Commute Time in Northampton
The most frequently occuring commute durations in Northampton are 60 to 89 minutes (152 commuters, 43.3%), 5 to 9 minutes (118 commuters, 33.6%), and 90 or more minutes (54 commuters, 15.4%).
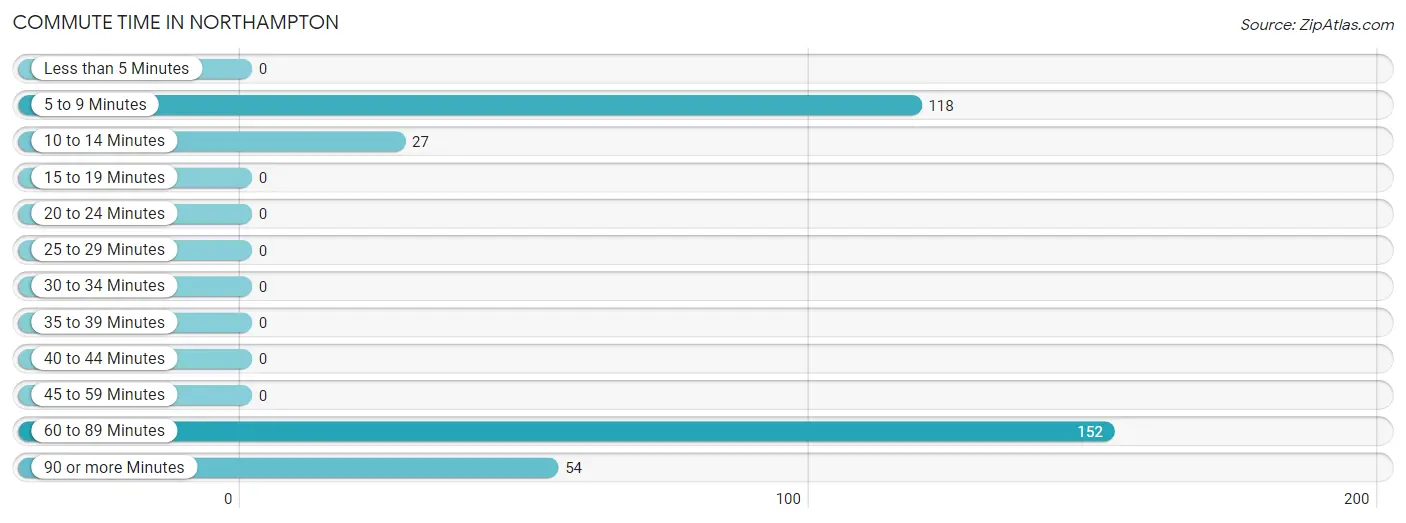
| Commute Time | # Commuters | % Commuters |
| Less than 5 Minutes | 0 | 0.0% |
| 5 to 9 Minutes | 118 | 33.6% |
| 10 to 14 Minutes | 27 | 7.7% |
| 15 to 19 Minutes | 0 | 0.0% |
| 20 to 24 Minutes | 0 | 0.0% |
| 25 to 29 Minutes | 0 | 0.0% |
| 30 to 34 Minutes | 0 | 0.0% |
| 35 to 39 Minutes | 0 | 0.0% |
| 40 to 44 Minutes | 0 | 0.0% |
| 45 to 59 Minutes | 0 | 0.0% |
| 60 to 89 Minutes | 152 | 43.3% |
| 90 or more Minutes | 54 | 15.4% |
Commute Time by Sex in Northampton
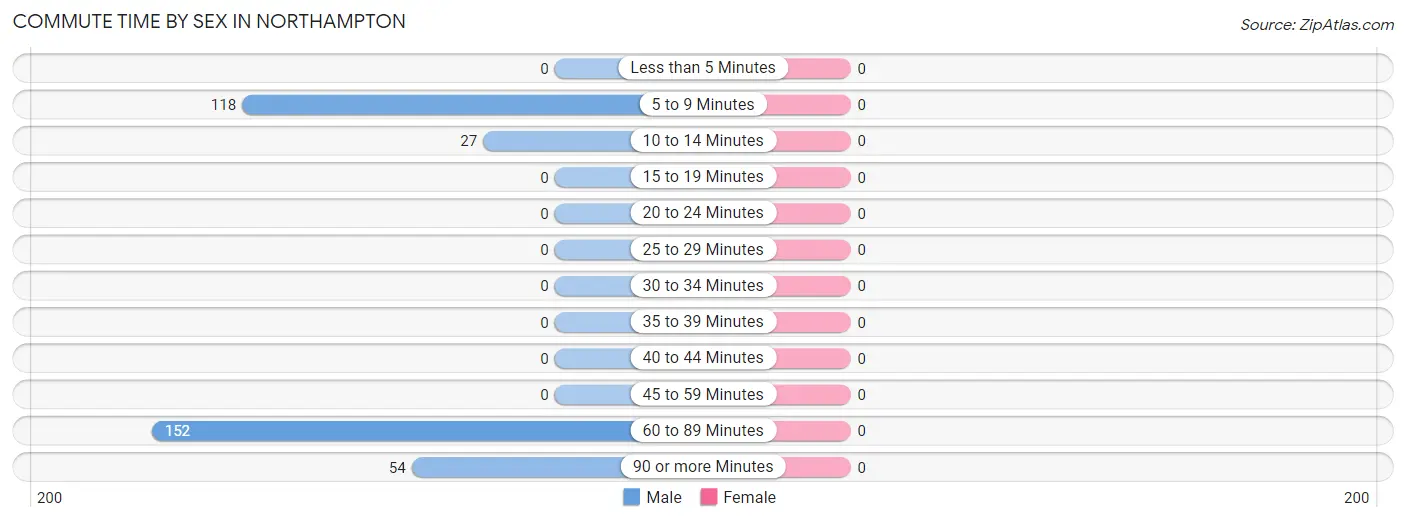
| Commute Time | Male | Female |
| Less than 5 Minutes | 0 (0.0%) | 0 (0.0%) |
| 5 to 9 Minutes | 118 (33.6%) | 0 (0.0%) |
| 10 to 14 Minutes | 27 (7.7%) | 0 (0.0%) |
| 15 to 19 Minutes | 0 (0.0%) | 0 (0.0%) |
| 20 to 24 Minutes | 0 (0.0%) | 0 (0.0%) |
| 25 to 29 Minutes | 0 (0.0%) | 0 (0.0%) |
| 30 to 34 Minutes | 0 (0.0%) | 0 (0.0%) |
| 35 to 39 Minutes | 0 (0.0%) | 0 (0.0%) |
| 40 to 44 Minutes | 0 (0.0%) | 0 (0.0%) |
| 45 to 59 Minutes | 0 (0.0%) | 0 (0.0%) |
| 60 to 89 Minutes | 152 (43.3%) | 0 (0.0%) |
| 90 or more Minutes | 54 (15.4%) | 0 (0.0%) |
Time of Departure to Work by Sex in Northampton
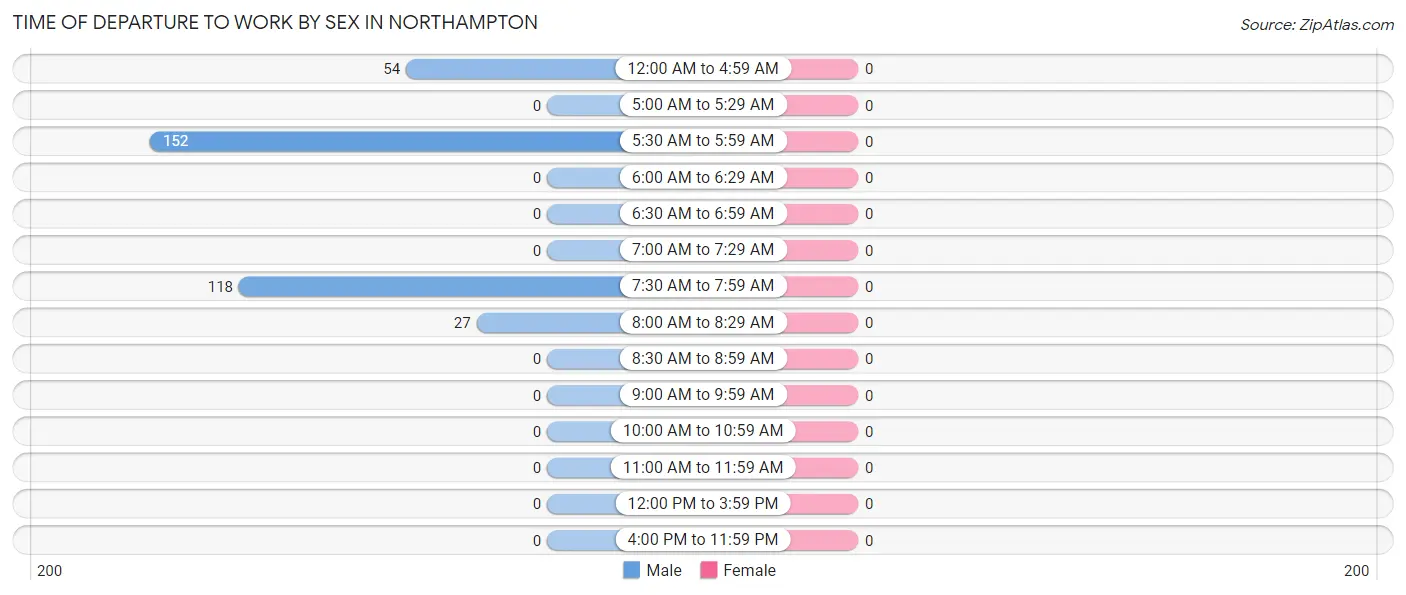
| Time of Departure | Male | Female |
| 12:00 AM to 4:59 AM | 54 (15.4%) | 0 (0.0%) |
| 5:00 AM to 5:29 AM | 0 (0.0%) | 0 (0.0%) |
| 5:30 AM to 5:59 AM | 152 (43.3%) | 0 (0.0%) |
| 6:00 AM to 6:29 AM | 0 (0.0%) | 0 (0.0%) |
| 6:30 AM to 6:59 AM | 0 (0.0%) | 0 (0.0%) |
| 7:00 AM to 7:29 AM | 0 (0.0%) | 0 (0.0%) |
| 7:30 AM to 7:59 AM | 118 (33.6%) | 0 (0.0%) |
| 8:00 AM to 8:29 AM | 27 (7.7%) | 0 (0.0%) |
| 8:30 AM to 8:59 AM | 0 (0.0%) | 0 (0.0%) |
| 9:00 AM to 9:59 AM | 0 (0.0%) | 0 (0.0%) |
| 10:00 AM to 10:59 AM | 0 (0.0%) | 0 (0.0%) |
| 11:00 AM to 11:59 AM | 0 (0.0%) | 0 (0.0%) |
| 12:00 PM to 3:59 PM | 0 (0.0%) | 0 (0.0%) |
| 4:00 PM to 11:59 PM | 0 (0.0%) | 0 (0.0%) |
| Total | 351 (100.0%) | 0 (0.0%) |
Housing Occupancy in Northampton
Occupancy by Ownership in Northampton
Of the total 391 dwellings in Northampton, owner-occupied units account for 198 (50.6%), while renter-occupied units make up 193 (49.4%).
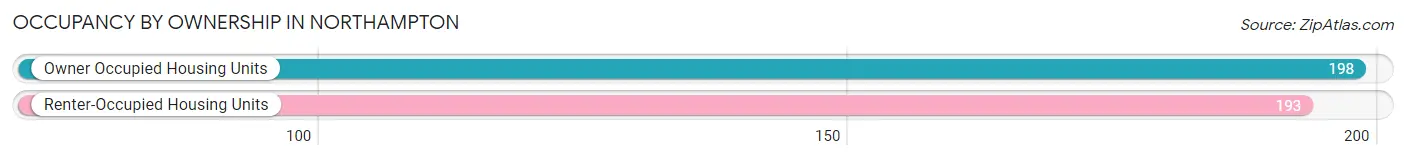
| Occupancy | # Housing Units | % Housing Units |
| Owner Occupied Housing Units | 198 | 50.6% |
| Renter-Occupied Housing Units | 193 | 49.4% |
| Total Occupied Housing Units | 391 | 100.0% |
Occupancy by Household Size in Northampton
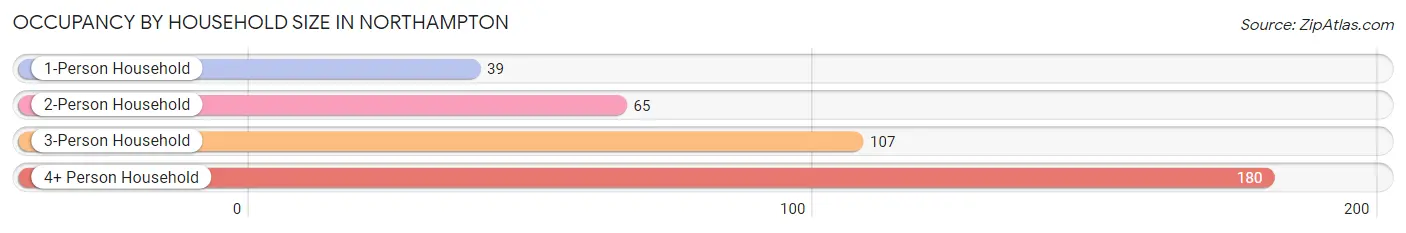
| Household Size | # Housing Units | % Housing Units |
| 1-Person Household | 39 | 10.0% |
| 2-Person Household | 65 | 16.6% |
| 3-Person Household | 107 | 27.4% |
| 4+ Person Household | 180 | 46.0% |
| Total Housing Units | 391 | 100.0% |
Occupancy by Ownership by Household Size in Northampton
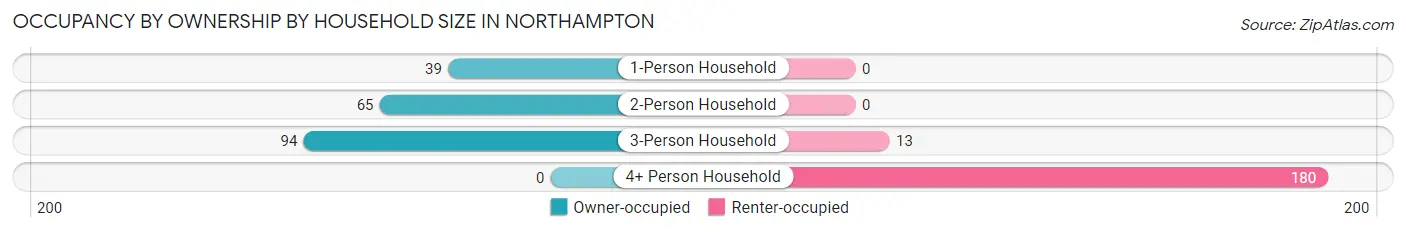
| Household Size | Owner-occupied | Renter-occupied |
| 1-Person Household | 39 (100.0%) | 0 (0.0%) |
| 2-Person Household | 65 (100.0%) | 0 (0.0%) |
| 3-Person Household | 94 (87.8%) | 13 (12.1%) |
| 4+ Person Household | 0 (0.0%) | 180 (100.0%) |
| Total Housing Units | 198 (50.6%) | 193 (49.4%) |
Occupancy by Educational Attainment in Northampton
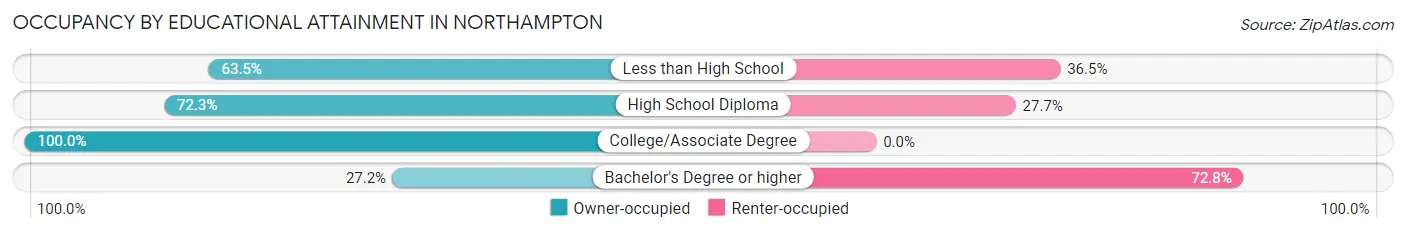
| Household Size | Owner-occupied | Renter-occupied |
| Less than High School | 94 (63.5%) | 54 (36.5%) |
| High School Diploma | 34 (72.3%) | 13 (27.7%) |
| College/Associate Degree | 23 (100.0%) | 0 (0.0%) |
| Bachelor's Degree or higher | 47 (27.2%) | 126 (72.8%) |
Occupancy by Age of Householder in Northampton
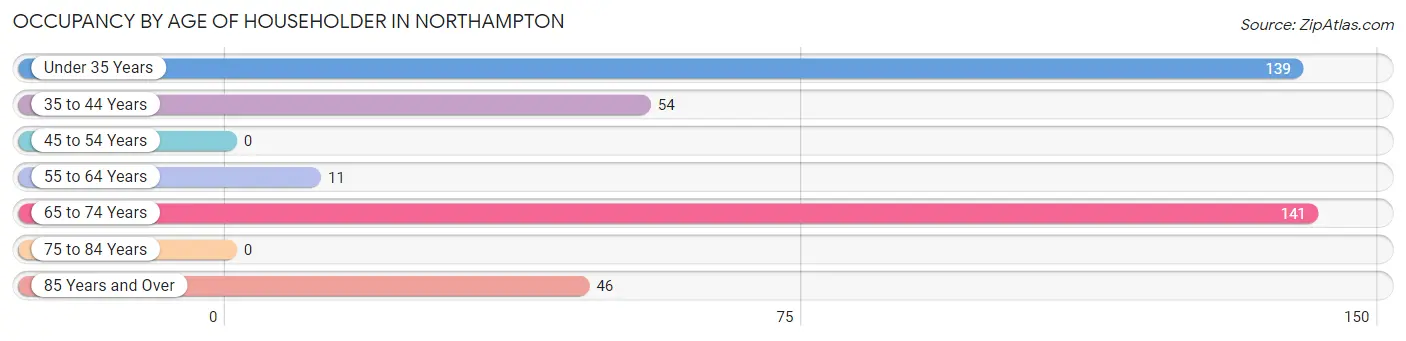
| Age Bracket | # Households | % Households |
| Under 35 Years | 139 | 35.5% |
| 35 to 44 Years | 54 | 13.8% |
| 45 to 54 Years | 0 | 0.0% |
| 55 to 64 Years | 11 | 2.8% |
| 65 to 74 Years | 141 | 36.1% |
| 75 to 84 Years | 0 | 0.0% |
| 85 Years and Over | 46 | 11.8% |
| Total | 391 | 100.0% |
Housing Finances in Northampton
Median Income by Occupancy in Northampton
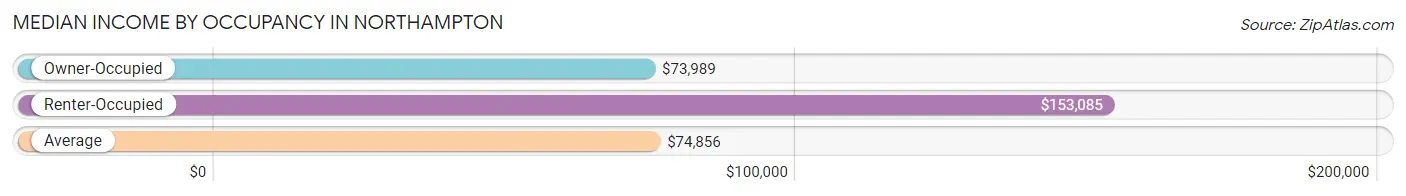
| Occupancy Type | # Households | Median Income |
| Owner-Occupied | 198 (50.6%) | $73,989 |
| Renter-Occupied | 193 (49.4%) | $153,085 |
| Average | 391 (100.0%) | $74,856 |
Occupancy by Householder Income Bracket in Northampton
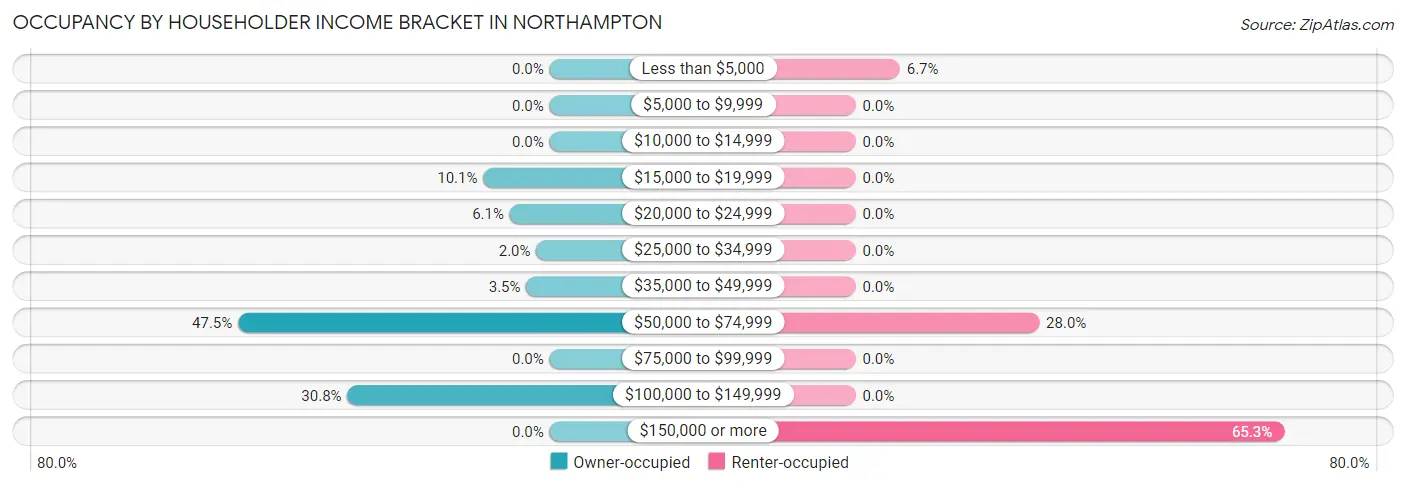
| Income Bracket | Owner-occupied | Renter-occupied |
| Less than $5,000 | 0 (0.0%) | 13 (6.7%) |
| $5,000 to $9,999 | 0 (0.0%) | 0 (0.0%) |
| $10,000 to $14,999 | 0 (0.0%) | 0 (0.0%) |
| $15,000 to $19,999 | 20 (10.1%) | 0 (0.0%) |
| $20,000 to $24,999 | 12 (6.1%) | 0 (0.0%) |
| $25,000 to $34,999 | 4 (2.0%) | 0 (0.0%) |
| $35,000 to $49,999 | 7 (3.5%) | 0 (0.0%) |
| $50,000 to $74,999 | 94 (47.5%) | 54 (28.0%) |
| $75,000 to $99,999 | 0 (0.0%) | 0 (0.0%) |
| $100,000 to $149,999 | 61 (30.8%) | 0 (0.0%) |
| $150,000 or more | 0 (0.0%) | 126 (65.3%) |
| Total | 198 (100.0%) | 193 (100.0%) |
Monthly Housing Cost Tiers in Northampton
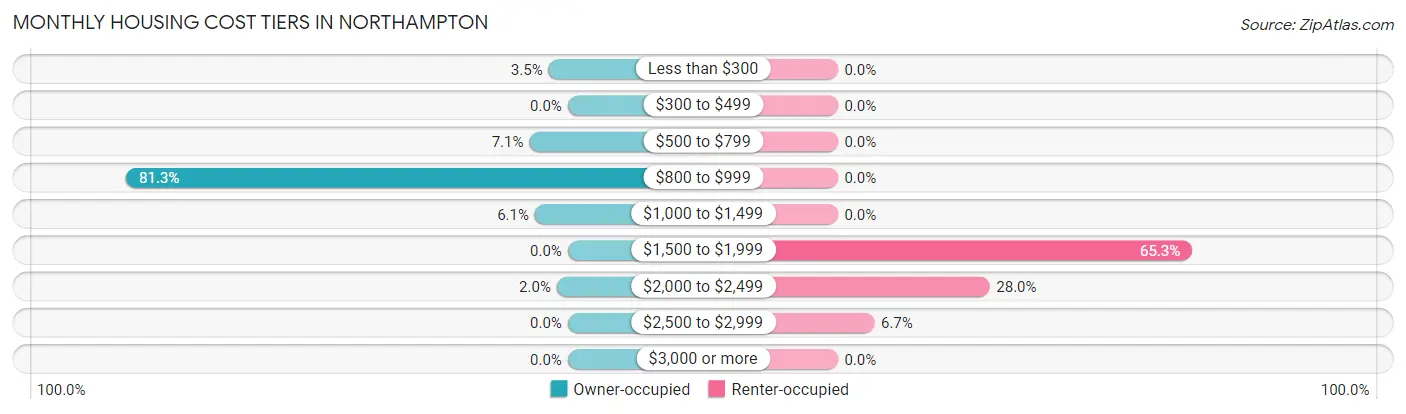
| Monthly Cost | Owner-occupied | Renter-occupied |
| Less than $300 | 7 (3.5%) | 0 (0.0%) |
| $300 to $499 | 0 (0.0%) | 0 (0.0%) |
| $500 to $799 | 14 (7.1%) | 0 (0.0%) |
| $800 to $999 | 161 (81.3%) | 0 (0.0%) |
| $1,000 to $1,499 | 12 (6.1%) | 0 (0.0%) |
| $1,500 to $1,999 | 0 (0.0%) | 126 (65.3%) |
| $2,000 to $2,499 | 4 (2.0%) | 54 (28.0%) |
| $2,500 to $2,999 | 0 (0.0%) | 13 (6.7%) |
| $3,000 or more | 0 (0.0%) | 0 (0.0%) |
| Total | 198 (100.0%) | 193 (100.0%) |
Physical Housing Characteristics in Northampton
Housing Structures in Northampton
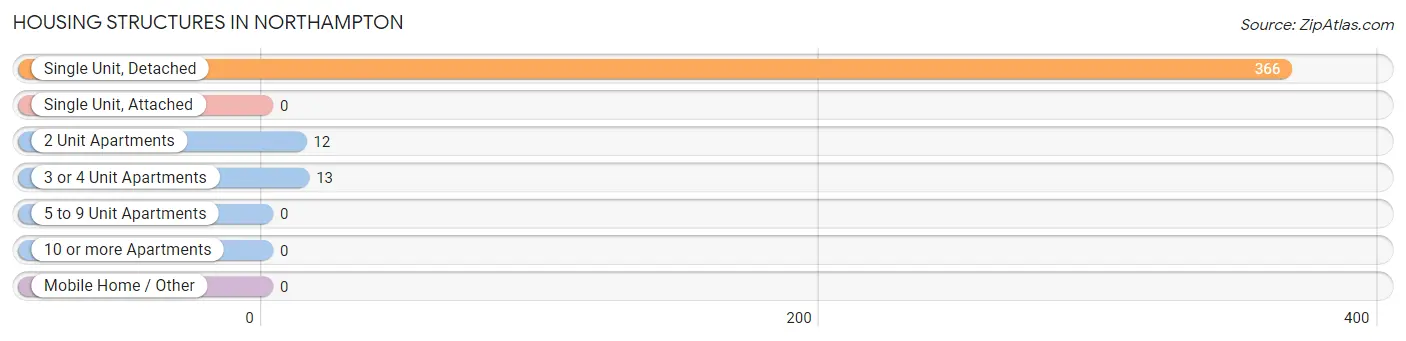
| Structure Type | # Housing Units | % Housing Units |
| Single Unit, Detached | 366 | 93.6% |
| Single Unit, Attached | 0 | 0.0% |
| 2 Unit Apartments | 12 | 3.1% |
| 3 or 4 Unit Apartments | 13 | 3.3% |
| 5 to 9 Unit Apartments | 0 | 0.0% |
| 10 or more Apartments | 0 | 0.0% |
| Mobile Home / Other | 0 | 0.0% |
| Total | 391 | 100.0% |
Housing Structures by Occupancy in Northampton
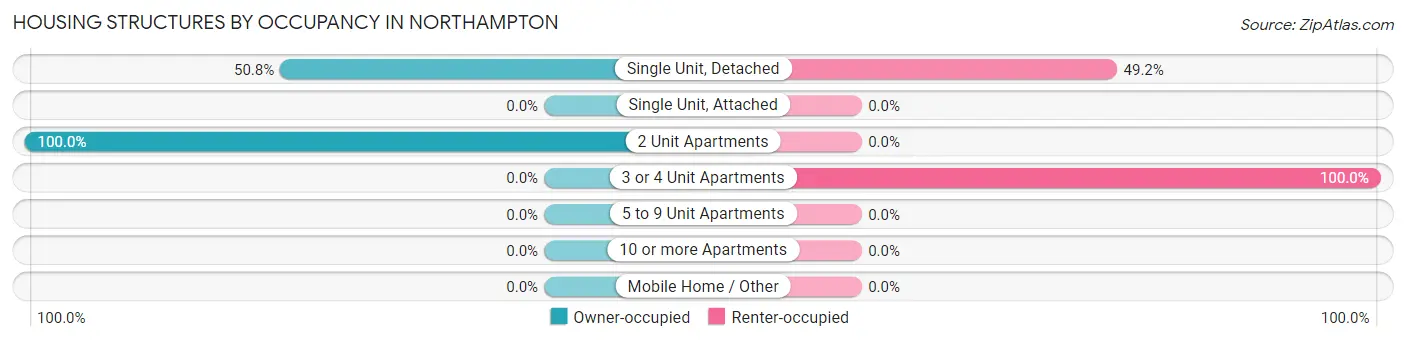
| Structure Type | Owner-occupied | Renter-occupied |
| Single Unit, Detached | 186 (50.8%) | 180 (49.2%) |
| Single Unit, Attached | 0 (0.0%) | 0 (0.0%) |
| 2 Unit Apartments | 12 (100.0%) | 0 (0.0%) |
| 3 or 4 Unit Apartments | 0 (0.0%) | 13 (100.0%) |
| 5 to 9 Unit Apartments | 0 (0.0%) | 0 (0.0%) |
| 10 or more Apartments | 0 (0.0%) | 0 (0.0%) |
| Mobile Home / Other | 0 (0.0%) | 0 (0.0%) |
| Total | 198 (50.6%) | 193 (49.4%) |
Housing Structures by Number of Rooms in Northampton
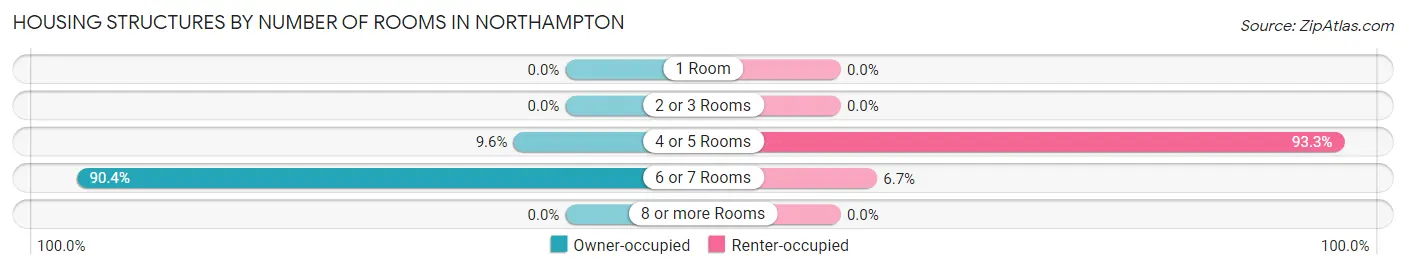
| Number of Rooms | Owner-occupied | Renter-occupied |
| 1 Room | 0 (0.0%) | 0 (0.0%) |
| 2 or 3 Rooms | 0 (0.0%) | 0 (0.0%) |
| 4 or 5 Rooms | 19 (9.6%) | 180 (93.3%) |
| 6 or 7 Rooms | 179 (90.4%) | 13 (6.7%) |
| 8 or more Rooms | 0 (0.0%) | 0 (0.0%) |
| Total | 198 (100.0%) | 193 (100.0%) |
Housing Structure by Heating Type in Northampton
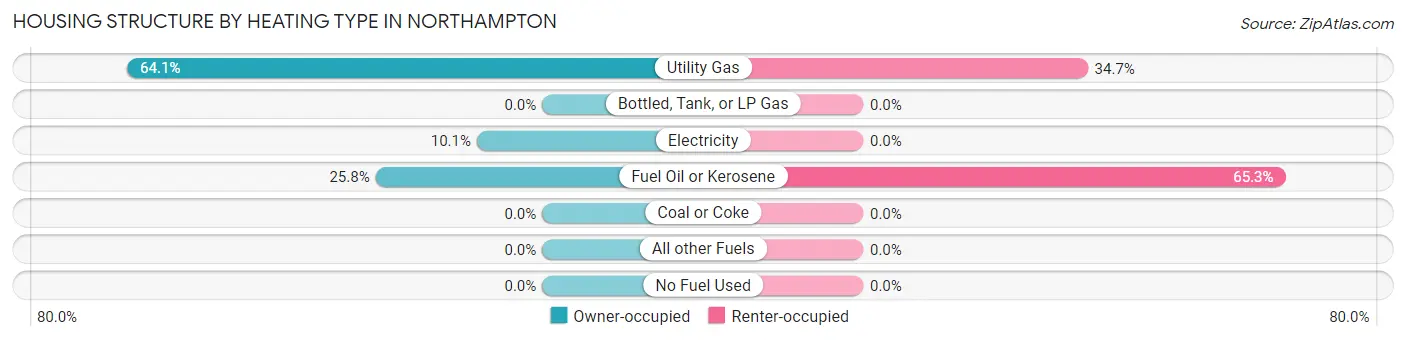
| Heating Type | Owner-occupied | Renter-occupied |
| Utility Gas | 127 (64.1%) | 67 (34.7%) |
| Bottled, Tank, or LP Gas | 0 (0.0%) | 0 (0.0%) |
| Electricity | 20 (10.1%) | 0 (0.0%) |
| Fuel Oil or Kerosene | 51 (25.8%) | 126 (65.3%) |
| Coal or Coke | 0 (0.0%) | 0 (0.0%) |
| All other Fuels | 0 (0.0%) | 0 (0.0%) |
| No Fuel Used | 0 (0.0%) | 0 (0.0%) |
| Total | 198 (100.0%) | 193 (100.0%) |
Household Vehicle Usage in Northampton
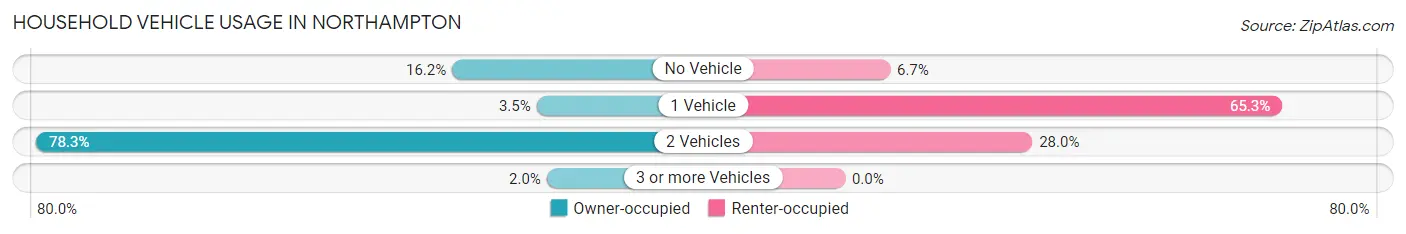
| Vehicles per Household | Owner-occupied | Renter-occupied |
| No Vehicle | 32 (16.2%) | 13 (6.7%) |
| 1 Vehicle | 7 (3.5%) | 126 (65.3%) |
| 2 Vehicles | 155 (78.3%) | 54 (28.0%) |
| 3 or more Vehicles | 4 (2.0%) | 0 (0.0%) |
| Total | 198 (100.0%) | 193 (100.0%) |
Real Estate & Mortgages in Northampton
Real Estate and Mortgage Overview in Northampton
| Characteristic | Without Mortgage | With Mortgage |
| Housing Units | 194 | 4 |
| Median Property Value | - | - |
| Median Household Income | $74,043 | $0 |
| Monthly Housing Costs | $910 | $0 |
| Real Estate Taxes | $4,472 | $0 |
Property Value by Mortgage Status in Northampton
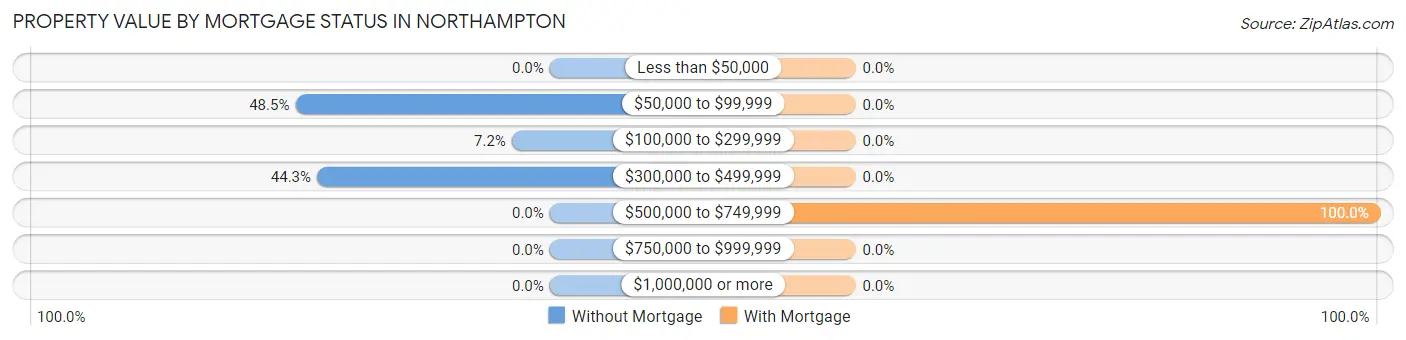
| Property Value | Without Mortgage | With Mortgage |
| Less than $50,000 | 0 (0.0%) | 0 (0.0%) |
| $50,000 to $99,999 | 94 (48.4%) | 0 (0.0%) |
| $100,000 to $299,999 | 14 (7.2%) | 0 (0.0%) |
| $300,000 to $499,999 | 86 (44.3%) | 0 (0.0%) |
| $500,000 to $749,999 | 0 (0.0%) | 4 (100.0%) |
| $750,000 to $999,999 | 0 (0.0%) | 0 (0.0%) |
| $1,000,000 or more | 0 (0.0%) | 0 (0.0%) |
| Total | 194 (100.0%) | 4 (100.0%) |
Household Income by Mortgage Status in Northampton
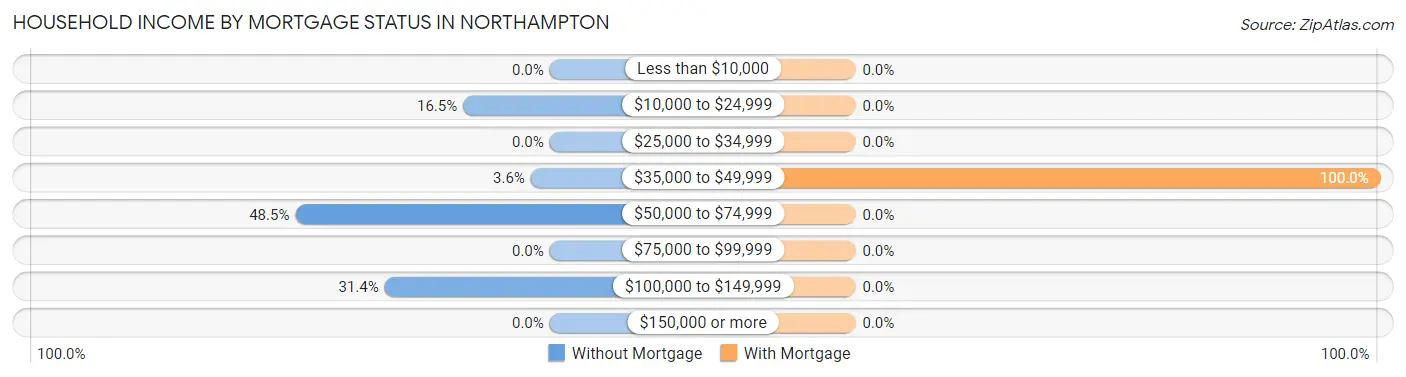
| Household Income | Without Mortgage | With Mortgage |
| Less than $10,000 | 0 (0.0%) | 0 (0.0%) |
| $10,000 to $24,999 | 32 (16.5%) | 0 (0.0%) |
| $25,000 to $34,999 | 0 (0.0%) | 0 (0.0%) |
| $35,000 to $49,999 | 7 (3.6%) | 4 (100.0%) |
| $50,000 to $74,999 | 94 (48.4%) | 0 (0.0%) |
| $75,000 to $99,999 | 0 (0.0%) | 0 (0.0%) |
| $100,000 to $149,999 | 61 (31.4%) | 0 (0.0%) |
| $150,000 or more | 0 (0.0%) | 0 (0.0%) |
| Total | 194 (100.0%) | 4 (100.0%) |
Property Value to Household Income Ratio in Northampton
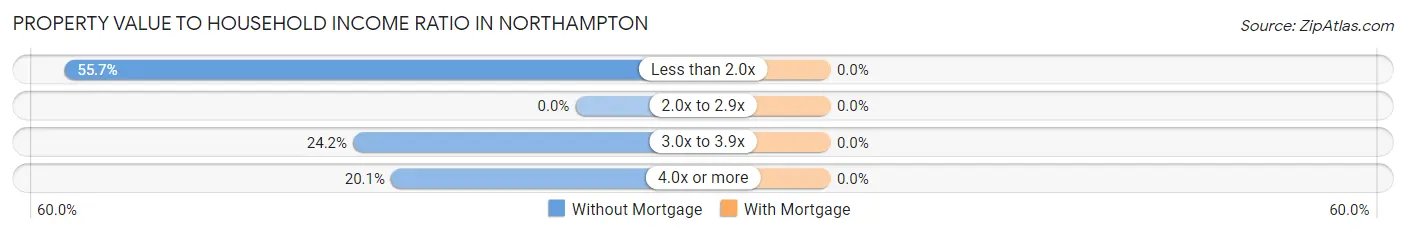
| Value-to-Income Ratio | Without Mortgage | With Mortgage |
| Less than 2.0x | 108 (55.7%) | 0 (0.0%) |
| 2.0x to 2.9x | 0 (0.0%) | 0 (0.0%) |
| 3.0x to 3.9x | 47 (24.2%) | 0 (0.0%) |
| 4.0x or more | 39 (20.1%) | 0 (0.0%) |
| Total | 194 (100.0%) | 4 (100.0%) |
Real Estate Taxes by Mortgage Status in Northampton
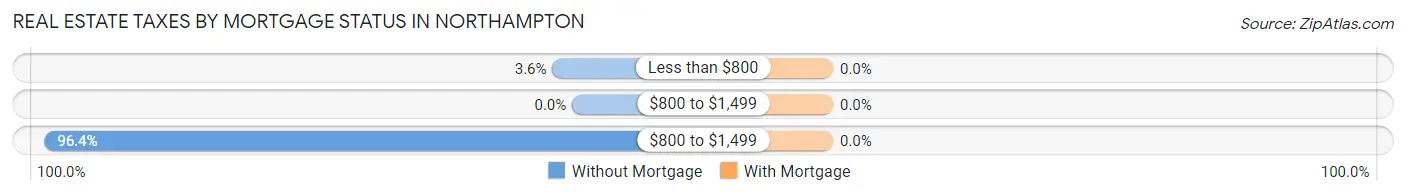
| Property Taxes | Without Mortgage | With Mortgage |
| Less than $800 | 7 (3.6%) | 0 (0.0%) |
| $800 to $1,499 | 0 (0.0%) | 0 (0.0%) |
| $800 to $1,499 | 187 (96.4%) | 0 (0.0%) |
| Total | 194 (100.0%) | 4 (100.0%) |
Health & Disability in Northampton
Health Insurance Coverage by Age in Northampton
| Age Bracket | With Coverage | Without Coverage |
| Under 6 Years | 330 (100.0%) | 0 (0.0%) |
| 6 to 18 Years | 40 (100.0%) | 0 (0.0%) |
| 19 to 25 Years | 170 (69.1%) | 76 (30.9%) |
| 26 to 34 Years | 306 (96.2%) | 12 (3.8%) |
| 35 to 44 Years | 33 (14.9%) | 189 (85.1%) |
| 45 to 54 Years | 0 (0.0%) | 0 (0.0%) |
| 55 to 64 Years | 17 (100.0%) | 0 (0.0%) |
| 65 to 74 Years | 185 (100.0%) | 0 (0.0%) |
| 75 Years and older | 47 (100.0%) | 0 (0.0%) |
| Total | 1,128 (80.3%) | 277 (19.7%) |
Health Insurance Coverage by Citizenship Status in Northampton
| Citizenship Status | With Coverage | Without Coverage |
| Native Born | 330 (100.0%) | 0 (0.0%) |
| Foreign Born, Citizen | 40 (100.0%) | 0 (0.0%) |
| Foreign Born, not a Citizen | 170 (69.1%) | 76 (30.9%) |
Health Insurance Coverage by Household Income in Northampton
| Household Income | With Coverage | Without Coverage |
| Under $25,000 | 32 (43.2%) | 42 (56.8%) |
| $25,000 to $49,999 | 16 (100.0%) | 0 (0.0%) |
| $50,000 to $74,999 | 553 (82.5%) | 117 (17.5%) |
| $75,000 to $99,999 | 0 (0.0%) | 0 (0.0%) |
| $100,000 and over | 522 (81.6%) | 118 (18.4%) |
Public vs Private Health Insurance Coverage by Age in Northampton
| Age Bracket | Public Insurance | Private Insurance |
| Under 6 | 264 (80.0%) | 66 (20.0%) |
| 6 to 18 Years | 40 (100.0%) | 0 (0.0%) |
| 19 to 25 Years | 1 (0.4%) | 170 (69.1%) |
| 25 to 34 Years | 153 (48.1%) | 305 (95.9%) |
| 35 to 44 Years | 1 (0.4%) | 32 (14.4%) |
| 45 to 54 Years | 0 (0.0%) | 0 (0.0%) |
| 55 to 64 Years | 5 (29.4%) | 16 (94.1%) |
| 65 to 74 Years | 185 (100.0%) | 185 (100.0%) |
| 75 Years and over | 47 (100.0%) | 32 (68.1%) |
| Total | 696 (49.5%) | 806 (57.4%) |
Disability Status by Sex by Age in Northampton
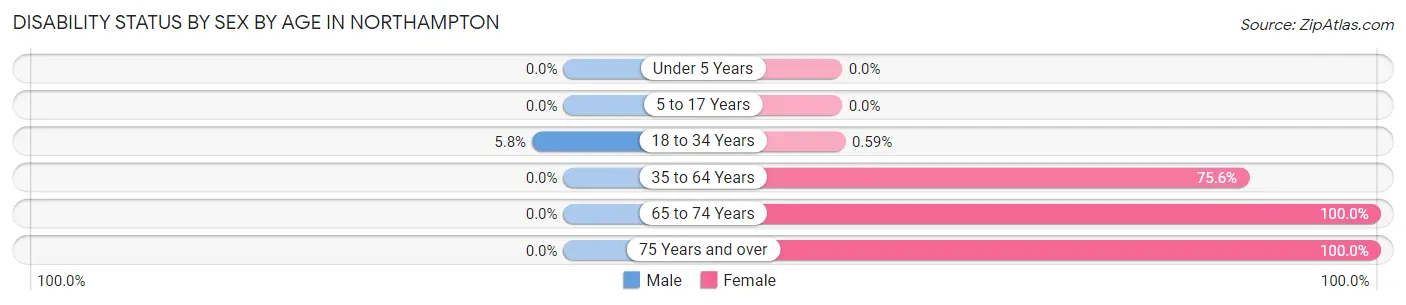
| Age Bracket | Male | Female |
| Under 5 Years | 0 (0.0%) | 0 (0.0%) |
| 5 to 17 Years | 0 (0.0%) | 0 (0.0%) |
| 18 to 34 Years | 13 (5.8%) | 2 (0.6%) |
| 35 to 64 Years | 0 (0.0%) | 34 (75.6%) |
| 65 to 74 Years | 0 (0.0%) | 138 (100.0%) |
| 75 Years and over | 0 (0.0%) | 47 (100.0%) |
Disability Class by Sex by Age in Northampton
Disability Class: Hearing Difficulty
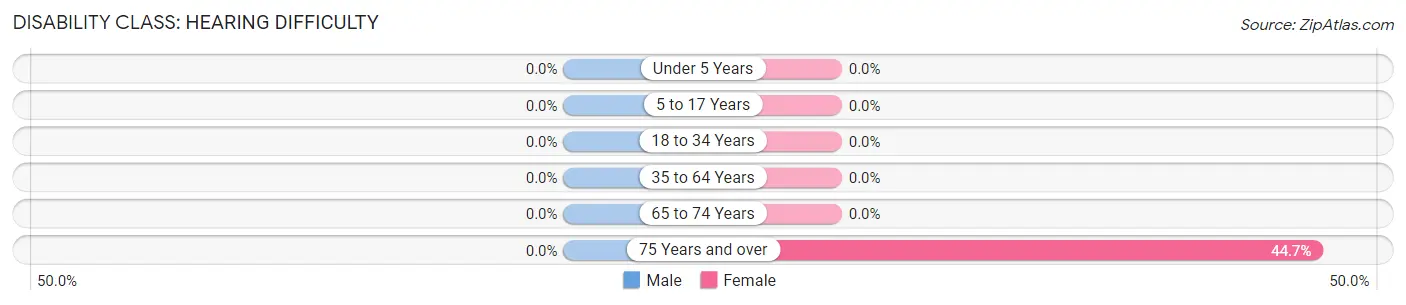
| Age Bracket | Male | Female |
| Under 5 Years | 0 (0.0%) | 0 (0.0%) |
| 5 to 17 Years | 0 (0.0%) | 0 (0.0%) |
| 18 to 34 Years | 0 (0.0%) | 0 (0.0%) |
| 35 to 64 Years | 0 (0.0%) | 0 (0.0%) |
| 65 to 74 Years | 0 (0.0%) | 0 (0.0%) |
| 75 Years and over | 0 (0.0%) | 21 (44.7%) |
Disability Class: Vision Difficulty
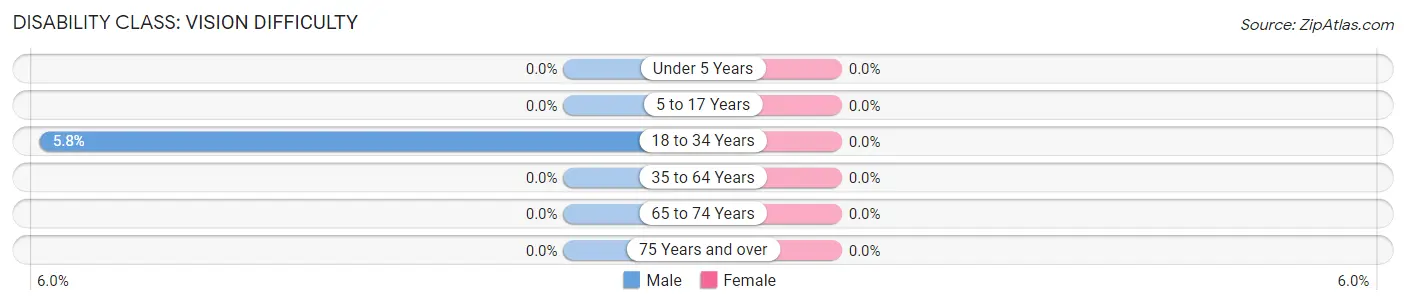
| Age Bracket | Male | Female |
| Under 5 Years | 0 (0.0%) | 0 (0.0%) |
| 5 to 17 Years | 0 (0.0%) | 0 (0.0%) |
| 18 to 34 Years | 13 (5.8%) | 0 (0.0%) |
| 35 to 64 Years | 0 (0.0%) | 0 (0.0%) |
| 65 to 74 Years | 0 (0.0%) | 0 (0.0%) |
| 75 Years and over | 0 (0.0%) | 0 (0.0%) |
Disability Class: Cognitive Difficulty
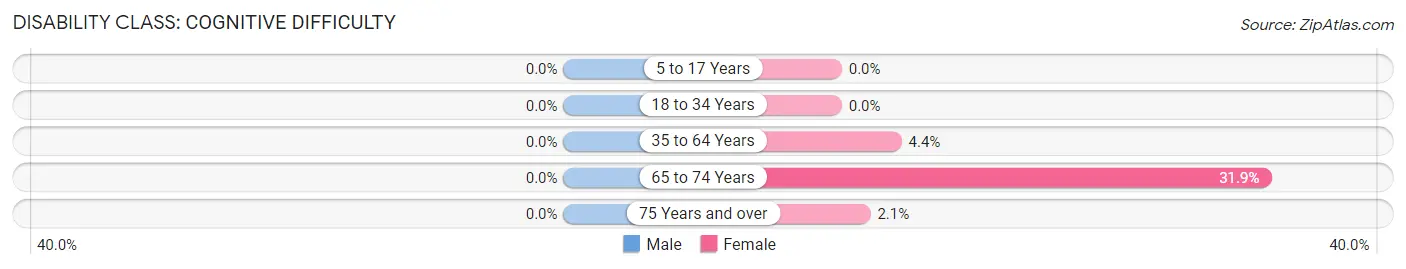
| Age Bracket | Male | Female |
| 5 to 17 Years | 0 (0.0%) | 0 (0.0%) |
| 18 to 34 Years | 0 (0.0%) | 0 (0.0%) |
| 35 to 64 Years | 0 (0.0%) | 2 (4.4%) |
| 65 to 74 Years | 0 (0.0%) | 44 (31.9%) |
| 75 Years and over | 0 (0.0%) | 1 (2.1%) |
Disability Class: Ambulatory Difficulty
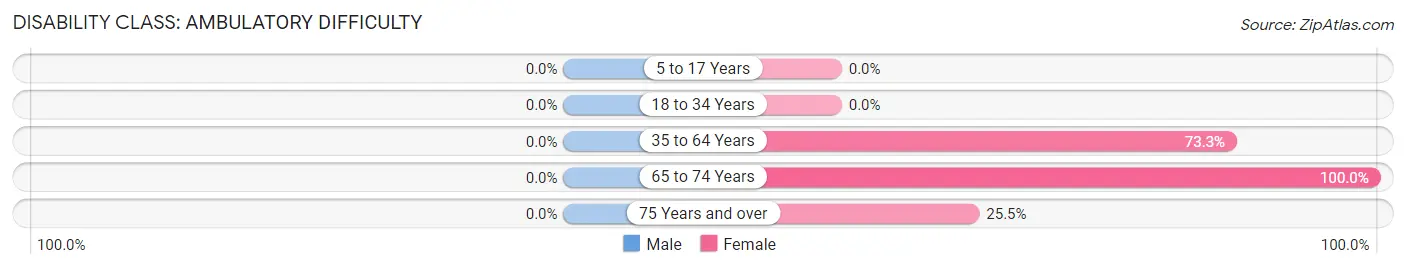
| Age Bracket | Male | Female |
| 5 to 17 Years | 0 (0.0%) | 0 (0.0%) |
| 18 to 34 Years | 0 (0.0%) | 0 (0.0%) |
| 35 to 64 Years | 0 (0.0%) | 33 (73.3%) |
| 65 to 74 Years | 0 (0.0%) | 138 (100.0%) |
| 75 Years and over | 0 (0.0%) | 12 (25.5%) |
Disability Class: Self-Care Difficulty
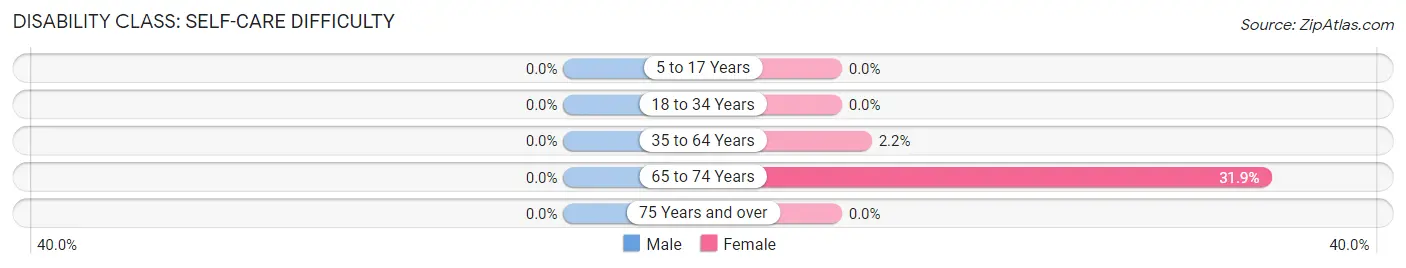
| Age Bracket | Male | Female |
| 5 to 17 Years | 0 (0.0%) | 0 (0.0%) |
| 18 to 34 Years | 0 (0.0%) | 0 (0.0%) |
| 35 to 64 Years | 0 (0.0%) | 1 (2.2%) |
| 65 to 74 Years | 0 (0.0%) | 44 (31.9%) |
| 75 Years and over | 0 (0.0%) | 0 (0.0%) |
Technology Access in Northampton
Computing Device Access in Northampton
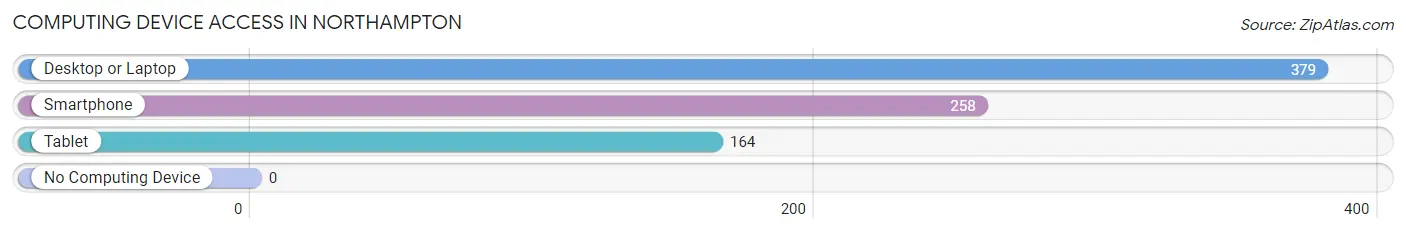
| Device Type | # Households | % Households |
| Desktop or Laptop | 379 | 96.9% |
| Smartphone | 258 | 66.0% |
| Tablet | 164 | 41.9% |
| No Computing Device | 0 | 0.0% |
| Total | 391 | 100.0% |
Internet Access in Northampton
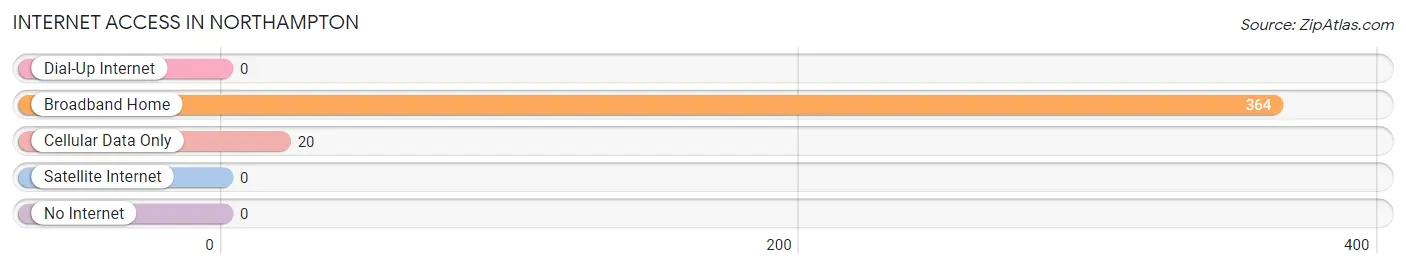
| Internet Type | # Households | % Households |
| Dial-Up Internet | 0 | 0.0% |
| Broadband Home | 364 | 93.1% |
| Cellular Data Only | 20 | 5.1% |
| Satellite Internet | 0 | 0.0% |
| No Internet | 0 | 0.0% |
| Total | 391 | 100.0% |
Northampton Summary
Northampton is a town located in the western part of Fulton County, New York, United States. The population was 1,845 at the 2010 census. The town is named after the English county of Northamptonshire.
Geography
Northampton is located in the western part of Fulton County, New York. It is bordered by the towns of Johnstown to the north, Broadalbin to the east, Mayfield to the south, and Perth to the west. The town is located in the Adirondack Mountains and is home to several small lakes, including Lake Pleasant, Lake Sacandaga, and Lake Lorraine.
The highest point in the town is an unnamed peak in the Adirondack Mountains, with an elevation of 2,890 feet (881 m). The town is home to several small streams, including the Sacandaga River, which flows through the town from north to south.
Demographics
As of the census of 2010, there were 1,845 people, 745 households, and 517 families residing in the town. The population density was 39.3 people per square mile (15.2/km2). There were 845 housing units at an average density of 17.9 per square mile (6.9/km2). The racial makeup of the town was 97.3% White, 0.3% African American, 0.2% Native American, 0.2% Asian, 0.2% from other races, and 1.9% from two or more races. Hispanic or Latino of any race were 1.2% of the population.
There were 745 households, out of which 28.2% had children under the age of 18 living with them, 54.2% were married couples living together, 9.2% had a female householder with no husband present, and 31.2% were non-families. 25.7% of all households were made up of individuals, and 11.2% had someone living alone who was 65 years of age or older. The average household size was 2.47 and the average family size was 2.94.
In the town, the population was spread out, with 24.2% under the age of 18, 6.2% from 18 to 24, 25.2% from 25 to 44, 28.2% from 45 to 64, and 16.2% who were 65 years of age or older. The median age was 41 years. For every 100 females, there were 97.2 males. For every 100 females age 18 and over, there were 94.2 males.
Economy
The economy of Northampton is largely based on agriculture and tourism. The town is home to several small farms, which produce a variety of crops, including corn, hay, and apples. The town is also home to several small businesses, including restaurants, gas stations, and convenience stores.
Tourism is an important part of the economy of Northampton. The town is home to several popular attractions, including the Sacandaga River, which is popular for fishing and boating, and the Adirondack Mountains, which are popular for hiking and camping. The town is also home to several small lakes, which are popular for swimming and boating.
Conclusion
Northampton is a small town located in the western part of Fulton County, New York. The town is home to several small lakes, streams, and mountains, and is a popular destination for tourists. The economy of Northampton is largely based on agriculture and tourism, and the town is home to several small businesses. The population of Northampton was 1,845 at the 2010 census.
Common Questions
What is Per Capita Income in Northampton?
Per Capita income in Northampton is $27,820.
What is the Median Family Income in Northampton?
Median Family Income in Northampton is $73,057.
What is the Median Household income in Northampton?
Median Household Income in Northampton is $74,856.
What is Inequality or Gini Index in Northampton?
Inequality or Gini Index in Northampton is 0.26.
What is the Total Population of Northampton?
Total Population of Northampton is 1,405.
What is the Total Male Population of Northampton?
Total Male Population of Northampton is 654.
What is the Total Female Population of Northampton?
Total Female Population of Northampton is 751.
What is the Ratio of Males per 100 Females in Northampton?
There are 87.08 Males per 100 Females in Northampton.
What is the Ratio of Females per 100 Males in Northampton?
There are 114.83 Females per 100 Males in Northampton.
What is the Median Population Age in Northampton?
Median Population Age in Northampton is 32.4 Years.
What is the Average Family Size in Northampton
Average Family Size in Northampton is 3.5 People.
What is the Average Household Size in Northampton
Average Household Size in Northampton is 3.6 People.
How Large is the Labor Force in Northampton?
There are 520 People in the Labor Forcein in Northampton.
What is the Percentage of People in the Labor Force in Northampton?
48.4% of People are in the Labor Force in Northampton.
What is the Unemployment Rate in Northampton?
Unemployment Rate in Northampton is 6.9%.