Millport, NY Map & Demographics
Millport Map
Millport Overview
$23,340
PER CAPITA INCOME
$67,000
AVG FAMILY INCOME
$42,344
AVG HOUSEHOLD INCOME
28.4%
WAGE / INCOME GAP [ % ]
71.6¢/ $1
WAGE / INCOME GAP [ $ ]
$7,243
FAMILY INCOME DEFICIT
0.37
INEQUALITY / GINI INDEX
425
TOTAL POPULATION
217
MALE POPULATION
208
FEMALE POPULATION
104.33
MALES / 100 FEMALES
95.85
FEMALES / 100 MALES
48.5
MEDIAN AGE
3.4
AVG FAMILY SIZE
2.7
AVG HOUSEHOLD SIZE
159
LABOR FORCE [ PEOPLE ]
48.0%
PERCENT IN LABOR FORCE
12.6%
UNEMPLOYMENT RATE
Millport Zip Codes
Millport Area Codes
Income in Millport
Income Overview in Millport
Per Capita Income in Millport is $23,340, while median incomes of families and households are $67,000 and $42,344 respectively.
| Characteristic | Number | Measure |
| Per Capita Income | 425 | $23,340 |
| Median Family Income | 92 | $67,000 |
| Mean Family Income | 92 | $81,453 |
| Median Household Income | 159 | $42,344 |
| Mean Household Income | 159 | $62,924 |
| Income Deficit | 92 | $7,243 |
| Wage / Income Gap (%) | 425 | 28.44% |
| Wage / Income Gap ($) | 425 | 71.56¢ per $1 |
| Gini / Inequality Index | 425 | 0.37 |
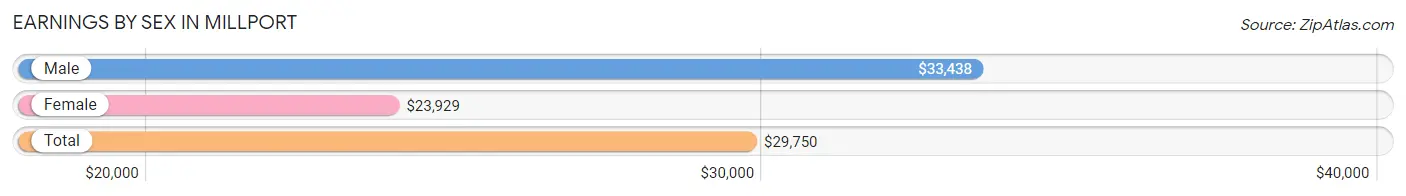
Earnings by Sex in Millport
Average Earnings in Millport are $29,750, $33,438 for men and $23,929 for women, a difference of 28.4%.
| Sex | Number | Average Earnings |
| Male | 89 (60.5%) | $33,438 |
| Female | 58 (39.5%) | $23,929 |
| Total | 147 (100.0%) | $29,750 |
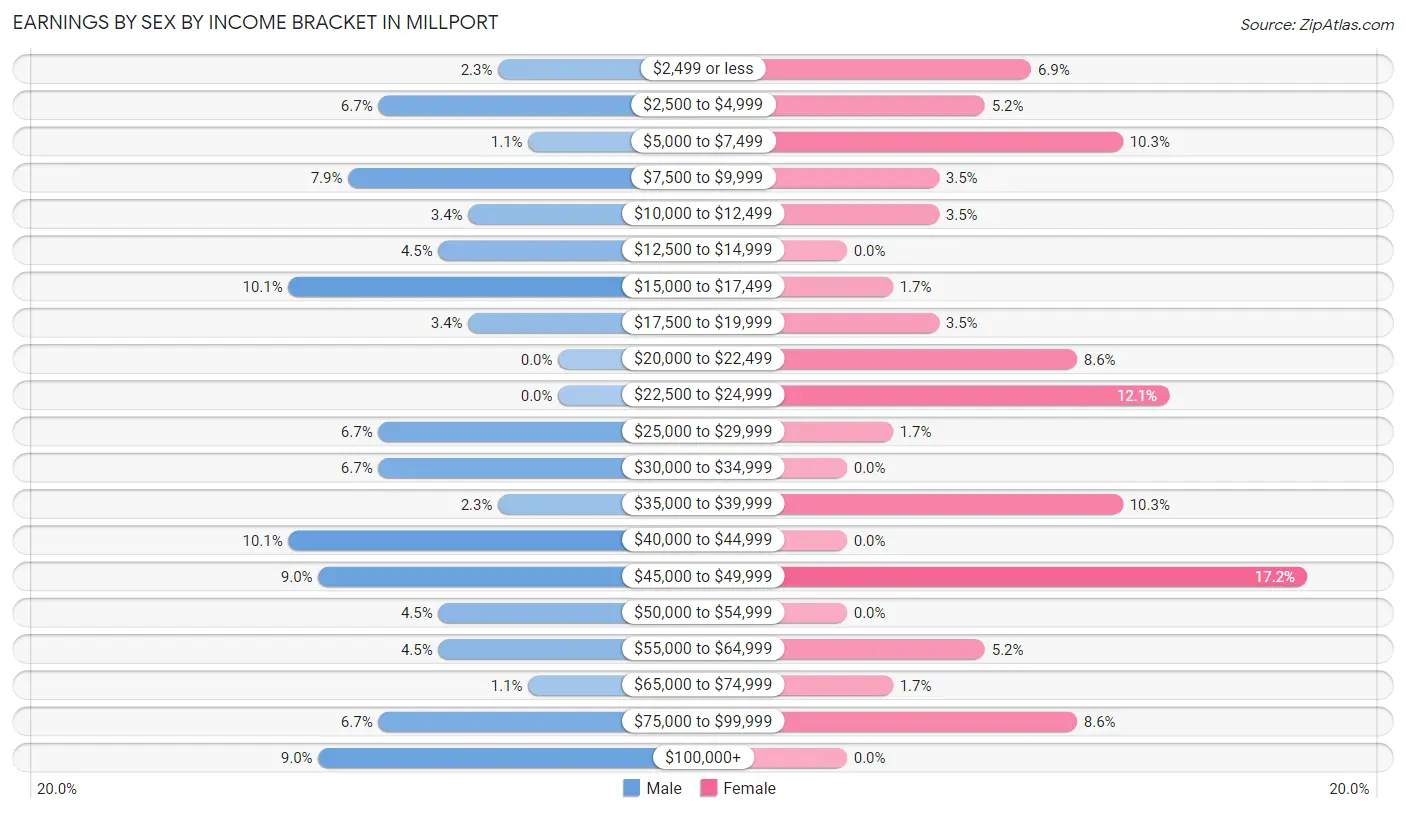
Earnings by Sex by Income Bracket in Millport
The most common earnings brackets in Millport are $15,000 to $17,499 for men (9 | 10.1%) and $45,000 to $49,999 for women (10 | 17.2%).
| Income | Male | Female |
| $2,499 or less | 2 (2.2%) | 4 (6.9%) |
| $2,500 to $4,999 | 6 (6.7%) | 3 (5.2%) |
| $5,000 to $7,499 | 1 (1.1%) | 6 (10.3%) |
| $7,500 to $9,999 | 7 (7.9%) | 2 (3.5%) |
| $10,000 to $12,499 | 3 (3.4%) | 2 (3.5%) |
| $12,500 to $14,999 | 4 (4.5%) | 0 (0.0%) |
| $15,000 to $17,499 | 9 (10.1%) | 1 (1.7%) |
| $17,500 to $19,999 | 3 (3.4%) | 2 (3.5%) |
| $20,000 to $22,499 | 0 (0.0%) | 5 (8.6%) |
| $22,500 to $24,999 | 0 (0.0%) | 7 (12.1%) |
| $25,000 to $29,999 | 6 (6.7%) | 1 (1.7%) |
| $30,000 to $34,999 | 6 (6.7%) | 0 (0.0%) |
| $35,000 to $39,999 | 2 (2.2%) | 6 (10.3%) |
| $40,000 to $44,999 | 9 (10.1%) | 0 (0.0%) |
| $45,000 to $49,999 | 8 (9.0%) | 10 (17.2%) |
| $50,000 to $54,999 | 4 (4.5%) | 0 (0.0%) |
| $55,000 to $64,999 | 4 (4.5%) | 3 (5.2%) |
| $65,000 to $74,999 | 1 (1.1%) | 1 (1.7%) |
| $75,000 to $99,999 | 6 (6.7%) | 5 (8.6%) |
| $100,000+ | 8 (9.0%) | 0 (0.0%) |
| Total | 89 (100.0%) | 58 (100.0%) |
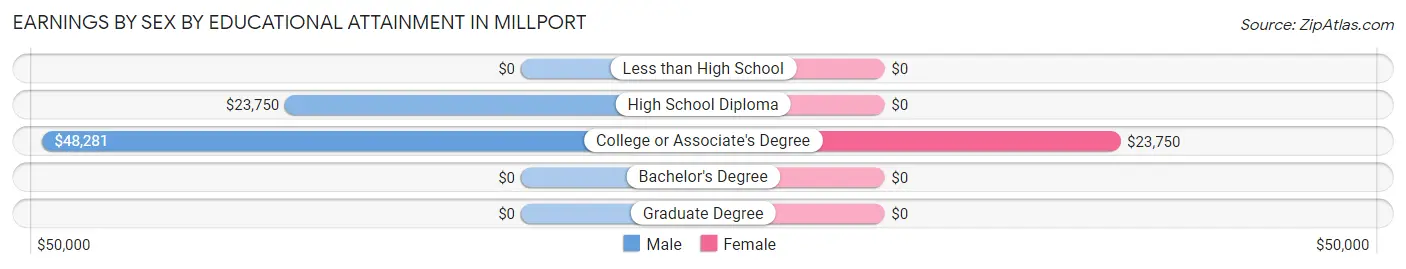
Earnings by Sex by Educational Attainment in Millport
| Educational Attainment | Male Income | Female Income |
| Less than High School | - | - |
| High School Diploma | $23,750 | $0 |
| College or Associate's Degree | $48,281 | $23,750 |
| Bachelor's Degree | - | - |
| Graduate Degree | - | - |
| Total | $33,125 | $0 |
Family Income in Millport
Family Income Brackets in Millport
According to the Millport family income data, there are 30 families falling into the $35,000 to $49,999 income range, which is the most common income bracket and makes up 32.6% of all families.
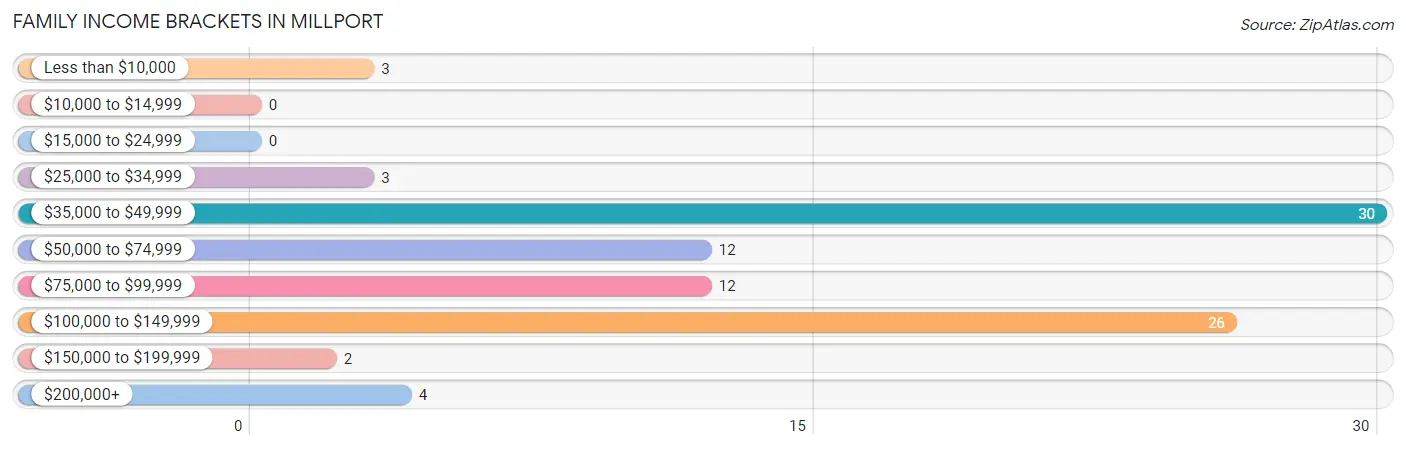
| Income Bracket | # Families | % Families |
| Less than $10,000 | 3 | 3.3% |
| $10,000 to $14,999 | 0 | 0.0% |
| $15,000 to $24,999 | 0 | 0.0% |
| $25,000 to $34,999 | 3 | 3.3% |
| $35,000 to $49,999 | 30 | 32.6% |
| $50,000 to $74,999 | 12 | 13.0% |
| $75,000 to $99,999 | 12 | 13.0% |
| $100,000 to $149,999 | 26 | 28.3% |
| $150,000 to $199,999 | 2 | 2.2% |
| $200,000+ | 4 | 4.3% |
Family Income by Famaliy Size in Millport
3-person families (15 | 16.3%) account for the highest median family income in Millport with $102,083 per family, while 3-person families (15 | 16.3%) have the highest median income of $34,028 per family member.
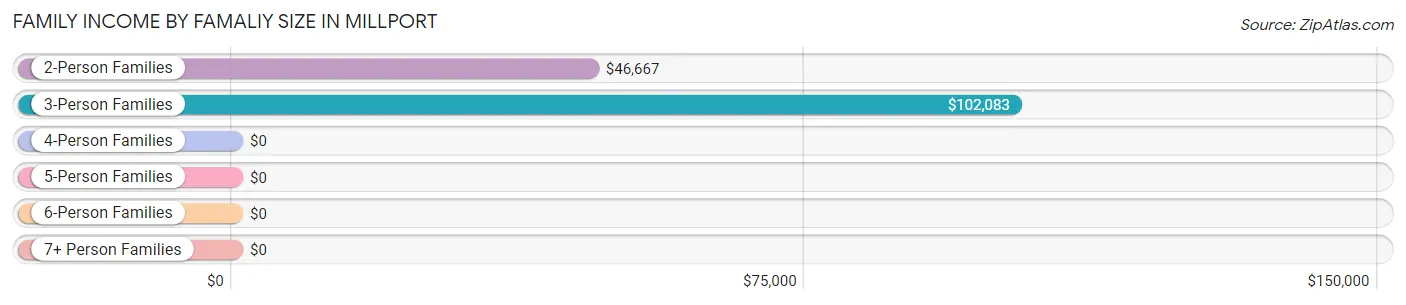
| Income Bracket | # Families | Median Income |
| 2-Person Families | 38 (41.3%) | $46,667 |
| 3-Person Families | 15 (16.3%) | $102,083 |
| 4-Person Families | 15 (16.3%) | $0 |
| 5-Person Families | 9 (9.8%) | $0 |
| 6-Person Families | 11 (12.0%) | $0 |
| 7+ Person Families | 4 (4.3%) | $0 |
| Total | 92 (100.0%) | $67,000 |
Family Income by Number of Earners in Millport
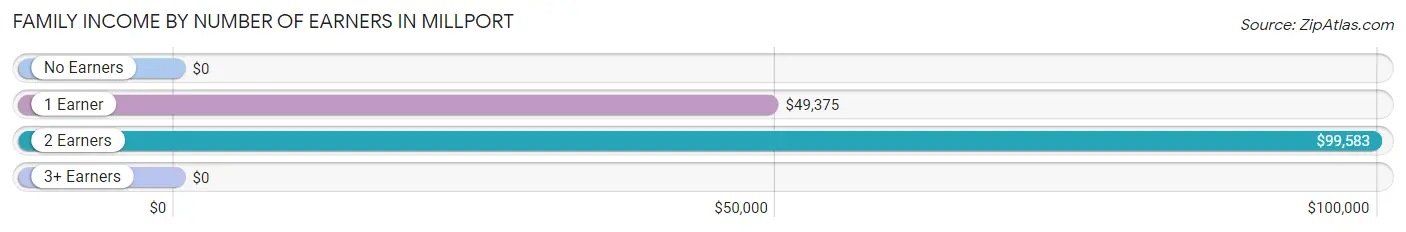
| Number of Earners | # Families | Median Income |
| No Earners | 23 (25.0%) | $0 |
| 1 Earner | 27 (29.3%) | $49,375 |
| 2 Earners | 37 (40.2%) | $99,583 |
| 3+ Earners | 5 (5.4%) | $0 |
| Total | 92 (100.0%) | $67,000 |
Household Income in Millport
Household Income Brackets in Millport
With 55 households falling in the category, the $35,000 to $49,999 income range is the most frequent in Millport, accounting for 34.6% of all households. In contrast, only 2 households (1.3%) fall into the $150,000 to $199,999 income bracket, making it the least populous group.
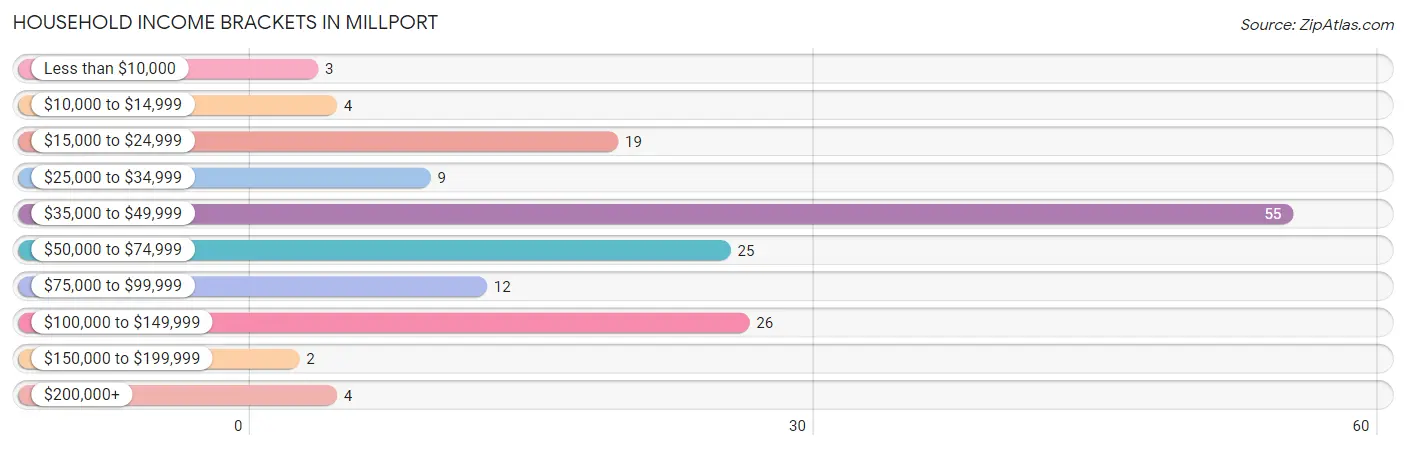
| Income Bracket | # Households | % Households |
| Less than $10,000 | 3 | 1.9% |
| $10,000 to $14,999 | 4 | 2.5% |
| $15,000 to $24,999 | 19 | 11.9% |
| $25,000 to $34,999 | 9 | 5.7% |
| $35,000 to $49,999 | 55 | 34.6% |
| $50,000 to $74,999 | 25 | 15.7% |
| $75,000 to $99,999 | 12 | 7.5% |
| $100,000 to $149,999 | 26 | 16.4% |
| $150,000 to $199,999 | 2 | 1.3% |
| $200,000+ | 4 | 2.5% |
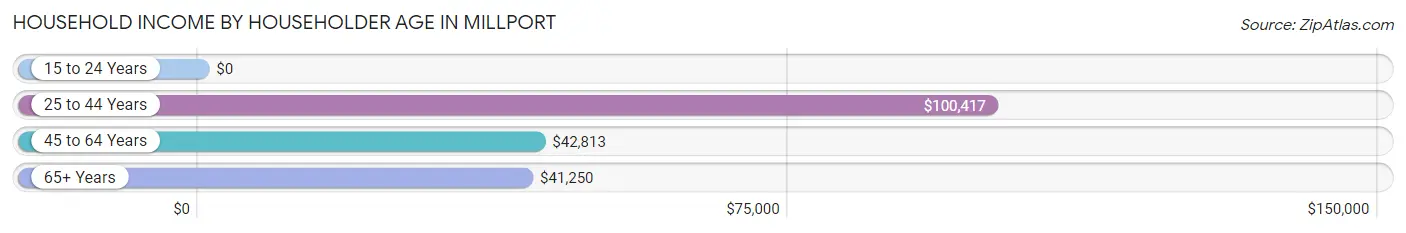
Household Income by Householder Age in Millport
The median household income in Millport is $42,344, with the highest median household income of $100,417 found in the 25 to 44 years age bracket for the primary householder. A total of 37 households (23.3%) fall into this category. Meanwhile, the 15 to 24 years age bracket for the primary householder has the lowest median household income of $0, with 6 households (3.8%) in this group.
| Income Bracket | # Households | Median Income |
| 15 to 24 Years | 6 (3.8%) | $0 |
| 25 to 44 Years | 37 (23.3%) | $100,417 |
| 45 to 64 Years | 53 (33.3%) | $42,813 |
| 65+ Years | 63 (39.6%) | $41,250 |
| Total | 159 (100.0%) | $42,344 |
Poverty in Millport
Income Below Poverty by Sex and Age in Millport
With 10.1% poverty level for males and 7.2% for females among the residents of Millport, 6 to 11 year old males and 16 and 17 year old females are the most vulnerable to poverty, with 6 males (23.1%) and 3 females (60.0%) in their respective age groups living below the poverty level.
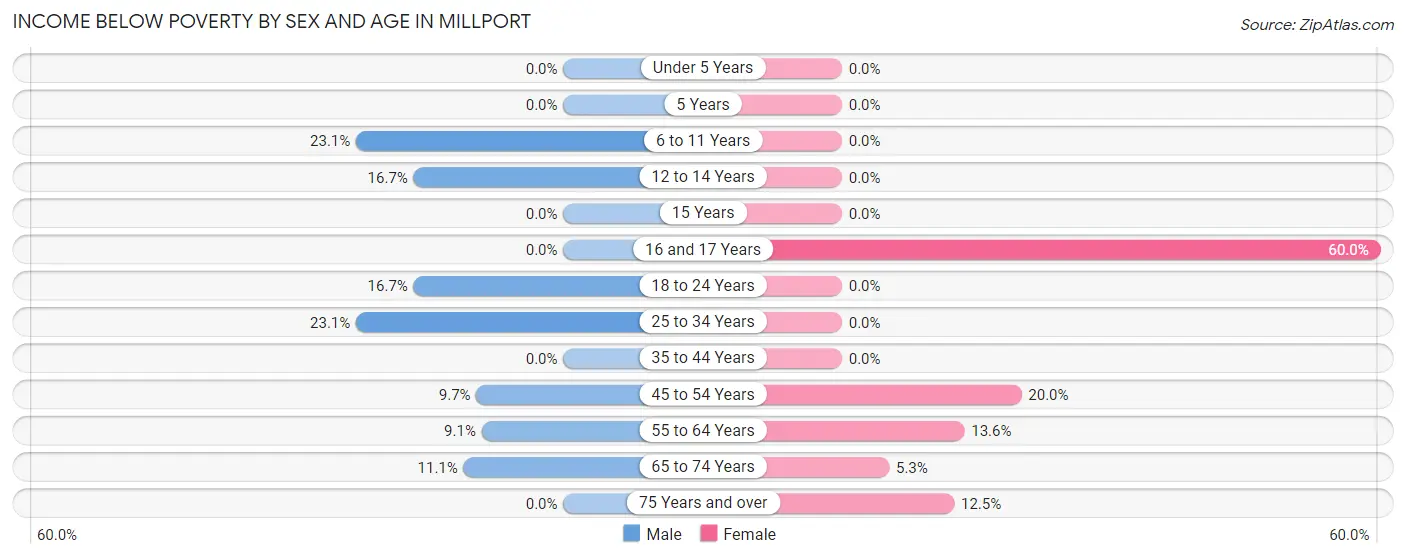
| Age Bracket | Male | Female |
| Under 5 Years | 0 (0.0%) | 0 (0.0%) |
| 5 Years | 0 (0.0%) | 0 (0.0%) |
| 6 to 11 Years | 6 (23.1%) | 0 (0.0%) |
| 12 to 14 Years | 3 (16.7%) | 0 (0.0%) |
| 15 Years | 0 (0.0%) | 0 (0.0%) |
| 16 and 17 Years | 0 (0.0%) | 3 (60.0%) |
| 18 to 24 Years | 3 (16.7%) | 0 (0.0%) |
| 25 to 34 Years | 3 (23.1%) | 0 (0.0%) |
| 35 to 44 Years | 0 (0.0%) | 0 (0.0%) |
| 45 to 54 Years | 3 (9.7%) | 4 (20.0%) |
| 55 to 64 Years | 2 (9.1%) | 3 (13.6%) |
| 65 to 74 Years | 2 (11.1%) | 3 (5.3%) |
| 75 Years and over | 0 (0.0%) | 2 (12.5%) |
| Total | 22 (10.1%) | 15 (7.2%) |
Income Above Poverty by Sex and Age in Millport
According to the poverty statistics in Millport, males aged under 5 years and females aged under 5 years are the age groups that are most secure financially, with 100.0% of males and 100.0% of females in these age groups living above the poverty line.
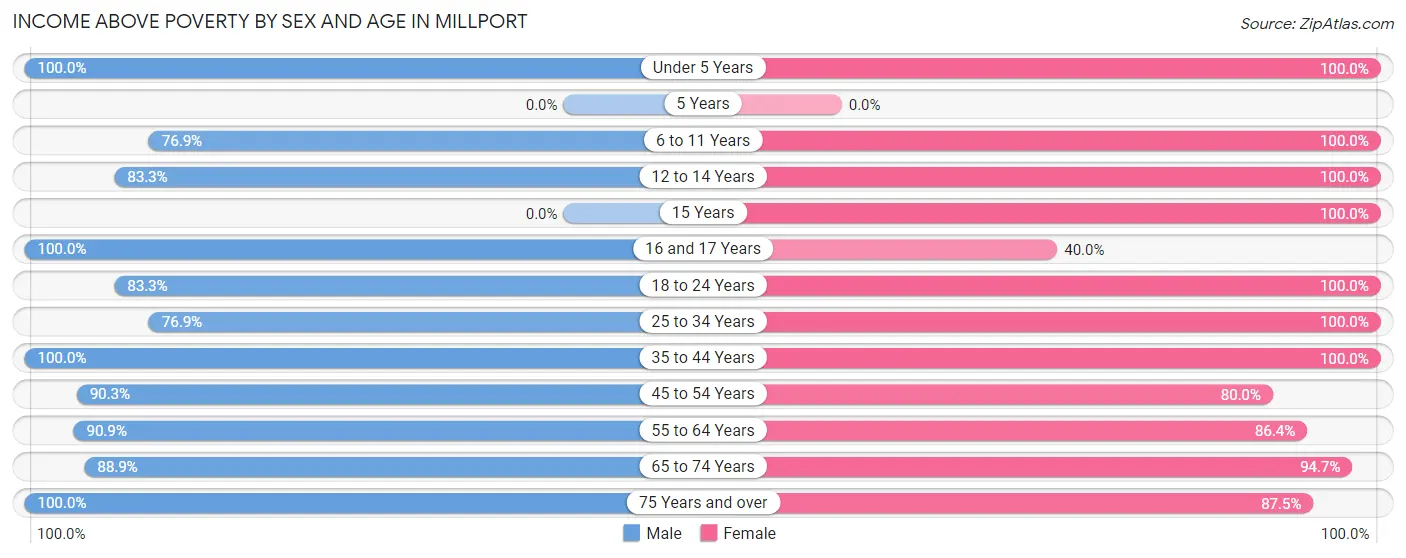
| Age Bracket | Male | Female |
| Under 5 Years | 4 (100.0%) | 4 (100.0%) |
| 5 Years | 0 (0.0%) | 0 (0.0%) |
| 6 to 11 Years | 20 (76.9%) | 12 (100.0%) |
| 12 to 14 Years | 15 (83.3%) | 20 (100.0%) |
| 15 Years | 0 (0.0%) | 10 (100.0%) |
| 16 and 17 Years | 7 (100.0%) | 2 (40.0%) |
| 18 to 24 Years | 15 (83.3%) | 3 (100.0%) |
| 25 to 34 Years | 10 (76.9%) | 12 (100.0%) |
| 35 to 44 Years | 13 (100.0%) | 27 (100.0%) |
| 45 to 54 Years | 28 (90.3%) | 16 (80.0%) |
| 55 to 64 Years | 20 (90.9%) | 19 (86.4%) |
| 65 to 74 Years | 16 (88.9%) | 54 (94.7%) |
| 75 Years and over | 47 (100.0%) | 14 (87.5%) |
| Total | 195 (89.9%) | 193 (92.8%) |
Income Below Poverty Among Married-Couple Families in Millport
The poverty statistics for married-couple families in Millport show that 12.3% or 7 of the total 57 families live below the poverty line. Families with 3 or 4 children have the highest poverty rate of 40.0%, comprising of 4 families. On the other hand, families with 1 or 2 children have the lowest poverty rate of 3.8%, which includes 1 families.
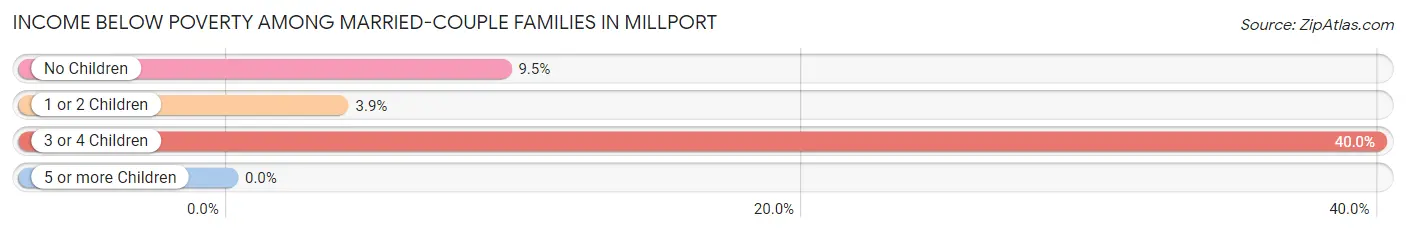
| Children | Above Poverty | Below Poverty |
| No Children | 19 (90.5%) | 2 (9.5%) |
| 1 or 2 Children | 25 (96.2%) | 1 (3.8%) |
| 3 or 4 Children | 6 (60.0%) | 4 (40.0%) |
| 5 or more Children | 0 (0.0%) | 0 (0.0%) |
| Total | 50 (87.7%) | 7 (12.3%) |
Income Below Poverty Among Single-Parent Households in Millport
| Children | Single Father | Single Mother |
| No Children | 0 (0.0%) | 0 (0.0%) |
| 1 or 2 Children | 0 (0.0%) | 0 (0.0%) |
| 3 or 4 Children | 0 (0.0%) | 0 (0.0%) |
| 5 or more Children | 0 (0.0%) | 0 (0.0%) |
| Total | 0 (0.0%) | 0 (0.0%) |
Income Below Poverty Among Married-Couple vs Single-Parent Households in Millport
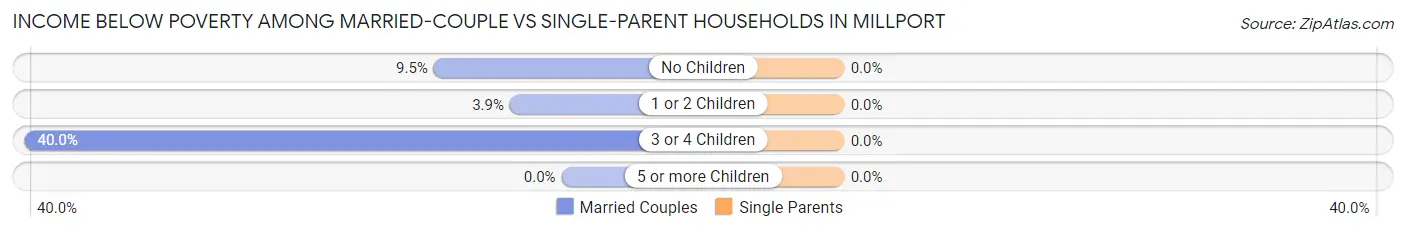
| Children | Married-Couple Families | Single-Parent Households |
| No Children | 2 (9.5%) | 0 (0.0%) |
| 1 or 2 Children | 1 (3.8%) | 0 (0.0%) |
| 3 or 4 Children | 4 (40.0%) | 0 (0.0%) |
| 5 or more Children | 0 (0.0%) | 0 (0.0%) |
| Total | 7 (12.3%) | 0 (0.0%) |
Race in Millport
The most populous races in Millport are White / Caucasian (406 | 95.5%), Two or more Races (10 | 2.4%), and Native / Alaskan (7 | 1.7%).
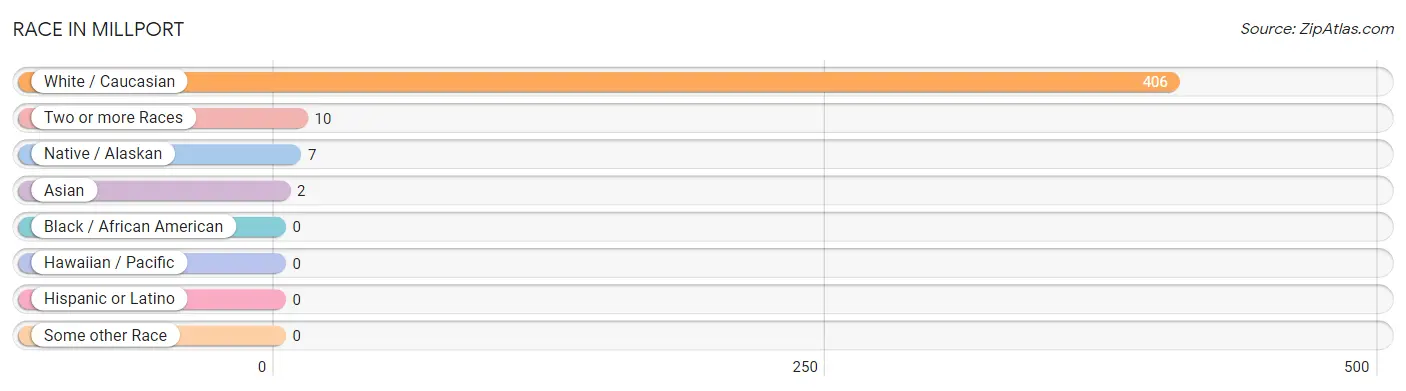
| Race | # Population | % Population |
| Asian | 2 | 0.5% |
| Black / African American | 0 | 0.0% |
| Hawaiian / Pacific | 0 | 0.0% |
| Hispanic or Latino | 0 | 0.0% |
| Native / Alaskan | 7 | 1.7% |
| White / Caucasian | 406 | 95.5% |
| Two or more Races | 10 | 2.4% |
| Some other Race | 0 | 0.0% |
| Total | 425 | 100.0% |
Ancestry in Millport
The most populous ancestries reported in Millport are Irish (79 | 18.6%), German (67 | 15.8%), American (49 | 11.5%), English (49 | 11.5%), and Italian (19 | 4.5%), together accounting for 61.9% of all Millport residents.
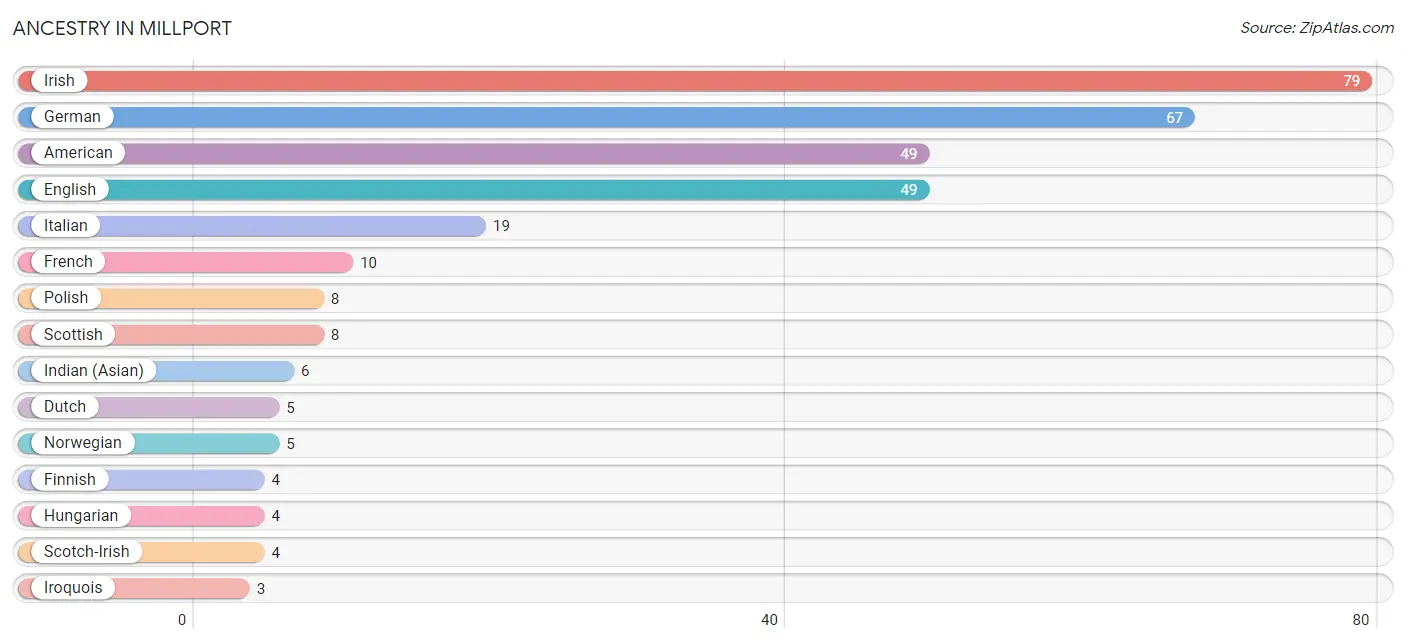
| Ancestry | # Population | % Population |
| American | 49 | 11.5% |
| Dutch | 5 | 1.2% |
| English | 49 | 11.5% |
| Finnish | 4 | 0.9% |
| French | 10 | 2.4% |
| German | 67 | 15.8% |
| Hungarian | 4 | 0.9% |
| Indian (Asian) | 6 | 1.4% |
| Irish | 79 | 18.6% |
| Iroquois | 3 | 0.7% |
| Italian | 19 | 4.5% |
| Norwegian | 5 | 1.2% |
| Polish | 8 | 1.9% |
| Scotch-Irish | 4 | 0.9% |
| Scottish | 8 | 1.9% | View All 15 Rows |
Immigrants in Millport
The most numerous immigrant groups reported in Millport came from , and Canada (1 | 0.2%), together accounting for 0.2% of all Millport residents.

| Immigration Origin | # Population | % Population |
| Canada | 1 | 0.2% | View All 1 Rows |
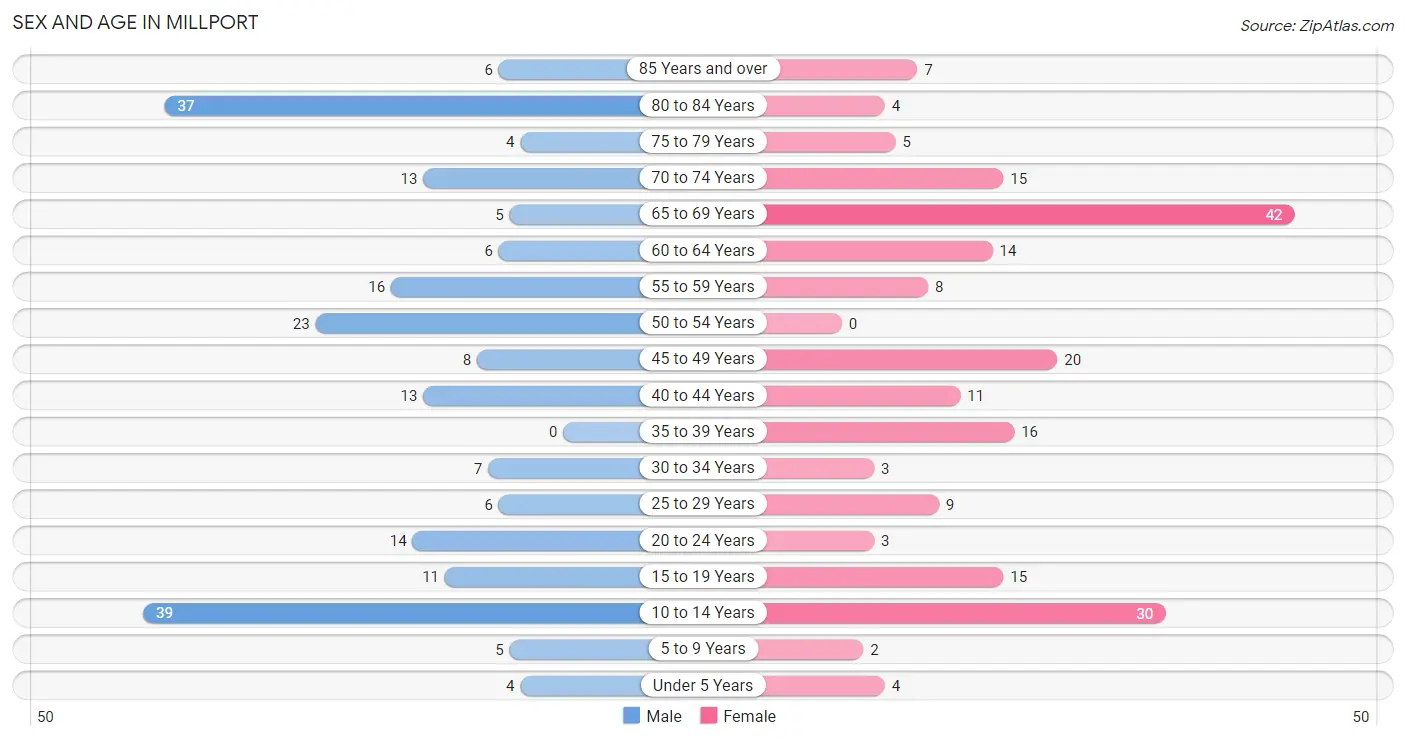
Sex and Age in Millport
Sex and Age in Millport
The most populous age groups in Millport are 10 to 14 Years (39 | 18.0%) for men and 65 to 69 Years (42 | 20.2%) for women.
| Age Bracket | Male | Female |
| Under 5 Years | 4 (1.8%) | 4 (1.9%) |
| 5 to 9 Years | 5 (2.3%) | 2 (1.0%) |
| 10 to 14 Years | 39 (18.0%) | 30 (14.4%) |
| 15 to 19 Years | 11 (5.1%) | 15 (7.2%) |
| 20 to 24 Years | 14 (6.5%) | 3 (1.4%) |
| 25 to 29 Years | 6 (2.8%) | 9 (4.3%) |
| 30 to 34 Years | 7 (3.2%) | 3 (1.4%) |
| 35 to 39 Years | 0 (0.0%) | 16 (7.7%) |
| 40 to 44 Years | 13 (6.0%) | 11 (5.3%) |
| 45 to 49 Years | 8 (3.7%) | 20 (9.6%) |
| 50 to 54 Years | 23 (10.6%) | 0 (0.0%) |
| 55 to 59 Years | 16 (7.4%) | 8 (3.8%) |
| 60 to 64 Years | 6 (2.8%) | 14 (6.7%) |
| 65 to 69 Years | 5 (2.3%) | 42 (20.2%) |
| 70 to 74 Years | 13 (6.0%) | 15 (7.2%) |
| 75 to 79 Years | 4 (1.8%) | 5 (2.4%) |
| 80 to 84 Years | 37 (17.1%) | 4 (1.9%) |
| 85 Years and over | 6 (2.8%) | 7 (3.4%) |
| Total | 217 (100.0%) | 208 (100.0%) |
Families and Households in Millport
Median Family Size in Millport
The median family size in Millport is 3.35 persons per family, with single female/mother families (22 | 23.9%) accounting for the largest median family size of 3.82 persons per family. On the other hand, single male/father families (13 | 14.1%) represent the smallest median family size with 2.08 persons per family.
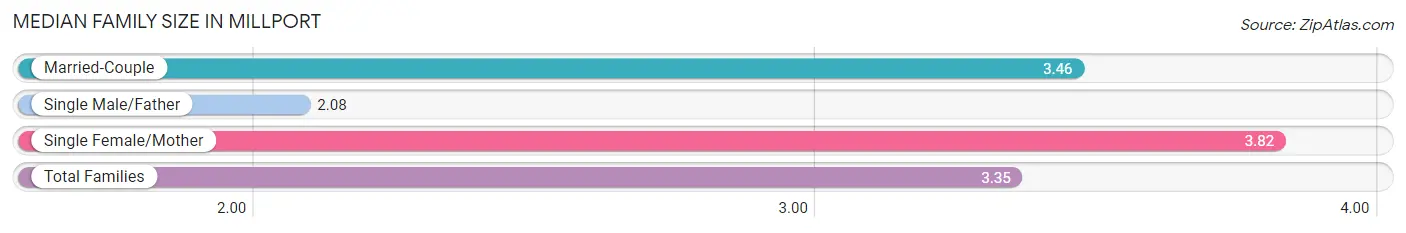
| Family Type | # Families | Family Size |
| Married-Couple | 57 (62.0%) | 3.46 |
| Single Male/Father | 13 (14.1%) | 2.08 |
| Single Female/Mother | 22 (23.9%) | 3.82 |
| Total Families | 92 (100.0%) | 3.35 |
Median Household Size in Millport
The median household size in Millport is 2.67 persons per household, with single female/mother households (22 | 13.8%) accounting for the largest median household size of 4.18 persons per household. non-family households (67 | 42.1%) represent the smallest median household size with 1.57 persons per household.
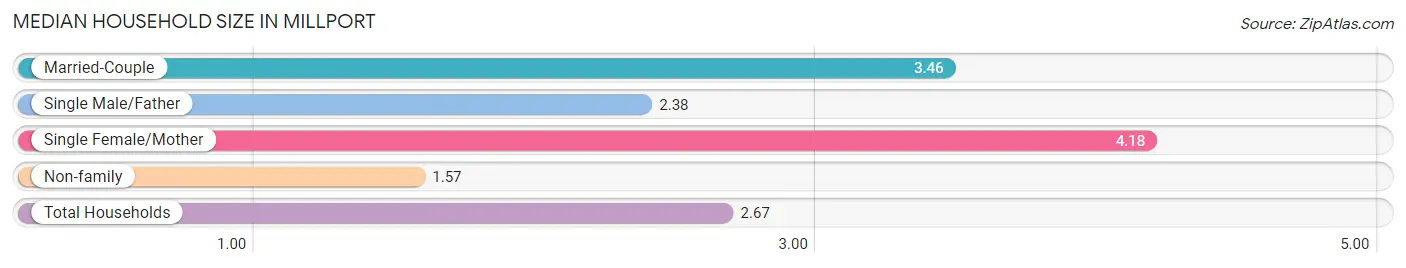
| Household Type | # Households | Household Size |
| Married-Couple | 57 (35.8%) | 3.46 |
| Single Male/Father | 13 (8.2%) | 2.38 |
| Single Female/Mother | 22 (13.8%) | 4.18 |
| Non-family | 67 (42.1%) | 1.57 |
| Total Households | 159 (100.0%) | 2.67 |
Household Size by Marriage Status in Millport
Out of a total of 159 households in Millport, 92 (57.9%) are family households, while 67 (42.1%) are nonfamily households. The most numerous type of family households are 2-person households, comprising 28, and the most common type of nonfamily households are 1-person households, comprising 34.
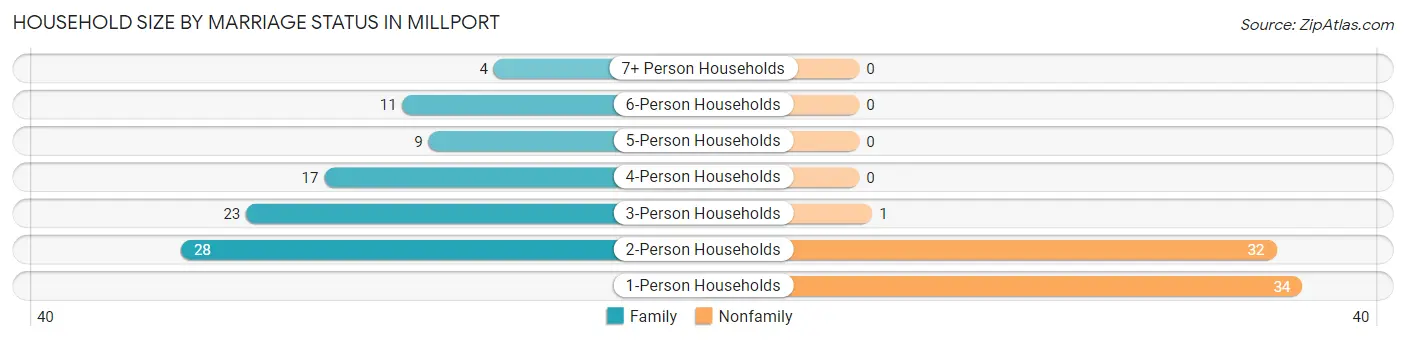
| Household Size | Family Households | Nonfamily Households |
| 1-Person Households | - | 34 (21.4%) |
| 2-Person Households | 28 (17.6%) | 32 (20.1%) |
| 3-Person Households | 23 (14.5%) | 1 (0.6%) |
| 4-Person Households | 17 (10.7%) | 0 (0.0%) |
| 5-Person Households | 9 (5.7%) | 0 (0.0%) |
| 6-Person Households | 11 (6.9%) | 0 (0.0%) |
| 7+ Person Households | 4 (2.5%) | 0 (0.0%) |
| Total | 92 (57.9%) | 67 (42.1%) |
Female Fertility in Millport
Fertility by Age in Millport
| Age Bracket | Women with Births | Births / 1,000 Women |
| 15 to 19 years | 0 (0.0%) | 0.0 |
| 20 to 34 years | 0 (0.0%) | 0.0 |
| 35 to 50 years | 0 (0.0%) | 0.0 |
| Total | 0 (0.0%) | 0.0 |
Fertility by Age by Marriage Status in Millport
| Age Bracket | Married | Unmarried |
| 15 to 19 years | 0 (0.0%) | 0 (0.0%) |
| 20 to 34 years | 0 (0.0%) | 0 (0.0%) |
| 35 to 50 years | 0 (0.0%) | 0 (0.0%) |
| Total | 0 (0.0%) | 0 (0.0%) |
Fertility by Education in Millport
| Educational Attainment | Women with Births | Births / 1,000 Women |
| Less than High School | 0 (0.0%) | 0.0 |
| High School Diploma | 0 (0.0%) | 0.0 |
| College or Associate's Degree | 0 (0.0%) | 0.0 |
| Bachelor's Degree | 0 (0.0%) | 0.0 |
| Graduate Degree | 0 (0.0%) | 0.0 |
| Total | 0 (0.0%) | 0.0 |
Fertility by Education by Marriage Status in Millport
| Educational Attainment | Married | Unmarried |
| Less than High School | 0 (0.0%) | 0 (0.0%) |
| High School Diploma | 0 (0.0%) | 0 (0.0%) |
| College or Associate's Degree | 0 (0.0%) | 0 (0.0%) |
| Bachelor's Degree | 0 (0.0%) | 0 (0.0%) |
| Graduate Degree | 0 (0.0%) | 0 (0.0%) |
| Total | 0 (0.0%) | 0 (0.0%) |
Employment Characteristics in Millport
Employment by Class of Employer in Millport
Among the 135 employed individuals in Millport, private company employees (80 | 59.3%), local government employees (20 | 14.8%), and self-employed (not incorporated) (12 | 8.9%) make up the most common classes of employment.
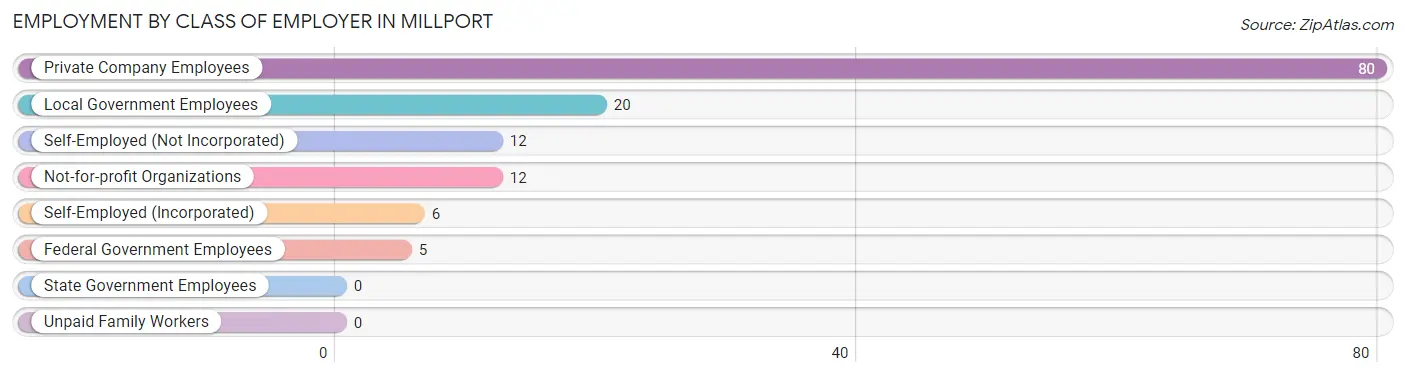
| Employer Class | # Employees | % Employees |
| Private Company Employees | 80 | 59.3% |
| Self-Employed (Incorporated) | 6 | 4.4% |
| Self-Employed (Not Incorporated) | 12 | 8.9% |
| Not-for-profit Organizations | 12 | 8.9% |
| Local Government Employees | 20 | 14.8% |
| State Government Employees | 0 | 0.0% |
| Federal Government Employees | 5 | 3.7% |
| Unpaid Family Workers | 0 | 0.0% |
| Total | 135 | 100.0% |
Employment Status by Age in Millport
According to the labor force statistics for Millport, out of the total population over 16 years of age (331), 48.0% or 159 individuals are in the labor force, with 12.6% or 20 of them unemployed. The age group with the highest labor force participation rate is 20 to 24 years, with 100.0% or 17 individuals in the labor force. Within the labor force, the 20 to 24 years age range has the highest percentage of unemployed individuals, with 41.2% or 7 of them being unemployed.
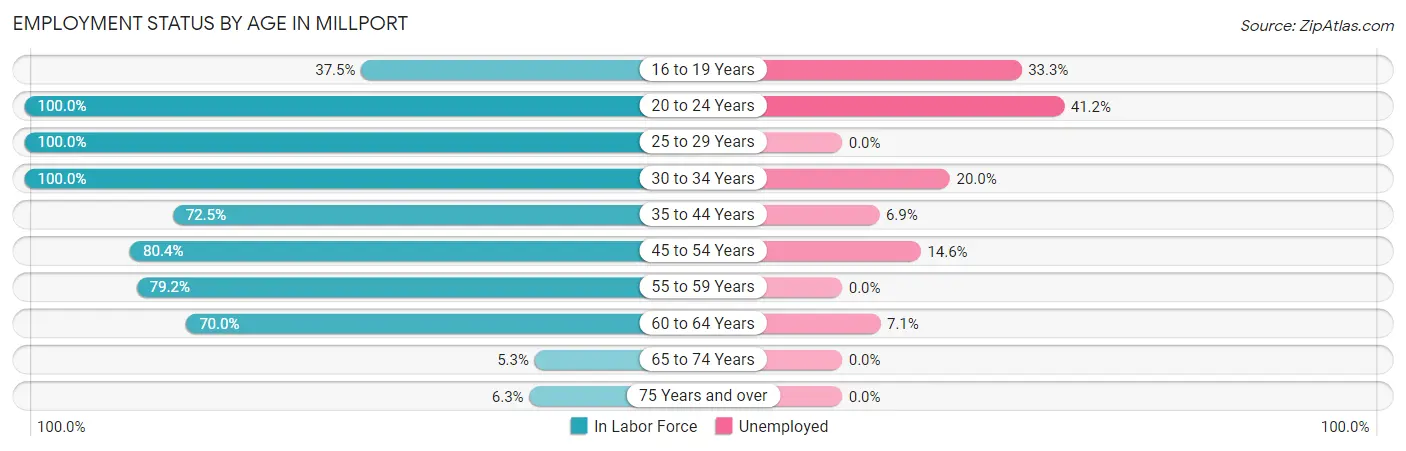
| Age Bracket | In Labor Force | Unemployed |
| 16 to 19 Years | 6 (37.5%) | 2 (33.3%) |
| 20 to 24 Years | 17 (100.0%) | 7 (41.2%) |
| 25 to 29 Years | 15 (100.0%) | 0 (0.0%) |
| 30 to 34 Years | 10 (100.0%) | 2 (20.0%) |
| 35 to 44 Years | 29 (72.5%) | 2 (6.9%) |
| 45 to 54 Years | 41 (80.4%) | 6 (14.6%) |
| 55 to 59 Years | 19 (79.2%) | 0 (0.0%) |
| 60 to 64 Years | 14 (70.0%) | 1 (7.1%) |
| 65 to 74 Years | 4 (5.3%) | 0 (0.0%) |
| 75 Years and over | 4 (6.3%) | 0 (0.0%) |
| Total | 159 (48.0%) | 20 (12.6%) |
Employment Status by Educational Attainment in Millport
According to labor force statistics for Millport, 80.0% of individuals (128) out of the total population between 25 and 64 years of age (160) are in the labor force, with 8.6% or 11 of them being unemployed. The group with the highest labor force participation rate are those with the educational attainment of less than high school, with 100.0% or 11 individuals in the labor force. Within the labor force, individuals with bachelor's degree or higher education have the highest percentage of unemployment, with 28.6% or 6 of them being unemployed.
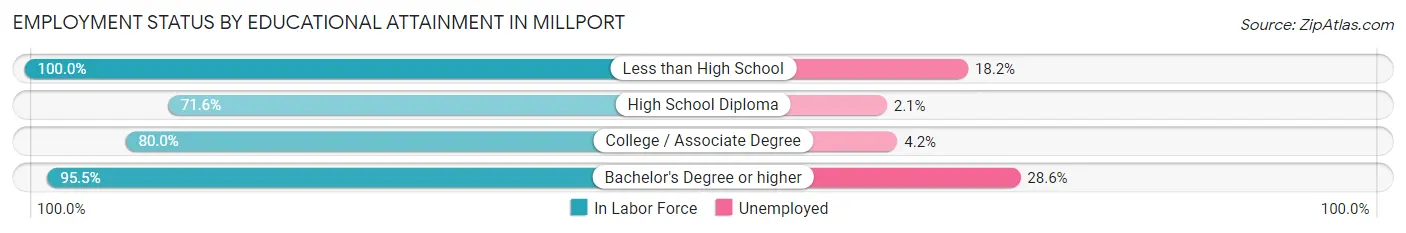
| Educational Attainment | In Labor Force | Unemployed |
| Less than High School | 11 (100.0%) | 2 (18.2%) |
| High School Diploma | 48 (71.6%) | 1 (2.1%) |
| College / Associate Degree | 48 (80.0%) | 3 (4.2%) |
| Bachelor's Degree or higher | 21 (95.5%) | 6 (28.6%) |
| Total | 128 (80.0%) | 14 (8.6%) |
Employment Occupations by Sex in Millport
Management, Business, Science and Arts Occupations
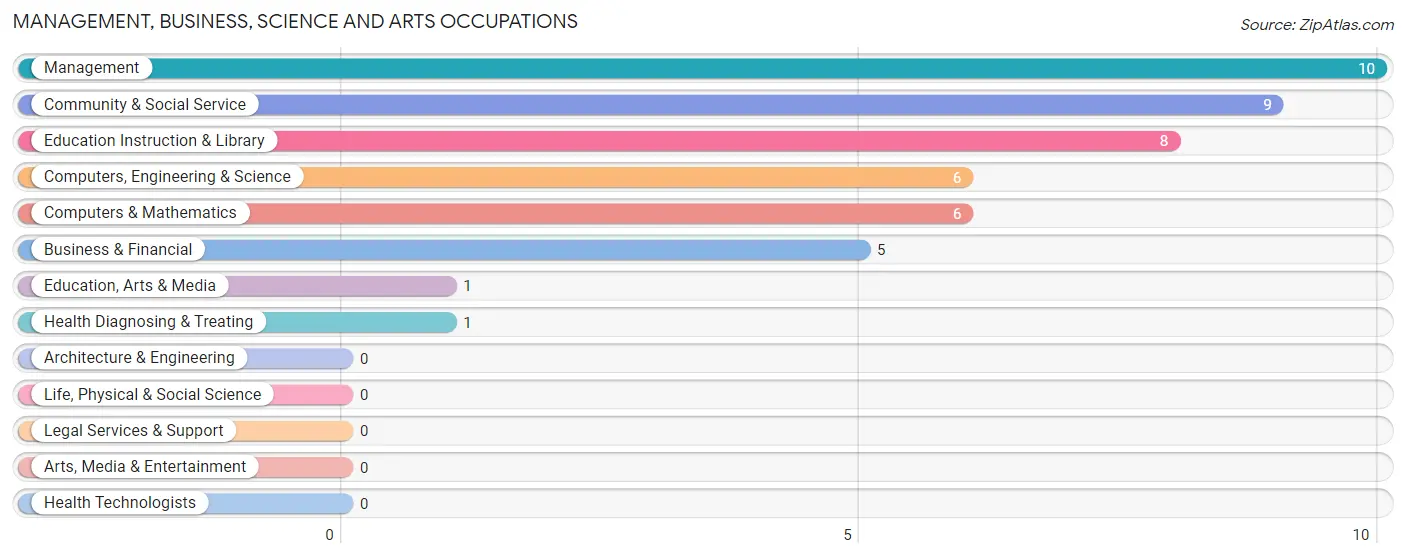
The most common Management, Business, Science and Arts occupations in Millport are Management (10 | 7.2%), Community & Social Service (9 | 6.5%), Education Instruction & Library (8 | 5.8%), Computers, Engineering & Science (6 | 4.3%), and Computers & Mathematics (6 | 4.3%).
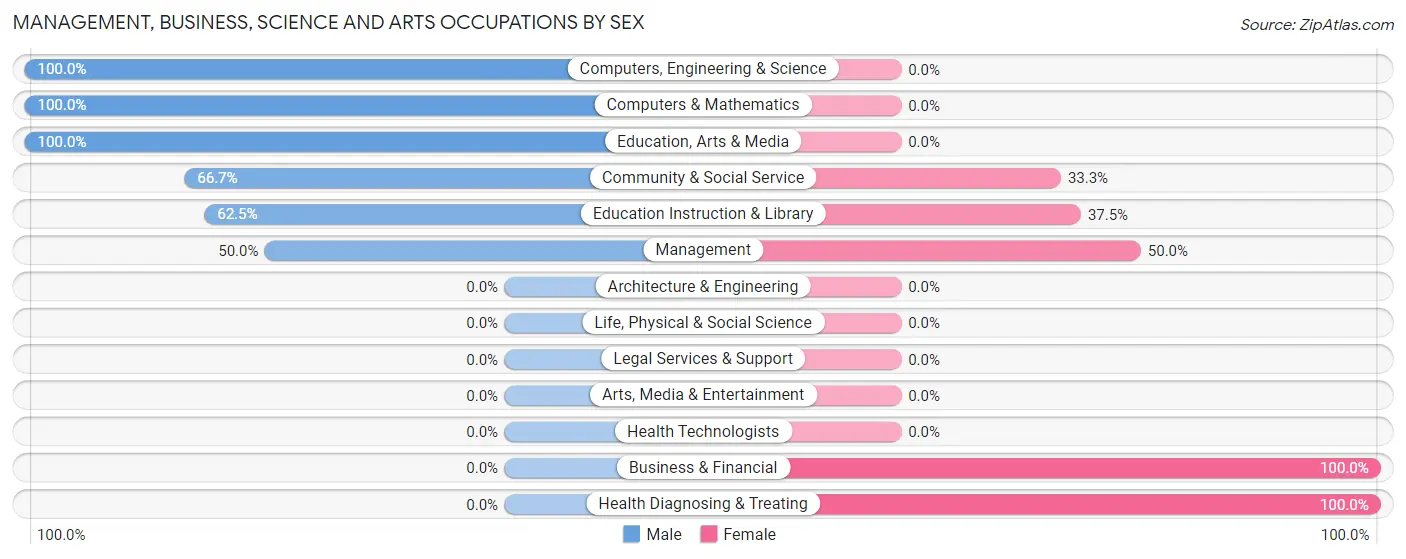
Management, Business, Science and Arts Occupations by Sex
Within the Management, Business, Science and Arts occupations in Millport, the most male-oriented occupations are Computers, Engineering & Science (100.0%), Computers & Mathematics (100.0%), and Education, Arts & Media (100.0%), while the most female-oriented occupations are Business & Financial (100.0%), Health Diagnosing & Treating (100.0%), and Management (50.0%).
| Occupation | Male | Female |
| Management | 5 (50.0%) | 5 (50.0%) |
| Business & Financial | 0 (0.0%) | 5 (100.0%) |
| Computers, Engineering & Science | 6 (100.0%) | 0 (0.0%) |
| Computers & Mathematics | 6 (100.0%) | 0 (0.0%) |
| Architecture & Engineering | 0 (0.0%) | 0 (0.0%) |
| Life, Physical & Social Science | 0 (0.0%) | 0 (0.0%) |
| Community & Social Service | 6 (66.7%) | 3 (33.3%) |
| Education, Arts & Media | 1 (100.0%) | 0 (0.0%) |
| Legal Services & Support | 0 (0.0%) | 0 (0.0%) |
| Education Instruction & Library | 5 (62.5%) | 3 (37.5%) |
| Arts, Media & Entertainment | 0 (0.0%) | 0 (0.0%) |
| Health Diagnosing & Treating | 0 (0.0%) | 1 (100.0%) |
| Health Technologists | 0 (0.0%) | 0 (0.0%) |
| Total (Category) | 17 (54.8%) | 14 (45.2%) |
| Total (Overall) | 85 (61.2%) | 54 (38.9%) |
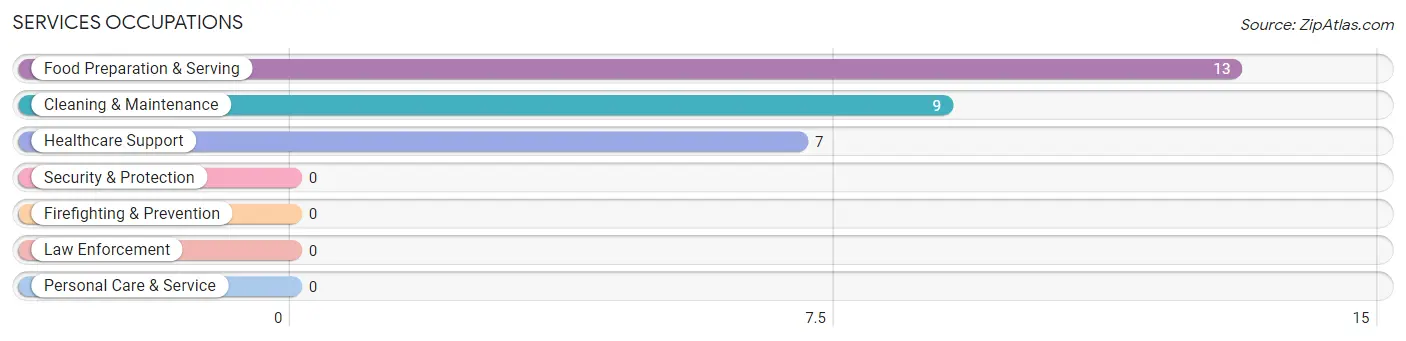
Services Occupations
The most common Services occupations in Millport are Food Preparation & Serving (13 | 9.3%), Cleaning & Maintenance (9 | 6.5%), and Healthcare Support (7 | 5.0%).
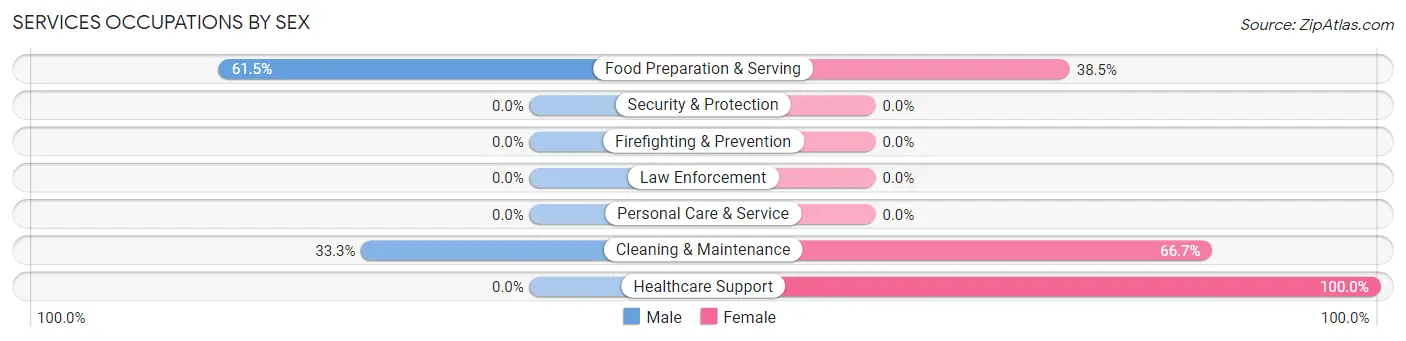
Services Occupations by Sex
Within the Services occupations in Millport, the most male-oriented occupations are Food Preparation & Serving (61.5%), and Cleaning & Maintenance (33.3%), while the most female-oriented occupations are Healthcare Support (100.0%), Cleaning & Maintenance (66.7%), and Food Preparation & Serving (38.5%).
| Occupation | Male | Female |
| Healthcare Support | 0 (0.0%) | 7 (100.0%) |
| Security & Protection | 0 (0.0%) | 0 (0.0%) |
| Firefighting & Prevention | 0 (0.0%) | 0 (0.0%) |
| Law Enforcement | 0 (0.0%) | 0 (0.0%) |
| Food Preparation & Serving | 8 (61.5%) | 5 (38.5%) |
| Cleaning & Maintenance | 3 (33.3%) | 6 (66.7%) |
| Personal Care & Service | 0 (0.0%) | 0 (0.0%) |
| Total (Category) | 11 (37.9%) | 18 (62.1%) |
| Total (Overall) | 85 (61.2%) | 54 (38.9%) |
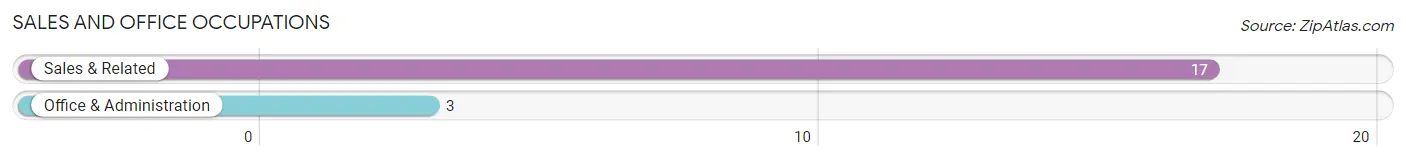
Sales and Office Occupations
The most common Sales and Office occupations in Millport are Sales & Related (17 | 12.2%), and Office & Administration (3 | 2.2%).
Sales and Office Occupations by Sex

| Occupation | Male | Female |
| Sales & Related | 6 (35.3%) | 11 (64.7%) |
| Office & Administration | 0 (0.0%) | 3 (100.0%) |
| Total (Category) | 6 (30.0%) | 14 (70.0%) |
| Total (Overall) | 85 (61.2%) | 54 (38.9%) |
Natural Resources, Construction and Maintenance Occupations
The most common Natural Resources, Construction and Maintenance occupations in Millport are Construction & Extraction (9 | 6.5%), Installation, Maintenance & Repair (7 | 5.0%), and Farming, Fishing & Forestry (1 | 0.7%).
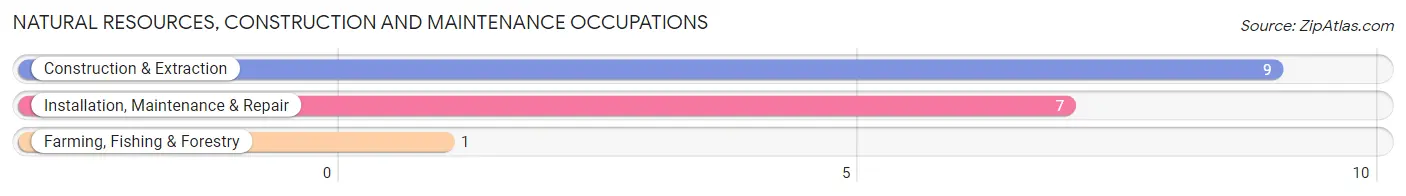
Natural Resources, Construction and Maintenance Occupations by Sex

| Occupation | Male | Female |
| Farming, Fishing & Forestry | 1 (100.0%) | 0 (0.0%) |
| Construction & Extraction | 9 (100.0%) | 0 (0.0%) |
| Installation, Maintenance & Repair | 7 (100.0%) | 0 (0.0%) |
| Total (Category) | 17 (100.0%) | 0 (0.0%) |
| Total (Overall) | 85 (61.2%) | 54 (38.9%) |
Production, Transportation and Moving Occupations
The most common Production, Transportation and Moving occupations in Millport are Production (31 | 22.3%), Material Moving (7 | 5.0%), and Transportation (4 | 2.9%).
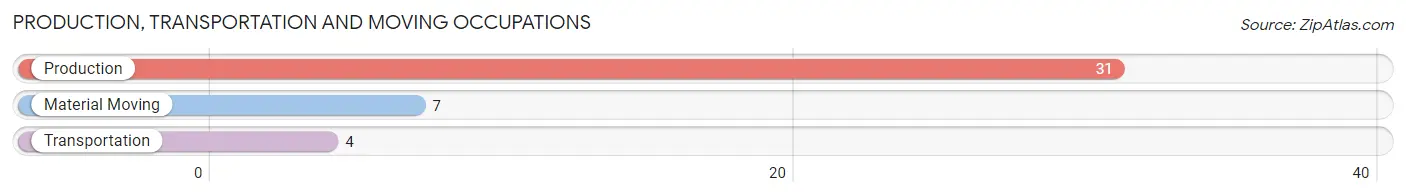
Production, Transportation and Moving Occupations by Sex
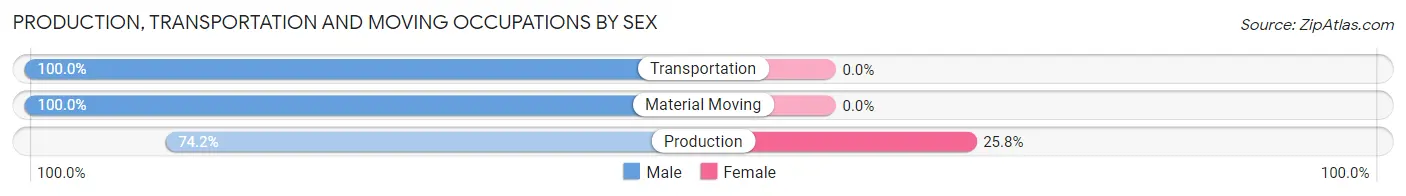
| Occupation | Male | Female |
| Production | 23 (74.2%) | 8 (25.8%) |
| Transportation | 4 (100.0%) | 0 (0.0%) |
| Material Moving | 7 (100.0%) | 0 (0.0%) |
| Total (Category) | 34 (80.9%) | 8 (19.1%) |
| Total (Overall) | 85 (61.2%) | 54 (38.9%) |
Employment Industries by Sex in Millport
Employment Industries in Millport
The major employment industries in Millport include Retail Trade (25 | 18.0%), Manufacturing (22 | 15.8%), Finance & Insurance (14 | 10.1%), Accommodation & Food Services (14 | 10.1%), and Educational Services (13 | 9.3%).
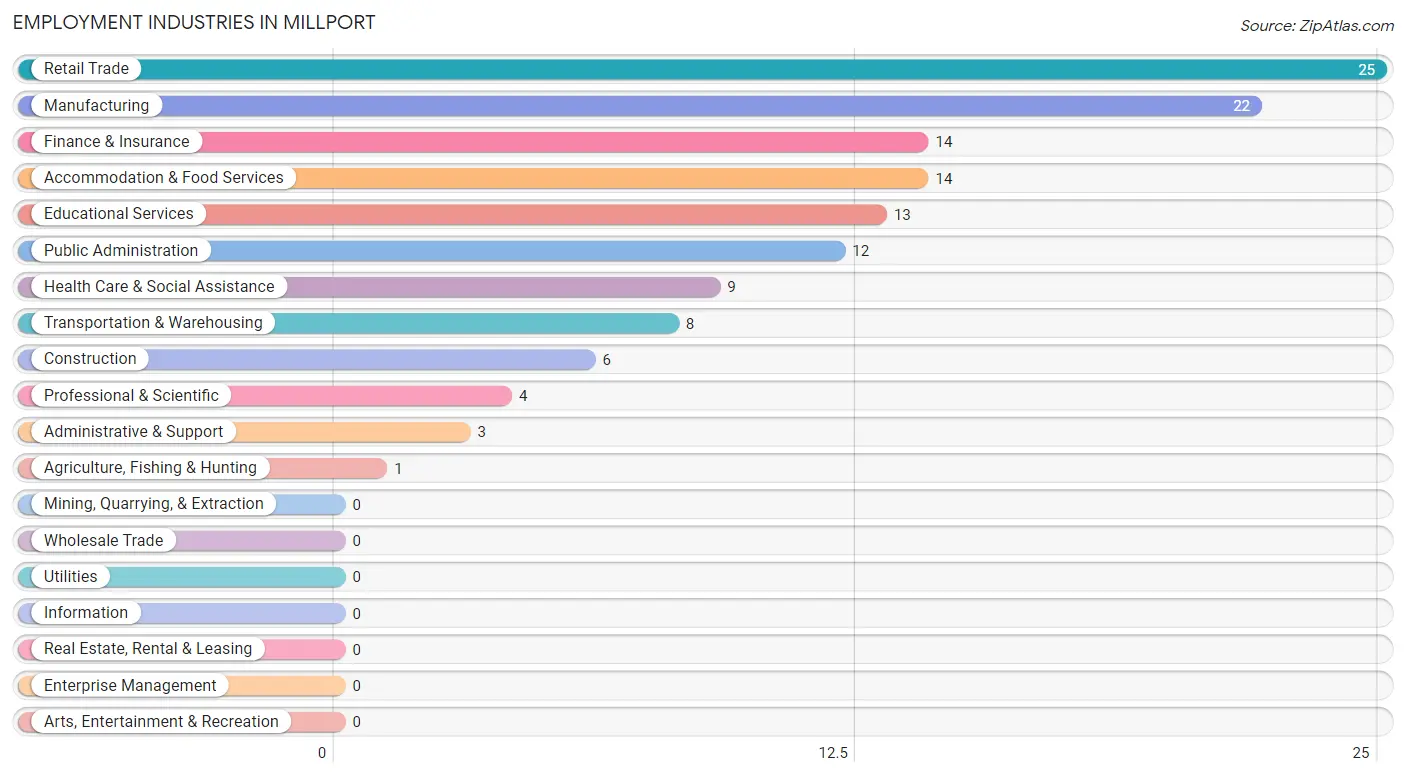
Employment Industries by Sex in Millport
The Millport industries that see more men than women are Agriculture, Fishing & Hunting (100.0%), Construction (100.0%), and Manufacturing (100.0%), whereas the industries that tend to have a higher number of women are Professional & Scientific (100.0%), Health Care & Social Assistance (100.0%), and Educational Services (61.5%).
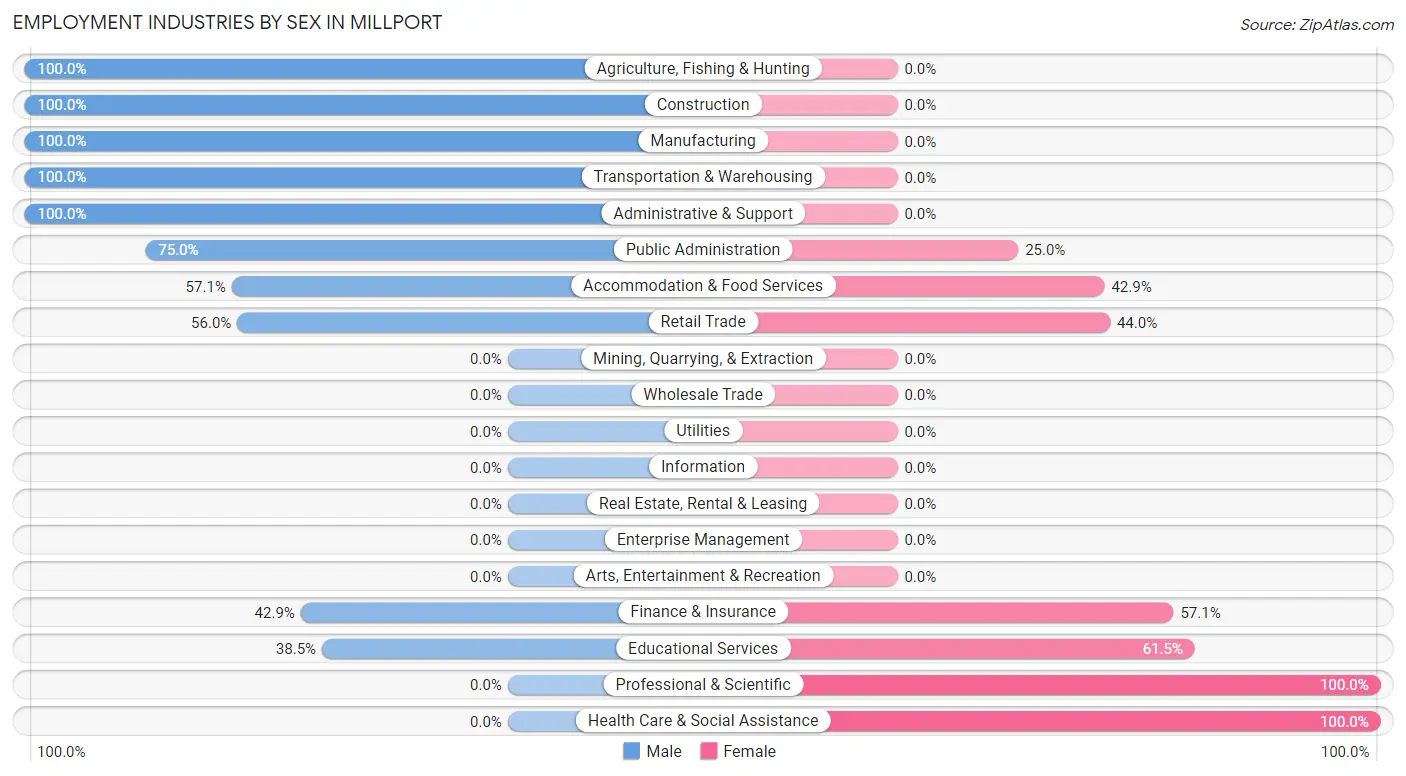
| Industry | Male | Female |
| Agriculture, Fishing & Hunting | 1 (100.0%) | 0 (0.0%) |
| Mining, Quarrying, & Extraction | 0 (0.0%) | 0 (0.0%) |
| Construction | 6 (100.0%) | 0 (0.0%) |
| Manufacturing | 22 (100.0%) | 0 (0.0%) |
| Wholesale Trade | 0 (0.0%) | 0 (0.0%) |
| Retail Trade | 14 (56.0%) | 11 (44.0%) |
| Transportation & Warehousing | 8 (100.0%) | 0 (0.0%) |
| Utilities | 0 (0.0%) | 0 (0.0%) |
| Information | 0 (0.0%) | 0 (0.0%) |
| Finance & Insurance | 6 (42.9%) | 8 (57.1%) |
| Real Estate, Rental & Leasing | 0 (0.0%) | 0 (0.0%) |
| Professional & Scientific | 0 (0.0%) | 4 (100.0%) |
| Enterprise Management | 0 (0.0%) | 0 (0.0%) |
| Administrative & Support | 3 (100.0%) | 0 (0.0%) |
| Educational Services | 5 (38.5%) | 8 (61.5%) |
| Health Care & Social Assistance | 0 (0.0%) | 9 (100.0%) |
| Arts, Entertainment & Recreation | 0 (0.0%) | 0 (0.0%) |
| Accommodation & Food Services | 8 (57.1%) | 6 (42.9%) |
| Public Administration | 9 (75.0%) | 3 (25.0%) |
| Total | 85 (61.2%) | 54 (38.9%) |
Education in Millport
School Enrollment in Millport
The most common levels of schooling among the 108 students in Millport are middle school (61 | 56.5%), high school (30 | 27.8%), and elementary school (7 | 6.5%).
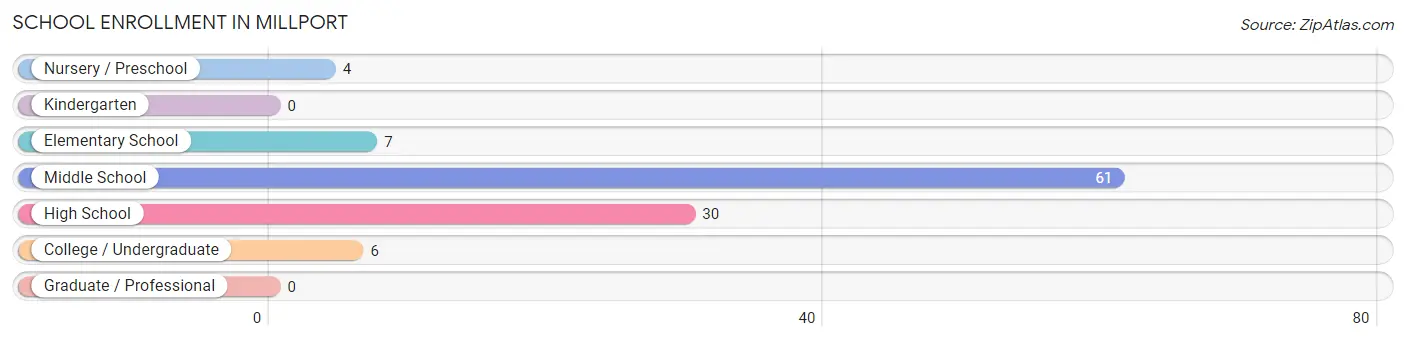
| School Level | # Students | % Students |
| Nursery / Preschool | 4 | 3.7% |
| Kindergarten | 0 | 0.0% |
| Elementary School | 7 | 6.5% |
| Middle School | 61 | 56.5% |
| High School | 30 | 27.8% |
| College / Undergraduate | 6 | 5.6% |
| Graduate / Professional | 0 | 0.0% |
| Total | 108 | 100.0% |
School Enrollment by Age by Funding Source in Millport
Out of a total of 108 students who are enrolled in schools in Millport, 8 (7.4%) attend a private institution, while the remaining 100 (92.6%) are enrolled in public schools. The age group of 5 to 9 year old has the highest likelihood of being enrolled in private schools, with 1 (14.3% in the age bracket) enrolled. Conversely, the age group of 3 to 4 year olds has the lowest likelihood of being enrolled in a private school, with 4 (100.0% in the age bracket) attending a public institution.
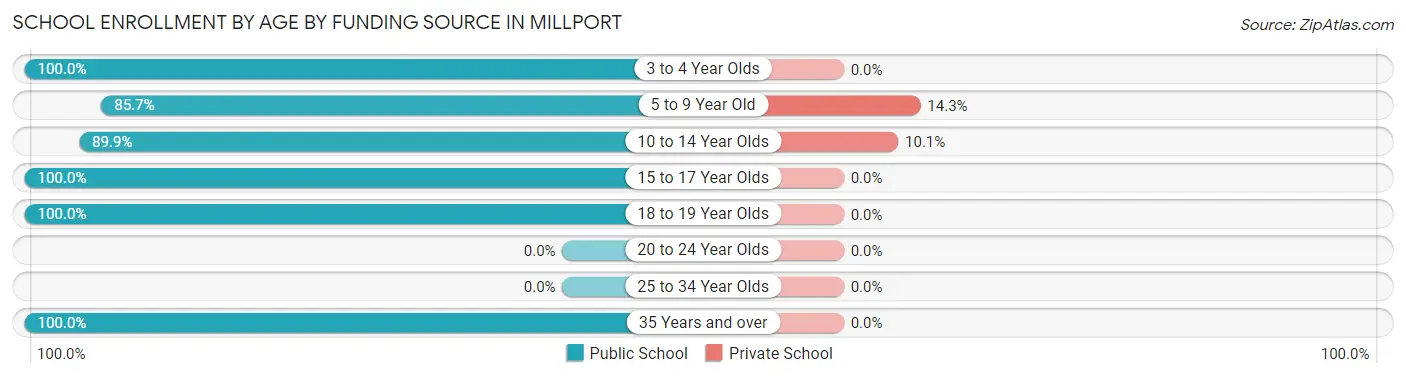
| Age Bracket | Public School | Private School |
| 3 to 4 Year Olds | 4 (100.0%) | 0 (0.0%) |
| 5 to 9 Year Old | 6 (85.7%) | 1 (14.3%) |
| 10 to 14 Year Olds | 62 (89.9%) | 7 (10.1%) |
| 15 to 17 Year Olds | 22 (100.0%) | 0 (0.0%) |
| 18 to 19 Year Olds | 3 (100.0%) | 0 (0.0%) |
| 20 to 24 Year Olds | 0 (0.0%) | 0 (0.0%) |
| 25 to 34 Year Olds | 0 (0.0%) | 0 (0.0%) |
| 35 Years and over | 3 (100.0%) | 0 (0.0%) |
| Total | 100 (92.6%) | 8 (7.4%) |
Educational Attainment by Field of Study in Millport
Psychology (11 | 47.8%), communications (4 | 17.4%), education (3 | 13.0%), liberal arts & history (3 | 13.0%), and social sciences (1 | 4.3%) are the most common fields of study among 23 individuals in Millport who have obtained a bachelor's degree or higher.
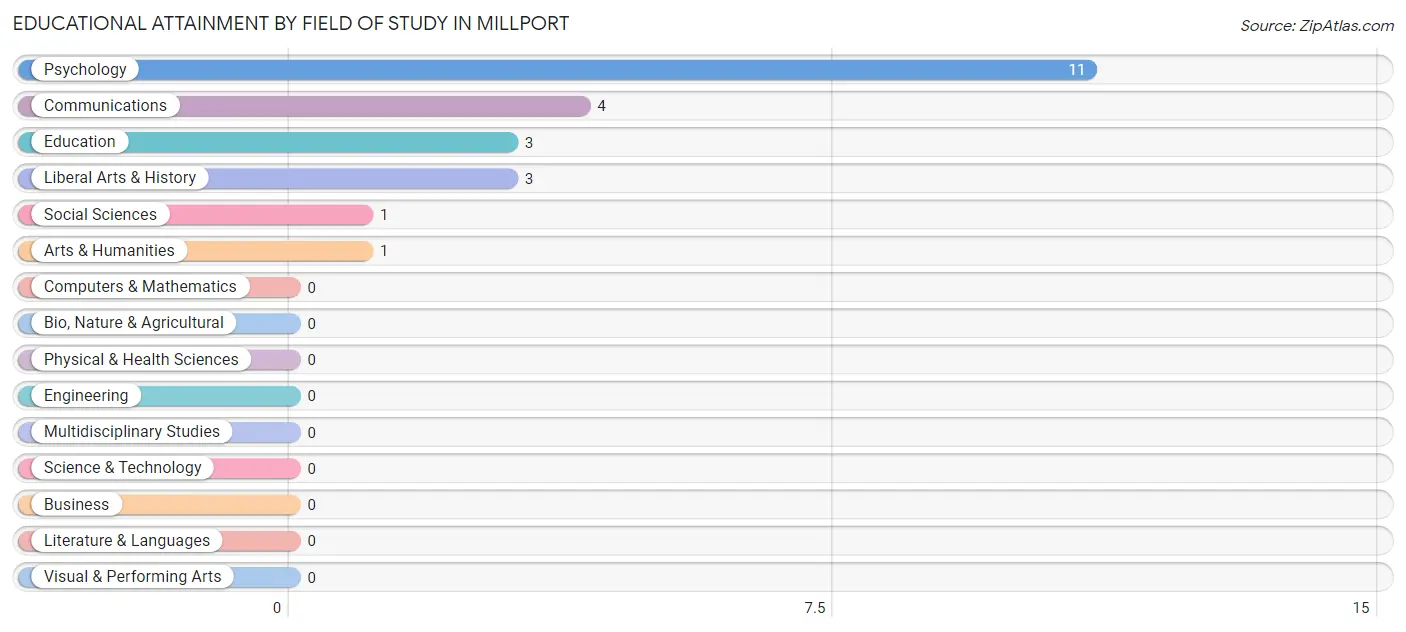
| Field of Study | # Graduates | % Graduates |
| Computers & Mathematics | 0 | 0.0% |
| Bio, Nature & Agricultural | 0 | 0.0% |
| Physical & Health Sciences | 0 | 0.0% |
| Psychology | 11 | 47.8% |
| Social Sciences | 1 | 4.3% |
| Engineering | 0 | 0.0% |
| Multidisciplinary Studies | 0 | 0.0% |
| Science & Technology | 0 | 0.0% |
| Business | 0 | 0.0% |
| Education | 3 | 13.0% |
| Literature & Languages | 0 | 0.0% |
| Liberal Arts & History | 3 | 13.0% |
| Visual & Performing Arts | 0 | 0.0% |
| Communications | 4 | 17.4% |
| Arts & Humanities | 1 | 4.3% |
| Total | 23 | 100.0% |
Transportation & Commute in Millport
Vehicle Availability by Sex in Millport
The most prevalent vehicle ownership categories in Millport are males with 2 vehicles (30, accounting for 37.0%) and females with 2 vehicles (34, making up 55.6%).
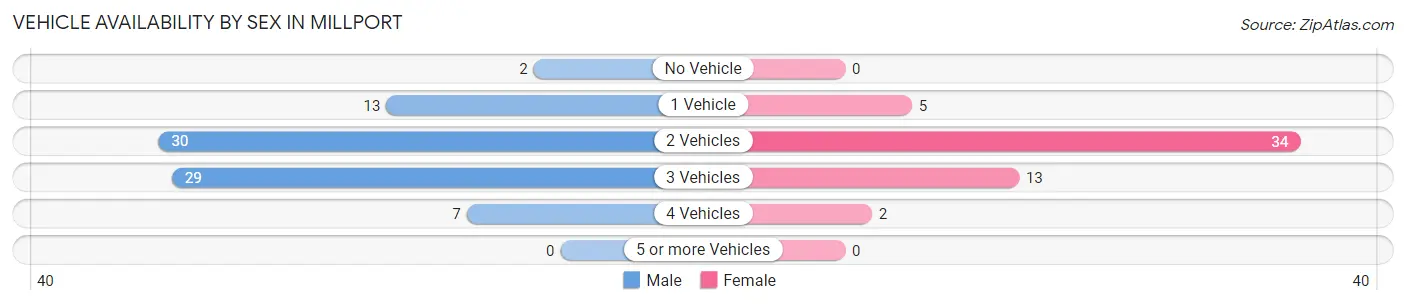
| Vehicles Available | Male | Female |
| No Vehicle | 2 (2.5%) | 0 (0.0%) |
| 1 Vehicle | 13 (16.1%) | 5 (9.3%) |
| 2 Vehicles | 30 (37.0%) | 34 (63.0%) |
| 3 Vehicles | 29 (35.8%) | 13 (24.1%) |
| 4 Vehicles | 7 (8.6%) | 2 (3.7%) |
| 5 or more Vehicles | 0 (0.0%) | 0 (0.0%) |
| Total | 81 (100.0%) | 54 (100.0%) |
Commute Time in Millport
The most frequently occuring commute durations in Millport are 20 to 24 minutes (44 commuters, 35.8%), 10 to 14 minutes (20 commuters, 16.3%), and 15 to 19 minutes (16 commuters, 13.0%).
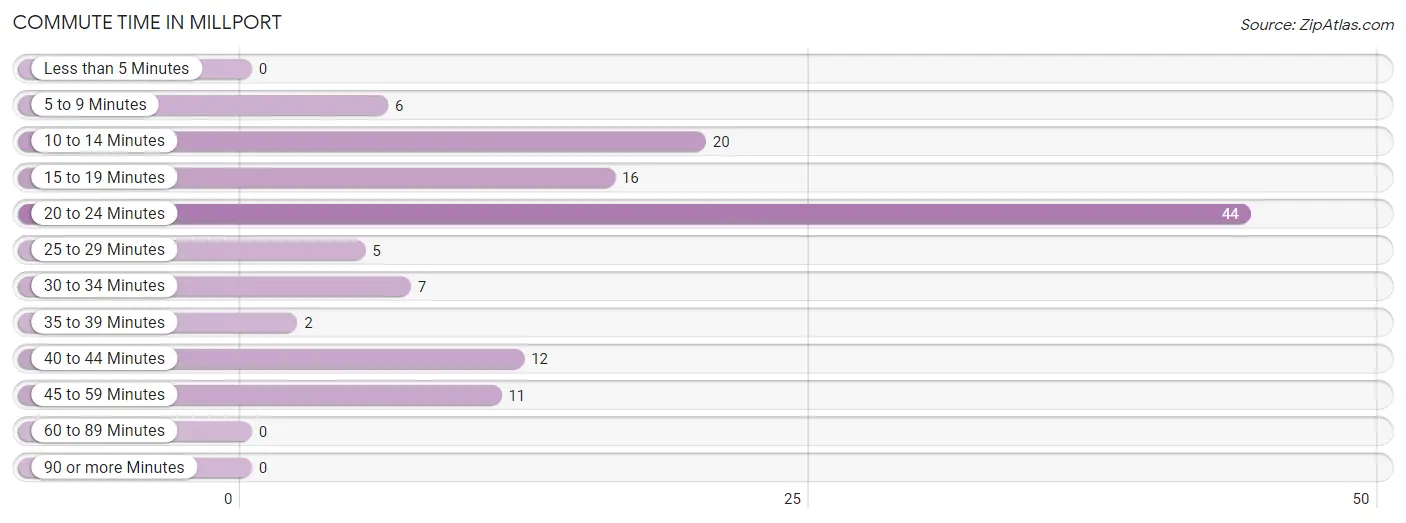
| Commute Time | # Commuters | % Commuters |
| Less than 5 Minutes | 0 | 0.0% |
| 5 to 9 Minutes | 6 | 4.9% |
| 10 to 14 Minutes | 20 | 16.3% |
| 15 to 19 Minutes | 16 | 13.0% |
| 20 to 24 Minutes | 44 | 35.8% |
| 25 to 29 Minutes | 5 | 4.1% |
| 30 to 34 Minutes | 7 | 5.7% |
| 35 to 39 Minutes | 2 | 1.6% |
| 40 to 44 Minutes | 12 | 9.8% |
| 45 to 59 Minutes | 11 | 8.9% |
| 60 to 89 Minutes | 0 | 0.0% |
| 90 or more Minutes | 0 | 0.0% |
Commute Time by Sex in Millport
The most common commute times in Millport are 10 to 14 minutes (14 commuters, 19.4%) for males and 20 to 24 minutes (33 commuters, 64.7%) for females.
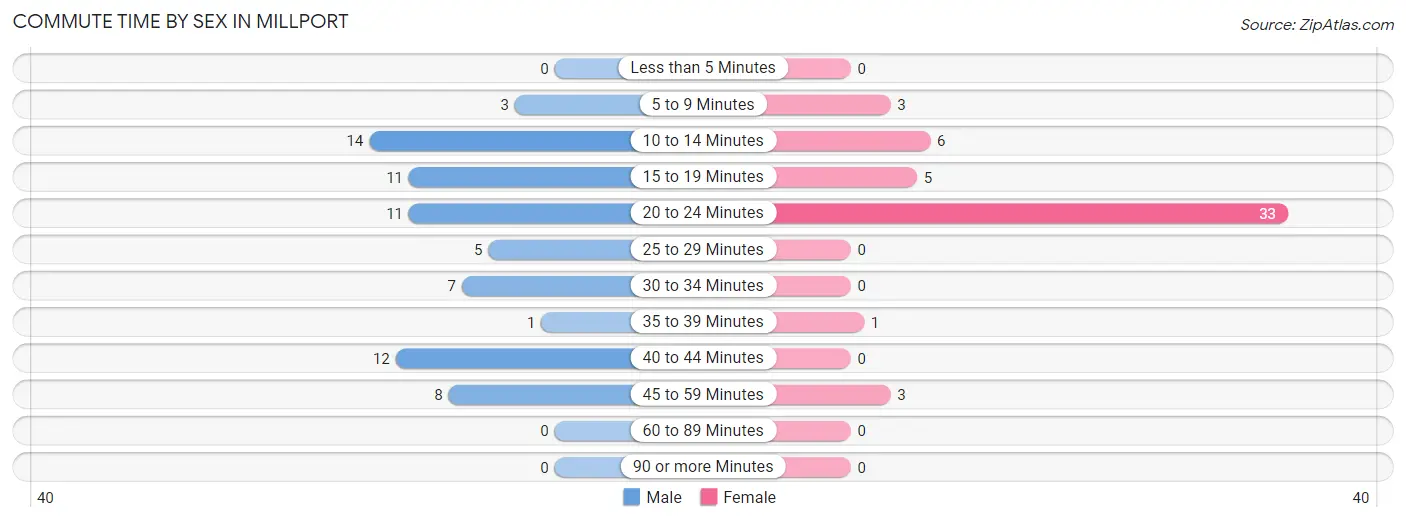
| Commute Time | Male | Female |
| Less than 5 Minutes | 0 (0.0%) | 0 (0.0%) |
| 5 to 9 Minutes | 3 (4.2%) | 3 (5.9%) |
| 10 to 14 Minutes | 14 (19.4%) | 6 (11.8%) |
| 15 to 19 Minutes | 11 (15.3%) | 5 (9.8%) |
| 20 to 24 Minutes | 11 (15.3%) | 33 (64.7%) |
| 25 to 29 Minutes | 5 (6.9%) | 0 (0.0%) |
| 30 to 34 Minutes | 7 (9.7%) | 0 (0.0%) |
| 35 to 39 Minutes | 1 (1.4%) | 1 (2.0%) |
| 40 to 44 Minutes | 12 (16.7%) | 0 (0.0%) |
| 45 to 59 Minutes | 8 (11.1%) | 3 (5.9%) |
| 60 to 89 Minutes | 0 (0.0%) | 0 (0.0%) |
| 90 or more Minutes | 0 (0.0%) | 0 (0.0%) |
Time of Departure to Work by Sex in Millport
The most frequent times of departure to work in Millport are 12:00 PM to 3:59 PM (17, 23.6%) for males and 7:30 AM to 7:59 AM (9, 17.6%) for females.
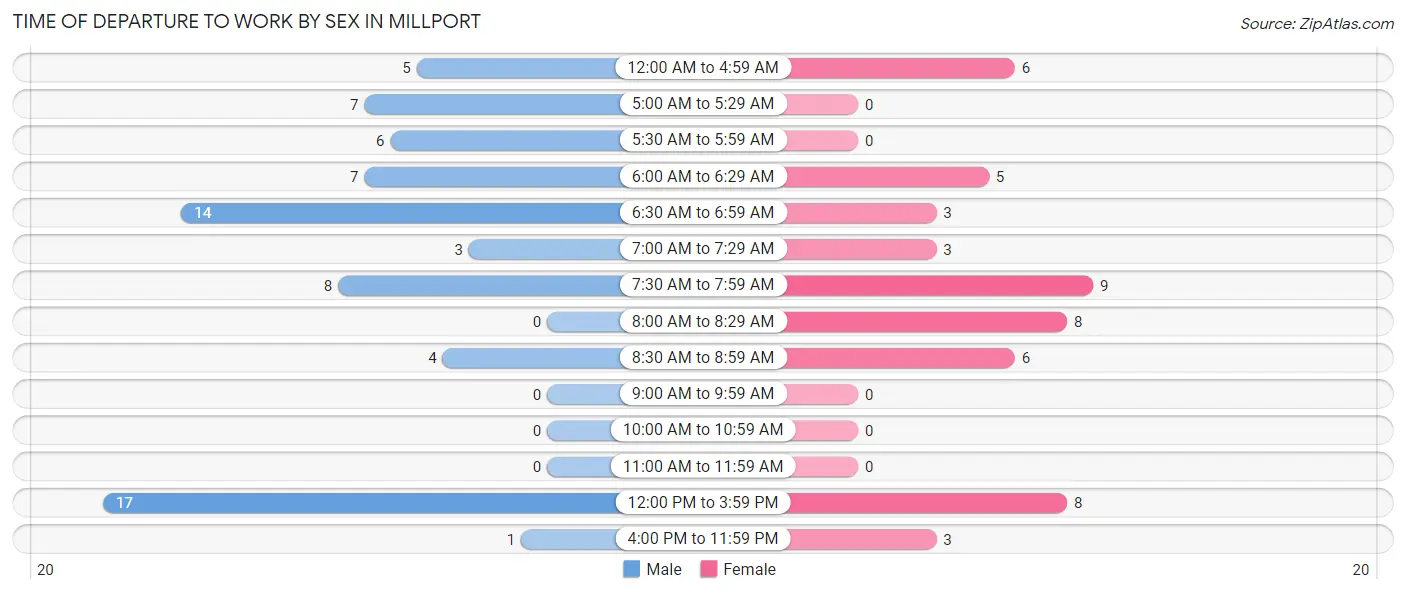
| Time of Departure | Male | Female |
| 12:00 AM to 4:59 AM | 5 (6.9%) | 6 (11.8%) |
| 5:00 AM to 5:29 AM | 7 (9.7%) | 0 (0.0%) |
| 5:30 AM to 5:59 AM | 6 (8.3%) | 0 (0.0%) |
| 6:00 AM to 6:29 AM | 7 (9.7%) | 5 (9.8%) |
| 6:30 AM to 6:59 AM | 14 (19.4%) | 3 (5.9%) |
| 7:00 AM to 7:29 AM | 3 (4.2%) | 3 (5.9%) |
| 7:30 AM to 7:59 AM | 8 (11.1%) | 9 (17.6%) |
| 8:00 AM to 8:29 AM | 0 (0.0%) | 8 (15.7%) |
| 8:30 AM to 8:59 AM | 4 (5.6%) | 6 (11.8%) |
| 9:00 AM to 9:59 AM | 0 (0.0%) | 0 (0.0%) |
| 10:00 AM to 10:59 AM | 0 (0.0%) | 0 (0.0%) |
| 11:00 AM to 11:59 AM | 0 (0.0%) | 0 (0.0%) |
| 12:00 PM to 3:59 PM | 17 (23.6%) | 8 (15.7%) |
| 4:00 PM to 11:59 PM | 1 (1.4%) | 3 (5.9%) |
| Total | 72 (100.0%) | 51 (100.0%) |
Housing Occupancy in Millport
Occupancy by Ownership in Millport
Of the total 159 dwellings in Millport, owner-occupied units account for 152 (95.6%), while renter-occupied units make up 7 (4.4%).
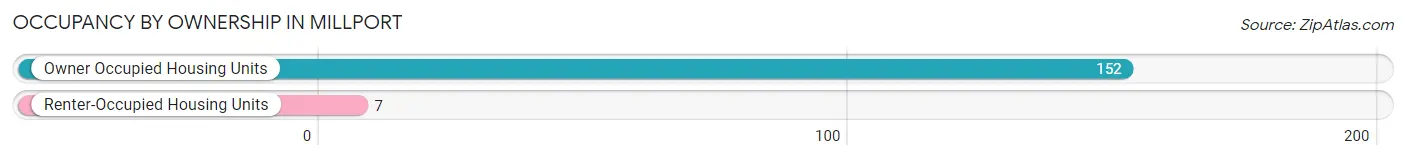
| Occupancy | # Housing Units | % Housing Units |
| Owner Occupied Housing Units | 152 | 95.6% |
| Renter-Occupied Housing Units | 7 | 4.4% |
| Total Occupied Housing Units | 159 | 100.0% |
Occupancy by Household Size in Millport
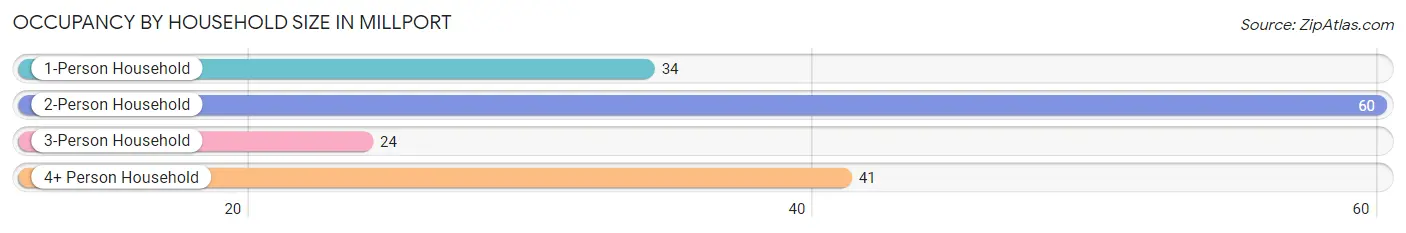
| Household Size | # Housing Units | % Housing Units |
| 1-Person Household | 34 | 21.4% |
| 2-Person Household | 60 | 37.7% |
| 3-Person Household | 24 | 15.1% |
| 4+ Person Household | 41 | 25.8% |
| Total Housing Units | 159 | 100.0% |
Occupancy by Ownership by Household Size in Millport
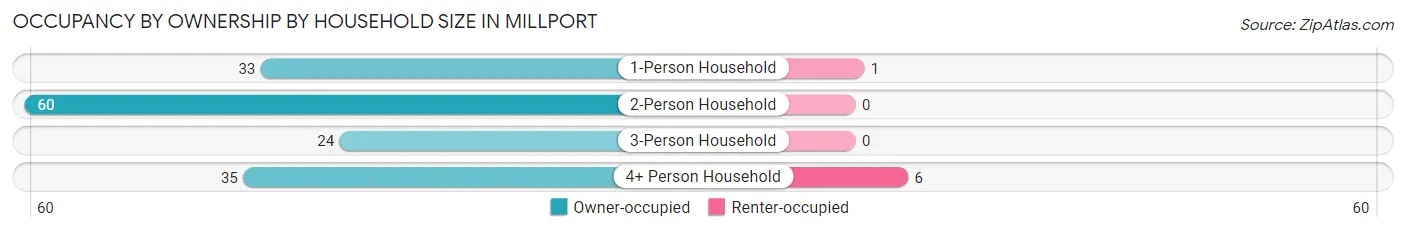
| Household Size | Owner-occupied | Renter-occupied |
| 1-Person Household | 33 (97.1%) | 1 (2.9%) |
| 2-Person Household | 60 (100.0%) | 0 (0.0%) |
| 3-Person Household | 24 (100.0%) | 0 (0.0%) |
| 4+ Person Household | 35 (85.4%) | 6 (14.6%) |
| Total Housing Units | 152 (95.6%) | 7 (4.4%) |
Occupancy by Educational Attainment in Millport
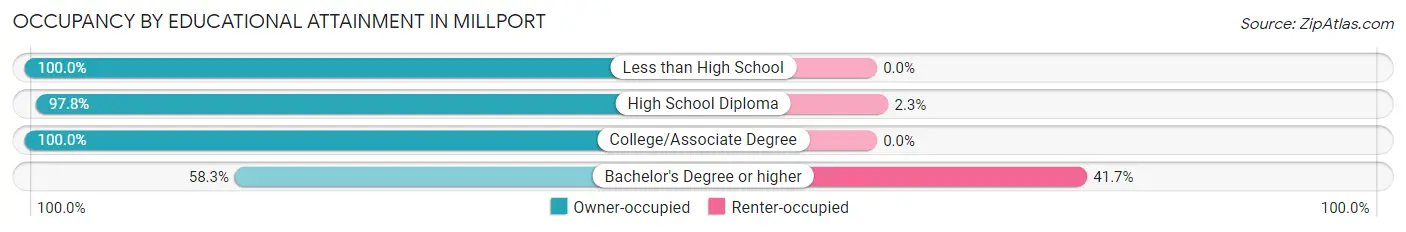
| Household Size | Owner-occupied | Renter-occupied |
| Less than High School | 6 (100.0%) | 0 (0.0%) |
| High School Diploma | 87 (97.8%) | 2 (2.2%) |
| College/Associate Degree | 52 (100.0%) | 0 (0.0%) |
| Bachelor's Degree or higher | 7 (58.3%) | 5 (41.7%) |
Occupancy by Age of Householder in Millport
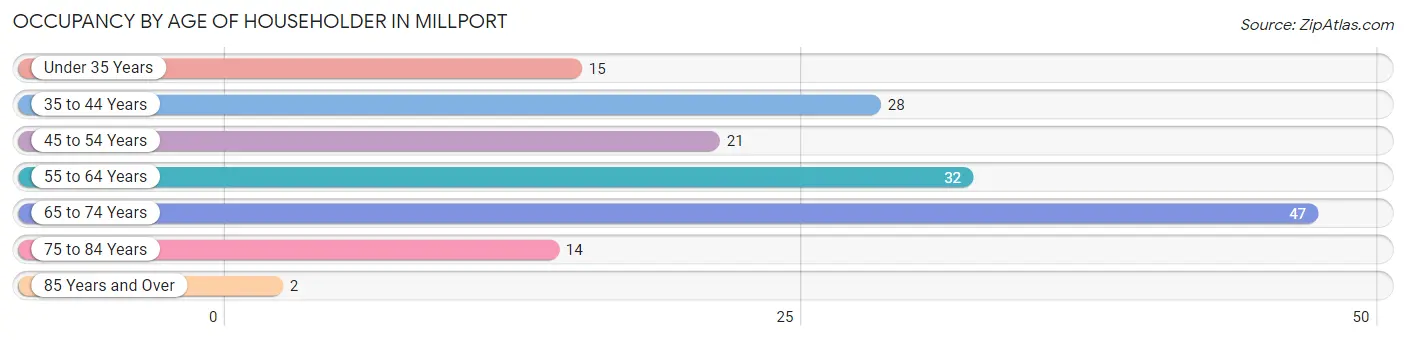
| Age Bracket | # Households | % Households |
| Under 35 Years | 15 | 9.4% |
| 35 to 44 Years | 28 | 17.6% |
| 45 to 54 Years | 21 | 13.2% |
| 55 to 64 Years | 32 | 20.1% |
| 65 to 74 Years | 47 | 29.6% |
| 75 to 84 Years | 14 | 8.8% |
| 85 Years and Over | 2 | 1.3% |
| Total | 159 | 100.0% |
Housing Finances in Millport
Median Income by Occupancy in Millport
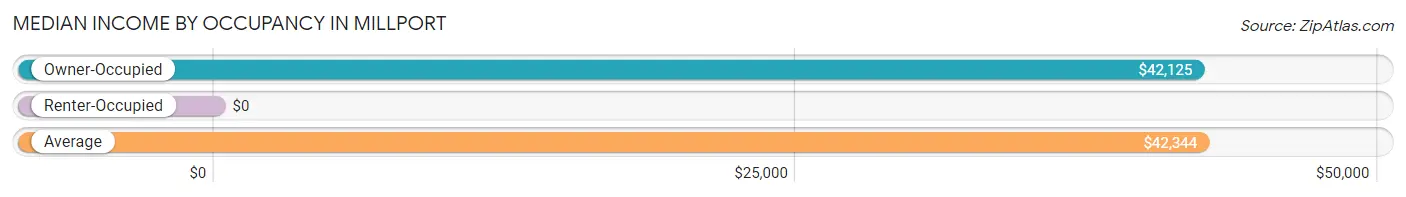
| Occupancy Type | # Households | Median Income |
| Owner-Occupied | 152 (95.6%) | $42,125 |
| Renter-Occupied | 7 (4.4%) | $0 |
| Average | 159 (100.0%) | $42,344 |
Occupancy by Householder Income Bracket in Millport
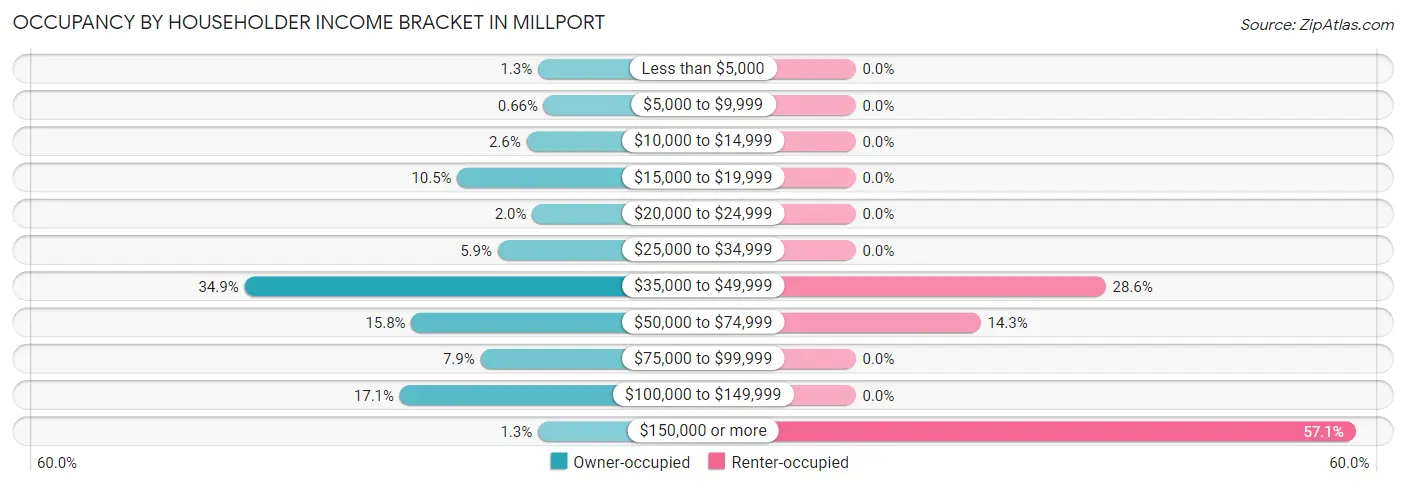
| Income Bracket | Owner-occupied | Renter-occupied |
| Less than $5,000 | 2 (1.3%) | 0 (0.0%) |
| $5,000 to $9,999 | 1 (0.7%) | 0 (0.0%) |
| $10,000 to $14,999 | 4 (2.6%) | 0 (0.0%) |
| $15,000 to $19,999 | 16 (10.5%) | 0 (0.0%) |
| $20,000 to $24,999 | 3 (2.0%) | 0 (0.0%) |
| $25,000 to $34,999 | 9 (5.9%) | 0 (0.0%) |
| $35,000 to $49,999 | 53 (34.9%) | 2 (28.6%) |
| $50,000 to $74,999 | 24 (15.8%) | 1 (14.3%) |
| $75,000 to $99,999 | 12 (7.9%) | 0 (0.0%) |
| $100,000 to $149,999 | 26 (17.1%) | 0 (0.0%) |
| $150,000 or more | 2 (1.3%) | 4 (57.1%) |
| Total | 152 (100.0%) | 7 (100.0%) |
Monthly Housing Cost Tiers in Millport
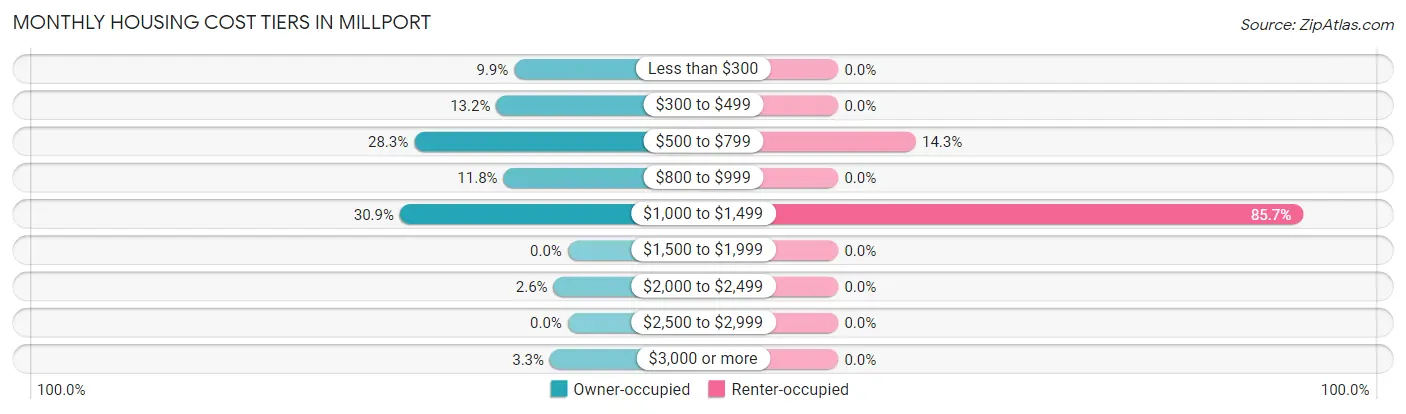
| Monthly Cost | Owner-occupied | Renter-occupied |
| Less than $300 | 15 (9.9%) | 0 (0.0%) |
| $300 to $499 | 20 (13.2%) | 0 (0.0%) |
| $500 to $799 | 43 (28.3%) | 1 (14.3%) |
| $800 to $999 | 18 (11.8%) | 0 (0.0%) |
| $1,000 to $1,499 | 47 (30.9%) | 6 (85.7%) |
| $1,500 to $1,999 | 0 (0.0%) | 0 (0.0%) |
| $2,000 to $2,499 | 4 (2.6%) | 0 (0.0%) |
| $2,500 to $2,999 | 0 (0.0%) | 0 (0.0%) |
| $3,000 or more | 5 (3.3%) | 0 (0.0%) |
| Total | 152 (100.0%) | 7 (100.0%) |
Physical Housing Characteristics in Millport
Housing Structures in Millport
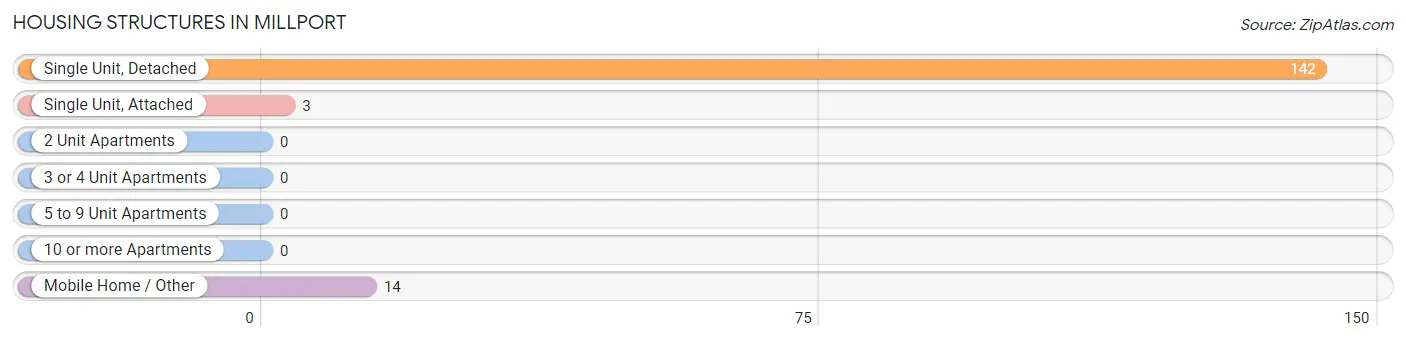
| Structure Type | # Housing Units | % Housing Units |
| Single Unit, Detached | 142 | 89.3% |
| Single Unit, Attached | 3 | 1.9% |
| 2 Unit Apartments | 0 | 0.0% |
| 3 or 4 Unit Apartments | 0 | 0.0% |
| 5 to 9 Unit Apartments | 0 | 0.0% |
| 10 or more Apartments | 0 | 0.0% |
| Mobile Home / Other | 14 | 8.8% |
| Total | 159 | 100.0% |
Housing Structures by Occupancy in Millport
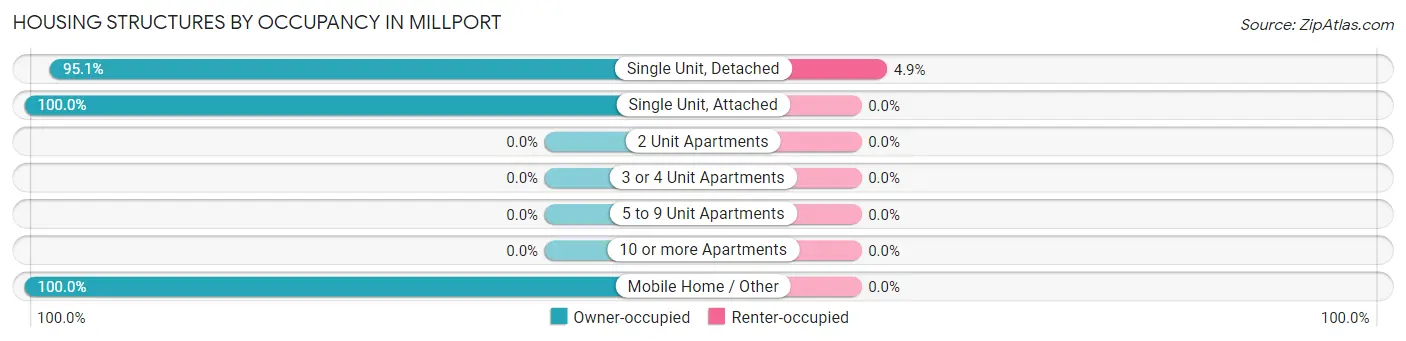
| Structure Type | Owner-occupied | Renter-occupied |
| Single Unit, Detached | 135 (95.1%) | 7 (4.9%) |
| Single Unit, Attached | 3 (100.0%) | 0 (0.0%) |
| 2 Unit Apartments | 0 (0.0%) | 0 (0.0%) |
| 3 or 4 Unit Apartments | 0 (0.0%) | 0 (0.0%) |
| 5 to 9 Unit Apartments | 0 (0.0%) | 0 (0.0%) |
| 10 or more Apartments | 0 (0.0%) | 0 (0.0%) |
| Mobile Home / Other | 14 (100.0%) | 0 (0.0%) |
| Total | 152 (95.6%) | 7 (4.4%) |
Housing Structures by Number of Rooms in Millport
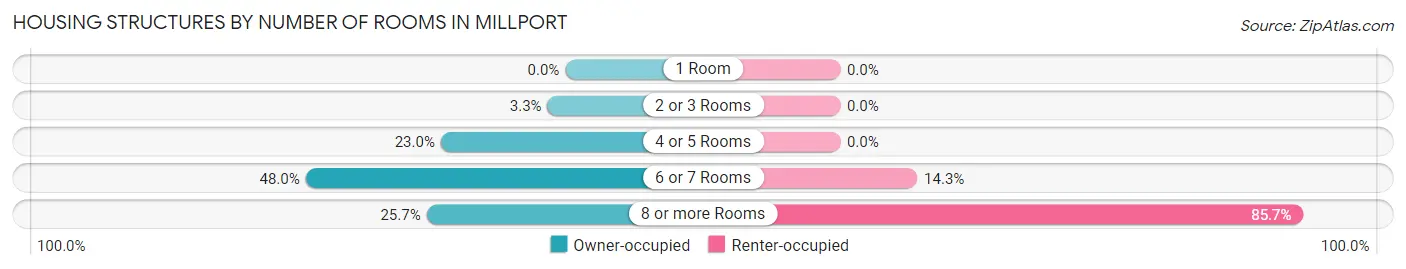
| Number of Rooms | Owner-occupied | Renter-occupied |
| 1 Room | 0 (0.0%) | 0 (0.0%) |
| 2 or 3 Rooms | 5 (3.3%) | 0 (0.0%) |
| 4 or 5 Rooms | 35 (23.0%) | 0 (0.0%) |
| 6 or 7 Rooms | 73 (48.0%) | 1 (14.3%) |
| 8 or more Rooms | 39 (25.7%) | 6 (85.7%) |
| Total | 152 (100.0%) | 7 (100.0%) |
Housing Structure by Heating Type in Millport
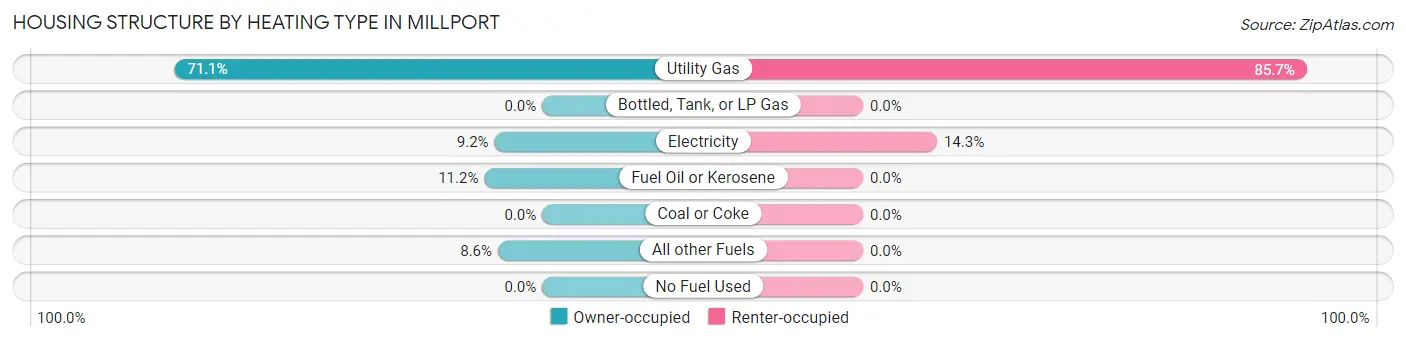
| Heating Type | Owner-occupied | Renter-occupied |
| Utility Gas | 108 (71.1%) | 6 (85.7%) |
| Bottled, Tank, or LP Gas | 0 (0.0%) | 0 (0.0%) |
| Electricity | 14 (9.2%) | 1 (14.3%) |
| Fuel Oil or Kerosene | 17 (11.2%) | 0 (0.0%) |
| Coal or Coke | 0 (0.0%) | 0 (0.0%) |
| All other Fuels | 13 (8.6%) | 0 (0.0%) |
| No Fuel Used | 0 (0.0%) | 0 (0.0%) |
| Total | 152 (100.0%) | 7 (100.0%) |
Household Vehicle Usage in Millport
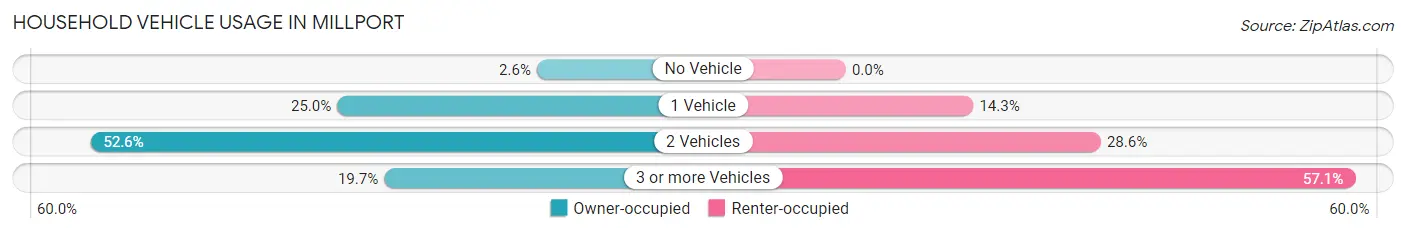
| Vehicles per Household | Owner-occupied | Renter-occupied |
| No Vehicle | 4 (2.6%) | 0 (0.0%) |
| 1 Vehicle | 38 (25.0%) | 1 (14.3%) |
| 2 Vehicles | 80 (52.6%) | 2 (28.6%) |
| 3 or more Vehicles | 30 (19.7%) | 4 (57.1%) |
| Total | 152 (100.0%) | 7 (100.0%) |
Real Estate & Mortgages in Millport
Real Estate and Mortgage Overview in Millport
| Characteristic | Without Mortgage | With Mortgage |
| Housing Units | 67 | 85 |
| Median Property Value | $77,000 | $94,300 |
| Median Household Income | $36,250 | $0 |
| Monthly Housing Costs | $485 | $5 |
| Real Estate Taxes | $1,969 | $5 |
Property Value by Mortgage Status in Millport
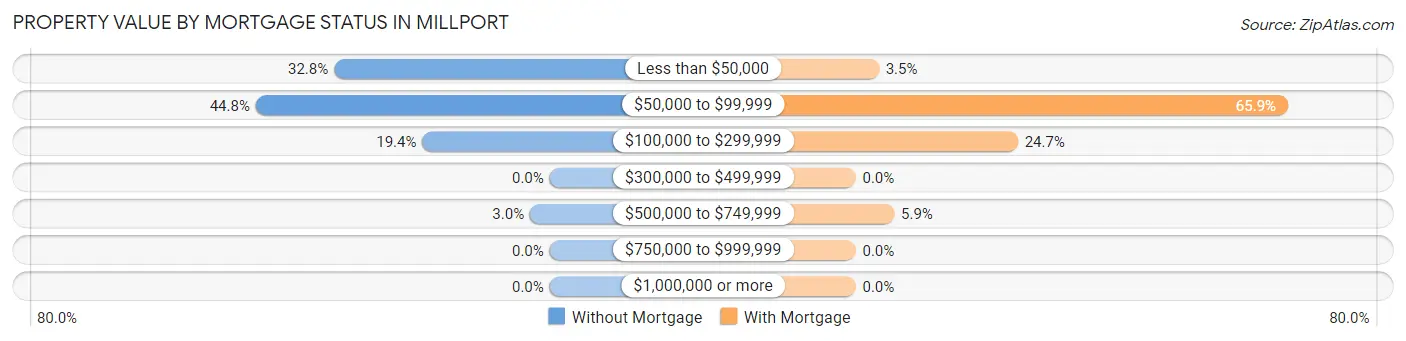
| Property Value | Without Mortgage | With Mortgage |
| Less than $50,000 | 22 (32.8%) | 3 (3.5%) |
| $50,000 to $99,999 | 30 (44.8%) | 56 (65.9%) |
| $100,000 to $299,999 | 13 (19.4%) | 21 (24.7%) |
| $300,000 to $499,999 | 0 (0.0%) | 0 (0.0%) |
| $500,000 to $749,999 | 2 (3.0%) | 5 (5.9%) |
| $750,000 to $999,999 | 0 (0.0%) | 0 (0.0%) |
| $1,000,000 or more | 0 (0.0%) | 0 (0.0%) |
| Total | 67 (100.0%) | 85 (100.0%) |
Household Income by Mortgage Status in Millport
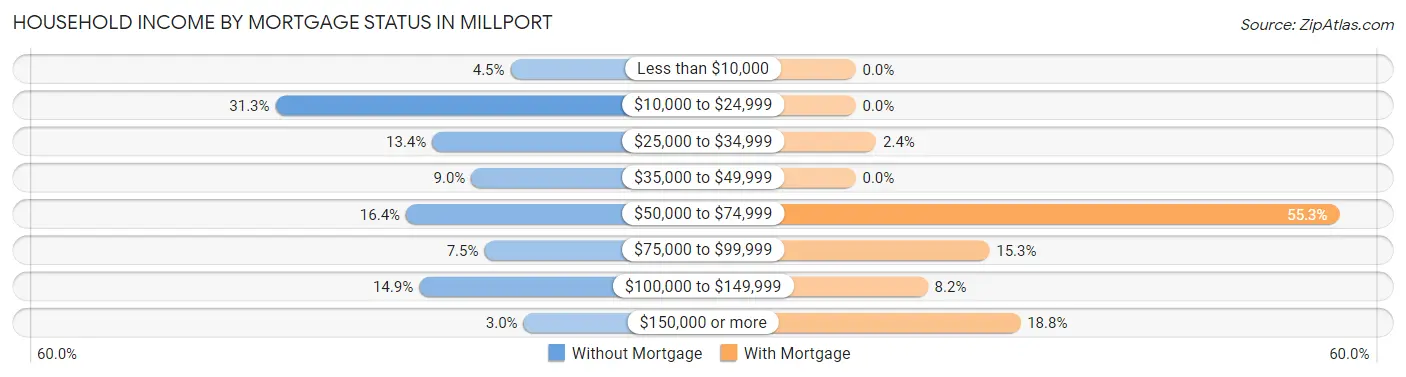
| Household Income | Without Mortgage | With Mortgage |
| Less than $10,000 | 3 (4.5%) | 0 (0.0%) |
| $10,000 to $24,999 | 21 (31.3%) | 0 (0.0%) |
| $25,000 to $34,999 | 9 (13.4%) | 2 (2.4%) |
| $35,000 to $49,999 | 6 (9.0%) | 0 (0.0%) |
| $50,000 to $74,999 | 11 (16.4%) | 47 (55.3%) |
| $75,000 to $99,999 | 5 (7.5%) | 13 (15.3%) |
| $100,000 to $149,999 | 10 (14.9%) | 7 (8.2%) |
| $150,000 or more | 2 (3.0%) | 16 (18.8%) |
| Total | 67 (100.0%) | 85 (100.0%) |
Property Value to Household Income Ratio in Millport
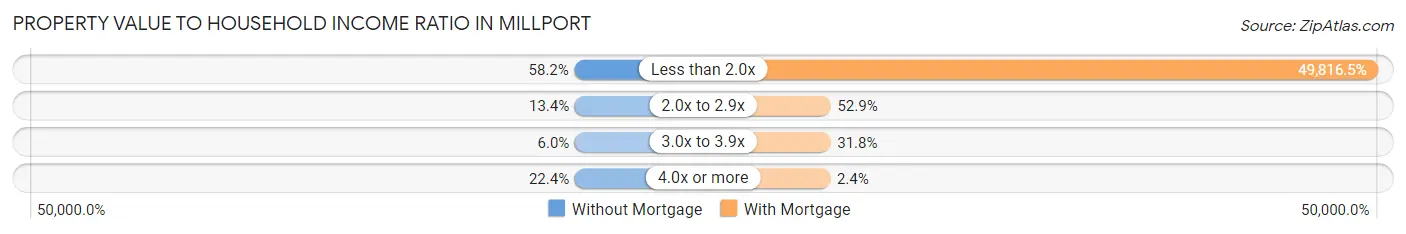
| Value-to-Income Ratio | Without Mortgage | With Mortgage |
| Less than 2.0x | 39 (58.2%) | 42,344 (49,816.5%) |
| 2.0x to 2.9x | 9 (13.4%) | 45 (52.9%) |
| 3.0x to 3.9x | 4 (6.0%) | 27 (31.8%) |
| 4.0x or more | 15 (22.4%) | 2 (2.4%) |
| Total | 67 (100.0%) | 85 (100.0%) |
Real Estate Taxes by Mortgage Status in Millport
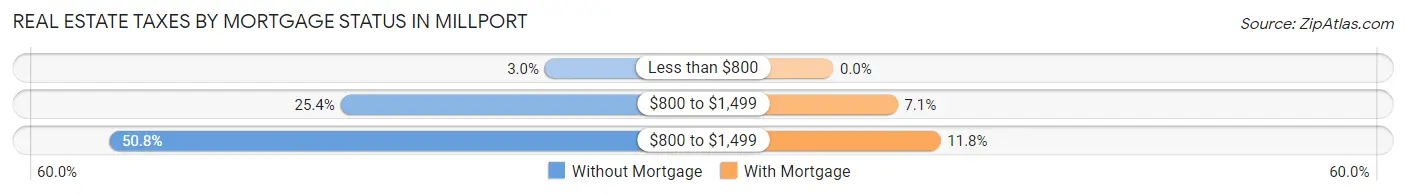
| Property Taxes | Without Mortgage | With Mortgage |
| Less than $800 | 2 (3.0%) | 0 (0.0%) |
| $800 to $1,499 | 17 (25.4%) | 6 (7.1%) |
| $800 to $1,499 | 34 (50.7%) | 10 (11.8%) |
| Total | 67 (100.0%) | 85 (100.0%) |
Health & Disability in Millport
Health Insurance Coverage by Age in Millport
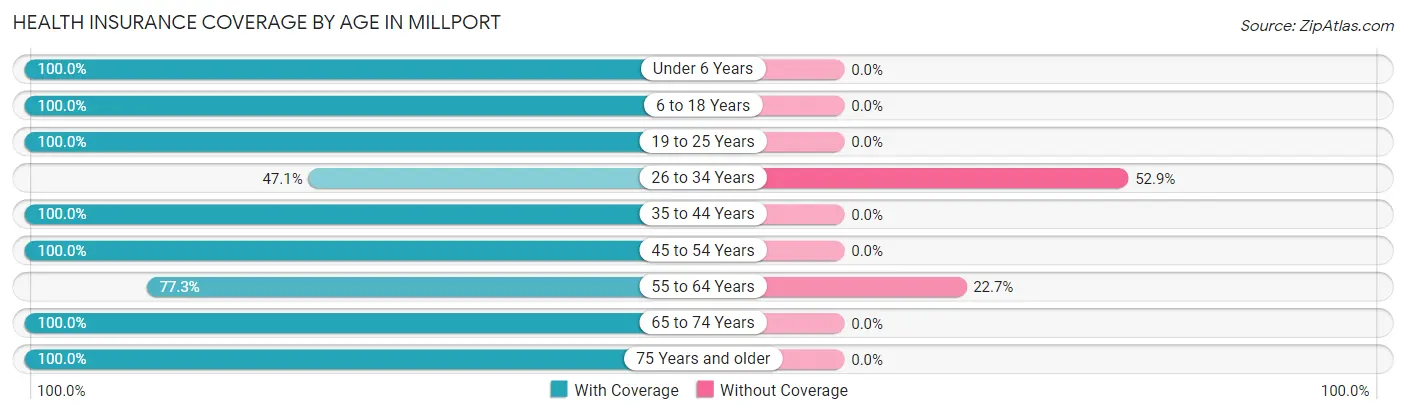
| Age Bracket | With Coverage | Without Coverage |
| Under 6 Years | 8 (100.0%) | 0 (0.0%) |
| 6 to 18 Years | 99 (100.0%) | 0 (0.0%) |
| 19 to 25 Years | 28 (100.0%) | 0 (0.0%) |
| 26 to 34 Years | 8 (47.1%) | 9 (52.9%) |
| 35 to 44 Years | 40 (100.0%) | 0 (0.0%) |
| 45 to 54 Years | 51 (100.0%) | 0 (0.0%) |
| 55 to 64 Years | 34 (77.3%) | 10 (22.7%) |
| 65 to 74 Years | 75 (100.0%) | 0 (0.0%) |
| 75 Years and older | 63 (100.0%) | 0 (0.0%) |
| Total | 406 (95.5%) | 19 (4.5%) |
Health Insurance Coverage by Citizenship Status in Millport
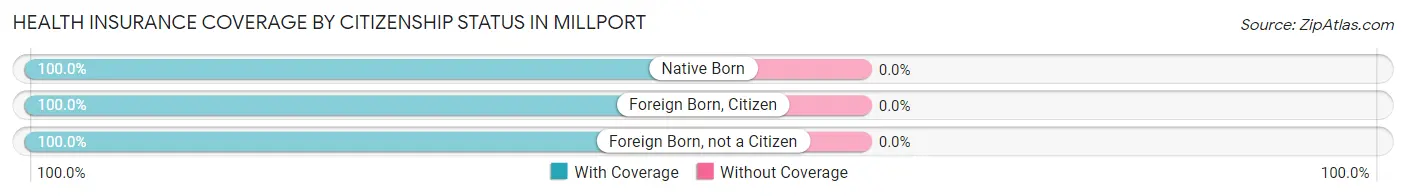
| Citizenship Status | With Coverage | Without Coverage |
| Native Born | 8 (100.0%) | 0 (0.0%) |
| Foreign Born, Citizen | 99 (100.0%) | 0 (0.0%) |
| Foreign Born, not a Citizen | 28 (100.0%) | 0 (0.0%) |
Health Insurance Coverage by Household Income in Millport
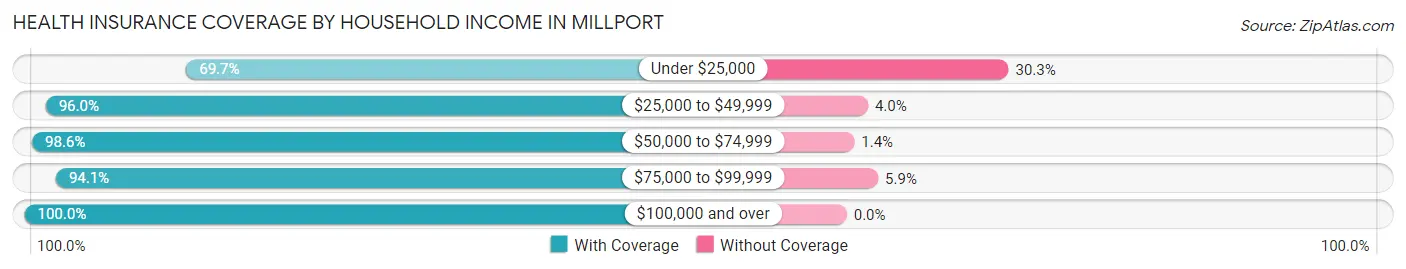
| Household Income | With Coverage | Without Coverage |
| Under $25,000 | 23 (69.7%) | 10 (30.3%) |
| $25,000 to $49,999 | 145 (96.0%) | 6 (4.0%) |
| $50,000 to $74,999 | 70 (98.6%) | 1 (1.4%) |
| $75,000 to $99,999 | 32 (94.1%) | 2 (5.9%) |
| $100,000 and over | 136 (100.0%) | 0 (0.0%) |
Public vs Private Health Insurance Coverage by Age in Millport
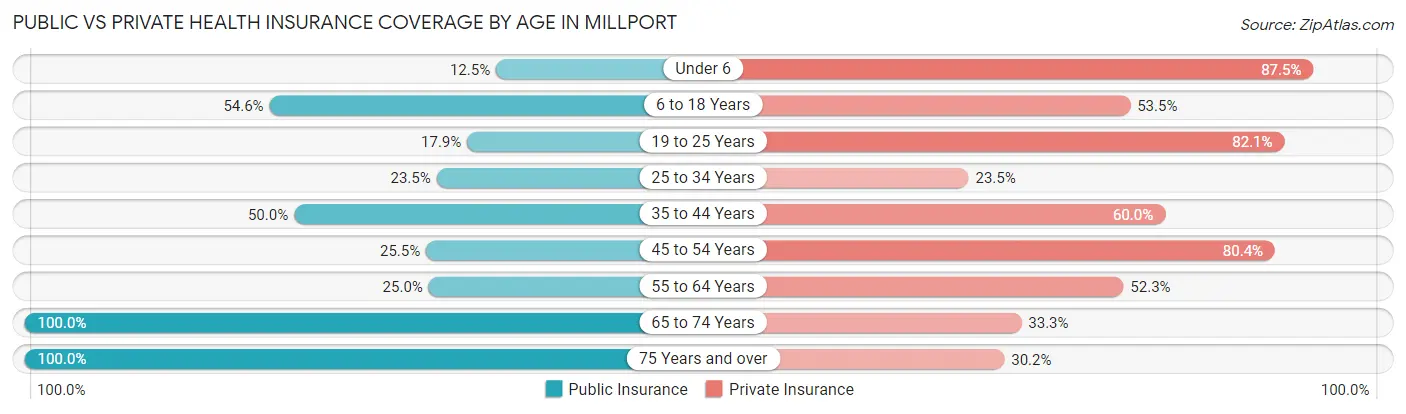
| Age Bracket | Public Insurance | Private Insurance |
| Under 6 | 1 (12.5%) | 7 (87.5%) |
| 6 to 18 Years | 54 (54.5%) | 53 (53.5%) |
| 19 to 25 Years | 5 (17.9%) | 23 (82.1%) |
| 25 to 34 Years | 4 (23.5%) | 4 (23.5%) |
| 35 to 44 Years | 20 (50.0%) | 24 (60.0%) |
| 45 to 54 Years | 13 (25.5%) | 41 (80.4%) |
| 55 to 64 Years | 11 (25.0%) | 23 (52.3%) |
| 65 to 74 Years | 75 (100.0%) | 25 (33.3%) |
| 75 Years and over | 63 (100.0%) | 19 (30.2%) |
| Total | 246 (57.9%) | 219 (51.5%) |
Disability Status by Sex by Age in Millport
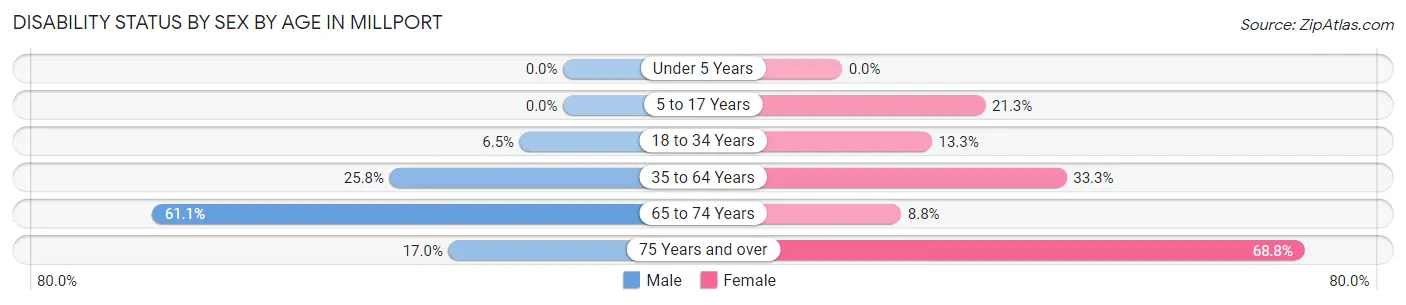
| Age Bracket | Male | Female |
| Under 5 Years | 0 (0.0%) | 0 (0.0%) |
| 5 to 17 Years | 0 (0.0%) | 10 (21.3%) |
| 18 to 34 Years | 2 (6.5%) | 2 (13.3%) |
| 35 to 64 Years | 17 (25.8%) | 23 (33.3%) |
| 65 to 74 Years | 11 (61.1%) | 5 (8.8%) |
| 75 Years and over | 8 (17.0%) | 11 (68.8%) |
Disability Class by Sex by Age in Millport
Disability Class: Hearing Difficulty
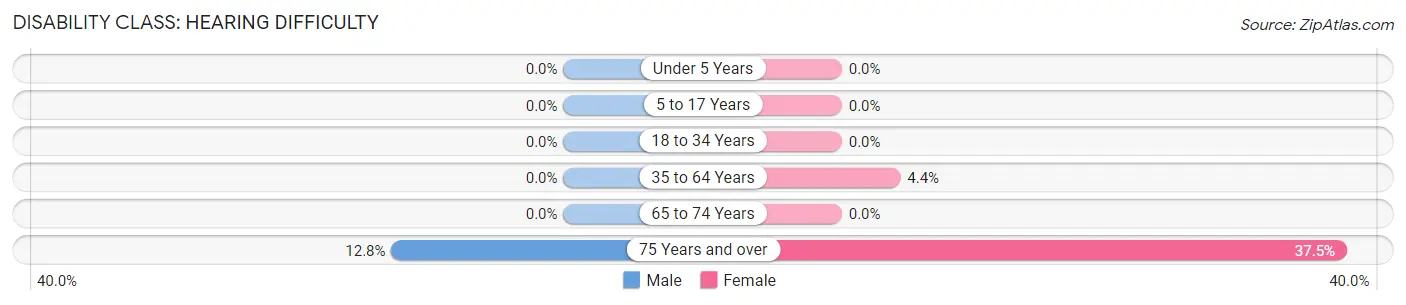
| Age Bracket | Male | Female |
| Under 5 Years | 0 (0.0%) | 0 (0.0%) |
| 5 to 17 Years | 0 (0.0%) | 0 (0.0%) |
| 18 to 34 Years | 0 (0.0%) | 0 (0.0%) |
| 35 to 64 Years | 0 (0.0%) | 3 (4.3%) |
| 65 to 74 Years | 0 (0.0%) | 0 (0.0%) |
| 75 Years and over | 6 (12.8%) | 6 (37.5%) |
Disability Class: Vision Difficulty
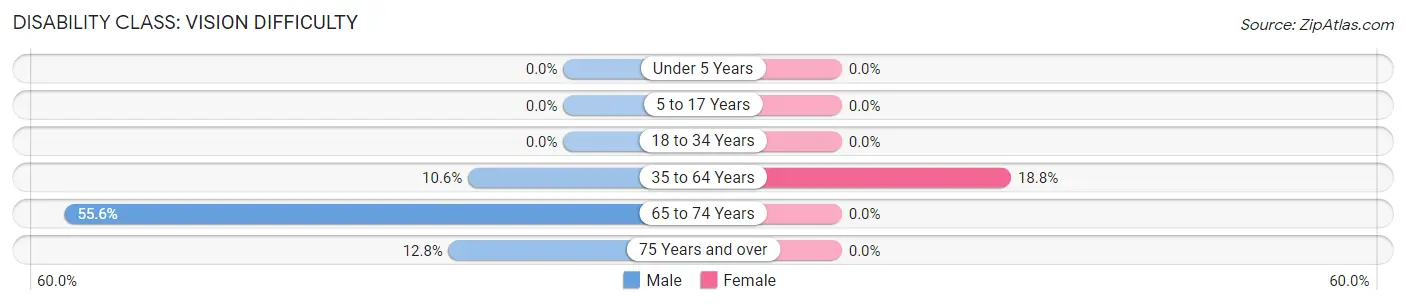
| Age Bracket | Male | Female |
| Under 5 Years | 0 (0.0%) | 0 (0.0%) |
| 5 to 17 Years | 0 (0.0%) | 0 (0.0%) |
| 18 to 34 Years | 0 (0.0%) | 0 (0.0%) |
| 35 to 64 Years | 7 (10.6%) | 13 (18.8%) |
| 65 to 74 Years | 10 (55.6%) | 0 (0.0%) |
| 75 Years and over | 6 (12.8%) | 0 (0.0%) |
Disability Class: Cognitive Difficulty
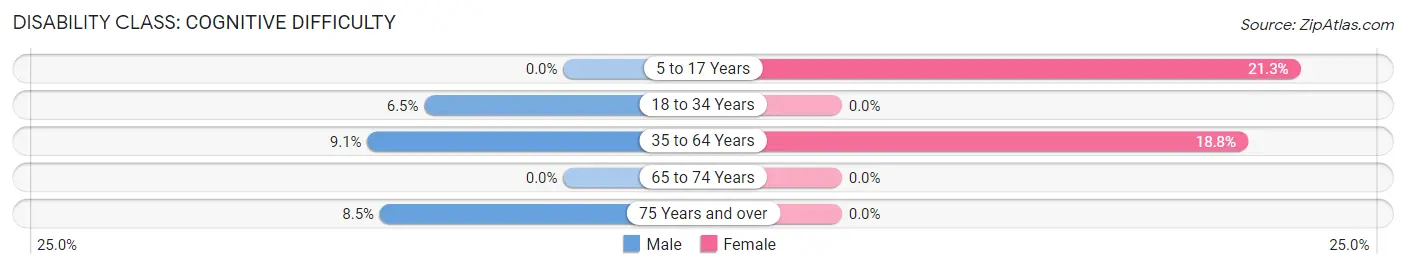
| Age Bracket | Male | Female |
| 5 to 17 Years | 0 (0.0%) | 10 (21.3%) |
| 18 to 34 Years | 2 (6.5%) | 0 (0.0%) |
| 35 to 64 Years | 6 (9.1%) | 13 (18.8%) |
| 65 to 74 Years | 0 (0.0%) | 0 (0.0%) |
| 75 Years and over | 4 (8.5%) | 0 (0.0%) |
Disability Class: Ambulatory Difficulty
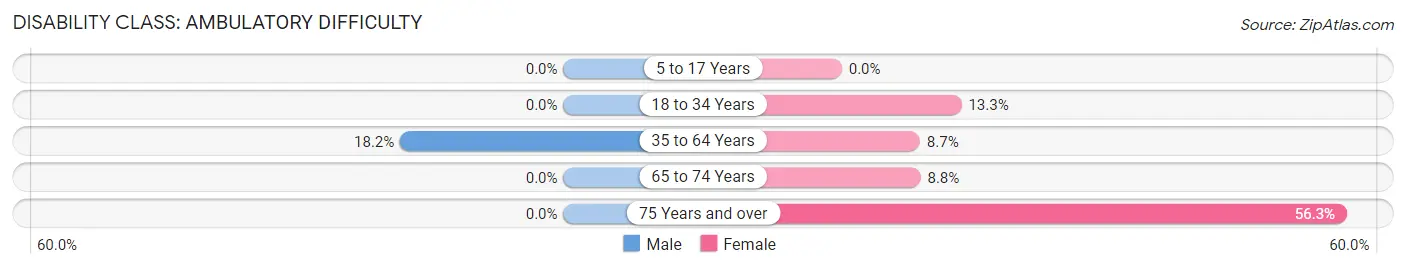
| Age Bracket | Male | Female |
| 5 to 17 Years | 0 (0.0%) | 0 (0.0%) |
| 18 to 34 Years | 0 (0.0%) | 2 (13.3%) |
| 35 to 64 Years | 12 (18.2%) | 6 (8.7%) |
| 65 to 74 Years | 0 (0.0%) | 5 (8.8%) |
| 75 Years and over | 0 (0.0%) | 9 (56.2%) |
Disability Class: Self-Care Difficulty
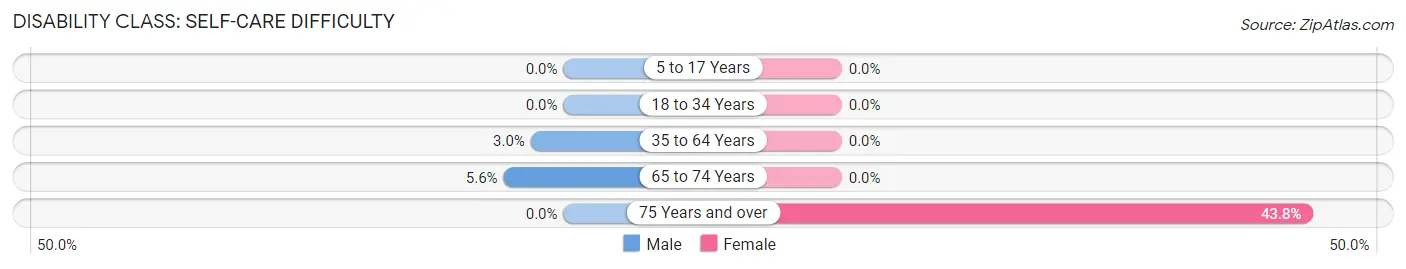
| Age Bracket | Male | Female |
| 5 to 17 Years | 0 (0.0%) | 0 (0.0%) |
| 18 to 34 Years | 0 (0.0%) | 0 (0.0%) |
| 35 to 64 Years | 2 (3.0%) | 0 (0.0%) |
| 65 to 74 Years | 1 (5.6%) | 0 (0.0%) |
| 75 Years and over | 0 (0.0%) | 7 (43.8%) |
Technology Access in Millport
Computing Device Access in Millport
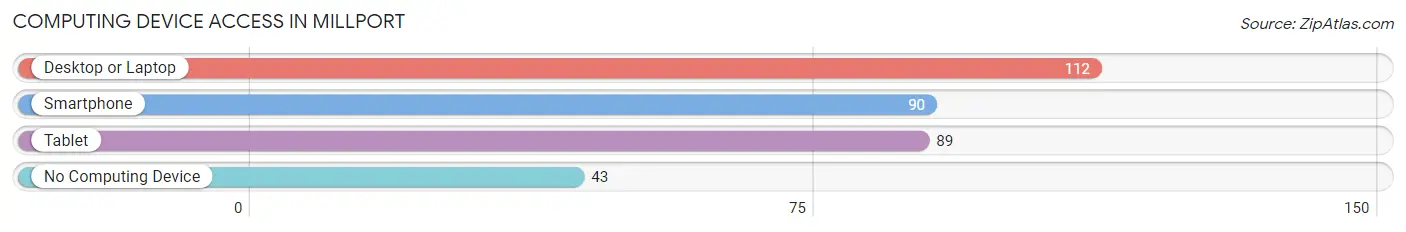
| Device Type | # Households | % Households |
| Desktop or Laptop | 112 | 70.4% |
| Smartphone | 90 | 56.6% |
| Tablet | 89 | 56.0% |
| No Computing Device | 43 | 27.0% |
| Total | 159 | 100.0% |
Internet Access in Millport
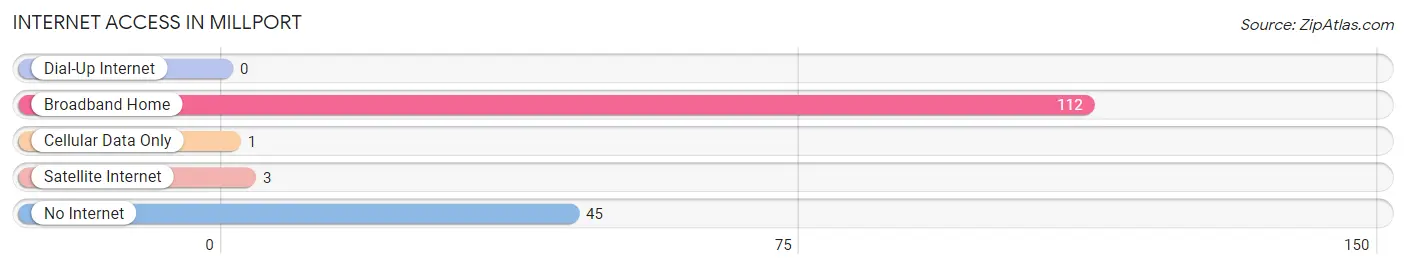
| Internet Type | # Households | % Households |
| Dial-Up Internet | 0 | 0.0% |
| Broadband Home | 112 | 70.4% |
| Cellular Data Only | 1 | 0.6% |
| Satellite Internet | 3 | 1.9% |
| No Internet | 45 | 28.3% |
| Total | 159 | 100.0% |
Millport Summary
Millport is a small village located in Chemung County, New York. It is situated on the banks of the Chemung River, approximately 10 miles south of Elmira. The village has a population of approximately 1,000 people and is part of the Elmira-Corning Metropolitan Statistical Area.
History
Millport was first settled in 1790 by a group of settlers from Connecticut. The village was originally known as “Milltown” and was later renamed “Millport” in 1820. The village was incorporated in 1837 and was the first village in Chemung County to be incorporated.
The village was an important stop on the Chemung Canal, which was built in 1833. The canal connected the Chemung River to the Susquehanna River and was used to transport goods and passengers between the two rivers. The canal was an important part of the local economy and helped to spur the growth of the village.
The village was also an important stop on the Erie Railroad, which was built in 1851. The railroad connected the village to Elmira and other nearby towns and cities. The railroad was an important part of the local economy and helped to spur the growth of the village.
Geography
Millport is located in the Southern Tier region of New York. The village is situated on the banks of the Chemung River, approximately 10 miles south of Elmira. The village is located in a rural area and is surrounded by rolling hills and farmland.
The village is located in the Chemung Valley, which is a fertile agricultural region. The valley is home to a variety of crops, including corn, soybeans, wheat, and hay. The valley is also home to a variety of livestock, including cows, pigs, and chickens.
Economy
The economy of Millport is largely based on agriculture. The village is located in a fertile agricultural region and is home to a variety of crops, including corn, soybeans, wheat, and hay. The village is also home to a variety of livestock, including cows, pigs, and chickens.
The village is also home to a number of small businesses, including restaurants, shops, and services. The village is also home to a number of manufacturing companies, including a paper mill and a furniture factory.
Demographics
As of the 2010 census, the population of Millport was 1,000 people. The village is predominantly white, with approximately 95% of the population being white. The village is also home to a small Hispanic population, with approximately 4% of the population being Hispanic.
The median household income in Millport is $41,250, which is slightly lower than the national median of $50,000. The median home value in the village is $117,000, which is slightly lower than the national median of $180,000.
Conclusion
Millport is a small village located in Chemung County, New York. The village has a population of approximately 1,000 people and is part of the Elmira-Corning Metropolitan Statistical Area. The village was first settled in 1790 and was an important stop on the Chemung Canal and the Erie Railroad. The economy of Millport is largely based on agriculture and small businesses. The village is predominantly white, with a small Hispanic population. The median household income in Millport is $41,250 and the median home value is $117,000.
Common Questions
What is Per Capita Income in Millport?
Per Capita income in Millport is $23,340.
What is the Median Family Income in Millport?
Median Family Income in Millport is $67,000.
What is the Median Household income in Millport?
Median Household Income in Millport is $42,344.
What is Income or Wage Gap in Millport?
Income or Wage Gap in Millport is 28.4%.
Women in Millport earn 71.6 cents for every dollar earned by a man.
What is Family Income Deficit in Millport?
Family Income Deficit in Millport is $7,243.
Families that are below poverty line in Millport earn $7,243 less on average than the poverty threshold level.
What is Inequality or Gini Index in Millport?
Inequality or Gini Index in Millport is 0.37.
What is the Total Population of Millport?
Total Population of Millport is 425.
What is the Total Male Population of Millport?
Total Male Population of Millport is 217.
What is the Total Female Population of Millport?
Total Female Population of Millport is 208.
What is the Ratio of Males per 100 Females in Millport?
There are 104.33 Males per 100 Females in Millport.
What is the Ratio of Females per 100 Males in Millport?
There are 95.85 Females per 100 Males in Millport.
What is the Median Population Age in Millport?
Median Population Age in Millport is 48.5 Years.
What is the Average Family Size in Millport
Average Family Size in Millport is 3.4 People.
What is the Average Household Size in Millport
Average Household Size in Millport is 2.7 People.
How Large is the Labor Force in Millport?
There are 159 People in the Labor Forcein in Millport.
What is the Percentage of People in the Labor Force in Millport?
48.0% of People are in the Labor Force in Millport.
What is the Unemployment Rate in Millport?
Unemployment Rate in Millport is 12.6%.