Nyack, NY Map & Demographics
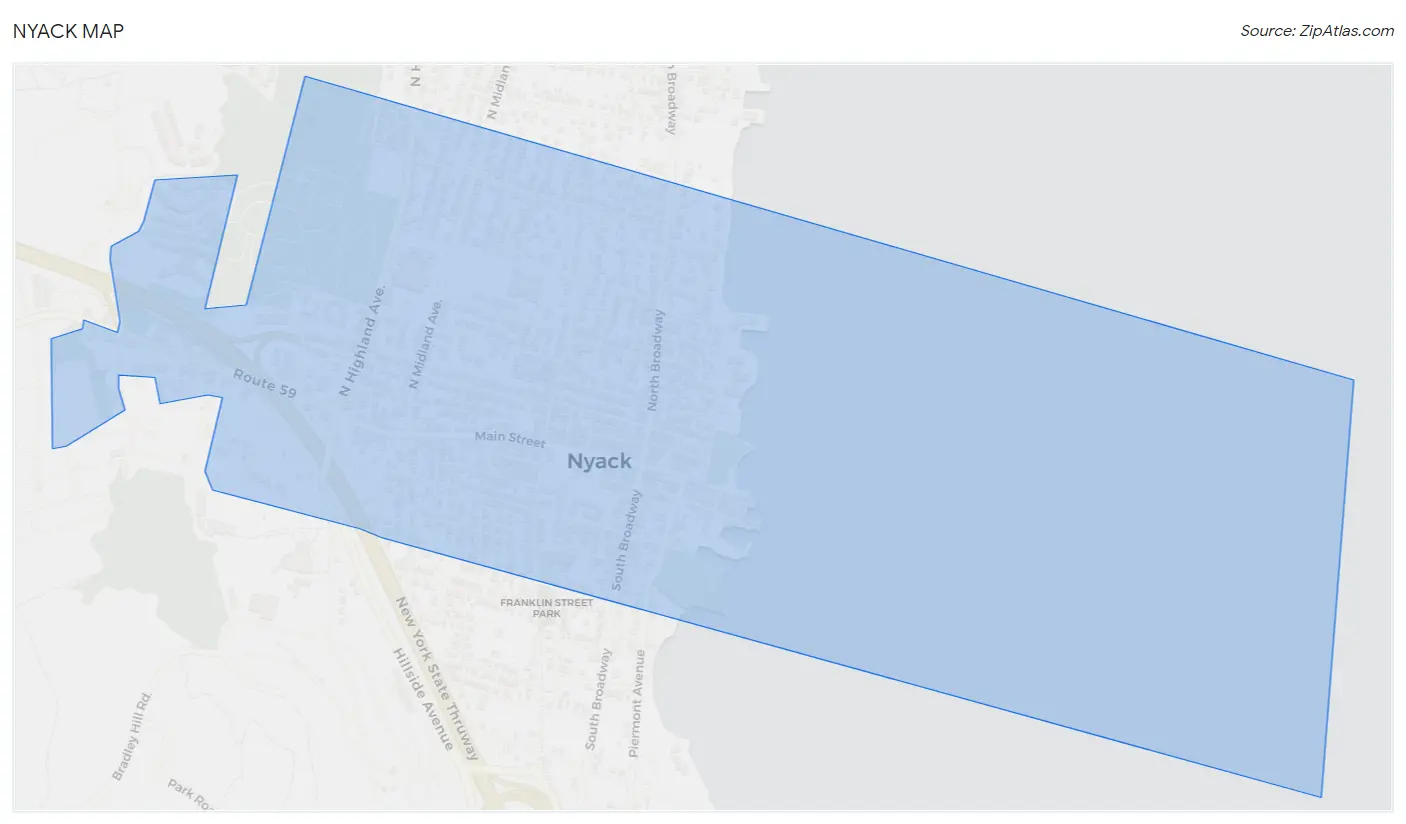
Nyack Map
Nyack Overview
$69,937
PER CAPITA INCOME
$124,207
AVG FAMILY INCOME
$97,013
AVG HOUSEHOLD INCOME
5.0%
WAGE / INCOME GAP [ % ]
95.0¢/ $1
WAGE / INCOME GAP [ $ ]
0.51
INEQUALITY / GINI INDEX
7,057
TOTAL POPULATION
3,187
MALE POPULATION
3,870
FEMALE POPULATION
82.35
MALES / 100 FEMALES
121.43
FEMALES / 100 MALES
44.5
MEDIAN AGE
3.3
AVG FAMILY SIZE
2.1
AVG HOUSEHOLD SIZE
4,087
LABOR FORCE [ PEOPLE ]
69.4%
PERCENT IN LABOR FORCE
9.7%
UNEMPLOYMENT RATE
Nyack Zip Codes
Income in Nyack
Income Overview in Nyack
Per Capita Income in Nyack is $69,937, while median incomes of families and households are $124,207 and $97,013 respectively.
| Characteristic | Number | Measure |
| Per Capita Income | 7,057 | $69,937 |
| Median Family Income | 1,427 | $124,207 |
| Mean Family Income | 1,427 | $192,515 |
| Median Household Income | 3,257 | $97,013 |
| Mean Household Income | 3,257 | $149,353 |
| Income Deficit | 1,427 | $0 |
| Wage / Income Gap (%) | 7,057 | 4.96% |
| Wage / Income Gap ($) | 7,057 | 95.04¢ per $1 |
| Gini / Inequality Index | 7,057 | 0.51 |
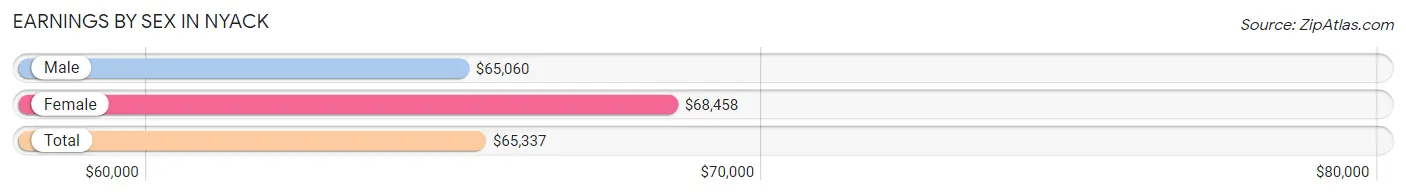
Earnings by Sex in Nyack
Average Earnings in Nyack are $65,337, $65,060 for men and $68,458 for women, a difference of 5.0%.
| Sex | Number | Average Earnings |
| Male | 1,977 (49.0%) | $65,060 |
| Female | 2,059 (51.0%) | $68,458 |
| Total | 4,036 (100.0%) | $65,337 |
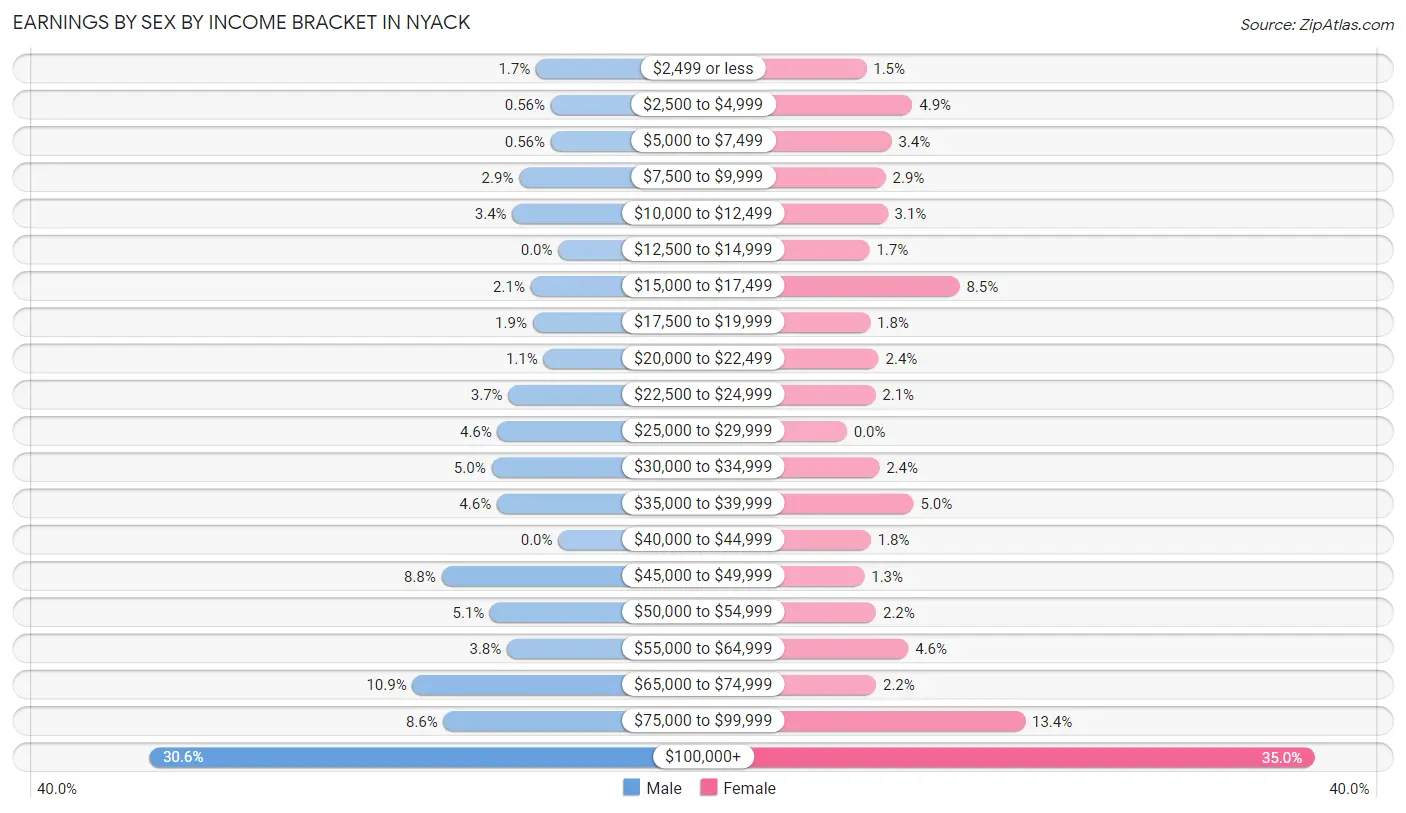
Earnings by Sex by Income Bracket in Nyack
The most common earnings brackets in Nyack are $100,000+ for men (605 | 30.6%) and $100,000+ for women (721 | 35.0%).
| Income | Male | Female |
| $2,499 or less | 33 (1.7%) | 30 (1.5%) |
| $2,500 to $4,999 | 11 (0.6%) | 101 (4.9%) |
| $5,000 to $7,499 | 11 (0.6%) | 69 (3.4%) |
| $7,500 to $9,999 | 58 (2.9%) | 60 (2.9%) |
| $10,000 to $12,499 | 68 (3.4%) | 63 (3.1%) |
| $12,500 to $14,999 | 0 (0.0%) | 35 (1.7%) |
| $15,000 to $17,499 | 41 (2.1%) | 174 (8.5%) |
| $17,500 to $19,999 | 38 (1.9%) | 36 (1.8%) |
| $20,000 to $22,499 | 22 (1.1%) | 49 (2.4%) |
| $22,500 to $24,999 | 74 (3.7%) | 44 (2.1%) |
| $25,000 to $29,999 | 90 (4.5%) | 0 (0.0%) |
| $30,000 to $34,999 | 99 (5.0%) | 50 (2.4%) |
| $35,000 to $39,999 | 91 (4.6%) | 103 (5.0%) |
| $40,000 to $44,999 | 0 (0.0%) | 37 (1.8%) |
| $45,000 to $49,999 | 173 (8.7%) | 27 (1.3%) |
| $50,000 to $54,999 | 101 (5.1%) | 45 (2.2%) |
| $55,000 to $64,999 | 76 (3.8%) | 95 (4.6%) |
| $65,000 to $74,999 | 216 (10.9%) | 45 (2.2%) |
| $75,000 to $99,999 | 170 (8.6%) | 275 (13.4%) |
| $100,000+ | 605 (30.6%) | 721 (35.0%) |
| Total | 1,977 (100.0%) | 2,059 (100.0%) |
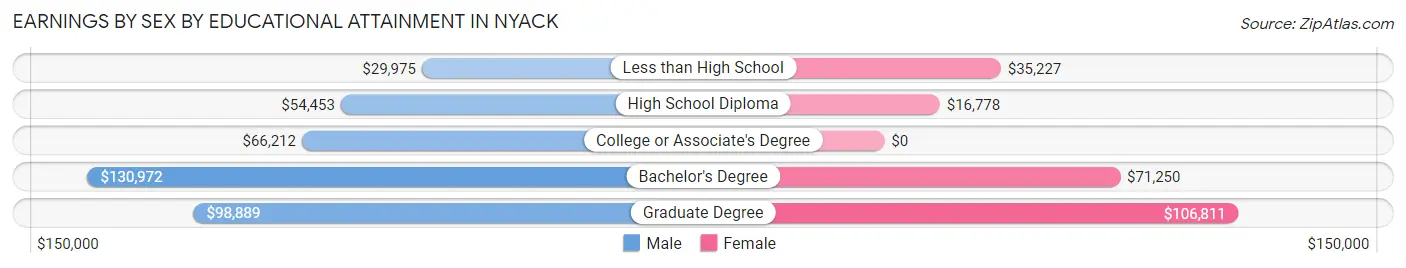
Earnings by Sex by Educational Attainment in Nyack
Average earnings in Nyack are $67,236 for men and $78,722 for women, a difference of 14.6%. Men with an educational attainment of bachelor's degree enjoy the highest average annual earnings of $130,972, while those with less than high school education earn the least with $29,975. Women with an educational attainment of graduate degree earn the most with the average annual earnings of $106,811, while those with high school diploma education have the smallest earnings of $16,778.
| Educational Attainment | Male Income | Female Income |
| Less than High School | $29,975 | $35,227 |
| High School Diploma | $54,453 | $16,778 |
| College or Associate's Degree | $66,212 | $0 |
| Bachelor's Degree | $130,972 | $71,250 |
| Graduate Degree | $98,889 | $106,811 |
| Total | $67,236 | $78,722 |
Family Income in Nyack
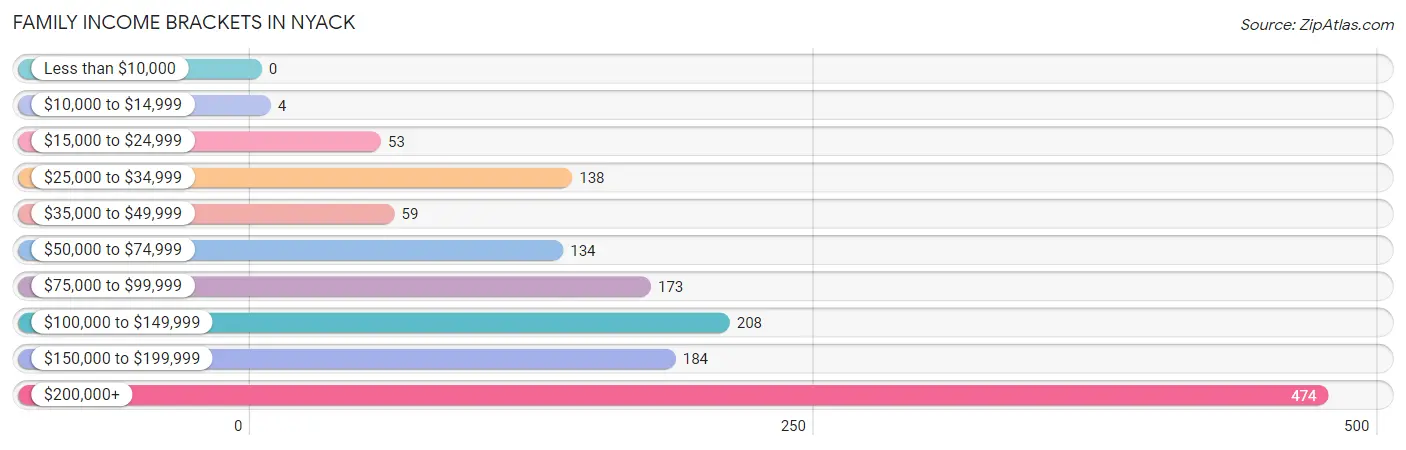
Family Income Brackets in Nyack
According to the Nyack family income data, there are 474 families falling into the $200,000+ income range, which is the most common income bracket and makes up 33.2% of all families.
| Income Bracket | # Families | % Families |
| Less than $10,000 | 0 | 0.0% |
| $10,000 to $14,999 | 4 | 0.3% |
| $15,000 to $24,999 | 53 | 3.7% |
| $25,000 to $34,999 | 138 | 9.7% |
| $35,000 to $49,999 | 59 | 4.1% |
| $50,000 to $74,999 | 134 | 9.4% |
| $75,000 to $99,999 | 173 | 12.1% |
| $100,000 to $149,999 | 208 | 14.6% |
| $150,000 to $199,999 | 184 | 12.9% |
| $200,000+ | 474 | 33.2% |
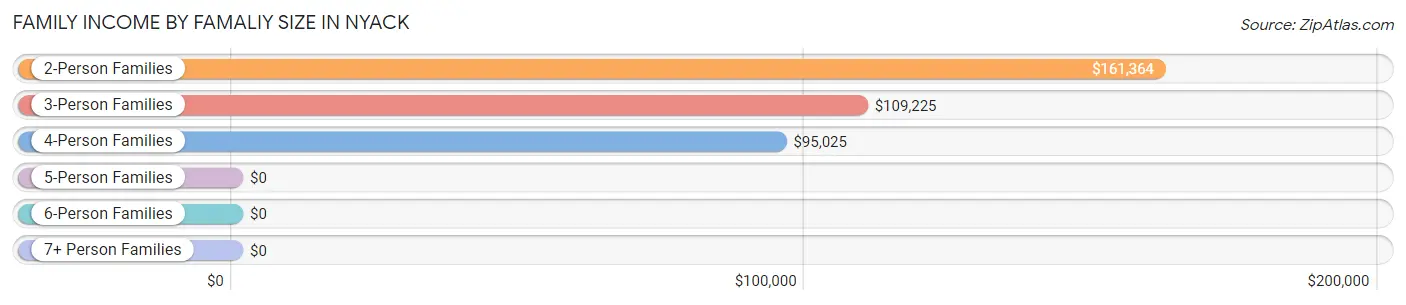
Family Income by Famaliy Size in Nyack
2-person families (642 | 45.0%) account for the highest median family income in Nyack with $161,364 per family, while 2-person families (642 | 45.0%) have the highest median income of $80,682 per family member.
| Income Bracket | # Families | Median Income |
| 2-Person Families | 642 (45.0%) | $161,364 |
| 3-Person Families | 300 (21.0%) | $109,225 |
| 4-Person Families | 449 (31.5%) | $95,025 |
| 5-Person Families | 0 (0.0%) | $0 |
| 6-Person Families | 0 (0.0%) | $0 |
| 7+ Person Families | 36 (2.5%) | $0 |
| Total | 1,427 (100.0%) | $124,207 |
Family Income by Number of Earners in Nyack
The median family income in Nyack is $124,207, with families comprising 2 earners (542) having the highest median family income of $220,244, while families with 1 earner (398) have the lowest median family income of $55,455, accounting for 38.0% and 27.9% of families, respectively.

| Number of Earners | # Families | Median Income |
| No Earners | 194 (13.6%) | $86,143 |
| 1 Earner | 398 (27.9%) | $55,455 |
| 2 Earners | 542 (38.0%) | $220,244 |
| 3+ Earners | 293 (20.5%) | $122,604 |
| Total | 1,427 (100.0%) | $124,207 |
Household Income in Nyack
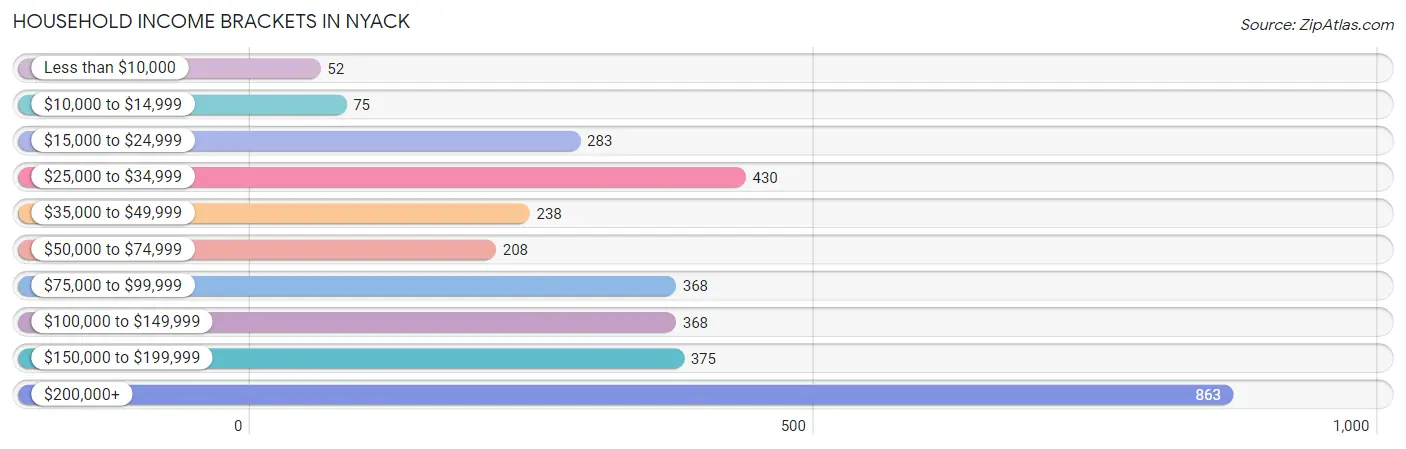
Household Income Brackets in Nyack
With 863 households falling in the category, the $200,000+ income range is the most frequent in Nyack, accounting for 26.5% of all households. In contrast, only 52 households (1.6%) fall into the less than $10,000 income bracket, making it the least populous group.
| Income Bracket | # Households | % Households |
| Less than $10,000 | 52 | 1.6% |
| $10,000 to $14,999 | 75 | 2.3% |
| $15,000 to $24,999 | 283 | 8.7% |
| $25,000 to $34,999 | 430 | 13.2% |
| $35,000 to $49,999 | 238 | 7.3% |
| $50,000 to $74,999 | 208 | 6.4% |
| $75,000 to $99,999 | 368 | 11.3% |
| $100,000 to $149,999 | 368 | 11.3% |
| $150,000 to $199,999 | 375 | 11.5% |
| $200,000+ | 863 | 26.5% |
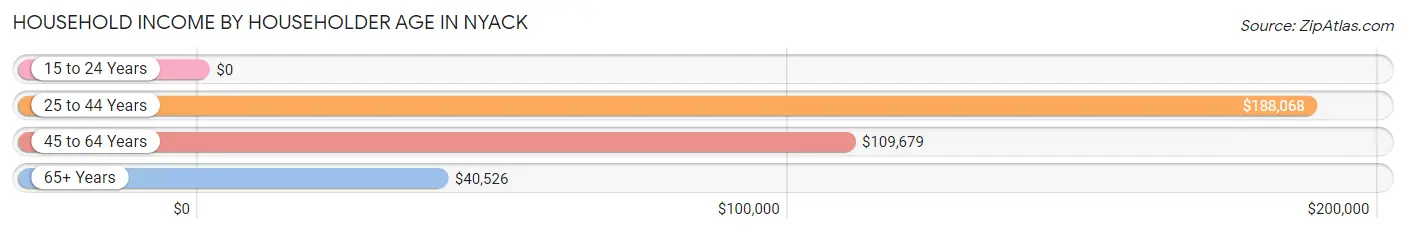
Household Income by Householder Age in Nyack
The median household income in Nyack is $97,013, with the highest median household income of $188,068 found in the 25 to 44 years age bracket for the primary householder. A total of 815 households (25.0%) fall into this category.
| Income Bracket | # Households | Median Income |
| 15 to 24 Years | 0 (0.0%) | $0 |
| 25 to 44 Years | 815 (25.0%) | $188,068 |
| 45 to 64 Years | 1,182 (36.3%) | $109,679 |
| 65+ Years | 1,260 (38.7%) | $40,526 |
| Total | 3,257 (100.0%) | $97,013 |
Poverty in Nyack
Income Below Poverty by Sex and Age in Nyack
With 5.2% poverty level for males and 2.4% for females among the residents of Nyack, under 5 year old males and 18 to 24 year old females are the most vulnerable to poverty, with 21 males (21.6%) and 16 females (14.9%) in their respective age groups living below the poverty level.
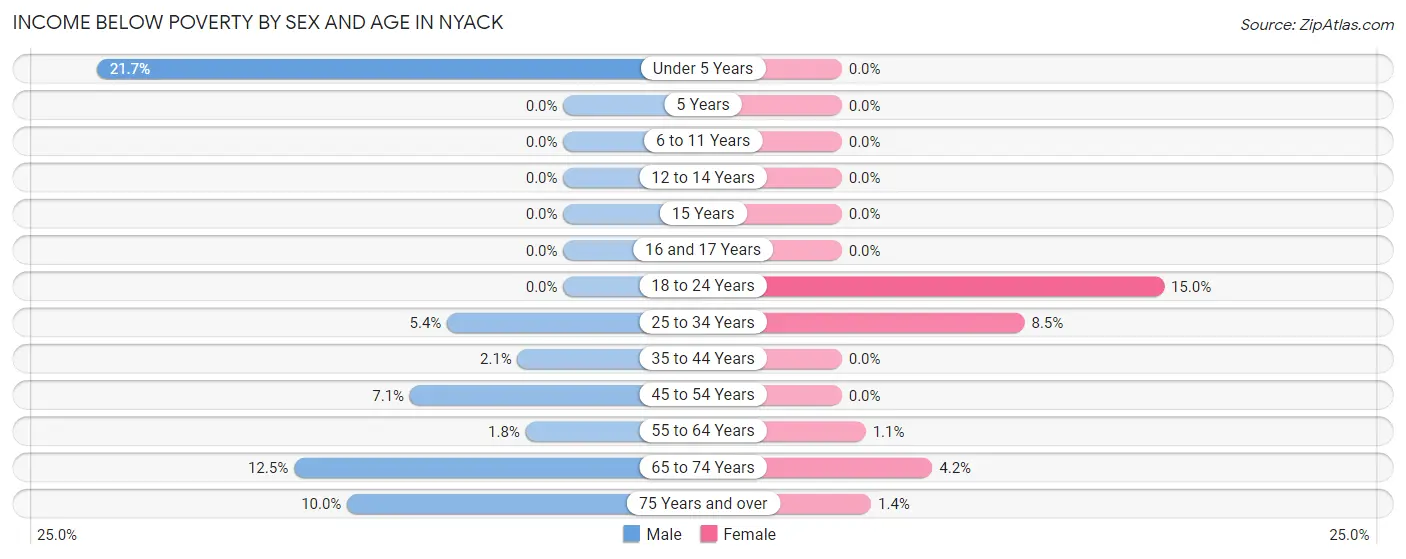
| Age Bracket | Male | Female |
| Under 5 Years | 21 (21.6%) | 0 (0.0%) |
| 5 Years | 0 (0.0%) | 0 (0.0%) |
| 6 to 11 Years | 0 (0.0%) | 0 (0.0%) |
| 12 to 14 Years | 0 (0.0%) | 0 (0.0%) |
| 15 Years | 0 (0.0%) | 0 (0.0%) |
| 16 and 17 Years | 0 (0.0%) | 0 (0.0%) |
| 18 to 24 Years | 0 (0.0%) | 16 (14.9%) |
| 25 to 34 Years | 27 (5.4%) | 39 (8.5%) |
| 35 to 44 Years | 12 (2.1%) | 0 (0.0%) |
| 45 to 54 Years | 27 (7.1%) | 0 (0.0%) |
| 55 to 64 Years | 7 (1.8%) | 9 (1.1%) |
| 65 to 74 Years | 32 (12.5%) | 25 (4.2%) |
| 75 Years and over | 39 (10.0%) | 4 (1.4%) |
| Total | 165 (5.2%) | 93 (2.4%) |
Income Above Poverty by Sex and Age in Nyack
According to the poverty statistics in Nyack, males aged 6 to 11 years and females aged under 5 years are the age groups that are most secure financially, with 100.0% of males and 100.0% of females in these age groups living above the poverty line.
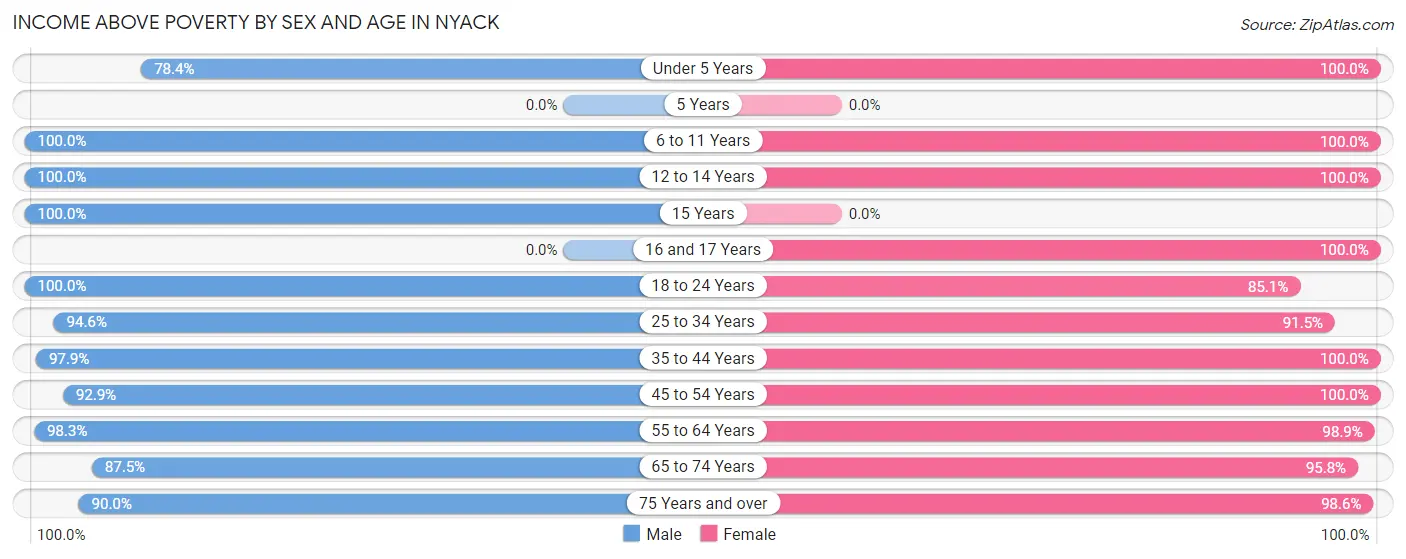
| Age Bracket | Male | Female |
| Under 5 Years | 76 (78.3%) | 296 (100.0%) |
| 5 Years | 0 (0.0%) | 0 (0.0%) |
| 6 to 11 Years | 213 (100.0%) | 334 (100.0%) |
| 12 to 14 Years | 180 (100.0%) | 23 (100.0%) |
| 15 Years | 25 (100.0%) | 0 (0.0%) |
| 16 and 17 Years | 0 (0.0%) | 67 (100.0%) |
| 18 to 24 Years | 181 (100.0%) | 91 (85.1%) |
| 25 to 34 Years | 474 (94.6%) | 421 (91.5%) |
| 35 to 44 Years | 553 (97.9%) | 533 (100.0%) |
| 45 to 54 Years | 352 (92.9%) | 327 (100.0%) |
| 55 to 64 Years | 394 (98.3%) | 805 (98.9%) |
| 65 to 74 Years | 224 (87.5%) | 570 (95.8%) |
| 75 Years and over | 350 (90.0%) | 291 (98.6%) |
| Total | 3,022 (94.8%) | 3,758 (97.6%) |
Income Below Poverty Among Married-Couple Families in Nyack
The poverty statistics for married-couple families in Nyack show that 0.9% or 8 of the total 934 families live below the poverty line. Families with no children have the highest poverty rate of 1.2%, comprising of 8 families. On the other hand, families with 1 or 2 children have the lowest poverty rate of 0.0%, which includes 0 families.
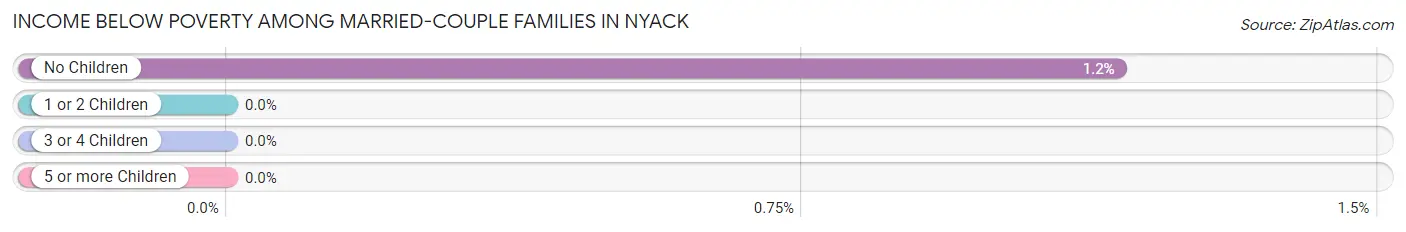
| Children | Above Poverty | Below Poverty |
| No Children | 679 (98.8%) | 8 (1.2%) |
| 1 or 2 Children | 247 (100.0%) | 0 (0.0%) |
| 3 or 4 Children | 0 (0.0%) | 0 (0.0%) |
| 5 or more Children | 0 (0.0%) | 0 (0.0%) |
| Total | 926 (99.1%) | 8 (0.9%) |
Income Below Poverty Among Single-Parent Households in Nyack
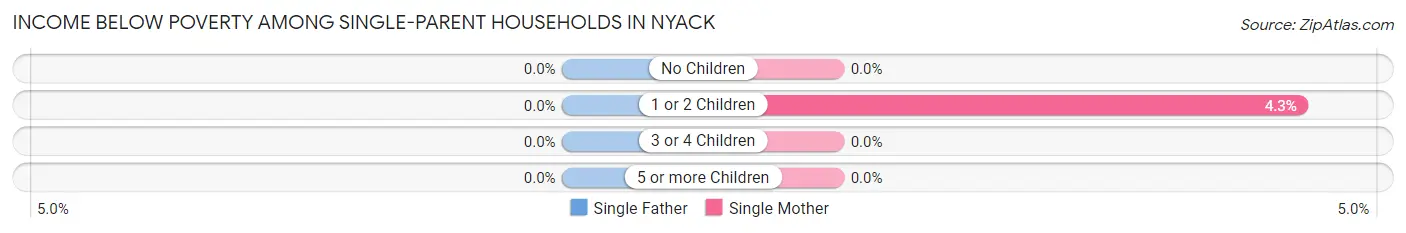
| Children | Single Father | Single Mother |
| No Children | 0 (0.0%) | 0 (0.0%) |
| 1 or 2 Children | 0 (0.0%) | 13 (4.3%) |
| 3 or 4 Children | 0 (0.0%) | 0 (0.0%) |
| 5 or more Children | 0 (0.0%) | 0 (0.0%) |
| Total | 0 (0.0%) | 13 (2.8%) |
Income Below Poverty Among Married-Couple vs Single-Parent Households in Nyack
The poverty data for Nyack shows that 8 of the married-couple family households (0.9%) and 13 of the single-parent households (2.6%) are living below the poverty level. Within the married-couple family households, those with no children have the highest poverty rate, with 8 households (1.2%) falling below the poverty line. Among the single-parent households, those with 1 or 2 children have the highest poverty rate, with 13 household (4.3%) living below poverty.
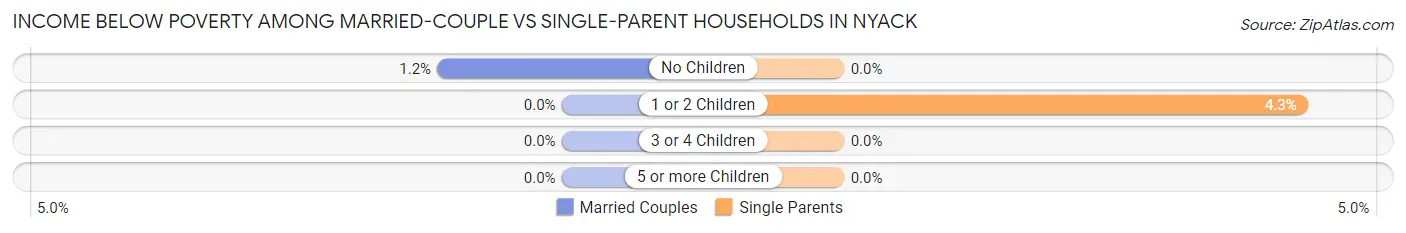
| Children | Married-Couple Families | Single-Parent Households |
| No Children | 8 (1.2%) | 0 (0.0%) |
| 1 or 2 Children | 0 (0.0%) | 13 (4.3%) |
| 3 or 4 Children | 0 (0.0%) | 0 (0.0%) |
| 5 or more Children | 0 (0.0%) | 0 (0.0%) |
| Total | 8 (0.9%) | 13 (2.6%) |
Race in Nyack
The most populous races in Nyack are White / Caucasian (3,882 | 55.0%), Black / African American (1,849 | 26.2%), and Hispanic or Latino (1,131 | 16.0%).
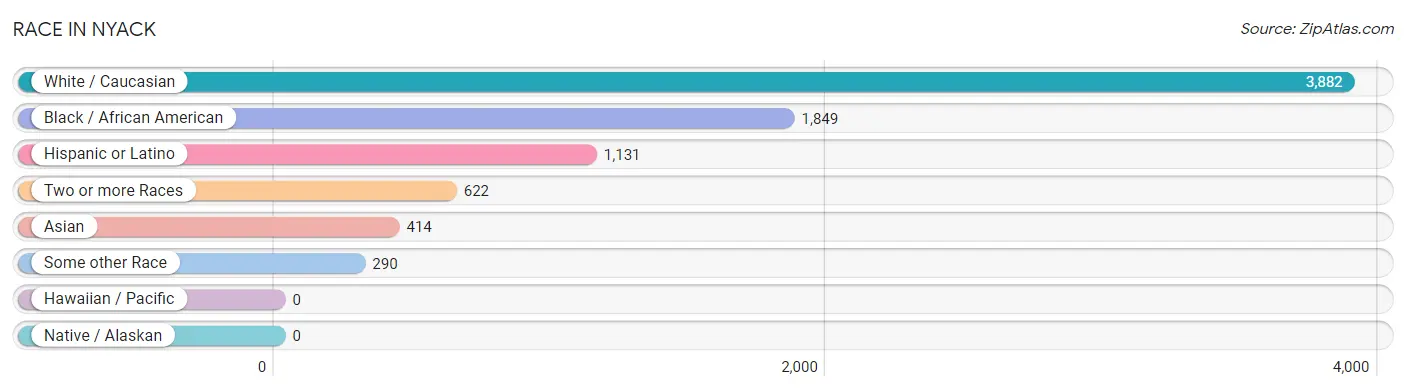
| Race | # Population | % Population |
| Asian | 414 | 5.9% |
| Black / African American | 1,849 | 26.2% |
| Hawaiian / Pacific | 0 | 0.0% |
| Hispanic or Latino | 1,131 | 16.0% |
| Native / Alaskan | 0 | 0.0% |
| White / Caucasian | 3,882 | 55.0% |
| Two or more Races | 622 | 8.8% |
| Some other Race | 290 | 4.1% |
| Total | 7,057 | 100.0% |
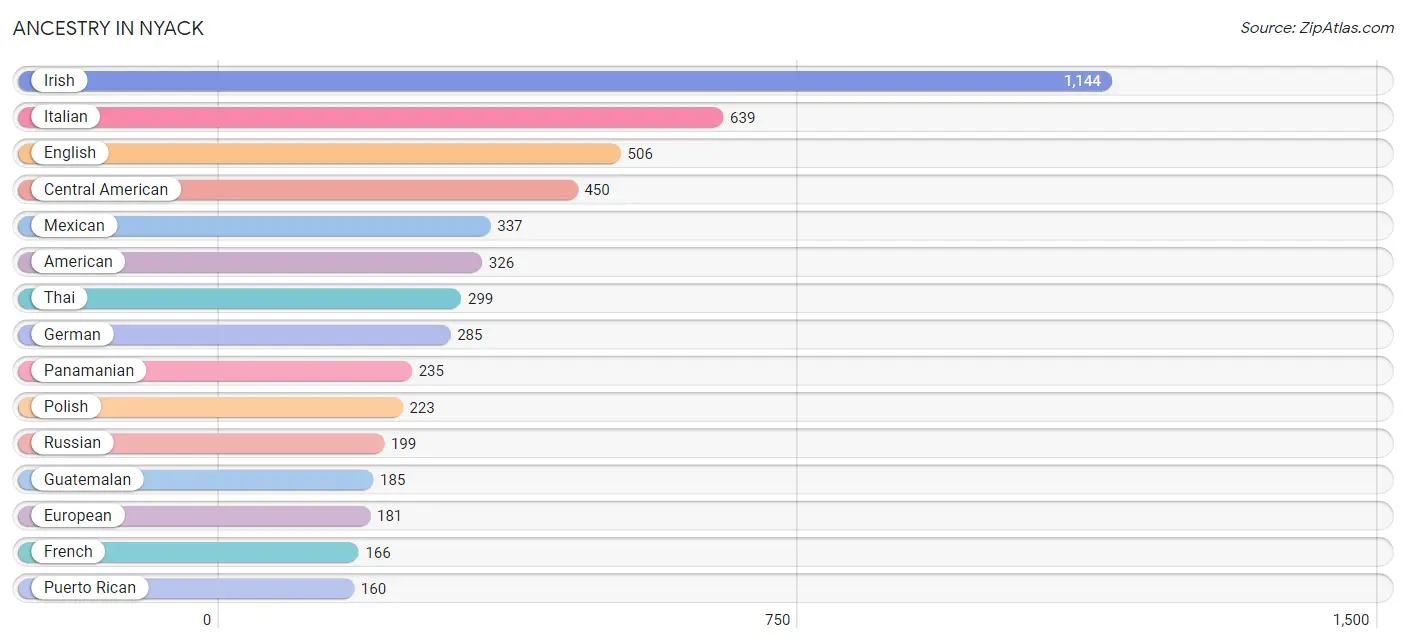
Ancestry in Nyack
The most populous ancestries reported in Nyack are Irish (1,144 | 16.2%), Italian (639 | 9.0%), English (506 | 7.2%), Central American (450 | 6.4%), and Mexican (337 | 4.8%), together accounting for 43.6% of all Nyack residents.
| Ancestry | # Population | % Population |
| African | 154 | 2.2% |
| American | 326 | 4.6% |
| Arab | 61 | 0.9% |
| Austrian | 98 | 1.4% |
| Bhutanese | 20 | 0.3% |
| British | 20 | 0.3% |
| Burmese | 7 | 0.1% |
| Canadian | 40 | 0.6% |
| Central American | 450 | 6.4% |
| Colombian | 114 | 1.6% |
| Czech | 28 | 0.4% |
| Danish | 18 | 0.3% |
| Dominican | 12 | 0.2% |
| Dutch | 58 | 0.8% |
| Eastern European | 115 | 1.6% |
| Ecuadorian | 17 | 0.2% |
| English | 506 | 7.2% |
| European | 181 | 2.6% |
| Finnish | 27 | 0.4% |
| French | 166 | 2.4% |
| French Canadian | 10 | 0.1% |
| German | 285 | 4.0% |
| Greek | 120 | 1.7% |
| Guatemalan | 185 | 2.6% |
| Guyanese | 36 | 0.5% |
| Haitian | 140 | 2.0% |
| Hungarian | 38 | 0.5% |
| Indian (Asian) | 37 | 0.5% |
| Iraqi | 21 | 0.3% |
| Irish | 1,144 | 16.2% |
| Italian | 639 | 9.0% |
| Jamaican | 133 | 1.9% |
| Kenyan | 1 | 0.0% |
| Korean | 152 | 2.1% |
| Lebanese | 40 | 0.6% |
| Lithuanian | 13 | 0.2% |
| Mexican | 337 | 4.8% |
| Northern European | 62 | 0.9% |
| Norwegian | 57 | 0.8% |
| Panamanian | 235 | 3.3% |
| Polish | 223 | 3.2% |
| Portuguese | 31 | 0.4% |
| Puerto Rican | 160 | 2.3% |
| Russian | 199 | 2.8% |
| Salvadoran | 30 | 0.4% |
| Scandinavian | 17 | 0.2% |
| Scottish | 60 | 0.9% |
| South American | 157 | 2.2% |
| Sri Lankan | 12 | 0.2% |
| Subsaharan African | 155 | 2.2% |
| Swiss | 136 | 1.9% |
| Thai | 299 | 4.2% |
| Ukrainian | 8 | 0.1% |
| Uruguayan | 15 | 0.2% |
| Venezuelan | 11 | 0.2% | View All 55 Rows |
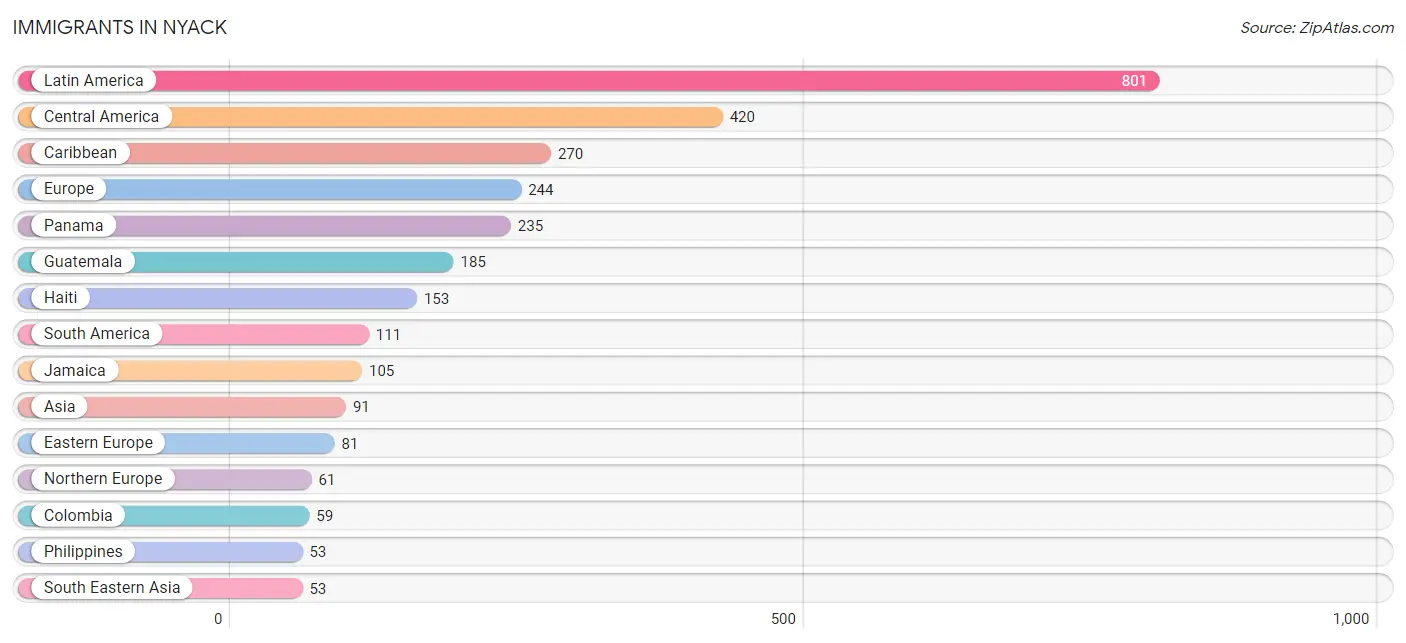
Immigrants in Nyack
The most numerous immigrant groups reported in Nyack came from Latin America (801 | 11.4%), Central America (420 | 5.9%), Caribbean (270 | 3.8%), Europe (244 | 3.5%), and Panama (235 | 3.3%), together accounting for 27.9% of all Nyack residents.
| Immigration Origin | # Population | % Population |
| Africa | 1 | 0.0% |
| Asia | 91 | 1.3% |
| Brazil | 29 | 0.4% |
| Canada | 21 | 0.3% |
| Caribbean | 270 | 3.8% |
| Central America | 420 | 5.9% |
| China | 6 | 0.1% |
| Colombia | 59 | 0.8% |
| Dominican Republic | 12 | 0.2% |
| Eastern Africa | 1 | 0.0% |
| Eastern Asia | 38 | 0.5% |
| Eastern Europe | 81 | 1.1% |
| England | 48 | 0.7% |
| Europe | 244 | 3.5% |
| France | 18 | 0.3% |
| Guatemala | 185 | 2.6% |
| Guyana | 8 | 0.1% |
| Haiti | 153 | 2.2% |
| Italy | 42 | 0.6% |
| Jamaica | 105 | 1.5% |
| Japan | 25 | 0.4% |
| Kenya | 1 | 0.0% |
| Korea | 7 | 0.1% |
| Latin America | 801 | 11.4% |
| Moldova | 39 | 0.5% |
| Northern Europe | 61 | 0.9% |
| Panama | 235 | 3.3% |
| Philippines | 53 | 0.7% |
| Poland | 34 | 0.5% |
| Portugal | 8 | 0.1% |
| South America | 111 | 1.6% |
| South Eastern Asia | 53 | 0.7% |
| Southern Europe | 50 | 0.7% |
| Switzerland | 34 | 0.5% |
| Ukraine | 8 | 0.1% |
| Uruguay | 15 | 0.2% |
| Western Europe | 52 | 0.7% | View All 37 Rows |
Sex and Age in Nyack
Sex and Age in Nyack
The most populous age groups in Nyack are 35 to 39 Years (404 | 12.7%) for men and 35 to 39 Years (465 | 12.0%) for women.
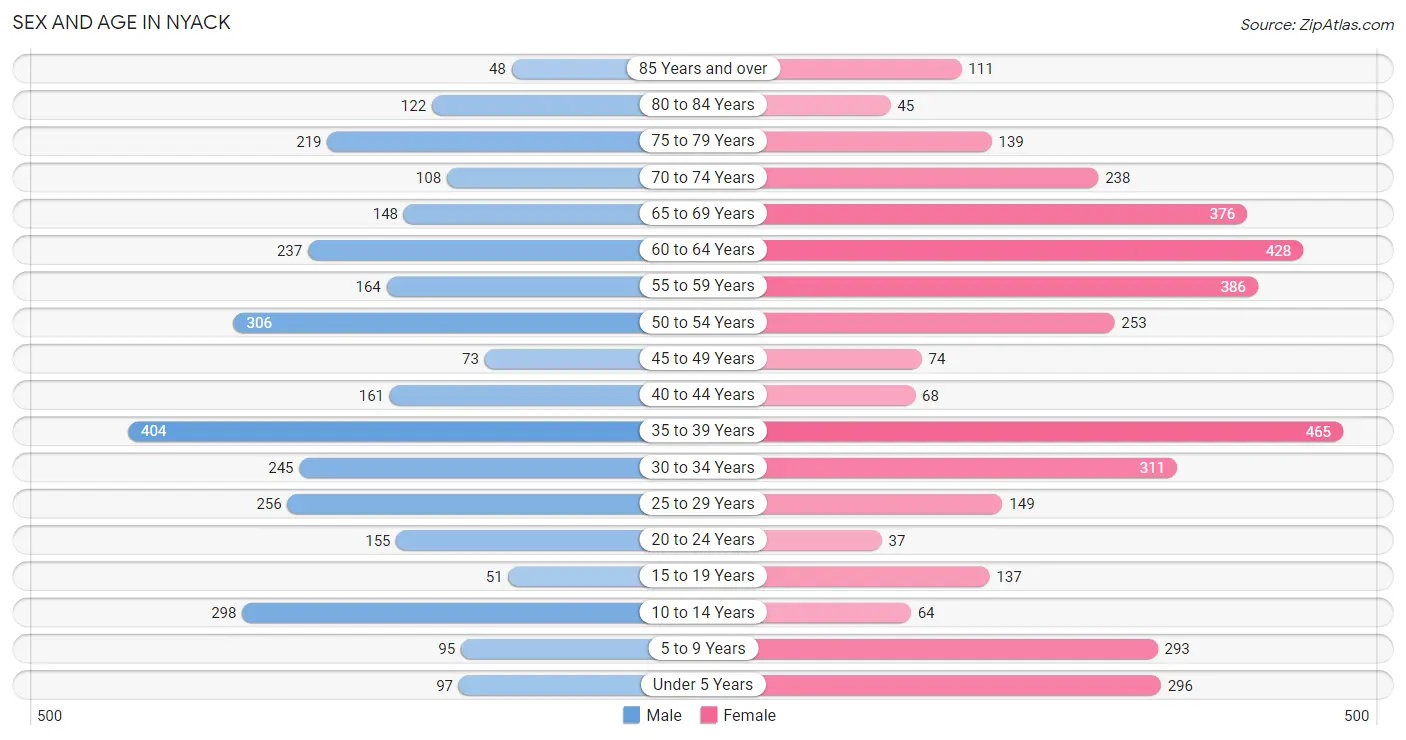
| Age Bracket | Male | Female |
| Under 5 Years | 97 (3.0%) | 296 (7.6%) |
| 5 to 9 Years | 95 (3.0%) | 293 (7.6%) |
| 10 to 14 Years | 298 (9.3%) | 64 (1.7%) |
| 15 to 19 Years | 51 (1.6%) | 137 (3.5%) |
| 20 to 24 Years | 155 (4.9%) | 37 (1.0%) |
| 25 to 29 Years | 256 (8.0%) | 149 (3.8%) |
| 30 to 34 Years | 245 (7.7%) | 311 (8.0%) |
| 35 to 39 Years | 404 (12.7%) | 465 (12.0%) |
| 40 to 44 Years | 161 (5.1%) | 68 (1.8%) |
| 45 to 49 Years | 73 (2.3%) | 74 (1.9%) |
| 50 to 54 Years | 306 (9.6%) | 253 (6.5%) |
| 55 to 59 Years | 164 (5.1%) | 386 (10.0%) |
| 60 to 64 Years | 237 (7.4%) | 428 (11.1%) |
| 65 to 69 Years | 148 (4.6%) | 376 (9.7%) |
| 70 to 74 Years | 108 (3.4%) | 238 (6.1%) |
| 75 to 79 Years | 219 (6.9%) | 139 (3.6%) |
| 80 to 84 Years | 122 (3.8%) | 45 (1.2%) |
| 85 Years and over | 48 (1.5%) | 111 (2.9%) |
| Total | 3,187 (100.0%) | 3,870 (100.0%) |
Families and Households in Nyack
Median Family Size in Nyack
The median family size in Nyack is 3.26 persons per family, with single female/mother families (468 | 32.8%) accounting for the largest median family size of 4.49 persons per family. On the other hand, single male/father families (25 | 1.8%) represent the smallest median family size with 2.60 persons per family.
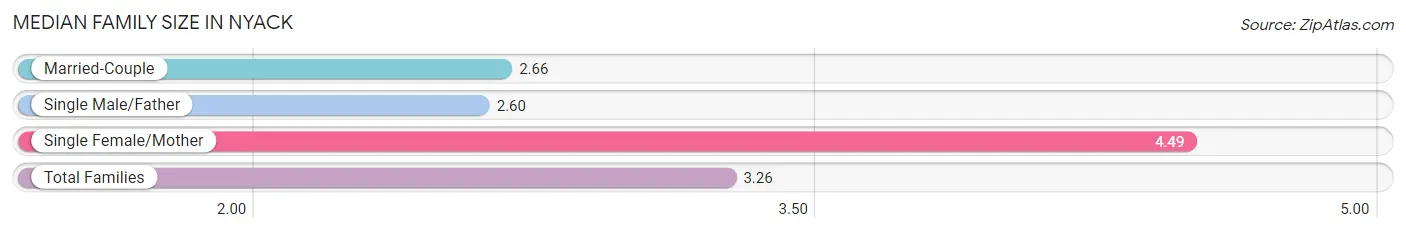
| Family Type | # Families | Family Size |
| Married-Couple | 934 (65.4%) | 2.66 |
| Single Male/Father | 25 (1.8%) | 2.60 |
| Single Female/Mother | 468 (32.8%) | 4.49 |
| Total Families | 1,427 (100.0%) | 3.26 |
Median Household Size in Nyack
The median household size in Nyack is 2.14 persons per household, with single female/mother households (468 | 14.4%) accounting for the largest median household size of 4.57 persons per household. non-family households (1,830 | 56.2%) represent the smallest median household size with 1.24 persons per household.
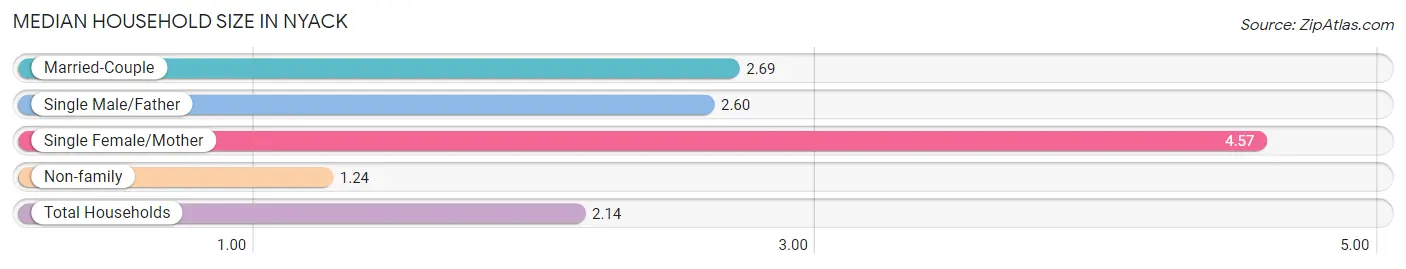
| Household Type | # Households | Household Size |
| Married-Couple | 934 (28.7%) | 2.69 |
| Single Male/Father | 25 (0.8%) | 2.60 |
| Single Female/Mother | 468 (14.4%) | 4.57 |
| Non-family | 1,830 (56.2%) | 1.24 |
| Total Households | 3,257 (100.0%) | 2.14 |
Household Size by Marriage Status in Nyack
Out of a total of 3,257 households in Nyack, 1,427 (43.8%) are family households, while 1,830 (56.2%) are nonfamily households. The most numerous type of family households are 2-person households, comprising 631, and the most common type of nonfamily households are 1-person households, comprising 1,269.
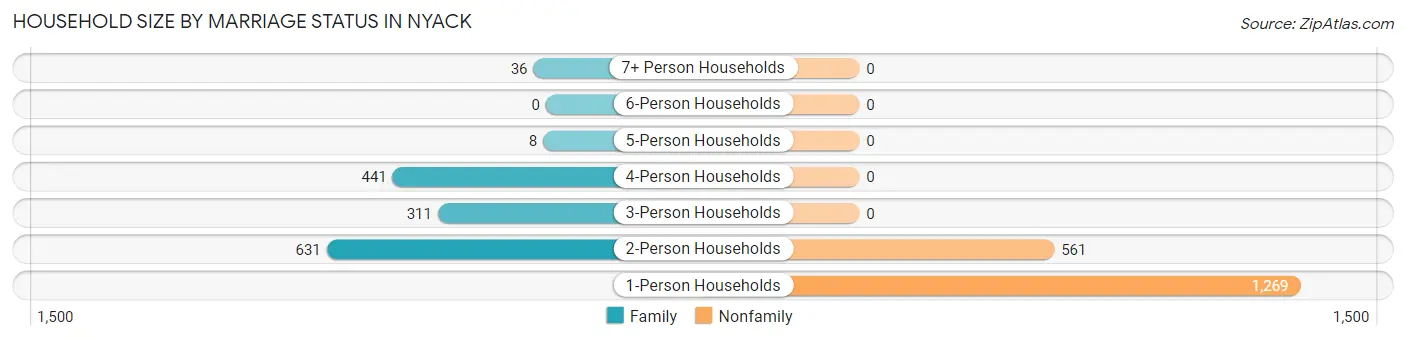
| Household Size | Family Households | Nonfamily Households |
| 1-Person Households | - | 1,269 (39.0%) |
| 2-Person Households | 631 (19.4%) | 561 (17.2%) |
| 3-Person Households | 311 (9.6%) | 0 (0.0%) |
| 4-Person Households | 441 (13.5%) | 0 (0.0%) |
| 5-Person Households | 8 (0.3%) | 0 (0.0%) |
| 6-Person Households | 0 (0.0%) | 0 (0.0%) |
| 7+ Person Households | 36 (1.1%) | 0 (0.0%) |
| Total | 1,427 (43.8%) | 1,830 (56.2%) |
Female Fertility in Nyack
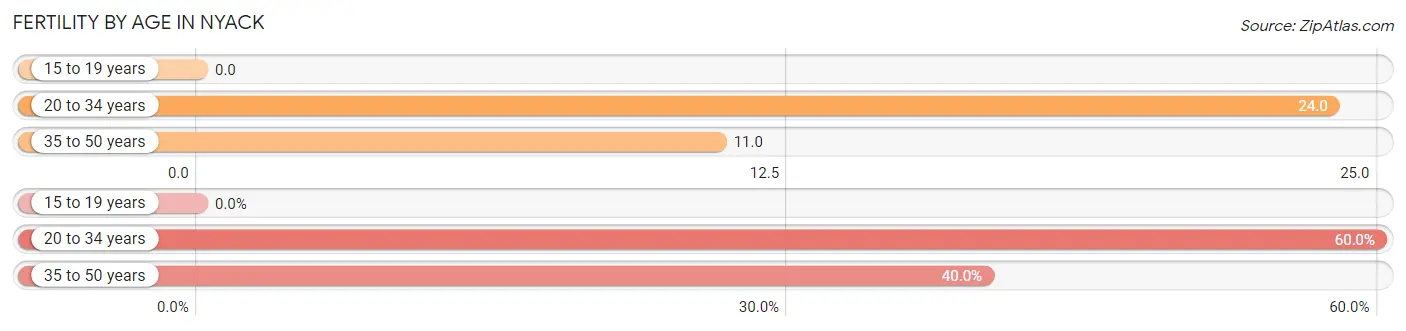
Fertility by Age in Nyack
Average fertility rate in Nyack is 15.0 births per 1,000 women. Women in the age bracket of 20 to 34 years have the highest fertility rate with 24.0 births per 1,000 women. Women in the age bracket of 20 to 34 years acount for 60.0% of all women with births.
| Age Bracket | Women with Births | Births / 1,000 Women |
| 15 to 19 years | 0 (0.0%) | 0.0 |
| 20 to 34 years | 12 (60.0%) | 24.0 |
| 35 to 50 years | 8 (40.0%) | 11.0 |
| Total | 20 (100.0%) | 15.0 |
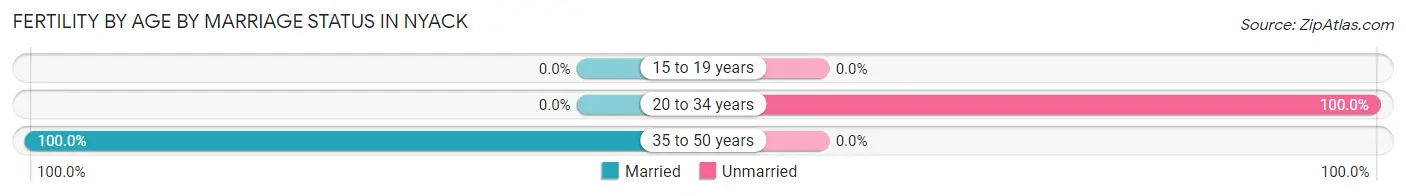
Fertility by Age by Marriage Status in Nyack
40.0% of women with births (20) in Nyack are married. The highest percentage of unmarried women with births falls into 20 to 34 years age bracket with 100.0% of them unmarried at the time of birth, while the lowest percentage of unmarried women with births belong to 35 to 50 years age bracket with 0.0% of them unmarried.
| Age Bracket | Married | Unmarried |
| 15 to 19 years | 0 (0.0%) | 0 (0.0%) |
| 20 to 34 years | 0 (0.0%) | 12 (100.0%) |
| 35 to 50 years | 8 (100.0%) | 0 (0.0%) |
| Total | 8 (40.0%) | 12 (60.0%) |
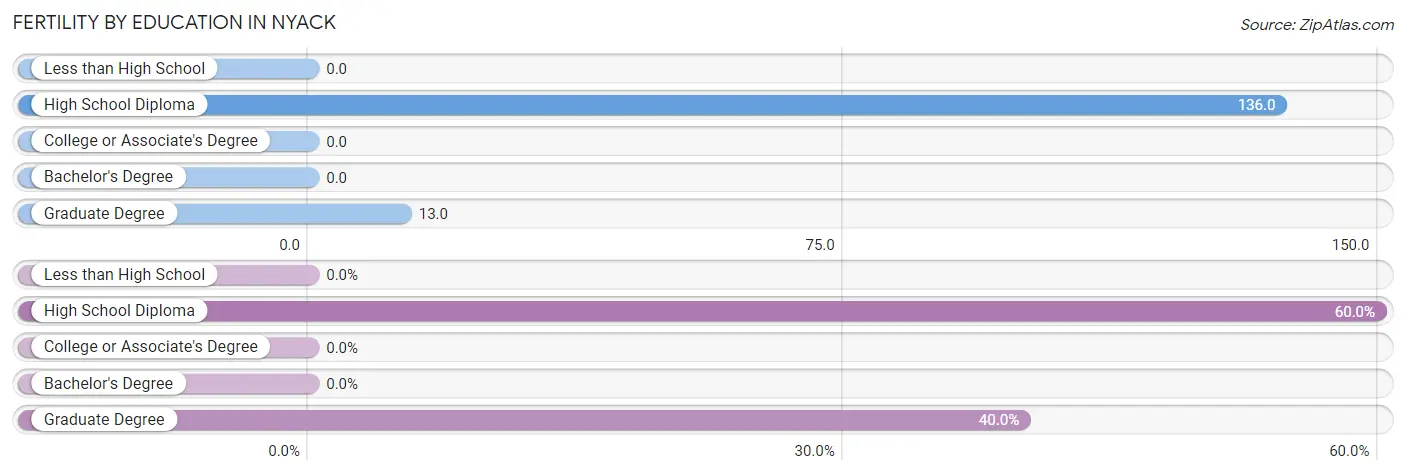
Fertility by Education in Nyack
| Educational Attainment | Women with Births | Births / 1,000 Women |
| Less than High School | 0 (0.0%) | 0.0 |
| High School Diploma | 12 (60.0%) | 136.0 |
| College or Associate's Degree | 0 (0.0%) | 0.0 |
| Bachelor's Degree | 0 (0.0%) | 0.0 |
| Graduate Degree | 8 (40.0%) | 13.0 |
| Total | 20 (100.0%) | 15.0 |
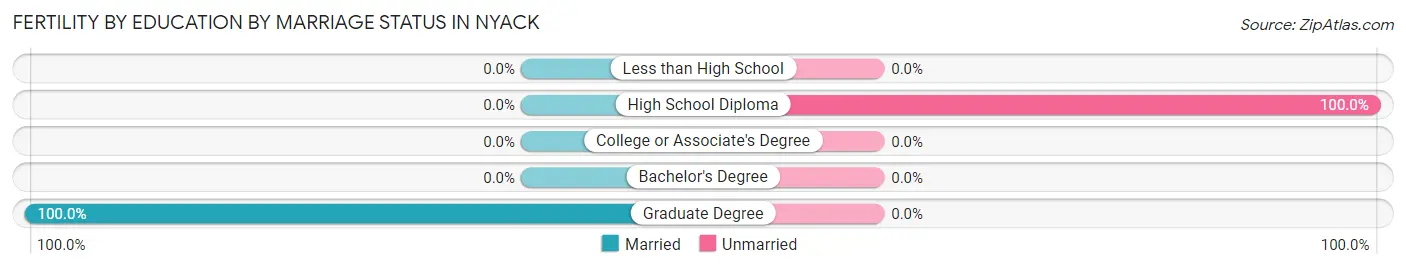
Fertility by Education by Marriage Status in Nyack
60.0% of women with births in Nyack are unmarried. Women with the educational attainment of graduate degree are most likely to be married with 100.0% of them married at childbirth, while women with the educational attainment of high school diploma are least likely to be married with 100.0% of them unmarried at childbirth.
| Educational Attainment | Married | Unmarried |
| Less than High School | 0 (0.0%) | 0 (0.0%) |
| High School Diploma | 0 (0.0%) | 12 (100.0%) |
| College or Associate's Degree | 0 (0.0%) | 0 (0.0%) |
| Bachelor's Degree | 0 (0.0%) | 0 (0.0%) |
| Graduate Degree | 8 (100.0%) | 0 (0.0%) |
| Total | 8 (40.0%) | 12 (60.0%) |
Employment Characteristics in Nyack
Employment by Class of Employer in Nyack
Among the 3,652 employed individuals in Nyack, private company employees (2,146 | 58.8%), not-for-profit organizations (568 | 15.5%), and self-employed (not incorporated) (344 | 9.4%) make up the most common classes of employment.
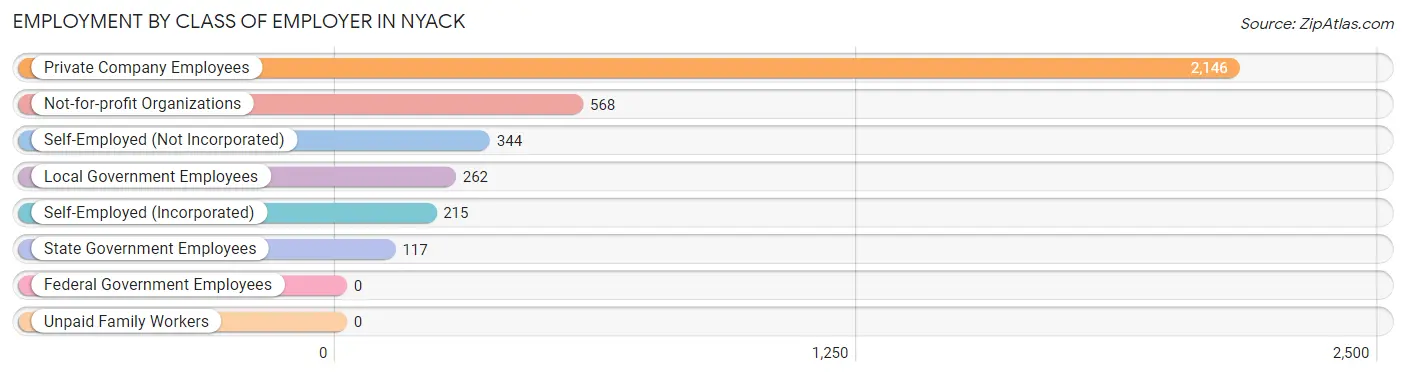
| Employer Class | # Employees | % Employees |
| Private Company Employees | 2,146 | 58.8% |
| Self-Employed (Incorporated) | 215 | 5.9% |
| Self-Employed (Not Incorporated) | 344 | 9.4% |
| Not-for-profit Organizations | 568 | 15.5% |
| Local Government Employees | 262 | 7.2% |
| State Government Employees | 117 | 3.2% |
| Federal Government Employees | 0 | 0.0% |
| Unpaid Family Workers | 0 | 0.0% |
| Total | 3,652 | 100.0% |
Employment Status by Age in Nyack
According to the labor force statistics for Nyack, out of the total population over 16 years of age (5,889), 69.4% or 4,087 individuals are in the labor force, with 9.7% or 396 of them unemployed. The age group with the highest labor force participation rate is 35 to 44 years, with 99.5% or 1,093 individuals in the labor force. Within the labor force, the 16 to 19 years age range has the highest percentage of unemployed individuals, with 85.5% or 65 of them being unemployed.
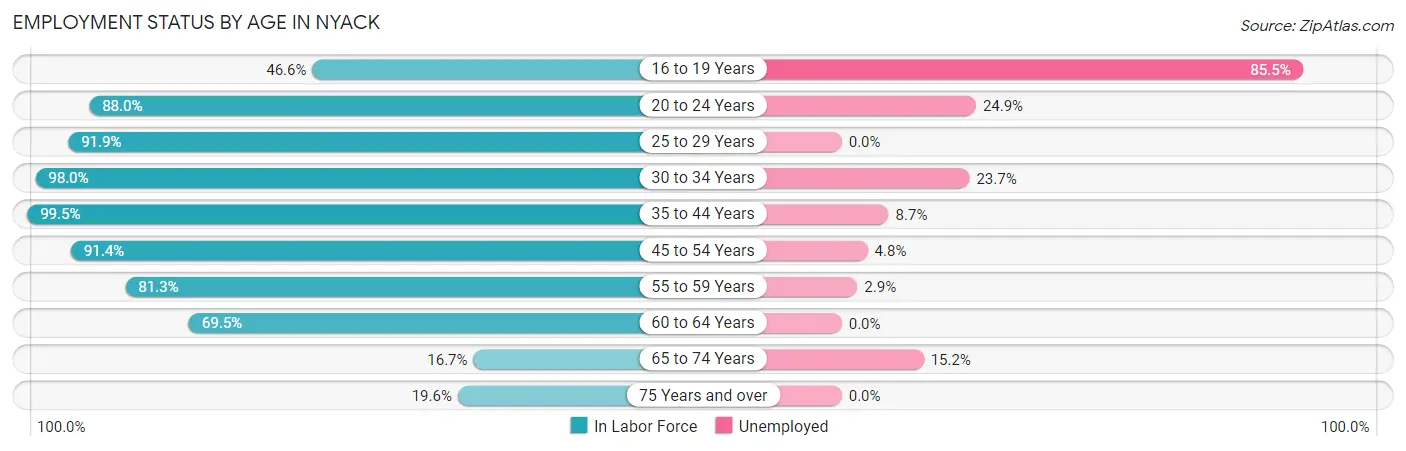
| Age Bracket | In Labor Force | Unemployed |
| 16 to 19 Years | 76 (46.6%) | 65 (85.5%) |
| 20 to 24 Years | 169 (88.0%) | 42 (24.9%) |
| 25 to 29 Years | 372 (91.9%) | 0 (0.0%) |
| 30 to 34 Years | 545 (98.0%) | 129 (23.7%) |
| 35 to 44 Years | 1,093 (99.5%) | 95 (8.7%) |
| 45 to 54 Years | 645 (91.4%) | 31 (4.8%) |
| 55 to 59 Years | 447 (81.3%) | 13 (2.9%) |
| 60 to 64 Years | 462 (69.5%) | 0 (0.0%) |
| 65 to 74 Years | 145 (16.7%) | 22 (15.2%) |
| 75 Years and over | 134 (19.6%) | 0 (0.0%) |
| Total | 4,087 (69.4%) | 396 (9.7%) |
Employment Status by Educational Attainment in Nyack
According to labor force statistics for Nyack, 89.5% of individuals (3,562) out of the total population between 25 and 64 years of age (3,980) are in the labor force, with 7.5% or 267 of them being unemployed. The group with the highest labor force participation rate are those with the educational attainment of bachelor's degree or higher, with 93.2% or 2,232 individuals in the labor force. Within the labor force, individuals with college / associate degree education have the highest percentage of unemployment, with 20.6% or 125 of them being unemployed.
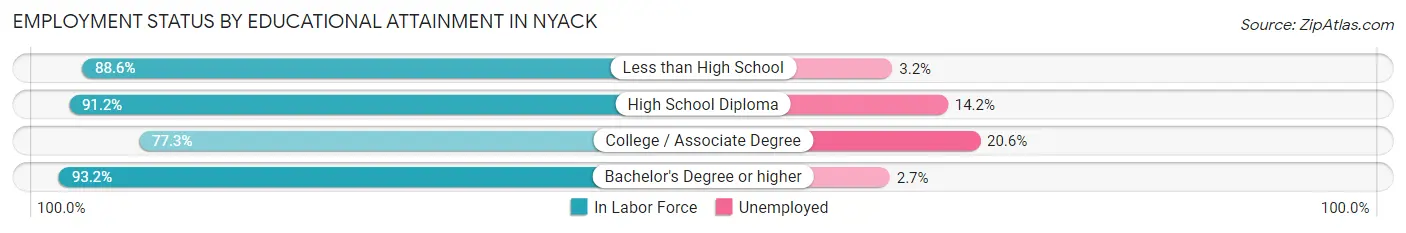
| Educational Attainment | In Labor Force | Unemployed |
| Less than High School | 186 (88.6%) | 7 (3.2%) |
| High School Diploma | 536 (91.2%) | 83 (14.2%) |
| College / Associate Degree | 608 (77.3%) | 162 (20.6%) |
| Bachelor's Degree or higher | 2,232 (93.2%) | 65 (2.7%) |
| Total | 3,562 (89.5%) | 298 (7.5%) |
Employment Occupations by Sex in Nyack
Management, Business, Science and Arts Occupations
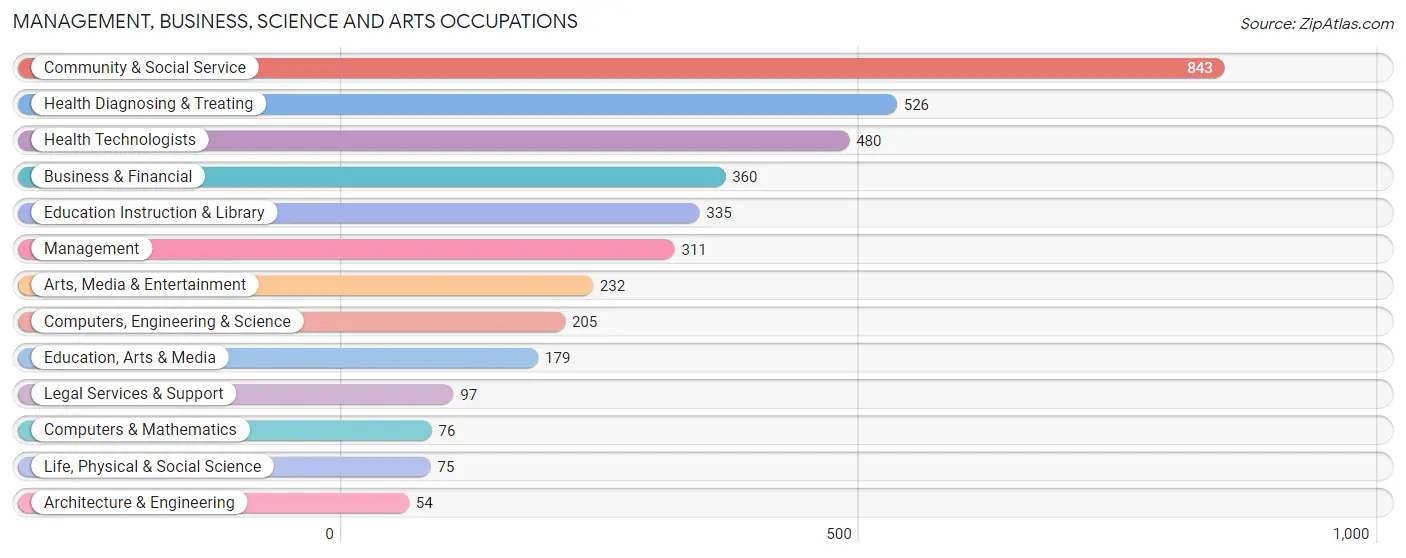
The most common Management, Business, Science and Arts occupations in Nyack are Community & Social Service (843 | 22.9%), Health Diagnosing & Treating (526 | 14.2%), Health Technologists (480 | 13.0%), Business & Financial (360 | 9.8%), and Education Instruction & Library (335 | 9.1%).
Management, Business, Science and Arts Occupations by Sex
Within the Management, Business, Science and Arts occupations in Nyack, the most male-oriented occupations are Computers & Mathematics (100.0%), Arts, Media & Entertainment (75.9%), and Business & Financial (63.6%), while the most female-oriented occupations are Health Technologists (84.0%), Health Diagnosing & Treating (83.1%), and Architecture & Engineering (74.1%).
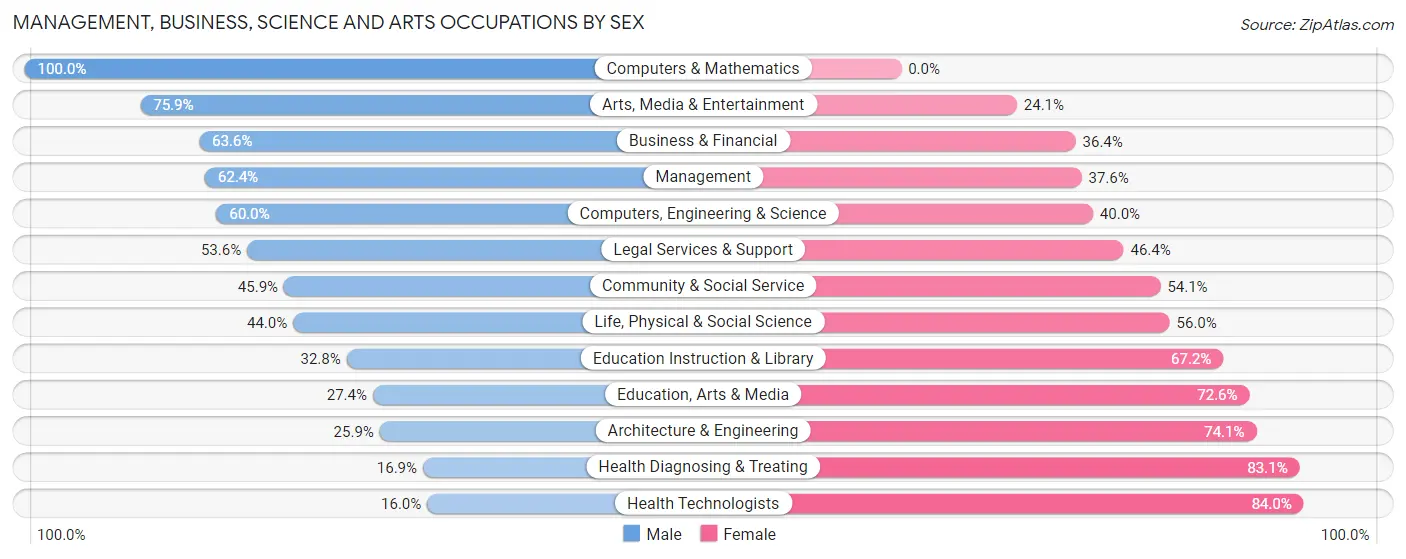
| Occupation | Male | Female |
| Management | 194 (62.4%) | 117 (37.6%) |
| Business & Financial | 229 (63.6%) | 131 (36.4%) |
| Computers, Engineering & Science | 123 (60.0%) | 82 (40.0%) |
| Computers & Mathematics | 76 (100.0%) | 0 (0.0%) |
| Architecture & Engineering | 14 (25.9%) | 40 (74.1%) |
| Life, Physical & Social Science | 33 (44.0%) | 42 (56.0%) |
| Community & Social Service | 387 (45.9%) | 456 (54.1%) |
| Education, Arts & Media | 49 (27.4%) | 130 (72.6%) |
| Legal Services & Support | 52 (53.6%) | 45 (46.4%) |
| Education Instruction & Library | 110 (32.8%) | 225 (67.2%) |
| Arts, Media & Entertainment | 176 (75.9%) | 56 (24.1%) |
| Health Diagnosing & Treating | 89 (16.9%) | 437 (83.1%) |
| Health Technologists | 77 (16.0%) | 403 (84.0%) |
| Total (Category) | 1,022 (45.5%) | 1,223 (54.5%) |
| Total (Overall) | 1,828 (49.5%) | 1,862 (50.5%) |
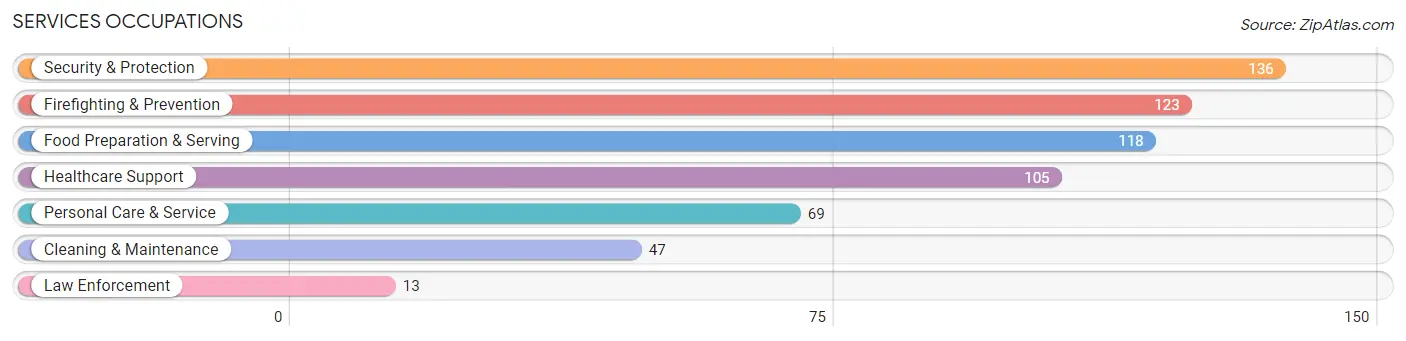
Services Occupations
The most common Services occupations in Nyack are Security & Protection (136 | 3.7%), Firefighting & Prevention (123 | 3.3%), Food Preparation & Serving (118 | 3.2%), Healthcare Support (105 | 2.9%), and Personal Care & Service (69 | 1.9%).
Services Occupations by Sex
Within the Services occupations in Nyack, the most male-oriented occupations are Law Enforcement (100.0%), Personal Care & Service (68.1%), and Food Preparation & Serving (51.7%), while the most female-oriented occupations are Healthcare Support (100.0%), Firefighting & Prevention (100.0%), and Cleaning & Maintenance (100.0%).
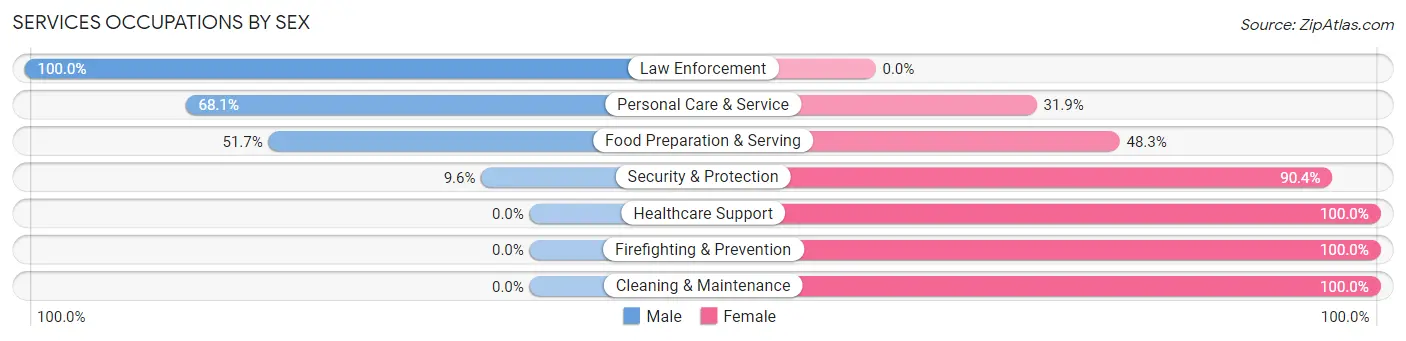
| Occupation | Male | Female |
| Healthcare Support | 0 (0.0%) | 105 (100.0%) |
| Security & Protection | 13 (9.6%) | 123 (90.4%) |
| Firefighting & Prevention | 0 (0.0%) | 123 (100.0%) |
| Law Enforcement | 13 (100.0%) | 0 (0.0%) |
| Food Preparation & Serving | 61 (51.7%) | 57 (48.3%) |
| Cleaning & Maintenance | 0 (0.0%) | 47 (100.0%) |
| Personal Care & Service | 47 (68.1%) | 22 (31.9%) |
| Total (Category) | 121 (25.5%) | 354 (74.5%) |
| Total (Overall) | 1,828 (49.5%) | 1,862 (50.5%) |
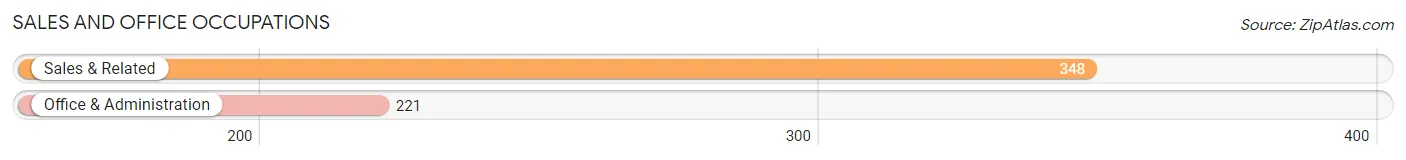
Sales and Office Occupations
The most common Sales and Office occupations in Nyack are Sales & Related (348 | 9.4%), and Office & Administration (221 | 6.0%).
Sales and Office Occupations by Sex
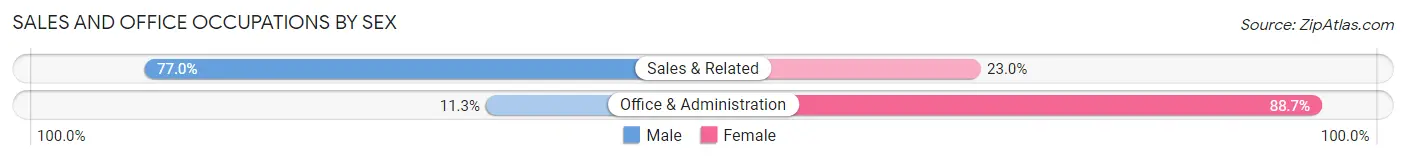
| Occupation | Male | Female |
| Sales & Related | 268 (77.0%) | 80 (23.0%) |
| Office & Administration | 25 (11.3%) | 196 (88.7%) |
| Total (Category) | 293 (51.5%) | 276 (48.5%) |
| Total (Overall) | 1,828 (49.5%) | 1,862 (50.5%) |
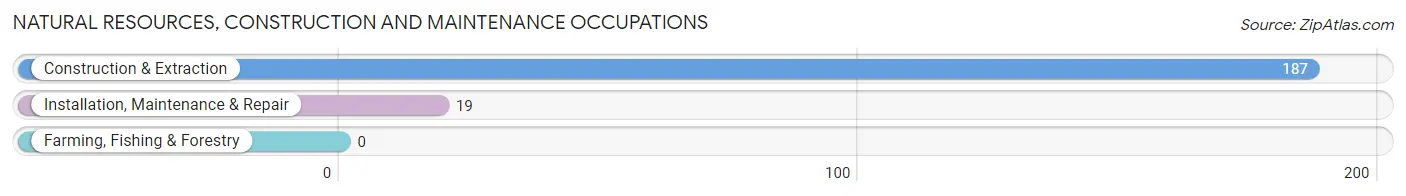
Natural Resources, Construction and Maintenance Occupations
The most common Natural Resources, Construction and Maintenance occupations in Nyack are Construction & Extraction (187 | 5.1%), and Installation, Maintenance & Repair (19 | 0.5%).
Natural Resources, Construction and Maintenance Occupations by Sex
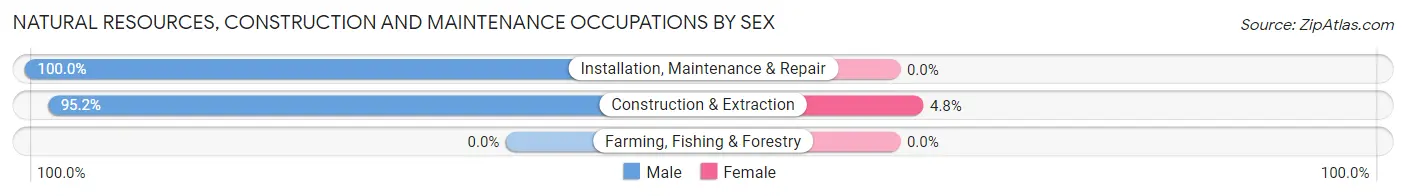
| Occupation | Male | Female |
| Farming, Fishing & Forestry | 0 (0.0%) | 0 (0.0%) |
| Construction & Extraction | 178 (95.2%) | 9 (4.8%) |
| Installation, Maintenance & Repair | 19 (100.0%) | 0 (0.0%) |
| Total (Category) | 197 (95.6%) | 9 (4.4%) |
| Total (Overall) | 1,828 (49.5%) | 1,862 (50.5%) |
Production, Transportation and Moving Occupations
The most common Production, Transportation and Moving occupations in Nyack are Material Moving (93 | 2.5%), Production (55 | 1.5%), and Transportation (47 | 1.3%).
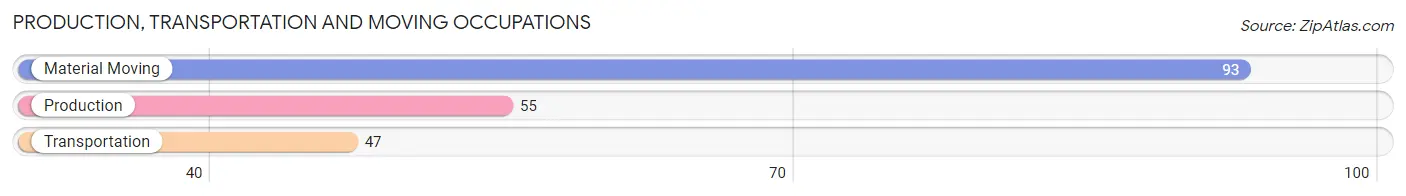
Production, Transportation and Moving Occupations by Sex
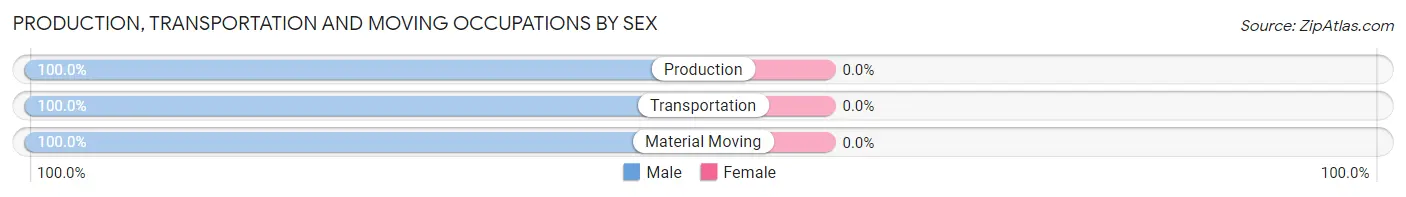
| Occupation | Male | Female |
| Production | 55 (100.0%) | 0 (0.0%) |
| Transportation | 47 (100.0%) | 0 (0.0%) |
| Material Moving | 93 (100.0%) | 0 (0.0%) |
| Total (Category) | 195 (100.0%) | 0 (0.0%) |
| Total (Overall) | 1,828 (49.5%) | 1,862 (50.5%) |
Employment Industries by Sex in Nyack
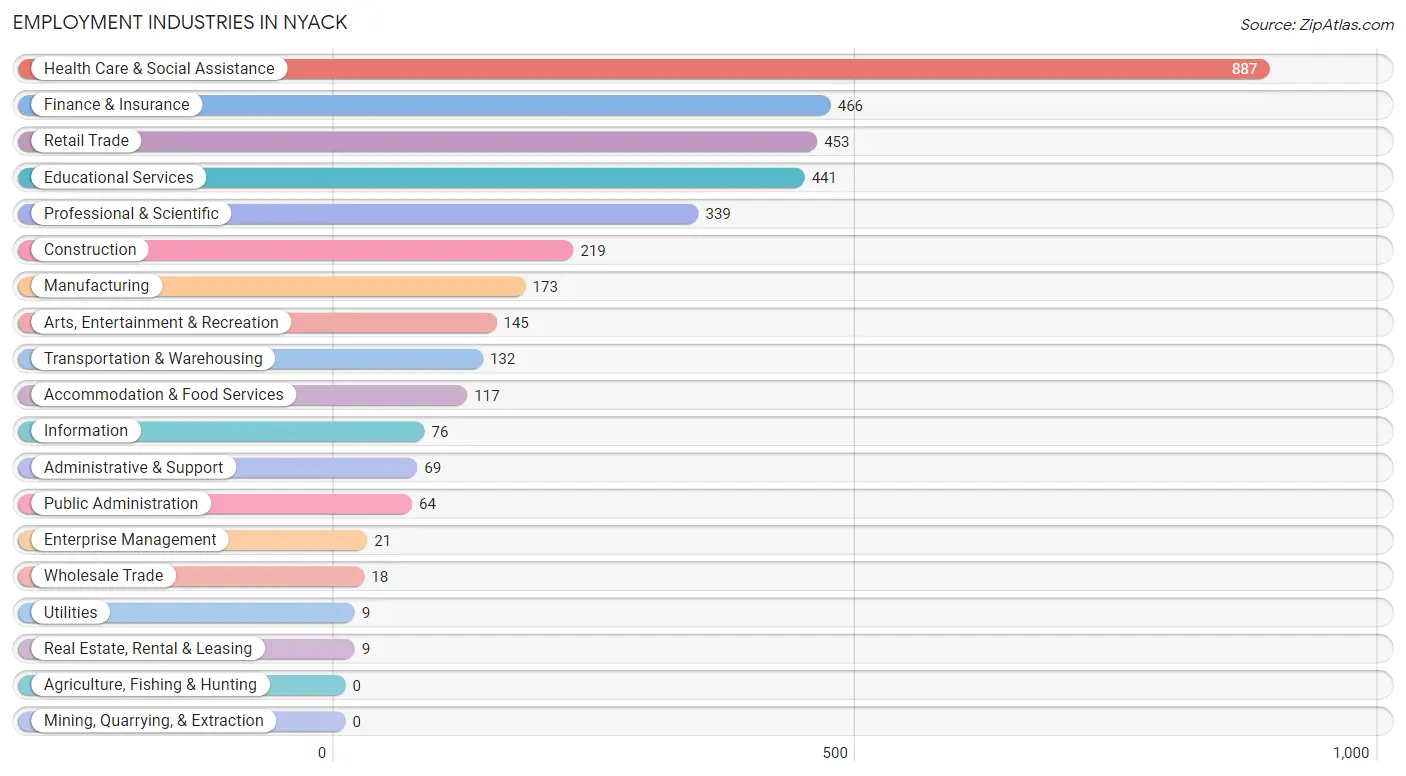
Employment Industries in Nyack
The major employment industries in Nyack include Health Care & Social Assistance (887 | 24.0%), Finance & Insurance (466 | 12.6%), Retail Trade (453 | 12.3%), Educational Services (441 | 11.9%), and Professional & Scientific (339 | 9.2%).
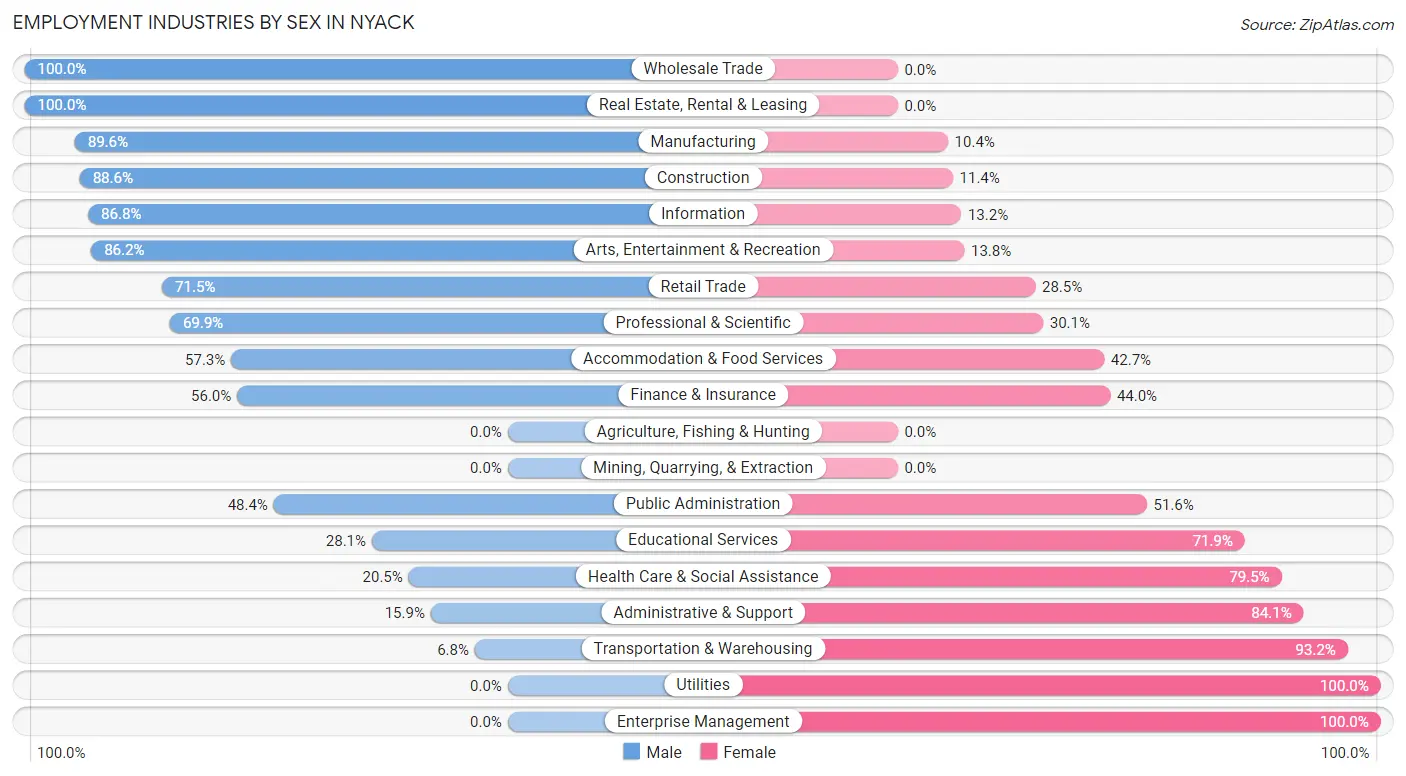
Employment Industries by Sex in Nyack
The Nyack industries that see more men than women are Wholesale Trade (100.0%), Real Estate, Rental & Leasing (100.0%), and Manufacturing (89.6%), whereas the industries that tend to have a higher number of women are Utilities (100.0%), Enterprise Management (100.0%), and Transportation & Warehousing (93.2%).
| Industry | Male | Female |
| Agriculture, Fishing & Hunting | 0 (0.0%) | 0 (0.0%) |
| Mining, Quarrying, & Extraction | 0 (0.0%) | 0 (0.0%) |
| Construction | 194 (88.6%) | 25 (11.4%) |
| Manufacturing | 155 (89.6%) | 18 (10.4%) |
| Wholesale Trade | 18 (100.0%) | 0 (0.0%) |
| Retail Trade | 324 (71.5%) | 129 (28.5%) |
| Transportation & Warehousing | 9 (6.8%) | 123 (93.2%) |
| Utilities | 0 (0.0%) | 9 (100.0%) |
| Information | 66 (86.8%) | 10 (13.2%) |
| Finance & Insurance | 261 (56.0%) | 205 (44.0%) |
| Real Estate, Rental & Leasing | 9 (100.0%) | 0 (0.0%) |
| Professional & Scientific | 237 (69.9%) | 102 (30.1%) |
| Enterprise Management | 0 (0.0%) | 21 (100.0%) |
| Administrative & Support | 11 (15.9%) | 58 (84.1%) |
| Educational Services | 124 (28.1%) | 317 (71.9%) |
| Health Care & Social Assistance | 182 (20.5%) | 705 (79.5%) |
| Arts, Entertainment & Recreation | 125 (86.2%) | 20 (13.8%) |
| Accommodation & Food Services | 67 (57.3%) | 50 (42.7%) |
| Public Administration | 31 (48.4%) | 33 (51.6%) |
| Total | 1,828 (49.5%) | 1,862 (50.5%) |
Education in Nyack
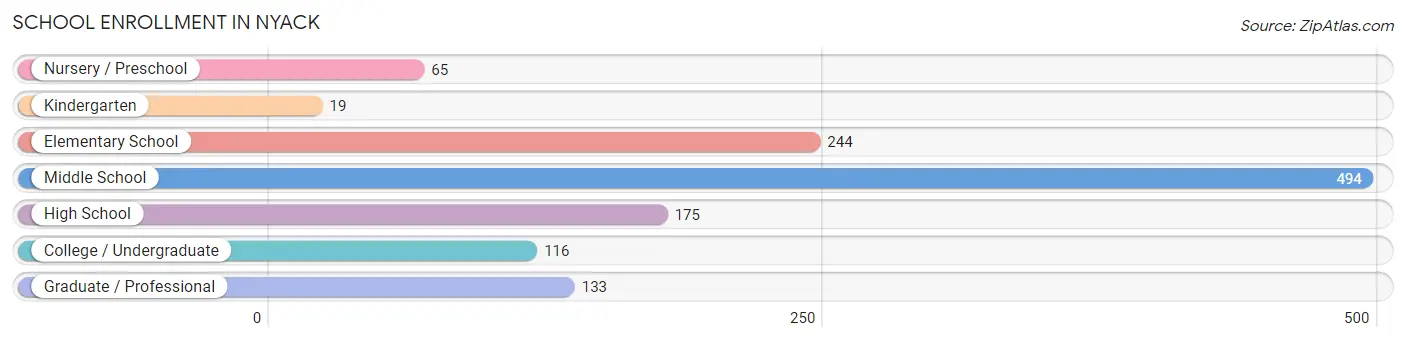
School Enrollment in Nyack
The most common levels of schooling among the 1,246 students in Nyack are middle school (494 | 39.7%), elementary school (244 | 19.6%), and high school (175 | 14.0%).
| School Level | # Students | % Students |
| Nursery / Preschool | 65 | 5.2% |
| Kindergarten | 19 | 1.5% |
| Elementary School | 244 | 19.6% |
| Middle School | 494 | 39.7% |
| High School | 175 | 14.0% |
| College / Undergraduate | 116 | 9.3% |
| Graduate / Professional | 133 | 10.7% |
| Total | 1,246 | 100.0% |
School Enrollment by Age by Funding Source in Nyack
Out of a total of 1,246 students who are enrolled in schools in Nyack, 224 (18.0%) attend a private institution, while the remaining 1,022 (82.0%) are enrolled in public schools. The age group of 3 to 4 year olds has the highest likelihood of being enrolled in private schools, with 58 (69.1% in the age bracket) enrolled. Conversely, the age group of 15 to 17 year olds has the lowest likelihood of being enrolled in a private school, with 92 (100.0% in the age bracket) attending a public institution.
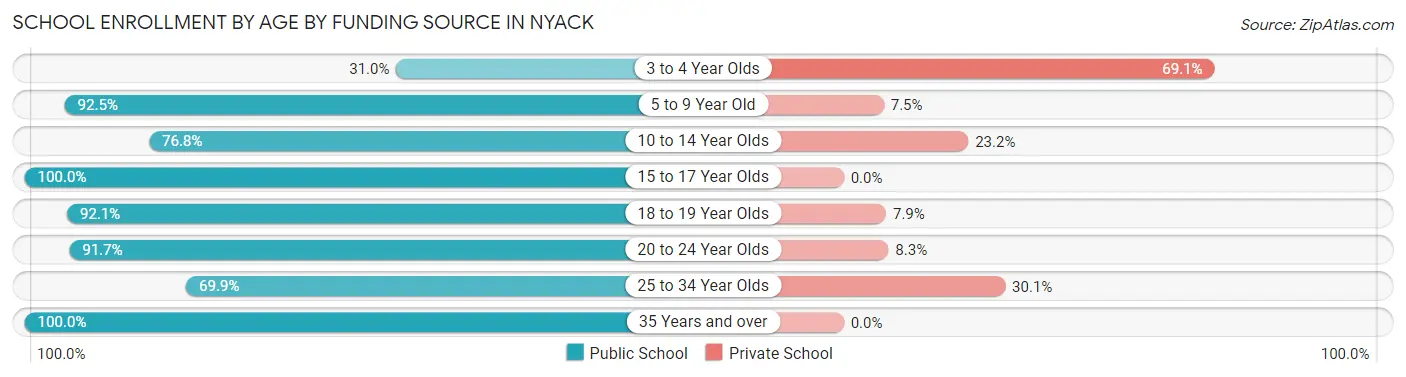
| Age Bracket | Public School | Private School |
| 3 to 4 Year Olds | 26 (30.9%) | 58 (69.1%) |
| 5 to 9 Year Old | 359 (92.5%) | 29 (7.5%) |
| 10 to 14 Year Olds | 278 (76.8%) | 84 (23.2%) |
| 15 to 17 Year Olds | 92 (100.0%) | 0 (0.0%) |
| 18 to 19 Year Olds | 70 (92.1%) | 6 (7.9%) |
| 20 to 24 Year Olds | 77 (91.7%) | 7 (8.3%) |
| 25 to 34 Year Olds | 93 (69.9%) | 40 (30.1%) |
| 35 Years and over | 27 (100.0%) | 0 (0.0%) |
| Total | 1,022 (82.0%) | 224 (18.0%) |
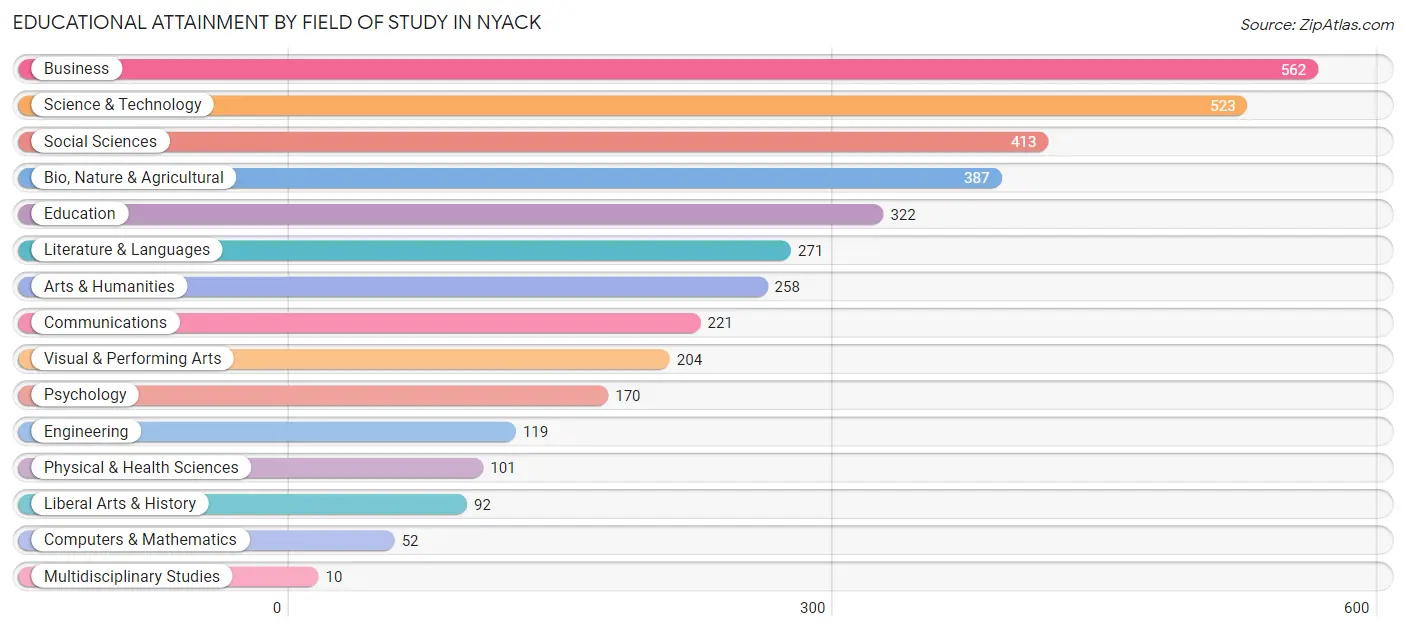
Educational Attainment by Field of Study in Nyack
Business (562 | 15.2%), science & technology (523 | 14.1%), social sciences (413 | 11.2%), bio, nature & agricultural (387 | 10.4%), and education (322 | 8.7%) are the most common fields of study among 3,705 individuals in Nyack who have obtained a bachelor's degree or higher.
| Field of Study | # Graduates | % Graduates |
| Computers & Mathematics | 52 | 1.4% |
| Bio, Nature & Agricultural | 387 | 10.4% |
| Physical & Health Sciences | 101 | 2.7% |
| Psychology | 170 | 4.6% |
| Social Sciences | 413 | 11.2% |
| Engineering | 119 | 3.2% |
| Multidisciplinary Studies | 10 | 0.3% |
| Science & Technology | 523 | 14.1% |
| Business | 562 | 15.2% |
| Education | 322 | 8.7% |
| Literature & Languages | 271 | 7.3% |
| Liberal Arts & History | 92 | 2.5% |
| Visual & Performing Arts | 204 | 5.5% |
| Communications | 221 | 6.0% |
| Arts & Humanities | 258 | 7.0% |
| Total | 3,705 | 100.0% |
Transportation & Commute in Nyack
Vehicle Availability by Sex in Nyack
The most prevalent vehicle ownership categories in Nyack are males with 2 vehicles (1,039, accounting for 57.2%) and females with 2 vehicles (1,011, making up 57.0%).
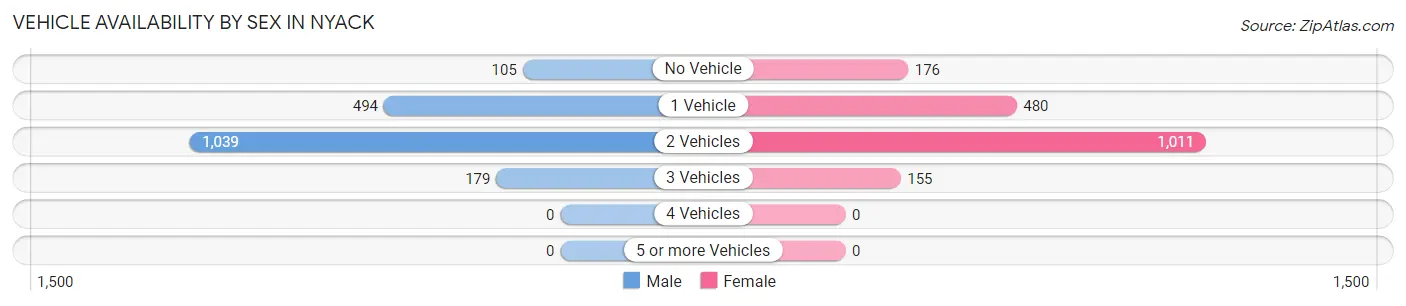
| Vehicles Available | Male | Female |
| No Vehicle | 105 (5.8%) | 176 (9.7%) |
| 1 Vehicle | 494 (27.2%) | 480 (26.3%) |
| 2 Vehicles | 1,039 (57.2%) | 1,011 (55.5%) |
| 3 Vehicles | 179 (9.9%) | 155 (8.5%) |
| 4 Vehicles | 0 (0.0%) | 0 (0.0%) |
| 5 or more Vehicles | 0 (0.0%) | 0 (0.0%) |
| Total | 1,817 (100.0%) | 1,822 (100.0%) |
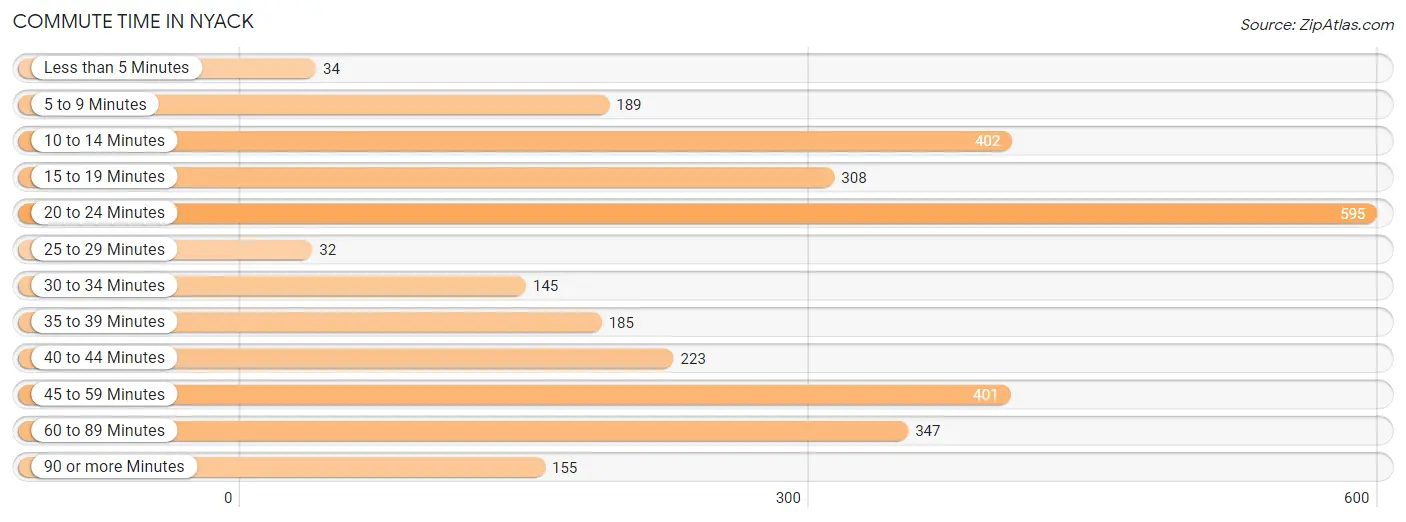
Commute Time in Nyack
The most frequently occuring commute durations in Nyack are 20 to 24 minutes (595 commuters, 19.7%), 10 to 14 minutes (402 commuters, 13.3%), and 45 to 59 minutes (401 commuters, 13.3%).
| Commute Time | # Commuters | % Commuters |
| Less than 5 Minutes | 34 | 1.1% |
| 5 to 9 Minutes | 189 | 6.3% |
| 10 to 14 Minutes | 402 | 13.3% |
| 15 to 19 Minutes | 308 | 10.2% |
| 20 to 24 Minutes | 595 | 19.7% |
| 25 to 29 Minutes | 32 | 1.1% |
| 30 to 34 Minutes | 145 | 4.8% |
| 35 to 39 Minutes | 185 | 6.1% |
| 40 to 44 Minutes | 223 | 7.4% |
| 45 to 59 Minutes | 401 | 13.3% |
| 60 to 89 Minutes | 347 | 11.5% |
| 90 or more Minutes | 155 | 5.1% |
Commute Time by Sex in Nyack
The most common commute times in Nyack are 20 to 24 minutes (249 commuters, 16.6%) for males and 20 to 24 minutes (346 commuters, 22.8%) for females.
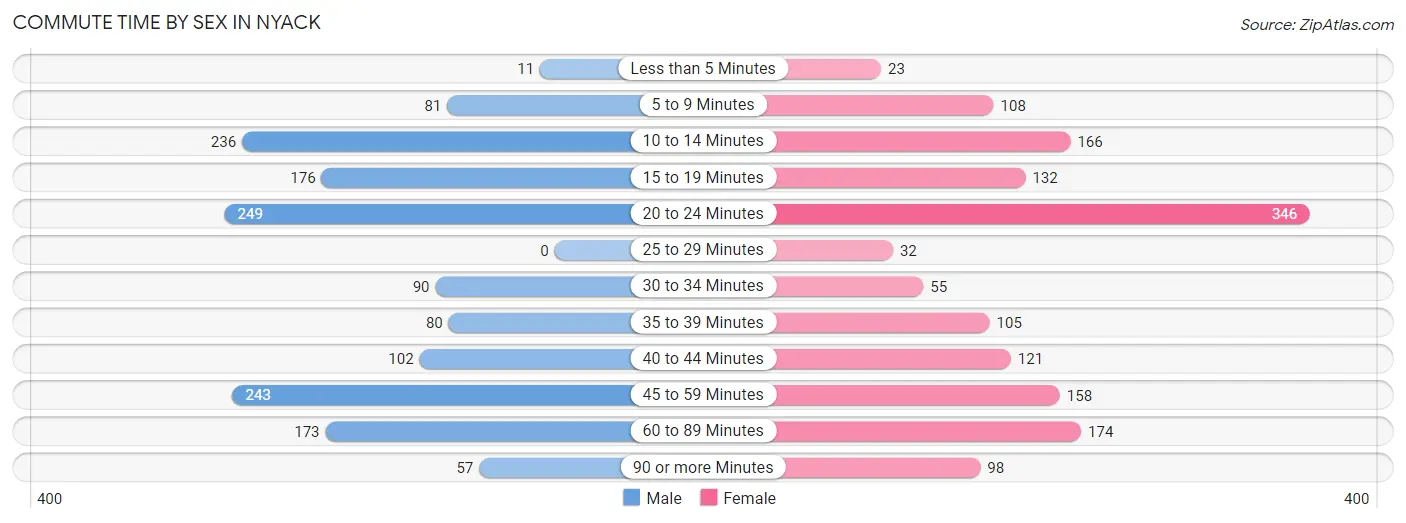
| Commute Time | Male | Female |
| Less than 5 Minutes | 11 (0.7%) | 23 (1.5%) |
| 5 to 9 Minutes | 81 (5.4%) | 108 (7.1%) |
| 10 to 14 Minutes | 236 (15.8%) | 166 (10.9%) |
| 15 to 19 Minutes | 176 (11.7%) | 132 (8.7%) |
| 20 to 24 Minutes | 249 (16.6%) | 346 (22.8%) |
| 25 to 29 Minutes | 0 (0.0%) | 32 (2.1%) |
| 30 to 34 Minutes | 90 (6.0%) | 55 (3.6%) |
| 35 to 39 Minutes | 80 (5.3%) | 105 (6.9%) |
| 40 to 44 Minutes | 102 (6.8%) | 121 (8.0%) |
| 45 to 59 Minutes | 243 (16.2%) | 158 (10.4%) |
| 60 to 89 Minutes | 173 (11.6%) | 174 (11.5%) |
| 90 or more Minutes | 57 (3.8%) | 98 (6.5%) |
Time of Departure to Work by Sex in Nyack
The most frequent times of departure to work in Nyack are 7:30 AM to 7:59 AM (256, 17.1%) for males and 8:00 AM to 8:29 AM (427, 28.1%) for females.
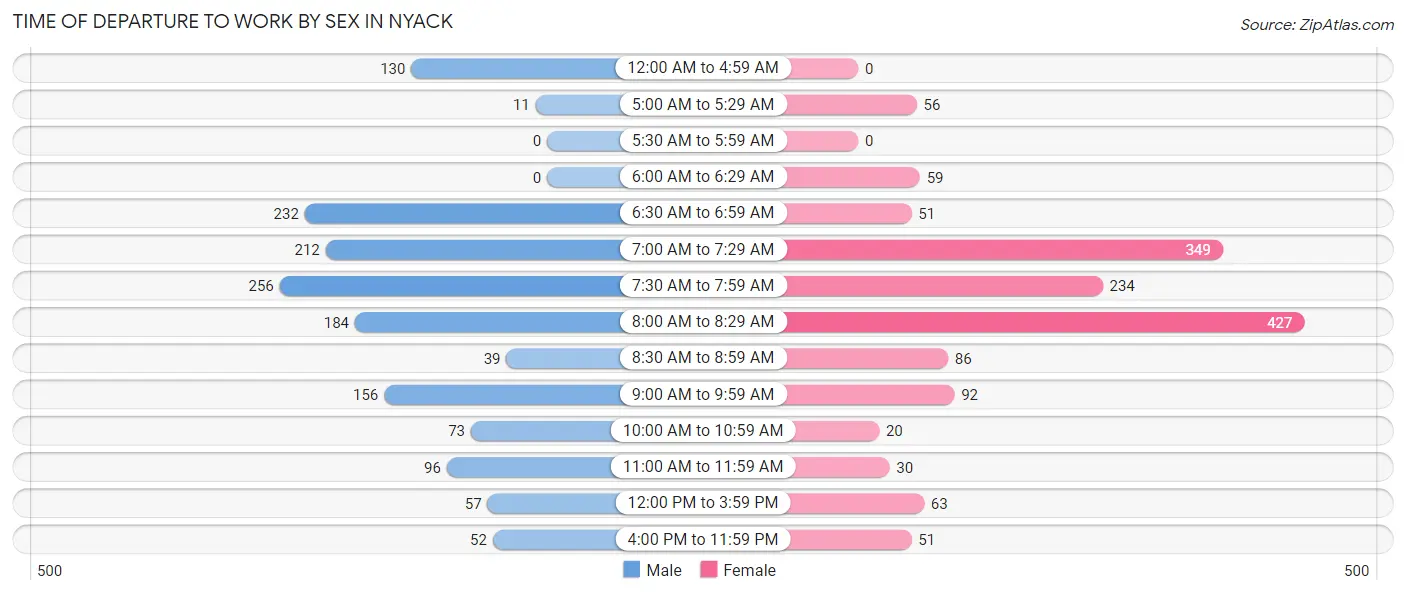
| Time of Departure | Male | Female |
| 12:00 AM to 4:59 AM | 130 (8.7%) | 0 (0.0%) |
| 5:00 AM to 5:29 AM | 11 (0.7%) | 56 (3.7%) |
| 5:30 AM to 5:59 AM | 0 (0.0%) | 0 (0.0%) |
| 6:00 AM to 6:29 AM | 0 (0.0%) | 59 (3.9%) |
| 6:30 AM to 6:59 AM | 232 (15.5%) | 51 (3.4%) |
| 7:00 AM to 7:29 AM | 212 (14.1%) | 349 (23.0%) |
| 7:30 AM to 7:59 AM | 256 (17.1%) | 234 (15.4%) |
| 8:00 AM to 8:29 AM | 184 (12.3%) | 427 (28.1%) |
| 8:30 AM to 8:59 AM | 39 (2.6%) | 86 (5.7%) |
| 9:00 AM to 9:59 AM | 156 (10.4%) | 92 (6.1%) |
| 10:00 AM to 10:59 AM | 73 (4.9%) | 20 (1.3%) |
| 11:00 AM to 11:59 AM | 96 (6.4%) | 30 (2.0%) |
| 12:00 PM to 3:59 PM | 57 (3.8%) | 63 (4.2%) |
| 4:00 PM to 11:59 PM | 52 (3.5%) | 51 (3.4%) |
| Total | 1,498 (100.0%) | 1,518 (100.0%) |
Housing Occupancy in Nyack
Occupancy by Ownership in Nyack
Of the total 3,257 dwellings in Nyack, owner-occupied units account for 1,030 (31.6%), while renter-occupied units make up 2,227 (68.4%).
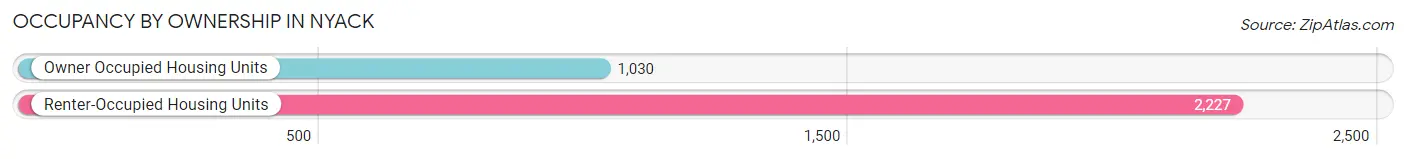
| Occupancy | # Housing Units | % Housing Units |
| Owner Occupied Housing Units | 1,030 | 31.6% |
| Renter-Occupied Housing Units | 2,227 | 68.4% |
| Total Occupied Housing Units | 3,257 | 100.0% |
Occupancy by Household Size in Nyack
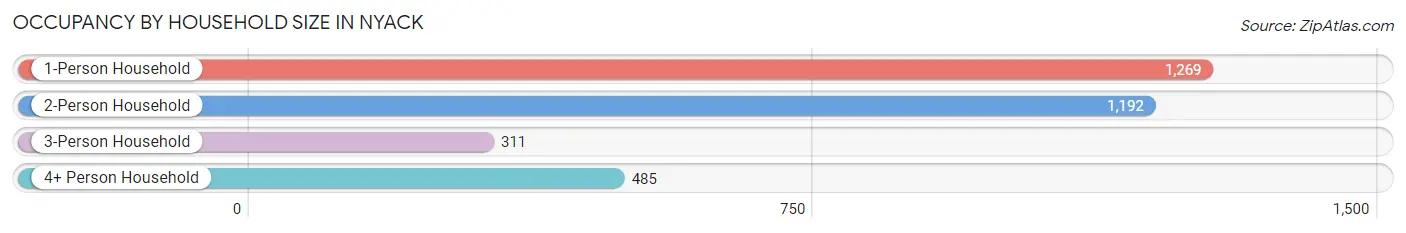
| Household Size | # Housing Units | % Housing Units |
| 1-Person Household | 1,269 | 39.0% |
| 2-Person Household | 1,192 | 36.6% |
| 3-Person Household | 311 | 9.6% |
| 4+ Person Household | 485 | 14.9% |
| Total Housing Units | 3,257 | 100.0% |
Occupancy by Ownership by Household Size in Nyack
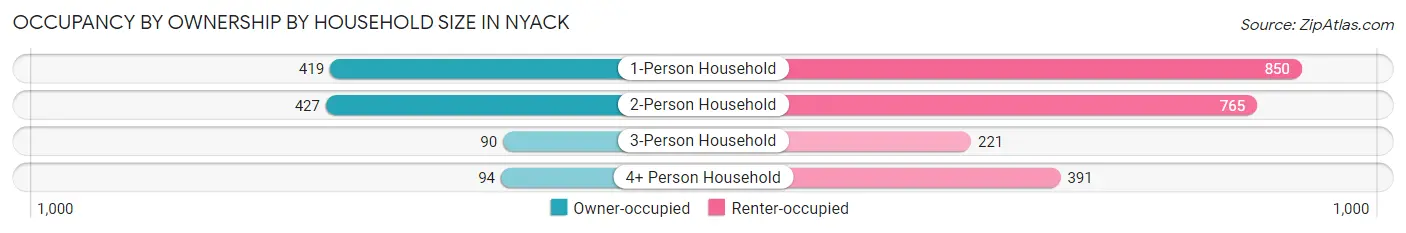
| Household Size | Owner-occupied | Renter-occupied |
| 1-Person Household | 419 (33.0%) | 850 (67.0%) |
| 2-Person Household | 427 (35.8%) | 765 (64.2%) |
| 3-Person Household | 90 (28.9%) | 221 (71.1%) |
| 4+ Person Household | 94 (19.4%) | 391 (80.6%) |
| Total Housing Units | 1,030 (31.6%) | 2,227 (68.4%) |
Occupancy by Educational Attainment in Nyack
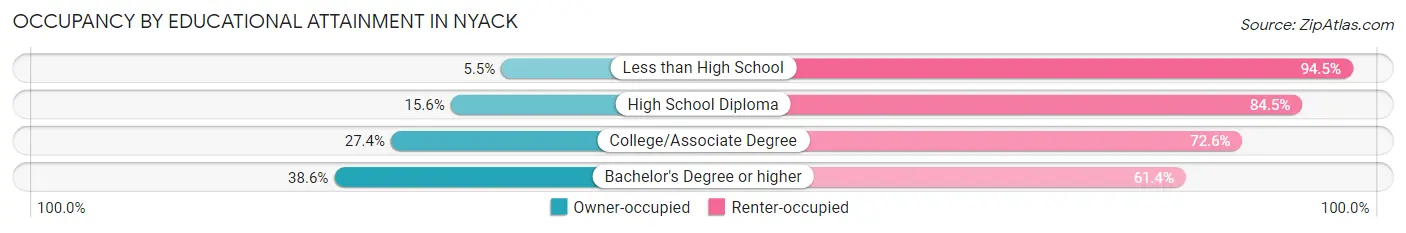
| Household Size | Owner-occupied | Renter-occupied |
| Less than High School | 10 (5.5%) | 171 (94.5%) |
| High School Diploma | 65 (15.5%) | 353 (84.5%) |
| College/Associate Degree | 175 (27.4%) | 464 (72.6%) |
| Bachelor's Degree or higher | 780 (38.6%) | 1,239 (61.4%) |
Occupancy by Age of Householder in Nyack
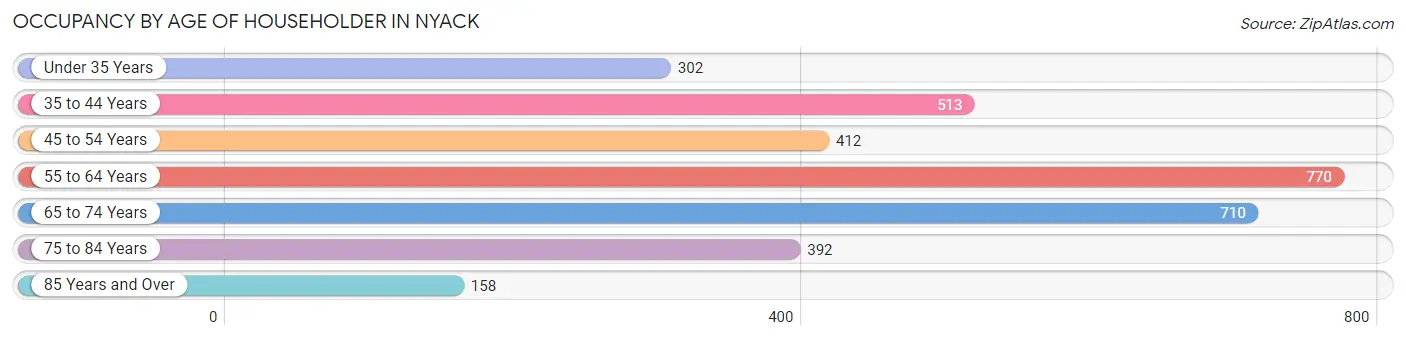
| Age Bracket | # Households | % Households |
| Under 35 Years | 302 | 9.3% |
| 35 to 44 Years | 513 | 15.8% |
| 45 to 54 Years | 412 | 12.7% |
| 55 to 64 Years | 770 | 23.6% |
| 65 to 74 Years | 710 | 21.8% |
| 75 to 84 Years | 392 | 12.0% |
| 85 Years and Over | 158 | 4.9% |
| Total | 3,257 | 100.0% |
Housing Finances in Nyack
Median Income by Occupancy in Nyack
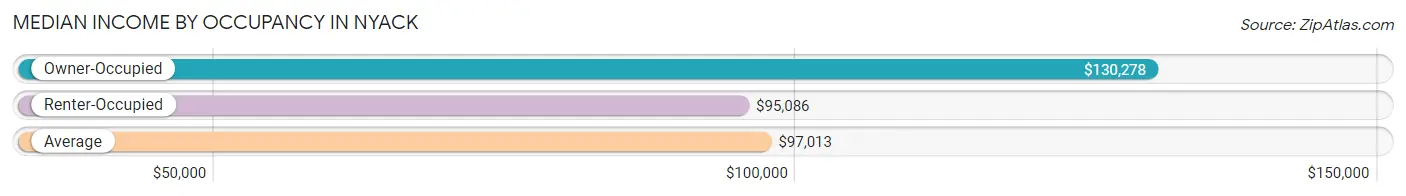
| Occupancy Type | # Households | Median Income |
| Owner-Occupied | 1,030 (31.6%) | $130,278 |
| Renter-Occupied | 2,227 (68.4%) | $95,086 |
| Average | 3,257 (100.0%) | $97,013 |
Occupancy by Householder Income Bracket in Nyack
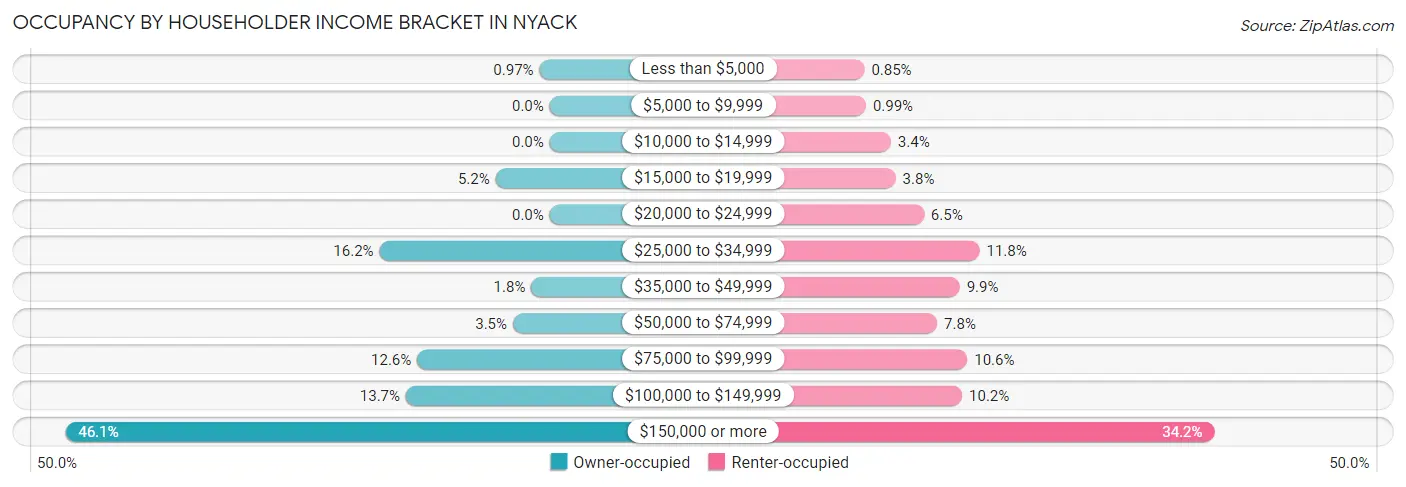
| Income Bracket | Owner-occupied | Renter-occupied |
| Less than $5,000 | 10 (1.0%) | 19 (0.9%) |
| $5,000 to $9,999 | 0 (0.0%) | 22 (1.0%) |
| $10,000 to $14,999 | 0 (0.0%) | 75 (3.4%) |
| $15,000 to $19,999 | 53 (5.1%) | 85 (3.8%) |
| $20,000 to $24,999 | 0 (0.0%) | 145 (6.5%) |
| $25,000 to $34,999 | 167 (16.2%) | 263 (11.8%) |
| $35,000 to $49,999 | 18 (1.8%) | 221 (9.9%) |
| $50,000 to $74,999 | 36 (3.5%) | 173 (7.8%) |
| $75,000 to $99,999 | 130 (12.6%) | 237 (10.6%) |
| $100,000 to $149,999 | 141 (13.7%) | 226 (10.2%) |
| $150,000 or more | 475 (46.1%) | 761 (34.2%) |
| Total | 1,030 (100.0%) | 2,227 (100.0%) |
Monthly Housing Cost Tiers in Nyack
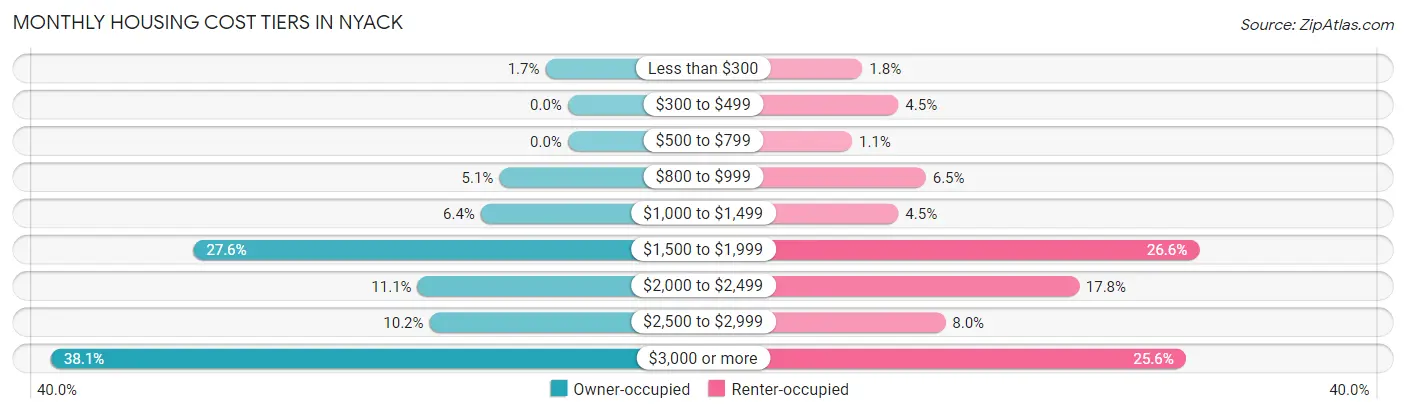
| Monthly Cost | Owner-occupied | Renter-occupied |
| Less than $300 | 17 (1.7%) | 41 (1.8%) |
| $300 to $499 | 0 (0.0%) | 100 (4.5%) |
| $500 to $799 | 0 (0.0%) | 24 (1.1%) |
| $800 to $999 | 52 (5.1%) | 145 (6.5%) |
| $1,000 to $1,499 | 66 (6.4%) | 100 (4.5%) |
| $1,500 to $1,999 | 284 (27.6%) | 593 (26.6%) |
| $2,000 to $2,499 | 114 (11.1%) | 396 (17.8%) |
| $2,500 to $2,999 | 105 (10.2%) | 177 (8.0%) |
| $3,000 or more | 392 (38.1%) | 571 (25.6%) |
| Total | 1,030 (100.0%) | 2,227 (100.0%) |
Physical Housing Characteristics in Nyack
Housing Structures in Nyack
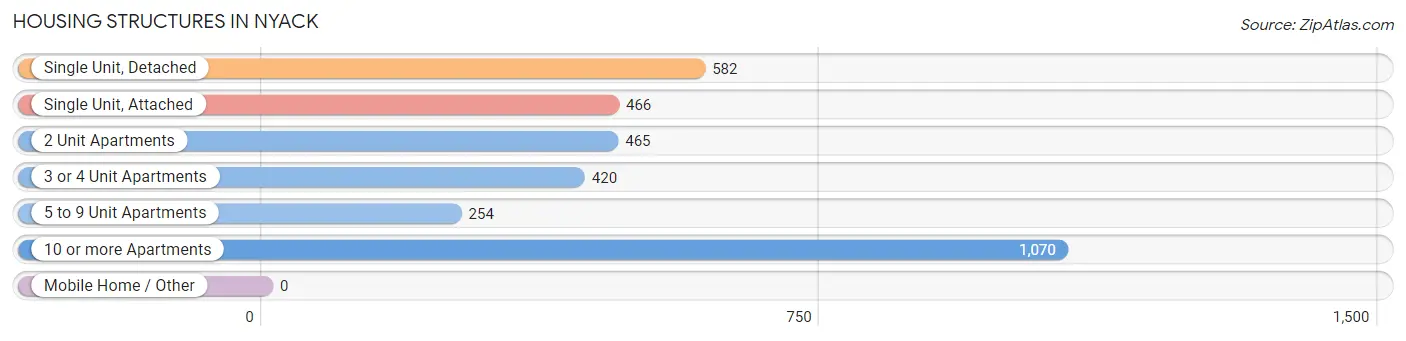
| Structure Type | # Housing Units | % Housing Units |
| Single Unit, Detached | 582 | 17.9% |
| Single Unit, Attached | 466 | 14.3% |
| 2 Unit Apartments | 465 | 14.3% |
| 3 or 4 Unit Apartments | 420 | 12.9% |
| 5 to 9 Unit Apartments | 254 | 7.8% |
| 10 or more Apartments | 1,070 | 32.9% |
| Mobile Home / Other | 0 | 0.0% |
| Total | 3,257 | 100.0% |
Housing Structures by Occupancy in Nyack
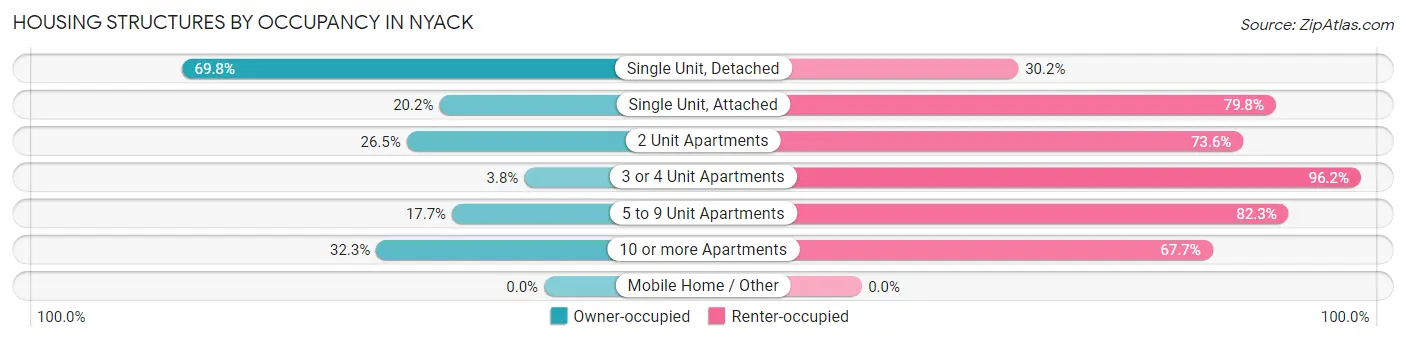
| Structure Type | Owner-occupied | Renter-occupied |
| Single Unit, Detached | 406 (69.8%) | 176 (30.2%) |
| Single Unit, Attached | 94 (20.2%) | 372 (79.8%) |
| 2 Unit Apartments | 123 (26.5%) | 342 (73.6%) |
| 3 or 4 Unit Apartments | 16 (3.8%) | 404 (96.2%) |
| 5 to 9 Unit Apartments | 45 (17.7%) | 209 (82.3%) |
| 10 or more Apartments | 346 (32.3%) | 724 (67.7%) |
| Mobile Home / Other | 0 (0.0%) | 0 (0.0%) |
| Total | 1,030 (31.6%) | 2,227 (68.4%) |
Housing Structures by Number of Rooms in Nyack
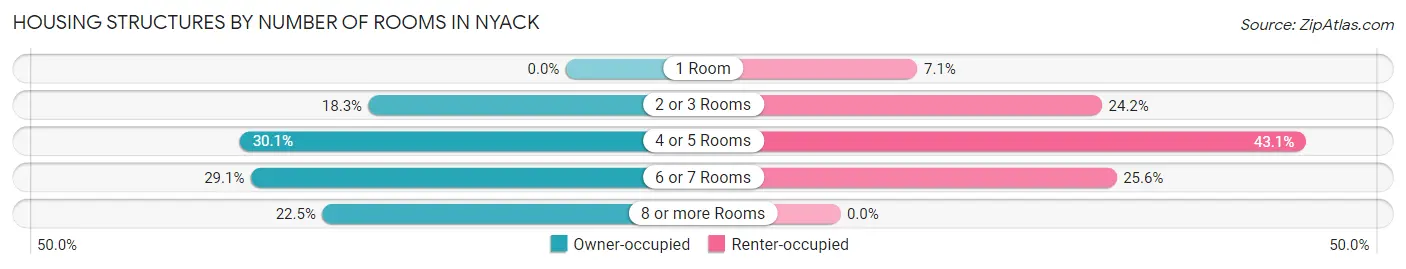
| Number of Rooms | Owner-occupied | Renter-occupied |
| 1 Room | 0 (0.0%) | 159 (7.1%) |
| 2 or 3 Rooms | 188 (18.2%) | 539 (24.2%) |
| 4 or 5 Rooms | 310 (30.1%) | 960 (43.1%) |
| 6 or 7 Rooms | 300 (29.1%) | 569 (25.6%) |
| 8 or more Rooms | 232 (22.5%) | 0 (0.0%) |
| Total | 1,030 (100.0%) | 2,227 (100.0%) |
Housing Structure by Heating Type in Nyack
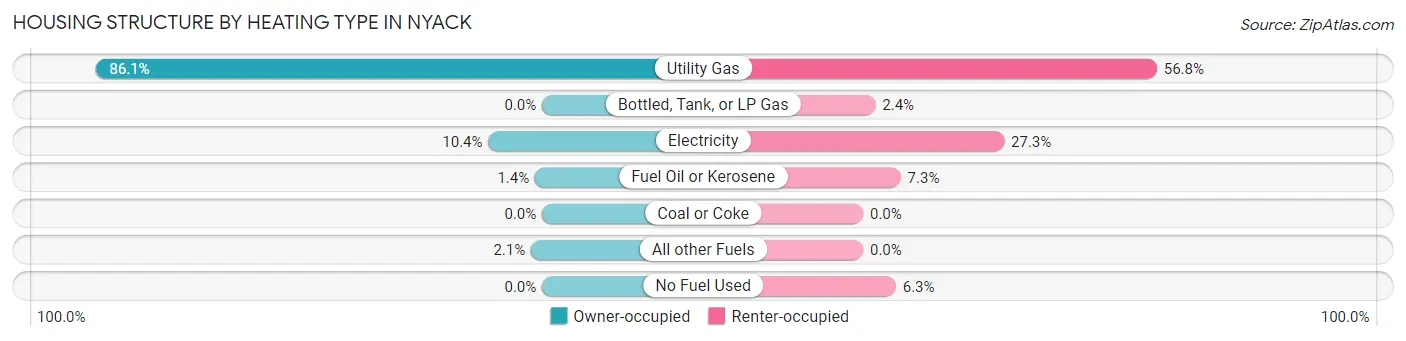
| Heating Type | Owner-occupied | Renter-occupied |
| Utility Gas | 887 (86.1%) | 1,264 (56.8%) |
| Bottled, Tank, or LP Gas | 0 (0.0%) | 53 (2.4%) |
| Electricity | 107 (10.4%) | 607 (27.3%) |
| Fuel Oil or Kerosene | 14 (1.4%) | 162 (7.3%) |
| Coal or Coke | 0 (0.0%) | 0 (0.0%) |
| All other Fuels | 22 (2.1%) | 0 (0.0%) |
| No Fuel Used | 0 (0.0%) | 141 (6.3%) |
| Total | 1,030 (100.0%) | 2,227 (100.0%) |
Household Vehicle Usage in Nyack
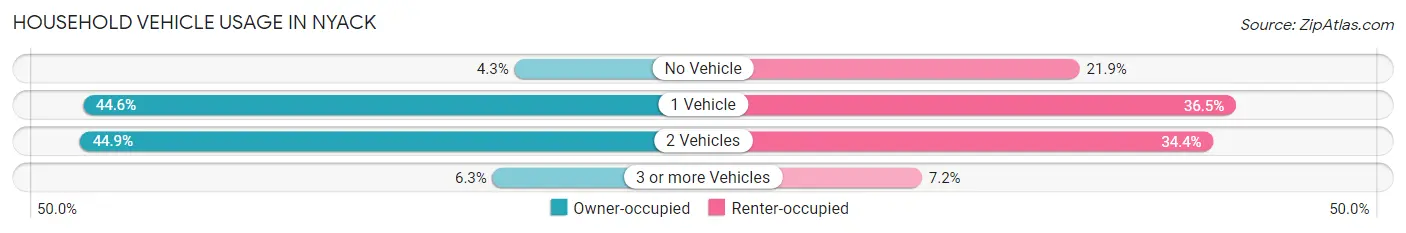
| Vehicles per Household | Owner-occupied | Renter-occupied |
| No Vehicle | 44 (4.3%) | 488 (21.9%) |
| 1 Vehicle | 459 (44.6%) | 813 (36.5%) |
| 2 Vehicles | 462 (44.9%) | 766 (34.4%) |
| 3 or more Vehicles | 65 (6.3%) | 160 (7.2%) |
| Total | 1,030 (100.0%) | 2,227 (100.0%) |
Real Estate & Mortgages in Nyack
Real Estate and Mortgage Overview in Nyack
| Characteristic | Without Mortgage | With Mortgage |
| Housing Units | 491 | 539 |
| Median Property Value | $623,300 | $496,800 |
| Median Household Income | - | - |
| Monthly Housing Costs | $1,501 | $370 |
| Real Estate Taxes | $10,001 | $0 |
Property Value by Mortgage Status in Nyack
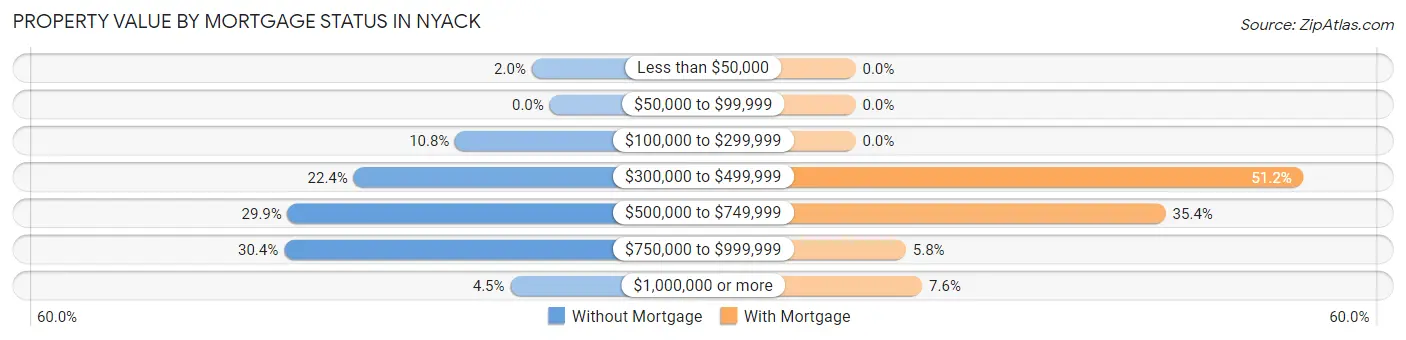
| Property Value | Without Mortgage | With Mortgage |
| Less than $50,000 | 10 (2.0%) | 0 (0.0%) |
| $50,000 to $99,999 | 0 (0.0%) | 0 (0.0%) |
| $100,000 to $299,999 | 53 (10.8%) | 0 (0.0%) |
| $300,000 to $499,999 | 110 (22.4%) | 276 (51.2%) |
| $500,000 to $749,999 | 147 (29.9%) | 191 (35.4%) |
| $750,000 to $999,999 | 149 (30.3%) | 31 (5.8%) |
| $1,000,000 or more | 22 (4.5%) | 41 (7.6%) |
| Total | 491 (100.0%) | 539 (100.0%) |
Household Income by Mortgage Status in Nyack
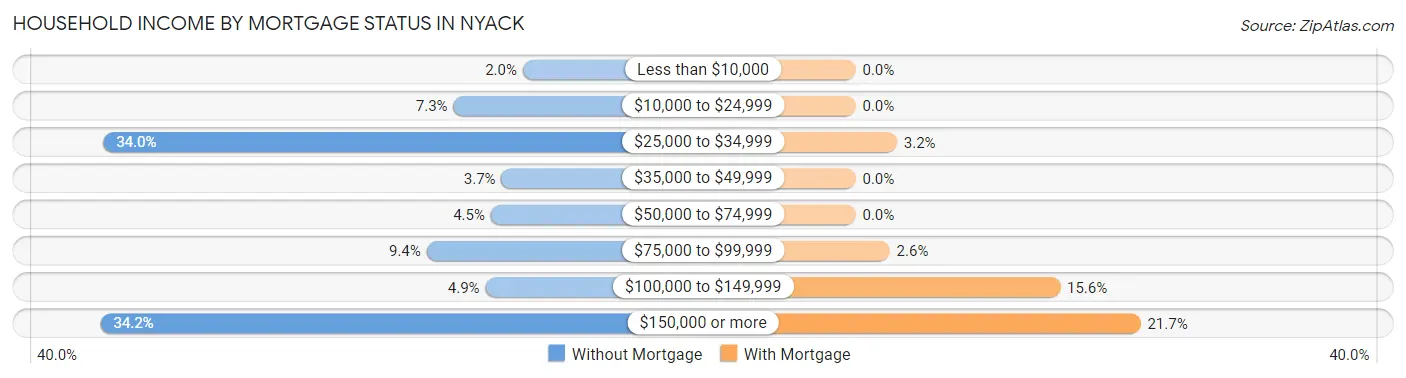
| Household Income | Without Mortgage | With Mortgage |
| Less than $10,000 | 10 (2.0%) | 0 (0.0%) |
| $10,000 to $24,999 | 36 (7.3%) | 0 (0.0%) |
| $25,000 to $34,999 | 167 (34.0%) | 17 (3.2%) |
| $35,000 to $49,999 | 18 (3.7%) | 0 (0.0%) |
| $50,000 to $74,999 | 22 (4.5%) | 0 (0.0%) |
| $75,000 to $99,999 | 46 (9.4%) | 14 (2.6%) |
| $100,000 to $149,999 | 24 (4.9%) | 84 (15.6%) |
| $150,000 or more | 168 (34.2%) | 117 (21.7%) |
| Total | 491 (100.0%) | 539 (100.0%) |
Property Value to Household Income Ratio in Nyack
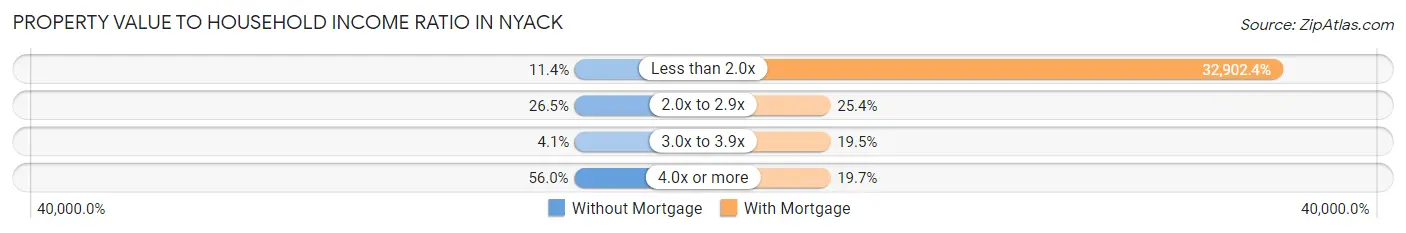
| Value-to-Income Ratio | Without Mortgage | With Mortgage |
| Less than 2.0x | 56 (11.4%) | 177,344 (32,902.4%) |
| 2.0x to 2.9x | 130 (26.5%) | 137 (25.4%) |
| 3.0x to 3.9x | 20 (4.1%) | 105 (19.5%) |
| 4.0x or more | 275 (56.0%) | 106 (19.7%) |
| Total | 491 (100.0%) | 539 (100.0%) |
Real Estate Taxes by Mortgage Status in Nyack
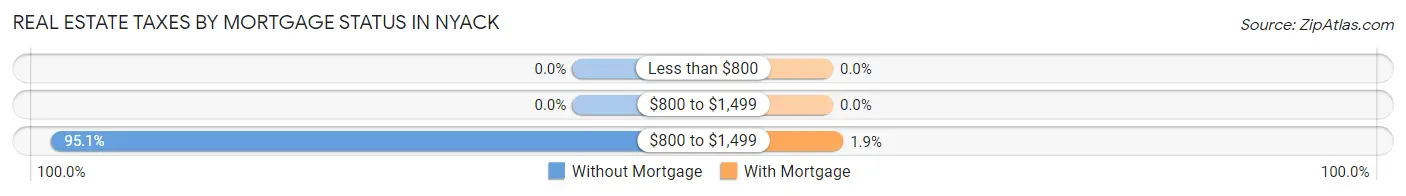
| Property Taxes | Without Mortgage | With Mortgage |
| Less than $800 | 0 (0.0%) | 0 (0.0%) |
| $800 to $1,499 | 0 (0.0%) | 0 (0.0%) |
| $800 to $1,499 | 467 (95.1%) | 10 (1.9%) |
| Total | 491 (100.0%) | 539 (100.0%) |
Health & Disability in Nyack
Health Insurance Coverage by Age in Nyack
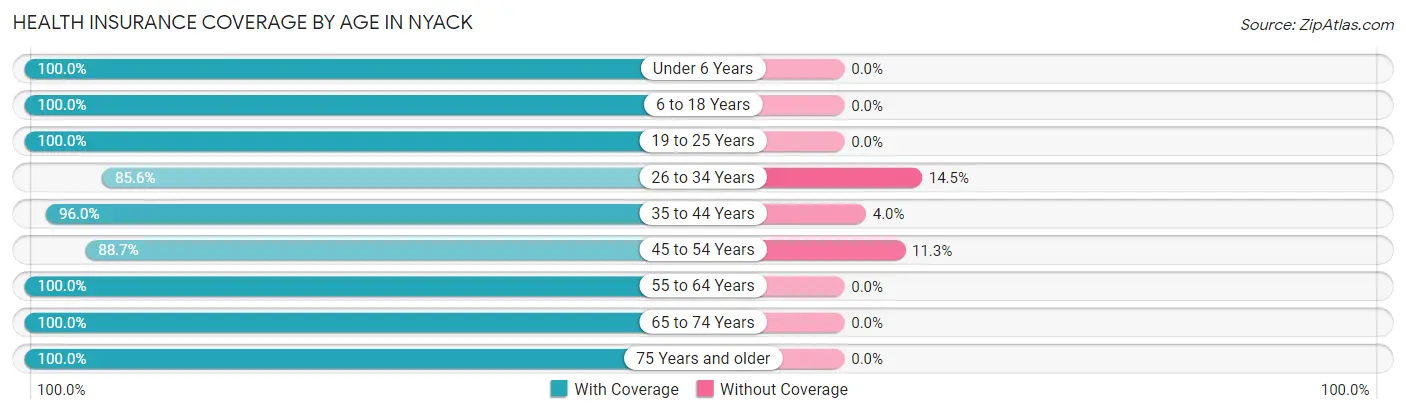
| Age Bracket | With Coverage | Without Coverage |
| Under 6 Years | 393 (100.0%) | 0 (0.0%) |
| 6 to 18 Years | 927 (100.0%) | 0 (0.0%) |
| 19 to 25 Years | 278 (100.0%) | 0 (0.0%) |
| 26 to 34 Years | 758 (85.6%) | 128 (14.4%) |
| 35 to 44 Years | 1,054 (96.0%) | 44 (4.0%) |
| 45 to 54 Years | 626 (88.7%) | 80 (11.3%) |
| 55 to 64 Years | 1,215 (100.0%) | 0 (0.0%) |
| 65 to 74 Years | 851 (100.0%) | 0 (0.0%) |
| 75 Years and older | 684 (100.0%) | 0 (0.0%) |
| Total | 6,786 (96.4%) | 252 (3.6%) |
Health Insurance Coverage by Citizenship Status in Nyack
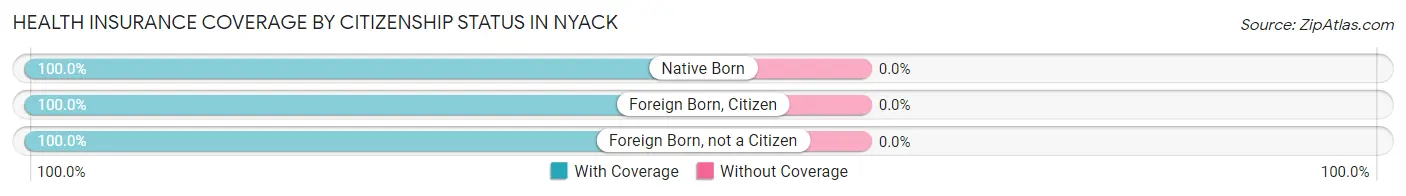
| Citizenship Status | With Coverage | Without Coverage |
| Native Born | 393 (100.0%) | 0 (0.0%) |
| Foreign Born, Citizen | 927 (100.0%) | 0 (0.0%) |
| Foreign Born, not a Citizen | 278 (100.0%) | 0 (0.0%) |
Health Insurance Coverage by Household Income in Nyack
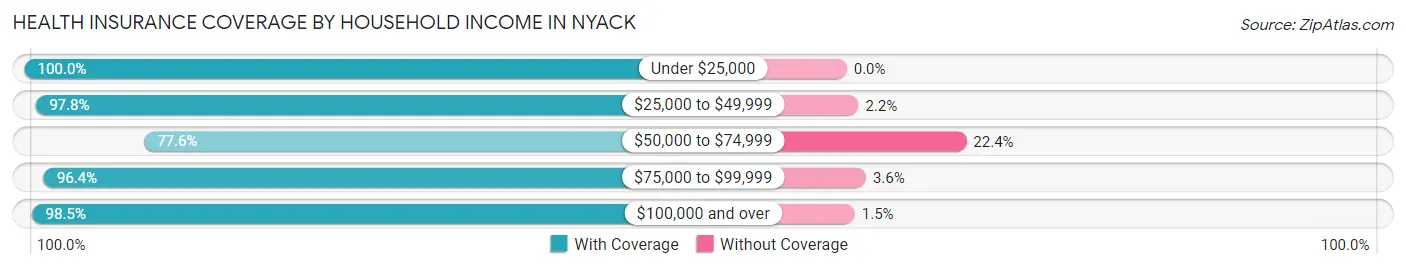
| Household Income | With Coverage | Without Coverage |
| Under $25,000 | 494 (100.0%) | 0 (0.0%) |
| $25,000 to $49,999 | 1,248 (97.8%) | 28 (2.2%) |
| $50,000 to $74,999 | 471 (77.6%) | 136 (22.4%) |
| $75,000 to $99,999 | 858 (96.4%) | 32 (3.6%) |
| $100,000 and over | 3,660 (98.5%) | 56 (1.5%) |
Public vs Private Health Insurance Coverage by Age in Nyack
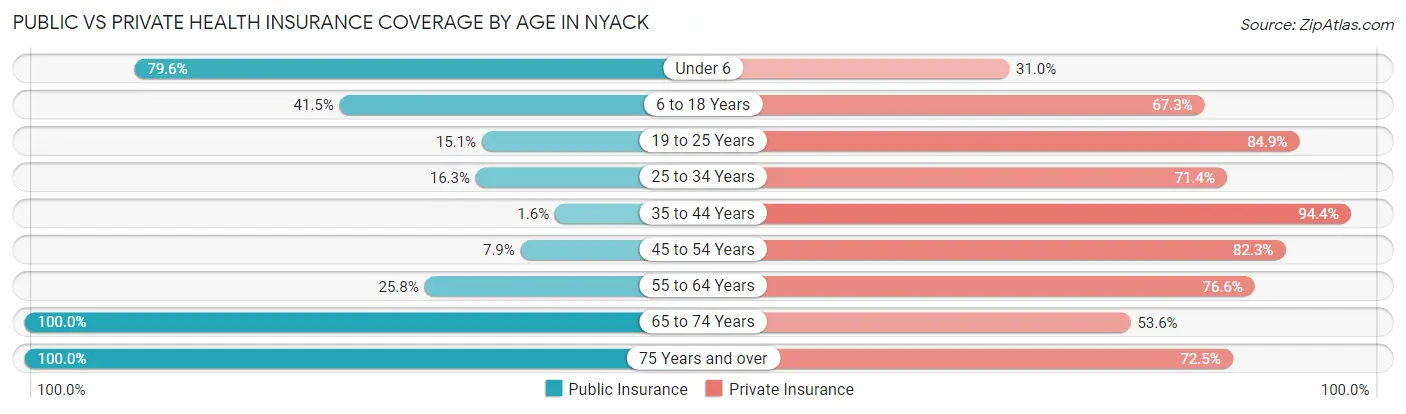
| Age Bracket | Public Insurance | Private Insurance |
| Under 6 | 313 (79.6%) | 122 (31.0%) |
| 6 to 18 Years | 385 (41.5%) | 624 (67.3%) |
| 19 to 25 Years | 42 (15.1%) | 236 (84.9%) |
| 25 to 34 Years | 144 (16.3%) | 633 (71.4%) |
| 35 to 44 Years | 17 (1.5%) | 1,037 (94.4%) |
| 45 to 54 Years | 56 (7.9%) | 581 (82.3%) |
| 55 to 64 Years | 313 (25.8%) | 931 (76.6%) |
| 65 to 74 Years | 851 (100.0%) | 456 (53.6%) |
| 75 Years and over | 684 (100.0%) | 496 (72.5%) |
| Total | 2,805 (39.9%) | 5,116 (72.7%) |
Disability Status by Sex by Age in Nyack
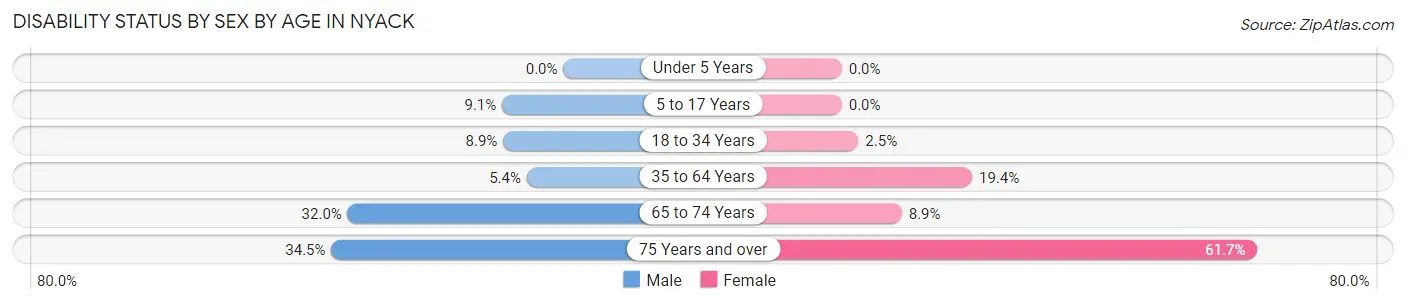
| Age Bracket | Male | Female |
| Under 5 Years | 0 (0.0%) | 0 (0.0%) |
| 5 to 17 Years | 38 (9.1%) | 0 (0.0%) |
| 18 to 34 Years | 61 (8.9%) | 14 (2.5%) |
| 35 to 64 Years | 73 (5.4%) | 324 (19.4%) |
| 65 to 74 Years | 82 (32.0%) | 53 (8.9%) |
| 75 Years and over | 134 (34.4%) | 182 (61.7%) |
Disability Class by Sex by Age in Nyack
Disability Class: Hearing Difficulty
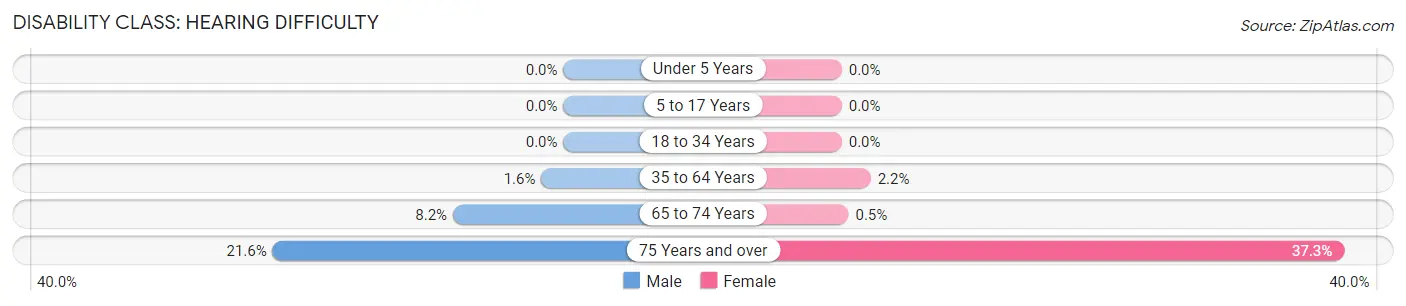
| Age Bracket | Male | Female |
| Under 5 Years | 0 (0.0%) | 0 (0.0%) |
| 5 to 17 Years | 0 (0.0%) | 0 (0.0%) |
| 18 to 34 Years | 0 (0.0%) | 0 (0.0%) |
| 35 to 64 Years | 22 (1.6%) | 36 (2.1%) |
| 65 to 74 Years | 21 (8.2%) | 3 (0.5%) |
| 75 Years and over | 84 (21.6%) | 110 (37.3%) |
Disability Class: Vision Difficulty
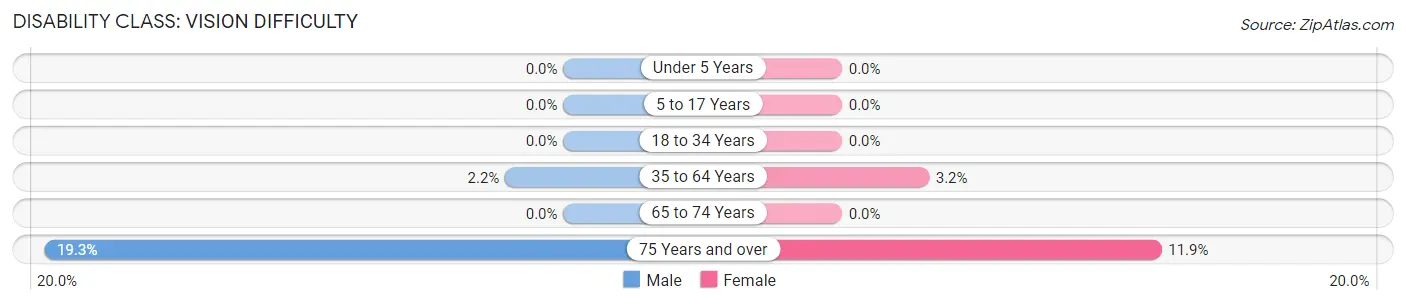
| Age Bracket | Male | Female |
| Under 5 Years | 0 (0.0%) | 0 (0.0%) |
| 5 to 17 Years | 0 (0.0%) | 0 (0.0%) |
| 18 to 34 Years | 0 (0.0%) | 0 (0.0%) |
| 35 to 64 Years | 29 (2.2%) | 54 (3.2%) |
| 65 to 74 Years | 0 (0.0%) | 0 (0.0%) |
| 75 Years and over | 75 (19.3%) | 35 (11.9%) |
Disability Class: Cognitive Difficulty
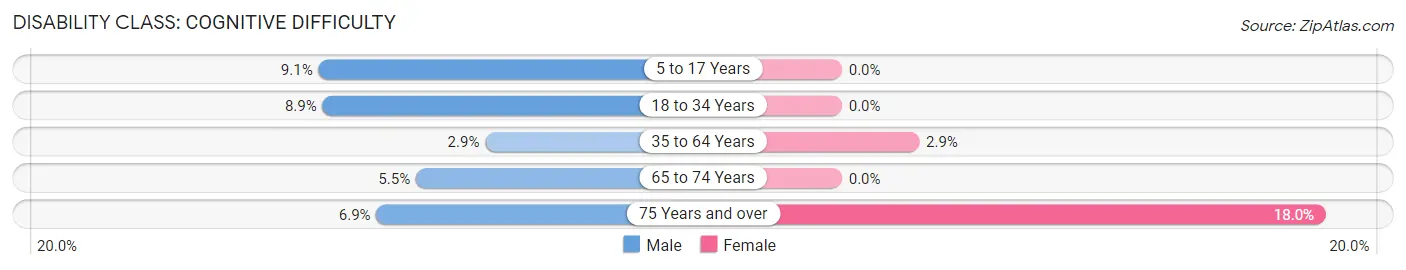
| Age Bracket | Male | Female |
| 5 to 17 Years | 38 (9.1%) | 0 (0.0%) |
| 18 to 34 Years | 61 (8.9%) | 0 (0.0%) |
| 35 to 64 Years | 39 (2.9%) | 48 (2.9%) |
| 65 to 74 Years | 14 (5.5%) | 0 (0.0%) |
| 75 Years and over | 27 (6.9%) | 53 (18.0%) |
Disability Class: Ambulatory Difficulty
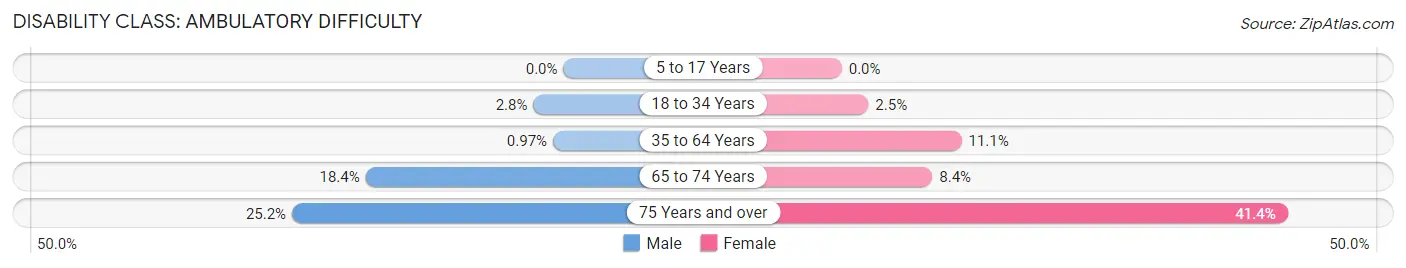
| Age Bracket | Male | Female |
| 5 to 17 Years | 0 (0.0%) | 0 (0.0%) |
| 18 to 34 Years | 19 (2.8%) | 14 (2.5%) |
| 35 to 64 Years | 13 (1.0%) | 186 (11.1%) |
| 65 to 74 Years | 47 (18.4%) | 50 (8.4%) |
| 75 Years and over | 98 (25.2%) | 122 (41.4%) |
Disability Class: Self-Care Difficulty
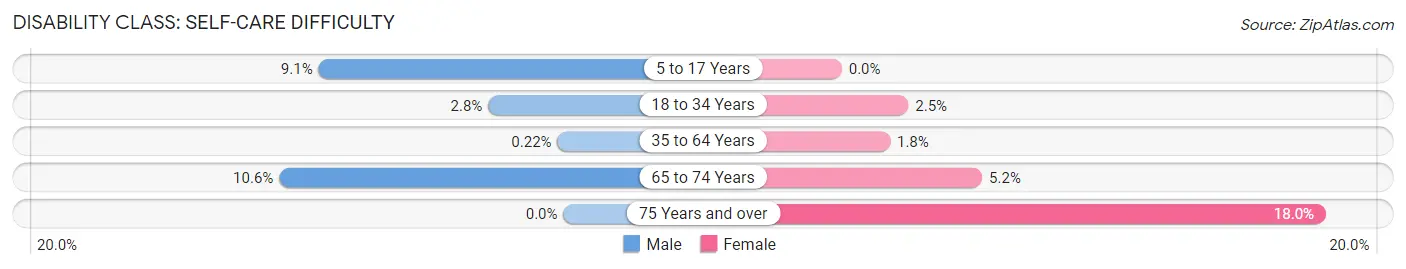
| Age Bracket | Male | Female |
| 5 to 17 Years | 38 (9.1%) | 0 (0.0%) |
| 18 to 34 Years | 19 (2.8%) | 14 (2.5%) |
| 35 to 64 Years | 3 (0.2%) | 30 (1.8%) |
| 65 to 74 Years | 27 (10.5%) | 31 (5.2%) |
| 75 Years and over | 0 (0.0%) | 53 (18.0%) |
Technology Access in Nyack
Computing Device Access in Nyack
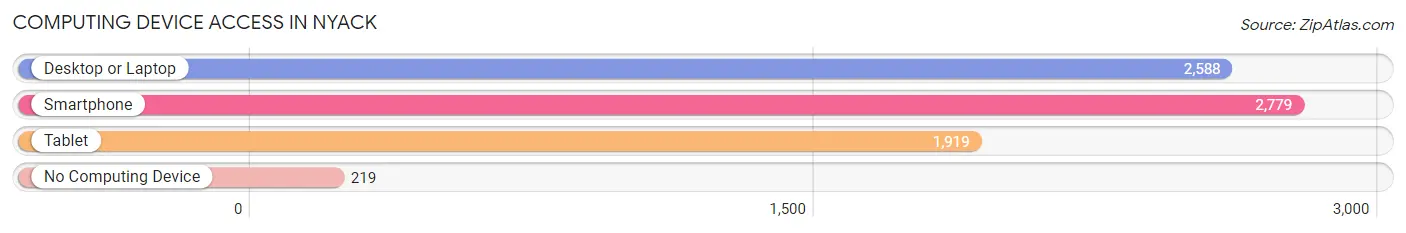
| Device Type | # Households | % Households |
| Desktop or Laptop | 2,588 | 79.5% |
| Smartphone | 2,779 | 85.3% |
| Tablet | 1,919 | 58.9% |
| No Computing Device | 219 | 6.7% |
| Total | 3,257 | 100.0% |
Internet Access in Nyack
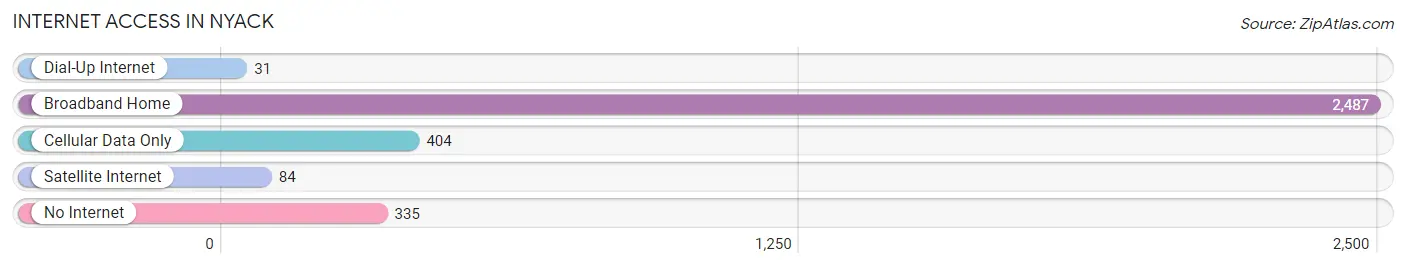
| Internet Type | # Households | % Households |
| Dial-Up Internet | 31 | 0.9% |
| Broadband Home | 2,487 | 76.4% |
| Cellular Data Only | 404 | 12.4% |
| Satellite Internet | 84 | 2.6% |
| No Internet | 335 | 10.3% |
| Total | 3,257 | 100.0% |
Nyack Summary
Nyack is a village located in the town of Orangetown in Rockland County, New York. It is situated on the west bank of the Hudson River, approximately 19 miles north of Manhattan. The village has a population of 6,765 as of the 2010 census.
History
The area that is now Nyack was originally inhabited by the Lenape Native Americans. The first Europeans to settle in the area were the Dutch, who arrived in 1675. The village was originally known as Nyaack, which is derived from the Lenape word for “the place of the wild geese.”
In the late 18th century, the village was a popular destination for wealthy New Yorkers who wanted to escape the hustle and bustle of the city. The village was incorporated in 1872 and was home to a variety of industries, including shipbuilding, brickmaking, and ice harvesting.
In the late 19th century, Nyack became a popular summer resort destination for wealthy New Yorkers. The village was home to several grand hotels, including the Tappan Zee Hotel, which was built in 1885 and was one of the largest hotels in the country at the time.
Geography
Nyack is located in the town of Orangetown in Rockland County, New York. It is situated on the west bank of the Hudson River, approximately 19 miles north of Manhattan. The village has a total area of 2.2 square miles, all of which is land.
The village is bordered by the Hudson River to the east, the village of South Nyack to the south, the village of Upper Nyack to the west, and the town of Clarkstown to the north. The village is located within the New York metropolitan area.
Economy
Nyack’s economy is largely based on tourism and retail. The village is home to several popular restaurants, shops, and galleries. It is also home to the Edward Hopper House Art Center, which is a museum dedicated to the works of the famous American artist.
The village is also home to several corporate headquarters, including the headquarters of the global financial services firm, Citigroup.
Demographics
As of the 2010 census, Nyack had a population of 6,765. The racial makeup of the village was 79.2% White, 11.2% African American, 0.3% Native American, 4.2% Asian, 0.1% Pacific Islander, 2.2% from other races, and 2.9% from two or more races. Hispanic or Latino of any race were 8.2% of the population.
The median household income in Nyack was $68,945, and the median family income was $87,813. The per capita income for the village was $37,945. About 8.2% of families and 11.2% of the population were below the poverty line, including 15.2% of those under age 18 and 5.2% of those age 65 or over.
Common Questions
What is Per Capita Income in Nyack?
Per Capita income in Nyack is $69,937.
What is the Median Family Income in Nyack?
Median Family Income in Nyack is $124,207.
What is the Median Household income in Nyack?
Median Household Income in Nyack is $97,013.
What is Income or Wage Gap in Nyack?
Income or Wage Gap in Nyack is 5.0%.
Women in Nyack earn 95.0 cents for every dollar earned by a man.
What is Inequality or Gini Index in Nyack?
Inequality or Gini Index in Nyack is 0.51.
What is the Total Population of Nyack?
Total Population of Nyack is 7,057.
What is the Total Male Population of Nyack?
Total Male Population of Nyack is 3,187.
What is the Total Female Population of Nyack?
Total Female Population of Nyack is 3,870.
What is the Ratio of Males per 100 Females in Nyack?
There are 82.35 Males per 100 Females in Nyack.
What is the Ratio of Females per 100 Males in Nyack?
There are 121.43 Females per 100 Males in Nyack.
What is the Median Population Age in Nyack?
Median Population Age in Nyack is 44.5 Years.
What is the Average Family Size in Nyack
Average Family Size in Nyack is 3.3 People.
What is the Average Household Size in Nyack
Average Household Size in Nyack is 2.1 People.
How Large is the Labor Force in Nyack?
There are 4,087 People in the Labor Forcein in Nyack.
What is the Percentage of People in the Labor Force in Nyack?
69.4% of People are in the Labor Force in Nyack.
What is the Unemployment Rate in Nyack?
Unemployment Rate in Nyack is 9.7%.