Terryville, NY Map & Demographics
Terryville Map
Terryville Overview
$47,098
PER CAPITA INCOME
$138,620
AVG FAMILY INCOME
$112,682
AVG HOUSEHOLD INCOME
36.7%
WAGE / INCOME GAP [ % ]
63.3¢/ $1
WAGE / INCOME GAP [ $ ]
0.41
INEQUALITY / GINI INDEX
10,890
TOTAL POPULATION
4,900
MALE POPULATION
5,990
FEMALE POPULATION
81.80
MALES / 100 FEMALES
122.24
FEMALES / 100 MALES
40.8
MEDIAN AGE
3.5
AVG FAMILY SIZE
2.8
AVG HOUSEHOLD SIZE
5,754
LABOR FORCE [ PEOPLE ]
66.2%
PERCENT IN LABOR FORCE
6.4%
UNEMPLOYMENT RATE
Income in Terryville
Income Overview in Terryville
Per Capita Income in Terryville is $47,098, while median incomes of families and households are $138,620 and $112,682 respectively.
| Characteristic | Number | Measure |
| Per Capita Income | 10,890 | $47,098 |
| Median Family Income | 2,653 | $138,620 |
| Mean Family Income | 2,653 | $155,698 |
| Median Household Income | 3,820 | $112,682 |
| Mean Household Income | 3,820 | $130,374 |
| Income Deficit | 2,653 | $0 |
| Wage / Income Gap (%) | 10,890 | 36.70% |
| Wage / Income Gap ($) | 10,890 | 63.30¢ per $1 |
| Gini / Inequality Index | 10,890 | 0.41 |
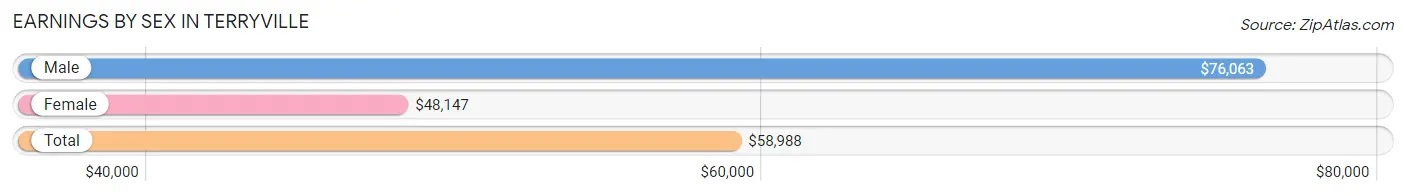
Earnings by Sex in Terryville
Average Earnings in Terryville are $58,988, $76,063 for men and $48,147 for women, a difference of 36.7%.
| Sex | Number | Average Earnings |
| Male | 2,835 (48.5%) | $76,063 |
| Female | 3,011 (51.5%) | $48,147 |
| Total | 5,846 (100.0%) | $58,988 |
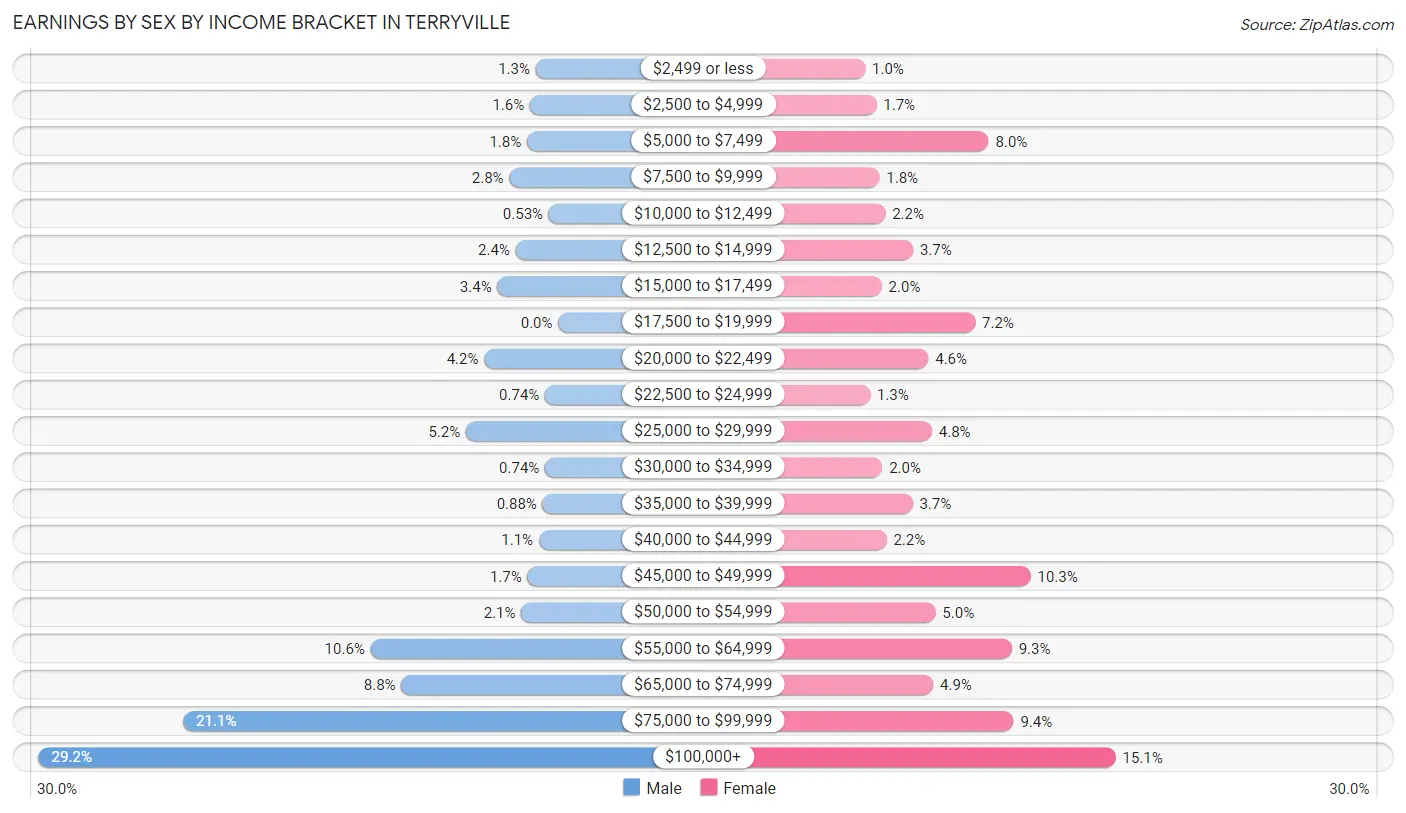
Earnings by Sex by Income Bracket in Terryville
The most common earnings brackets in Terryville are $100,000+ for men (828 | 29.2%) and $100,000+ for women (455 | 15.1%).
| Income | Male | Female |
| $2,499 or less | 36 (1.3%) | 31 (1.0%) |
| $2,500 to $4,999 | 45 (1.6%) | 50 (1.7%) |
| $5,000 to $7,499 | 50 (1.8%) | 240 (8.0%) |
| $7,500 to $9,999 | 78 (2.8%) | 55 (1.8%) |
| $10,000 to $12,499 | 15 (0.5%) | 65 (2.2%) |
| $12,500 to $14,999 | 68 (2.4%) | 112 (3.7%) |
| $15,000 to $17,499 | 97 (3.4%) | 59 (2.0%) |
| $17,500 to $19,999 | 0 (0.0%) | 217 (7.2%) |
| $20,000 to $22,499 | 118 (4.2%) | 138 (4.6%) |
| $22,500 to $24,999 | 21 (0.7%) | 39 (1.3%) |
| $25,000 to $29,999 | 147 (5.2%) | 144 (4.8%) |
| $30,000 to $34,999 | 21 (0.7%) | 60 (2.0%) |
| $35,000 to $39,999 | 25 (0.9%) | 111 (3.7%) |
| $40,000 to $44,999 | 31 (1.1%) | 67 (2.2%) |
| $45,000 to $49,999 | 49 (1.7%) | 311 (10.3%) |
| $50,000 to $54,999 | 59 (2.1%) | 150 (5.0%) |
| $55,000 to $64,999 | 299 (10.5%) | 279 (9.3%) |
| $65,000 to $74,999 | 250 (8.8%) | 146 (4.9%) |
| $75,000 to $99,999 | 598 (21.1%) | 282 (9.4%) |
| $100,000+ | 828 (29.2%) | 455 (15.1%) |
| Total | 2,835 (100.0%) | 3,011 (100.0%) |
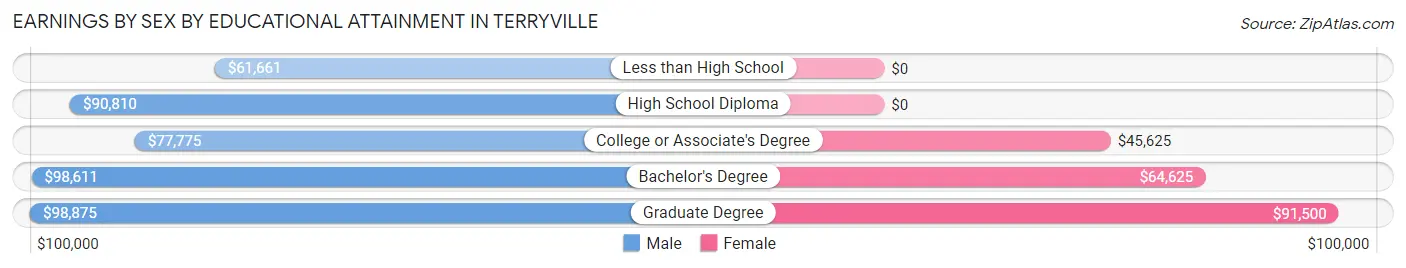
Earnings by Sex by Educational Attainment in Terryville
Average earnings in Terryville are $78,395 for men and $53,304 for women, a difference of 32.0%. Men with an educational attainment of graduate degree enjoy the highest average annual earnings of $98,875, while those with less than high school education earn the least with $61,661. Women with an educational attainment of graduate degree earn the most with the average annual earnings of $91,500, while those with college or associate's degree education have the smallest earnings of $45,625.
| Educational Attainment | Male Income | Female Income |
| Less than High School | $61,661 | $0 |
| High School Diploma | $90,810 | $0 |
| College or Associate's Degree | $77,775 | $45,625 |
| Bachelor's Degree | $98,611 | $64,625 |
| Graduate Degree | $98,875 | $91,500 |
| Total | $78,395 | $53,304 |
Family Income in Terryville
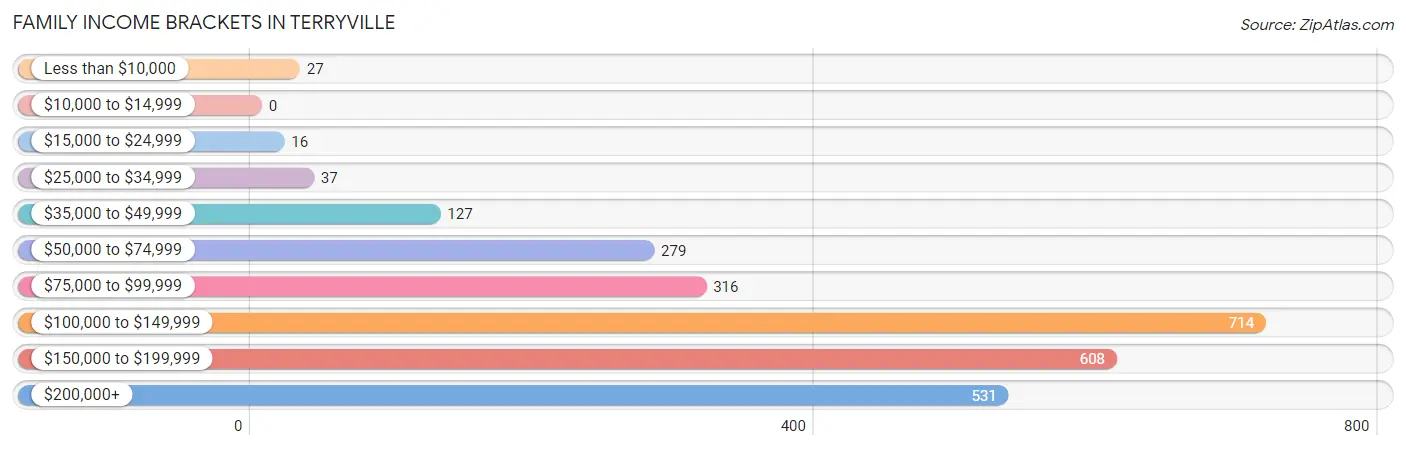
Family Income Brackets in Terryville
According to the Terryville family income data, there are 714 families falling into the $100,000 to $149,999 income range, which is the most common income bracket and makes up 26.9% of all families.
| Income Bracket | # Families | % Families |
| Less than $10,000 | 27 | 1.0% |
| $10,000 to $14,999 | 0 | 0.0% |
| $15,000 to $24,999 | 16 | 0.6% |
| $25,000 to $34,999 | 37 | 1.4% |
| $35,000 to $49,999 | 127 | 4.8% |
| $50,000 to $74,999 | 279 | 10.5% |
| $75,000 to $99,999 | 316 | 11.9% |
| $100,000 to $149,999 | 714 | 26.9% |
| $150,000 to $199,999 | 608 | 22.9% |
| $200,000+ | 531 | 20.0% |
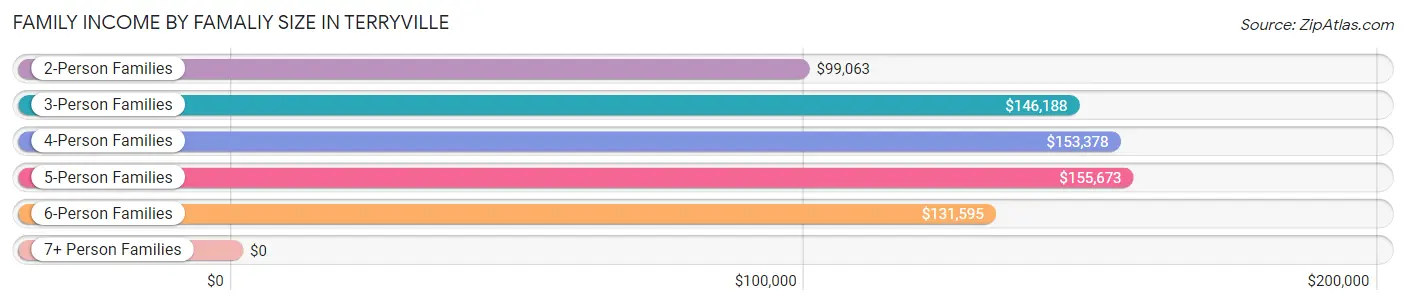
Family Income by Famaliy Size in Terryville
5-person families (321 | 12.1%) account for the highest median family income in Terryville with $155,673 per family, while 2-person families (863 | 32.5%) have the highest median income of $49,532 per family member.
| Income Bracket | # Families | Median Income |
| 2-Person Families | 863 (32.5%) | $99,063 |
| 3-Person Families | 583 (22.0%) | $146,188 |
| 4-Person Families | 811 (30.6%) | $153,378 |
| 5-Person Families | 321 (12.1%) | $155,673 |
| 6-Person Families | 75 (2.8%) | $131,595 |
| 7+ Person Families | 0 (0.0%) | $0 |
| Total | 2,653 (100.0%) | $138,620 |
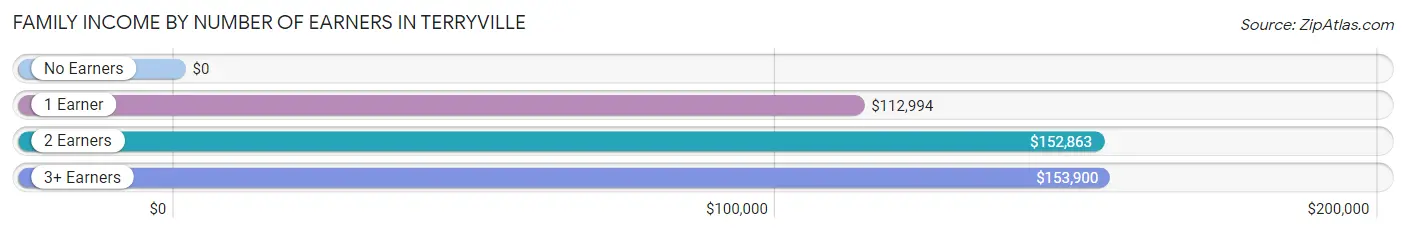
Family Income by Number of Earners in Terryville
| Number of Earners | # Families | Median Income |
| No Earners | 279 (10.5%) | $0 |
| 1 Earner | 562 (21.2%) | $112,994 |
| 2 Earners | 1,353 (51.0%) | $152,863 |
| 3+ Earners | 459 (17.3%) | $153,900 |
| Total | 2,653 (100.0%) | $138,620 |
Household Income in Terryville
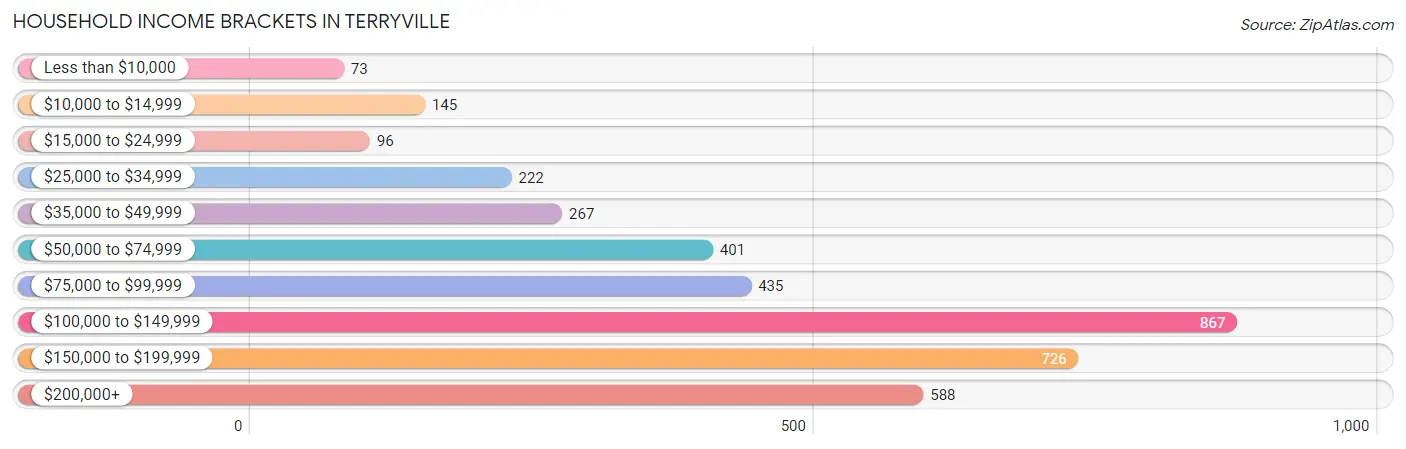
Household Income Brackets in Terryville
With 867 households falling in the category, the $100,000 to $149,999 income range is the most frequent in Terryville, accounting for 22.7% of all households. In contrast, only 73 households (1.9%) fall into the less than $10,000 income bracket, making it the least populous group.
| Income Bracket | # Households | % Households |
| Less than $10,000 | 73 | 1.9% |
| $10,000 to $14,999 | 145 | 3.8% |
| $15,000 to $24,999 | 96 | 2.5% |
| $25,000 to $34,999 | 222 | 5.8% |
| $35,000 to $49,999 | 267 | 7.0% |
| $50,000 to $74,999 | 401 | 10.5% |
| $75,000 to $99,999 | 435 | 11.4% |
| $100,000 to $149,999 | 867 | 22.7% |
| $150,000 to $199,999 | 726 | 19.0% |
| $200,000+ | 588 | 15.4% |
Household Income by Householder Age in Terryville
The median household income in Terryville is $112,682, with the highest median household income of $153,290 found in the 45 to 64 years age bracket for the primary householder. A total of 1,531 households (40.1%) fall into this category.
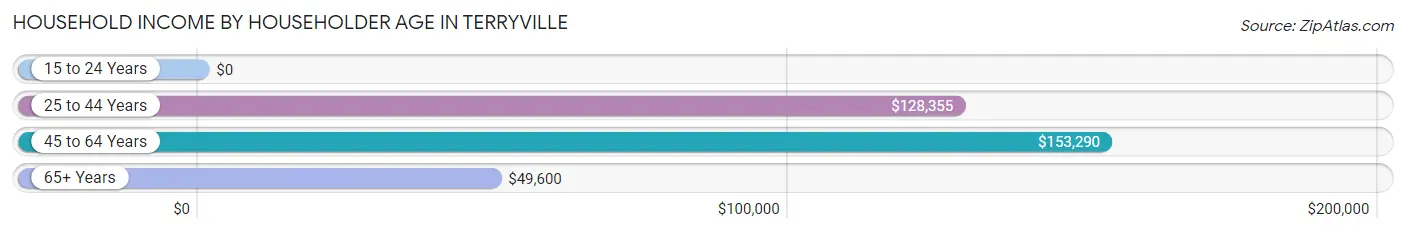
| Income Bracket | # Households | Median Income |
| 15 to 24 Years | 0 (0.0%) | $0 |
| 25 to 44 Years | 1,049 (27.5%) | $128,355 |
| 45 to 64 Years | 1,531 (40.1%) | $153,290 |
| 65+ Years | 1,240 (32.5%) | $49,600 |
| Total | 3,820 (100.0%) | $112,682 |
Poverty in Terryville
Income Below Poverty by Sex and Age in Terryville
With 1.9% poverty level for males and 2.7% for females among the residents of Terryville, 25 to 34 year old males and 75 year old and over females are the most vulnerable to poverty, with 33 males (6.1%) and 49 females (8.6%) in their respective age groups living below the poverty level.
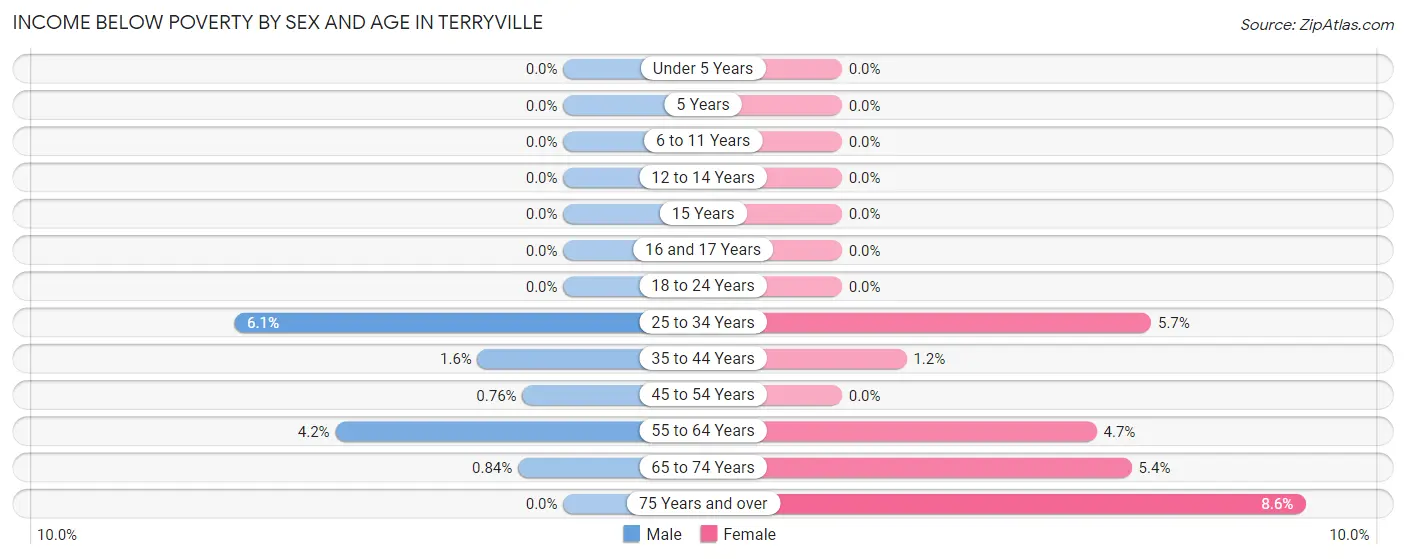
| Age Bracket | Male | Female |
| Under 5 Years | 0 (0.0%) | 0 (0.0%) |
| 5 Years | 0 (0.0%) | 0 (0.0%) |
| 6 to 11 Years | 0 (0.0%) | 0 (0.0%) |
| 12 to 14 Years | 0 (0.0%) | 0 (0.0%) |
| 15 Years | 0 (0.0%) | 0 (0.0%) |
| 16 and 17 Years | 0 (0.0%) | 0 (0.0%) |
| 18 to 24 Years | 0 (0.0%) | 0 (0.0%) |
| 25 to 34 Years | 33 (6.1%) | 35 (5.7%) |
| 35 to 44 Years | 13 (1.6%) | 9 (1.2%) |
| 45 to 54 Years | 4 (0.8%) | 0 (0.0%) |
| 55 to 64 Years | 40 (4.2%) | 37 (4.7%) |
| 65 to 74 Years | 3 (0.8%) | 29 (5.4%) |
| 75 Years and over | 0 (0.0%) | 49 (8.6%) |
| Total | 93 (1.9%) | 159 (2.7%) |
Income Above Poverty by Sex and Age in Terryville
According to the poverty statistics in Terryville, males aged under 5 years and females aged under 5 years are the age groups that are most secure financially, with 100.0% of males and 100.0% of females in these age groups living above the poverty line.
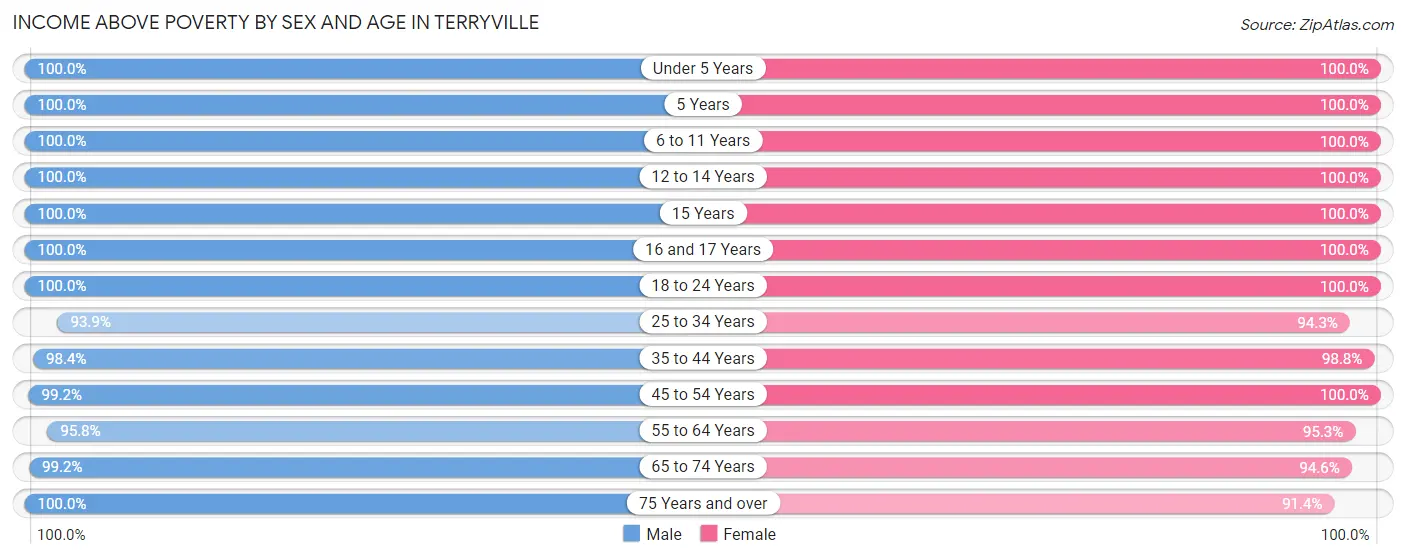
| Age Bracket | Male | Female |
| Under 5 Years | 129 (100.0%) | 335 (100.0%) |
| 5 Years | 128 (100.0%) | 27 (100.0%) |
| 6 to 11 Years | 346 (100.0%) | 498 (100.0%) |
| 12 to 14 Years | 363 (100.0%) | 218 (100.0%) |
| 15 Years | 14 (100.0%) | 135 (100.0%) |
| 16 and 17 Years | 177 (100.0%) | 163 (100.0%) |
| 18 to 24 Years | 305 (100.0%) | 671 (100.0%) |
| 25 to 34 Years | 507 (93.9%) | 575 (94.3%) |
| 35 to 44 Years | 806 (98.4%) | 740 (98.8%) |
| 45 to 54 Years | 524 (99.2%) | 686 (100.0%) |
| 55 to 64 Years | 905 (95.8%) | 745 (95.3%) |
| 65 to 74 Years | 353 (99.2%) | 510 (94.6%) |
| 75 Years and over | 250 (100.0%) | 521 (91.4%) |
| Total | 4,807 (98.1%) | 5,824 (97.3%) |
Income Below Poverty Among Married-Couple Families in Terryville
The poverty statistics for married-couple families in Terryville show that 1.2% or 26 of the total 2,177 families live below the poverty line. Families with no children have the highest poverty rate of 2.1%, comprising of 26 families. On the other hand, families with 1 or 2 children have the lowest poverty rate of 0.0%, which includes 0 families.
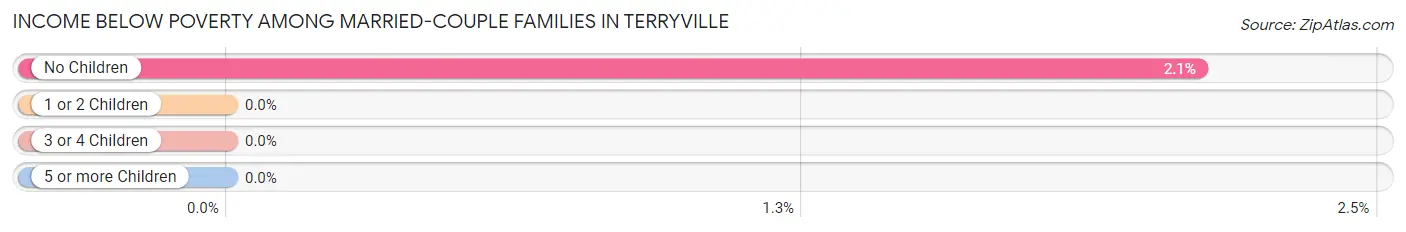
| Children | Above Poverty | Below Poverty |
| No Children | 1,205 (97.9%) | 26 (2.1%) |
| 1 or 2 Children | 719 (100.0%) | 0 (0.0%) |
| 3 or 4 Children | 227 (100.0%) | 0 (0.0%) |
| 5 or more Children | 0 (0.0%) | 0 (0.0%) |
| Total | 2,151 (98.8%) | 26 (1.2%) |
Income Below Poverty Among Single-Parent Households in Terryville
| Children | Single Father | Single Mother |
| No Children | 0 (0.0%) | 0 (0.0%) |
| 1 or 2 Children | 0 (0.0%) | 0 (0.0%) |
| 3 or 4 Children | 0 (0.0%) | 0 (0.0%) |
| 5 or more Children | 0 (0.0%) | 0 (0.0%) |
| Total | 0 (0.0%) | 0 (0.0%) |
Income Below Poverty Among Married-Couple vs Single-Parent Households in Terryville
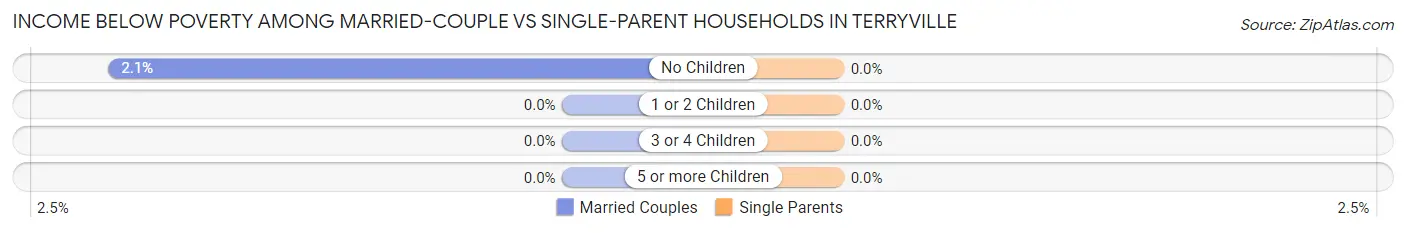
| Children | Married-Couple Families | Single-Parent Households |
| No Children | 26 (2.1%) | 0 (0.0%) |
| 1 or 2 Children | 0 (0.0%) | 0 (0.0%) |
| 3 or 4 Children | 0 (0.0%) | 0 (0.0%) |
| 5 or more Children | 0 (0.0%) | 0 (0.0%) |
| Total | 26 (1.2%) | 0 (0.0%) |
Race in Terryville
The most populous races in Terryville are White / Caucasian (9,158 | 84.1%), Hispanic or Latino (1,954 | 17.9%), and Some other Race (891 | 8.2%).
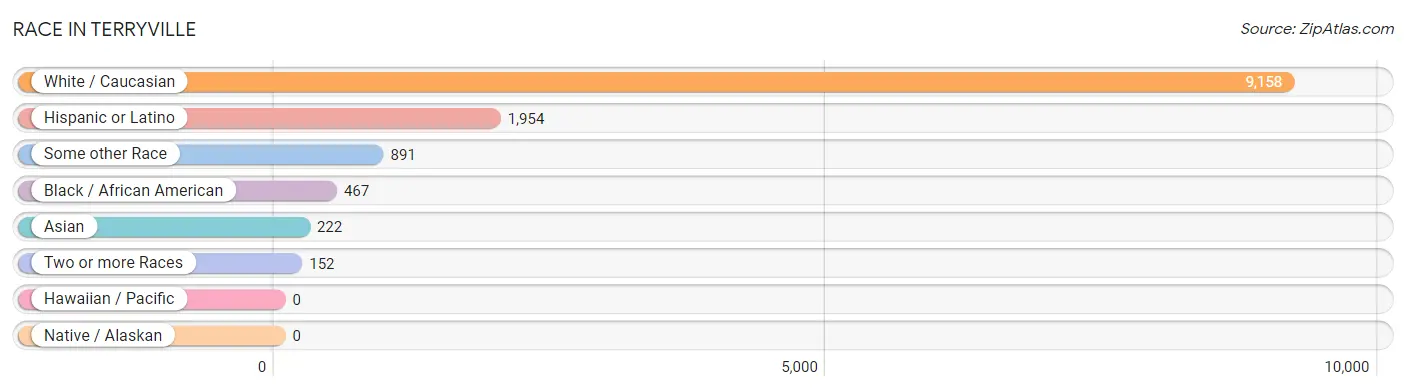
| Race | # Population | % Population |
| Asian | 222 | 2.0% |
| Black / African American | 467 | 4.3% |
| Hawaiian / Pacific | 0 | 0.0% |
| Hispanic or Latino | 1,954 | 17.9% |
| Native / Alaskan | 0 | 0.0% |
| White / Caucasian | 9,158 | 84.1% |
| Two or more Races | 152 | 1.4% |
| Some other Race | 891 | 8.2% |
| Total | 10,890 | 100.0% |
Ancestry in Terryville
The most populous ancestries reported in Terryville are Italian (3,620 | 33.2%), German (1,931 | 17.7%), Irish (1,279 | 11.7%), Dominican (1,104 | 10.1%), and Polish (873 | 8.0%), together accounting for 80.9% of all Terryville residents.
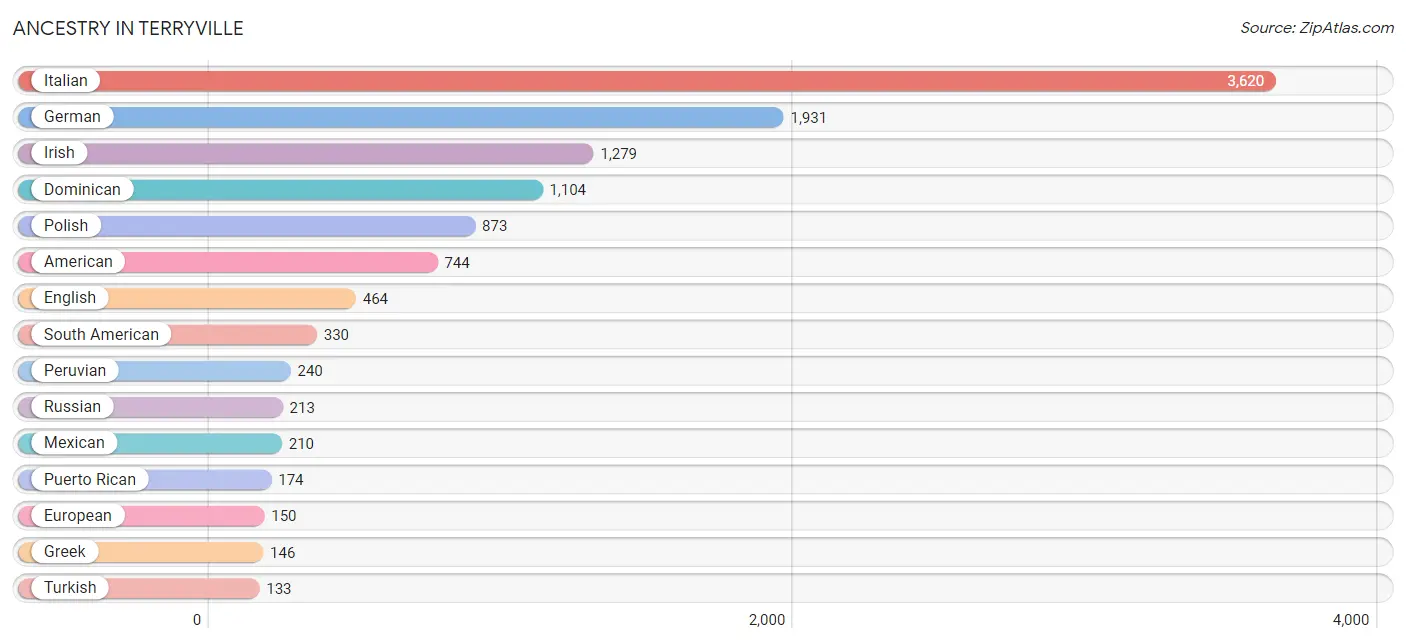
| Ancestry | # Population | % Population |
| African | 77 | 0.7% |
| American | 744 | 6.8% |
| Austrian | 7 | 0.1% |
| Belgian | 17 | 0.2% |
| Bhutanese | 17 | 0.2% |
| British | 40 | 0.4% |
| Canadian | 102 | 0.9% |
| Central American | 11 | 0.1% |
| Colombian | 13 | 0.1% |
| Costa Rican | 11 | 0.1% |
| Croatian | 15 | 0.1% |
| Czech | 14 | 0.1% |
| Czechoslovakian | 8 | 0.1% |
| Danish | 66 | 0.6% |
| Dominican | 1,104 | 10.1% |
| Dutch | 25 | 0.2% |
| Eastern European | 14 | 0.1% |
| Ecuadorian | 59 | 0.5% |
| English | 464 | 4.3% |
| European | 150 | 1.4% |
| French Canadian | 40 | 0.4% |
| German | 1,931 | 17.7% |
| Greek | 146 | 1.3% |
| Haitian | 76 | 0.7% |
| Hungarian | 98 | 0.9% |
| Indian (Asian) | 91 | 0.8% |
| Irish | 1,279 | 11.7% |
| Italian | 3,620 | 33.2% |
| Lithuanian | 55 | 0.5% |
| Maltese | 45 | 0.4% |
| Mexican | 210 | 1.9% |
| Northern European | 27 | 0.3% |
| Norwegian | 121 | 1.1% |
| Peruvian | 240 | 2.2% |
| Polish | 873 | 8.0% |
| Portuguese | 20 | 0.2% |
| Puerto Rican | 174 | 1.6% |
| Russian | 213 | 2.0% |
| Scandinavian | 11 | 0.1% |
| Scotch-Irish | 44 | 0.4% |
| Scottish | 22 | 0.2% |
| Sioux | 62 | 0.6% |
| South American | 330 | 3.0% |
| Spaniard | 118 | 1.1% |
| Sri Lankan | 11 | 0.1% |
| Subsaharan African | 77 | 0.7% |
| Swedish | 13 | 0.1% |
| Swiss | 32 | 0.3% |
| Thai | 128 | 1.2% |
| Turkish | 133 | 1.2% |
| Ukrainian | 12 | 0.1% |
| Venezuelan | 18 | 0.2% |
| Welsh | 21 | 0.2% | View All 53 Rows |
Immigrants in Terryville
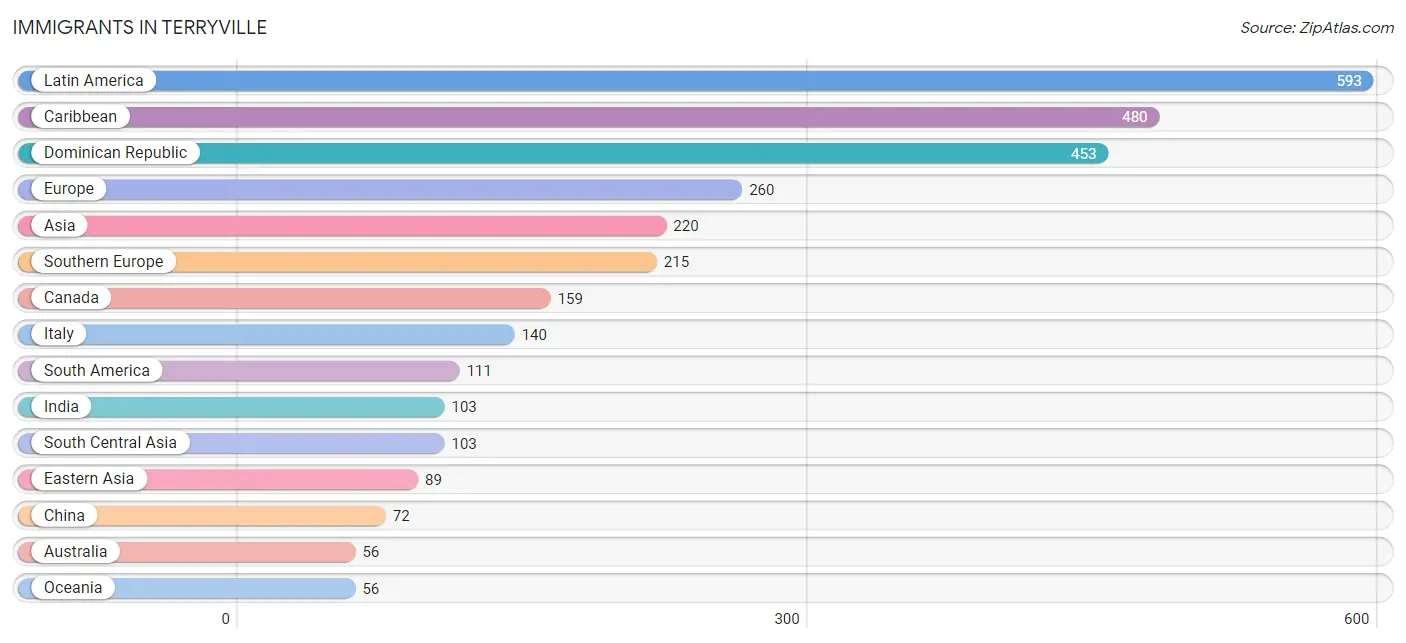
The most numerous immigrant groups reported in Terryville came from Latin America (593 | 5.4%), Caribbean (480 | 4.4%), Dominican Republic (453 | 4.2%), Europe (260 | 2.4%), and Asia (220 | 2.0%), together accounting for 18.4% of all Terryville residents.
| Immigration Origin | # Population | % Population |
| Argentina | 14 | 0.1% |
| Asia | 220 | 2.0% |
| Australia | 56 | 0.5% |
| Belgium | 15 | 0.1% |
| Belize | 2 | 0.0% |
| Brazil | 16 | 0.2% |
| Canada | 159 | 1.5% |
| Caribbean | 480 | 4.4% |
| Central America | 2 | 0.0% |
| China | 72 | 0.7% |
| Colombia | 13 | 0.1% |
| Croatia | 15 | 0.1% |
| Dominican Republic | 453 | 4.2% |
| Eastern Asia | 89 | 0.8% |
| Eastern Europe | 15 | 0.1% |
| Ecuador | 44 | 0.4% |
| England | 13 | 0.1% |
| Europe | 260 | 2.4% |
| Greece | 46 | 0.4% |
| Haiti | 27 | 0.3% |
| India | 103 | 0.9% |
| Italy | 140 | 1.3% |
| Japan | 17 | 0.2% |
| Latin America | 593 | 5.4% |
| Northern Europe | 15 | 0.1% |
| Oceania | 56 | 0.5% |
| Peru | 6 | 0.1% |
| Portugal | 29 | 0.3% |
| South America | 111 | 1.0% |
| South Central Asia | 103 | 0.9% |
| South Eastern Asia | 11 | 0.1% |
| Southern Europe | 215 | 2.0% |
| Turkey | 17 | 0.2% |
| Venezuela | 18 | 0.2% |
| Vietnam | 11 | 0.1% |
| Western Asia | 17 | 0.2% |
| Western Europe | 15 | 0.1% | View All 37 Rows |
Sex and Age in Terryville
Sex and Age in Terryville
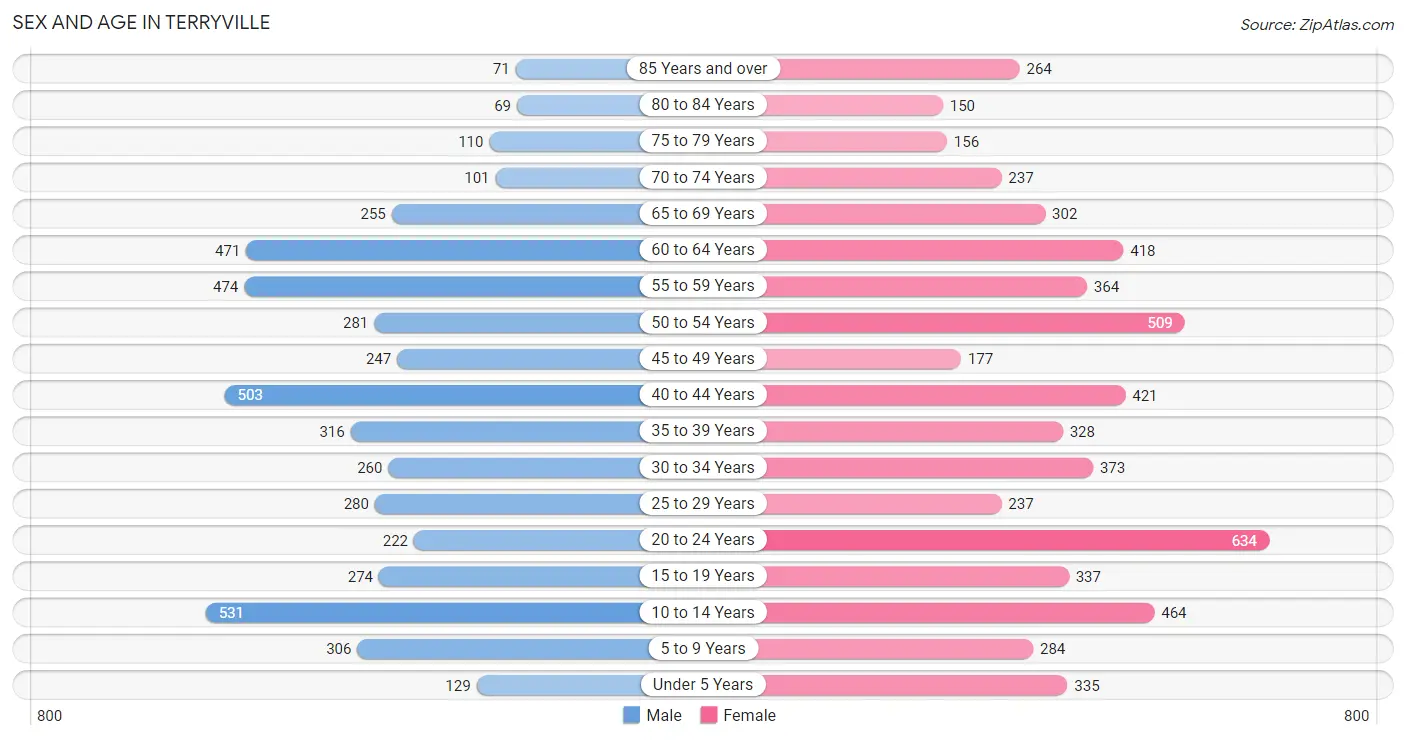
The most populous age groups in Terryville are 10 to 14 Years (531 | 10.8%) for men and 20 to 24 Years (634 | 10.6%) for women.
| Age Bracket | Male | Female |
| Under 5 Years | 129 (2.6%) | 335 (5.6%) |
| 5 to 9 Years | 306 (6.2%) | 284 (4.7%) |
| 10 to 14 Years | 531 (10.8%) | 464 (7.7%) |
| 15 to 19 Years | 274 (5.6%) | 337 (5.6%) |
| 20 to 24 Years | 222 (4.5%) | 634 (10.6%) |
| 25 to 29 Years | 280 (5.7%) | 237 (4.0%) |
| 30 to 34 Years | 260 (5.3%) | 373 (6.2%) |
| 35 to 39 Years | 316 (6.5%) | 328 (5.5%) |
| 40 to 44 Years | 503 (10.3%) | 421 (7.0%) |
| 45 to 49 Years | 247 (5.0%) | 177 (2.9%) |
| 50 to 54 Years | 281 (5.7%) | 509 (8.5%) |
| 55 to 59 Years | 474 (9.7%) | 364 (6.1%) |
| 60 to 64 Years | 471 (9.6%) | 418 (7.0%) |
| 65 to 69 Years | 255 (5.2%) | 302 (5.0%) |
| 70 to 74 Years | 101 (2.1%) | 237 (4.0%) |
| 75 to 79 Years | 110 (2.2%) | 156 (2.6%) |
| 80 to 84 Years | 69 (1.4%) | 150 (2.5%) |
| 85 Years and over | 71 (1.5%) | 264 (4.4%) |
| Total | 4,900 (100.0%) | 5,990 (100.0%) |
Families and Households in Terryville
Median Family Size in Terryville
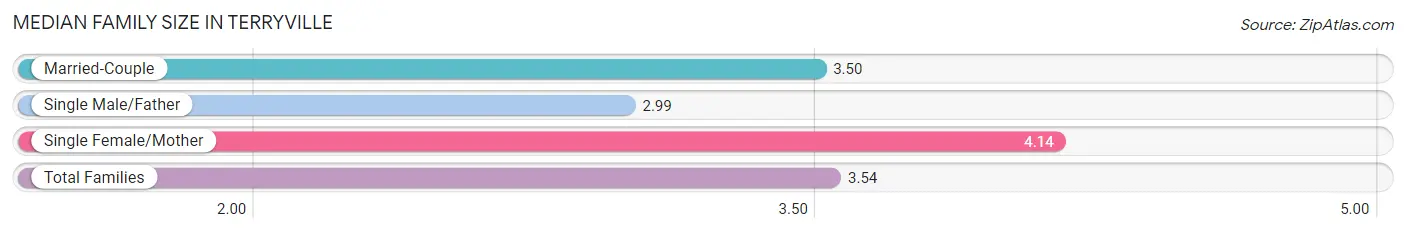
The median family size in Terryville is 3.54 persons per family, with single female/mother families (289 | 10.9%) accounting for the largest median family size of 4.14 persons per family. On the other hand, single male/father families (187 | 7.0%) represent the smallest median family size with 2.99 persons per family.
| Family Type | # Families | Family Size |
| Married-Couple | 2,177 (82.1%) | 3.50 |
| Single Male/Father | 187 (7.0%) | 2.99 |
| Single Female/Mother | 289 (10.9%) | 4.14 |
| Total Families | 2,653 (100.0%) | 3.54 |
Median Household Size in Terryville
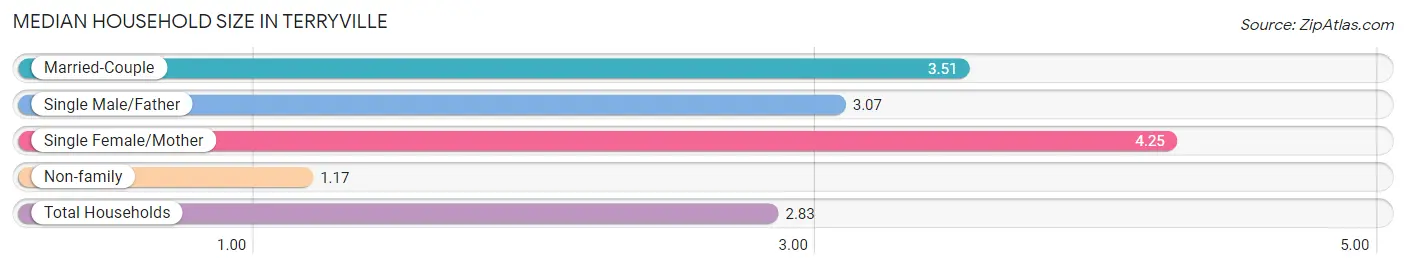
The median household size in Terryville is 2.83 persons per household, with single female/mother households (289 | 7.6%) accounting for the largest median household size of 4.25 persons per household. non-family households (1,167 | 30.5%) represent the smallest median household size with 1.17 persons per household.
| Household Type | # Households | Household Size |
| Married-Couple | 2,177 (57.0%) | 3.51 |
| Single Male/Father | 187 (4.9%) | 3.07 |
| Single Female/Mother | 289 (7.6%) | 4.25 |
| Non-family | 1,167 (30.5%) | 1.17 |
| Total Households | 3,820 (100.0%) | 2.83 |
Household Size by Marriage Status in Terryville
Out of a total of 3,820 households in Terryville, 2,653 (69.5%) are family households, while 1,167 (30.5%) are nonfamily households. The most numerous type of family households are 4-person households, comprising 875, and the most common type of nonfamily households are 1-person households, comprising 979.
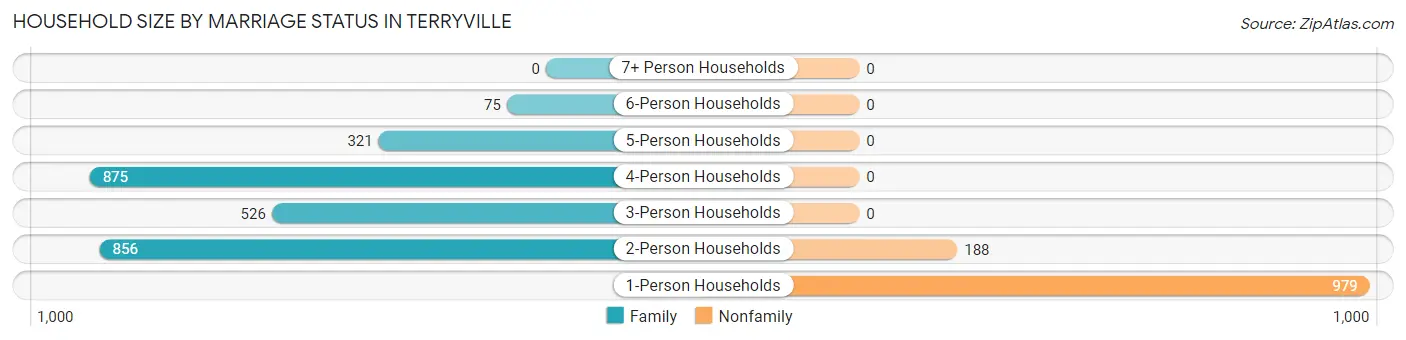
| Household Size | Family Households | Nonfamily Households |
| 1-Person Households | - | 979 (25.6%) |
| 2-Person Households | 856 (22.4%) | 188 (4.9%) |
| 3-Person Households | 526 (13.8%) | 0 (0.0%) |
| 4-Person Households | 875 (22.9%) | 0 (0.0%) |
| 5-Person Households | 321 (8.4%) | 0 (0.0%) |
| 6-Person Households | 75 (2.0%) | 0 (0.0%) |
| 7+ Person Households | 0 (0.0%) | 0 (0.0%) |
| Total | 2,653 (69.5%) | 1,167 (30.5%) |
Female Fertility in Terryville
Fertility by Age in Terryville
Average fertility rate in Terryville is 25.0 births per 1,000 women. Women in the age bracket of 20 to 34 years have the highest fertility rate with 39.0 births per 1,000 women. Women in the age bracket of 20 to 34 years acount for 76.6% of all women with births.
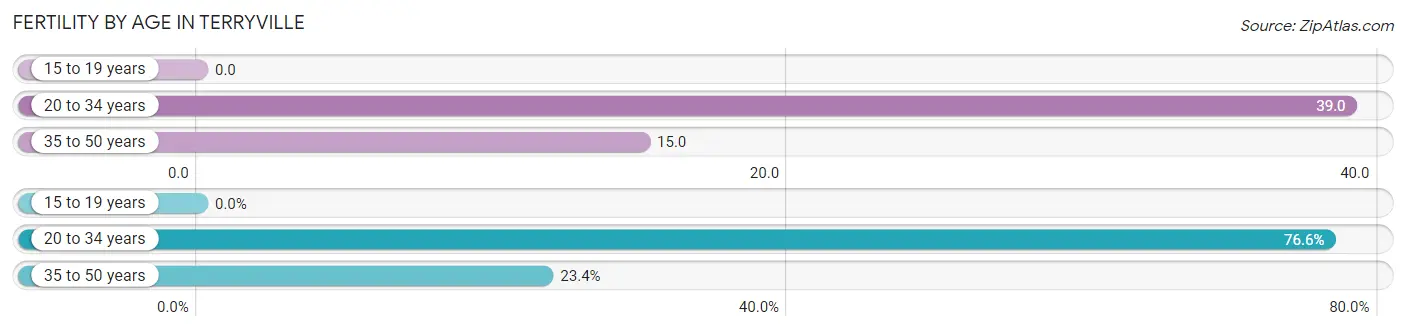
| Age Bracket | Women with Births | Births / 1,000 Women |
| 15 to 19 years | 0 (0.0%) | 0.0 |
| 20 to 34 years | 49 (76.6%) | 39.0 |
| 35 to 50 years | 15 (23.4%) | 15.0 |
| Total | 64 (100.0%) | 25.0 |
Fertility by Age by Marriage Status in Terryville
90.6% of women with births (64) in Terryville are married. The highest percentage of unmarried women with births falls into 35 to 50 years age bracket with 40.0% of them unmarried at the time of birth, while the lowest percentage of unmarried women with births belong to 20 to 34 years age bracket with 0.0% of them unmarried.
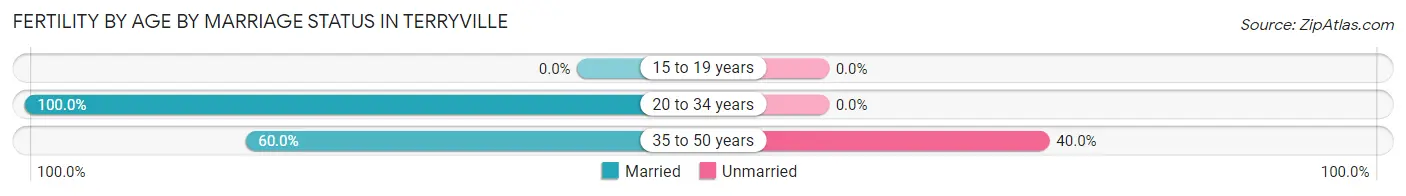
| Age Bracket | Married | Unmarried |
| 15 to 19 years | 0 (0.0%) | 0 (0.0%) |
| 20 to 34 years | 49 (100.0%) | 0 (0.0%) |
| 35 to 50 years | 9 (60.0%) | 6 (40.0%) |
| Total | 58 (90.6%) | 6 (9.4%) |
Fertility by Education in Terryville
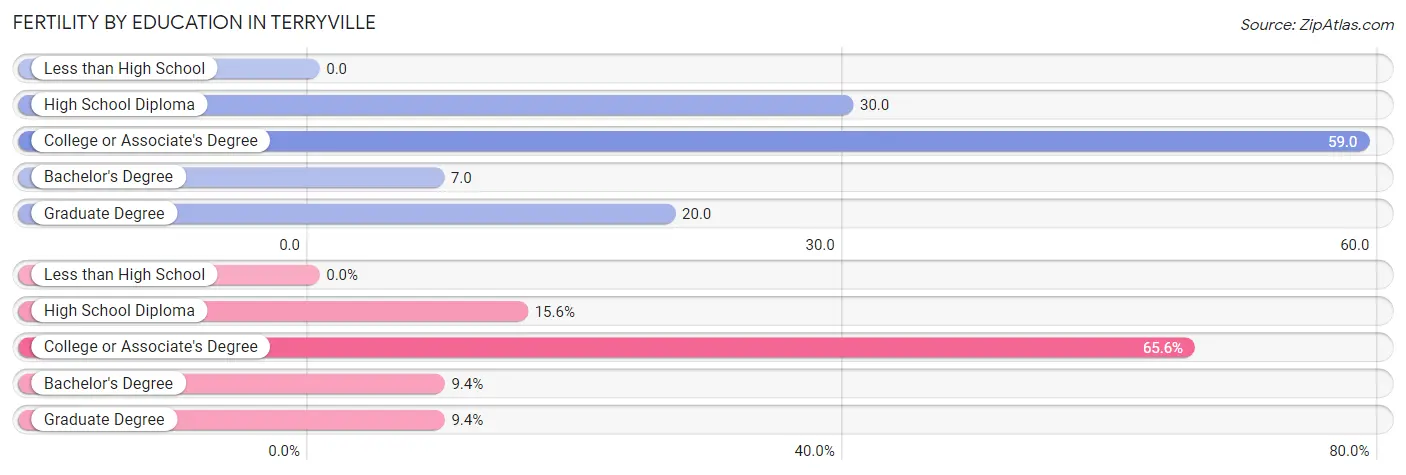
| Educational Attainment | Women with Births | Births / 1,000 Women |
| Less than High School | 0 (0.0%) | 0.0 |
| High School Diploma | 10 (15.6%) | 30.0 |
| College or Associate's Degree | 42 (65.6%) | 59.0 |
| Bachelor's Degree | 6 (9.4%) | 7.0 |
| Graduate Degree | 6 (9.4%) | 20.0 |
| Total | 64 (100.0%) | 25.0 |
Fertility by Education by Marriage Status in Terryville
9.4% of women with births in Terryville are unmarried. Women with the educational attainment of high school diploma are most likely to be married with 100.0% of them married at childbirth, while women with the educational attainment of graduate degree are least likely to be married with 100.0% of them unmarried at childbirth.
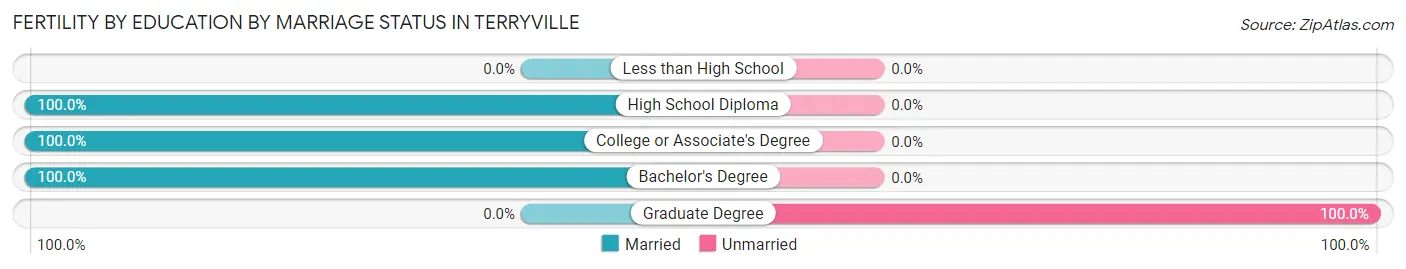
| Educational Attainment | Married | Unmarried |
| Less than High School | 0 (0.0%) | 0 (0.0%) |
| High School Diploma | 10 (100.0%) | 0 (0.0%) |
| College or Associate's Degree | 42 (100.0%) | 0 (0.0%) |
| Bachelor's Degree | 6 (100.0%) | 0 (0.0%) |
| Graduate Degree | 0 (0.0%) | 6 (100.0%) |
| Total | 58 (90.6%) | 6 (9.4%) |
Employment Characteristics in Terryville
Employment by Class of Employer in Terryville
Among the 5,222 employed individuals in Terryville, private company employees (3,554 | 68.1%), local government employees (642 | 12.3%), and self-employed (incorporated) (285 | 5.5%) make up the most common classes of employment.
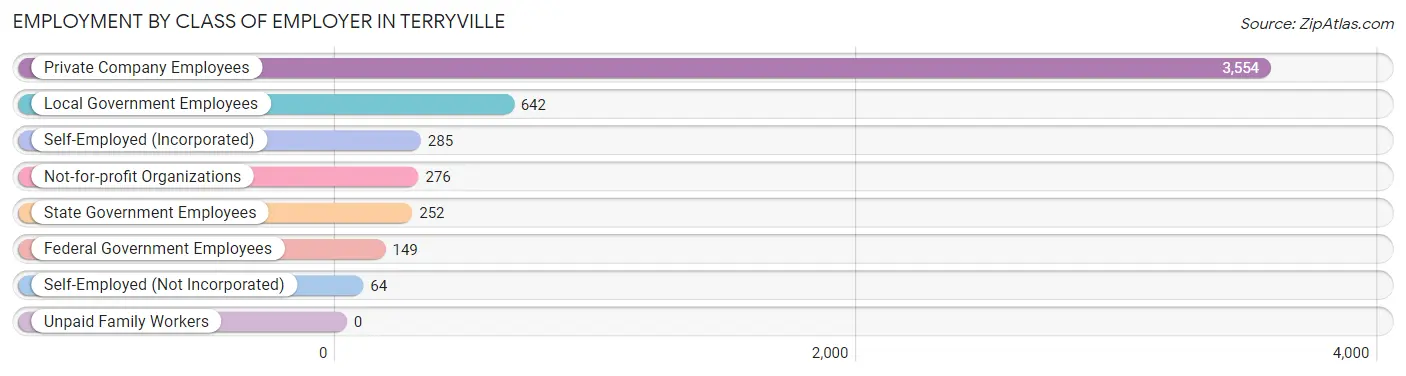
| Employer Class | # Employees | % Employees |
| Private Company Employees | 3,554 | 68.1% |
| Self-Employed (Incorporated) | 285 | 5.5% |
| Self-Employed (Not Incorporated) | 64 | 1.2% |
| Not-for-profit Organizations | 276 | 5.3% |
| Local Government Employees | 642 | 12.3% |
| State Government Employees | 252 | 4.8% |
| Federal Government Employees | 149 | 2.9% |
| Unpaid Family Workers | 0 | 0.0% |
| Total | 5,222 | 100.0% |
Employment Status by Age in Terryville
According to the labor force statistics for Terryville, out of the total population over 16 years of age (8,692), 66.2% or 5,754 individuals are in the labor force, with 6.4% or 368 of them unemployed. The age group with the highest labor force participation rate is 45 to 54 years, with 93.5% or 1,135 individuals in the labor force. Within the labor force, the 20 to 24 years age range has the highest percentage of unemployed individuals, with 35.7% or 276 of them being unemployed.
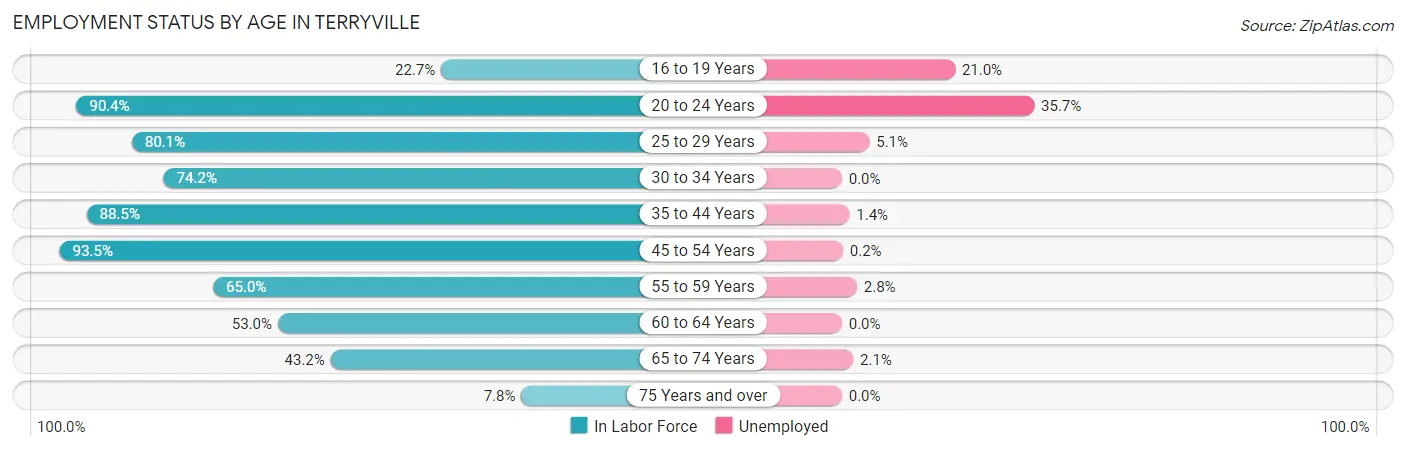
| Age Bracket | In Labor Force | Unemployed |
| 16 to 19 Years | 105 (22.7%) | 22 (21.0%) |
| 20 to 24 Years | 774 (90.4%) | 276 (35.7%) |
| 25 to 29 Years | 414 (80.1%) | 21 (5.1%) |
| 30 to 34 Years | 470 (74.2%) | 0 (0.0%) |
| 35 to 44 Years | 1,388 (88.5%) | 19 (1.4%) |
| 45 to 54 Years | 1,135 (93.5%) | 2 (0.2%) |
| 55 to 59 Years | 545 (65.0%) | 15 (2.8%) |
| 60 to 64 Years | 471 (53.0%) | 0 (0.0%) |
| 65 to 74 Years | 387 (43.2%) | 8 (2.1%) |
| 75 Years and over | 64 (7.8%) | 0 (0.0%) |
| Total | 5,754 (66.2%) | 368 (6.4%) |
Employment Status by Educational Attainment in Terryville
According to labor force statistics for Terryville, 78.1% of individuals (4,420) out of the total population between 25 and 64 years of age (5,659) are in the labor force, with 1.3% or 57 of them being unemployed. The group with the highest labor force participation rate are those with the educational attainment of bachelor's degree or higher, with 88.1% or 1,766 individuals in the labor force. Within the labor force, individuals with college / associate degree education have the highest percentage of unemployment, with 3.3% or 40 of them being unemployed.
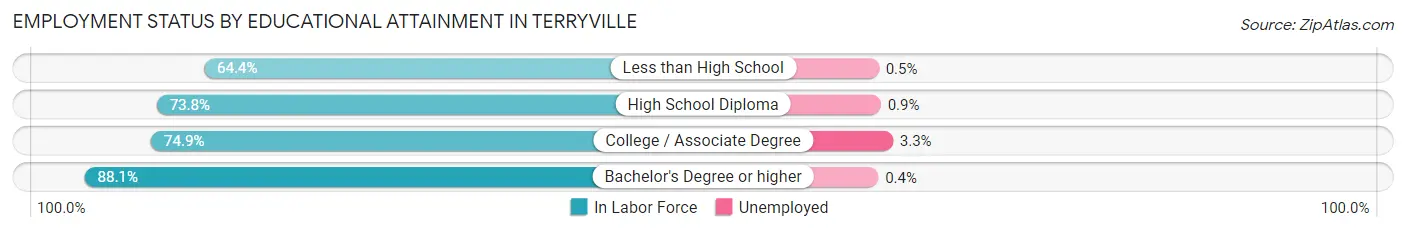
| Educational Attainment | In Labor Force | Unemployed |
| Less than High School | 401 (64.4%) | 3 (0.5%) |
| High School Diploma | 1,052 (73.8%) | 13 (0.9%) |
| College / Associate Degree | 1,203 (74.9%) | 53 (3.3%) |
| Bachelor's Degree or higher | 1,766 (88.1%) | 8 (0.4%) |
| Total | 4,420 (78.1%) | 74 (1.3%) |
Employment Occupations by Sex in Terryville
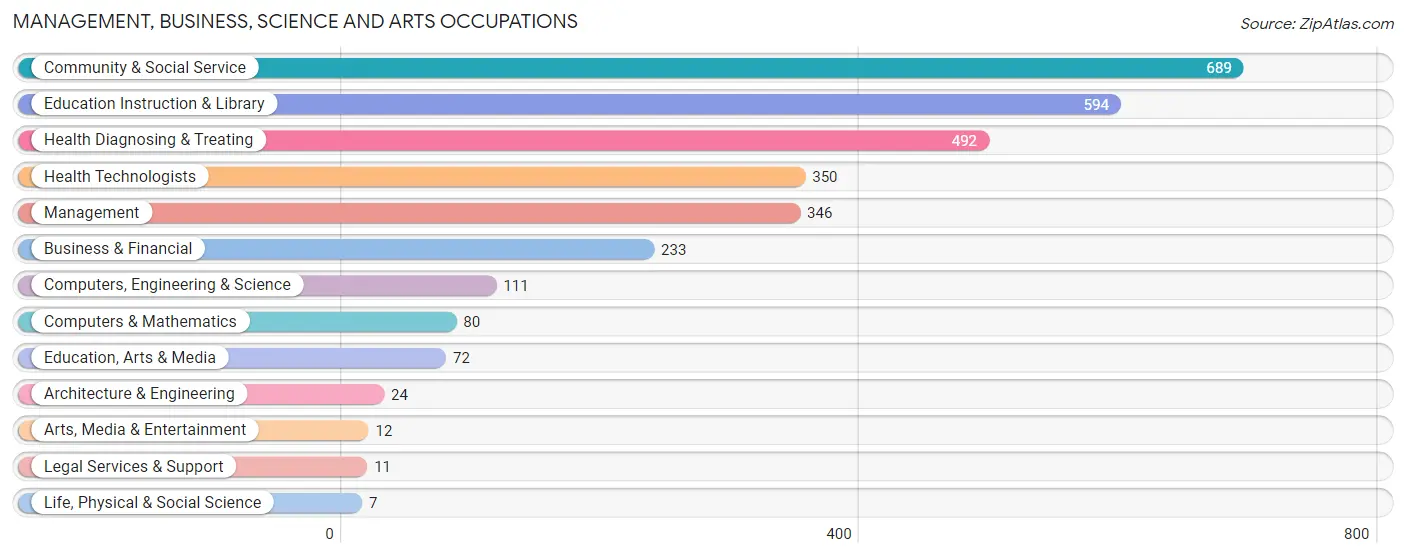
Management, Business, Science and Arts Occupations
The most common Management, Business, Science and Arts occupations in Terryville are Community & Social Service (689 | 12.9%), Education Instruction & Library (594 | 11.1%), Health Diagnosing & Treating (492 | 9.2%), Health Technologists (350 | 6.6%), and Management (346 | 6.5%).
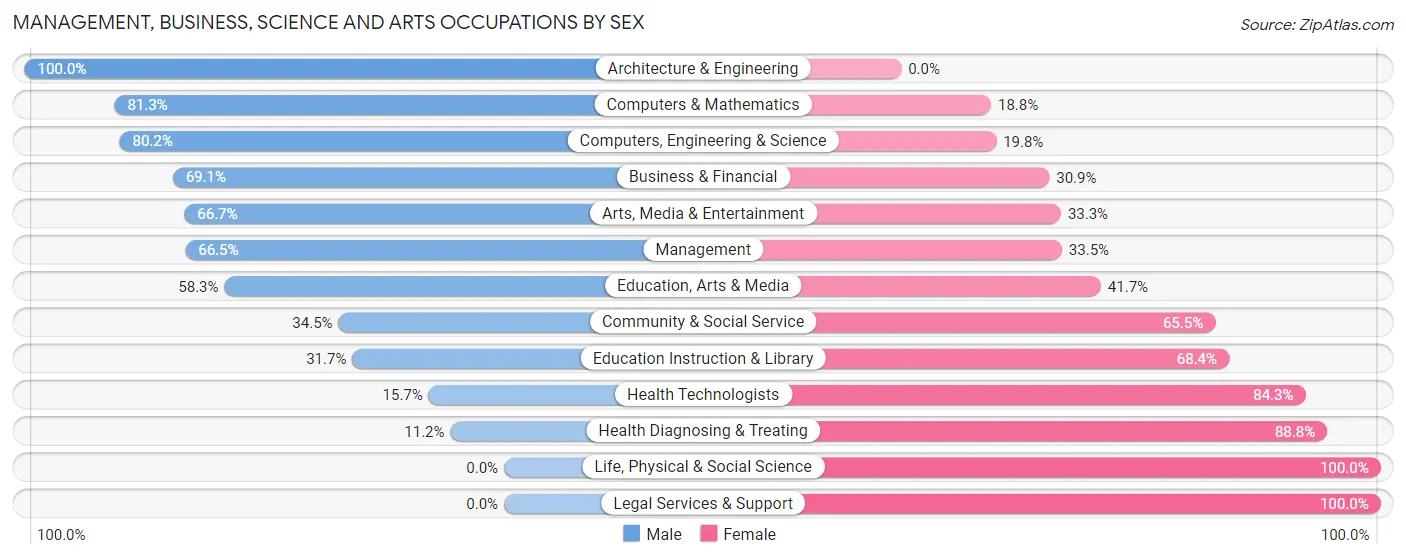
Management, Business, Science and Arts Occupations by Sex
Within the Management, Business, Science and Arts occupations in Terryville, the most male-oriented occupations are Architecture & Engineering (100.0%), Computers & Mathematics (81.2%), and Computers, Engineering & Science (80.2%), while the most female-oriented occupations are Life, Physical & Social Science (100.0%), Legal Services & Support (100.0%), and Health Diagnosing & Treating (88.8%).
| Occupation | Male | Female |
| Management | 230 (66.5%) | 116 (33.5%) |
| Business & Financial | 161 (69.1%) | 72 (30.9%) |
| Computers, Engineering & Science | 89 (80.2%) | 22 (19.8%) |
| Computers & Mathematics | 65 (81.2%) | 15 (18.8%) |
| Architecture & Engineering | 24 (100.0%) | 0 (0.0%) |
| Life, Physical & Social Science | 0 (0.0%) | 7 (100.0%) |
| Community & Social Service | 238 (34.5%) | 451 (65.5%) |
| Education, Arts & Media | 42 (58.3%) | 30 (41.7%) |
| Legal Services & Support | 0 (0.0%) | 11 (100.0%) |
| Education Instruction & Library | 188 (31.7%) | 406 (68.3%) |
| Arts, Media & Entertainment | 8 (66.7%) | 4 (33.3%) |
| Health Diagnosing & Treating | 55 (11.2%) | 437 (88.8%) |
| Health Technologists | 55 (15.7%) | 295 (84.3%) |
| Total (Category) | 773 (41.3%) | 1,098 (58.7%) |
| Total (Overall) | 2,697 (50.6%) | 2,635 (49.4%) |
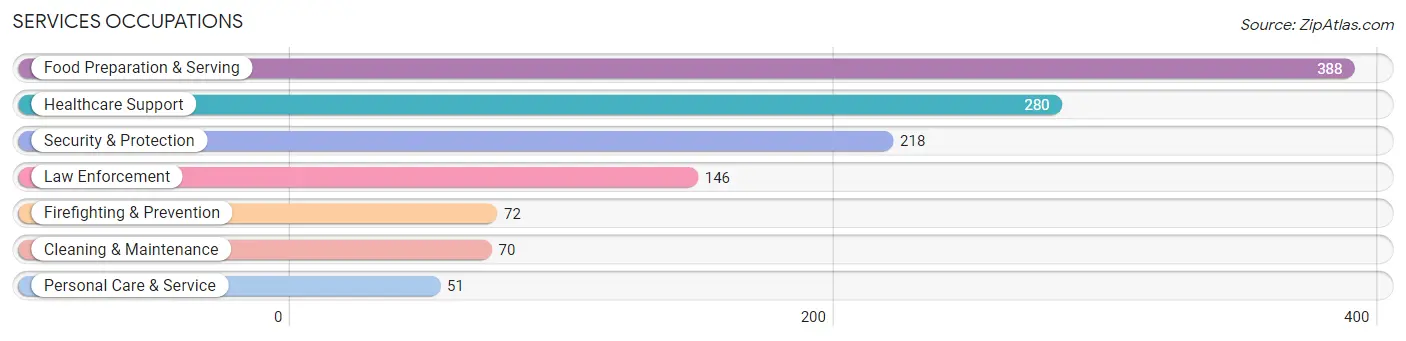
Services Occupations
The most common Services occupations in Terryville are Food Preparation & Serving (388 | 7.3%), Healthcare Support (280 | 5.2%), Security & Protection (218 | 4.1%), Law Enforcement (146 | 2.7%), and Firefighting & Prevention (72 | 1.3%).
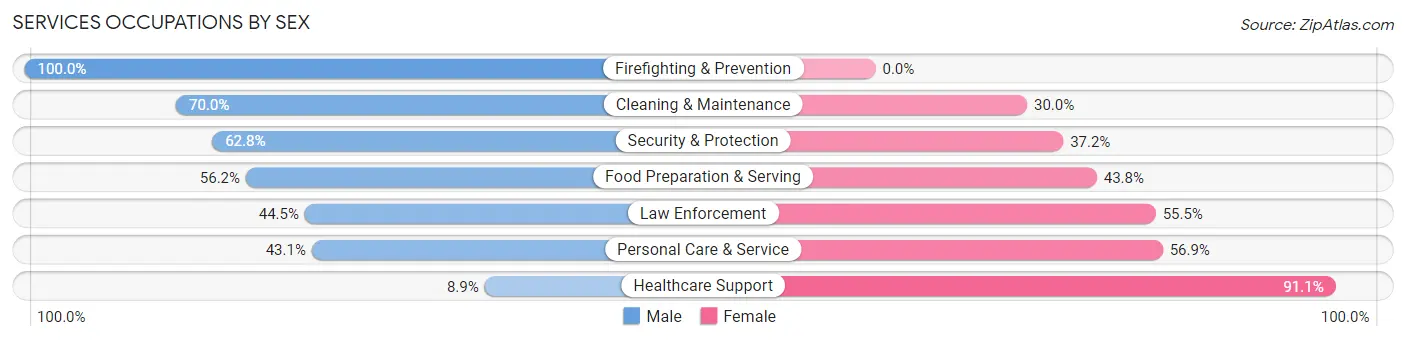
Services Occupations by Sex
Within the Services occupations in Terryville, the most male-oriented occupations are Firefighting & Prevention (100.0%), Cleaning & Maintenance (70.0%), and Security & Protection (62.8%), while the most female-oriented occupations are Healthcare Support (91.1%), Personal Care & Service (56.9%), and Law Enforcement (55.5%).
| Occupation | Male | Female |
| Healthcare Support | 25 (8.9%) | 255 (91.1%) |
| Security & Protection | 137 (62.8%) | 81 (37.2%) |
| Firefighting & Prevention | 72 (100.0%) | 0 (0.0%) |
| Law Enforcement | 65 (44.5%) | 81 (55.5%) |
| Food Preparation & Serving | 218 (56.2%) | 170 (43.8%) |
| Cleaning & Maintenance | 49 (70.0%) | 21 (30.0%) |
| Personal Care & Service | 22 (43.1%) | 29 (56.9%) |
| Total (Category) | 451 (44.8%) | 556 (55.2%) |
| Total (Overall) | 2,697 (50.6%) | 2,635 (49.4%) |
Sales and Office Occupations
The most common Sales and Office occupations in Terryville are Office & Administration (880 | 16.5%), and Sales & Related (746 | 14.0%).

Sales and Office Occupations by Sex
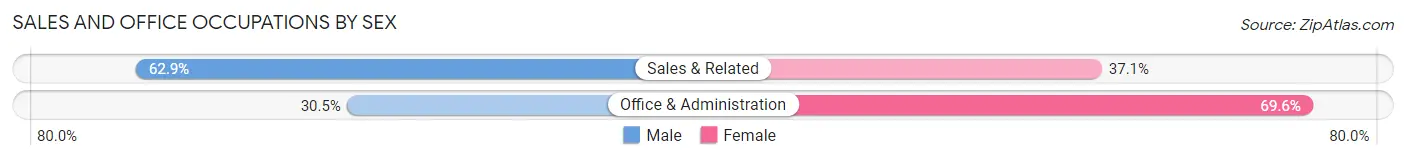
| Occupation | Male | Female |
| Sales & Related | 469 (62.9%) | 277 (37.1%) |
| Office & Administration | 268 (30.4%) | 612 (69.6%) |
| Total (Category) | 737 (45.3%) | 889 (54.7%) |
| Total (Overall) | 2,697 (50.6%) | 2,635 (49.4%) |
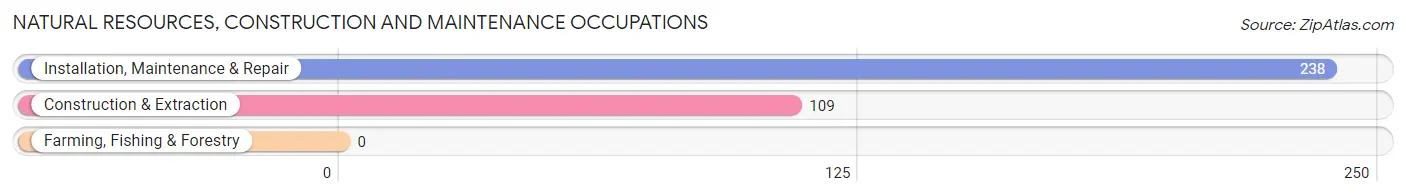
Natural Resources, Construction and Maintenance Occupations
The most common Natural Resources, Construction and Maintenance occupations in Terryville are Installation, Maintenance & Repair (238 | 4.5%), and Construction & Extraction (109 | 2.0%).
Natural Resources, Construction and Maintenance Occupations by Sex
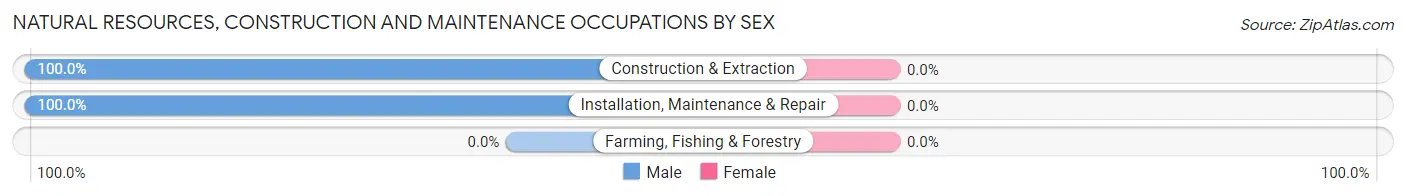
| Occupation | Male | Female |
| Farming, Fishing & Forestry | 0 (0.0%) | 0 (0.0%) |
| Construction & Extraction | 109 (100.0%) | 0 (0.0%) |
| Installation, Maintenance & Repair | 238 (100.0%) | 0 (0.0%) |
| Total (Category) | 347 (100.0%) | 0 (0.0%) |
| Total (Overall) | 2,697 (50.6%) | 2,635 (49.4%) |
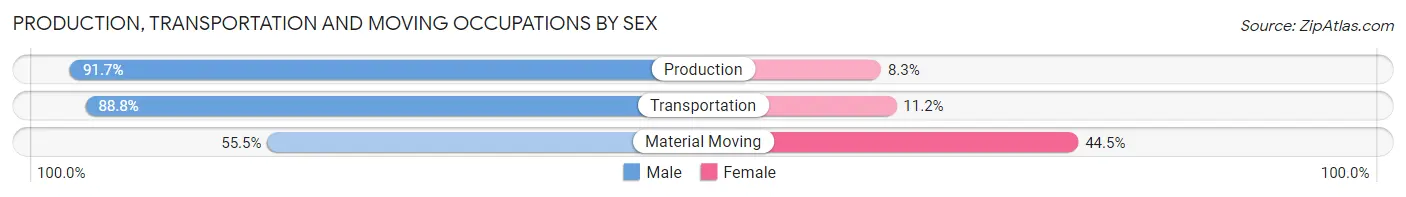
Production, Transportation and Moving Occupations
The most common Production, Transportation and Moving occupations in Terryville are Transportation (197 | 3.7%), Production (156 | 2.9%), and Material Moving (128 | 2.4%).
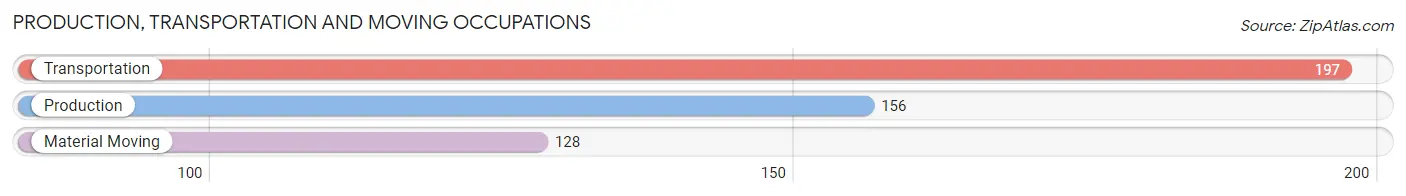
Production, Transportation and Moving Occupations by Sex
| Occupation | Male | Female |
| Production | 143 (91.7%) | 13 (8.3%) |
| Transportation | 175 (88.8%) | 22 (11.2%) |
| Material Moving | 71 (55.5%) | 57 (44.5%) |
| Total (Category) | 389 (80.9%) | 92 (19.1%) |
| Total (Overall) | 2,697 (50.6%) | 2,635 (49.4%) |
Employment Industries by Sex in Terryville
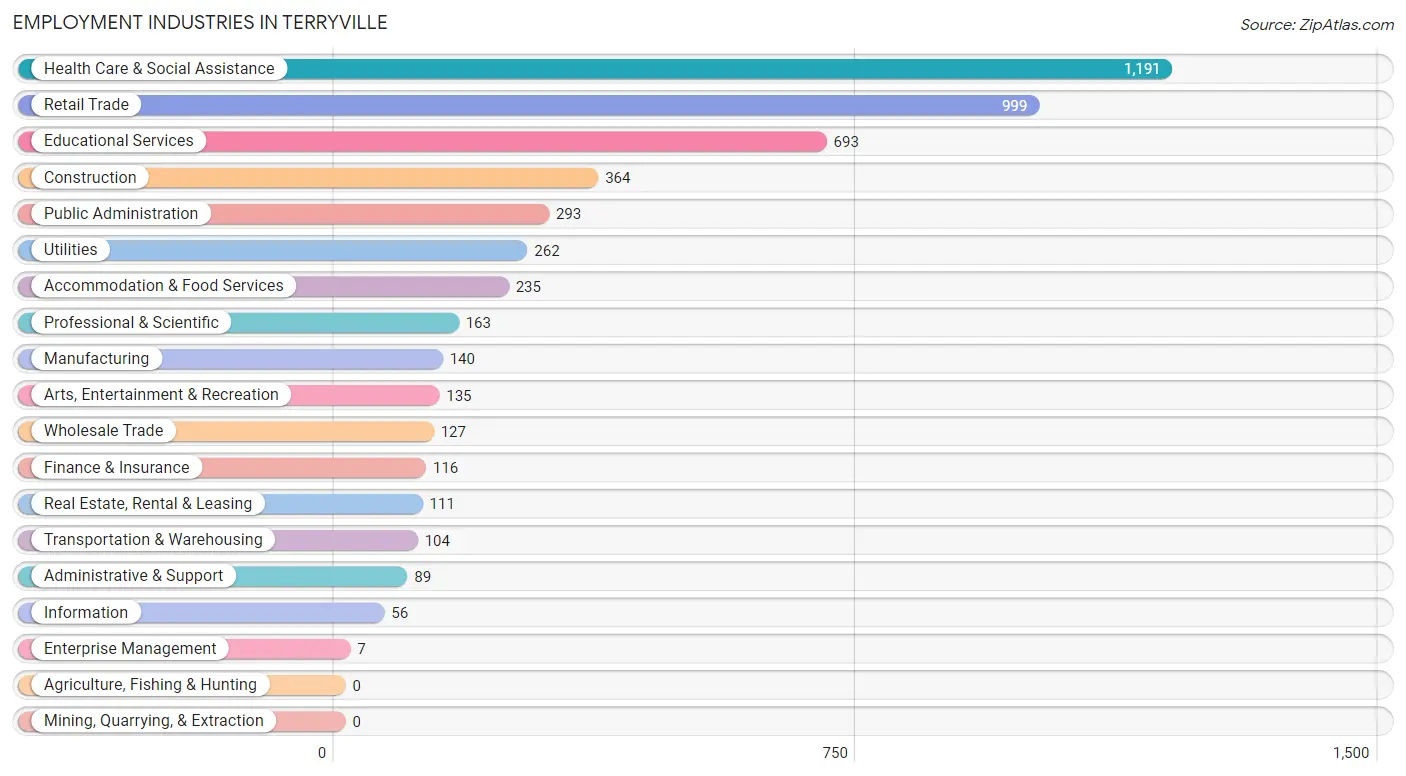
Employment Industries in Terryville
The major employment industries in Terryville include Health Care & Social Assistance (1,191 | 22.3%), Retail Trade (999 | 18.7%), Educational Services (693 | 13.0%), Construction (364 | 6.8%), and Public Administration (293 | 5.5%).
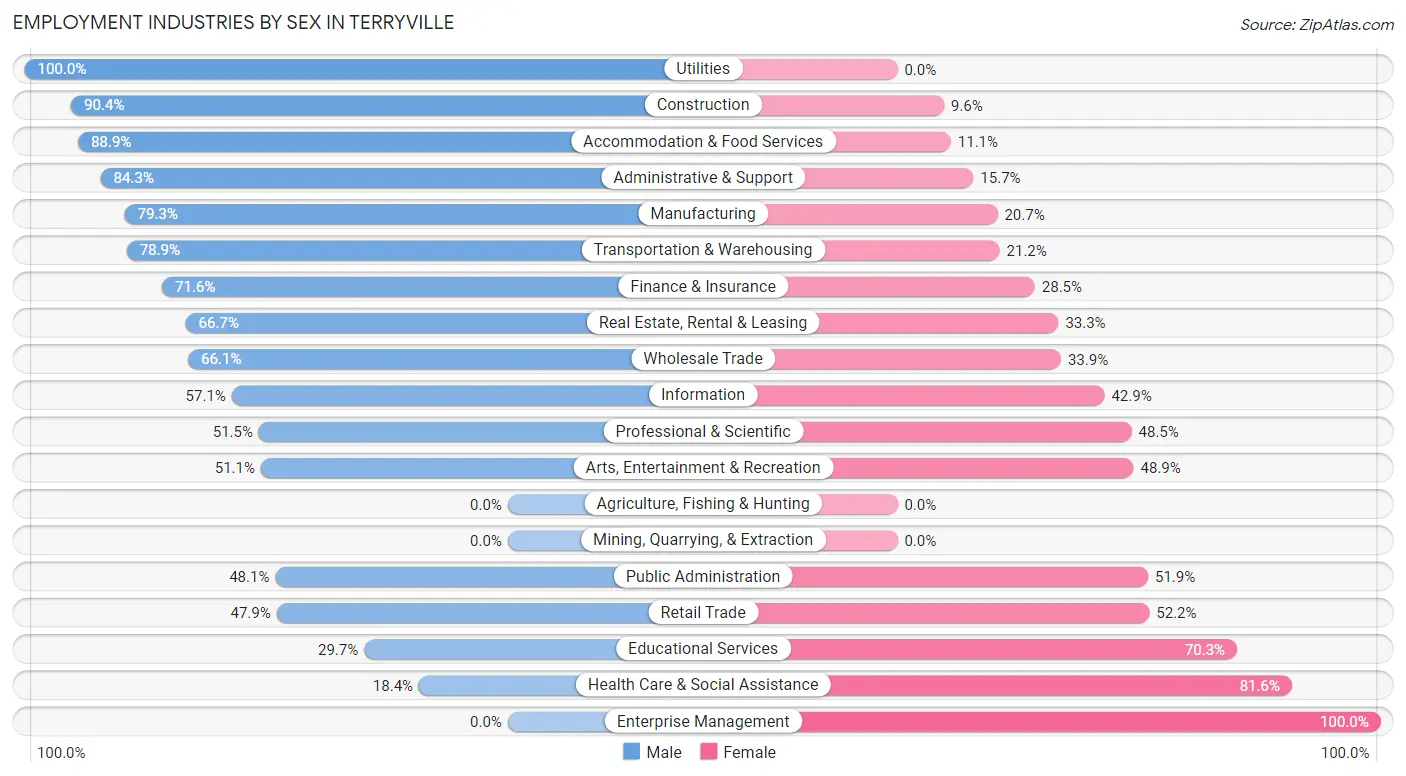
Employment Industries by Sex in Terryville
The Terryville industries that see more men than women are Utilities (100.0%), Construction (90.4%), and Accommodation & Food Services (88.9%), whereas the industries that tend to have a higher number of women are Enterprise Management (100.0%), Health Care & Social Assistance (81.6%), and Educational Services (70.3%).
| Industry | Male | Female |
| Agriculture, Fishing & Hunting | 0 (0.0%) | 0 (0.0%) |
| Mining, Quarrying, & Extraction | 0 (0.0%) | 0 (0.0%) |
| Construction | 329 (90.4%) | 35 (9.6%) |
| Manufacturing | 111 (79.3%) | 29 (20.7%) |
| Wholesale Trade | 84 (66.1%) | 43 (33.9%) |
| Retail Trade | 478 (47.8%) | 521 (52.1%) |
| Transportation & Warehousing | 82 (78.8%) | 22 (21.1%) |
| Utilities | 262 (100.0%) | 0 (0.0%) |
| Information | 32 (57.1%) | 24 (42.9%) |
| Finance & Insurance | 83 (71.6%) | 33 (28.4%) |
| Real Estate, Rental & Leasing | 74 (66.7%) | 37 (33.3%) |
| Professional & Scientific | 84 (51.5%) | 79 (48.5%) |
| Enterprise Management | 0 (0.0%) | 7 (100.0%) |
| Administrative & Support | 75 (84.3%) | 14 (15.7%) |
| Educational Services | 206 (29.7%) | 487 (70.3%) |
| Health Care & Social Assistance | 219 (18.4%) | 972 (81.6%) |
| Arts, Entertainment & Recreation | 69 (51.1%) | 66 (48.9%) |
| Accommodation & Food Services | 209 (88.9%) | 26 (11.1%) |
| Public Administration | 141 (48.1%) | 152 (51.9%) |
| Total | 2,697 (50.6%) | 2,635 (49.4%) |
Education in Terryville
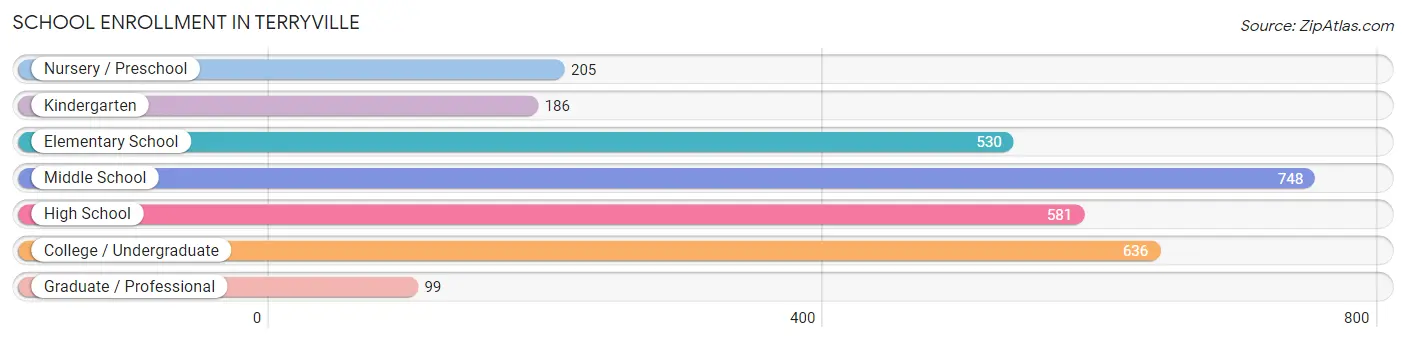
School Enrollment in Terryville
The most common levels of schooling among the 2,985 students in Terryville are middle school (748 | 25.1%), college / undergraduate (636 | 21.3%), and high school (581 | 19.5%).
| School Level | # Students | % Students |
| Nursery / Preschool | 205 | 6.9% |
| Kindergarten | 186 | 6.2% |
| Elementary School | 530 | 17.8% |
| Middle School | 748 | 25.1% |
| High School | 581 | 19.5% |
| College / Undergraduate | 636 | 21.3% |
| Graduate / Professional | 99 | 3.3% |
| Total | 2,985 | 100.0% |
School Enrollment by Age by Funding Source in Terryville
Out of a total of 2,985 students who are enrolled in schools in Terryville, 263 (8.8%) attend a private institution, while the remaining 2,722 (91.2%) are enrolled in public schools. The age group of 20 to 24 year olds has the highest likelihood of being enrolled in private schools, with 194 (59.3% in the age bracket) enrolled. Conversely, the age group of 5 to 9 year old has the lowest likelihood of being enrolled in a private school, with 589 (100.0% in the age bracket) attending a public institution.
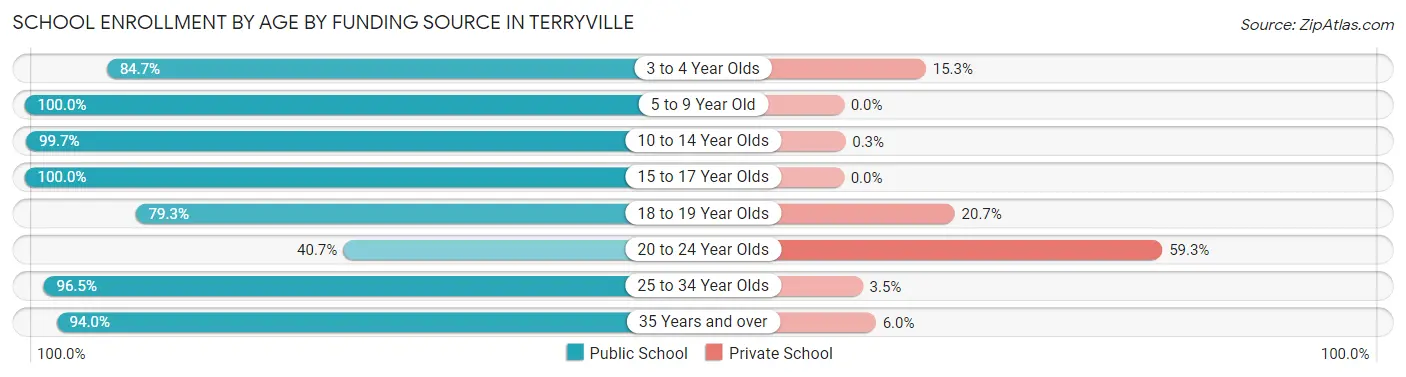
| Age Bracket | Public School | Private School |
| 3 to 4 Year Olds | 155 (84.7%) | 28 (15.3%) |
| 5 to 9 Year Old | 589 (100.0%) | 0 (0.0%) |
| 10 to 14 Year Olds | 992 (99.7%) | 3 (0.3%) |
| 15 to 17 Year Olds | 466 (100.0%) | 0 (0.0%) |
| 18 to 19 Year Olds | 96 (79.3%) | 25 (20.7%) |
| 20 to 24 Year Olds | 133 (40.7%) | 194 (59.3%) |
| 25 to 34 Year Olds | 164 (96.5%) | 6 (3.5%) |
| 35 Years and over | 126 (94.0%) | 8 (6.0%) |
| Total | 2,722 (91.2%) | 263 (8.8%) |
Educational Attainment by Field of Study in Terryville
Business (457 | 17.6%), education (382 | 14.7%), science & technology (239 | 9.2%), computers & mathematics (198 | 7.6%), and bio, nature & agricultural (198 | 7.6%) are the most common fields of study among 2,591 individuals in Terryville who have obtained a bachelor's degree or higher.
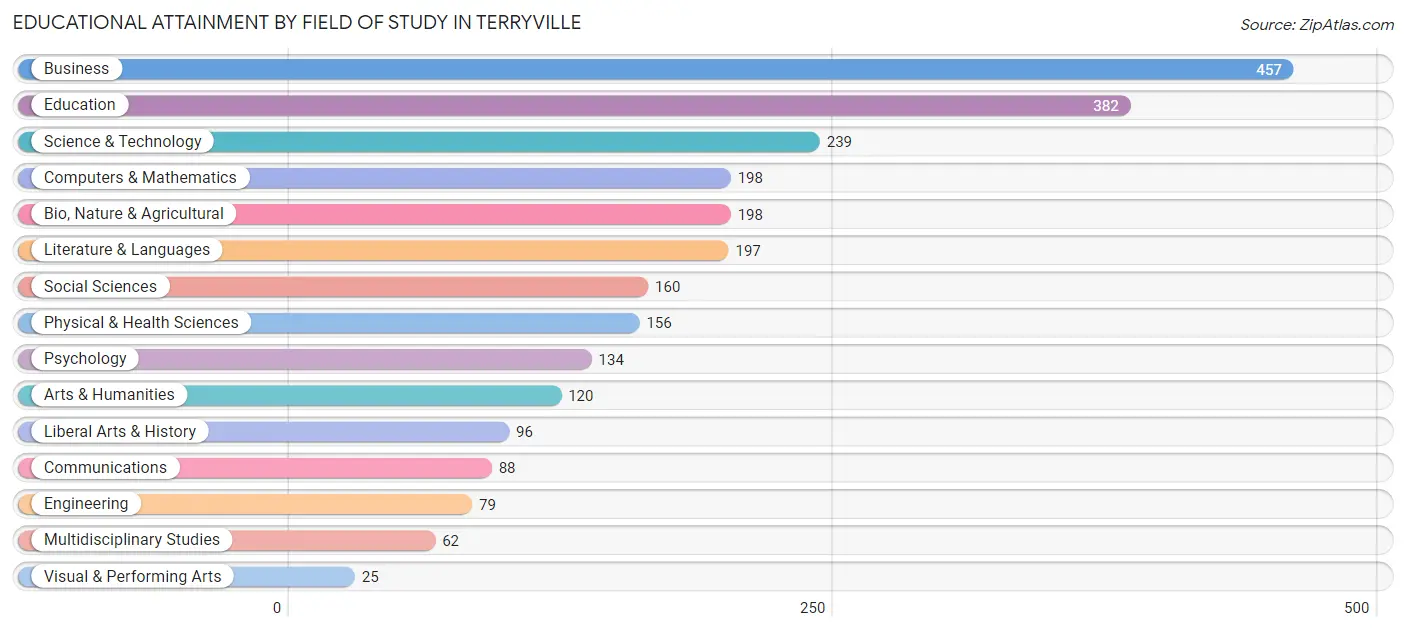
| Field of Study | # Graduates | % Graduates |
| Computers & Mathematics | 198 | 7.6% |
| Bio, Nature & Agricultural | 198 | 7.6% |
| Physical & Health Sciences | 156 | 6.0% |
| Psychology | 134 | 5.2% |
| Social Sciences | 160 | 6.2% |
| Engineering | 79 | 3.0% |
| Multidisciplinary Studies | 62 | 2.4% |
| Science & Technology | 239 | 9.2% |
| Business | 457 | 17.6% |
| Education | 382 | 14.7% |
| Literature & Languages | 197 | 7.6% |
| Liberal Arts & History | 96 | 3.7% |
| Visual & Performing Arts | 25 | 1.0% |
| Communications | 88 | 3.4% |
| Arts & Humanities | 120 | 4.6% |
| Total | 2,591 | 100.0% |
Transportation & Commute in Terryville
Vehicle Availability by Sex in Terryville
The most prevalent vehicle ownership categories in Terryville are males with 2 vehicles (1,070, accounting for 40.7%) and females with 2 vehicles (901, making up 41.4%).
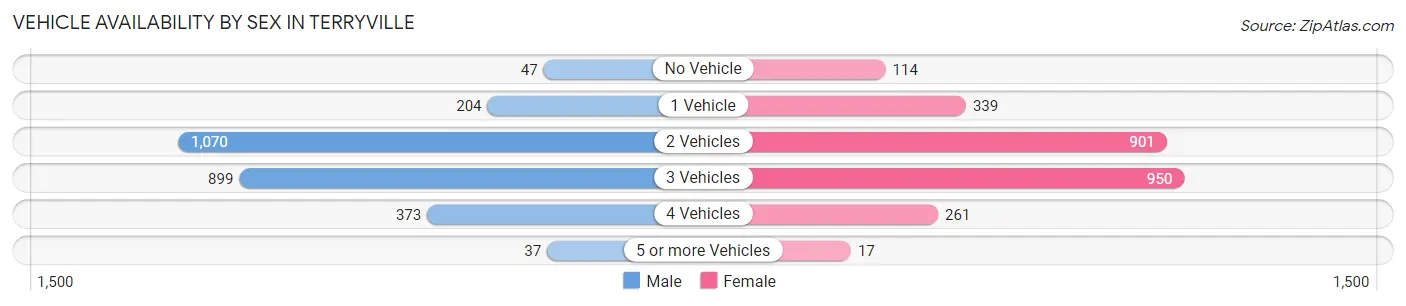
| Vehicles Available | Male | Female |
| No Vehicle | 47 (1.8%) | 114 (4.4%) |
| 1 Vehicle | 204 (7.8%) | 339 (13.1%) |
| 2 Vehicles | 1,070 (40.7%) | 901 (34.9%) |
| 3 Vehicles | 899 (34.2%) | 950 (36.8%) |
| 4 Vehicles | 373 (14.2%) | 261 (10.1%) |
| 5 or more Vehicles | 37 (1.4%) | 17 (0.7%) |
| Total | 2,630 (100.0%) | 2,582 (100.0%) |
Commute Time in Terryville
The most frequently occuring commute durations in Terryville are 30 to 34 minutes (705 commuters, 14.1%), 5 to 9 minutes (694 commuters, 13.9%), and 60 to 89 minutes (693 commuters, 13.9%).
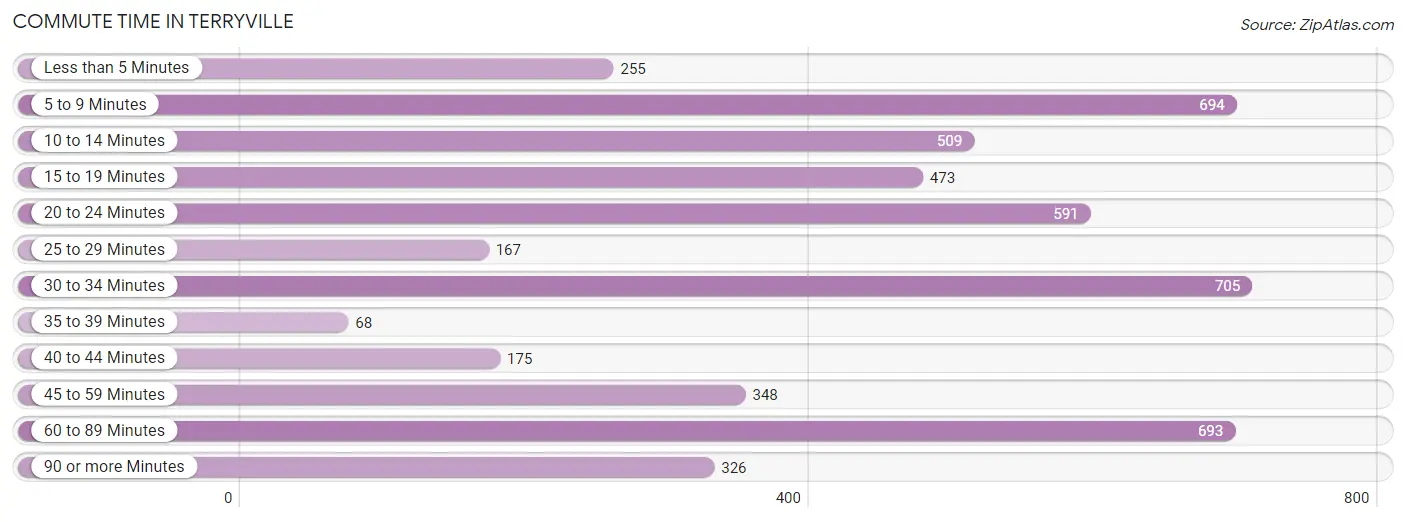
| Commute Time | # Commuters | % Commuters |
| Less than 5 Minutes | 255 | 5.1% |
| 5 to 9 Minutes | 694 | 13.9% |
| 10 to 14 Minutes | 509 | 10.2% |
| 15 to 19 Minutes | 473 | 9.5% |
| 20 to 24 Minutes | 591 | 11.8% |
| 25 to 29 Minutes | 167 | 3.3% |
| 30 to 34 Minutes | 705 | 14.1% |
| 35 to 39 Minutes | 68 | 1.4% |
| 40 to 44 Minutes | 175 | 3.5% |
| 45 to 59 Minutes | 348 | 7.0% |
| 60 to 89 Minutes | 693 | 13.9% |
| 90 or more Minutes | 326 | 6.5% |
Commute Time by Sex in Terryville
The most common commute times in Terryville are 60 to 89 minutes (580 commuters, 22.7%) for males and 5 to 9 minutes (363 commuters, 14.8%) for females.
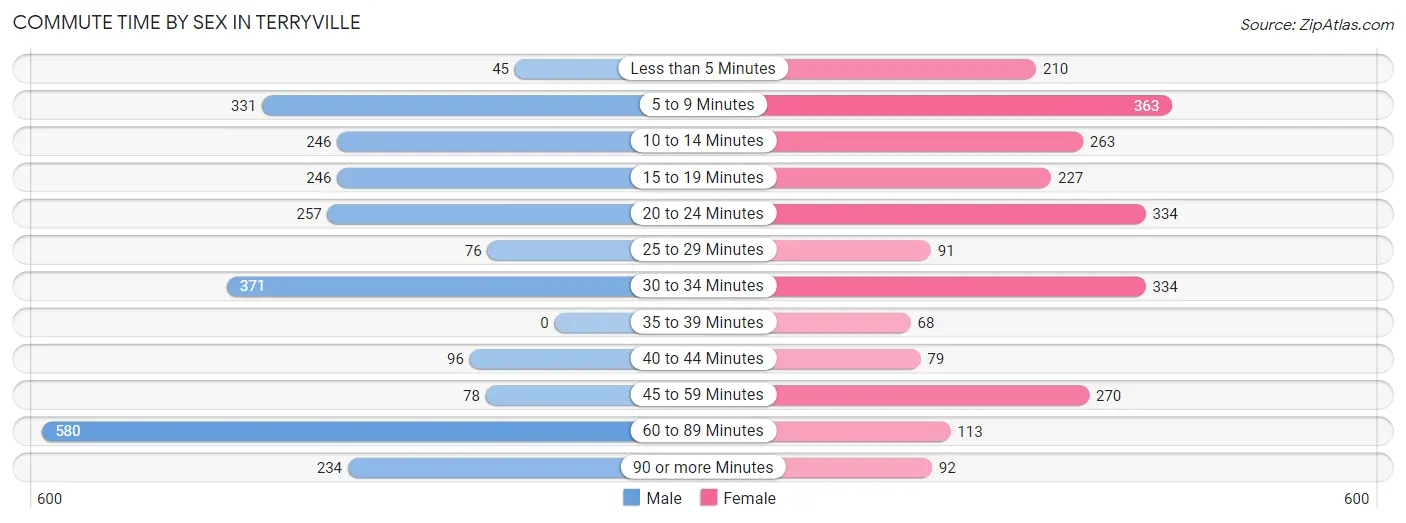
| Commute Time | Male | Female |
| Less than 5 Minutes | 45 (1.8%) | 210 (8.6%) |
| 5 to 9 Minutes | 331 (12.9%) | 363 (14.8%) |
| 10 to 14 Minutes | 246 (9.6%) | 263 (10.8%) |
| 15 to 19 Minutes | 246 (9.6%) | 227 (9.3%) |
| 20 to 24 Minutes | 257 (10.0%) | 334 (13.7%) |
| 25 to 29 Minutes | 76 (3.0%) | 91 (3.7%) |
| 30 to 34 Minutes | 371 (14.5%) | 334 (13.7%) |
| 35 to 39 Minutes | 0 (0.0%) | 68 (2.8%) |
| 40 to 44 Minutes | 96 (3.7%) | 79 (3.2%) |
| 45 to 59 Minutes | 78 (3.0%) | 270 (11.1%) |
| 60 to 89 Minutes | 580 (22.7%) | 113 (4.6%) |
| 90 or more Minutes | 234 (9.1%) | 92 (3.8%) |
Time of Departure to Work by Sex in Terryville
The most frequent times of departure to work in Terryville are 7:30 AM to 7:59 AM (320, 12.5%) for males and 8:00 AM to 8:29 AM (441, 18.0%) for females.
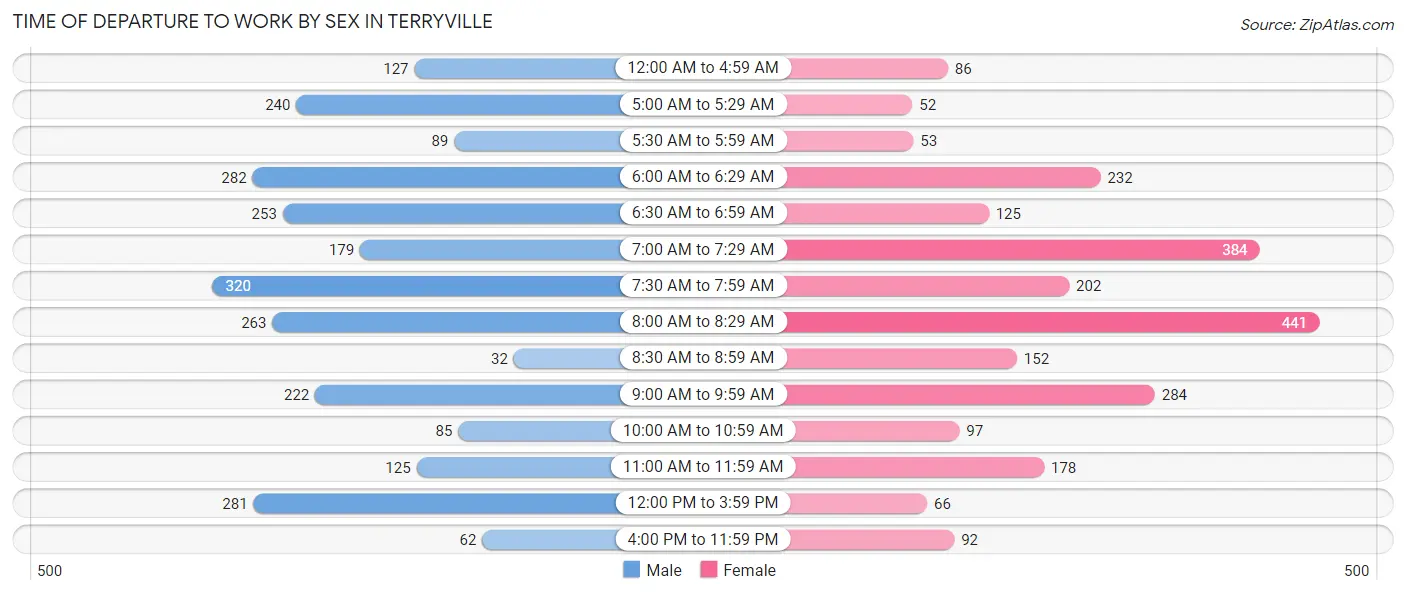
| Time of Departure | Male | Female |
| 12:00 AM to 4:59 AM | 127 (5.0%) | 86 (3.5%) |
| 5:00 AM to 5:29 AM | 240 (9.4%) | 52 (2.1%) |
| 5:30 AM to 5:59 AM | 89 (3.5%) | 53 (2.2%) |
| 6:00 AM to 6:29 AM | 282 (11.0%) | 232 (9.5%) |
| 6:30 AM to 6:59 AM | 253 (9.9%) | 125 (5.1%) |
| 7:00 AM to 7:29 AM | 179 (7.0%) | 384 (15.7%) |
| 7:30 AM to 7:59 AM | 320 (12.5%) | 202 (8.3%) |
| 8:00 AM to 8:29 AM | 263 (10.3%) | 441 (18.0%) |
| 8:30 AM to 8:59 AM | 32 (1.3%) | 152 (6.2%) |
| 9:00 AM to 9:59 AM | 222 (8.7%) | 284 (11.6%) |
| 10:00 AM to 10:59 AM | 85 (3.3%) | 97 (4.0%) |
| 11:00 AM to 11:59 AM | 125 (4.9%) | 178 (7.3%) |
| 12:00 PM to 3:59 PM | 281 (11.0%) | 66 (2.7%) |
| 4:00 PM to 11:59 PM | 62 (2.4%) | 92 (3.8%) |
| Total | 2,560 (100.0%) | 2,444 (100.0%) |
Housing Occupancy in Terryville
Occupancy by Ownership in Terryville
Of the total 3,820 dwellings in Terryville, owner-occupied units account for 2,917 (76.4%), while renter-occupied units make up 903 (23.6%).
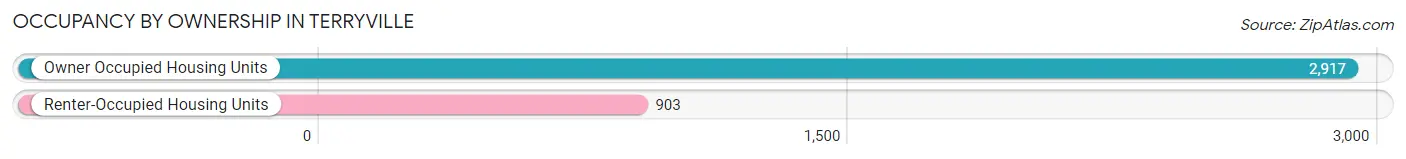
| Occupancy | # Housing Units | % Housing Units |
| Owner Occupied Housing Units | 2,917 | 76.4% |
| Renter-Occupied Housing Units | 903 | 23.6% |
| Total Occupied Housing Units | 3,820 | 100.0% |
Occupancy by Household Size in Terryville
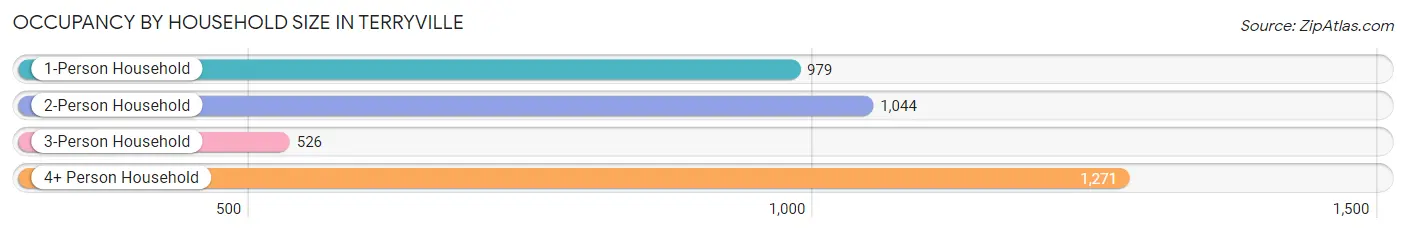
| Household Size | # Housing Units | % Housing Units |
| 1-Person Household | 979 | 25.6% |
| 2-Person Household | 1,044 | 27.3% |
| 3-Person Household | 526 | 13.8% |
| 4+ Person Household | 1,271 | 33.3% |
| Total Housing Units | 3,820 | 100.0% |
Occupancy by Ownership by Household Size in Terryville
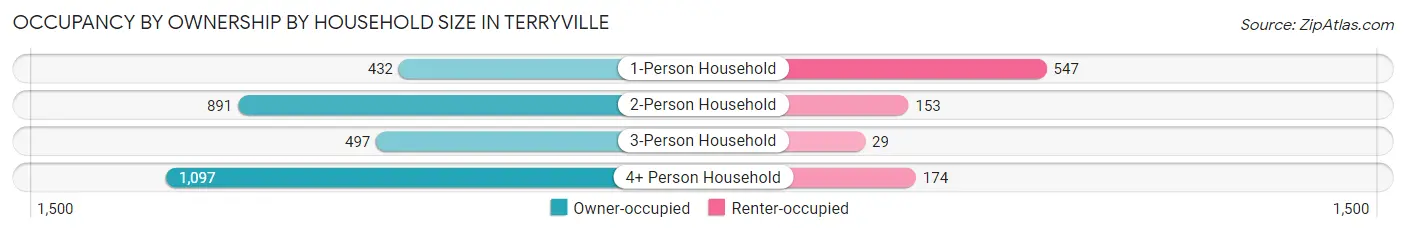
| Household Size | Owner-occupied | Renter-occupied |
| 1-Person Household | 432 (44.1%) | 547 (55.9%) |
| 2-Person Household | 891 (85.3%) | 153 (14.7%) |
| 3-Person Household | 497 (94.5%) | 29 (5.5%) |
| 4+ Person Household | 1,097 (86.3%) | 174 (13.7%) |
| Total Housing Units | 2,917 (76.4%) | 903 (23.6%) |
Occupancy by Educational Attainment in Terryville
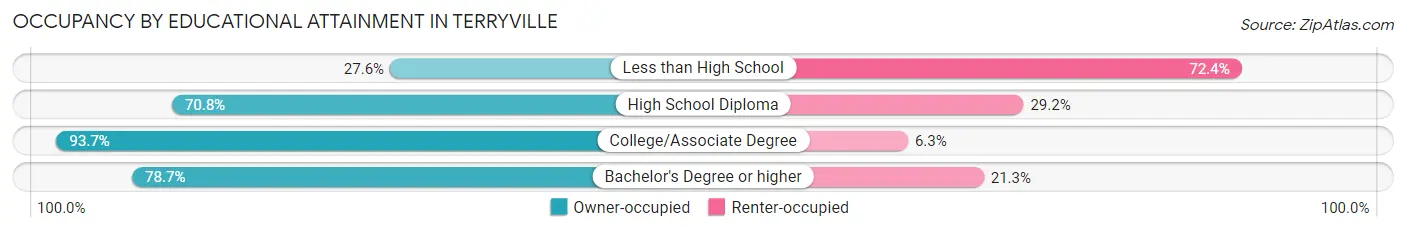
| Household Size | Owner-occupied | Renter-occupied |
| Less than High School | 75 (27.6%) | 197 (72.4%) |
| High School Diploma | 870 (70.8%) | 359 (29.2%) |
| College/Associate Degree | 921 (93.7%) | 62 (6.3%) |
| Bachelor's Degree or higher | 1,051 (78.7%) | 285 (21.3%) |
Occupancy by Age of Householder in Terryville
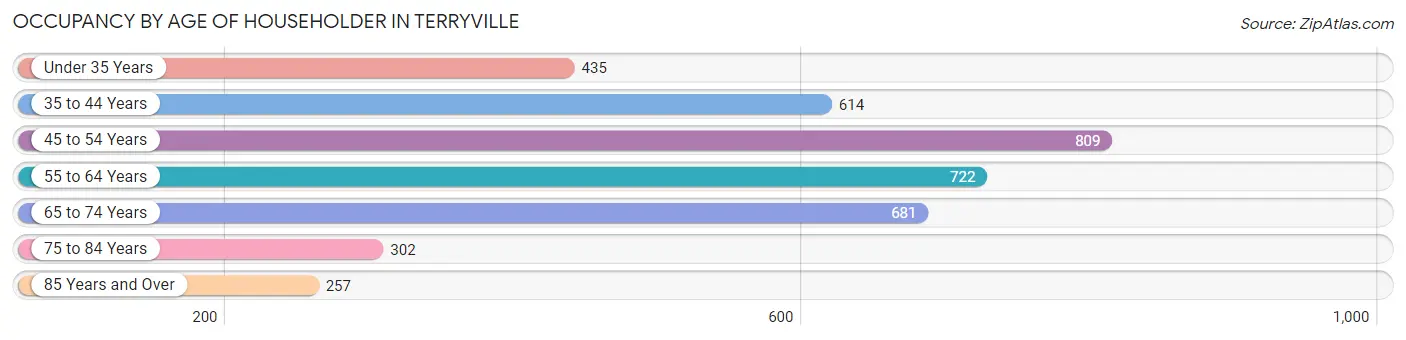
| Age Bracket | # Households | % Households |
| Under 35 Years | 435 | 11.4% |
| 35 to 44 Years | 614 | 16.1% |
| 45 to 54 Years | 809 | 21.2% |
| 55 to 64 Years | 722 | 18.9% |
| 65 to 74 Years | 681 | 17.8% |
| 75 to 84 Years | 302 | 7.9% |
| 85 Years and Over | 257 | 6.7% |
| Total | 3,820 | 100.0% |
Housing Finances in Terryville
Median Income by Occupancy in Terryville
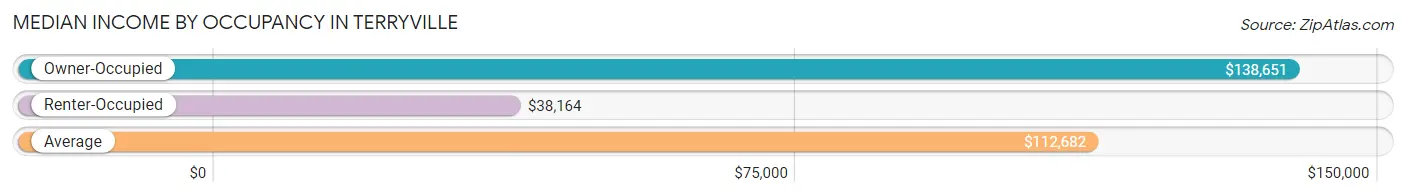
| Occupancy Type | # Households | Median Income |
| Owner-Occupied | 2,917 (76.4%) | $138,651 |
| Renter-Occupied | 903 (23.6%) | $38,164 |
| Average | 3,820 (100.0%) | $112,682 |
Occupancy by Householder Income Bracket in Terryville
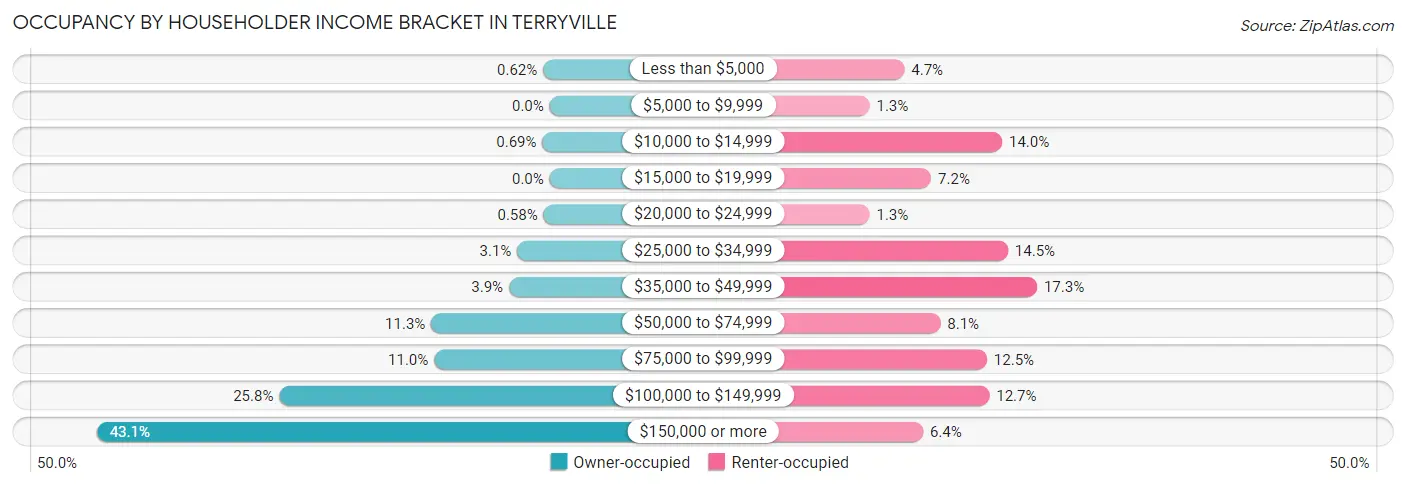
| Income Bracket | Owner-occupied | Renter-occupied |
| Less than $5,000 | 18 (0.6%) | 42 (4.6%) |
| $5,000 to $9,999 | 0 (0.0%) | 12 (1.3%) |
| $10,000 to $14,999 | 20 (0.7%) | 126 (14.0%) |
| $15,000 to $19,999 | 0 (0.0%) | 65 (7.2%) |
| $20,000 to $24,999 | 17 (0.6%) | 12 (1.3%) |
| $25,000 to $34,999 | 90 (3.1%) | 131 (14.5%) |
| $35,000 to $49,999 | 113 (3.9%) | 156 (17.3%) |
| $50,000 to $74,999 | 329 (11.3%) | 73 (8.1%) |
| $75,000 to $99,999 | 321 (11.0%) | 113 (12.5%) |
| $100,000 to $149,999 | 751 (25.8%) | 115 (12.7%) |
| $150,000 or more | 1,258 (43.1%) | 58 (6.4%) |
| Total | 2,917 (100.0%) | 903 (100.0%) |
Monthly Housing Cost Tiers in Terryville
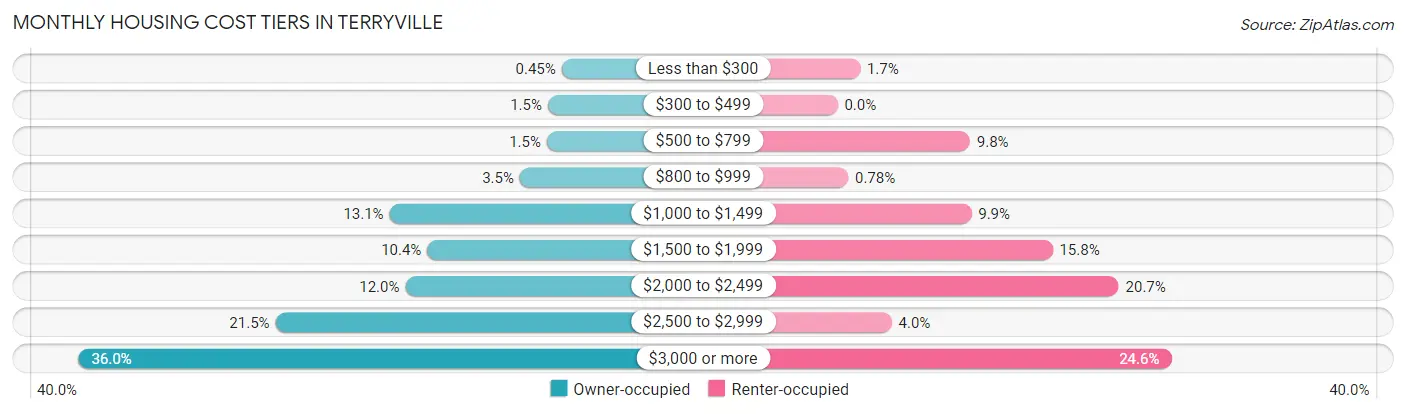
| Monthly Cost | Owner-occupied | Renter-occupied |
| Less than $300 | 13 (0.4%) | 15 (1.7%) |
| $300 to $499 | 43 (1.5%) | 0 (0.0%) |
| $500 to $799 | 45 (1.5%) | 88 (9.8%) |
| $800 to $999 | 103 (3.5%) | 7 (0.8%) |
| $1,000 to $1,499 | 383 (13.1%) | 89 (9.9%) |
| $1,500 to $1,999 | 302 (10.3%) | 143 (15.8%) |
| $2,000 to $2,499 | 349 (12.0%) | 187 (20.7%) |
| $2,500 to $2,999 | 628 (21.5%) | 36 (4.0%) |
| $3,000 or more | 1,051 (36.0%) | 222 (24.6%) |
| Total | 2,917 (100.0%) | 903 (100.0%) |
Physical Housing Characteristics in Terryville
Housing Structures in Terryville
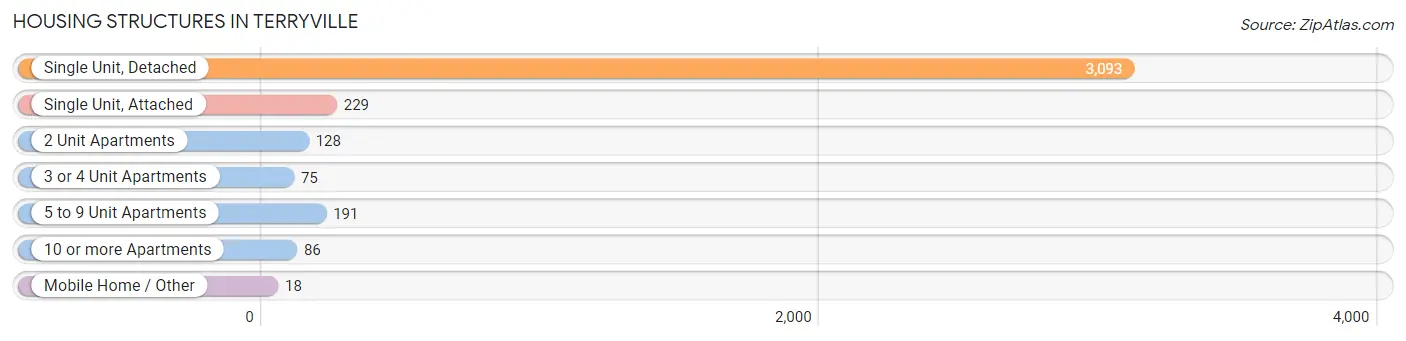
| Structure Type | # Housing Units | % Housing Units |
| Single Unit, Detached | 3,093 | 81.0% |
| Single Unit, Attached | 229 | 6.0% |
| 2 Unit Apartments | 128 | 3.4% |
| 3 or 4 Unit Apartments | 75 | 2.0% |
| 5 to 9 Unit Apartments | 191 | 5.0% |
| 10 or more Apartments | 86 | 2.2% |
| Mobile Home / Other | 18 | 0.5% |
| Total | 3,820 | 100.0% |
Housing Structures by Occupancy in Terryville
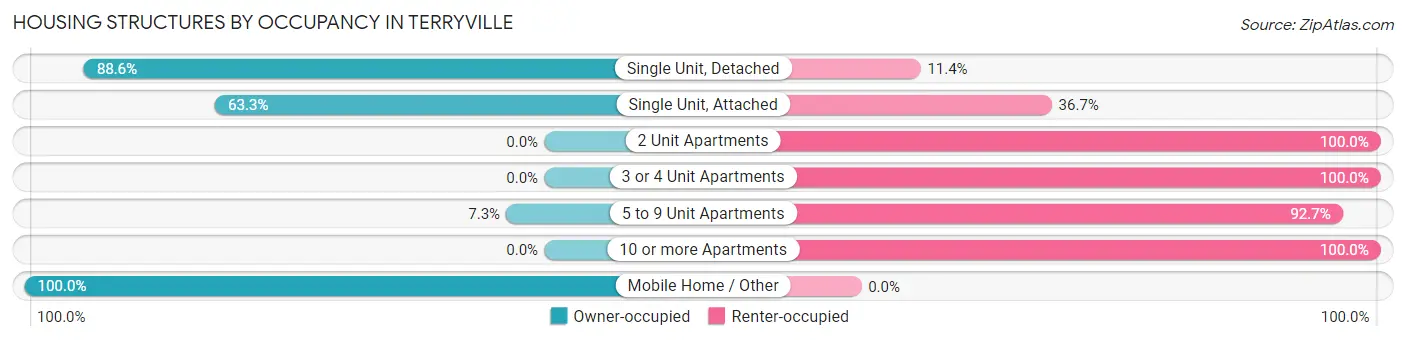
| Structure Type | Owner-occupied | Renter-occupied |
| Single Unit, Detached | 2,740 (88.6%) | 353 (11.4%) |
| Single Unit, Attached | 145 (63.3%) | 84 (36.7%) |
| 2 Unit Apartments | 0 (0.0%) | 128 (100.0%) |
| 3 or 4 Unit Apartments | 0 (0.0%) | 75 (100.0%) |
| 5 to 9 Unit Apartments | 14 (7.3%) | 177 (92.7%) |
| 10 or more Apartments | 0 (0.0%) | 86 (100.0%) |
| Mobile Home / Other | 18 (100.0%) | 0 (0.0%) |
| Total | 2,917 (76.4%) | 903 (23.6%) |
Housing Structures by Number of Rooms in Terryville
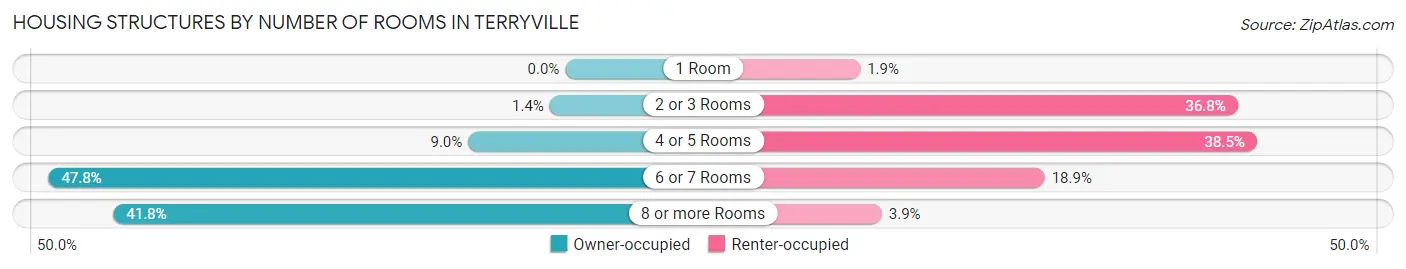
| Number of Rooms | Owner-occupied | Renter-occupied |
| 1 Room | 0 (0.0%) | 17 (1.9%) |
| 2 or 3 Rooms | 42 (1.4%) | 332 (36.8%) |
| 4 or 5 Rooms | 262 (9.0%) | 348 (38.5%) |
| 6 or 7 Rooms | 1,394 (47.8%) | 171 (18.9%) |
| 8 or more Rooms | 1,219 (41.8%) | 35 (3.9%) |
| Total | 2,917 (100.0%) | 903 (100.0%) |
Housing Structure by Heating Type in Terryville
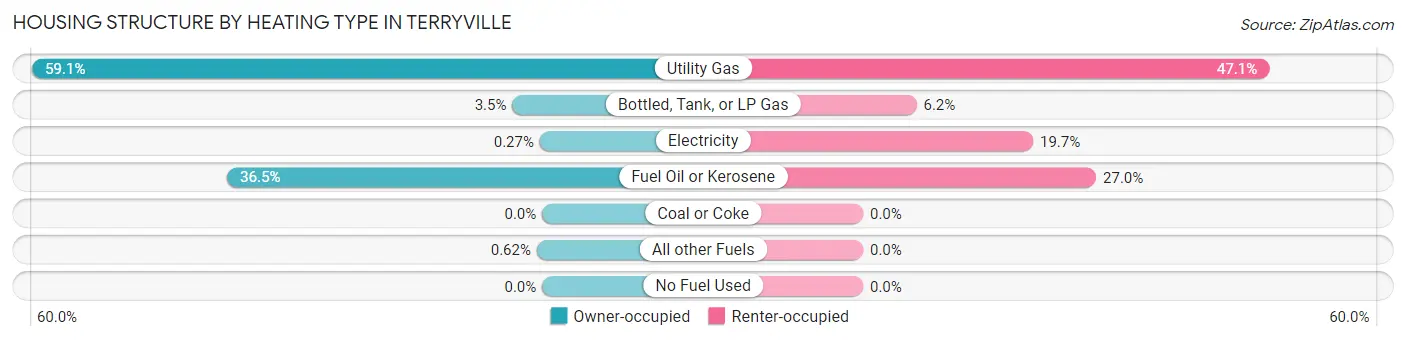
| Heating Type | Owner-occupied | Renter-occupied |
| Utility Gas | 1,725 (59.1%) | 425 (47.1%) |
| Bottled, Tank, or LP Gas | 101 (3.5%) | 56 (6.2%) |
| Electricity | 8 (0.3%) | 178 (19.7%) |
| Fuel Oil or Kerosene | 1,065 (36.5%) | 244 (27.0%) |
| Coal or Coke | 0 (0.0%) | 0 (0.0%) |
| All other Fuels | 18 (0.6%) | 0 (0.0%) |
| No Fuel Used | 0 (0.0%) | 0 (0.0%) |
| Total | 2,917 (100.0%) | 903 (100.0%) |
Household Vehicle Usage in Terryville
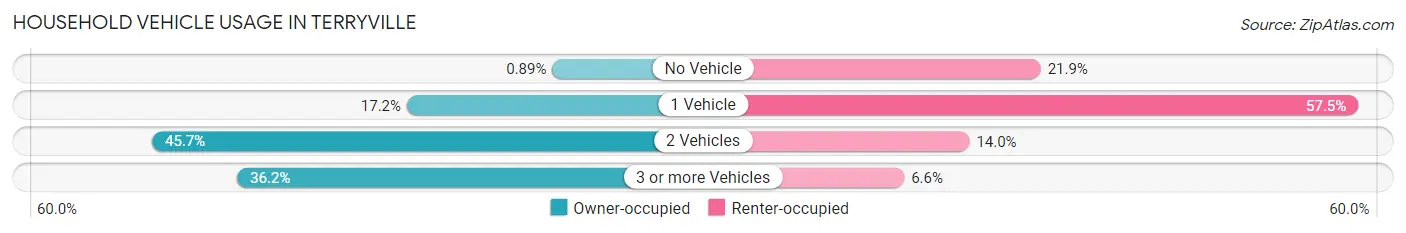
| Vehicles per Household | Owner-occupied | Renter-occupied |
| No Vehicle | 26 (0.9%) | 198 (21.9%) |
| 1 Vehicle | 501 (17.2%) | 519 (57.5%) |
| 2 Vehicles | 1,334 (45.7%) | 126 (14.0%) |
| 3 or more Vehicles | 1,056 (36.2%) | 60 (6.6%) |
| Total | 2,917 (100.0%) | 903 (100.0%) |
Real Estate & Mortgages in Terryville
Real Estate and Mortgage Overview in Terryville
| Characteristic | Without Mortgage | With Mortgage |
| Housing Units | 711 | 2,206 |
| Median Property Value | $410,300 | $442,100 |
| Median Household Income | $87,373 | $1,085 |
| Monthly Housing Costs | $1,340 | $1,038 |
| Real Estate Taxes | $10,001 | $80 |
Property Value by Mortgage Status in Terryville
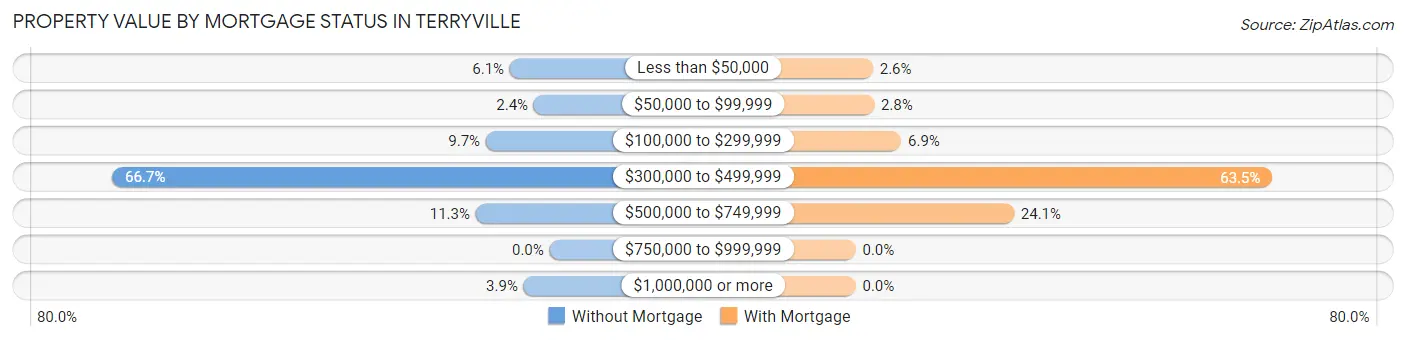
| Property Value | Without Mortgage | With Mortgage |
| Less than $50,000 | 43 (6.0%) | 58 (2.6%) |
| $50,000 to $99,999 | 17 (2.4%) | 62 (2.8%) |
| $100,000 to $299,999 | 69 (9.7%) | 153 (6.9%) |
| $300,000 to $499,999 | 474 (66.7%) | 1,401 (63.5%) |
| $500,000 to $749,999 | 80 (11.3%) | 532 (24.1%) |
| $750,000 to $999,999 | 0 (0.0%) | 0 (0.0%) |
| $1,000,000 or more | 28 (3.9%) | 0 (0.0%) |
| Total | 711 (100.0%) | 2,206 (100.0%) |
Household Income by Mortgage Status in Terryville
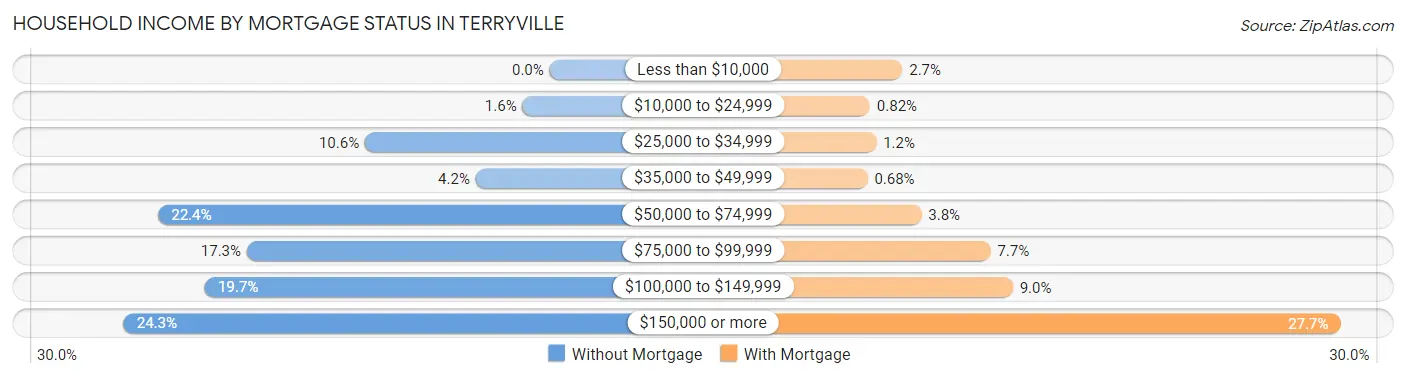
| Household Income | Without Mortgage | With Mortgage |
| Less than $10,000 | 0 (0.0%) | 59 (2.7%) |
| $10,000 to $24,999 | 11 (1.5%) | 18 (0.8%) |
| $25,000 to $34,999 | 75 (10.5%) | 26 (1.2%) |
| $35,000 to $49,999 | 30 (4.2%) | 15 (0.7%) |
| $50,000 to $74,999 | 159 (22.4%) | 83 (3.8%) |
| $75,000 to $99,999 | 123 (17.3%) | 170 (7.7%) |
| $100,000 to $149,999 | 140 (19.7%) | 198 (9.0%) |
| $150,000 or more | 173 (24.3%) | 611 (27.7%) |
| Total | 711 (100.0%) | 2,206 (100.0%) |
Property Value to Household Income Ratio in Terryville
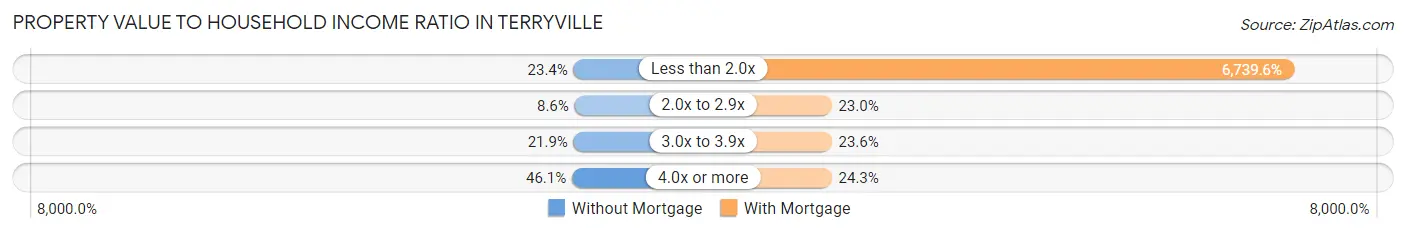
| Value-to-Income Ratio | Without Mortgage | With Mortgage |
| Less than 2.0x | 166 (23.4%) | 148,676 (6,739.6%) |
| 2.0x to 2.9x | 61 (8.6%) | 507 (23.0%) |
| 3.0x to 3.9x | 156 (21.9%) | 521 (23.6%) |
| 4.0x or more | 328 (46.1%) | 536 (24.3%) |
| Total | 711 (100.0%) | 2,206 (100.0%) |
Real Estate Taxes by Mortgage Status in Terryville
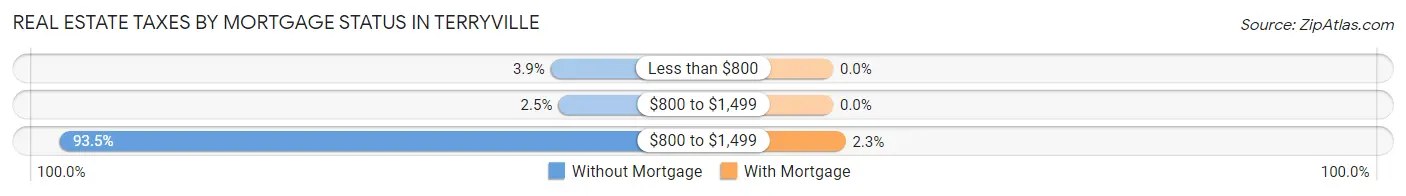
| Property Taxes | Without Mortgage | With Mortgage |
| Less than $800 | 28 (3.9%) | 0 (0.0%) |
| $800 to $1,499 | 18 (2.5%) | 0 (0.0%) |
| $800 to $1,499 | 665 (93.5%) | 50 (2.3%) |
| Total | 711 (100.0%) | 2,206 (100.0%) |
Health & Disability in Terryville
Health Insurance Coverage by Age in Terryville
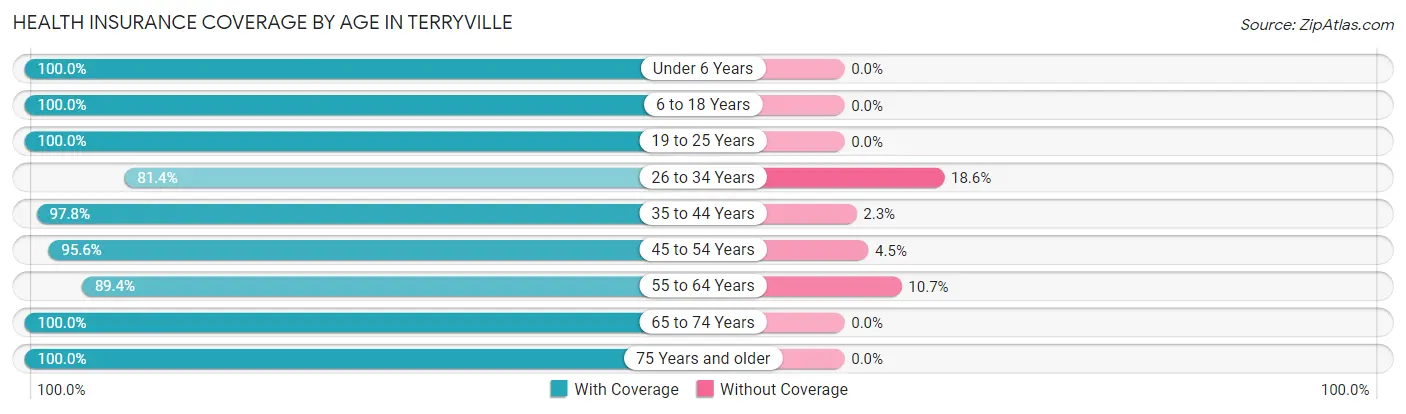
| Age Bracket | With Coverage | Without Coverage |
| Under 6 Years | 619 (100.0%) | 0 (0.0%) |
| 6 to 18 Years | 1,937 (100.0%) | 0 (0.0%) |
| 19 to 25 Years | 1,006 (100.0%) | 0 (0.0%) |
| 26 to 34 Years | 893 (81.4%) | 204 (18.6%) |
| 35 to 44 Years | 1,477 (97.8%) | 34 (2.2%) |
| 45 to 54 Years | 1,160 (95.6%) | 54 (4.4%) |
| 55 to 64 Years | 1,543 (89.3%) | 184 (10.6%) |
| 65 to 74 Years | 895 (100.0%) | 0 (0.0%) |
| 75 Years and older | 820 (100.0%) | 0 (0.0%) |
| Total | 10,350 (95.6%) | 476 (4.4%) |
Health Insurance Coverage by Citizenship Status in Terryville
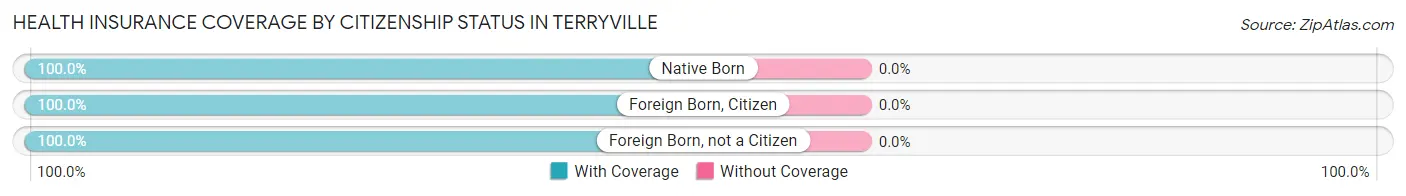
| Citizenship Status | With Coverage | Without Coverage |
| Native Born | 619 (100.0%) | 0 (0.0%) |
| Foreign Born, Citizen | 1,937 (100.0%) | 0 (0.0%) |
| Foreign Born, not a Citizen | 1,006 (100.0%) | 0 (0.0%) |
Health Insurance Coverage by Household Income in Terryville
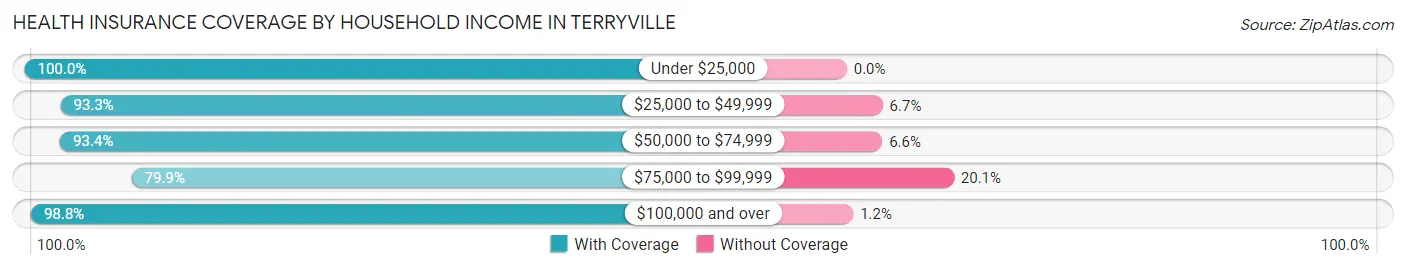
| Household Income | With Coverage | Without Coverage |
| Under $25,000 | 347 (100.0%) | 0 (0.0%) |
| $25,000 to $49,999 | 625 (93.3%) | 45 (6.7%) |
| $50,000 to $74,999 | 801 (93.4%) | 57 (6.6%) |
| $75,000 to $99,999 | 1,132 (79.9%) | 284 (20.1%) |
| $100,000 and over | 7,379 (98.8%) | 90 (1.2%) |
Public vs Private Health Insurance Coverage by Age in Terryville
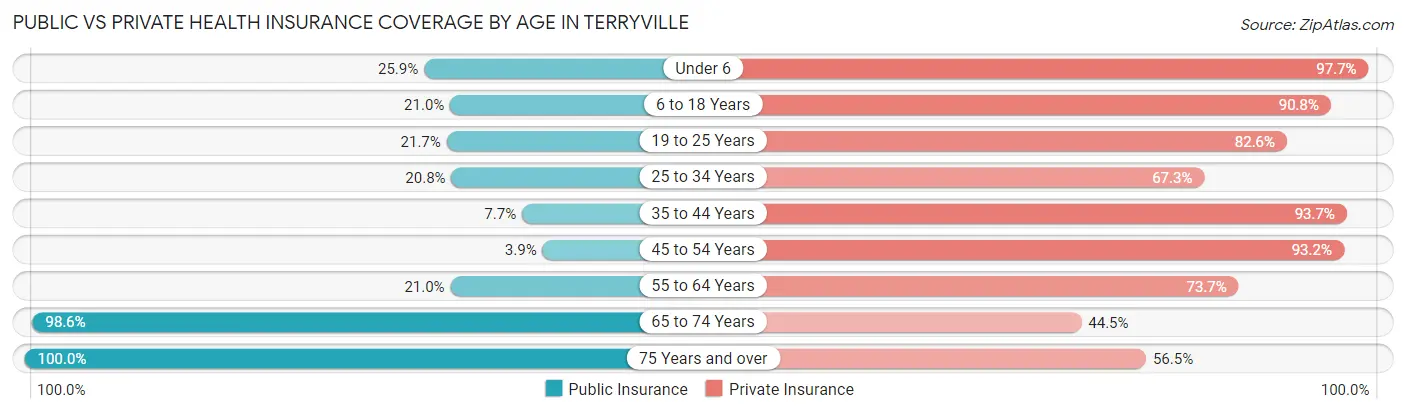
| Age Bracket | Public Insurance | Private Insurance |
| Under 6 | 160 (25.9%) | 605 (97.7%) |
| 6 to 18 Years | 407 (21.0%) | 1,758 (90.8%) |
| 19 to 25 Years | 218 (21.7%) | 831 (82.6%) |
| 25 to 34 Years | 228 (20.8%) | 738 (67.3%) |
| 35 to 44 Years | 116 (7.7%) | 1,416 (93.7%) |
| 45 to 54 Years | 47 (3.9%) | 1,131 (93.2%) |
| 55 to 64 Years | 362 (21.0%) | 1,272 (73.7%) |
| 65 to 74 Years | 882 (98.6%) | 398 (44.5%) |
| 75 Years and over | 820 (100.0%) | 463 (56.5%) |
| Total | 3,240 (29.9%) | 8,612 (79.5%) |
Disability Status by Sex by Age in Terryville
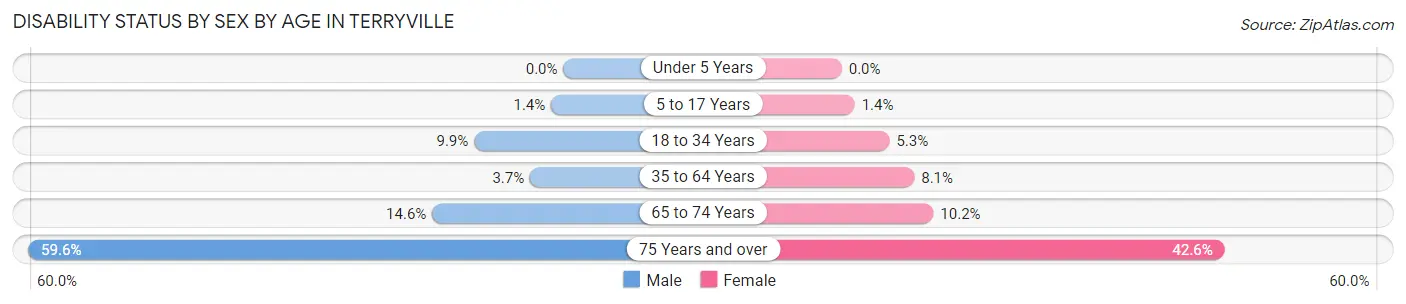
| Age Bracket | Male | Female |
| Under 5 Years | 0 (0.0%) | 0 (0.0%) |
| 5 to 17 Years | 14 (1.4%) | 15 (1.4%) |
| 18 to 34 Years | 84 (9.9%) | 68 (5.3%) |
| 35 to 64 Years | 83 (3.7%) | 179 (8.1%) |
| 65 to 74 Years | 52 (14.6%) | 55 (10.2%) |
| 75 Years and over | 149 (59.6%) | 243 (42.6%) |
Disability Class by Sex by Age in Terryville
Disability Class: Hearing Difficulty
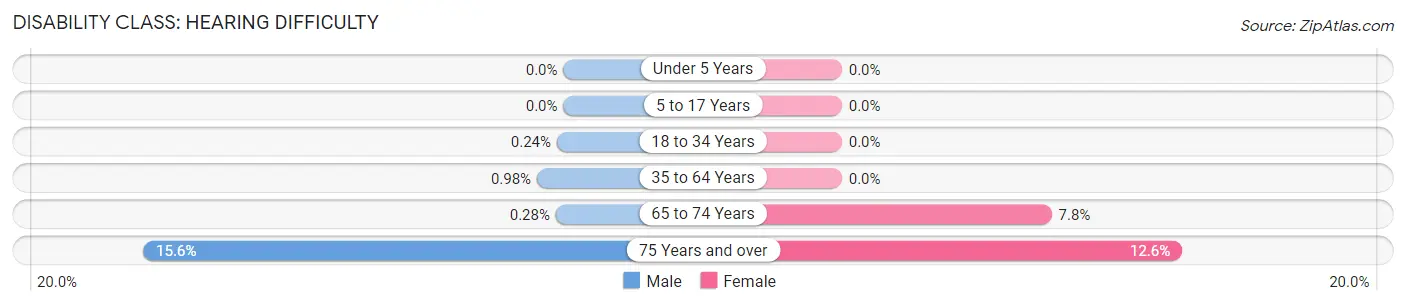
| Age Bracket | Male | Female |
| Under 5 Years | 0 (0.0%) | 0 (0.0%) |
| 5 to 17 Years | 0 (0.0%) | 0 (0.0%) |
| 18 to 34 Years | 2 (0.2%) | 0 (0.0%) |
| 35 to 64 Years | 22 (1.0%) | 0 (0.0%) |
| 65 to 74 Years | 1 (0.3%) | 42 (7.8%) |
| 75 Years and over | 39 (15.6%) | 72 (12.6%) |
Disability Class: Vision Difficulty
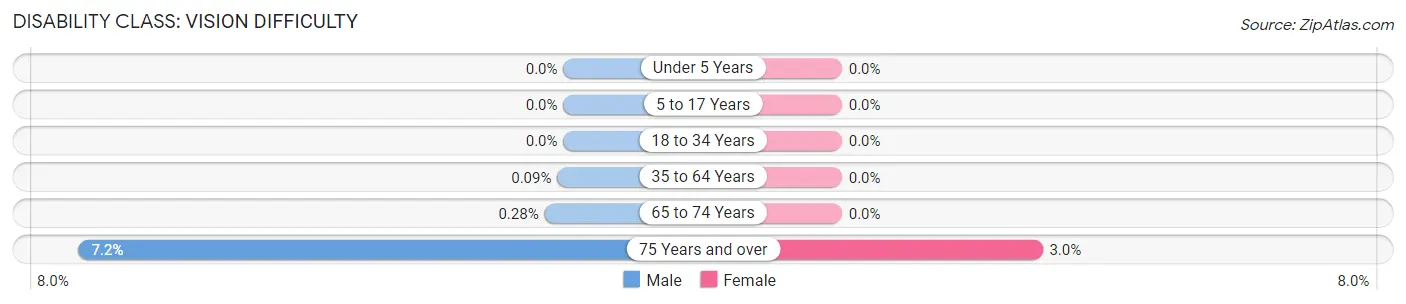
| Age Bracket | Male | Female |
| Under 5 Years | 0 (0.0%) | 0 (0.0%) |
| 5 to 17 Years | 0 (0.0%) | 0 (0.0%) |
| 18 to 34 Years | 0 (0.0%) | 0 (0.0%) |
| 35 to 64 Years | 2 (0.1%) | 0 (0.0%) |
| 65 to 74 Years | 1 (0.3%) | 0 (0.0%) |
| 75 Years and over | 18 (7.2%) | 17 (3.0%) |
Disability Class: Cognitive Difficulty
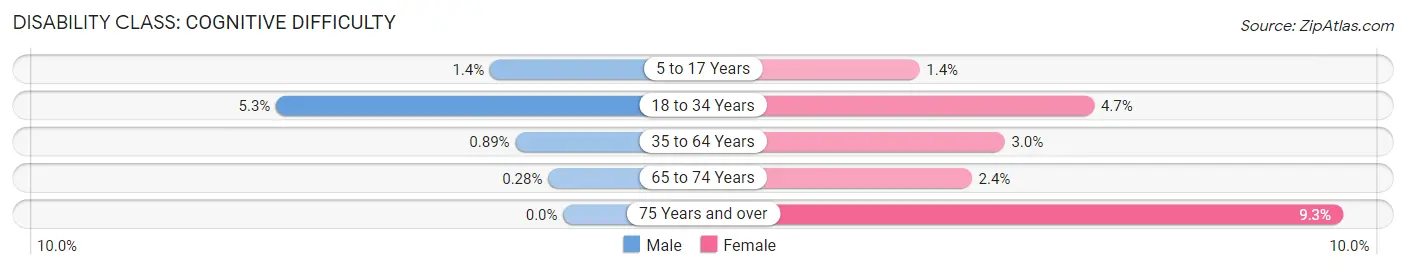
| Age Bracket | Male | Female |
| 5 to 17 Years | 14 (1.4%) | 15 (1.4%) |
| 18 to 34 Years | 45 (5.3%) | 60 (4.7%) |
| 35 to 64 Years | 20 (0.9%) | 67 (3.0%) |
| 65 to 74 Years | 1 (0.3%) | 13 (2.4%) |
| 75 Years and over | 0 (0.0%) | 53 (9.3%) |
Disability Class: Ambulatory Difficulty
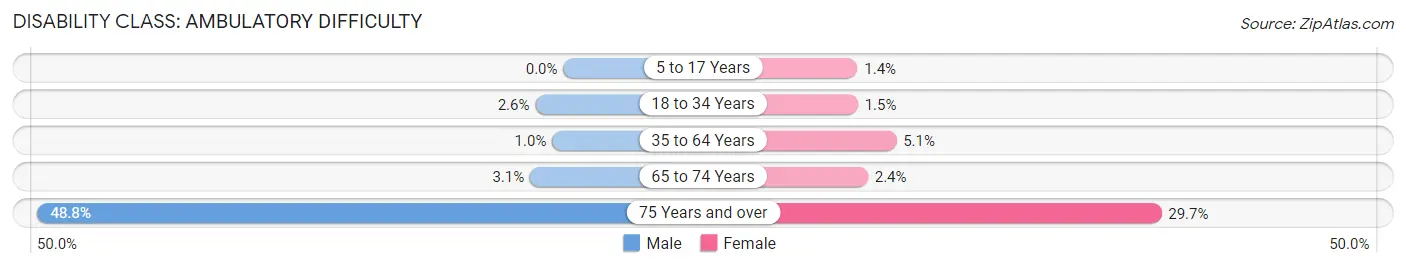
| Age Bracket | Male | Female |
| 5 to 17 Years | 0 (0.0%) | 15 (1.4%) |
| 18 to 34 Years | 22 (2.6%) | 19 (1.5%) |
| 35 to 64 Years | 23 (1.0%) | 112 (5.1%) |
| 65 to 74 Years | 11 (3.1%) | 13 (2.4%) |
| 75 Years and over | 122 (48.8%) | 169 (29.6%) |
Disability Class: Self-Care Difficulty
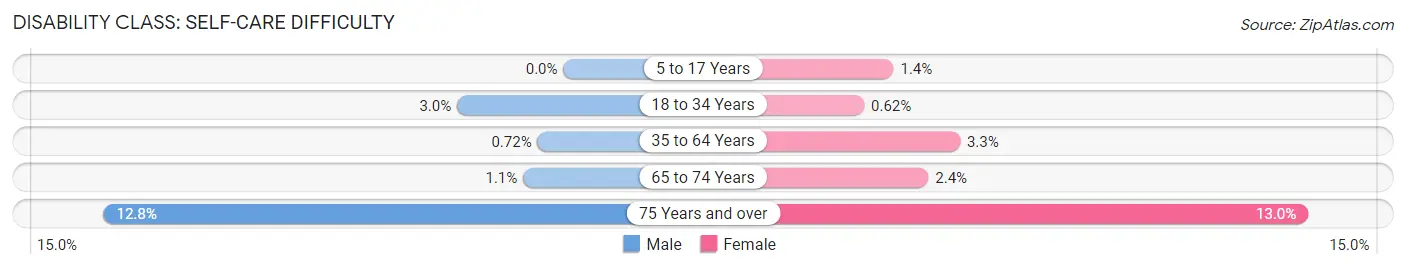
| Age Bracket | Male | Female |
| 5 to 17 Years | 0 (0.0%) | 15 (1.4%) |
| 18 to 34 Years | 25 (3.0%) | 8 (0.6%) |
| 35 to 64 Years | 16 (0.7%) | 73 (3.3%) |
| 65 to 74 Years | 4 (1.1%) | 13 (2.4%) |
| 75 Years and over | 32 (12.8%) | 74 (13.0%) |
Technology Access in Terryville
Computing Device Access in Terryville
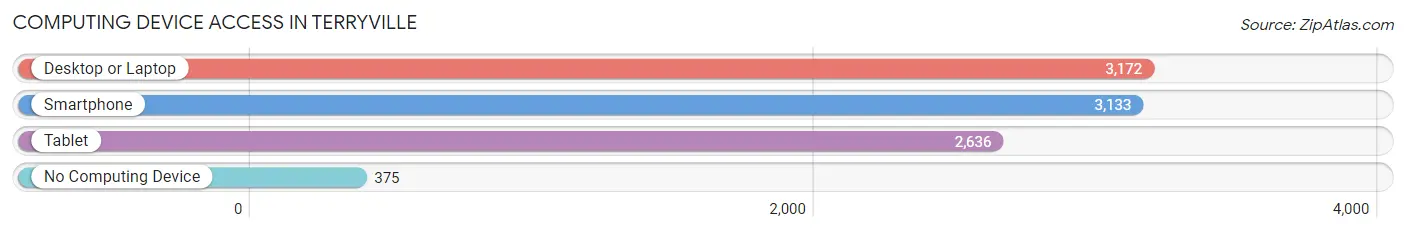
| Device Type | # Households | % Households |
| Desktop or Laptop | 3,172 | 83.0% |
| Smartphone | 3,133 | 82.0% |
| Tablet | 2,636 | 69.0% |
| No Computing Device | 375 | 9.8% |
| Total | 3,820 | 100.0% |
Internet Access in Terryville
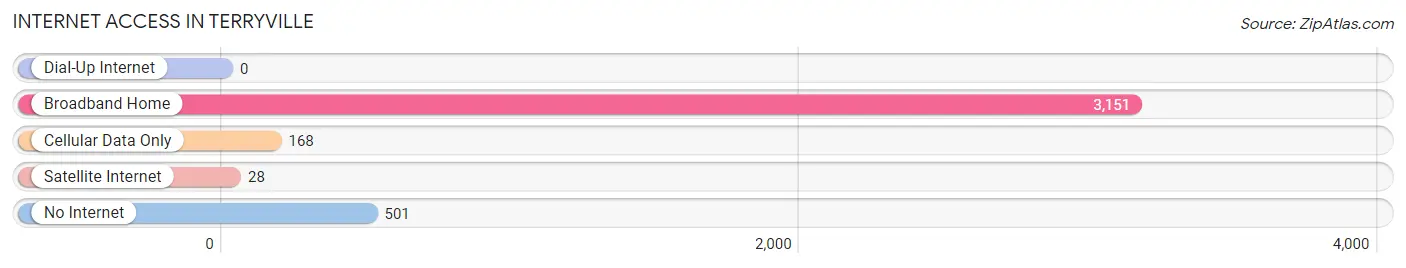
| Internet Type | # Households | % Households |
| Dial-Up Internet | 0 | 0.0% |
| Broadband Home | 3,151 | 82.5% |
| Cellular Data Only | 168 | 4.4% |
| Satellite Internet | 28 | 0.7% |
| No Internet | 501 | 13.1% |
| Total | 3,820 | 100.0% |
Terryville Summary
Pomfret is a town located in Chautauqua County, New York, United States. The population was 1,945 at the 2010 census. The town is named after the Pomfret family, who were early settlers in the area.
History
The area that is now Pomfret was first settled in 1811 by the Pomfret family. The town was formed in 1821 from the town of Chautauqua. The town was originally called "Pomfretville" but the name was changed to Pomfret in 1827.
The town was an agricultural community for many years, with the main crops being wheat, corn, and potatoes. The town also had several sawmills and gristmills.
Geography
Pomfret is located in the western part of Chautauqua County, in the southwestern corner of the state. It is bordered by the towns of Chautauqua to the east, Ellery to the south, and Stockton to the west. The town is located on the eastern shore of Chautauqua Lake.
The terrain of the town is mostly flat, with some rolling hills in the northern part of the town. The highest point in the town is an unnamed hill in the northern part of the town, with an elevation of 1,400 feet (427 m).
Economy
The economy of Pomfret is largely based on agriculture and tourism. The town is home to several wineries, including the Chautauqua Cellars Winery and the Lakewood Vineyards. The town also has several small businesses, including a grocery store, a hardware store, and a few restaurants.
The town is also home to the Chautauqua Institution, a summer educational center that hosts lectures, concerts, and other events. The Institution is a major employer in the town, and is a major tourist attraction.
Demographics
As of the census of 2010, there were 1,945 people, 817 households, and 545 families residing in the town. The population density was 39.3 people per square mile (15.2/km2). There were 945 housing units at an average density of 19.2 per square mile (7.4/km2). The racial makeup of the town was 97.3% White, 0.6% African American, 0.2% Native American, 0.2% Asian, 0.1% Pacific Islander, 0.4% from other races, and 1.2% from two or more races. Hispanic or Latino of any race were 1.2% of the population.
There were 817 households, out of which 28.2% had children under the age of 18 living with them, 51.2% were married couples living together, 10.2% had a female householder with no husband present, and 33.7% were non-families. 28.2% of all households were made up of individuals, and 12.2% had someone living alone who was 65 years of age or older. The average household size was 2.37 and the average family size was 2.86.
In the town, the population was spread out, with 23.2% under the age of 18, 6.2% from 18 to 24, 24.2% from 25 to 44, 28.7% from 45 to 64, and 17.7% who were 65 years of age or older. The median age was 42 years. For every 100 females, there were 95.2 males. For every 100 females age 18 and over, there were 92.2 males.
The median income for a household in the town was $37,500, and the median income for a family was $45,000. Males had a median income of $31,250 versus $25,000 for females. The per capita income for the town was $19,945. About 8.2% of families and 11.2% of the population were below the poverty line, including 15.2% of those under age 18 and 8.2% of those age 65 or over.
Common Questions
What is Per Capita Income in Terryville?
Per Capita income in Terryville is $47,098.
What is the Median Family Income in Terryville?
Median Family Income in Terryville is $138,620.
What is the Median Household income in Terryville?
Median Household Income in Terryville is $112,682.
What is Income or Wage Gap in Terryville?
Income or Wage Gap in Terryville is 36.7%.
Women in Terryville earn 63.3 cents for every dollar earned by a man.
What is Inequality or Gini Index in Terryville?
Inequality or Gini Index in Terryville is 0.41.
What is the Total Population of Terryville?
Total Population of Terryville is 10,890.
What is the Total Male Population of Terryville?
Total Male Population of Terryville is 4,900.
What is the Total Female Population of Terryville?
Total Female Population of Terryville is 5,990.
What is the Ratio of Males per 100 Females in Terryville?
There are 81.80 Males per 100 Females in Terryville.
What is the Ratio of Females per 100 Males in Terryville?
There are 122.24 Females per 100 Males in Terryville.
What is the Median Population Age in Terryville?
Median Population Age in Terryville is 40.8 Years.
What is the Average Family Size in Terryville
Average Family Size in Terryville is 3.5 People.
What is the Average Household Size in Terryville
Average Household Size in Terryville is 2.8 People.
How Large is the Labor Force in Terryville?
There are 5,754 People in the Labor Forcein in Terryville.
What is the Percentage of People in the Labor Force in Terryville?
66.2% of People are in the Labor Force in Terryville.
What is the Unemployment Rate in Terryville?
Unemployment Rate in Terryville is 6.4%.