Greenacres, CA Map & Demographics
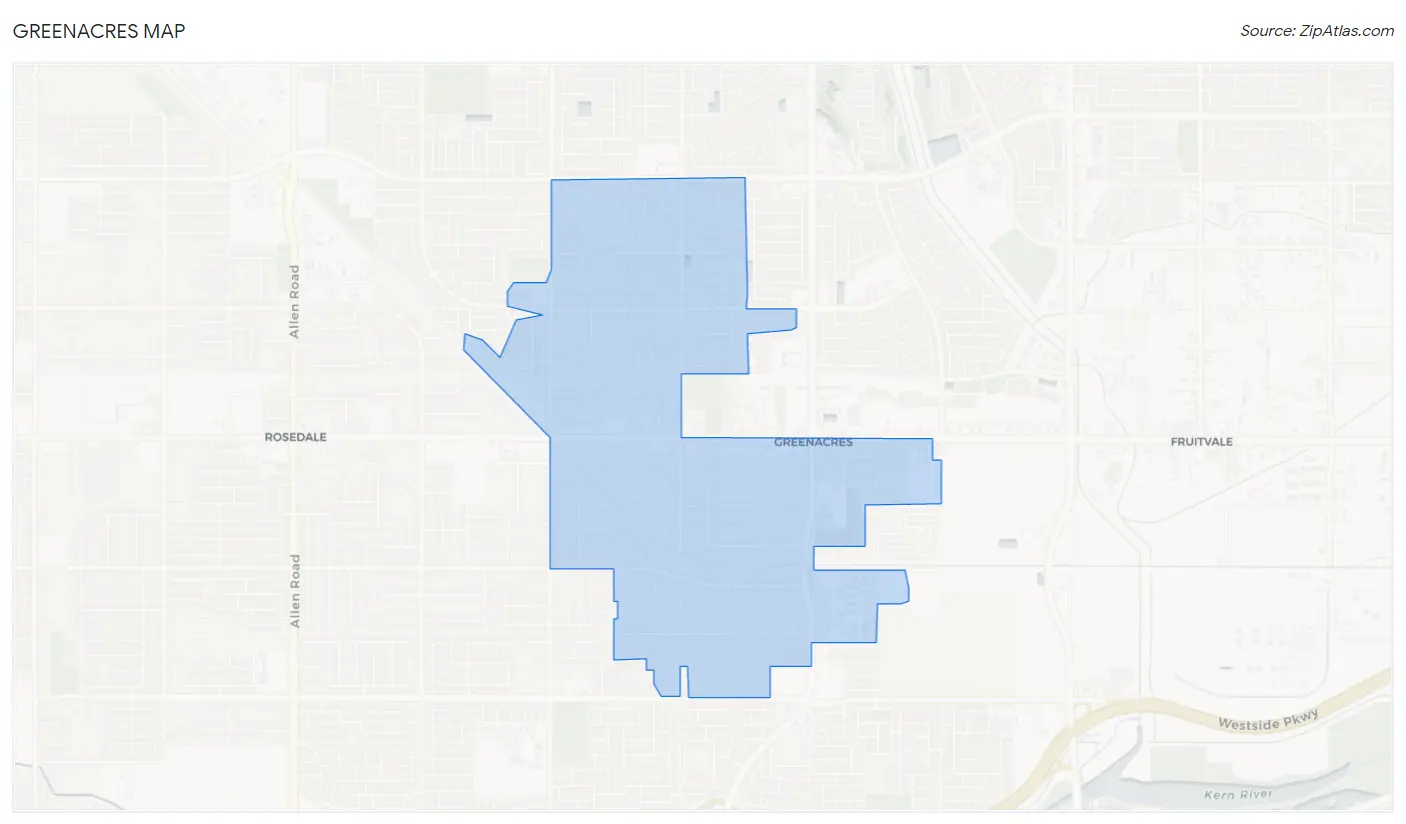
Greenacres Map
Greenacres Overview
$35,537
PER CAPITA INCOME
$96,741
AVG FAMILY INCOME
$85,550
AVG HOUSEHOLD INCOME
5.0%
WAGE / INCOME GAP [ % ]
95.0¢/ $1
WAGE / INCOME GAP [ $ ]
$10,565
FAMILY INCOME DEFICIT
0.43
INEQUALITY / GINI INDEX
4,562
TOTAL POPULATION
2,329
MALE POPULATION
2,233
FEMALE POPULATION
104.30
MALES / 100 FEMALES
95.88
FEMALES / 100 MALES
40.1
MEDIAN AGE
3.5
AVG FAMILY SIZE
3.0
AVG HOUSEHOLD SIZE
2,140
LABOR FORCE [ PEOPLE ]
61.3%
PERCENT IN LABOR FORCE
10.1%
UNEMPLOYMENT RATE
Income in Greenacres
Income Overview in Greenacres
Per Capita Income in Greenacres is $35,537, while median incomes of families and households are $96,741 and $85,550 respectively.
| Characteristic | Number | Measure |
| Per Capita Income | 4,562 | $35,537 |
| Median Family Income | 1,139 | $96,741 |
| Mean Family Income | 1,139 | $105,208 |
| Median Household Income | 1,525 | $85,550 |
| Mean Household Income | 1,525 | $102,504 |
| Income Deficit | 1,139 | $10,565 |
| Wage / Income Gap (%) | 4,562 | 5.05% |
| Wage / Income Gap ($) | 4,562 | 94.95¢ per $1 |
| Gini / Inequality Index | 4,562 | 0.43 |
Earnings by Sex in Greenacres
Average Earnings in Greenacres are $48,750, $50,383 for men and $47,841 for women, a difference of 5.1%.
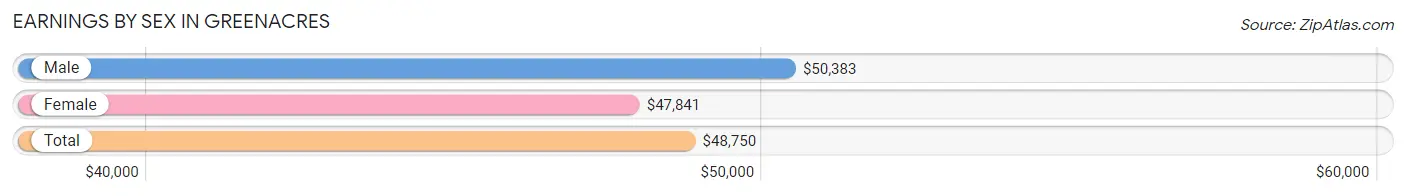
| Sex | Number | Average Earnings |
| Male | 1,187 (57.9%) | $50,383 |
| Female | 865 (42.1%) | $47,841 |
| Total | 2,052 (100.0%) | $48,750 |
Earnings by Sex by Income Bracket in Greenacres
The most common earnings brackets in Greenacres are $100,000+ for men (215 | 18.1%) and $100,000+ for women (164 | 19.0%).
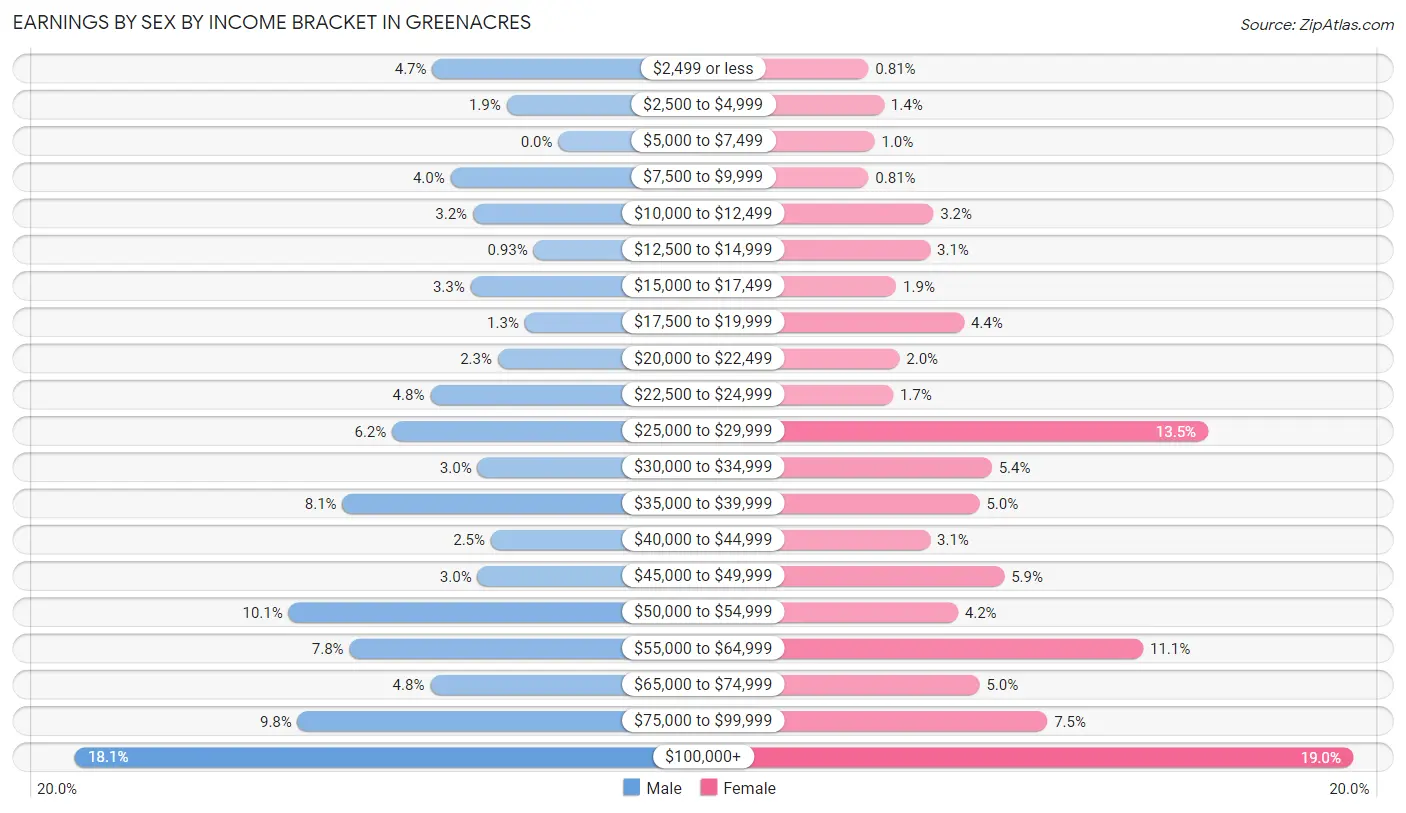
| Income | Male | Female |
| $2,499 or less | 56 (4.7%) | 7 (0.8%) |
| $2,500 to $4,999 | 23 (1.9%) | 12 (1.4%) |
| $5,000 to $7,499 | 0 (0.0%) | 9 (1.0%) |
| $7,500 to $9,999 | 48 (4.0%) | 7 (0.8%) |
| $10,000 to $12,499 | 38 (3.2%) | 28 (3.2%) |
| $12,500 to $14,999 | 11 (0.9%) | 27 (3.1%) |
| $15,000 to $17,499 | 39 (3.3%) | 16 (1.8%) |
| $17,500 to $19,999 | 15 (1.3%) | 38 (4.4%) |
| $20,000 to $22,499 | 27 (2.3%) | 17 (2.0%) |
| $22,500 to $24,999 | 57 (4.8%) | 15 (1.7%) |
| $25,000 to $29,999 | 74 (6.2%) | 117 (13.5%) |
| $30,000 to $34,999 | 36 (3.0%) | 47 (5.4%) |
| $35,000 to $39,999 | 96 (8.1%) | 43 (5.0%) |
| $40,000 to $44,999 | 30 (2.5%) | 27 (3.1%) |
| $45,000 to $49,999 | 36 (3.0%) | 51 (5.9%) |
| $50,000 to $54,999 | 120 (10.1%) | 36 (4.2%) |
| $55,000 to $64,999 | 93 (7.8%) | 96 (11.1%) |
| $65,000 to $74,999 | 57 (4.8%) | 43 (5.0%) |
| $75,000 to $99,999 | 116 (9.8%) | 65 (7.5%) |
| $100,000+ | 215 (18.1%) | 164 (19.0%) |
| Total | 1,187 (100.0%) | 865 (100.0%) |
Earnings by Sex by Educational Attainment in Greenacres
Average earnings in Greenacres are $52,764 for men and $49,621 for women, a difference of 6.0%. Men with an educational attainment of bachelor's degree enjoy the highest average annual earnings of $83,667, while those with college or associate's degree education earn the least with $46,157. Women with an educational attainment of bachelor's degree earn the most with the average annual earnings of $105,764, while those with college or associate's degree education have the smallest earnings of $29,722.
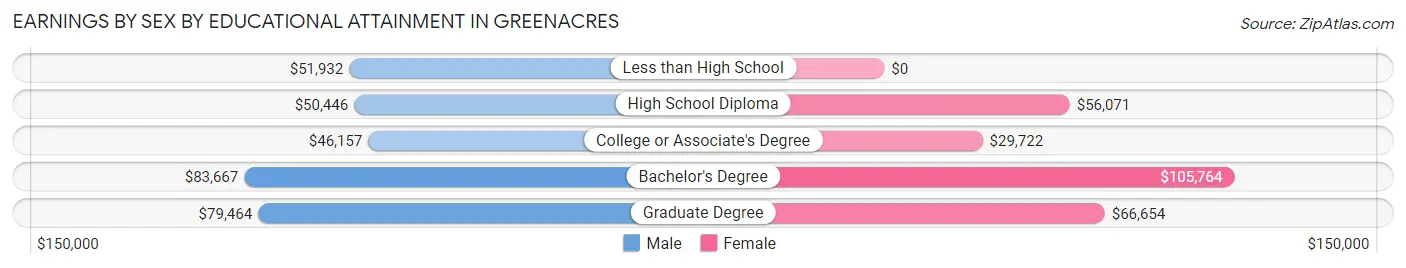
| Educational Attainment | Male Income | Female Income |
| Less than High School | $51,932 | $0 |
| High School Diploma | $50,446 | $56,071 |
| College or Associate's Degree | $46,157 | $29,722 |
| Bachelor's Degree | $83,667 | $105,764 |
| Graduate Degree | $79,464 | $66,654 |
| Total | $52,764 | $49,621 |
Family Income in Greenacres
Family Income Brackets in Greenacres
According to the Greenacres family income data, there are 312 families falling into the $100,000 to $149,999 income range, which is the most common income bracket and makes up 27.4% of all families. Conversely, the $10,000 to $14,999 income bracket is the least frequent group with only 8 families (0.7%) belonging to this category.
| Income Bracket | # Families | % Families |
| Less than $10,000 | 21 | 1.8% |
| $10,000 to $14,999 | 8 | 0.7% |
| $15,000 to $24,999 | 8 | 0.7% |
| $25,000 to $34,999 | 51 | 4.5% |
| $35,000 to $49,999 | 144 | 12.6% |
| $50,000 to $74,999 | 222 | 19.5% |
| $75,000 to $99,999 | 145 | 12.7% |
| $100,000 to $149,999 | 312 | 27.4% |
| $150,000 to $199,999 | 148 | 13.0% |
| $200,000+ | 82 | 7.2% |
Family Income by Famaliy Size in Greenacres
5-person families (125 | 11.0%) account for the highest median family income in Greenacres with $171,771 per family, while 2-person families (570 | 50.0%) have the highest median income of $43,516 per family member.
| Income Bracket | # Families | Median Income |
| 2-Person Families | 570 (50.0%) | $87,031 |
| 3-Person Families | 164 (14.4%) | $78,750 |
| 4-Person Families | 162 (14.2%) | $111,611 |
| 5-Person Families | 125 (11.0%) | $171,771 |
| 6-Person Families | 97 (8.5%) | $99,205 |
| 7+ Person Families | 21 (1.8%) | $0 |
| Total | 1,139 (100.0%) | $96,741 |
Family Income by Number of Earners in Greenacres
The median family income in Greenacres is $96,741, with families comprising 3+ earners (104) having the highest median family income of $117,222, while families with no earners (215) have the lowest median family income of $44,375, accounting for 9.1% and 18.9% of families, respectively.
| Number of Earners | # Families | Median Income |
| No Earners | 215 (18.9%) | $44,375 |
| 1 Earner | 401 (35.2%) | $91,563 |
| 2 Earners | 419 (36.8%) | $104,353 |
| 3+ Earners | 104 (9.1%) | $117,222 |
| Total | 1,139 (100.0%) | $96,741 |
Household Income in Greenacres
Household Income Brackets in Greenacres
With 313 households falling in the category, the $100,000 to $149,999 income range is the most frequent in Greenacres, accounting for 20.5% of all households. In contrast, only 37 households (2.4%) fall into the $10,000 to $14,999 income bracket, making it the least populous group.
| Income Bracket | # Households | % Households |
| Less than $10,000 | 56 | 3.7% |
| $10,000 to $14,999 | 37 | 2.4% |
| $15,000 to $24,999 | 37 | 2.4% |
| $25,000 to $34,999 | 137 | 9.0% |
| $35,000 to $49,999 | 191 | 12.5% |
| $50,000 to $74,999 | 256 | 16.8% |
| $75,000 to $99,999 | 194 | 12.7% |
| $100,000 to $149,999 | 313 | 20.5% |
| $150,000 to $199,999 | 175 | 11.5% |
| $200,000+ | 133 | 8.7% |
Household Income by Householder Age in Greenacres
The median household income in Greenacres is $85,550, with the highest median household income of $103,625 found in the 45 to 64 years age bracket for the primary householder. A total of 585 households (38.4%) fall into this category. Meanwhile, the 15 to 24 years age bracket for the primary householder has the lowest median household income of $0, with 2 households (0.1%) in this group.
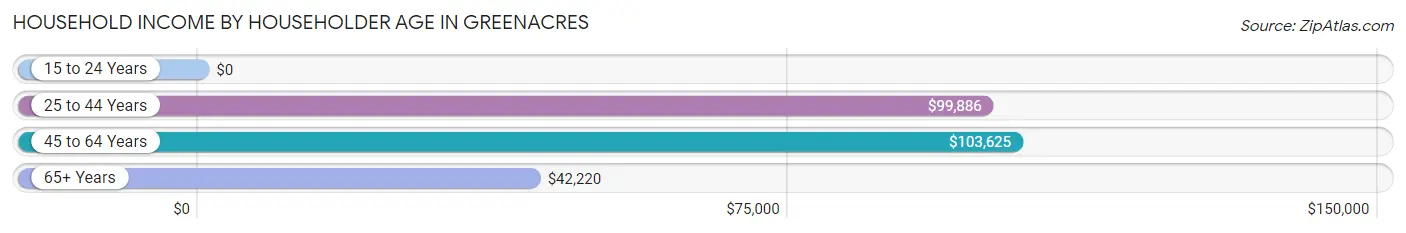
| Income Bracket | # Households | Median Income |
| 15 to 24 Years | 2 (0.1%) | $0 |
| 25 to 44 Years | 461 (30.2%) | $99,886 |
| 45 to 64 Years | 585 (38.4%) | $103,625 |
| 65+ Years | 477 (31.3%) | $42,220 |
| Total | 1,525 (100.0%) | $85,550 |
Poverty in Greenacres
Income Below Poverty by Sex and Age in Greenacres
With 2.8% poverty level for males and 5.6% for females among the residents of Greenacres, 45 to 54 year old males and 55 to 64 year old females are the most vulnerable to poverty, with 19 males (9.5%) and 42 females (13.9%) in their respective age groups living below the poverty level.
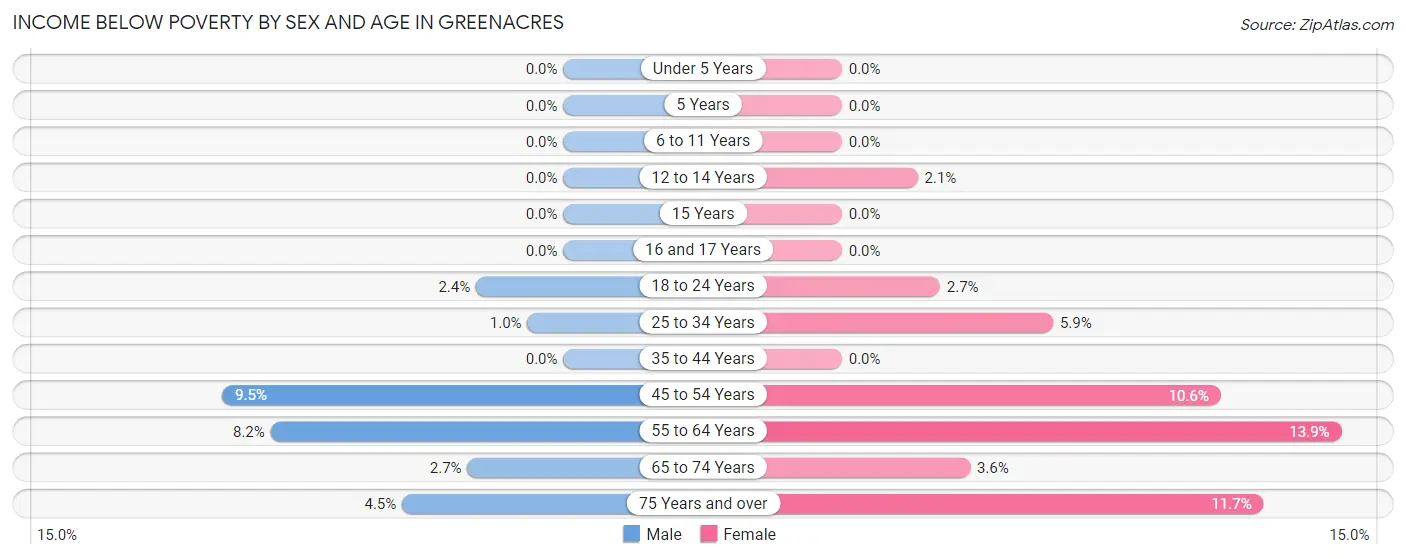
| Age Bracket | Male | Female |
| Under 5 Years | 0 (0.0%) | 0 (0.0%) |
| 5 Years | 0 (0.0%) | 0 (0.0%) |
| 6 to 11 Years | 0 (0.0%) | 0 (0.0%) |
| 12 to 14 Years | 0 (0.0%) | 2 (2.1%) |
| 15 Years | 0 (0.0%) | 0 (0.0%) |
| 16 and 17 Years | 0 (0.0%) | 0 (0.0%) |
| 18 to 24 Years | 5 (2.4%) | 3 (2.7%) |
| 25 to 34 Years | 3 (1.0%) | 15 (5.9%) |
| 35 to 44 Years | 0 (0.0%) | 0 (0.0%) |
| 45 to 54 Years | 19 (9.5%) | 27 (10.5%) |
| 55 to 64 Years | 26 (8.2%) | 42 (13.9%) |
| 65 to 74 Years | 6 (2.7%) | 6 (3.6%) |
| 75 Years and over | 7 (4.5%) | 31 (11.7%) |
| Total | 66 (2.8%) | 126 (5.6%) |
Income Above Poverty by Sex and Age in Greenacres
According to the poverty statistics in Greenacres, males aged under 5 years and females aged under 5 years are the age groups that are most secure financially, with 100.0% of males and 100.0% of females in these age groups living above the poverty line.
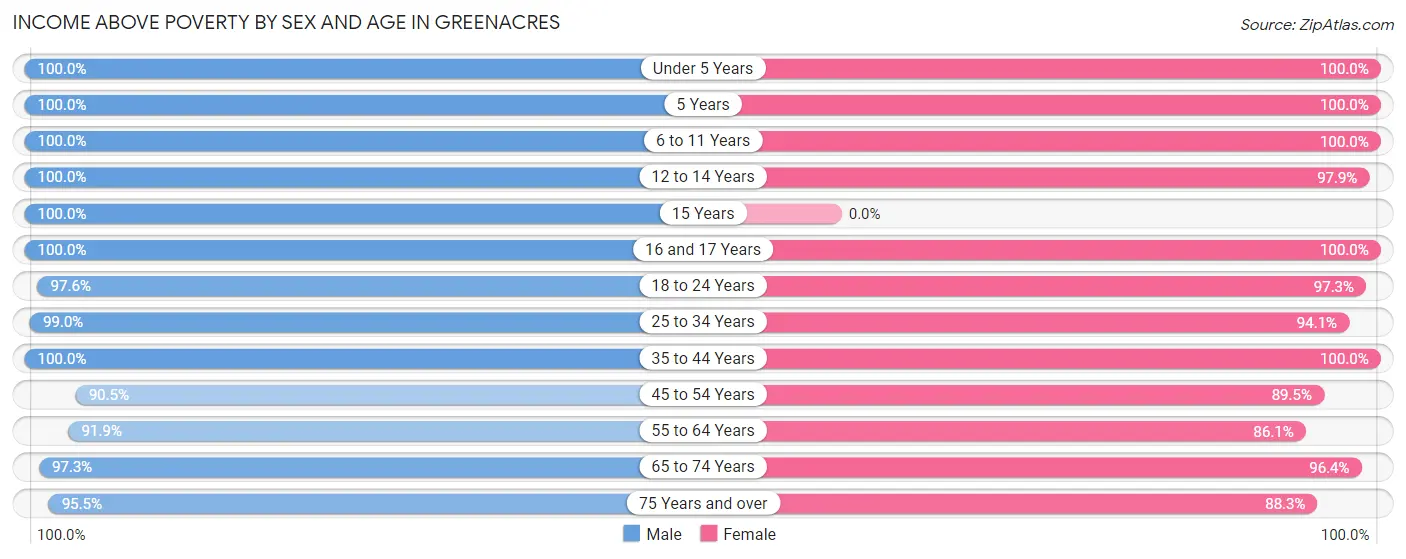
| Age Bracket | Male | Female |
| Under 5 Years | 50 (100.0%) | 141 (100.0%) |
| 5 Years | 11 (100.0%) | 80 (100.0%) |
| 6 to 11 Years | 166 (100.0%) | 227 (100.0%) |
| 12 to 14 Years | 231 (100.0%) | 93 (97.9%) |
| 15 Years | 70 (100.0%) | 0 (0.0%) |
| 16 and 17 Years | 73 (100.0%) | 50 (100.0%) |
| 18 to 24 Years | 201 (97.6%) | 107 (97.3%) |
| 25 to 34 Years | 296 (99.0%) | 240 (94.1%) |
| 35 to 44 Years | 323 (100.0%) | 285 (100.0%) |
| 45 to 54 Years | 181 (90.5%) | 229 (89.4%) |
| 55 to 64 Years | 293 (91.8%) | 260 (86.1%) |
| 65 to 74 Years | 219 (97.3%) | 162 (96.4%) |
| 75 Years and over | 149 (95.5%) | 233 (88.3%) |
| Total | 2,263 (97.2%) | 2,107 (94.4%) |
Income Below Poverty Among Married-Couple Families in Greenacres
The poverty statistics for married-couple families in Greenacres show that 3.9% or 31 of the total 799 families live below the poverty line. Families with no children have the highest poverty rate of 6.1%, comprising of 28 families. On the other hand, families with 3 or 4 children have the lowest poverty rate of 0.0%, which includes 0 families.
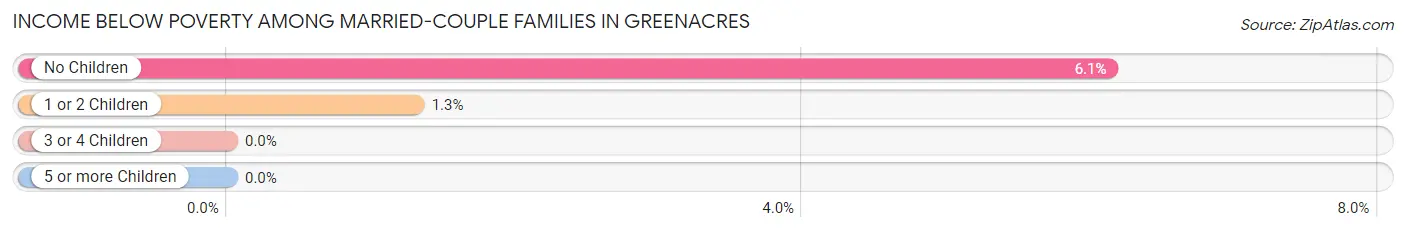
| Children | Above Poverty | Below Poverty |
| No Children | 429 (93.9%) | 28 (6.1%) |
| 1 or 2 Children | 227 (98.7%) | 3 (1.3%) |
| 3 or 4 Children | 91 (100.0%) | 0 (0.0%) |
| 5 or more Children | 21 (100.0%) | 0 (0.0%) |
| Total | 768 (96.1%) | 31 (3.9%) |
Income Below Poverty Among Single-Parent Households in Greenacres
| Children | Single Father | Single Mother |
| No Children | 0 (0.0%) | 0 (0.0%) |
| 1 or 2 Children | 0 (0.0%) | 0 (0.0%) |
| 3 or 4 Children | 0 (0.0%) | 0 (0.0%) |
| 5 or more Children | 0 (0.0%) | 0 (0.0%) |
| Total | 0 (0.0%) | 0 (0.0%) |
Income Below Poverty Among Married-Couple vs Single-Parent Households in Greenacres
| Children | Married-Couple Families | Single-Parent Households |
| No Children | 28 (6.1%) | 0 (0.0%) |
| 1 or 2 Children | 3 (1.3%) | 0 (0.0%) |
| 3 or 4 Children | 0 (0.0%) | 0 (0.0%) |
| 5 or more Children | 0 (0.0%) | 0 (0.0%) |
| Total | 31 (3.9%) | 0 (0.0%) |
Race in Greenacres
The most populous races in Greenacres are White / Caucasian (3,297 | 72.3%), Hispanic or Latino (1,858 | 40.7%), and Two or more Races (948 | 20.8%).
| Race | # Population | % Population |
| Asian | 58 | 1.3% |
| Black / African American | 0 | 0.0% |
| Hawaiian / Pacific | 0 | 0.0% |
| Hispanic or Latino | 1,858 | 40.7% |
| Native / Alaskan | 32 | 0.7% |
| White / Caucasian | 3,297 | 72.3% |
| Two or more Races | 948 | 20.8% |
| Some other Race | 227 | 5.0% |
| Total | 4,562 | 100.0% |
Ancestry in Greenacres
The most populous ancestries reported in Greenacres are Mexican (1,691 | 37.1%), Irish (414 | 9.1%), Italian (347 | 7.6%), French (326 | 7.1%), and English (307 | 6.7%), together accounting for 67.6% of all Greenacres residents.
| Ancestry | # Population | % Population |
| American | 140 | 3.1% |
| Apache | 27 | 0.6% |
| Argentinean | 7 | 0.2% |
| Belgian | 6 | 0.1% |
| Bhutanese | 3 | 0.1% |
| British | 8 | 0.2% |
| Burmese | 49 | 1.1% |
| Canadian | 9 | 0.2% |
| Central American | 29 | 0.6% |
| Cuban | 29 | 0.6% |
| Dutch | 24 | 0.5% |
| Eastern European | 24 | 0.5% |
| Ecuadorian | 10 | 0.2% |
| English | 307 | 6.7% |
| European | 126 | 2.8% |
| French | 326 | 7.1% |
| German | 299 | 6.6% |
| Greek | 58 | 1.3% |
| Irish | 414 | 9.1% |
| Italian | 347 | 7.6% |
| Korean | 6 | 0.1% |
| Lithuanian | 12 | 0.3% |
| Mexican | 1,691 | 37.1% |
| Navajo | 27 | 0.6% |
| Norwegian | 59 | 1.3% |
| Peruvian | 8 | 0.2% |
| Polish | 67 | 1.5% |
| Portuguese | 177 | 3.9% |
| Russian | 38 | 0.8% |
| Salvadoran | 29 | 0.6% |
| Scandinavian | 8 | 0.2% |
| Scotch-Irish | 7 | 0.2% |
| Scottish | 30 | 0.7% |
| South American | 25 | 0.5% |
| Spanish | 84 | 1.8% |
| Swedish | 38 | 0.8% |
| West Indian | 7 | 0.2% | View All 37 Rows |
Immigrants in Greenacres
The most numerous immigrant groups reported in Greenacres came from Latin America (176 | 3.9%), Central America (144 | 3.2%), Mexico (144 | 3.2%), Asia (34 | 0.7%), and South America (32 | 0.7%), together accounting for 11.6% of all Greenacres residents.
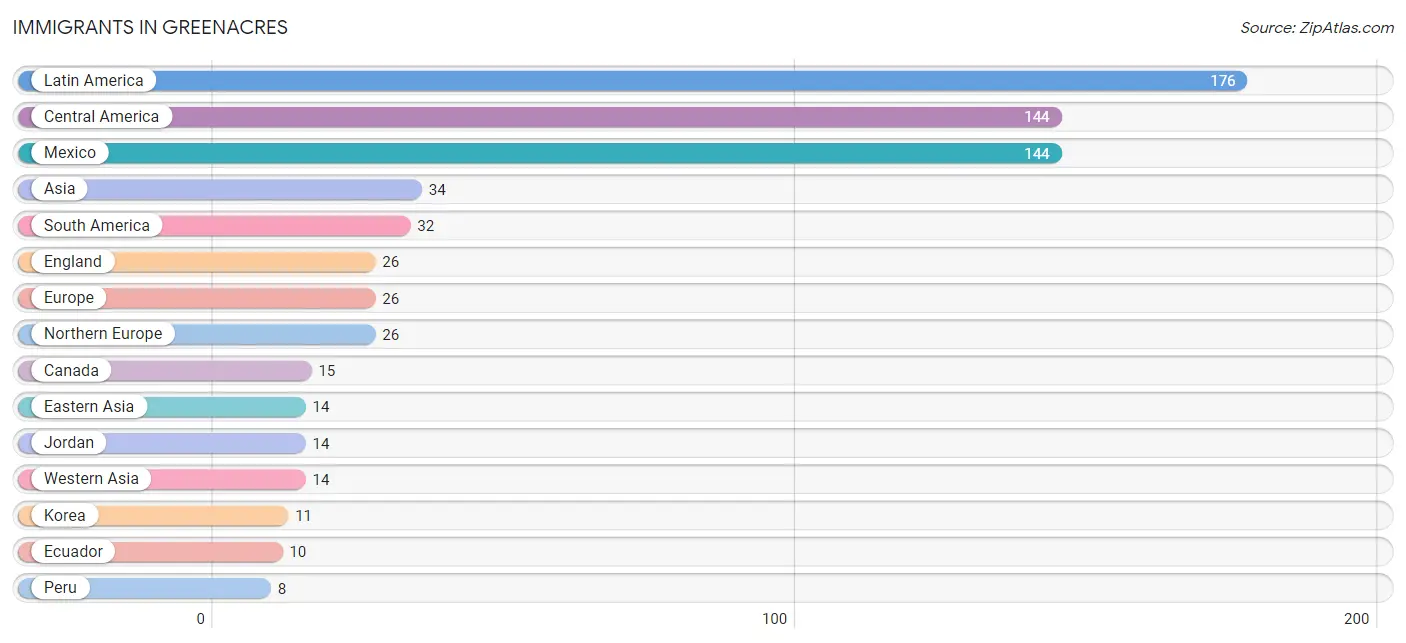
| Immigration Origin | # Population | % Population |
| Argentina | 7 | 0.2% |
| Asia | 34 | 0.7% |
| Canada | 15 | 0.3% |
| Central America | 144 | 3.2% |
| Eastern Asia | 14 | 0.3% |
| Ecuador | 10 | 0.2% |
| England | 26 | 0.6% |
| Europe | 26 | 0.6% |
| Guyana | 7 | 0.2% |
| Japan | 3 | 0.1% |
| Jordan | 14 | 0.3% |
| Korea | 11 | 0.2% |
| Latin America | 176 | 3.9% |
| Mexico | 144 | 3.2% |
| Northern Europe | 26 | 0.6% |
| Peru | 8 | 0.2% |
| Philippines | 6 | 0.1% |
| South America | 32 | 0.7% |
| South Eastern Asia | 6 | 0.1% |
| Western Asia | 14 | 0.3% | View All 20 Rows |
Sex and Age in Greenacres
Sex and Age in Greenacres
The most populous age groups in Greenacres are 10 to 14 Years (301 | 12.9%) for men and 5 to 9 Years (262 | 11.7%) for women.
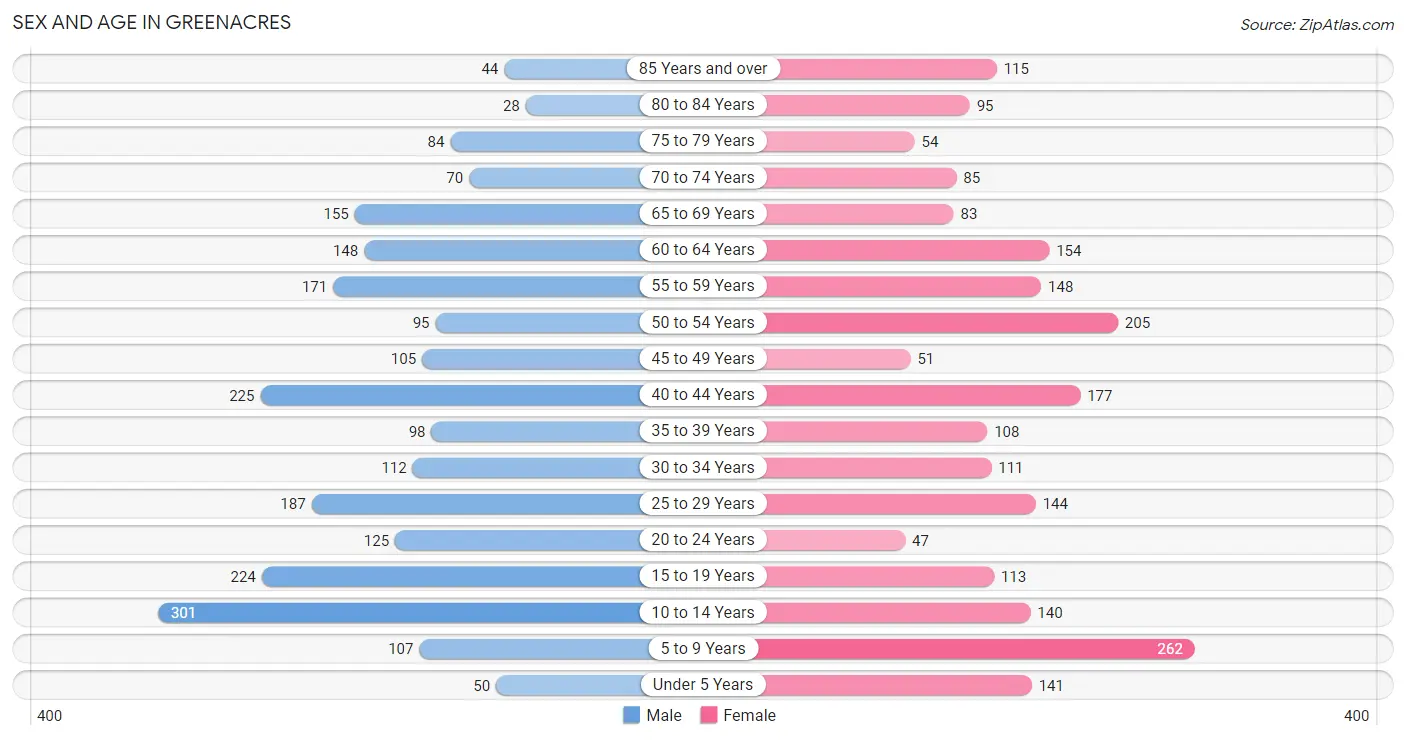
| Age Bracket | Male | Female |
| Under 5 Years | 50 (2.1%) | 141 (6.3%) |
| 5 to 9 Years | 107 (4.6%) | 262 (11.7%) |
| 10 to 14 Years | 301 (12.9%) | 140 (6.3%) |
| 15 to 19 Years | 224 (9.6%) | 113 (5.1%) |
| 20 to 24 Years | 125 (5.4%) | 47 (2.1%) |
| 25 to 29 Years | 187 (8.0%) | 144 (6.5%) |
| 30 to 34 Years | 112 (4.8%) | 111 (5.0%) |
| 35 to 39 Years | 98 (4.2%) | 108 (4.8%) |
| 40 to 44 Years | 225 (9.7%) | 177 (7.9%) |
| 45 to 49 Years | 105 (4.5%) | 51 (2.3%) |
| 50 to 54 Years | 95 (4.1%) | 205 (9.2%) |
| 55 to 59 Years | 171 (7.3%) | 148 (6.6%) |
| 60 to 64 Years | 148 (6.4%) | 154 (6.9%) |
| 65 to 69 Years | 155 (6.7%) | 83 (3.7%) |
| 70 to 74 Years | 70 (3.0%) | 85 (3.8%) |
| 75 to 79 Years | 84 (3.6%) | 54 (2.4%) |
| 80 to 84 Years | 28 (1.2%) | 95 (4.3%) |
| 85 Years and over | 44 (1.9%) | 115 (5.1%) |
| Total | 2,329 (100.0%) | 2,233 (100.0%) |
Families and Households in Greenacres
Median Family Size in Greenacres
The median family size in Greenacres is 3.48 persons per family, with married-couple families (799 | 70.2%) accounting for the largest median family size of 3.54 persons per family. On the other hand, single female/mother families (148 | 13.0%) represent the smallest median family size with 3.29 persons per family.
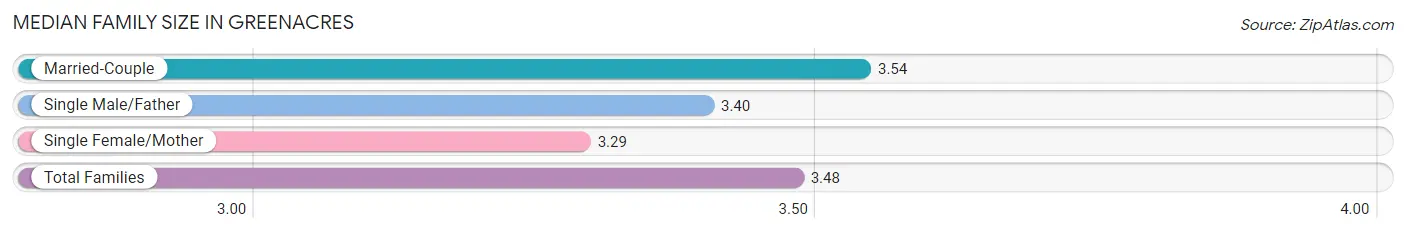
| Family Type | # Families | Family Size |
| Married-Couple | 799 (70.2%) | 3.54 |
| Single Male/Father | 192 (16.9%) | 3.40 |
| Single Female/Mother | 148 (13.0%) | 3.29 |
| Total Families | 1,139 (100.0%) | 3.48 |
Median Household Size in Greenacres
The median household size in Greenacres is 2.99 persons per household, with single male/father households (192 | 12.6%) accounting for the largest median household size of 3.97 persons per household. non-family households (386 | 25.3%) represent the smallest median household size with 1.13 persons per household.
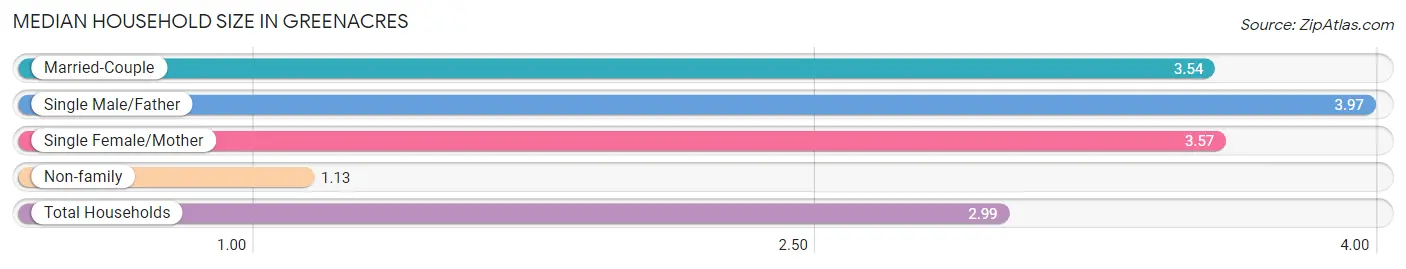
| Household Type | # Households | Household Size |
| Married-Couple | 799 (52.4%) | 3.54 |
| Single Male/Father | 192 (12.6%) | 3.97 |
| Single Female/Mother | 148 (9.7%) | 3.57 |
| Non-family | 386 (25.3%) | 1.13 |
| Total Households | 1,525 (100.0%) | 2.99 |
Household Size by Marriage Status in Greenacres
Out of a total of 1,525 households in Greenacres, 1,139 (74.7%) are family households, while 386 (25.3%) are nonfamily households. The most numerous type of family households are 2-person households, comprising 497, and the most common type of nonfamily households are 1-person households, comprising 341.
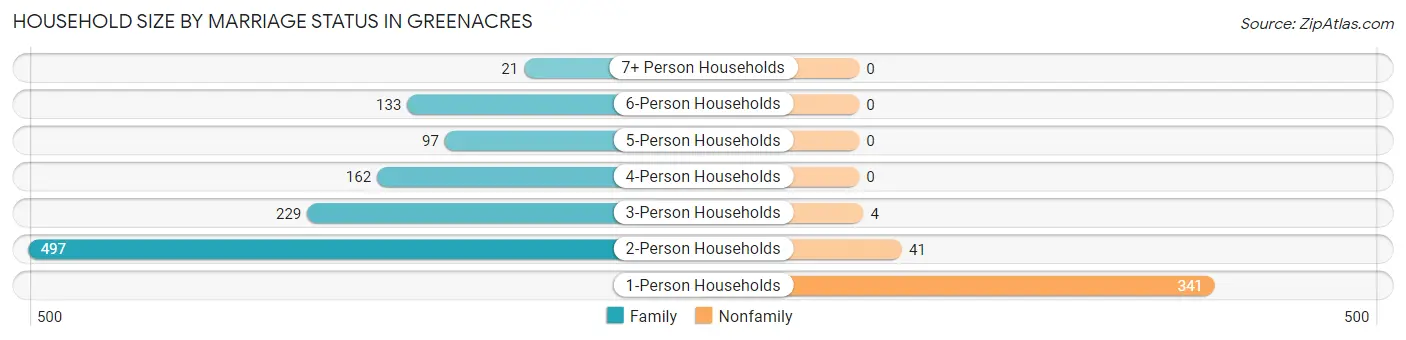
| Household Size | Family Households | Nonfamily Households |
| 1-Person Households | - | 341 (22.4%) |
| 2-Person Households | 497 (32.6%) | 41 (2.7%) |
| 3-Person Households | 229 (15.0%) | 4 (0.3%) |
| 4-Person Households | 162 (10.6%) | 0 (0.0%) |
| 5-Person Households | 97 (6.4%) | 0 (0.0%) |
| 6-Person Households | 133 (8.7%) | 0 (0.0%) |
| 7+ Person Households | 21 (1.4%) | 0 (0.0%) |
| Total | 1,139 (74.7%) | 386 (25.3%) |
Female Fertility in Greenacres
Fertility by Age in Greenacres
| Age Bracket | Women with Births | Births / 1,000 Women |
| 15 to 19 years | 0 (0.0%) | 0.0 |
| 20 to 34 years | 0 (0.0%) | 0.0 |
| 35 to 50 years | 0 (0.0%) | 0.0 |
| Total | 0 (0.0%) | 0.0 |
Fertility by Age by Marriage Status in Greenacres
| Age Bracket | Married | Unmarried |
| 15 to 19 years | 0 (0.0%) | 0 (0.0%) |
| 20 to 34 years | 0 (0.0%) | 0 (0.0%) |
| 35 to 50 years | 0 (0.0%) | 0 (0.0%) |
| Total | 0 (0.0%) | 0 (0.0%) |
Fertility by Education in Greenacres
| Educational Attainment | Women with Births | Births / 1,000 Women |
| Less than High School | 0 (0.0%) | 0.0 |
| High School Diploma | 0 (0.0%) | 0.0 |
| College or Associate's Degree | 0 (0.0%) | 0.0 |
| Bachelor's Degree | 0 (0.0%) | 0.0 |
| Graduate Degree | 0 (0.0%) | 0.0 |
| Total | 0 (0.0%) | 0.0 |
Fertility by Education by Marriage Status in Greenacres
| Educational Attainment | Married | Unmarried |
| Less than High School | 0 (0.0%) | 0 (0.0%) |
| High School Diploma | 0 (0.0%) | 0 (0.0%) |
| College or Associate's Degree | 0 (0.0%) | 0 (0.0%) |
| Bachelor's Degree | 0 (0.0%) | 0 (0.0%) |
| Graduate Degree | 0 (0.0%) | 0 (0.0%) |
| Total | 0 (0.0%) | 0 (0.0%) |
Employment Characteristics in Greenacres
Employment by Class of Employer in Greenacres
Among the 1,858 employed individuals in Greenacres, private company employees (1,225 | 65.9%), local government employees (224 | 12.1%), and self-employed (not incorporated) (170 | 9.1%) make up the most common classes of employment.
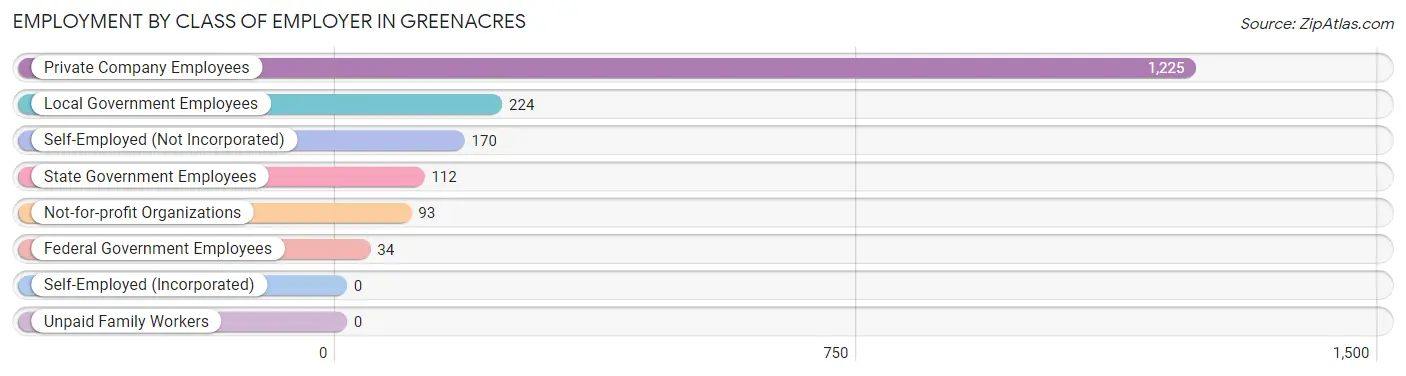
| Employer Class | # Employees | % Employees |
| Private Company Employees | 1,225 | 65.9% |
| Self-Employed (Incorporated) | 0 | 0.0% |
| Self-Employed (Not Incorporated) | 170 | 9.1% |
| Not-for-profit Organizations | 93 | 5.0% |
| Local Government Employees | 224 | 12.1% |
| State Government Employees | 112 | 6.0% |
| Federal Government Employees | 34 | 1.8% |
| Unpaid Family Workers | 0 | 0.0% |
| Total | 1,858 | 100.0% |
Employment Status by Age in Greenacres
According to the labor force statistics for Greenacres, out of the total population over 16 years of age (3,491), 61.3% or 2,140 individuals are in the labor force, with 10.1% or 216 of them unemployed. The age group with the highest labor force participation rate is 30 to 34 years, with 100.0% or 223 individuals in the labor force. Within the labor force, the 16 to 19 years age range has the highest percentage of unemployed individuals, with 45.1% or 23 of them being unemployed.
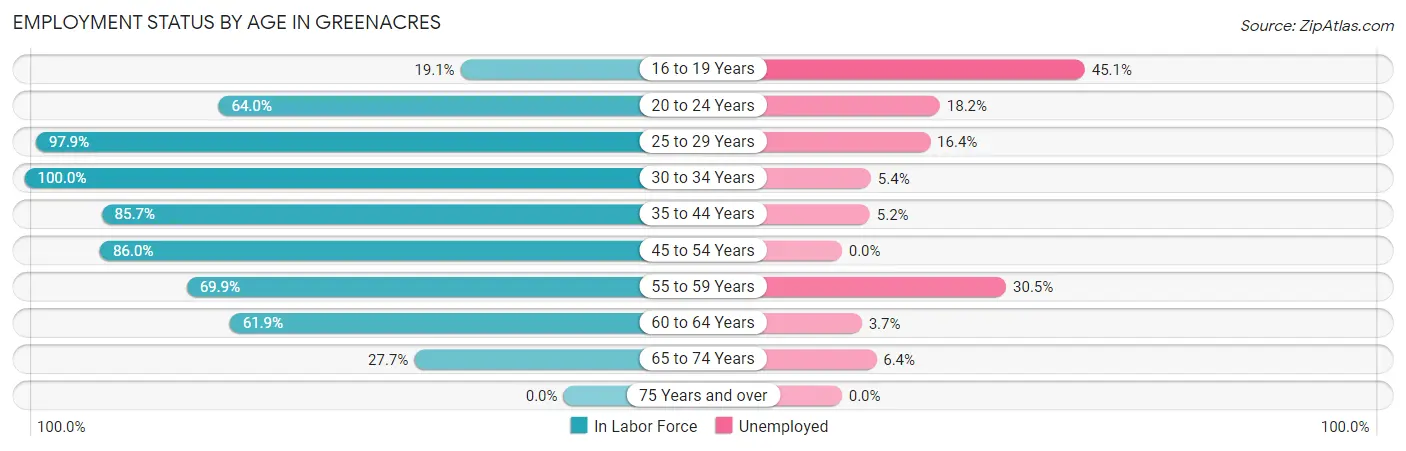
| Age Bracket | In Labor Force | Unemployed |
| 16 to 19 Years | 51 (19.1%) | 23 (45.1%) |
| 20 to 24 Years | 110 (64.0%) | 20 (18.2%) |
| 25 to 29 Years | 324 (97.9%) | 53 (16.4%) |
| 30 to 34 Years | 223 (100.0%) | 12 (5.4%) |
| 35 to 44 Years | 521 (85.7%) | 27 (5.2%) |
| 45 to 54 Years | 392 (86.0%) | 0 (0.0%) |
| 55 to 59 Years | 223 (69.9%) | 68 (30.5%) |
| 60 to 64 Years | 187 (61.9%) | 7 (3.7%) |
| 65 to 74 Years | 109 (27.7%) | 7 (6.4%) |
| 75 Years and over | 0 (0.0%) | 0 (0.0%) |
| Total | 2,140 (61.3%) | 216 (10.1%) |
Employment Status by Educational Attainment in Greenacres
According to labor force statistics for Greenacres, 83.5% of individuals (1,870) out of the total population between 25 and 64 years of age (2,239) are in the labor force, with 8.9% or 166 of them being unemployed. The group with the highest labor force participation rate are those with the educational attainment of college / associate degree, with 84.8% or 616 individuals in the labor force. Within the labor force, individuals with high school diploma education have the highest percentage of unemployment, with 16.4% or 116 of them being unemployed.
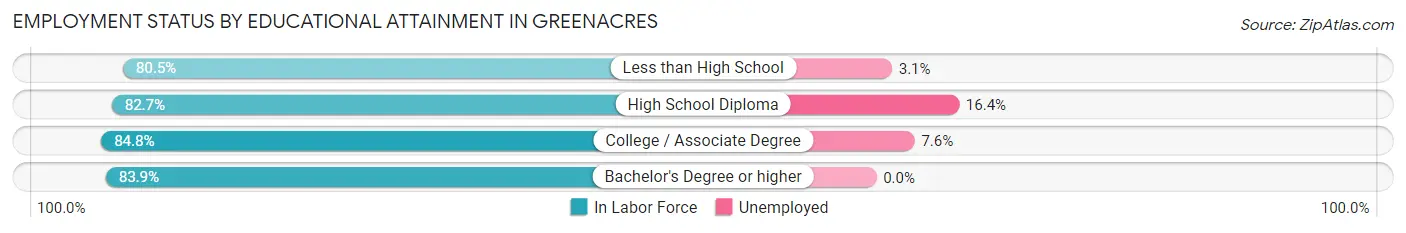
| Educational Attainment | In Labor Force | Unemployed |
| Less than High School | 128 (80.5%) | 5 (3.1%) |
| High School Diploma | 709 (82.7%) | 141 (16.4%) |
| College / Associate Degree | 616 (84.8%) | 55 (7.6%) |
| Bachelor's Degree or higher | 417 (83.9%) | 0 (0.0%) |
| Total | 1,870 (83.5%) | 199 (8.9%) |
Employment Occupations by Sex in Greenacres
Management, Business, Science and Arts Occupations
The most common Management, Business, Science and Arts occupations in Greenacres are Community & Social Service (271 | 14.1%), Education Instruction & Library (217 | 11.3%), Management (184 | 9.6%), Health Diagnosing & Treating (68 | 3.5%), and Computers, Engineering & Science (62 | 3.2%).
Management, Business, Science and Arts Occupations by Sex
Within the Management, Business, Science and Arts occupations in Greenacres, the most male-oriented occupations are Life, Physical & Social Science (100.0%), Computers, Engineering & Science (64.5%), and Management (63.6%), while the most female-oriented occupations are Health Technologists (100.0%), Education Instruction & Library (93.5%), and Community & Social Service (88.6%).
| Occupation | Male | Female |
| Management | 117 (63.6%) | 67 (36.4%) |
| Business & Financial | 21 (38.9%) | 33 (61.1%) |
| Computers, Engineering & Science | 40 (64.5%) | 22 (35.5%) |
| Computers & Mathematics | 9 (47.4%) | 10 (52.6%) |
| Architecture & Engineering | 18 (60.0%) | 12 (40.0%) |
| Life, Physical & Social Science | 13 (100.0%) | 0 (0.0%) |
| Community & Social Service | 31 (11.4%) | 240 (88.6%) |
| Education, Arts & Media | 17 (31.5%) | 37 (68.5%) |
| Legal Services & Support | 0 (0.0%) | 0 (0.0%) |
| Education Instruction & Library | 14 (6.5%) | 203 (93.5%) |
| Arts, Media & Entertainment | 0 (0.0%) | 0 (0.0%) |
| Health Diagnosing & Treating | 19 (27.9%) | 49 (72.1%) |
| Health Technologists | 0 (0.0%) | 43 (100.0%) |
| Total (Category) | 228 (35.7%) | 411 (64.3%) |
| Total (Overall) | 1,085 (56.4%) | 838 (43.6%) |
Services Occupations
The most common Services occupations in Greenacres are Food Preparation & Serving (106 | 5.5%), Security & Protection (60 | 3.1%), Healthcare Support (54 | 2.8%), Cleaning & Maintenance (52 | 2.7%), and Law Enforcement (49 | 2.5%).
Services Occupations by Sex
Within the Services occupations in Greenacres, the most male-oriented occupations are Security & Protection (100.0%), Firefighting & Prevention (100.0%), and Law Enforcement (100.0%), while the most female-oriented occupations are Personal Care & Service (100.0%), Food Preparation & Serving (81.1%), and Healthcare Support (18.5%).
| Occupation | Male | Female |
| Healthcare Support | 44 (81.5%) | 10 (18.5%) |
| Security & Protection | 60 (100.0%) | 0 (0.0%) |
| Firefighting & Prevention | 11 (100.0%) | 0 (0.0%) |
| Law Enforcement | 49 (100.0%) | 0 (0.0%) |
| Food Preparation & Serving | 20 (18.9%) | 86 (81.1%) |
| Cleaning & Maintenance | 52 (100.0%) | 0 (0.0%) |
| Personal Care & Service | 0 (0.0%) | 23 (100.0%) |
| Total (Category) | 176 (59.7%) | 119 (40.3%) |
| Total (Overall) | 1,085 (56.4%) | 838 (43.6%) |
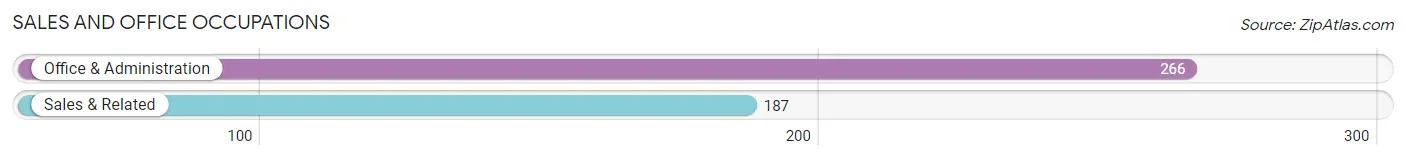
Sales and Office Occupations
The most common Sales and Office occupations in Greenacres are Office & Administration (266 | 13.8%), and Sales & Related (187 | 9.7%).
Sales and Office Occupations by Sex
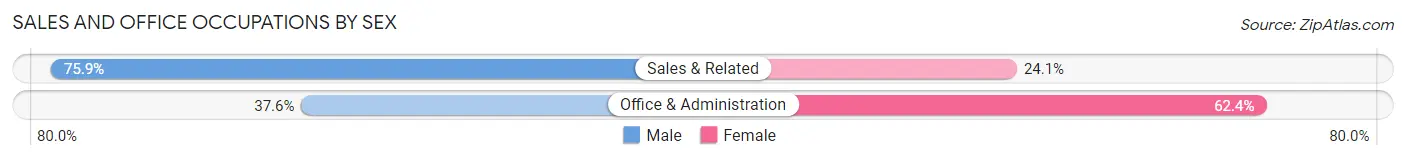
| Occupation | Male | Female |
| Sales & Related | 142 (75.9%) | 45 (24.1%) |
| Office & Administration | 100 (37.6%) | 166 (62.4%) |
| Total (Category) | 242 (53.4%) | 211 (46.6%) |
| Total (Overall) | 1,085 (56.4%) | 838 (43.6%) |
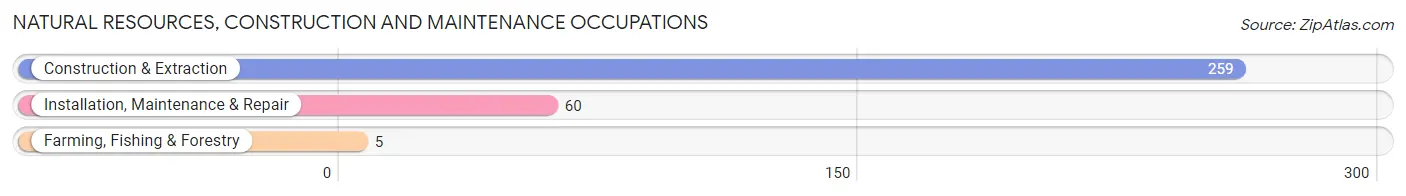
Natural Resources, Construction and Maintenance Occupations
The most common Natural Resources, Construction and Maintenance occupations in Greenacres are Construction & Extraction (259 | 13.5%), Installation, Maintenance & Repair (60 | 3.1%), and Farming, Fishing & Forestry (5 | 0.3%).
Natural Resources, Construction and Maintenance Occupations by Sex
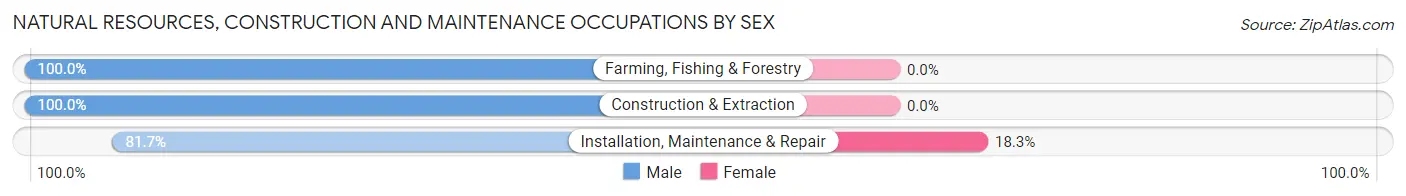
| Occupation | Male | Female |
| Farming, Fishing & Forestry | 5 (100.0%) | 0 (0.0%) |
| Construction & Extraction | 259 (100.0%) | 0 (0.0%) |
| Installation, Maintenance & Repair | 49 (81.7%) | 11 (18.3%) |
| Total (Category) | 313 (96.6%) | 11 (3.4%) |
| Total (Overall) | 1,085 (56.4%) | 838 (43.6%) |
Production, Transportation and Moving Occupations
The most common Production, Transportation and Moving occupations in Greenacres are Transportation (85 | 4.4%), Material Moving (72 | 3.7%), and Production (55 | 2.9%).
Production, Transportation and Moving Occupations by Sex
| Occupation | Male | Female |
| Production | 13 (23.6%) | 42 (76.4%) |
| Transportation | 85 (100.0%) | 0 (0.0%) |
| Material Moving | 28 (38.9%) | 44 (61.1%) |
| Total (Category) | 126 (59.4%) | 86 (40.6%) |
| Total (Overall) | 1,085 (56.4%) | 838 (43.6%) |
Employment Industries by Sex in Greenacres
Employment Industries in Greenacres
The major employment industries in Greenacres include Construction (267 | 13.9%), Educational Services (230 | 12.0%), Retail Trade (207 | 10.8%), Health Care & Social Assistance (201 | 10.4%), and Manufacturing (145 | 7.5%).
Employment Industries by Sex in Greenacres
The Greenacres industries that see more men than women are Agriculture, Fishing & Hunting (100.0%), Transportation & Warehousing (100.0%), and Utilities (100.0%), whereas the industries that tend to have a higher number of women are Finance & Insurance (100.0%), Educational Services (93.9%), and Professional & Scientific (88.2%).
| Industry | Male | Female |
| Agriculture, Fishing & Hunting | 19 (100.0%) | 0 (0.0%) |
| Mining, Quarrying, & Extraction | 103 (89.6%) | 12 (10.4%) |
| Construction | 249 (93.3%) | 18 (6.7%) |
| Manufacturing | 39 (26.9%) | 106 (73.1%) |
| Wholesale Trade | 31 (70.5%) | 13 (29.5%) |
| Retail Trade | 127 (61.4%) | 80 (38.7%) |
| Transportation & Warehousing | 123 (100.0%) | 0 (0.0%) |
| Utilities | 14 (100.0%) | 0 (0.0%) |
| Information | 8 (100.0%) | 0 (0.0%) |
| Finance & Insurance | 0 (0.0%) | 16 (100.0%) |
| Real Estate, Rental & Leasing | 66 (82.5%) | 14 (17.5%) |
| Professional & Scientific | 9 (11.8%) | 67 (88.2%) |
| Enterprise Management | 0 (0.0%) | 0 (0.0%) |
| Administrative & Support | 16 (36.4%) | 28 (63.6%) |
| Educational Services | 14 (6.1%) | 216 (93.9%) |
| Health Care & Social Assistance | 63 (31.3%) | 138 (68.7%) |
| Arts, Entertainment & Recreation | 0 (0.0%) | 0 (0.0%) |
| Accommodation & Food Services | 58 (59.2%) | 40 (40.8%) |
| Public Administration | 70 (54.7%) | 58 (45.3%) |
| Total | 1,085 (56.4%) | 838 (43.6%) |
Education in Greenacres
School Enrollment in Greenacres
The most common levels of schooling among the 1,181 students in Greenacres are middle school (350 | 29.6%), high school (326 | 27.6%), and elementary school (241 | 20.4%).
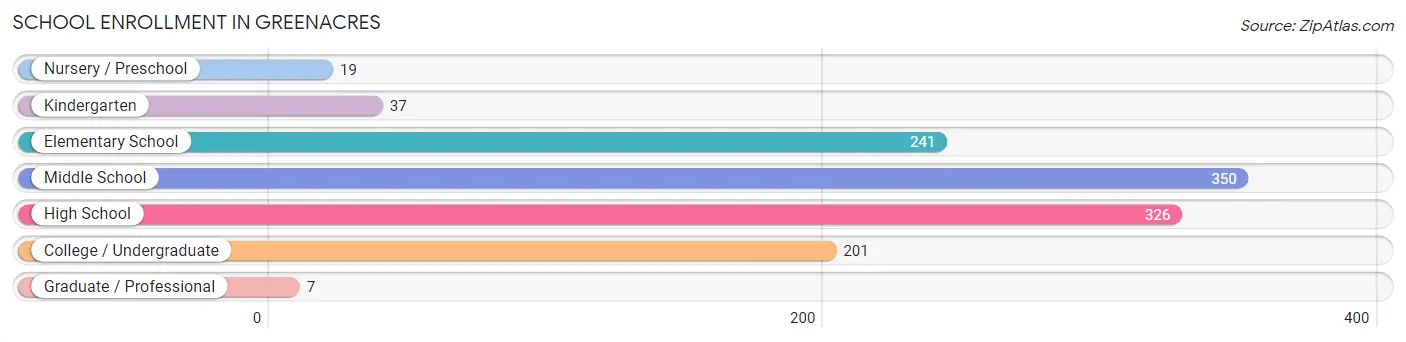
| School Level | # Students | % Students |
| Nursery / Preschool | 19 | 1.6% |
| Kindergarten | 37 | 3.1% |
| Elementary School | 241 | 20.4% |
| Middle School | 350 | 29.6% |
| High School | 326 | 27.6% |
| College / Undergraduate | 201 | 17.0% |
| Graduate / Professional | 7 | 0.6% |
| Total | 1,181 | 100.0% |
School Enrollment by Age by Funding Source in Greenacres
Out of a total of 1,181 students who are enrolled in schools in Greenacres, 313 (26.5%) attend a private institution, while the remaining 868 (73.5%) are enrolled in public schools. The age group of 25 to 34 year olds has the highest likelihood of being enrolled in private schools, with 64 (81.0% in the age bracket) enrolled. Conversely, the age group of 20 to 24 year olds has the lowest likelihood of being enrolled in a private school, with 85 (87.6% in the age bracket) attending a public institution.
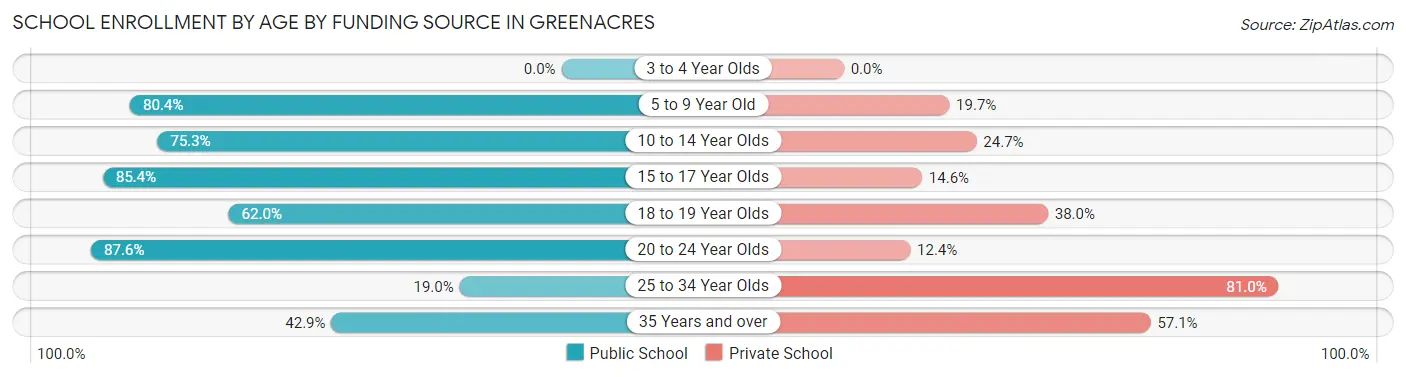
| Age Bracket | Public School | Private School |
| 3 to 4 Year Olds | 0 (0.0%) | 0 (0.0%) |
| 5 to 9 Year Old | 229 (80.3%) | 56 (19.7%) |
| 10 to 14 Year Olds | 332 (75.3%) | 109 (24.7%) |
| 15 to 17 Year Olds | 129 (85.4%) | 22 (14.6%) |
| 18 to 19 Year Olds | 75 (62.0%) | 46 (38.0%) |
| 20 to 24 Year Olds | 85 (87.6%) | 12 (12.4%) |
| 25 to 34 Year Olds | 15 (19.0%) | 64 (81.0%) |
| 35 Years and over | 3 (42.9%) | 4 (57.1%) |
| Total | 868 (73.5%) | 313 (26.5%) |
Educational Attainment by Field of Study in Greenacres
Bio, nature & agricultural (95 | 14.0%), business (92 | 13.6%), literature & languages (79 | 11.7%), arts & humanities (69 | 10.2%), and social sciences (68 | 10.0%) are the most common fields of study among 678 individuals in Greenacres who have obtained a bachelor's degree or higher.
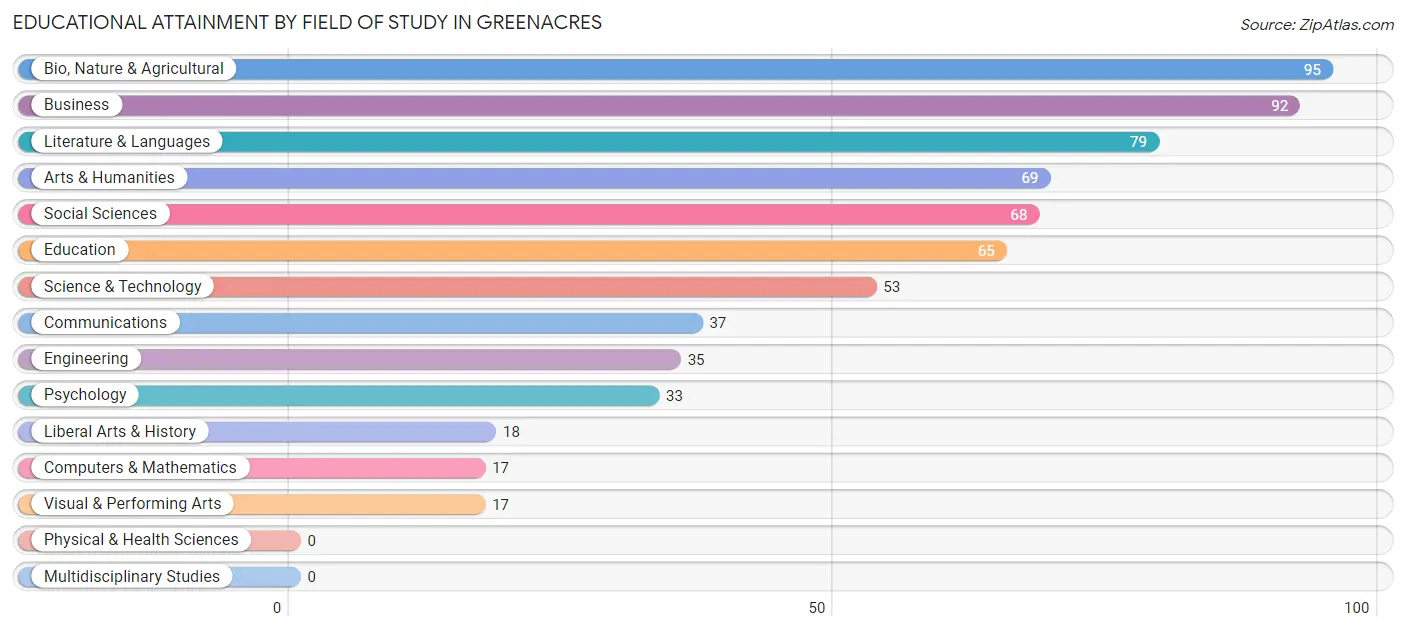
| Field of Study | # Graduates | % Graduates |
| Computers & Mathematics | 17 | 2.5% |
| Bio, Nature & Agricultural | 95 | 14.0% |
| Physical & Health Sciences | 0 | 0.0% |
| Psychology | 33 | 4.9% |
| Social Sciences | 68 | 10.0% |
| Engineering | 35 | 5.2% |
| Multidisciplinary Studies | 0 | 0.0% |
| Science & Technology | 53 | 7.8% |
| Business | 92 | 13.6% |
| Education | 65 | 9.6% |
| Literature & Languages | 79 | 11.7% |
| Liberal Arts & History | 18 | 2.6% |
| Visual & Performing Arts | 17 | 2.5% |
| Communications | 37 | 5.5% |
| Arts & Humanities | 69 | 10.2% |
| Total | 678 | 100.0% |
Transportation & Commute in Greenacres
Vehicle Availability by Sex in Greenacres
The most prevalent vehicle ownership categories in Greenacres are males with 2 vehicles (389, accounting for 36.7%) and females with 2 vehicles (297, making up 48.9%).
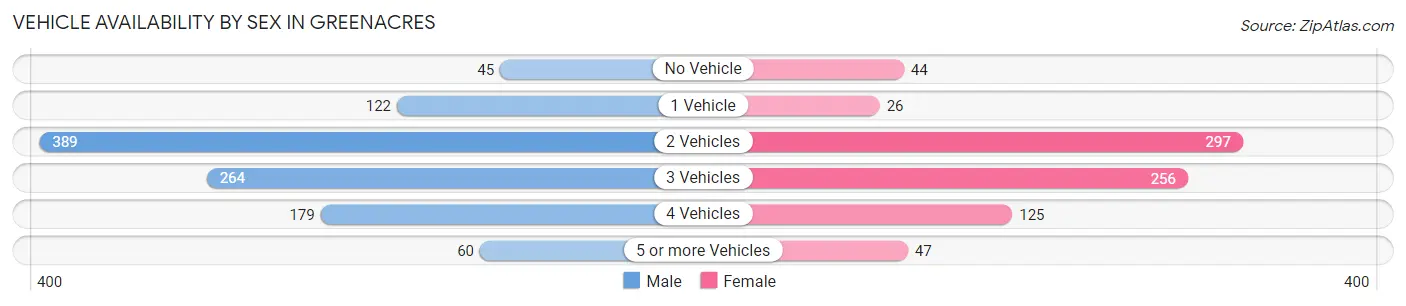
| Vehicles Available | Male | Female |
| No Vehicle | 45 (4.3%) | 44 (5.5%) |
| 1 Vehicle | 122 (11.5%) | 26 (3.3%) |
| 2 Vehicles | 389 (36.7%) | 297 (37.4%) |
| 3 Vehicles | 264 (24.9%) | 256 (32.2%) |
| 4 Vehicles | 179 (16.9%) | 125 (15.7%) |
| 5 or more Vehicles | 60 (5.7%) | 47 (5.9%) |
| Total | 1,059 (100.0%) | 795 (100.0%) |
Commute Time in Greenacres
The most frequently occuring commute durations in Greenacres are 20 to 24 minutes (502 commuters, 28.3%), 15 to 19 minutes (352 commuters, 19.8%), and 10 to 14 minutes (270 commuters, 15.2%).
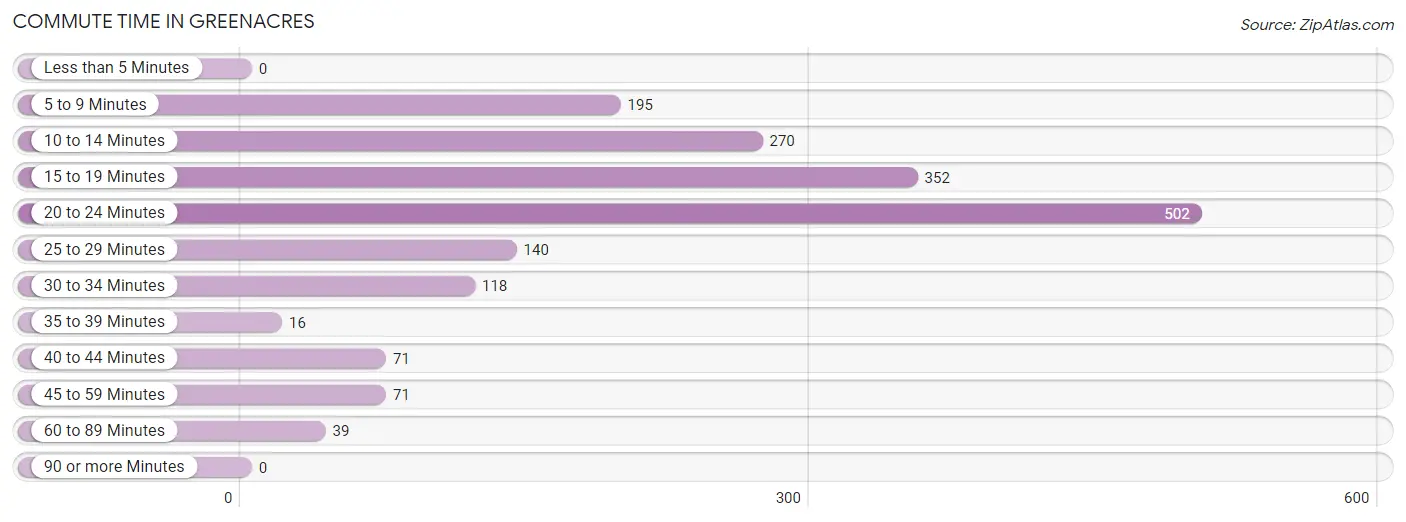
| Commute Time | # Commuters | % Commuters |
| Less than 5 Minutes | 0 | 0.0% |
| 5 to 9 Minutes | 195 | 11.0% |
| 10 to 14 Minutes | 270 | 15.2% |
| 15 to 19 Minutes | 352 | 19.8% |
| 20 to 24 Minutes | 502 | 28.3% |
| 25 to 29 Minutes | 140 | 7.9% |
| 30 to 34 Minutes | 118 | 6.7% |
| 35 to 39 Minutes | 16 | 0.9% |
| 40 to 44 Minutes | 71 | 4.0% |
| 45 to 59 Minutes | 71 | 4.0% |
| 60 to 89 Minutes | 39 | 2.2% |
| 90 or more Minutes | 0 | 0.0% |
Commute Time by Sex in Greenacres
The most common commute times in Greenacres are 20 to 24 minutes (315 commuters, 30.8%) for males and 20 to 24 minutes (187 commuters, 24.9%) for females.
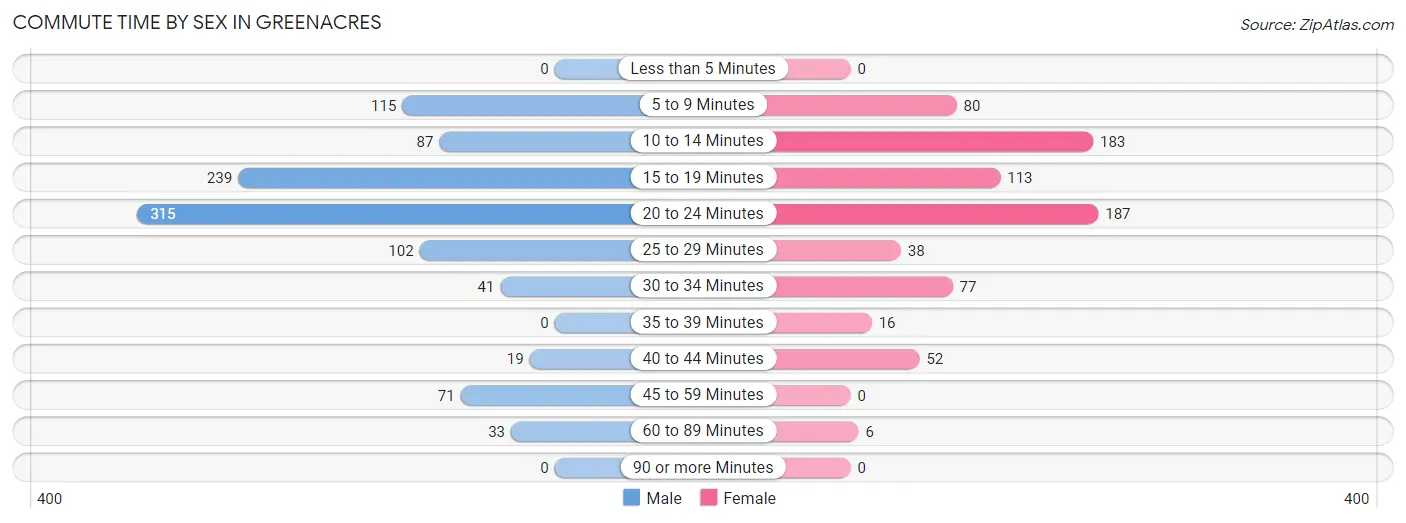
| Commute Time | Male | Female |
| Less than 5 Minutes | 0 (0.0%) | 0 (0.0%) |
| 5 to 9 Minutes | 115 (11.3%) | 80 (10.6%) |
| 10 to 14 Minutes | 87 (8.5%) | 183 (24.3%) |
| 15 to 19 Minutes | 239 (23.4%) | 113 (15.0%) |
| 20 to 24 Minutes | 315 (30.8%) | 187 (24.9%) |
| 25 to 29 Minutes | 102 (10.0%) | 38 (5.1%) |
| 30 to 34 Minutes | 41 (4.0%) | 77 (10.2%) |
| 35 to 39 Minutes | 0 (0.0%) | 16 (2.1%) |
| 40 to 44 Minutes | 19 (1.9%) | 52 (6.9%) |
| 45 to 59 Minutes | 71 (7.0%) | 0 (0.0%) |
| 60 to 89 Minutes | 33 (3.2%) | 6 (0.8%) |
| 90 or more Minutes | 0 (0.0%) | 0 (0.0%) |
Time of Departure to Work by Sex in Greenacres
The most frequent times of departure to work in Greenacres are 6:00 AM to 6:29 AM (178, 17.4%) for males and 7:00 AM to 7:29 AM (218, 29.0%) for females.
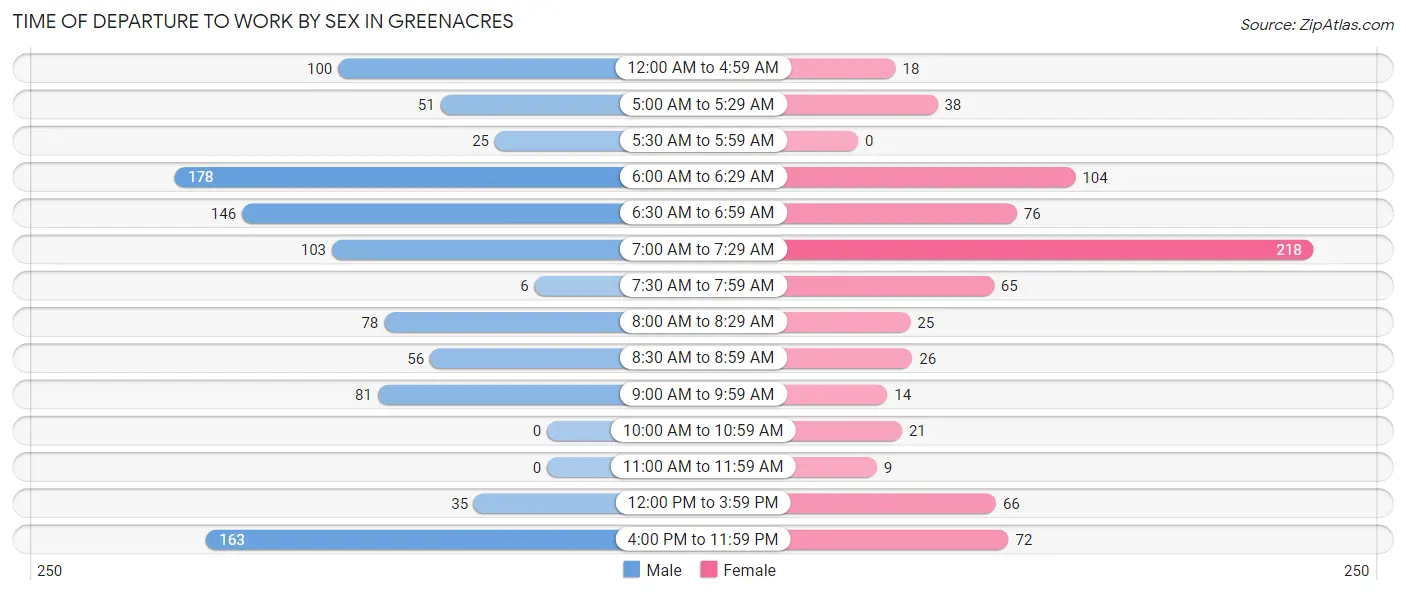
| Time of Departure | Male | Female |
| 12:00 AM to 4:59 AM | 100 (9.8%) | 18 (2.4%) |
| 5:00 AM to 5:29 AM | 51 (5.0%) | 38 (5.1%) |
| 5:30 AM to 5:59 AM | 25 (2.5%) | 0 (0.0%) |
| 6:00 AM to 6:29 AM | 178 (17.4%) | 104 (13.8%) |
| 6:30 AM to 6:59 AM | 146 (14.3%) | 76 (10.1%) |
| 7:00 AM to 7:29 AM | 103 (10.1%) | 218 (29.0%) |
| 7:30 AM to 7:59 AM | 6 (0.6%) | 65 (8.6%) |
| 8:00 AM to 8:29 AM | 78 (7.6%) | 25 (3.3%) |
| 8:30 AM to 8:59 AM | 56 (5.5%) | 26 (3.5%) |
| 9:00 AM to 9:59 AM | 81 (7.9%) | 14 (1.9%) |
| 10:00 AM to 10:59 AM | 0 (0.0%) | 21 (2.8%) |
| 11:00 AM to 11:59 AM | 0 (0.0%) | 9 (1.2%) |
| 12:00 PM to 3:59 PM | 35 (3.4%) | 66 (8.8%) |
| 4:00 PM to 11:59 PM | 163 (16.0%) | 72 (9.6%) |
| Total | 1,022 (100.0%) | 752 (100.0%) |
Housing Occupancy in Greenacres
Occupancy by Ownership in Greenacres
Of the total 1,525 dwellings in Greenacres, owner-occupied units account for 1,236 (81.0%), while renter-occupied units make up 289 (19.0%).
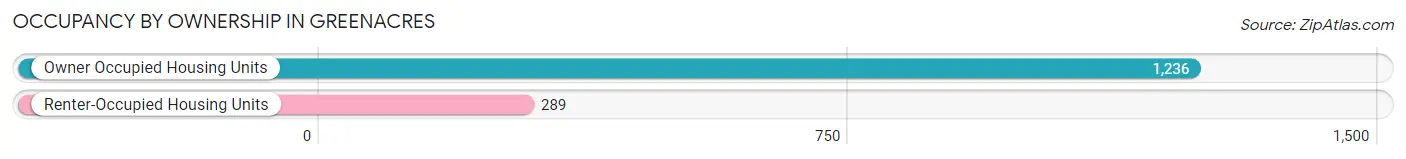
| Occupancy | # Housing Units | % Housing Units |
| Owner Occupied Housing Units | 1,236 | 81.0% |
| Renter-Occupied Housing Units | 289 | 19.0% |
| Total Occupied Housing Units | 1,525 | 100.0% |
Occupancy by Household Size in Greenacres
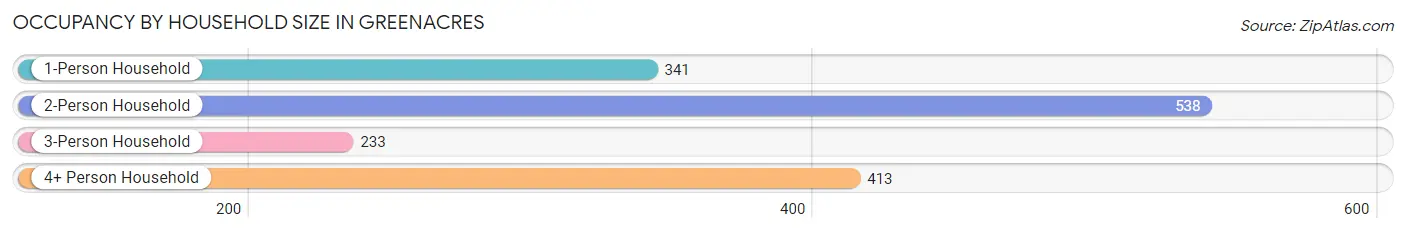
| Household Size | # Housing Units | % Housing Units |
| 1-Person Household | 341 | 22.4% |
| 2-Person Household | 538 | 35.3% |
| 3-Person Household | 233 | 15.3% |
| 4+ Person Household | 413 | 27.1% |
| Total Housing Units | 1,525 | 100.0% |
Occupancy by Ownership by Household Size in Greenacres
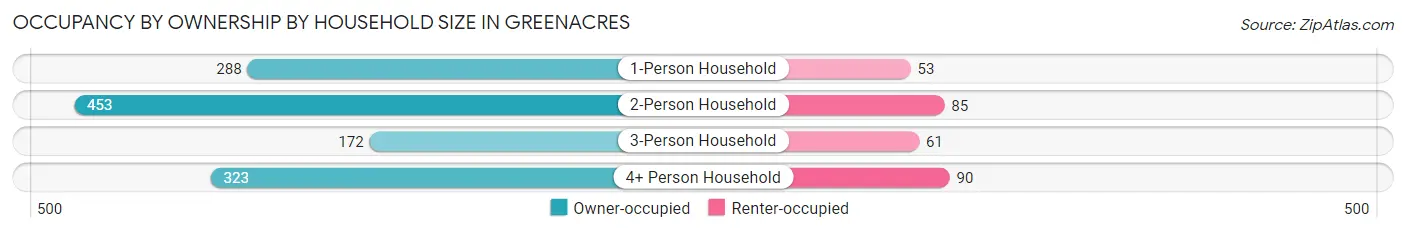
| Household Size | Owner-occupied | Renter-occupied |
| 1-Person Household | 288 (84.5%) | 53 (15.5%) |
| 2-Person Household | 453 (84.2%) | 85 (15.8%) |
| 3-Person Household | 172 (73.8%) | 61 (26.2%) |
| 4+ Person Household | 323 (78.2%) | 90 (21.8%) |
| Total Housing Units | 1,236 (81.0%) | 289 (19.0%) |
Occupancy by Educational Attainment in Greenacres
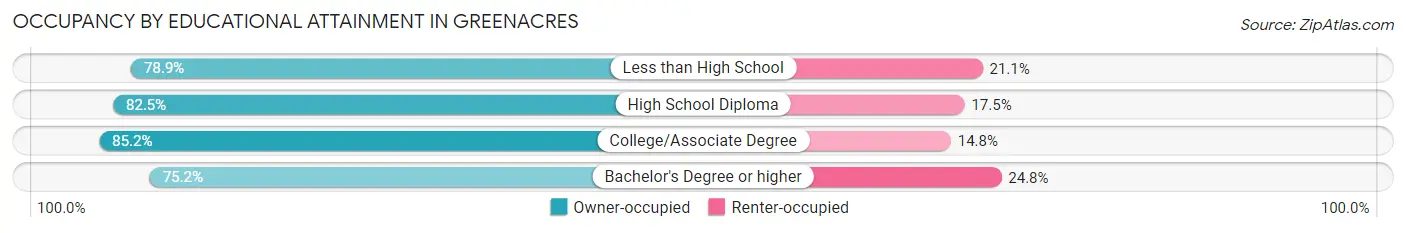
| Household Size | Owner-occupied | Renter-occupied |
| Less than High School | 116 (78.9%) | 31 (21.1%) |
| High School Diploma | 344 (82.5%) | 73 (17.5%) |
| College/Associate Degree | 455 (85.2%) | 79 (14.8%) |
| Bachelor's Degree or higher | 321 (75.2%) | 106 (24.8%) |
Occupancy by Age of Householder in Greenacres
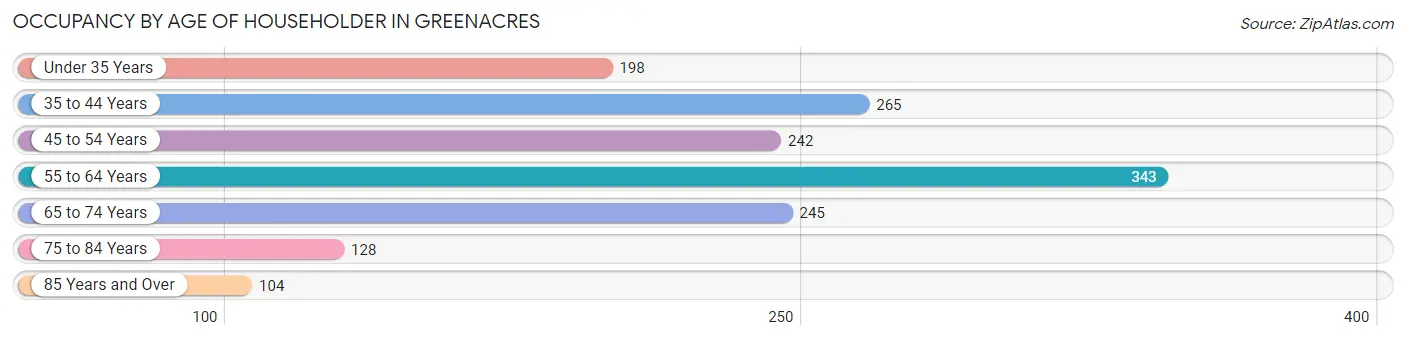
| Age Bracket | # Households | % Households |
| Under 35 Years | 198 | 13.0% |
| 35 to 44 Years | 265 | 17.4% |
| 45 to 54 Years | 242 | 15.9% |
| 55 to 64 Years | 343 | 22.5% |
| 65 to 74 Years | 245 | 16.1% |
| 75 to 84 Years | 128 | 8.4% |
| 85 Years and Over | 104 | 6.8% |
| Total | 1,525 | 100.0% |
Housing Finances in Greenacres
Median Income by Occupancy in Greenacres
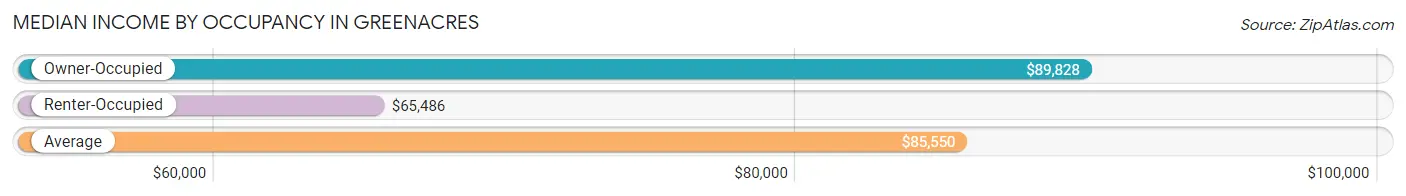
| Occupancy Type | # Households | Median Income |
| Owner-Occupied | 1,236 (81.0%) | $89,828 |
| Renter-Occupied | 289 (19.0%) | $65,486 |
| Average | 1,525 (100.0%) | $85,550 |
Occupancy by Householder Income Bracket in Greenacres
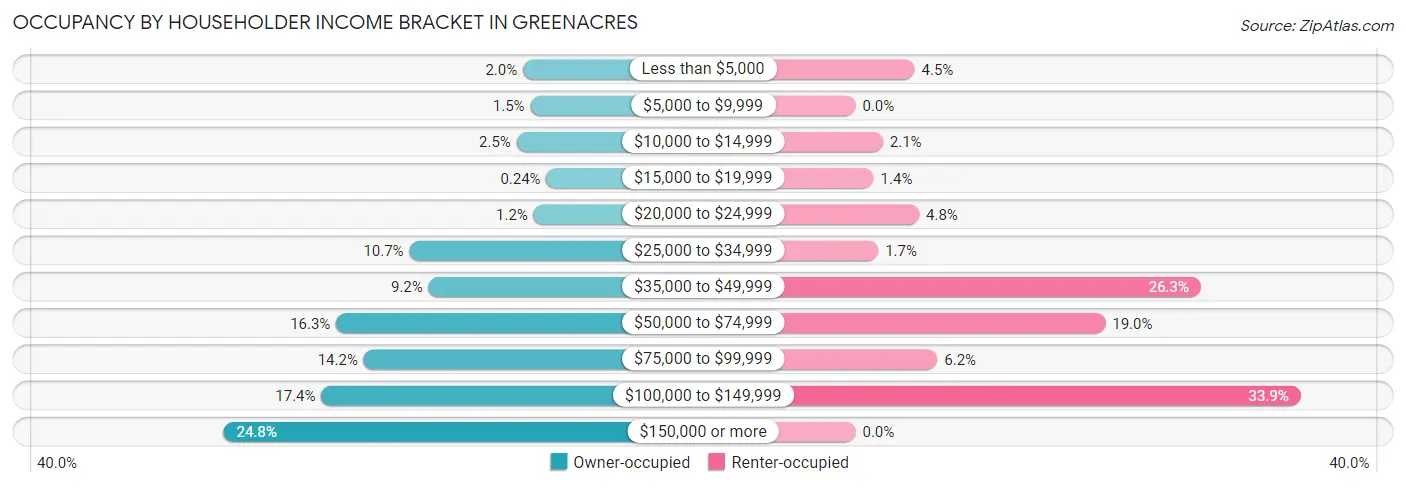
| Income Bracket | Owner-occupied | Renter-occupied |
| Less than $5,000 | 25 (2.0%) | 13 (4.5%) |
| $5,000 to $9,999 | 18 (1.5%) | 0 (0.0%) |
| $10,000 to $14,999 | 31 (2.5%) | 6 (2.1%) |
| $15,000 to $19,999 | 3 (0.2%) | 4 (1.4%) |
| $20,000 to $24,999 | 15 (1.2%) | 14 (4.8%) |
| $25,000 to $34,999 | 132 (10.7%) | 5 (1.7%) |
| $35,000 to $49,999 | 114 (9.2%) | 76 (26.3%) |
| $50,000 to $74,999 | 201 (16.3%) | 55 (19.0%) |
| $75,000 to $99,999 | 175 (14.2%) | 18 (6.2%) |
| $100,000 to $149,999 | 215 (17.4%) | 98 (33.9%) |
| $150,000 or more | 307 (24.8%) | 0 (0.0%) |
| Total | 1,236 (100.0%) | 289 (100.0%) |
Monthly Housing Cost Tiers in Greenacres
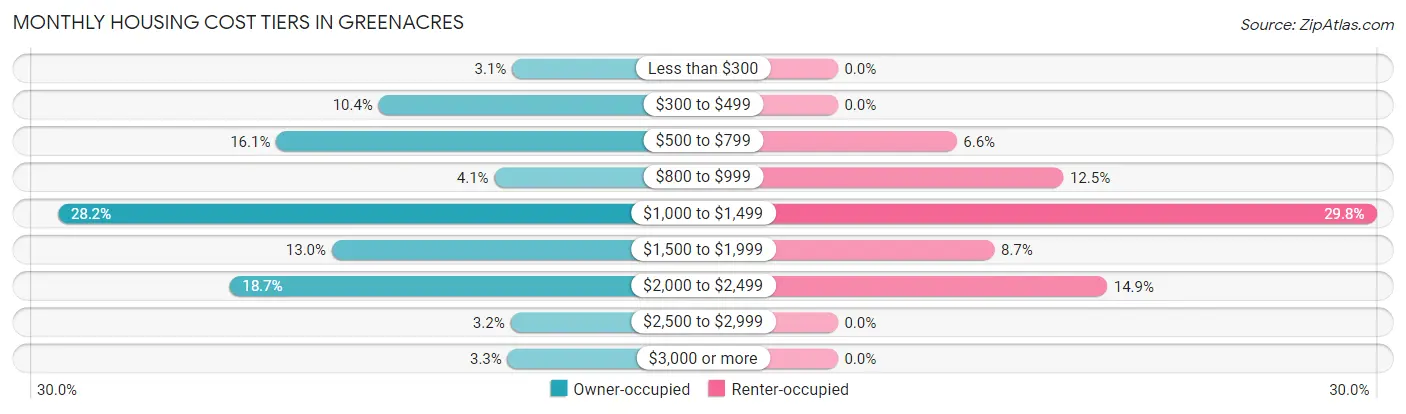
| Monthly Cost | Owner-occupied | Renter-occupied |
| Less than $300 | 38 (3.1%) | 0 (0.0%) |
| $300 to $499 | 129 (10.4%) | 0 (0.0%) |
| $500 to $799 | 199 (16.1%) | 19 (6.6%) |
| $800 to $999 | 50 (4.1%) | 36 (12.5%) |
| $1,000 to $1,499 | 348 (28.2%) | 86 (29.8%) |
| $1,500 to $1,999 | 161 (13.0%) | 25 (8.6%) |
| $2,000 to $2,499 | 231 (18.7%) | 43 (14.9%) |
| $2,500 to $2,999 | 39 (3.2%) | 0 (0.0%) |
| $3,000 or more | 41 (3.3%) | 0 (0.0%) |
| Total | 1,236 (100.0%) | 289 (100.0%) |
Physical Housing Characteristics in Greenacres
Housing Structures in Greenacres
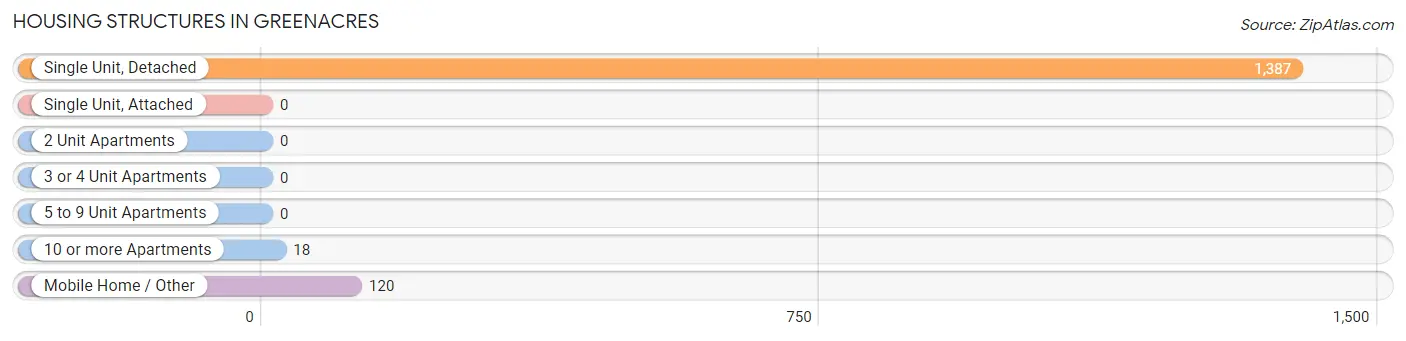
| Structure Type | # Housing Units | % Housing Units |
| Single Unit, Detached | 1,387 | 90.9% |
| Single Unit, Attached | 0 | 0.0% |
| 2 Unit Apartments | 0 | 0.0% |
| 3 or 4 Unit Apartments | 0 | 0.0% |
| 5 to 9 Unit Apartments | 0 | 0.0% |
| 10 or more Apartments | 18 | 1.2% |
| Mobile Home / Other | 120 | 7.9% |
| Total | 1,525 | 100.0% |
Housing Structures by Occupancy in Greenacres
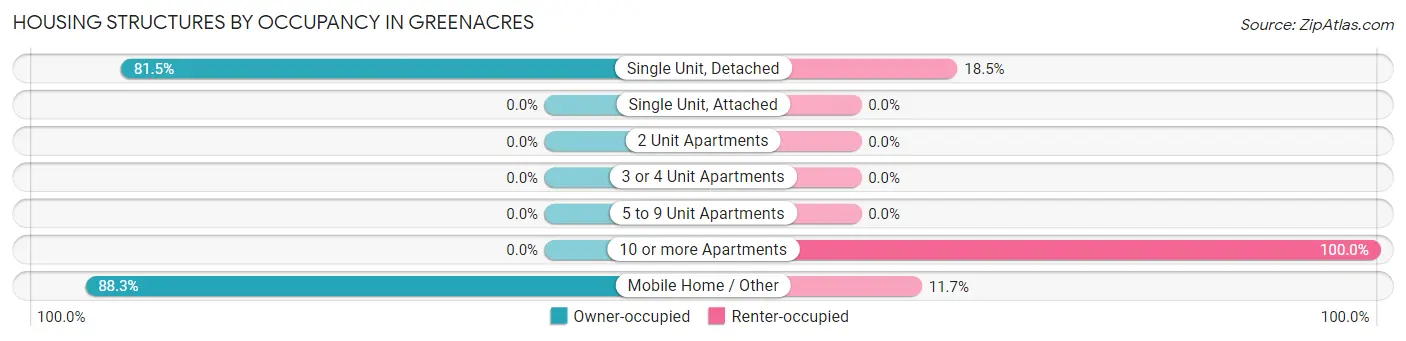
| Structure Type | Owner-occupied | Renter-occupied |
| Single Unit, Detached | 1,130 (81.5%) | 257 (18.5%) |
| Single Unit, Attached | 0 (0.0%) | 0 (0.0%) |
| 2 Unit Apartments | 0 (0.0%) | 0 (0.0%) |
| 3 or 4 Unit Apartments | 0 (0.0%) | 0 (0.0%) |
| 5 to 9 Unit Apartments | 0 (0.0%) | 0 (0.0%) |
| 10 or more Apartments | 0 (0.0%) | 18 (100.0%) |
| Mobile Home / Other | 106 (88.3%) | 14 (11.7%) |
| Total | 1,236 (81.0%) | 289 (19.0%) |
Housing Structures by Number of Rooms in Greenacres
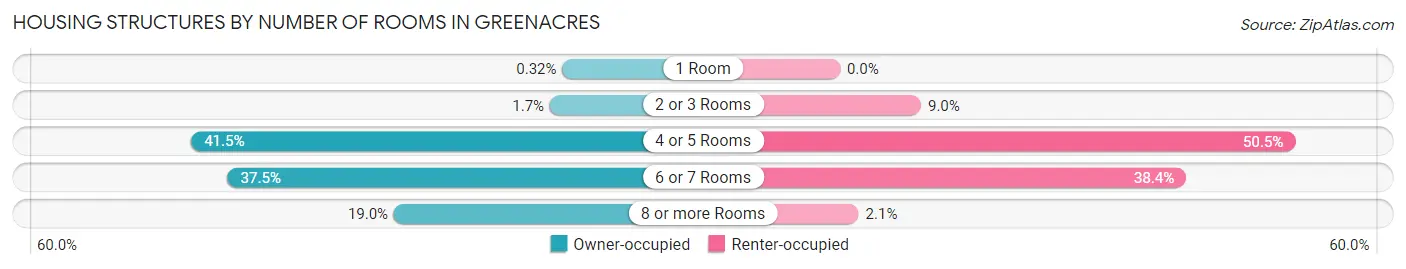
| Number of Rooms | Owner-occupied | Renter-occupied |
| 1 Room | 4 (0.3%) | 0 (0.0%) |
| 2 or 3 Rooms | 21 (1.7%) | 26 (9.0%) |
| 4 or 5 Rooms | 513 (41.5%) | 146 (50.5%) |
| 6 or 7 Rooms | 463 (37.5%) | 111 (38.4%) |
| 8 or more Rooms | 235 (19.0%) | 6 (2.1%) |
| Total | 1,236 (100.0%) | 289 (100.0%) |
Housing Structure by Heating Type in Greenacres
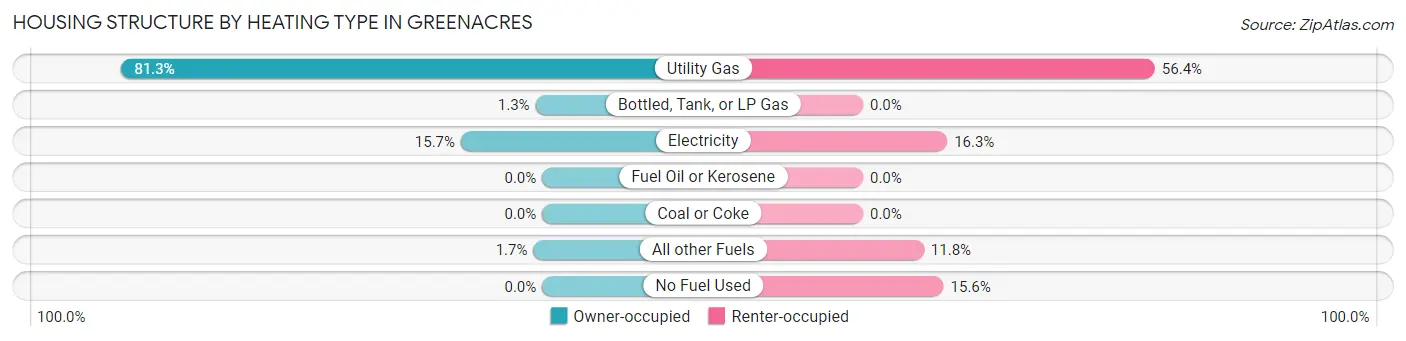
| Heating Type | Owner-occupied | Renter-occupied |
| Utility Gas | 1,005 (81.3%) | 163 (56.4%) |
| Bottled, Tank, or LP Gas | 16 (1.3%) | 0 (0.0%) |
| Electricity | 194 (15.7%) | 47 (16.3%) |
| Fuel Oil or Kerosene | 0 (0.0%) | 0 (0.0%) |
| Coal or Coke | 0 (0.0%) | 0 (0.0%) |
| All other Fuels | 21 (1.7%) | 34 (11.8%) |
| No Fuel Used | 0 (0.0%) | 45 (15.6%) |
| Total | 1,236 (100.0%) | 289 (100.0%) |
Household Vehicle Usage in Greenacres
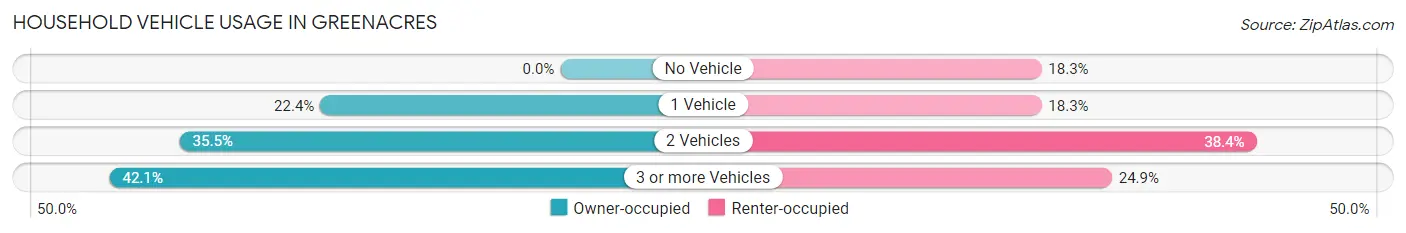
| Vehicles per Household | Owner-occupied | Renter-occupied |
| No Vehicle | 0 (0.0%) | 53 (18.3%) |
| 1 Vehicle | 277 (22.4%) | 53 (18.3%) |
| 2 Vehicles | 439 (35.5%) | 111 (38.4%) |
| 3 or more Vehicles | 520 (42.1%) | 72 (24.9%) |
| Total | 1,236 (100.0%) | 289 (100.0%) |
Real Estate & Mortgages in Greenacres
Real Estate and Mortgage Overview in Greenacres
| Characteristic | Without Mortgage | With Mortgage |
| Housing Units | 358 | 878 |
| Median Property Value | $226,800 | $295,100 |
| Median Household Income | $50,000 | $279 |
| Monthly Housing Costs | $544 | $41 |
| Real Estate Taxes | $2,173 | $3 |
Property Value by Mortgage Status in Greenacres
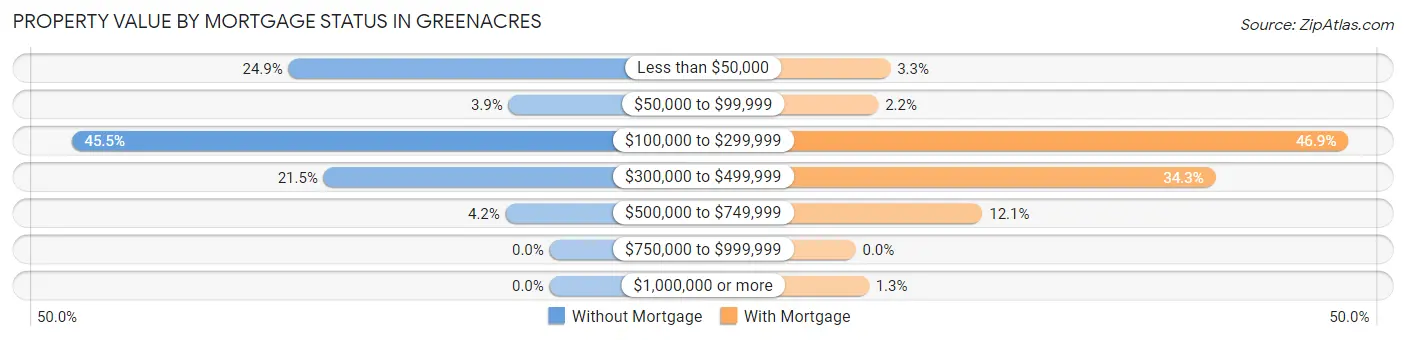
| Property Value | Without Mortgage | With Mortgage |
| Less than $50,000 | 89 (24.9%) | 29 (3.3%) |
| $50,000 to $99,999 | 14 (3.9%) | 19 (2.2%) |
| $100,000 to $299,999 | 163 (45.5%) | 412 (46.9%) |
| $300,000 to $499,999 | 77 (21.5%) | 301 (34.3%) |
| $500,000 to $749,999 | 15 (4.2%) | 106 (12.1%) |
| $750,000 to $999,999 | 0 (0.0%) | 0 (0.0%) |
| $1,000,000 or more | 0 (0.0%) | 11 (1.3%) |
| Total | 358 (100.0%) | 878 (100.0%) |
Household Income by Mortgage Status in Greenacres
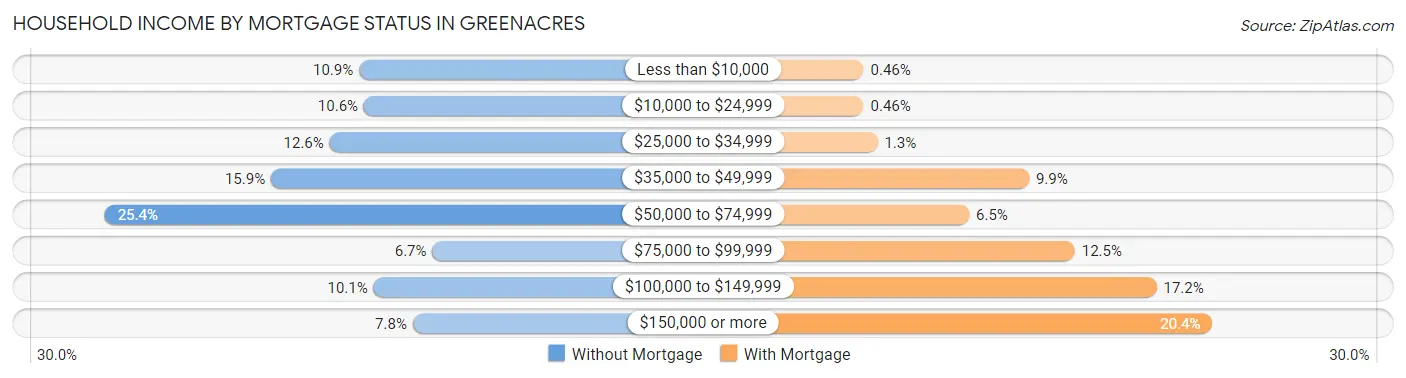
| Household Income | Without Mortgage | With Mortgage |
| Less than $10,000 | 39 (10.9%) | 4 (0.5%) |
| $10,000 to $24,999 | 38 (10.6%) | 4 (0.5%) |
| $25,000 to $34,999 | 45 (12.6%) | 11 (1.3%) |
| $35,000 to $49,999 | 57 (15.9%) | 87 (9.9%) |
| $50,000 to $74,999 | 91 (25.4%) | 57 (6.5%) |
| $75,000 to $99,999 | 24 (6.7%) | 110 (12.5%) |
| $100,000 to $149,999 | 36 (10.1%) | 151 (17.2%) |
| $150,000 or more | 28 (7.8%) | 179 (20.4%) |
| Total | 358 (100.0%) | 878 (100.0%) |
Property Value to Household Income Ratio in Greenacres
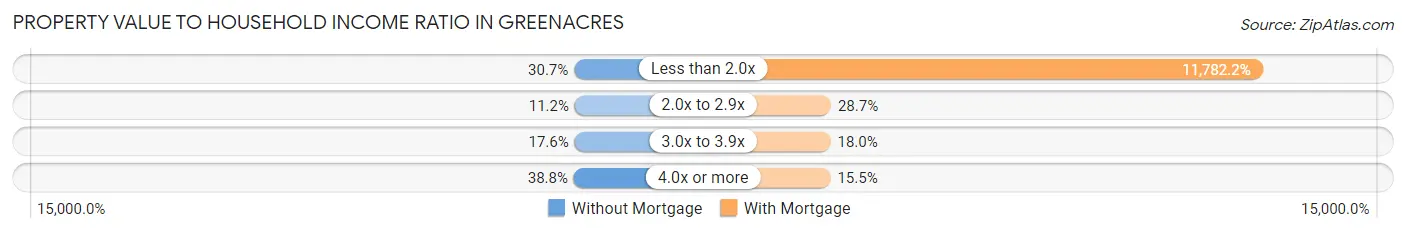
| Value-to-Income Ratio | Without Mortgage | With Mortgage |
| Less than 2.0x | 110 (30.7%) | 103,448 (11,782.2%) |
| 2.0x to 2.9x | 40 (11.2%) | 252 (28.7%) |
| 3.0x to 3.9x | 63 (17.6%) | 158 (18.0%) |
| 4.0x or more | 139 (38.8%) | 136 (15.5%) |
| Total | 358 (100.0%) | 878 (100.0%) |
Real Estate Taxes by Mortgage Status in Greenacres
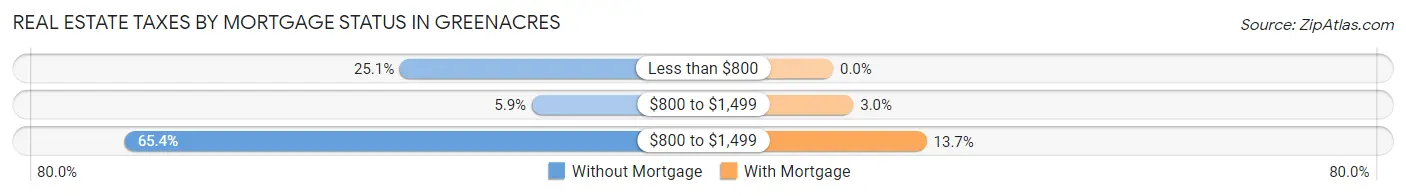
| Property Taxes | Without Mortgage | With Mortgage |
| Less than $800 | 90 (25.1%) | 0 (0.0%) |
| $800 to $1,499 | 21 (5.9%) | 26 (3.0%) |
| $800 to $1,499 | 234 (65.4%) | 120 (13.7%) |
| Total | 358 (100.0%) | 878 (100.0%) |
Health & Disability in Greenacres
Health Insurance Coverage by Age in Greenacres
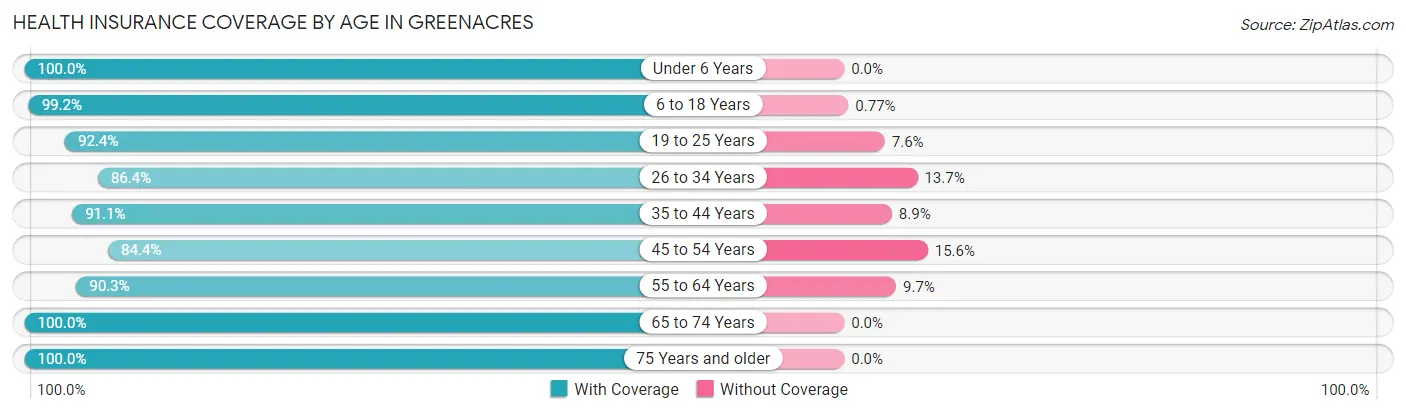
| Age Bracket | With Coverage | Without Coverage |
| Under 6 Years | 282 (100.0%) | 0 (0.0%) |
| 6 to 18 Years | 1,029 (99.2%) | 8 (0.8%) |
| 19 to 25 Years | 208 (92.4%) | 17 (7.6%) |
| 26 to 34 Years | 449 (86.4%) | 71 (13.7%) |
| 35 to 44 Years | 554 (91.1%) | 54 (8.9%) |
| 45 to 54 Years | 385 (84.4%) | 71 (15.6%) |
| 55 to 64 Years | 561 (90.3%) | 60 (9.7%) |
| 65 to 74 Years | 393 (100.0%) | 0 (0.0%) |
| 75 Years and older | 420 (100.0%) | 0 (0.0%) |
| Total | 4,281 (93.8%) | 281 (6.2%) |
Health Insurance Coverage by Citizenship Status in Greenacres
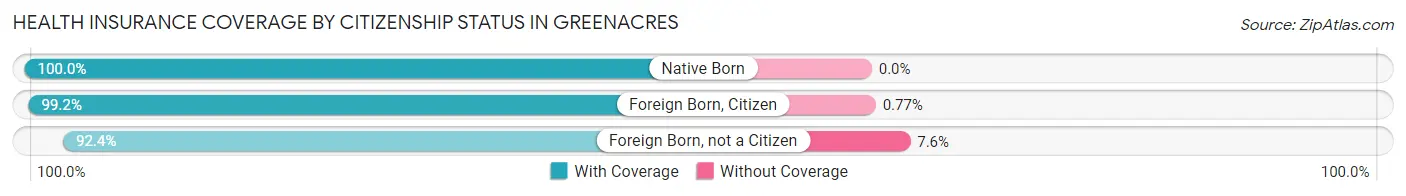
| Citizenship Status | With Coverage | Without Coverage |
| Native Born | 282 (100.0%) | 0 (0.0%) |
| Foreign Born, Citizen | 1,029 (99.2%) | 8 (0.8%) |
| Foreign Born, not a Citizen | 208 (92.4%) | 17 (7.6%) |
Health Insurance Coverage by Household Income in Greenacres
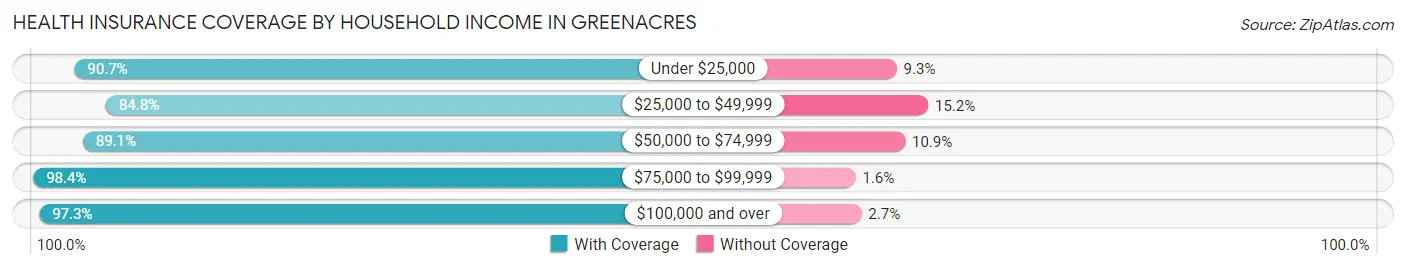
| Household Income | With Coverage | Without Coverage |
| Under $25,000 | 165 (90.7%) | 17 (9.3%) |
| $25,000 to $49,999 | 506 (84.8%) | 91 (15.2%) |
| $50,000 to $74,999 | 817 (89.1%) | 100 (10.9%) |
| $75,000 to $99,999 | 547 (98.4%) | 9 (1.6%) |
| $100,000 and over | 2,238 (97.3%) | 63 (2.7%) |
Public vs Private Health Insurance Coverage by Age in Greenacres
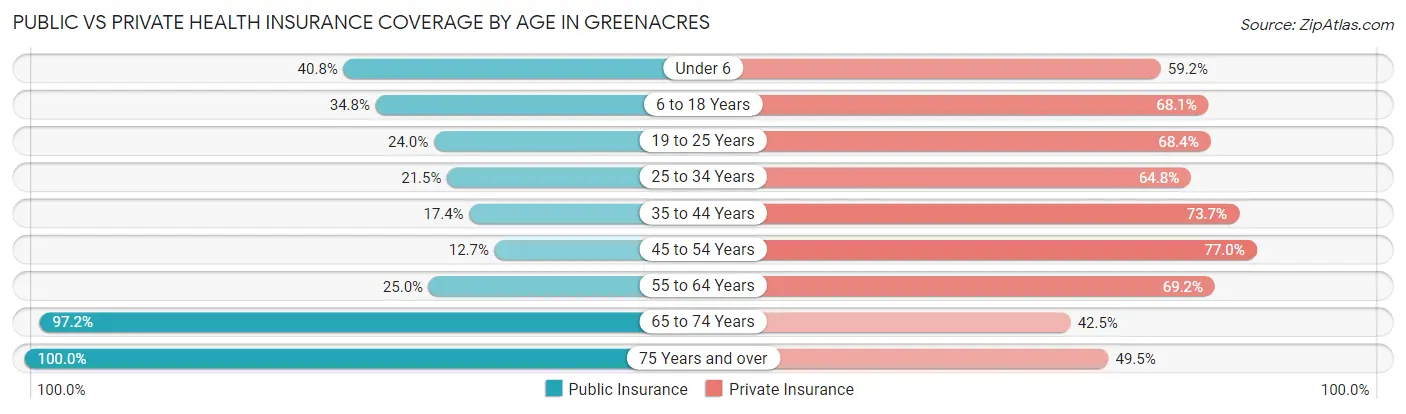
| Age Bracket | Public Insurance | Private Insurance |
| Under 6 | 115 (40.8%) | 167 (59.2%) |
| 6 to 18 Years | 361 (34.8%) | 706 (68.1%) |
| 19 to 25 Years | 54 (24.0%) | 154 (68.4%) |
| 25 to 34 Years | 112 (21.5%) | 337 (64.8%) |
| 35 to 44 Years | 106 (17.4%) | 448 (73.7%) |
| 45 to 54 Years | 58 (12.7%) | 351 (77.0%) |
| 55 to 64 Years | 155 (25.0%) | 430 (69.2%) |
| 65 to 74 Years | 382 (97.2%) | 167 (42.5%) |
| 75 Years and over | 420 (100.0%) | 208 (49.5%) |
| Total | 1,763 (38.7%) | 2,968 (65.1%) |
Disability Status by Sex by Age in Greenacres
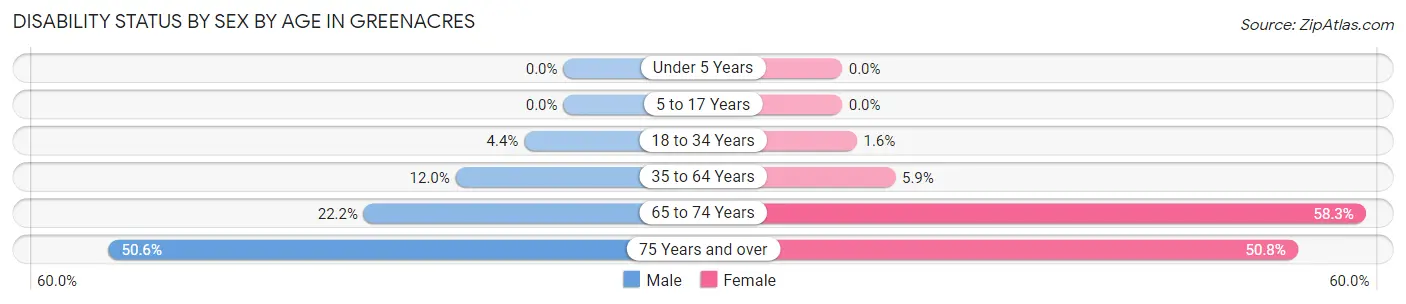
| Age Bracket | Male | Female |
| Under 5 Years | 0 (0.0%) | 0 (0.0%) |
| 5 to 17 Years | 0 (0.0%) | 0 (0.0%) |
| 18 to 34 Years | 22 (4.4%) | 6 (1.6%) |
| 35 to 64 Years | 101 (12.0%) | 50 (5.9%) |
| 65 to 74 Years | 50 (22.2%) | 98 (58.3%) |
| 75 Years and over | 79 (50.6%) | 134 (50.8%) |
Disability Class by Sex by Age in Greenacres
Disability Class: Hearing Difficulty
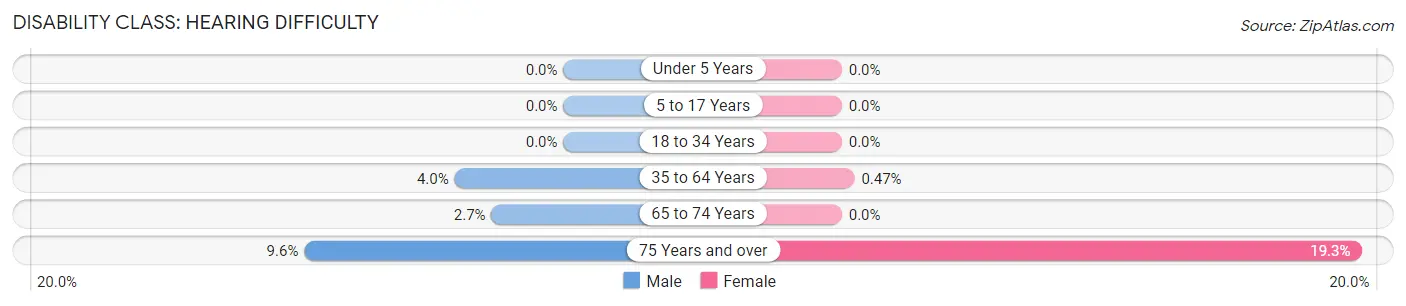
| Age Bracket | Male | Female |
| Under 5 Years | 0 (0.0%) | 0 (0.0%) |
| 5 to 17 Years | 0 (0.0%) | 0 (0.0%) |
| 18 to 34 Years | 0 (0.0%) | 0 (0.0%) |
| 35 to 64 Years | 34 (4.0%) | 4 (0.5%) |
| 65 to 74 Years | 6 (2.7%) | 0 (0.0%) |
| 75 Years and over | 15 (9.6%) | 51 (19.3%) |
Disability Class: Vision Difficulty
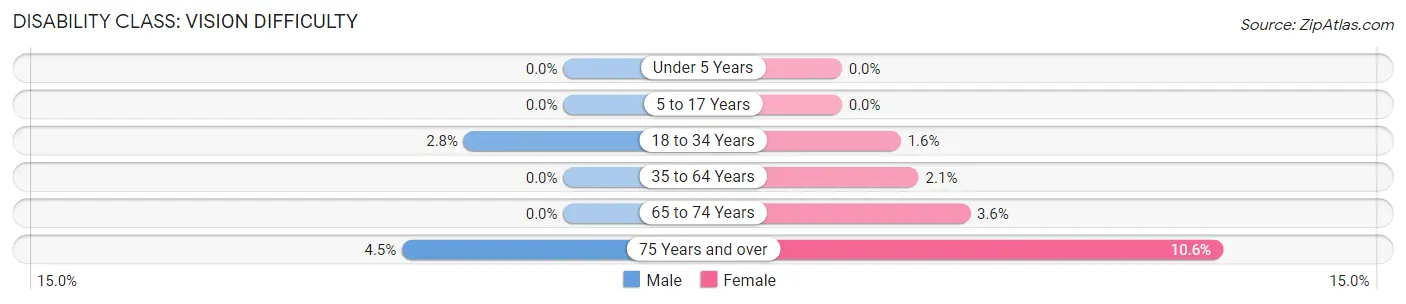
| Age Bracket | Male | Female |
| Under 5 Years | 0 (0.0%) | 0 (0.0%) |
| 5 to 17 Years | 0 (0.0%) | 0 (0.0%) |
| 18 to 34 Years | 14 (2.8%) | 6 (1.6%) |
| 35 to 64 Years | 0 (0.0%) | 18 (2.1%) |
| 65 to 74 Years | 0 (0.0%) | 6 (3.6%) |
| 75 Years and over | 7 (4.5%) | 28 (10.6%) |
Disability Class: Cognitive Difficulty
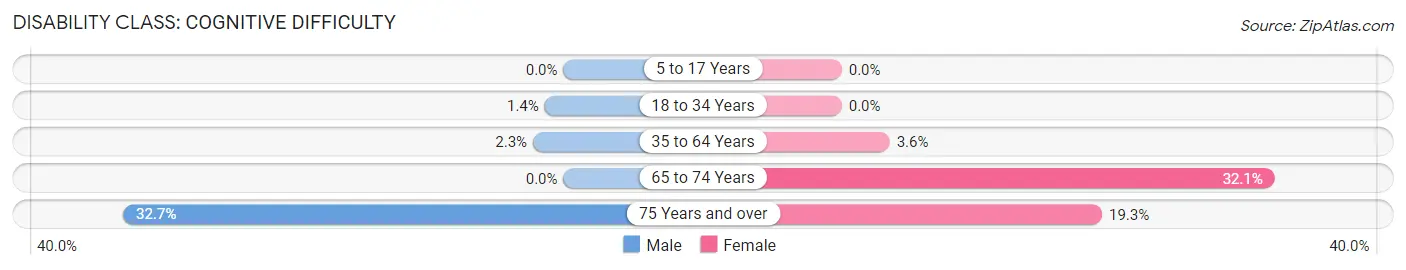
| Age Bracket | Male | Female |
| 5 to 17 Years | 0 (0.0%) | 0 (0.0%) |
| 18 to 34 Years | 7 (1.4%) | 0 (0.0%) |
| 35 to 64 Years | 19 (2.3%) | 30 (3.6%) |
| 65 to 74 Years | 0 (0.0%) | 54 (32.1%) |
| 75 Years and over | 51 (32.7%) | 51 (19.3%) |
Disability Class: Ambulatory Difficulty
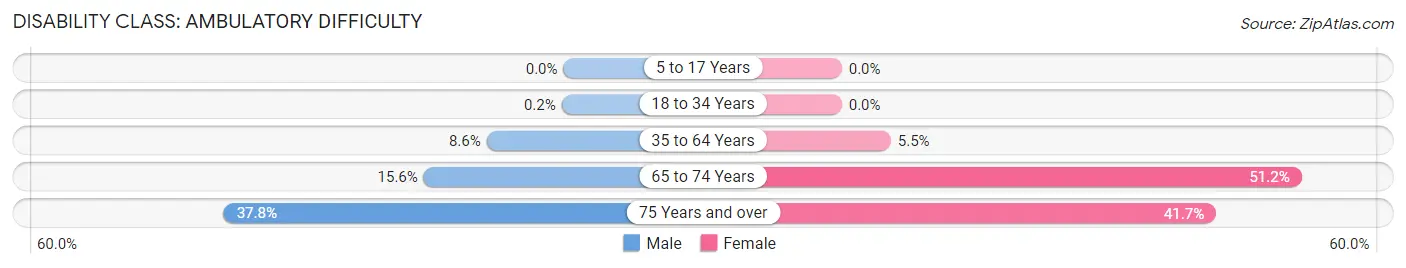
| Age Bracket | Male | Female |
| 5 to 17 Years | 0 (0.0%) | 0 (0.0%) |
| 18 to 34 Years | 1 (0.2%) | 0 (0.0%) |
| 35 to 64 Years | 72 (8.6%) | 46 (5.5%) |
| 65 to 74 Years | 35 (15.6%) | 86 (51.2%) |
| 75 Years and over | 59 (37.8%) | 110 (41.7%) |
Disability Class: Self-Care Difficulty
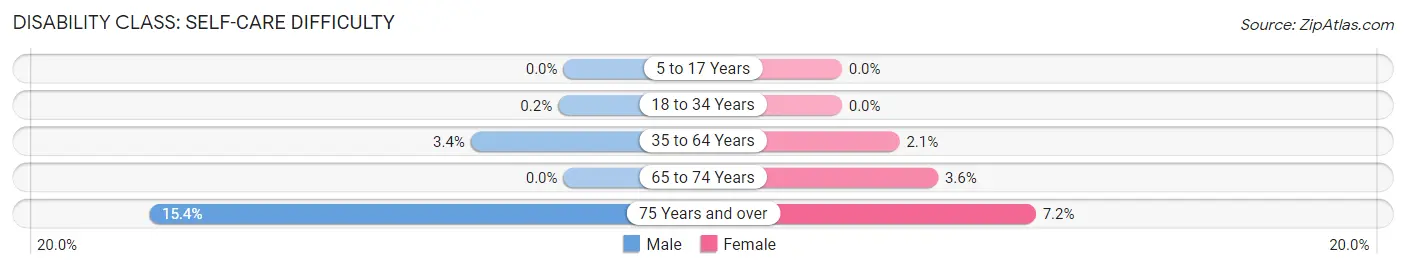
| Age Bracket | Male | Female |
| 5 to 17 Years | 0 (0.0%) | 0 (0.0%) |
| 18 to 34 Years | 1 (0.2%) | 0 (0.0%) |
| 35 to 64 Years | 29 (3.4%) | 18 (2.1%) |
| 65 to 74 Years | 0 (0.0%) | 6 (3.6%) |
| 75 Years and over | 24 (15.4%) | 19 (7.2%) |
Technology Access in Greenacres
Computing Device Access in Greenacres
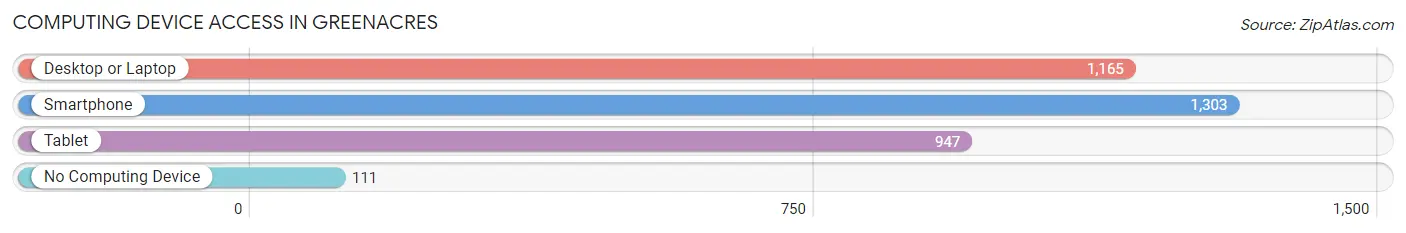
| Device Type | # Households | % Households |
| Desktop or Laptop | 1,165 | 76.4% |
| Smartphone | 1,303 | 85.4% |
| Tablet | 947 | 62.1% |
| No Computing Device | 111 | 7.3% |
| Total | 1,525 | 100.0% |
Internet Access in Greenacres
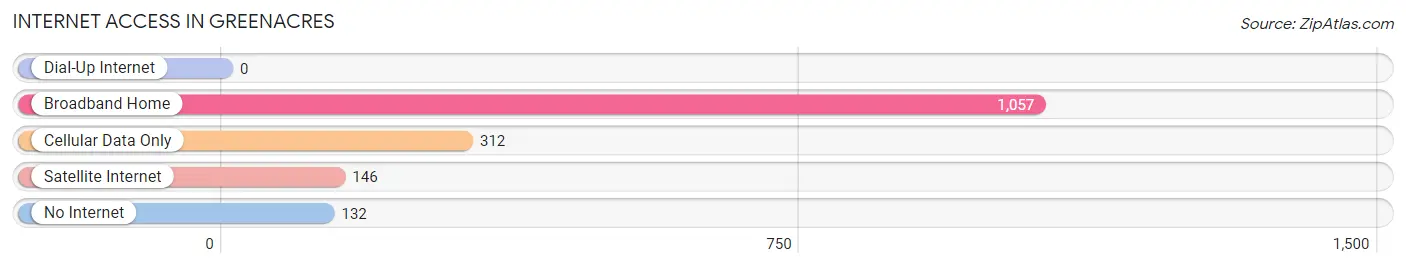
| Internet Type | # Households | % Households |
| Dial-Up Internet | 0 | 0.0% |
| Broadband Home | 1,057 | 69.3% |
| Cellular Data Only | 312 | 20.5% |
| Satellite Internet | 146 | 9.6% |
| No Internet | 132 | 8.7% |
| Total | 1,525 | 100.0% |
Greenacres Summary
Greenacres is a small city located in the San Joaquin Valley of California, United States. It is situated in the southeastern corner of Fresno County, approximately 10 miles east of Fresno. The city was incorporated in 1959 and has a population of approximately 10,000 people.
Geography
Greenacres is located in the San Joaquin Valley of California, in the southeastern corner of Fresno County. It is situated at an elevation of approximately 300 feet above sea level. The city is bordered by the cities of Fresno, Clovis, and Sanger. The city is located in a semi-arid climate, with hot summers and mild winters. The average annual precipitation is approximately 8 inches.
The city is divided into two distinct areas: the urban area and the rural area. The urban area is located in the center of the city and is home to most of the city's businesses and residential areas. The rural area is located on the outskirts of the city and is primarily agricultural land.
Economy
Greenacres is primarily a residential community, with a small business district. The city's economy is largely based on agriculture, with the majority of the city's businesses being related to farming and ranching. The city is also home to a number of small businesses, including restaurants, retail stores, and professional services.
Demographics
As of the 2010 census, Greenacres had a population of 10,000 people. The racial makeup of the city was 75.3% White, 0.7% African American, 0.7% Native American, 0.7% Asian, 0.2% Pacific Islander, 19.3% from other races, and 3.7% from two or more races. Hispanic or Latino of any race were 33.3% of the population.
The median income for a household in the city was $41,250, and the median income for a family was $45,000. The per capita income for the city was $17,845. About 17.3% of families and 20.2% of the population were below the poverty line, including 28.3% of those under age 18 and 8.3% of those age 65 or over.
History
Greenacres was originally inhabited by the Yokuts Native American tribe. The area was first settled by European settlers in the late 1800s, when the area was used for farming and ranching. The city was officially incorporated in 1959.
In the 1960s, the city began to experience rapid growth due to the influx of people from the San Francisco Bay Area. This growth continued into the 1970s and 1980s, when the city experienced a population boom.
Today, Greenacres is a small city with a population of approximately 10,000 people. The city is home to a number of small businesses, including restaurants, retail stores, and professional services. The city is also home to a number of parks and recreational areas, including the Greenacres Community Park.
Common Questions
What is Per Capita Income in Greenacres?
Per Capita income in Greenacres is $35,537.
What is the Median Family Income in Greenacres?
Median Family Income in Greenacres is $96,741.
What is the Median Household income in Greenacres?
Median Household Income in Greenacres is $85,550.
What is Income or Wage Gap in Greenacres?
Income or Wage Gap in Greenacres is 5.0%.
Women in Greenacres earn 95.0 cents for every dollar earned by a man.
What is Family Income Deficit in Greenacres?
Family Income Deficit in Greenacres is $10,565.
Families that are below poverty line in Greenacres earn $10,565 less on average than the poverty threshold level.
What is Inequality or Gini Index in Greenacres?
Inequality or Gini Index in Greenacres is 0.43.
What is the Total Population of Greenacres?
Total Population of Greenacres is 4,562.
What is the Total Male Population of Greenacres?
Total Male Population of Greenacres is 2,329.
What is the Total Female Population of Greenacres?
Total Female Population of Greenacres is 2,233.
What is the Ratio of Males per 100 Females in Greenacres?
There are 104.30 Males per 100 Females in Greenacres.
What is the Ratio of Females per 100 Males in Greenacres?
There are 95.88 Females per 100 Males in Greenacres.
What is the Median Population Age in Greenacres?
Median Population Age in Greenacres is 40.1 Years.
What is the Average Family Size in Greenacres
Average Family Size in Greenacres is 3.5 People.
What is the Average Household Size in Greenacres
Average Household Size in Greenacres is 3.0 People.
How Large is the Labor Force in Greenacres?
There are 2,140 People in the Labor Forcein in Greenacres.
What is the Percentage of People in the Labor Force in Greenacres?
61.3% of People are in the Labor Force in Greenacres.
What is the Unemployment Rate in Greenacres?
Unemployment Rate in Greenacres is 10.1%.